User login
Two‐Item Bedside Test for Delirium
Delirium (acute confusion) is common in older adults and leads to poor outcomes, such as death, clinician and caregiver burden, and prolonged cognitive and functional decline.[1, 2, 3, 4] Delirium is extremely costly, with estimates ranging from $143 to $152 billion annually (2005 US$).[5, 6] Early detection and management may improve the poor outcomes and reduce costs attributable to delirium,[3, 7] yet delirium identification in clinical practice has been challenging, particularly when translating research tools to the bedside.[8, 9, 10]As a result, only 12% to 35% of delirium cases are detected in routine care, with hypoactive delirium and delirium superimposed on dementia most likely to be missed.[11, 12, 13, 14, 15]
To address these issues, we recently developed and published the three‐dimensional Confusion Assessment Method (3D‐CAM), the 3‐minute diagnostic assessment for CAM‐defined delirium.[16] The 3D‐CAM is a structured assessment tool that includes mental status testing, patient symptom probes, and guided interviewer observations for signs of delirium. 3D‐CAM items were selected through a rigorous process to determine the most informative items for the 4 CAM diagnostic features.[17] The 3D‐CAM can be completed in 3 minutes, and has 95% sensitivity and 94% specificity relative to a reference standard.[16]
Despite the capabilities of the 3D‐CAM, there are situations when even 3 minutes is too long to devote to delirium identification. Moreover, a 2‐step approach in which a sensitive ultrabrief screen is administered, followed by the 3D‐CAM in positives, may be the most efficient approach for large‐scale delirium case identification. The aim of the current study was to use the 3D‐CAM database to identify the most sensitive single item and pair of items in the diagnosis of delirium, using the reference standard in the diagnostic accuracy analysis. We hypothesized that we could identify a single item with greater than 80% sensitivity and a pair of items with greater than 90% sensitivity for detection of delirium.
METHODS
Study Sample and Design
We analyzed data from the 3D‐CAM validation study,[16] which prospectively enrolled participants from a large urban teaching hospital in Boston, Massachusetts, using a consecutive enrollment sampling strategy. Inclusion criteria were: (1) 75 years old, (2) admitted to general or geriatric medicine services, (3) able to communicate in English, (4) without terminal conditions, (5) expected hospital stay of 2 days, (6) not a previous study participant. Experienced clinicians screened patients for eligibility. If the patient lacked capacity to provide consent, the designated surrogate decision maker was contacted. The study was approved by the institutional review board.
Reference Standard Delirium Diagnosis
The reference standard delirium diagnosis was based on an extensive (45 minutes) face‐to‐face patient interview by experienced clinician assessors (neuropsychologists or advanced practice nurses), medical record review, and input from the nurse and family members. This comprehensive assessment included: (1) reason for hospital admission, hospital course, and presence of cognitive concerns, (2) family, social, and functional history, (3) Montreal Cognitive Assessment,[18] (4) Geriatric Depression Scale,[19] (5) medical record review including scoring of comorbidities using the Charlson index,[20] determination of functional status using the basic and Instrumental Activities of Daily Living,[21, 22] psychoactive medications administered, and (6) a family member interview to assess the patient's baseline cognitive status that included the Eight‐Item Interview to Differentiate Aging and Dementia,[23] to assess the presence of dementia. Using all of these data, an expert panel, including the clinical assessor, the study principal investigator (E.R.M.), a geriatrician, and an experienced neuropsychologist, adjudicated the final delirium diagnoses using Diagnostic and Statistical Manual of Mental Disorders, 4th Edition (DSM‐IV) criteria. The panel also adjudicated for the presence or absence of dementia and mild cognitive impairment based on National Institute on Aging‐Alzheimer's Association (NIA‐AA) criteria.[24] This approach has been used in other delirium studies.[25]
3D‐CAM Assessments
After the reference standard assessment, the 3D‐CAM was administered by trained research assistants (RAs) who were blinded to the results of the reference standard. To reduce the likelihood of fluctuations or temporal changes, all assessments were completed between 11:00 am and 2:00 pm and for each participant, within a 2‐hour time period (for example, 11:23 am to 1:23 pm).
Statistical Analyses to Determine the Best Single‐ and Two‐Item Screeners
To determine the best single 3D‐CAM item to identify delirium, the responses of the 20 individual items in the 3D‐CAM (see Supporting Table 1 in the online version of this article) were compared to the reference standard to determine their sensitivity and specificity. Similarly, an algorithm was used to generate all unique 2‐item combinations of the 20 items (190 unique pairs), which were compared to the reference. An error, no response, or an answer of I do not know by the patient was considered a positive screen for delirium. The 2‐item screeners were considered positive if 1 or both of the items were positive. Sensitivity and specificity were calculated along with 95% confidence intervals (CIs).
Subset analyses were performed to determine sensitivity and specificity of individual items and pairs of items stratified by the patient's baseline cognitive status. Two strata were createdpatients with dementia (N=56), and patients with normal baseline cognitive status or mild cognitive impairment (MCI) (N=145). We chose to group MCI with normal for 2 reasons: (1) dementia is a well‐established and strong risk factor for delirium, whereas the evidence for MCI being a risk factor for delirium is less established and (2) to achieve adequate allocation of delirious cases in both strata. Last, we report the sensitivity of altered level of consciousness (LOC), which included lethargy, stupor, coma, and hypervigilance as a single screening item for delirium in the overall sample and by cognitive status. Analyses were conducted using commercially available software (SAS version 9.3; SAS Institute, Inc., Cary, NC).
RESULTS
Characteristics of the patients are shown in Table 1. Subjects had a mean age of 84 years, 62% were female, and 28% had a baseline dementia. Forty‐two (21%) had delirium based on the clinical reference standard. Twenty (10%) had less than a high school education and 100 (49%) had at least a college education.
| Characteristic | N (%) |
|---|---|
| |
| Age, y, mean (SD) | 84 (5.4) |
| Sex, n (%) female | 125 (62) |
| White, n (%) | 177 (88) |
| Education, n (%) | |
| Less than high school | 20 (10) |
| High school graduate | 75 (38) |
| College plus | 100 (49) |
| Vision interfered with interview, n (%) | 5 (2) |
| Hearing interfered with interview, n (%) | 18 (9) |
| English second language n (%) | 10 (5) |
| Charlson, mean (SD) | 3 (2.3) |
| ADL, n (% impaired) | 110 (55) |
| IADL, n (% impaired) | 163 (81) |
| MCI, n (%) | 50 (25) |
| Dementia, n (%) | 56 (28) |
| Delirium, n (%) | 42 (21) |
| MoCA, mean (SD) | 19 (6.6) |
| MoCA, median (range) | 20 (030) |
Single Item Screens
Table 2 reports the results of single‐item screens for delirium with sensitivity, the ability to correctly identify delirium when it is present by the reference standard, and specificity, the ability to correctly identify patients without delirium when it is not present by reference standard and 95% CIs. Items are listed in descending order of sensitivity; in the case of ties, the item with the higher specificity is listed first. The screening items with the highest sensitivity for delirium are Months of the year backwards, and Four digits backwards, both with a sensitivity of 83% (95% CI: 69%‐93%). Of these 2 items, Months of the year backwards had a much better specificity of 69% (95% CI: 61%‐76%), whereas Four digits backwards had a specificity of 52% (95% CI: 44%‐60%). The item What is the day of the week? had lower sensitivity at 71% (95% CI: 55%‐84%), but excellent specificity at 92% (95% CI: 87%‐96%).
| Screen Item | Screen Positive (%)c | Sensitivity (95% CI) | Specificity (95% CI) | LR | LR |
|---|---|---|---|---|---|
| |||||
| Months of the year backwards | 42 | 0.83 (0.69‐0.93) | 0.69 (0.61‐0.76) | 2.7 | 0.24 |
| Four digits backwards | 56 | 0.83 (0.69‐0.93) | 0.52 (0.44‐0.60) | 1.72 | 0.32 |
| What is the day of the week? | 21 | 0.71 (0.55‐0.84) | 0.92 (0.87‐0.96) | 9.46 | 0.31 |
| What is the year? | 16 | 0.55 (0.39‐0.70) | 0.94 (0.9‐0.97) | 9.67 | 0.48 |
| Have you felt confused during the past day? | 14 | 0.50 (0.34‐0.66) | 0.95 (0.9‐0.98) | 9.94 | 0.53 |
| Days of the week backwards | 15 | 0.50 (0.34‐0.66) | 0.94 (0.89‐0.97) | 7.95 | 0.53 |
| During the past day, did you see things that were not really there? | 11 | 0.45 (0.3‐0.61) | 0.97 (0.94‐0.99) | 17.98 | 0.56 |
| Three digits backwards | 15 | 0.45 (0.3‐0.61) | 0.92 (0.87‐0.96) | 5.99 | 0.59 |
| What type of place is this? | 9 | 0.38 (0.24‐0.54) | 0.99 (0.96‐1) | 30.29 | 0.63 |
| During the past day, did you think you were not in the hospital? | 10 | 0.38 (0.24‐0.54) | 0.97 (0.94‐0.99) | 15.14 | 0.64 |
We then examined performance of single‐item screeners in patients with and without dementia (Table 3). In persons with dementia, the best single item was also Months of the year backwards, with a sensitivity of 89% (95% CI: 72%‐98%) and a specificity of 61% (95% CI: 41%‐78%). In persons with normal baseline cognition or MCI, the best performing single item was Four digits backwards, with sensitivity of 79% (95% CI: 49%‐95%) and specificity of 51% (95% CI: 42%‐60%). Months of the year backwards also performed well, with sensitivity of 71% (95% CI: 42%‐92%) and specificity of 71% (95% CI: 62%‐79%).
| Test Item | Normal/MCI Patients (n=145) | Dementia Patients (n=56) | ||||||||
|---|---|---|---|---|---|---|---|---|---|---|
| Screen Positive (%)b | Sensitivity (95% CI) | Specificity (95% CI) | LR | LR | Screen Positive (%)b | Sensitivity (95% CI) | Specificity (95% CI) | LR | LR | |
| ||||||||||
| Months backwards | 33 | 0.71 (0.42‐0.92) | 0.71 (0.62‐0.79) | 2.46 | 0.4 | 64 | 0.89 (0.72‐0.98) | 0.61 (0.41‐0.78) | 2.27 | 0.18 |
| Four digits backwards | 52 | 0.79 (0.49‐0.95) | 0.51 (0.42‐0.60) | 1.61 | 0.42 | 66 | 0.86 (0.67‐0.96) | 0.54 (0.34‐0.72) | 1.85 | 0.27 |
| What is the day of the week? | 10 | 0.64 (0.35‐0.87) | 0.96 (0.91‐0.99) | 16.84 | 0.37 | 50 | 0.75 (0.55‐0.89) | 0.75 (0.55‐0.89) | 3 | 0.33 |
Two‐Item Screens
Table 4 reports the results of 2‐item screens for delirium with sensitivity, specificity, and 95% CIs. Item pairs are listed in descending order of sensitivity following the same convention as in Table 2. The 2‐item screen with the highest sensitivity for delirium is the combination of What is the day of the week? and Months of the year backwards, with a sensitivity of 93% (95% CI: 81%‐99%) and specificity of 64% (95% CI: 56%‐70%). This screen had a positive and negative likelihood ratio (LR) of 2.59 and 0.11, respectively. The combination of What is the day of the week? and Four digits backwards had the same sensitivity 93% (95% CI: 81%‐99%), but lower specificity of 48% (95% CI: 40%‐56%). The combination of What type of place is this? (hospital) and Four digits backwards had a sensitivity of 90% (95% CI: 77%‐97%) and specificity of 51% (95% CI: 43%‐50%).
| Screen Item 1 | Screen Item 2 | Screen Positive (%)c | Sensitivity (95% CI) | Specificity (95% CI) | LR | LR |
|---|---|---|---|---|---|---|
| ||||||
| What is the day of the week? | Months backwards | 48 | 0.93 (0.81‐0.99) | 0.64 (0.56‐0.70) | 2.59 | 0.11 |
| What is the day of the week? | Four digits backwards | 60 | 0.93 (0.81‐0.99) | 0.48 (0.4‐0.56) | 1.8 | 0.15 |
| Four digits backwards | Months backwards | 65 | 0.93 (0.81‐0.99) | 0.42 (0.34‐0.50) | 1.6 | 0.17 |
| What type of place is this? | Four digits backwards | 58 | 0.90 (0.77‐0.97) | 0.51 (0.43‐0.50) | 1.84 | 0.19 |
| What is the year? | Four digits backwards | 59 | 0.9 (0.77‐0.97) | 0.5 (0.42‐0.5) | 1.80 | 0.19 |
| What is the day of the week? | Three digits backwards | 30 | 0.88 (0.74‐0.96) | 0.86 (0.79‐0.90) | 6.09 | 0.14 |
| What is the year? | Months backwards | 44 | 0.88 (0.74‐0.96) | 0.68 (0.6‐0.75) | 2.75 | 0.18 |
| What type of place is this? | Months backwards | 43 | 0.86 (0.71‐0.95) | 0.69 (0.61‐0.70) | 2.73 | 0.21 |
| During the past day, did you think you were not in the hospital? | Months backwards | 43 | 0.86 (0.71‐0.95) | 0.69 (0.61‐0.70) | 2.73 | 0.21 |
| Days of the week backwards | Months backwards | 43 | 0.86 (0.71‐0.95) | 0.68 (0.6‐0.75) | 2.67 | 0.21 |
When subjects were stratified by baseline cognition, the best 2‐item screens for normal and MCI patients was What is the day of the week? and Four digits backwards, with 93% sensitivity (95% CI: 66%‐100%) and 50% specificity (95% CI: 42%‐59%). The best pair of items for patients with dementia (Table 5) was the same as the overall sample, What is the day of the week? and Months of the year backwards, but its performance differed with a higher sensitivity of 96% (95% CI: 82%‐100%) and lower specificity of 43% (95% CI: 24%‐63%). This same pair of items had 86% sensitivity (95% CI: 57%‐98%) and 69% (95% CI: 60%‐77%) specificity for persons with either normal cognition or MCI.
| Test Item 1 | Test Item 2 | Normal/MCI Patients (n=145) | Dementia Patients (n=56) | ||||||||
|---|---|---|---|---|---|---|---|---|---|---|---|
| Item Positive (%)b | Sensitivity (95% CI) | Specificity (95% CI) | LR | LR | Item Positive (%)b | Sensitivity (95% CI) | Specificity (95% CI) | LR | LR | ||
| |||||||||||
| What is the day of the week? | Months backwards | 36 | 0.86 (0.57‐0.98) | 0.69 (0.60‐0.77) | 2.74 | 0.21 | 77 | 0.96 (0.82‐1) | 0.43 (0.24‐0.63) | 1.69 | 0.08 |
| What is the day of the week? | Four digits backwards | 54 | 0.93 (0.66‐1) | 0.5 (0.42‐0.59) | 1.87 | 0.14 | 77 | 0.93 (0.76‐0.99) | 0.39 (0.22‐0.59) | 1.53 | 0.18 |
| Four digits backwards | Months backwards | 61 | 0.93 (0.66‐1) | 0.43 (0.34‐0.52) | 1.62 | 0.17 | 77 | 0.93 (0.76‐0.99) | 0.39 (0.22‐0.59) | 1.53 | 0.18 |
Altered Level of Consciousness as a Screener for Delirium
Altered level of consciousness (ALOC) was uncommon in our sample, with an overall prevalence of 10/201 (4.9%). When examined as a screening item for delirium, ALOC had very poor sensitivity of 19% (95% CI: 9%‐34%) but had excellent specificity 99% (95% CI: 96%‐100%). Altered LOC also demonstrated poor screening performance when stratified by cognitive status, with a sensitivity of 14% in the normal and MCI group (95% CI: 2%‐43%) and sensitivity of 21% (95% CI: 8%‐41%) in persons with dementia.
Positive and Negative Predictive Values
Although we focused on sensitivity and specificity in evaluating 1‐ and 2‐item screeners, we also examined positive and negative predictive values. These values will vary depending on the overall prevalence of delirium, which was 21% in this dataset. The best 1‐item screener, Months of the year backwards, had a positive predictive value of 31% and negative predictive value of 94%. The best 2‐item screener, Months of the year backwards with What is the day of the week?, had a positive predictive value of 41% and negative predictive value of 97% (see Supporting Tables 2 and 3 in the online version of this article) LRs for the items are in Tables 2 through 5.
DISCUSSION
Identifying simple, efficient, bedside case‐identification methods for delirium is an essential step toward improving recognition of this highly morbid syndrome in hospitalized older adults. In this study, we identified a single cognitive item, Months of the year backwards, that identified 83% of delirium cases when compared with a reference standard diagnosis. Furthermore, we identified 2 items, Months of the year backwards and What is the day of the week? which when used in combination identified 93% of delirium cases. The same 1 and 2 items also worked well in patients with dementia, in whom delirium is often missed. Although these items require further clinical validation, the development of an ultrabrief 2‐item test that identifies over 90% of delirium cases and can be completed in less than 1 minute (recently, we administered the best 2‐item screener to 20 consecutive general medicine patients over age 70 years, and it was completed in a median of 36.5 seconds), holds great potential for simplifying bedside delirium screening and improving the care of hospitalized older adults.
Our current findings both confirm and extend the emerging literature on best screening items for delirium. Sands and colleagues (2010)[26] tested a single test for delirium, Do you think (name of patient) has been more confused lately? in 21 subjects and achieved a sensitivity of 80%. Han and colleagues developed a screening tool in emergency‐department patients using the LOC question from the Richmond Agitation‐Sedation Scale and spelling the word lunch backwards, and achieved 98% sensitivity, but in a younger emergency department population with a low prevalence of dementia.[27] O'Regan et al. recently also found Months of the year backwards to be the best single‐screening item for delirium in a large sample, but only tested a 1‐item screen.[28] Our study extends these studies in several important ways by: (1) employing a rigorous clinical reference standard diagnosis of delirium, (2) having a large sample with a high prevalence of patients with dementia, (3) use of a general medical population, and (4) examining the best 2‐item screens in addition to the best single item.
Systematic intervention programs[29, 30, 31] that focus on improved delirium evaluation and management have the potential to improve patient outcomes and reduce costs. However, targeting these programs to patients with delirium has proven difficult, as only 12% to 35% of delirium cases are recognized in routine clinical practice.[11, 12, 13, 14, 15] The 1‐ and 2‐item screeners we identified could play an important role in future delirium identification. The 3D‐CAM combines high sensitivity (95%) with high specificity (94%)[16] and therefore would be an excellent choice as the second step after a positive screen. The feasibility, effectiveness, and cost of administering these screeners, followed by a brief diagnostic tool such as the 3D‐CAM, should be evaluated in future work.
Our study has noteworthy strengths, including the use of a large purposefully challenging clinical sample with advanced age that included a substantial proportion with dementia, a detailed assessment, and the testing of very brief and practical tools for bedside delirium screening.[25] This study also has several important limitations. Most importantly, we presented secondary analysis of individual items and pairs of items drawn from the 3D CAM assessment; therefore, the 2‐item bedside screen requires prospective clinical validation. The reference standard was based on the DSM‐IV, because this study was conducted prior to the release of DSM‐V. In addition, the ordering of the reference standard and 3D‐CAM assessments was not randomized due to feasibility constraints. In addition, this study was cross‐sectional, involved only a single hospital, and enrolled only older medical patients during the day shift. Our sample was older (aged 75 years and older), and a younger sample may have had a different prevalence of delirium, which could affect the positive predictive value of our ultrabrief screen. We plan to test this in a sample of patients aged 70 years and older in future studies. Finally, it should be noted that these best 1‐item and 2‐item screeners miss 17% and 7% of delirium cases, respectively. In cases where this is unacceptably high, alternative approaches might be necessary.
It is important to remember that these 1‐ and 2‐item screeners are not diagnostic tools and therefore should not be used in isolation. Optimally, they will be followed by a more specific evaluation, such as the 3D‐CAM, as part of a systematic delirium identification process. For instance, in our sample (with a delirium rate of 21%), the best 2‐item screener had a positive predictive value of 41%, meaning that positive screens are more likely to be false positives than true positives (see Supporting Tables 2 and 3 in the online version of this article).[32] Nevertheless, by reducing the total number of patients who require diagnostic instrument administration, use of these ultrabrief screeners can improve efficiency and result in a net benefit to delirium case‐identification efforts.[32]
Time has been demonstrated to be a barrier to delirium identification in previous studies, but there are likely others. These may include, for instance, staff nihilism about screening making a difference, ambiguous responsibility for delirium screening and management, unsupportive system leadership, and absent payment for these activities.[31] Moreover, it is possible that the 2‐step process we propose may create an incentive for staff to avoid positive screens as they see it creating more work for themselves. We plan to identify and address such barriers in our future work.
In conclusion, we identified a single screening item for delirium, Months of the year backwards, with 83% sensitivity, and a pair of items, Months of the year backwards and What is the day of the week?, with 93% sensitivity relative to a rigorous reference standard diagnosis. These ultrabrief screening items work well in patients with and without dementia, and should require very little training of staff. Future studies should further validate these tools, and determine their translatability and scalability into programs for systematic, widespread delirium detection. Developing efficient and accurate case identification strategies is a necessary prerequisite to appropriately target delirium management protocols, enabling healthcare systems to effectively address this costly and deadly condition.
Disclosures
Author contributionsD.M.F. conceived the study idea, participated in its design and coordination, and drafted the initial manuscript. S.K.I. contributed to the study design and conceptualization, supervision, funding, preliminary analysis, and interpretation of the data, and critical revision of the manuscript. J.G. conducted the analysis for the study and critically revised the manuscript. L.N. supervised the analysis for the study and critically revised the manuscript. R.J. contributed to the study design and critical revision of the manuscript. J.S.S. critically revised the manuscript. E.R.M. obtained funding for the study, supervised all data collection, assisted in drafting and critically revising the manuscript, and contributed to the conceptualization, design, and supervision of the study. All authors have seen and agree with the contents of the manuscript.
This work was supported by the National Institute of Aging grant number R01AG030618 and K24AG035075 to Dr. Marcantonio. Dr. Inouye's time was supported in part by grants P01AG031720, R01AG044518, and K07AG041835 from the National Institute on Aging. Dr. Inouye holds the Milton and Shirley F. Levy Family Chair (Hebrew Senior Life/Harvard Medical School). Dr. Fick is partially supported from National Institute of Nursing Research grant number R01 NR011042. Dr. Saczynski was supported in part by funding from the National Institute on Aging (K01AG33643) and from the National Heart Lung and Blood Institute (U01HL105268). The funding agencies had no role and the authors retained full autonomy in the preparation of this article. All authors and coauthors have no financial or nonfinancial conflicts of interest to disclose regarding this article.
This article was presented at the Presidential Poster Session at the American Geriatrics Society 2014 Annual Meeting in Orlando, Florida, May 14, 2014.
- , , , , , Delirium in elderly patients and the risk of postdischarge mortality, institutionalization, and dementia: a meta‐analysis. JAMA. 2010;304(4):443–451.
- , , , et al. Cognitive trajectories after postoperative delirium. N Engl J Med. 2012;367(1):30–39.
- , , Delirium in elderly people. Lancet. 2014;383:911–922.
- , , , Delirium superimposed on dementia is associated with prolonged length of stay and poor outcomes in hospitalized older adults. J Hosp Med. 2013;8(9):500–505.
- , , , , One‐year health care costs associated with delirium in the elderly population. Arch Intern Med. 2008;168(1):27–32.
- , The importance of delirium: Economic and societal costs. J Am Geriatr Soc. 2011;59(suppl 2):S241–S243.
- Delirium. Ann Intern Med. 2011;154(11):ITC6.
- , , , , , Fostering implementation of health services research findings into practice: a consolidated framework for advancing implementation science. Implement Sci. 2009;4:50.
- , , , Mixed‐methods approach to understanding nurses' clinical reasoning in recognizing delirium in hospitalized older adults. J Contin Educ Nurs. 2014;45:1–13.
- , , Educational interventions to improve recognition of delirium: a systematic review. J Am Geriatr Soc. 2013;61(11):1983–1993.
- , Delirium superimposed on dementia: accuracy of nurse documentation. J Gerontol Nurs. 2012;38(1):32–42.
- , , , et al. Detection of delirium by bedside nurses using the confusion assessment method. J Am Geriatr Soc. 2006;54:685–689.
- , , , et al. Documentation of delirium in elderly patients with hip fracture. J Gerontol Nurs. 2002;28(11):23–29.
- , , , Recorded delirium in a national sample of elderly inpatients: potential implications for recognition. J Geriatr Psychiatry Neurol. 2003;16(1):32–38.
- , , , et al. A tale of two methods: chart and interview methods for identifying delirium. J Am Geriatr Soc. 2014;62(3):518–524.
- , , , et al. 3D‐CAM: Derivation and validation of a 3‐minute diagnostic interview for CAM‐defined delirium: a cross‐sectional diagnostic test study. Ann Intern Med. 2014;161(8):554–561.
- , , , et al. Selecting optimal screening items for delirium: an application of item response theory. BMC Med Res Methodol. 2013;13:8.
- , , , et al. The Montreal Cognitive Assessment, MoCA: a brief screening tool for mild cognitive impairment. J Am Geriatr Soc. 2005;53(4):695–699.
- Geriatric Depression Scale. Psychopharmacol Bull. 1988;24(4):709–711.
- , , , A new method of classifying prognostic comorbidity in longitudinal studies: development and validation. J Chronic Dis. 1987;40(5):373–383.
- , , , , Studies of illness in the aged: the index of ADL: a standardized measure of biological and psychosocial function. JAMA. 1963;185:914–919.
- , Assessment of older people: self‐maintaining and instrumental activities of daily living. Gerontologist. 1969;9(3):179–186.
- , , , et al. The AD8: a brief informant interview to detect dementia. Neurology. 2005;65(4):559–564.
- , , , et al. The diagnosis of dementia due to Alzheimer's disease: recommendations from the National Institute on Aging‐Alzheimer's Association workgroups on diagnostic guidelines for Alzheimer's disease. Alzheimers Dement. 2011;7(3):263–269.
- , , , et al. Delirium diagnosis methodology used in research: a survey‐based study. Am J Geriatr Psychiatry. 2014;22(12):1513–1521.
- , , , , Single Question in Delirium (SQiD): testing its efficacy against psychiatrist interview, the Confusion Assessment Method and the Memorial Delirium Assessment Scale. Palliat Med. 2010;24(6):561–565.
- , , , et al. Diagnosing delirium in older emergency department patients: validity and reliability of the delirium triage screen and the brief confusion assessment method. Ann Emerg Med. 2013;62(5):457–465.
- , , , et al. Attention! A good bedside test for delirium? J Neurol Neurosurg Psychiatry. 2014;85(10):1122–1131.
- , , , , A model for management of delirious postacute care patients. J Am Geriatr Soc. 2005;53(10):1817–1825.
- , , , Computerized decision support for delirium superimposed on dementia in older adults: a pilot study. J Gerontol Nurs. 2011;37(4):39–47.
- , , , et al. Barriers and facilitators to implementing delirium rounds in a clinical trial across three diverse hospital settings. Clin Nurs Res. 2014;23(2):201–215.
- , Antecedent probability and the efficiency of psychometric signs, patterns, or cutting scores. Psychol Bull. 1955;52(3):194.
Delirium (acute confusion) is common in older adults and leads to poor outcomes, such as death, clinician and caregiver burden, and prolonged cognitive and functional decline.[1, 2, 3, 4] Delirium is extremely costly, with estimates ranging from $143 to $152 billion annually (2005 US$).[5, 6] Early detection and management may improve the poor outcomes and reduce costs attributable to delirium,[3, 7] yet delirium identification in clinical practice has been challenging, particularly when translating research tools to the bedside.[8, 9, 10]As a result, only 12% to 35% of delirium cases are detected in routine care, with hypoactive delirium and delirium superimposed on dementia most likely to be missed.[11, 12, 13, 14, 15]
To address these issues, we recently developed and published the three‐dimensional Confusion Assessment Method (3D‐CAM), the 3‐minute diagnostic assessment for CAM‐defined delirium.[16] The 3D‐CAM is a structured assessment tool that includes mental status testing, patient symptom probes, and guided interviewer observations for signs of delirium. 3D‐CAM items were selected through a rigorous process to determine the most informative items for the 4 CAM diagnostic features.[17] The 3D‐CAM can be completed in 3 minutes, and has 95% sensitivity and 94% specificity relative to a reference standard.[16]
Despite the capabilities of the 3D‐CAM, there are situations when even 3 minutes is too long to devote to delirium identification. Moreover, a 2‐step approach in which a sensitive ultrabrief screen is administered, followed by the 3D‐CAM in positives, may be the most efficient approach for large‐scale delirium case identification. The aim of the current study was to use the 3D‐CAM database to identify the most sensitive single item and pair of items in the diagnosis of delirium, using the reference standard in the diagnostic accuracy analysis. We hypothesized that we could identify a single item with greater than 80% sensitivity and a pair of items with greater than 90% sensitivity for detection of delirium.
METHODS
Study Sample and Design
We analyzed data from the 3D‐CAM validation study,[16] which prospectively enrolled participants from a large urban teaching hospital in Boston, Massachusetts, using a consecutive enrollment sampling strategy. Inclusion criteria were: (1) 75 years old, (2) admitted to general or geriatric medicine services, (3) able to communicate in English, (4) without terminal conditions, (5) expected hospital stay of 2 days, (6) not a previous study participant. Experienced clinicians screened patients for eligibility. If the patient lacked capacity to provide consent, the designated surrogate decision maker was contacted. The study was approved by the institutional review board.
Reference Standard Delirium Diagnosis
The reference standard delirium diagnosis was based on an extensive (45 minutes) face‐to‐face patient interview by experienced clinician assessors (neuropsychologists or advanced practice nurses), medical record review, and input from the nurse and family members. This comprehensive assessment included: (1) reason for hospital admission, hospital course, and presence of cognitive concerns, (2) family, social, and functional history, (3) Montreal Cognitive Assessment,[18] (4) Geriatric Depression Scale,[19] (5) medical record review including scoring of comorbidities using the Charlson index,[20] determination of functional status using the basic and Instrumental Activities of Daily Living,[21, 22] psychoactive medications administered, and (6) a family member interview to assess the patient's baseline cognitive status that included the Eight‐Item Interview to Differentiate Aging and Dementia,[23] to assess the presence of dementia. Using all of these data, an expert panel, including the clinical assessor, the study principal investigator (E.R.M.), a geriatrician, and an experienced neuropsychologist, adjudicated the final delirium diagnoses using Diagnostic and Statistical Manual of Mental Disorders, 4th Edition (DSM‐IV) criteria. The panel also adjudicated for the presence or absence of dementia and mild cognitive impairment based on National Institute on Aging‐Alzheimer's Association (NIA‐AA) criteria.[24] This approach has been used in other delirium studies.[25]
3D‐CAM Assessments
After the reference standard assessment, the 3D‐CAM was administered by trained research assistants (RAs) who were blinded to the results of the reference standard. To reduce the likelihood of fluctuations or temporal changes, all assessments were completed between 11:00 am and 2:00 pm and for each participant, within a 2‐hour time period (for example, 11:23 am to 1:23 pm).
Statistical Analyses to Determine the Best Single‐ and Two‐Item Screeners
To determine the best single 3D‐CAM item to identify delirium, the responses of the 20 individual items in the 3D‐CAM (see Supporting Table 1 in the online version of this article) were compared to the reference standard to determine their sensitivity and specificity. Similarly, an algorithm was used to generate all unique 2‐item combinations of the 20 items (190 unique pairs), which were compared to the reference. An error, no response, or an answer of I do not know by the patient was considered a positive screen for delirium. The 2‐item screeners were considered positive if 1 or both of the items were positive. Sensitivity and specificity were calculated along with 95% confidence intervals (CIs).
Subset analyses were performed to determine sensitivity and specificity of individual items and pairs of items stratified by the patient's baseline cognitive status. Two strata were createdpatients with dementia (N=56), and patients with normal baseline cognitive status or mild cognitive impairment (MCI) (N=145). We chose to group MCI with normal for 2 reasons: (1) dementia is a well‐established and strong risk factor for delirium, whereas the evidence for MCI being a risk factor for delirium is less established and (2) to achieve adequate allocation of delirious cases in both strata. Last, we report the sensitivity of altered level of consciousness (LOC), which included lethargy, stupor, coma, and hypervigilance as a single screening item for delirium in the overall sample and by cognitive status. Analyses were conducted using commercially available software (SAS version 9.3; SAS Institute, Inc., Cary, NC).
RESULTS
Characteristics of the patients are shown in Table 1. Subjects had a mean age of 84 years, 62% were female, and 28% had a baseline dementia. Forty‐two (21%) had delirium based on the clinical reference standard. Twenty (10%) had less than a high school education and 100 (49%) had at least a college education.
| Characteristic | N (%) |
|---|---|
| |
| Age, y, mean (SD) | 84 (5.4) |
| Sex, n (%) female | 125 (62) |
| White, n (%) | 177 (88) |
| Education, n (%) | |
| Less than high school | 20 (10) |
| High school graduate | 75 (38) |
| College plus | 100 (49) |
| Vision interfered with interview, n (%) | 5 (2) |
| Hearing interfered with interview, n (%) | 18 (9) |
| English second language n (%) | 10 (5) |
| Charlson, mean (SD) | 3 (2.3) |
| ADL, n (% impaired) | 110 (55) |
| IADL, n (% impaired) | 163 (81) |
| MCI, n (%) | 50 (25) |
| Dementia, n (%) | 56 (28) |
| Delirium, n (%) | 42 (21) |
| MoCA, mean (SD) | 19 (6.6) |
| MoCA, median (range) | 20 (030) |
Single Item Screens
Table 2 reports the results of single‐item screens for delirium with sensitivity, the ability to correctly identify delirium when it is present by the reference standard, and specificity, the ability to correctly identify patients without delirium when it is not present by reference standard and 95% CIs. Items are listed in descending order of sensitivity; in the case of ties, the item with the higher specificity is listed first. The screening items with the highest sensitivity for delirium are Months of the year backwards, and Four digits backwards, both with a sensitivity of 83% (95% CI: 69%‐93%). Of these 2 items, Months of the year backwards had a much better specificity of 69% (95% CI: 61%‐76%), whereas Four digits backwards had a specificity of 52% (95% CI: 44%‐60%). The item What is the day of the week? had lower sensitivity at 71% (95% CI: 55%‐84%), but excellent specificity at 92% (95% CI: 87%‐96%).
| Screen Item | Screen Positive (%)c | Sensitivity (95% CI) | Specificity (95% CI) | LR | LR |
|---|---|---|---|---|---|
| |||||
| Months of the year backwards | 42 | 0.83 (0.69‐0.93) | 0.69 (0.61‐0.76) | 2.7 | 0.24 |
| Four digits backwards | 56 | 0.83 (0.69‐0.93) | 0.52 (0.44‐0.60) | 1.72 | 0.32 |
| What is the day of the week? | 21 | 0.71 (0.55‐0.84) | 0.92 (0.87‐0.96) | 9.46 | 0.31 |
| What is the year? | 16 | 0.55 (0.39‐0.70) | 0.94 (0.9‐0.97) | 9.67 | 0.48 |
| Have you felt confused during the past day? | 14 | 0.50 (0.34‐0.66) | 0.95 (0.9‐0.98) | 9.94 | 0.53 |
| Days of the week backwards | 15 | 0.50 (0.34‐0.66) | 0.94 (0.89‐0.97) | 7.95 | 0.53 |
| During the past day, did you see things that were not really there? | 11 | 0.45 (0.3‐0.61) | 0.97 (0.94‐0.99) | 17.98 | 0.56 |
| Three digits backwards | 15 | 0.45 (0.3‐0.61) | 0.92 (0.87‐0.96) | 5.99 | 0.59 |
| What type of place is this? | 9 | 0.38 (0.24‐0.54) | 0.99 (0.96‐1) | 30.29 | 0.63 |
| During the past day, did you think you were not in the hospital? | 10 | 0.38 (0.24‐0.54) | 0.97 (0.94‐0.99) | 15.14 | 0.64 |
We then examined performance of single‐item screeners in patients with and without dementia (Table 3). In persons with dementia, the best single item was also Months of the year backwards, with a sensitivity of 89% (95% CI: 72%‐98%) and a specificity of 61% (95% CI: 41%‐78%). In persons with normal baseline cognition or MCI, the best performing single item was Four digits backwards, with sensitivity of 79% (95% CI: 49%‐95%) and specificity of 51% (95% CI: 42%‐60%). Months of the year backwards also performed well, with sensitivity of 71% (95% CI: 42%‐92%) and specificity of 71% (95% CI: 62%‐79%).
| Test Item | Normal/MCI Patients (n=145) | Dementia Patients (n=56) | ||||||||
|---|---|---|---|---|---|---|---|---|---|---|
| Screen Positive (%)b | Sensitivity (95% CI) | Specificity (95% CI) | LR | LR | Screen Positive (%)b | Sensitivity (95% CI) | Specificity (95% CI) | LR | LR | |
| ||||||||||
| Months backwards | 33 | 0.71 (0.42‐0.92) | 0.71 (0.62‐0.79) | 2.46 | 0.4 | 64 | 0.89 (0.72‐0.98) | 0.61 (0.41‐0.78) | 2.27 | 0.18 |
| Four digits backwards | 52 | 0.79 (0.49‐0.95) | 0.51 (0.42‐0.60) | 1.61 | 0.42 | 66 | 0.86 (0.67‐0.96) | 0.54 (0.34‐0.72) | 1.85 | 0.27 |
| What is the day of the week? | 10 | 0.64 (0.35‐0.87) | 0.96 (0.91‐0.99) | 16.84 | 0.37 | 50 | 0.75 (0.55‐0.89) | 0.75 (0.55‐0.89) | 3 | 0.33 |
Two‐Item Screens
Table 4 reports the results of 2‐item screens for delirium with sensitivity, specificity, and 95% CIs. Item pairs are listed in descending order of sensitivity following the same convention as in Table 2. The 2‐item screen with the highest sensitivity for delirium is the combination of What is the day of the week? and Months of the year backwards, with a sensitivity of 93% (95% CI: 81%‐99%) and specificity of 64% (95% CI: 56%‐70%). This screen had a positive and negative likelihood ratio (LR) of 2.59 and 0.11, respectively. The combination of What is the day of the week? and Four digits backwards had the same sensitivity 93% (95% CI: 81%‐99%), but lower specificity of 48% (95% CI: 40%‐56%). The combination of What type of place is this? (hospital) and Four digits backwards had a sensitivity of 90% (95% CI: 77%‐97%) and specificity of 51% (95% CI: 43%‐50%).
| Screen Item 1 | Screen Item 2 | Screen Positive (%)c | Sensitivity (95% CI) | Specificity (95% CI) | LR | LR |
|---|---|---|---|---|---|---|
| ||||||
| What is the day of the week? | Months backwards | 48 | 0.93 (0.81‐0.99) | 0.64 (0.56‐0.70) | 2.59 | 0.11 |
| What is the day of the week? | Four digits backwards | 60 | 0.93 (0.81‐0.99) | 0.48 (0.4‐0.56) | 1.8 | 0.15 |
| Four digits backwards | Months backwards | 65 | 0.93 (0.81‐0.99) | 0.42 (0.34‐0.50) | 1.6 | 0.17 |
| What type of place is this? | Four digits backwards | 58 | 0.90 (0.77‐0.97) | 0.51 (0.43‐0.50) | 1.84 | 0.19 |
| What is the year? | Four digits backwards | 59 | 0.9 (0.77‐0.97) | 0.5 (0.42‐0.5) | 1.80 | 0.19 |
| What is the day of the week? | Three digits backwards | 30 | 0.88 (0.74‐0.96) | 0.86 (0.79‐0.90) | 6.09 | 0.14 |
| What is the year? | Months backwards | 44 | 0.88 (0.74‐0.96) | 0.68 (0.6‐0.75) | 2.75 | 0.18 |
| What type of place is this? | Months backwards | 43 | 0.86 (0.71‐0.95) | 0.69 (0.61‐0.70) | 2.73 | 0.21 |
| During the past day, did you think you were not in the hospital? | Months backwards | 43 | 0.86 (0.71‐0.95) | 0.69 (0.61‐0.70) | 2.73 | 0.21 |
| Days of the week backwards | Months backwards | 43 | 0.86 (0.71‐0.95) | 0.68 (0.6‐0.75) | 2.67 | 0.21 |
When subjects were stratified by baseline cognition, the best 2‐item screens for normal and MCI patients was What is the day of the week? and Four digits backwards, with 93% sensitivity (95% CI: 66%‐100%) and 50% specificity (95% CI: 42%‐59%). The best pair of items for patients with dementia (Table 5) was the same as the overall sample, What is the day of the week? and Months of the year backwards, but its performance differed with a higher sensitivity of 96% (95% CI: 82%‐100%) and lower specificity of 43% (95% CI: 24%‐63%). This same pair of items had 86% sensitivity (95% CI: 57%‐98%) and 69% (95% CI: 60%‐77%) specificity for persons with either normal cognition or MCI.
| Test Item 1 | Test Item 2 | Normal/MCI Patients (n=145) | Dementia Patients (n=56) | ||||||||
|---|---|---|---|---|---|---|---|---|---|---|---|
| Item Positive (%)b | Sensitivity (95% CI) | Specificity (95% CI) | LR | LR | Item Positive (%)b | Sensitivity (95% CI) | Specificity (95% CI) | LR | LR | ||
| |||||||||||
| What is the day of the week? | Months backwards | 36 | 0.86 (0.57‐0.98) | 0.69 (0.60‐0.77) | 2.74 | 0.21 | 77 | 0.96 (0.82‐1) | 0.43 (0.24‐0.63) | 1.69 | 0.08 |
| What is the day of the week? | Four digits backwards | 54 | 0.93 (0.66‐1) | 0.5 (0.42‐0.59) | 1.87 | 0.14 | 77 | 0.93 (0.76‐0.99) | 0.39 (0.22‐0.59) | 1.53 | 0.18 |
| Four digits backwards | Months backwards | 61 | 0.93 (0.66‐1) | 0.43 (0.34‐0.52) | 1.62 | 0.17 | 77 | 0.93 (0.76‐0.99) | 0.39 (0.22‐0.59) | 1.53 | 0.18 |
Altered Level of Consciousness as a Screener for Delirium
Altered level of consciousness (ALOC) was uncommon in our sample, with an overall prevalence of 10/201 (4.9%). When examined as a screening item for delirium, ALOC had very poor sensitivity of 19% (95% CI: 9%‐34%) but had excellent specificity 99% (95% CI: 96%‐100%). Altered LOC also demonstrated poor screening performance when stratified by cognitive status, with a sensitivity of 14% in the normal and MCI group (95% CI: 2%‐43%) and sensitivity of 21% (95% CI: 8%‐41%) in persons with dementia.
Positive and Negative Predictive Values
Although we focused on sensitivity and specificity in evaluating 1‐ and 2‐item screeners, we also examined positive and negative predictive values. These values will vary depending on the overall prevalence of delirium, which was 21% in this dataset. The best 1‐item screener, Months of the year backwards, had a positive predictive value of 31% and negative predictive value of 94%. The best 2‐item screener, Months of the year backwards with What is the day of the week?, had a positive predictive value of 41% and negative predictive value of 97% (see Supporting Tables 2 and 3 in the online version of this article) LRs for the items are in Tables 2 through 5.
DISCUSSION
Identifying simple, efficient, bedside case‐identification methods for delirium is an essential step toward improving recognition of this highly morbid syndrome in hospitalized older adults. In this study, we identified a single cognitive item, Months of the year backwards, that identified 83% of delirium cases when compared with a reference standard diagnosis. Furthermore, we identified 2 items, Months of the year backwards and What is the day of the week? which when used in combination identified 93% of delirium cases. The same 1 and 2 items also worked well in patients with dementia, in whom delirium is often missed. Although these items require further clinical validation, the development of an ultrabrief 2‐item test that identifies over 90% of delirium cases and can be completed in less than 1 minute (recently, we administered the best 2‐item screener to 20 consecutive general medicine patients over age 70 years, and it was completed in a median of 36.5 seconds), holds great potential for simplifying bedside delirium screening and improving the care of hospitalized older adults.
Our current findings both confirm and extend the emerging literature on best screening items for delirium. Sands and colleagues (2010)[26] tested a single test for delirium, Do you think (name of patient) has been more confused lately? in 21 subjects and achieved a sensitivity of 80%. Han and colleagues developed a screening tool in emergency‐department patients using the LOC question from the Richmond Agitation‐Sedation Scale and spelling the word lunch backwards, and achieved 98% sensitivity, but in a younger emergency department population with a low prevalence of dementia.[27] O'Regan et al. recently also found Months of the year backwards to be the best single‐screening item for delirium in a large sample, but only tested a 1‐item screen.[28] Our study extends these studies in several important ways by: (1) employing a rigorous clinical reference standard diagnosis of delirium, (2) having a large sample with a high prevalence of patients with dementia, (3) use of a general medical population, and (4) examining the best 2‐item screens in addition to the best single item.
Systematic intervention programs[29, 30, 31] that focus on improved delirium evaluation and management have the potential to improve patient outcomes and reduce costs. However, targeting these programs to patients with delirium has proven difficult, as only 12% to 35% of delirium cases are recognized in routine clinical practice.[11, 12, 13, 14, 15] The 1‐ and 2‐item screeners we identified could play an important role in future delirium identification. The 3D‐CAM combines high sensitivity (95%) with high specificity (94%)[16] and therefore would be an excellent choice as the second step after a positive screen. The feasibility, effectiveness, and cost of administering these screeners, followed by a brief diagnostic tool such as the 3D‐CAM, should be evaluated in future work.
Our study has noteworthy strengths, including the use of a large purposefully challenging clinical sample with advanced age that included a substantial proportion with dementia, a detailed assessment, and the testing of very brief and practical tools for bedside delirium screening.[25] This study also has several important limitations. Most importantly, we presented secondary analysis of individual items and pairs of items drawn from the 3D CAM assessment; therefore, the 2‐item bedside screen requires prospective clinical validation. The reference standard was based on the DSM‐IV, because this study was conducted prior to the release of DSM‐V. In addition, the ordering of the reference standard and 3D‐CAM assessments was not randomized due to feasibility constraints. In addition, this study was cross‐sectional, involved only a single hospital, and enrolled only older medical patients during the day shift. Our sample was older (aged 75 years and older), and a younger sample may have had a different prevalence of delirium, which could affect the positive predictive value of our ultrabrief screen. We plan to test this in a sample of patients aged 70 years and older in future studies. Finally, it should be noted that these best 1‐item and 2‐item screeners miss 17% and 7% of delirium cases, respectively. In cases where this is unacceptably high, alternative approaches might be necessary.
It is important to remember that these 1‐ and 2‐item screeners are not diagnostic tools and therefore should not be used in isolation. Optimally, they will be followed by a more specific evaluation, such as the 3D‐CAM, as part of a systematic delirium identification process. For instance, in our sample (with a delirium rate of 21%), the best 2‐item screener had a positive predictive value of 41%, meaning that positive screens are more likely to be false positives than true positives (see Supporting Tables 2 and 3 in the online version of this article).[32] Nevertheless, by reducing the total number of patients who require diagnostic instrument administration, use of these ultrabrief screeners can improve efficiency and result in a net benefit to delirium case‐identification efforts.[32]
Time has been demonstrated to be a barrier to delirium identification in previous studies, but there are likely others. These may include, for instance, staff nihilism about screening making a difference, ambiguous responsibility for delirium screening and management, unsupportive system leadership, and absent payment for these activities.[31] Moreover, it is possible that the 2‐step process we propose may create an incentive for staff to avoid positive screens as they see it creating more work for themselves. We plan to identify and address such barriers in our future work.
In conclusion, we identified a single screening item for delirium, Months of the year backwards, with 83% sensitivity, and a pair of items, Months of the year backwards and What is the day of the week?, with 93% sensitivity relative to a rigorous reference standard diagnosis. These ultrabrief screening items work well in patients with and without dementia, and should require very little training of staff. Future studies should further validate these tools, and determine their translatability and scalability into programs for systematic, widespread delirium detection. Developing efficient and accurate case identification strategies is a necessary prerequisite to appropriately target delirium management protocols, enabling healthcare systems to effectively address this costly and deadly condition.
Disclosures
Author contributionsD.M.F. conceived the study idea, participated in its design and coordination, and drafted the initial manuscript. S.K.I. contributed to the study design and conceptualization, supervision, funding, preliminary analysis, and interpretation of the data, and critical revision of the manuscript. J.G. conducted the analysis for the study and critically revised the manuscript. L.N. supervised the analysis for the study and critically revised the manuscript. R.J. contributed to the study design and critical revision of the manuscript. J.S.S. critically revised the manuscript. E.R.M. obtained funding for the study, supervised all data collection, assisted in drafting and critically revising the manuscript, and contributed to the conceptualization, design, and supervision of the study. All authors have seen and agree with the contents of the manuscript.
This work was supported by the National Institute of Aging grant number R01AG030618 and K24AG035075 to Dr. Marcantonio. Dr. Inouye's time was supported in part by grants P01AG031720, R01AG044518, and K07AG041835 from the National Institute on Aging. Dr. Inouye holds the Milton and Shirley F. Levy Family Chair (Hebrew Senior Life/Harvard Medical School). Dr. Fick is partially supported from National Institute of Nursing Research grant number R01 NR011042. Dr. Saczynski was supported in part by funding from the National Institute on Aging (K01AG33643) and from the National Heart Lung and Blood Institute (U01HL105268). The funding agencies had no role and the authors retained full autonomy in the preparation of this article. All authors and coauthors have no financial or nonfinancial conflicts of interest to disclose regarding this article.
This article was presented at the Presidential Poster Session at the American Geriatrics Society 2014 Annual Meeting in Orlando, Florida, May 14, 2014.
- , , , , , Delirium in elderly patients and the risk of postdischarge mortality, institutionalization, and dementia: a meta‐analysis. JAMA. 2010;304(4):443–451.
- , , , et al. Cognitive trajectories after postoperative delirium. N Engl J Med. 2012;367(1):30–39.
- , , Delirium in elderly people. Lancet. 2014;383:911–922.
- , , , Delirium superimposed on dementia is associated with prolonged length of stay and poor outcomes in hospitalized older adults. J Hosp Med. 2013;8(9):500–505.
- , , , , One‐year health care costs associated with delirium in the elderly population. Arch Intern Med. 2008;168(1):27–32.
- , The importance of delirium: Economic and societal costs. J Am Geriatr Soc. 2011;59(suppl 2):S241–S243.
- Delirium. Ann Intern Med. 2011;154(11):ITC6.
- , , , , , Fostering implementation of health services research findings into practice: a consolidated framework for advancing implementation science. Implement Sci. 2009;4:50.
- , , , Mixed‐methods approach to understanding nurses' clinical reasoning in recognizing delirium in hospitalized older adults. J Contin Educ Nurs. 2014;45:1–13.
- , , Educational interventions to improve recognition of delirium: a systematic review. J Am Geriatr Soc. 2013;61(11):1983–1993.
- , Delirium superimposed on dementia: accuracy of nurse documentation. J Gerontol Nurs. 2012;38(1):32–42.
- , , , et al. Detection of delirium by bedside nurses using the confusion assessment method. J Am Geriatr Soc. 2006;54:685–689.
- , , , et al. Documentation of delirium in elderly patients with hip fracture. J Gerontol Nurs. 2002;28(11):23–29.
- , , , Recorded delirium in a national sample of elderly inpatients: potential implications for recognition. J Geriatr Psychiatry Neurol. 2003;16(1):32–38.
- , , , et al. A tale of two methods: chart and interview methods for identifying delirium. J Am Geriatr Soc. 2014;62(3):518–524.
- , , , et al. 3D‐CAM: Derivation and validation of a 3‐minute diagnostic interview for CAM‐defined delirium: a cross‐sectional diagnostic test study. Ann Intern Med. 2014;161(8):554–561.
- , , , et al. Selecting optimal screening items for delirium: an application of item response theory. BMC Med Res Methodol. 2013;13:8.
- , , , et al. The Montreal Cognitive Assessment, MoCA: a brief screening tool for mild cognitive impairment. J Am Geriatr Soc. 2005;53(4):695–699.
- Geriatric Depression Scale. Psychopharmacol Bull. 1988;24(4):709–711.
- , , , A new method of classifying prognostic comorbidity in longitudinal studies: development and validation. J Chronic Dis. 1987;40(5):373–383.
- , , , , Studies of illness in the aged: the index of ADL: a standardized measure of biological and psychosocial function. JAMA. 1963;185:914–919.
- , Assessment of older people: self‐maintaining and instrumental activities of daily living. Gerontologist. 1969;9(3):179–186.
- , , , et al. The AD8: a brief informant interview to detect dementia. Neurology. 2005;65(4):559–564.
- , , , et al. The diagnosis of dementia due to Alzheimer's disease: recommendations from the National Institute on Aging‐Alzheimer's Association workgroups on diagnostic guidelines for Alzheimer's disease. Alzheimers Dement. 2011;7(3):263–269.
- , , , et al. Delirium diagnosis methodology used in research: a survey‐based study. Am J Geriatr Psychiatry. 2014;22(12):1513–1521.
- , , , , Single Question in Delirium (SQiD): testing its efficacy against psychiatrist interview, the Confusion Assessment Method and the Memorial Delirium Assessment Scale. Palliat Med. 2010;24(6):561–565.
- , , , et al. Diagnosing delirium in older emergency department patients: validity and reliability of the delirium triage screen and the brief confusion assessment method. Ann Emerg Med. 2013;62(5):457–465.
- , , , et al. Attention! A good bedside test for delirium? J Neurol Neurosurg Psychiatry. 2014;85(10):1122–1131.
- , , , , A model for management of delirious postacute care patients. J Am Geriatr Soc. 2005;53(10):1817–1825.
- , , , Computerized decision support for delirium superimposed on dementia in older adults: a pilot study. J Gerontol Nurs. 2011;37(4):39–47.
- , , , et al. Barriers and facilitators to implementing delirium rounds in a clinical trial across three diverse hospital settings. Clin Nurs Res. 2014;23(2):201–215.
- , Antecedent probability and the efficiency of psychometric signs, patterns, or cutting scores. Psychol Bull. 1955;52(3):194.
© 2015 Society of Hospital Medicine
Physician Skin Examinations for Melanoma Screening
In the United States an estimated 73,870 new cases of melanoma will be diagnosed in 2015.1 Although melanoma accounts for less than 2% of all US skin cancer cases, it is responsible for the vast majority of skin cancer deaths. From 2007 to 2011, melanoma mortality rates decreased by 2.6% per year in individuals younger than 50 years but increased by 0.6% per year among those 50 years and older.1 Reports of the direct annual treatment costs for melanoma in the United States have ranged from $44.9 million for Medicare recipients with existing cases of melanoma to $932.5 million for newly diagnosed melanomas across all age groups.2
Melanoma survival rates are inversely related to tumor thickness at the time of diagnosis.3 Melanoma can be cured if caught early and properly treated. Secondary preventative measures include physician skin examinations (PSEs), which may increase the likelihood of detecting melanomas in earlier stages, thereby potentially increasing survival rates and quality of life as well as decreasing treatment costs. Physician skin examinations are performed in the physician’s office and are safe, noninvasive, and painless. Patients with suspicious lesions should subsequently undergo a skin biopsy, which is a low-risk procedure. False-positives from biopsies do not lead to extreme patient morbidity, and false-negatives will hopefully be detected at a subsequent visit.
There is a lack of consensus regarding recommendations for PSEs for skin cancer screening. Due to a lack of randomized controlled trials on the effects of skin cancer screening on patient morbidity and mortality, the US Preventive Services Task Force (USPSTF) has concluded that there is insufficient evidence to recommend for or against such screening4; however, other organizations including the American Cancer Society and the American Academy of Dermatology recommend periodic skin cancer screening examinations.1,5 In a rapidly changing health care climate and with the rollout of the Patient Protection and Affordable Care Act, a USPSTF recommendation for skin screening with PSEs for skin cancer would have a large impact on clinical practice in the United States.
This article provides a systematic review of the current domestic and international data regarding the impact of PSEs on melanoma tumor thickness at the time of diagnosis as well as mortality from melanoma.
Methods
Search Strategy
A systematic search of PubMed articles indexed for MEDLINE and Embase for studies related to melanoma and PSEs was performed for the period from each database’s inception to November 8, 2014. One of the authors (S.L.M.) designed a broad search strategy with assistance from a medical librarian who had expertise in searching research bibliographies. Articles were excluded if they had a cross-sectional study design or were editorials or review articles. Search terms included skin neoplasm, skin cancer, or melanoma in combination with any of the following: skin examination, mass screening, screening, and secondary prevention.
Study Selection
All published studies reporting outcomes and correlations with PSEs and cutaneous melanoma in adult patients were screened. If multiple studies were published describing the same study, follow-up studies were included for data extraction, but the original study was the primary resource. Observational studies were a focus in this review, as these types of studies are much more common in this subject area.
One of the authors (S.L.M.) screened the titles and abstracts of identified studies for eligibility. If the reviewer considered a study potentially eligible based on the abstract review, a full-text review was carried out. The reference lists of eligible studies were manually searched to identify additional studies.
Data Extraction, Quality Assessment, and Data Synthesis
Data items to be extracted were agreed on before search implementation and were extracted by one investigator (S.L.M.) following criteria developed by review of the Cochrane Handbook for Systematic Reviews of Interventions.6 Study population, design, sample size, and outcomes were extracted. Risk of bias of individual articles was evaluated using a tool developed from the RTI item bank (RTI International) for determining the risk of bias and precision of eligible observational studies.7 Studies ultimately were classified into 3 categories based on the risk of bias: (1) low risk of bias, (2) medium risk of bias, and (3) high risk of bias. The strength of evidence of included studies was evaluated by the following items: risk of bias, consistency, directness, precision, and overall conclusion. Data from the included studies was synthesized qualitatively in a narrative format. This review adhered to guidelines in the Cochrane Handbook for Systematic Reviews of Interventions6 and the PRISMA (preferred reporting items for systematic reviews and meta-analyses) guidelines.8
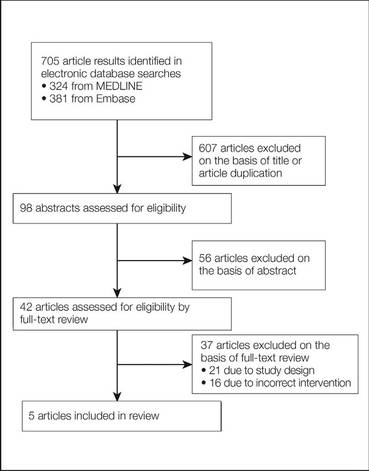
Results
A total of 705 titles were screened, 98 abstracts were assessed for eligibility, 42 full-text reviews were carried out, and 5 eligible studies were identified (Figure 1). Five observational studies were included in the final review. A summary of the results is presented in Table 1.
Included studies were assessed for several types of biases, including selection bias, attrition bias, detection bias, performance bias, and response bias. The judgments were given for each domain (Table 2). There was heterogeneity in study design, reporting of total-body skin examination methods, and reporting of outcomes among all 5 studies. All 5 studies were assessed as having a medium risk of bias.
Physician Skin Examination Impact
One article by Berwick et al9 reanalyzed data from a 1996 study10 and provided no significant evidence regarding the benefits of PSEs in the reduction of melanoma mortality. Data for 650 patients with newly diagnosed melanomas were obtained from the Connecticut Tumor Registry, a site for the National Cancer Institute’s Surveillance, Epidemiology, and End Results (SEER) program, along with 549 age- and sex-frequency matched controls from the general population.10 Participants were followed biannually for a mean of 5.4 years. Of the original 650 case patients, 122 were excluded from the study with reasons provided. Physician skin examination was defined as a positive response to the following questionnaire item: “[Before your recent biopsy] did the doctor examine your skin during any of your visits?”9 Data analysis showed no significant association between PSE and death from melanoma. Upon univariate analysis, the hazard ratio for physician screening was 0.7 (95% confidence interval [CI], 0.4-1.3).9
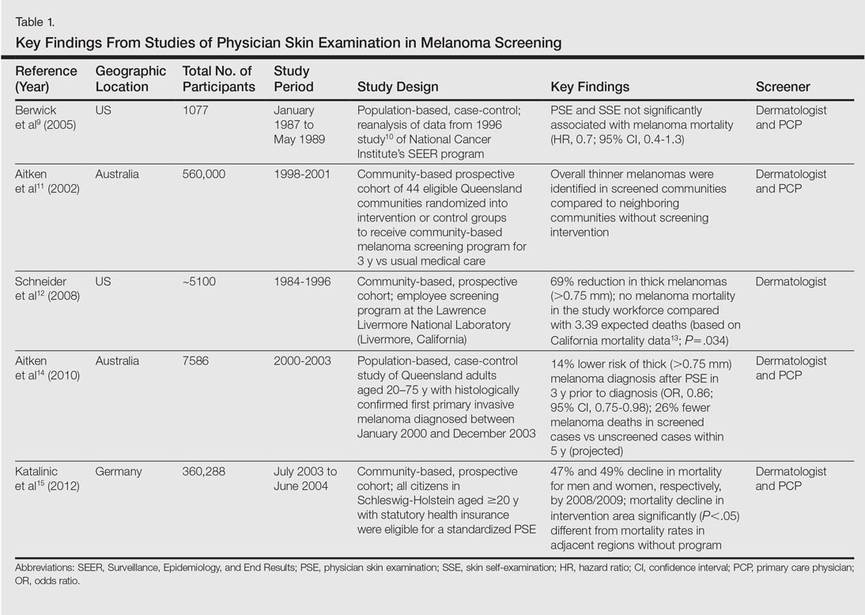
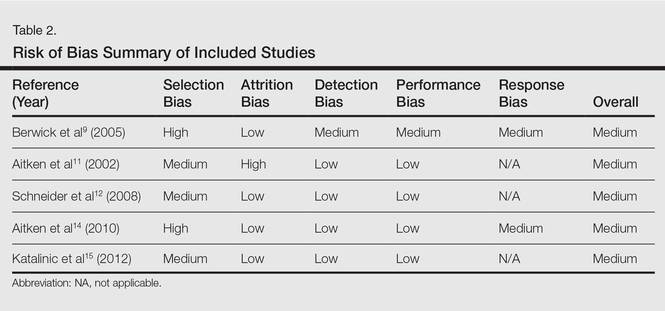
The SCREEN (Skin Cancer Research to Provide Evidence for Effectiveness of Screening in Northern Germany) project, which was undertaken in Schleswig-Holstein, Germany, is the world’s largest systematic population-based skin cancer screening program.15 The participation rate was
19% (N=360,288) of the eligible population (citizens aged ≥20 years with statutory health insurance). Screening was a 2-step process performed by trained physicians: initial general practitioner whole-body skin examination followed by referral to a dermatologist for evaluation of suspicious skin findings. Five years after the SCREEN program was conducted, melanoma mortality declined by 47% per 100,000 men and by 49% per 100,000 women. The annual percentage change in the most recent 10-year period (2000-2009) was 7.5% (95% CI, –14.0 to –0.5; P<.05) for men and 7.1% for women (95% CI,
–10.5 to –2.9; P<.05). Simultaneously, the melanoma mortality rates in the 4 unscreened adjacent regions and the rest of Germany were stable, significantly (P<.05) different from the decline in mortality observed in Schleswig-Holstein.15
A community-based, prospective cohort study investigated the impact of an employee melanoma screening program at the Lawrence Livermore National Laboratory (Livermore, California) (1984-1996) demonstrated an impact on melanoma thickness and mortality rates.12 The cohort (approximately 5100 participants) was followed over 3 phases of surveillance: (1) preawareness (1969-1975), (2) early awareness of increased melanoma risk (1976-1984), and (3) screening program (1984-1996). The screening program encouraged employees to self-examine their skin for “suggestive lesions”; if a suggestive lesion was found, a full-body skin examination was performed by a physician. After being evaluated, participants with melanoma, dysplastic nevi, 50 or more moles, or a family history of melanoma were offered a periodic full-body examination every 3 to 24 months, often with
full-body photography and dermoscopy. Physician skin screening resulted in a reduction in crude incidence of thicker melanomas (defined as
>0.75 mm) during the 3 study phases. Compared with the early-awareness period (phase 2), a 69% reduction in the diagnosis of thick melanomas was reported in the screening program period (phase 3)(P=.0001). During the screening period, no eligible melanoma deaths occurred in the study population, whereas the expected number of deaths was 3.39 (P=.034) based on observed melanoma mortality in 5 San Francisco/Oakland Bay–area counties in California as reported to the SEER program from 1984 to 1996.12
The strongest evidence for reduced thickness of melanomas detected via PSEs was reported in a population-based, case-control study by Aitken et al14 of all residents in Queensland, Australia, aged 20 to 75 years with a histologically confirmed first primary invasive cutaneous melanoma diagnosed between January 2000 and December 2003. Whole-body PSE in the 3 years before diagnosis was inversely associated with tumor thickness at diagnosis (χ2=44.37; P<.001), including a 14% lower risk of diagnosis of a thick melanoma (>0.75 mm)(odds ratio [OR], 0.86; 95% CI, 0.75-0.98) and a 40% lower risk of diagnosis of a melanoma that was 3 mm or larger (OR, 0.60; 95% CI, 0.43-0.83). The investigators applied melanoma thickness-specific survival estimates to the thickness distribution of the screened and unscreened cases in their sample to estimate melanoma deaths within 5 and 10 years of diagnosis. Compared to the unscreened cases, they estimated that the screened cases would have 26% fewer melanoma deaths within 5 years of diagnosis and 23% fewer deaths within 10 years.14
Another prospective cohort study in Queensland was designed to detect a 20% reduction in mortality from melanoma during a 15-year intervention period in communities that received a screening program.11 A total of 44 communities (aggregate population, 560,000 adults aged ≥30 years) were randomized into intervention or control groups to receive a community-based melanoma screening program for 3 years versus usual medical care.Overall, thinner melanomas were identified in communities with the screening program versus neighboring communities without it.11 Of the 33 melanomas found through the screening program, 39% (13/33) were in situ lesions, 55% (18/33) were thin (<1 mm) invasive lesions, and 6% (2/33) were 1-mm thick or greater.16 Within the population of Queensland during the period from 1999 through 2002, 36% were in situ lesions, 48% were invasive thin melanomas, and 16% were invasive melanomas 1-mm thick or more, indicating that melanomas found through screening were thinner or less advanced.17
Comment
Our review identified 5 studies describing the impact of PSEs for melanoma screening on tumor thickness at diagnosis and melanoma mortality. Key findings are highlighted in Figure 2. Our findings suggest that PSEs are associated with a decline in melanoma tumor thickness and melanoma-specific mortality. Our findings are qualitatively similar to prior reviews that supported the use of PSEs to detect thinner melanomas and improve mortality outcomes.18-20
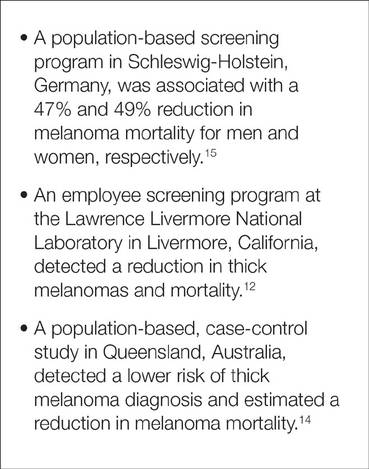
The greatest evidence for population-based screening programs was provided by the SCREEN study. This landmark study documented that screening programs utilizing primary care physicians (PCPs) and dermatologists can lead to a reduction in melanoma mortality.15 Findings from the study led to the countrywide expansion of the screening program in 2008, leading to 45 million Germans eligible for skin cancer screenings every 2 years.21 Nearly two-thirds of dermatologists (N=1348) were satisfied with routine PSE and 83% perceived a better quality of health care for skin with the 2008 expansion.22
Data suggest that physician-detected melanomas through PSEs or routine physical examinations are thinner at the time of diagnosis than those found by patients or their partners.14,23-26 Terushkin and Halpern20 analyzed 9 worldwide studies encompassing more than 7500 patients and found that physician-detected melanomas were 0.55 mm thinner than those detected by patients or their significant others. The workplace screening and education program reviewed herein also reported a reduction in thicker melanomas and melanoma mortality during the study period.12
Not all Americans have a regular dermatologist. As such, educating PCPs in skin cancer detection has been a recent area of study. The premise is that the skin examination can be integrated into routine physical examinations conducted by PCPs. The previously discussed studies, particularly Aitken et al,14 Schneider et al,12 and Katalinic et al,15 as well as the SCREEN program studies,15 suggest that integration of the skin examination into the routine physical examination may be a feasible method to reduce melanoma thickness and mortality. Furthermore, the SCREEN study15 identified participants with risk factors for melanoma, finding that approximately half of men and women (N=360,288) had at least one melanoma risk factor, which suggests that it may be more practical to design screening practices around high-risk participants.
Several studies were excluded from our analysis on the basis of study design, including cross-sectional observational studies; however, it is worth briefly commenting on the findings of the excluded studies here, as they add to the body of literature. A community-based, multi-institutional study of 566 adults with invasive melanoma assessed the role of PSEs in the year prior to diagnosis by interviewing participants in clinic within 3 months of melanoma diagnosis.24 Patients who underwent full-body PSE in the year prior to diagnosis were more than 2 times more likely to have thinner (≤1 mm) melanomas (OR, 2.51; 95% CI, 1.62-3.87]). Notably, men older than 60 years appeared to benefit the most from this practice; men in this age group contributed greatly to the observed effect, likely because they had 4 times the odds of a thinner melanoma (OR, 4.09; 95% CI, 1.88-8.89]). Thinner melanomas also were associated with an age of 60 years or younger, female sex, and higher education level.24
Pollitt et al27 analyzed the association between prediagnosis Medicaid enrollment status and melanoma tumor thickness. The study found that men and women who intermittently enrolled in Medicaid or were not enrolled until the month of diagnosis had an increased chance of late-stage melanoma when compared to other patients. Patients who continuously enrolled during the year prior to diagnosis had lower odds for thicker melanomas, suggesting that these patients had greater access to screening examinations.27
Roetzheim et al28 analyzed data from the SEER-Medicare linked dataset to investigate patterns of dermatologist and PCP visits in the 2 years before melanoma diagnosis. Medicare beneficiaries seeing both a dermatologist and a PCP prior to melanoma diagnosis had greater odds of a thinner melanoma and lower melanoma mortality compared to patients without such visits.28
Durbec et al29 conducted a retrospective, population-based study of 650 patients in France who were seen by a dermatologist for melanoma. The thinnest melanomas were reported in patients seeing a dermatologist for prospective follow-up of nevi or consulting a dermatologist for other diseases. Patients referred to a dermatologist by PCPs tended to be older and had the highest frequency of thick (>3 mm), nodular, and/or ulcerated melanomas,29 which could be interpreted as a need for greater PCP education in melanoma screening.
Rates of skin examinations have been increasing since the year 2000, both overall and among high-risk groups as reported by a recent study on skin cancer screening trends. Prevalence of having at least one total-body skin examination increased from 14.5% in 2000 to 16.5% in 2005 to 19.8% in 2010 (P<.0001).30 One study revealed a practice gap in which more than 3 in 10 PCPs and 1 in 10 dermatologists reported not screening more than half their high-risk patients for skin cancer.31 The major obstacle to narrowing the identified practice gap involves establishing a national strategy to screen high-risk individuals for skin cancer and requires partnerships among patients, PCPs, specialists, policy makers, and government sponsors.
Lack of evidence that screening for skin cancer with PSEs reduces overall mortality does not mean there is a lack of lifesaving potential of screenings. The resources required to execute a randomized controlled trial with adequate power are vast, as the USPSTF estimated 800,000 participants would be needed.4 Barriers to conducting a randomized clinical trial for skin cancer screening include the large sample size required, prolonged follow-up, and various ethical issues such as withholding screening for a cancer that is potentially curable in early stages. Lessons from screenings for breast and prostate cancers have taught us that such randomized controlled trials assessing cancer screening are costly and do not always produce definitive answers.32
Conclusion
Although proof of improved health outcomes from randomized controlled trials is still required, there is evidence to support targeted screening programs for the detection of thinner melanomas and, by proxy, reduced melanoma mortality. Amidst the health care climate change and payment reform, recommendations from national organizations on melanoma screenings are paramount. Clinicians should continue to offer regular skin examinations as the body of evidence continues to grow in support of PSEs for melanoma screening.
Acknowledgments—We are grateful to Mary Butler, PhD, and Robert Kane, MD, both from Minneapolis, Minnesota, for their guidance and consultation.
1. American Cancer Society. Cancer Facts & Figures 2015. Atlanta, GA: American Cancer Society; 2015. http: //www.cancer.org/Research/CancerFactsStatistics/cancer factsfigures2015/cancer-facts-and-figures-2015. Accessed July 6, 2015.
2. Guy G Jr, Ekwueme D, Tangka F, et al. Melanoma treatment costs: a systematic review of the literature, 1990-2011. Am J Prev. 2012;43:537-545.
3. Margolis D, Halpern A, Rebbeck T, et al. Validation of a melanoma prognostic model. Arch Dermatol. 1998;134:1597-1601.
4. Wolff T, Tai E, Miller T. Screening for skin cancer: an update of the evidence for the U.S. Preventative Services Task Force. Ann Intern Med. 2009;150:194-198.
5. American Academy of Dermatology. Melanoma
Monday. http://www.aad.org/spot-skin-cancer
/community-programs-events/melanoma-monday. Accessed August 19, 2015.
6. Higgins JPT, Green S, eds. Cochrane Handbook for
Systematic Reviews of Interventions Version 5.1.0 [updated March 2011]. The Cochrane Collaboration, 2011. http:
//www.cochrane-handbook.org. Updated March 2011. Accessed November 10, 2014.
7. Viswanathan M, Berkman N. Development of the RTI item bank on risk of bias and precision of observational studies. J Clin Epidemiol. 2012;65:163-178.
8. Moher D, Liberati A, Tetzlaff J, et al; PRISMA group. Preferred reporting items for systematic reviews and meta-analyses: the PRISMA statement [published online ahead of print July 23, 2009]. J Clin Epidemiol. 2009;62:1006-1012.
9. Berwick M, Armstrong B, Ben-Porat L. Sun exposure and mortality from melanoma. J Natl Cancer Inst. 2005;97:195-199.
10. Berwick M, Begg C, Fine J, et al. Screening for cutaneous melanoma by skin self-examination. J Natl Cancer Inst. 1996;88:17-23.
11. Aitken J, Elwood J, Lowe J, et al. A randomised trial of population screening for melanoma. J Med Screen. 2002;9:33-37.
12. Schneider J, Moore D, Mendelsohn M. Screening program reduced melanoma mortality at the Lawrence Livermore National Laboratory, 1984 to 1996. J Am Acad Dermatol. 2008;58:741-749.
13. Expert Health Data Programming Inc. Health data software and health statistics. Available from: http: //www.ehdp.com. Accessed April 1, 2001. Cited by: Schneider J, Moore D, Mendelsohn M. Screening program reduced melanoma mortality at the Lawrence Livermore National Laboratory, 1984 to 1996. J Am Acad Dermatol. 2008;58:741-749.
14. Aitken J, Elwood M, Baade P, et al. Clinical whole-body skin examination reduces the incidence of thick melanomas. Int J Cancer. 2010;126:450-458.
15. Katalinic A, Waldmann A, Weinstock M, et al. Does skin cancer screening save lives? an observational study comparing trends in melanoma mortality in regions with and without screening. Cancer. 2012;118:5395-5402.
16. Aitken J, Janda M, Elwood M, et al. Clinical outcomes from skin screening clinics within a community-based melanoma screening program. J Am Acad Dermatol. 2006;54:105-114.
17. Coory M, Baade P, Aitken JF, et al. Trends for in-situ and invasive melanoma in Queensland, Australia, 1982 to 2002. Cancer Causes Control. 2006;17:21-27.
18. Mayer JE, Swetter SM, Fu T, et al. Screening, early detection, education, and trends for melanoma: current status (2007-2013) and future directions: part II. screening, education, and future directions. J Am Acad Dermatol. 2014;71:611.e1-611.e10; quiz, 621-622.
19. Curiel-Lewandrowski C, Chen S, Swetter S, et al. Screening and prevention measures for melanoma: is there a survival advantage? Curr Oncol Rep. 2012;14:458-467.
20. Terushkin V, Halpern A. Melanoma early detection. Hematol Oncol Clin North Am. 2009;23:481-500.
21. Geller A, Greinert R, Sinclair C, et al. A nationwide population-based skin cancer screening in Germany: proceedings of the first meeting of the International Task Force on Skin Cancer Screening and Prevention (September 24 and 25, 2009) [published online ahead of print April 8, 2010]. Cancer Epidemiol. 2010;34:355-358.
22. Kornek T, Schafer I, Reusch M, et al. Routine skin cancer screening in Germany: four years of experience from the dermatologists’ perspective. Dermatology. 2012;225:289-293.
23. De Giorgi V, Grazzini M, Rossari S, et al. Is skin self-examination for cutaneous melanoma detection still adequate? a retrospective study. Dermatology. 2012;225:31-36.
24. Swetter S, Johnson T, Miller D, et al. Melanoma in middle-aged and older men: a multi-institutional survey study of factors related to tumor thickness. Arch Dermatol. 2009;145:397-404.
25. Kantor J, Kantor D. Routine dermatologist-performed full-body skin examination and early melanoma detection. Arch Dermatol. 2009;145:873-876.
26. Kovalyshyn I, Dusza S, Siamas K, et al. The impact of physician screening on melanoma detection. Arch Dermatol. 2011;147:1269-1275.
27. Pollitt R, Clarke C, Shema S, et al. California Medicaid enrollment and melanoma stage at diagnosis: a population-based study. Am J Prev Med. 2008;35:7-13.
28. Roetzheim R, Lee J, Ferrante J, et al. The influence of dermatologist and primary care physician visits on melanoma outcomes among Medicare beneficiaries. J Am Board Fam Med. 2013;26:637-647.
29. Durbec F, Vitry F, Granel-Brocard F, et al. The role of circumstances of diagnosis and access to dermatological care in early diagnosis of cutaneous melanoma: a population-based study in France. Arch Dermatol. 2010;146:240-246.
30. Lakhani N, Saraiya M, Thompson T, et al. Total body skin examination for skin cancer screening among U.S. adults from 2000 to 2010. Prev Med. 2014;61:75-80.
31. Oliveria SA, Heneghan MK, Cushman LF, et al. Skin cancer screening by dermatologists, family practitioners, and internists: barriers and facilitating factors. Arch Dermatol. 2011;147:39-44.
32. Bigby M. Why the evidence for skin cancer screening is insufficient: lessons from prostate cancer screening. Arch Dermatol. 2010;146:322-324.
In the United States an estimated 73,870 new cases of melanoma will be diagnosed in 2015.1 Although melanoma accounts for less than 2% of all US skin cancer cases, it is responsible for the vast majority of skin cancer deaths. From 2007 to 2011, melanoma mortality rates decreased by 2.6% per year in individuals younger than 50 years but increased by 0.6% per year among those 50 years and older.1 Reports of the direct annual treatment costs for melanoma in the United States have ranged from $44.9 million for Medicare recipients with existing cases of melanoma to $932.5 million for newly diagnosed melanomas across all age groups.2
Melanoma survival rates are inversely related to tumor thickness at the time of diagnosis.3 Melanoma can be cured if caught early and properly treated. Secondary preventative measures include physician skin examinations (PSEs), which may increase the likelihood of detecting melanomas in earlier stages, thereby potentially increasing survival rates and quality of life as well as decreasing treatment costs. Physician skin examinations are performed in the physician’s office and are safe, noninvasive, and painless. Patients with suspicious lesions should subsequently undergo a skin biopsy, which is a low-risk procedure. False-positives from biopsies do not lead to extreme patient morbidity, and false-negatives will hopefully be detected at a subsequent visit.
There is a lack of consensus regarding recommendations for PSEs for skin cancer screening. Due to a lack of randomized controlled trials on the effects of skin cancer screening on patient morbidity and mortality, the US Preventive Services Task Force (USPSTF) has concluded that there is insufficient evidence to recommend for or against such screening4; however, other organizations including the American Cancer Society and the American Academy of Dermatology recommend periodic skin cancer screening examinations.1,5 In a rapidly changing health care climate and with the rollout of the Patient Protection and Affordable Care Act, a USPSTF recommendation for skin screening with PSEs for skin cancer would have a large impact on clinical practice in the United States.
This article provides a systematic review of the current domestic and international data regarding the impact of PSEs on melanoma tumor thickness at the time of diagnosis as well as mortality from melanoma.
Methods
Search Strategy
A systematic search of PubMed articles indexed for MEDLINE and Embase for studies related to melanoma and PSEs was performed for the period from each database’s inception to November 8, 2014. One of the authors (S.L.M.) designed a broad search strategy with assistance from a medical librarian who had expertise in searching research bibliographies. Articles were excluded if they had a cross-sectional study design or were editorials or review articles. Search terms included skin neoplasm, skin cancer, or melanoma in combination with any of the following: skin examination, mass screening, screening, and secondary prevention.
Study Selection
All published studies reporting outcomes and correlations with PSEs and cutaneous melanoma in adult patients were screened. If multiple studies were published describing the same study, follow-up studies were included for data extraction, but the original study was the primary resource. Observational studies were a focus in this review, as these types of studies are much more common in this subject area.
One of the authors (S.L.M.) screened the titles and abstracts of identified studies for eligibility. If the reviewer considered a study potentially eligible based on the abstract review, a full-text review was carried out. The reference lists of eligible studies were manually searched to identify additional studies.
Data Extraction, Quality Assessment, and Data Synthesis
Data items to be extracted were agreed on before search implementation and were extracted by one investigator (S.L.M.) following criteria developed by review of the Cochrane Handbook for Systematic Reviews of Interventions.6 Study population, design, sample size, and outcomes were extracted. Risk of bias of individual articles was evaluated using a tool developed from the RTI item bank (RTI International) for determining the risk of bias and precision of eligible observational studies.7 Studies ultimately were classified into 3 categories based on the risk of bias: (1) low risk of bias, (2) medium risk of bias, and (3) high risk of bias. The strength of evidence of included studies was evaluated by the following items: risk of bias, consistency, directness, precision, and overall conclusion. Data from the included studies was synthesized qualitatively in a narrative format. This review adhered to guidelines in the Cochrane Handbook for Systematic Reviews of Interventions6 and the PRISMA (preferred reporting items for systematic reviews and meta-analyses) guidelines.8
Results
A total of 705 titles were screened, 98 abstracts were assessed for eligibility, 42 full-text reviews were carried out, and 5 eligible studies were identified (Figure 1). Five observational studies were included in the final review. A summary of the results is presented in Table 1.
Included studies were assessed for several types of biases, including selection bias, attrition bias, detection bias, performance bias, and response bias. The judgments were given for each domain (Table 2). There was heterogeneity in study design, reporting of total-body skin examination methods, and reporting of outcomes among all 5 studies. All 5 studies were assessed as having a medium risk of bias.
Physician Skin Examination Impact
One article by Berwick et al9 reanalyzed data from a 1996 study10 and provided no significant evidence regarding the benefits of PSEs in the reduction of melanoma mortality. Data for 650 patients with newly diagnosed melanomas were obtained from the Connecticut Tumor Registry, a site for the National Cancer Institute’s Surveillance, Epidemiology, and End Results (SEER) program, along with 549 age- and sex-frequency matched controls from the general population.10 Participants were followed biannually for a mean of 5.4 years. Of the original 650 case patients, 122 were excluded from the study with reasons provided. Physician skin examination was defined as a positive response to the following questionnaire item: “[Before your recent biopsy] did the doctor examine your skin during any of your visits?”9 Data analysis showed no significant association between PSE and death from melanoma. Upon univariate analysis, the hazard ratio for physician screening was 0.7 (95% confidence interval [CI], 0.4-1.3).9
The SCREEN (Skin Cancer Research to Provide Evidence for Effectiveness of Screening in Northern Germany) project, which was undertaken in Schleswig-Holstein, Germany, is the world’s largest systematic population-based skin cancer screening program.15 The participation rate was
19% (N=360,288) of the eligible population (citizens aged ≥20 years with statutory health insurance). Screening was a 2-step process performed by trained physicians: initial general practitioner whole-body skin examination followed by referral to a dermatologist for evaluation of suspicious skin findings. Five years after the SCREEN program was conducted, melanoma mortality declined by 47% per 100,000 men and by 49% per 100,000 women. The annual percentage change in the most recent 10-year period (2000-2009) was 7.5% (95% CI, –14.0 to –0.5; P<.05) for men and 7.1% for women (95% CI,
–10.5 to –2.9; P<.05). Simultaneously, the melanoma mortality rates in the 4 unscreened adjacent regions and the rest of Germany were stable, significantly (P<.05) different from the decline in mortality observed in Schleswig-Holstein.15
A community-based, prospective cohort study investigated the impact of an employee melanoma screening program at the Lawrence Livermore National Laboratory (Livermore, California) (1984-1996) demonstrated an impact on melanoma thickness and mortality rates.12 The cohort (approximately 5100 participants) was followed over 3 phases of surveillance: (1) preawareness (1969-1975), (2) early awareness of increased melanoma risk (1976-1984), and (3) screening program (1984-1996). The screening program encouraged employees to self-examine their skin for “suggestive lesions”; if a suggestive lesion was found, a full-body skin examination was performed by a physician. After being evaluated, participants with melanoma, dysplastic nevi, 50 or more moles, or a family history of melanoma were offered a periodic full-body examination every 3 to 24 months, often with
full-body photography and dermoscopy. Physician skin screening resulted in a reduction in crude incidence of thicker melanomas (defined as
>0.75 mm) during the 3 study phases. Compared with the early-awareness period (phase 2), a 69% reduction in the diagnosis of thick melanomas was reported in the screening program period (phase 3)(P=.0001). During the screening period, no eligible melanoma deaths occurred in the study population, whereas the expected number of deaths was 3.39 (P=.034) based on observed melanoma mortality in 5 San Francisco/Oakland Bay–area counties in California as reported to the SEER program from 1984 to 1996.12
The strongest evidence for reduced thickness of melanomas detected via PSEs was reported in a population-based, case-control study by Aitken et al14 of all residents in Queensland, Australia, aged 20 to 75 years with a histologically confirmed first primary invasive cutaneous melanoma diagnosed between January 2000 and December 2003. Whole-body PSE in the 3 years before diagnosis was inversely associated with tumor thickness at diagnosis (χ2=44.37; P<.001), including a 14% lower risk of diagnosis of a thick melanoma (>0.75 mm)(odds ratio [OR], 0.86; 95% CI, 0.75-0.98) and a 40% lower risk of diagnosis of a melanoma that was 3 mm or larger (OR, 0.60; 95% CI, 0.43-0.83). The investigators applied melanoma thickness-specific survival estimates to the thickness distribution of the screened and unscreened cases in their sample to estimate melanoma deaths within 5 and 10 years of diagnosis. Compared to the unscreened cases, they estimated that the screened cases would have 26% fewer melanoma deaths within 5 years of diagnosis and 23% fewer deaths within 10 years.14
Another prospective cohort study in Queensland was designed to detect a 20% reduction in mortality from melanoma during a 15-year intervention period in communities that received a screening program.11 A total of 44 communities (aggregate population, 560,000 adults aged ≥30 years) were randomized into intervention or control groups to receive a community-based melanoma screening program for 3 years versus usual medical care.Overall, thinner melanomas were identified in communities with the screening program versus neighboring communities without it.11 Of the 33 melanomas found through the screening program, 39% (13/33) were in situ lesions, 55% (18/33) were thin (<1 mm) invasive lesions, and 6% (2/33) were 1-mm thick or greater.16 Within the population of Queensland during the period from 1999 through 2002, 36% were in situ lesions, 48% were invasive thin melanomas, and 16% were invasive melanomas 1-mm thick or more, indicating that melanomas found through screening were thinner or less advanced.17
Comment
Our review identified 5 studies describing the impact of PSEs for melanoma screening on tumor thickness at diagnosis and melanoma mortality. Key findings are highlighted in Figure 2. Our findings suggest that PSEs are associated with a decline in melanoma tumor thickness and melanoma-specific mortality. Our findings are qualitatively similar to prior reviews that supported the use of PSEs to detect thinner melanomas and improve mortality outcomes.18-20
The greatest evidence for population-based screening programs was provided by the SCREEN study. This landmark study documented that screening programs utilizing primary care physicians (PCPs) and dermatologists can lead to a reduction in melanoma mortality.15 Findings from the study led to the countrywide expansion of the screening program in 2008, leading to 45 million Germans eligible for skin cancer screenings every 2 years.21 Nearly two-thirds of dermatologists (N=1348) were satisfied with routine PSE and 83% perceived a better quality of health care for skin with the 2008 expansion.22
Data suggest that physician-detected melanomas through PSEs or routine physical examinations are thinner at the time of diagnosis than those found by patients or their partners.14,23-26 Terushkin and Halpern20 analyzed 9 worldwide studies encompassing more than 7500 patients and found that physician-detected melanomas were 0.55 mm thinner than those detected by patients or their significant others. The workplace screening and education program reviewed herein also reported a reduction in thicker melanomas and melanoma mortality during the study period.12
Not all Americans have a regular dermatologist. As such, educating PCPs in skin cancer detection has been a recent area of study. The premise is that the skin examination can be integrated into routine physical examinations conducted by PCPs. The previously discussed studies, particularly Aitken et al,14 Schneider et al,12 and Katalinic et al,15 as well as the SCREEN program studies,15 suggest that integration of the skin examination into the routine physical examination may be a feasible method to reduce melanoma thickness and mortality. Furthermore, the SCREEN study15 identified participants with risk factors for melanoma, finding that approximately half of men and women (N=360,288) had at least one melanoma risk factor, which suggests that it may be more practical to design screening practices around high-risk participants.
Several studies were excluded from our analysis on the basis of study design, including cross-sectional observational studies; however, it is worth briefly commenting on the findings of the excluded studies here, as they add to the body of literature. A community-based, multi-institutional study of 566 adults with invasive melanoma assessed the role of PSEs in the year prior to diagnosis by interviewing participants in clinic within 3 months of melanoma diagnosis.24 Patients who underwent full-body PSE in the year prior to diagnosis were more than 2 times more likely to have thinner (≤1 mm) melanomas (OR, 2.51; 95% CI, 1.62-3.87]). Notably, men older than 60 years appeared to benefit the most from this practice; men in this age group contributed greatly to the observed effect, likely because they had 4 times the odds of a thinner melanoma (OR, 4.09; 95% CI, 1.88-8.89]). Thinner melanomas also were associated with an age of 60 years or younger, female sex, and higher education level.24
Pollitt et al27 analyzed the association between prediagnosis Medicaid enrollment status and melanoma tumor thickness. The study found that men and women who intermittently enrolled in Medicaid or were not enrolled until the month of diagnosis had an increased chance of late-stage melanoma when compared to other patients. Patients who continuously enrolled during the year prior to diagnosis had lower odds for thicker melanomas, suggesting that these patients had greater access to screening examinations.27
Roetzheim et al28 analyzed data from the SEER-Medicare linked dataset to investigate patterns of dermatologist and PCP visits in the 2 years before melanoma diagnosis. Medicare beneficiaries seeing both a dermatologist and a PCP prior to melanoma diagnosis had greater odds of a thinner melanoma and lower melanoma mortality compared to patients without such visits.28
Durbec et al29 conducted a retrospective, population-based study of 650 patients in France who were seen by a dermatologist for melanoma. The thinnest melanomas were reported in patients seeing a dermatologist for prospective follow-up of nevi or consulting a dermatologist for other diseases. Patients referred to a dermatologist by PCPs tended to be older and had the highest frequency of thick (>3 mm), nodular, and/or ulcerated melanomas,29 which could be interpreted as a need for greater PCP education in melanoma screening.
Rates of skin examinations have been increasing since the year 2000, both overall and among high-risk groups as reported by a recent study on skin cancer screening trends. Prevalence of having at least one total-body skin examination increased from 14.5% in 2000 to 16.5% in 2005 to 19.8% in 2010 (P<.0001).30 One study revealed a practice gap in which more than 3 in 10 PCPs and 1 in 10 dermatologists reported not screening more than half their high-risk patients for skin cancer.31 The major obstacle to narrowing the identified practice gap involves establishing a national strategy to screen high-risk individuals for skin cancer and requires partnerships among patients, PCPs, specialists, policy makers, and government sponsors.
Lack of evidence that screening for skin cancer with PSEs reduces overall mortality does not mean there is a lack of lifesaving potential of screenings. The resources required to execute a randomized controlled trial with adequate power are vast, as the USPSTF estimated 800,000 participants would be needed.4 Barriers to conducting a randomized clinical trial for skin cancer screening include the large sample size required, prolonged follow-up, and various ethical issues such as withholding screening for a cancer that is potentially curable in early stages. Lessons from screenings for breast and prostate cancers have taught us that such randomized controlled trials assessing cancer screening are costly and do not always produce definitive answers.32
Conclusion
Although proof of improved health outcomes from randomized controlled trials is still required, there is evidence to support targeted screening programs for the detection of thinner melanomas and, by proxy, reduced melanoma mortality. Amidst the health care climate change and payment reform, recommendations from national organizations on melanoma screenings are paramount. Clinicians should continue to offer regular skin examinations as the body of evidence continues to grow in support of PSEs for melanoma screening.
Acknowledgments—We are grateful to Mary Butler, PhD, and Robert Kane, MD, both from Minneapolis, Minnesota, for their guidance and consultation.
1. American Cancer Society. Cancer Facts & Figures 2015. Atlanta, GA: American Cancer Society; 2015. http: //www.cancer.org/Research/CancerFactsStatistics/cancer factsfigures2015/cancer-facts-and-figures-2015. Accessed July 6, 2015.
2. Guy G Jr, Ekwueme D, Tangka F, et al. Melanoma treatment costs: a systematic review of the literature, 1990-2011. Am J Prev. 2012;43:537-545.
3. Margolis D, Halpern A, Rebbeck T, et al. Validation of a melanoma prognostic model. Arch Dermatol. 1998;134:1597-1601.
4. Wolff T, Tai E, Miller T. Screening for skin cancer: an update of the evidence for the U.S. Preventative Services Task Force. Ann Intern Med. 2009;150:194-198.
5. American Academy of Dermatology. Melanoma
Monday. http://www.aad.org/spot-skin-cancer
/community-programs-events/melanoma-monday. Accessed August 19, 2015.
6. Higgins JPT, Green S, eds. Cochrane Handbook for
Systematic Reviews of Interventions Version 5.1.0 [updated March 2011]. The Cochrane Collaboration, 2011. http:
//www.cochrane-handbook.org. Updated March 2011. Accessed November 10, 2014.
7. Viswanathan M, Berkman N. Development of the RTI item bank on risk of bias and precision of observational studies. J Clin Epidemiol. 2012;65:163-178.
8. Moher D, Liberati A, Tetzlaff J, et al; PRISMA group. Preferred reporting items for systematic reviews and meta-analyses: the PRISMA statement [published online ahead of print July 23, 2009]. J Clin Epidemiol. 2009;62:1006-1012.
9. Berwick M, Armstrong B, Ben-Porat L. Sun exposure and mortality from melanoma. J Natl Cancer Inst. 2005;97:195-199.
10. Berwick M, Begg C, Fine J, et al. Screening for cutaneous melanoma by skin self-examination. J Natl Cancer Inst. 1996;88:17-23.
11. Aitken J, Elwood J, Lowe J, et al. A randomised trial of population screening for melanoma. J Med Screen. 2002;9:33-37.
12. Schneider J, Moore D, Mendelsohn M. Screening program reduced melanoma mortality at the Lawrence Livermore National Laboratory, 1984 to 1996. J Am Acad Dermatol. 2008;58:741-749.
13. Expert Health Data Programming Inc. Health data software and health statistics. Available from: http: //www.ehdp.com. Accessed April 1, 2001. Cited by: Schneider J, Moore D, Mendelsohn M. Screening program reduced melanoma mortality at the Lawrence Livermore National Laboratory, 1984 to 1996. J Am Acad Dermatol. 2008;58:741-749.
14. Aitken J, Elwood M, Baade P, et al. Clinical whole-body skin examination reduces the incidence of thick melanomas. Int J Cancer. 2010;126:450-458.
15. Katalinic A, Waldmann A, Weinstock M, et al. Does skin cancer screening save lives? an observational study comparing trends in melanoma mortality in regions with and without screening. Cancer. 2012;118:5395-5402.
16. Aitken J, Janda M, Elwood M, et al. Clinical outcomes from skin screening clinics within a community-based melanoma screening program. J Am Acad Dermatol. 2006;54:105-114.
17. Coory M, Baade P, Aitken JF, et al. Trends for in-situ and invasive melanoma in Queensland, Australia, 1982 to 2002. Cancer Causes Control. 2006;17:21-27.
18. Mayer JE, Swetter SM, Fu T, et al. Screening, early detection, education, and trends for melanoma: current status (2007-2013) and future directions: part II. screening, education, and future directions. J Am Acad Dermatol. 2014;71:611.e1-611.e10; quiz, 621-622.
19. Curiel-Lewandrowski C, Chen S, Swetter S, et al. Screening and prevention measures for melanoma: is there a survival advantage? Curr Oncol Rep. 2012;14:458-467.
20. Terushkin V, Halpern A. Melanoma early detection. Hematol Oncol Clin North Am. 2009;23:481-500.
21. Geller A, Greinert R, Sinclair C, et al. A nationwide population-based skin cancer screening in Germany: proceedings of the first meeting of the International Task Force on Skin Cancer Screening and Prevention (September 24 and 25, 2009) [published online ahead of print April 8, 2010]. Cancer Epidemiol. 2010;34:355-358.
22. Kornek T, Schafer I, Reusch M, et al. Routine skin cancer screening in Germany: four years of experience from the dermatologists’ perspective. Dermatology. 2012;225:289-293.
23. De Giorgi V, Grazzini M, Rossari S, et al. Is skin self-examination for cutaneous melanoma detection still adequate? a retrospective study. Dermatology. 2012;225:31-36.
24. Swetter S, Johnson T, Miller D, et al. Melanoma in middle-aged and older men: a multi-institutional survey study of factors related to tumor thickness. Arch Dermatol. 2009;145:397-404.
25. Kantor J, Kantor D. Routine dermatologist-performed full-body skin examination and early melanoma detection. Arch Dermatol. 2009;145:873-876.
26. Kovalyshyn I, Dusza S, Siamas K, et al. The impact of physician screening on melanoma detection. Arch Dermatol. 2011;147:1269-1275.
27. Pollitt R, Clarke C, Shema S, et al. California Medicaid enrollment and melanoma stage at diagnosis: a population-based study. Am J Prev Med. 2008;35:7-13.
28. Roetzheim R, Lee J, Ferrante J, et al. The influence of dermatologist and primary care physician visits on melanoma outcomes among Medicare beneficiaries. J Am Board Fam Med. 2013;26:637-647.
29. Durbec F, Vitry F, Granel-Brocard F, et al. The role of circumstances of diagnosis and access to dermatological care in early diagnosis of cutaneous melanoma: a population-based study in France. Arch Dermatol. 2010;146:240-246.
30. Lakhani N, Saraiya M, Thompson T, et al. Total body skin examination for skin cancer screening among U.S. adults from 2000 to 2010. Prev Med. 2014;61:75-80.
31. Oliveria SA, Heneghan MK, Cushman LF, et al. Skin cancer screening by dermatologists, family practitioners, and internists: barriers and facilitating factors. Arch Dermatol. 2011;147:39-44.
32. Bigby M. Why the evidence for skin cancer screening is insufficient: lessons from prostate cancer screening. Arch Dermatol. 2010;146:322-324.
Practice Points
- Current guidelines regarding melanoma screening are inconsistent.
- There is a growing pool of evidence supporting screening to improve melanoma outcomes.
Secular Trends in AB Resistance
Among hospitalized patients with serious infections, the choice of empiric therapy plays a key role in outcomes.[1, 2, 3, 4, 5, 6, 7, 8, 9] Rising rates and variable patterns of antimicrobial resistance, however, complicate selecting appropriate empiric therapy. Amidst this shifting landscape of resistance to antimicrobials, gram‐negative bacteria and specifically Acinetobacter baumannii (AB), remain a considerable challenge.[10] On the one hand, AB is a less‐frequent cause of serious infections than organisms like Pseudomonas aeruginosa or Enterobacteriaceae in severely ill hospitalized patients.[11, 12] On the other, AB has evolved a variety of resistance mechanisms and exhibits unpredictable susceptibility patterns.[13] These factors combine to increase the likelihood of administering inappropriate empiric therapy when faced with an infection caused by AB and, thereby, raising the risk of death.[14] The fact that clinicians may not routinely consider AB as the potential culprit pathogen in the patient they are treating along with this organism's highly in vitro resistant nature, may result in routine gram‐negative coverage being frequently inadequate for AB infections.
To address the poor outcomes related to inappropriate empiric therapy in the setting of AB, one requires an appreciation of the longitudinal changes and geographic differences in the susceptibility of this pathogen. Thus, we aimed to examine secular trends in the resistance of AB to antimicrobial agents whose effectiveness against this microorganism was well supported in the literature during the study timeframe.[15]
METHODS
To determine the prevalence of predefined resistance patterns among AB in respiratory and blood stream infection (BSI) specimens, we examined The Surveillance Network (TSN) database from Eurofins. We explored data collected between years 2003 and 2012. The database has been used extensively for surveillance purposes since 1994, and has previously been described in detail.[16, 17, 18, 19, 20] Briefly, TSN is a warehouse of routine clinical microbiology data collected from a nationally representative sample of microbiology laboratories in 217 hospitals in the United States. To minimize selection bias, laboratories are included based on their geography and the demographics of the populations they serve.[18] Only clinically significant samples are reported. No personal identifying information for source patients is available in this database. Only source laboratories that perform antimicrobial susceptibility testing according standard Food and Drug Administrationapproved testing methods and that interpret susceptibility in accordance with the Clinical Laboratory Standards Institute breakpoints are included.[21] (See Supporting Table 4 in the online version of this article for minimum inhibitory concentration (MIC) changes over the course of the studycurrent colistin and polymyxin breakpoints applied retrospectively). All enrolled laboratories undergo a pre‐enrollment site visit. Logical filters are used for routine quality control to detect unusual susceptibility profiles and to ensure appropriate testing methods. Repeat testing and reporting are done as necessary.[18]
Laboratory samples are reported as susceptible, intermediate, or resistant. We grouped isolates with intermediate MICs together with the resistant ones for the purposes of the current analysis. Duplicate isolates were excluded. Only samples representing 1 of the 2 infections of interest, respiratory or BSI, were included.
We examined 3 time periods2003 to 2005, 2006 to 2008, and 2009 to 2012for the prevalence of AB's resistance to the following antibiotics: carbapenems (imipenem, meropenem, doripenem), aminoglycosides (tobramycin, amikacin), tetracyclines (minocycline, doxycycline), polymyxins (colistin, polymyxin B), ampicillin‐sulbactam, and trimethoprim‐sulfamethoxazole. Antimicrobial resistance was defined by the designation of intermediate or resistant in the susceptibility category. Resistance to a class of antibiotics was defined as resistance to all drugs within the class for which testing was available. The organism was multidrug resistant (MDR) if it was resistant to at least 1 antimicrobial in at least 3 drug classes examined.[22] Resistance to a combination of 2 drugs was present if the specimen was resistant to both of the drugs in the combination for which testing was available. We examined the data by infection type, time period, the 9 US Census divisions, and location of origin of the sample.
All categorical variables are reported as percentages. Continuous variables are reported as meansstandard deviations and/or medians with the interquartile range (IQR). We did not pursue hypothesis testing due to a high risk of type I error in this large dataset. Therefore, only clinically important trends are highlighted.
RESULTS
Among the 39,320 AB specimens, 81.1% were derived from a respiratory source and 18.9% represented BSI. Demographics of source patients are listed in Table 1. Notably, the median age of those with respiratory infection (58 years; IQR 38, 73) was higher than among patients with BSI (54.5 years; IQR 36, 71), and there were proportionally fewer females among respiratory patients (39.9%) than those with BSI (46.0%). Though only 24.3% of all BSI samples originated from the intensive are unit (ICU), 40.5% of respiratory specimens came from that location. The plurality of all specimens was collected in the 2003 to 2005 time interval (41.3%), followed by 2006 to 2008 (34.7%), with a minority coming from years 2009 to 2012 (24.0%). The proportions of collected specimens from respiratory and BSI sources were similar in all time periods examined (Table 1). Geographically, the South Atlantic division contributed the most samples (24.1%) and East South Central the fewest (2.6%) (Figure 1). The vast majority of all samples came from hospital wards (78.6%), where roughly one‐half originated in the ICU (37.5%). Fewer still came from outpatient sources (18.3%), and a small minority (2.5%) from nursing homes.

| Pneumonia | BSI | All | |
|---|---|---|---|
| |||
| Total, N (%) | 31,868 (81.1) | 7,452 (18.9) | 39,320 |
| Age, y | |||
| Mean (SD) | 57.7 (37.4) | 57.6 (40.6) | 57.7 (38.0) |
| Median (IQR 25, 75) | 58 (38, 73) | 54.5 (36, 71) | 57 (37, 73) |
| Gender, female (%) | 12,725 (39.9) | 3,425 (46.0) | 16,150 (41.1) |
| ICU (%) | 12,9191 (40.5) | 1,809 (24.3) | 14,7284 (37.5) |
| Time period, % total | |||
| 20032005 | 12,910 (40.5) | 3,340 (44.8) | 16,250 (41.3) |
| 20062008 | 11,205 (35.2) | 2,435 (32.7) | 13,640 (34.7) |
| 20092012 | 7,753 (24.3) | 1,677 (22.5) | 9,430 (24.0) |
Figure 2 depicts overall resistance patterns by individual drugs, drug classes, and frequently used combinations of agents. Although doripenem had the highest rate of resistance numerically (90.3%), its susceptibility was tested only in a small minority of specimens (n=31, 0.08%). Resistance to trimethoprim‐sulfamethoxazole was high (55.3%) based on a large number of samples tested (n=33,031). Conversely, colistin as an agent and polymyxins as a class exhibited the highest susceptibility rates of over 90%, though the numbers of samples tested for susceptibility to these drugs were also small (colistin n=2,086, 5.3%; polymyxins n=3,120, 7.9%) (Figure 2). Among commonly used drug combinations, carbapenem+aminoglycoside (18.0%) had the lowest resistance rates, and nearly 30% of all AB specimens tested met the criteria for MDR.
Over time, resistance to carbapenems more‐than doubled, from 21.0% in 2003 to 2005 to 47.9% in 2009 to 2012 (Table 2). Although relatively few samples were tested for colistin susceptibility (n=2,086, 5.3%), resistance to this drug also more than doubled from 2.8% (95% confidence interval: 1.9‐4.2) in 2006 to 2008 to 6.9% (95% confidence interval: 5.7‐8.2) in 2009 to 2012. As a class, however, polymyxins exhibited stable resistance rates over the time frame of the study (Table 2). Prevalence of MDR AB rose from 21.4% in 2003 to 2005 to 33.7% in 2006 to 2008, and remained stable at 35.2% in 2009 to 2012. Resistance to even such broad combinations as carbapenem+ampicillin/sulbactam nearly tripled from 13.2% in 2003 to 2005 to 35.5% in 2009 to 2012. Notably, between 2003 and 2012, although resistance rates either rose or remained stable to all other agents, those to minocycline diminished from 56.5% in 2003 to 2005 to 36.6% in 2006 to 2008 to 30.5% in 2009 to 2012. (See Supporting Table 1 in the online version of this article for time trends based on whether they represented respiratory or BSI specimens, with directionally similar trends in both.)
| Drug/Combination | Time Period | ||||||||
|---|---|---|---|---|---|---|---|---|---|
| 20032005 | 20062008 | 20092012 | |||||||
| Na | %b | 95% CI | N | % | 95% CI | N | % | 95% CI | |
| |||||||||
| Amikacin | 12,949 | 25.2 | 24.5‐26.0 | 10.929 | 35.2 | 34.3‐36.1 | 6,292 | 45.7 | 44.4‐46.9 |
| Tobramycin | 14,549 | 37.1 | 36.3‐37.9 | 11,877 | 41.9 | 41.0‐42.8 | 7,901 | 39.2 | 38.1‐40.3 |
| Aminoglycoside | 14,505 | 22.5 | 21.8‐23.2 | 11,967 | 30.6 | 29.8‐31.4 | 7,736 | 34.8 | 33.8‐35.8 |
| Doxycycline | 173 | 36.4 | 29.6‐43.8 | 38 | 29.0 | 17.0‐44.8 | 32 | 34.4 | 20.4‐51.7 |
| Minocycline | 1,388 | 56.5 | 53.9‐50.1 | 902 | 36.6 | 33.5‐39.8 | 522 | 30.5 | 26.7‐34.5 |
| Tetracycline | 1,511 | 55.4 | 52.9‐57.9 | 940 | 36.3 | 33.3‐39.4 | 546 | 30.8 | 27.0‐34.8 |
| Doripenem | NR | NR | NR | 9 | 77.8 | 45.3‐93.7 | 22 | 95.5 | 78.2‐99.2 |
| Imipenem | 14,728 | 21.8 | 21.2‐22.5 | 12,094 | 40.3 | 39.4‐41.2 | 6,681 | 51.7 | 50.5‐52.9 |
| Meropenem | 7,226 | 37.0 | 35.9‐38.1 | 5,628 | 48.7 | 47.3‐50.0 | 4,919 | 47.3 | 45.9‐48.7 |
| Carbapenem | 15,490 | 21.0 | 20.4‐21.7 | 12,975 | 38.8 | 38.0‐39.7 | 8,778 | 47.9 | 46.9‐49.0 |
| Ampicillin/sulbactam | 10,525 | 35.2 | 34.3‐36.2 | 9,413 | 44.9 | 43.9‐45.9 | 6,460 | 41.2 | 40.0‐42.4 |
| Colistin | NR | NR | NR | 783 | 2.8 | 1.9‐4.2 | 1,303 | 6.9 | 5.7‐8.2 |
| Polymyxin B | 105 | 7.6 | 3.9‐14.3 | 796 | 12.8 | 10.7‐15.3 | 321 | 6.5 | 4.3‐9.6 |
| Polymyxin | 105 | 7.6 | 3.9‐14.3 | 1,563 | 7.9 | 6.6‐9.3 | 1,452 | 6.8 | 5.6‐8.2 |
| Trimethoprim/sulfamethoxazole | 13,640 | 52.5 | 51.7‐53.3 | 11,535 | 57.1 | 56.2‐58.0 | 7,856 | 57.6 | 56.5‐58.7 |
| MDRc | 16,249 | 21.4 | 20.7‐22.0 | 13,640 | 33.7 | 33.0‐34.5 | 9,431 | 35.2 | 34.2‐36.2 |
| Carbapenem+aminoglycoside | 14,601 | 8.9 | 8.5‐9.4 | 12,333 | 21.3 | 20.6‐22.0 | 8,256 | 29.3 | 28.3‐30.3 |
| Aminoglycoside+ampicillin/sulbactam | 10,107 | 12.9 | 12.3‐13.6 | 9,077 | 24.9 | 24.0‐25.8 | 6,200 | 24.3 | 23.2‐25.3 |
| Aminoglycosie+minocycline | 1,359 | 35.6 | 33.1‐38.2 | 856 | 21.4 | 18.8‐24.2 | 503 | 24.5 | 20.9‐28.4 |
| Carbapenem+ampicillin/sulbactam | 10,228 | 13.2 | 12.5‐13.9 | 9,145 | 29.4 | 28.4‐30.3 | 6,143 | 35.5 | 34.3‐36.7 |
Regionally, examining resistance by classes and combinations of antibiotics, trimethoprim‐sulfamethoxazole exhibited consistently the highest rates of resistance, ranging from the lowest in the New England (28.8%) to the highest in the East North Central (69.9%) Census divisions (See Supporting Table 2 in the online version of this article). The rates of resistance to tetracyclines ranged from 0.0% in New England to 52.6% in the Mountain division, and to polymyxins from 0.0% in the East South Central division to 23.4% in New England. Generally, New England enjoyed the lowest rates of resistance (0.0% to tetracyclines to 28.8% to trimethoprim‐sulfamethoxazole), and the Mountain division the highest (0.9% to polymyxins to 52.6% to tetracyclines). The rates of MDR AB ranged from 8.0% in New England to 50.4% in the Mountain division (see Supporting Table 2 in the online version of this article).
Examining resistances to drug classes and combinations by the location of the source specimen revealed that trimethoprim‐sulfamethoxazole once again exhibited the highest rate of resistance across all locations (see Supporting Table 3 in the online version of this article). Despite their modest contribution to the overall sample pool (n=967, 2.5%), organisms from nursing home subjects had the highest prevalence of resistance to aminoglycosides (36.3%), tetracyclines (57.1%), and carbapenems (47.1%). This pattern held true for combination regimens examined. Nursing homes also vastly surpassed other locations in the rates of MDR AB (46.5%). Interestingly, the rates of MDR did not differ substantially among regular inpatient wards (29.2%), the ICU (28.7%), and outpatient locations (26.2%) (see Supporting Table 3 in the online version of this article).
DISCUSSION
In this large multicenter survey we have documented the rising rates of AB resistance to clinically important antimicrobials in the United States. On the whole, all antimicrobials, except for minocycline, exhibited either large or small increases in resistance. Alarmingly, even colistin, a true last resort AB treatment, lost a considerable amount of activity against AB, with the resistance rate rising from 2.8% in 2006 to 2008 to 6.9% in 2009 to 2012. The single encouraging trend that we observed was that resistance to minocycline appeared to diminish substantially, going from over one‐half of all AB tested in 2003 to 2005 to just under one‐third in 2009 to 2012.
Although we did note a rise in the MDR AB, our data suggest a lower percentage of all AB that meets the MDR phenotype criteria compared to reports by other groups. For example, the Center for Disease Dynamics and Economic Policy (CDDEP), analyzing the same data as our study, reports a rise in MDR AB from 32.1% in 1999 to 51.0% in 2010.[23] This discrepancy is easily explained by the fact that we included polymyxins, tetracyclines, and trimethoprim‐sulfamethoxazole in our evaluation, whereas the CDDEP did not examine these agents. Furthermore, we omitted fluoroquinolones, a drug class with high rates of resistance, from our study, because we were interested in focusing only on antimicrobials with clinical data in AB infections.[22] In addition, we limited our evaluation to specimens derived from respiratory or BSI sources, whereas the CDDEP data reflect any AB isolate present in TSN.
We additionally confirm that there is substantial geographic variation in resistance patterns. Thus, despite different definitions, our data agree with those from the CDDEP that the MDR prevalence is highest in the Mountain and East North Central divisions, and lowest in New England overall.[23] The wide variations underscore the fact that it is not valid to speak of national rates of resistance, but rather it is important to concentrate on the local patterns. This information, though important from the macroepidemiologic standpoint, is likely still not granular enough to help clinicians make empiric treatment decisions. In fact, what is needed for that is real‐time antibiogram data specific to each center and even each unit within each center.
The latter point is further illustrated by our analysis of locations of origin of the specimens. In this analysis, we discovered that, contrary to the common presumption that the ICU has the highest rate of resistant organisms, specimens derived from nursing homes represent perhaps the most intensely resistant organisms. In other words, the nursing home is the setting most likely to harbor patients with respiratory infections and BSIs caused by resistant AB. These data are in agreement with several other recent investigations. In a period‐prevalence survey conducted in the state of Maryland in 2009 by Thom and colleagues, long‐term care facilities were found to have the highest prevalence of any AB, and also those resistant to imipenem, MDR, and extensively drug‐resistant organisms.[24] Mortensen and coworkers confirmed the high prevalence of AB and AB resistance in long‐term care facilities, and extended this finding to suggest that there is evidence for intra‐ and interhospital spread of these pathogens.[25] Our data confirm this concerning finding at the national level, and point to a potential area of intervention for infection prevention.
An additional finding of some concern is that the highest proportion of colistin resistance among those specimens, whose location of origin was reported in the database, was the outpatient setting (6.6% compared to 5.4% in the ICU specimens, for example). Although these infections would likely meet the definition for healthcare‐associated infection, AB as a community‐acquired respiratory pathogen is not unprecedented either in the United States or abroad.[26, 27, 28, 29, 30] It is, however, reassuring that most other antimicrobials examined in our study exhibit higher rates of susceptibility in the specimens derived from the outpatient settings than either from the hospital or the nursing home.
Our study has a number of strengths. As a large multicenter survey, it is representative of AB susceptibility patterns across the United States, which makes it highly generalizable. We focused on antibiotics for which clinical evidence is available, thus adding a practical dimension to the results. Another pragmatic consideration is examining the data by geographic distributions, allowing an additional layer of granularity for clinical decisions. At the same time it suffers from some limitations. The TSN database consists of microbiology samples from hospital laboratories. Although we attempted to reduce the risk of duplication, because of how samples are numbered in the database, repeat sampling remains a possibility. Despite having stratified the data by geography and the location of origin of the specimen, it is likely not granular enough for local risk stratification decisions clinicians make daily about the choices of empiric therapy. Some of the MIC breakpoints have changed over the period of the study (see Supporting Table 4 in the online version of this article). Because these changes occurred in the last year of data collection (2012), they should have had only a minimal, if any, impact on the observed rates of resistance in the time frame examined. Additionally, because resistance rates evolve rapidly, more current data are required for effective clinical decision making.
In summary, we have demonstrated that the last decade has seen an alarming increase in the rate of resistance of AB to multiple clinically important antimicrobial agents and classes. We have further emphasized the importance of granularity in susceptibility data to help clinicians make sensible decisions about empiric therapy in hospitalized patients with serious infections. Finally, and potentially most disturbingly, the nursing home as a location appears to be a robust reservoir for spread for resistant AB. All of these observations highlight the urgent need to develop novel antibiotics and nontraditional agents, such as antibodies and vaccines, to combat AB infections, in addition to having important infection prevention implications if we are to contain the looming threat of the end of antibiotics.[31]
Disclosure
This study was funded by a grant from Tetraphase Pharmaceuticals, Watertown, MA.
- National Nosocomial Infections Surveillance (NNIS) System Report. Am J Infect Control. 2004;32:470–485.
- , , , National surveillance of antimicrobial resistance in Pseudomonas aeruginosa isolates obtained from intensive care unit patients from 1993 to 2002. Antimicrob Agents Chemother. 2004;48:4606–4610.
- , , , et al. Health care‐associated pneumonia and community‐acquired pneumonia: a single‐center experience. Antimicrob Agents Chemother. 2007;51:3568–3573.
- , , , et al. Clinical importance of delays in the initiation of appropriate antibiotic treatment for ventilator‐associated pneumonia. Chest. 2002;122:262–268.
- ; ICU‐Acquired Pneumonia Study Group. Modification of empiric antibiotic treatment in patients with pneumonia acquired in the intensive care unit. Intensive Care Med. 1996;22:387–394.
- , , , , Antimicrobial therapy escalation and hospital mortality among patients with HCAP: a single center experience. Chest. 2008:134:963–968.
- , , , et al. Surviving Sepsis Campaign: international guidelines for management of severe sepsis and septic shock: 2008. Crit Care Med. 2008;36:296–327.
- , , , , , Inappropriate antibiotic therapy in Gram‐negative sepsis increases hospital length of stay. Crit Care Med. 2011;39:46–51.
- , , , Inadequate antimicrobial treatment of infections: a risk factor for hospital mortality among critically ill patients. Chest. 1999;115:462–474.
- Centers for Disease Control and Prevention. Antibiotic resistance threats in the United States, 2013. Available at: http://www.cdc.gov/drugresistance/threat-report-2013/pdf/ar-threats-2013-508.pdf#page=59. Accessed December 29, 2014.
- , , , et al.; National Healthcare Safety Network (NHSN) Team and Participating NHSN Facilities. Antimicrobial‐resistant pathogens associated with healthcare‐associated infections: summary of data reported to the National Healthcare Safety Network at the Centers for Disease Control and Prevention, 2009–2010. Infect Control Hosp Epidemiol. 2013;34:1–14.
- , , , , Multi‐drug resistance, inappropriate initial antibiotic therapy and mortality in Gram‐negative severe sepsis and septic shock: a retrospective cohort study. Crit Care. 2014;18(6):596.
- , , , , , Global challenge of multidrug‐resistant Acinetobacter baumannii. Antimicrob Agents Chemother. 2007;51:3471–3484.
- , , , Predictors of hospital mortality among septic ICU patients with Acinetobacter spp. bacteremia: a cohort study. BMC Infect Dis. 2014;14:572.
- , Treatment of Acinetobacter infections. Clin Infect Dis. 2010;51:79–84.
- , , Increasing resistance of Acinetobacter species to imipenem in United States hospitals, 1999–2006. Infect Control Hosp Epidemiol. 2010;31:196–197.
- , , , , Trends in resistance to carbapenems and third‐generation cephalosporins among clinical isolates of Klebsiella pneumoniae in the United States, 1999–2010. Infect Control Hosp Epidemiol. 2013;34:259–268.
- , , Antimicrobial resistance in key bloodstream bacterial isolates: electronic surveillance with the Surveillance Network Database—USA. Clin Infect Dis. 1999;29:259–263.
- , , Community‐associated methicillin‐resistant Staphylococcus aureus in outpatients, United States, 1999–2006. Emerg Infect Dis. 2009;15:1925–1930.
- , , , , Prevalence of antimicrobial resistance in bacteria isolated from central nervous system specimens as reported by U.S. hospital laboratories from 2000 to 2002. Ann Clin Microbiol Antimicrob. 2004;3:3.
- Performance standards for antimicrobial susceptibility testing: twenty‐second informational supplement. CLSI document M100‐S22. Wayne, PA: Clinical and Laboratory Standards Institute; 2012.
- , , , et al. Multidrug‐resistant, extensively drug‐resistant and pandrug‐resistant bacteria: an international expert proposal for interim standard definitions for acquired resistance. Clin Microbiol Infect. 2012;18:268–281.
- CDDEP: The Center for Disease Dynamics, Economics and Policy. Resistance map: Acinetobacter baumannii overview. Available at: http://www.cddep.org/projects/resistance_map/acinetobacter_baumannii_overview. Accessed January 16, 2015.
- , , , et al.; Maryland MDRO Prevention Collaborative. Assessing the burden of Acinetobacter baumannii in Maryland: a statewide cross‐sectional period prevalence survey. Infect Control Hosp Epidemiol. 2012;33:883–888.
- , , , et al. Multidrug‐resistant Acinetobacter baumannii infection, colonization, and transmission related to a long‐term care facility providing subacute care. Infect Control Hosp Epidemiol. 2014;35:406–411.
- , , , , , Severe community‐acquired pneumonia due to Acinetobacter baumannii. Chest. 2001;120:1072–1077.
- , , , , , Fulminant community‐acquired Acinetobacter baumannii pneumonia as distinct clinical syndrome. Chest. 2006;129:102–109.
- , , , Community‐acquired Acinetobacter baumannii pneumonia. Rev Clin Esp. 2003;203:284–286.
- , , , et al. Antimicrobial drug‐resistant microbes associated with hospitalized community‐acquired and healthcare‐associated pneumonia: a multi‐center study in Taiwan. J Formos Med Assoc. 2013;112:31–40.
- , , , , Antimicrobial resistance in Hispanic patients hospitalized in San Antonio, TX with community‐acquired pneumonia. Hosp Pract (1995). 2010;38:108–113.
- Centers for Disease Control and Prevention. CDC director blog. The end of antibiotics. Can we come back from the brink? Available at: http://blogs.cdc.gov/cdcdirector/2014/05/05/the-end-of-antibiotics-can-we-come-back-from-the-brink/. Published May 5, 2014. Accessed January 16, 2015.
Among hospitalized patients with serious infections, the choice of empiric therapy plays a key role in outcomes.[1, 2, 3, 4, 5, 6, 7, 8, 9] Rising rates and variable patterns of antimicrobial resistance, however, complicate selecting appropriate empiric therapy. Amidst this shifting landscape of resistance to antimicrobials, gram‐negative bacteria and specifically Acinetobacter baumannii (AB), remain a considerable challenge.[10] On the one hand, AB is a less‐frequent cause of serious infections than organisms like Pseudomonas aeruginosa or Enterobacteriaceae in severely ill hospitalized patients.[11, 12] On the other, AB has evolved a variety of resistance mechanisms and exhibits unpredictable susceptibility patterns.[13] These factors combine to increase the likelihood of administering inappropriate empiric therapy when faced with an infection caused by AB and, thereby, raising the risk of death.[14] The fact that clinicians may not routinely consider AB as the potential culprit pathogen in the patient they are treating along with this organism's highly in vitro resistant nature, may result in routine gram‐negative coverage being frequently inadequate for AB infections.
To address the poor outcomes related to inappropriate empiric therapy in the setting of AB, one requires an appreciation of the longitudinal changes and geographic differences in the susceptibility of this pathogen. Thus, we aimed to examine secular trends in the resistance of AB to antimicrobial agents whose effectiveness against this microorganism was well supported in the literature during the study timeframe.[15]
METHODS
To determine the prevalence of predefined resistance patterns among AB in respiratory and blood stream infection (BSI) specimens, we examined The Surveillance Network (TSN) database from Eurofins. We explored data collected between years 2003 and 2012. The database has been used extensively for surveillance purposes since 1994, and has previously been described in detail.[16, 17, 18, 19, 20] Briefly, TSN is a warehouse of routine clinical microbiology data collected from a nationally representative sample of microbiology laboratories in 217 hospitals in the United States. To minimize selection bias, laboratories are included based on their geography and the demographics of the populations they serve.[18] Only clinically significant samples are reported. No personal identifying information for source patients is available in this database. Only source laboratories that perform antimicrobial susceptibility testing according standard Food and Drug Administrationapproved testing methods and that interpret susceptibility in accordance with the Clinical Laboratory Standards Institute breakpoints are included.[21] (See Supporting Table 4 in the online version of this article for minimum inhibitory concentration (MIC) changes over the course of the studycurrent colistin and polymyxin breakpoints applied retrospectively). All enrolled laboratories undergo a pre‐enrollment site visit. Logical filters are used for routine quality control to detect unusual susceptibility profiles and to ensure appropriate testing methods. Repeat testing and reporting are done as necessary.[18]
Laboratory samples are reported as susceptible, intermediate, or resistant. We grouped isolates with intermediate MICs together with the resistant ones for the purposes of the current analysis. Duplicate isolates were excluded. Only samples representing 1 of the 2 infections of interest, respiratory or BSI, were included.
We examined 3 time periods2003 to 2005, 2006 to 2008, and 2009 to 2012for the prevalence of AB's resistance to the following antibiotics: carbapenems (imipenem, meropenem, doripenem), aminoglycosides (tobramycin, amikacin), tetracyclines (minocycline, doxycycline), polymyxins (colistin, polymyxin B), ampicillin‐sulbactam, and trimethoprim‐sulfamethoxazole. Antimicrobial resistance was defined by the designation of intermediate or resistant in the susceptibility category. Resistance to a class of antibiotics was defined as resistance to all drugs within the class for which testing was available. The organism was multidrug resistant (MDR) if it was resistant to at least 1 antimicrobial in at least 3 drug classes examined.[22] Resistance to a combination of 2 drugs was present if the specimen was resistant to both of the drugs in the combination for which testing was available. We examined the data by infection type, time period, the 9 US Census divisions, and location of origin of the sample.
All categorical variables are reported as percentages. Continuous variables are reported as meansstandard deviations and/or medians with the interquartile range (IQR). We did not pursue hypothesis testing due to a high risk of type I error in this large dataset. Therefore, only clinically important trends are highlighted.
RESULTS
Among the 39,320 AB specimens, 81.1% were derived from a respiratory source and 18.9% represented BSI. Demographics of source patients are listed in Table 1. Notably, the median age of those with respiratory infection (58 years; IQR 38, 73) was higher than among patients with BSI (54.5 years; IQR 36, 71), and there were proportionally fewer females among respiratory patients (39.9%) than those with BSI (46.0%). Though only 24.3% of all BSI samples originated from the intensive are unit (ICU), 40.5% of respiratory specimens came from that location. The plurality of all specimens was collected in the 2003 to 2005 time interval (41.3%), followed by 2006 to 2008 (34.7%), with a minority coming from years 2009 to 2012 (24.0%). The proportions of collected specimens from respiratory and BSI sources were similar in all time periods examined (Table 1). Geographically, the South Atlantic division contributed the most samples (24.1%) and East South Central the fewest (2.6%) (Figure 1). The vast majority of all samples came from hospital wards (78.6%), where roughly one‐half originated in the ICU (37.5%). Fewer still came from outpatient sources (18.3%), and a small minority (2.5%) from nursing homes.
| Pneumonia | BSI | All | |
|---|---|---|---|
| |||
| Total, N (%) | 31,868 (81.1) | 7,452 (18.9) | 39,320 |
| Age, y | |||
| Mean (SD) | 57.7 (37.4) | 57.6 (40.6) | 57.7 (38.0) |
| Median (IQR 25, 75) | 58 (38, 73) | 54.5 (36, 71) | 57 (37, 73) |
| Gender, female (%) | 12,725 (39.9) | 3,425 (46.0) | 16,150 (41.1) |
| ICU (%) | 12,9191 (40.5) | 1,809 (24.3) | 14,7284 (37.5) |
| Time period, % total | |||
| 20032005 | 12,910 (40.5) | 3,340 (44.8) | 16,250 (41.3) |
| 20062008 | 11,205 (35.2) | 2,435 (32.7) | 13,640 (34.7) |
| 20092012 | 7,753 (24.3) | 1,677 (22.5) | 9,430 (24.0) |
Figure 2 depicts overall resistance patterns by individual drugs, drug classes, and frequently used combinations of agents. Although doripenem had the highest rate of resistance numerically (90.3%), its susceptibility was tested only in a small minority of specimens (n=31, 0.08%). Resistance to trimethoprim‐sulfamethoxazole was high (55.3%) based on a large number of samples tested (n=33,031). Conversely, colistin as an agent and polymyxins as a class exhibited the highest susceptibility rates of over 90%, though the numbers of samples tested for susceptibility to these drugs were also small (colistin n=2,086, 5.3%; polymyxins n=3,120, 7.9%) (Figure 2). Among commonly used drug combinations, carbapenem+aminoglycoside (18.0%) had the lowest resistance rates, and nearly 30% of all AB specimens tested met the criteria for MDR.
Over time, resistance to carbapenems more‐than doubled, from 21.0% in 2003 to 2005 to 47.9% in 2009 to 2012 (Table 2). Although relatively few samples were tested for colistin susceptibility (n=2,086, 5.3%), resistance to this drug also more than doubled from 2.8% (95% confidence interval: 1.9‐4.2) in 2006 to 2008 to 6.9% (95% confidence interval: 5.7‐8.2) in 2009 to 2012. As a class, however, polymyxins exhibited stable resistance rates over the time frame of the study (Table 2). Prevalence of MDR AB rose from 21.4% in 2003 to 2005 to 33.7% in 2006 to 2008, and remained stable at 35.2% in 2009 to 2012. Resistance to even such broad combinations as carbapenem+ampicillin/sulbactam nearly tripled from 13.2% in 2003 to 2005 to 35.5% in 2009 to 2012. Notably, between 2003 and 2012, although resistance rates either rose or remained stable to all other agents, those to minocycline diminished from 56.5% in 2003 to 2005 to 36.6% in 2006 to 2008 to 30.5% in 2009 to 2012. (See Supporting Table 1 in the online version of this article for time trends based on whether they represented respiratory or BSI specimens, with directionally similar trends in both.)
| Drug/Combination | Time Period | ||||||||
|---|---|---|---|---|---|---|---|---|---|
| 20032005 | 20062008 | 20092012 | |||||||
| Na | %b | 95% CI | N | % | 95% CI | N | % | 95% CI | |
| |||||||||
| Amikacin | 12,949 | 25.2 | 24.5‐26.0 | 10.929 | 35.2 | 34.3‐36.1 | 6,292 | 45.7 | 44.4‐46.9 |
| Tobramycin | 14,549 | 37.1 | 36.3‐37.9 | 11,877 | 41.9 | 41.0‐42.8 | 7,901 | 39.2 | 38.1‐40.3 |
| Aminoglycoside | 14,505 | 22.5 | 21.8‐23.2 | 11,967 | 30.6 | 29.8‐31.4 | 7,736 | 34.8 | 33.8‐35.8 |
| Doxycycline | 173 | 36.4 | 29.6‐43.8 | 38 | 29.0 | 17.0‐44.8 | 32 | 34.4 | 20.4‐51.7 |
| Minocycline | 1,388 | 56.5 | 53.9‐50.1 | 902 | 36.6 | 33.5‐39.8 | 522 | 30.5 | 26.7‐34.5 |
| Tetracycline | 1,511 | 55.4 | 52.9‐57.9 | 940 | 36.3 | 33.3‐39.4 | 546 | 30.8 | 27.0‐34.8 |
| Doripenem | NR | NR | NR | 9 | 77.8 | 45.3‐93.7 | 22 | 95.5 | 78.2‐99.2 |
| Imipenem | 14,728 | 21.8 | 21.2‐22.5 | 12,094 | 40.3 | 39.4‐41.2 | 6,681 | 51.7 | 50.5‐52.9 |
| Meropenem | 7,226 | 37.0 | 35.9‐38.1 | 5,628 | 48.7 | 47.3‐50.0 | 4,919 | 47.3 | 45.9‐48.7 |
| Carbapenem | 15,490 | 21.0 | 20.4‐21.7 | 12,975 | 38.8 | 38.0‐39.7 | 8,778 | 47.9 | 46.9‐49.0 |
| Ampicillin/sulbactam | 10,525 | 35.2 | 34.3‐36.2 | 9,413 | 44.9 | 43.9‐45.9 | 6,460 | 41.2 | 40.0‐42.4 |
| Colistin | NR | NR | NR | 783 | 2.8 | 1.9‐4.2 | 1,303 | 6.9 | 5.7‐8.2 |
| Polymyxin B | 105 | 7.6 | 3.9‐14.3 | 796 | 12.8 | 10.7‐15.3 | 321 | 6.5 | 4.3‐9.6 |
| Polymyxin | 105 | 7.6 | 3.9‐14.3 | 1,563 | 7.9 | 6.6‐9.3 | 1,452 | 6.8 | 5.6‐8.2 |
| Trimethoprim/sulfamethoxazole | 13,640 | 52.5 | 51.7‐53.3 | 11,535 | 57.1 | 56.2‐58.0 | 7,856 | 57.6 | 56.5‐58.7 |
| MDRc | 16,249 | 21.4 | 20.7‐22.0 | 13,640 | 33.7 | 33.0‐34.5 | 9,431 | 35.2 | 34.2‐36.2 |
| Carbapenem+aminoglycoside | 14,601 | 8.9 | 8.5‐9.4 | 12,333 | 21.3 | 20.6‐22.0 | 8,256 | 29.3 | 28.3‐30.3 |
| Aminoglycoside+ampicillin/sulbactam | 10,107 | 12.9 | 12.3‐13.6 | 9,077 | 24.9 | 24.0‐25.8 | 6,200 | 24.3 | 23.2‐25.3 |
| Aminoglycosie+minocycline | 1,359 | 35.6 | 33.1‐38.2 | 856 | 21.4 | 18.8‐24.2 | 503 | 24.5 | 20.9‐28.4 |
| Carbapenem+ampicillin/sulbactam | 10,228 | 13.2 | 12.5‐13.9 | 9,145 | 29.4 | 28.4‐30.3 | 6,143 | 35.5 | 34.3‐36.7 |
Regionally, examining resistance by classes and combinations of antibiotics, trimethoprim‐sulfamethoxazole exhibited consistently the highest rates of resistance, ranging from the lowest in the New England (28.8%) to the highest in the East North Central (69.9%) Census divisions (See Supporting Table 2 in the online version of this article). The rates of resistance to tetracyclines ranged from 0.0% in New England to 52.6% in the Mountain division, and to polymyxins from 0.0% in the East South Central division to 23.4% in New England. Generally, New England enjoyed the lowest rates of resistance (0.0% to tetracyclines to 28.8% to trimethoprim‐sulfamethoxazole), and the Mountain division the highest (0.9% to polymyxins to 52.6% to tetracyclines). The rates of MDR AB ranged from 8.0% in New England to 50.4% in the Mountain division (see Supporting Table 2 in the online version of this article).
Examining resistances to drug classes and combinations by the location of the source specimen revealed that trimethoprim‐sulfamethoxazole once again exhibited the highest rate of resistance across all locations (see Supporting Table 3 in the online version of this article). Despite their modest contribution to the overall sample pool (n=967, 2.5%), organisms from nursing home subjects had the highest prevalence of resistance to aminoglycosides (36.3%), tetracyclines (57.1%), and carbapenems (47.1%). This pattern held true for combination regimens examined. Nursing homes also vastly surpassed other locations in the rates of MDR AB (46.5%). Interestingly, the rates of MDR did not differ substantially among regular inpatient wards (29.2%), the ICU (28.7%), and outpatient locations (26.2%) (see Supporting Table 3 in the online version of this article).
DISCUSSION
In this large multicenter survey we have documented the rising rates of AB resistance to clinically important antimicrobials in the United States. On the whole, all antimicrobials, except for minocycline, exhibited either large or small increases in resistance. Alarmingly, even colistin, a true last resort AB treatment, lost a considerable amount of activity against AB, with the resistance rate rising from 2.8% in 2006 to 2008 to 6.9% in 2009 to 2012. The single encouraging trend that we observed was that resistance to minocycline appeared to diminish substantially, going from over one‐half of all AB tested in 2003 to 2005 to just under one‐third in 2009 to 2012.
Although we did note a rise in the MDR AB, our data suggest a lower percentage of all AB that meets the MDR phenotype criteria compared to reports by other groups. For example, the Center for Disease Dynamics and Economic Policy (CDDEP), analyzing the same data as our study, reports a rise in MDR AB from 32.1% in 1999 to 51.0% in 2010.[23] This discrepancy is easily explained by the fact that we included polymyxins, tetracyclines, and trimethoprim‐sulfamethoxazole in our evaluation, whereas the CDDEP did not examine these agents. Furthermore, we omitted fluoroquinolones, a drug class with high rates of resistance, from our study, because we were interested in focusing only on antimicrobials with clinical data in AB infections.[22] In addition, we limited our evaluation to specimens derived from respiratory or BSI sources, whereas the CDDEP data reflect any AB isolate present in TSN.
We additionally confirm that there is substantial geographic variation in resistance patterns. Thus, despite different definitions, our data agree with those from the CDDEP that the MDR prevalence is highest in the Mountain and East North Central divisions, and lowest in New England overall.[23] The wide variations underscore the fact that it is not valid to speak of national rates of resistance, but rather it is important to concentrate on the local patterns. This information, though important from the macroepidemiologic standpoint, is likely still not granular enough to help clinicians make empiric treatment decisions. In fact, what is needed for that is real‐time antibiogram data specific to each center and even each unit within each center.
The latter point is further illustrated by our analysis of locations of origin of the specimens. In this analysis, we discovered that, contrary to the common presumption that the ICU has the highest rate of resistant organisms, specimens derived from nursing homes represent perhaps the most intensely resistant organisms. In other words, the nursing home is the setting most likely to harbor patients with respiratory infections and BSIs caused by resistant AB. These data are in agreement with several other recent investigations. In a period‐prevalence survey conducted in the state of Maryland in 2009 by Thom and colleagues, long‐term care facilities were found to have the highest prevalence of any AB, and also those resistant to imipenem, MDR, and extensively drug‐resistant organisms.[24] Mortensen and coworkers confirmed the high prevalence of AB and AB resistance in long‐term care facilities, and extended this finding to suggest that there is evidence for intra‐ and interhospital spread of these pathogens.[25] Our data confirm this concerning finding at the national level, and point to a potential area of intervention for infection prevention.
An additional finding of some concern is that the highest proportion of colistin resistance among those specimens, whose location of origin was reported in the database, was the outpatient setting (6.6% compared to 5.4% in the ICU specimens, for example). Although these infections would likely meet the definition for healthcare‐associated infection, AB as a community‐acquired respiratory pathogen is not unprecedented either in the United States or abroad.[26, 27, 28, 29, 30] It is, however, reassuring that most other antimicrobials examined in our study exhibit higher rates of susceptibility in the specimens derived from the outpatient settings than either from the hospital or the nursing home.
Our study has a number of strengths. As a large multicenter survey, it is representative of AB susceptibility patterns across the United States, which makes it highly generalizable. We focused on antibiotics for which clinical evidence is available, thus adding a practical dimension to the results. Another pragmatic consideration is examining the data by geographic distributions, allowing an additional layer of granularity for clinical decisions. At the same time it suffers from some limitations. The TSN database consists of microbiology samples from hospital laboratories. Although we attempted to reduce the risk of duplication, because of how samples are numbered in the database, repeat sampling remains a possibility. Despite having stratified the data by geography and the location of origin of the specimen, it is likely not granular enough for local risk stratification decisions clinicians make daily about the choices of empiric therapy. Some of the MIC breakpoints have changed over the period of the study (see Supporting Table 4 in the online version of this article). Because these changes occurred in the last year of data collection (2012), they should have had only a minimal, if any, impact on the observed rates of resistance in the time frame examined. Additionally, because resistance rates evolve rapidly, more current data are required for effective clinical decision making.
In summary, we have demonstrated that the last decade has seen an alarming increase in the rate of resistance of AB to multiple clinically important antimicrobial agents and classes. We have further emphasized the importance of granularity in susceptibility data to help clinicians make sensible decisions about empiric therapy in hospitalized patients with serious infections. Finally, and potentially most disturbingly, the nursing home as a location appears to be a robust reservoir for spread for resistant AB. All of these observations highlight the urgent need to develop novel antibiotics and nontraditional agents, such as antibodies and vaccines, to combat AB infections, in addition to having important infection prevention implications if we are to contain the looming threat of the end of antibiotics.[31]
Disclosure
This study was funded by a grant from Tetraphase Pharmaceuticals, Watertown, MA.
- National Nosocomial Infections Surveillance (NNIS) System Report. Am J Infect Control. 2004;32:470–485.
- , , , National surveillance of antimicrobial resistance in Pseudomonas aeruginosa isolates obtained from intensive care unit patients from 1993 to 2002. Antimicrob Agents Chemother. 2004;48:4606–4610.
- , , , et al. Health care‐associated pneumonia and community‐acquired pneumonia: a single‐center experience. Antimicrob Agents Chemother. 2007;51:3568–3573.
- , , , et al. Clinical importance of delays in the initiation of appropriate antibiotic treatment for ventilator‐associated pneumonia. Chest. 2002;122:262–268.
- ; ICU‐Acquired Pneumonia Study Group. Modification of empiric antibiotic treatment in patients with pneumonia acquired in the intensive care unit. Intensive Care Med. 1996;22:387–394.
- , , , , Antimicrobial therapy escalation and hospital mortality among patients with HCAP: a single center experience. Chest. 2008:134:963–968.
- , , , et al. Surviving Sepsis Campaign: international guidelines for management of severe sepsis and septic shock: 2008. Crit Care Med. 2008;36:296–327.
- , , , , , Inappropriate antibiotic therapy in Gram‐negative sepsis increases hospital length of stay. Crit Care Med. 2011;39:46–51.
- , , , Inadequate antimicrobial treatment of infections: a risk factor for hospital mortality among critically ill patients. Chest. 1999;115:462–474.
- Centers for Disease Control and Prevention. Antibiotic resistance threats in the United States, 2013. Available at: http://www.cdc.gov/drugresistance/threat-report-2013/pdf/ar-threats-2013-508.pdf#page=59. Accessed December 29, 2014.
- , , , et al.; National Healthcare Safety Network (NHSN) Team and Participating NHSN Facilities. Antimicrobial‐resistant pathogens associated with healthcare‐associated infections: summary of data reported to the National Healthcare Safety Network at the Centers for Disease Control and Prevention, 2009–2010. Infect Control Hosp Epidemiol. 2013;34:1–14.
- , , , , Multi‐drug resistance, inappropriate initial antibiotic therapy and mortality in Gram‐negative severe sepsis and septic shock: a retrospective cohort study. Crit Care. 2014;18(6):596.
- , , , , , Global challenge of multidrug‐resistant Acinetobacter baumannii. Antimicrob Agents Chemother. 2007;51:3471–3484.
- , , , Predictors of hospital mortality among septic ICU patients with Acinetobacter spp. bacteremia: a cohort study. BMC Infect Dis. 2014;14:572.
- , Treatment of Acinetobacter infections. Clin Infect Dis. 2010;51:79–84.
- , , Increasing resistance of Acinetobacter species to imipenem in United States hospitals, 1999–2006. Infect Control Hosp Epidemiol. 2010;31:196–197.
- , , , , Trends in resistance to carbapenems and third‐generation cephalosporins among clinical isolates of Klebsiella pneumoniae in the United States, 1999–2010. Infect Control Hosp Epidemiol. 2013;34:259–268.
- , , Antimicrobial resistance in key bloodstream bacterial isolates: electronic surveillance with the Surveillance Network Database—USA. Clin Infect Dis. 1999;29:259–263.
- , , Community‐associated methicillin‐resistant Staphylococcus aureus in outpatients, United States, 1999–2006. Emerg Infect Dis. 2009;15:1925–1930.
- , , , , Prevalence of antimicrobial resistance in bacteria isolated from central nervous system specimens as reported by U.S. hospital laboratories from 2000 to 2002. Ann Clin Microbiol Antimicrob. 2004;3:3.
- Performance standards for antimicrobial susceptibility testing: twenty‐second informational supplement. CLSI document M100‐S22. Wayne, PA: Clinical and Laboratory Standards Institute; 2012.
- , , , et al. Multidrug‐resistant, extensively drug‐resistant and pandrug‐resistant bacteria: an international expert proposal for interim standard definitions for acquired resistance. Clin Microbiol Infect. 2012;18:268–281.
- CDDEP: The Center for Disease Dynamics, Economics and Policy. Resistance map: Acinetobacter baumannii overview. Available at: http://www.cddep.org/projects/resistance_map/acinetobacter_baumannii_overview. Accessed January 16, 2015.
- , , , et al.; Maryland MDRO Prevention Collaborative. Assessing the burden of Acinetobacter baumannii in Maryland: a statewide cross‐sectional period prevalence survey. Infect Control Hosp Epidemiol. 2012;33:883–888.
- , , , et al. Multidrug‐resistant Acinetobacter baumannii infection, colonization, and transmission related to a long‐term care facility providing subacute care. Infect Control Hosp Epidemiol. 2014;35:406–411.
- , , , , , Severe community‐acquired pneumonia due to Acinetobacter baumannii. Chest. 2001;120:1072–1077.
- , , , , , Fulminant community‐acquired Acinetobacter baumannii pneumonia as distinct clinical syndrome. Chest. 2006;129:102–109.
- , , , Community‐acquired Acinetobacter baumannii pneumonia. Rev Clin Esp. 2003;203:284–286.
- , , , et al. Antimicrobial drug‐resistant microbes associated with hospitalized community‐acquired and healthcare‐associated pneumonia: a multi‐center study in Taiwan. J Formos Med Assoc. 2013;112:31–40.
- , , , , Antimicrobial resistance in Hispanic patients hospitalized in San Antonio, TX with community‐acquired pneumonia. Hosp Pract (1995). 2010;38:108–113.
- Centers for Disease Control and Prevention. CDC director blog. The end of antibiotics. Can we come back from the brink? Available at: http://blogs.cdc.gov/cdcdirector/2014/05/05/the-end-of-antibiotics-can-we-come-back-from-the-brink/. Published May 5, 2014. Accessed January 16, 2015.
© 2015 Society of Hospital Medicine

Evaluation of Gender as a Clinically Relevant Outcome Variable in the Treatment of Onychomycosis With Efinaconazole Topical Solution 10%
Onychomycosis is the most common nail disease in adults, representing up to 50% of all nail disorders, and is nearly always associated with tinea pedis.1,2 Moreover, toenail onychomycosis frequently involves several nails3 and can be more challenging to treat because of the slow growth rate of nails and the difficult delivery of antifungal agents to the nail bed.3,4
The most prevalent predisposing risk factor for developing onychomycosis is advanced age, with a reported prevalence of 18.2% in patients aged 60 to 79 years compared to 0.7% in patients younger than 19 years.2 Men are up to 3 times more likely to develop onychomycosis than women, though the reasons for this gender difference are less clear.2,5 It has been hypothesized that occupational factors may play a role,2 with increased use of occlusive footwear and more frequent nail injuries contributing to a higher incidence of onychomycosis in males.6
Differences in hormone levels associated with gender also may result in different capacities to inhibit the growth of dermatophytes.2 The risk for developing onychomycosis increases with age at a similar rate in both genders.7
Although onychomycosis is more common in men, the disease has been shown to have a greater impact on quality of life (QOL) in women. Studies have shown that onychomycosis was more likely to cause embarrassment in women than in men (83% vs 71%; N=258), and women with onychomycosis felt severely embarrassed more often than men (44% vs 26%; N=258).8,9 Additionally, one study (N=43,593) showed statistically significant differences associated with gender among onychomycosis patients who reported experiencing pain (33.7% of women vs 26.7% of men; P<.001), discomfort in walking (43.1% vs 36.4%; P<.001), and embarrassment (28.8% vs 25.1%; P<.001).10 Severe cases of onychomycosis even appear to have a negative impact on patients’ intimate relationships, and lower self-esteem has been reported in female patients due to unsightly and contagious-looking nail plates.11,12 Socks and stockings frequently may be damaged due to the constant friction from diseased nails that are sharp and dystrophic.13,14 In one study, treatment satisfaction was related to improvement in nail condition; however, males tended to be more satisfied with the improvement than females. Females were significantly less satisfied than males based on QOL scores for discomfort in wearing shoes (61.5 vs 86.3; P=.001), restrictions in shoe options (59.0 vs 82.8; P=.001), and the need to conceal toenails (73.3 vs 89.3; P<.01).15
Numerous studies have assessed the effectiveness of antifungal drugs in treating onychomycosis; however, there are limited data available on the impact of gender on outcome variables. Results from 2 identical 52-week, prospective, multicenter, randomized, double-blind studies of a total of 1655 participants (age range, 18–70 years) assessing the safety and efficacy of efinaconazole topical solution 10% in the treatment of onychomycosis were reported in 2013.16 Here, a gender subgroup analysis for male and female participants with mild to moderate onychomycosis is presented.
Methods
Two 52-week, prospective, multicenter, randomized, double-blind, vehicle-controlled studies were designed to evaluate the efficacy, safety, and tolerability of efinaconazole topical solution 10% versus vehicle in 1655 participants aged 18 to 70 years with mild to moderate toenail onychomycosis. Participants who presented with 20% to 50% clinical involvement of the target toenail were randomized (3:1 ratio) to once-daily application of a blinded study drug on the toenails for 48 weeks, followed by a 4-week follow-up period.16
Efficacy Evaluation
The primary efficacy end point was complete cure, defined as 0% clinical involvement of target toenail and mycologic cure based on negative potassium hydroxide examination and negative fungal culture at week 52.16 Secondary and supportive efficacy end points included mycologic cure, treatment success (<10% clinical involvement of the target toenail), complete or almost complete cure (≤5% clinical involvement and mycologic cure), and change in QOL based on a self-administered QOL questionnaire. All secondary end points were assessed at week 52.16 All items in the QOL questionnaire were transferred to a 0 to 100 scale, with higher scores indicating better functioning.17
In both studies, treatment compliance was assessed through participant diaries that detailed all drug applications as well as the weight of returned product bottles. Participants were considered noncompliant if they missed more than 14 cumulative applications of the study drug in the 28 days leading up to the visit at week 48, if they missed more than 20% of the total number of expected study drug applications during the treatment period, and/or if they missed 28 or more consecutive applications of the study drug during the total treatment period.
Safety Evaluation
Safety assessments included monitoring and recording adverse events (AEs) until week 52.16
Results
The 2 studies included a total of 1275 (77.2%) male and 376 (22.8%) female participants with mild to moderate onychomycosis (intention-to-treat population). Pooled results are provided in this analysis.
At baseline, the mean area of target toenail involvement among male and female participants in the efinaconazole treatment group was 36.7% and 35.6%, respectively, compared to 36.4% and 37.9%, respectively, in the vehicle group. The mean number of affected nontarget toenails was 2.8 and 2.7 among male and female participants, respectively, in the efinaconazole group compared to 2.9 and 2.4, respectively, in the vehicle group (Table 1).
Female participants tended to be somewhat more compliant with treatment than male participants at study end. At week 52, 93.0% and 93.4% of female participants in the efinaconazole and vehicle groups, respectively, were considered compliant with treatment compared to 91.1% and 88.6% of male participants, respectively (Table 1).
Primary Efficacy End Point (Observed Case)
At week 52, 15.8% of male and 27.1% of female participants in the efinaconazole treatment group had a complete cure compared to 4.2% and 6.3%, respectively, of those in the vehicle group (both P<.001). Efinaconazole topical solution 10% was significantly more effective than vehicle from week 48 (P<.001 male and P=.004 female).
The differences in complete cure rates reported for male (15.8%) and female (27.1%) participants treated with efinaconazole topical solution 10% were significant at week 52 (P=.001)(Figure 1).
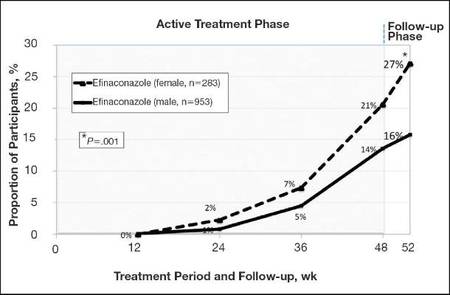 |
| Figure 1. Proportion of male and female participants treated with once-daily application of efinaconazole topical solution 10% who achieved complete cure from weeks 12 to 52 (observed case; intention-to-treat population; pooled data). |
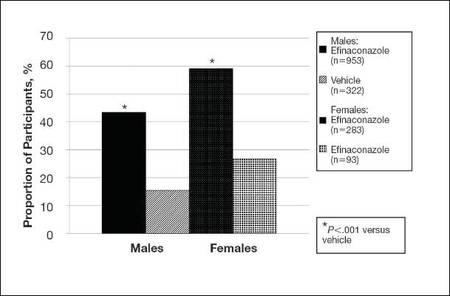 |
| Figure 2. Treatment success (defined as ≤10% clinical involvement of the target toenail) at week 52. Comparison of results with efinaconazole topical solution 10% and vehicle (observed case; intention-to-treat population; pooled data). |
Secondary and Supportive Efficacy End Points (Observed Case)
At week 52, 53.7% of male participants and 64.8% of female participants in the efinaconazole group achieved mycologic cure compared to 14.8% and 22.5%, respectively, of those in the vehicle group (both P<.001). Mycologic cure in the efinaconazole group versus the vehicle group became statistically significant at week 12 in male participants (P=.002) and at week 24 in female participants (P<.001).
At week 52, more male and female participants in the efinaconazole group (24.9% and 36.8%, respectively) achieved complete or almost complete cure compared to those in the vehicle group (6.8% and 11.3%, respectively), and 43.5% and 59.1% of male and female participants, respectively, were considered treatment successes (≤10% clinical involvement of the target toenail) compared to 15.5% and 26.8%, respectively, in the vehicle group (all P<.001)(Figure 2).
Treatment satisfaction scores were higher among female participants. At week 52, the mean QOL assessment score among female participants in the efinaconazole group was 77.2 compared to 70.3 among male participants in the same group (43.0 and 41.2, respectively, in the vehicle group). All QOL assessment scores were lower (ie, worse) in female onychomycosis participants at baseline. Improvements in all QOL scores were much greater in female participants at week 52 (Table 2).
The total number of efinaconazole applications was similar among male and female participants (315.1 vs 316.7). The mean amount of efina- conazole applied was greater in male participants (50.4 g vs 45.6 g), and overall compliance rates, though similar, were slightly higher in females compared to males (efinaconazole only)(93.0% vs 91.1%).
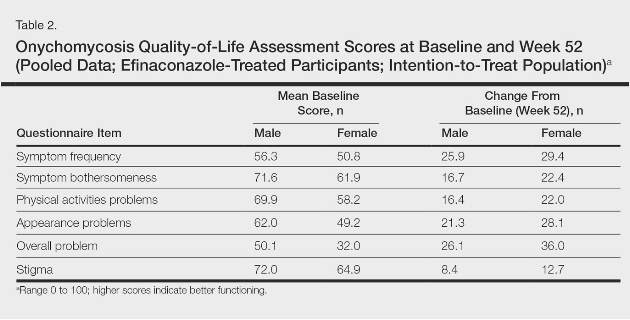
Safety
Overall, AE rates for efinaconazole were similar to those reported for vehicle (65.3% vs 59.8%).16 Slightly more female participants reported 1 or more AE than males (71.3% vs 63.5%). Adverse events were generally mild (50.0% in females; 53.7% in males) or moderate (46.7% in females; 41.8% in males) in severity, were not related to the study drug (89.9% in females; 93.1% in males), and resolved without sequelae. The rate of discontinuation from AEs was low (2.8% in females; 2.5% in males).
Comment
Efinaconazole topical solution 10% was significantly more effective than vehicle in both male and female participants with mild to moderate onychomycosis. It appears to be especially effective in female participants, with more than 27% of female participants achieving complete cure at week 52, and nearly 37% of female participants achieving complete or almost complete cure at week 52.
Mycologic cure is the only consistently defined efficacy parameter reported in toenail onychomycosis studies.18 It often is considered the main treatment goal, with complete cure occurring somewhat later as the nails grow out.19 Indeed, in this subgroup analysis the differences seen between the active and vehicle groups correlated well with the cure rates seen at week 52. Interestingly, significantly better mycologic cure rates (P=.002, active vs vehicle) were seen as early as week 12 in the male subgroup.
The current analysis suggests that male onychomycosis patients may be more difficult to treat, a finding noted by other investigators, though the reason is not clear.20 It is known that the prevalence of onychomycosis is higher in males,2,5 but data comparing cure rates by gender is lacking. It has been suggested that men more frequently undergo nail trauma and tend to seek help for more advanced disease.20 Treatment compliance also may be an issue. In our study, mean nail involvement was similar among male and female participants treated with efinaconazole (36.7% and 35.6%, respectively). Treatment compliance was higher among females compared to males (93.0% vs 91.1%), with the lowest compliance rates seen in males in the vehicle group (where complete cure rates also were the lowest). The amount of study drug used was greater in males, possibly due to larger toenails, though toenail surface area was not measured. Although there is no evidence to suggest that male toenails grow quicker, as many factors can impact nail growth, they tend to be thicker. Patients with thick toenails may be less likely to achieve complete cure.20 It also is possible that male toenails take longer to grow out fully, and they may require a longer treatment course. The 52-week duration of these studies may not have allowed for full regrowth of the nails, despite mycologic cure. Indeed, continued improvement in cure rates in onychomycosis patients with longer treatment courses have been noted by other investigators.21
The current analysis revealed much lower baseline QOL scores in female onychomycosis patients compared to male patients. Given that target nail involvement at baseline was similar across both groups, this finding may be indicative of greater concern about their condition among females, supporting other views that onychomycosis has a greater impact on QOL in female patients. Similar scores reported across genders at week 52 likely reflects the greater efficacy seen in females.
Conclusion
Based on this subgroup analysis, once-daily application of efinaconazole topical solution 10% may provide a useful option in the treatment of mild to moderate onychomycosis, particularly in female patients. The greater improvement in nail condition concomitantly among females translates to higher overall treatment satisfaction.
Acknowledgment—The author thanks Brian Bulley, MSc, of Inergy Limited, Lindfield, West Sussex, United Kingdom, for medical writing support. Valeant Pharmaceuticals North America, LLC, funded Inergy’s activities pertaining to the manuscript.
1. Scher RK, Coppa LM. Advances in the diagnosis and treatment of onychomycosis. Hosp Med. 1998;34:11-20.
2. Gupta AK, Jain HC, Lynde CW, et al. Prevalence and epidemiology of onychomycosis in patients visiting physicians’ offices: a multicenter Canadian survey of 15,000 patients. J Am Acad Dermatol. 2000;43:244-248.
3. Finch JJ, Warshaw EM. Toenail onychomycosis: current and future treatment options. Dermatol Ther. 2007;20:31-46.
4. Kumar S, Kimball AB. New antifungal therapies for the treatment of onychomycosis. Expert Opin Investig Drugs. 2009;18:727-734.
5. Elewski BE, Charif MA. Prevalence of onychomycosis in patients attending a dermatology clinic in northeastern Ohio for other conditions. Arch Dermatol. 1997;133:1172-1173.
6. Araujo AJG, Bastos OMP, Souza MAJ, et al. Occurrence of onychomycosis among patients attended in dermatology offices in the city of Rio de Janeiro, Brazil. An Bras Dermatol. 2003;78:299-308.
7. Pierard G. Onychomycosis and other superficial fungal infections of the foot in the elderly: a Pan-European Survey. Dermatology. 2001;202:220-224.
8. Drake LA, Scher RK, Smith EB, et al. Effect of onychomycosis on quality of life. J Am Acad Dermatol. 1998;38(5, pt 1):702-704.
9. Kowalczuk-Zieleniec E, Nowicki E, Majkowicz M. Onychomycosis changes quality of life. J Eur Acad Dermatol Venereol. 2002;16(suppl 1):248.
10. Katsambas A, Abeck D, Haneke E, et al. The effects of foot disease on quality of life: results of the Achilles Project. J Eur Acad Dermatol Venereol. 2005;19:191-195.
11. Salgo PL, Daniel CR, Gupta AK, et al. Onychomycosis disease management. Medical Crossfire: Debates, Peer Exchange and Insights in Medicine. 2003;4:1-17.
12. Elewski BE. The effect of toenail onychomycosis on patient quality of life. Int J Dermatol. 1997;36:754-756.
13. Hay RJ. The future of onychomycosis therapy may involve a combination of approaches. Br J Dermatol. 2001;145:3-8.
14. Whittam LR, Hay RJ. The impact of onychomycosis on quality of life. Clin Exp Dermatol. 1997;22:87-89.
15. Stier DM, Gause D, Joseph WS, et al. Patient satisfaction with oral versus nonoral therapeutic approaches in onychomycosis. J Am Podiatr Med Assoc. 2001;91:521-527.
16. Elewski BE, Rich P, Pollak R, et al. Efinaconazole 10% solution in the treatment of toenail onychomycosis: two phase 3 multicenter, randomized, double-blind studies. J Am Acad Dermatol. 2013;68:600-608.
17. Tosti A, Elewski BE. Treatment of onychomycosis with efinaconazole 10% topical solution and quality of life. J Clin Aesthet Dermatol. 2014;7:25-30.
18. Werschler WP, Bondar G, Armstrong D. Assessing treatment outcomes in toenail onychomycosis clinical trials. Am J Clin Dermatol. 2004;5:145-152.
19. Gupta AK. Treatment of dermatophyte toenail onychomycosis in the United States: a pharmacoeconomic analysis. J Am Podiatr Med Assoc. 2002;92:272-286.
20. Sigurgeirsson B. Prognostic factors for cure following treatment of onychomycosis. J Eur Acad Dermatol Venereol. 2010;24:679-684.
21. Epstein E. How often does oral treatment of toenail onychomycosis produce a disease-free nail? an analysis of published data. Arch Dermatol. 1998;134:1551-1554.
Onychomycosis is the most common nail disease in adults, representing up to 50% of all nail disorders, and is nearly always associated with tinea pedis.1,2 Moreover, toenail onychomycosis frequently involves several nails3 and can be more challenging to treat because of the slow growth rate of nails and the difficult delivery of antifungal agents to the nail bed.3,4
The most prevalent predisposing risk factor for developing onychomycosis is advanced age, with a reported prevalence of 18.2% in patients aged 60 to 79 years compared to 0.7% in patients younger than 19 years.2 Men are up to 3 times more likely to develop onychomycosis than women, though the reasons for this gender difference are less clear.2,5 It has been hypothesized that occupational factors may play a role,2 with increased use of occlusive footwear and more frequent nail injuries contributing to a higher incidence of onychomycosis in males.6
Differences in hormone levels associated with gender also may result in different capacities to inhibit the growth of dermatophytes.2 The risk for developing onychomycosis increases with age at a similar rate in both genders.7
Although onychomycosis is more common in men, the disease has been shown to have a greater impact on quality of life (QOL) in women. Studies have shown that onychomycosis was more likely to cause embarrassment in women than in men (83% vs 71%; N=258), and women with onychomycosis felt severely embarrassed more often than men (44% vs 26%; N=258).8,9 Additionally, one study (N=43,593) showed statistically significant differences associated with gender among onychomycosis patients who reported experiencing pain (33.7% of women vs 26.7% of men; P<.001), discomfort in walking (43.1% vs 36.4%; P<.001), and embarrassment (28.8% vs 25.1%; P<.001).10 Severe cases of onychomycosis even appear to have a negative impact on patients’ intimate relationships, and lower self-esteem has been reported in female patients due to unsightly and contagious-looking nail plates.11,12 Socks and stockings frequently may be damaged due to the constant friction from diseased nails that are sharp and dystrophic.13,14 In one study, treatment satisfaction was related to improvement in nail condition; however, males tended to be more satisfied with the improvement than females. Females were significantly less satisfied than males based on QOL scores for discomfort in wearing shoes (61.5 vs 86.3; P=.001), restrictions in shoe options (59.0 vs 82.8; P=.001), and the need to conceal toenails (73.3 vs 89.3; P<.01).15
Numerous studies have assessed the effectiveness of antifungal drugs in treating onychomycosis; however, there are limited data available on the impact of gender on outcome variables. Results from 2 identical 52-week, prospective, multicenter, randomized, double-blind studies of a total of 1655 participants (age range, 18–70 years) assessing the safety and efficacy of efinaconazole topical solution 10% in the treatment of onychomycosis were reported in 2013.16 Here, a gender subgroup analysis for male and female participants with mild to moderate onychomycosis is presented.
Methods
Two 52-week, prospective, multicenter, randomized, double-blind, vehicle-controlled studies were designed to evaluate the efficacy, safety, and tolerability of efinaconazole topical solution 10% versus vehicle in 1655 participants aged 18 to 70 years with mild to moderate toenail onychomycosis. Participants who presented with 20% to 50% clinical involvement of the target toenail were randomized (3:1 ratio) to once-daily application of a blinded study drug on the toenails for 48 weeks, followed by a 4-week follow-up period.16
Efficacy Evaluation
The primary efficacy end point was complete cure, defined as 0% clinical involvement of target toenail and mycologic cure based on negative potassium hydroxide examination and negative fungal culture at week 52.16 Secondary and supportive efficacy end points included mycologic cure, treatment success (<10% clinical involvement of the target toenail), complete or almost complete cure (≤5% clinical involvement and mycologic cure), and change in QOL based on a self-administered QOL questionnaire. All secondary end points were assessed at week 52.16 All items in the QOL questionnaire were transferred to a 0 to 100 scale, with higher scores indicating better functioning.17
In both studies, treatment compliance was assessed through participant diaries that detailed all drug applications as well as the weight of returned product bottles. Participants were considered noncompliant if they missed more than 14 cumulative applications of the study drug in the 28 days leading up to the visit at week 48, if they missed more than 20% of the total number of expected study drug applications during the treatment period, and/or if they missed 28 or more consecutive applications of the study drug during the total treatment period.
Safety Evaluation
Safety assessments included monitoring and recording adverse events (AEs) until week 52.16
Results
The 2 studies included a total of 1275 (77.2%) male and 376 (22.8%) female participants with mild to moderate onychomycosis (intention-to-treat population). Pooled results are provided in this analysis.
At baseline, the mean area of target toenail involvement among male and female participants in the efinaconazole treatment group was 36.7% and 35.6%, respectively, compared to 36.4% and 37.9%, respectively, in the vehicle group. The mean number of affected nontarget toenails was 2.8 and 2.7 among male and female participants, respectively, in the efinaconazole group compared to 2.9 and 2.4, respectively, in the vehicle group (Table 1).
Female participants tended to be somewhat more compliant with treatment than male participants at study end. At week 52, 93.0% and 93.4% of female participants in the efinaconazole and vehicle groups, respectively, were considered compliant with treatment compared to 91.1% and 88.6% of male participants, respectively (Table 1).
Primary Efficacy End Point (Observed Case)
At week 52, 15.8% of male and 27.1% of female participants in the efinaconazole treatment group had a complete cure compared to 4.2% and 6.3%, respectively, of those in the vehicle group (both P<.001). Efinaconazole topical solution 10% was significantly more effective than vehicle from week 48 (P<.001 male and P=.004 female).
The differences in complete cure rates reported for male (15.8%) and female (27.1%) participants treated with efinaconazole topical solution 10% were significant at week 52 (P=.001)(Figure 1).
|
| Figure 1. Proportion of male and female participants treated with once-daily application of efinaconazole topical solution 10% who achieved complete cure from weeks 12 to 52 (observed case; intention-to-treat population; pooled data). |
|
| Figure 2. Treatment success (defined as ≤10% clinical involvement of the target toenail) at week 52. Comparison of results with efinaconazole topical solution 10% and vehicle (observed case; intention-to-treat population; pooled data). |
Secondary and Supportive Efficacy End Points (Observed Case)
At week 52, 53.7% of male participants and 64.8% of female participants in the efinaconazole group achieved mycologic cure compared to 14.8% and 22.5%, respectively, of those in the vehicle group (both P<.001). Mycologic cure in the efinaconazole group versus the vehicle group became statistically significant at week 12 in male participants (P=.002) and at week 24 in female participants (P<.001).
At week 52, more male and female participants in the efinaconazole group (24.9% and 36.8%, respectively) achieved complete or almost complete cure compared to those in the vehicle group (6.8% and 11.3%, respectively), and 43.5% and 59.1% of male and female participants, respectively, were considered treatment successes (≤10% clinical involvement of the target toenail) compared to 15.5% and 26.8%, respectively, in the vehicle group (all P<.001)(Figure 2).
Treatment satisfaction scores were higher among female participants. At week 52, the mean QOL assessment score among female participants in the efinaconazole group was 77.2 compared to 70.3 among male participants in the same group (43.0 and 41.2, respectively, in the vehicle group). All QOL assessment scores were lower (ie, worse) in female onychomycosis participants at baseline. Improvements in all QOL scores were much greater in female participants at week 52 (Table 2).
The total number of efinaconazole applications was similar among male and female participants (315.1 vs 316.7). The mean amount of efina- conazole applied was greater in male participants (50.4 g vs 45.6 g), and overall compliance rates, though similar, were slightly higher in females compared to males (efinaconazole only)(93.0% vs 91.1%).
Safety
Overall, AE rates for efinaconazole were similar to those reported for vehicle (65.3% vs 59.8%).16 Slightly more female participants reported 1 or more AE than males (71.3% vs 63.5%). Adverse events were generally mild (50.0% in females; 53.7% in males) or moderate (46.7% in females; 41.8% in males) in severity, were not related to the study drug (89.9% in females; 93.1% in males), and resolved without sequelae. The rate of discontinuation from AEs was low (2.8% in females; 2.5% in males).
Comment
Efinaconazole topical solution 10% was significantly more effective than vehicle in both male and female participants with mild to moderate onychomycosis. It appears to be especially effective in female participants, with more than 27% of female participants achieving complete cure at week 52, and nearly 37% of female participants achieving complete or almost complete cure at week 52.
Mycologic cure is the only consistently defined efficacy parameter reported in toenail onychomycosis studies.18 It often is considered the main treatment goal, with complete cure occurring somewhat later as the nails grow out.19 Indeed, in this subgroup analysis the differences seen between the active and vehicle groups correlated well with the cure rates seen at week 52. Interestingly, significantly better mycologic cure rates (P=.002, active vs vehicle) were seen as early as week 12 in the male subgroup.
The current analysis suggests that male onychomycosis patients may be more difficult to treat, a finding noted by other investigators, though the reason is not clear.20 It is known that the prevalence of onychomycosis is higher in males,2,5 but data comparing cure rates by gender is lacking. It has been suggested that men more frequently undergo nail trauma and tend to seek help for more advanced disease.20 Treatment compliance also may be an issue. In our study, mean nail involvement was similar among male and female participants treated with efinaconazole (36.7% and 35.6%, respectively). Treatment compliance was higher among females compared to males (93.0% vs 91.1%), with the lowest compliance rates seen in males in the vehicle group (where complete cure rates also were the lowest). The amount of study drug used was greater in males, possibly due to larger toenails, though toenail surface area was not measured. Although there is no evidence to suggest that male toenails grow quicker, as many factors can impact nail growth, they tend to be thicker. Patients with thick toenails may be less likely to achieve complete cure.20 It also is possible that male toenails take longer to grow out fully, and they may require a longer treatment course. The 52-week duration of these studies may not have allowed for full regrowth of the nails, despite mycologic cure. Indeed, continued improvement in cure rates in onychomycosis patients with longer treatment courses have been noted by other investigators.21
The current analysis revealed much lower baseline QOL scores in female onychomycosis patients compared to male patients. Given that target nail involvement at baseline was similar across both groups, this finding may be indicative of greater concern about their condition among females, supporting other views that onychomycosis has a greater impact on QOL in female patients. Similar scores reported across genders at week 52 likely reflects the greater efficacy seen in females.
Conclusion
Based on this subgroup analysis, once-daily application of efinaconazole topical solution 10% may provide a useful option in the treatment of mild to moderate onychomycosis, particularly in female patients. The greater improvement in nail condition concomitantly among females translates to higher overall treatment satisfaction.
Acknowledgment—The author thanks Brian Bulley, MSc, of Inergy Limited, Lindfield, West Sussex, United Kingdom, for medical writing support. Valeant Pharmaceuticals North America, LLC, funded Inergy’s activities pertaining to the manuscript.
1. Scher RK, Coppa LM. Advances in the diagnosis and treatment of onychomycosis. Hosp Med. 1998;34:11-20.
2. Gupta AK, Jain HC, Lynde CW, et al. Prevalence and epidemiology of onychomycosis in patients visiting physicians’ offices: a multicenter Canadian survey of 15,000 patients. J Am Acad Dermatol. 2000;43:244-248.
3. Finch JJ, Warshaw EM. Toenail onychomycosis: current and future treatment options. Dermatol Ther. 2007;20:31-46.
4. Kumar S, Kimball AB. New antifungal therapies for the treatment of onychomycosis. Expert Opin Investig Drugs. 2009;18:727-734.
5. Elewski BE, Charif MA. Prevalence of onychomycosis in patients attending a dermatology clinic in northeastern Ohio for other conditions. Arch Dermatol. 1997;133:1172-1173.
6. Araujo AJG, Bastos OMP, Souza MAJ, et al. Occurrence of onychomycosis among patients attended in dermatology offices in the city of Rio de Janeiro, Brazil. An Bras Dermatol. 2003;78:299-308.
7. Pierard G. Onychomycosis and other superficial fungal infections of the foot in the elderly: a Pan-European Survey. Dermatology. 2001;202:220-224.
8. Drake LA, Scher RK, Smith EB, et al. Effect of onychomycosis on quality of life. J Am Acad Dermatol. 1998;38(5, pt 1):702-704.
9. Kowalczuk-Zieleniec E, Nowicki E, Majkowicz M. Onychomycosis changes quality of life. J Eur Acad Dermatol Venereol. 2002;16(suppl 1):248.
10. Katsambas A, Abeck D, Haneke E, et al. The effects of foot disease on quality of life: results of the Achilles Project. J Eur Acad Dermatol Venereol. 2005;19:191-195.
11. Salgo PL, Daniel CR, Gupta AK, et al. Onychomycosis disease management. Medical Crossfire: Debates, Peer Exchange and Insights in Medicine. 2003;4:1-17.
12. Elewski BE. The effect of toenail onychomycosis on patient quality of life. Int J Dermatol. 1997;36:754-756.
13. Hay RJ. The future of onychomycosis therapy may involve a combination of approaches. Br J Dermatol. 2001;145:3-8.
14. Whittam LR, Hay RJ. The impact of onychomycosis on quality of life. Clin Exp Dermatol. 1997;22:87-89.
15. Stier DM, Gause D, Joseph WS, et al. Patient satisfaction with oral versus nonoral therapeutic approaches in onychomycosis. J Am Podiatr Med Assoc. 2001;91:521-527.
16. Elewski BE, Rich P, Pollak R, et al. Efinaconazole 10% solution in the treatment of toenail onychomycosis: two phase 3 multicenter, randomized, double-blind studies. J Am Acad Dermatol. 2013;68:600-608.
17. Tosti A, Elewski BE. Treatment of onychomycosis with efinaconazole 10% topical solution and quality of life. J Clin Aesthet Dermatol. 2014;7:25-30.
18. Werschler WP, Bondar G, Armstrong D. Assessing treatment outcomes in toenail onychomycosis clinical trials. Am J Clin Dermatol. 2004;5:145-152.
19. Gupta AK. Treatment of dermatophyte toenail onychomycosis in the United States: a pharmacoeconomic analysis. J Am Podiatr Med Assoc. 2002;92:272-286.
20. Sigurgeirsson B. Prognostic factors for cure following treatment of onychomycosis. J Eur Acad Dermatol Venereol. 2010;24:679-684.
21. Epstein E. How often does oral treatment of toenail onychomycosis produce a disease-free nail? an analysis of published data. Arch Dermatol. 1998;134:1551-1554.
Practice Points
- Men, particularly as they age, are more likely to develop onychomycosis.
- Treatment adherence may be a bigger issue among male patients.
- Onychomycosis in males may be more difficult to treat for a variety of reasons.

A Multipronged Approach to Decrease the Risk of Clostridium difficile Infection at a Community Hospital and Long-Term Care Facility
From Sharp HealthCare, San Diego, CA.
Abstract
- Objective: To examine the relationship between the rate of Clostridium difficile infections (CDI) and implementation of 3 interventions aimed at preserving the fecal microbiome: (1) reduction of antimicrobial pressure; (2) reduction in intensity of gastrointestinal prophylaxis with proton-pump inhibitors (PPIs); and (3) expansion of probiotic therapy.
- Methods: We conducted a retrospective analysis of all inpatients with CDI between January 2009 and December 2013 receiving care at our community hospital and associated long-term care (LTC) facility. We used interrupted time series analysis to assess CDI rates during the implementation phase (2008–2010) and the postimplementation phase (2011–2013).
- Results: A reduction in the rate of health care facility–associated CDIs was seen. The mean number of cases per 10,000 patient days fell from 11.9 to 3.6 in acute care and 6.1 to 1.1 in LTC. Recurrence rates decreased from 64% in 2009 to 16% by 2014. The likelihood of CDI recurring was 3 times higher in those exposed to PPI and 0.35 times less likely in those who received probiotics with their initial CDI therapy.
- Conclusion: The risk of CDI incidence and recurrence was significantly reduced in our inpatients, with recurrent CDI associated with PPI use, multiple antibiotic courses, and lack of probiotics. We attribute our success to the combined effect of intensified antibiotic stewardship, reduced PPI use, and expanded probiotic use.
Clostridium difficile is classified as an urgent public health threat by the Centers for Disease Control and Prevention [1]. A recent study by the CDC found that it caused more than 400,000 infections in the United States in 2011, leading to over 29,000 deaths [2]. The costs of treating CDI are substantial and recurrences are common. While rates for many health care–associated infections are declining, C. difficile infection (CDI) rates remain at historically high levels [1] with the elderly at greatest risk for infection and mortality from the illness [3].
CDIs can be prevented. A principal recommendation for preventing CDIs is improving antibiotic use. Antibiotic use increases the risk for developing CDI by disrupting the colonic microbiome. Hospitalized and long-term care (LTC) patients are frequently prescribed antibiotics, but studies indicate that much of this use is inappropriate [4]. Antimicrobial stewardship has been shown to be effective in reducing CDI rates. Other infection prevention measures commonly employed to decrease the risk of hospital-onset CDI include monitoring of hand hygiene compliance using soap and water, terminal cleaning with bleach products of rooms occupied by patients with CDI, and daily cleaning of highly touched areas. At our institution, patients identified with CDI are placed on contact precautions until they have been adequately treated and have had resolution of diarrhea for 48 hours.
In addition to preventing CDI transmission through antimicrobial stewardship, attention is being paid to the possibility that restricting PPI use may help in preventing CDI. The increasing utilization of proton-pump inhibitors (PPIs) in recent years has coincided with the trend of increasing CDI rates. Although C. difficile spores are acid-resistant, vegetative forms are easily affected by acidity. Several studies have shown the association of acid suppression and greater susceptibility of acquiring CDI or recurrences [5–7]. Elevated gastric pH by PPIs facilitates the growth of potentially pathogenic upper and lower gastrointestinal (GI) tract flora, including the conversion of C. difficile from spore to vegetative form in the upper GI tract [5,8].
A growing body of evidence indicates that probiotics are both safe and effective for preventing CDIs [9]. Probiotics may counteract disturbances in intestinal flora, thereby reducing the risk for colonization by pathogenic bacteria. Probiotics can inhibit pathogen adhesion, colonization, and invasion of the gastrointestinal mucosa [10].
We hypothesized that preservation and/or restoration of the diversity of the fecal microbiome would prevent CDI and disease recurrence in our facility. Prior to 2009, we had strict infection prevention measures in place to prevent disease transmission, similar to many other institutions. In 2009, we implemented 3 additional interventions to reduce the rising incidence of CDI: (1) an antibiotic stewardship program, (2) lowering the intensity of acid suppression, and (3) expanding the use of probiotic therapy. The 3 interventions were initiated over the 19-month period January 2009 through July 2010. This study addresses the effects of these interventions.
Methods
Patients and Data Collection
The study was conducted at a community hospital (59 beds) that has an associated LTC facility (122 beds). We conducted a retrospective analysis of hospital and LTC data from all documented cases of CDI between January 2009 and December 2013. Study subjects included all patients with stools positive for C. difficile antigen and toxin with associated symptoms of infection (n = 123). Institutional review board approval was obtained prior to data collection.
The following information was collected: admission diagnosis, number of days from admission until confirmed CDI, residence prior to admission, duration and type of antibiotics received prior to or during symptoms of CDI, type of GI prophylaxis received within 14 days prior to and during CDI treatment, probiotic received and duration, and the type and duration of antibiotic treatment given for the CDI. The data collected was used to determine the likely origin of each C. difficile case, dates of recurrences, and the possible effects of the interventions. Antibiotic use was categorized as: (1) recent antibiotic course (antibiotics received within the preceding 4 weeks), (2) antibiotic courses greater than 10 days, and (3) multiple antibiotic courses (more than 1 antibiotic course received sequentially or concurrently).
Positive C. difficile infections were detected using a 2-step algorithm, starting in 2009. The samples were first screened with a rapid membrane enzyme immunoassay for glutamate dehydrogenase (GDH) antigen and toxin A and B in stool (C. Diff Quik Chek Complete, Techlab, Blacksburg, VA). Discrepant samples (GDH positive and toxin A and B negative) were reflexed to DNA-based PCR testing. The PCR assay was changed to the Verigene C. difficile test (Nanosphere, Northbrook, IL) in 2012. Up to 30 days after discharge from our facility, positive results were considered as acquired from our facility and positive results within 2 days of admission with symptoms of CDI were considered positive on admission and were not attributed to our facility. A primary episode of CDI was defined to be the first identified episode or event in each patient. Recurrent CDI was defined as a repeated case of CDI within 180 days of the original CDI event.
Interventions to Reduce CDI
Reduction of Antibiotic Pressure
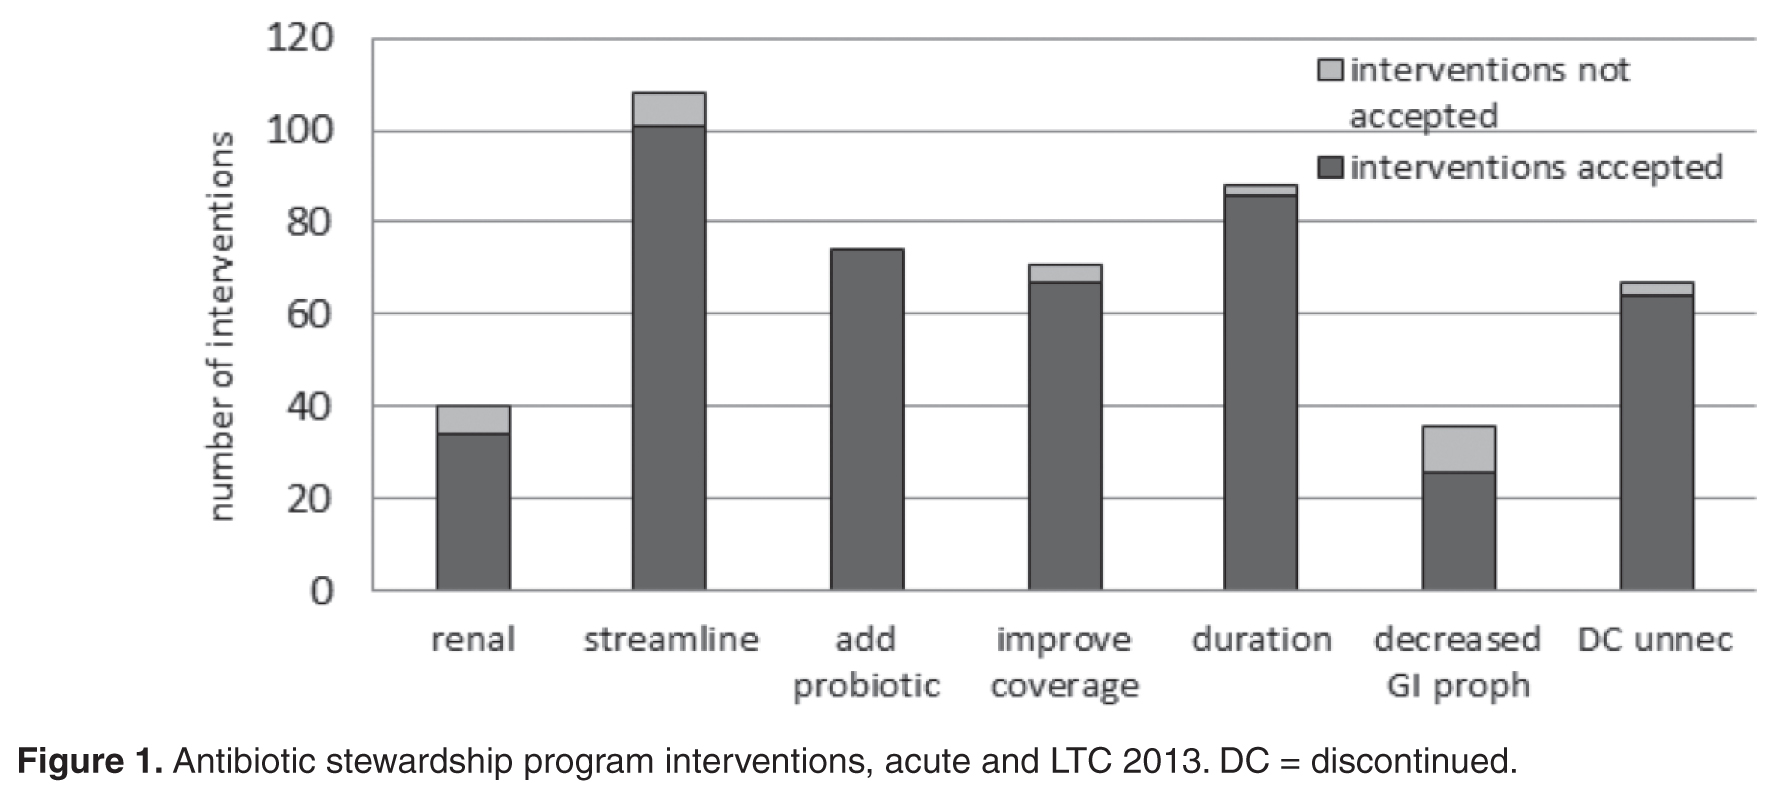
Other actions taken to improve antimicrobial prescribing as part of the stewardship program included medication usage evaluations (MUEs) for levofloxacin and carbapenems, implementing an automatic dosing/duration protocol for levofloxacin, and carbapenem restriction to prevent inappropriate use. Nursing and pharmacy staffs were educated on vancomycin appropriateness, benefits of MRSA screening for de-escalation, procalcitonin, and treatment of sepsis. Emergency department staff was educated on (1) empiric antimicrobial treatment recommendations for urinary and skin and soft tissue infections based on outpatient antibiogram data, (2) renal adjustment of antimicrobials, (3) fluoroquinolones: resistance formation, higher CDI risk and higher dosing recommendations, (4) GI prophylaxis recommendations, and (5) probiotics.
Reduction in the Intensity of Acid Suppression for GI Prophylaxis
PPIs were substituted with histamine-2 receptor antagonists (H2RA) whenever acid suppression for GI prophylaxis was warranted. If GI symptoms persisted, sucralfate was added. In May 2010, all eligible LTC patients were converted from PPIs to H2RA.
Expanding the Use of Probiotics
We expanded the use of probiotics as an adjunctive treatment for CDI with metronidazole ± vancomycin oral therapies. Probiotics were included concurrently with any broad-spectrum antibiotic administration, longer antibiotic courses (≥ 7 days), and/or multiple courses of antibiotics. The combination of Saccromyces boulardii plus Lactobacillus acidophilus and L. bulgaricus was given with twice daily dosing until the end of 2011. In January 2012, our facility switched over to daily administration of a probiotic with the active ingredients of Lactobacillus acidophilus and Lactobacillus casei, 50 billion colony-forming units. Probiotics were given during the antibiotic course plus for 1 additional week after course completion. Probiotics were not administered to selected groups of patients: (1) immunocompromised patients, (2) patients who were NPO, or (3) patients excluded by their physicians.
There was no change or enhanced targeting of infection prevention or environmental hygiene strategies during the study period.
Data Analysis and Statistical Methods
All data were collected on data collection sheets and transcribed into Microsoft Office Excel 2007 Service Pack 3. No data were excluded from analysis. Continuous variables, eg, number of cases of CDI, are reported as mean ± standard deviation. Categorical variables, eg, number of recurrent CDI cases, are reported as the count and percentage. Comparison of populations was done with the Wilcoxon rank sum test. Segments of the interrupted time series were assessed using linear regression. Associations were tested using χ2. Statistical tests were deemed significant when the α probability was < 0.05. No adjustments were made for multiplicity. Data descriptive statistics (including frequency histograms for visual examination of distributions) and statistical analyses were performed using Stata 11.1 (StataCorp, College Station, TX).
Results
CDIs
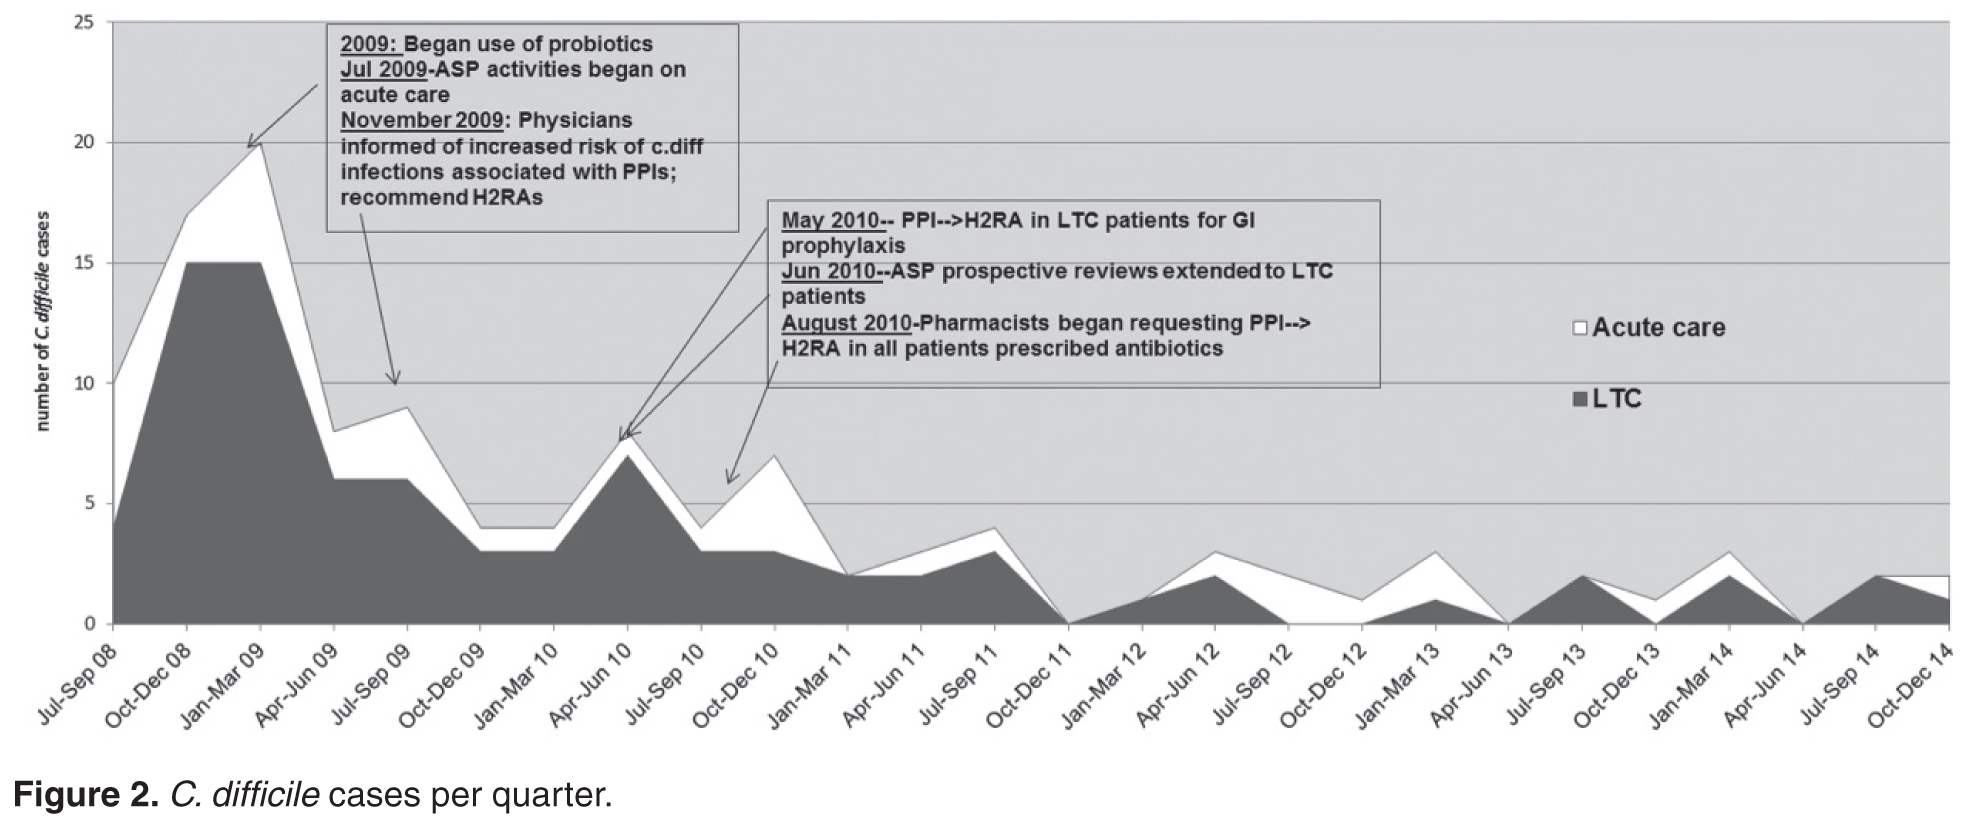

Within the population of patients having a CDI or recurrence, we found that those patients in the later time period (2011–2013) were significantly less likely to have a recurrence than those in the earlier time period (pre- Jan 2011) (chi square = 5.975, df = 1, P = 0.015). The odds ratio (OR) was 0.35 (95% CI 0.15 to 0.83).
Patients in the earlier (2009–2010) vs. the later post-intervention group (2011–2013) had more likely received multiple antibiotic courses (chi square = 5.32, df = 1, P = 0.021, OR 2.56), a PPI (chi square = 8.86, df = 1, P = 0.003, OR 3.38), and had a health care facility–associated infection originating from our institution as opposed to outside facility transfers or community-acquired cases (chi square = 7.09, df = 1, P = 0.008, OR 2.94).
Antibiotic Pressure

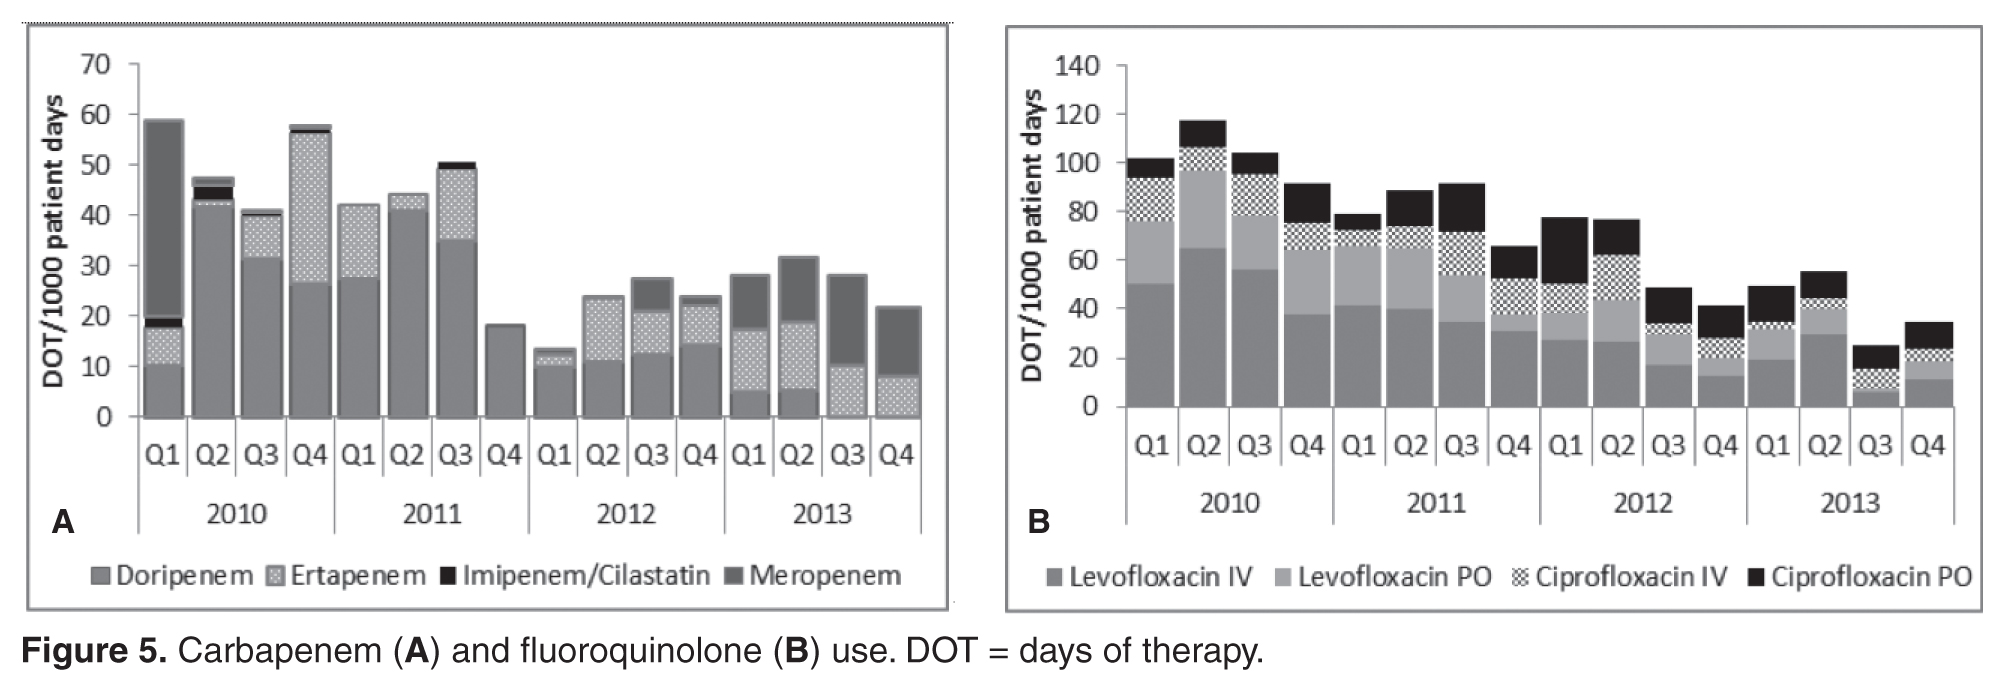
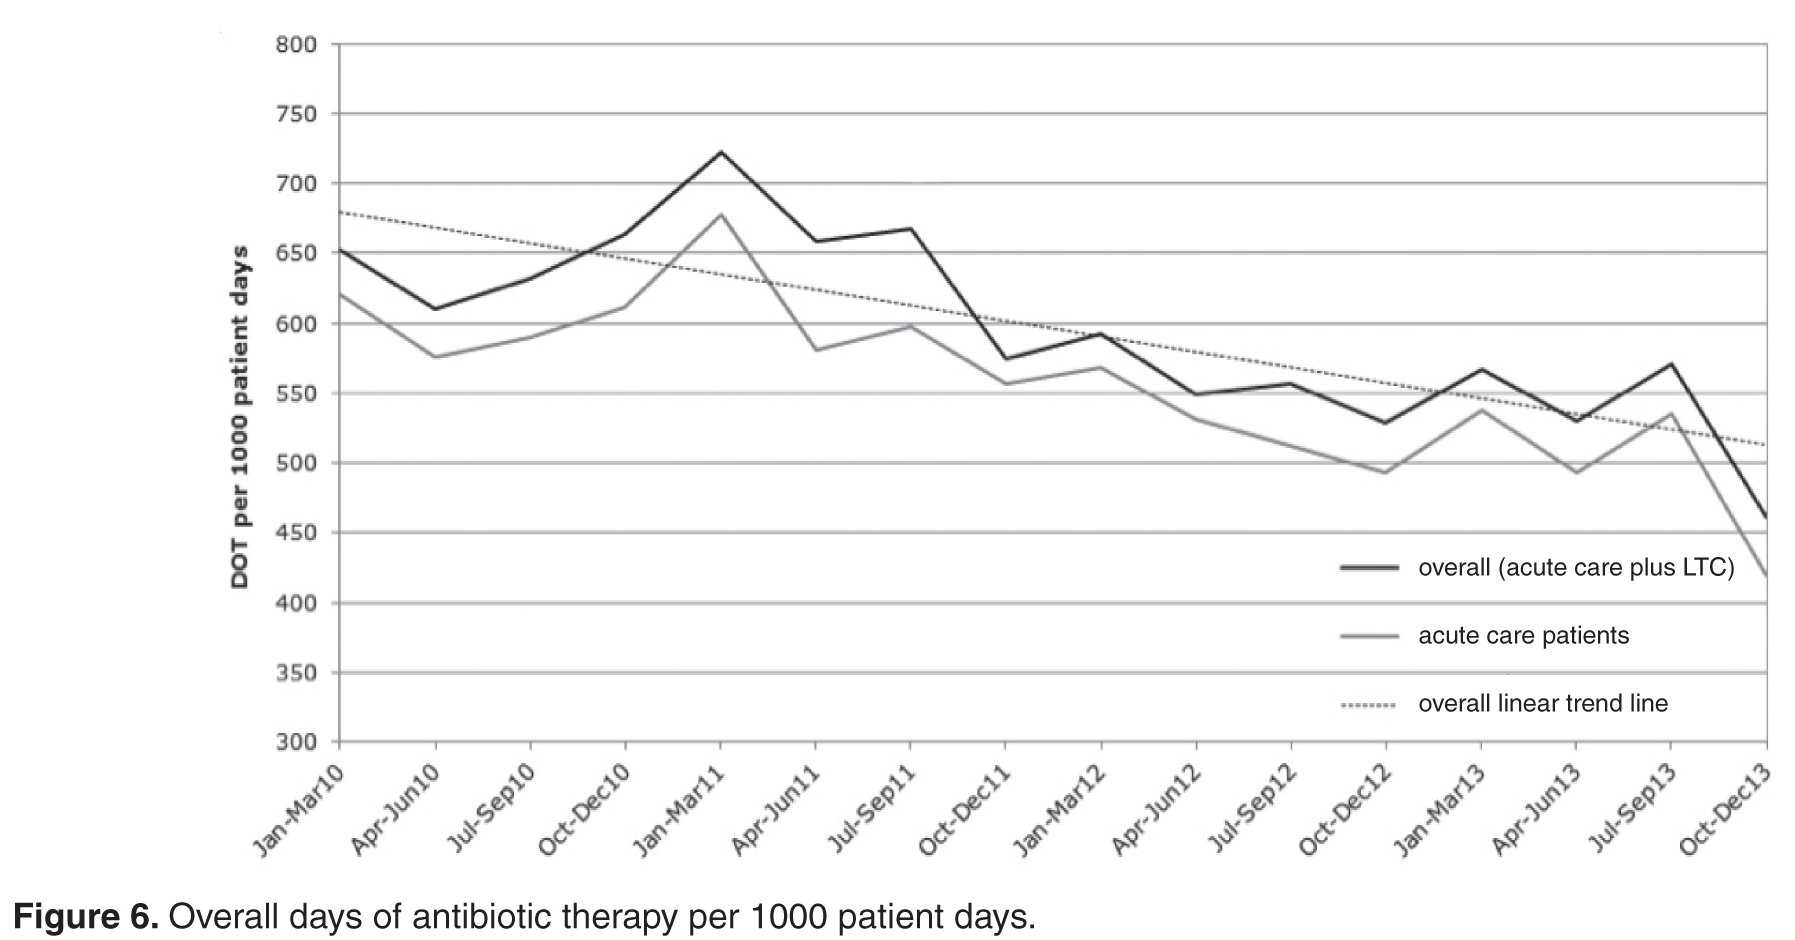
Acid Suppression
In evaluating the effects of limiting the use of PPIs, patients who received an H2RA or no antacid prophylaxis were significantly less likely to have a recurrence of CDI than those who received a PPI (chi square = 6.35, df = 1, P = 0.012). The OR for recurrence with PPIs was 3.05 (95% CI 1.25 to 7.44). Of patients exposed to PPIs, those exposed in the later time period (2011 through 2013) were significantly less likely to have a recurrence than those exposed in the early time period (third quarter 2008 through 2010; chi square = 15.14, df = 1, P < 0.001). The OR was 0.23 (95% CI, 0.11 to 0.49).
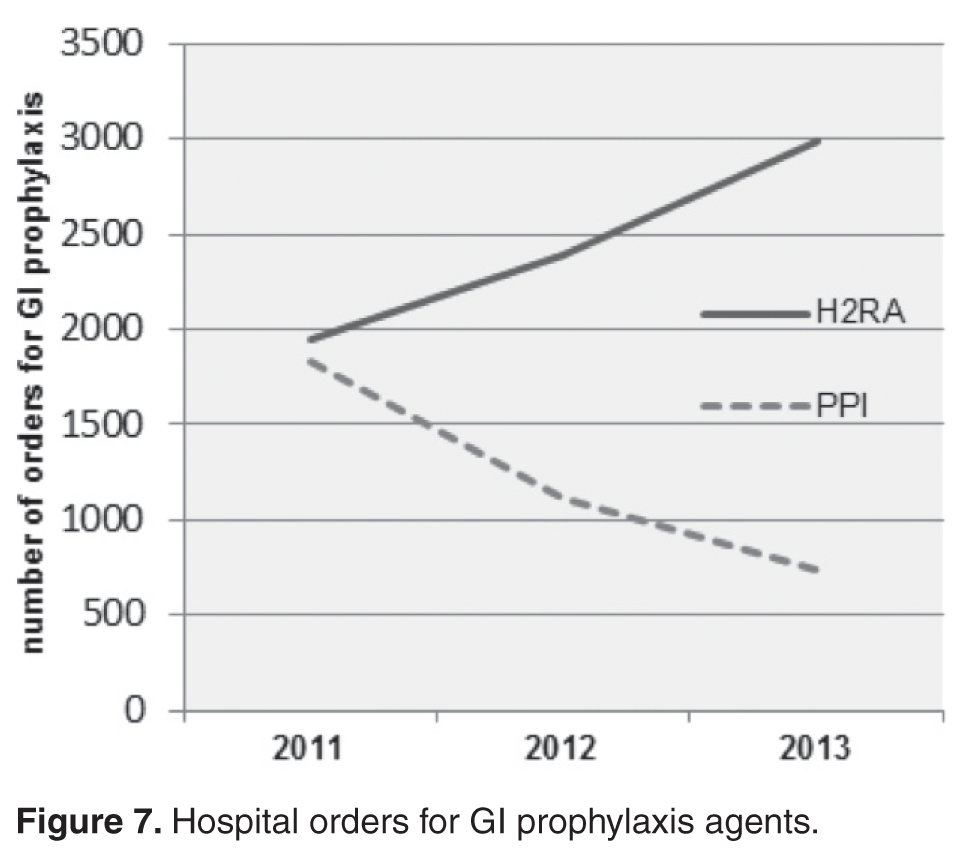
Probiotics
During 2009–2011, only 15% of the CDI patients had received probiotics with an antibiotic course. Probiotic therapy as part of CDI treatment increased from 60% in 2009 to 91% in 2011. Among patients that contracted CDI in 2012–2013, only 2 patients received probiotics with their antibiotic courses.
Recurrences

With regard to the effect of probiotics within this population, those who received 
One patient with significant initial antibiotic pressure was continued on her PPI during CDI treatment and continued to have recurrences, despite probiotic use. After her fourth recurrence, her PPI was changed to an H2RA, and she had no further recurrences. She continues off PPI therapy and is CDI-free 2 years later. Another patient who remained on his PPI had 3 recurrences, until finally a probiotic was added and the recurrences abated.
Discussion
CDI is common in hospitalized patients, and its incidence has increased due to multiple factors, which include the widespread use of broad-spectrum antimicrobials and increased use of PPIs. Our observational study showed a statistically significant reduction in the number of health care–associated CDI cases during our implementation period (mid–2008 through 2010). From 2011 on, all initiatives were maintained. As the lower rates of CDI continued, physician confidence in antimicrobial stewardship recommendations increased. During this latter portion of the study period, hospitalists uniformly switched patients to H2RA for GI prophylaxis, added prophylactic probiotics to antibiotic courses as well as CDI therapy, and were more receptive to streamlining and limiting durations of antibiotic therapy. Although the study was completed in 2013, follow-up data have shown that the low CDI incidence has continued through 2014.
The average age of the patients in our study was 69 years. In 2009, there were 41 C. difficile cases originating from our institution; however, by the end of 2011, only 9 cases had been reported, a 75% reduction. The majority of our cases of C. difficile in 2009–2010 originated from our facility’s LTC units (Figure 2). Risk factors in the LTC population included older age (72% are > 65 years) with multiple comorbidities, exposure to frequent multiple courses of broad-spectrum antibiotics, and use of PPIs as the standard for GI prophylaxis therapy. Multiple antibiotic courses had a strong association with PPI administration in the patients who contracted CDI, while recent antibiotics and antibiotics greater than 10 days did not. Implications may include an increased risk of CDI in patients requiring multiple antibiotic courses concurrent with PPI exposure.
Infection prevention strategies were promulgated among the health care team during the study period but were not specifically targeted for quality improvement efforts. Therefore, in contrast to other studies where infection prevention measures and environmental hygiene were prominent components of a CDI prevention “bundle,” our focus was on antimicrobial stewardship and PPI and probiotic use, not enhancement of standard infection prevention and environmental hygiene measures.
The antibiotics used prior to the development of CDI in our study were similar to findings from other studies that have associated broad-spectrum antibiotics with increased susceptibility to CDI [11]. Antimicrobials disrupt the normal GI flora, which is essential for eradicating many C. difficile spores [12]. The utilization of high-risk antibiotics and prolonged antimicrobial therapy were reduced with implementation of our antimicrobial stewardship program. In 2012, the antimicrobial stewardship program developed a LTC fever protocol, providing education to LTC nurses, physicians, and pharmacists using the modified McGeer criteria [13] for infection in LTC units and empiric antibiotic recommendations from our epidemiologist. A formal recommendation for a LTC 7-day stop date for urinary, respiratory, and skin and soft tissue infections was initiated, which included are-assessment at day 6–7 for resolution of symptoms.
With regard to PPI therapy, our study revealed that patients who had received a PPI at some point were 3.05 times more likely to have a recurrence of CDI than those who had not. These findings are consistent with the literature. Linsky et al [5] found a 42% increased risk of CDI recurrence in patients receiving PPIs concurrent with CDI treatment while considering covariates that may influence the risk of recurrent CDI or exposure to PPIs. A meta-analysis of 16 observational studies involving more than 1.2 million hospitalized patients by Janarthanan et al [14] explored the association between CDI and PPIs and showed a 65% increase in the incidence of CDI among PPI users. Those receiving PPI for GI prophylaxis in the earlier time period (before 2011) were 77% more likely to have a recurrence than those who received PPI in the later period. This finding might be associated with the more appropriate antimicrobial use and the more consistent use of consistent prophylactic probiotics in the later study period.
Our results showed that those who received probiotics with the initial CDI treatment were significantly less likely to have a recurrence than those who did not. Patients receiving probiotics in the later period (2011–2013) were 74% less likely to have a recurrence than patients in the earlier group (2009–2010). Despite the standard use of probiotics for primary CDI prevention at our institution, we could not show direct significance to the lack of probiotic use found in the identified CDI patients with this observational study design. The higher benefit in more recent years could possibly be attributed to the fact that these patients were much less likely to have received a PPI, that most had likely received probiotics concurrently plus 1 week after their antibiotic courses, and their antibiotic therapy was likely more focused and streamlined to prevent C. difficile infection. A meta-analysis of probiotic efficacy in primary CDI prevention suggested that probiotics can lead to a 64% reduction in the incidence of CDI, in addition to reducing GI-associated symptoms related to infection or antibiotic use [9]. A dose-response study of the efficacy of a probiotic formula showed a lower incidence of CDI, 1.2% for higher dose vs. 9.4% for lower dose vs. 23.8% for placebo [15]. Maziade et al [16] added prophylactic probiotics to a bundle of standard preventative measures for C. difficile infections, and were able to show an enhanced and sustained decrease in CDI rates (73%) and recurrences (39%). However, many of the probiotic studies which have studied the relationship to CDI have been criticized for reporting abnormally high rates of infection [9,16] missing data, a lack of controls or excessive patient exclusion criteria [17,18] The more recent PLACIDE study by Allen et al [19] was a large multicenter randomized controlled trial that did not show any benefit to CDI prevention with probiotics; however, with 83% of screened patients excluded, the patients were low risk, with the resulting CDI incidence (0.99%) too low to show a benefit. Acid suppression was also not revealed in the specific CDI cases, and others have found this to be a significant risk factor [5–7].
Limitations of this study include the study design (an observational, retrospective analysis), the small size of our facility, and the difficulty in obtaining probiotic history prior to admission in some cases. Due to a change in computer systems, hospital orders for GI prophylaxis agents could not be obtained for 2009–2010. Due to the fact that we instituted our interventions somewhat concurrently, it is difficult to analyze their individual impact. Randomized controlled trials evaluating the combined role of probiotics, GI prophylaxis, and antibiotic pressure in CDI are needed to further define the importance of this approach.
Corresponding author: Bridget Olson, RPh, Sharp Coronado Hospital & Villa Coronado Long-Term Care Facility, 250
Prospect Pl., Coronado CA 92118, bridget.olson@sharp.com.
Financial disclosures: None.
Author contributions: conception and design, BO, TH, KW, RO; analysis and interpretation of data, RAF; drafting of article, BO, RAF; critical revision of the article, RAF, JH, TH; provision of study materials or patients, BO; statistical expertise, RAF; administrative or technical support, KW, RO; collection and assembly of data, BO.
1. Centers for Disease Control and Prevention. Antibiotic resistance threats in the United States, 2013. http://www.cdc.gov/drugresistance/threat-report-2013/index.html.
2. Lessa FC, Mu Y, Bamberg WM, Beldavs ZG, et al. Burden of Clostridium difficile infection in the United States. N Engl J Med 2015;372:825–34.
3. Pepin J, Valiquette L, Cossette B. Mortality attributable to nosocomial Clostridium difficile-associated disease during an epidemic caused by a hypervirulent strain in Quebec. CMAJ 2005;173:1037–42.
4. Warren JW, Palumbo FB, Fitterman L, Speedie SM. Incidence and characteristics of antibiotic use in aged nursing home patients. J Am Geriatr Soc 1991;39:963–72.
5. Linsky A, Gupta K, Lawler E, et al. Proton pump inhibitors and risk for recurrent Clostridium difficile infection. Arch Intern Med 2010;170:772–8.
6. Dial S, Delaney JA, Barkun AN, Sulssa S. Use of gastric acid-suppressive agents and the risk of community-acquired Clostridium difficile-associated disease. JAMA 2005;294:2989–95.
7. Howell M, Novack V, Grgurich P, et.al. Iatrogenic gastric acid suppression and the risk if nosocomial Clostridium difficile infection. Arch Intern Med 2010;170:784–90.
8. Radulovic Z, Petrovic T, Bulajic S. Antibiotic susceptibility of probiotic bacteria. In Pana M, editor. Antibiotic resistant bacteria: a continuous challenge in the new millennium. Rijeka, Croatia: InTech; 2012.
9. Goldenberg JZ, Ma SS, Saxton JD, et al. Probiotics for the prevention of Clostridium difficile-associated diarrhea in adults and children. Cochrane Database Syst Rev 2013;5:CD006095.
10. Johnston BC, Ma SY, Goldenberg JZ, et al. Probiotics for the prevention of Clostridium difficile-associated diarrhea. Ann Intern Med 2012;157:878–88.
11. Blondeau JM. What have we learned about antimicrobial use and the risks for Clostridium difficile-associated diarrhoea? J Antimicrob Chemother 2009;63:203–37.
12. Elliott B, Chang BJ, Golledge CL et al. Clostridium difficile-associated diarrhoea. Intern Med J 2007;37:561–8.
13. Stone, ND, Ashraf, MS et al. Surveillance definitions of infections in long-term care facilities: revisiting the McGeer criteria. Infect Control Hosp Epidemiol 2012;33:965–77.
14. Janarthanan S, Ditah I, Adler DG, Ehrinpreis MN. Clostridium difficile-associated diarrhea and proton pump inhibitor therapy: a meta-analysis. Am J Gastroenterol 2012;107:1001–10.
15. Gao XW, Mubasher M, Fang CY, et al. Dose-response efficacy of a proprietary probiotic formula of Lactobacillus acidophilus CL1285 and Lactobacillus casei LBC80R for antibiotic-associated diarrhea and Clostridium difficile-associated diarrhea prophylaxis in adult patients. Am J Gastroenterol 2010;105:1636-41.
16. Maziade PJ, Andriessen JA, Pereira P, et.al. Impact of adding prophylactic probiotics to a bundle of standard preventative measures for Clostridium difficile infections: enhanced and sustained decrease in the incidence and severity of infection at a community hospital. Curr Med Res Opin 2013;29:1341–7.
17. Islam, J, Cohen J, Rajkumar C, Llewelyn M. Probiotics for the prevention and treatment of Clostridium difficile in older patients. Age Ageing 2012;41:706–11.
18. Hickson M, D’Souza AL, Muthu N, et al. Use of probiotic Lactobacillus preparation to prevent diarrhoea associated with antibiotics: randomised double blind placebo controlled trial. BMJ 2007;335:80.
19. Allen S J, Wareham K, Wang, D, et.al. Lactobacilli and bifidobacteria in the prevention of antibiotic-associated diarrhoea and Clostridium difficile diarrhoea in older inpatients (PLACIDE): a randomized, double-blind, placebo-controlled, multi-centre trial. Lancet 2013;382:1249–57.
From Sharp HealthCare, San Diego, CA.
Abstract
- Objective: To examine the relationship between the rate of Clostridium difficile infections (CDI) and implementation of 3 interventions aimed at preserving the fecal microbiome: (1) reduction of antimicrobial pressure; (2) reduction in intensity of gastrointestinal prophylaxis with proton-pump inhibitors (PPIs); and (3) expansion of probiotic therapy.
- Methods: We conducted a retrospective analysis of all inpatients with CDI between January 2009 and December 2013 receiving care at our community hospital and associated long-term care (LTC) facility. We used interrupted time series analysis to assess CDI rates during the implementation phase (2008–2010) and the postimplementation phase (2011–2013).
- Results: A reduction in the rate of health care facility–associated CDIs was seen. The mean number of cases per 10,000 patient days fell from 11.9 to 3.6 in acute care and 6.1 to 1.1 in LTC. Recurrence rates decreased from 64% in 2009 to 16% by 2014. The likelihood of CDI recurring was 3 times higher in those exposed to PPI and 0.35 times less likely in those who received probiotics with their initial CDI therapy.
- Conclusion: The risk of CDI incidence and recurrence was significantly reduced in our inpatients, with recurrent CDI associated with PPI use, multiple antibiotic courses, and lack of probiotics. We attribute our success to the combined effect of intensified antibiotic stewardship, reduced PPI use, and expanded probiotic use.
Clostridium difficile is classified as an urgent public health threat by the Centers for Disease Control and Prevention [1]. A recent study by the CDC found that it caused more than 400,000 infections in the United States in 2011, leading to over 29,000 deaths [2]. The costs of treating CDI are substantial and recurrences are common. While rates for many health care–associated infections are declining, C. difficile infection (CDI) rates remain at historically high levels [1] with the elderly at greatest risk for infection and mortality from the illness [3].
CDIs can be prevented. A principal recommendation for preventing CDIs is improving antibiotic use. Antibiotic use increases the risk for developing CDI by disrupting the colonic microbiome. Hospitalized and long-term care (LTC) patients are frequently prescribed antibiotics, but studies indicate that much of this use is inappropriate [4]. Antimicrobial stewardship has been shown to be effective in reducing CDI rates. Other infection prevention measures commonly employed to decrease the risk of hospital-onset CDI include monitoring of hand hygiene compliance using soap and water, terminal cleaning with bleach products of rooms occupied by patients with CDI, and daily cleaning of highly touched areas. At our institution, patients identified with CDI are placed on contact precautions until they have been adequately treated and have had resolution of diarrhea for 48 hours.
In addition to preventing CDI transmission through antimicrobial stewardship, attention is being paid to the possibility that restricting PPI use may help in preventing CDI. The increasing utilization of proton-pump inhibitors (PPIs) in recent years has coincided with the trend of increasing CDI rates. Although C. difficile spores are acid-resistant, vegetative forms are easily affected by acidity. Several studies have shown the association of acid suppression and greater susceptibility of acquiring CDI or recurrences [5–7]. Elevated gastric pH by PPIs facilitates the growth of potentially pathogenic upper and lower gastrointestinal (GI) tract flora, including the conversion of C. difficile from spore to vegetative form in the upper GI tract [5,8].
A growing body of evidence indicates that probiotics are both safe and effective for preventing CDIs [9]. Probiotics may counteract disturbances in intestinal flora, thereby reducing the risk for colonization by pathogenic bacteria. Probiotics can inhibit pathogen adhesion, colonization, and invasion of the gastrointestinal mucosa [10].
We hypothesized that preservation and/or restoration of the diversity of the fecal microbiome would prevent CDI and disease recurrence in our facility. Prior to 2009, we had strict infection prevention measures in place to prevent disease transmission, similar to many other institutions. In 2009, we implemented 3 additional interventions to reduce the rising incidence of CDI: (1) an antibiotic stewardship program, (2) lowering the intensity of acid suppression, and (3) expanding the use of probiotic therapy. The 3 interventions were initiated over the 19-month period January 2009 through July 2010. This study addresses the effects of these interventions.
Methods
Patients and Data Collection
The study was conducted at a community hospital (59 beds) that has an associated LTC facility (122 beds). We conducted a retrospective analysis of hospital and LTC data from all documented cases of CDI between January 2009 and December 2013. Study subjects included all patients with stools positive for C. difficile antigen and toxin with associated symptoms of infection (n = 123). Institutional review board approval was obtained prior to data collection.
The following information was collected: admission diagnosis, number of days from admission until confirmed CDI, residence prior to admission, duration and type of antibiotics received prior to or during symptoms of CDI, type of GI prophylaxis received within 14 days prior to and during CDI treatment, probiotic received and duration, and the type and duration of antibiotic treatment given for the CDI. The data collected was used to determine the likely origin of each C. difficile case, dates of recurrences, and the possible effects of the interventions. Antibiotic use was categorized as: (1) recent antibiotic course (antibiotics received within the preceding 4 weeks), (2) antibiotic courses greater than 10 days, and (3) multiple antibiotic courses (more than 1 antibiotic course received sequentially or concurrently).
Positive C. difficile infections were detected using a 2-step algorithm, starting in 2009. The samples were first screened with a rapid membrane enzyme immunoassay for glutamate dehydrogenase (GDH) antigen and toxin A and B in stool (C. Diff Quik Chek Complete, Techlab, Blacksburg, VA). Discrepant samples (GDH positive and toxin A and B negative) were reflexed to DNA-based PCR testing. The PCR assay was changed to the Verigene C. difficile test (Nanosphere, Northbrook, IL) in 2012. Up to 30 days after discharge from our facility, positive results were considered as acquired from our facility and positive results within 2 days of admission with symptoms of CDI were considered positive on admission and were not attributed to our facility. A primary episode of CDI was defined to be the first identified episode or event in each patient. Recurrent CDI was defined as a repeated case of CDI within 180 days of the original CDI event.
Interventions to Reduce CDI
Reduction of Antibiotic Pressure
Other actions taken to improve antimicrobial prescribing as part of the stewardship program included medication usage evaluations (MUEs) for levofloxacin and carbapenems, implementing an automatic dosing/duration protocol for levofloxacin, and carbapenem restriction to prevent inappropriate use. Nursing and pharmacy staffs were educated on vancomycin appropriateness, benefits of MRSA screening for de-escalation, procalcitonin, and treatment of sepsis. Emergency department staff was educated on (1) empiric antimicrobial treatment recommendations for urinary and skin and soft tissue infections based on outpatient antibiogram data, (2) renal adjustment of antimicrobials, (3) fluoroquinolones: resistance formation, higher CDI risk and higher dosing recommendations, (4) GI prophylaxis recommendations, and (5) probiotics.
Reduction in the Intensity of Acid Suppression for GI Prophylaxis
PPIs were substituted with histamine-2 receptor antagonists (H2RA) whenever acid suppression for GI prophylaxis was warranted. If GI symptoms persisted, sucralfate was added. In May 2010, all eligible LTC patients were converted from PPIs to H2RA.
Expanding the Use of Probiotics
We expanded the use of probiotics as an adjunctive treatment for CDI with metronidazole ± vancomycin oral therapies. Probiotics were included concurrently with any broad-spectrum antibiotic administration, longer antibiotic courses (≥ 7 days), and/or multiple courses of antibiotics. The combination of Saccromyces boulardii plus Lactobacillus acidophilus and L. bulgaricus was given with twice daily dosing until the end of 2011. In January 2012, our facility switched over to daily administration of a probiotic with the active ingredients of Lactobacillus acidophilus and Lactobacillus casei, 50 billion colony-forming units. Probiotics were given during the antibiotic course plus for 1 additional week after course completion. Probiotics were not administered to selected groups of patients: (1) immunocompromised patients, (2) patients who were NPO, or (3) patients excluded by their physicians.
There was no change or enhanced targeting of infection prevention or environmental hygiene strategies during the study period.
Data Analysis and Statistical Methods
All data were collected on data collection sheets and transcribed into Microsoft Office Excel 2007 Service Pack 3. No data were excluded from analysis. Continuous variables, eg, number of cases of CDI, are reported as mean ± standard deviation. Categorical variables, eg, number of recurrent CDI cases, are reported as the count and percentage. Comparison of populations was done with the Wilcoxon rank sum test. Segments of the interrupted time series were assessed using linear regression. Associations were tested using χ2. Statistical tests were deemed significant when the α probability was < 0.05. No adjustments were made for multiplicity. Data descriptive statistics (including frequency histograms for visual examination of distributions) and statistical analyses were performed using Stata 11.1 (StataCorp, College Station, TX).
Results
CDIs
Within the population of patients having a CDI or recurrence, we found that those patients in the later time period (2011–2013) were significantly less likely to have a recurrence than those in the earlier time period (pre- Jan 2011) (chi square = 5.975, df = 1, P = 0.015). The odds ratio (OR) was 0.35 (95% CI 0.15 to 0.83).
Patients in the earlier (2009–2010) vs. the later post-intervention group (2011–2013) had more likely received multiple antibiotic courses (chi square = 5.32, df = 1, P = 0.021, OR 2.56), a PPI (chi square = 8.86, df = 1, P = 0.003, OR 3.38), and had a health care facility–associated infection originating from our institution as opposed to outside facility transfers or community-acquired cases (chi square = 7.09, df = 1, P = 0.008, OR 2.94).
Antibiotic Pressure
Acid Suppression
In evaluating the effects of limiting the use of PPIs, patients who received an H2RA or no antacid prophylaxis were significantly less likely to have a recurrence of CDI than those who received a PPI (chi square = 6.35, df = 1, P = 0.012). The OR for recurrence with PPIs was 3.05 (95% CI 1.25 to 7.44). Of patients exposed to PPIs, those exposed in the later time period (2011 through 2013) were significantly less likely to have a recurrence than those exposed in the early time period (third quarter 2008 through 2010; chi square = 15.14, df = 1, P < 0.001). The OR was 0.23 (95% CI, 0.11 to 0.49).
Probiotics
During 2009–2011, only 15% of the CDI patients had received probiotics with an antibiotic course. Probiotic therapy as part of CDI treatment increased from 60% in 2009 to 91% in 2011. Among patients that contracted CDI in 2012–2013, only 2 patients received probiotics with their antibiotic courses.
Recurrences
With regard to the effect of probiotics within this population, those who received
One patient with significant initial antibiotic pressure was continued on her PPI during CDI treatment and continued to have recurrences, despite probiotic use. After her fourth recurrence, her PPI was changed to an H2RA, and she had no further recurrences. She continues off PPI therapy and is CDI-free 2 years later. Another patient who remained on his PPI had 3 recurrences, until finally a probiotic was added and the recurrences abated.
Discussion
CDI is common in hospitalized patients, and its incidence has increased due to multiple factors, which include the widespread use of broad-spectrum antimicrobials and increased use of PPIs. Our observational study showed a statistically significant reduction in the number of health care–associated CDI cases during our implementation period (mid–2008 through 2010). From 2011 on, all initiatives were maintained. As the lower rates of CDI continued, physician confidence in antimicrobial stewardship recommendations increased. During this latter portion of the study period, hospitalists uniformly switched patients to H2RA for GI prophylaxis, added prophylactic probiotics to antibiotic courses as well as CDI therapy, and were more receptive to streamlining and limiting durations of antibiotic therapy. Although the study was completed in 2013, follow-up data have shown that the low CDI incidence has continued through 2014.
The average age of the patients in our study was 69 years. In 2009, there were 41 C. difficile cases originating from our institution; however, by the end of 2011, only 9 cases had been reported, a 75% reduction. The majority of our cases of C. difficile in 2009–2010 originated from our facility’s LTC units (Figure 2). Risk factors in the LTC population included older age (72% are > 65 years) with multiple comorbidities, exposure to frequent multiple courses of broad-spectrum antibiotics, and use of PPIs as the standard for GI prophylaxis therapy. Multiple antibiotic courses had a strong association with PPI administration in the patients who contracted CDI, while recent antibiotics and antibiotics greater than 10 days did not. Implications may include an increased risk of CDI in patients requiring multiple antibiotic courses concurrent with PPI exposure.
Infection prevention strategies were promulgated among the health care team during the study period but were not specifically targeted for quality improvement efforts. Therefore, in contrast to other studies where infection prevention measures and environmental hygiene were prominent components of a CDI prevention “bundle,” our focus was on antimicrobial stewardship and PPI and probiotic use, not enhancement of standard infection prevention and environmental hygiene measures.
The antibiotics used prior to the development of CDI in our study were similar to findings from other studies that have associated broad-spectrum antibiotics with increased susceptibility to CDI [11]. Antimicrobials disrupt the normal GI flora, which is essential for eradicating many C. difficile spores [12]. The utilization of high-risk antibiotics and prolonged antimicrobial therapy were reduced with implementation of our antimicrobial stewardship program. In 2012, the antimicrobial stewardship program developed a LTC fever protocol, providing education to LTC nurses, physicians, and pharmacists using the modified McGeer criteria [13] for infection in LTC units and empiric antibiotic recommendations from our epidemiologist. A formal recommendation for a LTC 7-day stop date for urinary, respiratory, and skin and soft tissue infections was initiated, which included are-assessment at day 6–7 for resolution of symptoms.
With regard to PPI therapy, our study revealed that patients who had received a PPI at some point were 3.05 times more likely to have a recurrence of CDI than those who had not. These findings are consistent with the literature. Linsky et al [5] found a 42% increased risk of CDI recurrence in patients receiving PPIs concurrent with CDI treatment while considering covariates that may influence the risk of recurrent CDI or exposure to PPIs. A meta-analysis of 16 observational studies involving more than 1.2 million hospitalized patients by Janarthanan et al [14] explored the association between CDI and PPIs and showed a 65% increase in the incidence of CDI among PPI users. Those receiving PPI for GI prophylaxis in the earlier time period (before 2011) were 77% more likely to have a recurrence than those who received PPI in the later period. This finding might be associated with the more appropriate antimicrobial use and the more consistent use of consistent prophylactic probiotics in the later study period.
Our results showed that those who received probiotics with the initial CDI treatment were significantly less likely to have a recurrence than those who did not. Patients receiving probiotics in the later period (2011–2013) were 74% less likely to have a recurrence than patients in the earlier group (2009–2010). Despite the standard use of probiotics for primary CDI prevention at our institution, we could not show direct significance to the lack of probiotic use found in the identified CDI patients with this observational study design. The higher benefit in more recent years could possibly be attributed to the fact that these patients were much less likely to have received a PPI, that most had likely received probiotics concurrently plus 1 week after their antibiotic courses, and their antibiotic therapy was likely more focused and streamlined to prevent C. difficile infection. A meta-analysis of probiotic efficacy in primary CDI prevention suggested that probiotics can lead to a 64% reduction in the incidence of CDI, in addition to reducing GI-associated symptoms related to infection or antibiotic use [9]. A dose-response study of the efficacy of a probiotic formula showed a lower incidence of CDI, 1.2% for higher dose vs. 9.4% for lower dose vs. 23.8% for placebo [15]. Maziade et al [16] added prophylactic probiotics to a bundle of standard preventative measures for C. difficile infections, and were able to show an enhanced and sustained decrease in CDI rates (73%) and recurrences (39%). However, many of the probiotic studies which have studied the relationship to CDI have been criticized for reporting abnormally high rates of infection [9,16] missing data, a lack of controls or excessive patient exclusion criteria [17,18] The more recent PLACIDE study by Allen et al [19] was a large multicenter randomized controlled trial that did not show any benefit to CDI prevention with probiotics; however, with 83% of screened patients excluded, the patients were low risk, with the resulting CDI incidence (0.99%) too low to show a benefit. Acid suppression was also not revealed in the specific CDI cases, and others have found this to be a significant risk factor [5–7].
Limitations of this study include the study design (an observational, retrospective analysis), the small size of our facility, and the difficulty in obtaining probiotic history prior to admission in some cases. Due to a change in computer systems, hospital orders for GI prophylaxis agents could not be obtained for 2009–2010. Due to the fact that we instituted our interventions somewhat concurrently, it is difficult to analyze their individual impact. Randomized controlled trials evaluating the combined role of probiotics, GI prophylaxis, and antibiotic pressure in CDI are needed to further define the importance of this approach.
Corresponding author: Bridget Olson, RPh, Sharp Coronado Hospital & Villa Coronado Long-Term Care Facility, 250
Prospect Pl., Coronado CA 92118, bridget.olson@sharp.com.
Financial disclosures: None.
Author contributions: conception and design, BO, TH, KW, RO; analysis and interpretation of data, RAF; drafting of article, BO, RAF; critical revision of the article, RAF, JH, TH; provision of study materials or patients, BO; statistical expertise, RAF; administrative or technical support, KW, RO; collection and assembly of data, BO.
1. Centers for Disease Control and Prevention. Antibiotic resistance threats in the United States, 2013. http://www.cdc.gov/drugresistance/threat-report-2013/index.html.
2. Lessa FC, Mu Y, Bamberg WM, Beldavs ZG, et al. Burden of Clostridium difficile infection in the United States. N Engl J Med 2015;372:825–34.
3. Pepin J, Valiquette L, Cossette B. Mortality attributable to nosocomial Clostridium difficile-associated disease during an epidemic caused by a hypervirulent strain in Quebec. CMAJ 2005;173:1037–42.
4. Warren JW, Palumbo FB, Fitterman L, Speedie SM. Incidence and characteristics of antibiotic use in aged nursing home patients. J Am Geriatr Soc 1991;39:963–72.
5. Linsky A, Gupta K, Lawler E, et al. Proton pump inhibitors and risk for recurrent Clostridium difficile infection. Arch Intern Med 2010;170:772–8.
6. Dial S, Delaney JA, Barkun AN, Sulssa S. Use of gastric acid-suppressive agents and the risk of community-acquired Clostridium difficile-associated disease. JAMA 2005;294:2989–95.
7. Howell M, Novack V, Grgurich P, et.al. Iatrogenic gastric acid suppression and the risk if nosocomial Clostridium difficile infection. Arch Intern Med 2010;170:784–90.
8. Radulovic Z, Petrovic T, Bulajic S. Antibiotic susceptibility of probiotic bacteria. In Pana M, editor. Antibiotic resistant bacteria: a continuous challenge in the new millennium. Rijeka, Croatia: InTech; 2012.
9. Goldenberg JZ, Ma SS, Saxton JD, et al. Probiotics for the prevention of Clostridium difficile-associated diarrhea in adults and children. Cochrane Database Syst Rev 2013;5:CD006095.
10. Johnston BC, Ma SY, Goldenberg JZ, et al. Probiotics for the prevention of Clostridium difficile-associated diarrhea. Ann Intern Med 2012;157:878–88.
11. Blondeau JM. What have we learned about antimicrobial use and the risks for Clostridium difficile-associated diarrhoea? J Antimicrob Chemother 2009;63:203–37.
12. Elliott B, Chang BJ, Golledge CL et al. Clostridium difficile-associated diarrhoea. Intern Med J 2007;37:561–8.
13. Stone, ND, Ashraf, MS et al. Surveillance definitions of infections in long-term care facilities: revisiting the McGeer criteria. Infect Control Hosp Epidemiol 2012;33:965–77.
14. Janarthanan S, Ditah I, Adler DG, Ehrinpreis MN. Clostridium difficile-associated diarrhea and proton pump inhibitor therapy: a meta-analysis. Am J Gastroenterol 2012;107:1001–10.
15. Gao XW, Mubasher M, Fang CY, et al. Dose-response efficacy of a proprietary probiotic formula of Lactobacillus acidophilus CL1285 and Lactobacillus casei LBC80R for antibiotic-associated diarrhea and Clostridium difficile-associated diarrhea prophylaxis in adult patients. Am J Gastroenterol 2010;105:1636-41.
16. Maziade PJ, Andriessen JA, Pereira P, et.al. Impact of adding prophylactic probiotics to a bundle of standard preventative measures for Clostridium difficile infections: enhanced and sustained decrease in the incidence and severity of infection at a community hospital. Curr Med Res Opin 2013;29:1341–7.
17. Islam, J, Cohen J, Rajkumar C, Llewelyn M. Probiotics for the prevention and treatment of Clostridium difficile in older patients. Age Ageing 2012;41:706–11.
18. Hickson M, D’Souza AL, Muthu N, et al. Use of probiotic Lactobacillus preparation to prevent diarrhoea associated with antibiotics: randomised double blind placebo controlled trial. BMJ 2007;335:80.
19. Allen S J, Wareham K, Wang, D, et.al. Lactobacilli and bifidobacteria in the prevention of antibiotic-associated diarrhoea and Clostridium difficile diarrhoea in older inpatients (PLACIDE): a randomized, double-blind, placebo-controlled, multi-centre trial. Lancet 2013;382:1249–57.
The Value of Routine Transthoracic Echocardiography in Defining the Source of Stroke in a Community Hospital
From Anne Arundel Medical Center, Annapolis, MD.
Abstract
- Background: Acute stroke or cerebrovascular accident (CVA) is a common indication for hospitalization and can have devastating consequences, particularly in the setting of recurrence. Cardiac sources are potentially remediable; thus, a transthoracic echocardiogram (TTE) is frequently ordered to evaluate for a cardiac source of embolism.
- Objective: To evaluate the utility of performing TTE on patients experiencing a CVA or transient ischemic attack (TIA) to evaluate for a cardiac source of embolism.
- Methods: Retrospective review of TTE reports and patient electronic medical records at Anne Arundel Medical Center, a 385-bed community hospital. Medical charts for all CVA patients receiving a TTE between February 2012 to April 2013 were reviewed for TTEs showing unequivocal cardiac sources of embolism as evaluated by the reviewing cardiologist. Patient information and clinical morbidities were also noted to construct a composite demographic of CVA patients.
- Results: One TTE of 371 (0.270%) identified a clear cardiac embolus. Risk factors for stroke included hyper-tension (n = 302), cardiovascular disease (n = 204), cardiomyopathy (n = 131), and diabetes (n = 146).
- Conclusion: In the setting of stroke, TTE is of limited value when determining the etiology of stroke and should be used provisionally rather than routinely in evaluating patients experiencing CVA or TIA.
Acute cerebrovascular accident (CVA) is a common indication for hospitalization and can have devastating clinical consequences, particularly in the setting of recurrence. Defining the etiology of CVA and transient ischemic attacks (TIA) when they occur is important so that appropriate therapy can be initiated. Transthoracic echocardiograms (TTEs) are frequently ordered to evaluate for a cardiac source of embolism. No consensus exists about the use of imaging strategies to identify potential cardiovascular sources of emboli in patients who have had strokes.
A few published studies have investigated the yield of TTE in identifying cardiac sources of CVA. The yield has been reported to be between < 1% and as high as 37% [1–3]. However, some of the reported sources of CVA included mitral valve prolapse and patent foramen ovale [4,5], conditions for which the association with stroke has been questioned [6–8]. In addition, many of these studies were performed using clinical data from tertiary referral centers, which may have increased the yield of cardiac sources [9].
The purpose of this study was to evaluate the yield of TTE in evaluating for a clear cardiac source of embolism in a consecutive series of patients diagnosed with a CVA or TIA in a community hospital.
Methods
Setting
All data was collected from the echocardiography lab at Anne Arundel Medical Center, a 384-bed community hospital in Annapolis, MD. The medical center sees about 250 patients a day in its emergency department and admits about 30,000 patients annually. All echocardiograms are performed by a centralized laboratory accredited by the Intersocietal Commission for the Accreditation of Echocardiography Laboratories, which performs approximately 6000 echocardiograms annually.
All TTEs done for the diagnosis of CVA or TIA between 1 February 2013 and 1 May 2013 were evaluated in consecutive fashion by report review. Reports were searched for any cardiac source of embolism to include thrombus, tumor, vegetation, shunt, aortic atheroma, or any other finding that was felt to be a clear source of embolism by the interpreting cardiologist. We did not include entities such as mitral valve prolapse, patent foramen ovale, and isolated atrial septal aneurysms since their association with CVA/TIA has been questioned. Also not included was cardiomyopathy without aneurysm, apical wall motion abnormality, or intra-cavitary thrombus solely because the ejection fraction was less than 35%, as the literature does not support these conditions as clear causes of TIA or CVA.
In addition to reviewing echocardiogram reports, all patient records were evaluated for clinical variables including age, gender, presence of atrial fibrillation, hypertension, diabetes, past CVA, left atrial dilation by calculation of indexed direct left atrial volume, recent myocardial infarction, and known cardiovascular disease.
All echocardiograms were performed on Hewlet-Packard Vivid 7 or Vivid 9 (GE Healthcare, Wauwatosa, WI) by technicians who held registered diagnostic cardiac sonographer status. All TTEs contained the “standard” views in accordance with published guidelines [10].Saline contrast to look for shunts was not standard on these studies. Echocardiogram images were stored digitally and read from an EchoPac (GE Healthcare, Wauwatosa, WI) reading station. All echocardiograms were interpreted by one of 16 American Board of Internal Medicine–certified cardiologists, 5 of whom were testamurs (physicians who have passed one of the examinations of special competence in echocardiography). These 5 interpreted 20% of the studies.
Results
![]()
![]()
![]()
Discussion
Our data are in keeping with those of others, though our yield was even lower than that reported in previous studies [1–3]. The low yield may be explained by a number of factors. First, we did not include patent foramen ovale or atrial septal aneurysms (which account for a high percentage of embolic sources in other publications) since there is not a clear consensus that any of those entities are associated with an increased risk of embolic events. The exclusion of cardiomyopathy as a cause of CVA or TIA is arguable, but its link to CVA or TIA is also unproven. One study did associate cardiomyopathy with CVA [12]; however, the mechanism is not clear, as the incidence of CVA in cardiomyopathy has been described as similar regardless of the severity of left ventricular dysfunction [13].Many past reports have come from tertiary care centers, where there may be referral bias whereas our data come from consecutive patients at a single community hospital.
TTE is relatively quick to perform and interpret and carries no physical risk to a patient. However, our data suggest that ordering TTE routinely in the setting of CVA offers little value. With health care organizations turning their attention to reducing low-value care, which potentially wastes limited resources, considerations of value and effectiveness continue to be a priority. Our findings suggest TTE use in this setting conflicts with the current trajectory of value-based medical practice. As well, a prior Markov model decision analysis found that TTE is not cost-effective when used routinely to identify source of emboli in stroke [14].
Despite the low yield of TTE in evaluating for a cardiac source of CVA, TTEs continue to be frequently ordered. In our own institution, 48% of patients with a CVA or TIA underwent a TTE based on preferences and habits of individual admitting physicians and without any structured criteria. Order sets for CVA admissions do not include this test; physicians are adding it but not for any particular patient characteristic or exam finding.
There are a number of reasons that echocardiograms may be ordered more frequently by some. A documented decline in ordering echocardiograms was seen following education at one center [15], suggesting that lack of knowledge about the limitations of TTE may be a factor. A second potential factor is fear of medicolegal consequences. Indeed, the current American Heart Association/American Stroke Association guidelines for the early management of adults with ischemic stroke [16] offers no formal recommendations or clear indications.
Computerized decision support (CDS) that links the medical record to appropriateness criteria could potentially reduce the inappropriate use of TTE. CDS has been shown to be effective in reducing unnecessary ordering of tests in other settings [17–19].
Among the limitations in our analysis is the heterogeneity in echocardiogram readers. However, this heterogeneity may makes the study more relevant as it reflects the reality in most community hospitals. Another potential limitation is that saline contrast studies were not used routinely; however, this too is typical at community hospitals. Also, while all echocardiograms were interpreted by “board-certified” cardiologists, only 5 had passed the “examination of special competence” to be certified as a testamur of the National Board of Echocardiography, raising the question as to whether subtle findings could have been missed. However, there were no relevant findings in the 20% of studies interpreted by the testamurs, suggesting that the other echocardiographers were not missing diagnoses. Finally, we had only 10 patients younger than age 45 and so the study conclusions are less definitive for that age-group.
Conclusion
TTE was of limited utility in uncovering a cardiac source of embolism in a typical population with CVA or TIA.Based upon the data, we believe that TTE should not be used routinely in the setting of CVA; however, we do recognize that TTE may be of value in patients who have other comorbidities that would place them at increased risk of embolic CVA such as a recent anterior MI, those at risk for endocarditis, or those with brain imaging findings suggestive of embolic CVA [20]. Ordering a low-value test such as a TTE in the setting of TIA or CVA adds cost and does not often yield a clinically meaningful results. In addition, a “negative” TTE can be misinterpreted as a normal heart and forestall additional workup such as transesophageal echocardiography and long-term rhythm analysis, which may be of higher value. We suggest that in a community hospital setting the determination of need for TTE be made based on the clinical nuances of the case rather than by habit or as part of standardized order sets.
Corresponding author: Barry Meisenberg, MD, DeCesaris Cancer Institute, 2001 Medical Parkway, Annapolis, MD 21146, meisenberg@aahs.org.
Financial disclosures: None.
Author contributions: conception and design, BM, WCM; analysis and interpretation of data, BM, WCM; drafting of article, RHB, BM, WCM; critical revision of the article, BM, WCM; administrative or technical support, JC; collection and assembly of data, RHB, JC.
1. Rauh R, Fischereder M, Spengel FA. Transesophageal echocardiography in patients with focal cerebral ischemia of unknown cause. Stroke 1996;27:691.
2. Khan MA, Khealanj B, Kamal, A. Diagnostic yield of transthoracic echocardiography for stroke patients in a developing country. J Pak Med Assoc 2008;58:375–7.
3. de Abreu T, Mateus S, José Correia J. Therapy implications of transthoracic echocardiography in acute ischemic stroke patients. Stroke 2005;36:1565–6.
4. de Bruijn SFTM, Agema WRP, Lammers GJ, et al. Transesophageal echocardiography is superior to transthoracic echocardiography in management of patients of any age with transient ischemic attack or stroke. Stroke 2006;37:2531–4.
5. Putaala J, Metso AJ, MD, Metso T. Analysis of 1008 consecutive patients aged 15 to 49 with first-ever ischemic stroke. Stroke 2009;40:1195–203.
6. Lechat P, Mas JL, Lascault G, et al. Prevalence of patent fora-men ovale in patients with stroke. N Engl J Med 1988;318:1148–52.
7. Di Tullio MR, Jin Z, Russo C, et al. Patent foramen ovale, subclinical cerebrovascular disease, and ischemic stroke in a population-based cohort. J Am Coll Cardiol 2013; 62:35–41.
8. Orencia AJ, Petty GW, Khandheria BK, et al. Risk of stroke with mitral valve prolapse in population-based cohort study; Stroke 1995;26:7–13.
9. Holmes M, Rathbone J, Littlewood C. Routine echocardiography in the management of stroke and transient ischaemic attack: a systematic review and economic evaluation. Health Technol Assess 2014;18:1–176.
10. Ryan T, Armstrong W. Feigenbaum’s echocardiography. 7th ed. Philadelphia: Lippincott Williams & Wilkins; 2009.
11. Lip GY, Nieuwlaat R, Pisters R, et al. Refining clinical risk stratification for predicting stroke and thromboembolism in atrial fibrillation using a novel risk factor-based approach: the Euro Heart Survey on Atrial Fibrillation. Chest 2010;137:263–72.
12. Furie KL, Kasner SE, Adams RJ, et al. Guidelines for the prevention of stroke in patients with stroke or transient ischemic attack: a guideline for healthcare professionals from the American Heart Association/American Stroke Association. Stroke 2011;42:227–76.
13. Hays AG, Sacco RL, Rundek T. Left ventricular systolic dysfunction and the risk of ischemic stroke in a multiethnic population. Stroke 2006;37:1715–9.
14. McNamara RL, Lima JA, Whelton PK, Powe NR. Echocardiographic identification of cardiovascular sources of emboli to guide clinical management of stroke: a cost-effectiveness analysis. Ann Intern Med 1997;127:775–87.
15. Alberts MJ, Bennett CA, Rutledge VR. Hospital charges for stroke patients. Stroke 1996;27:1825–8.
16. Jauch EC, Saver JL, Adams HP, et al. Guidelines for the early management of patients with acute ischemic stroke: a guideline for healthcare professionals from the American Heart Association/American Stroke Association. Stroke 2013;44:870–947.
17. Levick DL, Stern G, Meyerhoefer CD, et al. Reducing unnecessary testing in a CPOE system through implementation of a targeted CDS intervention. BMC Med Inform Decis 2013;13:43.
18. Chen P, Tanasijevic MJ, Schoenenberger RA, et al. A computer-based intervention for improving the appropriateness of antiepileptic drug level monitoring. Am J Clin Pathol 2003;119:432–8.
19. Solberg LI, Wei F, Butler JC, et al. Effects of electronic decision support on high-tech diagnostic imaging orders and patients. Am J Manag Care 2010;16:102–6.
20. Menon BK, Coulter JI, Simerpret B, et al. Acute ischaemic stroke or transient ischaemic attack and the need for inpatient echocardiography. Postgrad Med J 2014;90:434–8.
From Anne Arundel Medical Center, Annapolis, MD.
Abstract
- Background: Acute stroke or cerebrovascular accident (CVA) is a common indication for hospitalization and can have devastating consequences, particularly in the setting of recurrence. Cardiac sources are potentially remediable; thus, a transthoracic echocardiogram (TTE) is frequently ordered to evaluate for a cardiac source of embolism.
- Objective: To evaluate the utility of performing TTE on patients experiencing a CVA or transient ischemic attack (TIA) to evaluate for a cardiac source of embolism.
- Methods: Retrospective review of TTE reports and patient electronic medical records at Anne Arundel Medical Center, a 385-bed community hospital. Medical charts for all CVA patients receiving a TTE between February 2012 to April 2013 were reviewed for TTEs showing unequivocal cardiac sources of embolism as evaluated by the reviewing cardiologist. Patient information and clinical morbidities were also noted to construct a composite demographic of CVA patients.
- Results: One TTE of 371 (0.270%) identified a clear cardiac embolus. Risk factors for stroke included hyper-tension (n = 302), cardiovascular disease (n = 204), cardiomyopathy (n = 131), and diabetes (n = 146).
- Conclusion: In the setting of stroke, TTE is of limited value when determining the etiology of stroke and should be used provisionally rather than routinely in evaluating patients experiencing CVA or TIA.
Acute cerebrovascular accident (CVA) is a common indication for hospitalization and can have devastating clinical consequences, particularly in the setting of recurrence. Defining the etiology of CVA and transient ischemic attacks (TIA) when they occur is important so that appropriate therapy can be initiated. Transthoracic echocardiograms (TTEs) are frequently ordered to evaluate for a cardiac source of embolism. No consensus exists about the use of imaging strategies to identify potential cardiovascular sources of emboli in patients who have had strokes.
A few published studies have investigated the yield of TTE in identifying cardiac sources of CVA. The yield has been reported to be between < 1% and as high as 37% [1–3]. However, some of the reported sources of CVA included mitral valve prolapse and patent foramen ovale [4,5], conditions for which the association with stroke has been questioned [6–8]. In addition, many of these studies were performed using clinical data from tertiary referral centers, which may have increased the yield of cardiac sources [9].
The purpose of this study was to evaluate the yield of TTE in evaluating for a clear cardiac source of embolism in a consecutive series of patients diagnosed with a CVA or TIA in a community hospital.
Methods
Setting
All data was collected from the echocardiography lab at Anne Arundel Medical Center, a 384-bed community hospital in Annapolis, MD. The medical center sees about 250 patients a day in its emergency department and admits about 30,000 patients annually. All echocardiograms are performed by a centralized laboratory accredited by the Intersocietal Commission for the Accreditation of Echocardiography Laboratories, which performs approximately 6000 echocardiograms annually.
All TTEs done for the diagnosis of CVA or TIA between 1 February 2013 and 1 May 2013 were evaluated in consecutive fashion by report review. Reports were searched for any cardiac source of embolism to include thrombus, tumor, vegetation, shunt, aortic atheroma, or any other finding that was felt to be a clear source of embolism by the interpreting cardiologist. We did not include entities such as mitral valve prolapse, patent foramen ovale, and isolated atrial septal aneurysms since their association with CVA/TIA has been questioned. Also not included was cardiomyopathy without aneurysm, apical wall motion abnormality, or intra-cavitary thrombus solely because the ejection fraction was less than 35%, as the literature does not support these conditions as clear causes of TIA or CVA.
In addition to reviewing echocardiogram reports, all patient records were evaluated for clinical variables including age, gender, presence of atrial fibrillation, hypertension, diabetes, past CVA, left atrial dilation by calculation of indexed direct left atrial volume, recent myocardial infarction, and known cardiovascular disease.
All echocardiograms were performed on Hewlet-Packard Vivid 7 or Vivid 9 (GE Healthcare, Wauwatosa, WI) by technicians who held registered diagnostic cardiac sonographer status. All TTEs contained the “standard” views in accordance with published guidelines [10].Saline contrast to look for shunts was not standard on these studies. Echocardiogram images were stored digitally and read from an EchoPac (GE Healthcare, Wauwatosa, WI) reading station. All echocardiograms were interpreted by one of 16 American Board of Internal Medicine–certified cardiologists, 5 of whom were testamurs (physicians who have passed one of the examinations of special competence in echocardiography). These 5 interpreted 20% of the studies.
Results
![]()
![]()
![]()
Discussion
Our data are in keeping with those of others, though our yield was even lower than that reported in previous studies [1–3]. The low yield may be explained by a number of factors. First, we did not include patent foramen ovale or atrial septal aneurysms (which account for a high percentage of embolic sources in other publications) since there is not a clear consensus that any of those entities are associated with an increased risk of embolic events. The exclusion of cardiomyopathy as a cause of CVA or TIA is arguable, but its link to CVA or TIA is also unproven. One study did associate cardiomyopathy with CVA [12]; however, the mechanism is not clear, as the incidence of CVA in cardiomyopathy has been described as similar regardless of the severity of left ventricular dysfunction [13].Many past reports have come from tertiary care centers, where there may be referral bias whereas our data come from consecutive patients at a single community hospital.
TTE is relatively quick to perform and interpret and carries no physical risk to a patient. However, our data suggest that ordering TTE routinely in the setting of CVA offers little value. With health care organizations turning their attention to reducing low-value care, which potentially wastes limited resources, considerations of value and effectiveness continue to be a priority. Our findings suggest TTE use in this setting conflicts with the current trajectory of value-based medical practice. As well, a prior Markov model decision analysis found that TTE is not cost-effective when used routinely to identify source of emboli in stroke [14].
Despite the low yield of TTE in evaluating for a cardiac source of CVA, TTEs continue to be frequently ordered. In our own institution, 48% of patients with a CVA or TIA underwent a TTE based on preferences and habits of individual admitting physicians and without any structured criteria. Order sets for CVA admissions do not include this test; physicians are adding it but not for any particular patient characteristic or exam finding.
There are a number of reasons that echocardiograms may be ordered more frequently by some. A documented decline in ordering echocardiograms was seen following education at one center [15], suggesting that lack of knowledge about the limitations of TTE may be a factor. A second potential factor is fear of medicolegal consequences. Indeed, the current American Heart Association/American Stroke Association guidelines for the early management of adults with ischemic stroke [16] offers no formal recommendations or clear indications.
Computerized decision support (CDS) that links the medical record to appropriateness criteria could potentially reduce the inappropriate use of TTE. CDS has been shown to be effective in reducing unnecessary ordering of tests in other settings [17–19].
Among the limitations in our analysis is the heterogeneity in echocardiogram readers. However, this heterogeneity may makes the study more relevant as it reflects the reality in most community hospitals. Another potential limitation is that saline contrast studies were not used routinely; however, this too is typical at community hospitals. Also, while all echocardiograms were interpreted by “board-certified” cardiologists, only 5 had passed the “examination of special competence” to be certified as a testamur of the National Board of Echocardiography, raising the question as to whether subtle findings could have been missed. However, there were no relevant findings in the 20% of studies interpreted by the testamurs, suggesting that the other echocardiographers were not missing diagnoses. Finally, we had only 10 patients younger than age 45 and so the study conclusions are less definitive for that age-group.
Conclusion
TTE was of limited utility in uncovering a cardiac source of embolism in a typical population with CVA or TIA.Based upon the data, we believe that TTE should not be used routinely in the setting of CVA; however, we do recognize that TTE may be of value in patients who have other comorbidities that would place them at increased risk of embolic CVA such as a recent anterior MI, those at risk for endocarditis, or those with brain imaging findings suggestive of embolic CVA [20]. Ordering a low-value test such as a TTE in the setting of TIA or CVA adds cost and does not often yield a clinically meaningful results. In addition, a “negative” TTE can be misinterpreted as a normal heart and forestall additional workup such as transesophageal echocardiography and long-term rhythm analysis, which may be of higher value. We suggest that in a community hospital setting the determination of need for TTE be made based on the clinical nuances of the case rather than by habit or as part of standardized order sets.
Corresponding author: Barry Meisenberg, MD, DeCesaris Cancer Institute, 2001 Medical Parkway, Annapolis, MD 21146, meisenberg@aahs.org.
Financial disclosures: None.
Author contributions: conception and design, BM, WCM; analysis and interpretation of data, BM, WCM; drafting of article, RHB, BM, WCM; critical revision of the article, BM, WCM; administrative or technical support, JC; collection and assembly of data, RHB, JC.
1. Rauh R, Fischereder M, Spengel FA. Transesophageal echocardiography in patients with focal cerebral ischemia of unknown cause. Stroke 1996;27:691.
2. Khan MA, Khealanj B, Kamal, A. Diagnostic yield of transthoracic echocardiography for stroke patients in a developing country. J Pak Med Assoc 2008;58:375–7.
3. de Abreu T, Mateus S, José Correia J. Therapy implications of transthoracic echocardiography in acute ischemic stroke patients. Stroke 2005;36:1565–6.
4. de Bruijn SFTM, Agema WRP, Lammers GJ, et al. Transesophageal echocardiography is superior to transthoracic echocardiography in management of patients of any age with transient ischemic attack or stroke. Stroke 2006;37:2531–4.
5. Putaala J, Metso AJ, MD, Metso T. Analysis of 1008 consecutive patients aged 15 to 49 with first-ever ischemic stroke. Stroke 2009;40:1195–203.
6. Lechat P, Mas JL, Lascault G, et al. Prevalence of patent fora-men ovale in patients with stroke. N Engl J Med 1988;318:1148–52.
7. Di Tullio MR, Jin Z, Russo C, et al. Patent foramen ovale, subclinical cerebrovascular disease, and ischemic stroke in a population-based cohort. J Am Coll Cardiol 2013; 62:35–41.
8. Orencia AJ, Petty GW, Khandheria BK, et al. Risk of stroke with mitral valve prolapse in population-based cohort study; Stroke 1995;26:7–13.
9. Holmes M, Rathbone J, Littlewood C. Routine echocardiography in the management of stroke and transient ischaemic attack: a systematic review and economic evaluation. Health Technol Assess 2014;18:1–176.
10. Ryan T, Armstrong W. Feigenbaum’s echocardiography. 7th ed. Philadelphia: Lippincott Williams & Wilkins; 2009.
11. Lip GY, Nieuwlaat R, Pisters R, et al. Refining clinical risk stratification for predicting stroke and thromboembolism in atrial fibrillation using a novel risk factor-based approach: the Euro Heart Survey on Atrial Fibrillation. Chest 2010;137:263–72.
12. Furie KL, Kasner SE, Adams RJ, et al. Guidelines for the prevention of stroke in patients with stroke or transient ischemic attack: a guideline for healthcare professionals from the American Heart Association/American Stroke Association. Stroke 2011;42:227–76.
13. Hays AG, Sacco RL, Rundek T. Left ventricular systolic dysfunction and the risk of ischemic stroke in a multiethnic population. Stroke 2006;37:1715–9.
14. McNamara RL, Lima JA, Whelton PK, Powe NR. Echocardiographic identification of cardiovascular sources of emboli to guide clinical management of stroke: a cost-effectiveness analysis. Ann Intern Med 1997;127:775–87.
15. Alberts MJ, Bennett CA, Rutledge VR. Hospital charges for stroke patients. Stroke 1996;27:1825–8.
16. Jauch EC, Saver JL, Adams HP, et al. Guidelines for the early management of patients with acute ischemic stroke: a guideline for healthcare professionals from the American Heart Association/American Stroke Association. Stroke 2013;44:870–947.
17. Levick DL, Stern G, Meyerhoefer CD, et al. Reducing unnecessary testing in a CPOE system through implementation of a targeted CDS intervention. BMC Med Inform Decis 2013;13:43.
18. Chen P, Tanasijevic MJ, Schoenenberger RA, et al. A computer-based intervention for improving the appropriateness of antiepileptic drug level monitoring. Am J Clin Pathol 2003;119:432–8.
19. Solberg LI, Wei F, Butler JC, et al. Effects of electronic decision support on high-tech diagnostic imaging orders and patients. Am J Manag Care 2010;16:102–6.
20. Menon BK, Coulter JI, Simerpret B, et al. Acute ischaemic stroke or transient ischaemic attack and the need for inpatient echocardiography. Postgrad Med J 2014;90:434–8.
New Treatment Options for Metastatic Thyroid Cancer
Thyroid cancer is the ninth most common malignancy in the U.S. At the time of diagnosis, thyroid cancer is mostly confined to the thyroid gland and regional lymph nodes. However, around 4% of patients with thyroid cancer present with metastatic disease. When compared with localized and regional thyroid cancer, 5-year survival rates for metastatic thyroid cancer are significantly worse (99.9%, 97.6%, and 54.7%, respectively).1 Treatment options for metastatic thyroid cancer are limited and largely depend on the pathology and the type of thyroid cancer.
Thyroid cancer can be divided into differentiated, medullary, and anaplastic subtypes based on pathology. The treatment for metastatic differentiated thyroid cancer (DTC) consists of radioactive iodine therapy, thyroid-stimulating hormone (TSH) suppression (thyroxine hormone) therapy, and external beam radiotherapy. Systemic therapy is considered in patients with metastatic DTC who progress despite the above treatment modalities. In the case of metastatic medullary thyroid cancer (MTC), patients who are not candidates for surgery or radiation are considered for systemic therapy, because MTC does not respond to radioactive iodine or TSH suppressive therapy. On the other hand, metastatic anaplastic thyroid cancer is a very aggressive subtype with no effective therapy available to date. Palliation of symptoms is the main goal for these patients, which can be achieved by loco-regional resection and palliative irradiation.2,3
This review focuses on the newer treatment options for metastatic DTC and MTC that are based on inhibition of cellular kinases.
Differentiated Thyroid Cancer
Differentiated thyroid cancer is the most common histologic type of thyroid cancer, accounting for 95% of all thyroid cancers and consists of papillary, follicular, and poorly differentiated thyroid cancer.2,3 Surgery is the treatment of choice for DTC. Based on tumor size and its local extension in the neck, treatment options include unilateral lobectomy and isthmectomy, total thyroidectomy, central neck dissection, and more extensive resection.2,3 After surgery, radioactive iodine is recommended in patients with known metastatic disease; locally invasive tumor, regardless of size; or primary tumor > 4 cm, in the absence of other high-risk features.2 This should be followed by TSH suppressive hormone therapy.2
About 7% to 23% of patients with DTC develop distant metastases.4 Two-thirds of these patients become refractory to radioactive iodine.5 Prognosis remains poor in these patients, with a 10-year survival rate from the time detection of metastasis of only 10%.5-7 Treatment options are limited. However, recently the understanding of cell biology in terms of key signaling pathways called kinases has been elucidated. The kinases that can stabilize progressive metastatic disease seem to be attractive therapeutic targets in treating patients whose disease no longer responds to radioiodine and TSH suppressive hormone therapy.
Papillary thyroid cancers frequently carry gene mutations and rearrangements that lead to activation of the mitogen-activated protein kinase (MAPK), which promotes cell division. The sequential components leading to activation of MAPK include rearrangements of RET and NTRK1 tyrosine kinases, activating mutations of BRAF, and activating mutations of RAS.8,9 Similarly, overexpression of normal c-myc and c-fos genes, as well as mutations of HRAS, NRAS, and KRAS genes, is found in follicular adenomas, follicular cancers, and occasionally papillary cancers.10-14 Increased expression of vascular endothelial growth factor (VEGF) and its receptors (VEGFRs) might have a role in thyroid carcinoma as well.15
These kinases (the serine kinase BRAF and tyrosine kinases RET and RAS, and the contributory roles of tyrosine kinases in growth factor receptors such as the VEGFR) stimulate tumor proliferation, angiogenesis, invasion, metastasis, and inhibit tumor cell apoptosis. Kinase inhibitors target these signaling kinases, affecting tumor cell biology and its microenvironment.16,17
A wide variety of multitargeted kinase inhibitors (MKIs) have entered clinical trials for patients with advanced or progressive metastatic thyroid cancers. Two such agents, sorafenib and lenvatinib, are approved by the FDA for use in selected patients with refractory metastatic DTC, whereas many other drugs remain investigational for this disease. In phase 2 and 3 trials, most of the treatment responses for MKIs were partial. Complete responses were rare, and no study has reported a complete analysis of overall survival (OS) outcomes. Results from some new randomized trials indicate an improvement in progression-free survival (PFS) compared with placebo, and additional trials are underway.
Sorafenib
Sorafenib was approved by the FDA in 2013 for the treatment of locally recurrent or metastatic, progressive DTC that no longer responds to radioactive iodine treatment.18 Sorafenib is an oral, small molecule MKI. It works on VEGFRs 1, 2, and 3; platelet-derived growth factor receptor (PDGFR); common RET/PTC subtypes; KIT; and less potently, BRAF.19 The recommended dose is 400 mg orally twice a day.
In April 2014, Brose and colleagues published the phase 3 DECISION study on sorafenib.20 It was a multicenter, randomized, double-blinded, placebo-controlled trial of 417 patients with radioactive iodine-refractory locally advanced or metastatic DTC that had progressed within the previous 14 months.20 The results of the trial were promising. The median PFS was 5 months longer in the sorafenib group (10.8 mo) than in the placebo group (5.8 mo; hazard ratio [HR], 0.59; 95% conidence interval [CI], 0.45-0.76; P < .0001). The primary endpoint of the trial was PFS, and crossover from placebo to sorafenib was permitted upon progression. Overall survival did not differ significantly between the treatment groups (placebo vs sorafenib) at the time of the primary analysis data cutoff. However, OS results may have been confounded by postprogression crossover from placebo to open-label sorafenib by the majority of placebo patients.
In subgroup analysis, patients with BRAF and RAS mutations and wild-type BRAF and RAS subgroups had a significant increase in median PFS in the sorafenib treatment group compared with the placebo group (Table 1).20
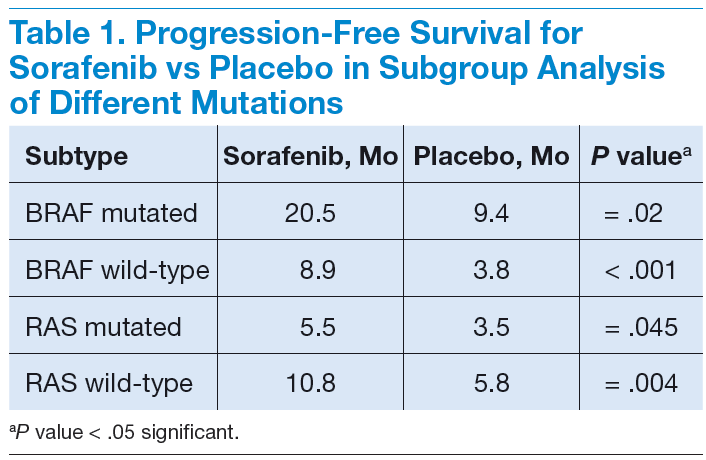
Adverse events (AEs) occurred in 98.6% of patients receiving sorafenib during the double-blind period and in 87.6% of patients receiving placebo. Most AEs were grade 1 or 2. The most common AEs were hand-foot-skin reactions (76.3%), diarrhea (68.6%), alopecia (67.1%), and rash or desquamation (50.2%). Toxicities led to dose modification in 78% of patients and permanent discontinuation of therapy in 19%.20 Like other BRAF inhibitors, sorafenib has been associated with an increased incidence of cutaneous squamous cell carcinomas (5%), keratoacanthomas, and other premalignant actinic lesions.21
Lenvatinib
In February 2015, lenvatinib was approved for the treatment of locally recurrent or metastatic, progressive DTC that no longer responds to radioactive iodine treatment.22 Lenvatinib is a MKI of VEGFRs 1, 2, and 3; fibroblast growth factor receptors 1 through 4; PDGFR-α; RET, and KIT.23,24 The recommended dose is 24 mg orally once daily.
Schlumberger and colleagues published results from the SELECT trial, a randomized, double-blinded, multicenter phase 3 study involving 392 patients with progressive thyroid cancer that was refractory to iodine-131.25 A total of 261 patients received lenvatinib, and 131 patients received a placebo. Upon disease progression, patients in the placebo group were allowed to receive open-label lenvatinib. The study’s primary endpoint was PFS. Secondary endpoints were the response rate (RR), OS, and safety. The median PFS was 18.3 months in the lenvatinib group and 3.6 months in the placebo group (HR, 0.21; 99% CI, 0.14-0.31; P < .001). The RR was 64.8% in the lenvatinib group (4 complete and 165 partial responses) and 1.5% in the placebo group (P < .001). There was no significant difference in OS between the 2 groups (HR for death, 0.73; 95% CI, 0.50-1.07; P = .10). This difference became larger when a potential crossover bias was considered (rank-preserving structural failure time model; HR, 0.62; 95% CI, 0.40-1.00; P = .05).25
In a subgroup analysis, median PFS was about 14 months in the absence of prior anti-VEGFR therapy and 11 months of prior therapy. The treatmentrelated AEs were 97.3% in the lenvatinib group, and 75.9% were grade 3 or higher. Common treatmentrelated AEs of any grade in the lenvatinib group included hypertension (67.8%), diarrhea (59.4%), fatigue or asthenia (59.0%), decreased appetite (50.2%), decreased weight (46.4%), and nausea (41.0%). The study drug had to be discontinued because of AEs in 14% of patients who received lenvatinib and 2% of patients who received placebo. In the lenvatinib group, 2.3% patients had treatment-related fatal events (6 patients).25
Summary
Patients with DTC who progress after radioactive iodine therapy, TSH suppressive therapy, and external beam radiotherapy should be considered for systemic therapy. Systemic therapy consists of MKIs, which can stabilize progressive metastatic disease. These newer drugs have significant toxicities. Therefore, it is important to limit the use of systemic treatments to patients at significant risk for morbidity or mortality due to progressive metastatic disease. Patients treated with systemic agents should have a good baseline performance status, such as being ambulatory at least 50% (Eastern Cooperative Oncology Group performance score of 2) of the day to tolerate these treatments.
Patients who have disease progression or are unable to tolerate sorafenib and lenvatinib can choose to participate in clinical trials with investigational multitarget inhibitors. Other alternatives include vandetinib, pazopanib, and sunitinib, which finished phase 2 trials and showed some partial responses.26-30 If the patients are unable to tolerate MKIs, they can try doxorubicin-based conventional chemotherapy regimens.31
Medullary Thyroid Cancer
Medullary thyroid cancer is a neuroendocrine tumor arising from the thyroid parafollicular cells, accounting for about 4% of thyroid carcinomas, most of which are sporadic. However, some are familial as part of the multiple endocrine neoplasia type 2 (MEN 2) syndromes, which are transmitted in an autosomal dominant fashion.32,33 Similar to DTC, the primary treatment option is surgery. Medullary thyroid cancer can be cured only by complete resection of the thyroid tumor and any local and regional metastases. Compared with DTC, metastatic MTC is unresponsive to radioiodine or TSH
suppressive treatment, because this cancer neither concentrates iodine nor is TSH dependent.34,35
The 10-year OS rate in MTC is ≤ 40% in patients with locally advanced or metastatic disease.32,36,37 In hereditary MTC, germline mutations in the c-ret proto-oncogene occur in virtually all patients. In sporadic MTC, 85% of patients have the M918T mutation, and somatic c-ret mutations are seen in about 50% of patients.38-42
Similar to DTC, due to the presence of mutations involving RET receptor tyrosine kinase, molecular targeted therapeutics with activity against RET demonstrate a potential therapeutic target in MTC.43-45 Other signaling pathways likely to contribute to the growth and invasiveness of MTC include VEGFR-dependent tumor angiogenesis and epidermal growth factor receptor (EGFR)-dependent tumor cell proliferation.46
In 2011 and 2012, the FDA approved tyrosine kinase inhibitors (TKIs) vandetanib and cabozantinib for metastatic MTC. Similar to treatment for DTC, systemic therapy is mainly based on targeted therapies. Patients with progressive or symptomatic metastatic disease who are not candidates for surgery or radiotherapy should be considered for TKI therapy.
Vandetanib
Vandetanib is approved for unresectable, locally advanced or metastatic sporadic or hereditary MTC.47 The daily recommended dose is 300 mg/d. It is an oral MKI that targets VEGFR, RET/PTC, and the EGFR.48
The ZETA trial was an international randomized phase 3 trial involving patients with unresectable locally advanced or metastatic sporadic or hereditary MTC.48 In a ZETA trial study by Wells Jr and colleagues, patients with advanced MTC were randomly assigned in a 2:1 ratio to receive vandetanib 300 mg/d or placebo. After objective disease progression, patients could elect to receive openlabel vandetanib. The primary endpoint was PFS, determined by independent central Response Evaluation Criteria in Solid Tumors assessments.
A total of 331 patients were randomly assigned to receive vandetanib (231 patients) or placebo (100 patients). At data cutoff, with median follow-up of 24 months, PFS was significantly prolonged in patients randomly assigned to vandetanib vs placebo (30.5 mo vs 19.3 mo; HR, 0.46; 95% CI, 0.31-0.69). The objective RR was significantly higher in the vandetanib group (45% vs 13%). The presence of a somatic RET M918T mutation predicted an improved PFS.
Common AEs (any grade) noted with vandetanib vs placebo include diarrhea (56% vs 26%), rash (45% vs 11%), nausea (33% vs 16%), hypertension (32% vs 5%), and headache (26% vs 9%). Torsades de pointes and sudden death were reported in patients receiving vandetanib. Data on OS were immature at data cutoff (HR, 0.89; 95% CI, 0.48-1.65). A final survival analysis will take place when 50% of the patients have died.48
Vandetanib is currently approved with a Risk Evaluation and Mitigation Strategy to inform health care professionals about serious heart-related risks. Electrocardiograms and serum potassium, calcium, magnesium, and TSH should be taken at 2 to 4 weeks and 8 to 12 weeks after starting treatment and every 3 months after that. Patients with diarrhea may require more frequent monitoring.
Cabozantinib
In 2012, the FDA approved cabozantinib for the treatment of progressive, metastatic MTC.49 It is an oral, small molecule TKI that targets VEGFRs 1 and 2, MET, and RET. The inhibitory activity against MET, the cognate receptor for the hepatocyte growth factor, may provide additional synergistic benefit in MTC.50 The daily recommended dose is 140 mg/d. A phase 3 randomized EXAM trial in patients with progressive, metastatic, or unresectable locally advanced MTC.51 Three hundred thirty patients were randomly assigned to receive either cabozantinib 140 mg or placebo once daily. Progressionfree survival was improved with cabozantinib compared with that of placebo (11.2 vs 4.0 mo; HR, 0.28; 95% CI, 0.19-0.40). Partial responses were observed in 27% vs 0% in placebo. A planned interim analysis of OS was conducted, including 96 (44%) of the 217 patient deaths required for the final analysis, with no statistically significant difference observed between the treatment arms (HR, 0.98; 95% CI, 0.63-1.52). Survival follow-up is planned to continue until at least 217 deaths have been observed.
There was markedly improved PFS in the subset of patients treated with cabozantinib compared with placebo whose tumors contained RET M918T mutations (61 vs 17 wk; HR, 0.15; 95% CI, 0.08-0.28) or RAS mutations (47 vs 8 wk; HR, 0.15; 95% CI, 0.02-1.10).51
The most common AEs, occurring in ≥ 25% of patients, were diarrhea, stomatitis, hand and foot syndrome, hypertension, and abdominal pain. Although uncommon, clinically significant AEs also included fistula formation and osteonecrosis of the jaw.
Summary
Patients with progressive or symptomatic metastatic disease who are not candidates for surgery or radiotherapy should be considered for TKI therapy. Though not curative, TKIs can only stabilize disease progression. Initiation of TKIs should be considered in rapidly progressive disease, because these drugs are associated with considerable AEs affecting the quality of life (QOL).
Patients who progressed or were unable to tolerate vandetanib or cabozantinib can choose to participate in clinical trials with investigational multitarget inhibitors. Other alternatives include pazopanib, sunitinib, and sorafenib, which finished phase 2 trials and showed some partial responses.29,52-57 If patients are unable to tolerate MKIs, they can try conventional chemotherapy consisting of dacarbazine with other agents or doxorubin.58-60
Conclusions
Molecular targeted therapy is an emerging treatment option for patients with metastatic thyroid cancer (Table 2). The authors suggest that such patients participate in clinical trials in the hope of developing more effective and tolerable drugs and recommend oral TKIs for patients with rapidly progressive disease who cannot participate in a clinical trial. For patients who cannot tolerate or fail one TKI, the authors recommend trying other TKIs before initiating cytotoxic chemotherapy.
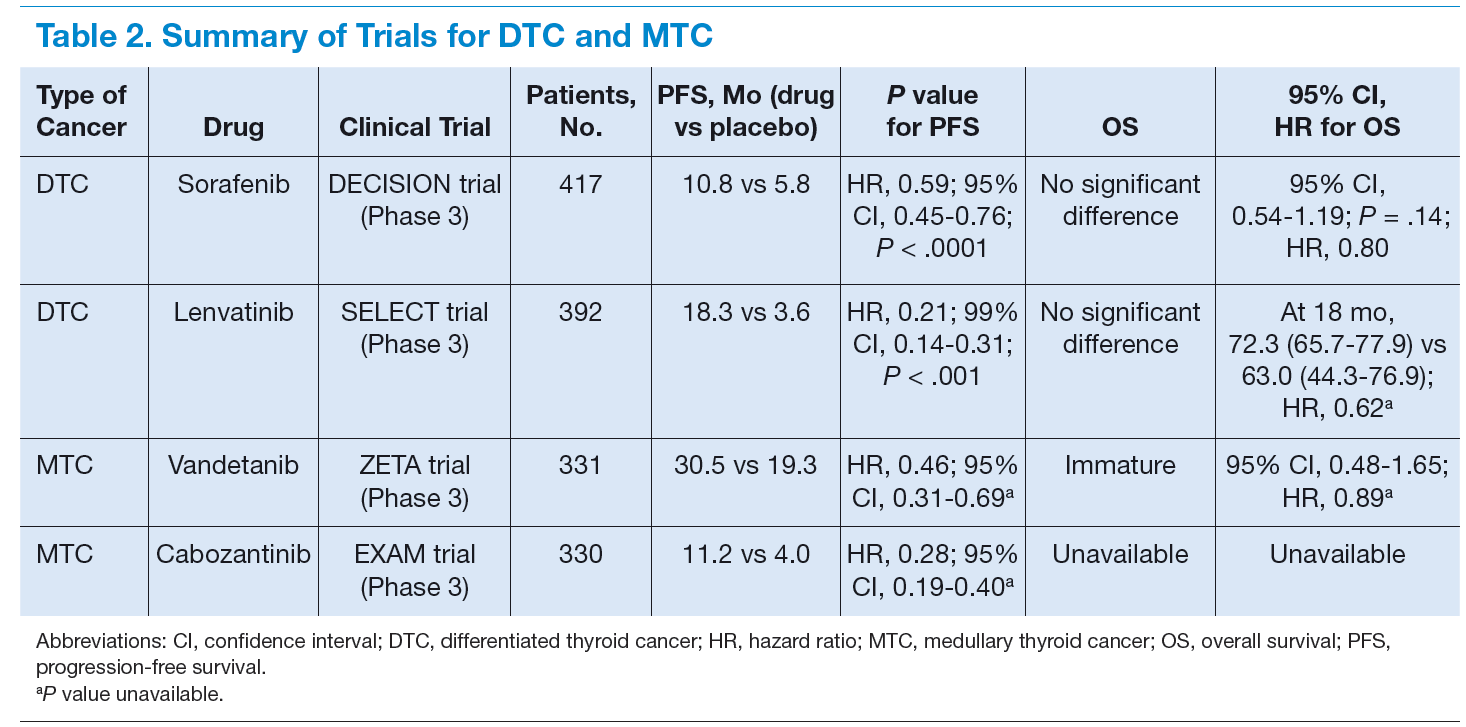
Before initiation of treatment for metastatic disease, an important factor to consider is the pace of disease progression. Patients who are asymptomatic and have the very indolent disease may postpone kinase inhibitor therapy until they become rapidly progressive or symptomatic, because the AEs of treatment will adversely affect the patient’s QOL. In patients with symptomatic and rapidly progressive disease, initiation of treatment with kinase inhibitor therapy can lead to stabilization of disease, although at the cost of some AEs. More structured clinical trials are needed, along with an evaluation of newer molecular targets for the management of this progressive metastatic disease with a dismal prognosis.
Author disclosures
The authors report no actual or potential conflicts of interest with regard to this article.
Disclaimer
The opinions expressed herein are those of the authors and do not necessarily reflect those of Federal Practitioner, Frontline Medical Communications Inc., the U.S. Government, or any of its agencies. This article may discuss unlabeled or investigational use of certain drugs. Please review complete prescribing information for specific drugs or drug combinations—including indications, contraindications, warnings, and adverse effects—before administering pharmacologic therapy to patients.
Click here to read the digital edition.
1. Howlader N, Noone AM, Krapcho M, et al, eds. SEER Cancer Statistics Review, 1975-2012. Bethesda, MD: National Cancer Institute; 2015.
2. Cooper DS, Doherty GM, Haugen BR, et al; American Thyroid Association (ATA) Guidelines Taskforce on Thyroid Nodules and Differentiated Thyroid Cancer. Revised American Thyroid Association management guidelines for patients with thyroid nodules and differentiated thyroid cancer. Thyroid. 2009;19(11):1167-1214.
3. National Comprehensive Cancer Network. NCCN clinical practice guidelines in oncology: thyroid carcinoma. National Comprehensive Cancer Network Website. http://www.nccn.org/professionals/physician_gls/pdf/thyroid.pdf. Updated May 11, 2015. Accessed July 10, 2015.
4. Shoup M, Stojadinovic A, Nissan A, et al. Prognostic indicators of outcomes in patients with distant metastases from differentiated thyroid carcinoma. J Am Coll Surg. 2003;197(2):191-197.
5. Durante C, Haddy N, Baudin E, et al. Long-term outcome of 444 patients with distant metastases from papillary and follicular thyroid carcinoma: benefits and limits of radioiodine therapy. J Clin Endocrinol Metab. 2006;91(8):2892-2899.
6. Busaidy NL, Cabanillas ME. Differentiated thyroid cancer: management of patients with radioiodine nonresponsive disease. J Thyroid Res. 2012;2012:618985.
7. Schlumberger M, Brose M, Elisei R, et al. Definition and management of radioactive iodine-refractory differentiated thyroid cancer. Lancet Diabetes Endocrinol. 2014;2(5):356-358.
8. Melillo RM, Castellone MD, Guarino V, et al. The RET/PTC-RAS-BRAF linear signaling cascade mediates the motile and mitogenic phenotype of thyroid cancer cells. J Clin Invest. 2005;115(4):1068-1081.
9. Ciampi R, Nikiforov YE. RET/PTC rearrangements and BRAF mutations in thyroid tumorigenesis. Endocrinology. 2007;148(3):936-941.
10. Lemoine NR, Mayall ES, Wyllie FS, et al. High frequency of ras oncogene activation in all stages of human thyroid tumorigenesis. Oncogene. 1989;4(2):159-164.
11. Namba H, Rubin SA, Fagin JA. Point mutations of ras oncogenes are an early event in thyroid tumorigenesis. Mol Endocrinol. 1990;4(10):1474-1479.
12. Suarez HG, du Villard JA, Severino M, et al. Presence of mutations in all three ras genes in human thyroid tumors. Oncogene. 1990;5(4):565-570.
13. Karga H, Lee JK, Vickery AL Jr, Thor A, Gaz RD, Jameson JL. Ras oncogene mutations in benign and malignant thyroid neoplasms. J Clin Endocrinol Metab. 1991;73(4):832-836.
14. Terrier P, Sheng ZM, Schlumberger M, et al. Structure and expression of c-myc and c-fos proto-oncogenes in thyroid carcinomas. Br J Cancer. 1988;57(1):43-47.
15. Klein M, Vignaud JM, Hennequin V, et al. Increased expression of the vascular endothelial growth factor is a pejorative prognosis marker in papillary thyroid carcinoma. J Clin Endocrinol Metab. 2001;86(2):656-658.
16. Zhang J, Yang PL, Gray NS. Targeting cancer with small molecule kinase inhibitors. Nat Rev Cancer. 2009;9(1):28-39.
17. Haugen BR, Sherman SI. Evolving approaches to patients with advanced differentiated thyroid cancer. Endocr Rev. 2013;34(3):439-455.
18. U.S. Food and Drug Administration. FDA approves Nexavar to treat type of thyroid cancer [press release]. Silver Spring, MD: U.S. Food and Drug Administration; November 22, 2013.
19. Wilhelm SM, Carter C, Tang L, et al. BAY 43-9006 exhibits broad spectrum oral antitumor activity and targets the RAF/MEK/ERK pathway and receptor tyrosine kinases involved in tumor progression and angiogenesis. Cancer Res. 2004;64(19):7099-7109.
20. Brose MS, Nutting CM, Jarzab B, et al; DECISION investigators. Sorafenib in radioactive iodine-refractory, locally advanced or metastatic differentiated thyroid cancer: a randomised, double-blind, phase 3 trial. Lancet. 2014;384(9940):319-328.
21. Dubauskas Z, Kunishige J, Prieto VG, Jonasch E, Hwu P, Tannir NM. Cutaneous squamous cell carcinoma and inflammation of actinic keratoses associated with sorafenib. Clin Genitourin Cancer. 2009;7(1):20-23.
22. U.S. Food and Drug Administration. FDA approves Lenvima for a type of thyroid cancer [press release]. Silver Spring, MD: U.S. Food and Drug Administration; February 13, 2015.
23. Matsui J, Yamamoto Y, Funahashi Y, et al. E7080, a novel inhibitor that targets multiple kinases, has potent antitumor activities against stem cell factor producing human small cell lung cancer H146, based on angiogenesis inhibition. Int J Cancer. 2008;122(3):664-671.
24. Matsui J, Funahashi Y, Uenaka T, Watanabe T, Tsuruoka A, Asada M. Multi-kinase inhibitor E7080 suppresses lymph node and lung metastases of human mammary breast tumor MDA-MB-231 via inhibition of vascular endothelial growth factorreceptor (VEGF-R) 2 and VEGF-R3 kinase. Clin Cancer Res. 2008;14(17):5459-5465.
25. Schlumberger M, Tahara M, Wirth LJ, et al. Lenvatinib versus placebo in radioiodine- refractory thyroid cancer. N Engl J Med. 2015;372(7):621-630.
26. Leboulleux S, Bastholt L, Krause T, et al. Vandetanib in locally advanced or metastatic differentiated thyroid cancer: a randomised, double-blind, phase 2 trial. Lancet Oncol. 2012;13(9):897-905.
27. A randomised, double-blind, placebo-controlled, multi-centre phase III study to assess the efficacy and safety of vandetanib (CAPRELSA) 300 mg in patients with differentiated thyroid cancer that is either locally advanced or metastatic who are refractory or unsuitable for radioiodine (RAI) therapy. Trial number NCT01876784. ClinicalTrials.gov Website. https://clinicaltrials.gov/show/NCT01876784. Updated June 26, 2015. Accessed July 22, 2015.
28. Bible KC, Suman VJ, Molina JR, et al; Endocrine Malignancies Disease Oriented Group; Mayo Clinic Cancer Center; Mayo Phase 2 Consortium. Efficacy of pazopanib in progressive, radioiodine-refractory, metastatic differentiated thyroid cancers: results of a phase 2 consortium study. Lancet Oncol. 2010;11(10):962-972.
29. Kim DW, Jo YS, Jung HS, et al. An orally administered multitarget tyrosine kinase inhibitor, SU11248, is a novel potent inhibitor of thyroid oncogenic RET/papillary thyroid cancer kinases. J Clin Endocrinol Metab. 2006;91(10):4070-4076.
30. Dawson SJ, Conus NM, Toner GC, et al. Sustained clinical responses to tyrosine kinase inhibitor sunitinib in thyroid carcinoma. Anticancer Drugs. 2008;19(5):547-552.
31. Carter SK, Blum RH. New chemotherapeutic agents—bleomycin and adriamycin. CA Cancer J Clin. 1974;24(6):322-331.
32. Hundahl SA, Fleming ID, Fremgen AM, Menck HR. A National Cancer Data Base report on 53,856 cases of thyroid carcinoma treated in the U.S., 1985-1995 [see comments]. Cancer. 1998;83(12):2638-2648.
33. Lakhani VT, You YN, Wells SA. The multiple endocrine neoplasia syndromes. Annu Rev Med. 2007;58:253-265.
34. Martins RG, Rajendran JG, Capell P, Byrd DR, Mankoff DA. Medullary thyroid cancer: options for systemic therapy of metastatic disease? J Clin Oncol. 2006;24(11):1653-1655.
35. American Thyroid Association Guidelines Task Force; Kloos RT, Eng C, Evans DB, et al. Medullary thyroid cancer: management guidelines of the American Thyroid Association. Thyroid. 2009;19(6):565-612.
36. Roman S, Lin R, Sosa JA. Prognosis of medullary thyroid carcinoma: demographic, clinical, and pathologic predictors of survival in 1252 cases. Cancer. 2006;107(9):2134-2142.
37. Modigliani E, Cohen R, Campos JM, et al. Prognostic factors for survival and for biochemical cure in medullary thyroid carcinoma: results in 899 patients. The GETC Study Group. Groupe d’étude des tumeurs à calcitonine. Clin Endocrinol (Oxf). 1998;48(3):265-273.
38. Donis-Keller H, Dou S, Chi D, et al. Mutations in the RET proto-oncogene are associated with MEN 2A and FMTC. Hum Mol Genet. 1993;2(7):851-856.
39. Mulligan LM, Kwok JB, Healey CS, et al. Germ-line mutations of the RET protooncogene in multiple endocrine neoplasia type 2A. Nature. 363(6428):458-460.
40. Carlson KM, Dou S, Chi D, et al. Single missense mutation in the tyrosine kinase catalytic domain of the RET protooncogene is associated with multiple endocrine neoplasia type 2B. Proc Natl Acad Sci USA. 1994;91(4):1579-1583.
41. Marsh DJ, Learoyd DL, Andrew SD, et al. Somatic mutations in the RET protooncogene in sporadic medullary thyroid carcinoma. Clin Endocrinol (Oxf). 1996;44(3):249-257.
42. Elisei R, Cosci B, Romei C, et al. Prognostic significance of somatic RET oncogene mutations in sporadic medullary thyroid cancer: a 10-year follow-up study. J Clin Endocrinol Metab. 2008;93(3):682-687.
43. Carlomagno F, Vitagliano D, Guida T, et al. ZD6474, an orally available inhibitor of KDR tyrosine kinase activity, efficiently blocks oncogenic RET kinases. Cancer Res. 2002;62(24):7284-7290.
44. Carlomagno F, Anaganti S, Guida T, et al. BAY 43-9006 inhibition of oncogenic RET mutants. J Natl Cancer Inst. 2006;98(5):326-334.
45. Santoro M, Carlomagno F. Drug insight: small molecule inhibitors of protein kinases in the treatment of thyroid cancer. Nat Clin Pract Endocrinol Metab. 2006;2(1):42-52.
46. Rodríguez-Antona C, Pallares J, Montero-Conde C, et al. Overexpression and activation of EGFR and VEGFR2 in medullary thyroid carcinomas is related to metastasis. Endocr Relat Cancer. 2010;17(1):7-16.
47. U.S. Food and Drug Administration. FDA approves new treatment for rare form of thyroid cancer [press release]. Silver Spring, MD: U.S. Food and Drug Administration; April 6, 2011.
48. Wells SA Jr, Robinson BG, Gagel RF, et al. Vandetanib in patients with locally advanced or metastatic medullary thyroid cancer: a randomized, double-blind phase III trial. J Clin Oncol. 2012;30(2):134-141.
49. U.S. Food and Drug Administration. FDA approves Cometriq to treat rare type of thyroid cancer [press release]. Silver Spring, MD: U.S. Food and Drug Administration; November 29, 2012.
50. Cui JJ. Inhibitors targeting hepatocyte growth factor receptor and their potential therapeutic applications. Expert Opin Ther Pat. 2007;17(9):1035-1045.
51. Schoffski P, Elisei R, Müller S, et al. An international, double-blind, randomized, placebo-controlled phase III trial (EXAM) of cabozantinib (XL184) in medullary thyroid carcinoma (MTC) patients (pts) with documented RECIST progression at baseline. J Clin Oncol. 2012;30(suppl):5508.
52. Kober F, Hermann M, Handler A, Krotla G. Effect of sorafenib in symptomatic metastatic medullary thyroid cancer. J Clin Oncol. 2007;25(18S):14065.
53. Lam ET, Ringel MD, Kloos RT, et al. Phase II clinical trial of sorafenib in metastatic medullary thyroid cancer. J Clin Oncol. 2010;28(14):2323-2330.
54. Hong DS, Sebti SM, Newman RA, et al. Phase I trial of a combination of the multikinase inhibitor sorafenib and the farnesyltransferase inhibitor tipifarnib in advanced malignancies. Clin Cancer Res. 2009;15(22):7061-7068.
55. Kelleher FC, McDermott R. Response to sunitinib in medullary thyroid cancer. Ann Intern Med. 2008;148(7):567.
56. Carr LL, Mankoff DA, Goulart BH, et al. Phase II study of daily sunitinib in FDGPET- positive, iodine-refractory differentiated thyroid cancer and metastatic medullary carcinoma of the thyroid with functional imaging correlation. Clin Cancer Res. 2010;16(21):5260-5268.
57. Bible KC, Suman VJ, Molina JR, et al; Endocrine Malignancies Disease Oriented Group; Mayo Clinic Cancer Center; Mayo Phase 2 Consortium. A multicenter phase 2 trial of pazopanib in metastatic and progressive medullary thyroid carcinoma: MC057H. J Clin Endocrinol Metab. 2014;99(5):1687-1693.
58. Ball DW. Medullary thyroid cancer: monitoring and therapy. Endocrinol Metab Clin North Am. 2007;36(3):823-837, viii.
59. Nocera M, Baudin E, Pellegriti G, Cailleux AF, Mechelany-Corone C, Schlumberger M. Treatment of advanced medullary thyroid cancer with an alternating combination of doxorubicin-streptozocin and 5 FU-dacarbazine. Groupe d’Etude des Tumeurs à Calcitonine (GETC). Br J Cancer. 2000;83(6):715-718.
60. Shimaoka K, Schoenfeld DA, DeWys WD, Creech RH, DeConti R. A randomized trial of doxorubicin versus doxorubicin plus cisplatin in patients with advanced thyroid carcinoma. Cancer. 1985;56(9):2155-2160.
Thyroid cancer is the ninth most common malignancy in the U.S. At the time of diagnosis, thyroid cancer is mostly confined to the thyroid gland and regional lymph nodes. However, around 4% of patients with thyroid cancer present with metastatic disease. When compared with localized and regional thyroid cancer, 5-year survival rates for metastatic thyroid cancer are significantly worse (99.9%, 97.6%, and 54.7%, respectively).1 Treatment options for metastatic thyroid cancer are limited and largely depend on the pathology and the type of thyroid cancer.
Thyroid cancer can be divided into differentiated, medullary, and anaplastic subtypes based on pathology. The treatment for metastatic differentiated thyroid cancer (DTC) consists of radioactive iodine therapy, thyroid-stimulating hormone (TSH) suppression (thyroxine hormone) therapy, and external beam radiotherapy. Systemic therapy is considered in patients with metastatic DTC who progress despite the above treatment modalities. In the case of metastatic medullary thyroid cancer (MTC), patients who are not candidates for surgery or radiation are considered for systemic therapy, because MTC does not respond to radioactive iodine or TSH suppressive therapy. On the other hand, metastatic anaplastic thyroid cancer is a very aggressive subtype with no effective therapy available to date. Palliation of symptoms is the main goal for these patients, which can be achieved by loco-regional resection and palliative irradiation.2,3
This review focuses on the newer treatment options for metastatic DTC and MTC that are based on inhibition of cellular kinases.
Differentiated Thyroid Cancer
Differentiated thyroid cancer is the most common histologic type of thyroid cancer, accounting for 95% of all thyroid cancers and consists of papillary, follicular, and poorly differentiated thyroid cancer.2,3 Surgery is the treatment of choice for DTC. Based on tumor size and its local extension in the neck, treatment options include unilateral lobectomy and isthmectomy, total thyroidectomy, central neck dissection, and more extensive resection.2,3 After surgery, radioactive iodine is recommended in patients with known metastatic disease; locally invasive tumor, regardless of size; or primary tumor > 4 cm, in the absence of other high-risk features.2 This should be followed by TSH suppressive hormone therapy.2
About 7% to 23% of patients with DTC develop distant metastases.4 Two-thirds of these patients become refractory to radioactive iodine.5 Prognosis remains poor in these patients, with a 10-year survival rate from the time detection of metastasis of only 10%.5-7 Treatment options are limited. However, recently the understanding of cell biology in terms of key signaling pathways called kinases has been elucidated. The kinases that can stabilize progressive metastatic disease seem to be attractive therapeutic targets in treating patients whose disease no longer responds to radioiodine and TSH suppressive hormone therapy.
Papillary thyroid cancers frequently carry gene mutations and rearrangements that lead to activation of the mitogen-activated protein kinase (MAPK), which promotes cell division. The sequential components leading to activation of MAPK include rearrangements of RET and NTRK1 tyrosine kinases, activating mutations of BRAF, and activating mutations of RAS.8,9 Similarly, overexpression of normal c-myc and c-fos genes, as well as mutations of HRAS, NRAS, and KRAS genes, is found in follicular adenomas, follicular cancers, and occasionally papillary cancers.10-14 Increased expression of vascular endothelial growth factor (VEGF) and its receptors (VEGFRs) might have a role in thyroid carcinoma as well.15
These kinases (the serine kinase BRAF and tyrosine kinases RET and RAS, and the contributory roles of tyrosine kinases in growth factor receptors such as the VEGFR) stimulate tumor proliferation, angiogenesis, invasion, metastasis, and inhibit tumor cell apoptosis. Kinase inhibitors target these signaling kinases, affecting tumor cell biology and its microenvironment.16,17
A wide variety of multitargeted kinase inhibitors (MKIs) have entered clinical trials for patients with advanced or progressive metastatic thyroid cancers. Two such agents, sorafenib and lenvatinib, are approved by the FDA for use in selected patients with refractory metastatic DTC, whereas many other drugs remain investigational for this disease. In phase 2 and 3 trials, most of the treatment responses for MKIs were partial. Complete responses were rare, and no study has reported a complete analysis of overall survival (OS) outcomes. Results from some new randomized trials indicate an improvement in progression-free survival (PFS) compared with placebo, and additional trials are underway.
Sorafenib
Sorafenib was approved by the FDA in 2013 for the treatment of locally recurrent or metastatic, progressive DTC that no longer responds to radioactive iodine treatment.18 Sorafenib is an oral, small molecule MKI. It works on VEGFRs 1, 2, and 3; platelet-derived growth factor receptor (PDGFR); common RET/PTC subtypes; KIT; and less potently, BRAF.19 The recommended dose is 400 mg orally twice a day.
In April 2014, Brose and colleagues published the phase 3 DECISION study on sorafenib.20 It was a multicenter, randomized, double-blinded, placebo-controlled trial of 417 patients with radioactive iodine-refractory locally advanced or metastatic DTC that had progressed within the previous 14 months.20 The results of the trial were promising. The median PFS was 5 months longer in the sorafenib group (10.8 mo) than in the placebo group (5.8 mo; hazard ratio [HR], 0.59; 95% conidence interval [CI], 0.45-0.76; P < .0001). The primary endpoint of the trial was PFS, and crossover from placebo to sorafenib was permitted upon progression. Overall survival did not differ significantly between the treatment groups (placebo vs sorafenib) at the time of the primary analysis data cutoff. However, OS results may have been confounded by postprogression crossover from placebo to open-label sorafenib by the majority of placebo patients.
In subgroup analysis, patients with BRAF and RAS mutations and wild-type BRAF and RAS subgroups had a significant increase in median PFS in the sorafenib treatment group compared with the placebo group (Table 1).20
Adverse events (AEs) occurred in 98.6% of patients receiving sorafenib during the double-blind period and in 87.6% of patients receiving placebo. Most AEs were grade 1 or 2. The most common AEs were hand-foot-skin reactions (76.3%), diarrhea (68.6%), alopecia (67.1%), and rash or desquamation (50.2%). Toxicities led to dose modification in 78% of patients and permanent discontinuation of therapy in 19%.20 Like other BRAF inhibitors, sorafenib has been associated with an increased incidence of cutaneous squamous cell carcinomas (5%), keratoacanthomas, and other premalignant actinic lesions.21
Lenvatinib
In February 2015, lenvatinib was approved for the treatment of locally recurrent or metastatic, progressive DTC that no longer responds to radioactive iodine treatment.22 Lenvatinib is a MKI of VEGFRs 1, 2, and 3; fibroblast growth factor receptors 1 through 4; PDGFR-α; RET, and KIT.23,24 The recommended dose is 24 mg orally once daily.
Schlumberger and colleagues published results from the SELECT trial, a randomized, double-blinded, multicenter phase 3 study involving 392 patients with progressive thyroid cancer that was refractory to iodine-131.25 A total of 261 patients received lenvatinib, and 131 patients received a placebo. Upon disease progression, patients in the placebo group were allowed to receive open-label lenvatinib. The study’s primary endpoint was PFS. Secondary endpoints were the response rate (RR), OS, and safety. The median PFS was 18.3 months in the lenvatinib group and 3.6 months in the placebo group (HR, 0.21; 99% CI, 0.14-0.31; P < .001). The RR was 64.8% in the lenvatinib group (4 complete and 165 partial responses) and 1.5% in the placebo group (P < .001). There was no significant difference in OS between the 2 groups (HR for death, 0.73; 95% CI, 0.50-1.07; P = .10). This difference became larger when a potential crossover bias was considered (rank-preserving structural failure time model; HR, 0.62; 95% CI, 0.40-1.00; P = .05).25
In a subgroup analysis, median PFS was about 14 months in the absence of prior anti-VEGFR therapy and 11 months of prior therapy. The treatmentrelated AEs were 97.3% in the lenvatinib group, and 75.9% were grade 3 or higher. Common treatmentrelated AEs of any grade in the lenvatinib group included hypertension (67.8%), diarrhea (59.4%), fatigue or asthenia (59.0%), decreased appetite (50.2%), decreased weight (46.4%), and nausea (41.0%). The study drug had to be discontinued because of AEs in 14% of patients who received lenvatinib and 2% of patients who received placebo. In the lenvatinib group, 2.3% patients had treatment-related fatal events (6 patients).25
Summary
Patients with DTC who progress after radioactive iodine therapy, TSH suppressive therapy, and external beam radiotherapy should be considered for systemic therapy. Systemic therapy consists of MKIs, which can stabilize progressive metastatic disease. These newer drugs have significant toxicities. Therefore, it is important to limit the use of systemic treatments to patients at significant risk for morbidity or mortality due to progressive metastatic disease. Patients treated with systemic agents should have a good baseline performance status, such as being ambulatory at least 50% (Eastern Cooperative Oncology Group performance score of 2) of the day to tolerate these treatments.
Patients who have disease progression or are unable to tolerate sorafenib and lenvatinib can choose to participate in clinical trials with investigational multitarget inhibitors. Other alternatives include vandetinib, pazopanib, and sunitinib, which finished phase 2 trials and showed some partial responses.26-30 If the patients are unable to tolerate MKIs, they can try doxorubicin-based conventional chemotherapy regimens.31
Medullary Thyroid Cancer
Medullary thyroid cancer is a neuroendocrine tumor arising from the thyroid parafollicular cells, accounting for about 4% of thyroid carcinomas, most of which are sporadic. However, some are familial as part of the multiple endocrine neoplasia type 2 (MEN 2) syndromes, which are transmitted in an autosomal dominant fashion.32,33 Similar to DTC, the primary treatment option is surgery. Medullary thyroid cancer can be cured only by complete resection of the thyroid tumor and any local and regional metastases. Compared with DTC, metastatic MTC is unresponsive to radioiodine or TSH
suppressive treatment, because this cancer neither concentrates iodine nor is TSH dependent.34,35
The 10-year OS rate in MTC is ≤ 40% in patients with locally advanced or metastatic disease.32,36,37 In hereditary MTC, germline mutations in the c-ret proto-oncogene occur in virtually all patients. In sporadic MTC, 85% of patients have the M918T mutation, and somatic c-ret mutations are seen in about 50% of patients.38-42
Similar to DTC, due to the presence of mutations involving RET receptor tyrosine kinase, molecular targeted therapeutics with activity against RET demonstrate a potential therapeutic target in MTC.43-45 Other signaling pathways likely to contribute to the growth and invasiveness of MTC include VEGFR-dependent tumor angiogenesis and epidermal growth factor receptor (EGFR)-dependent tumor cell proliferation.46
In 2011 and 2012, the FDA approved tyrosine kinase inhibitors (TKIs) vandetanib and cabozantinib for metastatic MTC. Similar to treatment for DTC, systemic therapy is mainly based on targeted therapies. Patients with progressive or symptomatic metastatic disease who are not candidates for surgery or radiotherapy should be considered for TKI therapy.
Vandetanib
Vandetanib is approved for unresectable, locally advanced or metastatic sporadic or hereditary MTC.47 The daily recommended dose is 300 mg/d. It is an oral MKI that targets VEGFR, RET/PTC, and the EGFR.48
The ZETA trial was an international randomized phase 3 trial involving patients with unresectable locally advanced or metastatic sporadic or hereditary MTC.48 In a ZETA trial study by Wells Jr and colleagues, patients with advanced MTC were randomly assigned in a 2:1 ratio to receive vandetanib 300 mg/d or placebo. After objective disease progression, patients could elect to receive openlabel vandetanib. The primary endpoint was PFS, determined by independent central Response Evaluation Criteria in Solid Tumors assessments.
A total of 331 patients were randomly assigned to receive vandetanib (231 patients) or placebo (100 patients). At data cutoff, with median follow-up of 24 months, PFS was significantly prolonged in patients randomly assigned to vandetanib vs placebo (30.5 mo vs 19.3 mo; HR, 0.46; 95% CI, 0.31-0.69). The objective RR was significantly higher in the vandetanib group (45% vs 13%). The presence of a somatic RET M918T mutation predicted an improved PFS.
Common AEs (any grade) noted with vandetanib vs placebo include diarrhea (56% vs 26%), rash (45% vs 11%), nausea (33% vs 16%), hypertension (32% vs 5%), and headache (26% vs 9%). Torsades de pointes and sudden death were reported in patients receiving vandetanib. Data on OS were immature at data cutoff (HR, 0.89; 95% CI, 0.48-1.65). A final survival analysis will take place when 50% of the patients have died.48
Vandetanib is currently approved with a Risk Evaluation and Mitigation Strategy to inform health care professionals about serious heart-related risks. Electrocardiograms and serum potassium, calcium, magnesium, and TSH should be taken at 2 to 4 weeks and 8 to 12 weeks after starting treatment and every 3 months after that. Patients with diarrhea may require more frequent monitoring.
Cabozantinib
In 2012, the FDA approved cabozantinib for the treatment of progressive, metastatic MTC.49 It is an oral, small molecule TKI that targets VEGFRs 1 and 2, MET, and RET. The inhibitory activity against MET, the cognate receptor for the hepatocyte growth factor, may provide additional synergistic benefit in MTC.50 The daily recommended dose is 140 mg/d. A phase 3 randomized EXAM trial in patients with progressive, metastatic, or unresectable locally advanced MTC.51 Three hundred thirty patients were randomly assigned to receive either cabozantinib 140 mg or placebo once daily. Progressionfree survival was improved with cabozantinib compared with that of placebo (11.2 vs 4.0 mo; HR, 0.28; 95% CI, 0.19-0.40). Partial responses were observed in 27% vs 0% in placebo. A planned interim analysis of OS was conducted, including 96 (44%) of the 217 patient deaths required for the final analysis, with no statistically significant difference observed between the treatment arms (HR, 0.98; 95% CI, 0.63-1.52). Survival follow-up is planned to continue until at least 217 deaths have been observed.
There was markedly improved PFS in the subset of patients treated with cabozantinib compared with placebo whose tumors contained RET M918T mutations (61 vs 17 wk; HR, 0.15; 95% CI, 0.08-0.28) or RAS mutations (47 vs 8 wk; HR, 0.15; 95% CI, 0.02-1.10).51
The most common AEs, occurring in ≥ 25% of patients, were diarrhea, stomatitis, hand and foot syndrome, hypertension, and abdominal pain. Although uncommon, clinically significant AEs also included fistula formation and osteonecrosis of the jaw.
Summary
Patients with progressive or symptomatic metastatic disease who are not candidates for surgery or radiotherapy should be considered for TKI therapy. Though not curative, TKIs can only stabilize disease progression. Initiation of TKIs should be considered in rapidly progressive disease, because these drugs are associated with considerable AEs affecting the quality of life (QOL).
Patients who progressed or were unable to tolerate vandetanib or cabozantinib can choose to participate in clinical trials with investigational multitarget inhibitors. Other alternatives include pazopanib, sunitinib, and sorafenib, which finished phase 2 trials and showed some partial responses.29,52-57 If patients are unable to tolerate MKIs, they can try conventional chemotherapy consisting of dacarbazine with other agents or doxorubin.58-60
Conclusions
Molecular targeted therapy is an emerging treatment option for patients with metastatic thyroid cancer (Table 2). The authors suggest that such patients participate in clinical trials in the hope of developing more effective and tolerable drugs and recommend oral TKIs for patients with rapidly progressive disease who cannot participate in a clinical trial. For patients who cannot tolerate or fail one TKI, the authors recommend trying other TKIs before initiating cytotoxic chemotherapy.
Before initiation of treatment for metastatic disease, an important factor to consider is the pace of disease progression. Patients who are asymptomatic and have the very indolent disease may postpone kinase inhibitor therapy until they become rapidly progressive or symptomatic, because the AEs of treatment will adversely affect the patient’s QOL. In patients with symptomatic and rapidly progressive disease, initiation of treatment with kinase inhibitor therapy can lead to stabilization of disease, although at the cost of some AEs. More structured clinical trials are needed, along with an evaluation of newer molecular targets for the management of this progressive metastatic disease with a dismal prognosis.
Author disclosures
The authors report no actual or potential conflicts of interest with regard to this article.
Disclaimer
The opinions expressed herein are those of the authors and do not necessarily reflect those of Federal Practitioner, Frontline Medical Communications Inc., the U.S. Government, or any of its agencies. This article may discuss unlabeled or investigational use of certain drugs. Please review complete prescribing information for specific drugs or drug combinations—including indications, contraindications, warnings, and adverse effects—before administering pharmacologic therapy to patients.
Click here to read the digital edition.
1. Howlader N, Noone AM, Krapcho M, et al, eds. SEER Cancer Statistics Review, 1975-2012. Bethesda, MD: National Cancer Institute; 2015.
2. Cooper DS, Doherty GM, Haugen BR, et al; American Thyroid Association (ATA) Guidelines Taskforce on Thyroid Nodules and Differentiated Thyroid Cancer. Revised American Thyroid Association management guidelines for patients with thyroid nodules and differentiated thyroid cancer. Thyroid. 2009;19(11):1167-1214.
3. National Comprehensive Cancer Network. NCCN clinical practice guidelines in oncology: thyroid carcinoma. National Comprehensive Cancer Network Website. http://www.nccn.org/professionals/physician_gls/pdf/thyroid.pdf. Updated May 11, 2015. Accessed July 10, 2015.
4. Shoup M, Stojadinovic A, Nissan A, et al. Prognostic indicators of outcomes in patients with distant metastases from differentiated thyroid carcinoma. J Am Coll Surg. 2003;197(2):191-197.
5. Durante C, Haddy N, Baudin E, et al. Long-term outcome of 444 patients with distant metastases from papillary and follicular thyroid carcinoma: benefits and limits of radioiodine therapy. J Clin Endocrinol Metab. 2006;91(8):2892-2899.
6. Busaidy NL, Cabanillas ME. Differentiated thyroid cancer: management of patients with radioiodine nonresponsive disease. J Thyroid Res. 2012;2012:618985.
7. Schlumberger M, Brose M, Elisei R, et al. Definition and management of radioactive iodine-refractory differentiated thyroid cancer. Lancet Diabetes Endocrinol. 2014;2(5):356-358.
8. Melillo RM, Castellone MD, Guarino V, et al. The RET/PTC-RAS-BRAF linear signaling cascade mediates the motile and mitogenic phenotype of thyroid cancer cells. J Clin Invest. 2005;115(4):1068-1081.
9. Ciampi R, Nikiforov YE. RET/PTC rearrangements and BRAF mutations in thyroid tumorigenesis. Endocrinology. 2007;148(3):936-941.
10. Lemoine NR, Mayall ES, Wyllie FS, et al. High frequency of ras oncogene activation in all stages of human thyroid tumorigenesis. Oncogene. 1989;4(2):159-164.
11. Namba H, Rubin SA, Fagin JA. Point mutations of ras oncogenes are an early event in thyroid tumorigenesis. Mol Endocrinol. 1990;4(10):1474-1479.
12. Suarez HG, du Villard JA, Severino M, et al. Presence of mutations in all three ras genes in human thyroid tumors. Oncogene. 1990;5(4):565-570.
13. Karga H, Lee JK, Vickery AL Jr, Thor A, Gaz RD, Jameson JL. Ras oncogene mutations in benign and malignant thyroid neoplasms. J Clin Endocrinol Metab. 1991;73(4):832-836.
14. Terrier P, Sheng ZM, Schlumberger M, et al. Structure and expression of c-myc and c-fos proto-oncogenes in thyroid carcinomas. Br J Cancer. 1988;57(1):43-47.
15. Klein M, Vignaud JM, Hennequin V, et al. Increased expression of the vascular endothelial growth factor is a pejorative prognosis marker in papillary thyroid carcinoma. J Clin Endocrinol Metab. 2001;86(2):656-658.
16. Zhang J, Yang PL, Gray NS. Targeting cancer with small molecule kinase inhibitors. Nat Rev Cancer. 2009;9(1):28-39.
17. Haugen BR, Sherman SI. Evolving approaches to patients with advanced differentiated thyroid cancer. Endocr Rev. 2013;34(3):439-455.
18. U.S. Food and Drug Administration. FDA approves Nexavar to treat type of thyroid cancer [press release]. Silver Spring, MD: U.S. Food and Drug Administration; November 22, 2013.
19. Wilhelm SM, Carter C, Tang L, et al. BAY 43-9006 exhibits broad spectrum oral antitumor activity and targets the RAF/MEK/ERK pathway and receptor tyrosine kinases involved in tumor progression and angiogenesis. Cancer Res. 2004;64(19):7099-7109.
20. Brose MS, Nutting CM, Jarzab B, et al; DECISION investigators. Sorafenib in radioactive iodine-refractory, locally advanced or metastatic differentiated thyroid cancer: a randomised, double-blind, phase 3 trial. Lancet. 2014;384(9940):319-328.
21. Dubauskas Z, Kunishige J, Prieto VG, Jonasch E, Hwu P, Tannir NM. Cutaneous squamous cell carcinoma and inflammation of actinic keratoses associated with sorafenib. Clin Genitourin Cancer. 2009;7(1):20-23.
22. U.S. Food and Drug Administration. FDA approves Lenvima for a type of thyroid cancer [press release]. Silver Spring, MD: U.S. Food and Drug Administration; February 13, 2015.
23. Matsui J, Yamamoto Y, Funahashi Y, et al. E7080, a novel inhibitor that targets multiple kinases, has potent antitumor activities against stem cell factor producing human small cell lung cancer H146, based on angiogenesis inhibition. Int J Cancer. 2008;122(3):664-671.
24. Matsui J, Funahashi Y, Uenaka T, Watanabe T, Tsuruoka A, Asada M. Multi-kinase inhibitor E7080 suppresses lymph node and lung metastases of human mammary breast tumor MDA-MB-231 via inhibition of vascular endothelial growth factorreceptor (VEGF-R) 2 and VEGF-R3 kinase. Clin Cancer Res. 2008;14(17):5459-5465.
25. Schlumberger M, Tahara M, Wirth LJ, et al. Lenvatinib versus placebo in radioiodine- refractory thyroid cancer. N Engl J Med. 2015;372(7):621-630.
26. Leboulleux S, Bastholt L, Krause T, et al. Vandetanib in locally advanced or metastatic differentiated thyroid cancer: a randomised, double-blind, phase 2 trial. Lancet Oncol. 2012;13(9):897-905.
27. A randomised, double-blind, placebo-controlled, multi-centre phase III study to assess the efficacy and safety of vandetanib (CAPRELSA) 300 mg in patients with differentiated thyroid cancer that is either locally advanced or metastatic who are refractory or unsuitable for radioiodine (RAI) therapy. Trial number NCT01876784. ClinicalTrials.gov Website. https://clinicaltrials.gov/show/NCT01876784. Updated June 26, 2015. Accessed July 22, 2015.
28. Bible KC, Suman VJ, Molina JR, et al; Endocrine Malignancies Disease Oriented Group; Mayo Clinic Cancer Center; Mayo Phase 2 Consortium. Efficacy of pazopanib in progressive, radioiodine-refractory, metastatic differentiated thyroid cancers: results of a phase 2 consortium study. Lancet Oncol. 2010;11(10):962-972.
29. Kim DW, Jo YS, Jung HS, et al. An orally administered multitarget tyrosine kinase inhibitor, SU11248, is a novel potent inhibitor of thyroid oncogenic RET/papillary thyroid cancer kinases. J Clin Endocrinol Metab. 2006;91(10):4070-4076.
30. Dawson SJ, Conus NM, Toner GC, et al. Sustained clinical responses to tyrosine kinase inhibitor sunitinib in thyroid carcinoma. Anticancer Drugs. 2008;19(5):547-552.
31. Carter SK, Blum RH. New chemotherapeutic agents—bleomycin and adriamycin. CA Cancer J Clin. 1974;24(6):322-331.
32. Hundahl SA, Fleming ID, Fremgen AM, Menck HR. A National Cancer Data Base report on 53,856 cases of thyroid carcinoma treated in the U.S., 1985-1995 [see comments]. Cancer. 1998;83(12):2638-2648.
33. Lakhani VT, You YN, Wells SA. The multiple endocrine neoplasia syndromes. Annu Rev Med. 2007;58:253-265.
34. Martins RG, Rajendran JG, Capell P, Byrd DR, Mankoff DA. Medullary thyroid cancer: options for systemic therapy of metastatic disease? J Clin Oncol. 2006;24(11):1653-1655.
35. American Thyroid Association Guidelines Task Force; Kloos RT, Eng C, Evans DB, et al. Medullary thyroid cancer: management guidelines of the American Thyroid Association. Thyroid. 2009;19(6):565-612.
36. Roman S, Lin R, Sosa JA. Prognosis of medullary thyroid carcinoma: demographic, clinical, and pathologic predictors of survival in 1252 cases. Cancer. 2006;107(9):2134-2142.
37. Modigliani E, Cohen R, Campos JM, et al. Prognostic factors for survival and for biochemical cure in medullary thyroid carcinoma: results in 899 patients. The GETC Study Group. Groupe d’étude des tumeurs à calcitonine. Clin Endocrinol (Oxf). 1998;48(3):265-273.
38. Donis-Keller H, Dou S, Chi D, et al. Mutations in the RET proto-oncogene are associated with MEN 2A and FMTC. Hum Mol Genet. 1993;2(7):851-856.
39. Mulligan LM, Kwok JB, Healey CS, et al. Germ-line mutations of the RET protooncogene in multiple endocrine neoplasia type 2A. Nature. 363(6428):458-460.
40. Carlson KM, Dou S, Chi D, et al. Single missense mutation in the tyrosine kinase catalytic domain of the RET protooncogene is associated with multiple endocrine neoplasia type 2B. Proc Natl Acad Sci USA. 1994;91(4):1579-1583.
41. Marsh DJ, Learoyd DL, Andrew SD, et al. Somatic mutations in the RET protooncogene in sporadic medullary thyroid carcinoma. Clin Endocrinol (Oxf). 1996;44(3):249-257.
42. Elisei R, Cosci B, Romei C, et al. Prognostic significance of somatic RET oncogene mutations in sporadic medullary thyroid cancer: a 10-year follow-up study. J Clin Endocrinol Metab. 2008;93(3):682-687.
43. Carlomagno F, Vitagliano D, Guida T, et al. ZD6474, an orally available inhibitor of KDR tyrosine kinase activity, efficiently blocks oncogenic RET kinases. Cancer Res. 2002;62(24):7284-7290.
44. Carlomagno F, Anaganti S, Guida T, et al. BAY 43-9006 inhibition of oncogenic RET mutants. J Natl Cancer Inst. 2006;98(5):326-334.
45. Santoro M, Carlomagno F. Drug insight: small molecule inhibitors of protein kinases in the treatment of thyroid cancer. Nat Clin Pract Endocrinol Metab. 2006;2(1):42-52.
46. Rodríguez-Antona C, Pallares J, Montero-Conde C, et al. Overexpression and activation of EGFR and VEGFR2 in medullary thyroid carcinomas is related to metastasis. Endocr Relat Cancer. 2010;17(1):7-16.
47. U.S. Food and Drug Administration. FDA approves new treatment for rare form of thyroid cancer [press release]. Silver Spring, MD: U.S. Food and Drug Administration; April 6, 2011.
48. Wells SA Jr, Robinson BG, Gagel RF, et al. Vandetanib in patients with locally advanced or metastatic medullary thyroid cancer: a randomized, double-blind phase III trial. J Clin Oncol. 2012;30(2):134-141.
49. U.S. Food and Drug Administration. FDA approves Cometriq to treat rare type of thyroid cancer [press release]. Silver Spring, MD: U.S. Food and Drug Administration; November 29, 2012.
50. Cui JJ. Inhibitors targeting hepatocyte growth factor receptor and their potential therapeutic applications. Expert Opin Ther Pat. 2007;17(9):1035-1045.
51. Schoffski P, Elisei R, Müller S, et al. An international, double-blind, randomized, placebo-controlled phase III trial (EXAM) of cabozantinib (XL184) in medullary thyroid carcinoma (MTC) patients (pts) with documented RECIST progression at baseline. J Clin Oncol. 2012;30(suppl):5508.
52. Kober F, Hermann M, Handler A, Krotla G. Effect of sorafenib in symptomatic metastatic medullary thyroid cancer. J Clin Oncol. 2007;25(18S):14065.
53. Lam ET, Ringel MD, Kloos RT, et al. Phase II clinical trial of sorafenib in metastatic medullary thyroid cancer. J Clin Oncol. 2010;28(14):2323-2330.
54. Hong DS, Sebti SM, Newman RA, et al. Phase I trial of a combination of the multikinase inhibitor sorafenib and the farnesyltransferase inhibitor tipifarnib in advanced malignancies. Clin Cancer Res. 2009;15(22):7061-7068.
55. Kelleher FC, McDermott R. Response to sunitinib in medullary thyroid cancer. Ann Intern Med. 2008;148(7):567.
56. Carr LL, Mankoff DA, Goulart BH, et al. Phase II study of daily sunitinib in FDGPET- positive, iodine-refractory differentiated thyroid cancer and metastatic medullary carcinoma of the thyroid with functional imaging correlation. Clin Cancer Res. 2010;16(21):5260-5268.
57. Bible KC, Suman VJ, Molina JR, et al; Endocrine Malignancies Disease Oriented Group; Mayo Clinic Cancer Center; Mayo Phase 2 Consortium. A multicenter phase 2 trial of pazopanib in metastatic and progressive medullary thyroid carcinoma: MC057H. J Clin Endocrinol Metab. 2014;99(5):1687-1693.
58. Ball DW. Medullary thyroid cancer: monitoring and therapy. Endocrinol Metab Clin North Am. 2007;36(3):823-837, viii.
59. Nocera M, Baudin E, Pellegriti G, Cailleux AF, Mechelany-Corone C, Schlumberger M. Treatment of advanced medullary thyroid cancer with an alternating combination of doxorubicin-streptozocin and 5 FU-dacarbazine. Groupe d’Etude des Tumeurs à Calcitonine (GETC). Br J Cancer. 2000;83(6):715-718.
60. Shimaoka K, Schoenfeld DA, DeWys WD, Creech RH, DeConti R. A randomized trial of doxorubicin versus doxorubicin plus cisplatin in patients with advanced thyroid carcinoma. Cancer. 1985;56(9):2155-2160.
Midterm Follow-Up of Metal-Backed Glenoid Components in Anatomical Total Shoulder Arthroplasties
Total shoulder arthroplasty (TSA) is being performed with increasing frequency. According to recent data, the number of TSAs performed annually increased 2.5-fold from 2000 to 2008.1 As more are performed, the need for improved implant survival will increase as well. In particular, advances in glenoid survivorship will be a primary focus. Previous experience has demonstrated that the glenoid component is the most common source of loosening and failure, and glenoid loosening has been documented in 33% to 44% of arthroplasties, with the rate of radiographically lucent lines even higher.2-5 Thus, a correlation between increasing incidence of procedures and high rates of glenoid loosening represents the potential for a significant increase in the number of future revisions. A recent report from Germany indicated that TSA had a 3-fold higher relative burden of revision than hemiarthroplasty.6
Ingrowth metal-backed glenoid components offer the theoretical advantage of bone growth directly into the prosthesis with a single host–prosthesis interface. Use of a novel tantalum glenoid may avoid the stress-shielding, component-stiffness, dissociation, and backside-wear issues that have produced the high failure rates of conventional metal-backed glenoids. According to the literature, the multiple different-style cementless glenoids being used have had unpredictable outcomes and demonstrated an increased need for revisions.7-11
In this article, we present a case series of midterm radiographic and clinical outcomes for TSAs using porous tantalum glenoid components. Our goals were to further understanding of survivorship and complications associated with ingrowth glenoid components and to demonstrate the differences that may occur with use of tantalum.
Materials and Methods
Data were examined for all TSAs performed at a single institution between 2004 and 2013. Before reviewing the data, we obtained approval from the hospital institutional review board. Our retrospective chart review identified all patients who underwent TSA using a tantalum ingrowth glenoid component. Exclusion criteria included revision arthroplasty, use of a non-tantalum glenoid, reverse shoulder arthroplasty, and conversion from hemiarthroplasty to TSA. Twelve shoulders (11 patients) were identified. We obtained patient consent to examine the data collected, and patients were reexamined if they had not been seen within the past 12 months. Figures 1 and 2 show the preoperative radiographs.


The TSAs were performed by 2 fellowship-trained shoulder surgeons using glenoid components with porous tantalum anchors (Zimmer). Indications for this procedure were age under 60 years, no prior surgery, and glenoid morphology allowing for version correction without bone grafting. Patients with severe posterior erosion that required bone graft or with a dysplastic glenoid were not indicated for this glenoid implant.
In each case, the anesthesia team placed an indwelling interscalene catheter, and then the surgery was performed with the patient under deep sedation. The beach-chair position and a deltopectoral approach were used, and biceps tendon tenodesis was performed. The subscapularis was elevated with a lesser tuberosity osteotomy and was repaired with nonabsorbable braided suture at the end of the case. During glenoid implantation, the periphery of the polyethylene was cemented. This is consistent with the approved method of implantation for this device. Closed suction drainage was used. After surgery, the patient was restricted to no weight-bearing. During the first 6 weeks, passive forward elevation was allowed to 130° and external rotation to 30°. Active and active-assisted range of motion was started at 6 weeks, and muscular strengthening was allowed 12 weeks after surgery.
We analyzed standard radiographs at yearly intervals for trabecular bony architecture and lucency surrounding the tantalum anchor of the glenoid. Before and after surgery, American Shoulder and Elbow Surgeons (ASES) scores and active forward elevation (AFE) and active external rotation (AER) measurements were recorded. These measurements served as endpoints of analysis.
Results
Twelve shoulders (11 patients) were identified and examined. Mean follow-up was 20 months (range, 6-84 months). In all cases, annual standard radiographs showed bony trabeculae adjacent to the tantalum anchor without lucency. There was no sign of glenoid loosening in any patient.
ASES scores and AFE and AER measurements were obtained with physical examinations and compared with t tests. ASES scores, available for 8 patients, increased from 32 before surgery to 85 after surgery (P < .01). Mean AFE increased from 117° to 159° (P < .01), and mean AER increased from 23° to 53° (P < .01). Figures 3 and 4 show the postoperative radiographs, and the Table highlights the ASES and range-of-motion data.


Discussion
Data for the 12 TSAs followed in this series showed promising outcomes for cementless ingrowth glenoid components. Much as with other data in the literature, there were significant improvements in ASES scores, AFE, and AER. What differs from the majority of available data is the survivorship and lack of radiolucent lines on follow-up radiographs.
Boileau and colleagues7 randomized 39 patients (40 shoulders) to either a cemented all-polyethylene glenoid or a cementless metal-backed glenoid component. Although the metal-backed glenoid components had a significantly lower rate of radiolucent lines, the metal-backed glenoids had a significantly higher rate of loosening. The authors subsequently abandoned use of uncemented metal-backed glenoid components. Taunton and colleagues8 reviewed 83 TSAs with a metal-backed bone ingrowth glenoid component. In 74 cases, the preoperative diagnosis was primary osteoarthritis. Mean clinical follow-up was 9.5 years. During follow-up, there were improvements in pain, forward elevation, and external rotation. Radiographic glenoid loosening was noted in 33 shoulders; 9 required revision for glenoid loosening. Both series demonstrated a high rate of revisions for cementless glenoid components.
Similar revision difficulties were noted by Montoya and colleagues.9 In their series of 65 TSAs performed for primary osteoarthritis, a cementless glenoid component was implanted. There were significant improvements in Constant scores, forward flexion, external rotation, and abduction but also an 11.3% revision rate noted at 68 months (mean follow-up). Glenoid revisions were required predominantly in patients with eccentric preoperative glenoid morphology. Lawrence and colleagues10 used a cementless ingrowth glenoid component in 21 shoulder arthroplasties performed for glenoid bone loss (13) or revision (8). They noted a high rate of revisions but good outcomes for the cases not revised. In both studies, there was a high rate of revision for glenoid loosening but also a tendency for revisions to be correlated with more challenging clinical applications.
Wirth and colleagues11 followed 44 TSAs using a minimally cemented ingrowth glenoid component. There were significant improvements in ASES scores, Simple Shoulder Test scores, and visual analog scale pain ratings. No revisions for glenoid loosening were noted. The implants were thought to provide durable outcomes at a mean follow-up of 4 years. These results were similar to those appreciated in the present study. In both series, the revision rate was much lower than described in the literature, and there were predictable improvements in pain and active motion.
Our study had several limitations: small number of patients, no comparison group, and relatively short follow-up. More long-term data are needed to appropriately compare cemented and uncemented glenoid components. In addition, it is difficult to compare our group of patients with those described in the literature, as the implants used differ. Despite these limitations, our data suggest that tantalum ingrowth glenoid components provide predictable and sustainable outcomes in TSA. With longer-term follow-up, tantalum ingrowth glenoids may demonstrate a durable and reliable alternative to cemented glenoid components.
1. Kim SH, Wise BL, Zhang Y, Szabo RM. Increasing incidence of shoulder arthroplasty in the United States. J Bone Joint Surg Am. 2011;93(24):2249-2254.
2. Torchia ME, Cofield RH, Settergren CR. Total shoulder arthroplasty with the Neer prosthesis: long-term results. J Shoulder Elbow Surg. 1997;6(6):495-505.
3. Kasten P, Pape G, Raiss P, et al. Mid-term survivorship analysis of a shoulder replacement with a keeled glenoid and a modern cementing technique. J Bone Joint Surg Br. 2010;92(3):387-392.
4. Bohsali KI, Wirth MA, Rockwood CA Jr. Complications of total shoulder arthroplasty. J Bone Joint Surg Am. 2006;88(10):2279-2292.
5. Neer CS 2nd, Watson KC, Stanton FJ. Recent experience in total shoulder replacement. J Bone Joint Surg Am. 1982;64(3):319-337.
6. Hollatz MF, Stang A. Nationwide shoulder arthroplasty rates and revision burden in Germany: analysis of the national hospitalization data 2005 to 2006. J Shoulder Elbow Surg. 2014;23(11):e267-e274.
7. Boileau P, Avidor C, Krishnan SG, Walch G, Kempf JF, Molé D. Cemented polyethylene versus uncemented metal-backed glenoid components in total shoulder arthroplasty: a prospective, double-blind, randomized study. J Shoulder Elbow Surg. 2002;11(4):351-359.
8. Taunton MJ, McIntosh AL, Sperling JW, Cofield RH. Total shoulder arthroplasty with a metal-backed, bone-ingrowth glenoid component. Medium to long-term results. J Bone Joint Surg Am. 2008;90(10):2180-2188.
9. Montoya F, Magosch P, Scheiderer B, Lichtenberg S, Melean P, Habermeyer P. Midterm results of a total shoulder prosthesis fixed with a cementless glenoid component. J Shoulder Elbow Surg. 2013;22(5):628-635.
10. Lawrence TM, Ahmadi S, Sperling JW, Cofield RH. Fixation and durability of a bone-ingrowth component for glenoid bone loss. J Shoulder Elbow Surg. 2012;21(12):1764-1769.
11. Wirth MA, Loredo R, Garcia G, Rockwood CA Jr, Southworth C, Iannotti JP. Total shoulder arthroplasty with an all-polyethylene pegged bone-ingrowth glenoid component: a clinical and radiographic outcome study. J Bone Joint Surg Am. 2012;94(3):260-267.
Total shoulder arthroplasty (TSA) is being performed with increasing frequency. According to recent data, the number of TSAs performed annually increased 2.5-fold from 2000 to 2008.1 As more are performed, the need for improved implant survival will increase as well. In particular, advances in glenoid survivorship will be a primary focus. Previous experience has demonstrated that the glenoid component is the most common source of loosening and failure, and glenoid loosening has been documented in 33% to 44% of arthroplasties, with the rate of radiographically lucent lines even higher.2-5 Thus, a correlation between increasing incidence of procedures and high rates of glenoid loosening represents the potential for a significant increase in the number of future revisions. A recent report from Germany indicated that TSA had a 3-fold higher relative burden of revision than hemiarthroplasty.6
Ingrowth metal-backed glenoid components offer the theoretical advantage of bone growth directly into the prosthesis with a single host–prosthesis interface. Use of a novel tantalum glenoid may avoid the stress-shielding, component-stiffness, dissociation, and backside-wear issues that have produced the high failure rates of conventional metal-backed glenoids. According to the literature, the multiple different-style cementless glenoids being used have had unpredictable outcomes and demonstrated an increased need for revisions.7-11
In this article, we present a case series of midterm radiographic and clinical outcomes for TSAs using porous tantalum glenoid components. Our goals were to further understanding of survivorship and complications associated with ingrowth glenoid components and to demonstrate the differences that may occur with use of tantalum.
Materials and Methods
Data were examined for all TSAs performed at a single institution between 2004 and 2013. Before reviewing the data, we obtained approval from the hospital institutional review board. Our retrospective chart review identified all patients who underwent TSA using a tantalum ingrowth glenoid component. Exclusion criteria included revision arthroplasty, use of a non-tantalum glenoid, reverse shoulder arthroplasty, and conversion from hemiarthroplasty to TSA. Twelve shoulders (11 patients) were identified. We obtained patient consent to examine the data collected, and patients were reexamined if they had not been seen within the past 12 months. Figures 1 and 2 show the preoperative radiographs.
The TSAs were performed by 2 fellowship-trained shoulder surgeons using glenoid components with porous tantalum anchors (Zimmer). Indications for this procedure were age under 60 years, no prior surgery, and glenoid morphology allowing for version correction without bone grafting. Patients with severe posterior erosion that required bone graft or with a dysplastic glenoid were not indicated for this glenoid implant.
In each case, the anesthesia team placed an indwelling interscalene catheter, and then the surgery was performed with the patient under deep sedation. The beach-chair position and a deltopectoral approach were used, and biceps tendon tenodesis was performed. The subscapularis was elevated with a lesser tuberosity osteotomy and was repaired with nonabsorbable braided suture at the end of the case. During glenoid implantation, the periphery of the polyethylene was cemented. This is consistent with the approved method of implantation for this device. Closed suction drainage was used. After surgery, the patient was restricted to no weight-bearing. During the first 6 weeks, passive forward elevation was allowed to 130° and external rotation to 30°. Active and active-assisted range of motion was started at 6 weeks, and muscular strengthening was allowed 12 weeks after surgery.
We analyzed standard radiographs at yearly intervals for trabecular bony architecture and lucency surrounding the tantalum anchor of the glenoid. Before and after surgery, American Shoulder and Elbow Surgeons (ASES) scores and active forward elevation (AFE) and active external rotation (AER) measurements were recorded. These measurements served as endpoints of analysis.
Results
Twelve shoulders (11 patients) were identified and examined. Mean follow-up was 20 months (range, 6-84 months). In all cases, annual standard radiographs showed bony trabeculae adjacent to the tantalum anchor without lucency. There was no sign of glenoid loosening in any patient.
ASES scores and AFE and AER measurements were obtained with physical examinations and compared with t tests. ASES scores, available for 8 patients, increased from 32 before surgery to 85 after surgery (P < .01). Mean AFE increased from 117° to 159° (P < .01), and mean AER increased from 23° to 53° (P < .01). Figures 3 and 4 show the postoperative radiographs, and the Table highlights the ASES and range-of-motion data.
Discussion
Data for the 12 TSAs followed in this series showed promising outcomes for cementless ingrowth glenoid components. Much as with other data in the literature, there were significant improvements in ASES scores, AFE, and AER. What differs from the majority of available data is the survivorship and lack of radiolucent lines on follow-up radiographs.
Boileau and colleagues7 randomized 39 patients (40 shoulders) to either a cemented all-polyethylene glenoid or a cementless metal-backed glenoid component. Although the metal-backed glenoid components had a significantly lower rate of radiolucent lines, the metal-backed glenoids had a significantly higher rate of loosening. The authors subsequently abandoned use of uncemented metal-backed glenoid components. Taunton and colleagues8 reviewed 83 TSAs with a metal-backed bone ingrowth glenoid component. In 74 cases, the preoperative diagnosis was primary osteoarthritis. Mean clinical follow-up was 9.5 years. During follow-up, there were improvements in pain, forward elevation, and external rotation. Radiographic glenoid loosening was noted in 33 shoulders; 9 required revision for glenoid loosening. Both series demonstrated a high rate of revisions for cementless glenoid components.
Similar revision difficulties were noted by Montoya and colleagues.9 In their series of 65 TSAs performed for primary osteoarthritis, a cementless glenoid component was implanted. There were significant improvements in Constant scores, forward flexion, external rotation, and abduction but also an 11.3% revision rate noted at 68 months (mean follow-up). Glenoid revisions were required predominantly in patients with eccentric preoperative glenoid morphology. Lawrence and colleagues10 used a cementless ingrowth glenoid component in 21 shoulder arthroplasties performed for glenoid bone loss (13) or revision (8). They noted a high rate of revisions but good outcomes for the cases not revised. In both studies, there was a high rate of revision for glenoid loosening but also a tendency for revisions to be correlated with more challenging clinical applications.
Wirth and colleagues11 followed 44 TSAs using a minimally cemented ingrowth glenoid component. There were significant improvements in ASES scores, Simple Shoulder Test scores, and visual analog scale pain ratings. No revisions for glenoid loosening were noted. The implants were thought to provide durable outcomes at a mean follow-up of 4 years. These results were similar to those appreciated in the present study. In both series, the revision rate was much lower than described in the literature, and there were predictable improvements in pain and active motion.
Our study had several limitations: small number of patients, no comparison group, and relatively short follow-up. More long-term data are needed to appropriately compare cemented and uncemented glenoid components. In addition, it is difficult to compare our group of patients with those described in the literature, as the implants used differ. Despite these limitations, our data suggest that tantalum ingrowth glenoid components provide predictable and sustainable outcomes in TSA. With longer-term follow-up, tantalum ingrowth glenoids may demonstrate a durable and reliable alternative to cemented glenoid components.
1. Kim SH, Wise BL, Zhang Y, Szabo RM. Increasing incidence of shoulder arthroplasty in the United States. J Bone Joint Surg Am. 2011;93(24):2249-2254.
2. Torchia ME, Cofield RH, Settergren CR. Total shoulder arthroplasty with the Neer prosthesis: long-term results. J Shoulder Elbow Surg. 1997;6(6):495-505.
3. Kasten P, Pape G, Raiss P, et al. Mid-term survivorship analysis of a shoulder replacement with a keeled glenoid and a modern cementing technique. J Bone Joint Surg Br. 2010;92(3):387-392.
4. Bohsali KI, Wirth MA, Rockwood CA Jr. Complications of total shoulder arthroplasty. J Bone Joint Surg Am. 2006;88(10):2279-2292.
5. Neer CS 2nd, Watson KC, Stanton FJ. Recent experience in total shoulder replacement. J Bone Joint Surg Am. 1982;64(3):319-337.
6. Hollatz MF, Stang A. Nationwide shoulder arthroplasty rates and revision burden in Germany: analysis of the national hospitalization data 2005 to 2006. J Shoulder Elbow Surg. 2014;23(11):e267-e274.
7. Boileau P, Avidor C, Krishnan SG, Walch G, Kempf JF, Molé D. Cemented polyethylene versus uncemented metal-backed glenoid components in total shoulder arthroplasty: a prospective, double-blind, randomized study. J Shoulder Elbow Surg. 2002;11(4):351-359.
8. Taunton MJ, McIntosh AL, Sperling JW, Cofield RH. Total shoulder arthroplasty with a metal-backed, bone-ingrowth glenoid component. Medium to long-term results. J Bone Joint Surg Am. 2008;90(10):2180-2188.
9. Montoya F, Magosch P, Scheiderer B, Lichtenberg S, Melean P, Habermeyer P. Midterm results of a total shoulder prosthesis fixed with a cementless glenoid component. J Shoulder Elbow Surg. 2013;22(5):628-635.
10. Lawrence TM, Ahmadi S, Sperling JW, Cofield RH. Fixation and durability of a bone-ingrowth component for glenoid bone loss. J Shoulder Elbow Surg. 2012;21(12):1764-1769.
11. Wirth MA, Loredo R, Garcia G, Rockwood CA Jr, Southworth C, Iannotti JP. Total shoulder arthroplasty with an all-polyethylene pegged bone-ingrowth glenoid component: a clinical and radiographic outcome study. J Bone Joint Surg Am. 2012;94(3):260-267.

Fingertip Amputation Treatment: A Survey Study
Finger injuries are common, representing an estimated 3 million emergency department visits per year in the United States, with 44% of these diagnosed as lacerations.1 Amputations of the finger (partial and complete) in non-work-related accidents alone are estimated at 30,000 per year.1 The fingertip is a highly specialized structure that contributes to precision function of the hand through tactile feedback and fine motor control as well as hand aesthetics. An injury can compromise a variety of fingertip structures, including the distal phalanx, which provides length and structural support; the fingernail, germinal matrix, and sterile matrix, which protect the fingertip and function as tools; and the volar skin pad, which is important for sensation and fine motor activity.
There is considerable debate regarding optimal management of fingertip amputations, and to date there have been no prospective, randomly controlled trials to guide treatment.2 Injury characteristics, amputation levels, and patient priorities all contribute to management decisions. Treatment goals are to maintain length when possible; to provide stable, supple, and sensate skin coverage; to ensure the nail plate regrows without complication; and to maintain normal overall finger shape and cosmesis. In addition, a simple, cost-effective treatment with short recovery time and no donor-site morbidity is desired.
Treatment recommendations are wide-ranging, and evidence-based literature is sparse. About 30 years ago, 2 retrospective comparative studies found no difference in outcomes between simpler treatments (primary closure, secondary wound healing) and various operative strategies.3,4 Since then, most of the scientific studies have been retrospective noncomparative case series, all reporting good to excellent results.5-17 Investigators generally implied superior results of a studied procedure over those of more conservative treatments. Recommended treatments include secondary wound healing, simple flaps, staged flaps, pedicle flaps, allograft and autograft coverage, composite grafting, and replantation, for all levels of fingertip injury.
Given our surgical advances, improved techniques, and accumulating experience, we may have expected better outcomes with newer and more complex reconstructive efforts. Unfortunately, in a recent review of 53 fingertip injuries treated with a reconstructive procedure, bone shortening with closure, or secondary healing, Wang and colleagues18 found no discernible differences in outcomes at 4.5-year follow-up. They questioned whether complex reconstructive procedures are worth the time, expense, and risk. In the absence of prospective, comparative studies, surgeons must rely on anecdotal evidence (including predominantly level IV evidence), training bias, previous experience, and the prevailing common wisdom.
Toward that end, we became interested in identifying treatment preferences for fingertip amputations. We conducted a study to better understand how surgeon and patient factors influence the treatment preferences for distal fingertip amputations among a cross section of US and international hand surgeons. We hypothesized that hand surgeons’ treatment preferences would be varied and influenced by surgeon and patient demographics.
Materials and Methods
An online multiple-choice survey was created and powered by Constant Contact. The survey consisted of 6 surgeon demographic questions; 5 treatment preference questions regarding patient age, sex, occupation, and germinal matrix management; and 5 clinical scenarios based on Allen levels 2, 3 (with and without exposed distal phalanx), and 4 and volar oblique middle-finger amputations. The Allen classification designates level 2 injuries as those involving only the distal pulp and nail.19 Level 3 injuries also involve the terminal distal phalanx, and level 4 injuries extend to the lunula. The survey questions are listed in the Appendix. For the clinical scenario questions, treatment choices included wound care, skeletal shortening and closure, composite graft, autograft, allograft, V-Y/Kutler flap, advancement flap, thenar flap, cross-finger flap, pedicle and homodigital flap, replantation, and other.
An email invitation was sent to members of the American Association for Hand Surgery (AAHS). The survey was also submitted to personal contacts of international hand societies named on the AAHS website to expand the international response. A reminder email was sent 1 week after the original invitation. The survey was closed 5 weeks later, and the responses were analyzed with all non-US hand surgeons grouped collectively as an international group, compared with the US group. Institutional review board approval was not needed for this survey study.
Statistics
A generalized linear regression model was used to implement logistic regression with random effects for question and respondent. This approach accounts for multiple observations from the same respondent, assuming that both respondent and question are random samples from a larger population. The model estimated the probability that a given surgical approach (eg, skeletal shortening, wound care) would be selected, based on the predictors of the US versus international respondent, time in practice, practice type, and whether the fingertip was available. The model returned adjusted odds ratios (ORs) for each predictor, controlling for all the others. By convention, P < .05 was considered significant. No attempt was made to prune the model of nonsignificant factors. Analyses were performed using the lme4 package on the R statistical platform (R Foundation for Statistical Computing).
Results
One hundred ninety-eight responses were recorded. Of the 1054 AAHS members invited to take the survey, 174 (US, international) responded (17% response rate). One hundred twenty-three responses and 62% of the total were generated from US hand surgeons. Fifty-eight percent of US responses were from the Mid-South, Midwest, or Mid-Atlantic region. Fifty-seven percent of international responses were from Brazil and Europe. Respondents’ demographic data are listed in Tables 1 and 2.
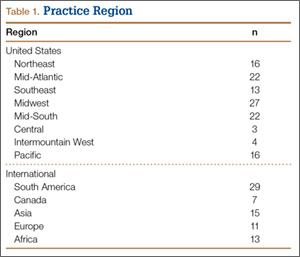
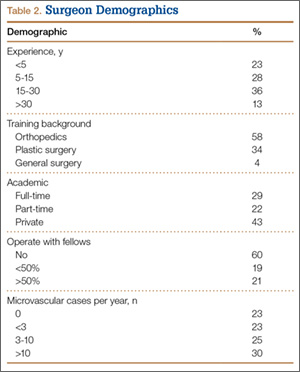
Responses to the 5 clinical scenarios showed a wide variation in treatment preferences. The top 6 preferred treatment selections for an acute, clean long-finger amputation in a healthy 40-year-old office worker are shown in Figures 1 to 5. When surgeons who preferred replant were asked what they would do if the amputated part was not available, they indicated flap coverage more often than less complex treatments, such as skeletal shortening/primary closure or wound care.
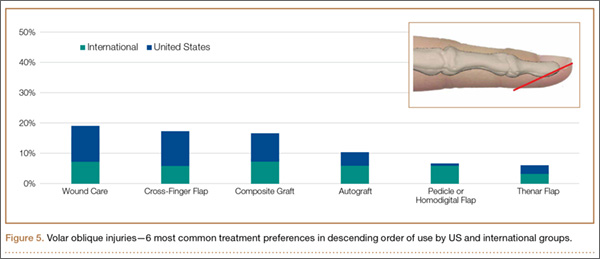
There were statistically significant differences in treatment preferences between US and international hand surgeons when controlling for all other demographic variables. Adjusted ORs and their confidence intervals (CIs) for the aggregate clinical scenarios are presented in a forest plot in Figure 6. Figure 4 shows that US surgeons were more likely to choose wound care (OR, 3.6; P < .0004) and less likely to attempt a replant (OR, 0.01; P < .0001). US surgeons were also less likely to use a pedicle or homodigital island flap when the amputated fingertip was both available (OR, 0.04; P = .039) and unavailable (OR, 0.47; Ps = .029).
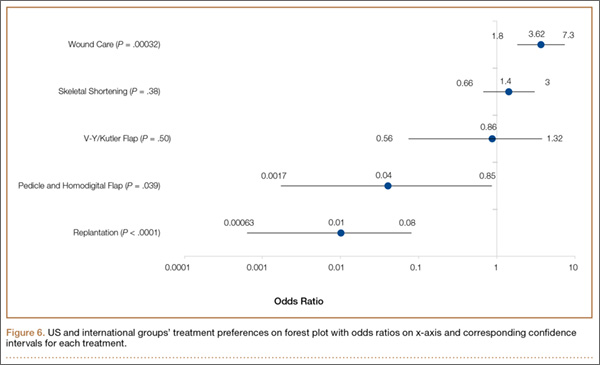
Among all respondents and across all clinical scenarios, skeletal shortening with closure was favored among hand surgeons in practice less than 5 years compared with those in practice longer (OR, 2.11; 95% CI, 1.36-3.25; P = .0008). Similarly, surgeons with more than 30 years of experience were the least likely to favor wound care (OR, 0.2; 95% CI, 0.09-0.93; P = .037). Compared with orthopedic surgeons, plastic surgeons opted for wound care less often (OR, 0.44; 95% CI, 0.23-0.98; P = .018) and appeared to prefer replantation, but the difference was not statistically significant (OR, 8.86; 95% CI, 0.99-79.61; P = .054).
Replantation was less often chosen by private practice versus full-time academic surgeons (OR, 0.09; 95% CI, 0.01-0.91; P = .041.) Part-time academics were no more or less likely to perform replantation than full-time academics were (OR, 0.52; 95% CI, 0.05-5.41; P = .58). Of the 59 respondents who performed more than 10 microvascular cases a year, 18 (31%) chose replant for Allen level 4 amputations. In comparison, 9 (20%) of the 45 respondents who performed fewer than 3 microvascular cases a year chose replant for amputations at this level. Amount of time working with fellows did not affect treatment preferences.
Patient demographics (age, sex, occupation) also played a role in treatment decisions (Table 3). The most significant factors appeared to be age and occupation. Regarding age, 41% of respondents chose more complex procedures for patients younger than 15, and 62% chose less complex procedures for patients older than 70 years. Regarding occupation, 61% chose more complex procedures for professional musicians, and 60% chose less complex procedures for manual laborers. Sex did not influence clinical decisions for 78% of respondents. There was also substantial variation in both the indications for germinal matrix ablation and the frequency of sterile matrix transplant (Table 3).
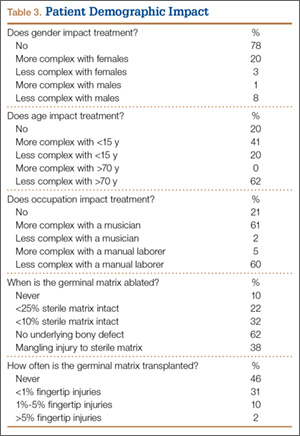
Discussion
Although there is a variety of treatment options and published treatment guidelines for distal fingertip amputations, few comparative studies support use of one treatment over another. In our experience, treatment decisions are based mainly on injury parameters, but surgeon preference and patient factors (age, sex, occupation) can also influence care. Our goal in this study was to better understand how surgeon and patient factors influence treatment preferences for distal fingertip amputations among a cross section of US and international hand surgeons. Our survey results showed lack of consensus among hand surgeons and highlighted several trends.
As expected, we found a wide range of treatment preferences for each clinical scenario queried, ranging from more simple treatments (eg, wound care) to more complex ones (eg, replantation). With patient parameters (age, profession, finger, acuity, injury type, tissue preservation, smoking status) standardized in the clinical scenarios, the treatment differences noted should reflect surgeon preference. However, other patient factors (eg, cultural differences, religious beliefs, surgeon setting, practice pattern, resource availability) that were not included in the clinical scenarios could also affect treatment preferences.
One particularly interesting finding was that international hand surgeons were 6.8 times more likely to replant a distal fingertip amputation. One possible explanation for this variation is the influence of cultural differences. For example, in East Asian countries, there can be a cultural stigma associated with loss of a fingertip, and therefore more of a desire on the part of the patient to restore the original finger.20,21 In addition, the international respondents were biased toward academic practices—which could skew the treatment preference toward replantation, as we found that academic surgeons were more inclined to replantation.
Our finding that replantation was more commonly preferred by academic versus private practice surgeons may suggest a training bias, an affinity for more complex or interesting procedures, or access to hospital equipment and staff, including residents and fellows, not usually found at smaller community hospitals, where private practice surgeons are more commonly based. Jazayeri and colleagues22 found that institutions specializing in microsurgery often produced better outcomes than nonspecializing institutions. Therefore, it is not surprising that private practice hand surgeons may less often opt to replant a distal fingertip amputation. It is also not surprising that plastic surgeons are more inclined to perform a replantation or flap coverage, as their training is more microsurgery-intensive and their practice more focused on aesthetics compared with the other specialists.
Distal fingertip replantation is accepted by most as technically demanding, but it seems that the additional effort and resources would be justified if the procedure provided a superior outcome. However, other factors, such as cost of treatment and length of recovery, should also be considered. Average replantation cost has been estimated to range from $7500 to $14,000, compared with $2800 for non-replantation-related care, and median stay is about 4 days longer for replantation-related care.23,24 These estimates do not include indirect costs, such as for postoperative rehabilitation, which is likely longer and more expensive, even in distal fingertip replantation. These disparities may not justify the outcome (of having a complete fingertip) if more conservative treatments yield similar results.17,18 In addition, there is the expected failure rate of limb replantation surgery. In analysis of the overall societal costs and benefits of larger upper extremity limb replantation, the loss of invested resources sustained with failed limb replantation may be outweighed by the benefit of another patient having a successful outcome. In the case of fingertip replantation, however, does the undefined benefit of the successful patient outcome outweigh the investment of resources lost in cases of replantation failure? Understandably, there is a need for more robust clinical outcome and cost-comparative evidence to better inform decisions regarding distal fingertip amputation.
We found that wound care and skeletal shortening with primary closure (particularly with Allen level 3 injuries) were preferred more by surgeons within the first 5 years of practice. This finding seems to imply a lack of experience or confidence on the part of younger surgeons performing more complex procedures, such as flap coverage. Conversely, this finding may indicate a shift in treatment principle based on recent literature suggesting equivalent outcomes with simpler procedures.17,18 Although our survey study did not provide an option for treatment combinations or staged procedures, several respondents wrote in that skeletal shortening supplemented with various types of autografts and allografts would be their preferred treatment.
Patient factors also play a significant role in clinical decisions. Age and profession seem to be important determinants, with more than 50% of respondents, on average, changing their treatment recommendation based on these 2 factors. A majority of respondents would perform a less involved procedure for a manual laborer, suggesting a quicker return to work is prioritized over a perceived improved clinical outcome. Interestingly, for patients younger than 15 years, the preference was divided, with 41% of surgeons opting for a more complex procedure. This suggests the importance of restoring anatomy in a younger patient, or the perceived decreased risk or failure rate with more involved treatment. Twenty percent preferred a less complex procedure in a younger patient, perhaps relying on the patient’s developmental potential for a good outcome or suggesting a concern for patient intolerance or compliance with complex surgery.
Nail plate regrowth can be a problem with fingertip amputations. Nail deformity is highly correlated with injury level, with amputations proximal to the lunula more likely to cause nail plate deformity.25,26 Jebson and colleagues27 recommended germinal matrix ablation for amputations proximal to the lunula. We found respondents often performed ablations for other indications, including injured or minimal remaining sterile matrix and lack of bony support for the sterile matrix. Forty-six percent of respondents had never performed sterile matrix transplant, which could indicate that they were unfamiliar with the technique or had donor-site concerns, or that postinjury nail deformities are uncommon, well tolerated, or treated along with other procedures, such as germinal matrix ablation.
Several weaknesses of this study must be highlighted. First, our response rate was smaller than desired. Although this work incorporated a large number of surgeon responses, nearly 200, the response rate was only 17%. In addition, although number of responses was likely adequate to show the diversity of opinion, the preferences and trends reported might not be representative of all hand surgeons. We could not perform a nonresponder analysis because of a lack of specific demographic data for the AAHS and international hand society members. However, AAHS has an approximate 50/50 mix of plastic and orthopedic surgeons, similar to our responder demographic, suggesting our smaller subset of responses might be representative of the whole. According to AAHS, a majority of its members are “academic” hand surgeons, so our results might not adequately reflect the preferences of community hand surgeons and ultimately might overstate the frequency of more complex treatments. Last, our international response was limited to a few countries. A larger, more broadly distributed response would provide a better understanding of regional preferences, which could shed light on the importance of cultural differences.
Variations in patient insurance status were not queried in this survey but might also affect treatment decisions. More involved, costly, and highly reimbursing procedures might be deemed reasonable options for a small perceived clinical benefit for insured patients.
When multiple digits or the thumb is injured, or there are other concomitant injuries, surgeons may alter their choice of intervention. In mangled extremities, preservation of salvageable functional units takes precedence over aesthetics and likely affects choice of treatment for the amputated fingertips. Similarly, multiple fingertip amputations, even if all at the same level, may be differently regarded than a solitary injury.
Conclusion
For distal fingertip amputations, there is little evidence supporting one approach over another. Without level I comparative data guiding treatment, anecdotal evidence and surgeon personal preferences likely contribute to the large variation noted in this survey. Our study results showed the disparity of fingertip treatment preferences among a cross section of US and international hand surgeons. More important, results underscored the need for a well-designed comparative study to determine the most effective treatments for distal fingertip amputations.
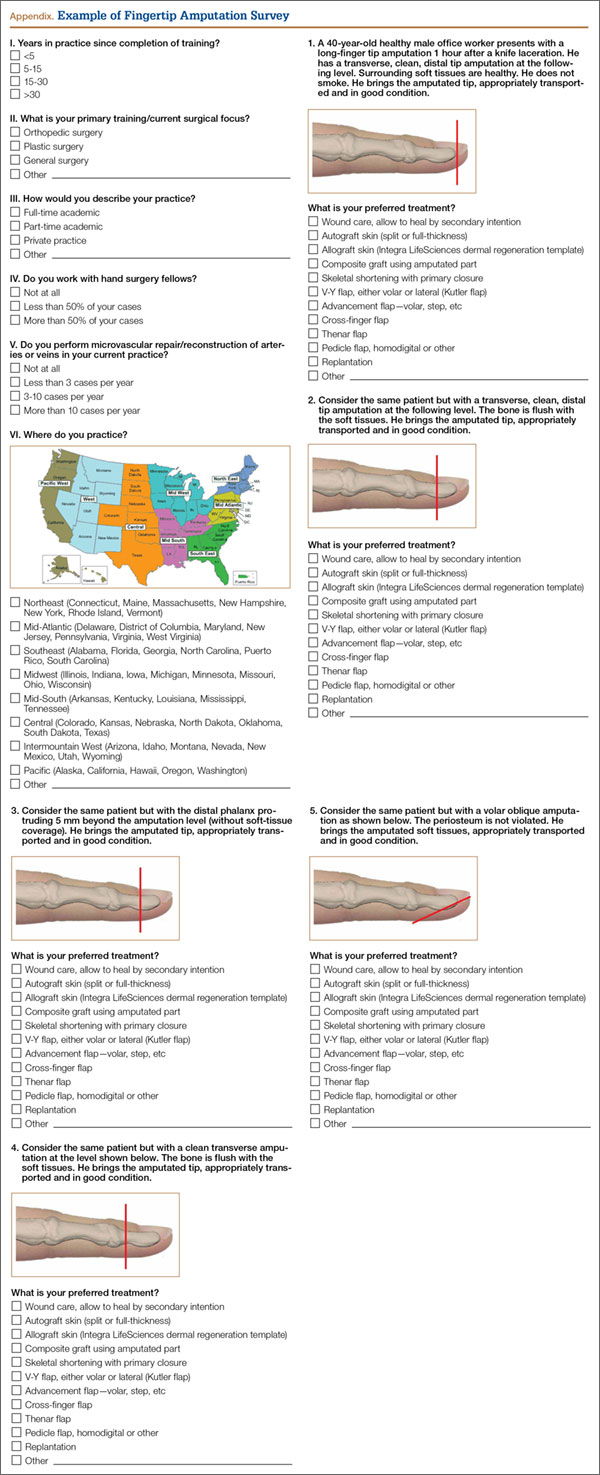
1. Conn JM, Annest JL, Ryan GW, Budnitz DS. Non-work-related finger amputations in the United States, 2001-2002. Ann Emerg Med. 2005;45(6):630-635.
2. Bickel KD, Dosanjh A. Fingertip reconstruction. J Hand Surg Am. 2008;33(8):1417-1419.
3. Söderberg T, Nyström Å, Hallmans G, Hultén J. Treatment of fingertip amputations with bone exposure. A comparative study between surgical and conservative treatment methods. Scand J Plast Reconstr Surg. 1983;17(2):147-152.
4. Braun M, Horton RC, Snelling CF. Fingertip amputation: review of 100 digits. Can J Surg. 1985;28(1):72-75.
5. Sammut D. Fingertip injuries. A review of indications and methods of management. Curr Orthop. 2002;16:271-285.
6. Mennen U, Wiese A. Fingertip injuries management with semi-occlusive dressing. J Hand Surg Br. 1993;18(4):416-422.
7. Atasoy E, Ioakimidis E, Kasdan ML, Kutz JE, Kleinert HE. Reconstruction of the amputated fingertip with a triangular volar flap. A new surgical procedure. J Bone Joint Surg Am. 1970;52(5):921-926.
8. Kutler W. A new method for finger tip amputation. J Am Med Assoc. 1947;133(1):29-30.
9. Takeishi M, Shinoda A, Sugiyama A, Ui K. Innervated reverse dorsal digital island flap for fingertip reconstruction. J Hand Surg Am. 2006;31(7):1094-1099.
10. Tuncali D, Barutcu AY, Gokrem S, Terzioglu A, Aslan G. The hatchet flap for reconstruction of fingertip amputations. Plast Reconstr Surg. 2006;117(6):1933-1939.
11. Teoh LC, Tay SC, Yong FC, Tan SH, Khoo DB. Heterodigital arterialized flaps for large finger wounds: results and indications. Plast Reconstr Surg. 2003;111(6):1905-1913.
12. Nishikawa H, Smith PJ. The recovery of sensation and function after cross-finger flaps for fingertip injury. J Hand Surg Br. 1992;17(1):102-107.
13. Rinker B. Fingertip reconstruction with the laterally based thenar flap: indications and long-term functional results. Hand. 2006;1(1):2-8.
14. Jung MS, Lim YK, Hong YT, Kim HN. Treatment of fingertip amputation in adults by palmar pocketing of the amputated part. Arch Plast Surg. 2012;39(4):404-410.
15. Venkatramani H, Sabapathy SR. Fingertip replantation: technical considerations and outcome analysis of 24 consecutive fingertip replantations. Indian J Plast Surg. 2011;44(2):237-245.
16. Chen SY, Wang CH, Fu JP, Chang SC, Chen SG. Composite grafting for traumatic fingertip amputation in adults: technique reinforcement and experience in 31 digits. J Trauma. 2011;70(1):148-153.
17. van den Berg WB, Vergeer RA, van der Sluis CK, Ten Duis HJ, Werker PM. Comparison of three types of treatment modalities on the outcome of fingertip injuries. J Trauma Acute Care Surg. 2012;72(6):1681-1687.
18. Wang K, Sears ED, Shauver MJ, Chung KC. A systematic review of outcomes of revision amputation treatment for fingertip amputations. Hand. 2013;8(2):139-145.
19. Allen MJ. Conservative management of finger tip injuries in adults. Hand. 1980;12(3):257-265.
20. Chen CT, Wei FC, Chen HC, Chuang CC, Chen HT, Hsu WM. Distal phalanx replantation. Microsurgery. 1994;15(1):77-82.
21. Kim WK, Lim JH, Han SK. Fingertip replantations: clinical evaluation of 135 digits. Plast Reconstr Surg. 1996;98(3):470-476.
22. Jazayeri L, Klausner JQ, Chang J. Distal digital replantation. Plast Reconstr Surg. 2013;132(5):1207-1217.
23. Hattori Y, Doi K, Sakamoto S, Yamasaki H, Wahegaonkar A, Addosooki A. Fingertip replantation. J Hand Surg Am. 2007;32(4):548-555.
24. Goldner RD, Stevanovic MV, Nunley JA, Urbaniak JR. Digital replantation at the level of the distal interphalangeal joint and the distal phalanx. J Hand Surg Am. 1989;14(2 pt 1):214-220.
25. Nishi G, Shibata Y, Tago K, Kubota M, Suzuki M. Nail regeneration in digits replanted after amputation through the distal phalanx. J Hand Surg Am. 1996;21(2):229-233.
26. Yamano Y. Replantation of the amputated distal part of the fingers. J Hand Surg Am. 1985;10(2):211-218.
27. Jebson PJ, Louis DS, Bagg M. Amputations. In: Wolfe SW, Pederson WC, Hotchkiss RN, Kozin SH, eds. Green’s Operative Hand Surgery. 6th ed. Philadelphia, PA: Churchill Livingstone; 2010:1885-1927.
Finger injuries are common, representing an estimated 3 million emergency department visits per year in the United States, with 44% of these diagnosed as lacerations.1 Amputations of the finger (partial and complete) in non-work-related accidents alone are estimated at 30,000 per year.1 The fingertip is a highly specialized structure that contributes to precision function of the hand through tactile feedback and fine motor control as well as hand aesthetics. An injury can compromise a variety of fingertip structures, including the distal phalanx, which provides length and structural support; the fingernail, germinal matrix, and sterile matrix, which protect the fingertip and function as tools; and the volar skin pad, which is important for sensation and fine motor activity.
There is considerable debate regarding optimal management of fingertip amputations, and to date there have been no prospective, randomly controlled trials to guide treatment.2 Injury characteristics, amputation levels, and patient priorities all contribute to management decisions. Treatment goals are to maintain length when possible; to provide stable, supple, and sensate skin coverage; to ensure the nail plate regrows without complication; and to maintain normal overall finger shape and cosmesis. In addition, a simple, cost-effective treatment with short recovery time and no donor-site morbidity is desired.
Treatment recommendations are wide-ranging, and evidence-based literature is sparse. About 30 years ago, 2 retrospective comparative studies found no difference in outcomes between simpler treatments (primary closure, secondary wound healing) and various operative strategies.3,4 Since then, most of the scientific studies have been retrospective noncomparative case series, all reporting good to excellent results.5-17 Investigators generally implied superior results of a studied procedure over those of more conservative treatments. Recommended treatments include secondary wound healing, simple flaps, staged flaps, pedicle flaps, allograft and autograft coverage, composite grafting, and replantation, for all levels of fingertip injury.
Given our surgical advances, improved techniques, and accumulating experience, we may have expected better outcomes with newer and more complex reconstructive efforts. Unfortunately, in a recent review of 53 fingertip injuries treated with a reconstructive procedure, bone shortening with closure, or secondary healing, Wang and colleagues18 found no discernible differences in outcomes at 4.5-year follow-up. They questioned whether complex reconstructive procedures are worth the time, expense, and risk. In the absence of prospective, comparative studies, surgeons must rely on anecdotal evidence (including predominantly level IV evidence), training bias, previous experience, and the prevailing common wisdom.
Toward that end, we became interested in identifying treatment preferences for fingertip amputations. We conducted a study to better understand how surgeon and patient factors influence the treatment preferences for distal fingertip amputations among a cross section of US and international hand surgeons. We hypothesized that hand surgeons’ treatment preferences would be varied and influenced by surgeon and patient demographics.
Materials and Methods
An online multiple-choice survey was created and powered by Constant Contact. The survey consisted of 6 surgeon demographic questions; 5 treatment preference questions regarding patient age, sex, occupation, and germinal matrix management; and 5 clinical scenarios based on Allen levels 2, 3 (with and without exposed distal phalanx), and 4 and volar oblique middle-finger amputations. The Allen classification designates level 2 injuries as those involving only the distal pulp and nail.19 Level 3 injuries also involve the terminal distal phalanx, and level 4 injuries extend to the lunula. The survey questions are listed in the Appendix. For the clinical scenario questions, treatment choices included wound care, skeletal shortening and closure, composite graft, autograft, allograft, V-Y/Kutler flap, advancement flap, thenar flap, cross-finger flap, pedicle and homodigital flap, replantation, and other.
An email invitation was sent to members of the American Association for Hand Surgery (AAHS). The survey was also submitted to personal contacts of international hand societies named on the AAHS website to expand the international response. A reminder email was sent 1 week after the original invitation. The survey was closed 5 weeks later, and the responses were analyzed with all non-US hand surgeons grouped collectively as an international group, compared with the US group. Institutional review board approval was not needed for this survey study.
Statistics
A generalized linear regression model was used to implement logistic regression with random effects for question and respondent. This approach accounts for multiple observations from the same respondent, assuming that both respondent and question are random samples from a larger population. The model estimated the probability that a given surgical approach (eg, skeletal shortening, wound care) would be selected, based on the predictors of the US versus international respondent, time in practice, practice type, and whether the fingertip was available. The model returned adjusted odds ratios (ORs) for each predictor, controlling for all the others. By convention, P < .05 was considered significant. No attempt was made to prune the model of nonsignificant factors. Analyses were performed using the lme4 package on the R statistical platform (R Foundation for Statistical Computing).
Results
One hundred ninety-eight responses were recorded. Of the 1054 AAHS members invited to take the survey, 174 (US, international) responded (17% response rate). One hundred twenty-three responses and 62% of the total were generated from US hand surgeons. Fifty-eight percent of US responses were from the Mid-South, Midwest, or Mid-Atlantic region. Fifty-seven percent of international responses were from Brazil and Europe. Respondents’ demographic data are listed in Tables 1 and 2.
Responses to the 5 clinical scenarios showed a wide variation in treatment preferences. The top 6 preferred treatment selections for an acute, clean long-finger amputation in a healthy 40-year-old office worker are shown in Figures 1 to 5. When surgeons who preferred replant were asked what they would do if the amputated part was not available, they indicated flap coverage more often than less complex treatments, such as skeletal shortening/primary closure or wound care.
There were statistically significant differences in treatment preferences between US and international hand surgeons when controlling for all other demographic variables. Adjusted ORs and their confidence intervals (CIs) for the aggregate clinical scenarios are presented in a forest plot in Figure 6. Figure 4 shows that US surgeons were more likely to choose wound care (OR, 3.6; P < .0004) and less likely to attempt a replant (OR, 0.01; P < .0001). US surgeons were also less likely to use a pedicle or homodigital island flap when the amputated fingertip was both available (OR, 0.04; P = .039) and unavailable (OR, 0.47; Ps = .029).
Among all respondents and across all clinical scenarios, skeletal shortening with closure was favored among hand surgeons in practice less than 5 years compared with those in practice longer (OR, 2.11; 95% CI, 1.36-3.25; P = .0008). Similarly, surgeons with more than 30 years of experience were the least likely to favor wound care (OR, 0.2; 95% CI, 0.09-0.93; P = .037). Compared with orthopedic surgeons, plastic surgeons opted for wound care less often (OR, 0.44; 95% CI, 0.23-0.98; P = .018) and appeared to prefer replantation, but the difference was not statistically significant (OR, 8.86; 95% CI, 0.99-79.61; P = .054).
Replantation was less often chosen by private practice versus full-time academic surgeons (OR, 0.09; 95% CI, 0.01-0.91; P = .041.) Part-time academics were no more or less likely to perform replantation than full-time academics were (OR, 0.52; 95% CI, 0.05-5.41; P = .58). Of the 59 respondents who performed more than 10 microvascular cases a year, 18 (31%) chose replant for Allen level 4 amputations. In comparison, 9 (20%) of the 45 respondents who performed fewer than 3 microvascular cases a year chose replant for amputations at this level. Amount of time working with fellows did not affect treatment preferences.
Patient demographics (age, sex, occupation) also played a role in treatment decisions (Table 3). The most significant factors appeared to be age and occupation. Regarding age, 41% of respondents chose more complex procedures for patients younger than 15, and 62% chose less complex procedures for patients older than 70 years. Regarding occupation, 61% chose more complex procedures for professional musicians, and 60% chose less complex procedures for manual laborers. Sex did not influence clinical decisions for 78% of respondents. There was also substantial variation in both the indications for germinal matrix ablation and the frequency of sterile matrix transplant (Table 3).
Discussion
Although there is a variety of treatment options and published treatment guidelines for distal fingertip amputations, few comparative studies support use of one treatment over another. In our experience, treatment decisions are based mainly on injury parameters, but surgeon preference and patient factors (age, sex, occupation) can also influence care. Our goal in this study was to better understand how surgeon and patient factors influence treatment preferences for distal fingertip amputations among a cross section of US and international hand surgeons. Our survey results showed lack of consensus among hand surgeons and highlighted several trends.
As expected, we found a wide range of treatment preferences for each clinical scenario queried, ranging from more simple treatments (eg, wound care) to more complex ones (eg, replantation). With patient parameters (age, profession, finger, acuity, injury type, tissue preservation, smoking status) standardized in the clinical scenarios, the treatment differences noted should reflect surgeon preference. However, other patient factors (eg, cultural differences, religious beliefs, surgeon setting, practice pattern, resource availability) that were not included in the clinical scenarios could also affect treatment preferences.
One particularly interesting finding was that international hand surgeons were 6.8 times more likely to replant a distal fingertip amputation. One possible explanation for this variation is the influence of cultural differences. For example, in East Asian countries, there can be a cultural stigma associated with loss of a fingertip, and therefore more of a desire on the part of the patient to restore the original finger.20,21 In addition, the international respondents were biased toward academic practices—which could skew the treatment preference toward replantation, as we found that academic surgeons were more inclined to replantation.
Our finding that replantation was more commonly preferred by academic versus private practice surgeons may suggest a training bias, an affinity for more complex or interesting procedures, or access to hospital equipment and staff, including residents and fellows, not usually found at smaller community hospitals, where private practice surgeons are more commonly based. Jazayeri and colleagues22 found that institutions specializing in microsurgery often produced better outcomes than nonspecializing institutions. Therefore, it is not surprising that private practice hand surgeons may less often opt to replant a distal fingertip amputation. It is also not surprising that plastic surgeons are more inclined to perform a replantation or flap coverage, as their training is more microsurgery-intensive and their practice more focused on aesthetics compared with the other specialists.
Distal fingertip replantation is accepted by most as technically demanding, but it seems that the additional effort and resources would be justified if the procedure provided a superior outcome. However, other factors, such as cost of treatment and length of recovery, should also be considered. Average replantation cost has been estimated to range from $7500 to $14,000, compared with $2800 for non-replantation-related care, and median stay is about 4 days longer for replantation-related care.23,24 These estimates do not include indirect costs, such as for postoperative rehabilitation, which is likely longer and more expensive, even in distal fingertip replantation. These disparities may not justify the outcome (of having a complete fingertip) if more conservative treatments yield similar results.17,18 In addition, there is the expected failure rate of limb replantation surgery. In analysis of the overall societal costs and benefits of larger upper extremity limb replantation, the loss of invested resources sustained with failed limb replantation may be outweighed by the benefit of another patient having a successful outcome. In the case of fingertip replantation, however, does the undefined benefit of the successful patient outcome outweigh the investment of resources lost in cases of replantation failure? Understandably, there is a need for more robust clinical outcome and cost-comparative evidence to better inform decisions regarding distal fingertip amputation.
We found that wound care and skeletal shortening with primary closure (particularly with Allen level 3 injuries) were preferred more by surgeons within the first 5 years of practice. This finding seems to imply a lack of experience or confidence on the part of younger surgeons performing more complex procedures, such as flap coverage. Conversely, this finding may indicate a shift in treatment principle based on recent literature suggesting equivalent outcomes with simpler procedures.17,18 Although our survey study did not provide an option for treatment combinations or staged procedures, several respondents wrote in that skeletal shortening supplemented with various types of autografts and allografts would be their preferred treatment.
Patient factors also play a significant role in clinical decisions. Age and profession seem to be important determinants, with more than 50% of respondents, on average, changing their treatment recommendation based on these 2 factors. A majority of respondents would perform a less involved procedure for a manual laborer, suggesting a quicker return to work is prioritized over a perceived improved clinical outcome. Interestingly, for patients younger than 15 years, the preference was divided, with 41% of surgeons opting for a more complex procedure. This suggests the importance of restoring anatomy in a younger patient, or the perceived decreased risk or failure rate with more involved treatment. Twenty percent preferred a less complex procedure in a younger patient, perhaps relying on the patient’s developmental potential for a good outcome or suggesting a concern for patient intolerance or compliance with complex surgery.
Nail plate regrowth can be a problem with fingertip amputations. Nail deformity is highly correlated with injury level, with amputations proximal to the lunula more likely to cause nail plate deformity.25,26 Jebson and colleagues27 recommended germinal matrix ablation for amputations proximal to the lunula. We found respondents often performed ablations for other indications, including injured or minimal remaining sterile matrix and lack of bony support for the sterile matrix. Forty-six percent of respondents had never performed sterile matrix transplant, which could indicate that they were unfamiliar with the technique or had donor-site concerns, or that postinjury nail deformities are uncommon, well tolerated, or treated along with other procedures, such as germinal matrix ablation.
Several weaknesses of this study must be highlighted. First, our response rate was smaller than desired. Although this work incorporated a large number of surgeon responses, nearly 200, the response rate was only 17%. In addition, although number of responses was likely adequate to show the diversity of opinion, the preferences and trends reported might not be representative of all hand surgeons. We could not perform a nonresponder analysis because of a lack of specific demographic data for the AAHS and international hand society members. However, AAHS has an approximate 50/50 mix of plastic and orthopedic surgeons, similar to our responder demographic, suggesting our smaller subset of responses might be representative of the whole. According to AAHS, a majority of its members are “academic” hand surgeons, so our results might not adequately reflect the preferences of community hand surgeons and ultimately might overstate the frequency of more complex treatments. Last, our international response was limited to a few countries. A larger, more broadly distributed response would provide a better understanding of regional preferences, which could shed light on the importance of cultural differences.
Variations in patient insurance status were not queried in this survey but might also affect treatment decisions. More involved, costly, and highly reimbursing procedures might be deemed reasonable options for a small perceived clinical benefit for insured patients.
When multiple digits or the thumb is injured, or there are other concomitant injuries, surgeons may alter their choice of intervention. In mangled extremities, preservation of salvageable functional units takes precedence over aesthetics and likely affects choice of treatment for the amputated fingertips. Similarly, multiple fingertip amputations, even if all at the same level, may be differently regarded than a solitary injury.
Conclusion
For distal fingertip amputations, there is little evidence supporting one approach over another. Without level I comparative data guiding treatment, anecdotal evidence and surgeon personal preferences likely contribute to the large variation noted in this survey. Our study results showed the disparity of fingertip treatment preferences among a cross section of US and international hand surgeons. More important, results underscored the need for a well-designed comparative study to determine the most effective treatments for distal fingertip amputations.
1. Conn JM, Annest JL, Ryan GW, Budnitz DS. Non-work-related finger amputations in the United States, 2001-2002. Ann Emerg Med. 2005;45(6):630-635.
2. Bickel KD, Dosanjh A. Fingertip reconstruction. J Hand Surg Am. 2008;33(8):1417-1419.
3. Söderberg T, Nyström Å, Hallmans G, Hultén J. Treatment of fingertip amputations with bone exposure. A comparative study between surgical and conservative treatment methods. Scand J Plast Reconstr Surg. 1983;17(2):147-152.
4. Braun M, Horton RC, Snelling CF. Fingertip amputation: review of 100 digits. Can J Surg. 1985;28(1):72-75.
5. Sammut D. Fingertip injuries. A review of indications and methods of management. Curr Orthop. 2002;16:271-285.
6. Mennen U, Wiese A. Fingertip injuries management with semi-occlusive dressing. J Hand Surg Br. 1993;18(4):416-422.
7. Atasoy E, Ioakimidis E, Kasdan ML, Kutz JE, Kleinert HE. Reconstruction of the amputated fingertip with a triangular volar flap. A new surgical procedure. J Bone Joint Surg Am. 1970;52(5):921-926.
8. Kutler W. A new method for finger tip amputation. J Am Med Assoc. 1947;133(1):29-30.
9. Takeishi M, Shinoda A, Sugiyama A, Ui K. Innervated reverse dorsal digital island flap for fingertip reconstruction. J Hand Surg Am. 2006;31(7):1094-1099.
10. Tuncali D, Barutcu AY, Gokrem S, Terzioglu A, Aslan G. The hatchet flap for reconstruction of fingertip amputations. Plast Reconstr Surg. 2006;117(6):1933-1939.
11. Teoh LC, Tay SC, Yong FC, Tan SH, Khoo DB. Heterodigital arterialized flaps for large finger wounds: results and indications. Plast Reconstr Surg. 2003;111(6):1905-1913.
12. Nishikawa H, Smith PJ. The recovery of sensation and function after cross-finger flaps for fingertip injury. J Hand Surg Br. 1992;17(1):102-107.
13. Rinker B. Fingertip reconstruction with the laterally based thenar flap: indications and long-term functional results. Hand. 2006;1(1):2-8.
14. Jung MS, Lim YK, Hong YT, Kim HN. Treatment of fingertip amputation in adults by palmar pocketing of the amputated part. Arch Plast Surg. 2012;39(4):404-410.
15. Venkatramani H, Sabapathy SR. Fingertip replantation: technical considerations and outcome analysis of 24 consecutive fingertip replantations. Indian J Plast Surg. 2011;44(2):237-245.
16. Chen SY, Wang CH, Fu JP, Chang SC, Chen SG. Composite grafting for traumatic fingertip amputation in adults: technique reinforcement and experience in 31 digits. J Trauma. 2011;70(1):148-153.
17. van den Berg WB, Vergeer RA, van der Sluis CK, Ten Duis HJ, Werker PM. Comparison of three types of treatment modalities on the outcome of fingertip injuries. J Trauma Acute Care Surg. 2012;72(6):1681-1687.
18. Wang K, Sears ED, Shauver MJ, Chung KC. A systematic review of outcomes of revision amputation treatment for fingertip amputations. Hand. 2013;8(2):139-145.
19. Allen MJ. Conservative management of finger tip injuries in adults. Hand. 1980;12(3):257-265.
20. Chen CT, Wei FC, Chen HC, Chuang CC, Chen HT, Hsu WM. Distal phalanx replantation. Microsurgery. 1994;15(1):77-82.
21. Kim WK, Lim JH, Han SK. Fingertip replantations: clinical evaluation of 135 digits. Plast Reconstr Surg. 1996;98(3):470-476.
22. Jazayeri L, Klausner JQ, Chang J. Distal digital replantation. Plast Reconstr Surg. 2013;132(5):1207-1217.
23. Hattori Y, Doi K, Sakamoto S, Yamasaki H, Wahegaonkar A, Addosooki A. Fingertip replantation. J Hand Surg Am. 2007;32(4):548-555.
24. Goldner RD, Stevanovic MV, Nunley JA, Urbaniak JR. Digital replantation at the level of the distal interphalangeal joint and the distal phalanx. J Hand Surg Am. 1989;14(2 pt 1):214-220.
25. Nishi G, Shibata Y, Tago K, Kubota M, Suzuki M. Nail regeneration in digits replanted after amputation through the distal phalanx. J Hand Surg Am. 1996;21(2):229-233.
26. Yamano Y. Replantation of the amputated distal part of the fingers. J Hand Surg Am. 1985;10(2):211-218.
27. Jebson PJ, Louis DS, Bagg M. Amputations. In: Wolfe SW, Pederson WC, Hotchkiss RN, Kozin SH, eds. Green’s Operative Hand Surgery. 6th ed. Philadelphia, PA: Churchill Livingstone; 2010:1885-1927.
The Role of Computed Tomography in Evaluating Intra-Articular Distal Humerus Fractures
Elbow fractures constitute 7% of all adult fractures, and 30% of these fractures are distal humerus fractures.1,2 Of these, 96% involve disruption of the articular surface.3 Intra-articular distal humerus fracture patterns can be difficult to characterize on plain radiographs, and therefore computed tomography (CT) is often used. The surgeon’s understanding of the fracture pattern and the deforming forces affects choice of surgical approach. In particular, multiplanar fracture patterns, including coronal shear fractures of the capitellum or trochlea, are often difficult to recognize on plain radiographs. Identification of a multiplanar fracture pattern may require a change in approach or fixation. CT is useful for other intra-articular fractures, such as those of the proximal humerus,3-6 but involves increased radiation and cost.
We conducted a study to determine the effect of adding CT evaluation to plain radiographic evaluation on the classification of, and treatment plans for, intra-articular distal humerus fractures. We hypothesized that adding CT images to plain radiographs would change the classification and treatment of these fractures and would improve interobserver agreement on classification and treatment.
Materials and Methods
After obtaining University of Southern California Institutional Review Board approval, we retrospectively studied 30 consecutive cases of adult intra-articular distal humerus fractures treated by Dr. Itamura at a level I trauma center between 1995 and 2008. In each case, the injured elbow was imaged with plain radiography and CT. Multiple machines were used for CT, but all according to the radiology department’s standard protocol. The images were evaluated by 9 independent observers from the same institution: 3 orthopedic surgeons (1 fellowship-trained shoulder/elbow subspecialist, 1 fellowship-trained upper extremity subspecialist, 1 fellowship-trained orthopedic trauma surgeon), 3 shoulder/elbow fellows, and 3 senior residents pursuing upper extremity fellowships on graduation. No observer was involved in the care of any of the patients. All identifying details were removed from the patient information presented to the observers. For each set of images, the observer was asked to classify the fractures according to the Mehne and Matta classification system,7,8 which is the predominant system used at our institution.
Diagrams of this classification system were provided, but there was no formal observer training or calibration. Seven treatment options were presented: (1) open reduction and internal fixation (ORIF) using a posterior approach with olecranon osteotomy, (2) ORIF using a posterior approach, (3) ORIF using a lateral approach, (4) ORIF using a medial approach, (5) ORIF using an anterior/anterolateral approach, (6) total elbow arthroplasty, and (7) nonoperative management. The only clinical data provided were patient age and sex.
Images were evaluated in blinded fashion. Two rounds of evaluation were compared. In round 1, plain radiographs were evaluated; in round 2, the same radiographs plus corresponding 2-dimensional (2-D) CT images. A minimum of 1 month was required between viewing rounds.
Statistical Analysis
Statistical analysis was performed by the Statistical Consultation and Research Center at our institution. Cohen κ was calculated to estimate the reliability of the fracture classification and treatment plan made by different observers on the same occasion (interobserver reliability). Cramer V9 was calculated to estimate the reliability of the fracture classification and treatment plan made by the same observer on separate occasions (intraobserver reliability). It measures the association between the 2 ratings as a percentage of their total variation. The κ value and Cramer V value were also used to evaluate results based on the observers’ training levels. Both κ and Cramer V values are interpreted as follows: .00 to .20 indicates slight agreement; .21 to .40, fair agreement; .41-.60, moderate agreement; .61 to .80, substantial agreement; and ≥.81, almost perfect agreement. Zero represents no agreement, and 1.00 represents perfect agreement.
Results
Overall intraobserver reliability for classification was fair (.393). It was moderate for the treatment plan (.426) between viewing rounds. Residents had the highest Cramer V value at .60 (moderate) for classification reliability, and attending surgeons had the highest value at .52 (moderate) for treatment plan. All 3 groups (residents, fellows, attending surgeons) showed moderate intraobserver agreement for treatment plan (Table 1).

Interobserver reliability did not improve with the addition of CT in round 2. Reliability was fair at both viewing rounds for classification and for treatment. For classification, the overall κ value was .21 for the first round and .20 for the second round. For treatment plan, the overall κ value was .28 for the first round and .27 for the second round. Attending surgeons decreased in agreement with regard to treatment plan with the addition of CT (.46, moderate, to .32, fair). Fellows had only slight agreement for both rounds with regard to classification as well as treatment (Table 2).
![]()
ORIF using a posterior approach with an olecranon osteotomy was the most common choice of treatment method overall at both time points (58.1% and 63.7%) and was still the most common choice when each group of observers (residents, fellows, faculty) was considered separately (Figure 1).

When classifying the fractures, attending surgeons chose the multiplanar fracture pattern 25.6% of the time when viewing radiographs only, and remained consistent in choosing this pattern 23.3% of the time when CT was added to radiographs. Fellows and residents chose this fracture pattern much less often (8.9% and 7.8%, respectively) when viewing radiographs only. Both fellows and residents increased their choice of the multiplanar fracture pattern by 10% (18.9% for fellows, 17.8% for residents) when CT was added (Figure 2).

Overall, the recognition of a multiplanar fracture pattern increased when CT was added. On 30 occasions, an answer was changed from another classification pattern to the multiplanar pattern when CT was added. Only 6 times did an observer change a multiplanar pattern selection at round 1 to another choice at round 2.
Adding CT in round 2 changed the treatment plan for multiplanar fractures. At round 1, 73.7% chose ORIF using a lateral approach for treatment of the multiplanar fracture versus 10.5% who chose ORIF using a posterior approach with an olecranon osteotomy. The choice of the posterior approach with olecranon osteotomy increased to 51.9% at round 2, using the technique we have previously described.5,10
Overall intraobserver reliability for classification was fair (.393). It was moderate for the treatment plan (.426) between viewing rounds. Residents had the highest Cramer V value at .60 (moderate) for classification reliability, and faculty had the highest value at .52 (moderate) for treatment plan. All 3 groups (residents, fellows, attending surgeons) showed moderate intraobserver agreement for treatment plan (Table 1).
Interobserver reliability did not improve with the addition of CT in round 2. Reliability for classification was fair for round 1 and slight for round 2. Reliability was fair at both viewing rounds for treatment. For classification, the overall κ value was .21 for round 1 and .20 for round 2. For treatment plan, the overall κ value was .28 for round 1 and .27 for round 2. Attending surgeons decreased in agreement with regard to treatment plan with the addition of CT (.46, moderate, to .32, fair). Fellows had only slight agreement for both rounds with regard to classification as well as treatment (Table 2).
Discussion
In this study, CT changed both classification and treatment when added to plain radiographs. Interestingly, interobserver reliability did not improve for classification or treatment with the addition of CT. This finding suggests substantial disagreement among qualified observers that is not resolved with more sophisticated imaging. We propose this disagreement is caused by differences in training and experience with specific fracture patterns and surgical approaches.
Our fair to moderate interobserver reliability using radiographs only is consistent with a study by Wainwright and colleagues,11 who demonstrated fair to moderate interobserver reliability with radiographs only using 3 different classification systems. CT did not improve interobserver reliability in the present study.
To our knowledge, the effect of adding CT to plain radiographs on classification and treatment plan has not been evaluated. Doornberg and colleagues2 evaluated the effect of adding 3-dimensional (3-D) CT to a combination of radiographs and 2-D CT. Using the AO (Arbeitsgemeinschaft für Osteosynthesefragen) classification12 and the classification system of Mehne and Matta, they found that 3-D CT improved intraobserver and interobserver reliability for classification but improved only intraobserver agreement for treatment. Interobserver agreement for treatment plan remained fair. In parallel with their study, fracture classification in our study was more often changed with CT than the treatment plan was. Training level appeared not to affect this finding. We found fair interobserver agreement for treatment choice as well, which was not improved by adding CT. Doornberg and colleagues2 concluded that the “relatively small added expense of three-dimensional computed tomography scans seems worthwhile.”
When evaluating specific fracture patterns in the Mehne and Matta classification system, we observed that less experienced surgeons (residents, fellows) were much more likely to identify multiplanar fracture patterns with the aid of CT. Use of CT did not change attending surgeons’ recognition of these multiplanar fractures, suggesting that the faculty were more capable of appreciating these fracture patterns with radiographs only (Figure 3). We also observed that adding CT changed the predominant treatment plan for multiplanar fractures from a lateral approach to a posterior approach with an olecranon osteotomy. Failure to appreciate this component of the fracture before surgery could lead to an increased intraoperative difficulty level. Failure to appreciate it during surgery could lead to unexpected postoperative displacement and ultimately poorer outcome.

There are limitations to our study. There is no gold standard for assessing the accuracy of classification decisions. Intraoperative classification could have served as a gold standard, but the fractures were not routinely assigned a classification during surgery. Brouwer and colleagues13 evaluated the diagnostic accuracy of CT (including 3-D CT) with intraoperative AO classification as a reference point and found improvement in intraobserver agreement but not interobserver agreement when describing fracture characteristics—and no significant effect on classification.
We used a single classification system, the one primarily used at our institution and by Dr. Itamura. There are many systems,7,12,14 all with their strengths and weaknesses, and no one system is used universally. Adding a system would have allowed us to compare results of more than one system. Our aim, however, was to keep our form simple for the sake of participation and completion of the viewings by each volunteer.
Only 2-D CT was used for this study, as 3-D images were not available for all patients. Although this is a potential weakness, it appears that, based on the study by Doornberg and colleagues,2 adding 3-D imaging resulted in only modest improvement in the reliability of classification and no significant improvement in agreement on treatment recommendation.
In addition, our results were likely biased by the fact that 8 of the 9 evaluators were trained by Dr. Itamura, who very often uses a posterior approach with an olecranon osteotomy for internal fixation of distal humerus intra-articular fractures, as previously described.8,10 Therefore, selection of this treatment option may have been overestimated in this study. Nevertheless, after reviewing the literature, Ljungquist and colleagues15 wrote, “There do not seem to be superior functional results associated with any one surgical approach to the distal humerus.”
We did not give the evaluators an indication of patients’ activity demands (only age and sex), which may have been relevant when considering total elbow arthroplasty.
Last, performing another round of evaluations with only plain radiographs, before introducing CT, would have provided intraobserver reliability results on plain radiograph evaluation, which could have been compared with intraobserver reliability when CT was added. Again, this was excluded to encourage participation and create the least cumbersome evaluation experience possible, which was thought appropriate, as this information is already in the literature.
Conclusion
Adding CT changed classifications and treatment plans. Raters were more likely to change their classifications than their treatment plans. The addition of CT did not increase agreement between observers. Despite the added radiation and cost, we recommend performing CT for all intra-articular distal humerus fractures because it improves understanding of the fracture pattern and affects treatment planning, especially for fractures with a coronal shear component, which is often not appreciated on plain radiographs.
1. Anglen J. Distal humerus. J Am Acad Orthop Surg. 2005;13(5):291-297.
2. Doornberg J, Lindenhovius A, Kloen P, van Dijk CN, Zurakowski D, Ring D. Two and three-dimensional computed tomography for the classification and management of distal humerus fractures. Evaluation of reliability and diagnostic accuracy. J Bone Joint Surg Am. 2006;88(8):1795-1801.
3. Pollock JW, Faber KJ, Athwal GS. Distal humerus fractures. Orthop Clin North Am. 2008;39(2):187-200.
4. Castagno AA, Shuman WP, Kilcoyne RF, Haynor DR, Morris ME, Matsen FA. Complex fractures of the proximal humerus: role of CT in treatment. Radiology. 1987;165(3):759-762.
5. Palvanen M, Kannus P, Niemi S, Parkkari J. Secular trends in the osteoporotic fractures of the distal humerus in elderly women. Eur J Epidemiol. 1998;14(2):159-164.
6. Siebenrock KA, Gerber C. The reproducibility of classification of fractures of the proximal end of the humerus. J Bone Joint Surg Am. 1993;75(12):1751-1755.
7. Jupiter JB, Mehne DK. Fractures of the distal humerus. Orthopedics. 1992;15(7):825-833.
8. Zalavras CG, McAllister ET, Singh A, Itamura JM. Operative treatment of intra-articular distal humerus fractures. Am J Orthop. 2007;36(12 suppl):8-12.
9. Cramer H. Mathematical Methods of Statistics. Princeton, NJ: Princeton University Press; 1946.
10. Panossian V, Zalavras C, Mirzayan R, Itamura JM. Intra-articular distal humerus fractures. In: Mirzayan R, Itamura JM, eds. Shoulder and Elbow Trauma. New York, NY: Thieme; 2004:67-78.
11. Wainwright AM, Williams JR, Carr AJ. Interobserver and intraobserver variation in classification systems for fractures of the distal humerus. J Bone Joint Surg Br. 2000;82(5):636-642.
12. Müller ME, Nazarian S, Koch P, Schatzker J. The Comprehensive Classification of Fractures in Long Bones. Berlin, Germany: Springer-Verlag; 1990.
13. Brouwer KM, Lindenhovius AL, Dyer GS, Zurakowski D, Mudgal C, Ring D. Diagnostic accuracy of 2- and 3-dimensional imaging and modeling of distal humerus fractures. J Shoulder Elbow Surg. 2012;21(6):772-776.
14. Riseborough EJ, Radin EL. Intercondylar T fractures of the humerus in the adult. A comparison of operative and non-operative treatment in 29 cases. J Bone Joint Surg Am. 1969;51(1):130-141.
15. Ljungquist KL, Beran MC, Awan H. Effects of surgical approach on functional outcomes of open reduction and internal fixation of intra-articular distal humeral fractures: a systematic review. J Shoulder Elbow Surg. 2012;21(1):126-135.
Elbow fractures constitute 7% of all adult fractures, and 30% of these fractures are distal humerus fractures.1,2 Of these, 96% involve disruption of the articular surface.3 Intra-articular distal humerus fracture patterns can be difficult to characterize on plain radiographs, and therefore computed tomography (CT) is often used. The surgeon’s understanding of the fracture pattern and the deforming forces affects choice of surgical approach. In particular, multiplanar fracture patterns, including coronal shear fractures of the capitellum or trochlea, are often difficult to recognize on plain radiographs. Identification of a multiplanar fracture pattern may require a change in approach or fixation. CT is useful for other intra-articular fractures, such as those of the proximal humerus,3-6 but involves increased radiation and cost.
We conducted a study to determine the effect of adding CT evaluation to plain radiographic evaluation on the classification of, and treatment plans for, intra-articular distal humerus fractures. We hypothesized that adding CT images to plain radiographs would change the classification and treatment of these fractures and would improve interobserver agreement on classification and treatment.
Materials and Methods
After obtaining University of Southern California Institutional Review Board approval, we retrospectively studied 30 consecutive cases of adult intra-articular distal humerus fractures treated by Dr. Itamura at a level I trauma center between 1995 and 2008. In each case, the injured elbow was imaged with plain radiography and CT. Multiple machines were used for CT, but all according to the radiology department’s standard protocol. The images were evaluated by 9 independent observers from the same institution: 3 orthopedic surgeons (1 fellowship-trained shoulder/elbow subspecialist, 1 fellowship-trained upper extremity subspecialist, 1 fellowship-trained orthopedic trauma surgeon), 3 shoulder/elbow fellows, and 3 senior residents pursuing upper extremity fellowships on graduation. No observer was involved in the care of any of the patients. All identifying details were removed from the patient information presented to the observers. For each set of images, the observer was asked to classify the fractures according to the Mehne and Matta classification system,7,8 which is the predominant system used at our institution.
Diagrams of this classification system were provided, but there was no formal observer training or calibration. Seven treatment options were presented: (1) open reduction and internal fixation (ORIF) using a posterior approach with olecranon osteotomy, (2) ORIF using a posterior approach, (3) ORIF using a lateral approach, (4) ORIF using a medial approach, (5) ORIF using an anterior/anterolateral approach, (6) total elbow arthroplasty, and (7) nonoperative management. The only clinical data provided were patient age and sex.
Images were evaluated in blinded fashion. Two rounds of evaluation were compared. In round 1, plain radiographs were evaluated; in round 2, the same radiographs plus corresponding 2-dimensional (2-D) CT images. A minimum of 1 month was required between viewing rounds.
Statistical Analysis
Statistical analysis was performed by the Statistical Consultation and Research Center at our institution. Cohen κ was calculated to estimate the reliability of the fracture classification and treatment plan made by different observers on the same occasion (interobserver reliability). Cramer V9 was calculated to estimate the reliability of the fracture classification and treatment plan made by the same observer on separate occasions (intraobserver reliability). It measures the association between the 2 ratings as a percentage of their total variation. The κ value and Cramer V value were also used to evaluate results based on the observers’ training levels. Both κ and Cramer V values are interpreted as follows: .00 to .20 indicates slight agreement; .21 to .40, fair agreement; .41-.60, moderate agreement; .61 to .80, substantial agreement; and ≥.81, almost perfect agreement. Zero represents no agreement, and 1.00 represents perfect agreement.
Results
Overall intraobserver reliability for classification was fair (.393). It was moderate for the treatment plan (.426) between viewing rounds. Residents had the highest Cramer V value at .60 (moderate) for classification reliability, and attending surgeons had the highest value at .52 (moderate) for treatment plan. All 3 groups (residents, fellows, attending surgeons) showed moderate intraobserver agreement for treatment plan (Table 1).
Interobserver reliability did not improve with the addition of CT in round 2. Reliability was fair at both viewing rounds for classification and for treatment. For classification, the overall κ value was .21 for the first round and .20 for the second round. For treatment plan, the overall κ value was .28 for the first round and .27 for the second round. Attending surgeons decreased in agreement with regard to treatment plan with the addition of CT (.46, moderate, to .32, fair). Fellows had only slight agreement for both rounds with regard to classification as well as treatment (Table 2).
![]()
ORIF using a posterior approach with an olecranon osteotomy was the most common choice of treatment method overall at both time points (58.1% and 63.7%) and was still the most common choice when each group of observers (residents, fellows, faculty) was considered separately (Figure 1).
When classifying the fractures, attending surgeons chose the multiplanar fracture pattern 25.6% of the time when viewing radiographs only, and remained consistent in choosing this pattern 23.3% of the time when CT was added to radiographs. Fellows and residents chose this fracture pattern much less often (8.9% and 7.8%, respectively) when viewing radiographs only. Both fellows and residents increased their choice of the multiplanar fracture pattern by 10% (18.9% for fellows, 17.8% for residents) when CT was added (Figure 2).
Overall, the recognition of a multiplanar fracture pattern increased when CT was added. On 30 occasions, an answer was changed from another classification pattern to the multiplanar pattern when CT was added. Only 6 times did an observer change a multiplanar pattern selection at round 1 to another choice at round 2.
Adding CT in round 2 changed the treatment plan for multiplanar fractures. At round 1, 73.7% chose ORIF using a lateral approach for treatment of the multiplanar fracture versus 10.5% who chose ORIF using a posterior approach with an olecranon osteotomy. The choice of the posterior approach with olecranon osteotomy increased to 51.9% at round 2, using the technique we have previously described.5,10
Overall intraobserver reliability for classification was fair (.393). It was moderate for the treatment plan (.426) between viewing rounds. Residents had the highest Cramer V value at .60 (moderate) for classification reliability, and faculty had the highest value at .52 (moderate) for treatment plan. All 3 groups (residents, fellows, attending surgeons) showed moderate intraobserver agreement for treatment plan (Table 1).
Interobserver reliability did not improve with the addition of CT in round 2. Reliability for classification was fair for round 1 and slight for round 2. Reliability was fair at both viewing rounds for treatment. For classification, the overall κ value was .21 for round 1 and .20 for round 2. For treatment plan, the overall κ value was .28 for round 1 and .27 for round 2. Attending surgeons decreased in agreement with regard to treatment plan with the addition of CT (.46, moderate, to .32, fair). Fellows had only slight agreement for both rounds with regard to classification as well as treatment (Table 2).
Discussion
In this study, CT changed both classification and treatment when added to plain radiographs. Interestingly, interobserver reliability did not improve for classification or treatment with the addition of CT. This finding suggests substantial disagreement among qualified observers that is not resolved with more sophisticated imaging. We propose this disagreement is caused by differences in training and experience with specific fracture patterns and surgical approaches.
Our fair to moderate interobserver reliability using radiographs only is consistent with a study by Wainwright and colleagues,11 who demonstrated fair to moderate interobserver reliability with radiographs only using 3 different classification systems. CT did not improve interobserver reliability in the present study.
To our knowledge, the effect of adding CT to plain radiographs on classification and treatment plan has not been evaluated. Doornberg and colleagues2 evaluated the effect of adding 3-dimensional (3-D) CT to a combination of radiographs and 2-D CT. Using the AO (Arbeitsgemeinschaft für Osteosynthesefragen) classification12 and the classification system of Mehne and Matta, they found that 3-D CT improved intraobserver and interobserver reliability for classification but improved only intraobserver agreement for treatment. Interobserver agreement for treatment plan remained fair. In parallel with their study, fracture classification in our study was more often changed with CT than the treatment plan was. Training level appeared not to affect this finding. We found fair interobserver agreement for treatment choice as well, which was not improved by adding CT. Doornberg and colleagues2 concluded that the “relatively small added expense of three-dimensional computed tomography scans seems worthwhile.”
When evaluating specific fracture patterns in the Mehne and Matta classification system, we observed that less experienced surgeons (residents, fellows) were much more likely to identify multiplanar fracture patterns with the aid of CT. Use of CT did not change attending surgeons’ recognition of these multiplanar fractures, suggesting that the faculty were more capable of appreciating these fracture patterns with radiographs only (Figure 3). We also observed that adding CT changed the predominant treatment plan for multiplanar fractures from a lateral approach to a posterior approach with an olecranon osteotomy. Failure to appreciate this component of the fracture before surgery could lead to an increased intraoperative difficulty level. Failure to appreciate it during surgery could lead to unexpected postoperative displacement and ultimately poorer outcome.
There are limitations to our study. There is no gold standard for assessing the accuracy of classification decisions. Intraoperative classification could have served as a gold standard, but the fractures were not routinely assigned a classification during surgery. Brouwer and colleagues13 evaluated the diagnostic accuracy of CT (including 3-D CT) with intraoperative AO classification as a reference point and found improvement in intraobserver agreement but not interobserver agreement when describing fracture characteristics—and no significant effect on classification.
We used a single classification system, the one primarily used at our institution and by Dr. Itamura. There are many systems,7,12,14 all with their strengths and weaknesses, and no one system is used universally. Adding a system would have allowed us to compare results of more than one system. Our aim, however, was to keep our form simple for the sake of participation and completion of the viewings by each volunteer.
Only 2-D CT was used for this study, as 3-D images were not available for all patients. Although this is a potential weakness, it appears that, based on the study by Doornberg and colleagues,2 adding 3-D imaging resulted in only modest improvement in the reliability of classification and no significant improvement in agreement on treatment recommendation.
In addition, our results were likely biased by the fact that 8 of the 9 evaluators were trained by Dr. Itamura, who very often uses a posterior approach with an olecranon osteotomy for internal fixation of distal humerus intra-articular fractures, as previously described.8,10 Therefore, selection of this treatment option may have been overestimated in this study. Nevertheless, after reviewing the literature, Ljungquist and colleagues15 wrote, “There do not seem to be superior functional results associated with any one surgical approach to the distal humerus.”
We did not give the evaluators an indication of patients’ activity demands (only age and sex), which may have been relevant when considering total elbow arthroplasty.
Last, performing another round of evaluations with only plain radiographs, before introducing CT, would have provided intraobserver reliability results on plain radiograph evaluation, which could have been compared with intraobserver reliability when CT was added. Again, this was excluded to encourage participation and create the least cumbersome evaluation experience possible, which was thought appropriate, as this information is already in the literature.
Conclusion
Adding CT changed classifications and treatment plans. Raters were more likely to change their classifications than their treatment plans. The addition of CT did not increase agreement between observers. Despite the added radiation and cost, we recommend performing CT for all intra-articular distal humerus fractures because it improves understanding of the fracture pattern and affects treatment planning, especially for fractures with a coronal shear component, which is often not appreciated on plain radiographs.
1. Anglen J. Distal humerus. J Am Acad Orthop Surg. 2005;13(5):291-297.
2. Doornberg J, Lindenhovius A, Kloen P, van Dijk CN, Zurakowski D, Ring D. Two and three-dimensional computed tomography for the classification and management of distal humerus fractures. Evaluation of reliability and diagnostic accuracy. J Bone Joint Surg Am. 2006;88(8):1795-1801.
3. Pollock JW, Faber KJ, Athwal GS. Distal humerus fractures. Orthop Clin North Am. 2008;39(2):187-200.
4. Castagno AA, Shuman WP, Kilcoyne RF, Haynor DR, Morris ME, Matsen FA. Complex fractures of the proximal humerus: role of CT in treatment. Radiology. 1987;165(3):759-762.
5. Palvanen M, Kannus P, Niemi S, Parkkari J. Secular trends in the osteoporotic fractures of the distal humerus in elderly women. Eur J Epidemiol. 1998;14(2):159-164.
6. Siebenrock KA, Gerber C. The reproducibility of classification of fractures of the proximal end of the humerus. J Bone Joint Surg Am. 1993;75(12):1751-1755.
7. Jupiter JB, Mehne DK. Fractures of the distal humerus. Orthopedics. 1992;15(7):825-833.
8. Zalavras CG, McAllister ET, Singh A, Itamura JM. Operative treatment of intra-articular distal humerus fractures. Am J Orthop. 2007;36(12 suppl):8-12.
9. Cramer H. Mathematical Methods of Statistics. Princeton, NJ: Princeton University Press; 1946.
10. Panossian V, Zalavras C, Mirzayan R, Itamura JM. Intra-articular distal humerus fractures. In: Mirzayan R, Itamura JM, eds. Shoulder and Elbow Trauma. New York, NY: Thieme; 2004:67-78.
11. Wainwright AM, Williams JR, Carr AJ. Interobserver and intraobserver variation in classification systems for fractures of the distal humerus. J Bone Joint Surg Br. 2000;82(5):636-642.
12. Müller ME, Nazarian S, Koch P, Schatzker J. The Comprehensive Classification of Fractures in Long Bones. Berlin, Germany: Springer-Verlag; 1990.
13. Brouwer KM, Lindenhovius AL, Dyer GS, Zurakowski D, Mudgal C, Ring D. Diagnostic accuracy of 2- and 3-dimensional imaging and modeling of distal humerus fractures. J Shoulder Elbow Surg. 2012;21(6):772-776.
14. Riseborough EJ, Radin EL. Intercondylar T fractures of the humerus in the adult. A comparison of operative and non-operative treatment in 29 cases. J Bone Joint Surg Am. 1969;51(1):130-141.
15. Ljungquist KL, Beran MC, Awan H. Effects of surgical approach on functional outcomes of open reduction and internal fixation of intra-articular distal humeral fractures: a systematic review. J Shoulder Elbow Surg. 2012;21(1):126-135.
