User login
Management of Hepatitis C in Patitents With HIV
In an era of potent antiretroviral therapy (ART), end stage liver disease (ESLD) is the second leading cause of death among patients with human immumodeficiency virus (HIV) infections who are co-infected with hepatitis C virus (HCV).1,2 In the U.S., HCV infection is the major cause of liver failure, liver transplantation, and liver disease associated death, with an annual mortality that now exceeds that of HIV.1,2 It is estimated that 30% to 35% of persons with HIV infection also have HCV infection.1,2 Interestingly, patients with underlying HIV have a lower rate of spontaneous hepatitis C virologic clearance during acute infection, which is thought to be directly related to their level of underlying immune suppression and immune function.3 The consequences of HCV infection in this population are significant and include accelerated liver disease and fibrosis progression, higher rates of ESLD, and shortened life span after hepatic decompensation.4,5 Because of these complications, the U.S. Department of Health and Human Services (DHHS) recommends that all HIV-infected patients should be screened for HCV infection, preferably before starting ART.6
HCV Treatment for HIV-HCV Co-Infection
The higher rates of fibrosis progression, decompensated liver disease, and morbidity and mortality secondary to ESLD compared with patients with HCV monoinfection are a major impetus to treat HCV in patients with HIV-HCV co-infection. However, there are very limited data on the safety and efficacy of the available antiviral agents for co-infection. The current paradigm is to stage patients before HCV treatment since those patients with minimal fibrosis may be able to wait for future less toxic or complex therapies, while HCV therapy should be offered to patients with portal or higher stages of fibrosis.7 Today with simpler and more effective therapies, even this paradigm is rapidly shifting to offering treatment for all infected patients.
The goal of HCV therapy is to achieve sustained virologic response (SVR), undetectable HCV RNA levels 24 weeks after the end of treatment. This endpoint is the gold standard of treatment-induced viral eradication and is used as the primary endpoint for treatment of HCV regardless of HIV status. Secondary goals are achieved upon viral eradication, including the reduction in morbidity and mortality associated with liver disease (eg, fibrosis/inflammation, hepatocellular carcinoma [HCC]).8 Failure to achieve SVR leaves the patient with continued risk of liver disease progression, including fibrosis and liver decompensation. Interestingly, in patients who have received treatment with peginterferon and ribavirin, there are data supporting a lower risk of liver-related mortality, hepatic decompensation, and liver stiffness when initial SVR is achieved, but there is a subsequent relapse (reappearance of HCV RNA).9
The complex decision to treat a patient with HIV infection for HCV is based on the stage of liver disease along with HCV genotype, viral load (VL), presence of comorbidities, and stability of the patient’s HIV regimen (if any). This is a long-term commitment for the patient, and his or her readiness to undergo and adhere to therapy is as important as the regimen. Given this complexity, it is also clear that treatment of HCV in either HCV alone or HIV-HCV co-infection should not be attempted without consultation and guidance from an infectious diseases or gastroenterology physician who has experience and training in the management of HCV and HIV. In general, a team of providers, including the physician, pharmacist, and social worker are required to ensure safety, compliance, and efficacy.
The timing of treatment is important in patients with bridging fibrosis or cirrhosis. However, treatment of mild to moderate disease can also be justified given the data supporting more rapid disease progression in patients with HIV-HCV co-infection, although not as pressing.4,5 The best indicator for disease stage remains liver biopsy, which is assessed for grade and stage of the liver injury. There are 3 primary reasons for performing a liver biopsy: (1) It provides useful information on the status of the liver injury; (2) It identifies features useful in the decision to initiate therapy; and (3) It may reveal advanced fibrosis or cirrhosis that necessitates surveillance for HCC. The biopsy also provides information on other histologic features that might have a bearing on liver disease progression.10 However, there are clear contraindications to treatment, including a history of decompensated cirrhosis (may be exacerbated by treatment), pregnancy (teratogenicity of ribavirin), or uncontrolled depression and unstable cardiac or pulmonary conditions.6 Patients with untreated/uncontrolled HIV and/or AIDS are not optimal for treatment.10
In patients presenting with HIV and HCV coinfection the order of HIV or HCV treatment does affect patient outcomes.6 Recommendations from the DHHS HIV task force are that all treatment-naive HIV/HCV coinfected patients be initiated on HIV ART regardless of their CD4 cell count.6 In patients with lower CD4 counts (eg, < 200 cells/mm3), it may be preferable to initiate ART and delay HCV therapy until CD4 count increases. The importance of immune reconstitution and function has been demonstrated by studies that show ART may slow the progression of liver disease by preserving or restoring immune function and reducing HIV-related immune activation and inflammation.
There is also evidence to support the model that HCV viremia increase proportionally to the extent of CD4 cell count decline; although there is no direct correlation between extent of liver damage and viremia there are direct implications for therapy.10 For most HIV-HCV co-infected patients, including those with cirrhosis, the benefits of ART outweigh concerns regarding drug-induced liver injury. Therefore, ART should be considered for patients with HIV-HCV co-infection, regardless of CD4 count, and treatment of HCV may be deferred until there is a rise in the CD4 count.11,12
Current Treatment Regimens
Antiretroviral regimens for patients with HIV-HCV coinfection are generally the same as those for individuals without HIV infection (Table).13-20 Importantly, when treating both infections the provider must consider the large pill burden, drug-drug interactions, and overlapping toxicities (in particular hepatic) prior to
starting therapy. The same predictors as those for monoinfection apply to co-infected patients, including the level of baseline viremia, with high-level viremia having a negative impact on overall SVR rates in clinical trials with the new protease inhibitor boceprevir (although it did not impact telaprevircontaining
regimens).21,22 Another factor that predicts treatment response is the HCV genotype (total of 6). In the U.S., genotype 1 accounts for 70% to 75% of HCV infections. Genotype 1a is responsible for two-thirds, and genotype 1b for one-third of genotype 1 infections. In treatment studies to date, genotype 1b is less likely to develop viral drug resistance and therefore has a higher treatment cure rate than HCV genotype 1a. 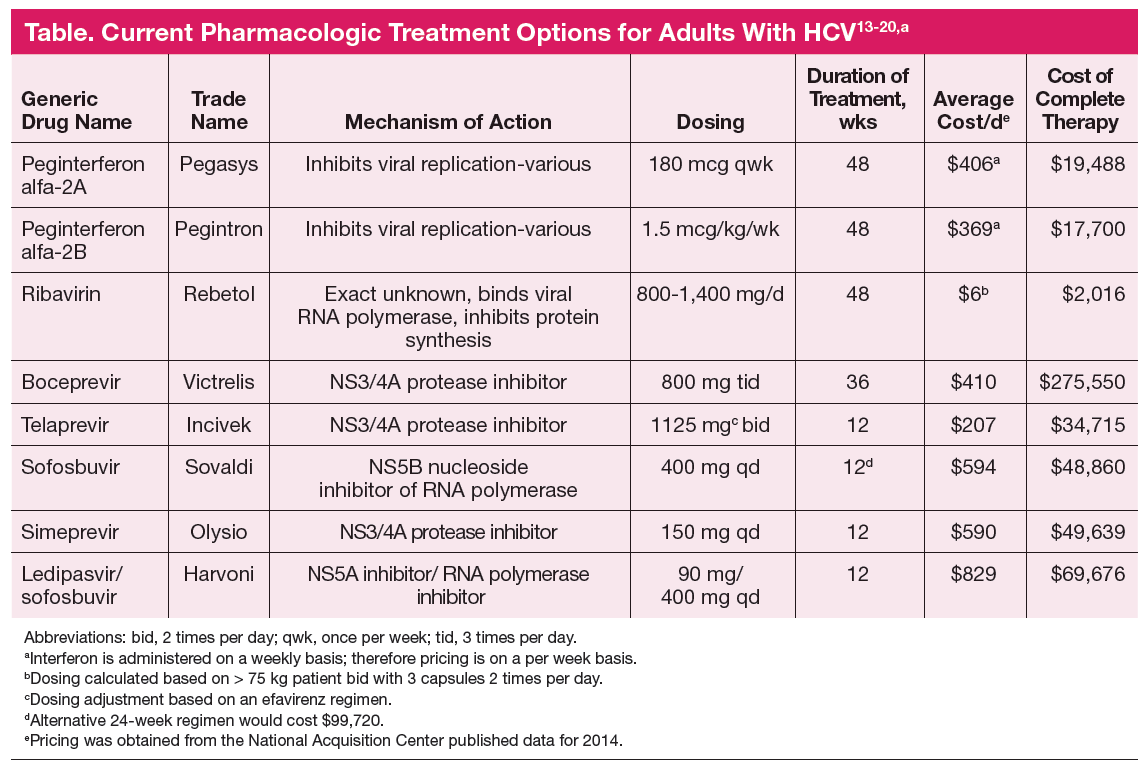
Treatment success with interferon-based regimens is also influenced by the patient’s interleukin 28B gene (IL28B) polymorphism. Patients with the IL28B CC genotype have a greater response than those with IL28B TT genotype.23 IL28B is a member of the type III interferon system. Interferons are part of the innate immune response of host cells to pathogens in particular viruses. They establish an antiviral state by inhibiting protein synthesis, alerting the immune system to the presence of pathogen, and inducing proteins with antiviral activity. Interferons are pivotal factors in fighting viral infections and establishing an antiviral state
in the infected and surrounding cells.24 Currently, we do not routinely determine IL28B genotypes; however, as technology improves and genotyping becomes more commercially available, this may be incorporated into routine practice. Moreover, with the second generation HCV drugs, including simpeprevir and sofosbuvir, the IL28 genotype is not a factor as new recommendations include interferon-free regimens.25
Peginterferon alpha plus ribavirin has been the mainstay of therapy since 2001, producing an overall 40% response in treated patients with HCV genotype 1.26 More recently, 4 classes of direct-acting antiviral (DAA) agents have been developed, including nonstructural protein 3/4A (NS3/4A) protease inhibitors (PIs), nonstructural protein 5B (NS5B) nucleoside inhibitors, NS5B non-nucleoside inhibitors, and nonstructural protein 5A (NS5A) inhibitors. Of these classes, the PIs boceprevir and telaprevir have been in use since 2011 and have significantly improved response rates to therapy for genotype 1 infection. These drugs, however, continue to require peginterferon and ribavirin therapy; therefore many of the barriers to therapy that existed previously remain.
Several clinical trials demonstrated significantly increased efficacy with PI backed therapy when compared with standard interferon ribavirin regimens in treatment-naive and treatment-experienced nonresponders/patients who have relapsed.21,22,27 Previously one of the main treatment predictors was the rapidity of viral suppression assessed at 4 weeks of therapy. If patients have a rapid virologic response (ie, > 2 log decrease in VL), they generally do well with sustained viral suppression. However, this predictor becomes unclear as the DAA are used. Because of their potency with rapid viral suppression, the durability of the rapid virologic response and its use as a predictor of treatment success becomes uncertain. To date, there have been few clinical trials completed and published on the efficacy and safety of this triple drug regimen in the HIV-HCV co-infected patient. However, what data there is available is encouraging.
In a phase 2 clinical trial of genotype 1 co-infected patients after a 4-week peginterferon and ribavirin leadin, boceprevir was initiated and continued for 44 weeks vs continuation of standard of care with peginterferon and ribavirin. In this cohort 42% of patients in the boceprevir arm achieved viral suppression at week 8 vs 15% in the standard therapy arm. At 24 weeks postcompletion of therapy, 63% of patient maintained SVR compared with 29% in the standard arm. Importantly, co-infected patients did not have new previously unreported adverse events (AEs), and the percentage of patients with AEs seemed to be similar to those with HCV infection alone.28 Similar studies of telaprevir also demonstrated more effective therapy than did the standard of care in co-infected patients. Another study evaluating telaprevir utilized a small cohort of 60 patients with genotype 1 infection. They were treated for 12 weeks with peginterferon, ribavirin, and telaprevir followed by an additional 36 weeks of peginterferon and ribavirin. After 4 weeks of therapy, 68% of patients in the telaprevir arm had rapid virologic response compared with none of the patients in the standard therapy arm. Patients included in this cohort had higher VL and advanced liver disease. Upon completion of the study at both 12 and 24 weeks posttherapy, 74% vs 24% of patients had SVR, respectively. Safety data in this study also demonstrated similar toxicity profiles as those with HCV monoinfection.29
In recent months the FDA approved the protease inhibitor simeprevir with pegylated interferon and ribavirin for the treatment of patients with HCV genotype 1. In addition, the FDA also approved sofosbuvir with pegylated interferon and ribavirin for the treatment of HCV genotype 1, and sofosbuvir and ribavirin for the treatment of HCV genotypes 2 and 3. Oral sofosbuvir plus ribavirin in patients with HCV and HIV infection (CD4 count > 500 cells/μL) resulted in an SVR of 76% in patients with genotype 1, 88% in those with genotype 2, and 67% in those with genotype 3.30 The sofosbuvir regimen utilized in the PHOTON-1 trial is an interferon-free regimen, the first time there has been success with interferon-free regimens in this population.30 A new study released in early November at the American Association for the Study of Liver Diseases meeting presented data from the ERADICATE trial, which was designed to test a simple once daily regimen of sofosbuvir and ledipasvir (a new inhibitor of HCV NS5A, a viral phosphoprotein that plays an important role in viral replication, assembly, and secretion) in 50 patients. Results presented demonstrated that at 12 weeks posttreatment all patients in the ART untreated group and all but one in the ART treated group had undetectable HCV RNA. The overall SVR rate was 98% for this study. This is the first time an interferon and ribavirin-free regimen has shown clear efficacy in the treatment and cure of HCV infection.25 New guidelines for the treatment of patients with HCV-HIV co-infection are expected to be released in the immediate future.
Conclusion
The sudden and dramatic change in hepatitis C management is now here, with an extraordinary array of new drugs expected to cure the majority of hepatitis C-infected patients.31 It remains an exciting time in the field as for the first time we may be able to reach solid cure rates with simpler, more accessible regimens, in particular as we are on the threshold of totally oral therapy. One of the greatest limitations has been and will remain the economics of therapy (Table), which is not discussed here but remains at the forefront of barriers to care and cure.
Author disclosures
The author reports no actual or potential conflicts of interest with regard to this article.
Disclaimer
The opinions expressed herein are those of the author and do not necessarily reflect those of Federal Practitioner, Frontline Medical Communications Inc., the U.S. Government, or any of its agencies. This article may discuss unlabeled or investigational use of certain drugs. Please review complete prescribing information for specific drugs or drug combinations—including indications, contraindications, warnings, and adverse effects—before administering pharmacologic therapy to patients.
1. Bica I, McGovern B, Dhar R, et al. Increasing mortality due to end-stage liver disease in patients with human immunodeficiency virus infection. Clin Infect Dis. 2001;32(3):492-497.
2. Weber R, Sabin CA, Friis-Møller, et al. Liver-related deaths in persons infected with the human immunodeficiency virus: The D:A:D study. Arch Intern Med. 2006;166(15):1632-1641.
3. Thomson EC, Fleming VM, Main J, et al. Predicting spontaneous clearance of acute hepatitis C virus in a large cohort of HIV-1-infected men. Gut. 2011;60(6):837-845.
4. Kim AY, Chung RT. Coinfection with HIV-1 and HCV--a one-two punch. Gastroenterology. 2009;137(3):795-814.
5. McGovern BH. Hepatitis C in the HIV-infected patient. J Acquir immune Defic Syndr. 2007;45(suppl 2):S47-S56; discussion S66-S67.
6. US Department of Health and Human Services. Guidelines for the use of antiretroviral agents in HIV-1-infected adults and adolescents. http://aidsinfo.nih.gov/contentfiles/lvguidelines/adultandadolescentgl.pdf. Updated November 13, 2014. Accessed December 5, 2014.
7. Silver D, Karnik G, Osinusi A, et al. Effect of HIV on liver fibrosis among HCVinfected African Americans. Clin Infect Dis. 2013;56(9):1280-1283.
8. Rodríguez-Torres M, Rodríguez-Orengo JF, Ríos-Bedoya CF, et al. Effect of hepatitis C virus treatment in fibrosis progression rate (FPR) and time to cirrhosis (TTC) in patients co-infected with human immunodeficiency virus: a paired liver biopsy study. J Hepatol. 2007;46(4):613-619.
9. Berenguer J, Alvarez-Pellicer J, Carrero A, et al; GESIDA HIV/HCV Cohort Study Group. Clinical effects of viral relapse after interferon plus ribavirin in patients co-infected with human immunodeficiency virus and hepatitis C virus. J Hepatol. 2013;58(6):1104-1112.
10. Ghany MG, Strader DB, Thomas DL, Seeff LB; American Association for the Study
of Liver Diseases. Diagnosis, management, and treatment of hepatitis C: An update. Hepatology. 2009;49(4):1335-1374.
11. Al lison RD, Katsounas A, Koziol DE, et al. Association of interleukin-15-induced peripheral immune activation with hepatic stellate cell activation in persons coinfected with hepatitis C virus and HIV. J Infect Dis. 2009;200(4):619-623.
12. Ba lagopal A, Ray SC, De Oca RM, et al. Kupffer cells are depleted with HIV immunodeficiency and partially recovered with antiretroviral immune reconstitution. AIDS. 2009;23(18):2397-2404.
13. Pe gasys [package insert]. South San Francisco, CA: Genentech USA, Inc; 2014.
14. Pegintron [package insert]. Whitehouse Station, NJ: Merck & Co, Inc; 2013.
15. Rebetol [package insert]. Whitehouse Station, NJ: Merck & Co, Inc; 2013.
16. Victrelis [package insert]. Whitehouse Station, NJ: Merck & Co, Inc; 2013.
17. Incivek [package insert]. Cambridge, MA: Vertex Pharamaceuticals Inc; 2013.
18. Sovaldi [package insert]. Foster City, CA: Gilead Sciences, Inc; 2014.
19. Olysio [package insert]. Titusville, NJ: Janssen Therapeutics; 2014.
20. Harvoni [package insert]. Foster City, CA: Gilead Sciences, Inc.; 2014.
21. Jacobson IM, McHutchison JG, Dusheiko G, et al; ADVANCE Study Team. Telaprevir for previously untreated chronic hepatitis C virus infection. N Engl J Med.2011;364(25):2405-2416.
22. Sherman KE, Flamm SL, Afdhal NH, et al; ILLUMINATE Study Team. Responseguided telaprevir combination treatment for hepatitis C virus infection. N Engl J Med. 2011;365(11):1014-1024.
23. Ge D, Fellay J, Thompson AJ, et al. Genetic variation in IL28B predicts hepatitis C treatment-induced viral clearance. Nature. 2009;461(7262):399-4
24. Kempuraj D, Donelan J, Frydas S, et al. Interleukin-28 and 29 (IL-28 and IL-29): new cytokines with anti-viral activities. Int J Immunopathol Pharmacol. 2004;17(2):103-106.
25. Townsend KS, Osinsi A, Nelson AK, et al, High Efficacy of sofosbuvir/ledipasvir for the treatment of HCV genotype 1 in patients coinfected with HIV on or off antiretroviral therapy: Results from the NIAID ERADICATE Trial.¤Presented at: American Association for the Study of Liver Diseases (AASLD) Liver Meeting. Boston, MA; November 7-11, 2014; Abstract 84.
26. Manns MP, McHutchison JG, Gordon SC, et al. Peginterferon alfa-2b plus ribavirin compared with interferon alfa-2b plus ribavirin for initial treatment of chronic hepatitis C: A randomised trial. Lancet. 2001;358(9286):958-965.
27. Poordad F, McCone J Jr, Bacon BR, et al; SPRINT-2 Investigators. Boceprevir for untreated chronic HCV genotype 1 infection. N Engl J Med. 2011;364(13):1195-1206.
28. Thomas DL, Bartlett JG, Peters MG, Sherman KE, Sulkowski MS, Pham PA. Provisional guidance on the use of hepatitis C virus protease inhibitors for treatment of hepatitis C in HIV-infected persons. Clin Infect Dis. 2012;54(7):979-983.
29. Sulkowski MS, Sherman KE, Dieterich DT, et al. Combination therapy with telaprevir for chronic hepatitis C virus genotype 1 infection in patients with HIV: A randomized trial. Ann Intern Med. 2013;159(2):86-96.
30. Sulkowski MS, Rodriguez-Torres M, Lalezari JP, et al. All-oral therapy with sofosbuvir plus ribavirin for the treatment of HCV genotype 1, 2, and 3 infection in patients co-infected with HIV (PHOTON-1). Hepatology. 2013;58(suppl 1):313A. Abstract 212.
31. Advances in the treatment of hepatitis C virus infection from EASL 2013. Gastroenterol Hepatol (N Y). 2013;9(6 suppl 3):1-18.
In an era of potent antiretroviral therapy (ART), end stage liver disease (ESLD) is the second leading cause of death among patients with human immumodeficiency virus (HIV) infections who are co-infected with hepatitis C virus (HCV).1,2 In the U.S., HCV infection is the major cause of liver failure, liver transplantation, and liver disease associated death, with an annual mortality that now exceeds that of HIV.1,2 It is estimated that 30% to 35% of persons with HIV infection also have HCV infection.1,2 Interestingly, patients with underlying HIV have a lower rate of spontaneous hepatitis C virologic clearance during acute infection, which is thought to be directly related to their level of underlying immune suppression and immune function.3 The consequences of HCV infection in this population are significant and include accelerated liver disease and fibrosis progression, higher rates of ESLD, and shortened life span after hepatic decompensation.4,5 Because of these complications, the U.S. Department of Health and Human Services (DHHS) recommends that all HIV-infected patients should be screened for HCV infection, preferably before starting ART.6
HCV Treatment for HIV-HCV Co-Infection
The higher rates of fibrosis progression, decompensated liver disease, and morbidity and mortality secondary to ESLD compared with patients with HCV monoinfection are a major impetus to treat HCV in patients with HIV-HCV co-infection. However, there are very limited data on the safety and efficacy of the available antiviral agents for co-infection. The current paradigm is to stage patients before HCV treatment since those patients with minimal fibrosis may be able to wait for future less toxic or complex therapies, while HCV therapy should be offered to patients with portal or higher stages of fibrosis.7 Today with simpler and more effective therapies, even this paradigm is rapidly shifting to offering treatment for all infected patients.
The goal of HCV therapy is to achieve sustained virologic response (SVR), undetectable HCV RNA levels 24 weeks after the end of treatment. This endpoint is the gold standard of treatment-induced viral eradication and is used as the primary endpoint for treatment of HCV regardless of HIV status. Secondary goals are achieved upon viral eradication, including the reduction in morbidity and mortality associated with liver disease (eg, fibrosis/inflammation, hepatocellular carcinoma [HCC]).8 Failure to achieve SVR leaves the patient with continued risk of liver disease progression, including fibrosis and liver decompensation. Interestingly, in patients who have received treatment with peginterferon and ribavirin, there are data supporting a lower risk of liver-related mortality, hepatic decompensation, and liver stiffness when initial SVR is achieved, but there is a subsequent relapse (reappearance of HCV RNA).9
The complex decision to treat a patient with HIV infection for HCV is based on the stage of liver disease along with HCV genotype, viral load (VL), presence of comorbidities, and stability of the patient’s HIV regimen (if any). This is a long-term commitment for the patient, and his or her readiness to undergo and adhere to therapy is as important as the regimen. Given this complexity, it is also clear that treatment of HCV in either HCV alone or HIV-HCV co-infection should not be attempted without consultation and guidance from an infectious diseases or gastroenterology physician who has experience and training in the management of HCV and HIV. In general, a team of providers, including the physician, pharmacist, and social worker are required to ensure safety, compliance, and efficacy.
The timing of treatment is important in patients with bridging fibrosis or cirrhosis. However, treatment of mild to moderate disease can also be justified given the data supporting more rapid disease progression in patients with HIV-HCV co-infection, although not as pressing.4,5 The best indicator for disease stage remains liver biopsy, which is assessed for grade and stage of the liver injury. There are 3 primary reasons for performing a liver biopsy: (1) It provides useful information on the status of the liver injury; (2) It identifies features useful in the decision to initiate therapy; and (3) It may reveal advanced fibrosis or cirrhosis that necessitates surveillance for HCC. The biopsy also provides information on other histologic features that might have a bearing on liver disease progression.10 However, there are clear contraindications to treatment, including a history of decompensated cirrhosis (may be exacerbated by treatment), pregnancy (teratogenicity of ribavirin), or uncontrolled depression and unstable cardiac or pulmonary conditions.6 Patients with untreated/uncontrolled HIV and/or AIDS are not optimal for treatment.10
In patients presenting with HIV and HCV coinfection the order of HIV or HCV treatment does affect patient outcomes.6 Recommendations from the DHHS HIV task force are that all treatment-naive HIV/HCV coinfected patients be initiated on HIV ART regardless of their CD4 cell count.6 In patients with lower CD4 counts (eg, < 200 cells/mm3), it may be preferable to initiate ART and delay HCV therapy until CD4 count increases. The importance of immune reconstitution and function has been demonstrated by studies that show ART may slow the progression of liver disease by preserving or restoring immune function and reducing HIV-related immune activation and inflammation.
There is also evidence to support the model that HCV viremia increase proportionally to the extent of CD4 cell count decline; although there is no direct correlation between extent of liver damage and viremia there are direct implications for therapy.10 For most HIV-HCV co-infected patients, including those with cirrhosis, the benefits of ART outweigh concerns regarding drug-induced liver injury. Therefore, ART should be considered for patients with HIV-HCV co-infection, regardless of CD4 count, and treatment of HCV may be deferred until there is a rise in the CD4 count.11,12
Current Treatment Regimens
Antiretroviral regimens for patients with HIV-HCV coinfection are generally the same as those for individuals without HIV infection (Table).13-20 Importantly, when treating both infections the provider must consider the large pill burden, drug-drug interactions, and overlapping toxicities (in particular hepatic) prior to
starting therapy. The same predictors as those for monoinfection apply to co-infected patients, including the level of baseline viremia, with high-level viremia having a negative impact on overall SVR rates in clinical trials with the new protease inhibitor boceprevir (although it did not impact telaprevircontaining
regimens).21,22 Another factor that predicts treatment response is the HCV genotype (total of 6). In the U.S., genotype 1 accounts for 70% to 75% of HCV infections. Genotype 1a is responsible for two-thirds, and genotype 1b for one-third of genotype 1 infections. In treatment studies to date, genotype 1b is less likely to develop viral drug resistance and therefore has a higher treatment cure rate than HCV genotype 1a.
Treatment success with interferon-based regimens is also influenced by the patient’s interleukin 28B gene (IL28B) polymorphism. Patients with the IL28B CC genotype have a greater response than those with IL28B TT genotype.23 IL28B is a member of the type III interferon system. Interferons are part of the innate immune response of host cells to pathogens in particular viruses. They establish an antiviral state by inhibiting protein synthesis, alerting the immune system to the presence of pathogen, and inducing proteins with antiviral activity. Interferons are pivotal factors in fighting viral infections and establishing an antiviral state
in the infected and surrounding cells.24 Currently, we do not routinely determine IL28B genotypes; however, as technology improves and genotyping becomes more commercially available, this may be incorporated into routine practice. Moreover, with the second generation HCV drugs, including simpeprevir and sofosbuvir, the IL28 genotype is not a factor as new recommendations include interferon-free regimens.25
Peginterferon alpha plus ribavirin has been the mainstay of therapy since 2001, producing an overall 40% response in treated patients with HCV genotype 1.26 More recently, 4 classes of direct-acting antiviral (DAA) agents have been developed, including nonstructural protein 3/4A (NS3/4A) protease inhibitors (PIs), nonstructural protein 5B (NS5B) nucleoside inhibitors, NS5B non-nucleoside inhibitors, and nonstructural protein 5A (NS5A) inhibitors. Of these classes, the PIs boceprevir and telaprevir have been in use since 2011 and have significantly improved response rates to therapy for genotype 1 infection. These drugs, however, continue to require peginterferon and ribavirin therapy; therefore many of the barriers to therapy that existed previously remain.
Several clinical trials demonstrated significantly increased efficacy with PI backed therapy when compared with standard interferon ribavirin regimens in treatment-naive and treatment-experienced nonresponders/patients who have relapsed.21,22,27 Previously one of the main treatment predictors was the rapidity of viral suppression assessed at 4 weeks of therapy. If patients have a rapid virologic response (ie, > 2 log decrease in VL), they generally do well with sustained viral suppression. However, this predictor becomes unclear as the DAA are used. Because of their potency with rapid viral suppression, the durability of the rapid virologic response and its use as a predictor of treatment success becomes uncertain. To date, there have been few clinical trials completed and published on the efficacy and safety of this triple drug regimen in the HIV-HCV co-infected patient. However, what data there is available is encouraging.
In a phase 2 clinical trial of genotype 1 co-infected patients after a 4-week peginterferon and ribavirin leadin, boceprevir was initiated and continued for 44 weeks vs continuation of standard of care with peginterferon and ribavirin. In this cohort 42% of patients in the boceprevir arm achieved viral suppression at week 8 vs 15% in the standard therapy arm. At 24 weeks postcompletion of therapy, 63% of patient maintained SVR compared with 29% in the standard arm. Importantly, co-infected patients did not have new previously unreported adverse events (AEs), and the percentage of patients with AEs seemed to be similar to those with HCV infection alone.28 Similar studies of telaprevir also demonstrated more effective therapy than did the standard of care in co-infected patients. Another study evaluating telaprevir utilized a small cohort of 60 patients with genotype 1 infection. They were treated for 12 weeks with peginterferon, ribavirin, and telaprevir followed by an additional 36 weeks of peginterferon and ribavirin. After 4 weeks of therapy, 68% of patients in the telaprevir arm had rapid virologic response compared with none of the patients in the standard therapy arm. Patients included in this cohort had higher VL and advanced liver disease. Upon completion of the study at both 12 and 24 weeks posttherapy, 74% vs 24% of patients had SVR, respectively. Safety data in this study also demonstrated similar toxicity profiles as those with HCV monoinfection.29
In recent months the FDA approved the protease inhibitor simeprevir with pegylated interferon and ribavirin for the treatment of patients with HCV genotype 1. In addition, the FDA also approved sofosbuvir with pegylated interferon and ribavirin for the treatment of HCV genotype 1, and sofosbuvir and ribavirin for the treatment of HCV genotypes 2 and 3. Oral sofosbuvir plus ribavirin in patients with HCV and HIV infection (CD4 count > 500 cells/μL) resulted in an SVR of 76% in patients with genotype 1, 88% in those with genotype 2, and 67% in those with genotype 3.30 The sofosbuvir regimen utilized in the PHOTON-1 trial is an interferon-free regimen, the first time there has been success with interferon-free regimens in this population.30 A new study released in early November at the American Association for the Study of Liver Diseases meeting presented data from the ERADICATE trial, which was designed to test a simple once daily regimen of sofosbuvir and ledipasvir (a new inhibitor of HCV NS5A, a viral phosphoprotein that plays an important role in viral replication, assembly, and secretion) in 50 patients. Results presented demonstrated that at 12 weeks posttreatment all patients in the ART untreated group and all but one in the ART treated group had undetectable HCV RNA. The overall SVR rate was 98% for this study. This is the first time an interferon and ribavirin-free regimen has shown clear efficacy in the treatment and cure of HCV infection.25 New guidelines for the treatment of patients with HCV-HIV co-infection are expected to be released in the immediate future.
Conclusion
The sudden and dramatic change in hepatitis C management is now here, with an extraordinary array of new drugs expected to cure the majority of hepatitis C-infected patients.31 It remains an exciting time in the field as for the first time we may be able to reach solid cure rates with simpler, more accessible regimens, in particular as we are on the threshold of totally oral therapy. One of the greatest limitations has been and will remain the economics of therapy (Table), which is not discussed here but remains at the forefront of barriers to care and cure.
Author disclosures
The author reports no actual or potential conflicts of interest with regard to this article.
Disclaimer
The opinions expressed herein are those of the author and do not necessarily reflect those of Federal Practitioner, Frontline Medical Communications Inc., the U.S. Government, or any of its agencies. This article may discuss unlabeled or investigational use of certain drugs. Please review complete prescribing information for specific drugs or drug combinations—including indications, contraindications, warnings, and adverse effects—before administering pharmacologic therapy to patients.
1. Bica I, McGovern B, Dhar R, et al. Increasing mortality due to end-stage liver disease in patients with human immunodeficiency virus infection. Clin Infect Dis. 2001;32(3):492-497.
2. Weber R, Sabin CA, Friis-Møller, et al. Liver-related deaths in persons infected with the human immunodeficiency virus: The D:A:D study. Arch Intern Med. 2006;166(15):1632-1641.
3. Thomson EC, Fleming VM, Main J, et al. Predicting spontaneous clearance of acute hepatitis C virus in a large cohort of HIV-1-infected men. Gut. 2011;60(6):837-845.
4. Kim AY, Chung RT. Coinfection with HIV-1 and HCV--a one-two punch. Gastroenterology. 2009;137(3):795-814.
5. McGovern BH. Hepatitis C in the HIV-infected patient. J Acquir immune Defic Syndr. 2007;45(suppl 2):S47-S56; discussion S66-S67.
6. US Department of Health and Human Services. Guidelines for the use of antiretroviral agents in HIV-1-infected adults and adolescents. http://aidsinfo.nih.gov/contentfiles/lvguidelines/adultandadolescentgl.pdf. Updated November 13, 2014. Accessed December 5, 2014.
7. Silver D, Karnik G, Osinusi A, et al. Effect of HIV on liver fibrosis among HCVinfected African Americans. Clin Infect Dis. 2013;56(9):1280-1283.
8. Rodríguez-Torres M, Rodríguez-Orengo JF, Ríos-Bedoya CF, et al. Effect of hepatitis C virus treatment in fibrosis progression rate (FPR) and time to cirrhosis (TTC) in patients co-infected with human immunodeficiency virus: a paired liver biopsy study. J Hepatol. 2007;46(4):613-619.
9. Berenguer J, Alvarez-Pellicer J, Carrero A, et al; GESIDA HIV/HCV Cohort Study Group. Clinical effects of viral relapse after interferon plus ribavirin in patients co-infected with human immunodeficiency virus and hepatitis C virus. J Hepatol. 2013;58(6):1104-1112.
10. Ghany MG, Strader DB, Thomas DL, Seeff LB; American Association for the Study
of Liver Diseases. Diagnosis, management, and treatment of hepatitis C: An update. Hepatology. 2009;49(4):1335-1374.
11. Al lison RD, Katsounas A, Koziol DE, et al. Association of interleukin-15-induced peripheral immune activation with hepatic stellate cell activation in persons coinfected with hepatitis C virus and HIV. J Infect Dis. 2009;200(4):619-623.
12. Ba lagopal A, Ray SC, De Oca RM, et al. Kupffer cells are depleted with HIV immunodeficiency and partially recovered with antiretroviral immune reconstitution. AIDS. 2009;23(18):2397-2404.
13. Pe gasys [package insert]. South San Francisco, CA: Genentech USA, Inc; 2014.
14. Pegintron [package insert]. Whitehouse Station, NJ: Merck & Co, Inc; 2013.
15. Rebetol [package insert]. Whitehouse Station, NJ: Merck & Co, Inc; 2013.
16. Victrelis [package insert]. Whitehouse Station, NJ: Merck & Co, Inc; 2013.
17. Incivek [package insert]. Cambridge, MA: Vertex Pharamaceuticals Inc; 2013.
18. Sovaldi [package insert]. Foster City, CA: Gilead Sciences, Inc; 2014.
19. Olysio [package insert]. Titusville, NJ: Janssen Therapeutics; 2014.
20. Harvoni [package insert]. Foster City, CA: Gilead Sciences, Inc.; 2014.
21. Jacobson IM, McHutchison JG, Dusheiko G, et al; ADVANCE Study Team. Telaprevir for previously untreated chronic hepatitis C virus infection. N Engl J Med.2011;364(25):2405-2416.
22. Sherman KE, Flamm SL, Afdhal NH, et al; ILLUMINATE Study Team. Responseguided telaprevir combination treatment for hepatitis C virus infection. N Engl J Med. 2011;365(11):1014-1024.
23. Ge D, Fellay J, Thompson AJ, et al. Genetic variation in IL28B predicts hepatitis C treatment-induced viral clearance. Nature. 2009;461(7262):399-4
24. Kempuraj D, Donelan J, Frydas S, et al. Interleukin-28 and 29 (IL-28 and IL-29): new cytokines with anti-viral activities. Int J Immunopathol Pharmacol. 2004;17(2):103-106.
25. Townsend KS, Osinsi A, Nelson AK, et al, High Efficacy of sofosbuvir/ledipasvir for the treatment of HCV genotype 1 in patients coinfected with HIV on or off antiretroviral therapy: Results from the NIAID ERADICATE Trial.¤Presented at: American Association for the Study of Liver Diseases (AASLD) Liver Meeting. Boston, MA; November 7-11, 2014; Abstract 84.
26. Manns MP, McHutchison JG, Gordon SC, et al. Peginterferon alfa-2b plus ribavirin compared with interferon alfa-2b plus ribavirin for initial treatment of chronic hepatitis C: A randomised trial. Lancet. 2001;358(9286):958-965.
27. Poordad F, McCone J Jr, Bacon BR, et al; SPRINT-2 Investigators. Boceprevir for untreated chronic HCV genotype 1 infection. N Engl J Med. 2011;364(13):1195-1206.
28. Thomas DL, Bartlett JG, Peters MG, Sherman KE, Sulkowski MS, Pham PA. Provisional guidance on the use of hepatitis C virus protease inhibitors for treatment of hepatitis C in HIV-infected persons. Clin Infect Dis. 2012;54(7):979-983.
29. Sulkowski MS, Sherman KE, Dieterich DT, et al. Combination therapy with telaprevir for chronic hepatitis C virus genotype 1 infection in patients with HIV: A randomized trial. Ann Intern Med. 2013;159(2):86-96.
30. Sulkowski MS, Rodriguez-Torres M, Lalezari JP, et al. All-oral therapy with sofosbuvir plus ribavirin for the treatment of HCV genotype 1, 2, and 3 infection in patients co-infected with HIV (PHOTON-1). Hepatology. 2013;58(suppl 1):313A. Abstract 212.
31. Advances in the treatment of hepatitis C virus infection from EASL 2013. Gastroenterol Hepatol (N Y). 2013;9(6 suppl 3):1-18.
Observation, Visit Status, and RAC Audits
Medicare patients are increasingly hospitalized as outpatients under observation. From 2006 to 2012, outpatient services grew nationally by 28.5%, whereas inpatient discharges decreased by 12.6% per Medicare beneficiary.[1] This increased use of observation stays for hospitalized Medicare beneficiaries and the recent Centers for Medicare & Medicaid Services (CMS) 2‐Midnight rule for determination of visit status are increasing areas of concern for hospitals, policymakers, and the public,[2] as patients hospitalized under observation are not covered by Medicare Part A hospital insurance, are subject to uncapped out‐of‐pocket charges under Medicare Part B, and may be billed by the hospital for certain medications. Additionally, Medicare beneficiaries hospitalized in outpatient status, which includes all hospitalizations under observation, do not qualify for skilled nursing facility care benefits after discharge, which requires a stay that spans at least 3 consecutive midnights as an inpatient.[3]
In contrast, the federal Recovery Audit program, previously called and still commonly referred to as the Recovery Audit Contractor (RAC) program, responsible for postpayment review of inpatient claims, has received relatively little attention. Established in 2006, and fully operationalized in federal fiscal year (FY) 2010,[4] RACs are private government contractors granted the authority to audit hospital charts for appropriate medical necessity, which can consider whether the care delivered was indicated and whether it was delivered in the appropriate Medicare visit status, outpatient or inpatient. Criteria for hospitalization status (inpatient vs outpatient) as defined in the Medicare Conditions of Participation, often allow for subjectivity (medical judgment) in determining which status is appropriate.[5] Hospitals may contest RAC decisions and payment denials through a preappeals discussion period, then through a 5‐level appeals process. Although early appeals occur between the hospital and private contractors, appeals reaching level 3 are heard by the Department of Health and Human Services (HHS) Office of Medicare Hearings and Appeals (OMHA) Administrative Law Judges (ALJ). Levels 4 (Medicare Appeals Council) and 5 (United States District Court) appeals are also handled by the federal government.[6]
Medicare fraud and abuse should not be tolerated, and systematic surveillance needs to be an integral part of the Medicare program.[4] However, there are increasing concerns that the RAC program has resulted in overaggressive denials.[7, 8] Unlike other Medicare contractors, RAC auditors are paid a contingency fee based on the percentage of hospital payment recouped for cases they audit and deny for improper payment.[4] RACs are not subject to any financial penalty for cases they deny but are overturned in the discussion period or in the appeals process. This may create an incentive system that financially encourages RACs to assert improper payment, and the current system lacks both transparency and clear performance metrics for auditors. Of particular concern are Medicare Part A complex reviews, the most fiscally impactful area of RAC activity. According to CMS FY 2013 data, 41.1% of all claims with collections were complex reviews, yet these claims accounted for almost all (95.2%) of total dollars recovered by the RACs, with almost all (96%) dollars recovered being from Part A claims.[9] Complex reviews involve an auditor retrospectively and manually reviewing a medical record and then using his or her clinical and related professional judgment to decide whether the care was medically necessary. This is compared to automated coding or billing reviews, which are based solely on claims data.
Increased RAC activity and the willingness of hospitals to challenge RAC findings of improper payment has led to an increase in appeals volume that has overloaded the appeals process. On March 13, 2013, CMS offered hospitals the ability to rebill Medicare Part B as an appeals alternative.[10] This did not temper level 3 appeals requests received by the OMHA, which increased from 1250 per week in January 2012 to over 15,000 per week by November 2013.[11] Citing an overwhelmingly increased rate of appeal submissions and the resultant backlog, the OMHA decided to freeze new hospital appeals assignments in December 2013.[11] In another attempt to clear the backlog, on August 29, 2014, CMS offered a settlement that would pay hospitals 68% of the net allowable amount of the original Part A claim (minus any beneficiary deductibles) if a hospital agreed to concede all of its eligible appeals.[12] Notably, cases settled under this agreement would remain officially categorized as denied for improper payment.
The HHS Office of Inspector General (OIG)[4] and the CMS[9, 13, 14] have produced recent reports of RAC auditing and appeals activity that contain variable numbers that conflict with hospital accounts of auditing and appeals activity.[15, 16] In addition to these conflicting reports, little is known about RAC auditing of individual programs over time, the length of time cases spend in appeals, and staff required to navigate the audit and appeals processes. Given these questions, and the importance of RAC auditing pressure in the growth of hospital observation care, we conducted a retrospective descriptive study of all RAC activity for complex Medicare Part A alleged overpayment determinations at the Johns Hopkins Hospital, the University of Utah, and University of Wisconsin Hospital and Clinics for calendar years 2010 to 2013.
METHODS
The University of Wisconsin‐Madison Health Sciences institutional review board (IRB) and the Johns Hopkins Hospital IRB did not require review of this study. The University of Utah received an exemption. All 3 hospitals are tertiary care academic medical centers. The University of Wisconsin Hospital and Clinics (UWHC) is a 592‐bed hospital located in Madison, Wisconsin,[17] the Johns Hopkins Hospital (JHH) is a 1145‐bed medical center located in Baltimore, Maryland,[18] and the University of Utah Hospital (UU) is a 770‐bed facility in Salt Lake City, Utah (information available upon request). Each hospital is under a different RAC, representing 3 of the 4 RAC regions, and each is under a different Medicare Administrative Contractor, contractors responsible for level 1 appeals. The 3 hospitals have the same Qualified Independent Contractor responsible for level 2 appeals.
For the purposes of this study, any chart or medical record requested for review by an RAC was considered a medical necessity chart request or an audit. The terms overpayment determinations and denials were used interchangeably to describe audits the RACs alleged did not meet medical necessity for Medicare Part A billing. As previously described, the term medical necessity specifically considered not only whether actual medical services were appropriate, but also whether the services were delivered in the appropriate status, outpatient or inpatient. Appeals and/or request for discussion were cases where the overpayment determination was disputed and challenged by the hospital.
All complex review Medicare Part A RAC medical record requests by date of RAC request from the official start of the RAC program, January 1, 2010,[4] to December 31, 2013, were included in this study. Medical record requests for automated reviews that related to coding and billing clarifications were not included in this study, nor were complex Medicare Part B reviews, complex reviews for inpatient rehabilitation facilities, or psychiatric day hospitalizations. Notably, JHH is a Periodic Interim Payment (PIP) Medicare hospital, which is a reimbursement mechanism where biweekly payments [are] made to a Provider enrolled in the PIP program, and are based on the hospital's estimate of applicable Medicare reimbursement for the current cost report period.[19] Because PIP payments are made collectively to the hospital based on historical data, adjustments for individual inpatients could not be easily adjudicated and processed. Due to the increased complexity of this reimbursement mechanism, RAC audits did not begin at JHH until 2012. In addition, in contrast to the other 2 institutions, all of the RAC complex review audits at JHH in 2013 were for Part B cases, such as disputing need for intensity‐modulated radiation therapy versus conventional radiation therapy, or contesting the medical necessity of blepharoplasty. As a result, JHH had complex Part A review audits only for 2012 during the study time period. All data were deidentified prior to review by investigators.
As RACs can audit charts for up to 3 years after the bill is submitted,[13] a chart request in 2013 may represent a 2010 hospitalization, but for purposes of this study, was logged as a 2013 case. There currently is no standard methodology to calculate time spent in appeals. The UWHC and JHH calculate time in discussion or appeals from the day the discussion or appeal was initiated by the hospital, and the UU calculates the time in appeals from the date of the findings letter from the RAC, which makes comparable recorded time in appeals longer at UU (estimated 510 days for 20112013 cases, up to 120 days for 2010 cases).Time in appeals includes all cases that remain in the discussion or appeals process as of June 30, 2014.
The RAC process is as follows (Tables 1 and 2):
- The RAC requests hospital claims (RAC Medical Necessity Chart Requests [Audits]).
- The RAC either concludes the hospital claim was compliant as filed/paid and the process ends or the RAC asserts improper payment and requests repayment (RAC Overpayment Determinations of Requested Charts [Denials]).
- The hospital makes an initial decision to not contest the RAC decision (and repay), or to dispute the decision (Hospital Disputes Overpayment Determination [Appeal/Discussion]). Prior to filing an appeal, the hospital may request a discussion of the case with an RAC medical director, during which the RAC medical director can overturn the original determination. If the RAC declines to overturn the decision in discussion, the hospital may proceed with a formal appeal. Although CMS does not calculate the discussion period as part of the appeals process,[12] overpayment determinations contested by the hospital in either discussion or appeal represent the sum total of RAC denials disputed by the hospital.
Contested cases have 1 of 4 outcomes:
Contested overpayment determinations can be decided in favor of the hospital (Discussion or Appeal Decided in Favor of Hospital or RAC Withdrew)
- Contested overpayment determinations can be decided in favor of the RAC during the appeal process, and either the hospital exhausts the appeal process or elects not to take the appeal to the next level. Although the appeals process has 5 levels, no cases at our 3 hospitals have reached level 4 or 5, so cases without a decision to date remain in appeals at 1 of the first 3 levels (Case Still in Discussion or Appeals).[4]
- Hospital may miss an appeal deadline (Hospital Missed Appeal Deadline at Any Level) and the case is automatically decided in favor of the RAC.
- As of March 13, 2013,[10] for appeals that meet certain criteria and involve dispute over the billing of hospital services under Part A, CMS allowed hospitals to withdraw an appeal and rebill Medicare Part B. Prior to this time, hospitals could rebill for a very limited list of ancillary Part B Only services, and only within the 1‐year timely filing period.[13] Due to the lengthy appeals process and associated legal and administrative costs, hospitals may not agree with the RAC determination but make a business decision to recoup some payment under this mechanism (Hospital Chose to Rebill as Part B During Discussion or Appeals Process).
| Totals | Johns Hopkins Hospital | ||||||||||
|---|---|---|---|---|---|---|---|---|---|---|---|
| 2010 | 2011 | 2012 | 2013 | All Years | 2010 | 2011 | 2012 | 2013 | All Years | ||
| University of Wisconsin Hospital and Clinics | University of Utah | ||||||||||
| 2010 | 2011 | 2012 | 2013 | All Years | 2010 | 2011 | 2012 | 2013 | All Years | ||
| |||||||||||
| Total no. of Medicare encounters | 24,400 | 24,998 | 25,370 | 27,094 | 101,862 | 11,212b | 11,750b | 11,842 | 12,674c | 47,478 | |
| RAC Medical Necessity Chart Requests (Audits) | 547 | 1,735 | 3,887 | 1,941 | 8,110 (8.0%) | 0 | 0 | 938 | 0 | 938 (2.0%) | |
| RAC Overpayment Determinations Of Requested Charts (Denials)d | 164 (30.0%) | 516 (29.7%) | 1,200 (30.9%) | 656 (33.8%) | 2,536 (31.3%) | 0 (0%) | 0 (0%) | 432 (46.1%) | 0 (0%) | 432 (46.1%) | |
| Hospital Disputes Overpayment Determination (Appeal/Discussion) | 128 (78.0%) | 409 (79.3%) | 1,129 (94.1%) | 643 (98.0%) | 2,309 (91.0% | 0 (0%) | 0 (0%) | 431 (99.8%) | 0 (0%) | 431 (99.8%) | |
| Outcome of Disputed Overpayment Determinatione | |||||||||||
| Hospital Missed Appeal Deadline at Any Level | 0 (0.0%) | 1 (0.2%) | 13 (1.2%) | 4 (0.6%) | 18 (0.8%) | 0 (0%) | 0 (0%) | 0 (0.0%) | 0 (0%) | 0 (0.0%) | |
| Hospital Chose To Rebill as Part B During Discussion Or Appeals Process | 80 (62.5%) | 202 (49.4%) | 511 (45.3%) | 158 (24.6%) | 951 (41.2%) | 0 (0%) | 0 (0%) | 208 (48.3%) | 0 (0%) | 208 (48.3%) | |
| Discussion or Appeal Decided In Favor Of Hospital or RAC Withdrewf | 45 (35.2%) | 127 (31.1%) | 449 (39.8%) | 345 (53.7%) | 966 (41.8%) | 0 (0%) | 0 (0%) | 151 (35.0%) | 0 (0%) | 151 (35.0%) | |
| Case Still in Discussion or Appeals | 3 (2.3%) | 79 (19.3%) | 156 13.8%) | 136 (21.2%) | 374 (16.2%) | 0 (0%) | 0 (0%) | 72 (16.7%) | 0 (0%) | 72 (16.7%) | |
| Mean Time for Cases Still in Discussion or Appeals, d (SD) | 1208 (41) | 958 (79) | 518 (125) | 350 (101) | 555 (255) | N/A | N/A | 478 (164) | N/A | 478 (164) | |
| Total no. of Medicare encounters l | 8,096 | 8,038 | 8,429 | 9,086 | 33,649 | 5,092 | 5,210 | 5,099 | 5,334 | 20,735 | |
| RAC Medical Necessity Chart Requests (Audits) | 15 | 526 | 1,484 | 960 | 2,985 (8.9%) | 532 | 1,209 | 1,465 | 981 | 4,187 (20.2%) | |
| RAC Overpayment Determinations of Requested Charts (Denials)bd | 3 (20.0%) | 147 (27.9%) | 240 (16.2%) | 164 (17.1%) | 554 (18.6%) | 161 (30.3%) | 369 (30.5%) | 528 (36.0%) | 492 (50.2%) | 1,550 (37.0%) | |
| Hospital Disputes Overpayment Determination (Appeal/Discussion) | 1 (33.3%) | 71 (48.3%) | 170 (70.8%) | 151 (92.1%) | 393 (70.9%) | 127 (78.9%) | 338 (91.6%) | 528 (100.0%) | 492 (100.0%) | 1,485 (95.8%) | |
| Outcome of Disputed Overpayment Determinatione | |||||||||||
| Hospital Missed Appeal Deadline at Any Level | 0 (0.0%) | 1 (1.4%) | 0 (0.0%) | 4 (2.6%) | 5 (1.3%) | 0 (0.0%) | 0 (0.0%) | 13 (2.5%) | 0 (0.0%) | 13 (0.9%) | |
| Hospital Chose to Rebill as Part B During Discussion or Appeals Process | 1 (100%) | 3 (4.2%) | 13 (7.6%) | 3 (2.0%) | 20 (5.1%) | 79 (62.2%) | 199 (58.9%) | 290 (54.9%) | 155 (31.5%) | 723 (48.7%) | |
| Discussion or Appeal Decided in Favor of Hospital or RAC Withdrewf | 0 (0.0%) | 44 (62.0%) | 123 (72.4%) | 93 (61.6%) | 260 (66.2%) | 45 (35.4%) | 83 (24.6%) | 175 (33.1%) | 252 (51.2%) | 555 (37.4%) | |
| Case Still in Discussion or Appeals | 0 0.0% | 23 (32.4%) | 34 (20.0%) | 51 (33.8%) | 108 (27.5%) | 3 (2.4%) | 56 (16.6%) | 50 (9.5%) | 85 (17.3%) | 194 (13.1%) | |
| Mean Time for Cases Still in Discussion or Appeals, d (SD) | N/A | 926 (70) | 564 (90) | 323 (134) | 528 (258) | 1,208 (41) | 970 (80) | 544 (25) | 365 (72) | 599 (273) | |
| 2010 | 2011 | 2012 | 2013 | All | 2010 | 2011 | 2012 | 2013 | All | |
|---|---|---|---|---|---|---|---|---|---|---|
| Total Appeals With Decisions | Johns Hopkins Hospital | |||||||||
| Total no. | 125 | 330 | 973 | 507 | 1,935 | 0 | 0 | 359 | 0 | 359 |
| ||||||||||
| Hospital Missed Appeal Deadline at Any Level | 0 (0.0%) | 1 (0.3%) | 13 (1.3%) | 4 (0.8%) | 18 (0.9%) | 0 (0.0%) | 0 (0.0%) | 0 (0.0%) | 0 (0.0%) | 0 (0.0%) |
| Hospital Chose to Rebill as Part B During Discussion or Appeals Process | 80 (64.0%) | 202 (61.2%) | 511 (52.5%) | 158 (31.2%) | 951 (49.1%) | 0 (0.0%) | 0 (0.0%) | 208 (57.9%) | 0 (0.0%) | 208 (57.9%) |
| Discussion or Appeal Decided in Favor of Hospital or RAC Withdrew | 45 (36.0%) | 127 (38.5%) | 449 (46.1%) | 345 (68.0%) | 966 (49.9%) | 0 (0.0%) | 0 (0.0%) | 151 (42.1%) | 0 (0.0%) | 151 (42.1%) |
| Discussion Period and RAC Withdrawals | 0 (0.0%) | 59 (17.9%) | 351 (36.1%) | 235 (46.4%) | 645 (33.3%) | 0 (0.0%) | 0 (0.0%) | 139 (38.7%) | 0 (0.0%) | 139 (38.7%) |
| Level 1 Appeal | 10 (8.0%) | 22 (6.7%) | 60 (6.2%) | 62 (12.2%)1 | 154 (8.0%) | 0 (0.0%) | 0 (0.0%) | 2 (0.6%) | 0 (0.0%) | 2 (0.6%) |
| Level 2 Appeal | 22 (17.6%) | 36 (10.9%) | 38 (3.9%) | 48 (9.5%)1 | 144 (7.4%) | 0 (0.0%) | 0 (0.0%) | 10 (2.8%) | 0 (0.0%) | 10 (2.8%) |
| Level 3 Appealc | 13 (10.4%) | 10 (3.0%) | N/A (N/A) | N/A (N/A) | 23 (1.2%) | 0 (0.0%) | 0 (0.0%) | N/A (N/A) | 0 (0.0%) | 0 (0.0%) |
| 2010 | 2011 | 2012 | 2013 | All | 2010 | 2011 | 2012 | 2013 | All | |
| University of Wisconsin Hospital and Clinics | University of Utah | |||||||||
| Total no. | 1 | 48 | 136 | 100 | 285 | 124 | 282 | 478 | 407 | 1,291 |
| Hospital Missed Appeal Deadline at Any Level | 0 (0.0%) | 1 (2.1% | 0 (0.0%) | 4 (4.0%) | 5 (1.8%) | 0 (0.0%) | 0 (0.0%) | 13 (2.7%) | 0 (0.0%) | 13 (1.0%) |
| Hospital Chose to Rebill as Part B During Discussion or Appeals Process | 1 (100.0%) | 3 (6.3% | 13 (9.6%) | 3 (3.0%) | 20 (7.0%) | 79 (63.7%) | 199 (70.6%) | 290 (60.7%) | 155 (38.1%) | 723 (56.0%) |
| Discussion or Appeal Decided in Favor of Hospital or RAC Withdrewb | 0 (0.0%) | 44 (91.7%) | 123 (90.4%) | 93 (93.0%) | 260 (91.2%) | 45 (36.3%) | 83 (29.4%) | 175 (36.6%) | 252 (61.9%) | 555 (43.0%) |
| Discussion Period and RAC Withdrawals | 0 (0.0%) | 38 (79.2%) | 66 (48.5%) | 44 (44.0%) | 148 (51.9% | 0 (0.0%) | 21 (7.4%) | 146 (30.5%) | 191 (46.9%) | 358 (27.7%) |
| Level 1 Appeal | 0 (0.0%) | 2 (4.2%) | 47 (34.6%) | 34 (34.0%) | 83 (29.1%) | 10 (8.1%) | 20 (7.1%) | 11 (2.3%) | 28 (6.9%) | 69 (5.3%) |
| Level 2 Appeal | 0 (0.0%) | 4 (8.3%) | 10 (7.4%) | 15 (15.0%) | 29 (10.2%) | 22 (17.7%) | 32 (11.3%) | 18 (3.8%) | 33 (8.1%) | 105 (8.1%) |
| Level 3 Appealc | 0 (0.0%) | N/A (N/A) | N/A (N/A) | N/A (N/A) | 0 (0.0%) | 13 (10.5%) | 10 (3.5%) | N/A (N/A) | N/A(N/A) | 23 (1.8%) |
The administration at each hospital provided labor estimates for workforce dedicated to the review process generated by the RACs based on hourly accounting of one‐quarter of work during 2012, updated to FY 2014 accounting (Table 3). Concurrent case management status determination work was not included in these numbers due to the difficulty in solely attributing concurrent review workforce numbers to the RACs, as concurrent case management is a CMS Condition of Participation irrespective of the RAC program.
| JHH | UWHC | UU | Mean | |
|---|---|---|---|---|
| ||||
| Physicians: assist with status determinations, audits, and appeals | 1.0 | 0.5 | 0.6 | 0.7 |
| Nursing administration: audit and appeal preparation | 0.9 | 0.2 | 1.9 | 1.0 |
| Legal counsel: assist with rules interpretation, audit, and appeal preparation | 0.2 | 0.3 | 0.1 | 0.2 |
| Data analyst: prepare and track reports of audit and appeals | 2.0 | 1.8 | 2.4 | 2.0 |
| Administration and other directors | 2.3 | 0.9 | 0.3 | 1.2 |
| Total FTE workforce | 6.4 | 3.7 | 5.3 | 5.1 |
Statistics
Descriptive statistics were used to describe the data. Staffing numbers are expressed as full‐time equivalents (FTE).
RESULTS
Yearly Medicare Encounters and RAC Activity of Part A Complex Reviews
RACs audited 8.0% (8110/101,862) of inpatient Medicare cases, alleged noncompliance (all overpayments) for 31.3% (2536/8110) of Part A complex review cases requested, and the hospitals disputed 91.0% (2309/2536) of these assertions. None of these cases of alleged noncompliance claimed the actual medical services were unnecessary. Rather, every Part A complex review overpayment determination by all 3 RACs contested medical necessity related to outpatient versus inpatient status. In 2010 and 2011, there were in aggregate fewer audits (2282), overpayment determinations (680), and appeals or discussion requests (537 of 680, 79.0%), compared to audits (5828), overpayment determinations (1856), and appeals or discussion requests (1772 of 1856, 95.5%) in 2012 and 2013. The hospitals appealed or requested discussion of a greater percentage each successive year (2010, 78.0%; 2011, 79.3%; 2012, 94.1%; and 2013, 98.0%). This increased RAC activity, and hospital willingness to dispute the RAC overpayment determinations equaled a more than 300% increase in appeals and discussion request volume related to Part A complex review audits in just 2 years.
The 16.2% (374/2309) of disputed cases still under discussion or appeal have spent an average mean of 555 days (standard deviation 255 days) without a decision, with time in appeals exceeding 900 days for cases from 2010 and 2011. Notably, the 3 programs were subject to Part A complex review audits at widely different rates (Table 1).
Yearly RAC Part A Complex Review Overpayment Determinations Disputed by Hospitals With Decisions
The hospitals won, either in discussion or appeal, a combined greater percentage of contested overpayment determinations annually, from 36.0% (45/125) in 2010, to 38.5% (127/330) in 2011, to 46.1% (449/973) in 2012, to 68.0% (345/507) in 2013. Overall, for 49.1% (951/1935) of cases with decisions, the hospitals withdrew or rebilled under Part B at some point in the discussion or appeals process to avoid the lengthy appeals process and/or loss of the amount of the entire claim. A total of 49.9% (966/1935) of appeals with decisions have been won in discussion or appeal over the 4‐year study period. One‐third of all resolved cases (33.3%, 645/1935) were decided in favor of the hospital in the discussion period, with these discussion cases accounting for two‐thirds (66.8%, 645/966) of all favorable resolved cases for the hospital. Importantly, if cases overturned in discussion were omitted as they are in federal reports, the hospitals' success rate would fall to 16.6% (321/1935), a number similar to those that appear in annual CMS reports.[9, 13, 14] The hospitals also conceded 18 cases (0.9%) by missing a filing deadline (Table 2).
Estimated Workforce Dedicated to Part A Complex Review Medical Necessity Audits and Appeals
The institutions each employ an average of 5.1 FTE staff to manage the audit and appeal process, a number that does not include concurrent case management staff who assist in daily status determinations (Table 3).
CONCLUSIONS
In this study of 3 academic medical centers, there was a more than 2‐fold increase in RAC audits and a nearly 3‐fold rise in overpayment determinations over the last 2 calendar years of the study, resulting in a more than 3‐fold increase in appeals or requests for discussion in 2012 to 2013 compared to 2010 to 2011. In addition, although CMS manually reviews less than 0.3% of submitted claims each year through programs such as the Recovery Audit Program,[9] at the study hospitals, complex Part A RAC audits occurred at a rate more than 25 times that (8.0%), suggesting that these types of claims are a disproportionate focus of auditing activity. The high overall complex Part A audit rate, accompanied by acceleration of RAC activity and the hospitals' increased willingness to dispute RAC overpayment determinations each year, if representative of similar institutions, would explain the appeals backlog, most notably at the ALJ (level 3) level. Importantly, none of these Part A complex review denials contested a need for the medical care delivered, demonstrating that much of the RAC process at the hospitals focused exclusively on the nuances of medical necessity and variation in interpretation of CMS guidelines that related to whether hospital care should be provided under inpatient or outpatient status.
These data also show continued aggressive RAC audit activity despite an increasing overturn rate in favor of the hospitals in discussion or on appeal each year (from 36.0% in 2010 to 68.0% in 2013). The majority of the hospitals' successful decisions occurred in the discussion period, when the hospital had the opportunity to review the denial with the RAC medical director, a physician, prior to beginning the official appeals process. The 33% overturn rate found in the discussion period represents an error rate by the initial RAC auditors that was internally verified by the RAC medical director. The RAC internal error rate was replicated at 3 different RACs, highlighting internal process problems across the RAC system. This is concerning, because the discussion period is not considered part of the formal appeals process, so these cases are not appearing in CMS or OIG reports of RAC activity, leading to an underestimation of the true successful overturned denial rates at the 3 study hospitals, and likely many other hospitals.
The study hospitals are also being denied timely due process and payments for services delivered. The hospitals currently face an appeals process that, on average, far exceeds 500 days. In almost half of the contested overpayment determinations, the hospitals withdrew a case or rebilled Part B, not due to agreement with a RAC determination, but to avoid the lengthy, cumbersome, and expensive appeals process and/or to minimize the risk of losing the amount of the entire Part A claim. This is concerning, as cases withdrawn in the appeals process are considered improper payments in federal reports, despite a large number of these cases being withdrawn simply to avoid an inefficient appeals process. Notably, Medicare is not adhering to its own rules, which require appeals to be heard in a timely manner, specifically 60 days for level 1 or 2 appeals, and 90 days for a level 3 appeal,[6, 20] even though the hospitals lost the ability to appeal cases when they missed a deadline. Even if hospitals agreed to the recent 68% settlement offer[12] from CMS, appeals may reaccumulate without auditing reform. As noted earlier, this recent settlement offer came more than a year after the enhanced ability to rebill denied Part A claims for Part B, yet the backlog remains.
This study also showed that a large hospital workforce is required to manage the lengthy audit and appeals process generated by RACs. These staff are paid with funds that could be used to provide direct patient care or internal process improvement. The federal government also directly pays for unchecked RAC activity through the complex appeals process. Any report of dollars that RACs recoup for the federal government should be considered in light of their administrative costs to hospitals and government contractors, and direct costs at the federal level.
This study also showed that RACs audited the 3 institutions differently, despite similar willingness of the hospitals to dispute overpayment determinations and similar hospital success rates in appeals or discussion, suggesting that hospital compliance with Medicare policy was not the driver of variable RAC activity. This variation may be due to factors not apparent in this study, such as variable RAC interpretation of federal policy, a decision of a particular RAC to focus on complex Medicare Part B or automated reviews instead of complex Part A reviews, or RAC workforce differences that are not specific to the hospitals. Regardless, the variation in audit activity suggests that greater transparency and accountability in RAC activity is merited.
Perhaps most importantly, this study highlights factors that may help explain differing auditing and appeals numbers reported by the OIG,[4] CMS,[9, 13, 14] and hospitals.[15, 16] Given the marked increase in RAC activity over the last 4 years, the 2010 and 2011 data included in a recent OIG report[4] likely do not represent current auditing and appeals practice. With regard to the CMS reports,[9, 13, 14] although CMS included FY 2013[9] activity in its most recent report, it did not account for denials overturned in the discussion period, as these are not technically appeals, even though these are contested cases decided in favor of the hospital. This most recent CMS report[9] uses overpayment determinations from FY 2013, yet counts appeals and decisions that occurred in 2013, with the comment that these decisions may be for overpayment determinations prior to 2013. The CMS reports also variably combine automated, semiautomated, complex Part A, and complex Part B claims in its reports, making interpretation challenging. Finally, although CMS reported an increase in improper payments recovered from FY 2011[14] ($939 million) to FY 2012[13] ($2.4 billion) to FY 2013[9] ($3.75 billion), this is at least partly a reflection of increased RAC activity as demonstrated in this study, and may reflect the fact that many hospitals do not have the resources to continually appeal or choose not to contest these cases based on a financial business decision. Importantly, these numbers now far exceed recoupment in other quality programs, such as the Readmissions Reduction Program (estimated $428 million next FY),[21] indicating the increased fiscal impact of the RAC program on hospital reimbursement.
To increase accuracy, future federal reports of auditing and appeals should detail and include cases overturned in the discussion period, and carefully describe the denominator of total audits and appeals given the likelihood that many appeals in a given year will not have a decision in that year. Percent of total Medicare claims subject to complex Part A audit should be stated. Reports should also identify and consider an alternative classification for complex Part A cases the hospital elects to rebill under Medicare Part B, and also detail on what grounds medical necessity is being contested (eg, whether the actual care delivered was not necessary or if it is an outpatient versus inpatient billing issue). Time spent in the appeals process must also be reported. Complex Part A, complex Part B, semiautomated, and automated reviews should also be considered separately, and dates of reported audits and appeals must be as current as possible in this rapidly changing environment.
In this study, RACs conducted complex Part A audits at a rate 25 times the CMS‐reported overall audit rate, confirming complex Part A audits are a particular focus of RAC activity. There was a more than doubling of RAC audits at the study hospitals from the years 2010 ‐ 2011 to 2012 ‐ 2013 and a nearly 3‐fold increase in overpayment determinations. Concomitantly, the more than 3‐fold increase in appeals and discussion volume over this same time period was consistent with the development of the current national appeals backlog. The 3 study hospitals won a greater percentage of contested cases each year, from approximately one‐third of cases in 2010 to two‐thirds of cases with decisions in 2013, but there was no appreciable decrease in RAC overpayment determinations over that time period. The majority of successfully challenged cases were won in discussion, favorable decisions for hospitals not appearing in federal appeals reports. Time in appeals exceeded 550 days, causing the hospitals to withdraw some cases to avoid the lengthy appeals process and/or to minimize the risk of losing the amount of the entire Part A claim. The hospitals also lost a small number of appeals by missing a filing deadline, yet there was no reciprocal case concession when the appeals system missed a deadline. RACs found no cases of care at the 3 hospitals that should not have been delivered, but rather challenged the status determination (inpatient vs outpatient) to dispute medical necessity of care delivered. Finally, an average of approximately 5 FTEs at each institution were employed in the audits and appeals process. These data support a need for systematic improvements in the RAC system so that fair, constructive, and cost‐efficient surveillance of the Medicare program can be realized.
Acknowledgements
The authors thank Becky Borchert, MS, RN BC, ACM, CPHQ, Program Manager for Medicare/Medicaid Utilization Review at the University of Wisconsin Hospital and Clinics; Carol Duhaney and Joan Kratz, RN, at Johns Hopkins Hospital; and Morgan Walker at the University of Utah for their assistance in data preparation and presentation. Without their meticulous work and invaluable assistance, this study would not have been possible. The authors also thank Josh Boswell, JD, for his critical review of the manuscript.
Disclosure: Nothing to report.
- Medicare Payment Advisory Commission. Hospital inpatient and observation services. 2014 Report to Congress. Medicare Payment Policy. Available at: http://www.medpac.gov/documents/reports/mar14_entirereport.pdf?sfvrsn=0. Accessed September 22, 2014.
- American Hospital Association “2‐midnight rule” lawsuit vs Department of Health and Human Services. Available at: http://www.aha.org/content/14/140414‐complaint‐2midnight.pdf. Accessed August 8, 2014.
- Centers for Medicare administrative law judge hearing program for Medicare claim appeals. Fed Regist. 2014;79(214): 65660 – 65663. Available at: http://www.hhs.gov/omha/files/omha_federal_register_notice_2014–26214.pdf. Accessed December 6, 2014.
- . Medicare fines 2,610 hospitals in third round of readmission penalties. Kaiser Health News. Available at: http://kaiserhealthnews.org/news/medicare‐readmissions‐penalties‐2015. Accessed November 30, 2014.
Medicare patients are increasingly hospitalized as outpatients under observation. From 2006 to 2012, outpatient services grew nationally by 28.5%, whereas inpatient discharges decreased by 12.6% per Medicare beneficiary.[1] This increased use of observation stays for hospitalized Medicare beneficiaries and the recent Centers for Medicare & Medicaid Services (CMS) 2‐Midnight rule for determination of visit status are increasing areas of concern for hospitals, policymakers, and the public,[2] as patients hospitalized under observation are not covered by Medicare Part A hospital insurance, are subject to uncapped out‐of‐pocket charges under Medicare Part B, and may be billed by the hospital for certain medications. Additionally, Medicare beneficiaries hospitalized in outpatient status, which includes all hospitalizations under observation, do not qualify for skilled nursing facility care benefits after discharge, which requires a stay that spans at least 3 consecutive midnights as an inpatient.[3]
In contrast, the federal Recovery Audit program, previously called and still commonly referred to as the Recovery Audit Contractor (RAC) program, responsible for postpayment review of inpatient claims, has received relatively little attention. Established in 2006, and fully operationalized in federal fiscal year (FY) 2010,[4] RACs are private government contractors granted the authority to audit hospital charts for appropriate medical necessity, which can consider whether the care delivered was indicated and whether it was delivered in the appropriate Medicare visit status, outpatient or inpatient. Criteria for hospitalization status (inpatient vs outpatient) as defined in the Medicare Conditions of Participation, often allow for subjectivity (medical judgment) in determining which status is appropriate.[5] Hospitals may contest RAC decisions and payment denials through a preappeals discussion period, then through a 5‐level appeals process. Although early appeals occur between the hospital and private contractors, appeals reaching level 3 are heard by the Department of Health and Human Services (HHS) Office of Medicare Hearings and Appeals (OMHA) Administrative Law Judges (ALJ). Levels 4 (Medicare Appeals Council) and 5 (United States District Court) appeals are also handled by the federal government.[6]
Medicare fraud and abuse should not be tolerated, and systematic surveillance needs to be an integral part of the Medicare program.[4] However, there are increasing concerns that the RAC program has resulted in overaggressive denials.[7, 8] Unlike other Medicare contractors, RAC auditors are paid a contingency fee based on the percentage of hospital payment recouped for cases they audit and deny for improper payment.[4] RACs are not subject to any financial penalty for cases they deny but are overturned in the discussion period or in the appeals process. This may create an incentive system that financially encourages RACs to assert improper payment, and the current system lacks both transparency and clear performance metrics for auditors. Of particular concern are Medicare Part A complex reviews, the most fiscally impactful area of RAC activity. According to CMS FY 2013 data, 41.1% of all claims with collections were complex reviews, yet these claims accounted for almost all (95.2%) of total dollars recovered by the RACs, with almost all (96%) dollars recovered being from Part A claims.[9] Complex reviews involve an auditor retrospectively and manually reviewing a medical record and then using his or her clinical and related professional judgment to decide whether the care was medically necessary. This is compared to automated coding or billing reviews, which are based solely on claims data.
Increased RAC activity and the willingness of hospitals to challenge RAC findings of improper payment has led to an increase in appeals volume that has overloaded the appeals process. On March 13, 2013, CMS offered hospitals the ability to rebill Medicare Part B as an appeals alternative.[10] This did not temper level 3 appeals requests received by the OMHA, which increased from 1250 per week in January 2012 to over 15,000 per week by November 2013.[11] Citing an overwhelmingly increased rate of appeal submissions and the resultant backlog, the OMHA decided to freeze new hospital appeals assignments in December 2013.[11] In another attempt to clear the backlog, on August 29, 2014, CMS offered a settlement that would pay hospitals 68% of the net allowable amount of the original Part A claim (minus any beneficiary deductibles) if a hospital agreed to concede all of its eligible appeals.[12] Notably, cases settled under this agreement would remain officially categorized as denied for improper payment.
The HHS Office of Inspector General (OIG)[4] and the CMS[9, 13, 14] have produced recent reports of RAC auditing and appeals activity that contain variable numbers that conflict with hospital accounts of auditing and appeals activity.[15, 16] In addition to these conflicting reports, little is known about RAC auditing of individual programs over time, the length of time cases spend in appeals, and staff required to navigate the audit and appeals processes. Given these questions, and the importance of RAC auditing pressure in the growth of hospital observation care, we conducted a retrospective descriptive study of all RAC activity for complex Medicare Part A alleged overpayment determinations at the Johns Hopkins Hospital, the University of Utah, and University of Wisconsin Hospital and Clinics for calendar years 2010 to 2013.
METHODS
The University of Wisconsin‐Madison Health Sciences institutional review board (IRB) and the Johns Hopkins Hospital IRB did not require review of this study. The University of Utah received an exemption. All 3 hospitals are tertiary care academic medical centers. The University of Wisconsin Hospital and Clinics (UWHC) is a 592‐bed hospital located in Madison, Wisconsin,[17] the Johns Hopkins Hospital (JHH) is a 1145‐bed medical center located in Baltimore, Maryland,[18] and the University of Utah Hospital (UU) is a 770‐bed facility in Salt Lake City, Utah (information available upon request). Each hospital is under a different RAC, representing 3 of the 4 RAC regions, and each is under a different Medicare Administrative Contractor, contractors responsible for level 1 appeals. The 3 hospitals have the same Qualified Independent Contractor responsible for level 2 appeals.
For the purposes of this study, any chart or medical record requested for review by an RAC was considered a medical necessity chart request or an audit. The terms overpayment determinations and denials were used interchangeably to describe audits the RACs alleged did not meet medical necessity for Medicare Part A billing. As previously described, the term medical necessity specifically considered not only whether actual medical services were appropriate, but also whether the services were delivered in the appropriate status, outpatient or inpatient. Appeals and/or request for discussion were cases where the overpayment determination was disputed and challenged by the hospital.
All complex review Medicare Part A RAC medical record requests by date of RAC request from the official start of the RAC program, January 1, 2010,[4] to December 31, 2013, were included in this study. Medical record requests for automated reviews that related to coding and billing clarifications were not included in this study, nor were complex Medicare Part B reviews, complex reviews for inpatient rehabilitation facilities, or psychiatric day hospitalizations. Notably, JHH is a Periodic Interim Payment (PIP) Medicare hospital, which is a reimbursement mechanism where biweekly payments [are] made to a Provider enrolled in the PIP program, and are based on the hospital's estimate of applicable Medicare reimbursement for the current cost report period.[19] Because PIP payments are made collectively to the hospital based on historical data, adjustments for individual inpatients could not be easily adjudicated and processed. Due to the increased complexity of this reimbursement mechanism, RAC audits did not begin at JHH until 2012. In addition, in contrast to the other 2 institutions, all of the RAC complex review audits at JHH in 2013 were for Part B cases, such as disputing need for intensity‐modulated radiation therapy versus conventional radiation therapy, or contesting the medical necessity of blepharoplasty. As a result, JHH had complex Part A review audits only for 2012 during the study time period. All data were deidentified prior to review by investigators.
As RACs can audit charts for up to 3 years after the bill is submitted,[13] a chart request in 2013 may represent a 2010 hospitalization, but for purposes of this study, was logged as a 2013 case. There currently is no standard methodology to calculate time spent in appeals. The UWHC and JHH calculate time in discussion or appeals from the day the discussion or appeal was initiated by the hospital, and the UU calculates the time in appeals from the date of the findings letter from the RAC, which makes comparable recorded time in appeals longer at UU (estimated 510 days for 20112013 cases, up to 120 days for 2010 cases).Time in appeals includes all cases that remain in the discussion or appeals process as of June 30, 2014.
The RAC process is as follows (Tables 1 and 2):
- The RAC requests hospital claims (RAC Medical Necessity Chart Requests [Audits]).
- The RAC either concludes the hospital claim was compliant as filed/paid and the process ends or the RAC asserts improper payment and requests repayment (RAC Overpayment Determinations of Requested Charts [Denials]).
- The hospital makes an initial decision to not contest the RAC decision (and repay), or to dispute the decision (Hospital Disputes Overpayment Determination [Appeal/Discussion]). Prior to filing an appeal, the hospital may request a discussion of the case with an RAC medical director, during which the RAC medical director can overturn the original determination. If the RAC declines to overturn the decision in discussion, the hospital may proceed with a formal appeal. Although CMS does not calculate the discussion period as part of the appeals process,[12] overpayment determinations contested by the hospital in either discussion or appeal represent the sum total of RAC denials disputed by the hospital.
Contested cases have 1 of 4 outcomes:
Contested overpayment determinations can be decided in favor of the hospital (Discussion or Appeal Decided in Favor of Hospital or RAC Withdrew)
- Contested overpayment determinations can be decided in favor of the RAC during the appeal process, and either the hospital exhausts the appeal process or elects not to take the appeal to the next level. Although the appeals process has 5 levels, no cases at our 3 hospitals have reached level 4 or 5, so cases without a decision to date remain in appeals at 1 of the first 3 levels (Case Still in Discussion or Appeals).[4]
- Hospital may miss an appeal deadline (Hospital Missed Appeal Deadline at Any Level) and the case is automatically decided in favor of the RAC.
- As of March 13, 2013,[10] for appeals that meet certain criteria and involve dispute over the billing of hospital services under Part A, CMS allowed hospitals to withdraw an appeal and rebill Medicare Part B. Prior to this time, hospitals could rebill for a very limited list of ancillary Part B Only services, and only within the 1‐year timely filing period.[13] Due to the lengthy appeals process and associated legal and administrative costs, hospitals may not agree with the RAC determination but make a business decision to recoup some payment under this mechanism (Hospital Chose to Rebill as Part B During Discussion or Appeals Process).
| Totals | Johns Hopkins Hospital | ||||||||||
|---|---|---|---|---|---|---|---|---|---|---|---|
| 2010 | 2011 | 2012 | 2013 | All Years | 2010 | 2011 | 2012 | 2013 | All Years | ||
| University of Wisconsin Hospital and Clinics | University of Utah | ||||||||||
| 2010 | 2011 | 2012 | 2013 | All Years | 2010 | 2011 | 2012 | 2013 | All Years | ||
| |||||||||||
| Total no. of Medicare encounters | 24,400 | 24,998 | 25,370 | 27,094 | 101,862 | 11,212b | 11,750b | 11,842 | 12,674c | 47,478 | |
| RAC Medical Necessity Chart Requests (Audits) | 547 | 1,735 | 3,887 | 1,941 | 8,110 (8.0%) | 0 | 0 | 938 | 0 | 938 (2.0%) | |
| RAC Overpayment Determinations Of Requested Charts (Denials)d | 164 (30.0%) | 516 (29.7%) | 1,200 (30.9%) | 656 (33.8%) | 2,536 (31.3%) | 0 (0%) | 0 (0%) | 432 (46.1%) | 0 (0%) | 432 (46.1%) | |
| Hospital Disputes Overpayment Determination (Appeal/Discussion) | 128 (78.0%) | 409 (79.3%) | 1,129 (94.1%) | 643 (98.0%) | 2,309 (91.0% | 0 (0%) | 0 (0%) | 431 (99.8%) | 0 (0%) | 431 (99.8%) | |
| Outcome of Disputed Overpayment Determinatione | |||||||||||
| Hospital Missed Appeal Deadline at Any Level | 0 (0.0%) | 1 (0.2%) | 13 (1.2%) | 4 (0.6%) | 18 (0.8%) | 0 (0%) | 0 (0%) | 0 (0.0%) | 0 (0%) | 0 (0.0%) | |
| Hospital Chose To Rebill as Part B During Discussion Or Appeals Process | 80 (62.5%) | 202 (49.4%) | 511 (45.3%) | 158 (24.6%) | 951 (41.2%) | 0 (0%) | 0 (0%) | 208 (48.3%) | 0 (0%) | 208 (48.3%) | |
| Discussion or Appeal Decided In Favor Of Hospital or RAC Withdrewf | 45 (35.2%) | 127 (31.1%) | 449 (39.8%) | 345 (53.7%) | 966 (41.8%) | 0 (0%) | 0 (0%) | 151 (35.0%) | 0 (0%) | 151 (35.0%) | |
| Case Still in Discussion or Appeals | 3 (2.3%) | 79 (19.3%) | 156 13.8%) | 136 (21.2%) | 374 (16.2%) | 0 (0%) | 0 (0%) | 72 (16.7%) | 0 (0%) | 72 (16.7%) | |
| Mean Time for Cases Still in Discussion or Appeals, d (SD) | 1208 (41) | 958 (79) | 518 (125) | 350 (101) | 555 (255) | N/A | N/A | 478 (164) | N/A | 478 (164) | |
| Total no. of Medicare encounters l | 8,096 | 8,038 | 8,429 | 9,086 | 33,649 | 5,092 | 5,210 | 5,099 | 5,334 | 20,735 | |
| RAC Medical Necessity Chart Requests (Audits) | 15 | 526 | 1,484 | 960 | 2,985 (8.9%) | 532 | 1,209 | 1,465 | 981 | 4,187 (20.2%) | |
| RAC Overpayment Determinations of Requested Charts (Denials)bd | 3 (20.0%) | 147 (27.9%) | 240 (16.2%) | 164 (17.1%) | 554 (18.6%) | 161 (30.3%) | 369 (30.5%) | 528 (36.0%) | 492 (50.2%) | 1,550 (37.0%) | |
| Hospital Disputes Overpayment Determination (Appeal/Discussion) | 1 (33.3%) | 71 (48.3%) | 170 (70.8%) | 151 (92.1%) | 393 (70.9%) | 127 (78.9%) | 338 (91.6%) | 528 (100.0%) | 492 (100.0%) | 1,485 (95.8%) | |
| Outcome of Disputed Overpayment Determinatione | |||||||||||
| Hospital Missed Appeal Deadline at Any Level | 0 (0.0%) | 1 (1.4%) | 0 (0.0%) | 4 (2.6%) | 5 (1.3%) | 0 (0.0%) | 0 (0.0%) | 13 (2.5%) | 0 (0.0%) | 13 (0.9%) | |
| Hospital Chose to Rebill as Part B During Discussion or Appeals Process | 1 (100%) | 3 (4.2%) | 13 (7.6%) | 3 (2.0%) | 20 (5.1%) | 79 (62.2%) | 199 (58.9%) | 290 (54.9%) | 155 (31.5%) | 723 (48.7%) | |
| Discussion or Appeal Decided in Favor of Hospital or RAC Withdrewf | 0 (0.0%) | 44 (62.0%) | 123 (72.4%) | 93 (61.6%) | 260 (66.2%) | 45 (35.4%) | 83 (24.6%) | 175 (33.1%) | 252 (51.2%) | 555 (37.4%) | |
| Case Still in Discussion or Appeals | 0 0.0% | 23 (32.4%) | 34 (20.0%) | 51 (33.8%) | 108 (27.5%) | 3 (2.4%) | 56 (16.6%) | 50 (9.5%) | 85 (17.3%) | 194 (13.1%) | |
| Mean Time for Cases Still in Discussion or Appeals, d (SD) | N/A | 926 (70) | 564 (90) | 323 (134) | 528 (258) | 1,208 (41) | 970 (80) | 544 (25) | 365 (72) | 599 (273) | |
| 2010 | 2011 | 2012 | 2013 | All | 2010 | 2011 | 2012 | 2013 | All | |
|---|---|---|---|---|---|---|---|---|---|---|
| Total Appeals With Decisions | Johns Hopkins Hospital | |||||||||
| Total no. | 125 | 330 | 973 | 507 | 1,935 | 0 | 0 | 359 | 0 | 359 |
| ||||||||||
| Hospital Missed Appeal Deadline at Any Level | 0 (0.0%) | 1 (0.3%) | 13 (1.3%) | 4 (0.8%) | 18 (0.9%) | 0 (0.0%) | 0 (0.0%) | 0 (0.0%) | 0 (0.0%) | 0 (0.0%) |
| Hospital Chose to Rebill as Part B During Discussion or Appeals Process | 80 (64.0%) | 202 (61.2%) | 511 (52.5%) | 158 (31.2%) | 951 (49.1%) | 0 (0.0%) | 0 (0.0%) | 208 (57.9%) | 0 (0.0%) | 208 (57.9%) |
| Discussion or Appeal Decided in Favor of Hospital or RAC Withdrew | 45 (36.0%) | 127 (38.5%) | 449 (46.1%) | 345 (68.0%) | 966 (49.9%) | 0 (0.0%) | 0 (0.0%) | 151 (42.1%) | 0 (0.0%) | 151 (42.1%) |
| Discussion Period and RAC Withdrawals | 0 (0.0%) | 59 (17.9%) | 351 (36.1%) | 235 (46.4%) | 645 (33.3%) | 0 (0.0%) | 0 (0.0%) | 139 (38.7%) | 0 (0.0%) | 139 (38.7%) |
| Level 1 Appeal | 10 (8.0%) | 22 (6.7%) | 60 (6.2%) | 62 (12.2%)1 | 154 (8.0%) | 0 (0.0%) | 0 (0.0%) | 2 (0.6%) | 0 (0.0%) | 2 (0.6%) |
| Level 2 Appeal | 22 (17.6%) | 36 (10.9%) | 38 (3.9%) | 48 (9.5%)1 | 144 (7.4%) | 0 (0.0%) | 0 (0.0%) | 10 (2.8%) | 0 (0.0%) | 10 (2.8%) |
| Level 3 Appealc | 13 (10.4%) | 10 (3.0%) | N/A (N/A) | N/A (N/A) | 23 (1.2%) | 0 (0.0%) | 0 (0.0%) | N/A (N/A) | 0 (0.0%) | 0 (0.0%) |
| 2010 | 2011 | 2012 | 2013 | All | 2010 | 2011 | 2012 | 2013 | All | |
| University of Wisconsin Hospital and Clinics | University of Utah | |||||||||
| Total no. | 1 | 48 | 136 | 100 | 285 | 124 | 282 | 478 | 407 | 1,291 |
| Hospital Missed Appeal Deadline at Any Level | 0 (0.0%) | 1 (2.1% | 0 (0.0%) | 4 (4.0%) | 5 (1.8%) | 0 (0.0%) | 0 (0.0%) | 13 (2.7%) | 0 (0.0%) | 13 (1.0%) |
| Hospital Chose to Rebill as Part B During Discussion or Appeals Process | 1 (100.0%) | 3 (6.3% | 13 (9.6%) | 3 (3.0%) | 20 (7.0%) | 79 (63.7%) | 199 (70.6%) | 290 (60.7%) | 155 (38.1%) | 723 (56.0%) |
| Discussion or Appeal Decided in Favor of Hospital or RAC Withdrewb | 0 (0.0%) | 44 (91.7%) | 123 (90.4%) | 93 (93.0%) | 260 (91.2%) | 45 (36.3%) | 83 (29.4%) | 175 (36.6%) | 252 (61.9%) | 555 (43.0%) |
| Discussion Period and RAC Withdrawals | 0 (0.0%) | 38 (79.2%) | 66 (48.5%) | 44 (44.0%) | 148 (51.9% | 0 (0.0%) | 21 (7.4%) | 146 (30.5%) | 191 (46.9%) | 358 (27.7%) |
| Level 1 Appeal | 0 (0.0%) | 2 (4.2%) | 47 (34.6%) | 34 (34.0%) | 83 (29.1%) | 10 (8.1%) | 20 (7.1%) | 11 (2.3%) | 28 (6.9%) | 69 (5.3%) |
| Level 2 Appeal | 0 (0.0%) | 4 (8.3%) | 10 (7.4%) | 15 (15.0%) | 29 (10.2%) | 22 (17.7%) | 32 (11.3%) | 18 (3.8%) | 33 (8.1%) | 105 (8.1%) |
| Level 3 Appealc | 0 (0.0%) | N/A (N/A) | N/A (N/A) | N/A (N/A) | 0 (0.0%) | 13 (10.5%) | 10 (3.5%) | N/A (N/A) | N/A(N/A) | 23 (1.8%) |
The administration at each hospital provided labor estimates for workforce dedicated to the review process generated by the RACs based on hourly accounting of one‐quarter of work during 2012, updated to FY 2014 accounting (Table 3). Concurrent case management status determination work was not included in these numbers due to the difficulty in solely attributing concurrent review workforce numbers to the RACs, as concurrent case management is a CMS Condition of Participation irrespective of the RAC program.
| JHH | UWHC | UU | Mean | |
|---|---|---|---|---|
| ||||
| Physicians: assist with status determinations, audits, and appeals | 1.0 | 0.5 | 0.6 | 0.7 |
| Nursing administration: audit and appeal preparation | 0.9 | 0.2 | 1.9 | 1.0 |
| Legal counsel: assist with rules interpretation, audit, and appeal preparation | 0.2 | 0.3 | 0.1 | 0.2 |
| Data analyst: prepare and track reports of audit and appeals | 2.0 | 1.8 | 2.4 | 2.0 |
| Administration and other directors | 2.3 | 0.9 | 0.3 | 1.2 |
| Total FTE workforce | 6.4 | 3.7 | 5.3 | 5.1 |
Statistics
Descriptive statistics were used to describe the data. Staffing numbers are expressed as full‐time equivalents (FTE).
RESULTS
Yearly Medicare Encounters and RAC Activity of Part A Complex Reviews
RACs audited 8.0% (8110/101,862) of inpatient Medicare cases, alleged noncompliance (all overpayments) for 31.3% (2536/8110) of Part A complex review cases requested, and the hospitals disputed 91.0% (2309/2536) of these assertions. None of these cases of alleged noncompliance claimed the actual medical services were unnecessary. Rather, every Part A complex review overpayment determination by all 3 RACs contested medical necessity related to outpatient versus inpatient status. In 2010 and 2011, there were in aggregate fewer audits (2282), overpayment determinations (680), and appeals or discussion requests (537 of 680, 79.0%), compared to audits (5828), overpayment determinations (1856), and appeals or discussion requests (1772 of 1856, 95.5%) in 2012 and 2013. The hospitals appealed or requested discussion of a greater percentage each successive year (2010, 78.0%; 2011, 79.3%; 2012, 94.1%; and 2013, 98.0%). This increased RAC activity, and hospital willingness to dispute the RAC overpayment determinations equaled a more than 300% increase in appeals and discussion request volume related to Part A complex review audits in just 2 years.
The 16.2% (374/2309) of disputed cases still under discussion or appeal have spent an average mean of 555 days (standard deviation 255 days) without a decision, with time in appeals exceeding 900 days for cases from 2010 and 2011. Notably, the 3 programs were subject to Part A complex review audits at widely different rates (Table 1).
Yearly RAC Part A Complex Review Overpayment Determinations Disputed by Hospitals With Decisions
The hospitals won, either in discussion or appeal, a combined greater percentage of contested overpayment determinations annually, from 36.0% (45/125) in 2010, to 38.5% (127/330) in 2011, to 46.1% (449/973) in 2012, to 68.0% (345/507) in 2013. Overall, for 49.1% (951/1935) of cases with decisions, the hospitals withdrew or rebilled under Part B at some point in the discussion or appeals process to avoid the lengthy appeals process and/or loss of the amount of the entire claim. A total of 49.9% (966/1935) of appeals with decisions have been won in discussion or appeal over the 4‐year study period. One‐third of all resolved cases (33.3%, 645/1935) were decided in favor of the hospital in the discussion period, with these discussion cases accounting for two‐thirds (66.8%, 645/966) of all favorable resolved cases for the hospital. Importantly, if cases overturned in discussion were omitted as they are in federal reports, the hospitals' success rate would fall to 16.6% (321/1935), a number similar to those that appear in annual CMS reports.[9, 13, 14] The hospitals also conceded 18 cases (0.9%) by missing a filing deadline (Table 2).
Estimated Workforce Dedicated to Part A Complex Review Medical Necessity Audits and Appeals
The institutions each employ an average of 5.1 FTE staff to manage the audit and appeal process, a number that does not include concurrent case management staff who assist in daily status determinations (Table 3).
CONCLUSIONS
In this study of 3 academic medical centers, there was a more than 2‐fold increase in RAC audits and a nearly 3‐fold rise in overpayment determinations over the last 2 calendar years of the study, resulting in a more than 3‐fold increase in appeals or requests for discussion in 2012 to 2013 compared to 2010 to 2011. In addition, although CMS manually reviews less than 0.3% of submitted claims each year through programs such as the Recovery Audit Program,[9] at the study hospitals, complex Part A RAC audits occurred at a rate more than 25 times that (8.0%), suggesting that these types of claims are a disproportionate focus of auditing activity. The high overall complex Part A audit rate, accompanied by acceleration of RAC activity and the hospitals' increased willingness to dispute RAC overpayment determinations each year, if representative of similar institutions, would explain the appeals backlog, most notably at the ALJ (level 3) level. Importantly, none of these Part A complex review denials contested a need for the medical care delivered, demonstrating that much of the RAC process at the hospitals focused exclusively on the nuances of medical necessity and variation in interpretation of CMS guidelines that related to whether hospital care should be provided under inpatient or outpatient status.
These data also show continued aggressive RAC audit activity despite an increasing overturn rate in favor of the hospitals in discussion or on appeal each year (from 36.0% in 2010 to 68.0% in 2013). The majority of the hospitals' successful decisions occurred in the discussion period, when the hospital had the opportunity to review the denial with the RAC medical director, a physician, prior to beginning the official appeals process. The 33% overturn rate found in the discussion period represents an error rate by the initial RAC auditors that was internally verified by the RAC medical director. The RAC internal error rate was replicated at 3 different RACs, highlighting internal process problems across the RAC system. This is concerning, because the discussion period is not considered part of the formal appeals process, so these cases are not appearing in CMS or OIG reports of RAC activity, leading to an underestimation of the true successful overturned denial rates at the 3 study hospitals, and likely many other hospitals.
The study hospitals are also being denied timely due process and payments for services delivered. The hospitals currently face an appeals process that, on average, far exceeds 500 days. In almost half of the contested overpayment determinations, the hospitals withdrew a case or rebilled Part B, not due to agreement with a RAC determination, but to avoid the lengthy, cumbersome, and expensive appeals process and/or to minimize the risk of losing the amount of the entire Part A claim. This is concerning, as cases withdrawn in the appeals process are considered improper payments in federal reports, despite a large number of these cases being withdrawn simply to avoid an inefficient appeals process. Notably, Medicare is not adhering to its own rules, which require appeals to be heard in a timely manner, specifically 60 days for level 1 or 2 appeals, and 90 days for a level 3 appeal,[6, 20] even though the hospitals lost the ability to appeal cases when they missed a deadline. Even if hospitals agreed to the recent 68% settlement offer[12] from CMS, appeals may reaccumulate without auditing reform. As noted earlier, this recent settlement offer came more than a year after the enhanced ability to rebill denied Part A claims for Part B, yet the backlog remains.
This study also showed that a large hospital workforce is required to manage the lengthy audit and appeals process generated by RACs. These staff are paid with funds that could be used to provide direct patient care or internal process improvement. The federal government also directly pays for unchecked RAC activity through the complex appeals process. Any report of dollars that RACs recoup for the federal government should be considered in light of their administrative costs to hospitals and government contractors, and direct costs at the federal level.
This study also showed that RACs audited the 3 institutions differently, despite similar willingness of the hospitals to dispute overpayment determinations and similar hospital success rates in appeals or discussion, suggesting that hospital compliance with Medicare policy was not the driver of variable RAC activity. This variation may be due to factors not apparent in this study, such as variable RAC interpretation of federal policy, a decision of a particular RAC to focus on complex Medicare Part B or automated reviews instead of complex Part A reviews, or RAC workforce differences that are not specific to the hospitals. Regardless, the variation in audit activity suggests that greater transparency and accountability in RAC activity is merited.
Perhaps most importantly, this study highlights factors that may help explain differing auditing and appeals numbers reported by the OIG,[4] CMS,[9, 13, 14] and hospitals.[15, 16] Given the marked increase in RAC activity over the last 4 years, the 2010 and 2011 data included in a recent OIG report[4] likely do not represent current auditing and appeals practice. With regard to the CMS reports,[9, 13, 14] although CMS included FY 2013[9] activity in its most recent report, it did not account for denials overturned in the discussion period, as these are not technically appeals, even though these are contested cases decided in favor of the hospital. This most recent CMS report[9] uses overpayment determinations from FY 2013, yet counts appeals and decisions that occurred in 2013, with the comment that these decisions may be for overpayment determinations prior to 2013. The CMS reports also variably combine automated, semiautomated, complex Part A, and complex Part B claims in its reports, making interpretation challenging. Finally, although CMS reported an increase in improper payments recovered from FY 2011[14] ($939 million) to FY 2012[13] ($2.4 billion) to FY 2013[9] ($3.75 billion), this is at least partly a reflection of increased RAC activity as demonstrated in this study, and may reflect the fact that many hospitals do not have the resources to continually appeal or choose not to contest these cases based on a financial business decision. Importantly, these numbers now far exceed recoupment in other quality programs, such as the Readmissions Reduction Program (estimated $428 million next FY),[21] indicating the increased fiscal impact of the RAC program on hospital reimbursement.
To increase accuracy, future federal reports of auditing and appeals should detail and include cases overturned in the discussion period, and carefully describe the denominator of total audits and appeals given the likelihood that many appeals in a given year will not have a decision in that year. Percent of total Medicare claims subject to complex Part A audit should be stated. Reports should also identify and consider an alternative classification for complex Part A cases the hospital elects to rebill under Medicare Part B, and also detail on what grounds medical necessity is being contested (eg, whether the actual care delivered was not necessary or if it is an outpatient versus inpatient billing issue). Time spent in the appeals process must also be reported. Complex Part A, complex Part B, semiautomated, and automated reviews should also be considered separately, and dates of reported audits and appeals must be as current as possible in this rapidly changing environment.
In this study, RACs conducted complex Part A audits at a rate 25 times the CMS‐reported overall audit rate, confirming complex Part A audits are a particular focus of RAC activity. There was a more than doubling of RAC audits at the study hospitals from the years 2010 ‐ 2011 to 2012 ‐ 2013 and a nearly 3‐fold increase in overpayment determinations. Concomitantly, the more than 3‐fold increase in appeals and discussion volume over this same time period was consistent with the development of the current national appeals backlog. The 3 study hospitals won a greater percentage of contested cases each year, from approximately one‐third of cases in 2010 to two‐thirds of cases with decisions in 2013, but there was no appreciable decrease in RAC overpayment determinations over that time period. The majority of successfully challenged cases were won in discussion, favorable decisions for hospitals not appearing in federal appeals reports. Time in appeals exceeded 550 days, causing the hospitals to withdraw some cases to avoid the lengthy appeals process and/or to minimize the risk of losing the amount of the entire Part A claim. The hospitals also lost a small number of appeals by missing a filing deadline, yet there was no reciprocal case concession when the appeals system missed a deadline. RACs found no cases of care at the 3 hospitals that should not have been delivered, but rather challenged the status determination (inpatient vs outpatient) to dispute medical necessity of care delivered. Finally, an average of approximately 5 FTEs at each institution were employed in the audits and appeals process. These data support a need for systematic improvements in the RAC system so that fair, constructive, and cost‐efficient surveillance of the Medicare program can be realized.
Acknowledgements
The authors thank Becky Borchert, MS, RN BC, ACM, CPHQ, Program Manager for Medicare/Medicaid Utilization Review at the University of Wisconsin Hospital and Clinics; Carol Duhaney and Joan Kratz, RN, at Johns Hopkins Hospital; and Morgan Walker at the University of Utah for their assistance in data preparation and presentation. Without their meticulous work and invaluable assistance, this study would not have been possible. The authors also thank Josh Boswell, JD, for his critical review of the manuscript.
Disclosure: Nothing to report.
- Medicare Payment Advisory Commission. Hospital inpatient and observation services. 2014 Report to Congress. Medicare Payment Policy. Available at: http://www.medpac.gov/documents/reports/mar14_entirereport.pdf?sfvrsn=0. Accessed September 22, 2014.
- American Hospital Association “2‐midnight rule” lawsuit vs Department of Health and Human Services. Available at: http://www.aha.org/content/14/140414‐complaint‐2midnight.pdf. Accessed August 8, 2014.
- Centers for Medicare administrative law judge hearing program for Medicare claim appeals. Fed Regist. 2014;79(214): 65660 – 65663. Available at: http://www.hhs.gov/omha/files/omha_federal_register_notice_2014–26214.pdf. Accessed December 6, 2014.
- . Medicare fines 2,610 hospitals in third round of readmission penalties. Kaiser Health News. Available at: http://kaiserhealthnews.org/news/medicare‐readmissions‐penalties‐2015. Accessed November 30, 2014.
© 2015 Society of Hospital Medicine
Reducing Inappropriate PPIs at Discharge
In 2013, there were more than 15 million Americans receiving proton pump inhibitors (PPIs),[1] with an associated drug cost of nearly $79 billion between 2007 and 2011.2 PPI use is reaching epidemic proportions, likely due to the medicalization of gastrointestinal symptoms coupled with pervasive marketing and academic detailing being performed by the pharmaceutical industry.
Although PPIs are generally considered safe, they are not as innocuous as many physicians believe. In 2011 and 2012, the US Food and Drug Administration and Health Canada, respectively, issued safety advisories regarding the use of these medications related to Clostridium difficile, fracture risk, and electrolyte derangement.[3, 4, 5, 6] There have also been numerous other harmful associations reported,[7, 8, 9, 10] suggesting it would be prudent to follow Health Canada's advice that: PPIs should be prescribed at the lowest dose and shortest duration of therapy appropriate to the condition being treated.[4] In many cases this implies stopping the PPI after an appropriate duration of therapy or attempting nonpharmacological or H2‐blocker therapy instead.
Nevertheless, despite numerous cautionary publications, PPI use for nonevidence‐based indications remains common. Because they are generally thought of as outpatient medications, PPIs are frequently continued in hospitalized patients, and inappropriate outpatient therapy is rarely addressed.[11, 12, 13] Likewise, inappropriate de novo use can also be observed during hospitalization and may continue on discharge.[13, 14, 15] Hospitalization may consequently present an opportunity to employ meaningful interventions targeting outpatient medication use.[16] We developed an opportune inpatient intervention targeting inappropriate PPI therapy.
Our study had 2 aims: first, to determine the magnitude of the problem in a contemporary Canadian medical inpatient population, and second, we sought to leverage the inpatient admission as an opportunity to promote change when the patient returned to the community through the application of an educational and web‐based quality‐improvement (QI) intervention.
METHODS
Patient Inclusion
Between January 2012 and December 2012, we included all consecutively admitted patients on our 46‐bed general medical clinical teaching unit belonging to a 417‐bed tertiary care teaching hospital in Montreal, Canada. There were no exclusion criteria. This time period was divided into 2 blocks: the preintervention control period from January 1 to June 3 and the intervention period from June 4 to December 16.
Intervention and Implementation Strategy
At the start of each academic period, we presented a 20‐minute information session on the benefits and harms of PPI use (see Supporting Information, Appendix, in the online version of this article). The unit's medical residents and faculty attended these rounds. The presentation described the project, consensus‐derived indications for PPI use, and potential adverse events attributable to PPIs (see Table 1 for indications based on internal consensus and similar studies[17, 18, 19, 20, 21, 22, 23]). All other indications were considered nonevidence based. At the end of the month, teams were given feedback on indications they provided using the Web tool and the proportion of patients they discharged on a PPI with and without indication.
|
| 1. Gastric or duodenal ulcer within the past 3 months |
| 2. Pathological hypersecretory conditions |
| 3. Gastroesophageal reflux disease with exacerbations within the last 3 months not responsive to H2 blockers and nonpharmacologic techniques |
| 4. Erosive esophagitis |
| 5. Recurring symptoms recently associated with severe indigestion within the last 3 months not responsive to H2 blocker or nonpharmacologic techniques |
| 6. Helicobacter pylori eradication |
| 7. Dual antiplatelet therapy |
| 8. Antiplatelet therapy with anticoagulants |
| 9. Antiplatelet or anticoagulant therapy with history of previous complicated ulcer |
| 10. Antiplatelet or NSAID with 2 of the following: concomitant systemic corticosteroids, age over 60 years, previous uncomplicated ulcer, concomitant NSAID, or antiplatelet/anticoagulant |
The process of evaluating and stopping PPIs was voluntary. Housestaff were encouraged to evaluate PPIs when ordering admission medications and upon preparing exit prescriptions. This was an opt‐in intervention. Once a patient on a PPI was identified, typically on admission to the unit, the indication for use could then be evaluated using the online tool, which was accessible on the internet via a link on all unit computers (see Supporting Information, Appendix, in the online version of this article).
The Web‐based tool was designed to be simple and informative. Users of the tool input anonymous data including comorbidities (check boxes provided). The tool collected the indication for PPI use, with available options including: the consensus‐derived evidence‐based indications, no identified indication, or free text. This was done purposefully to remind the teams of the consensus indications, with the goal that in choosing no identified indication the resident would consider cessation of unnecessary PPIs. The final step in the tool, discharge plan, presented the option of stopping the PPI in the absence of a satisfactory indication. We hypothesized that selecting this option would serve as an informal commitment to discontinuing the PPI during the creation of the discharge prescription; however, the tool was not automatically linked to these prescriptions.
If a home prescription was discontinued, the patient was counselled by the treating team and provided with an educational letter (see Supporting Information, Appendix, in the online version of this article), which was fastened to their discharge summary and given to the patient for delivery to all of their usual outpatient physician(s).
The design of the online tool was such that residents were to evaluate PPI use that would continue postdischarge from the hospital, rather than PPI use limited to the period of hospitalization.
Data Collection and Statistical Analysis
Data on baseline demographics and the specific indications for PPI use were collected through clinician interaction with the online tool. The proportion of patients on a PPI was ascertained through a separate data extraction of electronic discharge prescriptions. These involved medication reconciliation for all outpatient medications including whether or not they were continued, modified, or stopped. Thus, we could determine at discharge whether outpatient PPIs were continued or stopped or if a new PPI was initiated.
The proportion of patients admitted from home already receiving a PPI, those who received a new prescription for a PPI at discharge, and those whose PPI was stopped during admission were compared before and after the intervention using segmented regression analysis of an interrupted time series (see Supporting Information, Appendix, in the online version of this article).[24]
Post Hoc Power Calculations
For the pre‐post comparisons, given the preintervention number of admissions, proportions of PPI use in the community, new PPI use, and PPI discontinuation rates we would have had an 80% power to detect changes of 8.5%, 5%, and 5.5%, respectively.
Ethics
The McGill University Health Centre research ethics board approved this study. Informed consent was waived as the intervention was deemed to be best practice, and data collected were anonymous. Clinical consent was obtained by the treating team for all care decisions.
Funding
This initiative was conducted without any funding.
RESULTS
During the preintervention period, 464 patients were admitted, of whom 209 (45%) were taking a PPI prior to admission. During their hospitalization, an additional 53 patients (21% of nonusers) were newly prescribed a PPI that was continued at discharge. During the intervention period, a total of 640 patients were admitted, of whom 281 (44%) were taking a PPI prior to admission. During their hospitalization, 60 patients (17% of nonusers) were newly prescribed a PPI that was continued at discharge. Neither the monthly proportions admitted on PPIs from prior to admission (level P=0.59, slope P=0.46) or those newly initiated on a PPI (level P=0.36, slope P=0.18) were significantly different before compared to after the intervention. However, there was both a clinically and statistically significant difference in the proportion of preadmission PPIs that were discontinued at hospital discharge from a monthly mean of 7.7% (or 16/209) before intervention to 18.5% (or 52/281) afterward (Figure 1; level P=0.03, slope P=0.48).
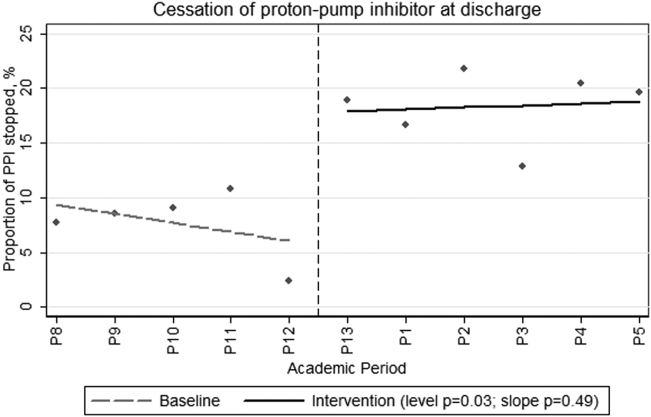
During the intervention period, our teams prospectively captured PPI indications and patient comorbidities for 54% (152/281) of the patients admitted on a PPI using the online assessment tool. The baseline characteristics of the population in whom the online tool was applied are shown in Table 2. These patients had a mean age of 69.6 years, and 49% were male. Thirty‐two percent had diabetes, 20% had chronic renal insufficiency, and 13% had experienced a gastrointestinal hemorrhage within the 3 months prior to admission. It was frequent for PPI users to receive systemic antibiotics (44%) or to have diagnoses potentially associated with PPI use such as community‐acquired pneumonia (25%) or C difficile (11%).
| Characteristic | Value |
|---|---|
| |
| Age, y, mean (SD) | 69.615.1 |
| Male gender, N (%) | 75 (49) |
| Initiation of PPI, N (%) | |
| Prior to hospitalization | 127 (84) |
| During hospitalization | 10 (6) |
| In ICU | 7 (4) |
| In ER | 8 (5) |
| Comorbidities, N (%) | |
| Diabetes mellitus | 48 (32) |
| Chronic renal failure, GFR <45 | 29 (20) |
| GI bleed in the last 3 months | 20 (13) |
| No comorbidities | 11 (7) |
| Medications, N (%) | |
| Current antiplatelet agent | 67 (44) |
| Current corticosteroid use | 40 (26) |
| Current therapeutic anticoagulation | 35 (23) |
| Current NSAID use | 13 (8.5) |
| Current bisphosphonate | 13 (8.5) |
| Potential contraindications to PPI, N (%) | |
| Current antibiotic therapy | 67 (44) |
| Pneumonia | 38 (25) |
| Clostridium difficile infection ever | 16 (11) |
| Clostridium difficile infection on present admission | 9 (6) |
Fifty‐four percent (82/152) of patients in whom the online tool was applied had an evidence‐based indication (Table 3). The most common indication for PPI prescription was the receipt of antiplatelet/anticoagulant or nonsteroidal anti‐inflammatory drug with 2 other known risk factors for upper gastrointestinal bleeding (20%). In the remaining 46% (70/152) of patients, the prescription of a PPI was deemed nonevidence based. Of these, 34 (49%) had their PPI discontinued. When patients were approached to discontinue therapy, the rate of success was high, with only 2 refusals.
| Indications | N (%) |
|---|---|
| |
| Approved indications for therapy | |
| Antiplatelet or NSAID with 2 of the following: age >60 years, systemic corticosteroids, previous uncomplicated ulcer, NSAID, or antiplatelet/anticoagulant | 28 (20) |
| Gastric or duodenal ulcer within the past 3 months | 23 (15) |
| Antiplatelet therapy with anticoagulants | 17 (11) |
| GERD with exacerbations within the last 3 months | 17 (11) |
| Dual antiplatelet therapy | 7 (5) |
| Pathological hypersecretory conditions | 0 |
| Helicobactor pylori eradication | 0 |
| Total with consensus indications | 79 (54) |
| Other described indications for therapy | |
| No indication identified | 46 (30) |
| Othera | 22 (14) |
| Palliative patients GERD prophylaxis | 5 (3) |
| Total without consensus indications | 70 (46) |
DISCUSSION
In this prospective intervention, 44% of patients admitted to an acute‐care medical ward were prescribed a PPI prior to their admission. In the subgroup of patients for whom the indication for PPI use was recorded through our online tool, less than half had an evidence‐based indication for ongoing therapy. Our intervention was successful in increasing the proportion of patients in whom preadmission PPI prescriptions were stopped at discharge from an average of 7.7% in the preintervention phase to 18.5% during the intervention. This intervention is novel in that we were able to reduce active community prescriptions for PPIs in patients without obvious indication by nearly 50%.
Our population's rates of PPI prescription were consistent with previous reports,[11, 12, 13, 15, 25, 26, 27, 28] and it is clear that many hospitalized patients continue their PPIs at discharge without clear indications. We propose that hospitalization can serve as an opportunity to reassess the necessity of continuous PPI use. Previous systematic attempts to reduce inappropriate PPI prescriptions in hospital have met with varied success. Several of these studies were unable to achieve a demonstrable effect.[23, 29, 30, 31] In contrast, Hamzat et al.[30] described a successful educational intervention targeting inpatients on a geriatric ward. A 4‐week educational strategy was employed, and they were able to discontinue PPIs in 10 of 60 (17%) patients without indication during a limited period of study. Another successful intervention by Gupta et al.[32] involved a before‐and‐after study combining a half‐hour physician education session with the introduction of a medication reconciliation tool. They showed a decrease in inappropriate discharge prescriptions of 50%. Not only did our study demonstrate an equally sizable reduction in inappropriate discharge prescriptions, but we also employed a more methodologically sound time‐series analysis to control for unmeasured contemporaneous factors such as rotating staff practices or monthly differences in patient composition. We demonstrated an immediate and sustained improvement in performance that lasted over 6 months. Furthermore, in contrast to other interventions, which addressed inappropriate inpatient use persisting on discharge, our intervention also addressed the appropriateness of PPI use that antedated hospitalization.
There are common themes to the successful programs. The more time spent educating and reminding the prescribing physicians, the more successful the intervention. Nonetheless, we believe our intervention is not onerous or overly time consuming. We performed a short presentation each month to educate rotating physicians, and the tool took less than 1 minute to complete once the information on PPI indication was available. Frequent education sessions may be initially necessary given the comfort that many physicians have developed in prescribing PPIs. A further prerequisite for success may be a familiarity with PPI indications and potential adverse effects. Without this, the intervention may not show a demonstrable effect, as was seen in a study of pulmonologists.[23] We hypothesize that some subspecialist physicians may not have the same appreciation of the adverse effects of PPIs nor the confidence to stop them when not indicated, as compared to general internists or hospitalists.
The proportion of patients with newly initiated PPIs at discharge decreased after the intervention, but this did not reach statistical significance. Our study's power may have precluded this. However, we had also previously put in place unpublished interventions to diminish inappropriate gastric prophylaxis in the hospital, which may have diminished the effect of this intervention.
Unfortunately, although we demonstrated a clinically significant effect on PPI exit prescription rates, we still found that nearly half of the patients who were evaluated using the online tool were discharged on PPIs despite our physicians' acknowledgment that they had no identifiable indication. It is possible that clinicians do not feel comfortable stopping these medications, owing to a fear that there is an indication that they are not aware of. In certain cases, it is possible that a reappraisal of the benefits, risks, and costs might reassure the clinician that they could safely stop the drug; however, therapeutic inertia is often hard to overcome.
Limitations
Our single‐center study occurred over a limited time period and examined a sample of patients that were assessed based on convenience. Other limitations included the uptake of the online tool, which was only 54% of patients on a PPI. In particular, few patients who were newly started on a PPI had the online tool applied. This is likely because the tool was filled out on a volunteer basis and was applied most routinely during the admission medication reconciliation process. There were a number of other reasons why the tool was underused, including having the inpatient teams responsible for the data collection despite preexisting demands on their time and the lack of data from patients who were admitted and discharged before a thorough review of the indication for PPI use could take place. However, despite the incomplete use of the online tool, the demographics of patients who were assessed are similar to our usual patient population. As such, we believe the data captured are representative. Furthermore, despite the tool being underused, there remained a clearly objectified reduction in PPI exit prescriptions that occurred immediately postintervention and persisted throughout the entire period of study. Although our teams were not universally using the Web‐tool, it was clear that they were influenced by the project and were stopping unnecessary therapy.
Additionally, the absence of postdischarge follow‐up is also an important limitation. We had originally planned to audit all patients whose PPIs were stopped at 3 months postdischarge but were not systematically able to do so. We did, however, obtain a 1‐time convenience sample interview midway through the intervention. At that time, of 18 patients interviewed, all but 1 remained off of their PPI at 3 months postdischarge. The 1 restart was for reflux symptoms without a preceding trial of lifestyle therapy or H2 blocker.
One final limitation of this study design is that the implementation portion of the intervention took place at the beginning of the academic year. Trainees at the beginning of the year might differ from trainees at the end of the year in that they are more receptive to an educational intervention and less firmly fixed in their practice patterns. If one is considering implementing a similar strategy in their academic institution, we recommend doing so at the start of the academic year to capture the interest of new trainees, maximize the intervention's effectiveness, and establish good habits early in training.
CONCLUSION
We have demonstrated that in medical inpatients, both PPI use and misuse remain common; however, with a combined educational and Web‐based QI intervention, we could successfully decrease inappropriate exit prescriptions. Hospitalization, particularly at academic centers, should serve as an important point of contact for residents in training and expert faculty physicians to reconsider and rationalize patient medications. We should take the opportunity to engender a culture of responsibility for all of the medications that we represcribe at discharge, including an appraisal of the relevant harms and benefits, particularly when a medication is potentially unnecessary. We ought to then communicate the rationale for any changes to our community partners to maintain continuity of care. In this way, hospitalists can help treat the prescription indigestion that has become a common affliction in modern medicine.
Disclosure
Nothing to report.
- IMS Institute for Healthcare Informatics. Medicine Use and Shifting Costs of Healthcare. 2014. Available at: http://www.imshealth.com/deployedfiles/imshealth/Global/Content/Corporate/IMS%20Health%20Institute/Reports/Secure/IIHI_US_Use_of_Meds_for_2013.pdf. Accessed September 26, 2014.
- , , . National use of proton pump inhibitors from 2007 to 2011. JAMA Intern Med. 2014;174(11):1856–1858.
- Health Canada. Proton Pump Inhibitors (antacids): Possible Risk of Clostridium difficile‐Associated Diarrhea. 2012. Available at: http://www.healthycanadians.gc.ca/recall‐alert‐rappel‐avis/hc‐sc/2012/13651a‐eng.php. Accessed February 16, 2015.
- Health Canada. Proton Pump Inhibitors: Hypomagnesemia Accompanied by Hypocalcemia and Hypokalemia. 2011. Available at: http://www.hc‐sc.gc.ca/dhp‐mps/medeff/bulletin/carn‐bcei_v21n3‐eng.php#_Proton_pump_inhibitors. Accessed February 16, 2015.
- US Food and Drug Administration. FDA Drug Safety Communication: Possible Increased Risk of Fractures of the Hip, Wrist, and Spine With the Use of Proton Pump Inhibitors. 2012. Available at: http://www.fda.gov/Drugs/DrugSafety/PostmarketDrugSafetyInformationforPatientsandProviders/ucm213206.htm. Accessed February 15, 2015.
- US Food and Drug Administration. FDA Drug Safety Communication: Clostridium difficile‐Associated Diarrhea Can Be Associated With Stomach Acid Drugs Known as Proton Pump Inhibitors (PPIs). 2012. Available at: http://www.fda.gov/drugs/drugsafety/ucm290510.htm. Accessed February 15, 2015.
- , , . Meta‐analysis: proton pump inhibitor use and the risk of community‐acquired pneumonia. Aliment Pharmacol Ther. 2010;31(11):1165–1177.
- , , , et al. Proton pump inhibitors and risk of 1‐year mortality and rehospitalization in older patients discharged from acute care hospitals. JAMA Intern Med. 2013;173(7):518–523.
- , , , . Acid‐suppressive medication use and the risk for hospital‐acquired pneumonia. JAMA. 2009;301(20):2120–2128.
- , , , et al. Proton pump inhibitors and functional decline in older adults discharged from acute care hospitals. J Am Geriatr Soc. 2014;62(6):1110–1115.
- , , , , . Do hospitalists overuse proton pump inhibitors? Data from a contemporary cohort. J Hosp Med. 2014;9(11):731–733.
- , , , , , . Inappropriate prescribing of proton pump inhibitors in hospitalized patients. J Hosp Med. 2012;7(5):421–425.
- , , , , . Potential costs of inappropriate use of proton pump inhibitors. Am J Med Sci. 2014;347(6):446–451.
- , , , . Long‐term use of acid suppression started inappropriately during hospitalization. Aliment Pharmacol Ther. 2005;21(10):1203–1209.
- , , , , , . Continuation of proton pump inhibitors from hospital to community. Pharm World Sci. 2006;28(4):189–193.
- , , , , , . Hospitalist and primary care physician perspectives on medication management of chronic conditions for hospitalized patients. J Hosp Med. 2014;9(5):303–309.
- , , , et al. Antibacterial treatment of gastric ulcers associated with Helicobacter pylori. N Engl J Med. 1995;332(3):139–142.
- , , , et al. Effect of intravenous omeprazole on recurrent bleeding after endoscopic treatment of bleeding peptic ulcers. N Engl J Med. 2000;343(5):310–316.
- , , , et al. Lansoprazole for the prevention of recurrences of ulcer complications from long‐term low‐dose aspirin use. N Engl J Med. 2002;346(26):2033–2038.
- , . American College of Gastroenterology guideline on the management of Helicobacter pylori infection. Am J Gastroenterol. 2007;102(8):1808–1825.
- , , . Guidelines for prevention of NSAID‐related ulcer complications. Am J Gastroenterol. 2009;104(3):728–738.
- , , , Canadian consensus guidelines on long‐term nonsteroidal anti‐inflammatory drug therapy and the need for gastroprotection: benefits versus risks. Aliment Pharmacol Ther. 2009;29(5):481–496.
- , , , et al., The effects of guideline implementation for proton pump inhibitor prescription on two pulmonary medicine wards. Aliment Pharmacol Ther. 2009;29(2):213–221.
- , , , . Segmented regression analysis of interrupted time series studies in medication use research. J Clin Pharm Ther. 2002;27(4):299–309.
- , , . Overuse of acid‐suppressive therapy in hospitalized patients. Am J Gastroenterol. 2000;95(11):3118–3122.
- , , , . Proton pump inhibitors: a survey of prescribing in an Irish general hospital. Int J Clin Pract. 2005;59(1):31–34.
- , , . Overuse of proton pump inhibitors. J Clin Pharm Ther. 2000;25(5):333–340.
- , , , et al. Prevalence and appropriateness of drug prescriptions for peptic ulcer and gastro‐esophageal reflux disease in a cohort of hospitalized elderly. Eur J Intern Med. 2011;22(2):205–210.
- , , , . Inappropriate prescribing of proton pump inhibitors in primary care. Postgrad Med J. 2007;83(975):66–68.
- , , , , , . Inappropriate prescribing of proton pump inhibitors in older patients: effects of an educational strategy. Drugs Aging. 2012;29(8):681–690.
- , , , . Impact of academic detailing on proton pump inhibitor prescribing behaviour in a community hospital. Can Pharm J (Ott). 2011;144(2):66–71.
- , , , , , . Decreased acid suppression therapy overuse after education and medication reconciliation. Int J Clin Pract. 2013;67(1):60–65.
In 2013, there were more than 15 million Americans receiving proton pump inhibitors (PPIs),[1] with an associated drug cost of nearly $79 billion between 2007 and 2011.2 PPI use is reaching epidemic proportions, likely due to the medicalization of gastrointestinal symptoms coupled with pervasive marketing and academic detailing being performed by the pharmaceutical industry.
Although PPIs are generally considered safe, they are not as innocuous as many physicians believe. In 2011 and 2012, the US Food and Drug Administration and Health Canada, respectively, issued safety advisories regarding the use of these medications related to Clostridium difficile, fracture risk, and electrolyte derangement.[3, 4, 5, 6] There have also been numerous other harmful associations reported,[7, 8, 9, 10] suggesting it would be prudent to follow Health Canada's advice that: PPIs should be prescribed at the lowest dose and shortest duration of therapy appropriate to the condition being treated.[4] In many cases this implies stopping the PPI after an appropriate duration of therapy or attempting nonpharmacological or H2‐blocker therapy instead.
Nevertheless, despite numerous cautionary publications, PPI use for nonevidence‐based indications remains common. Because they are generally thought of as outpatient medications, PPIs are frequently continued in hospitalized patients, and inappropriate outpatient therapy is rarely addressed.[11, 12, 13] Likewise, inappropriate de novo use can also be observed during hospitalization and may continue on discharge.[13, 14, 15] Hospitalization may consequently present an opportunity to employ meaningful interventions targeting outpatient medication use.[16] We developed an opportune inpatient intervention targeting inappropriate PPI therapy.
Our study had 2 aims: first, to determine the magnitude of the problem in a contemporary Canadian medical inpatient population, and second, we sought to leverage the inpatient admission as an opportunity to promote change when the patient returned to the community through the application of an educational and web‐based quality‐improvement (QI) intervention.
METHODS
Patient Inclusion
Between January 2012 and December 2012, we included all consecutively admitted patients on our 46‐bed general medical clinical teaching unit belonging to a 417‐bed tertiary care teaching hospital in Montreal, Canada. There were no exclusion criteria. This time period was divided into 2 blocks: the preintervention control period from January 1 to June 3 and the intervention period from June 4 to December 16.
Intervention and Implementation Strategy
At the start of each academic period, we presented a 20‐minute information session on the benefits and harms of PPI use (see Supporting Information, Appendix, in the online version of this article). The unit's medical residents and faculty attended these rounds. The presentation described the project, consensus‐derived indications for PPI use, and potential adverse events attributable to PPIs (see Table 1 for indications based on internal consensus and similar studies[17, 18, 19, 20, 21, 22, 23]). All other indications were considered nonevidence based. At the end of the month, teams were given feedback on indications they provided using the Web tool and the proportion of patients they discharged on a PPI with and without indication.
|
| 1. Gastric or duodenal ulcer within the past 3 months |
| 2. Pathological hypersecretory conditions |
| 3. Gastroesophageal reflux disease with exacerbations within the last 3 months not responsive to H2 blockers and nonpharmacologic techniques |
| 4. Erosive esophagitis |
| 5. Recurring symptoms recently associated with severe indigestion within the last 3 months not responsive to H2 blocker or nonpharmacologic techniques |
| 6. Helicobacter pylori eradication |
| 7. Dual antiplatelet therapy |
| 8. Antiplatelet therapy with anticoagulants |
| 9. Antiplatelet or anticoagulant therapy with history of previous complicated ulcer |
| 10. Antiplatelet or NSAID with 2 of the following: concomitant systemic corticosteroids, age over 60 years, previous uncomplicated ulcer, concomitant NSAID, or antiplatelet/anticoagulant |
The process of evaluating and stopping PPIs was voluntary. Housestaff were encouraged to evaluate PPIs when ordering admission medications and upon preparing exit prescriptions. This was an opt‐in intervention. Once a patient on a PPI was identified, typically on admission to the unit, the indication for use could then be evaluated using the online tool, which was accessible on the internet via a link on all unit computers (see Supporting Information, Appendix, in the online version of this article).
The Web‐based tool was designed to be simple and informative. Users of the tool input anonymous data including comorbidities (check boxes provided). The tool collected the indication for PPI use, with available options including: the consensus‐derived evidence‐based indications, no identified indication, or free text. This was done purposefully to remind the teams of the consensus indications, with the goal that in choosing no identified indication the resident would consider cessation of unnecessary PPIs. The final step in the tool, discharge plan, presented the option of stopping the PPI in the absence of a satisfactory indication. We hypothesized that selecting this option would serve as an informal commitment to discontinuing the PPI during the creation of the discharge prescription; however, the tool was not automatically linked to these prescriptions.
If a home prescription was discontinued, the patient was counselled by the treating team and provided with an educational letter (see Supporting Information, Appendix, in the online version of this article), which was fastened to their discharge summary and given to the patient for delivery to all of their usual outpatient physician(s).
The design of the online tool was such that residents were to evaluate PPI use that would continue postdischarge from the hospital, rather than PPI use limited to the period of hospitalization.
Data Collection and Statistical Analysis
Data on baseline demographics and the specific indications for PPI use were collected through clinician interaction with the online tool. The proportion of patients on a PPI was ascertained through a separate data extraction of electronic discharge prescriptions. These involved medication reconciliation for all outpatient medications including whether or not they were continued, modified, or stopped. Thus, we could determine at discharge whether outpatient PPIs were continued or stopped or if a new PPI was initiated.
The proportion of patients admitted from home already receiving a PPI, those who received a new prescription for a PPI at discharge, and those whose PPI was stopped during admission were compared before and after the intervention using segmented regression analysis of an interrupted time series (see Supporting Information, Appendix, in the online version of this article).[24]
Post Hoc Power Calculations
For the pre‐post comparisons, given the preintervention number of admissions, proportions of PPI use in the community, new PPI use, and PPI discontinuation rates we would have had an 80% power to detect changes of 8.5%, 5%, and 5.5%, respectively.
Ethics
The McGill University Health Centre research ethics board approved this study. Informed consent was waived as the intervention was deemed to be best practice, and data collected were anonymous. Clinical consent was obtained by the treating team for all care decisions.
Funding
This initiative was conducted without any funding.
RESULTS
During the preintervention period, 464 patients were admitted, of whom 209 (45%) were taking a PPI prior to admission. During their hospitalization, an additional 53 patients (21% of nonusers) were newly prescribed a PPI that was continued at discharge. During the intervention period, a total of 640 patients were admitted, of whom 281 (44%) were taking a PPI prior to admission. During their hospitalization, 60 patients (17% of nonusers) were newly prescribed a PPI that was continued at discharge. Neither the monthly proportions admitted on PPIs from prior to admission (level P=0.59, slope P=0.46) or those newly initiated on a PPI (level P=0.36, slope P=0.18) were significantly different before compared to after the intervention. However, there was both a clinically and statistically significant difference in the proportion of preadmission PPIs that were discontinued at hospital discharge from a monthly mean of 7.7% (or 16/209) before intervention to 18.5% (or 52/281) afterward (Figure 1; level P=0.03, slope P=0.48).
During the intervention period, our teams prospectively captured PPI indications and patient comorbidities for 54% (152/281) of the patients admitted on a PPI using the online assessment tool. The baseline characteristics of the population in whom the online tool was applied are shown in Table 2. These patients had a mean age of 69.6 years, and 49% were male. Thirty‐two percent had diabetes, 20% had chronic renal insufficiency, and 13% had experienced a gastrointestinal hemorrhage within the 3 months prior to admission. It was frequent for PPI users to receive systemic antibiotics (44%) or to have diagnoses potentially associated with PPI use such as community‐acquired pneumonia (25%) or C difficile (11%).
| Characteristic | Value |
|---|---|
| |
| Age, y, mean (SD) | 69.615.1 |
| Male gender, N (%) | 75 (49) |
| Initiation of PPI, N (%) | |
| Prior to hospitalization | 127 (84) |
| During hospitalization | 10 (6) |
| In ICU | 7 (4) |
| In ER | 8 (5) |
| Comorbidities, N (%) | |
| Diabetes mellitus | 48 (32) |
| Chronic renal failure, GFR <45 | 29 (20) |
| GI bleed in the last 3 months | 20 (13) |
| No comorbidities | 11 (7) |
| Medications, N (%) | |
| Current antiplatelet agent | 67 (44) |
| Current corticosteroid use | 40 (26) |
| Current therapeutic anticoagulation | 35 (23) |
| Current NSAID use | 13 (8.5) |
| Current bisphosphonate | 13 (8.5) |
| Potential contraindications to PPI, N (%) | |
| Current antibiotic therapy | 67 (44) |
| Pneumonia | 38 (25) |
| Clostridium difficile infection ever | 16 (11) |
| Clostridium difficile infection on present admission | 9 (6) |
Fifty‐four percent (82/152) of patients in whom the online tool was applied had an evidence‐based indication (Table 3). The most common indication for PPI prescription was the receipt of antiplatelet/anticoagulant or nonsteroidal anti‐inflammatory drug with 2 other known risk factors for upper gastrointestinal bleeding (20%). In the remaining 46% (70/152) of patients, the prescription of a PPI was deemed nonevidence based. Of these, 34 (49%) had their PPI discontinued. When patients were approached to discontinue therapy, the rate of success was high, with only 2 refusals.
| Indications | N (%) |
|---|---|
| |
| Approved indications for therapy | |
| Antiplatelet or NSAID with 2 of the following: age >60 years, systemic corticosteroids, previous uncomplicated ulcer, NSAID, or antiplatelet/anticoagulant | 28 (20) |
| Gastric or duodenal ulcer within the past 3 months | 23 (15) |
| Antiplatelet therapy with anticoagulants | 17 (11) |
| GERD with exacerbations within the last 3 months | 17 (11) |
| Dual antiplatelet therapy | 7 (5) |
| Pathological hypersecretory conditions | 0 |
| Helicobactor pylori eradication | 0 |
| Total with consensus indications | 79 (54) |
| Other described indications for therapy | |
| No indication identified | 46 (30) |
| Othera | 22 (14) |
| Palliative patients GERD prophylaxis | 5 (3) |
| Total without consensus indications | 70 (46) |
DISCUSSION
In this prospective intervention, 44% of patients admitted to an acute‐care medical ward were prescribed a PPI prior to their admission. In the subgroup of patients for whom the indication for PPI use was recorded through our online tool, less than half had an evidence‐based indication for ongoing therapy. Our intervention was successful in increasing the proportion of patients in whom preadmission PPI prescriptions were stopped at discharge from an average of 7.7% in the preintervention phase to 18.5% during the intervention. This intervention is novel in that we were able to reduce active community prescriptions for PPIs in patients without obvious indication by nearly 50%.
Our population's rates of PPI prescription were consistent with previous reports,[11, 12, 13, 15, 25, 26, 27, 28] and it is clear that many hospitalized patients continue their PPIs at discharge without clear indications. We propose that hospitalization can serve as an opportunity to reassess the necessity of continuous PPI use. Previous systematic attempts to reduce inappropriate PPI prescriptions in hospital have met with varied success. Several of these studies were unable to achieve a demonstrable effect.[23, 29, 30, 31] In contrast, Hamzat et al.[30] described a successful educational intervention targeting inpatients on a geriatric ward. A 4‐week educational strategy was employed, and they were able to discontinue PPIs in 10 of 60 (17%) patients without indication during a limited period of study. Another successful intervention by Gupta et al.[32] involved a before‐and‐after study combining a half‐hour physician education session with the introduction of a medication reconciliation tool. They showed a decrease in inappropriate discharge prescriptions of 50%. Not only did our study demonstrate an equally sizable reduction in inappropriate discharge prescriptions, but we also employed a more methodologically sound time‐series analysis to control for unmeasured contemporaneous factors such as rotating staff practices or monthly differences in patient composition. We demonstrated an immediate and sustained improvement in performance that lasted over 6 months. Furthermore, in contrast to other interventions, which addressed inappropriate inpatient use persisting on discharge, our intervention also addressed the appropriateness of PPI use that antedated hospitalization.
There are common themes to the successful programs. The more time spent educating and reminding the prescribing physicians, the more successful the intervention. Nonetheless, we believe our intervention is not onerous or overly time consuming. We performed a short presentation each month to educate rotating physicians, and the tool took less than 1 minute to complete once the information on PPI indication was available. Frequent education sessions may be initially necessary given the comfort that many physicians have developed in prescribing PPIs. A further prerequisite for success may be a familiarity with PPI indications and potential adverse effects. Without this, the intervention may not show a demonstrable effect, as was seen in a study of pulmonologists.[23] We hypothesize that some subspecialist physicians may not have the same appreciation of the adverse effects of PPIs nor the confidence to stop them when not indicated, as compared to general internists or hospitalists.
The proportion of patients with newly initiated PPIs at discharge decreased after the intervention, but this did not reach statistical significance. Our study's power may have precluded this. However, we had also previously put in place unpublished interventions to diminish inappropriate gastric prophylaxis in the hospital, which may have diminished the effect of this intervention.
Unfortunately, although we demonstrated a clinically significant effect on PPI exit prescription rates, we still found that nearly half of the patients who were evaluated using the online tool were discharged on PPIs despite our physicians' acknowledgment that they had no identifiable indication. It is possible that clinicians do not feel comfortable stopping these medications, owing to a fear that there is an indication that they are not aware of. In certain cases, it is possible that a reappraisal of the benefits, risks, and costs might reassure the clinician that they could safely stop the drug; however, therapeutic inertia is often hard to overcome.
Limitations
Our single‐center study occurred over a limited time period and examined a sample of patients that were assessed based on convenience. Other limitations included the uptake of the online tool, which was only 54% of patients on a PPI. In particular, few patients who were newly started on a PPI had the online tool applied. This is likely because the tool was filled out on a volunteer basis and was applied most routinely during the admission medication reconciliation process. There were a number of other reasons why the tool was underused, including having the inpatient teams responsible for the data collection despite preexisting demands on their time and the lack of data from patients who were admitted and discharged before a thorough review of the indication for PPI use could take place. However, despite the incomplete use of the online tool, the demographics of patients who were assessed are similar to our usual patient population. As such, we believe the data captured are representative. Furthermore, despite the tool being underused, there remained a clearly objectified reduction in PPI exit prescriptions that occurred immediately postintervention and persisted throughout the entire period of study. Although our teams were not universally using the Web‐tool, it was clear that they were influenced by the project and were stopping unnecessary therapy.
Additionally, the absence of postdischarge follow‐up is also an important limitation. We had originally planned to audit all patients whose PPIs were stopped at 3 months postdischarge but were not systematically able to do so. We did, however, obtain a 1‐time convenience sample interview midway through the intervention. At that time, of 18 patients interviewed, all but 1 remained off of their PPI at 3 months postdischarge. The 1 restart was for reflux symptoms without a preceding trial of lifestyle therapy or H2 blocker.
One final limitation of this study design is that the implementation portion of the intervention took place at the beginning of the academic year. Trainees at the beginning of the year might differ from trainees at the end of the year in that they are more receptive to an educational intervention and less firmly fixed in their practice patterns. If one is considering implementing a similar strategy in their academic institution, we recommend doing so at the start of the academic year to capture the interest of new trainees, maximize the intervention's effectiveness, and establish good habits early in training.
CONCLUSION
We have demonstrated that in medical inpatients, both PPI use and misuse remain common; however, with a combined educational and Web‐based QI intervention, we could successfully decrease inappropriate exit prescriptions. Hospitalization, particularly at academic centers, should serve as an important point of contact for residents in training and expert faculty physicians to reconsider and rationalize patient medications. We should take the opportunity to engender a culture of responsibility for all of the medications that we represcribe at discharge, including an appraisal of the relevant harms and benefits, particularly when a medication is potentially unnecessary. We ought to then communicate the rationale for any changes to our community partners to maintain continuity of care. In this way, hospitalists can help treat the prescription indigestion that has become a common affliction in modern medicine.
Disclosure
Nothing to report.
- IMS Institute for Healthcare Informatics. Medicine Use and Shifting Costs of Healthcare. 2014. Available at: http://www.imshealth.com/deployedfiles/imshealth/Global/Content/Corporate/IMS%20Health%20Institute/Reports/Secure/IIHI_US_Use_of_Meds_for_2013.pdf. Accessed September 26, 2014.
- , , . National use of proton pump inhibitors from 2007 to 2011. JAMA Intern Med. 2014;174(11):1856–1858.
- Health Canada. Proton Pump Inhibitors (antacids): Possible Risk of Clostridium difficile‐Associated Diarrhea. 2012. Available at: http://www.healthycanadians.gc.ca/recall‐alert‐rappel‐avis/hc‐sc/2012/13651a‐eng.php. Accessed February 16, 2015.
- Health Canada. Proton Pump Inhibitors: Hypomagnesemia Accompanied by Hypocalcemia and Hypokalemia. 2011. Available at: http://www.hc‐sc.gc.ca/dhp‐mps/medeff/bulletin/carn‐bcei_v21n3‐eng.php#_Proton_pump_inhibitors. Accessed February 16, 2015.
- US Food and Drug Administration. FDA Drug Safety Communication: Possible Increased Risk of Fractures of the Hip, Wrist, and Spine With the Use of Proton Pump Inhibitors. 2012. Available at: http://www.fda.gov/Drugs/DrugSafety/PostmarketDrugSafetyInformationforPatientsandProviders/ucm213206.htm. Accessed February 15, 2015.
- US Food and Drug Administration. FDA Drug Safety Communication: Clostridium difficile‐Associated Diarrhea Can Be Associated With Stomach Acid Drugs Known as Proton Pump Inhibitors (PPIs). 2012. Available at: http://www.fda.gov/drugs/drugsafety/ucm290510.htm. Accessed February 15, 2015.
- , , . Meta‐analysis: proton pump inhibitor use and the risk of community‐acquired pneumonia. Aliment Pharmacol Ther. 2010;31(11):1165–1177.
- , , , et al. Proton pump inhibitors and risk of 1‐year mortality and rehospitalization in older patients discharged from acute care hospitals. JAMA Intern Med. 2013;173(7):518–523.
- , , , . Acid‐suppressive medication use and the risk for hospital‐acquired pneumonia. JAMA. 2009;301(20):2120–2128.
- , , , et al. Proton pump inhibitors and functional decline in older adults discharged from acute care hospitals. J Am Geriatr Soc. 2014;62(6):1110–1115.
- , , , , . Do hospitalists overuse proton pump inhibitors? Data from a contemporary cohort. J Hosp Med. 2014;9(11):731–733.
- , , , , , . Inappropriate prescribing of proton pump inhibitors in hospitalized patients. J Hosp Med. 2012;7(5):421–425.
- , , , , . Potential costs of inappropriate use of proton pump inhibitors. Am J Med Sci. 2014;347(6):446–451.
- , , , . Long‐term use of acid suppression started inappropriately during hospitalization. Aliment Pharmacol Ther. 2005;21(10):1203–1209.
- , , , , , . Continuation of proton pump inhibitors from hospital to community. Pharm World Sci. 2006;28(4):189–193.
- , , , , , . Hospitalist and primary care physician perspectives on medication management of chronic conditions for hospitalized patients. J Hosp Med. 2014;9(5):303–309.
- , , , et al. Antibacterial treatment of gastric ulcers associated with Helicobacter pylori. N Engl J Med. 1995;332(3):139–142.
- , , , et al. Effect of intravenous omeprazole on recurrent bleeding after endoscopic treatment of bleeding peptic ulcers. N Engl J Med. 2000;343(5):310–316.
- , , , et al. Lansoprazole for the prevention of recurrences of ulcer complications from long‐term low‐dose aspirin use. N Engl J Med. 2002;346(26):2033–2038.
- , . American College of Gastroenterology guideline on the management of Helicobacter pylori infection. Am J Gastroenterol. 2007;102(8):1808–1825.
- , , . Guidelines for prevention of NSAID‐related ulcer complications. Am J Gastroenterol. 2009;104(3):728–738.
- , , , Canadian consensus guidelines on long‐term nonsteroidal anti‐inflammatory drug therapy and the need for gastroprotection: benefits versus risks. Aliment Pharmacol Ther. 2009;29(5):481–496.
- , , , et al., The effects of guideline implementation for proton pump inhibitor prescription on two pulmonary medicine wards. Aliment Pharmacol Ther. 2009;29(2):213–221.
- , , , . Segmented regression analysis of interrupted time series studies in medication use research. J Clin Pharm Ther. 2002;27(4):299–309.
- , , . Overuse of acid‐suppressive therapy in hospitalized patients. Am J Gastroenterol. 2000;95(11):3118–3122.
- , , , . Proton pump inhibitors: a survey of prescribing in an Irish general hospital. Int J Clin Pract. 2005;59(1):31–34.
- , , . Overuse of proton pump inhibitors. J Clin Pharm Ther. 2000;25(5):333–340.
- , , , et al. Prevalence and appropriateness of drug prescriptions for peptic ulcer and gastro‐esophageal reflux disease in a cohort of hospitalized elderly. Eur J Intern Med. 2011;22(2):205–210.
- , , , . Inappropriate prescribing of proton pump inhibitors in primary care. Postgrad Med J. 2007;83(975):66–68.
- , , , , , . Inappropriate prescribing of proton pump inhibitors in older patients: effects of an educational strategy. Drugs Aging. 2012;29(8):681–690.
- , , , . Impact of academic detailing on proton pump inhibitor prescribing behaviour in a community hospital. Can Pharm J (Ott). 2011;144(2):66–71.
- , , , , , . Decreased acid suppression therapy overuse after education and medication reconciliation. Int J Clin Pract. 2013;67(1):60–65.
© 2015 Society of Hospital Medicine

Attention-Deficit/Hyperactivity Disorder in a VA Polytrauma Clinic
Traumatic brain injury (TBI) and posttraumatic stress disorder (PTSD) are considered the signature injuries in veterans of the military operations in Iraq and Afghanistan.1 In 2007, the VA implemented the Polytrauma System of Care (PSC) to provide comprehensive screening, evaluation, and treatment of these multifaceted injuries.2,3 The VA defined polytrauma as “two or more injuries to physical regions or organ systems, one of which may be life threatening, resulting in physical, cognitive, psychological, or psychosocial impairments and functional disability.”3 The VA intended the PSC to provide a national system of integrated care to meet the unique needs of these combat service members.
In addition to the comprehensive evaluation and treatment of traumatic injuries, a critical mission of the PSC is to facilitate the reintegration of injured combat veterans into their home communities. Optimal community reintegration requires that the clinician also assess premorbid comorbidities, which may affect postdeployment adjustments. Attention-deficit/hyperactivity disorder (ADHD), with an estimated adult prevalence of 4.4% in the U.S. and 2.5% to 3.4% worldwide, is a common disorder in the general adult population that often is associated with chronic social and vocational adjustment difficulties.4-6 The increasing recognition that this disorder often persists into adulthood is of significance to veterans, largely young and male, who have left military service and are reintegrating into college and community job settings.7 Despite growing interest in adult ADHD, little is known about its prevalence and correlates in the veteran population.
The prevalence of ADHD in the Operation Enduring Freedom/Operation Iraqi Freedom/Operation New Dawn (OEF/OIF/OND) veteran polytrauma population has not been adequately studied. Studies have found that combat veterans with or without confirmed TBI diagnosis commonly have similar overlapping symptoms, such as memory problems, difficulty concentrating, poor attention, and sleep problems associated with other comorbidities such as pain, PTSD, ADHD, and other mental health diagnoses.8-14 Increased awareness of various clinical variables would enhance understanding of the population characteristics and specific needs for education and management.
Related: Preparing the Military Health System for the 21st Century
To begin to address the lack of information about ADHD in the VA polytrauma population, this study aimed to (1) identify the prevalence of ADHD in veterans referred to the Clement J. Zablocki (CJZ) VAMC Polytrauma Clinic (PC) in Milwaukee, Wisconsin; (2) describe demographic characteristics of polytrauma veterans with ADHD; (3) determine the comorbidity relationship between ADHD and TBI, PTSD, depression and anxiety disorders, and substance abuse; and (4) determine whether individuals with ADHD compared with those without ADHD report more physical and emotional symptomatic distress with particular attention given to reports of pain, headaches, and problems with attention and concentration, memory, and sleep.
Methods
The study population consisted of 690 OEF/OIF/OND soldiers and veterans who received a comprehensive TBI evaluation in the CJZVAMC PC from January 1, 2008, to December 31, 2012. Referrals to the PC were made by primary care physicians (PCPs) when OEF/OIF/OND veterans or service members enrolled at a VA facility for health care or transferred their care from another VA facility.
Either a prior diagnosis of TBI established by a qualified provider or positive responses to a 4-question screening tool for TBI prompted a referral to the PC. The 4 questions sought to establish (1) events that may increase risk of TBIs; (2) immediate symptoms following the event; (3) new or worsening symptoms following the event; and (4) current symptoms.1 Referrals to the clinic most commonly came from PCPs at the CJZVAMC and its associated community-based outpatient clinics but occasionally came from mental health service providers.
Study Design
The CJZVAMC Institutional Review Board approved this study. A population database was developed from a review of medical records, clinical interviews of patients, and completion of standard intake forms during the veterans’ initial evaluations in the CJZVAMC PC. The database aimed to abstract patient information relevant for understanding and treating the population seen in the clinic. The database contained information related to demographics, injury parameters, neurobehavioral and PTSD symptoms, past and current mental health disorders, substance abuse history, pain symptoms, and developmental history (eg, ADHD, learning disability).
Related: First Brain Wave Test to Diagnose ADHD
Prior to the PC intake interview, each veteran completed a packet of preclinic questionnaires that included information concerning deployment-related injury exposure and history; the 22-item Neurobehavioral Symptom Inventory (NSI), which assessed physical, cognitive, and emotional symptoms; current pain symptoms; and the Posttraumatic Stress Disorder Checklist-Civilian Version (PCLC).15,16 Intake interviews in the CJZVAMC PC were typically conducted with a minimum of 2 specialties present (physical medicine/rehabilitation and neuropsychology) and occasionally as many as 4 specialties present (also including health psychology and social work). Data collection and abstraction for the database were derived by all specialties present and assisted by the polytrauma program technician.
Diagnoses
The diagnosis of ADHD in a veteran was established through 1 of 2 methods: (1) report of a developmental history of behavioral adjustment difficulties consistent with ADHD that was coupled with formal psychiatric diagnosis and recommended treatment of ADHD in childhood; or (2) current diagnosis of ADHD as identified in the veteran’s active problem list. In most cases of report of developmental diagnosis, the veteran reported having been diagnosed and having received treatment with a stimulant medication for a period of time. In a few cases, the veteran reported having been diagnosed and stimulant medication was recommended, but the veteran’s parents declined the pharmacologic treatment in favor of behavioral treatment strategies.
In cases of current diagnosis, Diagnostic and Statistical Manual of Mental Disorders, Text Revision, 4th Edition (DSM-IV-TR), criteria were applied and supported by formal clinical examinations for ADHD conducted by psychologists, psychiatrists or neuropsychologists, or through VA disability (Compensation and Pension) evaluations where an issue related to ADHD diagnosis was raised.17 There was considerable overlap between these 2 diagnostic criteria (ie, through report of developmental history of diagnosis or formal adult evaluation) with 93% of cases being positive on both diagnostic methods.
Other comorbid psychiatric (eg, depression, anxiety, PTSD, substance abuse) and medical (eg, headache, pain) conditions also were abstracted from the veteran’s medical records at the time of the intake evaluation. Documentation of these conditions was derived from the veteran’s problem list and clinical notes that identified the condition as a diagnostic conclusion or focus of treatment. The comorbid conditions were not otherwise independently documented. Many veterans were taking psychotropic medications for mood, sleep, or chronic pain problems at the time of evaluation in the PC; however, use of medication and their effects were not systematically evaluated.
Statistical Analysis
In addition to documentation of the population prevalence for ADHD, analysis for disproportionate prevalence of comorbid conditions in individuals with ADHD compared with those without ADHD was done through the use of the chi-square test and/or Fisher exact test. For continuous variables, t tests were used to compare individuals with ADHD with individuals without ADHD. To control family-wise type I error to a P value of .05, a false discovery rate (FDR) was applied to studies of demographics, comorbidities, and ratings of symptomatic distress.
Results
The general population characteristics of the 690 veterans and soldiers are summarized in Table 1. The sample was predominantly male (96%), white (88%), and ranged in age from 22 to 55 years with a mean of 28 years. Active-duty service members and reservists from the U.S. Army, Marines, Navy, and Air Force were represented, but most were Army veterans (72%). Most (63%) had a high school education. About two-thirds of the veterans had a single deployment, and the remaining had multiple deployments.

The TBI clinic evaluations found that 58% of the patients had ≥ 1 TBI during their deployments, almost exclusively mild in severity. Seventy-three patients met study criteria for ADHD: 69 with an identified history of diagnosis in childhood and 68 with a current diagnosis, with 93% overlap of these groups. Table 2 provides a breakdown of demographic characteristics, comorbidities, and symptomatic distress in veterans with ADHD compared with those without the diagnosis.

Demographic Characteristics
Veterans with ADHD were found to be slightly younger (2.3 years younger, P = .003) and to have less education (greater frequency of less than high school and high school only, P = .003) compared with those who did not have the diagnosis. No significant group differences in sex, employment/school status, marital status, or number of deployments were identified in veterans with ADHD compared with non-ADHD veterans. Individuals with ADHD did not experience more physical, emotional, or sexual abuse as children than did their non-ADHD counterparts. The prevalence of TBI during deployment was similar in veterans with ADHD compared with that of non-ADHD veterans. There was a trend for veterans with ADHD to have more TBIs prior to military service than in non-ADHD veterans; however, this trend did not reach statistical significance (P = .188).
Comorbidities
After application of the FDR threshold, veterans with ADHD did not show a disproportionate prevalence of mental health diagnoses (eg, PTSD, depression and anxiety disorders, or substance abuse). There was a nonsignificant trend for more veterans with ADHD to report pain during the previous 30 days (P = .035) and more issues with substance abuse (P = .10) than for non-ADHD veterans, but these trends did not meet the FDR threshold of < .05.
Symptomatic Distress
Veterans with ADHD did not report significantly greater levels of distress on either the NSI or the PCLC survey compared with non-ADHD veterans.Not surprisingly, when select symptoms were investigated, veterans with ADHD reported more problems with attention and concentration than for non-ADHD veterans (P = .015). No group differences were identified for sleep issues, headaches, or memory, although there was a trend for the latter (P = .14).
Discussion
In this study, there was a 10.6% prevalence of ADHD in 690 OEF/OIF/OND combat veterans. This rate is considerably higher than estimates of prevalence of ADHD in adults (4.4%) made from a nationwide survey and worldwide prevalence estimates of 2.5% to 3.5%.4-6 Still, the current prevalence finding is consistent with a recent finding of ADHD in previous deploying U.S. soldiers military samples (10.4%).18 The high prevalence of ADHD in the current clinic population argues for increased provider awareness of this condition as a possible factor in postdeployment adjustment assessments.
Changes in prevalence estimates of ADHD may represent increased awareness of the condition over this interval of time, professional drift in the application of diagnostic criteria, or changes in societal attitudes about acceptability in pursuing treatment for the condition. For example, in nationwide surveys in 2003, 2007, and 2011, the CDC identified an increase from 7.8% to 9.5% to 11%, respectively, in diagnoses of ADHD in childhood.19 Also, considering that the current sample was predominantly male and the prevalence of ADHD in males is higher than in females, one might expect a higher ADHD prevalence rate in this study than that in the general population. In this regard, the ADHD prevalence rate in males remains comparable to that estimated by recent CDC survey data.19
When estimating ADHD population prevalence in the future, it is worth noting that a change in the diagnostic criteria for ADHD has occurred in DSM-5. Specifically, the age at which critical symptoms must be present to make the diagnosis of ADHD has been increased from age 7 years to age 12 years, and the number of critical symptoms to meet hyperactivity-impulsivity criteria has been lowered from 6 to 5 in older adolescents and adults.20 These changes in the diagnostic criteria for ADHD will have the net effect of increasing estimates of prevalence of ADHD.
The 73 individuals with an ADHD diagnoses in this study were found to have less education and be slightly younger than were the veterans who did not have an ADHD diagnosis. This finding is not unexpected, as individuals with ADHD are known to struggle in school and often drop out of high school and pursue alternative means of getting an equivalency degree or certification.21 Early departure from high school can be followed by earlier enlistment in the military. Prior studies by Krauss and colleagues found similar findings in an ADHD study of military recruits (ie, they were less likely to have education beyond a high school degree).7
ADHD and TBI
Given problems with attention, impulsivity, and high levels of aggressive behaviors associated with ADHD, individuals with ADHD have been found to be at higher risk for accidental injuries, including TBI, than are individuals without ADHD.21,22 Thus, soldiers with ADHD may be at greater risk for TBI during their time in the military. In the current sample, although veterans with ADHD showed a trend toward having more TBIs prior to joining the military relative to non-ADHD veterans, the veterans with ADHD had a similar rate of TBIs during their time in the military relative to non-ADHD veterans.
Although individuals with ADHD are reported to have a higher prevalence of mental health issues than does the general public, this was not evident in the current sample.21 Veterans with ADHD in this study did not have a disproportionate prevalence of PTSD, depression, anxiety, or substance abuse.
There was a nonsignificant trend for more individuals with an ADHD diagnosis compared with those without the diagnosis to report experiencing pain during the 30 days prior to their evaluation in the PC. Although not statistically significant, this finding would not be unexpected, in that individuals with ADHD are known to show less tolerance for frustration relative to that of the general population.21 In the current study, reports of pain in the ADHD group correlated with reports of being irritable and easily annoyed (r = .27, P = .024), but no correlation was observed with reports of poor frustration tolerance (r = .04, P = .74). Still, of note, > 90% of the OEF/OIF/OND veterans in this study, regardless of their ADHD diagnosis, reported pain symptoms of some type. The high prevalence of pain symptoms in this sample is consistent with a previous study that found pain to be one of the most common problems in polytrauma patients.10
Related: Civilian Stress Compounds Service-Related Stress
Not surprisingly, as shown in Table 2, veterans with ADHD compared with those without the diagnosis reported more problems with attention and concentration. The report of more attentional problems is seemingly not accounted for by group differences in reports of pain in general, headaches, sleep disturbance, or memory problems.
Study Strengths
A large sample of veterans constituted this study, and the data were gathered in consecutive referrals to the CJZVAMC PC over a 5-year period. Also, information on a number of comorbidities were captured simultaneously with the polytrauma and ADHD diagnoses, allowing much greater ability to investigate the interaction of multiple comorbidities as well as lingering reports of symptoms following discharge from active military service.
In these authors’ experience, veterans with ADHD benefit substantially from structured treatment interventions that are focused on developing compensatory skills for their problems with attention and impulsivity. Individuals with ADHD typically have a greater need for assistance with planning and organizing, making decisions, problem solving, and regulating their attention and affect. Individuals with ADHD may benefit from treatment strategies focused on ADHD behaviors in conjunction with traditional treatment strategies frequently used in the PC. These strategies include increased case management, medication trials, education regarding ADHD, vocational assistance, and consideration of both the school and work accommodations.
Studies have shown that treatments with stimulants improve functioning and reduce depression and substance use.21 In this study, < 5% of individuals with ADHD were taking stimulants at the time they were initially assessed in the PC, whereas the majority were taking stimulants after being referred for ADHD evaluation. Thus, identification of veterans with ADHD has clinical relevance in understanding the specific needs that guide development of individualized treatment plans to promote successful community reintegration.
Limitations
One limitation of the study is the lack of available medical records of historical ADHD diagnoses prior to military service. Also, although DSM-IV criteria for ADHD were operational in the psychodiagnostic clinics for these subjects, because the polytrauma study team did not conduct the evaluations in this sample, uniform diagnostic standards may not have been consistently applied when establishing the ADHD diagnosis. There was a 93% agreement between the 2 methods of diagnosis (ie, report of developmental diagnosis or positive adult evaluation), suggesting that diagnostic precision for ADHD in this study was reasonably accurate.
Another significant limitation of this study, apart from establishing medical and psychiatric status at the time of the initial referral to the PC, is the omission of functional outcome assessments regarding success of polytrauma treatment initiatives or ultimate community reintegration of successful psychosocial participation or academic and vocational achievements. Future longitudinal outcome studies are needed to determine whether ADHD has a significant impact on clinical outcomes. Of interest, pain was an overwhelmingly common factor (> 90%) for the military population studied at this site. Some degree of disturbance in attentional capacities is common in patients with chronic pain, which may aggravate ADHD symptoms and vice versa. Further investigations are needed to determine the potential functional impact of pain, including use of pain and psychotropic medications, on ADHD symptoms and the combined effect of these symptoms on overall outcome from rehabilitation and reintegration efforts.
Although these findings suggest that polytrauma veterans with ADHD do not have more psychiatric or physical comorbidities than do veterans without ADHD, it is premature to conclude that community reintegration can be optimally managed in the same way for both groups. Community reintegration of individuals with ADHD will likely be challenging, as these individuals often have struggled with functioning in their communities prior to their military service.
Studies of adult ADHD in the U.S. and in other countries have found that it is often associated with substantial impairment in managing the demands of functioning as an adult in society.4 Although some theorists have speculated that symptoms of ADHD may have been evolutionarily adaptive to survival in select environments (eg, predatory hunting environments), there is no clear evidence to support such adaptive benefits of the symptom in modern combat environments.23,24 Symptoms of ADHD are typically maladaptive to soldiers transitioning to civilian lives.
Conclusions
This investigation described the demographic and clinical characteristics of OEF/OIF/OND veterans referred for evaluation of TBI to the CJZVAMC PC during 5 years of operation from 2008 through 2012. The aim was to increase provider awareness of possible important variables that may influence recovery and community reintegration. This study may help to form the foundation for future lines of research into variables such as ADHD that may influence outcomes of rehabilitation and reintegration interventions.
To better understand the treatment needs of young veterans returning home from the wars in Iraq and Afghanistan, this study sought to identify the prevalence rate of ADHD, a condition known to complicate community adjustment. In this study, there was a 10.6% prevalence of ADHD among the 690 OEF/OIF/OND combat veterans seen over the 5-year period in the CJZVAMC PC, which is substantially higher than prevalence estimates in the U.S. general population but similar to estimates in previous military samples.
Compared with veterans who did not have ADHD, veterans with ADHD were younger, less well educated, and reported more problems with attention and concentration but did not have a greater incidence of military TBI or mental health comorbidities. The high prevalence of ADHD in this group argues for greater awareness of this clinical variable and development of intervention programs tailored to the specific skill deficiencies found in the condition, which can be included as part of the comprehensive treatment interventions.
Veterans with ADHD treated in the PC seem to benefit from structured treatment plans and education to promote self-awareness and veteran-centered self-management for effective symptom reduction and coping strategies. Development of effective integrated treatment options with a focus on educational and vocational resources and assistance could facilitate successful community reintegration. Future studies are needed to further assess outcomes of community reintegration, including academic and occupational outcomes, in this population.
Author disclosures
The authors report no actual or potential conflicts of interest with regard to this article.
Disclaimer
The opinions expressed herein are those of the authors and do not necessarily reflect those of Federal Practitioner, Frontline Medical Communications Inc., the U.S. Government, or any of its agencies. This article may discuss unlabeled or investigational use of certain drugs. Please review complete prescribing information for specific drugs or drug combinations—including indications, contraindications, warnings, and adverse effects—before administering pharmacologic therapy to patients.
1. Hoge CW, McGurk D, Thomas JL, Cox AL, Engel CC, Castro CA. Mild traumatic brain injury in U.S. soldiers returning from Iraq. N Engl J Med. 2008;358(5):453-463.
2. Screening and Evaluation of Possible Traumatic Brain Injury in Operation Enduring Freedom (OEF) and Operation Iraqi Freedom (OIF) Veterans. Washington, DC: Dept of Veterans Affairs; 2010. VHA Directive 2010-012.
3. Polytrauma System of Care. Washington, DC: Dept of Veterans Affairs; 2013. VHA Handbook 1172.01.
4. Kessler RC, Adler L, Barkley R, et al. The prevalence and correlates of adult ADHD in the United States: Results from the National Comorbidity Survey Replication. Am J Psychiatry. 2006;163(4):716-723.
5. Simon V, Czobor P, Bálint S, Mészáros A, Bitter I. Prevalence and correlates of adult attention-deficit hyperactivity disorder: Meta-analysis. Br J Psychiatry. 2009;194(3):204-211.
6. Fayyad J, De Graaf R, Kessler R, et al. Cross-national prevalence and correlates of adult attention-deficit hyperactivity disorder. Br J Psychiatry. 2007;190(5):402-409.
7. Krauss MR, Russell RK, Powers TE, Li Y. Accession standards for attention-deficit/hyperactivity disorder: A survival analysis of military recruits, 1995-2000. Mil Med. 2006;171(2):99-102.
8. Vanderploeg RD, Belanger HG, Horner RD, et al. Health outcomes associated with military deployment: Mild traumatic brain injury, blast, trauma, and combat associations in the Florida National Guard. Arch Phys Med Rehabil. 2012;93(11):1887-1895.
9. Theeler BJ, Flynn FG, Erickson JC. Headaches after concussion in US soldiers returning from Iraq or Afghanistan. Headache. 2010;50(8):1262-1272.
10. Sayer NA, Chiros CE, Sigford B, et al. Characteristics and rehabilitation outcomes among patients with blast and other injuries sustained during the Global War on Terror. Arch Phys Med Rehabil. 2008;89(1):163-170.
11. Sayer NA, Rettmann NA, Carlson KF, et al. Veterans with history of mild traumatic brain injury and posttraumatic stress disorder: Challenges from provider perspective. J Rehabil Res Dev. 2009;46(6):703-716.
12. Nampiaparampil DE. Prevalence of chronic pain after traumatic brain injury: A systematic review. JAMA. 2008;300(6):711-719.
13. Halbauer JD, Ashford JW, Zeitzer JM, Adamson MM, Lew HL, Yesavage JA. Neuropsychiatric diagnosis and management of chronic sequelae of war-related mild to moderate traumatic brain injury. J Rehabil Res Dev. 2009;46(6):757-796.
14. Romesser J, Shen S, Reblin M, et al. A preliminary study of the effect of a diagnosis of concussion on PTSD symptoms and other psychiatric variables at the time of treatment seeking among veterans. Mil Med. 2011;176(3):246-252.
15. Cicerone KD, Kalmar K. Persistent postconcussion syndrome: The structure of subjective complaints after mild traumatic brain injury. J Head Trauma Rehabil. 1995;10(3):1-17.
16. Weathers FW, Huska JA, Keane TM. PCL-C for DSM-IV. Boston, MA: National Center for PTSD–Behavioral Science Division; 1991.
17. American Psychiatric Association. Diagnostic and Statistical Manual of Mental Disorders, Text Revision (DSM-IV-TR). 4th ed. Washington, DC: American Psychiatric Association; 2000.
18. Hanson JA, Haub MD, Walker JJ, Johnston DT, Goff BS, Dretsch MN. Attention deficit hyperactivity disorder subtypes and their relation to cognitive functioning, mood states, and combat stress symptomatology in deploying U.S. soldiers. Mil Med. 2012;177(6):655-662.
19. Visser SN, Danielson ML, Bitsko RH, et al. Trends in the parent-report of health care provider-diagnosed and medicated attention-deficit/hyperactivity disorder: United States, 2003-2011. J Am Acad Child Adolesc Psychiatry. 2014;53(1):34-46.e2.
20. American Psychiatric Association. Diagnostic and Statistical Manual of Mental Disorders (DSM-5). 5th ed. Washington, DC: American Psychiatric Association; 2013.
21. Barkley, RA, Murphy KR, Fischer M. ADHD in Adults: What the Science Says. New York, NY: Guilford Press; 2008.
22. Barkley RA, Cox D. A review of driving risks and impairments associated with attention-deficit/hyperactivity disorder and the effects of stimulant medication on driving performance. J Safety Res. 2007;38(1):113-128.
23. Shelley-Tremblay JF, Rosén LA. Attention deficit hyperactivity disorder: An evolutionary perspective. J Genet Psychol. 1996;157(4):443-453.
24. Jensen PS, Mrazek D, Knapp PK, et al. Evolution and revolution in child psychiatry: ADHD as a disorder of adaptation. J Am Acad Child Adolesc Psychiatry. 1997;36(12):1672-1679.
Traumatic brain injury (TBI) and posttraumatic stress disorder (PTSD) are considered the signature injuries in veterans of the military operations in Iraq and Afghanistan.1 In 2007, the VA implemented the Polytrauma System of Care (PSC) to provide comprehensive screening, evaluation, and treatment of these multifaceted injuries.2,3 The VA defined polytrauma as “two or more injuries to physical regions or organ systems, one of which may be life threatening, resulting in physical, cognitive, psychological, or psychosocial impairments and functional disability.”3 The VA intended the PSC to provide a national system of integrated care to meet the unique needs of these combat service members.
In addition to the comprehensive evaluation and treatment of traumatic injuries, a critical mission of the PSC is to facilitate the reintegration of injured combat veterans into their home communities. Optimal community reintegration requires that the clinician also assess premorbid comorbidities, which may affect postdeployment adjustments. Attention-deficit/hyperactivity disorder (ADHD), with an estimated adult prevalence of 4.4% in the U.S. and 2.5% to 3.4% worldwide, is a common disorder in the general adult population that often is associated with chronic social and vocational adjustment difficulties.4-6 The increasing recognition that this disorder often persists into adulthood is of significance to veterans, largely young and male, who have left military service and are reintegrating into college and community job settings.7 Despite growing interest in adult ADHD, little is known about its prevalence and correlates in the veteran population.
The prevalence of ADHD in the Operation Enduring Freedom/Operation Iraqi Freedom/Operation New Dawn (OEF/OIF/OND) veteran polytrauma population has not been adequately studied. Studies have found that combat veterans with or without confirmed TBI diagnosis commonly have similar overlapping symptoms, such as memory problems, difficulty concentrating, poor attention, and sleep problems associated with other comorbidities such as pain, PTSD, ADHD, and other mental health diagnoses.8-14 Increased awareness of various clinical variables would enhance understanding of the population characteristics and specific needs for education and management.
Related: Preparing the Military Health System for the 21st Century
To begin to address the lack of information about ADHD in the VA polytrauma population, this study aimed to (1) identify the prevalence of ADHD in veterans referred to the Clement J. Zablocki (CJZ) VAMC Polytrauma Clinic (PC) in Milwaukee, Wisconsin; (2) describe demographic characteristics of polytrauma veterans with ADHD; (3) determine the comorbidity relationship between ADHD and TBI, PTSD, depression and anxiety disorders, and substance abuse; and (4) determine whether individuals with ADHD compared with those without ADHD report more physical and emotional symptomatic distress with particular attention given to reports of pain, headaches, and problems with attention and concentration, memory, and sleep.
Methods
The study population consisted of 690 OEF/OIF/OND soldiers and veterans who received a comprehensive TBI evaluation in the CJZVAMC PC from January 1, 2008, to December 31, 2012. Referrals to the PC were made by primary care physicians (PCPs) when OEF/OIF/OND veterans or service members enrolled at a VA facility for health care or transferred their care from another VA facility.
Either a prior diagnosis of TBI established by a qualified provider or positive responses to a 4-question screening tool for TBI prompted a referral to the PC. The 4 questions sought to establish (1) events that may increase risk of TBIs; (2) immediate symptoms following the event; (3) new or worsening symptoms following the event; and (4) current symptoms.1 Referrals to the clinic most commonly came from PCPs at the CJZVAMC and its associated community-based outpatient clinics but occasionally came from mental health service providers.
Study Design
The CJZVAMC Institutional Review Board approved this study. A population database was developed from a review of medical records, clinical interviews of patients, and completion of standard intake forms during the veterans’ initial evaluations in the CJZVAMC PC. The database aimed to abstract patient information relevant for understanding and treating the population seen in the clinic. The database contained information related to demographics, injury parameters, neurobehavioral and PTSD symptoms, past and current mental health disorders, substance abuse history, pain symptoms, and developmental history (eg, ADHD, learning disability).
Related: First Brain Wave Test to Diagnose ADHD
Prior to the PC intake interview, each veteran completed a packet of preclinic questionnaires that included information concerning deployment-related injury exposure and history; the 22-item Neurobehavioral Symptom Inventory (NSI), which assessed physical, cognitive, and emotional symptoms; current pain symptoms; and the Posttraumatic Stress Disorder Checklist-Civilian Version (PCLC).15,16 Intake interviews in the CJZVAMC PC were typically conducted with a minimum of 2 specialties present (physical medicine/rehabilitation and neuropsychology) and occasionally as many as 4 specialties present (also including health psychology and social work). Data collection and abstraction for the database were derived by all specialties present and assisted by the polytrauma program technician.
Diagnoses
The diagnosis of ADHD in a veteran was established through 1 of 2 methods: (1) report of a developmental history of behavioral adjustment difficulties consistent with ADHD that was coupled with formal psychiatric diagnosis and recommended treatment of ADHD in childhood; or (2) current diagnosis of ADHD as identified in the veteran’s active problem list. In most cases of report of developmental diagnosis, the veteran reported having been diagnosed and having received treatment with a stimulant medication for a period of time. In a few cases, the veteran reported having been diagnosed and stimulant medication was recommended, but the veteran’s parents declined the pharmacologic treatment in favor of behavioral treatment strategies.
In cases of current diagnosis, Diagnostic and Statistical Manual of Mental Disorders, Text Revision, 4th Edition (DSM-IV-TR), criteria were applied and supported by formal clinical examinations for ADHD conducted by psychologists, psychiatrists or neuropsychologists, or through VA disability (Compensation and Pension) evaluations where an issue related to ADHD diagnosis was raised.17 There was considerable overlap between these 2 diagnostic criteria (ie, through report of developmental history of diagnosis or formal adult evaluation) with 93% of cases being positive on both diagnostic methods.
Other comorbid psychiatric (eg, depression, anxiety, PTSD, substance abuse) and medical (eg, headache, pain) conditions also were abstracted from the veteran’s medical records at the time of the intake evaluation. Documentation of these conditions was derived from the veteran’s problem list and clinical notes that identified the condition as a diagnostic conclusion or focus of treatment. The comorbid conditions were not otherwise independently documented. Many veterans were taking psychotropic medications for mood, sleep, or chronic pain problems at the time of evaluation in the PC; however, use of medication and their effects were not systematically evaluated.
Statistical Analysis
In addition to documentation of the population prevalence for ADHD, analysis for disproportionate prevalence of comorbid conditions in individuals with ADHD compared with those without ADHD was done through the use of the chi-square test and/or Fisher exact test. For continuous variables, t tests were used to compare individuals with ADHD with individuals without ADHD. To control family-wise type I error to a P value of .05, a false discovery rate (FDR) was applied to studies of demographics, comorbidities, and ratings of symptomatic distress.
Results
The general population characteristics of the 690 veterans and soldiers are summarized in Table 1. The sample was predominantly male (96%), white (88%), and ranged in age from 22 to 55 years with a mean of 28 years. Active-duty service members and reservists from the U.S. Army, Marines, Navy, and Air Force were represented, but most were Army veterans (72%). Most (63%) had a high school education. About two-thirds of the veterans had a single deployment, and the remaining had multiple deployments.
The TBI clinic evaluations found that 58% of the patients had ≥ 1 TBI during their deployments, almost exclusively mild in severity. Seventy-three patients met study criteria for ADHD: 69 with an identified history of diagnosis in childhood and 68 with a current diagnosis, with 93% overlap of these groups. Table 2 provides a breakdown of demographic characteristics, comorbidities, and symptomatic distress in veterans with ADHD compared with those without the diagnosis.
Demographic Characteristics
Veterans with ADHD were found to be slightly younger (2.3 years younger, P = .003) and to have less education (greater frequency of less than high school and high school only, P = .003) compared with those who did not have the diagnosis. No significant group differences in sex, employment/school status, marital status, or number of deployments were identified in veterans with ADHD compared with non-ADHD veterans. Individuals with ADHD did not experience more physical, emotional, or sexual abuse as children than did their non-ADHD counterparts. The prevalence of TBI during deployment was similar in veterans with ADHD compared with that of non-ADHD veterans. There was a trend for veterans with ADHD to have more TBIs prior to military service than in non-ADHD veterans; however, this trend did not reach statistical significance (P = .188).
Comorbidities
After application of the FDR threshold, veterans with ADHD did not show a disproportionate prevalence of mental health diagnoses (eg, PTSD, depression and anxiety disorders, or substance abuse). There was a nonsignificant trend for more veterans with ADHD to report pain during the previous 30 days (P = .035) and more issues with substance abuse (P = .10) than for non-ADHD veterans, but these trends did not meet the FDR threshold of < .05.
Symptomatic Distress
Veterans with ADHD did not report significantly greater levels of distress on either the NSI or the PCLC survey compared with non-ADHD veterans.Not surprisingly, when select symptoms were investigated, veterans with ADHD reported more problems with attention and concentration than for non-ADHD veterans (P = .015). No group differences were identified for sleep issues, headaches, or memory, although there was a trend for the latter (P = .14).
Discussion
In this study, there was a 10.6% prevalence of ADHD in 690 OEF/OIF/OND combat veterans. This rate is considerably higher than estimates of prevalence of ADHD in adults (4.4%) made from a nationwide survey and worldwide prevalence estimates of 2.5% to 3.5%.4-6 Still, the current prevalence finding is consistent with a recent finding of ADHD in previous deploying U.S. soldiers military samples (10.4%).18 The high prevalence of ADHD in the current clinic population argues for increased provider awareness of this condition as a possible factor in postdeployment adjustment assessments.
Changes in prevalence estimates of ADHD may represent increased awareness of the condition over this interval of time, professional drift in the application of diagnostic criteria, or changes in societal attitudes about acceptability in pursuing treatment for the condition. For example, in nationwide surveys in 2003, 2007, and 2011, the CDC identified an increase from 7.8% to 9.5% to 11%, respectively, in diagnoses of ADHD in childhood.19 Also, considering that the current sample was predominantly male and the prevalence of ADHD in males is higher than in females, one might expect a higher ADHD prevalence rate in this study than that in the general population. In this regard, the ADHD prevalence rate in males remains comparable to that estimated by recent CDC survey data.19
When estimating ADHD population prevalence in the future, it is worth noting that a change in the diagnostic criteria for ADHD has occurred in DSM-5. Specifically, the age at which critical symptoms must be present to make the diagnosis of ADHD has been increased from age 7 years to age 12 years, and the number of critical symptoms to meet hyperactivity-impulsivity criteria has been lowered from 6 to 5 in older adolescents and adults.20 These changes in the diagnostic criteria for ADHD will have the net effect of increasing estimates of prevalence of ADHD.
The 73 individuals with an ADHD diagnoses in this study were found to have less education and be slightly younger than were the veterans who did not have an ADHD diagnosis. This finding is not unexpected, as individuals with ADHD are known to struggle in school and often drop out of high school and pursue alternative means of getting an equivalency degree or certification.21 Early departure from high school can be followed by earlier enlistment in the military. Prior studies by Krauss and colleagues found similar findings in an ADHD study of military recruits (ie, they were less likely to have education beyond a high school degree).7
ADHD and TBI
Given problems with attention, impulsivity, and high levels of aggressive behaviors associated with ADHD, individuals with ADHD have been found to be at higher risk for accidental injuries, including TBI, than are individuals without ADHD.21,22 Thus, soldiers with ADHD may be at greater risk for TBI during their time in the military. In the current sample, although veterans with ADHD showed a trend toward having more TBIs prior to joining the military relative to non-ADHD veterans, the veterans with ADHD had a similar rate of TBIs during their time in the military relative to non-ADHD veterans.
Although individuals with ADHD are reported to have a higher prevalence of mental health issues than does the general public, this was not evident in the current sample.21 Veterans with ADHD in this study did not have a disproportionate prevalence of PTSD, depression, anxiety, or substance abuse.
There was a nonsignificant trend for more individuals with an ADHD diagnosis compared with those without the diagnosis to report experiencing pain during the 30 days prior to their evaluation in the PC. Although not statistically significant, this finding would not be unexpected, in that individuals with ADHD are known to show less tolerance for frustration relative to that of the general population.21 In the current study, reports of pain in the ADHD group correlated with reports of being irritable and easily annoyed (r = .27, P = .024), but no correlation was observed with reports of poor frustration tolerance (r = .04, P = .74). Still, of note, > 90% of the OEF/OIF/OND veterans in this study, regardless of their ADHD diagnosis, reported pain symptoms of some type. The high prevalence of pain symptoms in this sample is consistent with a previous study that found pain to be one of the most common problems in polytrauma patients.10
Related: Civilian Stress Compounds Service-Related Stress
Not surprisingly, as shown in Table 2, veterans with ADHD compared with those without the diagnosis reported more problems with attention and concentration. The report of more attentional problems is seemingly not accounted for by group differences in reports of pain in general, headaches, sleep disturbance, or memory problems.
Study Strengths
A large sample of veterans constituted this study, and the data were gathered in consecutive referrals to the CJZVAMC PC over a 5-year period. Also, information on a number of comorbidities were captured simultaneously with the polytrauma and ADHD diagnoses, allowing much greater ability to investigate the interaction of multiple comorbidities as well as lingering reports of symptoms following discharge from active military service.
In these authors’ experience, veterans with ADHD benefit substantially from structured treatment interventions that are focused on developing compensatory skills for their problems with attention and impulsivity. Individuals with ADHD typically have a greater need for assistance with planning and organizing, making decisions, problem solving, and regulating their attention and affect. Individuals with ADHD may benefit from treatment strategies focused on ADHD behaviors in conjunction with traditional treatment strategies frequently used in the PC. These strategies include increased case management, medication trials, education regarding ADHD, vocational assistance, and consideration of both the school and work accommodations.
Studies have shown that treatments with stimulants improve functioning and reduce depression and substance use.21 In this study, < 5% of individuals with ADHD were taking stimulants at the time they were initially assessed in the PC, whereas the majority were taking stimulants after being referred for ADHD evaluation. Thus, identification of veterans with ADHD has clinical relevance in understanding the specific needs that guide development of individualized treatment plans to promote successful community reintegration.
Limitations
One limitation of the study is the lack of available medical records of historical ADHD diagnoses prior to military service. Also, although DSM-IV criteria for ADHD were operational in the psychodiagnostic clinics for these subjects, because the polytrauma study team did not conduct the evaluations in this sample, uniform diagnostic standards may not have been consistently applied when establishing the ADHD diagnosis. There was a 93% agreement between the 2 methods of diagnosis (ie, report of developmental diagnosis or positive adult evaluation), suggesting that diagnostic precision for ADHD in this study was reasonably accurate.
Another significant limitation of this study, apart from establishing medical and psychiatric status at the time of the initial referral to the PC, is the omission of functional outcome assessments regarding success of polytrauma treatment initiatives or ultimate community reintegration of successful psychosocial participation or academic and vocational achievements. Future longitudinal outcome studies are needed to determine whether ADHD has a significant impact on clinical outcomes. Of interest, pain was an overwhelmingly common factor (> 90%) for the military population studied at this site. Some degree of disturbance in attentional capacities is common in patients with chronic pain, which may aggravate ADHD symptoms and vice versa. Further investigations are needed to determine the potential functional impact of pain, including use of pain and psychotropic medications, on ADHD symptoms and the combined effect of these symptoms on overall outcome from rehabilitation and reintegration efforts.
Although these findings suggest that polytrauma veterans with ADHD do not have more psychiatric or physical comorbidities than do veterans without ADHD, it is premature to conclude that community reintegration can be optimally managed in the same way for both groups. Community reintegration of individuals with ADHD will likely be challenging, as these individuals often have struggled with functioning in their communities prior to their military service.
Studies of adult ADHD in the U.S. and in other countries have found that it is often associated with substantial impairment in managing the demands of functioning as an adult in society.4 Although some theorists have speculated that symptoms of ADHD may have been evolutionarily adaptive to survival in select environments (eg, predatory hunting environments), there is no clear evidence to support such adaptive benefits of the symptom in modern combat environments.23,24 Symptoms of ADHD are typically maladaptive to soldiers transitioning to civilian lives.
Conclusions
This investigation described the demographic and clinical characteristics of OEF/OIF/OND veterans referred for evaluation of TBI to the CJZVAMC PC during 5 years of operation from 2008 through 2012. The aim was to increase provider awareness of possible important variables that may influence recovery and community reintegration. This study may help to form the foundation for future lines of research into variables such as ADHD that may influence outcomes of rehabilitation and reintegration interventions.
To better understand the treatment needs of young veterans returning home from the wars in Iraq and Afghanistan, this study sought to identify the prevalence rate of ADHD, a condition known to complicate community adjustment. In this study, there was a 10.6% prevalence of ADHD among the 690 OEF/OIF/OND combat veterans seen over the 5-year period in the CJZVAMC PC, which is substantially higher than prevalence estimates in the U.S. general population but similar to estimates in previous military samples.
Compared with veterans who did not have ADHD, veterans with ADHD were younger, less well educated, and reported more problems with attention and concentration but did not have a greater incidence of military TBI or mental health comorbidities. The high prevalence of ADHD in this group argues for greater awareness of this clinical variable and development of intervention programs tailored to the specific skill deficiencies found in the condition, which can be included as part of the comprehensive treatment interventions.
Veterans with ADHD treated in the PC seem to benefit from structured treatment plans and education to promote self-awareness and veteran-centered self-management for effective symptom reduction and coping strategies. Development of effective integrated treatment options with a focus on educational and vocational resources and assistance could facilitate successful community reintegration. Future studies are needed to further assess outcomes of community reintegration, including academic and occupational outcomes, in this population.
Author disclosures
The authors report no actual or potential conflicts of interest with regard to this article.
Disclaimer
The opinions expressed herein are those of the authors and do not necessarily reflect those of Federal Practitioner, Frontline Medical Communications Inc., the U.S. Government, or any of its agencies. This article may discuss unlabeled or investigational use of certain drugs. Please review complete prescribing information for specific drugs or drug combinations—including indications, contraindications, warnings, and adverse effects—before administering pharmacologic therapy to patients.
1. Hoge CW, McGurk D, Thomas JL, Cox AL, Engel CC, Castro CA. Mild traumatic brain injury in U.S. soldiers returning from Iraq. N Engl J Med. 2008;358(5):453-463.
2. Screening and Evaluation of Possible Traumatic Brain Injury in Operation Enduring Freedom (OEF) and Operation Iraqi Freedom (OIF) Veterans. Washington, DC: Dept of Veterans Affairs; 2010. VHA Directive 2010-012.
3. Polytrauma System of Care. Washington, DC: Dept of Veterans Affairs; 2013. VHA Handbook 1172.01.
4. Kessler RC, Adler L, Barkley R, et al. The prevalence and correlates of adult ADHD in the United States: Results from the National Comorbidity Survey Replication. Am J Psychiatry. 2006;163(4):716-723.
5. Simon V, Czobor P, Bálint S, Mészáros A, Bitter I. Prevalence and correlates of adult attention-deficit hyperactivity disorder: Meta-analysis. Br J Psychiatry. 2009;194(3):204-211.
6. Fayyad J, De Graaf R, Kessler R, et al. Cross-national prevalence and correlates of adult attention-deficit hyperactivity disorder. Br J Psychiatry. 2007;190(5):402-409.
7. Krauss MR, Russell RK, Powers TE, Li Y. Accession standards for attention-deficit/hyperactivity disorder: A survival analysis of military recruits, 1995-2000. Mil Med. 2006;171(2):99-102.
8. Vanderploeg RD, Belanger HG, Horner RD, et al. Health outcomes associated with military deployment: Mild traumatic brain injury, blast, trauma, and combat associations in the Florida National Guard. Arch Phys Med Rehabil. 2012;93(11):1887-1895.
9. Theeler BJ, Flynn FG, Erickson JC. Headaches after concussion in US soldiers returning from Iraq or Afghanistan. Headache. 2010;50(8):1262-1272.
10. Sayer NA, Chiros CE, Sigford B, et al. Characteristics and rehabilitation outcomes among patients with blast and other injuries sustained during the Global War on Terror. Arch Phys Med Rehabil. 2008;89(1):163-170.
11. Sayer NA, Rettmann NA, Carlson KF, et al. Veterans with history of mild traumatic brain injury and posttraumatic stress disorder: Challenges from provider perspective. J Rehabil Res Dev. 2009;46(6):703-716.
12. Nampiaparampil DE. Prevalence of chronic pain after traumatic brain injury: A systematic review. JAMA. 2008;300(6):711-719.
13. Halbauer JD, Ashford JW, Zeitzer JM, Adamson MM, Lew HL, Yesavage JA. Neuropsychiatric diagnosis and management of chronic sequelae of war-related mild to moderate traumatic brain injury. J Rehabil Res Dev. 2009;46(6):757-796.
14. Romesser J, Shen S, Reblin M, et al. A preliminary study of the effect of a diagnosis of concussion on PTSD symptoms and other psychiatric variables at the time of treatment seeking among veterans. Mil Med. 2011;176(3):246-252.
15. Cicerone KD, Kalmar K. Persistent postconcussion syndrome: The structure of subjective complaints after mild traumatic brain injury. J Head Trauma Rehabil. 1995;10(3):1-17.
16. Weathers FW, Huska JA, Keane TM. PCL-C for DSM-IV. Boston, MA: National Center for PTSD–Behavioral Science Division; 1991.
17. American Psychiatric Association. Diagnostic and Statistical Manual of Mental Disorders, Text Revision (DSM-IV-TR). 4th ed. Washington, DC: American Psychiatric Association; 2000.
18. Hanson JA, Haub MD, Walker JJ, Johnston DT, Goff BS, Dretsch MN. Attention deficit hyperactivity disorder subtypes and their relation to cognitive functioning, mood states, and combat stress symptomatology in deploying U.S. soldiers. Mil Med. 2012;177(6):655-662.
19. Visser SN, Danielson ML, Bitsko RH, et al. Trends in the parent-report of health care provider-diagnosed and medicated attention-deficit/hyperactivity disorder: United States, 2003-2011. J Am Acad Child Adolesc Psychiatry. 2014;53(1):34-46.e2.
20. American Psychiatric Association. Diagnostic and Statistical Manual of Mental Disorders (DSM-5). 5th ed. Washington, DC: American Psychiatric Association; 2013.
21. Barkley, RA, Murphy KR, Fischer M. ADHD in Adults: What the Science Says. New York, NY: Guilford Press; 2008.
22. Barkley RA, Cox D. A review of driving risks and impairments associated with attention-deficit/hyperactivity disorder and the effects of stimulant medication on driving performance. J Safety Res. 2007;38(1):113-128.
23. Shelley-Tremblay JF, Rosén LA. Attention deficit hyperactivity disorder: An evolutionary perspective. J Genet Psychol. 1996;157(4):443-453.
24. Jensen PS, Mrazek D, Knapp PK, et al. Evolution and revolution in child psychiatry: ADHD as a disorder of adaptation. J Am Acad Child Adolesc Psychiatry. 1997;36(12):1672-1679.
Risk Factors for Postoperative Complications in Trigger Finger Release
Stenosing tenosynovitis, or trigger finger, is a pathology commonly referred to the plastic and hand surgery service of the North Florida/South Georgia Veterans Health System (NFSGVHS). Patients usually present to their primary care provider with symptoms of the finger being temporarily locked or stuck in the flexed position. This can be a painful problem due to the size mismatch between the flexor tendon and the pulley under which it glides.
Patients are typically referred to surgery after failing ≥ 1 attempt at nonoperative management. The surgery is relatively quick and straightforward; however, postoperative complications can lead to an unexpected costly and lengthy recovery. The objective of this study was to identify potential risk factors that can predispose patients to postoperative complications so that those risk factors may be better anticipated and modified, if possible.
Methods
A retrospective chart review of trigger finger release surgery was performed on-site at the Malcom Randall VAMC in Gainesville, Florida, from January 2005 to December 2010 to identify risk factors associated with postoperative complications. The study was approved by both the NFSGVHS Internal Review Board and the University of Florida Institutional Review Board. Patients who underwent surgery exclusively for ≥ 1 trigger fingers by the plastic surgery service were included in the study.
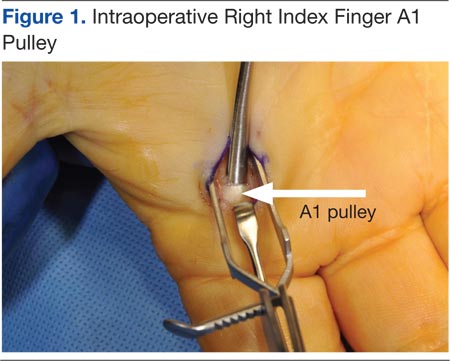
The surgery involves making an incision over the affected A1 pulley in the hand (Figure 1) and sharply releasing it (Figure 2) under direct vision. Potential risk factors for postoperative complications were recorded. These risk factors included smoking status, diabetic status, type of incision, and number of digits released during the surgical procedure.
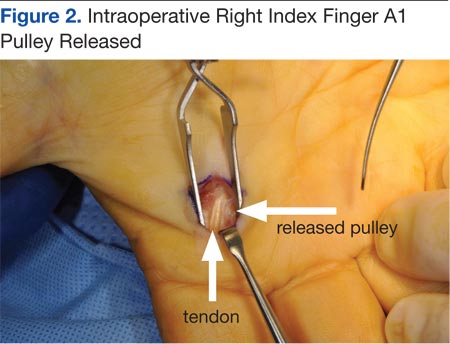
Results
Ninety-eight digits (on 81 hands) were identified as meeting inclusion criteria. Surgeries were performed using a longitudinal (43), transverse (48), oblique (5), or Brunner (2) incision. There were 10 complications: cellulitis (3), pyogenic flexor tenosynovitis (3), scar adhesion (1), delayed healing (2), and incomplete release (1). The overall complication rate was 10.2%. The authors compared risk factors with complications, using the chi square test and a determining of P < .05.
Related: Making the Case for Minimally Invasive Surgery
There was no link found between overall postoperative complications and diabetic status, incision type, or smoking status. There was a statistically significant link between diabetic patients and the incidence of postoperative infection (P = .002) and between 2 digits operated on during the same surgery and postoperative infection (P = .027)
Discussion
The routine practice of the NFSGVHS hand clinic is to offer a steroid injection as the initial treatment for trigger finger. Health care providers (HCPs) allow no more than 3 injections to the same digit to avoid the rare but potentially serious complication of a tendon rupture.1 Due to the large NFSGVHS catchment area, wait time for elective trigger finger surgery is several months. This 3-injection plan has been well received by patients and referring providers due to these wait times. However, a recent article by Kerrigan and Stanwix concluded that the most cost-efficient treatment strategy is 2 steroid injections before surgery.2
More often than not, trigger finger release is a short, outpatient surgery with a quick recovery. To minimize the risk of stiffness and scar adhesions, the NFSGVHS practice is to refer all postoperative hand cases for ≥ 1 hand therapy appointment on the same day as their first postoperative visit.
Cost Estimates
When complications occur, they can be costly to patients due to both time spent away from home and work and additional expenses. When the current procedural terminology (CPT) codes are run through the VistA integrated billing system, based on the VHA Chief Business Office Reasonable Charges, a complication can more than double the charges associated with A1 pulley surgery.
A flexor sheath incision and drainage (I+D) (CPT 26020) charges $8,935.35 (facility charge, $6,911.95 plus professional fee, $2,023.40), compared with open trigger finger release (CPT 26055) at $8,365.66 (facility charge, $6,911.95 plus professional fee, $1,453.71). According to a conversation with the finance service officer at NFSGVHS (2/11/2014), the anesthesia bill ($490.56/15 min), anticipated level 3 emergency department visits (facility charge, $889.22 plus professional fee $493.40), and inpatient stays (daily floor bed $786.19) can make an infectious complication costly.
Trigger finger can also be released percutaneously. This is a reasonable option that avoids the operating room, but NFSGVHS surgeons prefer the open surgery due to concerns for tendon and nerve injury that can result from a blind sweep of the needle.3,4
Related: Prevention of Venous Thromboembolism After Total Joint Replacement
Existing studies found complications for trigger finger release ranging from 1% to 31%.5,6 Wound complications and joint stiffness are known complications.5-7 In this study, 60% of the complications were infections, and 80% of the complications were wound complications. Six of 8 patients with wound-healing complications received perioperative antibiotics. Three patients returned to the operating room for an I+D of the flexor sheath. The results showed a statistically significant link between > 1 digit treated at the same surgery and postoperative complications (P = .027). A PubMed search revealed no existing hand literature with this association.
Risk Factors
Diabetes, tobacco use, type of incision, and number of digits treated were assessed as risk factors for complications after trigger finger surgery. Nicotine is widely accepted as increasing the risk for wound complications.8 Almost 20% of the U.S. population smokes, compared with 22% of the VA population and 32% of active-duty military personnel.9 One in 4 veterans has been diagnosed with diabetes, a well-known predisposing factor in delayed wound healing and infection.10,11 No prior studies were found comparing type of incision or multiple digits treated as complications risk factors.
There is also a well-known association between trigger finger and diabetes. Chronic hyperglycemia results in the accumulation of collagen within tendon sheaths due to impairment of collagen breakdown. Patients with diabetes tend to present with multiple digit involvement and respond less favorably to steroid injections compared with patients without diabetes.12 Wound healing is also impaired in patients with diabetes. All 6 wound infections in this study were in patients with diabetes. Proposed etiologies for wound-healing complications include pathologic angiogenesis, impaired fibroblast proliferation and migration, impaired circulation, decreased oxygenation, and a defective immune response to the injured site.13
Trigger finger may develop in multiple digits. Once surgery has been planned for 1 digit, patients may request surgery on another digit on the same hand that has not had an attempt at nonoperative intervention. The NFSGVHS plastic surgeons have raised the threshold to offer multiple surgical procedures on the same hand at the same operative visit to minimize recovery time and number of visits, particularly when patients are travelling long distances. This may be less convenient; however, the overall cost to the patient and the health care system in the event of a complication is significant. Plastic surgery providers also run an alcohol prep pad over the incision site to prevent inoculation of the flexor sheath during suture removal.
Current recommendations to ameliorate the postoperative risks to the patient and costs to the system include endorsing a more conservative approach to treating trigger finger than was previously practiced at NFSGVHS. The known, less favorable response of patients with diabetes to steroid injections plus their elevated risk of postoperative infection create a catch-22 for the treatment plan. Given the low risk of a single steroid injection to the flexor sheath, this procedure is still recommended as a first-line treatment.
Related: Experience Tells in Hip Arthroplasty
During the 5-year study there was a lower threshold for surgical management and for treatment of multiple digits during the same surgery than the one currently practiced, with an overall consensus of the hospital’s HCPs. The authors recommend that all patients start with a steroid injection before committing to surgery. Patients with diabetes are informed that the injection will cause a temporary rise in their blood glucose.14 If they are resistant to the injection, high-dose oral nonsteroidal anti-inflammatory drugs and/or proximal interphalangeal joint splinting is ordered.
Verification of A1C values showing better chronic management of blood sugar is a procedure HCPs from the NFSGVHS will begin to follow. Preoperative A1C values between 6.5% and 8% in patients known to have diabetes has been recommended.15 A1C values > 7% have been found to be an independent risk factor for stenosing tenosynovitis.16 The total number of trigger finger surgeries may drop with the benefit of improved utilization of resources.
Conclusion
The authors found a statistically significant association between postoperative infection and 2 patient populations: patients with diabetes (P = .002) and patients having > 1 digit released during the same surgery (P = .027). This outcome suggests using caution when offering A1 pulley release in select patient populations.
Acknowledgement
Justine Pierson, BS, research coordinator at University of Florida, for statistical analysis. Funding is through salary.
Author disclosures
The authors report no actual or potential conflicts of interest with regard to this article.
Disclaimer
The opinions expressed herein are those of the authors and do not necessarily reflect those of Federal Practitioner, Frontline Medical Communications Inc., the U.S. Government, or any of its agencies. This article may discuss unlabeled or investigational use of certain drugs. Please review complete prescribing information for specific drugs or drug combinations—including indications, contraindications, warnings, and adverse effects—before administering pharmacologic therapy to patients.
1. Yamada K, Masuko, T, Iwasaki N. Rupture of the flexor digitorum profundus tendon after injections of insoluble steroid for a trigger finger. J Hand Surg Eur. 2011;36(1):77-78.
2. Kerrigan CL, Stanwix MG. Using evidence to minimize the cost of trigger finger care. J Hand Surg Am. 2009;34(6):997-1005.
3. Habbu R, Putnam MD, Adams JE. Percutaneous Release of the A1 pulley: a cadaver study. J Hand Surg Am. 2012;37(11):2273-2277.
4. Guler F, Kose O, Ercan EC, Turan A, Canbora K. Open vs percutaneous release for the treatment of trigger thumb. Orthopedics. 2013;36(10):e1290-e1294.
5. Lim M-H, Lim K-K, Rasheed MZ, Narayana S, Tan B-H. Outcome of open trigger digit release. J Hand Surg Eur. 2007;32(4):457-479.
6. Will R, Lubahn J. Complications of open trigger finger release. J Hand Surg Am. 2010;35(4):594-596.
7. Lee WT, Chong AK. Outcome study of open trigger digit release. J Hand Surg Eur. 2011;36(4):339.
8. Rinker B. The evils of nicotine: An evidence-based guide to smoking and plastic surgery. Ann Plast Surg. 2013;70(5):599-605.
9. Bondurant S, Wedge R, eds. Combating Tobacco Use in Military and Veteran Populations. Washington, DC: The National Academies; 2009.
10. Shilling AM, Raphael J. Diabetes, hyperglycemia, and infections. Best Pract Res Clin Anaesthesiol. 2008;22(3):519-535.
11. Kuppersmith J, Francis J, Kerr E, et al. Advancing evidence-based care for diabetes: Lessons from the Veterans Health Administration. Health Aff. 2007;26(2):156-158.
12. Brown E, Genoway KA. Impact of diabetes on outcomes in hand surgery. J Hand Surg Am. 2011;36(12):2067-2072.
13. Francis-Goforth KN, Harken AH, Saba JD. Normalization of diabetic wound healing. Surgery. 2010;147(3):446-449.
14. Wang AA, Hutchinson DT. The effect of corticosteroid injection for trigger finger on blood glucose level in diabetic patients. J Hand Surg Am. 2006;31(6):979-981.
15. Underwood P, Askari R, Hurwitz S, Chamarthi B, Garg R. Preoperative A1C and Clinical Outcomes in patients with diabetes undergoing major noncardiac surgical procedures. Diabetes Care. 2014; 37(3): 611-616.
16. Vance MC, Tucker JJ, Harness NG. The association of hemoglobin A1c with the prevalence of stenosing tenosynovitis. J Hand Surg Am. 2012;37(9):1765-1769.
Stenosing tenosynovitis, or trigger finger, is a pathology commonly referred to the plastic and hand surgery service of the North Florida/South Georgia Veterans Health System (NFSGVHS). Patients usually present to their primary care provider with symptoms of the finger being temporarily locked or stuck in the flexed position. This can be a painful problem due to the size mismatch between the flexor tendon and the pulley under which it glides.
Patients are typically referred to surgery after failing ≥ 1 attempt at nonoperative management. The surgery is relatively quick and straightforward; however, postoperative complications can lead to an unexpected costly and lengthy recovery. The objective of this study was to identify potential risk factors that can predispose patients to postoperative complications so that those risk factors may be better anticipated and modified, if possible.
Methods
A retrospective chart review of trigger finger release surgery was performed on-site at the Malcom Randall VAMC in Gainesville, Florida, from January 2005 to December 2010 to identify risk factors associated with postoperative complications. The study was approved by both the NFSGVHS Internal Review Board and the University of Florida Institutional Review Board. Patients who underwent surgery exclusively for ≥ 1 trigger fingers by the plastic surgery service were included in the study.
The surgery involves making an incision over the affected A1 pulley in the hand (Figure 1) and sharply releasing it (Figure 2) under direct vision. Potential risk factors for postoperative complications were recorded. These risk factors included smoking status, diabetic status, type of incision, and number of digits released during the surgical procedure.
Results
Ninety-eight digits (on 81 hands) were identified as meeting inclusion criteria. Surgeries were performed using a longitudinal (43), transverse (48), oblique (5), or Brunner (2) incision. There were 10 complications: cellulitis (3), pyogenic flexor tenosynovitis (3), scar adhesion (1), delayed healing (2), and incomplete release (1). The overall complication rate was 10.2%. The authors compared risk factors with complications, using the chi square test and a determining of P < .05.
Related: Making the Case for Minimally Invasive Surgery
There was no link found between overall postoperative complications and diabetic status, incision type, or smoking status. There was a statistically significant link between diabetic patients and the incidence of postoperative infection (P = .002) and between 2 digits operated on during the same surgery and postoperative infection (P = .027)
Discussion
The routine practice of the NFSGVHS hand clinic is to offer a steroid injection as the initial treatment for trigger finger. Health care providers (HCPs) allow no more than 3 injections to the same digit to avoid the rare but potentially serious complication of a tendon rupture.1 Due to the large NFSGVHS catchment area, wait time for elective trigger finger surgery is several months. This 3-injection plan has been well received by patients and referring providers due to these wait times. However, a recent article by Kerrigan and Stanwix concluded that the most cost-efficient treatment strategy is 2 steroid injections before surgery.2
More often than not, trigger finger release is a short, outpatient surgery with a quick recovery. To minimize the risk of stiffness and scar adhesions, the NFSGVHS practice is to refer all postoperative hand cases for ≥ 1 hand therapy appointment on the same day as their first postoperative visit.
Cost Estimates
When complications occur, they can be costly to patients due to both time spent away from home and work and additional expenses. When the current procedural terminology (CPT) codes are run through the VistA integrated billing system, based on the VHA Chief Business Office Reasonable Charges, a complication can more than double the charges associated with A1 pulley surgery.
A flexor sheath incision and drainage (I+D) (CPT 26020) charges $8,935.35 (facility charge, $6,911.95 plus professional fee, $2,023.40), compared with open trigger finger release (CPT 26055) at $8,365.66 (facility charge, $6,911.95 plus professional fee, $1,453.71). According to a conversation with the finance service officer at NFSGVHS (2/11/2014), the anesthesia bill ($490.56/15 min), anticipated level 3 emergency department visits (facility charge, $889.22 plus professional fee $493.40), and inpatient stays (daily floor bed $786.19) can make an infectious complication costly.
Trigger finger can also be released percutaneously. This is a reasonable option that avoids the operating room, but NFSGVHS surgeons prefer the open surgery due to concerns for tendon and nerve injury that can result from a blind sweep of the needle.3,4
Related: Prevention of Venous Thromboembolism After Total Joint Replacement
Existing studies found complications for trigger finger release ranging from 1% to 31%.5,6 Wound complications and joint stiffness are known complications.5-7 In this study, 60% of the complications were infections, and 80% of the complications were wound complications. Six of 8 patients with wound-healing complications received perioperative antibiotics. Three patients returned to the operating room for an I+D of the flexor sheath. The results showed a statistically significant link between > 1 digit treated at the same surgery and postoperative complications (P = .027). A PubMed search revealed no existing hand literature with this association.
Risk Factors
Diabetes, tobacco use, type of incision, and number of digits treated were assessed as risk factors for complications after trigger finger surgery. Nicotine is widely accepted as increasing the risk for wound complications.8 Almost 20% of the U.S. population smokes, compared with 22% of the VA population and 32% of active-duty military personnel.9 One in 4 veterans has been diagnosed with diabetes, a well-known predisposing factor in delayed wound healing and infection.10,11 No prior studies were found comparing type of incision or multiple digits treated as complications risk factors.
There is also a well-known association between trigger finger and diabetes. Chronic hyperglycemia results in the accumulation of collagen within tendon sheaths due to impairment of collagen breakdown. Patients with diabetes tend to present with multiple digit involvement and respond less favorably to steroid injections compared with patients without diabetes.12 Wound healing is also impaired in patients with diabetes. All 6 wound infections in this study were in patients with diabetes. Proposed etiologies for wound-healing complications include pathologic angiogenesis, impaired fibroblast proliferation and migration, impaired circulation, decreased oxygenation, and a defective immune response to the injured site.13
Trigger finger may develop in multiple digits. Once surgery has been planned for 1 digit, patients may request surgery on another digit on the same hand that has not had an attempt at nonoperative intervention. The NFSGVHS plastic surgeons have raised the threshold to offer multiple surgical procedures on the same hand at the same operative visit to minimize recovery time and number of visits, particularly when patients are travelling long distances. This may be less convenient; however, the overall cost to the patient and the health care system in the event of a complication is significant. Plastic surgery providers also run an alcohol prep pad over the incision site to prevent inoculation of the flexor sheath during suture removal.
Current recommendations to ameliorate the postoperative risks to the patient and costs to the system include endorsing a more conservative approach to treating trigger finger than was previously practiced at NFSGVHS. The known, less favorable response of patients with diabetes to steroid injections plus their elevated risk of postoperative infection create a catch-22 for the treatment plan. Given the low risk of a single steroid injection to the flexor sheath, this procedure is still recommended as a first-line treatment.
Related: Experience Tells in Hip Arthroplasty
During the 5-year study there was a lower threshold for surgical management and for treatment of multiple digits during the same surgery than the one currently practiced, with an overall consensus of the hospital’s HCPs. The authors recommend that all patients start with a steroid injection before committing to surgery. Patients with diabetes are informed that the injection will cause a temporary rise in their blood glucose.14 If they are resistant to the injection, high-dose oral nonsteroidal anti-inflammatory drugs and/or proximal interphalangeal joint splinting is ordered.
Verification of A1C values showing better chronic management of blood sugar is a procedure HCPs from the NFSGVHS will begin to follow. Preoperative A1C values between 6.5% and 8% in patients known to have diabetes has been recommended.15 A1C values > 7% have been found to be an independent risk factor for stenosing tenosynovitis.16 The total number of trigger finger surgeries may drop with the benefit of improved utilization of resources.
Conclusion
The authors found a statistically significant association between postoperative infection and 2 patient populations: patients with diabetes (P = .002) and patients having > 1 digit released during the same surgery (P = .027). This outcome suggests using caution when offering A1 pulley release in select patient populations.
Acknowledgement
Justine Pierson, BS, research coordinator at University of Florida, for statistical analysis. Funding is through salary.
Author disclosures
The authors report no actual or potential conflicts of interest with regard to this article.
Disclaimer
The opinions expressed herein are those of the authors and do not necessarily reflect those of Federal Practitioner, Frontline Medical Communications Inc., the U.S. Government, or any of its agencies. This article may discuss unlabeled or investigational use of certain drugs. Please review complete prescribing information for specific drugs or drug combinations—including indications, contraindications, warnings, and adverse effects—before administering pharmacologic therapy to patients.
1. Yamada K, Masuko, T, Iwasaki N. Rupture of the flexor digitorum profundus tendon after injections of insoluble steroid for a trigger finger. J Hand Surg Eur. 2011;36(1):77-78.
2. Kerrigan CL, Stanwix MG. Using evidence to minimize the cost of trigger finger care. J Hand Surg Am. 2009;34(6):997-1005.
3. Habbu R, Putnam MD, Adams JE. Percutaneous Release of the A1 pulley: a cadaver study. J Hand Surg Am. 2012;37(11):2273-2277.
4. Guler F, Kose O, Ercan EC, Turan A, Canbora K. Open vs percutaneous release for the treatment of trigger thumb. Orthopedics. 2013;36(10):e1290-e1294.
5. Lim M-H, Lim K-K, Rasheed MZ, Narayana S, Tan B-H. Outcome of open trigger digit release. J Hand Surg Eur. 2007;32(4):457-479.
6. Will R, Lubahn J. Complications of open trigger finger release. J Hand Surg Am. 2010;35(4):594-596.
7. Lee WT, Chong AK. Outcome study of open trigger digit release. J Hand Surg Eur. 2011;36(4):339.
8. Rinker B. The evils of nicotine: An evidence-based guide to smoking and plastic surgery. Ann Plast Surg. 2013;70(5):599-605.
9. Bondurant S, Wedge R, eds. Combating Tobacco Use in Military and Veteran Populations. Washington, DC: The National Academies; 2009.
10. Shilling AM, Raphael J. Diabetes, hyperglycemia, and infections. Best Pract Res Clin Anaesthesiol. 2008;22(3):519-535.
11. Kuppersmith J, Francis J, Kerr E, et al. Advancing evidence-based care for diabetes: Lessons from the Veterans Health Administration. Health Aff. 2007;26(2):156-158.
12. Brown E, Genoway KA. Impact of diabetes on outcomes in hand surgery. J Hand Surg Am. 2011;36(12):2067-2072.
13. Francis-Goforth KN, Harken AH, Saba JD. Normalization of diabetic wound healing. Surgery. 2010;147(3):446-449.
14. Wang AA, Hutchinson DT. The effect of corticosteroid injection for trigger finger on blood glucose level in diabetic patients. J Hand Surg Am. 2006;31(6):979-981.
15. Underwood P, Askari R, Hurwitz S, Chamarthi B, Garg R. Preoperative A1C and Clinical Outcomes in patients with diabetes undergoing major noncardiac surgical procedures. Diabetes Care. 2014; 37(3): 611-616.
16. Vance MC, Tucker JJ, Harness NG. The association of hemoglobin A1c with the prevalence of stenosing tenosynovitis. J Hand Surg Am. 2012;37(9):1765-1769.
Arthritis, Infectious Tenosynovitis, and Tendon Rupture in a Patient With Rheumatoid Arthritis and Psoriasis
Compared with monoarticular arthritis, polyarticular arthritis may yield an initially narrower differential diagnosis that focuses on systemic inflammatory conditions, such as rheumatoid arthritis (RA). Approximately 15% to 30% of septic arthritis is polyarticular, of which about 45% is associated with underlying RA.1,2 Regardless of the number of joints involved, septic (infectious) arthritis is a valid consideration given the morbidity and mortality.
In a retrospective study in the United Kingdom (UK) between 1982 and 1991, the morbidity and mortality of septic arthritis was 31.6% and 11.5%, respectively, and 16% of the study population had RA.3 A review of the literature by Dubost and colleagues found that polyarticular septic arthritis (PASA) has a mortality of 31% to 42% compared with 4% to 8% for monoarticular septic arthritis, and RA was present in 67% of the PASA fatalities.1
Related: The Golden Era of Treatment in Rheumatology
Rheumatoid arthritis and its treatment predispose patients to septic arthritis. Septic arthritis in the UK general population is 0.42 per 100 patient-years for patients with RA on antitumor necrosis factor therapy.3,4 In a retrospective study in the U.S., the incidence of septic arthritis was 0.40 per 100 patient-years for patients with RA compared with 0.02 per 100 patient-years for patients without RA.5
Other complications of RA include infectious tenosynovitis and tendon rupture. The incidence and prevalence of infectious tenosynovitis and tendon rupture in RA are not firmly established in the literature.
We present a patient with RA and psoriasis who responded initially to acute management for RA but subsequently was diagnosed with culture-negative polyarticular arthritis and infectious tenosynovitis associated with beta hemolytic group G Streptococcus (GGS), a part of Streptococcus milleri (S. milleri). During surgery, he was also found to have bilateral extensor pollicus longus (EPL) tendon rupture. Given the possible morbidity, the authors believe this patient may be of interest to the medical community.
Case Presentation
A 69-year-old African American male presented with 3 to 4 days of swelling and pain of bilateral wrists, bilateral hands, and the left ankle with subjective, but resolved, fevers and chills. His medical history was significant for seropositive erosive RA, psoriasis, hypertension, hyperlipidemia, alcohol abuse, chronic tobacco use, osteoporosis, and glaucoma. He did not have diabetes, reported no IV drug abuse, and except for the immunosuppressive effects of his medications, was not otherwise immunocompromised.
For 2 years in the outpatient setting, the rheumatology clinic had been managing the patient’s rheumatoid factor (RF) positive and anti-cyclic citrullinated peptide (CCP) antibody positive erosive RA with etanercept 25 mg subcutaneously twice a week. The RA affected his hands, wrists, shoulders, and ankles bilaterally but was successfully controlled. The dermatology clinic was managing the patient’s psoriasis with calcipotriene cream 0.005% twice a week and clobetasol ointment 0.05% twice a week. Psoriatic plaques were noted on bilateral elbows, bilateral dorsal hands, and bilateral dorsal feet.
Initial Evaluation
At evaluation, the patient’s vital signs revealed a temperature of 36.3°C (97.3°F), pulse of 102 beats per minute, respiratory rate of 16 breaths per minute, oxygen saturation of 99% on room air, and blood pressure of 102/70 mm Hg. He was found to have edema, tenderness, and erythema of the wrists bilaterally and left metacarpophalangeal joints (MCPs) and edematous right MCPs and left medial ankle.
The patient had been nonadherent with etanercept for 5 monthsand restarted taking the medication only 2 weeks before presentation. He had noticed worsening arthritis for at least 1 month. His last RA flare was approximately 1 year before presentation. Additional symptoms included 4 days of nausea, nonbloody and nonbilious emesis, left lower quadrant pain, and diarrhea without melena or hematochezia.
Initial laboratory studies found 3.2 k/μL white blood cells (WBCs) with a differential of 11.9% lymphocytes, 4.2% monocytes, 83.3% neutrophils, 0.5% eosinophils, and 0.1% basophils; 165 k/μL platelets; 96 mm/h erythrocyte sedimentation rate (ESR); and 45 mg/dL C-reactive protein. The patient was diagnosed with viral gastroenteritis and RA flare and was admitted for inpatient management secondary to limited ability to care for himself.
Related: Infliximab-Induced Complications
The patient was started on prednisone 40 mg orally once a day (for 5 days) for empiric treatment of an RA flare and continued on etanercept. The inpatient rheumatology service was consulted. Further evaluation later that day found involvement of the proximal interphalangeal joints and elbows and tenderness of the tendons of the dorsal hand bilaterally. Over the next 2 days, the patient remained afebrile and WBCs were within normal limits. Edema, erythema, and tenderness of the involved joints somewhat improved, but tenderness along the tendons of the dorsal hand worsened, which concerned the managing teams for infectious tenosynovitis.
By day 4, the patient was afebrile and had a leukocytosis of 12.9 k/μLwith neutrophils 86.7%, but improvement of erythema, pain, and range of motion of involved joints and no tenderness to palpation of tendons was noted. The inpatient orthopedic surgery service evaluated the patient and did not find sufficient evidence necessitating surgical intervention.
Worsening Condition
On day 6, arthrocentesis of the left wrist was performed secondary to worsening of erythema and edema. The patient experienced new edema of the left shoulder and leukocytosis continued to trend upward (15.7 k/μL on day 6). Purulent aspirate (1.5 mL) was obtained from the fluctuance and tenosynovium of the left wrist. Empiric vancomycin 1 g IV twice daily and ceftriaxone 2 g IV daily were started and continued for 3 days. By this point in his hospital course, the patient had received 1 dose of etanercept. Prednisone and etanercept were previously discontinued because of the discovered infection. Blood cultures were drawn and had no growth (Table). Gastroenterology studies were limited to stool cultures and did not include colonoscopy. Leukocytosis began trending down.
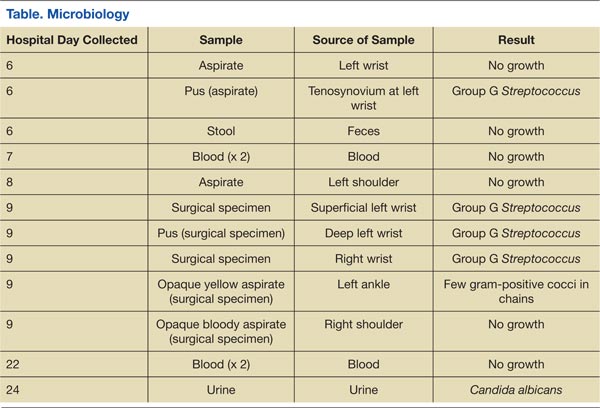
On day 8, antibiotics were tailored to penicillin G 4 million units IV every 4 hours following growth of GGS from the sample of the left wrist. Subsequently, synovial fluid (3 mL) from the left shoulder was obtained following initiation of antibiotic therapy and had no growth. Magnetic resonance imaging (MRI) found tenosynovitis of the left ankle and right wrist.
On day 9, transthoracic echocardiography was performed and found no evidence of infectious endocarditis. Later that night, the patient was taken to surgery for incision and drainage/debridement of bilateral wrists and left ankle, synovectomy of right wrist, and aspiration of right shoulder. Findings included abscess in the left wrist and inflammatory synovitis and bilateral EPL tendon rupture consistent with RA. Pus from the left ankle had few gram-positive cocci in chains with no growth, and the specimens from both wrists grew GGS. Aspirate from the left ankle was an opaque yellow fluid with 14,900/mm3 WBC, 30,000/mm3 red blood cells (RBC), 97% neutrophils, 1% macrophages, 2% lymphocytes, and 0% monocytes. Aspirate from the right shoulder was an opaque bloody fluid with 10,100/mm3 WBC, 40,000/mm3 RBC, 95% neutrophils, 2% macrophages, 1% lymphocytes, and 1% monocytes. On day 10, sulfasalazine 500 mg twice a day was initiated for RA.
Following surgery and continued antibiotics, the patient’s leukocytosis resolved, and improvement was seen in all joints with decreased edema, erythema, and pain and increased range of motion. Postoperative recovery was complicated by ileus, urinary retention, and fungal (Candida albicans) urinary tract infection, all of which resolved without significant complications. The inpatient rheumatology service restarted prednisone at a lower dose of 20 mg. The patient became afebrile and sufficiently stable for transfer to a lower level of care with continued physical therapy and IV antibiotics for another 3 weeks.
Discussion
The patient had 2 underlying systemic inflammatory conditions: RA and psoriasis. The underlying chronic arthritis was likely caused by RA, not psoriatic arthritis (PsA). The patient met the 2010 American College of Rheumatology criteria but failed to meet the classification criteria for PsA.6,7 However, the clinical features of RA and PsA overlap. Rheumatoid factor and CCP can be positive laboratory findings in both RA and PsA.8-14 Tenosynovitis is found in about half of RA patients and PsA patients (P > .05).15 In its evaluation of the patient, the inpatient rheumatology service suspected that the patient may have had RA with components of PsA.
Rheumatoid arthritis complicates the diagnosis of septic arthritis. In a study by Nolla and colleagues, a mean of 7.3 days (range 3 to 18 days) elapsed before a diagnosis of septic arthritis was made in 10 patients with RA on corticosteroids.2 Consideration of risk factors such as increasing age, male sex, tobacco use, extra-articular manifestations of RA, positive RF, rheumatoid nodules, poor functional capacity, high ESR, leukopenia, comorbidities (chronic lung disease, alcoholism, organic brain disease, and diabetes), and the use of corticosteroids may expedite the diagnosis of infections in patients with RA.16 In this case, the patient had some of these risk factors: age, male sex, alcoholism, chronic tobacco use, positive RF, high ESR, and leukopenia (at presentation).
Related: Trend Toward Concomitant Supplements and Medications
The history of medication nonadherence of etanercept with progressively worsening arthritis and early clinical improvement (reduction in erythema, edema, and pain and temporary loss of signs of tenosynovitis on examination) while on prednisone suggested that the patient had a RA flare. The prednisone likely alleviated the inflammatory process but created an immunosuppressed state that allowed GGS to invade and possibly disseminate. Alternately, the patient may have been infected before presentation. The lack of a definitive time line for his case prevented the authors from forming conclusions about a possible causal relationship between the infection and medications. The subjective fevers before admission were nonspecific and could have been caused by RA, presumed gastroenteritis, or other undiagnosed infectious processes. The observed leukocytosis may have been initially corticosteroid-induced.17
Septic Arthritis
The suspicion of septic arthritis and infectious tenosynovitis substantially increased on day 6 with worsening symptoms, involvement of additional joints, and spiking fevers. Group G Streptococcus was obtained from the aspirate of the left wrist and from the surgical specimens from the bilateral wrists. The clinical presentation, MRI imaging studies, and surgical and nonsurgical specimens supported a diagnosis of GGS tenosynovitis. However, there was no clear evidence (ie, positive culture with identified organism) of septic arthritis, likely secondary to early septic arthritis and initiation of antibiotics before joint aspirations. The aspirate from the left ankle was yellow and opaque, but the culture was negative.
The pathogenic organism in the patient was GGS. Group G Streptococcus is normal flora of the oral cavity, gastrointestinal (GI) tract, upper respiratory tract, genital tract, and skin, which were all possible sources of seeding.18 Streptococcal species account for about 20% of septic arthritis, and GGS arthritis accounts for 4% to 19% of streptococcal arthritis.19-22 From a review of the literature, 2 cases of GGS tenosynovitis have been published.23,24 However, in an ultrasound study and MRI study, 49% and 43%, respectively, of patients with RA had tenosynovitis of the tendons of the hands.15,25
GGS Demographics
About three-quarters (71%) of patients with GGS arthritis are male.19 The analysis of the literature by Bronze and colleagues found that chronic joint disease and alcoholism are present in 34% and 14% of patients with GGS arthritis, respectively. One-quarter (23% from Dubost and colleagues) to one-third (32% from Schattner and colleagues) of patients with GGS arthritis have RA.19,26
Fever is present in less than half (43%) of patients with GGS arthritis.19 Positive synovial fluid is expected in 90% of patients.19 Leukocytosis and elevated ESR need not be present.27,28 The arthritis is polyarticular in one-quarter of patients (24% from Bronze and colleagues and 26% from Dubost and colleagues).19,26
Positive blood cultures can be expected in one-fourth (26%) of patients with GGS arthritis.19 The patient’s blood cultures were negative. Blood cultures drawn before initiation of antibiotics yielded no growth, so if the spread was hematogenous, the bacteremia was transient or intermittent. Before and after initiation of antibiotics, specimens from the shoulders did not grow colonies, whereas specimens from the wrists did. If the shoulders were truly infected, these findings and the notably later involvement of the shoulders suggest that the shoulders may have been seeded later in the hospital course.
Trenkner and colleagues proposed that GI abnormalities provide a portal of entry for GGS, which is under the umbrella of S. milleri.29S. milleri is associated with abscess formation, usually of the GI tract.30-32 In the study patient, the possible gastroenteritis may have provided such a portal of entry and subsequent seeding to the joints, and an abscess was found in the left wrist.
Tendon Rupture
Additionally, bilateral EPL tendon rupture likely occurred as a consequence of the inflammatory process from RA and infectious tenosynovitis in the patient. According to Zheng and colleagues, tenosynovitis is an inflammatory process of the synovial tendon sheath that may result in degeneration and rupture of the tendons and may contribute to bone erosions, development of joint deformities, and loss of functional capacity.33 In a histologic study of a ruptured EPL tendon from a patient with RA, Harris observed a chronic inflammatory cellular reaction.34 Harris also described a male with RA with unconfirmed bilateral EPL rupture.34 Björkman and colleague identified previous injury, RA, and local or systemic steroids as important etiologic factors for EPL tendon rupture.35
As in the case of this patient, the utilization of both medical and surgical therapy is not uncommon for treating GGS infection. Antibiotic therapy typically consists of penicillin (74%).26 Surgical intervention is necessary in 16% to 37% of patients.19,26 This patient required both penicillin and incision and drainage/debridement before significant clinical improvement was noted. Prognosis of GGS arthritis is favorable with 5% mortality.26
Conclusion
Septic arthritis and infectious tenosynovitis are readily treatable with low mortality if promptly identified. Identification can be masked by other medical conditions, such as RA and psoriasis, and their associated immunosuppressive treatment. Bilateral EPL tendon rupture may be a complication of RA, particularly with an underlying septic arthritis and infectious tenosynovitis.
Author disclosures
The authors report no actual or potential conflicts of interest with regard to this article.
Disclaimer
The opinions expressed herein are those of the authors and do not necessarily reflect those of Federal Practitioner, Frontline Medical Communications Inc., the U.S. Government, or any of its agencies. This article may discuss unlabeled or investigational use of certain drugs. Please review the complete prescribing information for specific drugs or drug combinations—including indications, contraindications, warnings, and adverse effects—before administering pharmacologic therapy to patients.
1. Dubost JJ, Fis I, Denis P, et al. Polyarticular septic arthritis. Medicine (Baltimore). 1993;72(5):296-310.
2. Nolla JM, Gómez-Vaquero C, Fiter J, et al. Pyarthrosis in patients with rheumatoid arthritis: A detailed analysis of 10 cases and literature review. Semin Arthritis Rheum. 2000;30(2):121-126.
3.Weston VC, Jones AC, Bradbury N, Fawthrop F, Doherty M. Clinical features and outcome of septic arthritis in a single UK Health District 1982-1991. Ann Rheum Dis. 1999;58(4):214-219.
4. Galloway JB, Hyrich KL, Mercer LK, et al; BSR Biologics Register. Risk of septic arthritis in patients with rheumatoid arthritis and the effect of anti-TNF therapy: Results from the British Society for Rheumatology Biologics Register. Ann Rheum Dis. 2011;70(10):1810-1814.
5. Doran MF, Crowson CS, Pond GR, O’Fallon WM, Gabriel SE. Frequency of infection in patients with rheumatoid arthritis compared with controls: A population-based study. Arthritis Rheum. 2002;46(9):2287-2293.
6. Aletaha D, Neogi T, Silman AJ, et al. 2010 Rheumatoid arthritis classification criteria: An American College of Rheumatology/European League Against Rheumatism collaborative initiative. Arthritis Rheum. 2010;62(9):2569-2581.
7. Taylor W, Gladman D, Helliwell P, Marchesoni A, Mease P, Mielants H; CASPAR Study Group. Classification criteria for psoriatic arthritis: Development of new criteria from a large international study. Arthritis Rheum. 2006;54(8):2665-2673.
8. Gladman DD, Shuckett R, Russell ML, Thorne JC, Schachter RK. Psoriatic arthritis (PSA)—An analysis of 220 patients. Q J Med. 1987;62(238):127-141.
9. Bogliolo L, Alpini C, Caporali R, Scirè CA, Moratti R, Montecucco C. Antibodies to cyclic citrullinated peptides in psoriatic arthritis. J Rheumatol. 2005;32(3):511-515.
10. Vander Cruyssen B, Hoffman IE, Zmierczak H, et al. Anti-citrullinated peptide antibodies may occur in patients with psoriatic arthritis. Ann Rheum Dis. 2005;64(8):1145-1149.
11. Alenius GM, Berglin E, Rantapää Dahlgvist S. Antibodies against cyclic citrullinated peptide (CCP) in psoriatic patients with or without joint inflammation. Ann Rheum Dis. 2006;65(3):398-400.
12. Candia L, Marquez J, Gonzalez C, et al. Low frequency of anticyclic citrullinated peptide antibodies in psoriatic arthritis but not in cutaneous psoriasis. J Clin Rheumatol. 2006;12(5):226-229.
13. Inanc N, Dalkilic E, Kamali S, et al. Anti-CCP antibodies in rheumatoid arthritis and psoriatic arthritis. Clin Rheumatol. 2007;26(1):17-23.
14. Popescu C, Zofota S, Bojinca V, Ionescu R. Anti-cyclic citrullinated peptide antibodies in psoriatic arthritis—Cross-sectional study and literature review. J Med Life. 2013;6(4):376-382.
15. Schoellnast H, Deutschmann HA, Hermann J, et al. Psoriatic arthritis and rheumatoid arthritis: Findings in contrast-enhanced MRI. AJR Am J Roentgenol. 2006;187(2):351-357.
16. Doran MF, Crowson CS, Pond GR, O’Fallon WM, Gabriel SE. Predictors of infection in rheumatoid arthritis. Arthritis Rheum. 2002;46(9):2294-2300.
17. Shoenfeld Y, Gurewich Y, Gallant LA, Pinkhas J. Prednisone-induced leukocytosis. Influence of dosage, method and duration of administration on the degree of leukocytosis. Am J Med. 1981;71(5):773-778.
18. Gossling J. Occurrence and pathogenicity of the Streptococcus milleri group. Rev Infect Dis. 1988;10(2):257-285.
19. Dubost JJ, Soubrier M, De Champs C, Ristori JM, Sauvezie B. Streptococcal septic arthritis in adults. A study of 55 cases with a literature review. Joint Bone Spine. 2004;71(4):303-311.
20. Ryan MJ, Kavanagh R, Wall PG, Hazleman BL. Bacterial joint infections in England and Wales: Analysis of bacterial isolates over a four year period. Br J Rheumatol. 1997;36(3):370-373.
21. Morgan DS, Fisher D, Merianos A, Currie BJ. An 18 year clinical review of septic arthritis from tropical Australia. Epidemiol Infect. 1996;117(3):423-428.
22. Kaandorp CJ, Dinant HJ, van de Laar MA, Moens HJ, Prins AP, Dijkmans BA. Incidence and sources of native and prosthetic joint infection: A community based prospective survey. Ann Rheum Dis. 1997;56(8):470-475.
23. Bradlow A, Mitchell RG, Mowat AG. Group G streptococcal arthritis. Rheumatol Rehabil. 1982;21(4):206-210.
24. Meier JL, Gerster JC. Bursitis and tenosynovitis caused by group G streptococci. J Rheumatol. 1983;10(5):817-818.
25. Filippucci E, Gabba A, Di Geso L, Girolimetti R, Salaffi F, Grassi W. Hand tendon involvement in rheumatoid arthritis: An ultrasound study. Semin Arthritis Rheum. 2012;41(6):752-760.
26. Bronze MS, Whitby S, Schaberg DR. Group G streptococcal arthritis: Case report and review of the literature. Am J Med Sci. 1997;313(4):239-243.
27. Schattner A, Vosti KL. Bacterial arthritis due to beta-hemolytic streptococci of serogroups A, B, C, F, and G. Analysis of 23 cases and a review of the literature. Medicine (Baltimore). 1998;77(2):122-139.
28. Gaunt PN, Seal DV. Group G streptococcal infection of joints and joint prostheses. J Infect. 1986;13(2):115-123.
29. Trenkner SW, Braunstein EM, Lynn MD, Ike RW. Group G streptococcal arthritis and bowel disease: A rare enteropathic arthropathy. Gastrointest Radiol. 1987;12(3):265-267.
30. Bert F, Bariou-Lancelin M, Lambert-Zechovsky N. Clinical significance of bacteremia involving the “Streptococcus milleri” group: 51 cases and review. Clin Infect Dis. 1998;27(2):385-387.
31. Casariego E, Rodriguez A, Corredoira JC, et al. Prospective study of Streptococcus milleri bacteremia. Eur J Clin Microbiol Infect Dis. 1996;15(3):194-200.
32. Jacobs JA, Pietersen HG, Stobberingh EE, Soeters PB. Bacteremia involving the “Streptococcus milleri” group: Analysis of 19 cases. Clin Infect Dis. 1994;19(4):704-713.
33. Zheng S, Robinson E, Yeoman S, et al. MRI bone oedema predicts eight year tendon function at the wrist but not the requirement for orthopaedic surgery in rheumatoid arthritis. Ann Rheum Dis. 2006;65(5):607-611.
34. Harris R. Spontaneous rupture of the tendon of extensor pollicis longus as a complication of rheumatoid arthritis. Ann Rheum Dis. 1951;10(3):298-306.
35. Björkman A, Jörgsholm P. Rupture of the extensor pollicis longus tendon: A study of aetiological factors. Scand J Plast Reconstr Surg Hand Surg. 2004;38(1):32-35.
Compared with monoarticular arthritis, polyarticular arthritis may yield an initially narrower differential diagnosis that focuses on systemic inflammatory conditions, such as rheumatoid arthritis (RA). Approximately 15% to 30% of septic arthritis is polyarticular, of which about 45% is associated with underlying RA.1,2 Regardless of the number of joints involved, septic (infectious) arthritis is a valid consideration given the morbidity and mortality.
In a retrospective study in the United Kingdom (UK) between 1982 and 1991, the morbidity and mortality of septic arthritis was 31.6% and 11.5%, respectively, and 16% of the study population had RA.3 A review of the literature by Dubost and colleagues found that polyarticular septic arthritis (PASA) has a mortality of 31% to 42% compared with 4% to 8% for monoarticular septic arthritis, and RA was present in 67% of the PASA fatalities.1
Related: The Golden Era of Treatment in Rheumatology
Rheumatoid arthritis and its treatment predispose patients to septic arthritis. Septic arthritis in the UK general population is 0.42 per 100 patient-years for patients with RA on antitumor necrosis factor therapy.3,4 In a retrospective study in the U.S., the incidence of septic arthritis was 0.40 per 100 patient-years for patients with RA compared with 0.02 per 100 patient-years for patients without RA.5
Other complications of RA include infectious tenosynovitis and tendon rupture. The incidence and prevalence of infectious tenosynovitis and tendon rupture in RA are not firmly established in the literature.
We present a patient with RA and psoriasis who responded initially to acute management for RA but subsequently was diagnosed with culture-negative polyarticular arthritis and infectious tenosynovitis associated with beta hemolytic group G Streptococcus (GGS), a part of Streptococcus milleri (S. milleri). During surgery, he was also found to have bilateral extensor pollicus longus (EPL) tendon rupture. Given the possible morbidity, the authors believe this patient may be of interest to the medical community.
Case Presentation
A 69-year-old African American male presented with 3 to 4 days of swelling and pain of bilateral wrists, bilateral hands, and the left ankle with subjective, but resolved, fevers and chills. His medical history was significant for seropositive erosive RA, psoriasis, hypertension, hyperlipidemia, alcohol abuse, chronic tobacco use, osteoporosis, and glaucoma. He did not have diabetes, reported no IV drug abuse, and except for the immunosuppressive effects of his medications, was not otherwise immunocompromised.
For 2 years in the outpatient setting, the rheumatology clinic had been managing the patient’s rheumatoid factor (RF) positive and anti-cyclic citrullinated peptide (CCP) antibody positive erosive RA with etanercept 25 mg subcutaneously twice a week. The RA affected his hands, wrists, shoulders, and ankles bilaterally but was successfully controlled. The dermatology clinic was managing the patient’s psoriasis with calcipotriene cream 0.005% twice a week and clobetasol ointment 0.05% twice a week. Psoriatic plaques were noted on bilateral elbows, bilateral dorsal hands, and bilateral dorsal feet.
Initial Evaluation
At evaluation, the patient’s vital signs revealed a temperature of 36.3°C (97.3°F), pulse of 102 beats per minute, respiratory rate of 16 breaths per minute, oxygen saturation of 99% on room air, and blood pressure of 102/70 mm Hg. He was found to have edema, tenderness, and erythema of the wrists bilaterally and left metacarpophalangeal joints (MCPs) and edematous right MCPs and left medial ankle.
The patient had been nonadherent with etanercept for 5 monthsand restarted taking the medication only 2 weeks before presentation. He had noticed worsening arthritis for at least 1 month. His last RA flare was approximately 1 year before presentation. Additional symptoms included 4 days of nausea, nonbloody and nonbilious emesis, left lower quadrant pain, and diarrhea without melena or hematochezia.
Initial laboratory studies found 3.2 k/μL white blood cells (WBCs) with a differential of 11.9% lymphocytes, 4.2% monocytes, 83.3% neutrophils, 0.5% eosinophils, and 0.1% basophils; 165 k/μL platelets; 96 mm/h erythrocyte sedimentation rate (ESR); and 45 mg/dL C-reactive protein. The patient was diagnosed with viral gastroenteritis and RA flare and was admitted for inpatient management secondary to limited ability to care for himself.
Related: Infliximab-Induced Complications
The patient was started on prednisone 40 mg orally once a day (for 5 days) for empiric treatment of an RA flare and continued on etanercept. The inpatient rheumatology service was consulted. Further evaluation later that day found involvement of the proximal interphalangeal joints and elbows and tenderness of the tendons of the dorsal hand bilaterally. Over the next 2 days, the patient remained afebrile and WBCs were within normal limits. Edema, erythema, and tenderness of the involved joints somewhat improved, but tenderness along the tendons of the dorsal hand worsened, which concerned the managing teams for infectious tenosynovitis.
By day 4, the patient was afebrile and had a leukocytosis of 12.9 k/μLwith neutrophils 86.7%, but improvement of erythema, pain, and range of motion of involved joints and no tenderness to palpation of tendons was noted. The inpatient orthopedic surgery service evaluated the patient and did not find sufficient evidence necessitating surgical intervention.
Worsening Condition
On day 6, arthrocentesis of the left wrist was performed secondary to worsening of erythema and edema. The patient experienced new edema of the left shoulder and leukocytosis continued to trend upward (15.7 k/μL on day 6). Purulent aspirate (1.5 mL) was obtained from the fluctuance and tenosynovium of the left wrist. Empiric vancomycin 1 g IV twice daily and ceftriaxone 2 g IV daily were started and continued for 3 days. By this point in his hospital course, the patient had received 1 dose of etanercept. Prednisone and etanercept were previously discontinued because of the discovered infection. Blood cultures were drawn and had no growth (Table). Gastroenterology studies were limited to stool cultures and did not include colonoscopy. Leukocytosis began trending down.
On day 8, antibiotics were tailored to penicillin G 4 million units IV every 4 hours following growth of GGS from the sample of the left wrist. Subsequently, synovial fluid (3 mL) from the left shoulder was obtained following initiation of antibiotic therapy and had no growth. Magnetic resonance imaging (MRI) found tenosynovitis of the left ankle and right wrist.
On day 9, transthoracic echocardiography was performed and found no evidence of infectious endocarditis. Later that night, the patient was taken to surgery for incision and drainage/debridement of bilateral wrists and left ankle, synovectomy of right wrist, and aspiration of right shoulder. Findings included abscess in the left wrist and inflammatory synovitis and bilateral EPL tendon rupture consistent with RA. Pus from the left ankle had few gram-positive cocci in chains with no growth, and the specimens from both wrists grew GGS. Aspirate from the left ankle was an opaque yellow fluid with 14,900/mm3 WBC, 30,000/mm3 red blood cells (RBC), 97% neutrophils, 1% macrophages, 2% lymphocytes, and 0% monocytes. Aspirate from the right shoulder was an opaque bloody fluid with 10,100/mm3 WBC, 40,000/mm3 RBC, 95% neutrophils, 2% macrophages, 1% lymphocytes, and 1% monocytes. On day 10, sulfasalazine 500 mg twice a day was initiated for RA.
Following surgery and continued antibiotics, the patient’s leukocytosis resolved, and improvement was seen in all joints with decreased edema, erythema, and pain and increased range of motion. Postoperative recovery was complicated by ileus, urinary retention, and fungal (Candida albicans) urinary tract infection, all of which resolved without significant complications. The inpatient rheumatology service restarted prednisone at a lower dose of 20 mg. The patient became afebrile and sufficiently stable for transfer to a lower level of care with continued physical therapy and IV antibiotics for another 3 weeks.
Discussion
The patient had 2 underlying systemic inflammatory conditions: RA and psoriasis. The underlying chronic arthritis was likely caused by RA, not psoriatic arthritis (PsA). The patient met the 2010 American College of Rheumatology criteria but failed to meet the classification criteria for PsA.6,7 However, the clinical features of RA and PsA overlap. Rheumatoid factor and CCP can be positive laboratory findings in both RA and PsA.8-14 Tenosynovitis is found in about half of RA patients and PsA patients (P > .05).15 In its evaluation of the patient, the inpatient rheumatology service suspected that the patient may have had RA with components of PsA.
Rheumatoid arthritis complicates the diagnosis of septic arthritis. In a study by Nolla and colleagues, a mean of 7.3 days (range 3 to 18 days) elapsed before a diagnosis of septic arthritis was made in 10 patients with RA on corticosteroids.2 Consideration of risk factors such as increasing age, male sex, tobacco use, extra-articular manifestations of RA, positive RF, rheumatoid nodules, poor functional capacity, high ESR, leukopenia, comorbidities (chronic lung disease, alcoholism, organic brain disease, and diabetes), and the use of corticosteroids may expedite the diagnosis of infections in patients with RA.16 In this case, the patient had some of these risk factors: age, male sex, alcoholism, chronic tobacco use, positive RF, high ESR, and leukopenia (at presentation).
Related: Trend Toward Concomitant Supplements and Medications
The history of medication nonadherence of etanercept with progressively worsening arthritis and early clinical improvement (reduction in erythema, edema, and pain and temporary loss of signs of tenosynovitis on examination) while on prednisone suggested that the patient had a RA flare. The prednisone likely alleviated the inflammatory process but created an immunosuppressed state that allowed GGS to invade and possibly disseminate. Alternately, the patient may have been infected before presentation. The lack of a definitive time line for his case prevented the authors from forming conclusions about a possible causal relationship between the infection and medications. The subjective fevers before admission were nonspecific and could have been caused by RA, presumed gastroenteritis, or other undiagnosed infectious processes. The observed leukocytosis may have been initially corticosteroid-induced.17
Septic Arthritis
The suspicion of septic arthritis and infectious tenosynovitis substantially increased on day 6 with worsening symptoms, involvement of additional joints, and spiking fevers. Group G Streptococcus was obtained from the aspirate of the left wrist and from the surgical specimens from the bilateral wrists. The clinical presentation, MRI imaging studies, and surgical and nonsurgical specimens supported a diagnosis of GGS tenosynovitis. However, there was no clear evidence (ie, positive culture with identified organism) of septic arthritis, likely secondary to early septic arthritis and initiation of antibiotics before joint aspirations. The aspirate from the left ankle was yellow and opaque, but the culture was negative.
The pathogenic organism in the patient was GGS. Group G Streptococcus is normal flora of the oral cavity, gastrointestinal (GI) tract, upper respiratory tract, genital tract, and skin, which were all possible sources of seeding.18 Streptococcal species account for about 20% of septic arthritis, and GGS arthritis accounts for 4% to 19% of streptococcal arthritis.19-22 From a review of the literature, 2 cases of GGS tenosynovitis have been published.23,24 However, in an ultrasound study and MRI study, 49% and 43%, respectively, of patients with RA had tenosynovitis of the tendons of the hands.15,25
GGS Demographics
About three-quarters (71%) of patients with GGS arthritis are male.19 The analysis of the literature by Bronze and colleagues found that chronic joint disease and alcoholism are present in 34% and 14% of patients with GGS arthritis, respectively. One-quarter (23% from Dubost and colleagues) to one-third (32% from Schattner and colleagues) of patients with GGS arthritis have RA.19,26
Fever is present in less than half (43%) of patients with GGS arthritis.19 Positive synovial fluid is expected in 90% of patients.19 Leukocytosis and elevated ESR need not be present.27,28 The arthritis is polyarticular in one-quarter of patients (24% from Bronze and colleagues and 26% from Dubost and colleagues).19,26
Positive blood cultures can be expected in one-fourth (26%) of patients with GGS arthritis.19 The patient’s blood cultures were negative. Blood cultures drawn before initiation of antibiotics yielded no growth, so if the spread was hematogenous, the bacteremia was transient or intermittent. Before and after initiation of antibiotics, specimens from the shoulders did not grow colonies, whereas specimens from the wrists did. If the shoulders were truly infected, these findings and the notably later involvement of the shoulders suggest that the shoulders may have been seeded later in the hospital course.
Trenkner and colleagues proposed that GI abnormalities provide a portal of entry for GGS, which is under the umbrella of S. milleri.29S. milleri is associated with abscess formation, usually of the GI tract.30-32 In the study patient, the possible gastroenteritis may have provided such a portal of entry and subsequent seeding to the joints, and an abscess was found in the left wrist.
Tendon Rupture
Additionally, bilateral EPL tendon rupture likely occurred as a consequence of the inflammatory process from RA and infectious tenosynovitis in the patient. According to Zheng and colleagues, tenosynovitis is an inflammatory process of the synovial tendon sheath that may result in degeneration and rupture of the tendons and may contribute to bone erosions, development of joint deformities, and loss of functional capacity.33 In a histologic study of a ruptured EPL tendon from a patient with RA, Harris observed a chronic inflammatory cellular reaction.34 Harris also described a male with RA with unconfirmed bilateral EPL rupture.34 Björkman and colleague identified previous injury, RA, and local or systemic steroids as important etiologic factors for EPL tendon rupture.35
As in the case of this patient, the utilization of both medical and surgical therapy is not uncommon for treating GGS infection. Antibiotic therapy typically consists of penicillin (74%).26 Surgical intervention is necessary in 16% to 37% of patients.19,26 This patient required both penicillin and incision and drainage/debridement before significant clinical improvement was noted. Prognosis of GGS arthritis is favorable with 5% mortality.26
Conclusion
Septic arthritis and infectious tenosynovitis are readily treatable with low mortality if promptly identified. Identification can be masked by other medical conditions, such as RA and psoriasis, and their associated immunosuppressive treatment. Bilateral EPL tendon rupture may be a complication of RA, particularly with an underlying septic arthritis and infectious tenosynovitis.
Author disclosures
The authors report no actual or potential conflicts of interest with regard to this article.
Disclaimer
The opinions expressed herein are those of the authors and do not necessarily reflect those of Federal Practitioner, Frontline Medical Communications Inc., the U.S. Government, or any of its agencies. This article may discuss unlabeled or investigational use of certain drugs. Please review the complete prescribing information for specific drugs or drug combinations—including indications, contraindications, warnings, and adverse effects—before administering pharmacologic therapy to patients.
1. Dubost JJ, Fis I, Denis P, et al. Polyarticular septic arthritis. Medicine (Baltimore). 1993;72(5):296-310.
2. Nolla JM, Gómez-Vaquero C, Fiter J, et al. Pyarthrosis in patients with rheumatoid arthritis: A detailed analysis of 10 cases and literature review. Semin Arthritis Rheum. 2000;30(2):121-126.
3.Weston VC, Jones AC, Bradbury N, Fawthrop F, Doherty M. Clinical features and outcome of septic arthritis in a single UK Health District 1982-1991. Ann Rheum Dis. 1999;58(4):214-219.
4. Galloway JB, Hyrich KL, Mercer LK, et al; BSR Biologics Register. Risk of septic arthritis in patients with rheumatoid arthritis and the effect of anti-TNF therapy: Results from the British Society for Rheumatology Biologics Register. Ann Rheum Dis. 2011;70(10):1810-1814.
5. Doran MF, Crowson CS, Pond GR, O’Fallon WM, Gabriel SE. Frequency of infection in patients with rheumatoid arthritis compared with controls: A population-based study. Arthritis Rheum. 2002;46(9):2287-2293.
6. Aletaha D, Neogi T, Silman AJ, et al. 2010 Rheumatoid arthritis classification criteria: An American College of Rheumatology/European League Against Rheumatism collaborative initiative. Arthritis Rheum. 2010;62(9):2569-2581.
7. Taylor W, Gladman D, Helliwell P, Marchesoni A, Mease P, Mielants H; CASPAR Study Group. Classification criteria for psoriatic arthritis: Development of new criteria from a large international study. Arthritis Rheum. 2006;54(8):2665-2673.
8. Gladman DD, Shuckett R, Russell ML, Thorne JC, Schachter RK. Psoriatic arthritis (PSA)—An analysis of 220 patients. Q J Med. 1987;62(238):127-141.
9. Bogliolo L, Alpini C, Caporali R, Scirè CA, Moratti R, Montecucco C. Antibodies to cyclic citrullinated peptides in psoriatic arthritis. J Rheumatol. 2005;32(3):511-515.
10. Vander Cruyssen B, Hoffman IE, Zmierczak H, et al. Anti-citrullinated peptide antibodies may occur in patients with psoriatic arthritis. Ann Rheum Dis. 2005;64(8):1145-1149.
11. Alenius GM, Berglin E, Rantapää Dahlgvist S. Antibodies against cyclic citrullinated peptide (CCP) in psoriatic patients with or without joint inflammation. Ann Rheum Dis. 2006;65(3):398-400.
12. Candia L, Marquez J, Gonzalez C, et al. Low frequency of anticyclic citrullinated peptide antibodies in psoriatic arthritis but not in cutaneous psoriasis. J Clin Rheumatol. 2006;12(5):226-229.
13. Inanc N, Dalkilic E, Kamali S, et al. Anti-CCP antibodies in rheumatoid arthritis and psoriatic arthritis. Clin Rheumatol. 2007;26(1):17-23.
14. Popescu C, Zofota S, Bojinca V, Ionescu R. Anti-cyclic citrullinated peptide antibodies in psoriatic arthritis—Cross-sectional study and literature review. J Med Life. 2013;6(4):376-382.
15. Schoellnast H, Deutschmann HA, Hermann J, et al. Psoriatic arthritis and rheumatoid arthritis: Findings in contrast-enhanced MRI. AJR Am J Roentgenol. 2006;187(2):351-357.
16. Doran MF, Crowson CS, Pond GR, O’Fallon WM, Gabriel SE. Predictors of infection in rheumatoid arthritis. Arthritis Rheum. 2002;46(9):2294-2300.
17. Shoenfeld Y, Gurewich Y, Gallant LA, Pinkhas J. Prednisone-induced leukocytosis. Influence of dosage, method and duration of administration on the degree of leukocytosis. Am J Med. 1981;71(5):773-778.
18. Gossling J. Occurrence and pathogenicity of the Streptococcus milleri group. Rev Infect Dis. 1988;10(2):257-285.
19. Dubost JJ, Soubrier M, De Champs C, Ristori JM, Sauvezie B. Streptococcal septic arthritis in adults. A study of 55 cases with a literature review. Joint Bone Spine. 2004;71(4):303-311.
20. Ryan MJ, Kavanagh R, Wall PG, Hazleman BL. Bacterial joint infections in England and Wales: Analysis of bacterial isolates over a four year period. Br J Rheumatol. 1997;36(3):370-373.
21. Morgan DS, Fisher D, Merianos A, Currie BJ. An 18 year clinical review of septic arthritis from tropical Australia. Epidemiol Infect. 1996;117(3):423-428.
22. Kaandorp CJ, Dinant HJ, van de Laar MA, Moens HJ, Prins AP, Dijkmans BA. Incidence and sources of native and prosthetic joint infection: A community based prospective survey. Ann Rheum Dis. 1997;56(8):470-475.
23. Bradlow A, Mitchell RG, Mowat AG. Group G streptococcal arthritis. Rheumatol Rehabil. 1982;21(4):206-210.
24. Meier JL, Gerster JC. Bursitis and tenosynovitis caused by group G streptococci. J Rheumatol. 1983;10(5):817-818.
25. Filippucci E, Gabba A, Di Geso L, Girolimetti R, Salaffi F, Grassi W. Hand tendon involvement in rheumatoid arthritis: An ultrasound study. Semin Arthritis Rheum. 2012;41(6):752-760.
26. Bronze MS, Whitby S, Schaberg DR. Group G streptococcal arthritis: Case report and review of the literature. Am J Med Sci. 1997;313(4):239-243.
27. Schattner A, Vosti KL. Bacterial arthritis due to beta-hemolytic streptococci of serogroups A, B, C, F, and G. Analysis of 23 cases and a review of the literature. Medicine (Baltimore). 1998;77(2):122-139.
28. Gaunt PN, Seal DV. Group G streptococcal infection of joints and joint prostheses. J Infect. 1986;13(2):115-123.
29. Trenkner SW, Braunstein EM, Lynn MD, Ike RW. Group G streptococcal arthritis and bowel disease: A rare enteropathic arthropathy. Gastrointest Radiol. 1987;12(3):265-267.
30. Bert F, Bariou-Lancelin M, Lambert-Zechovsky N. Clinical significance of bacteremia involving the “Streptococcus milleri” group: 51 cases and review. Clin Infect Dis. 1998;27(2):385-387.
31. Casariego E, Rodriguez A, Corredoira JC, et al. Prospective study of Streptococcus milleri bacteremia. Eur J Clin Microbiol Infect Dis. 1996;15(3):194-200.
32. Jacobs JA, Pietersen HG, Stobberingh EE, Soeters PB. Bacteremia involving the “Streptococcus milleri” group: Analysis of 19 cases. Clin Infect Dis. 1994;19(4):704-713.
33. Zheng S, Robinson E, Yeoman S, et al. MRI bone oedema predicts eight year tendon function at the wrist but not the requirement for orthopaedic surgery in rheumatoid arthritis. Ann Rheum Dis. 2006;65(5):607-611.
34. Harris R. Spontaneous rupture of the tendon of extensor pollicis longus as a complication of rheumatoid arthritis. Ann Rheum Dis. 1951;10(3):298-306.
35. Björkman A, Jörgsholm P. Rupture of the extensor pollicis longus tendon: A study of aetiological factors. Scand J Plast Reconstr Surg Hand Surg. 2004;38(1):32-35.
Evaluation of Methadone-Induced QTc Prolongation in a Veteran Population
Estimates of the annual incidence of sudden cardiac death (SCD) vary from 180,000 to 456,000.1 About 80% to 85% of the cases of SCD are due to a ventricular arrhythmia.2 One type of ventricular arrhythmia, torsades de pointes (TdP), is caused by a prolongation of the QT interval. Because the QT interval is dependent on heart rate, clinicians use the corrected QT (QTc) interval, which has been adjusted for heart rate. The HHS recommends using a gender-independent threshold of 450 msec to define QTc prolongation when conducting research.3 Additionally, a QTc interval > 500 msec is associated with an increased risk for TdP.4 Female gender, hypokalemia, hypomagnesemia, and medical conditions such as congenital long QT syndrome, heart failure, and left ventricular hypertrophy can predispose a person to QTc prolongation.5
Methadone is a synthetic opioid used for chronic pain management or for opioid or heroin addiction. In 2006, the FDA issued a public health advisory, which was followed by the addition of a black box warning to the labeling of methadone regarding cardiac abnormalities that caused serious adverse effects, including QT prolongation, TdP, and death.6 Additional recommendations to evaluate the pharmacokinetic and pharmacodynamic drug interactions were also added to the labeling.
Related: Reducing Opioid Use for Chronic Pain
Several prospective studies, cross-sectional studies, and retrospective reviews have reported QTc prolongation with methadone.7-14 Many cases of QTc prolongation and TdP have been in patients receiving methadone in large doses (> 100 mg/d); however, incidences have also occurred in those receiving typical doses of methadone for addiction treatment.8,15,16 Multiple studies have demonstrated that methadone-induced QTc prolongation is dose-dependent.8,17-20 In an observational study of 90 subjects who were undergoing methadone maintenance treatment, the subjects taking < 60 mg/d of methadone had a 7.7 msec prolongation of the QTc interval, which was significantly less QTc prolongation than in those receiving 60 mg/d to 109 mg/d (15.6 msec, P < .001) and 110 mg/d to 150 mg/d (17.4 msec, P = .001).21
However, in the current literature there are few studies evaluating the QTc prolonging effects of methadone when used in lower doses for pain, such as those used at the Southern Arizona VA Health Care System (SAVAHCS).8 Given the increased risk of cardiac arrhythmias, it is important to understand the effects of methadone on the QTc interval in a veteran patient population using methadone at lower doses for pain. Understanding this risk can help clinicians develop strategies and protocols for the safe use of methadone.
The purpose of this study was to evaluate the effect of methadone on the QTc interval among patients at SAVAHCS. The primary objective was to determine whether methadone prolongs the QTc interval when used for pain. Secondary outcomes included evaluations of the (1) QTc interval when stratified by the QTc interval obtained while prescribed methadone; (2) effects of low, medium, and high doses of methadone on the QTc interval; (3) effects of the concurrent use of QTc prolonging medications on the QTc interval; and (4) effects of the concurrent use of strong inhibitors of methadone clearance on the QTc interval. It was hypothesized that methadone, when used for pain, causes a significant prolongation of the QTc interval, and methadone-induced QTc prolongation is dose-dependent. It was also hypothesized that the QTc interval will be more prolonged when methadone is used concurrently with other medications with a known or conditional risk of TdP or with medications that are strong inhibitors of methadone clearance.
Methods
Full Institutional Review Board approval was obtained prior to initiating this retrospective pre-post study. This study used the electronic medical records (EMRs) of SAVAHCS from July 1, 2004, to July 31, 2012, to compare the QTc interval of patients on stable doses of methadone with the baseline QTc interval. Patients included were aged 18 to 87 years and dispensed a new prescription for methadone between January 1, 2006, and July 31, 2010. Patients must have been adherent to methadone as defined by a medication possession ratio of ≥ 0.8. Patients without a baseline electrocardiogram (ECG) within the 18 months prior to starting methadone, without at least 1 follow-up ECG 7 days to 2 years after the initial prescription, who had a diagnosis of heart failure, or used an implanted cardiac defibrillator or pacemaker as indicated by ICD-9 codes were excluded.
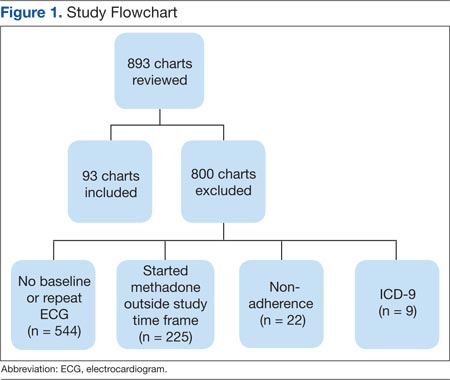
Information collected from the EMR included demographics (age and gender), the QTc interval before starting methadone (pre-QTc), the first QTc interval recorded while prescribed methadone (post-QTc) at a stable dose (defined as ≥ 7 days without a dose change), methadone total daily dose at the time of the post-QTc, concurrent QTc prolonging medications used at the time of each ECG, time elapsed between pre-QTc and post-QTc, time elapsed between the pre-QTc and initiation of methadone, and time elapsed between starting methadone and the post-QTc. All ECGs were recorded using a 12-lead ECG by the MAC 5500 Resting ECG Analysis System (GE Healthcare), which automatically calculates the QTc interval.
For the primary outcome, the mean pre-QTc and post-QTc were compared. These QTc intervals were further analyzed as secondary outcomes. The mean pre-QTc and post-QTc were compared when stratified by post-QTc of < 450 msec, 450 msec to 499 msec, and ≥ 500 msec. To analyze the dose effect of methadone, the mean pre-QTc and post-QTc were compared when stratified by methadone total daily dose: low (≤ 15 mg/d), medium (16-30 mg/d), and high (> 30 mg/d). Dose ranges were based on typical SAVAHCS prescriptions.
An additional secondary outcome was to determine the effect of the concurrent use of QTc prolonging medications on the QTc interval. The medications the subject was taking at the time of each ECG were reviewed to determine whether any of the medications were listed as Drugs with a risk of Torsades de Pointes or Drugs with a conditional risk of Torsades de Pointes on the CredibleMeds website.22,23 Drugs with a conditional risk of TdP are defined as drugs in which there is evidence that the drug prolongs the QTc interval and has a risk of TdP but only under certain conditions, such as high doses or drug interactions. The mean pre-QTc with and without concurrent use of QTc prolonging medications was compared with the mean post-QTc with QTc prolonging medications in addition to methadone.
Because methadone is extensively metabolized by cytochrome P450 3A4 (CYP3A4), another outcome was to determine the effect of the concurrent use of strong CYP3A4 inhibitors on the QTc interval. The medications the subject was taking at the time of each ECG were reviewed to determine whether any of the medications were listed as strong CYP3A4 inhibitors in The Pharmacist’s Letter/The Prescriber’s Letter.24 The mean pre-QTc with and without the concurrent use of strong CYP3A4 inhibitors was compared with the mean post-QTc with strong CYP3A4 inhibitors in addition to methadone.
Related: Pharmacist-Managed Collaborative Practice for Chronic Stable Angina
The primary and secondary outcomes were compared using a paired t test and descriptive statistics; demographics were analyzed using descriptive statistics. Based on the findings of a previous study, a minimum of 8 patients were needed to meet a power of 0.8 with an alpha 0.05 and a medium effect size when comparing the mean pre-QTc and post-QTc for the primary outcome.25
Results
Of 893 EMRs reviewed, 93 met inclusion criteria (Figure 1). The main reason for exclusion was lack of pre-QTc and/or post-QTc (n = 544). The mean age was 58 years (± 10 years), 92% were male, and the mean daily methadone dose at the time of the post-QTc was 29 mg (5 mg-160 mg) (Table 1). Thirty patients were prescribed ≥ 1 QTc prolonging medication at the time of the pre-QTc, 40 patients were prescribed ≥ 1 QTc prolonging medication at the time of the post-QTc, and 0 patients were prescribed a strong CYP3A4 inhibitor at the time of either QTc. There was an average of 151 days (0-554 days) between the pre-QTc and methadone initiation, 161 days (8-664 days) between methadone initiation and the post-QTc, and 312 days (10-1,003 days) between the pre-QTc and post-QTc.
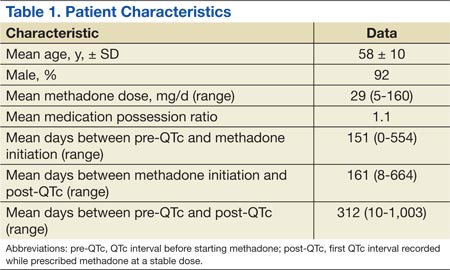
For the primary outcome, there was no significant increase in the QTc interval when comparing the pre-QTc and post-QTc (432 ± 26 msec vs 436 ± 28 msec, P = .221) (Figure 2). When stratified by post QTc, the group of patients with a post-QTc < 450 msec (n = 66) and the group with a post-QTc of ≥ 500 msec (n = 2) had no significant increase in the QTc interval (427 ± 26 msec vs 422 ± 16 msec and 422 ± 18 msec vs 533 ± 21 msec, respectively; P > .05) (Table 2). For the group of patients with a post-QTc of 450 msec to 499 msec (n = 25), methadone significantly prolonged the QTc interval (447 ± 21 msec vs 465 ± 12 msec, P < .001).
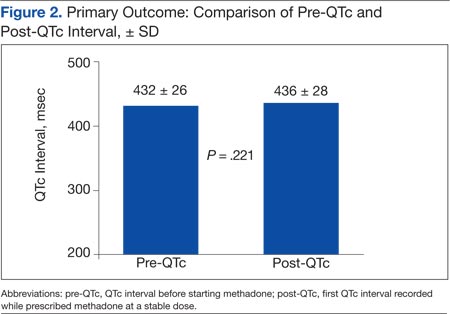
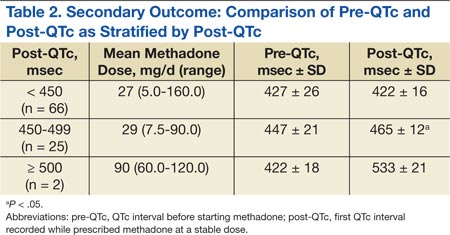
When stratified by methadone daily dose of ≤ 15 mg (n = 45), 16 mg to 30 mg (n = 27), and > 30 mg (n = 21), methadone did not significantly prolong the QTc interval in any group (428 ± 29 msec vs 430 ± 25 msec, 436 ± 16 msec vs 439 ± 21 msec, 437 ± 29 msec vs 446 ± 39 msec, respectively; P > .05) (Table 3). For the group of patients using ≥ 1 QTc prolonging medication at the time of the post-QTc and no QTc prolonging medications at the time of the pre-QTc, the addition of methadone did not significantly increase the QTc interval when compared with the pre-QTc (n = 15; 425 ± 23 msec vs 437 ± 31 msec, respectively; P > .05) (Table 4). For the group of patients prescribed ≥ 1 QTc prolonging medication at the pre-QTc and post-QTc, methadone did not significantly prolong the QTc interval (n = 25; 437 ± 32 msec vs 441 ± 33 msec, respectively; P > .05) (Table 5). No subjects were using strong CYP3A4 inhibitors; therefore, the effect of strong CYP3A4 inhibitors could not be assessed.
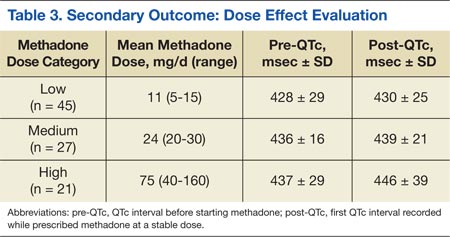
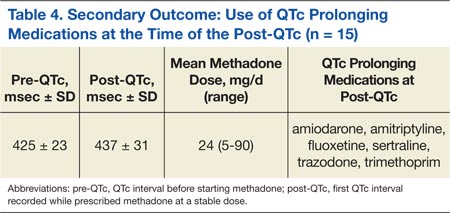
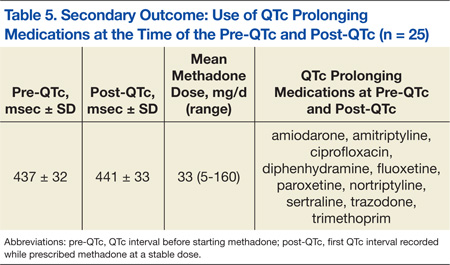
Discussion
The results of this study suggest that methadone-induced QTc interval prolongation may not be clearly evident at lower doses when used for pain. There was no significant increase in the QTc interval in the low-, medium-, and high-dose methadone groups, nor when analyzing the drug interactions. However, this study was powered based on the primary outcome, and it is possible that the study was underpowered to detect a difference in these secondary outcomes. When stratified by post-QTc, a significant increase in the QTc interval was noted for the group of patients with a post-QTc of 450 msec to 499 msec. The absolute mean differences between the pre-QTc and post-QTc for most of the secondary outcomes are unlikely to be clinically relevant, with the exception of the high-dose methadone group and the group stratified by post-QTc interval of 450 msec to 499 msec.
These results are supported by a prospective pilot study of 64 subjects with advanced cancer, which evaluated the QTc prolonging effects of methadone when used at lower doses (range 3-90 mg/d, median 23 mg/d).26 Only 1 of 64 subjects developed clinically significant QTc interval prolongation (QTc ≥ 500 msec) at the end of the second week of therapy. The mean QTc interval measured at baseline was 427 msec, which increased to a mean of 430 msec after 2 weeks of methadone use (mean dose 23 mg/d) and decreased thereafter (375 msec at 4 weeks with a mean dose of 15 mg/d and 373 msec at 8 weeks with a mean dose 28 mg/d; no P values reported). Additionally, no significant association was found between methadone dose and the QTc interval (P > .05).
This study evaluated the surrogate endpoint of QTc prolongation and found that 2 patients with a pre-QTc < 500 msec (434 msec and 409 msec) had a post-QTc > 500 msec (518 msec and 547 msec). These subjects were both in the high-dose methadone group receiving 120 mg/d and 60 mg/d of methadone, respectively. It is unclear what confounders were present at the time of the post-QTc.
Related: Using Dashboard Technology to Monitor Overdose
The study did not evaluate clinically relevant outcomes such as TdP or SCD; however, there is evidence that methadone when used within a therapeutic dose range is associated with SCD.27 In a prospective evaluation of SCD, 22 subjects using methadone found with therapeutic blood levels were compared with 106 subjects not using methadone. Most subjects were using methadone for pain control or opioid withdrawal. In 5 subjects (23%) in the methadone group, a cardiac abnormality (eg, coronary artery disease) that could have caused SCD was identified compared with 64 subjects (60%) in the group not using methadone (P = .002).
Limitations
There are several limitations of this study. This retrospective study does not allow for conclusions to be direct cause and effect, and the results relied on the EMR and methadone prescription fill dates to determine adherence to methadone, when methadone was initiated, and methadone daily dose. The exclusion criteria for the diagnosis of heart failure and the use of an implanted pacemaker and/or cardioverter defibrillator depended on the accuracy of the ICD-9 codes.
Also, many factors that affect the QTc interval were not assessed, such as potassium and magnesium levels, alcohol, cocaine, and amphetamine use. In addition, over-the-counter medications and medications obtained outside of SAVAHCS were not assessed. It is possible that any of those factors could be confounding variables. Furthermore, a majority of the subjects were male, and subjects with heart failure and those using an implanted pacemaker and/or cardioverter defibrillator were excluded from the study. In clinical practice, the results of the study cannot be generalized to those excluded patient populations. Additionally, the effect size of QTc prolongation observed was lower than was expected. Therefore, this study may not have been powered adequately to detect smaller differences in QTc prolongation.
Another limitation of the study is the high exclusion rate: about 90%. A majority of the patients were excluded due to the lack of ECG monitoring. The reason for obtaining an ECG was not assessed, and many subjects likely had an ECG obtained incidentally. Due to the high exclusion rate, selection bias may have been introduced into the study. Therefore, the 10% of subjects included in the study may not be representative of veterans using methadone for pain.
Very few studies of the effects of methadone on QTc prolongation in veterans have been published. A retrospective chart review by Fareed and colleagues sought to identify whether patients are at high risk for cardiac arrhythmias by adding an onsite ECG screening at baseline and annually for patients using methadone as part of a methadone maintenance program at the Atlanta VAMC.11 The patients in the study were an average age of 56 years, and 93% were male. The mean daily methadone dose was 90 ± 48 mg/d, and the mean duration of treatment was 38 ± 31 months. The mean QTc interval was significantly longer at the most recent QTc interval while using methadone compared with the baseline QTc interval (442 ± 25 msec vs 417 ± 30 msec, respectively; P < .001). Six percent of patients had a significant prolongation of the QTc interval from baseline to > 500 msec, and 27% had a significant prolongation of the QTc interval from baseline to 450 msec to 500 msec (P < .05).
This study and the study by Fareed and colleagues are similar in that both are retrospective, compare baseline QTc intervals and QTc intervals while using methadone, and include subjects of a similar age and gender. However, the subjects in the Fareed and colleagues study were using methadone for maintenance treatment at higher doses than in the present study. Additionally, the results of the studies differ. Fareed and colleagues found a prolongation of the QTc interval with methadone use. Although the present study has many limitations, it adds additional information to the medical literature regarding the QTc interval of veterans using methadone in lower doses at an average of 29 mg/d.
Conclusion
In this study of veterans using methadone for pain, methadone did not significantly increase the QTc interval. Two patients had a prolonged QTc interval of ≥ 500 msec while taking methadone. The QTc interval did not vary by methadone daily dose, and the concurrent use of QTc prolonging medications together with methadone did not increase the QTc interval. The concurrent use of strong CYP3A4 inhibitors could not be assessed, because none of the patients were on these medications.
Despite these findings, the study had several limitations, and there is a black box warning included in the labeling of methadone regarding QTc interval prolongation, TdP, and death. Therefore, it is advisable to monitor the QTc interval in patients using methadone, even at low doses. In those patients with a prolonged QTc interval and/or risk factors for QTc prolongation, methadone should either be avoided or used cautiously with close monitoring of the QTc interval.
Acknowledgments
This manuscript was prepared and research was conducted with resources and the use of facilities at the Southern Arizona VA Health Care System in Tucson, Arizona.
Author disclosures
The authors report no actual or potential conflicts of interest with regard to this article.
Disclaimer
The opinions expressed herein are those of the authors and do not necessarily reflect those of Federal Practitioner, Frontline Medical Communications Inc., the U.S. Government, or any of its agencies. This article may discuss unlabeled or investigational use of certain drugs. Please review complete prescribing information for specific drugs or drug combinations—including indications, contraindications, warnings, and adverse effects—before administering pharmacologic therapy to patients.
1. Kong MH, Fonarow GC, Peterson ED, et al. Systematic review of the incidence of sudden cardiac death in the United States. J Am Coll Cardiol. 2011;57(7): 794-801.
2. Josephson M, Wellens HJJ. Implantable defibrillators and sudden cardiac death. Circulation. 2004;109(22):2685-2691.
3. International Conference on Harmonisation-Quality. Guidance for Industry: E14 Clinical Evaluation of QT/QTc Interval Prolongation and Proarrhythmic Potential for Non-Antiarrhythmic Drugs. Rockville, MD: U.S. Food and Drug Administration; 2005.
4. Committee for Proprietary Medicinal Products. Points to Consider: The Assessment of the Potential for QT Interval Prolongation by Non-Cardiovascular Medicinal Products. London, UK: The European Agency for the Evaluation of Medicinal Products; 1997.
5. Stringer J, Welsh C, Tommasello A. Methadone-associated Q-T interval prolongation and torsades de pointes. Am J Health Syst Pharm. 2009;66(9):825-833.
6. Information for healthcare professionals: Methadone hydrochloride. U.S. Food and Drug Administration Website. http://www.fda.gov/Drugs/DrugSafety/PostmarketDrugSafetyInformationforPatientsandProviders/ucm142841.htm. Published November 2006. Updated August 23, 2013. Accessed January 9, 2015.
7. Anchersen K, Clausen T, Gossop M, Hansteen V, Waal H. Prevalence and clinical relevance of corrected QT interval prolongation during methadone and buprenorphine treatment: A mortality assessment study. Addiction. 2009;104(6):993-999.
8. Chang KC, Huang CL, Liang HY, et al. Gender-specific differences in susceptibility to low-dose methadone-associated QTc prolongation in patients with heroin dependence. J Cardiovasc Electrophysiol. 2012;23(5):527-533.
9. Cruciani RA, Sekine R, Homel P, et al. Measurement of QTc in patients receiving chronic methadone therapy. J Pain Symptom Manage. 2005;29(4):385-391.
10. Ehret GB, Voide C, Gex-Fabry M, et al. Drug-induced long QT syndrome in injection drug users receiving methadone: High frequency in hospitalized patients and risk factors. Arch Intern Med. 2006;166(12):1280-1287.
11. Fareed A, Vayalapalli S, Byrd-Sellers J, et al. Onsite QTc interval screening for patients in methadone maintenance treatment. J Addict Dis. 2010;29(1):15-22.
12. Fanoe S, Hvidt C, Ege P, Jensen GB. Syncope and QT prolongation among patients treated with methadone for heroin dependence in the city of Copenhagen. Heart. 2007;93(9):1051-1055.
13. Peles E, Bodner G, Kreek MJ, Rados V, Adelson M. Corrected-QT intervals as related to methadone dose and serum level in methadone maintenance treatment (MMT) patients: A cross-sectional study. Addiction. 2007;102(2):289-300.
14. Wedam EF, Bigelow GE, Johnson RE, Nuzzo PA, Haigney MC. QT-interval effects of methadone, levomethadyl, and buprenorphine in a randomized trial. Arch Intern Med. 2007;167(22):2469-2475.
15. DOLOPHINE [package insert]. Columbus, OH: Roxane Laboratories, Inc; 2012.
16. Krantz MJ, Martin J, Stimmel B, Mehta D, Haigney MC. QTc interval screening in methadone treatment. Ann Intern Med. 2009;150(6):387-395.
17. Krantz MJ, Kutinsky IB, Robertson AD, Mehler PS. Dose-related effects of methadone on QT prolongation in a series of patients with torsade de pointes. Pharmacotherapy. 2003;23(6):802-805.
18. Castro VM, Clements CC, Murphy SN, et al. QT interval and antidepressant use: A cross sectional study of electronic health records. BMJ. 2013;346:f288.
19. Florian J, Garnett CE, Nallani SC, Rappaport BA, Throckmorton DC. A modeling and simulation approach to characterize methadone QT prolongation using pooled data from five clinical trials in MMT patients. Clin Pharmacol Ther. 2012;91(4):666-672.
20. Fonseca F, Marti-Almor J, Pastor A, et al. Prevalence of long QTc interval in methadone maintenance patients. Drug Alcohol Depend. 2009;99(1-3):327-332.
21. Gheshlaghi F, Izadi-Mood N, Mardani A, Piri-Ardekani MR. Dose-dependent effects of methadone on the QT interval in patients under methadone maintenance treatment. Asia Pacific J Med Toxicol. 2013;2(1):6-9.
22. Drugs with a known risk of Torsades de Pointes. CredibleMeds Website. https://www.crediblemeds.org/new-drug-list. Updated January 14, 2015. Accessed January 14, 2015.
23. Drugs with a conditional risk of Torsades de Pointes. CredibleMeds Website. https://www.crediblemeds.org/new-drug-list. Updated January 14, 2015. Accessed January 14, 2015.
24. Cytochrome P450 drug interactions [full update October 2009]. Pharmacist’s Letter/Prescribers Letter. 2006;22(2):220233.
25. Huh B, Park CH. Retrospective analysis of low-dose methadone and QTc prolongation in chronic pain patients. Korean J Anesthesiol. 2010;58(4):338-343.
26. Reddy S, Hui D, El Osta B, et al. The effect of oral methadone on the QTc interval in advanced cancer patients: A prospective pilot study. J Palliat Med. 2010;13(1):33-38.
27. Chugh SS, Socoteanu C, Reinier K, Waltz J, Jui J, Gunson K. A community-based evaluation of sudden death associated with therapeutic levels of methadone. Am J Med. 2008;121(1):66-71.
Estimates of the annual incidence of sudden cardiac death (SCD) vary from 180,000 to 456,000.1 About 80% to 85% of the cases of SCD are due to a ventricular arrhythmia.2 One type of ventricular arrhythmia, torsades de pointes (TdP), is caused by a prolongation of the QT interval. Because the QT interval is dependent on heart rate, clinicians use the corrected QT (QTc) interval, which has been adjusted for heart rate. The HHS recommends using a gender-independent threshold of 450 msec to define QTc prolongation when conducting research.3 Additionally, a QTc interval > 500 msec is associated with an increased risk for TdP.4 Female gender, hypokalemia, hypomagnesemia, and medical conditions such as congenital long QT syndrome, heart failure, and left ventricular hypertrophy can predispose a person to QTc prolongation.5
Methadone is a synthetic opioid used for chronic pain management or for opioid or heroin addiction. In 2006, the FDA issued a public health advisory, which was followed by the addition of a black box warning to the labeling of methadone regarding cardiac abnormalities that caused serious adverse effects, including QT prolongation, TdP, and death.6 Additional recommendations to evaluate the pharmacokinetic and pharmacodynamic drug interactions were also added to the labeling.
Related: Reducing Opioid Use for Chronic Pain
Several prospective studies, cross-sectional studies, and retrospective reviews have reported QTc prolongation with methadone.7-14 Many cases of QTc prolongation and TdP have been in patients receiving methadone in large doses (> 100 mg/d); however, incidences have also occurred in those receiving typical doses of methadone for addiction treatment.8,15,16 Multiple studies have demonstrated that methadone-induced QTc prolongation is dose-dependent.8,17-20 In an observational study of 90 subjects who were undergoing methadone maintenance treatment, the subjects taking < 60 mg/d of methadone had a 7.7 msec prolongation of the QTc interval, which was significantly less QTc prolongation than in those receiving 60 mg/d to 109 mg/d (15.6 msec, P < .001) and 110 mg/d to 150 mg/d (17.4 msec, P = .001).21
However, in the current literature there are few studies evaluating the QTc prolonging effects of methadone when used in lower doses for pain, such as those used at the Southern Arizona VA Health Care System (SAVAHCS).8 Given the increased risk of cardiac arrhythmias, it is important to understand the effects of methadone on the QTc interval in a veteran patient population using methadone at lower doses for pain. Understanding this risk can help clinicians develop strategies and protocols for the safe use of methadone.
The purpose of this study was to evaluate the effect of methadone on the QTc interval among patients at SAVAHCS. The primary objective was to determine whether methadone prolongs the QTc interval when used for pain. Secondary outcomes included evaluations of the (1) QTc interval when stratified by the QTc interval obtained while prescribed methadone; (2) effects of low, medium, and high doses of methadone on the QTc interval; (3) effects of the concurrent use of QTc prolonging medications on the QTc interval; and (4) effects of the concurrent use of strong inhibitors of methadone clearance on the QTc interval. It was hypothesized that methadone, when used for pain, causes a significant prolongation of the QTc interval, and methadone-induced QTc prolongation is dose-dependent. It was also hypothesized that the QTc interval will be more prolonged when methadone is used concurrently with other medications with a known or conditional risk of TdP or with medications that are strong inhibitors of methadone clearance.
Methods
Full Institutional Review Board approval was obtained prior to initiating this retrospective pre-post study. This study used the electronic medical records (EMRs) of SAVAHCS from July 1, 2004, to July 31, 2012, to compare the QTc interval of patients on stable doses of methadone with the baseline QTc interval. Patients included were aged 18 to 87 years and dispensed a new prescription for methadone between January 1, 2006, and July 31, 2010. Patients must have been adherent to methadone as defined by a medication possession ratio of ≥ 0.8. Patients without a baseline electrocardiogram (ECG) within the 18 months prior to starting methadone, without at least 1 follow-up ECG 7 days to 2 years after the initial prescription, who had a diagnosis of heart failure, or used an implanted cardiac defibrillator or pacemaker as indicated by ICD-9 codes were excluded.
Information collected from the EMR included demographics (age and gender), the QTc interval before starting methadone (pre-QTc), the first QTc interval recorded while prescribed methadone (post-QTc) at a stable dose (defined as ≥ 7 days without a dose change), methadone total daily dose at the time of the post-QTc, concurrent QTc prolonging medications used at the time of each ECG, time elapsed between pre-QTc and post-QTc, time elapsed between the pre-QTc and initiation of methadone, and time elapsed between starting methadone and the post-QTc. All ECGs were recorded using a 12-lead ECG by the MAC 5500 Resting ECG Analysis System (GE Healthcare), which automatically calculates the QTc interval.
For the primary outcome, the mean pre-QTc and post-QTc were compared. These QTc intervals were further analyzed as secondary outcomes. The mean pre-QTc and post-QTc were compared when stratified by post-QTc of < 450 msec, 450 msec to 499 msec, and ≥ 500 msec. To analyze the dose effect of methadone, the mean pre-QTc and post-QTc were compared when stratified by methadone total daily dose: low (≤ 15 mg/d), medium (16-30 mg/d), and high (> 30 mg/d). Dose ranges were based on typical SAVAHCS prescriptions.
An additional secondary outcome was to determine the effect of the concurrent use of QTc prolonging medications on the QTc interval. The medications the subject was taking at the time of each ECG were reviewed to determine whether any of the medications were listed as Drugs with a risk of Torsades de Pointes or Drugs with a conditional risk of Torsades de Pointes on the CredibleMeds website.22,23 Drugs with a conditional risk of TdP are defined as drugs in which there is evidence that the drug prolongs the QTc interval and has a risk of TdP but only under certain conditions, such as high doses or drug interactions. The mean pre-QTc with and without concurrent use of QTc prolonging medications was compared with the mean post-QTc with QTc prolonging medications in addition to methadone.
Because methadone is extensively metabolized by cytochrome P450 3A4 (CYP3A4), another outcome was to determine the effect of the concurrent use of strong CYP3A4 inhibitors on the QTc interval. The medications the subject was taking at the time of each ECG were reviewed to determine whether any of the medications were listed as strong CYP3A4 inhibitors in The Pharmacist’s Letter/The Prescriber’s Letter.24 The mean pre-QTc with and without the concurrent use of strong CYP3A4 inhibitors was compared with the mean post-QTc with strong CYP3A4 inhibitors in addition to methadone.
Related: Pharmacist-Managed Collaborative Practice for Chronic Stable Angina
The primary and secondary outcomes were compared using a paired t test and descriptive statistics; demographics were analyzed using descriptive statistics. Based on the findings of a previous study, a minimum of 8 patients were needed to meet a power of 0.8 with an alpha 0.05 and a medium effect size when comparing the mean pre-QTc and post-QTc for the primary outcome.25
Results
Of 893 EMRs reviewed, 93 met inclusion criteria (Figure 1). The main reason for exclusion was lack of pre-QTc and/or post-QTc (n = 544). The mean age was 58 years (± 10 years), 92% were male, and the mean daily methadone dose at the time of the post-QTc was 29 mg (5 mg-160 mg) (Table 1). Thirty patients were prescribed ≥ 1 QTc prolonging medication at the time of the pre-QTc, 40 patients were prescribed ≥ 1 QTc prolonging medication at the time of the post-QTc, and 0 patients were prescribed a strong CYP3A4 inhibitor at the time of either QTc. There was an average of 151 days (0-554 days) between the pre-QTc and methadone initiation, 161 days (8-664 days) between methadone initiation and the post-QTc, and 312 days (10-1,003 days) between the pre-QTc and post-QTc.
For the primary outcome, there was no significant increase in the QTc interval when comparing the pre-QTc and post-QTc (432 ± 26 msec vs 436 ± 28 msec, P = .221) (Figure 2). When stratified by post QTc, the group of patients with a post-QTc < 450 msec (n = 66) and the group with a post-QTc of ≥ 500 msec (n = 2) had no significant increase in the QTc interval (427 ± 26 msec vs 422 ± 16 msec and 422 ± 18 msec vs 533 ± 21 msec, respectively; P > .05) (Table 2). For the group of patients with a post-QTc of 450 msec to 499 msec (n = 25), methadone significantly prolonged the QTc interval (447 ± 21 msec vs 465 ± 12 msec, P < .001).
When stratified by methadone daily dose of ≤ 15 mg (n = 45), 16 mg to 30 mg (n = 27), and > 30 mg (n = 21), methadone did not significantly prolong the QTc interval in any group (428 ± 29 msec vs 430 ± 25 msec, 436 ± 16 msec vs 439 ± 21 msec, 437 ± 29 msec vs 446 ± 39 msec, respectively; P > .05) (Table 3). For the group of patients using ≥ 1 QTc prolonging medication at the time of the post-QTc and no QTc prolonging medications at the time of the pre-QTc, the addition of methadone did not significantly increase the QTc interval when compared with the pre-QTc (n = 15; 425 ± 23 msec vs 437 ± 31 msec, respectively; P > .05) (Table 4). For the group of patients prescribed ≥ 1 QTc prolonging medication at the pre-QTc and post-QTc, methadone did not significantly prolong the QTc interval (n = 25; 437 ± 32 msec vs 441 ± 33 msec, respectively; P > .05) (Table 5). No subjects were using strong CYP3A4 inhibitors; therefore, the effect of strong CYP3A4 inhibitors could not be assessed.
Discussion
The results of this study suggest that methadone-induced QTc interval prolongation may not be clearly evident at lower doses when used for pain. There was no significant increase in the QTc interval in the low-, medium-, and high-dose methadone groups, nor when analyzing the drug interactions. However, this study was powered based on the primary outcome, and it is possible that the study was underpowered to detect a difference in these secondary outcomes. When stratified by post-QTc, a significant increase in the QTc interval was noted for the group of patients with a post-QTc of 450 msec to 499 msec. The absolute mean differences between the pre-QTc and post-QTc for most of the secondary outcomes are unlikely to be clinically relevant, with the exception of the high-dose methadone group and the group stratified by post-QTc interval of 450 msec to 499 msec.
These results are supported by a prospective pilot study of 64 subjects with advanced cancer, which evaluated the QTc prolonging effects of methadone when used at lower doses (range 3-90 mg/d, median 23 mg/d).26 Only 1 of 64 subjects developed clinically significant QTc interval prolongation (QTc ≥ 500 msec) at the end of the second week of therapy. The mean QTc interval measured at baseline was 427 msec, which increased to a mean of 430 msec after 2 weeks of methadone use (mean dose 23 mg/d) and decreased thereafter (375 msec at 4 weeks with a mean dose of 15 mg/d and 373 msec at 8 weeks with a mean dose 28 mg/d; no P values reported). Additionally, no significant association was found between methadone dose and the QTc interval (P > .05).
This study evaluated the surrogate endpoint of QTc prolongation and found that 2 patients with a pre-QTc < 500 msec (434 msec and 409 msec) had a post-QTc > 500 msec (518 msec and 547 msec). These subjects were both in the high-dose methadone group receiving 120 mg/d and 60 mg/d of methadone, respectively. It is unclear what confounders were present at the time of the post-QTc.
Related: Using Dashboard Technology to Monitor Overdose
The study did not evaluate clinically relevant outcomes such as TdP or SCD; however, there is evidence that methadone when used within a therapeutic dose range is associated with SCD.27 In a prospective evaluation of SCD, 22 subjects using methadone found with therapeutic blood levels were compared with 106 subjects not using methadone. Most subjects were using methadone for pain control or opioid withdrawal. In 5 subjects (23%) in the methadone group, a cardiac abnormality (eg, coronary artery disease) that could have caused SCD was identified compared with 64 subjects (60%) in the group not using methadone (P = .002).
Limitations
There are several limitations of this study. This retrospective study does not allow for conclusions to be direct cause and effect, and the results relied on the EMR and methadone prescription fill dates to determine adherence to methadone, when methadone was initiated, and methadone daily dose. The exclusion criteria for the diagnosis of heart failure and the use of an implanted pacemaker and/or cardioverter defibrillator depended on the accuracy of the ICD-9 codes.
Also, many factors that affect the QTc interval were not assessed, such as potassium and magnesium levels, alcohol, cocaine, and amphetamine use. In addition, over-the-counter medications and medications obtained outside of SAVAHCS were not assessed. It is possible that any of those factors could be confounding variables. Furthermore, a majority of the subjects were male, and subjects with heart failure and those using an implanted pacemaker and/or cardioverter defibrillator were excluded from the study. In clinical practice, the results of the study cannot be generalized to those excluded patient populations. Additionally, the effect size of QTc prolongation observed was lower than was expected. Therefore, this study may not have been powered adequately to detect smaller differences in QTc prolongation.
Another limitation of the study is the high exclusion rate: about 90%. A majority of the patients were excluded due to the lack of ECG monitoring. The reason for obtaining an ECG was not assessed, and many subjects likely had an ECG obtained incidentally. Due to the high exclusion rate, selection bias may have been introduced into the study. Therefore, the 10% of subjects included in the study may not be representative of veterans using methadone for pain.
Very few studies of the effects of methadone on QTc prolongation in veterans have been published. A retrospective chart review by Fareed and colleagues sought to identify whether patients are at high risk for cardiac arrhythmias by adding an onsite ECG screening at baseline and annually for patients using methadone as part of a methadone maintenance program at the Atlanta VAMC.11 The patients in the study were an average age of 56 years, and 93% were male. The mean daily methadone dose was 90 ± 48 mg/d, and the mean duration of treatment was 38 ± 31 months. The mean QTc interval was significantly longer at the most recent QTc interval while using methadone compared with the baseline QTc interval (442 ± 25 msec vs 417 ± 30 msec, respectively; P < .001). Six percent of patients had a significant prolongation of the QTc interval from baseline to > 500 msec, and 27% had a significant prolongation of the QTc interval from baseline to 450 msec to 500 msec (P < .05).
This study and the study by Fareed and colleagues are similar in that both are retrospective, compare baseline QTc intervals and QTc intervals while using methadone, and include subjects of a similar age and gender. However, the subjects in the Fareed and colleagues study were using methadone for maintenance treatment at higher doses than in the present study. Additionally, the results of the studies differ. Fareed and colleagues found a prolongation of the QTc interval with methadone use. Although the present study has many limitations, it adds additional information to the medical literature regarding the QTc interval of veterans using methadone in lower doses at an average of 29 mg/d.
Conclusion
In this study of veterans using methadone for pain, methadone did not significantly increase the QTc interval. Two patients had a prolonged QTc interval of ≥ 500 msec while taking methadone. The QTc interval did not vary by methadone daily dose, and the concurrent use of QTc prolonging medications together with methadone did not increase the QTc interval. The concurrent use of strong CYP3A4 inhibitors could not be assessed, because none of the patients were on these medications.
Despite these findings, the study had several limitations, and there is a black box warning included in the labeling of methadone regarding QTc interval prolongation, TdP, and death. Therefore, it is advisable to monitor the QTc interval in patients using methadone, even at low doses. In those patients with a prolonged QTc interval and/or risk factors for QTc prolongation, methadone should either be avoided or used cautiously with close monitoring of the QTc interval.
Acknowledgments
This manuscript was prepared and research was conducted with resources and the use of facilities at the Southern Arizona VA Health Care System in Tucson, Arizona.
Author disclosures
The authors report no actual or potential conflicts of interest with regard to this article.
Disclaimer
The opinions expressed herein are those of the authors and do not necessarily reflect those of Federal Practitioner, Frontline Medical Communications Inc., the U.S. Government, or any of its agencies. This article may discuss unlabeled or investigational use of certain drugs. Please review complete prescribing information for specific drugs or drug combinations—including indications, contraindications, warnings, and adverse effects—before administering pharmacologic therapy to patients.
1. Kong MH, Fonarow GC, Peterson ED, et al. Systematic review of the incidence of sudden cardiac death in the United States. J Am Coll Cardiol. 2011;57(7): 794-801.
2. Josephson M, Wellens HJJ. Implantable defibrillators and sudden cardiac death. Circulation. 2004;109(22):2685-2691.
3. International Conference on Harmonisation-Quality. Guidance for Industry: E14 Clinical Evaluation of QT/QTc Interval Prolongation and Proarrhythmic Potential for Non-Antiarrhythmic Drugs. Rockville, MD: U.S. Food and Drug Administration; 2005.
4. Committee for Proprietary Medicinal Products. Points to Consider: The Assessment of the Potential for QT Interval Prolongation by Non-Cardiovascular Medicinal Products. London, UK: The European Agency for the Evaluation of Medicinal Products; 1997.
5. Stringer J, Welsh C, Tommasello A. Methadone-associated Q-T interval prolongation and torsades de pointes. Am J Health Syst Pharm. 2009;66(9):825-833.
6. Information for healthcare professionals: Methadone hydrochloride. U.S. Food and Drug Administration Website. http://www.fda.gov/Drugs/DrugSafety/PostmarketDrugSafetyInformationforPatientsandProviders/ucm142841.htm. Published November 2006. Updated August 23, 2013. Accessed January 9, 2015.
7. Anchersen K, Clausen T, Gossop M, Hansteen V, Waal H. Prevalence and clinical relevance of corrected QT interval prolongation during methadone and buprenorphine treatment: A mortality assessment study. Addiction. 2009;104(6):993-999.
8. Chang KC, Huang CL, Liang HY, et al. Gender-specific differences in susceptibility to low-dose methadone-associated QTc prolongation in patients with heroin dependence. J Cardiovasc Electrophysiol. 2012;23(5):527-533.
9. Cruciani RA, Sekine R, Homel P, et al. Measurement of QTc in patients receiving chronic methadone therapy. J Pain Symptom Manage. 2005;29(4):385-391.
10. Ehret GB, Voide C, Gex-Fabry M, et al. Drug-induced long QT syndrome in injection drug users receiving methadone: High frequency in hospitalized patients and risk factors. Arch Intern Med. 2006;166(12):1280-1287.
11. Fareed A, Vayalapalli S, Byrd-Sellers J, et al. Onsite QTc interval screening for patients in methadone maintenance treatment. J Addict Dis. 2010;29(1):15-22.
12. Fanoe S, Hvidt C, Ege P, Jensen GB. Syncope and QT prolongation among patients treated with methadone for heroin dependence in the city of Copenhagen. Heart. 2007;93(9):1051-1055.
13. Peles E, Bodner G, Kreek MJ, Rados V, Adelson M. Corrected-QT intervals as related to methadone dose and serum level in methadone maintenance treatment (MMT) patients: A cross-sectional study. Addiction. 2007;102(2):289-300.
14. Wedam EF, Bigelow GE, Johnson RE, Nuzzo PA, Haigney MC. QT-interval effects of methadone, levomethadyl, and buprenorphine in a randomized trial. Arch Intern Med. 2007;167(22):2469-2475.
15. DOLOPHINE [package insert]. Columbus, OH: Roxane Laboratories, Inc; 2012.
16. Krantz MJ, Martin J, Stimmel B, Mehta D, Haigney MC. QTc interval screening in methadone treatment. Ann Intern Med. 2009;150(6):387-395.
17. Krantz MJ, Kutinsky IB, Robertson AD, Mehler PS. Dose-related effects of methadone on QT prolongation in a series of patients with torsade de pointes. Pharmacotherapy. 2003;23(6):802-805.
18. Castro VM, Clements CC, Murphy SN, et al. QT interval and antidepressant use: A cross sectional study of electronic health records. BMJ. 2013;346:f288.
19. Florian J, Garnett CE, Nallani SC, Rappaport BA, Throckmorton DC. A modeling and simulation approach to characterize methadone QT prolongation using pooled data from five clinical trials in MMT patients. Clin Pharmacol Ther. 2012;91(4):666-672.
20. Fonseca F, Marti-Almor J, Pastor A, et al. Prevalence of long QTc interval in methadone maintenance patients. Drug Alcohol Depend. 2009;99(1-3):327-332.
21. Gheshlaghi F, Izadi-Mood N, Mardani A, Piri-Ardekani MR. Dose-dependent effects of methadone on the QT interval in patients under methadone maintenance treatment. Asia Pacific J Med Toxicol. 2013;2(1):6-9.
22. Drugs with a known risk of Torsades de Pointes. CredibleMeds Website. https://www.crediblemeds.org/new-drug-list. Updated January 14, 2015. Accessed January 14, 2015.
23. Drugs with a conditional risk of Torsades de Pointes. CredibleMeds Website. https://www.crediblemeds.org/new-drug-list. Updated January 14, 2015. Accessed January 14, 2015.
24. Cytochrome P450 drug interactions [full update October 2009]. Pharmacist’s Letter/Prescribers Letter. 2006;22(2):220233.
25. Huh B, Park CH. Retrospective analysis of low-dose methadone and QTc prolongation in chronic pain patients. Korean J Anesthesiol. 2010;58(4):338-343.
26. Reddy S, Hui D, El Osta B, et al. The effect of oral methadone on the QTc interval in advanced cancer patients: A prospective pilot study. J Palliat Med. 2010;13(1):33-38.
27. Chugh SS, Socoteanu C, Reinier K, Waltz J, Jui J, Gunson K. A community-based evaluation of sudden death associated with therapeutic levels of methadone. Am J Med. 2008;121(1):66-71.
Using Light to Manage Sleep-Wake Issues in Patients With Dementia
Care of patients with dementia requires dynamic, creative approaches. Given the high incidence of sleep-wake disturbances in this population and the concomitant caregiver stress and institutionalization, researchers at the Geriatric Research Education and Clinical Center (GRECC) at the Louis Stokes Cleveland (LSC) VAMC in Ohio are exploring light as a nonpharmacologic intervention to improve sleep-wake activity in veterans with dementia.1
Light has a powerful physiologic effect on human circadian rhythms, and those who live in northern latitudes or spend long periods inside buildings often have limited exposure to dramatic light-dark differences required for circadian entrainment to the solar day. This article is intended to give a brief overview of the relationship between light and human health and describe initial pilot studies in improving rest-activity patterns through lighting.
Light and the Aging Eye
Light is received at the back of the eye and absorbed by retinal cells, rods, and cones and by intrinsically photosensitive retinal ganglion cells that are specialized circadian light receptors. These specialized receptors respond most strongly to short-wavelength (blue) light. Nerve pathways lead from the retina to the suprachiasmatic nucleus, the circadian pacemaker, influencing the secretion and suppression of biomarkers, such as melatonin, cortisol, and hypocretin.2 Many hormonal systems, including the steroid axis, key on this 24-hour cycle that seems to be partially timed via the hormone melatonin.
Serum melatonin signals darkness and nighttime to the body. It rises in the early evening, peaks in the middle of the night, and is low during the daytime hours. Light exposure at night can suppress melatonin, which can in turn alter the timing of circadian rhythm peaks and troughs.
Related: Development and Evaluation of a Geriatric Mood Management Program
Normal aging of the eye can include good acuity. Most older adults retain 20/25 or better vision in 1 eye into their 70s and 80s. However, changes in the anatomy of the eye due to aging can reduce contrast sensitivity, color vision, and visual fields. Reduction of light to the retina due to these normal physiologic changes can impair the response to circadian light. By the eighth and ninth decades of life, the amount of circadian activating light reaching the retina is one-tenth that for a 10 year old; thus, brighter white light or more short-wavelength light is needed.3
In addition to the anatomic changes in the eye, a muted 24-hour light exposure pattern contributes to circadian disruption in older adults. For those with dementia, the circadian disruption is manifested in rest-activity disorders, such as sundowning and day-night disorientation. Yet patients with dementia residing at home or in nursing homes routinely are exposed to subdued light patterns. For example, according to the results of a study, nursing home residents in San Diego, California, had a median of 10.5 min/d of exposure to bright light (> 1,000 lux) and median illuminance was 52 lux during daylight hours.4
How can light levels be changed to make them optimal or even sufficient for health? The researchers considered this question when opting to study light and its possible effects on older patients with dementia.
Lighting interventions in nursing homes may be effective. For example, 2 hours of bright light exposure in the morning improved sleep efficiency (number of minutes sleeping divided by number of minutes in bed).5 Furthermore, 30 minutes of sunlight per day has been shown to reduce daytime napping.6 In an investigation of long-term exposure to bright light, participants in the experimental group had less than the expected decline of their Mini-Mental State Examination scores across 3.5 years, improved depression scores, and less functional decline in their activities of daily living.7 Thus, lighting may have therapeutic effects for institutionalized patients with dementia, particularly if there is prolonged exposure.
Although increasing light levels improves rest-activity patterns in those with dementia, implementation and adherence is a challenge due to discomfort and glare, difficulty maintaining the level of light exposure due to a person’s activity, and/or energy codes that restrict power consumption in nursing homes. Although many human studies have used mixed spectrum light at high light levels, evidence suggests that the circadian system is maximally sensitive to shorter wavelength blue light.8 Therefore, short-wavelength blue light can achieve the same clinical outcomes while using lower illuminations and obviating many of the issues with bright lights.
Dayroom Transformation
In “light” of this background, the LSC VAMC GRECC engaged in a transformation of a community living center (CLC) dayroom to introduce circadian lighting, determine its acceptance to patients and staff, and measure rest-activity measurements for 3 residents. The CLC ward specializes in the care of veterans with dementia and had recently undergone a cultural transformation into a neighborhood system with many activities still centered on the dayroom/dining room. Based on the research of colleagues at the Lighting Research Center (LRC) at Rensselaer Polytechnic Institute (RPI) in Troy, New York, scientists at General Electric (GE) Lighting division in Cleveland developed fluorescent lamps emitting light in the short-wavelength portion of the visible spectrum (lamps with correlated color temperature [CCT] of 14,000 kelvin [K]; typical commercial use lamps have a CCT of 3,000-5,000 K).
Related: Home-Based Videotelehealth for Veterans With Dementia
The 14,000 K lamp, which was perceived as bluish-white or “blue sky” light, was chosen for installation. According to the model of human circadian phototransduction (the process in which the retina converts light signals into neural signals for the circadian system), the 14,000 K lamp can affect the circadian system at light levels much lower than those used in previously published studies (400-500 lux compared with > 2,500 lux).9 Changes in lamp spectrum and total irradiance emitted offered an 8-fold increase in circadian stimulation over the existing lighting. The LSC Human Subjects Review Board approved the project.
Measurements in the CLC ward indicated that existing lighting in the halls and rooms was dim—between 75 lux and 100 lux. Although this level was similar to those reported in the literature and satisfactory for reading and general activities, it likely was not sufficient to stimulate residents’ circadian systems.4 The dayroom was selected for lamp installation, because it was used for dining and many daily activities, thus maximizing the number of veterans who could benefit from exposure to the new type of lighting.
The dayroom was large, 35 feet by 40 feet, and had windows on 3 sides. Illumination came from the windows, which had blinds and/or window air conditioning units, and 13 ceiling fluorescent light fixtures, each with 4 lamps. Using multiple light meter measurements, 14,000 K lamps were installed in 7 of 13 light fixtures to minimize significant engineering changes while maximizing the illumination.

The Table shows the illumination in lux in the dayroom with and without the 14,000 K lighting. Horizontal light levels, 3 feet above the floor and measured in a horizontal direction, increased from between 300 lux and 350 lux to 500 lux. The lamps added more light and contrast while not increasing glare or causing excessive brightness.
Five veterans with dementia consented (with family members involved), but due to actigraph malfunction, only 3 of the 5 participants completed the 2 data collection periods: 7 continuous days of rest/activity measurements under the regular ward lighting and experimental lighting plan with a 3-week adaptation period in between. Results were generally in the expected direction after exposure to new lighting: Sleep latency (time in bed until the first 20 minutes of sleep) improved, decreasing by 23%, and sleep efficiency increased by 6.6%. The new lighting was well received; there were no reports about heat or glare, and the staff frequently commented that the room looked as though it was in reflected sunlight. A new CLC building was subsequently built with excellent window access and lighting. Therefore, the lighting project was moved to the home of a test subject.
Home Lighting Projects
In a feasibility pilot, the light exposure and rest activity of an older veteran with dementia and his spouse was measured in their home.10,11 Neither were exposed to light > 400 lux for much of the 7 continuous days of measurement, and the majority of their waking hours was spent in light < 100 lux (insufficient for reading). Actigraphy data indicated fragmented nighttime sleep for both participants with the caregiver sleeping much less than the veteran.
Related: New Guidelines on Concussion and Sleep Disturbance
This pilot suggested that appropriate circadian lighting in the home could positively influence circadian sleep-wake cycles. Therefore, in collaboration with colleagues at the LRC at RPI and GE, the authors initiated a study funded by the National Institute on Aging (PI: Figueiro M) to install home lighting customized to the rooms used most during the day by veterans with dementia. In phase 1, the results showed that circadian disruption in those with dementia in winter months was significantly higher than in the summer months and that healthy older adults received more circadian light and were less disrupted than those with dementia.12 Phase 2 of the study, which is a pretest/posttest control group intervention of circadian lighting, is ongoing.
Conclusion
The research has not yet provided a definitive answer about whether circadian-active light can improve circadian synchrony and thereby benefit patients with dementia and their caregivers. Work in this area is translational and ongoing: The issues of dosing, timing, and delivery are still open questions for further research. The next steps related to testing light delivery and dose could include tailoring the daytime lighting in day care centers with blue lighting and/or testing the use of blue light goggles.
Acknowledgements
The work discussed in this paper was funded in part by the Cleveland VISN 10 GRECC and the National Institute on Aging (grant # R01AG034157; Figueiro PI). GE Lighting, Cleveland, OH, USA donated the lamps used in the study.
Author disclosures
The authors report no actual or potential conflicts of interest with regard to this article.
Disclaimer
The opinions expressed herein are those of the authors and do not necessarily reflect those of Federal Practitioner, Frontline Medical Communications Inc., the U.S. Government, or any of its agencies. This article may discuss unlabeled or investigational use of certain drugs. Please review the complete prescribing information for specific drugs or drug combinations—including indications, contraindications, warnings, and adverse effects—before administering pharmacologic therapy to patients.
1. Vitiello MV, Borson S. Sleep disturbances in patients with Alzheimer’s disease: Epidemiology, pathophysiology and treatment. CNS Drugs. 2001;15(10):777-796.
2. Slats D, Claassen JA, Verbeek MM, Overeem S. Reciprocal interactions between sleep, circadian rhythms and Alzheimer’s disease: Focus on the role of hypocretin and melatonin. Ageing Res Rev. 2013;12(1):188-200.
3. Turner PL, Mainster MA. Circadian photoreception: Ageing and the eye’s important role in systemic health. Br J Ophthalmol. 2008;92(11):1439-1444.
4. Shochat T, Martin J, Marler M, Ancoli-Israel S. Illumination levels in nursing home patients: Effects on sleep and activity rhythms. J Sleep Res. 2000;9(4):373-379.
5. Fetveit A, Skjerve A, Bjorvatn B. Bright light treatment improves sleep in institutionalised elderly—an open trial. Int J Geriatr Psychiatry. 2003;18(6):520-526.
6. Alessi CA, Martin JL, Webber AP, Cynthia Kim E, Harker JO, Josephson KR. Randomized, controlled trial of a nonpharmacological intervention to improve abnormal sleep/wake patterns in nursing home residents. J Am Geriatr Soc. 2005;53(5):803-810.
7. Riemersma-van der Lek RF, Swaab DF, Twisk J, Hol EM, Hoogendijk WJ, Van Someren EJ. Effect of bright light and melatonin on cognitive and noncognitive function in elderly residents of group care facilities: A randomized controlled trial. JAMA. 2008;299(22):2642-2655.
8. Berson DM, Dunn FA, Takao M. Phototransduction by retinal ganglion cells that set the circadian clock. Science. 2002;295(5557):1070-1073.
9. Rea MS, Figueiro MG, Bullough JD, Bierman A. A model of phototransduction by the human circadian system. Brain Res Brain Res Rev. 2005;50(2):213-228.
10. Bierman A, Klein TR, Rea MS. The Daysimeter: A device for measuring optical radiation as a stimulus for the human circadian system. Meas Sci Technol. 2005;16(11):2292-2299.
11. Higgins PA, Hornick TR, Figueiro MG. Rest-activity and light exposure patterns in the home setting: A methodological case study. Am J Alzheimers Dis Other Demen. 2010;25(4):353-361.
12. Figueiro MG, Hamner R, Higgins P, Hornick T, Rea MS. Field measurements of light exposures and circadian disruption in two populations of older adults. J Alzheimers Dis. 2012;31(4):711-715.
Care of patients with dementia requires dynamic, creative approaches. Given the high incidence of sleep-wake disturbances in this population and the concomitant caregiver stress and institutionalization, researchers at the Geriatric Research Education and Clinical Center (GRECC) at the Louis Stokes Cleveland (LSC) VAMC in Ohio are exploring light as a nonpharmacologic intervention to improve sleep-wake activity in veterans with dementia.1
Light has a powerful physiologic effect on human circadian rhythms, and those who live in northern latitudes or spend long periods inside buildings often have limited exposure to dramatic light-dark differences required for circadian entrainment to the solar day. This article is intended to give a brief overview of the relationship between light and human health and describe initial pilot studies in improving rest-activity patterns through lighting.
Light and the Aging Eye
Light is received at the back of the eye and absorbed by retinal cells, rods, and cones and by intrinsically photosensitive retinal ganglion cells that are specialized circadian light receptors. These specialized receptors respond most strongly to short-wavelength (blue) light. Nerve pathways lead from the retina to the suprachiasmatic nucleus, the circadian pacemaker, influencing the secretion and suppression of biomarkers, such as melatonin, cortisol, and hypocretin.2 Many hormonal systems, including the steroid axis, key on this 24-hour cycle that seems to be partially timed via the hormone melatonin.
Serum melatonin signals darkness and nighttime to the body. It rises in the early evening, peaks in the middle of the night, and is low during the daytime hours. Light exposure at night can suppress melatonin, which can in turn alter the timing of circadian rhythm peaks and troughs.
Related: Development and Evaluation of a Geriatric Mood Management Program
Normal aging of the eye can include good acuity. Most older adults retain 20/25 or better vision in 1 eye into their 70s and 80s. However, changes in the anatomy of the eye due to aging can reduce contrast sensitivity, color vision, and visual fields. Reduction of light to the retina due to these normal physiologic changes can impair the response to circadian light. By the eighth and ninth decades of life, the amount of circadian activating light reaching the retina is one-tenth that for a 10 year old; thus, brighter white light or more short-wavelength light is needed.3
In addition to the anatomic changes in the eye, a muted 24-hour light exposure pattern contributes to circadian disruption in older adults. For those with dementia, the circadian disruption is manifested in rest-activity disorders, such as sundowning and day-night disorientation. Yet patients with dementia residing at home or in nursing homes routinely are exposed to subdued light patterns. For example, according to the results of a study, nursing home residents in San Diego, California, had a median of 10.5 min/d of exposure to bright light (> 1,000 lux) and median illuminance was 52 lux during daylight hours.4
How can light levels be changed to make them optimal or even sufficient for health? The researchers considered this question when opting to study light and its possible effects on older patients with dementia.
Lighting interventions in nursing homes may be effective. For example, 2 hours of bright light exposure in the morning improved sleep efficiency (number of minutes sleeping divided by number of minutes in bed).5 Furthermore, 30 minutes of sunlight per day has been shown to reduce daytime napping.6 In an investigation of long-term exposure to bright light, participants in the experimental group had less than the expected decline of their Mini-Mental State Examination scores across 3.5 years, improved depression scores, and less functional decline in their activities of daily living.7 Thus, lighting may have therapeutic effects for institutionalized patients with dementia, particularly if there is prolonged exposure.
Although increasing light levels improves rest-activity patterns in those with dementia, implementation and adherence is a challenge due to discomfort and glare, difficulty maintaining the level of light exposure due to a person’s activity, and/or energy codes that restrict power consumption in nursing homes. Although many human studies have used mixed spectrum light at high light levels, evidence suggests that the circadian system is maximally sensitive to shorter wavelength blue light.8 Therefore, short-wavelength blue light can achieve the same clinical outcomes while using lower illuminations and obviating many of the issues with bright lights.
Dayroom Transformation
In “light” of this background, the LSC VAMC GRECC engaged in a transformation of a community living center (CLC) dayroom to introduce circadian lighting, determine its acceptance to patients and staff, and measure rest-activity measurements for 3 residents. The CLC ward specializes in the care of veterans with dementia and had recently undergone a cultural transformation into a neighborhood system with many activities still centered on the dayroom/dining room. Based on the research of colleagues at the Lighting Research Center (LRC) at Rensselaer Polytechnic Institute (RPI) in Troy, New York, scientists at General Electric (GE) Lighting division in Cleveland developed fluorescent lamps emitting light in the short-wavelength portion of the visible spectrum (lamps with correlated color temperature [CCT] of 14,000 kelvin [K]; typical commercial use lamps have a CCT of 3,000-5,000 K).
Related: Home-Based Videotelehealth for Veterans With Dementia
The 14,000 K lamp, which was perceived as bluish-white or “blue sky” light, was chosen for installation. According to the model of human circadian phototransduction (the process in which the retina converts light signals into neural signals for the circadian system), the 14,000 K lamp can affect the circadian system at light levels much lower than those used in previously published studies (400-500 lux compared with > 2,500 lux).9 Changes in lamp spectrum and total irradiance emitted offered an 8-fold increase in circadian stimulation over the existing lighting. The LSC Human Subjects Review Board approved the project.
Measurements in the CLC ward indicated that existing lighting in the halls and rooms was dim—between 75 lux and 100 lux. Although this level was similar to those reported in the literature and satisfactory for reading and general activities, it likely was not sufficient to stimulate residents’ circadian systems.4 The dayroom was selected for lamp installation, because it was used for dining and many daily activities, thus maximizing the number of veterans who could benefit from exposure to the new type of lighting.
The dayroom was large, 35 feet by 40 feet, and had windows on 3 sides. Illumination came from the windows, which had blinds and/or window air conditioning units, and 13 ceiling fluorescent light fixtures, each with 4 lamps. Using multiple light meter measurements, 14,000 K lamps were installed in 7 of 13 light fixtures to minimize significant engineering changes while maximizing the illumination.
The Table shows the illumination in lux in the dayroom with and without the 14,000 K lighting. Horizontal light levels, 3 feet above the floor and measured in a horizontal direction, increased from between 300 lux and 350 lux to 500 lux. The lamps added more light and contrast while not increasing glare or causing excessive brightness.
Five veterans with dementia consented (with family members involved), but due to actigraph malfunction, only 3 of the 5 participants completed the 2 data collection periods: 7 continuous days of rest/activity measurements under the regular ward lighting and experimental lighting plan with a 3-week adaptation period in between. Results were generally in the expected direction after exposure to new lighting: Sleep latency (time in bed until the first 20 minutes of sleep) improved, decreasing by 23%, and sleep efficiency increased by 6.6%. The new lighting was well received; there were no reports about heat or glare, and the staff frequently commented that the room looked as though it was in reflected sunlight. A new CLC building was subsequently built with excellent window access and lighting. Therefore, the lighting project was moved to the home of a test subject.
Home Lighting Projects
In a feasibility pilot, the light exposure and rest activity of an older veteran with dementia and his spouse was measured in their home.10,11 Neither were exposed to light > 400 lux for much of the 7 continuous days of measurement, and the majority of their waking hours was spent in light < 100 lux (insufficient for reading). Actigraphy data indicated fragmented nighttime sleep for both participants with the caregiver sleeping much less than the veteran.
Related: New Guidelines on Concussion and Sleep Disturbance
This pilot suggested that appropriate circadian lighting in the home could positively influence circadian sleep-wake cycles. Therefore, in collaboration with colleagues at the LRC at RPI and GE, the authors initiated a study funded by the National Institute on Aging (PI: Figueiro M) to install home lighting customized to the rooms used most during the day by veterans with dementia. In phase 1, the results showed that circadian disruption in those with dementia in winter months was significantly higher than in the summer months and that healthy older adults received more circadian light and were less disrupted than those with dementia.12 Phase 2 of the study, which is a pretest/posttest control group intervention of circadian lighting, is ongoing.
Conclusion
The research has not yet provided a definitive answer about whether circadian-active light can improve circadian synchrony and thereby benefit patients with dementia and their caregivers. Work in this area is translational and ongoing: The issues of dosing, timing, and delivery are still open questions for further research. The next steps related to testing light delivery and dose could include tailoring the daytime lighting in day care centers with blue lighting and/or testing the use of blue light goggles.
Acknowledgements
The work discussed in this paper was funded in part by the Cleveland VISN 10 GRECC and the National Institute on Aging (grant # R01AG034157; Figueiro PI). GE Lighting, Cleveland, OH, USA donated the lamps used in the study.
Author disclosures
The authors report no actual or potential conflicts of interest with regard to this article.
Disclaimer
The opinions expressed herein are those of the authors and do not necessarily reflect those of Federal Practitioner, Frontline Medical Communications Inc., the U.S. Government, or any of its agencies. This article may discuss unlabeled or investigational use of certain drugs. Please review the complete prescribing information for specific drugs or drug combinations—including indications, contraindications, warnings, and adverse effects—before administering pharmacologic therapy to patients.
1. Vitiello MV, Borson S. Sleep disturbances in patients with Alzheimer’s disease: Epidemiology, pathophysiology and treatment. CNS Drugs. 2001;15(10):777-796.
2. Slats D, Claassen JA, Verbeek MM, Overeem S. Reciprocal interactions between sleep, circadian rhythms and Alzheimer’s disease: Focus on the role of hypocretin and melatonin. Ageing Res Rev. 2013;12(1):188-200.
3. Turner PL, Mainster MA. Circadian photoreception: Ageing and the eye’s important role in systemic health. Br J Ophthalmol. 2008;92(11):1439-1444.
4. Shochat T, Martin J, Marler M, Ancoli-Israel S. Illumination levels in nursing home patients: Effects on sleep and activity rhythms. J Sleep Res. 2000;9(4):373-379.
5. Fetveit A, Skjerve A, Bjorvatn B. Bright light treatment improves sleep in institutionalised elderly—an open trial. Int J Geriatr Psychiatry. 2003;18(6):520-526.
6. Alessi CA, Martin JL, Webber AP, Cynthia Kim E, Harker JO, Josephson KR. Randomized, controlled trial of a nonpharmacological intervention to improve abnormal sleep/wake patterns in nursing home residents. J Am Geriatr Soc. 2005;53(5):803-810.
7. Riemersma-van der Lek RF, Swaab DF, Twisk J, Hol EM, Hoogendijk WJ, Van Someren EJ. Effect of bright light and melatonin on cognitive and noncognitive function in elderly residents of group care facilities: A randomized controlled trial. JAMA. 2008;299(22):2642-2655.
8. Berson DM, Dunn FA, Takao M. Phototransduction by retinal ganglion cells that set the circadian clock. Science. 2002;295(5557):1070-1073.
9. Rea MS, Figueiro MG, Bullough JD, Bierman A. A model of phototransduction by the human circadian system. Brain Res Brain Res Rev. 2005;50(2):213-228.
10. Bierman A, Klein TR, Rea MS. The Daysimeter: A device for measuring optical radiation as a stimulus for the human circadian system. Meas Sci Technol. 2005;16(11):2292-2299.
11. Higgins PA, Hornick TR, Figueiro MG. Rest-activity and light exposure patterns in the home setting: A methodological case study. Am J Alzheimers Dis Other Demen. 2010;25(4):353-361.
12. Figueiro MG, Hamner R, Higgins P, Hornick T, Rea MS. Field measurements of light exposures and circadian disruption in two populations of older adults. J Alzheimers Dis. 2012;31(4):711-715.
Febrile Infant CPGs
Febrile young infants are at high risk for serious bacterial infection (SBI) with reported rates of 8.5% to 12%, even higher in neonates 28 days of age.[1, 2, 3] As a result, febrile infants often undergo extensive diagnostic evaluation consisting of a combination of urine, blood, and cerebrospinal fluid (CSF) testing.[4, 5, 6] Several clinical prediction algorithms use this diagnostic testing to identify febrile infants at low risk for SBI, but they differ with respect to age range, recommended testing, antibiotic administration, and threshold for hospitalization.[4, 5, 6] Additionally, the optimal management strategy for this population has not been defined.[7] Consequently, laboratory testing, antibiotic use, and hospitalization for febrile young infants vary widely among hospitals.[8, 9, 10]
Clinical practice guidelines (CPGs) are designed to implement evidence‐based care and reduce practice variability, with the goal of improving quality of care and optimizing costs.[11] Implementation of a CPG for management of febrile young infants in the Intermountain Healthcare System was associated with greater adherence to evidence‐based care and lower costs.[12] However, when strong evidence is lacking, different interpretations of febrile infant risk classification incorporated into local CPGs may be a major driver of the across‐hospital practice variation observed in prior studies.[8, 9] Understanding sources of variability as well as determining the association of CPGs with clinicians' practice patterns can help identify quality improvement opportunities, either through national benchmarking or local efforts.
Our primary objectives were to compare (1) recommendations of pediatric emergency departmentbased institutional CPGs for febrile young infants and (2) rates of urine, blood, CSF testing, hospitalization, and ceftriaxone use at emergency department (ED) discharge based upon CPG presence and the specific CPG recommendations. Our secondary objectives were to describe the association of CPGs with healthcare costs and return visits for SBI.
METHODS
Study Design
We used the Pediatric Health Information System (PHIS) to identify febrile infants 56 days of age who presented to the ED between January 1, 2013 and December 31, 2013. We also surveyed ED providers at participating PHIS hospitals. Informed consent was obtained from survey respondents. The institutional review board at Boston Children's Hospital approved the study protocol.
Clinical Practice Guideline Survey
We sent an electronic survey to medical directors or division directors at 37 pediatric EDs to determine whether their ED utilized a CPG for the management of the febrile young infant in 2013. If no response was received after the second attempt, we queried ED fellowship directors or other ED attending physicians at nonresponding hospitals. Survey items included the presence of a febrile young infant CPG, and if present, the year of implementation, ages targeted, and CPG content. As applicable, respondents were asked to share their CPG and/or provide the specific CPG recommendations.
We collected and managed survey data using the Research Electronic Data Capture (REDCap) electronic data capture tools hosted at Boston Children's Hospital. REDCap is a secure, Web‐based application designed to support data capture for research studies.[13]
Data Source
The PHIS database contains administrative data from 44 US children's hospitals. These hospitals, affiliated with the Children's Hospital Association, represent 85% of freestanding US children's hospitals.[14] Encrypted patient identifiers permit tracking of patients across encounters.[15] Data quality and integrity are assured jointly by the Children's Hospital Association and participating hospitals.[16] For this study, 7 hospitals were excluded due to incomplete ED data or known data‐quality issues.[17]
Patients
We identified study infants using the following International Classification of Diseases, 9th Revision (ICD‐9) admission or discharge diagnosis codes for fever as defined previously[8, 9]: 780.6, 778.4, 780.60, or 780.61. We excluded infants with a complex chronic condition[18] and those transferred from another institution, as these infants may warrant a nonstandard evaluation and/or may have incomplete data. For infants with >1 ED visit for fever during the study period, repeat visits within 3 days of an index visit were considered a revisit for the same episode of illness; visits >3 days following an index visit were considered as a new index visit.
Study Definitions
From the PHIS database, we abstracted demographic characteristics (gender, race/ethnicity), insurance status, and region where the hospital was located (using US Census categories[19]). Billing codes were used to assess whether urine, blood, and CSF testing (as defined previously[9]) were performed during the ED evaluation. To account for ED visits that spanned the midnight hour, for hospitalized patients we considered any testing or treatment occurring on the initial or second hospital day to be performed in the ED; billing code data in PHIS are based upon calendar day and do not distinguish testing performed in the ED versus inpatient setting.[8, 9] Patients billed for observation care were classified as being hospitalized.[20, 21]
We identified the presence of an SBI using ICD‐9 diagnosis codes for the following infections as described previously[9]: urinary tract infection or pyelonephritis,[22] bacteremia or sepsis, bacterial meningitis,[16] pneumonia,[23] or bacterial enteritis. To assess return visits for SBI that required inpatient management, we defined an ED revisit for an SBI as a return visit within 3 days of ED discharge[24, 25] that resulted in hospitalization with an associated ICD‐9 discharge diagnosis code for an SBI.
Hospitals charges in PHIS database were adjusted for hospital location by using the Centers for Medicare and Medicaid Services price/wage index. Costs were estimated by applying hospital‐level cost‐to‐charge ratios to charge data.[26]
Measured Exposures
The primary exposure was the presence of an ED‐based CPG for management of the febrile young infant aged 28 days and 29 to 56 days; 56 days was used as the upper age limit as all of the CPGs included infants up to this age or beyond. Six institutions utilized CPGs with different thresholds to define the age categories (eg, dichotomized at 27 or 30 days); these CPGs were classified into the aforementioned age groups to permit comparisons across standardized age groups. We classified institutions based on the presence of a CPG. To assess differences in the application of low‐risk criteria, the CPGs were further classified a priori based upon specific recommendations around laboratory testing and hospitalization, as well as ceftriaxone use for infants aged 29 to 56 days discharged from the ED. CPGs were categorized based upon whether testing, hospitalization, and ceftriaxone use were: (1) recommended for all patients, (2) recommended only if patients were classified as high risk (absence of low‐risk criteria), (3) recommended against, or (4) recommended to consider at clinician discretion.
Outcome Measures
Measured outcomes were performance of urine, blood, CSF testing, and hospitalization rate, as well as rate of ceftriaxone use for discharged infants aged 29 to 56 days, 3‐day revisits for SBI, and costs per visit, which included hospitalization costs for admitted patients.
Data Analysis
We described continuous variables using median and interquartile range or range values and categorical variables using frequencies. We compared medians using Wilcoxon rank sum and categorical variables using a [2] test. We compared rates of testing, hospitalization, ceftriaxone use, and 3‐day revisits for SBI based on the presence of a CPG, and when present, the specific CPG recommendations. Costs per visit were compared between institutions with and without CPGs and assessed separately for admitted and discharged patients. To adjust for potential confounders and clustering of patients within hospitals, we used generalized estimating equations with logistic regression to generate adjusted odd ratios (aORs) and 95% confidence intervals (CIs). Models were adjusted for geographic region, payer, race, and gender. Statistical analyses were performed by using SAS version 9.3 (SAS Institute, Cary, NC). We determined statistical significance as a 2‐tailed P value <0.05.
Febrile infants with bronchiolitis or a history of prematurity may be managed differently from full‐term febrile young infants without bronchiolitis.[6, 27] Therefore, we performed a subgroup analysis after exclusion of infants with an ICD‐9 discharge diagnosis code for bronchiolitis (466.11 and 466.19)[28] or prematurity (765).
Because our study included ED encounters in 2013, we repeated our analyses after exclusion of hospitals with CPGs implemented during the 2013 calendar year.
RESULTS
CPG by Institution
Thirty‐three (89.2%) of the 37 EDs surveyed completed the questionnaire. Overall, 21 (63.6%) of the 33 EDs had a CPG; 15 (45.5%) had a CPG for all infants 56 days of age, 5 (15.2%) had a CPG for infants 28 days only, and 1 (3.0%) had a CPG for infants 29 to 56 days but not 28 days of age (Figure 1). Seventeen EDs had an established CPG prior to 2013, and 4 hospitals implemented a CPG during the 2013 calendar year, 2 with CPGs for neonates 28 days and 2 with CPGs for both 28 days and 29 to 56 days of age. Hospitals with CPGs were more likely to be located in the Northeast and West regions of the United States and provide care to a higher proportion of non‐Hispanic white patients, as well as those with commercial insurance (Table 1).
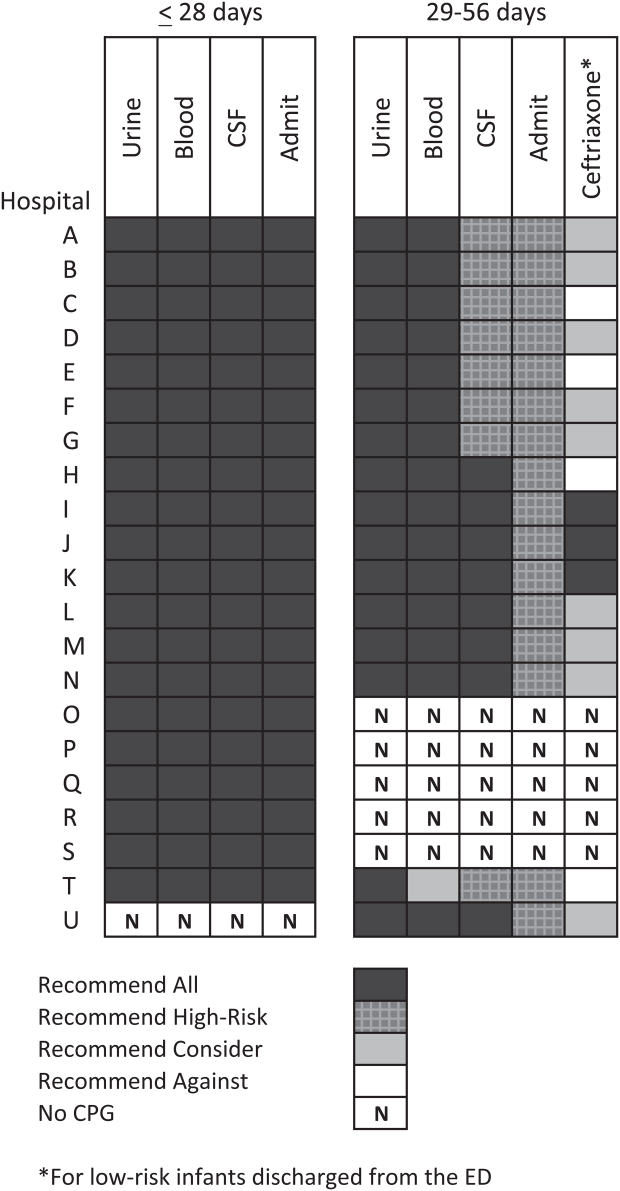
| Characteristic | 28 Days | 2956 Days | ||||
|---|---|---|---|---|---|---|
| No CPG, n=996, N (%) | CPG, n=2,149, N (%) | P Value | No CPG, n=2,460, N (%) | CPG, n=3,772, N (%) | P Value | |
| ||||||
| Race | ||||||
| Non‐Hispanic white | 325 (32.6) | 996 (46.3) | 867 (35.2) | 1,728 (45.8) | ||
| Non‐Hispanic black | 248 (24.9) | 381 (17.7) | 593 (24.1) | 670 (17.8) | ||
| Hispanic | 243 (24.4) | 531 (24.7) | 655 (26.6) | 986 (26.1) | ||
| Asian | 28 (2.8) | 78 (3.6) | 40 (1.6) | 122 (3.2) | ||
| Other Race | 152 (15.3) | 163 (7.6) | <0.001 | 305 (12.4) | 266 (7.1) | <0.001 |
| Gender | ||||||
| Female | 435 (43.7) | 926 (43.1) | 0.76 | 1,067 (43.4) | 1,714 (45.4) | 0.22 |
| Payer | ||||||
| Commercial | 243 (24.4) | 738 (34.3) | 554 (22.5) | 1,202 (31.9) | ||
| Government | 664 (66.7) | 1,269 (59.1) | 1,798 (73.1) | 2,342 (62.1) | ||
| Other payer | 89 (8.9) | 142 (6.6) | <0.001 | 108 (4.4) | 228 (6.0) | <0.001 |
| Region | ||||||
| Northeast | 39 (3.9) | 245 (11.4) | 77 (3.1) | 572 (15.2) | ||
| South | 648 (65.1) | 915 (42.6) | 1,662 (67.6) | 1,462 (38.8) | ||
| Midwest | 271 (27.2) | 462 (21.5) | 506 (20.6) | 851 (22.6) | ||
| West | 38 (3.8) | 527 (24.5) | <0.001 | 215 (8.7) | 887 (23.5) | <0.001 |
| Serious bacterial infection | ||||||
| Overall* | 131 (13.2) | 242 (11.3) | 0.14 | 191 (7.8) | 237 (6.3) | 0.03 |
| UTI/pyelonephritis | 73 (7.3) | 153 (7.1) | 103 (4.2) | 154 (4.1) | ||
| Bacteremia/sepsis | 56 (5.6) | 91 (4.2) | 78 (3.2) | 61 (1.6) | ||
| Bacterial meningitis | 15 (1.5) | 15 (0.7) | 4 (0.2) | 14 (0.4) | ||
| Age, d, median (IQR) | 18 (11, 24) | 18 (11, 23) | 0.67 | 46 (37, 53) | 45 (37, 53) | 0.11 |
All 20 CPGs for the febrile young infant 28 days of age recommended urine, blood, CSF testing, and hospitalization for all infants (Figure 1). Of the 16 hospitals with CPGs for febrile infants aged 29 to 56 days, all recommended urine and blood testing for all patients, except for 1 CPG, which recommended consideration of blood testing but not to obtain routinely. Hospitals varied in recommendations for CSF testing among infants aged 29 to 56 days: 8 (50%) recommended CSF testing in all patients and 8 (50%) recommended CSF testing only if the patient was high risk per defined criteria (based on history, physical examination, urine, and blood testing). In all 16 CPGs, hospitalization was recommended only for high‐risk infants. For low‐risk infants aged 2956 days being discharged from the ED, 3 hospitals recommended ceftriaxone for all, 9 recommended consideration of ceftriaxone, and 4 recommended against antibiotics (Figure 1).
Study Patients
During the study period, there were 10,415 infants 56 days old with a diagnosis of fever at the 33 participating hospitals. After exclusion of 635 (6.1%) infants with a complex chronic condition and 445 (4.3%) transferred from another institution (including 42 with a complex chronic condition), 9377 infants remained in our study cohort. Approximately one‐third of the cohort was 28 days of age and two‐thirds aged 29 to 56 days. The overall SBI rate was 8.5% but varied by age (11.9% in infants 28 days and 6.9% in infants 29 to 56 days of age) (Table 1).
CPGs and Use of Diagnostic Testing, Hospitalization Rates, Ceftriaxone Use, and Revisits for SBI
For infants 28 days of age, the presence of a CPG was not associated with urine, blood, CSF testing, or hospitalization after multivariable adjustment (Table 2). Among infants aged 29 to 56 days, urine testing did not differ based on the presence of a CPG, whereas blood testing was performed less often at the 1 hospital whose CPG recommended to consider, but not routinely obtain, testing (aOR: 0.4, 95% CI: 0.3‐0.7, P=0.001). Compared to hospitals without a CPG, CSF testing was performed less often at hospitals with CPG recommendations to only obtain CSF if high risk (aOR: 0.5, 95% CI: 0.3‐0.8, P=0.002). However, the odds of hospitalization did not differ at institutions with and without a febrile infant CPG (aOR: 0.7, 95% CI: 0.5‐1.1, P=0.10). For infants aged 29 to 56 days discharged from the ED, ceftriaxone was administered more often at hospitals with CPGs that recommended ceftriaxone for all discharged patients (aOR: 4.6, 95% CI: 2.39.3, P<0.001) and less often at hospitals whose CPGs recommended against antibiotics (aOR: 0.3, 95% CI: 0.1‐0.9, P=0.03) (Table 3). Our findings were similar in the subgroup of infants without bronchiolitis or prematurity (see Supporting Tables 1 and 2 in the online version of this article). After exclusion of hospitals with a CPG implemented during the 2013 calendar year (4 hospitals excluded in the 28 days age group and 2 hospitals excluded in the 29 to 56 days age group), infants aged 29 to 56 days cared for at a hospital with a CPG experienced a lower odds of hospitalization (aOR: 0.7, 95% CI: 0.4‐0.98, P=0.04). Otherwise, our findings in both age groups did not materially differ from the main analyses.
| Testing/Hospitalization | No. of Hospitals | No. of Patients | % Received* | aOR (95% CI) | P Value |
|---|---|---|---|---|---|
| |||||
| Laboratory testing | |||||
| Urine testing | |||||
| No CPG | 13 | 996 | 75.6 | Ref | |
| CPG: recommend for all | 20 | 2,149 | 80.7 | 1.2 (0.9‐1.7) | 0.22 |
| Blood testing | |||||
| No CPG | 13 | 996 | 76.9 | Ref | |
| CPG: recommend for all | 20 | 2,149 | 81.8 | 1.2 (0.9‐1.7) | 0.25 |
| CSF testing‖ | |||||
| No CPG | 13 | 996 | 71.0 | Ref | |
| CPG: recommend for all | 20 | 2,149 | 77.5 | 1.3 (1.01.7) | 0.08 |
| Disposition | |||||
| Hospitalization | |||||
| No CPG | 13 | 996 | 75.4 | Ref | |
| CPG: recommend for all | 20 | 2,149 | 81.6 | 1.2 (0.9‐1.8) | 0.26 |
| Testing/Hospitalization | No. of Hospitals | No. of Patients | % Received* | aOR (95% CI) | P Value |
|---|---|---|---|---|---|
| |||||
| Laboratory resting | |||||
| Urine testing | |||||
| No CPG | 17 | 2,460 | 81.1 | Ref | |
| CPG: recommend for all | 16 | 3,772 | 82.1 | 0.9 (0.7‐1.4) | 0.76 |
| Blood testing | |||||
| No CPG | 17 | 2,460 | 79.4 | Ref | |
| CPG: recommend for all | 15 | 3,628 | 82.6 | 1.1 (0.7‐1.6) | 0.70 |
| CPG: recommend consider | 1 | 144 | 62.5 | 0.4 (0.3‐0.7) | 0.001 |
| CSF testing‖ | |||||
| No CPG | 17 | 2,460 | 46.3 | Ref | |
| CPG: recommend for all | 8 | 1,517 | 70.3 | 1.3 (0.9‐1.9) | 0.11 |
| CPG: recommend if high‐risk | 8 | 2,255 | 39.9 | 0.5 (0.3‐0.8) | 0.002 |
| Disposition | |||||
| Hospitalization | |||||
| No CPG | 17 | 2,460 | 47.0 | Ref | |
| CPG: recommend if high‐risk | 16 | 3,772 | 42.0 | 0.7 (0.5‐1.1) | 0.10 |
| Ceftriaxone if discharged | |||||
| No CPG | 17 | 1,304 | 11.7 | Ref | |
| CPG: recommend against | 4 | 313 | 10.9 | 0.3 (0.1‐0.9) | 0.03 |
| CPG: recommend consider | 9 | 1,567 | 14.4 | 1.5 (0.9‐2.4) | 0.09 |
| CPG: recommend for all | 3 | 306 | 64.1 | 4.6 (2.39.3) | < 0.001 |
Three‐day revisits for SBI were similarly low at hospitals with and without CPGs among infants 28 days (1.5% vs 0.8%, P=0.44) and 29 to 56 days of age (1.4% vs 1.1%, P=0.44) and did not differ after exclusion of hospitals with a CPG implemented in 2013.
CPGs and Costs
Among infants 28 days of age, costs per visit did not differ for admitted and discharged patients based on CPG presence. The presence of an ED febrile infant CPG was associated with higher costs for both admitted and discharged infants 29 to 56 days of age (Table 4). The cost analysis did not significantly differ after exclusion of hospitals with CPGs implemented in 2013.
| 28 Days, Cost, Median (IQR) | 29 to 56 Days, Cost, Median (IQR) | |||||
|---|---|---|---|---|---|---|
| No CPG | CPG | P Value | No CPG | CPG | P Value | |
| ||||||
| Admitted | $4,979 ($3,408$6,607) [n=751] | $4,715 ($3,472$6,526) [n=1,753] | 0.79 | $3,756 ($2,725$5,041) [n=1,156] | $3,923 ($3,077$5,243) [n=1,586] | <0.001 |
| Discharged | $298 ($166$510) [n=245] | $231 ($160$464) [n=396] | 0.10 | $681($398$982) [n=1,304)] | $764 ($412$1,100) [n=2,186] | <0.001 |
DISCUSSION
We described the content and association of CPGs with management of the febrile infant 56 days of age across a large sample of children's hospitals. Nearly two‐thirds of included pediatric EDs have a CPG for the management of young febrile infants. Management of febrile infants 28 days was uniform, with a majority hospitalized after urine, blood, and CSF testing regardless of the presence of a CPG. In contrast, CPGs for infants 29 to 56 days of age varied in their recommendations for CSF testing as well as ceftriaxone use for infants discharged from the ED. Consequently, we observed considerable hospital variability in CSF testing and ceftriaxone use for discharged infants, which correlates with variation in the presence and content of CPGs. Institutional CPGs may be a source of the across‐hospital variation in care of febrile young infants observed in prior study.[9]
Febrile infants 28 days of age are at particularly high risk for SBI, with a prevalence of nearly 20% or higher.[2, 3, 29] The high prevalence of SBI, combined with the inherent difficulty in distinguishing neonates with and without SBI,[2, 30] has resulted in uniform CPG recommendations to perform the full‐sepsis workup in this young age group. Similar to prior studies,[8, 9] we observed that most febrile infants 28 days undergo the full sepsis evaluation, including CSF testing, and are hospitalized regardless of the presence of a CPG.
However, given the conflicting recommendations for febrile infants 29 to 56 days of age,[4, 5, 6] the optimal management strategy is less certain.[7] The Rochester, Philadelphia, and Boston criteria, 3 published models to identify infants at low risk for SBI, primarily differ in their recommendations for CSF testing and ceftriaxone use in this age group.[4, 5, 6] Half of the CPGs recommended CSF testing for all febrile infants, and half recommended CSF testing only if the infant was high risk. Institutional guidelines that recommended selective CSF testing for febrile infants aged 29 to 56 days were associated with lower rates of CSF testing. Furthermore, ceftriaxone use varied based on CPG recommendations for low‐risk infants discharged from the ED. Therefore, the influence of febrile infant CPGs mainly relates to the limiting of CSF testing and targeted ceftriaxone use in low‐risk infants. As the rate of return visits for SBI is low across hospitals, future study should assess outcomes at hospitals with CPGs recommending selective CSF testing. Of note, infants 29 to 56 days of age were less likely to be hospitalized when cared for at a hospital with an established CPG prior to 2013 without increase in 3‐day revisits for SBI. This finding may indicate that longer duration of CPG implementation is associated with lower rates of hospitalization for low‐risk infants; this finding merits further study.
The presence of a CPG was not associated with lower costs for febrile infants in either age group. Although individual healthcare systems have achieved lower costs with CPG implementation,[12] the mere presence of a CPG is not associated with lower costs when assessed across institutions. Higher costs for admitted and discharged infants 29 to 56 days of age in the presence of a CPG likely reflects the higher rate of CSF testing at hospitals whose CPGs recommend testing for all febrile infants, as well as inpatient management strategies for hospitalized infants not captured in our study. Future investigation should include an assessment of the cost‐effectiveness of the various testing and treatment strategies employed for the febrile young infant.
Our study has several limitations. First, the validity of ICD‐9 diagnosis codes for identifying young infants with fever is not well established, and thus our study is subject to misclassification bias. To minimize missed patients, we included infants with either an ICD‐9 admission or discharge diagnosis of fever; however, utilization of diagnosis codes for patient identification may have resulted in undercapture of infants with a measured temperature of 38.0C. It is also possible that some patients who did not undergo testing were misclassified as having a fever or had temperatures below standard thresholds to prompt diagnostic testing. This is a potential reason that testing was not performed in 100% of infants, even at hospitals with CPGs that recommended testing for all patients. Additionally, some febrile infants diagnosed with SBI may not have an associated ICD‐9 diagnosis code for fever. Although the overall SBI rate observed in our study was similar to prior studies,[4, 31] the rate in neonates 28 days of age was lower than reported in recent investigations,[2, 3] which may indicate inclusion of a higher proportion of low‐risk febrile infants. With the exception of bronchiolitis, we also did not assess diagnostic testing in the presence of other identified sources of infection such as herpes simplex virus.
Second, we were unable to assess the presence or absence of a CPG at the 4 excluded EDs that did not respond to the survey or the institutions excluded for data‐quality issues. However, included and excluded hospitals did not differ in region or annual ED volume (data not shown).
Third, although we classified hospitals based upon the presence and content of CPGs, we were unable to fully evaluate adherence to the CPG at each site.
Last, though PHIS hospitals represent 85% of freestanding children's hospitals, many febrile infants are hospitalized at non‐PHIS institutions; our results may not be generalizable to care provided at nonchildren's hospitals.
CONCLUSIONS
Management of febrile neonates 28 days of age does not vary based on CPG presence. However, CPGs for the febrile infant aged 29 to 56 days vary in recommendations for CSF testing as well as ceftriaxone use for low‐risk patients, which significantly contributes to practice variation and healthcare costs across institutions.
Acknowledgements
The Febrile Young Infant Research Collaborative includes the following additional investigators who are acknowledged for their work on this study: Kao‐Ping Chua, MD, Harvard PhD Program in Health Policy, Harvard University, Cambridge, Massachusetts, and Division of Emergency Medicine, Department of Pediatrics, Boston Children's Hospital, Boston, Massachusetts; Elana A. Feldman, BA, University of Washington School of Medicine, Seattle, Washington; and Katie L. Hayes, BS, Division of Emergency Medicine, Department of Pediatrics, The Children's Hospital of Philadelphia, Philadelphia, Pennsylvania.
Disclosures
This project was funded in part by The Gerber Foundation Novice Researcher Award (Ref #18273835). Dr. Fran Balamuth received career development support from the National Institutes of Health (NHLBI K12‐HL109009). Funders were not involved in design or conduct of the study; collection, management, analysis, or interpretation of the data; preparation, review, or approval of the manuscript. The authors have no financial relationships relevant to this article to disclose. No payment was received for the production of this article. The authors have no conflicts of interest relevant to this article to disclose.
- , , . Performance of low‐risk criteria in the evaluation of young infants with fever: review of the literature. Pediatrics. 2010;125:228–233.
- , , , , , . A week‐by‐week analysis of the low‐risk criteria for serious bacterial infection in febrile neonates. Arch Dis Child. 2009;94:287–292.
- , , , et al. Is 15 days an appropriate cut‐off age for considering serious bacterial infection in the management of febrile infants? Pediatr Infect Dis J. 2012;31:455–458.
- , , . Outpatient management without antibiotics of fever in selected infants. N Engl J Med. 1993;329:1437–1441.
- , , . Identifying febrile infants at risk for a serious bacterial infection. J Pediatr. 1993;123:489–490.
- , , , et al. Febrile infants at low risk for serious bacterial infection—an appraisal of the Rochester criteria and implications for management. Febrile Infant Collaborative Study Group. Pediatrics. 1994;94:390–396.
- American College of Emergency Physicians Clinical Policies Committee; American College of Emergency Physicians Clinical Policies Subcommittee on Pediatric Fever. Clinical policy for children younger than three years presenting to the emergency department with fever. Ann Emerg Med. 2003;42:530–545.
- , , , et al. Management of febrile neonates in US pediatric emergency departments. Pediatrics. 2014;133:187–195.
- , , , et al. Variation in care of the febrile young infant <90 days in US pediatric emergency departments. Pediatrics. 2014;134:667–677.
- , , , , . Fever survey highlights significant variations in how infants aged ≤60 days are evaluated and underline the need for guidelines. Acta Paediatr. 2014;103:379–385.
- . Evidence‐based guidelines and critical pathways for quality improvement. Pediatrics. 1999;103:225–232.
- , , , et al. Costs and infant outcomes after implementation of a care process model for febrile infants. Pediatrics. 2012;130:e16–e24.
- , , , , , . Research electronic data capture (REDCap)—a metadata‐driven methodology and workflow process for providing translational research informatics support. J Biomed Inform. 2009;42:377–381.
- , , , , , . Variation in occult injury screening for children with suspected abuse in selected US children's hospitals. Pediatrics. 2012;130:853–860.
- . Achieving data quality. How data from a pediatric health information system earns the trust of its users. J AHIMA. 2004;75:22–26.
- , , , . Corticosteroids and mortality in children with bacterial meningitis. JAMA. 2008;299:2048–2055.
- , , , et al. Variation in resource utilization across a national sample of pediatric emergency departments. J Pediatr. 2013;163:230–236.
- , , , , , . Deaths attributed to pediatric complex chronic conditions: national trends and implications for supportive care services. Pediatrics. 2001;107:E99.
- US Census Bureau. Geographic terms and concepts—census divisions and census regions. Available at: https://www.census.gov/geo/reference/gtc/gtc_census_divreg.html. Accessed September 10, 2014.
- , , , et al. Pediatric observation status: are we overlooking a growing population in children's hospitals? J Hosp Med. 2012;7:530–536.
- , , , et al. Differences in designations of observation care in US freestanding children's hospitals: are they virtual or real? J Hosp Med. 2012;7:287–293.
- , , , et al. Accuracy of administrative billing codes to detect urinary tract infection hospitalizations. Pediatrics. 2011;128:323–330.
- , , , et al. Identifying pediatric community‐acquired pneumonia hospitalizations: accuracy of administrative billing codes. JAMA Pediatr. 2013;167:851–858.
- , , , . Initial emergency department diagnosis and return visits: risk versus perception. Ann Emerg Med. 1998;32:569–573.
- , , , , . A national depiction of children with return visits to the emergency department within 72 hours, 2001–2007. Pediatr Emerg Care. 2012;28:606–610.
- Healthcare Cost and Utilization Project. Cost‐to‐charge ratio files. Available at: http://www.hcup‐us.ahrq.gov/db/state/costtocharge.jsp. Accessed September 11, 2014.
- , , , et al. Risk of serious bacterial infection in young febrile infants with respiratory syncytial virus infections. Pediatrics. 2004;113:1728–1734.
- , , , et al. Establishing benchmarks for the hospitalized care of children with asthma, bronchiolitis, and pneumonia. Pediatrics. 2014;134:555–562.
- , , , , , . Well appearing young infants with fever without known source in the emergency department: are lumbar punctures always necessary? Eur J Emerg Med. 2010;17:167–169.
- , . Unpredictability of serious bacterial illness in febrile infants from birth to 1 month of age. Arch Pediatr Adolesc Med. 1999;153:508–511.
- , , , et al. Management and outcomes of care of fever in early infancy. JAMA. 2004;291:1203–1212.
Febrile young infants are at high risk for serious bacterial infection (SBI) with reported rates of 8.5% to 12%, even higher in neonates 28 days of age.[1, 2, 3] As a result, febrile infants often undergo extensive diagnostic evaluation consisting of a combination of urine, blood, and cerebrospinal fluid (CSF) testing.[4, 5, 6] Several clinical prediction algorithms use this diagnostic testing to identify febrile infants at low risk for SBI, but they differ with respect to age range, recommended testing, antibiotic administration, and threshold for hospitalization.[4, 5, 6] Additionally, the optimal management strategy for this population has not been defined.[7] Consequently, laboratory testing, antibiotic use, and hospitalization for febrile young infants vary widely among hospitals.[8, 9, 10]
Clinical practice guidelines (CPGs) are designed to implement evidence‐based care and reduce practice variability, with the goal of improving quality of care and optimizing costs.[11] Implementation of a CPG for management of febrile young infants in the Intermountain Healthcare System was associated with greater adherence to evidence‐based care and lower costs.[12] However, when strong evidence is lacking, different interpretations of febrile infant risk classification incorporated into local CPGs may be a major driver of the across‐hospital practice variation observed in prior studies.[8, 9] Understanding sources of variability as well as determining the association of CPGs with clinicians' practice patterns can help identify quality improvement opportunities, either through national benchmarking or local efforts.
Our primary objectives were to compare (1) recommendations of pediatric emergency departmentbased institutional CPGs for febrile young infants and (2) rates of urine, blood, CSF testing, hospitalization, and ceftriaxone use at emergency department (ED) discharge based upon CPG presence and the specific CPG recommendations. Our secondary objectives were to describe the association of CPGs with healthcare costs and return visits for SBI.
METHODS
Study Design
We used the Pediatric Health Information System (PHIS) to identify febrile infants 56 days of age who presented to the ED between January 1, 2013 and December 31, 2013. We also surveyed ED providers at participating PHIS hospitals. Informed consent was obtained from survey respondents. The institutional review board at Boston Children's Hospital approved the study protocol.
Clinical Practice Guideline Survey
We sent an electronic survey to medical directors or division directors at 37 pediatric EDs to determine whether their ED utilized a CPG for the management of the febrile young infant in 2013. If no response was received after the second attempt, we queried ED fellowship directors or other ED attending physicians at nonresponding hospitals. Survey items included the presence of a febrile young infant CPG, and if present, the year of implementation, ages targeted, and CPG content. As applicable, respondents were asked to share their CPG and/or provide the specific CPG recommendations.
We collected and managed survey data using the Research Electronic Data Capture (REDCap) electronic data capture tools hosted at Boston Children's Hospital. REDCap is a secure, Web‐based application designed to support data capture for research studies.[13]
Data Source
The PHIS database contains administrative data from 44 US children's hospitals. These hospitals, affiliated with the Children's Hospital Association, represent 85% of freestanding US children's hospitals.[14] Encrypted patient identifiers permit tracking of patients across encounters.[15] Data quality and integrity are assured jointly by the Children's Hospital Association and participating hospitals.[16] For this study, 7 hospitals were excluded due to incomplete ED data or known data‐quality issues.[17]
Patients
We identified study infants using the following International Classification of Diseases, 9th Revision (ICD‐9) admission or discharge diagnosis codes for fever as defined previously[8, 9]: 780.6, 778.4, 780.60, or 780.61. We excluded infants with a complex chronic condition[18] and those transferred from another institution, as these infants may warrant a nonstandard evaluation and/or may have incomplete data. For infants with >1 ED visit for fever during the study period, repeat visits within 3 days of an index visit were considered a revisit for the same episode of illness; visits >3 days following an index visit were considered as a new index visit.
Study Definitions
From the PHIS database, we abstracted demographic characteristics (gender, race/ethnicity), insurance status, and region where the hospital was located (using US Census categories[19]). Billing codes were used to assess whether urine, blood, and CSF testing (as defined previously[9]) were performed during the ED evaluation. To account for ED visits that spanned the midnight hour, for hospitalized patients we considered any testing or treatment occurring on the initial or second hospital day to be performed in the ED; billing code data in PHIS are based upon calendar day and do not distinguish testing performed in the ED versus inpatient setting.[8, 9] Patients billed for observation care were classified as being hospitalized.[20, 21]
We identified the presence of an SBI using ICD‐9 diagnosis codes for the following infections as described previously[9]: urinary tract infection or pyelonephritis,[22] bacteremia or sepsis, bacterial meningitis,[16] pneumonia,[23] or bacterial enteritis. To assess return visits for SBI that required inpatient management, we defined an ED revisit for an SBI as a return visit within 3 days of ED discharge[24, 25] that resulted in hospitalization with an associated ICD‐9 discharge diagnosis code for an SBI.
Hospitals charges in PHIS database were adjusted for hospital location by using the Centers for Medicare and Medicaid Services price/wage index. Costs were estimated by applying hospital‐level cost‐to‐charge ratios to charge data.[26]
Measured Exposures
The primary exposure was the presence of an ED‐based CPG for management of the febrile young infant aged 28 days and 29 to 56 days; 56 days was used as the upper age limit as all of the CPGs included infants up to this age or beyond. Six institutions utilized CPGs with different thresholds to define the age categories (eg, dichotomized at 27 or 30 days); these CPGs were classified into the aforementioned age groups to permit comparisons across standardized age groups. We classified institutions based on the presence of a CPG. To assess differences in the application of low‐risk criteria, the CPGs were further classified a priori based upon specific recommendations around laboratory testing and hospitalization, as well as ceftriaxone use for infants aged 29 to 56 days discharged from the ED. CPGs were categorized based upon whether testing, hospitalization, and ceftriaxone use were: (1) recommended for all patients, (2) recommended only if patients were classified as high risk (absence of low‐risk criteria), (3) recommended against, or (4) recommended to consider at clinician discretion.
Outcome Measures
Measured outcomes were performance of urine, blood, CSF testing, and hospitalization rate, as well as rate of ceftriaxone use for discharged infants aged 29 to 56 days, 3‐day revisits for SBI, and costs per visit, which included hospitalization costs for admitted patients.
Data Analysis
We described continuous variables using median and interquartile range or range values and categorical variables using frequencies. We compared medians using Wilcoxon rank sum and categorical variables using a [2] test. We compared rates of testing, hospitalization, ceftriaxone use, and 3‐day revisits for SBI based on the presence of a CPG, and when present, the specific CPG recommendations. Costs per visit were compared between institutions with and without CPGs and assessed separately for admitted and discharged patients. To adjust for potential confounders and clustering of patients within hospitals, we used generalized estimating equations with logistic regression to generate adjusted odd ratios (aORs) and 95% confidence intervals (CIs). Models were adjusted for geographic region, payer, race, and gender. Statistical analyses were performed by using SAS version 9.3 (SAS Institute, Cary, NC). We determined statistical significance as a 2‐tailed P value <0.05.
Febrile infants with bronchiolitis or a history of prematurity may be managed differently from full‐term febrile young infants without bronchiolitis.[6, 27] Therefore, we performed a subgroup analysis after exclusion of infants with an ICD‐9 discharge diagnosis code for bronchiolitis (466.11 and 466.19)[28] or prematurity (765).
Because our study included ED encounters in 2013, we repeated our analyses after exclusion of hospitals with CPGs implemented during the 2013 calendar year.
RESULTS
CPG by Institution
Thirty‐three (89.2%) of the 37 EDs surveyed completed the questionnaire. Overall, 21 (63.6%) of the 33 EDs had a CPG; 15 (45.5%) had a CPG for all infants 56 days of age, 5 (15.2%) had a CPG for infants 28 days only, and 1 (3.0%) had a CPG for infants 29 to 56 days but not 28 days of age (Figure 1). Seventeen EDs had an established CPG prior to 2013, and 4 hospitals implemented a CPG during the 2013 calendar year, 2 with CPGs for neonates 28 days and 2 with CPGs for both 28 days and 29 to 56 days of age. Hospitals with CPGs were more likely to be located in the Northeast and West regions of the United States and provide care to a higher proportion of non‐Hispanic white patients, as well as those with commercial insurance (Table 1).
| Characteristic | 28 Days | 2956 Days | ||||
|---|---|---|---|---|---|---|
| No CPG, n=996, N (%) | CPG, n=2,149, N (%) | P Value | No CPG, n=2,460, N (%) | CPG, n=3,772, N (%) | P Value | |
| ||||||
| Race | ||||||
| Non‐Hispanic white | 325 (32.6) | 996 (46.3) | 867 (35.2) | 1,728 (45.8) | ||
| Non‐Hispanic black | 248 (24.9) | 381 (17.7) | 593 (24.1) | 670 (17.8) | ||
| Hispanic | 243 (24.4) | 531 (24.7) | 655 (26.6) | 986 (26.1) | ||
| Asian | 28 (2.8) | 78 (3.6) | 40 (1.6) | 122 (3.2) | ||
| Other Race | 152 (15.3) | 163 (7.6) | <0.001 | 305 (12.4) | 266 (7.1) | <0.001 |
| Gender | ||||||
| Female | 435 (43.7) | 926 (43.1) | 0.76 | 1,067 (43.4) | 1,714 (45.4) | 0.22 |
| Payer | ||||||
| Commercial | 243 (24.4) | 738 (34.3) | 554 (22.5) | 1,202 (31.9) | ||
| Government | 664 (66.7) | 1,269 (59.1) | 1,798 (73.1) | 2,342 (62.1) | ||
| Other payer | 89 (8.9) | 142 (6.6) | <0.001 | 108 (4.4) | 228 (6.0) | <0.001 |
| Region | ||||||
| Northeast | 39 (3.9) | 245 (11.4) | 77 (3.1) | 572 (15.2) | ||
| South | 648 (65.1) | 915 (42.6) | 1,662 (67.6) | 1,462 (38.8) | ||
| Midwest | 271 (27.2) | 462 (21.5) | 506 (20.6) | 851 (22.6) | ||
| West | 38 (3.8) | 527 (24.5) | <0.001 | 215 (8.7) | 887 (23.5) | <0.001 |
| Serious bacterial infection | ||||||
| Overall* | 131 (13.2) | 242 (11.3) | 0.14 | 191 (7.8) | 237 (6.3) | 0.03 |
| UTI/pyelonephritis | 73 (7.3) | 153 (7.1) | 103 (4.2) | 154 (4.1) | ||
| Bacteremia/sepsis | 56 (5.6) | 91 (4.2) | 78 (3.2) | 61 (1.6) | ||
| Bacterial meningitis | 15 (1.5) | 15 (0.7) | 4 (0.2) | 14 (0.4) | ||
| Age, d, median (IQR) | 18 (11, 24) | 18 (11, 23) | 0.67 | 46 (37, 53) | 45 (37, 53) | 0.11 |
All 20 CPGs for the febrile young infant 28 days of age recommended urine, blood, CSF testing, and hospitalization for all infants (Figure 1). Of the 16 hospitals with CPGs for febrile infants aged 29 to 56 days, all recommended urine and blood testing for all patients, except for 1 CPG, which recommended consideration of blood testing but not to obtain routinely. Hospitals varied in recommendations for CSF testing among infants aged 29 to 56 days: 8 (50%) recommended CSF testing in all patients and 8 (50%) recommended CSF testing only if the patient was high risk per defined criteria (based on history, physical examination, urine, and blood testing). In all 16 CPGs, hospitalization was recommended only for high‐risk infants. For low‐risk infants aged 2956 days being discharged from the ED, 3 hospitals recommended ceftriaxone for all, 9 recommended consideration of ceftriaxone, and 4 recommended against antibiotics (Figure 1).
Study Patients
During the study period, there were 10,415 infants 56 days old with a diagnosis of fever at the 33 participating hospitals. After exclusion of 635 (6.1%) infants with a complex chronic condition and 445 (4.3%) transferred from another institution (including 42 with a complex chronic condition), 9377 infants remained in our study cohort. Approximately one‐third of the cohort was 28 days of age and two‐thirds aged 29 to 56 days. The overall SBI rate was 8.5% but varied by age (11.9% in infants 28 days and 6.9% in infants 29 to 56 days of age) (Table 1).
CPGs and Use of Diagnostic Testing, Hospitalization Rates, Ceftriaxone Use, and Revisits for SBI
For infants 28 days of age, the presence of a CPG was not associated with urine, blood, CSF testing, or hospitalization after multivariable adjustment (Table 2). Among infants aged 29 to 56 days, urine testing did not differ based on the presence of a CPG, whereas blood testing was performed less often at the 1 hospital whose CPG recommended to consider, but not routinely obtain, testing (aOR: 0.4, 95% CI: 0.3‐0.7, P=0.001). Compared to hospitals without a CPG, CSF testing was performed less often at hospitals with CPG recommendations to only obtain CSF if high risk (aOR: 0.5, 95% CI: 0.3‐0.8, P=0.002). However, the odds of hospitalization did not differ at institutions with and without a febrile infant CPG (aOR: 0.7, 95% CI: 0.5‐1.1, P=0.10). For infants aged 29 to 56 days discharged from the ED, ceftriaxone was administered more often at hospitals with CPGs that recommended ceftriaxone for all discharged patients (aOR: 4.6, 95% CI: 2.39.3, P<0.001) and less often at hospitals whose CPGs recommended against antibiotics (aOR: 0.3, 95% CI: 0.1‐0.9, P=0.03) (Table 3). Our findings were similar in the subgroup of infants without bronchiolitis or prematurity (see Supporting Tables 1 and 2 in the online version of this article). After exclusion of hospitals with a CPG implemented during the 2013 calendar year (4 hospitals excluded in the 28 days age group and 2 hospitals excluded in the 29 to 56 days age group), infants aged 29 to 56 days cared for at a hospital with a CPG experienced a lower odds of hospitalization (aOR: 0.7, 95% CI: 0.4‐0.98, P=0.04). Otherwise, our findings in both age groups did not materially differ from the main analyses.
| Testing/Hospitalization | No. of Hospitals | No. of Patients | % Received* | aOR (95% CI) | P Value |
|---|---|---|---|---|---|
| |||||
| Laboratory testing | |||||
| Urine testing | |||||
| No CPG | 13 | 996 | 75.6 | Ref | |
| CPG: recommend for all | 20 | 2,149 | 80.7 | 1.2 (0.9‐1.7) | 0.22 |
| Blood testing | |||||
| No CPG | 13 | 996 | 76.9 | Ref | |
| CPG: recommend for all | 20 | 2,149 | 81.8 | 1.2 (0.9‐1.7) | 0.25 |
| CSF testing‖ | |||||
| No CPG | 13 | 996 | 71.0 | Ref | |
| CPG: recommend for all | 20 | 2,149 | 77.5 | 1.3 (1.01.7) | 0.08 |
| Disposition | |||||
| Hospitalization | |||||
| No CPG | 13 | 996 | 75.4 | Ref | |
| CPG: recommend for all | 20 | 2,149 | 81.6 | 1.2 (0.9‐1.8) | 0.26 |
| Testing/Hospitalization | No. of Hospitals | No. of Patients | % Received* | aOR (95% CI) | P Value |
|---|---|---|---|---|---|
| |||||
| Laboratory resting | |||||
| Urine testing | |||||
| No CPG | 17 | 2,460 | 81.1 | Ref | |
| CPG: recommend for all | 16 | 3,772 | 82.1 | 0.9 (0.7‐1.4) | 0.76 |
| Blood testing | |||||
| No CPG | 17 | 2,460 | 79.4 | Ref | |
| CPG: recommend for all | 15 | 3,628 | 82.6 | 1.1 (0.7‐1.6) | 0.70 |
| CPG: recommend consider | 1 | 144 | 62.5 | 0.4 (0.3‐0.7) | 0.001 |
| CSF testing‖ | |||||
| No CPG | 17 | 2,460 | 46.3 | Ref | |
| CPG: recommend for all | 8 | 1,517 | 70.3 | 1.3 (0.9‐1.9) | 0.11 |
| CPG: recommend if high‐risk | 8 | 2,255 | 39.9 | 0.5 (0.3‐0.8) | 0.002 |
| Disposition | |||||
| Hospitalization | |||||
| No CPG | 17 | 2,460 | 47.0 | Ref | |
| CPG: recommend if high‐risk | 16 | 3,772 | 42.0 | 0.7 (0.5‐1.1) | 0.10 |
| Ceftriaxone if discharged | |||||
| No CPG | 17 | 1,304 | 11.7 | Ref | |
| CPG: recommend against | 4 | 313 | 10.9 | 0.3 (0.1‐0.9) | 0.03 |
| CPG: recommend consider | 9 | 1,567 | 14.4 | 1.5 (0.9‐2.4) | 0.09 |
| CPG: recommend for all | 3 | 306 | 64.1 | 4.6 (2.39.3) | < 0.001 |
Three‐day revisits for SBI were similarly low at hospitals with and without CPGs among infants 28 days (1.5% vs 0.8%, P=0.44) and 29 to 56 days of age (1.4% vs 1.1%, P=0.44) and did not differ after exclusion of hospitals with a CPG implemented in 2013.
CPGs and Costs
Among infants 28 days of age, costs per visit did not differ for admitted and discharged patients based on CPG presence. The presence of an ED febrile infant CPG was associated with higher costs for both admitted and discharged infants 29 to 56 days of age (Table 4). The cost analysis did not significantly differ after exclusion of hospitals with CPGs implemented in 2013.
| 28 Days, Cost, Median (IQR) | 29 to 56 Days, Cost, Median (IQR) | |||||
|---|---|---|---|---|---|---|
| No CPG | CPG | P Value | No CPG | CPG | P Value | |
| ||||||
| Admitted | $4,979 ($3,408$6,607) [n=751] | $4,715 ($3,472$6,526) [n=1,753] | 0.79 | $3,756 ($2,725$5,041) [n=1,156] | $3,923 ($3,077$5,243) [n=1,586] | <0.001 |
| Discharged | $298 ($166$510) [n=245] | $231 ($160$464) [n=396] | 0.10 | $681($398$982) [n=1,304)] | $764 ($412$1,100) [n=2,186] | <0.001 |
DISCUSSION
We described the content and association of CPGs with management of the febrile infant 56 days of age across a large sample of children's hospitals. Nearly two‐thirds of included pediatric EDs have a CPG for the management of young febrile infants. Management of febrile infants 28 days was uniform, with a majority hospitalized after urine, blood, and CSF testing regardless of the presence of a CPG. In contrast, CPGs for infants 29 to 56 days of age varied in their recommendations for CSF testing as well as ceftriaxone use for infants discharged from the ED. Consequently, we observed considerable hospital variability in CSF testing and ceftriaxone use for discharged infants, which correlates with variation in the presence and content of CPGs. Institutional CPGs may be a source of the across‐hospital variation in care of febrile young infants observed in prior study.[9]
Febrile infants 28 days of age are at particularly high risk for SBI, with a prevalence of nearly 20% or higher.[2, 3, 29] The high prevalence of SBI, combined with the inherent difficulty in distinguishing neonates with and without SBI,[2, 30] has resulted in uniform CPG recommendations to perform the full‐sepsis workup in this young age group. Similar to prior studies,[8, 9] we observed that most febrile infants 28 days undergo the full sepsis evaluation, including CSF testing, and are hospitalized regardless of the presence of a CPG.
However, given the conflicting recommendations for febrile infants 29 to 56 days of age,[4, 5, 6] the optimal management strategy is less certain.[7] The Rochester, Philadelphia, and Boston criteria, 3 published models to identify infants at low risk for SBI, primarily differ in their recommendations for CSF testing and ceftriaxone use in this age group.[4, 5, 6] Half of the CPGs recommended CSF testing for all febrile infants, and half recommended CSF testing only if the infant was high risk. Institutional guidelines that recommended selective CSF testing for febrile infants aged 29 to 56 days were associated with lower rates of CSF testing. Furthermore, ceftriaxone use varied based on CPG recommendations for low‐risk infants discharged from the ED. Therefore, the influence of febrile infant CPGs mainly relates to the limiting of CSF testing and targeted ceftriaxone use in low‐risk infants. As the rate of return visits for SBI is low across hospitals, future study should assess outcomes at hospitals with CPGs recommending selective CSF testing. Of note, infants 29 to 56 days of age were less likely to be hospitalized when cared for at a hospital with an established CPG prior to 2013 without increase in 3‐day revisits for SBI. This finding may indicate that longer duration of CPG implementation is associated with lower rates of hospitalization for low‐risk infants; this finding merits further study.
The presence of a CPG was not associated with lower costs for febrile infants in either age group. Although individual healthcare systems have achieved lower costs with CPG implementation,[12] the mere presence of a CPG is not associated with lower costs when assessed across institutions. Higher costs for admitted and discharged infants 29 to 56 days of age in the presence of a CPG likely reflects the higher rate of CSF testing at hospitals whose CPGs recommend testing for all febrile infants, as well as inpatient management strategies for hospitalized infants not captured in our study. Future investigation should include an assessment of the cost‐effectiveness of the various testing and treatment strategies employed for the febrile young infant.
Our study has several limitations. First, the validity of ICD‐9 diagnosis codes for identifying young infants with fever is not well established, and thus our study is subject to misclassification bias. To minimize missed patients, we included infants with either an ICD‐9 admission or discharge diagnosis of fever; however, utilization of diagnosis codes for patient identification may have resulted in undercapture of infants with a measured temperature of 38.0C. It is also possible that some patients who did not undergo testing were misclassified as having a fever or had temperatures below standard thresholds to prompt diagnostic testing. This is a potential reason that testing was not performed in 100% of infants, even at hospitals with CPGs that recommended testing for all patients. Additionally, some febrile infants diagnosed with SBI may not have an associated ICD‐9 diagnosis code for fever. Although the overall SBI rate observed in our study was similar to prior studies,[4, 31] the rate in neonates 28 days of age was lower than reported in recent investigations,[2, 3] which may indicate inclusion of a higher proportion of low‐risk febrile infants. With the exception of bronchiolitis, we also did not assess diagnostic testing in the presence of other identified sources of infection such as herpes simplex virus.
Second, we were unable to assess the presence or absence of a CPG at the 4 excluded EDs that did not respond to the survey or the institutions excluded for data‐quality issues. However, included and excluded hospitals did not differ in region or annual ED volume (data not shown).
Third, although we classified hospitals based upon the presence and content of CPGs, we were unable to fully evaluate adherence to the CPG at each site.
Last, though PHIS hospitals represent 85% of freestanding children's hospitals, many febrile infants are hospitalized at non‐PHIS institutions; our results may not be generalizable to care provided at nonchildren's hospitals.
CONCLUSIONS
Management of febrile neonates 28 days of age does not vary based on CPG presence. However, CPGs for the febrile infant aged 29 to 56 days vary in recommendations for CSF testing as well as ceftriaxone use for low‐risk patients, which significantly contributes to practice variation and healthcare costs across institutions.
Acknowledgements
The Febrile Young Infant Research Collaborative includes the following additional investigators who are acknowledged for their work on this study: Kao‐Ping Chua, MD, Harvard PhD Program in Health Policy, Harvard University, Cambridge, Massachusetts, and Division of Emergency Medicine, Department of Pediatrics, Boston Children's Hospital, Boston, Massachusetts; Elana A. Feldman, BA, University of Washington School of Medicine, Seattle, Washington; and Katie L. Hayes, BS, Division of Emergency Medicine, Department of Pediatrics, The Children's Hospital of Philadelphia, Philadelphia, Pennsylvania.
Disclosures
This project was funded in part by The Gerber Foundation Novice Researcher Award (Ref #18273835). Dr. Fran Balamuth received career development support from the National Institutes of Health (NHLBI K12‐HL109009). Funders were not involved in design or conduct of the study; collection, management, analysis, or interpretation of the data; preparation, review, or approval of the manuscript. The authors have no financial relationships relevant to this article to disclose. No payment was received for the production of this article. The authors have no conflicts of interest relevant to this article to disclose.
- , , . Performance of low‐risk criteria in the evaluation of young infants with fever: review of the literature. Pediatrics. 2010;125:228–233.
- , , , , , . A week‐by‐week analysis of the low‐risk criteria for serious bacterial infection in febrile neonates. Arch Dis Child. 2009;94:287–292.
- , , , et al. Is 15 days an appropriate cut‐off age for considering serious bacterial infection in the management of febrile infants? Pediatr Infect Dis J. 2012;31:455–458.
- , , . Outpatient management without antibiotics of fever in selected infants. N Engl J Med. 1993;329:1437–1441.
- , , . Identifying febrile infants at risk for a serious bacterial infection. J Pediatr. 1993;123:489–490.
- , , , et al. Febrile infants at low risk for serious bacterial infection—an appraisal of the Rochester criteria and implications for management. Febrile Infant Collaborative Study Group. Pediatrics. 1994;94:390–396.
- American College of Emergency Physicians Clinical Policies Committee; American College of Emergency Physicians Clinical Policies Subcommittee on Pediatric Fever. Clinical policy for children younger than three years presenting to the emergency department with fever. Ann Emerg Med. 2003;42:530–545.
- , , , et al. Management of febrile neonates in US pediatric emergency departments. Pediatrics. 2014;133:187–195.
- , , , et al. Variation in care of the febrile young infant <90 days in US pediatric emergency departments. Pediatrics. 2014;134:667–677.
- , , , , . Fever survey highlights significant variations in how infants aged ≤60 days are evaluated and underline the need for guidelines. Acta Paediatr. 2014;103:379–385.
- . Evidence‐based guidelines and critical pathways for quality improvement. Pediatrics. 1999;103:225–232.
- , , , et al. Costs and infant outcomes after implementation of a care process model for febrile infants. Pediatrics. 2012;130:e16–e24.
- , , , , , . Research electronic data capture (REDCap)—a metadata‐driven methodology and workflow process for providing translational research informatics support. J Biomed Inform. 2009;42:377–381.
- , , , , , . Variation in occult injury screening for children with suspected abuse in selected US children's hospitals. Pediatrics. 2012;130:853–860.
- . Achieving data quality. How data from a pediatric health information system earns the trust of its users. J AHIMA. 2004;75:22–26.
- , , , . Corticosteroids and mortality in children with bacterial meningitis. JAMA. 2008;299:2048–2055.
- , , , et al. Variation in resource utilization across a national sample of pediatric emergency departments. J Pediatr. 2013;163:230–236.
- , , , , , . Deaths attributed to pediatric complex chronic conditions: national trends and implications for supportive care services. Pediatrics. 2001;107:E99.
- US Census Bureau. Geographic terms and concepts—census divisions and census regions. Available at: https://www.census.gov/geo/reference/gtc/gtc_census_divreg.html. Accessed September 10, 2014.
- , , , et al. Pediatric observation status: are we overlooking a growing population in children's hospitals? J Hosp Med. 2012;7:530–536.
- , , , et al. Differences in designations of observation care in US freestanding children's hospitals: are they virtual or real? J Hosp Med. 2012;7:287–293.
- , , , et al. Accuracy of administrative billing codes to detect urinary tract infection hospitalizations. Pediatrics. 2011;128:323–330.
- , , , et al. Identifying pediatric community‐acquired pneumonia hospitalizations: accuracy of administrative billing codes. JAMA Pediatr. 2013;167:851–858.
- , , , . Initial emergency department diagnosis and return visits: risk versus perception. Ann Emerg Med. 1998;32:569–573.
- , , , , . A national depiction of children with return visits to the emergency department within 72 hours, 2001–2007. Pediatr Emerg Care. 2012;28:606–610.
- Healthcare Cost and Utilization Project. Cost‐to‐charge ratio files. Available at: http://www.hcup‐us.ahrq.gov/db/state/costtocharge.jsp. Accessed September 11, 2014.
- , , , et al. Risk of serious bacterial infection in young febrile infants with respiratory syncytial virus infections. Pediatrics. 2004;113:1728–1734.
- , , , et al. Establishing benchmarks for the hospitalized care of children with asthma, bronchiolitis, and pneumonia. Pediatrics. 2014;134:555–562.
- , , , , , . Well appearing young infants with fever without known source in the emergency department: are lumbar punctures always necessary? Eur J Emerg Med. 2010;17:167–169.
- , . Unpredictability of serious bacterial illness in febrile infants from birth to 1 month of age. Arch Pediatr Adolesc Med. 1999;153:508–511.
- , , , et al. Management and outcomes of care of fever in early infancy. JAMA. 2004;291:1203–1212.
© 2015 Society of Hospital Medicine

Pneumococcal Vaccination and CAP
Community‐acquired pneumonia (CAP) ranks fifth among all causes of death and is the leading infectious cause of death among persons 65 years or older (hereafter elderly) in the US.[1] Of the 1.1 million short‐stay hospital discharges for pneumonia in 2010, 55% were for elderly patients.[2] The most common cause of pneumonia in elderly patients leading to hospitalization is infection with Streptococcus pneumoniae.[1, 3, 4, 5] The 23‐valent pneumococcal polysaccharide vaccine is recommended (PPSV23) for all elderly persons and has been shown to reduce incidences of invasive pneumococcal bacteremia among immunocompetent elderly individuals.[5] However, its effect on more common manifestations of pneumococcal disease, such as pneumonia, remains controversial.[5, 6, 7, 8]
Several studies examined the association between prior PV and in‐hospital outcomes for CAP in adult patients.[9, 10, 11] Although the effect of pneumococcal vaccination (PV) on inpatient mortality was inconclusive, the studies found shortened length of stay (LOS),[9, 10] lower risk of respiratory failure and other complications,[9] faster resolution of pneumonia symptoms,[10] and fewer intensive care unit (ICU) admissions,[11] among those with prior PV. These findings suggest potential additional benefits of PV in hospitalized CAP patients.
This study examined prior PV on in‐hospital outcomes in elderly veterans hospitalized for CAP. Because PV‐vaccinated patients are also more likely to have received influenza (flu) vaccination (FV),[9, 10, 11] which could independently or additively improve CAP outcomes in hospitalized elderly patients,[12, 13, 14] we attempted to separate out the effect of FV by stratifying patients into 4 subgroups: PV alone, FV alone, both, or neither. The priori hypothesis was that PV improves in‐hospital outcomes in elderly veterans hospitalized for CAP.
METHODS
Study Cohort
This study is a retrospective cohort study of all elderly veterans admitted to any Veterans Affairs (VA) hospitals for CAP during the fiscal year 2003 (FY'03) (October 1, 2002 to September 30, 2003). Inpatient admissions for pneumonia were defined based on the principal diagnosis of nonviral pneumonia (International Classification of Diseases, 9th Revision [ICD‐9], codes 481.xx487.0x). The principal diagnosis was defined as the condition determined to be the reason for the admission.[15] To select only CAP cases, we included admissions where patients were admitted either directly or through a VA outpatient clinic. We excluded transfers from another hospital, skilled nursing facilities, intermediate care facilities, or another healthcare facility. All patients were 65 years or older on the first day of the first admission in FY'03 (index admission) and had at least 1 outpatient visit to a VA facility each year during the 5 years prior to the index admission.
Data Source
Data were drawn from Veterans Health Administration medical SAS datasets (SAS Institute Inc.,
Cary, NC). Demographic characteristics, inpatient and outpatient care utilization, and related medical diagnoses and procedure codes were extracted from national patient data extracts. Selected lab test results were drawn from the Decision Support System national extracts. This study was approved by institutional review boards at the University of Arkansas for Medical Sciences and the Central Arkansas Veterans Healthcare System.
Prior Vaccination Status
Prior PV status was determined within 5 years prior to the index admission using: ICD‐9 codes V06.6, V06.8, and V03.82, ICD‐9 procedure code 99.55, or Current Procedure Terminology (CPT) codes 90732 and 90669.[16] This 5‐year time frame was chosen for 2 reasons: (1) the Centers for Disease Control and Prevention (CDC) recommends a second dose for elderly persons if the first dose was before age 65 years and more than 5 years have passed[17]; (2) effectiveness of PV decreases over time in elderly persons, especially after 5 years since vaccination.[5, 18] Consistent with the CDC's vaccination recommendation,[18] patients with no record of prior PV were classified as not vaccinated. Prior FV status was determined in the year before the index admission using: ICD‐9 code V04.8, ICD‐9 procedure code 99.52, or CPT codes 9065590660.[16] Based on prior vaccinations, patients were classified into 4 groups: PV alone, FV alone, both, or neither.
Outcome Variables
The primary outcomes were LOS and inpatient mortality. LOS, measured in days, was the duration of a hospital stay from admission to discharge, censored at death or transfer, the occurrence of which was ascertained via the discharge type field. Inpatient mortality was defined as death from any cause that occurred before discharge or transfer. The secondary outcomes were respiratory complications and any bacteremia identified via the diagnosis field of discharge records (see Supporting Information, Appendix Table A.1, in the online version of this article for a list of ICD‐9 codes).
| PV Only, n=1,347 | FV Only, n=1,698 | Both, n=1,668 | Neither, n=2,010 | P Value* | |
|---|---|---|---|---|---|
| |||||
| Age, median (IQR) | 77 (7181) | 77 (7281) | 77 (7181) | 77 (7282) | 0.0418 |
| 6574 years | 539 (40.0%) | 619 (36.5%) | 670 (40.2%) | 733 (36.5%) | 0.0051 |
| 7584 years | 635 (47.1%) | 892 (52.5%) | 836 (50.1%) | 1058 (52.6%) | |
| 85 years | 173 (12.8%) | 187 (11.0%) | 162 (9.7%) | 219 (10.9%) | |
| Male | 1318 (97.8%) | 1657 (97.6%) | 1638 (98.2%) | 1964 (97.7%) | 0.6378 |
| Race | |||||
| White | 848 (63.0%) | 1149 (67.7%) | 1097 (65.8%) | 1272 (63.3%) | <0.0003 |
| Nonwhite | 229 (17.0%) | 214 (12.6%) | 271 (16.2%) | 289 (14.4%) | |
| Unknown | 270 (20.0%) | 335 (19.7%) | 300 (18.0%) | 449 (22.3%) | |
| Married | 726 (53.9%) | 951 (56.0%) | 930 (55.8%) | 1043 (51.9%) | 0.0419 |
| No. of non‐mental health VA outpatient visits last year, median (IQR) | 17 (1027) | 21 (1332) | 22 (1434) | 15 (926) | <0.0001 |
| CAP hospitalization last year | 87 (6.5%) | 106 (6.2%) | 100 (6.0%) | 106 (5.3%) | 0.4689 |
| Respiratory conditions in past 30 days | 149 (11.1%) | 183 (10.8%) | 173 (10.4%) | 263 (13.1%) | 0.0424 |
| Charlson Comorbidity Index, median (IQR) | 2 (14) | 3 (14) | 3 (14) | 2 (14) | <0.0001 |
| Inpatient outcomes | |||||
| LOS, d, median(IQR) | 6 (410) | 5 (39) | 5 (39) | 6 (49) | 0.0077 |
| Death | 130 (9.7%) | 119 (7.0%) | 113 (6.8%) | 166 (8.3%) | 0.0127 |
| Bacteremia | 31 (2.3%) | 56 (3.3%) | 40 (2.4%) | 68 (3.4%) | 0.1204 |
| Respiratory complications | 200 (14.8%) | 192 (11.3%) | 185 (11.1%) | 253 (12.6%) | 0.0073 |
Covariates
Covariates included patients' demographic characteristics (age, gender, race, marital status) and Charlson Comorbidity Index scores. Comorbidities were identified during the year prior to the index admission using ICD‐9 diagnoses codes based on Deyo et al. adaptation.[19] Additionally, we included prior admission for CAP within the year preceding index admission, the number of outpatient visits (excluding mental health visits; ICD‐9 codes 290.xx319.xx) within the year preceding index admission, and acute respiratory conditions experienced within 30 days preceding index admission. Development of bacteremia and respiratory complications may increase LOS, and risk of mortality and were adjusted in the regression models for these outcomes.
Race
Missing race in VA administrative data is a well‐documented problem.[20] When available, missing race was imputed using information reported during a patient's other inpatient stays available in our data as follows. We first imputed it using the most frequently reported race category. If unavailable, race was imputed by the most recently reported race category whenever available. This imputation algorithm reduced the proportion of patients with missing race information in our data to from 76% to 20%. Remaining patients with missing race information after imputation were analyzed as a separate category.
Pneumonia Severity Index Score
For patients with available lab values, we constructed an abbreviated pneumonia severity index (PSI) score adapted from Escobar et al.[21] The original PSI score developed by the Pneumonia Patient Outcomes Research Team (PORT) is a validated clinical prediction tool that permits risk stratification with regard to the likelihood of adverse outcomes in CAP patients.[22] Calculation of the PORT score requires information on patient's physical examination and radiographic findings at admission,[22] which was unavailable to us. Escobar et al. developed and validated an abbreviated form of the PORT score (PSI‐E) in CAP patients that does not incorporate physical examination and radiographic findings.[21] We calculated the PSI‐E developed by Escobar et al. with the exception that arterial pH and PaO2 test results were omitted because they were not available in the VA lab result files for the years we examined.
Data Analysis
Patients' baseline characteristics (see Covariates) were compared across the 4 vaccination groups using the Kruskal‐Wallis test for continuous variables and [2] test for categorical variables. Multiple regression analyses were used to assess the effect of prior PV and FV on inpatient outcomes during the index admission while adjusting for covariates. LOS was analyzed using a generalized linear model (GLM) with a negative binomial distribution and a logarithmic link function,[23] and incidence rate ratios (IRRs) were reported. IRRs were calculated by taking the exponential of the estimated coefficients from the GLM and are interpretable as the relative change in mean LOS associated with a 1‐unit change in a predictor variable. Risk of inpatient mortality, and development of respiratory complications or bacteremia, were analyzed using logistic regressions, and odds ratios (ORs) were reported. All regression models adjusted for covariates as described earlier. In addition, we conducted propensity score matching of PV‐vaccinated (n=2937) and unvaccinated (n=2937) patients using the GMATCH algorithm.[24] Propensity scores were estimated using a logistic regression to predict prior PV based on covariates listed earlier and prior FV status. GLM or logistic regression models were applied to the matched sample, with PV as the only predictor to generate IRRs or ORs, respectively. To account for the matched nature of the data, analyses were stratified by matched pairs.[25]
Sensitivity Analysis
Many sensitivity analyses were performed that: (1) included patients admitted from nursing homes or other inpatient facilities (n=7296); (2) excluded 0‐night admissions (n=6678); (3) varied the minimum number of VA outpatient visits to 2, 3, 4, or 5 visits each year in the previous 5 years; and (4) adjusted for the abbreviated PSI score only in patients with available information (n=3689).
Flu Season
Defining prior FV status during the previous year may have included individuals who received FV for the previous flu season (eg, a patient was admitted in December 2003, but his or her last FV was in January 2003). We conducted 2 sensitivity analyses: (1) recoded patients who were last vaccinated in the previous flu season as unvaccinated and (2) restricted to index admissions occurred during the flu season (n=5311). A flu season was defined as from September to May of the following year.
Time Since Last PV
To determine if the effectiveness of PV varies by the years elapsed since vaccination, among those with prior PV, we further classified prior PV as within 1 year (1 year), 2 years (>1 but 2 years), 3 years (>2 but 3 years), 4 years (>3 but 4 years), or 5 years (>4 but 5 years) preceding the index admission. Two‐thirds of patients received PV more than 2 years ago. We re‐estimated the regression models with indicators for the number of years since the last PV (as defined above, PV within 1 year preceding index admission as the reference group).
All analyses were conducted using SAS software (SAS Institute, Inc.). A 2‐sided P value of <0.05 was used to determine statistical significance.
RESULTS
In FY'03, 10,540 elderly VA patients had at least 1 inpatient admission for nonviral pneumonia. Among them, 3242 were excluded due to lack of VA outpatient visits in at least 1 of the 5 years prior to the index admission. Additionally, 574 patients were excluded because they were transferred from nursing homes or other inpatient facilities. The final sample consisted of 6723 elderly patients; among them, 1347(20%) had only PV, 1698(25%) had only FV, 1668 (25%) had both, and 2010 (30%) had neither prior to admission (see Supporting Information, Appendix 1, in the online version of this article) (see Supporting Information, Appendix Figure A.1, in the online version of this article).
Table 1 compares patients' baseline characteristics and inpatient outcomes across vaccination groups. Patients with prior PV and FV had the shortest LOS and were least likely to experience respiratory complications or die during the inpatient stay. They also tended to be younger, had more frequent VA nonmental health outpatient visits in the previous year, and more medical comorbidities than other groups. Although these differences were statistically significant, the actual differences were small across the groups.
Table 2 presents findings from the adjusted regression analyses. After adjusting for covariates, having prior PV alone, FV alone, or both did not significantly affect the risk of inpatient mortality, compared to patients without records of either vaccination. However, having both prior PV and FV was associated with 10% reduction in LOS (IRR: 0.90; 95% confidence interval [CI]: 0.86‐0.95; P<0.0001). PV alone were associated with an increased risk of respiratory complications (OR: 1.23; 95% CI: 1.01‐1.51; P=0.0429) and trended toward a reduced risk of bacteremia (OR: 0.67; 95% CI: 0.43‐1.03; P=0.0673). After matching on patient characteristics including prior FV status, prior PV significantly lowered the risk of developing bacteremia (OR: 0.66; 95% CI: 0.48‐0.90; P=0.0088) but was not statistically significantly associated with the other outcomes (Table 3).
| Length of Stay (Days) | Inpatient Death | |||||
|---|---|---|---|---|---|---|
| Bacteremia | Respiratory Complications | |||||
| ||||||
| Vaccination status | IRR | 95% CI | P Value | OR | 95% CI | P Value |
| PV in previous 5 Years | 1.02 | 0.97‐1.07 | 0.4561 | 1.15 | 0.89‐1.50 | 0.2901 |
| FV last year | 0.97 | 0.92‐1.02 | 0.1920 | 0.90 | 0.69‐1.17 | 0.4193 |
| Both | 0.90 | 0.86‐0.95 | <0.0001 | 0.88 | 0.67‐1.16 | 0.3646 |
| Neither | Ref | Ref | ||||
| Vaccination status | OR | 95% CI | P Value | OR | 95% CI | P Value |
| PV in previous 5 Years | 0.67 | 0.43‐1.03 | 0.0673 | 1.23 | 1.01‐1.51 | 0.0429 |
| FV last year | 0.99 | 0.69‐1.42 | 0.9536 | 0.90 | 0.74‐1.10 | 0.3085 |
| Both | 0.72 | 0.48‐1.07 | 0.1047 | 0.87 | 0.71‐1.07 | 0.1860 |
| Neither | Ref | Ref | ||||
| In‐Hospital Outcomes, Matched Sample (n=5 874) | PV vs No PV | ||
|---|---|---|---|
| IRR/OR | 95% CI | P Value | |
| |||
| Length of stay | 0.97 | 0.93‐1.01 | 0.1502 |
| Inpatient death | 1.13 | 0.94‐1.37 | 0.2027 |
| Bacteremia | 0.66 | 0.48‐0.90 | 0.0088 |
| Respiratory complications | 1.11 | 0.95‐1.30 | 0.2018 |
Findings from sensitivity analyses are included in the online appendices. Results were generally robust to various sensitivity analyses. However, in the analysis using the subset of patients with available lab information to define the PSI‐E score, having prior FV alone was also found to be associated with reduced LOS (IRR: 0.92; 95% CI: 0.86‐0.98; P<0.05). The relationship between PV and in‐patient outcomes did not vary by the time since vaccination, which is consistent with Jackson et al.[11]
DISCUSSION
Consistent with previous findings,[7, 8, 9, 10, 11] elderly VA patients hospitalized for CAP were found to have an association between prior PV and reduced risk of bacteremia. However, no associations of prior PV alone with other in‐hospital outcomes (LOS, inpatient mortality, or development of respiratory complications) were consistently found. Although, FV was not associated with a decrease in inpatient mortality in this study, having had both prior PV and FV (not necessarily given at the same time) was found to be associated with shortened LOS.
Our findings were inconsistent with 3 previous studies of prior PV on in‐hospital outcomes among adult CAP patients. Those studies found shortened LOS,[9, 10] lower risk of respiratory failure and other complications,[9] faster resolution of pneumonia symptoms,[10] and fewer ICU admissions[11] among PV‐vaccinated patients. Subanalysis of elderly patients performed in 2 of the 3 studies demonstrated a comparable survival benefit[9] or protective effect on the composite outcome of ICU admission or death[11] among elderly patients compared to nonelderly patients. However, unlike our analysis, neither study excluded patients admitted from nursing home facilities. Our database, including patients admitted from nursing homes or other inpatient facilities, estimated a slightly more favorable effect of PV alone on inpatient mortality compared to our main analysis, although the estimate remained statistically insignificant (see Supporting Information, Appendix Table A.2, in the online version of this article).
In all 3 previous studies,[9, 10, 11] an overwhelming majority of PV vaccinated patients also received FV (Mykietiuk[10]: 90.2% in PV vaccinated vs 39.9% in unvaccinated; Fisman[9]: 70% vs 2.2%; Johnstone[11]: 88% vs 9%), making it harder to distinguish the effect of having only PV from that of having both PV and FV. By defining a separate group for having both vaccinations, we found that having both PV and FV reduced LOS relative to PV alone or having had neither vaccinations. This suggests that PV alone may not be as effective in improving inpatient outcomes as shown in the previous studies, although limitations of our study prevented us from making a deterministic conclusion.
Our findings of no beneficial effects of PV alone on in‐hospital outcomes for CAP other than bacteremia in the elderly VA patients are supported by previous findings of no effect of PV on all‐cause pneumonia and all‐cause mortality,[4, 7, 8] decreasing antibody response to PV,[26, 27, 28] and decreasing vaccine effectiveness over time in the elderly patients.[5, 18] Also, in a study of patients who were previously hospitalized for CAP, PV at discharge was not associated with prevention of subsequent hospitalization for CAP or death from all causes.[29]
PV alone was found to be associated with an increased risk of respiratory complications using an unmatched sample, and this finding appears to be robust to several variations in the sample selection process (see Supporting Information, Appendix, in the online version of this article). This paradoxical finding may be a result of residual confounding despite our efforts to control for baseline differences in patients' characteristics. Using propensity matching where only those with similar observed characteristics, including comorbidity burden, were compared, the result was no longer statistically significant, although still trended in the same direction.
Up until recently, PPSV23 was the only pneumococcal vaccine recommended for all elderly individuals 65 years or older. Since September 2014, 13‐valent pneumococcal conjugate vaccine (PCV13) has also been recommended for all elderly persons in the United States. PCV13 became available in 2010 and was initially recommended only for routine use in children ages 2 to 59 months. Early evidence indicated some herd effect in adults associated with the use of PCV13 in children; however, the effect was not statistically significant in all age groups.[30] Because at the time of the study elderly patients were not vaccinated by other pneumococcal vaccines, and PCV13 was not yet in use in children, this strengthens the findings in terms of evaluating the efficacy of PPSV23, because the association was not attenuated by the herd effect of PCV13 in children or having both PPSV23 and PCV13 in the elderly population. The recent recommendation to vaccinate all elderly adults with PCV13 was based on findings from an industry‐supported placebo‐controlled trial of pneumococcal vaccine nave patients.[31] It is unknown whether PCV13 is more effective than PPSV23 in elderly adults and whether giving both would have any additional benefit in the elderly population. Future studies with population wide data on PCV13 use in elderly adults are needed.
Limitations
The major limitation for generalizing to all elderly population is that we studied elderly veterans who are almost exclusively males (98%). Previous studies have found males are at higher risk of acquiring CAP,[32] to die from CAP,[33] and to be hospitalized for CAP.[34] Vaccine effectiveness was also found to be higher in women than men.[35] These suggest that our finding may not generalize to female patients admitted for CAP.
Another important limitation is that if PV and/or FV are truly effective in reducing hospitalizations for pneumonia, then those who were hospitalized despite prior vaccinations potentially may have more severe disease and/or be less responsive to the vaccines than unvaccinated patients. If so, this potential selection bias would bias our results toward null, and may partially explain our insignificant findings of PV alone on inpatient outcomes and the low vaccination rates observed in this study.
By focusing on elderly patients admitted for CAP, our cohort is more homogeneous than many previous studies, given that PV was recommended for all elderly persons at the time of the study, and all patients in our study had CAP. Nonetheless, unmeasured selection bias may exist and could partially explain the lack of estimated beneficial effect. In particular, the PSI score could not be calculated for the whole sample due to lack of data availability. In a subsample of patients with available information to calculate the abbreviated PSI score, we continued to find no significant beneficial effect of PV on outcomes other than bacteremia.
Other limitations included the possibility that prior vaccination status may have been misclassified because of (1) the use of diagnosis and procedure codes to identify prior vaccination status and (2) the lack of linked Medicare data to obtain the complete medical service utilization history of the elderly patients with dual coverage. To address the second issue, we selected patients with at least 1 VA outpatient visit each year in the previous 5 years of the index admission, hoping to identify patients who were more likely to be VA service users. In sensitivity analyses, we further restricted our data to only patients with at least 2, 3, 4, or 5 visits per year, respectively, in the previous 5 years, and the results were generally robust to these variations (see Supporting Information, Appendix Tables A.2 and A.3, in the online version of this article). Although higher vaccination rates have been reported previously (PV: 81%89%; FV: 79%80%) for all elderly veterans in 2003,[36, 37] a lower vaccination rate may be expected among hospitalized patients for CAP, if PV and/or FV are effective in reducing hospitalizations for pneumonia as reported in previous studies.[36, 38, 39] The lower PV rate observed among hospitalized elderly patients in this study is similar to another study of hospitalized elderly patients (50% prior PV rate),[40] and is consistent with the low prior PV rates reported in other studies of CAP‐hospitalized patients, which ranges from 11% to 22%.[9, 10, 11]
Cases of CAP admissions were identified based on principal diagnosis of pneumonia. This increased precision in the identified cases but may have underidentified CAP admissions. ICD‐9 code 481.0x (influenza with pneumonia) was also used for case identification, similar to other studies[4, 9, 12, 41]; excluding this code only excluded a few and did not affect the findings. Relying exclusively on diagnosis codes to detect pneumonia may also lead to misclassification due to coding errors. The gold standard to confirm pneumonia was with x‐ray. However, such information was not available in our data.
We did not have bacteriological data to study the pneumococcal‐specific outcomes, such as pneumococcal pneumonia or pneumococcal bacteremia, which the pneumococcal vaccine is designed to protect against. Diagnosis codes for the pneumococcal‐specific outcomes have low sensitivity,[42] and will significantly underidentify those cases. This limitation will bias our result toward null, which may partially explain the insignificant findings.
CONCLUSIONS
In this study of elderly VA patients admitted for CAP, we did not find significant effects of prior PV on LOS, inpatient mortality, or respiratory complications. Although given the limitations of this study, we could not conclusively say that PV has no effect on these outcomes. Nonetheless, our findings and the findings of no significant protective effect on overall mortality and decreasing antibody response to vaccines in the elderly from other studies, does raise the question of whether the previously reported beneficial effects on in‐hospital outcomes for CAP in adults could be generalized to elderly patients. Larger electronic medical record databases with more complete information on patients' vaccination history are needed to confirm these findings. Nonetheless, given its protective effect against invasive diseases,[7, 8] the economic benefits shown,[43, 44] and relative safety, PV should still be recommended for all elderly persons, especially very old and frail nursing home residents.[45] However, significant survival benefit and improved in‐hospital outcomes for CAP as reported in previous studies may not be expected in elderly patients with prior PV, particularly if vaccination was given more than 5 years ago. This study also supports the recommendation of FV in the elderly population. Although, FV was not associated with a decrease in inpatient mortality in this study, having both PV and FV was found to be associated with shortened LOS.
Disclosures
This study was supported by the Medical Research Endowment Fund of University of Arkansas for Medical Sciences awarded to C. Li. The funding agency had no role in the study design; collection, analysis, and interpretation of data; writing of the report; or the decision to submit the article for publication. The views expressed in this article are those of the authors and do not necessarily reflect the position or policy of the Department of Veterans Affairs or the United States government. All coauthors have seen and agree with the contents of the manuscript; the submission (aside from abstracts) is not under review by any other publication. All coauthors have contributed to the concept and design of the study, analysis and interpretation of data, and/or development of the manuscript. The manuscript was reviewed and revised by the coauthors to ensure that important intellectual content has been included in the final published version. C. Li is a consultant to eMaxHealth Systems on unrelated studies. The authors disclose no conflicts of interest with this study.
- , , , . Community‐acquired pneumonia in elderly patients. Aging Health. 2009;5(6):763–774.
- CDC/NCHS National Hospital Discharge Survey, 2010. Number of discharges from short‐stay hospitals, by first‐listed diagnosis and age: United States, 2010. National Center for Health Statistics. Available at: http://www.cdc.gov/nchs/data/nhds/3firstlisted/2010first3_numberage.pdf. Accessed July 14, 2014.
- , . Community‐acquired pneumonia in the elderly. Am J Geriatr Pharmacother. 2010;8(1):47–62.
- , , , et al. Effectiveness of pneumococcal polysaccharide vaccine in older adults. N Engl J Med. 2003;348:1747–1754.
- , . Pneumococcal vaccination of elderly adults: new paradigms for protection. Clin Infect Dis. 2008;47(10):1328–1338.
- , . The 23‐valent pneumococcal polysaccharide vaccine. Part 1. Efficacy of PPV in the elderly: a comparison of meta‐analysis. Eur J Epidemiol. 2004;19:353–363.
- , , , . Vaccines for preventing pneumococcal infection in adults. Cochrane Database Syst Rev. 2008;(1):CD000422.
- , , , , . Efficacy of pneumococcal vaccination in adults: a meta‐analysis. CMAJ. 2009;180(1):48–58.
- , , , , , . Prior pneumococcal vaccination is associated with reduced death, complications, and length of stay among hospitalized adults with community‐acquired pneumonia. Clin Infect Dis. 2006;42:1093–1101.
- , , , et al. Effect of prior pneumococcal vaccination on clinical outcome of hospitalized adults with community‐acquired pneumococcal pneumonia. Eur J Clin Microbiol Infect Dis. 2006;25:257–462.
- , , , . Effect of pneumococcal vaccination in hospitalized adults with community‐acquired pneumonia. Arch Intern Med. 2007;167:1938–1943.
- , , , , , . Influenza vaccination and risk of mortality among adults hospitalized with community‐acquired pneumonia. Arch Intern Med. 2007;167:53–59.
- , , , , , . Efficacy and effectiveness of influenza vaccines in elderly people: a systematic review. Lancet. 2005;366:1165–1174.
- , , , , . Effectiveness of influenza vaccine in the community‐dwelling elderly. N Engl J Med. 2007;357:1373–1381.
- VIReC Research User Guide: FY2002 VHA Medical SAS Inpatient Datasets. Hines, IL: Veterans Affairs Information Resource Center; 2003.
- Immunization Information Systems, Centers for Disease Control and Prevention. CPT codes mapped to CVX codes. Available at: http://www2a.cdc.gov/vaccines/iis/iisstandards/vaccines.asp?rpt=cpt. Accessed December 2, 2014.
- Centers for Disease Control and Prevention. Pneumococcal polysaccharide vaccine information statement. Available at: http://www.cdc.gov/vaccines/hcp/vis/vis‐statements/ppv.html. Accessed December 2, 2014.
- , , , et al. The protective efficacy of polyvalent pneumococcal polysaccharide vaccine. N Engl J Med. 1991;325:1453–1460.
- , , . Adapting a clinical comorbidity index for use with ICD‐9‐CM Administrative Databases. J Clin Epidemiol. 1992;45(6):613–619.
- , , , . Missing race/ethnicity data in Veterans Health Administration based disparities research: a systematic review. J Health Care Poor Underserved. 2006;17:128–140.
- , , , et al. Risk adjusting community‐acquired pneumonia hospital outcomes using automated databases. Am J Manag Care. 2008;14(3):158–166.
- , , , et al. A prediction rule to identify low‐risk patients with community‐acquired pneumonia. N Engl J Med. 1997;336:243–250.
- , , . A comparison of statistical modeling strategies for analyzing length of stay after CABG surgery. Health Serv Outcomes Res Methodol. 2002;3:107–133.
- , . GMATCH SAS macro. Available at: http://www.mayo.edu/research/documents/gmatchsas/DOC‐10027248. Accessed December 2, 2014.
- , , , . Analysis of Observational Health Care Data Using SAS. Cary, NC: SAS Institute; 2010.
- , , . Pneumococcal vaccination in older adults induces antibodies with low opsonic capacity and reduced antibody potency. Vaccine. 2008;26:5521–5526.
- , , . The effect of age on the response to the pneumococcal polysaccharide vaccine. BMC Infect Dis. 2010;10:60.
- , . Older adults have a low capacity to opsonize pneumococci due to low IgM antibody response to pneumococcal vaccinations. Infect Immun. 2011;79(1):314–320.
- , , , , . Impact of the pneumococcal vaccine on long‐term morbidity and mortality of adults at high risk for pneumonia. Clin Infect Dis. 2010;51(1):15–22.
- , , , , , . Effect of 13‐valent pneumococcal conjugate vaccine on admissions to hospital 2 years after its introduction in the USA: a time series analysis. Lancet Respir Med. 2014;2(5):387–394.
- American Academy of Family Physicians. ACIP recommends routine PCV13 immunization for adults 65 and older. Available at: http://www.aafp.org/news/health‐of‐the‐public/20140827pcv13vote.html. Accessed December 2, 2012.
- , , , et al. The burden of community‐acquired pneumonia in seniors: results of a population‐based study. Clin Infect Dis. 2004;39:1642–1650.
- , , , et al. Bacteremia with Streptococcus pneumoniae: sepsis and other risk factors for 30‐day mortality‐a hospital‐based cohort study. Eur J Clin Microbiol Infect Dis. 2012;13(10):2719–2725.
- , , , , . Trends in hospitalizations for pneumonia among persons aged 65 years or older in the United States, 1988–2002. JAMA. 2005;294(21):2712–2719.
- , , , et al. The effectiveness of the polysaccharide pneumococcal vaccine for the prevention of hospitalizations due to Streptococcus pneumoniae community‐acquired pneumonia in the elderly differs between the sexes: results from the Community‐Acquired Pneumonia Organization (CAPO) international cohort study. Vaccine. 2014;17:32(19):2198–2203.
- , , . Performance measures, vaccinations, and pneumonia rates among high‐risk patients in Veterans Administration health care. Am J Public Health. 2007;97(12):2167–2172.
- , , . Influenza and pneumococcal vaccination in older veterans: results from the Behavioral Risk Factor Surveillance System. J Am Geriatr Soc. 2006;54:217–223.
- , , , . The efficacy and cost effectiveness of vaccination against influenza among elderly persons living in the community. N Engl J Med. 1994;331:778–784.
- , , , . The health and economic benefits associated with pneumococcal vaccination of elderly persons with chronic lung disease. Arch Intern Med. 1999;159:2437–2442.
- , , . Pneumococcal vaccination in hospitalized elderly patients: role of the pharmacist. Pharmacotherapy. 2003;2(23):199–208.
- , , , . Accuracy of administrative data for identifying patients with pneumonia. Am J Med Qual. 2005;30:319–328.
- , , , , . International classification of diseases codes showed modest sensitivity for detecting community‐acquired pneumonia. J Clin Epidemiol. 2007;60(8):834–838.
- , , , et al. Cost‐effectiveness of pneumococcal vaccination of older people: a study in 5 western European countries. Clin Infect Dis. 2000;31:444–450.
- , , , et al. Cost‐effectiveness of pneumococcal vaccination for prevention of invasive pneumococcal disease in the elderly: an update for 10 Western European countries. Eur J Clin Microbiol Infect Dis. 2007;26(8):531–540.
- , , , et al. Efficacy of 23‐valent pneumococcal vaccine in preventing pneumonia and improving survival in nursing home residents: double blind, randomised and placebo controlled trial. BMJ. 2010;340:c1004.
Community‐acquired pneumonia (CAP) ranks fifth among all causes of death and is the leading infectious cause of death among persons 65 years or older (hereafter elderly) in the US.[1] Of the 1.1 million short‐stay hospital discharges for pneumonia in 2010, 55% were for elderly patients.[2] The most common cause of pneumonia in elderly patients leading to hospitalization is infection with Streptococcus pneumoniae.[1, 3, 4, 5] The 23‐valent pneumococcal polysaccharide vaccine is recommended (PPSV23) for all elderly persons and has been shown to reduce incidences of invasive pneumococcal bacteremia among immunocompetent elderly individuals.[5] However, its effect on more common manifestations of pneumococcal disease, such as pneumonia, remains controversial.[5, 6, 7, 8]
Several studies examined the association between prior PV and in‐hospital outcomes for CAP in adult patients.[9, 10, 11] Although the effect of pneumococcal vaccination (PV) on inpatient mortality was inconclusive, the studies found shortened length of stay (LOS),[9, 10] lower risk of respiratory failure and other complications,[9] faster resolution of pneumonia symptoms,[10] and fewer intensive care unit (ICU) admissions,[11] among those with prior PV. These findings suggest potential additional benefits of PV in hospitalized CAP patients.
This study examined prior PV on in‐hospital outcomes in elderly veterans hospitalized for CAP. Because PV‐vaccinated patients are also more likely to have received influenza (flu) vaccination (FV),[9, 10, 11] which could independently or additively improve CAP outcomes in hospitalized elderly patients,[12, 13, 14] we attempted to separate out the effect of FV by stratifying patients into 4 subgroups: PV alone, FV alone, both, or neither. The priori hypothesis was that PV improves in‐hospital outcomes in elderly veterans hospitalized for CAP.
METHODS
Study Cohort
This study is a retrospective cohort study of all elderly veterans admitted to any Veterans Affairs (VA) hospitals for CAP during the fiscal year 2003 (FY'03) (October 1, 2002 to September 30, 2003). Inpatient admissions for pneumonia were defined based on the principal diagnosis of nonviral pneumonia (International Classification of Diseases, 9th Revision [ICD‐9], codes 481.xx487.0x). The principal diagnosis was defined as the condition determined to be the reason for the admission.[15] To select only CAP cases, we included admissions where patients were admitted either directly or through a VA outpatient clinic. We excluded transfers from another hospital, skilled nursing facilities, intermediate care facilities, or another healthcare facility. All patients were 65 years or older on the first day of the first admission in FY'03 (index admission) and had at least 1 outpatient visit to a VA facility each year during the 5 years prior to the index admission.
Data Source
Data were drawn from Veterans Health Administration medical SAS datasets (SAS Institute Inc.,
Cary, NC). Demographic characteristics, inpatient and outpatient care utilization, and related medical diagnoses and procedure codes were extracted from national patient data extracts. Selected lab test results were drawn from the Decision Support System national extracts. This study was approved by institutional review boards at the University of Arkansas for Medical Sciences and the Central Arkansas Veterans Healthcare System.
Prior Vaccination Status
Prior PV status was determined within 5 years prior to the index admission using: ICD‐9 codes V06.6, V06.8, and V03.82, ICD‐9 procedure code 99.55, or Current Procedure Terminology (CPT) codes 90732 and 90669.[16] This 5‐year time frame was chosen for 2 reasons: (1) the Centers for Disease Control and Prevention (CDC) recommends a second dose for elderly persons if the first dose was before age 65 years and more than 5 years have passed[17]; (2) effectiveness of PV decreases over time in elderly persons, especially after 5 years since vaccination.[5, 18] Consistent with the CDC's vaccination recommendation,[18] patients with no record of prior PV were classified as not vaccinated. Prior FV status was determined in the year before the index admission using: ICD‐9 code V04.8, ICD‐9 procedure code 99.52, or CPT codes 9065590660.[16] Based on prior vaccinations, patients were classified into 4 groups: PV alone, FV alone, both, or neither.
Outcome Variables
The primary outcomes were LOS and inpatient mortality. LOS, measured in days, was the duration of a hospital stay from admission to discharge, censored at death or transfer, the occurrence of which was ascertained via the discharge type field. Inpatient mortality was defined as death from any cause that occurred before discharge or transfer. The secondary outcomes were respiratory complications and any bacteremia identified via the diagnosis field of discharge records (see Supporting Information, Appendix Table A.1, in the online version of this article for a list of ICD‐9 codes).
| PV Only, n=1,347 | FV Only, n=1,698 | Both, n=1,668 | Neither, n=2,010 | P Value* | |
|---|---|---|---|---|---|
| |||||
| Age, median (IQR) | 77 (7181) | 77 (7281) | 77 (7181) | 77 (7282) | 0.0418 |
| 6574 years | 539 (40.0%) | 619 (36.5%) | 670 (40.2%) | 733 (36.5%) | 0.0051 |
| 7584 years | 635 (47.1%) | 892 (52.5%) | 836 (50.1%) | 1058 (52.6%) | |
| 85 years | 173 (12.8%) | 187 (11.0%) | 162 (9.7%) | 219 (10.9%) | |
| Male | 1318 (97.8%) | 1657 (97.6%) | 1638 (98.2%) | 1964 (97.7%) | 0.6378 |
| Race | |||||
| White | 848 (63.0%) | 1149 (67.7%) | 1097 (65.8%) | 1272 (63.3%) | <0.0003 |
| Nonwhite | 229 (17.0%) | 214 (12.6%) | 271 (16.2%) | 289 (14.4%) | |
| Unknown | 270 (20.0%) | 335 (19.7%) | 300 (18.0%) | 449 (22.3%) | |
| Married | 726 (53.9%) | 951 (56.0%) | 930 (55.8%) | 1043 (51.9%) | 0.0419 |
| No. of non‐mental health VA outpatient visits last year, median (IQR) | 17 (1027) | 21 (1332) | 22 (1434) | 15 (926) | <0.0001 |
| CAP hospitalization last year | 87 (6.5%) | 106 (6.2%) | 100 (6.0%) | 106 (5.3%) | 0.4689 |
| Respiratory conditions in past 30 days | 149 (11.1%) | 183 (10.8%) | 173 (10.4%) | 263 (13.1%) | 0.0424 |
| Charlson Comorbidity Index, median (IQR) | 2 (14) | 3 (14) | 3 (14) | 2 (14) | <0.0001 |
| Inpatient outcomes | |||||
| LOS, d, median(IQR) | 6 (410) | 5 (39) | 5 (39) | 6 (49) | 0.0077 |
| Death | 130 (9.7%) | 119 (7.0%) | 113 (6.8%) | 166 (8.3%) | 0.0127 |
| Bacteremia | 31 (2.3%) | 56 (3.3%) | 40 (2.4%) | 68 (3.4%) | 0.1204 |
| Respiratory complications | 200 (14.8%) | 192 (11.3%) | 185 (11.1%) | 253 (12.6%) | 0.0073 |
Covariates
Covariates included patients' demographic characteristics (age, gender, race, marital status) and Charlson Comorbidity Index scores. Comorbidities were identified during the year prior to the index admission using ICD‐9 diagnoses codes based on Deyo et al. adaptation.[19] Additionally, we included prior admission for CAP within the year preceding index admission, the number of outpatient visits (excluding mental health visits; ICD‐9 codes 290.xx319.xx) within the year preceding index admission, and acute respiratory conditions experienced within 30 days preceding index admission. Development of bacteremia and respiratory complications may increase LOS, and risk of mortality and were adjusted in the regression models for these outcomes.
Race
Missing race in VA administrative data is a well‐documented problem.[20] When available, missing race was imputed using information reported during a patient's other inpatient stays available in our data as follows. We first imputed it using the most frequently reported race category. If unavailable, race was imputed by the most recently reported race category whenever available. This imputation algorithm reduced the proportion of patients with missing race information in our data to from 76% to 20%. Remaining patients with missing race information after imputation were analyzed as a separate category.
Pneumonia Severity Index Score
For patients with available lab values, we constructed an abbreviated pneumonia severity index (PSI) score adapted from Escobar et al.[21] The original PSI score developed by the Pneumonia Patient Outcomes Research Team (PORT) is a validated clinical prediction tool that permits risk stratification with regard to the likelihood of adverse outcomes in CAP patients.[22] Calculation of the PORT score requires information on patient's physical examination and radiographic findings at admission,[22] which was unavailable to us. Escobar et al. developed and validated an abbreviated form of the PORT score (PSI‐E) in CAP patients that does not incorporate physical examination and radiographic findings.[21] We calculated the PSI‐E developed by Escobar et al. with the exception that arterial pH and PaO2 test results were omitted because they were not available in the VA lab result files for the years we examined.
Data Analysis
Patients' baseline characteristics (see Covariates) were compared across the 4 vaccination groups using the Kruskal‐Wallis test for continuous variables and [2] test for categorical variables. Multiple regression analyses were used to assess the effect of prior PV and FV on inpatient outcomes during the index admission while adjusting for covariates. LOS was analyzed using a generalized linear model (GLM) with a negative binomial distribution and a logarithmic link function,[23] and incidence rate ratios (IRRs) were reported. IRRs were calculated by taking the exponential of the estimated coefficients from the GLM and are interpretable as the relative change in mean LOS associated with a 1‐unit change in a predictor variable. Risk of inpatient mortality, and development of respiratory complications or bacteremia, were analyzed using logistic regressions, and odds ratios (ORs) were reported. All regression models adjusted for covariates as described earlier. In addition, we conducted propensity score matching of PV‐vaccinated (n=2937) and unvaccinated (n=2937) patients using the GMATCH algorithm.[24] Propensity scores were estimated using a logistic regression to predict prior PV based on covariates listed earlier and prior FV status. GLM or logistic regression models were applied to the matched sample, with PV as the only predictor to generate IRRs or ORs, respectively. To account for the matched nature of the data, analyses were stratified by matched pairs.[25]
Sensitivity Analysis
Many sensitivity analyses were performed that: (1) included patients admitted from nursing homes or other inpatient facilities (n=7296); (2) excluded 0‐night admissions (n=6678); (3) varied the minimum number of VA outpatient visits to 2, 3, 4, or 5 visits each year in the previous 5 years; and (4) adjusted for the abbreviated PSI score only in patients with available information (n=3689).
Flu Season
Defining prior FV status during the previous year may have included individuals who received FV for the previous flu season (eg, a patient was admitted in December 2003, but his or her last FV was in January 2003). We conducted 2 sensitivity analyses: (1) recoded patients who were last vaccinated in the previous flu season as unvaccinated and (2) restricted to index admissions occurred during the flu season (n=5311). A flu season was defined as from September to May of the following year.
Time Since Last PV
To determine if the effectiveness of PV varies by the years elapsed since vaccination, among those with prior PV, we further classified prior PV as within 1 year (1 year), 2 years (>1 but 2 years), 3 years (>2 but 3 years), 4 years (>3 but 4 years), or 5 years (>4 but 5 years) preceding the index admission. Two‐thirds of patients received PV more than 2 years ago. We re‐estimated the regression models with indicators for the number of years since the last PV (as defined above, PV within 1 year preceding index admission as the reference group).
All analyses were conducted using SAS software (SAS Institute, Inc.). A 2‐sided P value of <0.05 was used to determine statistical significance.
RESULTS
In FY'03, 10,540 elderly VA patients had at least 1 inpatient admission for nonviral pneumonia. Among them, 3242 were excluded due to lack of VA outpatient visits in at least 1 of the 5 years prior to the index admission. Additionally, 574 patients were excluded because they were transferred from nursing homes or other inpatient facilities. The final sample consisted of 6723 elderly patients; among them, 1347(20%) had only PV, 1698(25%) had only FV, 1668 (25%) had both, and 2010 (30%) had neither prior to admission (see Supporting Information, Appendix 1, in the online version of this article) (see Supporting Information, Appendix Figure A.1, in the online version of this article).
Table 1 compares patients' baseline characteristics and inpatient outcomes across vaccination groups. Patients with prior PV and FV had the shortest LOS and were least likely to experience respiratory complications or die during the inpatient stay. They also tended to be younger, had more frequent VA nonmental health outpatient visits in the previous year, and more medical comorbidities than other groups. Although these differences were statistically significant, the actual differences were small across the groups.
Table 2 presents findings from the adjusted regression analyses. After adjusting for covariates, having prior PV alone, FV alone, or both did not significantly affect the risk of inpatient mortality, compared to patients without records of either vaccination. However, having both prior PV and FV was associated with 10% reduction in LOS (IRR: 0.90; 95% confidence interval [CI]: 0.86‐0.95; P<0.0001). PV alone were associated with an increased risk of respiratory complications (OR: 1.23; 95% CI: 1.01‐1.51; P=0.0429) and trended toward a reduced risk of bacteremia (OR: 0.67; 95% CI: 0.43‐1.03; P=0.0673). After matching on patient characteristics including prior FV status, prior PV significantly lowered the risk of developing bacteremia (OR: 0.66; 95% CI: 0.48‐0.90; P=0.0088) but was not statistically significantly associated with the other outcomes (Table 3).
| Length of Stay (Days) | Inpatient Death | |||||
|---|---|---|---|---|---|---|
| Bacteremia | Respiratory Complications | |||||
| ||||||
| Vaccination status | IRR | 95% CI | P Value | OR | 95% CI | P Value |
| PV in previous 5 Years | 1.02 | 0.97‐1.07 | 0.4561 | 1.15 | 0.89‐1.50 | 0.2901 |
| FV last year | 0.97 | 0.92‐1.02 | 0.1920 | 0.90 | 0.69‐1.17 | 0.4193 |
| Both | 0.90 | 0.86‐0.95 | <0.0001 | 0.88 | 0.67‐1.16 | 0.3646 |
| Neither | Ref | Ref | ||||
| Vaccination status | OR | 95% CI | P Value | OR | 95% CI | P Value |
| PV in previous 5 Years | 0.67 | 0.43‐1.03 | 0.0673 | 1.23 | 1.01‐1.51 | 0.0429 |
| FV last year | 0.99 | 0.69‐1.42 | 0.9536 | 0.90 | 0.74‐1.10 | 0.3085 |
| Both | 0.72 | 0.48‐1.07 | 0.1047 | 0.87 | 0.71‐1.07 | 0.1860 |
| Neither | Ref | Ref | ||||
| In‐Hospital Outcomes, Matched Sample (n=5 874) | PV vs No PV | ||
|---|---|---|---|
| IRR/OR | 95% CI | P Value | |
| |||
| Length of stay | 0.97 | 0.93‐1.01 | 0.1502 |
| Inpatient death | 1.13 | 0.94‐1.37 | 0.2027 |
| Bacteremia | 0.66 | 0.48‐0.90 | 0.0088 |
| Respiratory complications | 1.11 | 0.95‐1.30 | 0.2018 |
Findings from sensitivity analyses are included in the online appendices. Results were generally robust to various sensitivity analyses. However, in the analysis using the subset of patients with available lab information to define the PSI‐E score, having prior FV alone was also found to be associated with reduced LOS (IRR: 0.92; 95% CI: 0.86‐0.98; P<0.05). The relationship between PV and in‐patient outcomes did not vary by the time since vaccination, which is consistent with Jackson et al.[11]
DISCUSSION
Consistent with previous findings,[7, 8, 9, 10, 11] elderly VA patients hospitalized for CAP were found to have an association between prior PV and reduced risk of bacteremia. However, no associations of prior PV alone with other in‐hospital outcomes (LOS, inpatient mortality, or development of respiratory complications) were consistently found. Although, FV was not associated with a decrease in inpatient mortality in this study, having had both prior PV and FV (not necessarily given at the same time) was found to be associated with shortened LOS.
Our findings were inconsistent with 3 previous studies of prior PV on in‐hospital outcomes among adult CAP patients. Those studies found shortened LOS,[9, 10] lower risk of respiratory failure and other complications,[9] faster resolution of pneumonia symptoms,[10] and fewer ICU admissions[11] among PV‐vaccinated patients. Subanalysis of elderly patients performed in 2 of the 3 studies demonstrated a comparable survival benefit[9] or protective effect on the composite outcome of ICU admission or death[11] among elderly patients compared to nonelderly patients. However, unlike our analysis, neither study excluded patients admitted from nursing home facilities. Our database, including patients admitted from nursing homes or other inpatient facilities, estimated a slightly more favorable effect of PV alone on inpatient mortality compared to our main analysis, although the estimate remained statistically insignificant (see Supporting Information, Appendix Table A.2, in the online version of this article).
In all 3 previous studies,[9, 10, 11] an overwhelming majority of PV vaccinated patients also received FV (Mykietiuk[10]: 90.2% in PV vaccinated vs 39.9% in unvaccinated; Fisman[9]: 70% vs 2.2%; Johnstone[11]: 88% vs 9%), making it harder to distinguish the effect of having only PV from that of having both PV and FV. By defining a separate group for having both vaccinations, we found that having both PV and FV reduced LOS relative to PV alone or having had neither vaccinations. This suggests that PV alone may not be as effective in improving inpatient outcomes as shown in the previous studies, although limitations of our study prevented us from making a deterministic conclusion.
Our findings of no beneficial effects of PV alone on in‐hospital outcomes for CAP other than bacteremia in the elderly VA patients are supported by previous findings of no effect of PV on all‐cause pneumonia and all‐cause mortality,[4, 7, 8] decreasing antibody response to PV,[26, 27, 28] and decreasing vaccine effectiveness over time in the elderly patients.[5, 18] Also, in a study of patients who were previously hospitalized for CAP, PV at discharge was not associated with prevention of subsequent hospitalization for CAP or death from all causes.[29]
PV alone was found to be associated with an increased risk of respiratory complications using an unmatched sample, and this finding appears to be robust to several variations in the sample selection process (see Supporting Information, Appendix, in the online version of this article). This paradoxical finding may be a result of residual confounding despite our efforts to control for baseline differences in patients' characteristics. Using propensity matching where only those with similar observed characteristics, including comorbidity burden, were compared, the result was no longer statistically significant, although still trended in the same direction.
Up until recently, PPSV23 was the only pneumococcal vaccine recommended for all elderly individuals 65 years or older. Since September 2014, 13‐valent pneumococcal conjugate vaccine (PCV13) has also been recommended for all elderly persons in the United States. PCV13 became available in 2010 and was initially recommended only for routine use in children ages 2 to 59 months. Early evidence indicated some herd effect in adults associated with the use of PCV13 in children; however, the effect was not statistically significant in all age groups.[30] Because at the time of the study elderly patients were not vaccinated by other pneumococcal vaccines, and PCV13 was not yet in use in children, this strengthens the findings in terms of evaluating the efficacy of PPSV23, because the association was not attenuated by the herd effect of PCV13 in children or having both PPSV23 and PCV13 in the elderly population. The recent recommendation to vaccinate all elderly adults with PCV13 was based on findings from an industry‐supported placebo‐controlled trial of pneumococcal vaccine nave patients.[31] It is unknown whether PCV13 is more effective than PPSV23 in elderly adults and whether giving both would have any additional benefit in the elderly population. Future studies with population wide data on PCV13 use in elderly adults are needed.
Limitations
The major limitation for generalizing to all elderly population is that we studied elderly veterans who are almost exclusively males (98%). Previous studies have found males are at higher risk of acquiring CAP,[32] to die from CAP,[33] and to be hospitalized for CAP.[34] Vaccine effectiveness was also found to be higher in women than men.[35] These suggest that our finding may not generalize to female patients admitted for CAP.
Another important limitation is that if PV and/or FV are truly effective in reducing hospitalizations for pneumonia, then those who were hospitalized despite prior vaccinations potentially may have more severe disease and/or be less responsive to the vaccines than unvaccinated patients. If so, this potential selection bias would bias our results toward null, and may partially explain our insignificant findings of PV alone on inpatient outcomes and the low vaccination rates observed in this study.
By focusing on elderly patients admitted for CAP, our cohort is more homogeneous than many previous studies, given that PV was recommended for all elderly persons at the time of the study, and all patients in our study had CAP. Nonetheless, unmeasured selection bias may exist and could partially explain the lack of estimated beneficial effect. In particular, the PSI score could not be calculated for the whole sample due to lack of data availability. In a subsample of patients with available information to calculate the abbreviated PSI score, we continued to find no significant beneficial effect of PV on outcomes other than bacteremia.
Other limitations included the possibility that prior vaccination status may have been misclassified because of (1) the use of diagnosis and procedure codes to identify prior vaccination status and (2) the lack of linked Medicare data to obtain the complete medical service utilization history of the elderly patients with dual coverage. To address the second issue, we selected patients with at least 1 VA outpatient visit each year in the previous 5 years of the index admission, hoping to identify patients who were more likely to be VA service users. In sensitivity analyses, we further restricted our data to only patients with at least 2, 3, 4, or 5 visits per year, respectively, in the previous 5 years, and the results were generally robust to these variations (see Supporting Information, Appendix Tables A.2 and A.3, in the online version of this article). Although higher vaccination rates have been reported previously (PV: 81%89%; FV: 79%80%) for all elderly veterans in 2003,[36, 37] a lower vaccination rate may be expected among hospitalized patients for CAP, if PV and/or FV are effective in reducing hospitalizations for pneumonia as reported in previous studies.[36, 38, 39] The lower PV rate observed among hospitalized elderly patients in this study is similar to another study of hospitalized elderly patients (50% prior PV rate),[40] and is consistent with the low prior PV rates reported in other studies of CAP‐hospitalized patients, which ranges from 11% to 22%.[9, 10, 11]
Cases of CAP admissions were identified based on principal diagnosis of pneumonia. This increased precision in the identified cases but may have underidentified CAP admissions. ICD‐9 code 481.0x (influenza with pneumonia) was also used for case identification, similar to other studies[4, 9, 12, 41]; excluding this code only excluded a few and did not affect the findings. Relying exclusively on diagnosis codes to detect pneumonia may also lead to misclassification due to coding errors. The gold standard to confirm pneumonia was with x‐ray. However, such information was not available in our data.
We did not have bacteriological data to study the pneumococcal‐specific outcomes, such as pneumococcal pneumonia or pneumococcal bacteremia, which the pneumococcal vaccine is designed to protect against. Diagnosis codes for the pneumococcal‐specific outcomes have low sensitivity,[42] and will significantly underidentify those cases. This limitation will bias our result toward null, which may partially explain the insignificant findings.
CONCLUSIONS
In this study of elderly VA patients admitted for CAP, we did not find significant effects of prior PV on LOS, inpatient mortality, or respiratory complications. Although given the limitations of this study, we could not conclusively say that PV has no effect on these outcomes. Nonetheless, our findings and the findings of no significant protective effect on overall mortality and decreasing antibody response to vaccines in the elderly from other studies, does raise the question of whether the previously reported beneficial effects on in‐hospital outcomes for CAP in adults could be generalized to elderly patients. Larger electronic medical record databases with more complete information on patients' vaccination history are needed to confirm these findings. Nonetheless, given its protective effect against invasive diseases,[7, 8] the economic benefits shown,[43, 44] and relative safety, PV should still be recommended for all elderly persons, especially very old and frail nursing home residents.[45] However, significant survival benefit and improved in‐hospital outcomes for CAP as reported in previous studies may not be expected in elderly patients with prior PV, particularly if vaccination was given more than 5 years ago. This study also supports the recommendation of FV in the elderly population. Although, FV was not associated with a decrease in inpatient mortality in this study, having both PV and FV was found to be associated with shortened LOS.
Disclosures
This study was supported by the Medical Research Endowment Fund of University of Arkansas for Medical Sciences awarded to C. Li. The funding agency had no role in the study design; collection, analysis, and interpretation of data; writing of the report; or the decision to submit the article for publication. The views expressed in this article are those of the authors and do not necessarily reflect the position or policy of the Department of Veterans Affairs or the United States government. All coauthors have seen and agree with the contents of the manuscript; the submission (aside from abstracts) is not under review by any other publication. All coauthors have contributed to the concept and design of the study, analysis and interpretation of data, and/or development of the manuscript. The manuscript was reviewed and revised by the coauthors to ensure that important intellectual content has been included in the final published version. C. Li is a consultant to eMaxHealth Systems on unrelated studies. The authors disclose no conflicts of interest with this study.
- , , , . Community‐acquired pneumonia in elderly patients. Aging Health. 2009;5(6):763–774.
- CDC/NCHS National Hospital Discharge Survey, 2010. Number of discharges from short‐stay hospitals, by first‐listed diagnosis and age: United States, 2010. National Center for Health Statistics. Available at: http://www.cdc.gov/nchs/data/nhds/3firstlisted/2010first3_numberage.pdf. Accessed July 14, 2014.
- , . Community‐acquired pneumonia in the elderly. Am J Geriatr Pharmacother. 2010;8(1):47–62.
- , , , et al. Effectiveness of pneumococcal polysaccharide vaccine in older adults. N Engl J Med. 2003;348:1747–1754.
- , . Pneumococcal vaccination of elderly adults: new paradigms for protection. Clin Infect Dis. 2008;47(10):1328–1338.
- , . The 23‐valent pneumococcal polysaccharide vaccine. Part 1. Efficacy of PPV in the elderly: a comparison of meta‐analysis. Eur J Epidemiol. 2004;19:353–363.
- , , , . Vaccines for preventing pneumococcal infection in adults. Cochrane Database Syst Rev. 2008;(1):CD000422.
- , , , , . Efficacy of pneumococcal vaccination in adults: a meta‐analysis. CMAJ. 2009;180(1):48–58.
- , , , , , . Prior pneumococcal vaccination is associated with reduced death, complications, and length of stay among hospitalized adults with community‐acquired pneumonia. Clin Infect Dis. 2006;42:1093–1101.
- , , , et al. Effect of prior pneumococcal vaccination on clinical outcome of hospitalized adults with community‐acquired pneumococcal pneumonia. Eur J Clin Microbiol Infect Dis. 2006;25:257–462.
- , , , . Effect of pneumococcal vaccination in hospitalized adults with community‐acquired pneumonia. Arch Intern Med. 2007;167:1938–1943.
- , , , , , . Influenza vaccination and risk of mortality among adults hospitalized with community‐acquired pneumonia. Arch Intern Med. 2007;167:53–59.
- , , , , , . Efficacy and effectiveness of influenza vaccines in elderly people: a systematic review. Lancet. 2005;366:1165–1174.
- , , , , . Effectiveness of influenza vaccine in the community‐dwelling elderly. N Engl J Med. 2007;357:1373–1381.
- VIReC Research User Guide: FY2002 VHA Medical SAS Inpatient Datasets. Hines, IL: Veterans Affairs Information Resource Center; 2003.
- Immunization Information Systems, Centers for Disease Control and Prevention. CPT codes mapped to CVX codes. Available at: http://www2a.cdc.gov/vaccines/iis/iisstandards/vaccines.asp?rpt=cpt. Accessed December 2, 2014.
- Centers for Disease Control and Prevention. Pneumococcal polysaccharide vaccine information statement. Available at: http://www.cdc.gov/vaccines/hcp/vis/vis‐statements/ppv.html. Accessed December 2, 2014.
- , , , et al. The protective efficacy of polyvalent pneumococcal polysaccharide vaccine. N Engl J Med. 1991;325:1453–1460.
- , , . Adapting a clinical comorbidity index for use with ICD‐9‐CM Administrative Databases. J Clin Epidemiol. 1992;45(6):613–619.
- , , , . Missing race/ethnicity data in Veterans Health Administration based disparities research: a systematic review. J Health Care Poor Underserved. 2006;17:128–140.
- , , , et al. Risk adjusting community‐acquired pneumonia hospital outcomes using automated databases. Am J Manag Care. 2008;14(3):158–166.
- , , , et al. A prediction rule to identify low‐risk patients with community‐acquired pneumonia. N Engl J Med. 1997;336:243–250.
- , , . A comparison of statistical modeling strategies for analyzing length of stay after CABG surgery. Health Serv Outcomes Res Methodol. 2002;3:107–133.
- , . GMATCH SAS macro. Available at: http://www.mayo.edu/research/documents/gmatchsas/DOC‐10027248. Accessed December 2, 2014.
- , , , . Analysis of Observational Health Care Data Using SAS. Cary, NC: SAS Institute; 2010.
- , , . Pneumococcal vaccination in older adults induces antibodies with low opsonic capacity and reduced antibody potency. Vaccine. 2008;26:5521–5526.
- , , . The effect of age on the response to the pneumococcal polysaccharide vaccine. BMC Infect Dis. 2010;10:60.
- , . Older adults have a low capacity to opsonize pneumococci due to low IgM antibody response to pneumococcal vaccinations. Infect Immun. 2011;79(1):314–320.
- , , , , . Impact of the pneumococcal vaccine on long‐term morbidity and mortality of adults at high risk for pneumonia. Clin Infect Dis. 2010;51(1):15–22.
- , , , , , . Effect of 13‐valent pneumococcal conjugate vaccine on admissions to hospital 2 years after its introduction in the USA: a time series analysis. Lancet Respir Med. 2014;2(5):387–394.
- American Academy of Family Physicians. ACIP recommends routine PCV13 immunization for adults 65 and older. Available at: http://www.aafp.org/news/health‐of‐the‐public/20140827pcv13vote.html. Accessed December 2, 2012.
- , , , et al. The burden of community‐acquired pneumonia in seniors: results of a population‐based study. Clin Infect Dis. 2004;39:1642–1650.
- , , , et al. Bacteremia with Streptococcus pneumoniae: sepsis and other risk factors for 30‐day mortality‐a hospital‐based cohort study. Eur J Clin Microbiol Infect Dis. 2012;13(10):2719–2725.
- , , , , . Trends in hospitalizations for pneumonia among persons aged 65 years or older in the United States, 1988–2002. JAMA. 2005;294(21):2712–2719.
- , , , et al. The effectiveness of the polysaccharide pneumococcal vaccine for the prevention of hospitalizations due to Streptococcus pneumoniae community‐acquired pneumonia in the elderly differs between the sexes: results from the Community‐Acquired Pneumonia Organization (CAPO) international cohort study. Vaccine. 2014;17:32(19):2198–2203.
- , , . Performance measures, vaccinations, and pneumonia rates among high‐risk patients in Veterans Administration health care. Am J Public Health. 2007;97(12):2167–2172.
- , , . Influenza and pneumococcal vaccination in older veterans: results from the Behavioral Risk Factor Surveillance System. J Am Geriatr Soc. 2006;54:217–223.
- , , , . The efficacy and cost effectiveness of vaccination against influenza among elderly persons living in the community. N Engl J Med. 1994;331:778–784.
- , , , . The health and economic benefits associated with pneumococcal vaccination of elderly persons with chronic lung disease. Arch Intern Med. 1999;159:2437–2442.
- , , . Pneumococcal vaccination in hospitalized elderly patients: role of the pharmacist. Pharmacotherapy. 2003;2(23):199–208.
- , , , . Accuracy of administrative data for identifying patients with pneumonia. Am J Med Qual. 2005;30:319–328.
- , , , , . International classification of diseases codes showed modest sensitivity for detecting community‐acquired pneumonia. J Clin Epidemiol. 2007;60(8):834–838.
- , , , et al. Cost‐effectiveness of pneumococcal vaccination of older people: a study in 5 western European countries. Clin Infect Dis. 2000;31:444–450.
- , , , et al. Cost‐effectiveness of pneumococcal vaccination for prevention of invasive pneumococcal disease in the elderly: an update for 10 Western European countries. Eur J Clin Microbiol Infect Dis. 2007;26(8):531–540.
- , , , et al. Efficacy of 23‐valent pneumococcal vaccine in preventing pneumonia and improving survival in nursing home residents: double blind, randomised and placebo controlled trial. BMJ. 2010;340:c1004.
© 2015 Society of Hospital Medicine