User login
Fiduciary Services for Veterans With Psychiatric Disabilities
Veterans with psychiatric disabilities who are found incompetent to manage their finances are assigned trustees to directly receive and disburse their disability funds. The term representative payee refers to trustees assigned by the Social Security Administration (SSA), and the term for those assigned by the Veterans Benefits Administration (VBA) is fiduciaries. The generic term trustee will be used when referring to an individual responsible for managing another person’s benefits, regardless of the source of those benefits.
Because a trustee assignment is associated with the loss of legal rights and personal autonomy, the clinical utility of appointing trustees has been extensively researched.1-7 However, almost all the literature on trustees for adults with psychiatric disabilities has focused on services within the civilian sector, whereas little is known about military veterans with similar arrangements.
Veterans with psychiatric disabilities face challenges in managing money on a daily basis. Like other individuals with serious mental illnesses, they may have limitations in basic monetary skills associated with mild to severe cognitive deficits, experience difficulties in budgeting finances, and have impulsive spending habits during periods of acute psychosis, mania, or depression. Unlike civilians with severe mental illness, veterans are able to receive disability benefits from both the VBA and the SSA, thus having the potential for substantially greater income than is typical among nonveterans with psychiatric disabilities.
This increased income can increase veterans’ risk of debt through increased capacity to obtain credit cards and other unsecured loans as well as make them more vulnerable to financial exploitation and victimization. Veterans with incomes from both VBA and SSA face the added complication of dealing with 2 distinct, ever-changing, and often difficult-to-navigate benefit systems.
This article compares the VBA fiduciary program with the better-known SSA representative payment program, then discusses in detail the fiduciary program administered by the VBA, highlighting areas of particular relevance to clinicians, and ends with a review of the published literature on the VBA fiduciary program for individuals with severe mental illness.
Federal Trustee Programs
The magnitude of the 2 main federal trustee systems is remarkable. In 2010, 1.5 million adult beneficiaries who received Supplemental Security Income (SSI) had representative payees responsible for managing about $4 billion per month.8,9 Likewise, in 2010, almost 100,000 individuals receiving VBA benefits had fiduciaries responsible for overseeing about $100 million per month in disability compensation or pension benefits.10
The SSA has a single arrangement for provision of representative payee services in which the payee assignment can be indefinite, the responsibility for modification of the arrangement lies with the beneficiary, and oversight is minimal in both policy and practice.9 In contrast, the VBA, which oversees veterans’ pensions and disability benefits, administers several fiduciary arrangements that range in permanency and level of oversight (Table).
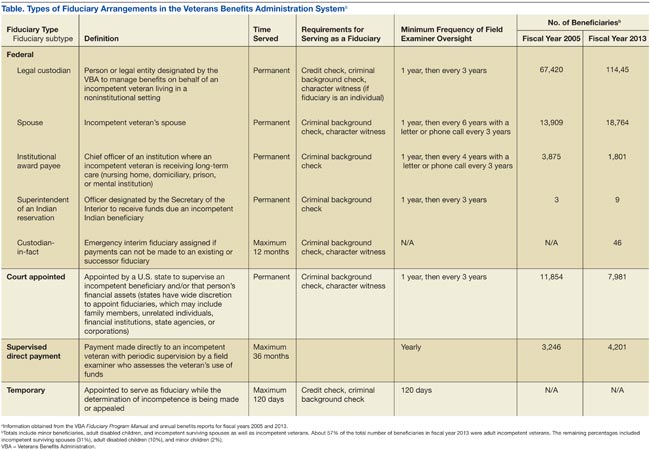
Permanent fiduciary appointments can be either federal or court appointed. Federal fiduciaries manage only VBA-appointed benefits, whereas court-appointed trustees (also known as guardians, fiduciaries, conservators, or curators, depending on the state) are appointed by the state to supervise all the financial assets of an incompetent beneficiary, potentially including both VBA and SSA benefits. Court-appointed trustees are usually designated when broader trust powers are needed to protect the beneficiary’s interests.11
A final VBA fiduciary arrangement is called a Supervised Direct Payment. The payment is made directly to a veteran with periodic supervision by a field examiner who assesses the veteran’s use of funds. This arrangement is used when a veteran has future potential to be deemed competent and released from VBA supervision. It allows the veteran a trial period of managing her/his funds generally for about a year but no longer than 36 months before transitioning to direct pay.11
Unlike SSA, which compensates total disability only, VBA has a rating system that estimates the degree to which a veteran is disabled and grants disability compensation accordingly.12 In 2009, the average monthly payment for all SSA recipients of SSI was $474; the average monthly payment for all recipients of disability benefits from VBA in that year was $925.13,14 For 2009, the federal maximum a SSA recipient could receive was only $674, although this could be supplemented by state funds. On the other hand, there is no set maximum for veterans’ benefits, which are determined through a formula that includes both percentage disability and number of dependents.12,13 In 2011, the average monthly payment for disabled veterans with fiduciaries was $2,540 per month.12 In a study of 49 veterans with trustees, the mean benefit from VBA was twice that of the SSA.15
Because VBA benefits are typically higher than those from SSA and because veterans can receive both SSA and VBA benefits, disabled veterans tend to have higher incomes than do civilians receiving disability benefits. Veterans also may receive lump sum payouts for past benefits, which can be substantial (often $20,000 to $40,000 and sometimes up to $100,000).16 For these reasons, identifying individuals who need a fiduciary and overseeing the management of funds once a fiduciary is assigned are critical.
Referral and Evaluation
The process through which a civilian SSA beneficiary is referred and evaluated for a representative payee is arguably less rigorous than is the referral of a veteran for the VBA fiduciary program. In the former, the treating clinician’s response to a single question, “In your opinion, is the beneficiary capable of managing his/her funds?” on the application for disability benefits often serves as the impetus for payee assignment.
In the latter, the VBA uses a rating agency to make determinations of a veteran’s capacity to handle VBA benefits either after receiving a request for such a determination or after receiving notice that a state court has determined the person is incompetent and/or has appointed a guardian to the person. The Code of Federal Regulations defines the criteria for finding a veteran with a psychiatric disability incompetent to manage his or her finances as follows: “a mentally incompetent person is one who because of injury or disease lacks the mental capacity to contract or to manage his or her own affairs, including disbursement of funds without limitation.”17 As such, if a veteran with mental illness is to be assigned a fiduciary, there needs to be evidence that the mental illness causes financial incompetence.
To assign a fiduciary, multiple sources of evidence are considered in demonstrating behaviors indicating financial incapacity. To illustrate, in Sanders v Principi, the VBA reviewed a veteran’s psychiatric history and weighed the opinion of a psychiatrist that the veteran’s mental illness was in remission against the opinion of family members that the veteran did not possess the ability to “conduct business transactions as his cognitive skills were severely impaired.”18
The VBA is expected to conduct a thorough review of the record and provide reasoned analysis in support of its conclusions, as discussed in Sims v Nicholson.19 The Sims court asserted that to render its decision, the VBA can consider a wide array of information sources, including field examination reports, private psychiatric examinations, medical examiners’ reports, and private physicians. Veterans are informed of the reasons behind the need for a fiduciary, which less commonly occurs in assigning representative payees in the SSA. Although the documented policy for evaluating and determining need for a fiduciary is impressive in its rigor, it is unknown to what extent these standards are put into actual practice.
For health care clinicians, deciding when to request formal assessment by the VBA rating agency of a veteran’s capacity to manage benefits can be challenging to both clinical judgment and to the therapeutic relationship. Although clinicians such as primary care providers, nurses, social workers, and case managers often hear information from the veteran and his/her family about the veteran’s day-to-day management of funds, most of these providers are not necessarily qualified to make a formal assessment of financial capacity.
Black and colleagues developed a measure to assess money mismanagement in a population composed primarily of veterans.20 Although this measure was correlated with client Global Assessment of Functioning scores and client-rated assessment of money mismanagement, it was not correlated with clinician judgment of the individual’s inability to manage funds. Rosen and colleagues similarly found that clinician assessment of whether a veteran would benefit from a trustee arrangement was not associated with the veteran meeting more stringent objective criteria, such as evidence that mismanagement of funds had resulted in the veteran’s inability to meet basic needs or had substantially harmed the veteran.21 Recognizing that their clinical judgment has limitations without external guidance, clinicians may postpone referral, particularly if there is also concern that the veteran may misunderstand the referral decision as a personal judgment, possibly impairing future relationships with the clinician or clinical team.
One option a clinician can consider prior to an official request to the VBA rating agency is to refer the veteran to a trained neuropsychologist for a financial capacity evaluation. The information obtained normally includes a detailed clinical interview, standardized performance measures, and neuropsychological testing.22 This evaluation may allow the clinician to feel more confident about his/her decision and provide a nonjudgmental way of initiating discussion with the veteran. Clinicians may also want to discuss the situation with staff of the Fiduciary Program prior to making a referral. The VBA website (http://benefits.va.gov/fiduciary) provides information about the fiduciary process, including regional contact information for fiduciary services, which clinicians and family members may find useful.
The Fiduciary Role
Once an individual has been determined to need a formal trustee, the decision of who will assume this role differs for SSA and VBA systems. Whereas over 70% of SSA-appointed representative payees for individuals are family members, the majority of fiduciaries for veterans are attorneys or paralegals.23,24 The ultimate designation of a trustee can have critical consequences for both beneficiaries and their families. Some studies have shown that people with psychiatric disabilities who are financially dependent on family members are significantly more likely to be aggressive and even violent toward those family members, with a greater elevated risk of conflict if the disabled person has more education, or even better money management skills, than the assigned family trustee.25-27 Although there are fewer family fiduciaries in the VBA system, it is still possible that veterans with psychiatric disabilities will have these conflicts.
The significant amount of money veterans receive may put them at higher risk for financial exploitation. Given that the VBA disability payment is a reliable source of income and that many veterans with psychiatric disabilities live in environments of lower socioeconomic status, the veteran with a psychiatric disability may be especially vulnerable to financial manipulation. In an environment where many individuals have limited monetary resources, experience financial strain, and are frequently unemployed, it is unsurprising that, at best, family and friends may seek help and assistance from the veteran, and at worst, may maliciously exploit him or her. As a disinterested third party, it can be helpful for the clinician to explore potential disparities between veterans’ disability benefits and the income of individuals with whom the veteran resides.
Additionally, the amount of compensation fiduciaries can receive for their role can be significant. Fiduciaries can receive up to 4% of the yearly VBA benefits of a veteran for whom they are managing money, although family members and court-appointed fiduciaries are not allowed to receive such a commission without a special exception.11 Because large retroactive payments may be disbursed all at once, 4% of the total can be substantial.16
Unsurprisingly, the VBA fiduciary system suffers from a certain amount of fraud, prompting recent efforts in Congress to investigate the program more closely.28 Particular concern has been expressed by the House Committee on Veterans Affairs about misuse of funds by so-called professional fiduciaries who provide services for multiple veterans.29 Recent audits estimated that over $400 million in payments and estates were at risk for misuse and over $80 million might be subject to fraud.16 Until 2004, there was no policy in place to replace a veteran’s funds if those funds had been misused by her/his fiduciary.30 However, this was corrected when Congress passed the Veterans Benefits Improvement Act, and the VBA now reissues benefits if they were misused and the VBA was found negligent in its monitoring of the fiduciary.31 Unfortunately, it is also the VBA that makes the determination of negligence, raising concerns about conflict of interest.
Clinicians may contact their VBA Regional Office to request an evaluation of a veteran’s situation if they have concerns about the fiduciary arrangement, either based on their own observations or on complaints received from the veteran. A field examiner is required to investigate concerns about misuse of veteran funds.11
Fiduciary Oversight
The SSA has been criticized for its lack of close oversight of representative payees. In a recent report on the SSA representative payee program, the evaluators noted, “More broadly, the [SSA] program does not require careful accounting and reporting by payees, nor does the current system appear to be useful in detecting possible misuse of benefits by payees.”9
In contrast, the VBA fiduciary program has designated field examiners who play a role in the initial competence determination, fiduciary arrangement and selection, and oversight of the fiduciary arrangement. Once the VBA has been alerted that a veteran may require a fiduciary, a field examiner is dispatched to observe the individual’s living conditions, fund requirements, and capacity to handle benefits.11 After the initial contact, the field examiner makes a recommendation of the appropriate financial arrangement and prospective fiduciary.
Regardless of the type of fiduciary arrangement in place, the field examiner makes periodic follow-up visits to the beneficiary based on the individual situation. The minimum frequency of required contacts is at least once per year.11 However, visits can occur as infrequently as 36 months in particular situations (Table). During follow-up visits, the field examiner evaluates the beneficiary’s welfare, the performance of the fiduciary, the use of funds, the competency of the beneficiary, and the necessity to continue the fiduciary relationship.11
Although detailed oversight of fiduciaries is technically required, there are a limited number of field examiners to provide that oversight. In 2006, caseloads for field examiners ranged from 132 to 592 cases per employee.Recent auditing showed that programs with the highest staff case loads also had the highest number of deficiencies, suggesting that some field examiners may be unable to provide sufficient oversight to all their clients.16 The effectiveness of field examiners may suffer when they are responsible for very high numbers of veterans.16 Improving oversight of fiduciaries is a stated goal of the VA Office of Inspector General, although increasing the number of field examiners is not mentioned as a means to achieve this goal.32
The SSA does not systematically assess whether a beneficiary is able to resume control over his or her finances. Responsibility lies with the beneficiary to initiate a request to become his/her own payee by demonstrating ability to care for self by means of any evidence, including providing a doctor’s statement or an official copy of a court order. The SSA further cautions beneficiaries who are considering submitting proof of their capability to manage their money as a result of improvement in their condition that, “If SSA believes your condition has improved to the point that you no longer need a payee, we may reevaluate your eligibility for disability payments.”33 This may discourage beneficiaries from attempting to rescind the payeeship, as they potentially risk losing their disability benefits as well.
In contrast, VBA requires regular assessment by a field examiner for continuation of the fiduciary arrangement.11 It is possible to rescind this arrangement if the veteran is found to be competent to handle his/her own funds, understands his/her financial situation, is applying funds to his/her needs appropriately, and would not benefit from further VBA supervision. Additionally, a trial period of limited fund disbursement for 3 to 5 months can be recommended in order to determine how well the veteran manages his/her money. This is commonly done when there are substantial amounts of money being held in trust for the veteran.11
Trustee Effectiveness
Considerable research has examined the effectiveness of the SSA representative payee program as well as potential benefits and risks to the payee. For example, in beneficiaries with psychiatric disabilities, payees can be instrumental in promoting residential stability, basic health care, and psychiatric treatment engagement.6 In addition, representative payeeship has been shown to be associated with reduced hospitalization, victimization, and homelessness.34,35 Finally, research has found better treatment adherence among consumers with payees compared with those without.5
On the other hand, risks noted in some studies suggest payeeship may be used coercively, thwart self-determination, and increase conflict.25 Additionally, payeeship was not associated with a differential reduction in substance use compared with SSA beneficiaries without a payee, nor did it have any effect on clinical outcomes.36-38 These studies may or may not be applicable to the veteran population: Few studies of SSA payeeship include veterans, and there are no studies examining the effectiveness of the VBA fiduciary program exclusively.
Conrad and colleagues reported on a randomized trial of a community trustee and case management program integrated with psychiatric care provided by the VHA.4 Twelve-month outcomes favored the use of the more integrated program, which showed a reduction in substance use, money mismanagement, and days homeless, along with an increased quality of life. However, the study did not distinguish between funding source (VBA, SSA, or both) and trustee status (SSA representative payee or VBA fiduciary). A voluntary program in which veterans worked with money managers who helped them manage funds and held their check books/bank cards also resulted in some improvement in substance use and money management, but this program did not involve either the formal SSA payee or VBA fiduciary systems.39
Although there is a perception that fiduciaries are unwanted impositions on individuals with mental illness, many veterans who have difficulty managing their money seem to want assistance. In one study, nearly 75% of the veterans interviewed agreed with the statement, “Someone who would give me advice around my funds would be helpful to me.” Thirty-four percent agreed with the statement, “Someone who would receive my check and control my funds would be helpful to me,” and 22% reported that they thought a money manager would have helped prevent their hospitalization.40 Additionally, veterans who had payees reported generally high levels of satisfaction and trust with their payee, as well as low feelings of coercion.15 Although similarities with the SSA system may allow some generalizing of findings across SSA and VBA, significant differences in how the programs are administered and the amount of money at stake justify independent evaluation of the VBA fiduciary program.
Conclusion
Veterans with psychiatric disabilities who are deemed incompetent to manage their finances are typically assigned a trustee to disperse disability funds. Both the VBA and SSA provide disability compensation and have a process for providing formal money management services for those determined to be financially incapacitated. However, these 2 federal programs are complex and have many differences.
Clinicians may come into contact with these programs when referring a veteran for services or when a veteran complains about their existing services. The decision of when to refer a veteran for evaluation for a fiduciary is challenging. Once a veteran is referred to the VBA rating agency, the VBA completes a more formalized evaluation to determine whether the beneficiary meets the criteria for a fiduciary. The VBA also has outlined more rigorous ongoing assessment requirements than has the SSA and has designated field examiners to complete these; however, in practice, field examiner heavy case-loads may make it more challenging for the VBA to achieve this rigor.
The VBA provides a formal means of evaluating a veteran’s ability to manage his or her funds through Supervised Direct Payment, which can allow a veteran to demonstrate the ability to manage money and thus end a fiduciary relationship that is no longer needed. In contrast, SSA has no formal evaluation program. Additionally, requesting an end to a payeeship for SSA funds can potentially trigger the loss of benefits, discouraging recipients from ever managing their money independently again.
Ultimately, assigning a fiduciary involves a complex decision weighing values of autonomy (veteran’s freedom to manage his or her own money) and social welfare (veteran’s safety if genuinely vulnerable to financial exploitation).
Author disclosures
The authors report no actual or potential conflicts of interest with regard to this article.
Disclaimer
The opinions expressed herein are those of the authors and do not necessarily reflect those of Federal Practitioner, Frontline Medical Communications Inc., the U.S. Government, or any of its agencies. This article may discuss unlabeled or investigational use of certain drugs. Please review the complete prescribing information for specific drugs or drug combinations—including indications, contraindications, warnings, and adverse effects—before administering pharmacologic therapy to patients.
1. Elbogen EB, Swanson JW, Swartz MS. Psychiatric disability, the use of financial leverage, and perceived coercion in mental health services. Int J Forensic Ment Health. 2003;2(2):119-127.
2. Rosen MI, Bailey M, Dombrowski E, Ablondi K, Rosenheck RA. A comparison of satisfaction with clinician, family members/friends and attorneys as payees. Community Ment Health J. 2005;41(3):291-306.
3. Rosenheck R. Disability payments and chemical dependence: Conflicting values and uncertain effects. Psychiatr Serv. 1997;48(6):789-791.
4. Conrad KJ, Lutz G, Matters MD, Donner L, Clark E, Lynch P. Randomized trial of psychiatric care with representative payeeship for persons with serious mental illness. Psychiatr Serv. 2006;57(2):197-204.
5. Elbogen EB, Swanson JW, Swartz MS. Effects of legal mechanisms on perceived coercion and treatment adherence among persons with severe mental illness. J Nerv Ment Dis. 2003;191(10):629-637.
6. Luchins DJ, Roberts DL, Hanrahan P. Representative payeeship and mental illness: A review. Adm Policy Ment Health. 2003;30(4):341-353.
7. Rosenheck R, Lam J, Randolph F. Impact of representative payees on substance abuse by homeless persons with serious mental illness. Psychiatr Serv. 1997;48(6):800-806.
8. Social Security Administration. 2010 Annual Report of the Supplemental Security Income Program. Washington, DC: Social Security Administration; 2010.
9. National Research Council Committee on Social Security Representative Payees. Improving the Social Security Representative Payee Program: Serving Beneficiaries and Minimizing Misuses. Washington, DC: Division of Behavioral and Social Sciences and Education; 2007.
10. Department of Veterans Affairs. Veterans Benefits Administration Annual Benefits Report Fiscal Year 2010. Washington, DC: Department of Veterans Affairs, Under Secretary of Veterans Affairs for Benefits; 2010.
11. Department of Veterans Affairs. Fiduciary Program Manual. Washington, DC: Department of Veterans Affairs, Under Secretary of Veterans Affairs for Benefits; 2005.
12. Department of Veterans Affairs. Veterans Benefits Administration Annual Benefits Report Fiscal Year 2011. Washington, DC: Department of Veterans Affairs, Under Secretary of Veterans Affairs for Benefits; 2011.
13. Social Security Administration. 2009 Annual Report of the Supplemental Security Income Program. Washington, DC: Social Security Administration; 2009.
14. Department of Veterans Affairs. Veterans Benefits Administration Annual Benefits Report Fiscal Year 2009. Washington, DC: Department of Veterans Affairs, Under Secretary of Veterans Affairs for Benefits; 2009.
15. Rosen MI, Rosenheck R, Shaner A, Eckman T, Gamache G, Krebs C. Payee relationships: Institutional payees versus personal acquaintances. Psychiatr Rehabil J. 2003;26(3):262-267.
16. Department of Veterans Affairs. Audit of Veterans Benefits Administration Fiduciary Program Operations. Document Number 05-01931-158. Washington, DC: Department of Veterans Affairs Office of Inspector General; 2006.
17. Calvert v Mansfield, 38 CFR § 3.353 (A) (2006).
18. Sanders v Principi, 17 Vet App 232 (2003).
19. Sims v Nicholson, 19 Vet App 453, 456 (2006).
20. Black RA, Rounsaville BJ, Rosenheck RA, Conrad KJ, Ball SA, Rosen MI. Measuring money mismanagement among dually diagnosed clients. J Nerv Ment Dis. 2008;196(7):576-579.
21. Rosen MI, Rosenheck RA, Shaner A, Eckman T, Gamache G, Krebs C. Veterans who may need a payee to prevent misuse of funds for drugs. Psychiatr Serv. 2002;53(8):995-1000.
22. American Bar Association Commission on Law and Aging/American Psychological Association. Assessment Of Older Adults With Diminished Capacity: A Handbook for Psychologists. Washington, DC: American Psychological Association; 2008.
23. Elbogen EB, Swanson JW, Swartz MS, Wagner HR. Characteristics of third-party money management for persons with psychiatric disabilities. Psychiatr Serv. 2003;54(8):1136-1141.
24. Social Security Administration. Annual Statistical Report on the Social Security Disability Insurance Program, 2006. Washington, DC: Social Security Administration; 2006.
25. Elbogen EB, Swanson JW, Swartz MS, Van Dorn R. Family representative payeeship and violence risk in severe mental illness. Law Hum Behav. 2005;29(5):563-574.
26. Estroff SE, Swanson JW, Lachicotte WS, Swartz M, Bolduc M. Risk reconsidered: Targets of violence in the social networks of people with serious psychiatric disorders. Soc Psychiatry Psychiatr Epidemiol. 1998;33(suppl 1):S95-S101.
27. Elbogen EB, Ferron JC, Swartz MS, Wilder CM, Swanson JW, Wagner HR. Characteristics of representative payeeship involving families of beneficiaries with psychiatric disabilities. Psychiatr Serv. 2007;58(11):1433-1440.
28. Mitchell A. VA fiduciary system seriously flawed. House Committee on Veterans Affairs Website. http://veterans.house.gov/press-release/va-fiduciary-system-seriously-flawed. Published February 9, 2012. Accessed November 25, 2014.
29. Subcommittee on Disability Assistance and Memorial Affairs, Committee on Veterans’ Affairs. Examining the U.S. Department of Veterans Affairs Fiduciary Program: How Can VA Better Protect Vulnerable Veterans and Their Families? Document 111-72. Washington, DC: U.S. Government Printing Office; 2010.
30. Subcommittee on Benefits Committee on Veterans Affairs. Hearing on Department of Veterans Affairs’ Fiduciary Program. Document Number 108-21. Washington, DC: U.S. Government Printing Office; 2003.
31. Thakker N. The state of veterans’ fiduciary programs: What is needed to protect our nation’s incapacitated veterans? Bifocal. 2006;28(2):19-27.
32. Department of Veterans Affairs. Semiannual Report to Congress: April 1, 2006-September 30, 2006. Washington, DC: Office of Inspector General, Department of Veterans Affairs; 2006.
33. Social Security. FAQs for beneficiaries who have a payee. Social Security Website. http://www.socialsecurity.gov/payee/faqbene.htm. Accessed November 25, 2014.
34. Hanrahan P, Luchins DJ, Savage C, Patrick G, Roberts D, Conrad KJ. Representative payee programs for persons with mental illness in Illinois. Psychiatr Serv. 2002;53(2):190-194.
35. Stoner MR. Money management services for the homeless mentally ill. Hosp Community Psychiatry. 1989;40(7):751-753.
36. Rosen MI, McMahon TJ, Rosenheck R. Does assigning a representative payee reduce substance abuse? Drug Alcohol Dependence. 2007;86(2-3):115-122.
37. Rosen MI. The ‘check effect’ reconsidered. Addiction. 2011;106(6):1071-1077.
38. Swartz JA, Hsieh CM, Baumohl J. Disability payments, drug use and representative payees: An analysis of the relationships. Addiction. 2003;98(7):965-975.
39. Rosen MI, Carroll KM, Stefanovics E, Rosenheck RA. A randomized controlled trial of a money management-based substance use intervention. Psychiatr Serv. 2009;60(4):498-504.
40. Rosen MI, Rosenheck R, Shaner A, Eckman T, Gamache G, Krebs C. Do patients who mismanage their funds use more health services? Adm Policy Ment Health. 2003;31(2):131-140.
Veterans with psychiatric disabilities who are found incompetent to manage their finances are assigned trustees to directly receive and disburse their disability funds. The term representative payee refers to trustees assigned by the Social Security Administration (SSA), and the term for those assigned by the Veterans Benefits Administration (VBA) is fiduciaries. The generic term trustee will be used when referring to an individual responsible for managing another person’s benefits, regardless of the source of those benefits.
Because a trustee assignment is associated with the loss of legal rights and personal autonomy, the clinical utility of appointing trustees has been extensively researched.1-7 However, almost all the literature on trustees for adults with psychiatric disabilities has focused on services within the civilian sector, whereas little is known about military veterans with similar arrangements.
Veterans with psychiatric disabilities face challenges in managing money on a daily basis. Like other individuals with serious mental illnesses, they may have limitations in basic monetary skills associated with mild to severe cognitive deficits, experience difficulties in budgeting finances, and have impulsive spending habits during periods of acute psychosis, mania, or depression. Unlike civilians with severe mental illness, veterans are able to receive disability benefits from both the VBA and the SSA, thus having the potential for substantially greater income than is typical among nonveterans with psychiatric disabilities.
This increased income can increase veterans’ risk of debt through increased capacity to obtain credit cards and other unsecured loans as well as make them more vulnerable to financial exploitation and victimization. Veterans with incomes from both VBA and SSA face the added complication of dealing with 2 distinct, ever-changing, and often difficult-to-navigate benefit systems.
This article compares the VBA fiduciary program with the better-known SSA representative payment program, then discusses in detail the fiduciary program administered by the VBA, highlighting areas of particular relevance to clinicians, and ends with a review of the published literature on the VBA fiduciary program for individuals with severe mental illness.
Federal Trustee Programs
The magnitude of the 2 main federal trustee systems is remarkable. In 2010, 1.5 million adult beneficiaries who received Supplemental Security Income (SSI) had representative payees responsible for managing about $4 billion per month.8,9 Likewise, in 2010, almost 100,000 individuals receiving VBA benefits had fiduciaries responsible for overseeing about $100 million per month in disability compensation or pension benefits.10
The SSA has a single arrangement for provision of representative payee services in which the payee assignment can be indefinite, the responsibility for modification of the arrangement lies with the beneficiary, and oversight is minimal in both policy and practice.9 In contrast, the VBA, which oversees veterans’ pensions and disability benefits, administers several fiduciary arrangements that range in permanency and level of oversight (Table).
Permanent fiduciary appointments can be either federal or court appointed. Federal fiduciaries manage only VBA-appointed benefits, whereas court-appointed trustees (also known as guardians, fiduciaries, conservators, or curators, depending on the state) are appointed by the state to supervise all the financial assets of an incompetent beneficiary, potentially including both VBA and SSA benefits. Court-appointed trustees are usually designated when broader trust powers are needed to protect the beneficiary’s interests.11
A final VBA fiduciary arrangement is called a Supervised Direct Payment. The payment is made directly to a veteran with periodic supervision by a field examiner who assesses the veteran’s use of funds. This arrangement is used when a veteran has future potential to be deemed competent and released from VBA supervision. It allows the veteran a trial period of managing her/his funds generally for about a year but no longer than 36 months before transitioning to direct pay.11
Unlike SSA, which compensates total disability only, VBA has a rating system that estimates the degree to which a veteran is disabled and grants disability compensation accordingly.12 In 2009, the average monthly payment for all SSA recipients of SSI was $474; the average monthly payment for all recipients of disability benefits from VBA in that year was $925.13,14 For 2009, the federal maximum a SSA recipient could receive was only $674, although this could be supplemented by state funds. On the other hand, there is no set maximum for veterans’ benefits, which are determined through a formula that includes both percentage disability and number of dependents.12,13 In 2011, the average monthly payment for disabled veterans with fiduciaries was $2,540 per month.12 In a study of 49 veterans with trustees, the mean benefit from VBA was twice that of the SSA.15
Because VBA benefits are typically higher than those from SSA and because veterans can receive both SSA and VBA benefits, disabled veterans tend to have higher incomes than do civilians receiving disability benefits. Veterans also may receive lump sum payouts for past benefits, which can be substantial (often $20,000 to $40,000 and sometimes up to $100,000).16 For these reasons, identifying individuals who need a fiduciary and overseeing the management of funds once a fiduciary is assigned are critical.
Referral and Evaluation
The process through which a civilian SSA beneficiary is referred and evaluated for a representative payee is arguably less rigorous than is the referral of a veteran for the VBA fiduciary program. In the former, the treating clinician’s response to a single question, “In your opinion, is the beneficiary capable of managing his/her funds?” on the application for disability benefits often serves as the impetus for payee assignment.
In the latter, the VBA uses a rating agency to make determinations of a veteran’s capacity to handle VBA benefits either after receiving a request for such a determination or after receiving notice that a state court has determined the person is incompetent and/or has appointed a guardian to the person. The Code of Federal Regulations defines the criteria for finding a veteran with a psychiatric disability incompetent to manage his or her finances as follows: “a mentally incompetent person is one who because of injury or disease lacks the mental capacity to contract or to manage his or her own affairs, including disbursement of funds without limitation.”17 As such, if a veteran with mental illness is to be assigned a fiduciary, there needs to be evidence that the mental illness causes financial incompetence.
To assign a fiduciary, multiple sources of evidence are considered in demonstrating behaviors indicating financial incapacity. To illustrate, in Sanders v Principi, the VBA reviewed a veteran’s psychiatric history and weighed the opinion of a psychiatrist that the veteran’s mental illness was in remission against the opinion of family members that the veteran did not possess the ability to “conduct business transactions as his cognitive skills were severely impaired.”18
The VBA is expected to conduct a thorough review of the record and provide reasoned analysis in support of its conclusions, as discussed in Sims v Nicholson.19 The Sims court asserted that to render its decision, the VBA can consider a wide array of information sources, including field examination reports, private psychiatric examinations, medical examiners’ reports, and private physicians. Veterans are informed of the reasons behind the need for a fiduciary, which less commonly occurs in assigning representative payees in the SSA. Although the documented policy for evaluating and determining need for a fiduciary is impressive in its rigor, it is unknown to what extent these standards are put into actual practice.
For health care clinicians, deciding when to request formal assessment by the VBA rating agency of a veteran’s capacity to manage benefits can be challenging to both clinical judgment and to the therapeutic relationship. Although clinicians such as primary care providers, nurses, social workers, and case managers often hear information from the veteran and his/her family about the veteran’s day-to-day management of funds, most of these providers are not necessarily qualified to make a formal assessment of financial capacity.
Black and colleagues developed a measure to assess money mismanagement in a population composed primarily of veterans.20 Although this measure was correlated with client Global Assessment of Functioning scores and client-rated assessment of money mismanagement, it was not correlated with clinician judgment of the individual’s inability to manage funds. Rosen and colleagues similarly found that clinician assessment of whether a veteran would benefit from a trustee arrangement was not associated with the veteran meeting more stringent objective criteria, such as evidence that mismanagement of funds had resulted in the veteran’s inability to meet basic needs or had substantially harmed the veteran.21 Recognizing that their clinical judgment has limitations without external guidance, clinicians may postpone referral, particularly if there is also concern that the veteran may misunderstand the referral decision as a personal judgment, possibly impairing future relationships with the clinician or clinical team.
One option a clinician can consider prior to an official request to the VBA rating agency is to refer the veteran to a trained neuropsychologist for a financial capacity evaluation. The information obtained normally includes a detailed clinical interview, standardized performance measures, and neuropsychological testing.22 This evaluation may allow the clinician to feel more confident about his/her decision and provide a nonjudgmental way of initiating discussion with the veteran. Clinicians may also want to discuss the situation with staff of the Fiduciary Program prior to making a referral. The VBA website (http://benefits.va.gov/fiduciary) provides information about the fiduciary process, including regional contact information for fiduciary services, which clinicians and family members may find useful.
The Fiduciary Role
Once an individual has been determined to need a formal trustee, the decision of who will assume this role differs for SSA and VBA systems. Whereas over 70% of SSA-appointed representative payees for individuals are family members, the majority of fiduciaries for veterans are attorneys or paralegals.23,24 The ultimate designation of a trustee can have critical consequences for both beneficiaries and their families. Some studies have shown that people with psychiatric disabilities who are financially dependent on family members are significantly more likely to be aggressive and even violent toward those family members, with a greater elevated risk of conflict if the disabled person has more education, or even better money management skills, than the assigned family trustee.25-27 Although there are fewer family fiduciaries in the VBA system, it is still possible that veterans with psychiatric disabilities will have these conflicts.
The significant amount of money veterans receive may put them at higher risk for financial exploitation. Given that the VBA disability payment is a reliable source of income and that many veterans with psychiatric disabilities live in environments of lower socioeconomic status, the veteran with a psychiatric disability may be especially vulnerable to financial manipulation. In an environment where many individuals have limited monetary resources, experience financial strain, and are frequently unemployed, it is unsurprising that, at best, family and friends may seek help and assistance from the veteran, and at worst, may maliciously exploit him or her. As a disinterested third party, it can be helpful for the clinician to explore potential disparities between veterans’ disability benefits and the income of individuals with whom the veteran resides.
Additionally, the amount of compensation fiduciaries can receive for their role can be significant. Fiduciaries can receive up to 4% of the yearly VBA benefits of a veteran for whom they are managing money, although family members and court-appointed fiduciaries are not allowed to receive such a commission without a special exception.11 Because large retroactive payments may be disbursed all at once, 4% of the total can be substantial.16
Unsurprisingly, the VBA fiduciary system suffers from a certain amount of fraud, prompting recent efforts in Congress to investigate the program more closely.28 Particular concern has been expressed by the House Committee on Veterans Affairs about misuse of funds by so-called professional fiduciaries who provide services for multiple veterans.29 Recent audits estimated that over $400 million in payments and estates were at risk for misuse and over $80 million might be subject to fraud.16 Until 2004, there was no policy in place to replace a veteran’s funds if those funds had been misused by her/his fiduciary.30 However, this was corrected when Congress passed the Veterans Benefits Improvement Act, and the VBA now reissues benefits if they were misused and the VBA was found negligent in its monitoring of the fiduciary.31 Unfortunately, it is also the VBA that makes the determination of negligence, raising concerns about conflict of interest.
Clinicians may contact their VBA Regional Office to request an evaluation of a veteran’s situation if they have concerns about the fiduciary arrangement, either based on their own observations or on complaints received from the veteran. A field examiner is required to investigate concerns about misuse of veteran funds.11
Fiduciary Oversight
The SSA has been criticized for its lack of close oversight of representative payees. In a recent report on the SSA representative payee program, the evaluators noted, “More broadly, the [SSA] program does not require careful accounting and reporting by payees, nor does the current system appear to be useful in detecting possible misuse of benefits by payees.”9
In contrast, the VBA fiduciary program has designated field examiners who play a role in the initial competence determination, fiduciary arrangement and selection, and oversight of the fiduciary arrangement. Once the VBA has been alerted that a veteran may require a fiduciary, a field examiner is dispatched to observe the individual’s living conditions, fund requirements, and capacity to handle benefits.11 After the initial contact, the field examiner makes a recommendation of the appropriate financial arrangement and prospective fiduciary.
Regardless of the type of fiduciary arrangement in place, the field examiner makes periodic follow-up visits to the beneficiary based on the individual situation. The minimum frequency of required contacts is at least once per year.11 However, visits can occur as infrequently as 36 months in particular situations (Table). During follow-up visits, the field examiner evaluates the beneficiary’s welfare, the performance of the fiduciary, the use of funds, the competency of the beneficiary, and the necessity to continue the fiduciary relationship.11
Although detailed oversight of fiduciaries is technically required, there are a limited number of field examiners to provide that oversight. In 2006, caseloads for field examiners ranged from 132 to 592 cases per employee.Recent auditing showed that programs with the highest staff case loads also had the highest number of deficiencies, suggesting that some field examiners may be unable to provide sufficient oversight to all their clients.16 The effectiveness of field examiners may suffer when they are responsible for very high numbers of veterans.16 Improving oversight of fiduciaries is a stated goal of the VA Office of Inspector General, although increasing the number of field examiners is not mentioned as a means to achieve this goal.32
The SSA does not systematically assess whether a beneficiary is able to resume control over his or her finances. Responsibility lies with the beneficiary to initiate a request to become his/her own payee by demonstrating ability to care for self by means of any evidence, including providing a doctor’s statement or an official copy of a court order. The SSA further cautions beneficiaries who are considering submitting proof of their capability to manage their money as a result of improvement in their condition that, “If SSA believes your condition has improved to the point that you no longer need a payee, we may reevaluate your eligibility for disability payments.”33 This may discourage beneficiaries from attempting to rescind the payeeship, as they potentially risk losing their disability benefits as well.
In contrast, VBA requires regular assessment by a field examiner for continuation of the fiduciary arrangement.11 It is possible to rescind this arrangement if the veteran is found to be competent to handle his/her own funds, understands his/her financial situation, is applying funds to his/her needs appropriately, and would not benefit from further VBA supervision. Additionally, a trial period of limited fund disbursement for 3 to 5 months can be recommended in order to determine how well the veteran manages his/her money. This is commonly done when there are substantial amounts of money being held in trust for the veteran.11
Trustee Effectiveness
Considerable research has examined the effectiveness of the SSA representative payee program as well as potential benefits and risks to the payee. For example, in beneficiaries with psychiatric disabilities, payees can be instrumental in promoting residential stability, basic health care, and psychiatric treatment engagement.6 In addition, representative payeeship has been shown to be associated with reduced hospitalization, victimization, and homelessness.34,35 Finally, research has found better treatment adherence among consumers with payees compared with those without.5
On the other hand, risks noted in some studies suggest payeeship may be used coercively, thwart self-determination, and increase conflict.25 Additionally, payeeship was not associated with a differential reduction in substance use compared with SSA beneficiaries without a payee, nor did it have any effect on clinical outcomes.36-38 These studies may or may not be applicable to the veteran population: Few studies of SSA payeeship include veterans, and there are no studies examining the effectiveness of the VBA fiduciary program exclusively.
Conrad and colleagues reported on a randomized trial of a community trustee and case management program integrated with psychiatric care provided by the VHA.4 Twelve-month outcomes favored the use of the more integrated program, which showed a reduction in substance use, money mismanagement, and days homeless, along with an increased quality of life. However, the study did not distinguish between funding source (VBA, SSA, or both) and trustee status (SSA representative payee or VBA fiduciary). A voluntary program in which veterans worked with money managers who helped them manage funds and held their check books/bank cards also resulted in some improvement in substance use and money management, but this program did not involve either the formal SSA payee or VBA fiduciary systems.39
Although there is a perception that fiduciaries are unwanted impositions on individuals with mental illness, many veterans who have difficulty managing their money seem to want assistance. In one study, nearly 75% of the veterans interviewed agreed with the statement, “Someone who would give me advice around my funds would be helpful to me.” Thirty-four percent agreed with the statement, “Someone who would receive my check and control my funds would be helpful to me,” and 22% reported that they thought a money manager would have helped prevent their hospitalization.40 Additionally, veterans who had payees reported generally high levels of satisfaction and trust with their payee, as well as low feelings of coercion.15 Although similarities with the SSA system may allow some generalizing of findings across SSA and VBA, significant differences in how the programs are administered and the amount of money at stake justify independent evaluation of the VBA fiduciary program.
Conclusion
Veterans with psychiatric disabilities who are deemed incompetent to manage their finances are typically assigned a trustee to disperse disability funds. Both the VBA and SSA provide disability compensation and have a process for providing formal money management services for those determined to be financially incapacitated. However, these 2 federal programs are complex and have many differences.
Clinicians may come into contact with these programs when referring a veteran for services or when a veteran complains about their existing services. The decision of when to refer a veteran for evaluation for a fiduciary is challenging. Once a veteran is referred to the VBA rating agency, the VBA completes a more formalized evaluation to determine whether the beneficiary meets the criteria for a fiduciary. The VBA also has outlined more rigorous ongoing assessment requirements than has the SSA and has designated field examiners to complete these; however, in practice, field examiner heavy case-loads may make it more challenging for the VBA to achieve this rigor.
The VBA provides a formal means of evaluating a veteran’s ability to manage his or her funds through Supervised Direct Payment, which can allow a veteran to demonstrate the ability to manage money and thus end a fiduciary relationship that is no longer needed. In contrast, SSA has no formal evaluation program. Additionally, requesting an end to a payeeship for SSA funds can potentially trigger the loss of benefits, discouraging recipients from ever managing their money independently again.
Ultimately, assigning a fiduciary involves a complex decision weighing values of autonomy (veteran’s freedom to manage his or her own money) and social welfare (veteran’s safety if genuinely vulnerable to financial exploitation).
Author disclosures
The authors report no actual or potential conflicts of interest with regard to this article.
Disclaimer
The opinions expressed herein are those of the authors and do not necessarily reflect those of Federal Practitioner, Frontline Medical Communications Inc., the U.S. Government, or any of its agencies. This article may discuss unlabeled or investigational use of certain drugs. Please review the complete prescribing information for specific drugs or drug combinations—including indications, contraindications, warnings, and adverse effects—before administering pharmacologic therapy to patients.
1. Elbogen EB, Swanson JW, Swartz MS. Psychiatric disability, the use of financial leverage, and perceived coercion in mental health services. Int J Forensic Ment Health. 2003;2(2):119-127.
2. Rosen MI, Bailey M, Dombrowski E, Ablondi K, Rosenheck RA. A comparison of satisfaction with clinician, family members/friends and attorneys as payees. Community Ment Health J. 2005;41(3):291-306.
3. Rosenheck R. Disability payments and chemical dependence: Conflicting values and uncertain effects. Psychiatr Serv. 1997;48(6):789-791.
4. Conrad KJ, Lutz G, Matters MD, Donner L, Clark E, Lynch P. Randomized trial of psychiatric care with representative payeeship for persons with serious mental illness. Psychiatr Serv. 2006;57(2):197-204.
5. Elbogen EB, Swanson JW, Swartz MS. Effects of legal mechanisms on perceived coercion and treatment adherence among persons with severe mental illness. J Nerv Ment Dis. 2003;191(10):629-637.
6. Luchins DJ, Roberts DL, Hanrahan P. Representative payeeship and mental illness: A review. Adm Policy Ment Health. 2003;30(4):341-353.
7. Rosenheck R, Lam J, Randolph F. Impact of representative payees on substance abuse by homeless persons with serious mental illness. Psychiatr Serv. 1997;48(6):800-806.
8. Social Security Administration. 2010 Annual Report of the Supplemental Security Income Program. Washington, DC: Social Security Administration; 2010.
9. National Research Council Committee on Social Security Representative Payees. Improving the Social Security Representative Payee Program: Serving Beneficiaries and Minimizing Misuses. Washington, DC: Division of Behavioral and Social Sciences and Education; 2007.
10. Department of Veterans Affairs. Veterans Benefits Administration Annual Benefits Report Fiscal Year 2010. Washington, DC: Department of Veterans Affairs, Under Secretary of Veterans Affairs for Benefits; 2010.
11. Department of Veterans Affairs. Fiduciary Program Manual. Washington, DC: Department of Veterans Affairs, Under Secretary of Veterans Affairs for Benefits; 2005.
12. Department of Veterans Affairs. Veterans Benefits Administration Annual Benefits Report Fiscal Year 2011. Washington, DC: Department of Veterans Affairs, Under Secretary of Veterans Affairs for Benefits; 2011.
13. Social Security Administration. 2009 Annual Report of the Supplemental Security Income Program. Washington, DC: Social Security Administration; 2009.
14. Department of Veterans Affairs. Veterans Benefits Administration Annual Benefits Report Fiscal Year 2009. Washington, DC: Department of Veterans Affairs, Under Secretary of Veterans Affairs for Benefits; 2009.
15. Rosen MI, Rosenheck R, Shaner A, Eckman T, Gamache G, Krebs C. Payee relationships: Institutional payees versus personal acquaintances. Psychiatr Rehabil J. 2003;26(3):262-267.
16. Department of Veterans Affairs. Audit of Veterans Benefits Administration Fiduciary Program Operations. Document Number 05-01931-158. Washington, DC: Department of Veterans Affairs Office of Inspector General; 2006.
17. Calvert v Mansfield, 38 CFR § 3.353 (A) (2006).
18. Sanders v Principi, 17 Vet App 232 (2003).
19. Sims v Nicholson, 19 Vet App 453, 456 (2006).
20. Black RA, Rounsaville BJ, Rosenheck RA, Conrad KJ, Ball SA, Rosen MI. Measuring money mismanagement among dually diagnosed clients. J Nerv Ment Dis. 2008;196(7):576-579.
21. Rosen MI, Rosenheck RA, Shaner A, Eckman T, Gamache G, Krebs C. Veterans who may need a payee to prevent misuse of funds for drugs. Psychiatr Serv. 2002;53(8):995-1000.
22. American Bar Association Commission on Law and Aging/American Psychological Association. Assessment Of Older Adults With Diminished Capacity: A Handbook for Psychologists. Washington, DC: American Psychological Association; 2008.
23. Elbogen EB, Swanson JW, Swartz MS, Wagner HR. Characteristics of third-party money management for persons with psychiatric disabilities. Psychiatr Serv. 2003;54(8):1136-1141.
24. Social Security Administration. Annual Statistical Report on the Social Security Disability Insurance Program, 2006. Washington, DC: Social Security Administration; 2006.
25. Elbogen EB, Swanson JW, Swartz MS, Van Dorn R. Family representative payeeship and violence risk in severe mental illness. Law Hum Behav. 2005;29(5):563-574.
26. Estroff SE, Swanson JW, Lachicotte WS, Swartz M, Bolduc M. Risk reconsidered: Targets of violence in the social networks of people with serious psychiatric disorders. Soc Psychiatry Psychiatr Epidemiol. 1998;33(suppl 1):S95-S101.
27. Elbogen EB, Ferron JC, Swartz MS, Wilder CM, Swanson JW, Wagner HR. Characteristics of representative payeeship involving families of beneficiaries with psychiatric disabilities. Psychiatr Serv. 2007;58(11):1433-1440.
28. Mitchell A. VA fiduciary system seriously flawed. House Committee on Veterans Affairs Website. http://veterans.house.gov/press-release/va-fiduciary-system-seriously-flawed. Published February 9, 2012. Accessed November 25, 2014.
29. Subcommittee on Disability Assistance and Memorial Affairs, Committee on Veterans’ Affairs. Examining the U.S. Department of Veterans Affairs Fiduciary Program: How Can VA Better Protect Vulnerable Veterans and Their Families? Document 111-72. Washington, DC: U.S. Government Printing Office; 2010.
30. Subcommittee on Benefits Committee on Veterans Affairs. Hearing on Department of Veterans Affairs’ Fiduciary Program. Document Number 108-21. Washington, DC: U.S. Government Printing Office; 2003.
31. Thakker N. The state of veterans’ fiduciary programs: What is needed to protect our nation’s incapacitated veterans? Bifocal. 2006;28(2):19-27.
32. Department of Veterans Affairs. Semiannual Report to Congress: April 1, 2006-September 30, 2006. Washington, DC: Office of Inspector General, Department of Veterans Affairs; 2006.
33. Social Security. FAQs for beneficiaries who have a payee. Social Security Website. http://www.socialsecurity.gov/payee/faqbene.htm. Accessed November 25, 2014.
34. Hanrahan P, Luchins DJ, Savage C, Patrick G, Roberts D, Conrad KJ. Representative payee programs for persons with mental illness in Illinois. Psychiatr Serv. 2002;53(2):190-194.
35. Stoner MR. Money management services for the homeless mentally ill. Hosp Community Psychiatry. 1989;40(7):751-753.
36. Rosen MI, McMahon TJ, Rosenheck R. Does assigning a representative payee reduce substance abuse? Drug Alcohol Dependence. 2007;86(2-3):115-122.
37. Rosen MI. The ‘check effect’ reconsidered. Addiction. 2011;106(6):1071-1077.
38. Swartz JA, Hsieh CM, Baumohl J. Disability payments, drug use and representative payees: An analysis of the relationships. Addiction. 2003;98(7):965-975.
39. Rosen MI, Carroll KM, Stefanovics E, Rosenheck RA. A randomized controlled trial of a money management-based substance use intervention. Psychiatr Serv. 2009;60(4):498-504.
40. Rosen MI, Rosenheck R, Shaner A, Eckman T, Gamache G, Krebs C. Do patients who mismanage their funds use more health services? Adm Policy Ment Health. 2003;31(2):131-140.

Congressionally Directed Medical Research Programs Complement Other Sources of Biomedical Funding
The Congressionally Directed Medical Research Programs (CDMRP), an office within the U.S. Army Medical Research and Materiel Command, has executed funding for research in 18 biomedical programs (Table). These programs touch the lives of service members, veterans, family members, and the general public. A partnership with the military, government, scientific community, survivors, patients, and their family members brings together spheres of stakeholders that typically might not otherwise collaborate and enables the CDMRP to complement other sources of research funding while focusing on research most directly relevant to each disease, condition, or injury.
The CDMRP began in 1992 when the breast cancer advocacy community launched a grassroots effort to raise public awareness of the need for increased federal funding for breast cancer research. These advocates requested from Congress additional research funding to support innovative, high-impact research where the government was willing to take a risk to leapfrog the field forward. In response, Congress added funds to the DoD budget for breast cancer research, and the Breast Cancer Research Program (BCRP) was established with a fiscal year (FY) 1992 congressional appropriation.
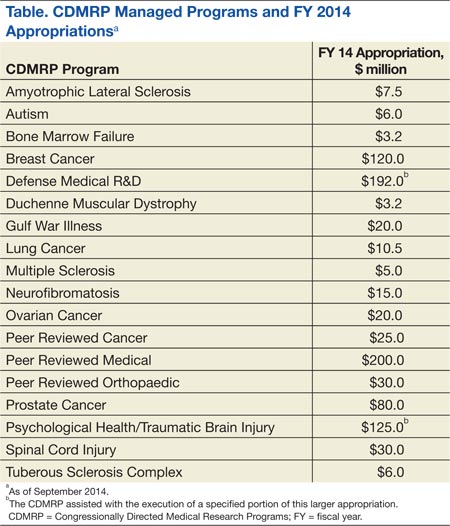
The CDMRP brought a flexible, efficient way of managing research and was enthusiastic about the advocates’ desire to have a voice in setting research priorities. Since the initial appropriation, advocates representing breast cancer, ovarian cancer, prostate cancer, neurofibromatosis, and a wide range of other diseases, conditions, and injuries have demonstrated the need to Congress to appropriate funds for their respective causes.
There are several features that differentiate the CDMRP from other funding agencies. The most significant differences follow:
- The CDMRP funds innovative high-risk/high-gain research focused on the disease, condition, or injury as specified in congressional language;
- Unlike other agencies, the CDMRP integrates patients, survivors, family members, or caregivers of a person living with the disease, condition, or injury into every aspect of the program management cycle; and
- Every year the CDMRP programs develop a new investment strategy and release award mechanisms based on the most critical needs and scientific gaps.
These features ensure that the research funded in each program is relevant and has a high potential for impact in the patient community.
Funding and Science Management
Funding for the programs managed by the CDMRP does not appear as part of the DoD core funding in the president’s budget; instead, Congress assesses the needs of its constituents and adds funding to the DoD budget, designated specifically to meet those needs on an annual basis. Management of the CDMRP is funded entirely out of the annual appropriation, and there is no financial burden to the DoD. Unlike other federally funded agencies that receive funding in the president’s budget every FY, each CDMRP program develops an investment strategy based on a single yearly congressional appropriation.
Full project funding is obligated at the start from the single FY appropriation, ensuring multiyear research projects are not at funding risk. This method is in contrast to other agencies, which fund projects in budget years and may fund only a percentage of previously committed levels or cut the length of time for funding, depending on varying budget year funding policies.
Each CDMRP research program is managed by a multidisciplinary team and includes an external advisory board composed of world-renowned expert scientists, clinicians, and survivors from the DoD, National Institutes of Health (NIH), Centers for Disease Control and Prevention, VA, as well as academia and industry. Each research program has a vision/mission that is focused on ending or curing that disease, condition, or injury, ameliorating its consequences, or having a major impact on the quality of life of its survivors. Establishing a vision is the first major milestone in program execution, which enables each program to develop its individual investment strategy.
When establishing the investment strategy, each program evaluates the funding landscape by comparing research portfolios and award mechanisms within the organization as well as with other federal and nonfederal agencies. For some of the CDMRP-managed programs, such as the Peer Reviewed Orthopaedic Research Program, the Spinal Cord Injury Research Program, and the Psychological Health/Traumatic Brain Injury Research Program, topic areas are aligned with the Defense Health Program (DHP) Defense Medical Research and Development Program (DMRDP). The appropriate DHP Joint Program Committee provides guidance on military-relevant research priorities and uses oversight of all core and congressional special interest research efforts across the DoD services to complement and leverage projects with CDMRP funding.
Establishment of each program’s vision and investment strategy leads to the development of Program Announcements (PAs), which describe the intent of each award mechanism in order to solicit research applications aimed at making a significant and nonincremental impact. The PAs for each program as well as links to application submission are made available on the CDMRP webpage (http://cdmrp.army.mil/funding/prgdefault.shtml).
Emphasized in CDMRP research opportunities are the specific needs of its advocacy communities. The CDMRP recognizes the value of firsthand experience with each of the targeted diseases, conditions, and injuries and has been a leader in integrating consumers (defined as a patient, survivor, family member, or caregiver of a person living with the disease, condition, or injury) into every aspect of a program’s execution. The value of consumer involvement is derived from each individual’s firsthand experience. This approach adds a perspective, passion, and sense of urgency, which ensures that the human dimension is incorporated in each program’s policy, investment strategy, and research focus. Consumers vote side by side with scientists and clinicians on advisory boards for each of the programs, and they have since the inception of the CDMRP.
Each research application must have an impact statement describing how the proposed research, if successful, will transform an aspect of the understanding, prevention, detection, and/or treatment of the respective program area; ie, have an impact on the consumer community. The impact of the proposed research is a critical determinant of the funding recommendation.
Each research program’s investment strategy and associated award mechanisms provide the framework and direction necessary to most effectively invest the congressional appropriation. Operationally, the CDMRP monitors for potentially similar approaches in research at many milestones in its science management model to ensure that the CDMRP-funded research is synergistic and harmonizing, not duplicative of other federal and nonfederal sources of funding.
At the time of proposal submission, a comprehensive list of current and pending funding support for the principal investigator (PI) and all key personnel must be submitted. During the review process, peer reviewers who have extensive knowledge of the subject consult the pending and existing support documentation to ensure the research is complementary to what is already being investigated in the field. This ensures that the proposals recommended for funding are synergistic and contribute to the substantiation of data relevant to clinical decisions. After a project has been recommended for funding, the CDMRP scientific officers (ie, scientific technical advisors) check all available sources to ensure that the project to be funded is complementary to ongoing research. Last, during the period of performance, details about funding applied for and/or new funding obtained is required in the annual technical progress reports. Through this science management model, CDMRP ensures that funded research is complementary and able to innovatively fill gaps in the biomedical research pipeline.
Biomedical Funding
Most diseases, conditions, and injuries are complex, and finding a cure for them requires problem solving from multiple disciplines and approaches as well as validation of research results. Prior to the fielding and clinical application of knowledge and products, research spans a continuum from discovery to clinical trials. As shown in Figure 1, novel award mechanisms developed by the CDMRP programs facilitate the success of this research continuum and innovatively complement traditional research funding agencies, such as the NIH. The intent of each award mechanism is designed to solicit research proposals focused on the needs of the patient community and how they relate to the vision of the program.
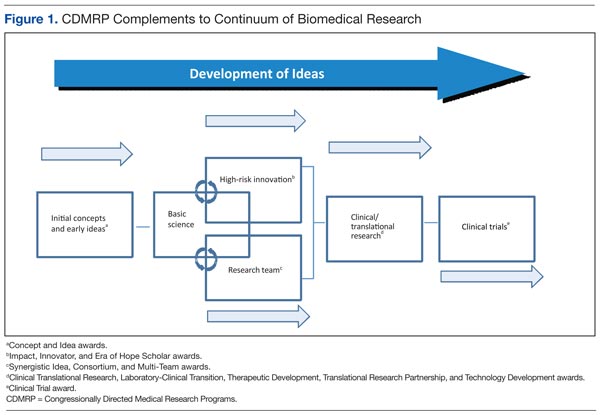
The Research Continuum
Some CDMRP programs provide support along the entire continuum of research. Other programs, with less mature research fields, focus on funding more basic research. There are also CDMRP programs that place emphasis on clinical and advanced development research. Each program’s annual investment strategy and choice of award mechanisms is based on the needs of the patient and research communities, gaps in research, and other barriers to progress in curing, rehabilitating, or eliminating the disease, condition, or injury.
Fostering the Development of Ideas
Since its inception in 1992, the DoD BCRP has sought to fund innovative, ground-breaking research by encouraging “outside the box” thinking and fostering creative collaborations that have the potential to have a high impact toward the eradication of this disease. The BCRP has a proven history of developing novel award mechanisms to foster new approaches in research. For example, the Idea Award was developed in the initial years of the BCRP to support novel research with little or no preliminary data that could ultimately lead to a critical discovery or advancement in breast cancer research. At that time, such high-risk, but potentially high-reward research was determined to be significantly underfunded by existing agencies and was thus identified as a gap in funding. Several major advancements in breast cancer, including the development of trastuzumab, testing of sentinel lymph node biopsy, and discovery of BRCA2 and PTEN gene mutations, were supported in part with funding from the BCRP.
The Idea Award mechanism has been adopted by other CDMRP programs to introduce new paradigms, challenge current paradigms, or look at existing problems from new perspectives in other disease- or condition-focused research. To support the exploration of highly innovative, untested concepts or theories, the BCRP and the Prostate Cancer Research Program (PCRP) developed other award mechanisms known as the Concept Award and the Exploration-Hypothesis Development Award, respectively.
These award mechanisms supporting early concepts and ideas provided complementary and multiple approaches to the most traditional and well-known grant program: the NIH R01 (Research Project Grant Program). In general, an R01 award requires preliminary data, supports the next logical or incremental step, is knowledge focused, has no specific program requirements, and is not focused on a single disease or condition. One of the hallmarks of this type of early idea award was that the preliminary data could then be used to submit a research proposal to an NIH-like R01 award mechanism.
A recent survey of Idea Awards offered by the BCRP from 2006 to 2011 indicated that > 40% of awardees successfully obtained other sources of funding, more than half coming from the NIH. The NIH Common Fund, established in 2006, led to the creation of a high-risk/high-reward program with the Transformative Research Award, which is focused on innovation and challenging existing paradigms, unlike the R01 mechanism. This indicates that although other agencies have developed award mechanisms supporting pilot and feasibility studies (eg, R21 awards–Exploratory/Developmental Research Grant) and high-risk/high-reward research (eg, Transformative Research Award), CDMRP’s creation of these mechanisms has transformed biomedical research and remains an important vehicle in the idea development funding pipeline.
Facilitating Collaborative Partnerships
Many funding agencies have recognized that research collaborations are important for investigating the increasing complexity of disease, conditions, and injuries. The CDMRP-managed BCRP, Ovarian Cancer Research Program(OCRP), and PCRP created collaborative award mechanisms (eg, the Synergistic Idea Award) in which one research project is submitted by multiple investigators whose combined resources are leveraged and their expertise synergized to better address a research question. A unique aspect of these collaborative award mechanisms is that all the investigators (appropriately called partners) receive an individual award, not a subaward, incentivizing investigators to develop partnerships that might not otherwise be formed.
Rewarding Science Teams
Recognizing that research collaborations are important in investigating the increasing complexity of disease and injuries, several of the CDMRP research programs have developed team science award mechanisms. Using the Manhattan Project as a successful example of bringing together the most talented scientists to conduct research and development simultaneously to quickly solve a common problem, the CDMRP Neurofibromatosis Research Program developed a consortium award mechanism to establish consortia of exceptional investigators to conceive, develop, and conduct collaborative pilot, phase 1, and phase 2 clinical evaluations. To the authors’ knowledge, this is the largest dedicated effort in neurofibromatosis research to date. This mechanism has been adopted by several other CDMRP programs to focus on multidisciplinary approaches with investigators from multiple institutions, to address high-impact research ideas or unmet needs.
The PCRP used this framework to support the infrastructure necessary for a consortium consisting of 13 major U.S. cancer centers (Prostate Cancer Clinical Trials Consortium [PCCTC]) to rapidly execute early-phase clinical trials of therapeutic agents. The PCCTC consortium now conducts about 25% of all early-phase U.S. clinical trials for prostate cancer and has dramatically impacted the speed at which new options for therapy are available to patients. For example, the drug abiraterone acetate was brought through clinical testing in half the time typically required and represents a new option in the treatment of metastatic prostate cancer. In addition, the PCCTC also brought MDV3100, another therapy for advanced disease, rapidly through all phases of clinical testing.
The Lung Cancer Research Program (LCRP) used the consortium award mechanism to create a unique, early detection clinical consortium that includes 4 academic organizations, 4 military treatment facilities, and 7 VA facilities to focus on characterizing, developing, and/or improving early detection modalities for lung cancer. The BCRP has recently introduced the Multi-Team and Transformative Vision Award mechanisms to support innovative teams of scientists, clinicians, and breast cancer survivors, patients, family members, and persons affected by and/or at risk of breast cancer to work together toward making breakthroughs that may have a revolutionary impact in breast cancer prevention or treatment.
Collectively, these team science mechanisms facilitate the exchange of ideas and bring together individuals with special knowledge and skills needed to sustain cross-fertilization. Such collaborations can unravel complex phenomena and significantly accelerate progress, thus shrinking the pipeline of traditional reductionist approaches to novel discoveries and outcomes.
Encouraging Visionary Individuals
The BCRP has developed a series of award mechanisms that seek to identify and fund individuals with potential for, or a history of, extraordinary innovation and creativity at varying career stages, from predoctoral training through established investigators. The BCRP Era of Hope Scholar (EOHS) Award supports early-career researchers who are the best and brightest in their field(s) and therefore have a high potential for innovation in breast cancer research.
While demonstrated experience in forming effective partnerships and collaborations is a requirement, experience in breast cancer is not, encouraging applicants to challenge current dogma and look beyond tradition and convention already established in the field. The unique intent of this mechanism changed the way innovative science is reviewed, since the individual young investigator, rather than the project, is the central feature of this award. The BCRP Innovator Award supports established, visionary individuals, who have demonstrated creativity, innovative work, and leadership in any field. This mechanism also broke new ground by providing individuals with the funding and freedom to pursue their most novel, visionary, high-risk ideas that could ultimately lead to ending disease.
Dr. Greg Hannon of Cold Spring Harbor Laboratory received a BCRP New Investigator Award in FY 1995 and was one of the first recipients of the Innovator Award in FY 2001, making scientific breakthroughs in understanding the mechanisms of RNA interference. He is currently applying these discoveries to the identification of new therapeutic targets for breast cancer. By funding such individuals at different stages of their research career, the BCRP has provided the foundation for many of today’s leading breast cancer researchers. Moreover, innovative researchers, such as Dr. Hannon, have moved from other fields into the breast cancer field as a result of BCRP funding.
Another investigator who transitioned into distinct disease fields as a result of CDMRP funding is. From 2002 to 2007, Dr. Chinnaiyan received funding from the PCRP and made a paradigm-shifting discovery and identified multiple recurrent gene fusions in human prostate cancers. Dr. Chinnaiyan had not worked in prostate cancer before embarking on his groundbreaking studies and is now a leader in that field. In 2007, Dr. Chinnaiyan had a vision that characterization of recurrent gene fusions within human breast cancers could lead to the identification of new biomarkers and therapeutic targets for this disease. He was awarded the BCRP EOHS Award and went on to make an exciting discovery of 2 novel recurrent and actionable gene fusions in breast cancer, the results of which were published in 2011.1
Within the CDMRP, the OCRP has adopted the Innovator Award mechanism to attract visionary individuals from any field of research to focus their creativity, innovation, and leadership on ovarian cancer research. Through the use of this mechanism, this program has been successful in funding several noncancer scientists, including engineers, to help solve biomedical problems in the field. Six years after the initial release by CDMRP, the NIH introduced the Director’s New Innovator Award and the Pioneer Award. This CDMRP novel mechanism seems to have transformed funding strategies by encouraging innovative individuals to provide solutions to the toughest medical challenges.
Translation of Science to the Clinic
A critical component in the research continuum is the translation of promising lead agents to clinical trials. The CDMRP programs uniquely address clinical/translational research by focusing on critical needs and specific gaps within a particular disease, condition, or injury rather than a broad investment in general translational research. For example, the PCRP Laboratory-Clinical Transition Award mechanism supports product-driven preclinical studies of promising lead agents or medical devices that have the potential to revolutionize prostate cancer clinical care. For this award mechanism, lead agent development projects generate preclinical data to be used for an FDA investigational device exemption application and/or current Good Manufacturing Practice production of a medical device.
Preclinical Awards
The CDMRP Amyotrophic Lateral Sclerosis (ALS) Research Program focuses on the preclinical development of new therapies using the Therapeutic Development Award mechanism, which is product-driven and supports preclinical assessment of therapeutics, and the Therapeutic Idea Award mechanism, which promotes new ideas for novel therapeutics. This preclinical focus on therapeutic development compliments that of the National Institute of Neurological Disorders and Stroke (NINDS), the major NIH funder of ALS research, which concentrates primarily on funding basic and clinical research.
The CDMRP Gulf War Illness (GWI) Research Program created a unique award mechanism, the Innovative Treatment Evaluation Award, to support the early systematic evaluation of innovative treatment interventions that can provide proof of principle data for broader efficacy trials. The only other major funder of GWI research is the VA Office of Research and Development, which relies on the individual research interests of its intramural investigators.
In support of the 2012 Presidential Executive Order, the DoD and VA devoted > $100 million to fund 2 new consortia aimed at improving diagnosis and treatment of mild traumatic brain injury and posttraumatic stress disorder (PTSD). The Consortium to Alleviate PTSD and the Chronic Effects of Neurotrauma Consortium are jointly managed by the VA and CDMRP on behalf of the DoD and bring together leading scientists and clinicians devoted to the health and welfare of our nation’s service members and veterans. Consortium efforts are expected to have an emphasis toward translational/clinical work.
The OCRP developed the Translational Research Partnership Award mechanism to move an observation from the laboratory into clinical application for ovarian cancer. The novelty of this award is that one partner in the collaboration is required to be a laboratory scientist and the other is required to be a clinician. This award mechanism has been adopted by several other CDMRP research programs; a comparable mechanism has not been offered by other funding agencies.
The Peer Reviewed Orthopaedic Research Program (PRORP) is the only major funding source dedicated to research in combat and combat-related orthopedic injuries, the largest source of long-term morbidity for injured military personnel. The PRORP crafts investment strategies to address these challenges using award mechanisms such as the Technology Development, Translational Partnership, and the Clinical Trial awards, which emphasize clinical and mature translational research. While industry, including pharmaceutical, biotechnology, and medical device firms, remains the largest funder of clinical trial research, the CDMRP’s niche in this arena is the ability to encourage preventive or therapeutic interventions that are in line with the priorities of the communities affected by the disease.
Training and Career Development
Training the next generation of scientists in both basic and clinical research is instrumental for the advancement of biomedical research. The career development pipeline traditionally proceeds from predoctoral through postdoctoral training to the new or junior faculty level investigator (Figure 2). The CDMRP offers pre- and postdoctoral training award mechanisms in which the research is disease- or condition-specific, and the trainee is named as the principal investigator, thereby providing the trainee with his or her first source of research funding.
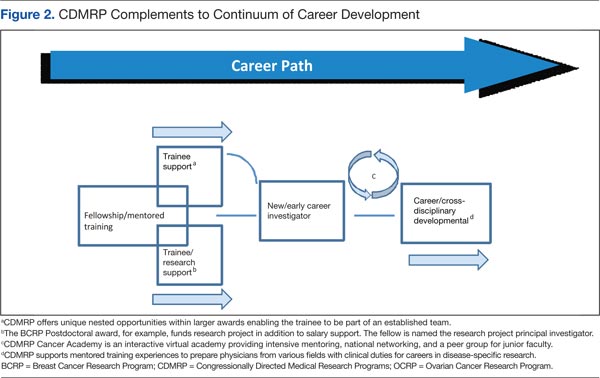
The BCRP Postdoctoral Award mechanism is unique in that it provides funding for the research in addition to stipend support. The trainee is expected to have discretion over management of the award, thus providing valuable training as a researcher. In addition to recent doctoral graduates, many CDMRP training mechanisms support recent medical graduates and encourage the training of physician-scientists. For example, the Prostate Cancer Research Program (PCRP) supports the training of physicians with clinical duties for a career in prostate cancer research through the physician Research Training Award. At the time of application, the PI must be in the last year of medical residency, must designate a mentor with an established research program, and institutions must provide at least 40% protection of the PI’s time for research.
The PRORP offers a career development award in which active-duty military researchers, physical therapists, occupational therapists, or physician-scientists with < 8 years of clinical or postdoctoral research experience (excluding clinical residency or medical fellowship training) are eligible to apply. The LCRP has offered a promising clinician research award supporting the training of MDs or MD/PhDs with clinical duties and/or responsibilities that are within 5 years of a professional appointment. Each of these physician training mechanisms not only provide support at an early career stage to investigators at DoD or other clinical sites, but also enable physicians to have a career at the forefront of research and clinical practice.
In 2002, the NIH observed that the percentage of competing NIH grants awarded to investigators aged ≤ 35 years declined from 23% in 1980 to < 4% in 2002. To support these young investigators, the NIH introduced the Pathway to Independence Award mechanism, providing several years of mentored support for promising postdoctoral scientists followed by several years of independent support. More recently, the NIH has focused on new investigators by offering more R01 awards to this group. Because securing early concept funding helps pave the way for the larger R01 grant application, increasing the support for early investigators is important for creating a critical threshold of scientists with exceptional talent.
The CDMRP New Investigator Award programs are intended to support scientists in the early stages of their careers through the continued development of promising independent investigators and/or the transition of established investigators. Each of the CDMRP programs has developed variations of the New Investigator Award to meet the goals of the disease- or condition-specific program. The OCRP Ovarian Cancer Academy, which includes both medical doctors and PhD scientists, is one of the more recent and innovative New Investigator Award mechanisms. This academy is an interactive virtual research and training platform that provides intensive mentoring, national networking, and a peer group for junior faculty in a collaborative and interactive environment. Taken together, the CDMRP programs offer unique award mechanisms to support researchers at critical junctures in their careers. The unique qualities and competitiveness of the CDMRP’s disease/condition-focused training awards have supported the early-career foundation for many of today’s leading researchers.
Conclusions
Congressionally Directed Medical Research Programs complement other federal and nonfederal sources of biomedical research funding and fill important research gaps through an evaluation of the funding landscape, identification of research gaps, and development of novel award mechanisms. The integration of survivors, patients, and their family members ensures that every aspect of the program management cycle balances scientific expertise with human perspective and has high impact on the patient community.
As new needs emerge, each research program designs an investment strategy to target areas most critically in need. The subsequent release of novel award mechanisms focuses research and enables an acceleration of science and/or leading researchers to the patient’s bedside. The CDMRP-funded discoveries have contributed to the development of new therapeutics, new diagnostics, and to changes in the standard of care exemplifying significant clinical impact and the innovative nature of these Congressional Special Interest Medical Research Programs.
To learn more about CDMRP or to receive funding notifications by e-mail, please visit http://cdmrp.army.mil.
Acknowledgments
The authors gratefully note the CDMRP Program Evaluation Steering Committee for critical review of the manuscript. Also acknowledged are CDMRP staff at large and Dr. Lisa Kinnard for support in this project.
Author disclosures
The authors report no actual or potential conflicts of interest with regard to this article.
Disclaimer
The opinions expressed herein are those of the authors and do not necessarily reflect those of Federal Practitioner, Frontline Medical Communications Inc., the U.S. Government, or any of its agencies. This article may discuss unlabeled or investigational use of certain drugs. Please review the complete prescribing information for specific drugs or drug combinations—including indications, contraindications, warnings, and adverse effects—before administering pharmacologic therapy to patients.
1. Robinson DR, Kalyana-Sundaram S, Wu Y-I, et al. Functionally recurrent rearrangements of the MAST kinase and Notch gene families in breast cancer. Nature Med. 2011;17(12):1646-1651.
The Congressionally Directed Medical Research Programs (CDMRP), an office within the U.S. Army Medical Research and Materiel Command, has executed funding for research in 18 biomedical programs (Table). These programs touch the lives of service members, veterans, family members, and the general public. A partnership with the military, government, scientific community, survivors, patients, and their family members brings together spheres of stakeholders that typically might not otherwise collaborate and enables the CDMRP to complement other sources of research funding while focusing on research most directly relevant to each disease, condition, or injury.
The CDMRP began in 1992 when the breast cancer advocacy community launched a grassroots effort to raise public awareness of the need for increased federal funding for breast cancer research. These advocates requested from Congress additional research funding to support innovative, high-impact research where the government was willing to take a risk to leapfrog the field forward. In response, Congress added funds to the DoD budget for breast cancer research, and the Breast Cancer Research Program (BCRP) was established with a fiscal year (FY) 1992 congressional appropriation.
The CDMRP brought a flexible, efficient way of managing research and was enthusiastic about the advocates’ desire to have a voice in setting research priorities. Since the initial appropriation, advocates representing breast cancer, ovarian cancer, prostate cancer, neurofibromatosis, and a wide range of other diseases, conditions, and injuries have demonstrated the need to Congress to appropriate funds for their respective causes.
There are several features that differentiate the CDMRP from other funding agencies. The most significant differences follow:
- The CDMRP funds innovative high-risk/high-gain research focused on the disease, condition, or injury as specified in congressional language;
- Unlike other agencies, the CDMRP integrates patients, survivors, family members, or caregivers of a person living with the disease, condition, or injury into every aspect of the program management cycle; and
- Every year the CDMRP programs develop a new investment strategy and release award mechanisms based on the most critical needs and scientific gaps.
These features ensure that the research funded in each program is relevant and has a high potential for impact in the patient community.
Funding and Science Management
Funding for the programs managed by the CDMRP does not appear as part of the DoD core funding in the president’s budget; instead, Congress assesses the needs of its constituents and adds funding to the DoD budget, designated specifically to meet those needs on an annual basis. Management of the CDMRP is funded entirely out of the annual appropriation, and there is no financial burden to the DoD. Unlike other federally funded agencies that receive funding in the president’s budget every FY, each CDMRP program develops an investment strategy based on a single yearly congressional appropriation.
Full project funding is obligated at the start from the single FY appropriation, ensuring multiyear research projects are not at funding risk. This method is in contrast to other agencies, which fund projects in budget years and may fund only a percentage of previously committed levels or cut the length of time for funding, depending on varying budget year funding policies.
Each CDMRP research program is managed by a multidisciplinary team and includes an external advisory board composed of world-renowned expert scientists, clinicians, and survivors from the DoD, National Institutes of Health (NIH), Centers for Disease Control and Prevention, VA, as well as academia and industry. Each research program has a vision/mission that is focused on ending or curing that disease, condition, or injury, ameliorating its consequences, or having a major impact on the quality of life of its survivors. Establishing a vision is the first major milestone in program execution, which enables each program to develop its individual investment strategy.
When establishing the investment strategy, each program evaluates the funding landscape by comparing research portfolios and award mechanisms within the organization as well as with other federal and nonfederal agencies. For some of the CDMRP-managed programs, such as the Peer Reviewed Orthopaedic Research Program, the Spinal Cord Injury Research Program, and the Psychological Health/Traumatic Brain Injury Research Program, topic areas are aligned with the Defense Health Program (DHP) Defense Medical Research and Development Program (DMRDP). The appropriate DHP Joint Program Committee provides guidance on military-relevant research priorities and uses oversight of all core and congressional special interest research efforts across the DoD services to complement and leverage projects with CDMRP funding.
Establishment of each program’s vision and investment strategy leads to the development of Program Announcements (PAs), which describe the intent of each award mechanism in order to solicit research applications aimed at making a significant and nonincremental impact. The PAs for each program as well as links to application submission are made available on the CDMRP webpage (http://cdmrp.army.mil/funding/prgdefault.shtml).
Emphasized in CDMRP research opportunities are the specific needs of its advocacy communities. The CDMRP recognizes the value of firsthand experience with each of the targeted diseases, conditions, and injuries and has been a leader in integrating consumers (defined as a patient, survivor, family member, or caregiver of a person living with the disease, condition, or injury) into every aspect of a program’s execution. The value of consumer involvement is derived from each individual’s firsthand experience. This approach adds a perspective, passion, and sense of urgency, which ensures that the human dimension is incorporated in each program’s policy, investment strategy, and research focus. Consumers vote side by side with scientists and clinicians on advisory boards for each of the programs, and they have since the inception of the CDMRP.
Each research application must have an impact statement describing how the proposed research, if successful, will transform an aspect of the understanding, prevention, detection, and/or treatment of the respective program area; ie, have an impact on the consumer community. The impact of the proposed research is a critical determinant of the funding recommendation.
Each research program’s investment strategy and associated award mechanisms provide the framework and direction necessary to most effectively invest the congressional appropriation. Operationally, the CDMRP monitors for potentially similar approaches in research at many milestones in its science management model to ensure that the CDMRP-funded research is synergistic and harmonizing, not duplicative of other federal and nonfederal sources of funding.
At the time of proposal submission, a comprehensive list of current and pending funding support for the principal investigator (PI) and all key personnel must be submitted. During the review process, peer reviewers who have extensive knowledge of the subject consult the pending and existing support documentation to ensure the research is complementary to what is already being investigated in the field. This ensures that the proposals recommended for funding are synergistic and contribute to the substantiation of data relevant to clinical decisions. After a project has been recommended for funding, the CDMRP scientific officers (ie, scientific technical advisors) check all available sources to ensure that the project to be funded is complementary to ongoing research. Last, during the period of performance, details about funding applied for and/or new funding obtained is required in the annual technical progress reports. Through this science management model, CDMRP ensures that funded research is complementary and able to innovatively fill gaps in the biomedical research pipeline.
Biomedical Funding
Most diseases, conditions, and injuries are complex, and finding a cure for them requires problem solving from multiple disciplines and approaches as well as validation of research results. Prior to the fielding and clinical application of knowledge and products, research spans a continuum from discovery to clinical trials. As shown in Figure 1, novel award mechanisms developed by the CDMRP programs facilitate the success of this research continuum and innovatively complement traditional research funding agencies, such as the NIH. The intent of each award mechanism is designed to solicit research proposals focused on the needs of the patient community and how they relate to the vision of the program.
The Research Continuum
Some CDMRP programs provide support along the entire continuum of research. Other programs, with less mature research fields, focus on funding more basic research. There are also CDMRP programs that place emphasis on clinical and advanced development research. Each program’s annual investment strategy and choice of award mechanisms is based on the needs of the patient and research communities, gaps in research, and other barriers to progress in curing, rehabilitating, or eliminating the disease, condition, or injury.
Fostering the Development of Ideas
Since its inception in 1992, the DoD BCRP has sought to fund innovative, ground-breaking research by encouraging “outside the box” thinking and fostering creative collaborations that have the potential to have a high impact toward the eradication of this disease. The BCRP has a proven history of developing novel award mechanisms to foster new approaches in research. For example, the Idea Award was developed in the initial years of the BCRP to support novel research with little or no preliminary data that could ultimately lead to a critical discovery or advancement in breast cancer research. At that time, such high-risk, but potentially high-reward research was determined to be significantly underfunded by existing agencies and was thus identified as a gap in funding. Several major advancements in breast cancer, including the development of trastuzumab, testing of sentinel lymph node biopsy, and discovery of BRCA2 and PTEN gene mutations, were supported in part with funding from the BCRP.
The Idea Award mechanism has been adopted by other CDMRP programs to introduce new paradigms, challenge current paradigms, or look at existing problems from new perspectives in other disease- or condition-focused research. To support the exploration of highly innovative, untested concepts or theories, the BCRP and the Prostate Cancer Research Program (PCRP) developed other award mechanisms known as the Concept Award and the Exploration-Hypothesis Development Award, respectively.
These award mechanisms supporting early concepts and ideas provided complementary and multiple approaches to the most traditional and well-known grant program: the NIH R01 (Research Project Grant Program). In general, an R01 award requires preliminary data, supports the next logical or incremental step, is knowledge focused, has no specific program requirements, and is not focused on a single disease or condition. One of the hallmarks of this type of early idea award was that the preliminary data could then be used to submit a research proposal to an NIH-like R01 award mechanism.
A recent survey of Idea Awards offered by the BCRP from 2006 to 2011 indicated that > 40% of awardees successfully obtained other sources of funding, more than half coming from the NIH. The NIH Common Fund, established in 2006, led to the creation of a high-risk/high-reward program with the Transformative Research Award, which is focused on innovation and challenging existing paradigms, unlike the R01 mechanism. This indicates that although other agencies have developed award mechanisms supporting pilot and feasibility studies (eg, R21 awards–Exploratory/Developmental Research Grant) and high-risk/high-reward research (eg, Transformative Research Award), CDMRP’s creation of these mechanisms has transformed biomedical research and remains an important vehicle in the idea development funding pipeline.
Facilitating Collaborative Partnerships
Many funding agencies have recognized that research collaborations are important for investigating the increasing complexity of disease, conditions, and injuries. The CDMRP-managed BCRP, Ovarian Cancer Research Program(OCRP), and PCRP created collaborative award mechanisms (eg, the Synergistic Idea Award) in which one research project is submitted by multiple investigators whose combined resources are leveraged and their expertise synergized to better address a research question. A unique aspect of these collaborative award mechanisms is that all the investigators (appropriately called partners) receive an individual award, not a subaward, incentivizing investigators to develop partnerships that might not otherwise be formed.
Rewarding Science Teams
Recognizing that research collaborations are important in investigating the increasing complexity of disease and injuries, several of the CDMRP research programs have developed team science award mechanisms. Using the Manhattan Project as a successful example of bringing together the most talented scientists to conduct research and development simultaneously to quickly solve a common problem, the CDMRP Neurofibromatosis Research Program developed a consortium award mechanism to establish consortia of exceptional investigators to conceive, develop, and conduct collaborative pilot, phase 1, and phase 2 clinical evaluations. To the authors’ knowledge, this is the largest dedicated effort in neurofibromatosis research to date. This mechanism has been adopted by several other CDMRP programs to focus on multidisciplinary approaches with investigators from multiple institutions, to address high-impact research ideas or unmet needs.
The PCRP used this framework to support the infrastructure necessary for a consortium consisting of 13 major U.S. cancer centers (Prostate Cancer Clinical Trials Consortium [PCCTC]) to rapidly execute early-phase clinical trials of therapeutic agents. The PCCTC consortium now conducts about 25% of all early-phase U.S. clinical trials for prostate cancer and has dramatically impacted the speed at which new options for therapy are available to patients. For example, the drug abiraterone acetate was brought through clinical testing in half the time typically required and represents a new option in the treatment of metastatic prostate cancer. In addition, the PCCTC also brought MDV3100, another therapy for advanced disease, rapidly through all phases of clinical testing.
The Lung Cancer Research Program (LCRP) used the consortium award mechanism to create a unique, early detection clinical consortium that includes 4 academic organizations, 4 military treatment facilities, and 7 VA facilities to focus on characterizing, developing, and/or improving early detection modalities for lung cancer. The BCRP has recently introduced the Multi-Team and Transformative Vision Award mechanisms to support innovative teams of scientists, clinicians, and breast cancer survivors, patients, family members, and persons affected by and/or at risk of breast cancer to work together toward making breakthroughs that may have a revolutionary impact in breast cancer prevention or treatment.
Collectively, these team science mechanisms facilitate the exchange of ideas and bring together individuals with special knowledge and skills needed to sustain cross-fertilization. Such collaborations can unravel complex phenomena and significantly accelerate progress, thus shrinking the pipeline of traditional reductionist approaches to novel discoveries and outcomes.
Encouraging Visionary Individuals
The BCRP has developed a series of award mechanisms that seek to identify and fund individuals with potential for, or a history of, extraordinary innovation and creativity at varying career stages, from predoctoral training through established investigators. The BCRP Era of Hope Scholar (EOHS) Award supports early-career researchers who are the best and brightest in their field(s) and therefore have a high potential for innovation in breast cancer research.
While demonstrated experience in forming effective partnerships and collaborations is a requirement, experience in breast cancer is not, encouraging applicants to challenge current dogma and look beyond tradition and convention already established in the field. The unique intent of this mechanism changed the way innovative science is reviewed, since the individual young investigator, rather than the project, is the central feature of this award. The BCRP Innovator Award supports established, visionary individuals, who have demonstrated creativity, innovative work, and leadership in any field. This mechanism also broke new ground by providing individuals with the funding and freedom to pursue their most novel, visionary, high-risk ideas that could ultimately lead to ending disease.
Dr. Greg Hannon of Cold Spring Harbor Laboratory received a BCRP New Investigator Award in FY 1995 and was one of the first recipients of the Innovator Award in FY 2001, making scientific breakthroughs in understanding the mechanisms of RNA interference. He is currently applying these discoveries to the identification of new therapeutic targets for breast cancer. By funding such individuals at different stages of their research career, the BCRP has provided the foundation for many of today’s leading breast cancer researchers. Moreover, innovative researchers, such as Dr. Hannon, have moved from other fields into the breast cancer field as a result of BCRP funding.
Another investigator who transitioned into distinct disease fields as a result of CDMRP funding is. From 2002 to 2007, Dr. Chinnaiyan received funding from the PCRP and made a paradigm-shifting discovery and identified multiple recurrent gene fusions in human prostate cancers. Dr. Chinnaiyan had not worked in prostate cancer before embarking on his groundbreaking studies and is now a leader in that field. In 2007, Dr. Chinnaiyan had a vision that characterization of recurrent gene fusions within human breast cancers could lead to the identification of new biomarkers and therapeutic targets for this disease. He was awarded the BCRP EOHS Award and went on to make an exciting discovery of 2 novel recurrent and actionable gene fusions in breast cancer, the results of which were published in 2011.1
Within the CDMRP, the OCRP has adopted the Innovator Award mechanism to attract visionary individuals from any field of research to focus their creativity, innovation, and leadership on ovarian cancer research. Through the use of this mechanism, this program has been successful in funding several noncancer scientists, including engineers, to help solve biomedical problems in the field. Six years after the initial release by CDMRP, the NIH introduced the Director’s New Innovator Award and the Pioneer Award. This CDMRP novel mechanism seems to have transformed funding strategies by encouraging innovative individuals to provide solutions to the toughest medical challenges.
Translation of Science to the Clinic
A critical component in the research continuum is the translation of promising lead agents to clinical trials. The CDMRP programs uniquely address clinical/translational research by focusing on critical needs and specific gaps within a particular disease, condition, or injury rather than a broad investment in general translational research. For example, the PCRP Laboratory-Clinical Transition Award mechanism supports product-driven preclinical studies of promising lead agents or medical devices that have the potential to revolutionize prostate cancer clinical care. For this award mechanism, lead agent development projects generate preclinical data to be used for an FDA investigational device exemption application and/or current Good Manufacturing Practice production of a medical device.
Preclinical Awards
The CDMRP Amyotrophic Lateral Sclerosis (ALS) Research Program focuses on the preclinical development of new therapies using the Therapeutic Development Award mechanism, which is product-driven and supports preclinical assessment of therapeutics, and the Therapeutic Idea Award mechanism, which promotes new ideas for novel therapeutics. This preclinical focus on therapeutic development compliments that of the National Institute of Neurological Disorders and Stroke (NINDS), the major NIH funder of ALS research, which concentrates primarily on funding basic and clinical research.
The CDMRP Gulf War Illness (GWI) Research Program created a unique award mechanism, the Innovative Treatment Evaluation Award, to support the early systematic evaluation of innovative treatment interventions that can provide proof of principle data for broader efficacy trials. The only other major funder of GWI research is the VA Office of Research and Development, which relies on the individual research interests of its intramural investigators.
In support of the 2012 Presidential Executive Order, the DoD and VA devoted > $100 million to fund 2 new consortia aimed at improving diagnosis and treatment of mild traumatic brain injury and posttraumatic stress disorder (PTSD). The Consortium to Alleviate PTSD and the Chronic Effects of Neurotrauma Consortium are jointly managed by the VA and CDMRP on behalf of the DoD and bring together leading scientists and clinicians devoted to the health and welfare of our nation’s service members and veterans. Consortium efforts are expected to have an emphasis toward translational/clinical work.
The OCRP developed the Translational Research Partnership Award mechanism to move an observation from the laboratory into clinical application for ovarian cancer. The novelty of this award is that one partner in the collaboration is required to be a laboratory scientist and the other is required to be a clinician. This award mechanism has been adopted by several other CDMRP research programs; a comparable mechanism has not been offered by other funding agencies.
The Peer Reviewed Orthopaedic Research Program (PRORP) is the only major funding source dedicated to research in combat and combat-related orthopedic injuries, the largest source of long-term morbidity for injured military personnel. The PRORP crafts investment strategies to address these challenges using award mechanisms such as the Technology Development, Translational Partnership, and the Clinical Trial awards, which emphasize clinical and mature translational research. While industry, including pharmaceutical, biotechnology, and medical device firms, remains the largest funder of clinical trial research, the CDMRP’s niche in this arena is the ability to encourage preventive or therapeutic interventions that are in line with the priorities of the communities affected by the disease.
Training and Career Development
Training the next generation of scientists in both basic and clinical research is instrumental for the advancement of biomedical research. The career development pipeline traditionally proceeds from predoctoral through postdoctoral training to the new or junior faculty level investigator (Figure 2). The CDMRP offers pre- and postdoctoral training award mechanisms in which the research is disease- or condition-specific, and the trainee is named as the principal investigator, thereby providing the trainee with his or her first source of research funding.
The BCRP Postdoctoral Award mechanism is unique in that it provides funding for the research in addition to stipend support. The trainee is expected to have discretion over management of the award, thus providing valuable training as a researcher. In addition to recent doctoral graduates, many CDMRP training mechanisms support recent medical graduates and encourage the training of physician-scientists. For example, the Prostate Cancer Research Program (PCRP) supports the training of physicians with clinical duties for a career in prostate cancer research through the physician Research Training Award. At the time of application, the PI must be in the last year of medical residency, must designate a mentor with an established research program, and institutions must provide at least 40% protection of the PI’s time for research.
The PRORP offers a career development award in which active-duty military researchers, physical therapists, occupational therapists, or physician-scientists with < 8 years of clinical or postdoctoral research experience (excluding clinical residency or medical fellowship training) are eligible to apply. The LCRP has offered a promising clinician research award supporting the training of MDs or MD/PhDs with clinical duties and/or responsibilities that are within 5 years of a professional appointment. Each of these physician training mechanisms not only provide support at an early career stage to investigators at DoD or other clinical sites, but also enable physicians to have a career at the forefront of research and clinical practice.
In 2002, the NIH observed that the percentage of competing NIH grants awarded to investigators aged ≤ 35 years declined from 23% in 1980 to < 4% in 2002. To support these young investigators, the NIH introduced the Pathway to Independence Award mechanism, providing several years of mentored support for promising postdoctoral scientists followed by several years of independent support. More recently, the NIH has focused on new investigators by offering more R01 awards to this group. Because securing early concept funding helps pave the way for the larger R01 grant application, increasing the support for early investigators is important for creating a critical threshold of scientists with exceptional talent.
The CDMRP New Investigator Award programs are intended to support scientists in the early stages of their careers through the continued development of promising independent investigators and/or the transition of established investigators. Each of the CDMRP programs has developed variations of the New Investigator Award to meet the goals of the disease- or condition-specific program. The OCRP Ovarian Cancer Academy, which includes both medical doctors and PhD scientists, is one of the more recent and innovative New Investigator Award mechanisms. This academy is an interactive virtual research and training platform that provides intensive mentoring, national networking, and a peer group for junior faculty in a collaborative and interactive environment. Taken together, the CDMRP programs offer unique award mechanisms to support researchers at critical junctures in their careers. The unique qualities and competitiveness of the CDMRP’s disease/condition-focused training awards have supported the early-career foundation for many of today’s leading researchers.
Conclusions
Congressionally Directed Medical Research Programs complement other federal and nonfederal sources of biomedical research funding and fill important research gaps through an evaluation of the funding landscape, identification of research gaps, and development of novel award mechanisms. The integration of survivors, patients, and their family members ensures that every aspect of the program management cycle balances scientific expertise with human perspective and has high impact on the patient community.
As new needs emerge, each research program designs an investment strategy to target areas most critically in need. The subsequent release of novel award mechanisms focuses research and enables an acceleration of science and/or leading researchers to the patient’s bedside. The CDMRP-funded discoveries have contributed to the development of new therapeutics, new diagnostics, and to changes in the standard of care exemplifying significant clinical impact and the innovative nature of these Congressional Special Interest Medical Research Programs.
To learn more about CDMRP or to receive funding notifications by e-mail, please visit http://cdmrp.army.mil.
Acknowledgments
The authors gratefully note the CDMRP Program Evaluation Steering Committee for critical review of the manuscript. Also acknowledged are CDMRP staff at large and Dr. Lisa Kinnard for support in this project.
Author disclosures
The authors report no actual or potential conflicts of interest with regard to this article.
Disclaimer
The opinions expressed herein are those of the authors and do not necessarily reflect those of Federal Practitioner, Frontline Medical Communications Inc., the U.S. Government, or any of its agencies. This article may discuss unlabeled or investigational use of certain drugs. Please review the complete prescribing information for specific drugs or drug combinations—including indications, contraindications, warnings, and adverse effects—before administering pharmacologic therapy to patients.
1. Robinson DR, Kalyana-Sundaram S, Wu Y-I, et al. Functionally recurrent rearrangements of the MAST kinase and Notch gene families in breast cancer. Nature Med. 2011;17(12):1646-1651.
1. Robinson DR, Kalyana-Sundaram S, Wu Y-I, et al. Functionally recurrent rearrangements of the MAST kinase and Notch gene families in breast cancer. Nature Med. 2011;17(12):1646-1651.
49-Year-Old Woman With a Broken Heart
Emotional stress can induce different responses in the body, particularly in the cardiovascular system. Apical ballooning syndrome (ABS), also known as takotsubo cardiomyopathy and broken heart syndrome, is a transient cardiomyopathy that mimics an acute myocardial infarction (AMI). Dote and colleagues first described this transient entity in Japan in the early 1990s.1 A case review series reported that 57.2% of patients were Asian, 40% were white.2 Mean patient age was 67 years, although cases of ABS have occurred in children and young adults.3,4
The term tako-tsubo means “octopus trap,” which is the morphology that the left ventricle resembles during systole in patients with this syndrome.5 The pathophysiology of ABS is thought to be mediated by a catecholamine surge. The presentation of ABS is indistinguishable from an AMI. The majority of patients present with angina-like chest pain, ischemic changes on an electrocardiogram (ECG), pulmonary edema, and elevation of cardiac enzymes. Apical ballooning syndrome is accompanied by reversible left ventricular apical ballooning in the absence of angiographically significant coronary artery disease.
Typically, echocardiographic findings show a left ventricle with preserved function in the basal segments, moderate-to-severe dysfunction in the mid portion of the left ventricle, and hypokinesis, akinesis, or dyskinesis in the apex. A unique but not exclusive feature of this syndrome is the occurrence of a preceding emotional trigger, usually sudden or unexpected. Most patients are initially treated for an AMI until angiography can rule out coronary obstruction. After several weeks, the left ventricular systolic function usually returns to normal.
Case Presentation
A 49-year-old woman with a history of arterial hypertension, fibromyalgia, peptic ulcer disease, and major depressive disorder with multiple admissions to the psychiatric ward (last admission was 4 weeks prior to the current presentation) presented to the emergency department, reporting severe retrosternal, oppressive chest pain with 9/10 intensity and 3 hours’ duration. The pain was associated with nausea, vomiting, diaphoresis, and palpitations. She reported no previous episodes of exertional angina, fever, illicit drug use, recent illness, or travel. She also reported no prodromal symptoms.
Her initial vital signs were essentially unremarkable, except for mild hypertension (148/84 mm Hg). The physical examination showed an anxious patient in acute distress due to chest pain. A cardiovascular examination revealed a regular heart rate and rhythm, no audible murmurs or gallops, no jugular vein distention, clear breath sounds, and no peripheral edema. The rest of the examination was otherwise unremarkable. An initial 12-lead ECG showed a normal sinus rhythm without any ST-T changes (Figure 1).
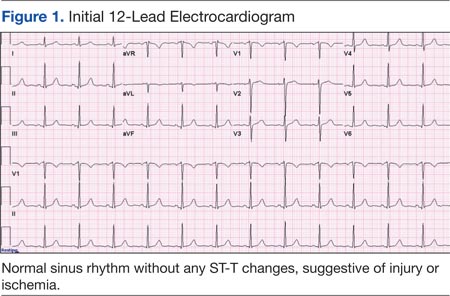
The initial cardiac markers were elevated (troponin T 0.36 ng/mL, CK-MB 4.51 ng/mL), as were NT-proBNP levels (1,057 pg/mL). The rest of the laboratory results were essentially unremarkable. The patient was started on aspirin, clopidogrel, enoxaparin, eptifibatide, and IV nitrates. She was admitted to the coronary care unit with a diagnostic impression of non-ST elevation MI. Despite medical management, the patient’s chest pain persisted for several hours from her initial presentation. A repeated 12-lead ECG revealed new borderline (1-1.5 mm) ST segment elevation in V2-V3, suggestive of possible myocardial injury (Figure 2).
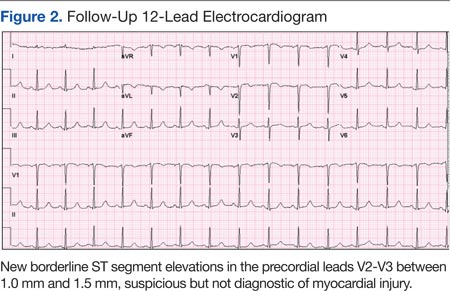
A bedside echocardiogram revealed severe wall motion abnor malities, ranging from hypokinesia to dyskinesia of all mid-to-distal left ventricular wall segments with sparing of the basal segment (Figure 3). The estimated left ventricular ejection fraction was 40% to 45%.
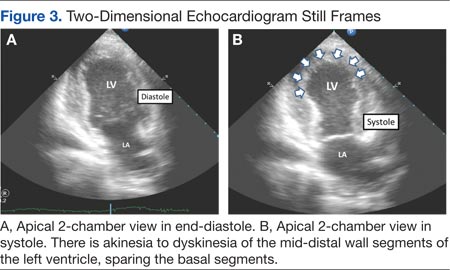
In view of these findings, the patient was taken to the catheterization laboratory for emergent coronary angiography, which ruled out significant obstructive coronary disease (Figure 4).
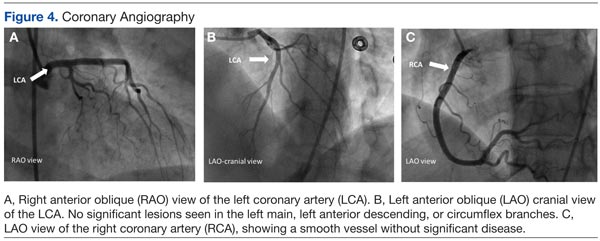
Left ventriculography in right and left anterior oblique projections revealed significant wall motion abnormalities of the mid-to-distal anterolateral and inferior wall segments, sparing the basal and apical segments, giving the appearance of ballooning in systole (Figure 5). The diagnosis of ABS involving the mid ventricular walls was explored.
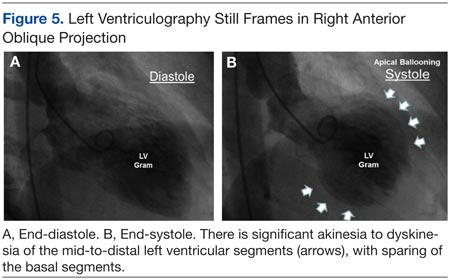
Subsequent sets of cardiac enzymes at 4 and 8 hours after arrival remained elevated, with a maximum troponin T 0.55 and CK-MB of 11.19. Repeated 12-lead ECG 24 hours post coronary angiography revealed anterolateral T wave inversion (Figure 6).
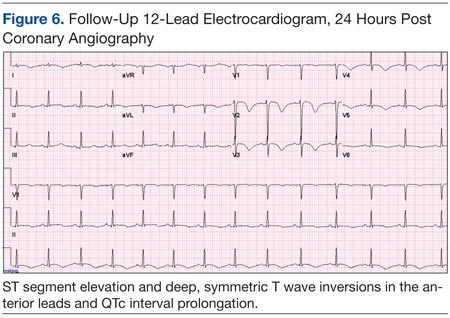
Noncontrast enhanced cardiac magnetic resonance imaging (MRI) (Figure 7) performed 5 days later revealed wall motion abnormalities highly suggestive of ABS, supporting previous echocardiographic and ventriculography findings. Unfortunately, contrast-enhanced phase for evaluation of delayed enhancement could not be completed, because the patient did not continue the study.
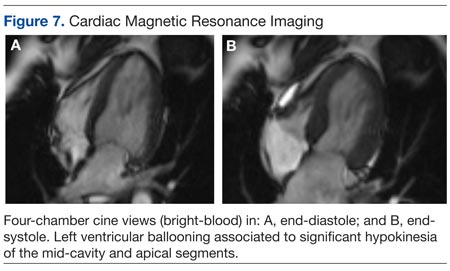
Toxicology tests were negative for sympathomimetic drugs. Metanephrine levels were within the normal range. Viral titers for cytomegalovirus and coxsackie virus also were negative. Inflammatory markers were mildly elevated (erythrocyte sedimentation rate, 22 mm/h; C-reactive protein, 4.2 mg/L).
The patient was treated with supportive care, psychotropic therapy, angiotensin-converting enzyme inhibitor (ACE-I), and beta blocker therapy. Within 9 days, NT-proBNP levels normalized (from peak 8,834 pg/mL to 191.5 pg/mL).
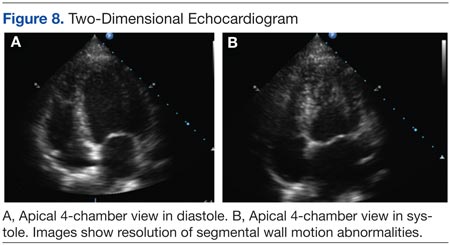
Six weeks later, an echocardiogram confirmed resolution of wall motion abnormalities (Figure 8). Follow-up cardiac MRI showed complete resolution of segmental wall motion abnormalities and the apical ballooning, normal wall thickness, and absent delayed enhancement (Figure 9). These findings further supported the diagnosis of ABS and excluded MI and myocarditis.
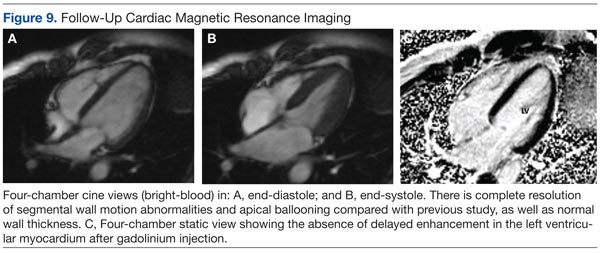
Discussion
What is striking about takotsubo cardiomyopathy is that the clinical presentation resembles an AMI. Several studies have reported that 1.7% to 2.2% of patients who had suspected acute coronary syndrome were subsequently diagnosed with takotsubo cardiomyopathy.6-8 Nearly 90% of reported cases involved postmenopausal women, and this may be related to loss of the cardioprotective effect of estrogen.5,9
A preceding stressful emotional or physical event is usually identified in about two-thirds of the patients with ABS.9 Most common emotional triggers are death of a relative or friend, broken relationships, assaults, and rapes, among others. Physical triggers include severe sepsis, shock, acute respiratory failure, seizures, and intracranial bleeds. Sometimes a specific trigger cannot be identified from the history, but the absence of an emotional or physical trigger does not exclude the diagnosis.
Although the exact pathogenesis of ABS remains unclear, it is likely that multiple factors are involved. Some of the suggested mechanisms are high levels of catecholamines, multivessel epicardial spasm, or coronary microvascular dysfunction.4 The catecholamine hypothesis has been supported by the finding that several patients with pheochromocytoma and subarachnoid hemorrhage also present with high levels of catecholamine and a cardiomyopathy resembling ABS. Furthermore, ABS has been reported in patients on catecholamine infusions and those treated with agents that inhibit reuptake of catecholamines.5
The presence of multivessel coronary spasm was suggested by early small studies in Japan, but more recent case series have not validated this hypothesis.5 The microvascular dysfunction hypothesis is supported by the presence of myocardial ischemia, diagnosed by ECG changes and elevated troponins, in the absence of significant coronary disease. However, it remains unclear whether this is a primary mechanism or a manifestation of a primary process.4 Microvascular dysfunction may be more likely related to impairment of myocardial relaxation with extramural coronary compression.
Signs and symptoms of ABS mimic those of AMI, with angina-like chest pain as the main presenting symptom in about 50% of cases.10 Other symptoms include dyspnea and less commonly, syncope or sudden cardiac death. Decompensated left heart failure occurs in 50% of patients, with severe hemodynamic compromise and cardiogenic shock not being uncommon. Other complications that may occur are tachyarrhythmias (atrial or ventricular) and ventricular thromboembolism.4
Common ECG changes in ABS include precordial ST segment elevations, symmetric T wave inversions, and nonspecific T wave changes.4,10 QT interval prolongation may be seen during the first days. Transient pathologic Q waves may be seen at presentation or afterward. These ECG changes tend to revert after weeks or months of presentation.
Elevation of cardiac biomarkers is usually present in laboratory data. Levels peak at 24 hours, and the degree of elevation is usually less than that seen in patients with an AMI.10 Most important, the degree of cardiac biomarker elevation is disproportionately low for the extent of involved coronary territory and left ventricular dysfunction. Other laboratory tests that are frequently altered are the BNP and pro-BNP levels, which are usually elevated due to transient left ventricular dysfunction. C-reactive protein elevates in most patients and indicates the presence of an acute inflammatory response.
Early coronary angiography should be performed in all patients with ABS to rule out the presence of a significant obstructive coronary lesion. Patients with ABS often have luminal irregularities or normal coronary vessels. However, concomitant obstructive coronary lesions may be found, especially in elderly patients.
The hallmark of ABS is a characteristic transient contractility abnormality of the left ventricle causing ballooning of the apex, which can be detected on left ventricular angiography or echocardiography. There are 3 distinct variants of ABS, according to the left ventricular myocardial wall segments involved.10 The classic form of takotsubo is characterized by hypokinesis, dyskinesis, or akinesis of the middle and apical segments of the left ventricle. The basal segment is usually spared and may be hyperdynamic. In the midventricular or apical sparing variant, the wall motion abnormalities are restricted to the midventricular segments, and apical contraction is preserved. This case resembles the atypical variant, because the midventricular segments were affected, whereas apical and basal regions were preserved. A rare variant of takotsubo exists with hypokinesis or akinesis of the base and preserved apical function.
Besides ABS and AMI, an important entity to consider in the differential diagnosis of transient wall motion abnormalities is regional myocarditis. Viral titers are helpful in excluding this condition. Furthermore, prolonged recovery is more commonly seen in myocarditis compared with ABS. Imaging studies are particularly helpful in this scenario.
Cardiac MRI demonstrates the wall motion abnormalities or apical ballooning typical for this condition and can differentiate ABS from myocarditis or MI. It is known that delayed myocardial enhancement is seen with myocardial fibrosis. Typically in ischemic cardiomyopathy, there is wall thinning with associated delayed enhancement that extends from the subendocardium to the epicardium (from 0%-90% of wall thickness) of a particular vascular territory. In myocarditis, the enhancement is usually seen in the involved intramyocardial (mesocardium) region, and the pattern is patchy. In ABS, the delayed enhancement is absent, because there is no fibrosis in the area of regional wall motion abnormalities, and wall thickness is usually normal.9,10
No evidence-based guidelines for treating ABS are currently available. Most patients are initially treated with antiplatelets/anticoagulant therapy, nitrates, and diuretics if the patient presents with heart failure. Patients should be admitted to an intensive care unit for close cardiac monitoring. Once ABS is diagnosed and significant coronary stenosis is excluded, patients should receive standard supportive care and optimal neurohormonal therapy. This should include beta blocker or combined alpha/beta blocker agents, an ACE-I or angiotensin receptor blocker, and diuretics if appropriate. Once left ventricular function (LVF) is recovered, therapy with inhibitors of the renin-angiotensin system may be discontinued, but patients should remain on long-term alpha or beta blocker therapy, because the sympathetic blockade provided by these agents may prevent recurrences of this disease.10
Prognosis is generally favorable, and most patients recover to normal LVF over weeks to months. It is important to assess the LVF 4 to 6 weeks after the patient is discharged to confirm the diagnosis of ABS. Recurrence may occur in up to 9% of cases.10 Long-term mortality is similar compared with the age-matched general population.
Conclusion
Apical ballooning syndrome is a relatively novel cardiomyopathy that has gained important attention among the cardiovascular community, mostly because its clinical presentation mimics that of an acute coronary syndrome. Awareness of this entity will result in a more focused diagnosis and appropriate treatment. Managing both cardiac and emotional components of this disease will have a permanent impact in the reversibility and secondary prevention of this cardiomyopathy.
Acknowledgments
Special thanks to the Radiology Service at the VA Caribbean Healthcare System, in particular Dr. Frances Aulet for interpretation of the cardiac MRI results and assistance with MRI images.
Author disclosures
The authors report no actual or potential conflicts of interest with regard to this article.
Disclaimer
The opinions expressed herein are those of the authors and do not necessarily reflect those of Federal Practitioner, Frontline Medical Communications Inc., the U.S. Government, or any of its agencies. This article may discuss unlabeled or investigational use of certain drugs. Please review complete prescribing information for specific drugs or drug combinations—including indications, contraindications, warnings, and adverse effects—before administering pharmacologic therapy to patients.
1. Dote K, Sato H, Tateishi H, Uchida T, Ishihara M. Myocardial stunning due to simultaneous multivessel coronary spasms: A review of 5 cases [in Japanese]. J Cardiol. 1991;21(2):203-214.
2. Donohue D, Movahed MR. Clinical characteristics, demographics and prognosis of transient left ventricular apical ballooning syndrome. Heart Fail Rev. 2005;9(4):311-316.
3. Afonso L, Bachour K, Awad K, Sandidge G. Takotsubo cardiomyopathy: Pathogenetic insights and myocardial perfusion kinetics using myocardial contrast echocardiography. Eur J Echocardiogr. 2008;9(6):849-854.
4. Buchholz S, Rudan G. Tako-tsubo syndrome on the rise: A review of the current literature. Postgrad Med J. 2007;83(978):261-264.
5. Hare J. The dilated, restrictive and infiltrative cardiomyopathies. Braunwald’s Heart Disease, A Textbook of Cardiovascular Medicine. 9th ed. Philadelphia, PA: Saunders; 2012:1562-1580.
6. Bybee KA, Prasad A, Barsness GW, et al. Clinical characteristics and thrombolysis in myocardial infarction frame counts in women with transient left ventricular apical ballooning syndrome. Am J Cardiol. 2004;94(3):343-346.
7. Ito K, Sugihara H, Katoh S, Azuma A, Nakagawa M. Assessment of Takotsubo (ampulla) cardiomyopathy using 99mTc-tetrofosmin myocardial SPECT—Comparison with acute coronary syndrome. Ann Nucl Med. 2003;17(2):115-122.
8. Prasad A, Lerman A, Rihal CS. Apical ballooning syndrome (Tako-Tsubo or stress cardiomyopathy): A mimic of acute myocardial infarction. Am Heart J. 2008;155(3):408-417.
9. Lange R, Hills D. Chemical cardiomyopathies. Braunwald’s Heart Disease, A Textbook of Cardiovascular Medicine. 10th ed. Philadelphia, PA: Saunders; 2014:1609-1611.
10. Gianni M, Dentali F, Grandi AM, Sumner G, Hiralal R, Lonn E. Apical ballooning syndrome or takotsubo cardiomyopathy: A systematic review. Eur Heart J. 2006;27(13):1523-1529.
Emotional stress can induce different responses in the body, particularly in the cardiovascular system. Apical ballooning syndrome (ABS), also known as takotsubo cardiomyopathy and broken heart syndrome, is a transient cardiomyopathy that mimics an acute myocardial infarction (AMI). Dote and colleagues first described this transient entity in Japan in the early 1990s.1 A case review series reported that 57.2% of patients were Asian, 40% were white.2 Mean patient age was 67 years, although cases of ABS have occurred in children and young adults.3,4
The term tako-tsubo means “octopus trap,” which is the morphology that the left ventricle resembles during systole in patients with this syndrome.5 The pathophysiology of ABS is thought to be mediated by a catecholamine surge. The presentation of ABS is indistinguishable from an AMI. The majority of patients present with angina-like chest pain, ischemic changes on an electrocardiogram (ECG), pulmonary edema, and elevation of cardiac enzymes. Apical ballooning syndrome is accompanied by reversible left ventricular apical ballooning in the absence of angiographically significant coronary artery disease.
Typically, echocardiographic findings show a left ventricle with preserved function in the basal segments, moderate-to-severe dysfunction in the mid portion of the left ventricle, and hypokinesis, akinesis, or dyskinesis in the apex. A unique but not exclusive feature of this syndrome is the occurrence of a preceding emotional trigger, usually sudden or unexpected. Most patients are initially treated for an AMI until angiography can rule out coronary obstruction. After several weeks, the left ventricular systolic function usually returns to normal.
Case Presentation
A 49-year-old woman with a history of arterial hypertension, fibromyalgia, peptic ulcer disease, and major depressive disorder with multiple admissions to the psychiatric ward (last admission was 4 weeks prior to the current presentation) presented to the emergency department, reporting severe retrosternal, oppressive chest pain with 9/10 intensity and 3 hours’ duration. The pain was associated with nausea, vomiting, diaphoresis, and palpitations. She reported no previous episodes of exertional angina, fever, illicit drug use, recent illness, or travel. She also reported no prodromal symptoms.
Her initial vital signs were essentially unremarkable, except for mild hypertension (148/84 mm Hg). The physical examination showed an anxious patient in acute distress due to chest pain. A cardiovascular examination revealed a regular heart rate and rhythm, no audible murmurs or gallops, no jugular vein distention, clear breath sounds, and no peripheral edema. The rest of the examination was otherwise unremarkable. An initial 12-lead ECG showed a normal sinus rhythm without any ST-T changes (Figure 1).
The initial cardiac markers were elevated (troponin T 0.36 ng/mL, CK-MB 4.51 ng/mL), as were NT-proBNP levels (1,057 pg/mL). The rest of the laboratory results were essentially unremarkable. The patient was started on aspirin, clopidogrel, enoxaparin, eptifibatide, and IV nitrates. She was admitted to the coronary care unit with a diagnostic impression of non-ST elevation MI. Despite medical management, the patient’s chest pain persisted for several hours from her initial presentation. A repeated 12-lead ECG revealed new borderline (1-1.5 mm) ST segment elevation in V2-V3, suggestive of possible myocardial injury (Figure 2).
A bedside echocardiogram revealed severe wall motion abnor malities, ranging from hypokinesia to dyskinesia of all mid-to-distal left ventricular wall segments with sparing of the basal segment (Figure 3). The estimated left ventricular ejection fraction was 40% to 45%.
In view of these findings, the patient was taken to the catheterization laboratory for emergent coronary angiography, which ruled out significant obstructive coronary disease (Figure 4).
Left ventriculography in right and left anterior oblique projections revealed significant wall motion abnormalities of the mid-to-distal anterolateral and inferior wall segments, sparing the basal and apical segments, giving the appearance of ballooning in systole (Figure 5). The diagnosis of ABS involving the mid ventricular walls was explored.
Subsequent sets of cardiac enzymes at 4 and 8 hours after arrival remained elevated, with a maximum troponin T 0.55 and CK-MB of 11.19. Repeated 12-lead ECG 24 hours post coronary angiography revealed anterolateral T wave inversion (Figure 6).
Noncontrast enhanced cardiac magnetic resonance imaging (MRI) (Figure 7) performed 5 days later revealed wall motion abnormalities highly suggestive of ABS, supporting previous echocardiographic and ventriculography findings. Unfortunately, contrast-enhanced phase for evaluation of delayed enhancement could not be completed, because the patient did not continue the study.
Toxicology tests were negative for sympathomimetic drugs. Metanephrine levels were within the normal range. Viral titers for cytomegalovirus and coxsackie virus also were negative. Inflammatory markers were mildly elevated (erythrocyte sedimentation rate, 22 mm/h; C-reactive protein, 4.2 mg/L).
The patient was treated with supportive care, psychotropic therapy, angiotensin-converting enzyme inhibitor (ACE-I), and beta blocker therapy. Within 9 days, NT-proBNP levels normalized (from peak 8,834 pg/mL to 191.5 pg/mL).
Six weeks later, an echocardiogram confirmed resolution of wall motion abnormalities (Figure 8). Follow-up cardiac MRI showed complete resolution of segmental wall motion abnormalities and the apical ballooning, normal wall thickness, and absent delayed enhancement (Figure 9). These findings further supported the diagnosis of ABS and excluded MI and myocarditis.
Discussion
What is striking about takotsubo cardiomyopathy is that the clinical presentation resembles an AMI. Several studies have reported that 1.7% to 2.2% of patients who had suspected acute coronary syndrome were subsequently diagnosed with takotsubo cardiomyopathy.6-8 Nearly 90% of reported cases involved postmenopausal women, and this may be related to loss of the cardioprotective effect of estrogen.5,9
A preceding stressful emotional or physical event is usually identified in about two-thirds of the patients with ABS.9 Most common emotional triggers are death of a relative or friend, broken relationships, assaults, and rapes, among others. Physical triggers include severe sepsis, shock, acute respiratory failure, seizures, and intracranial bleeds. Sometimes a specific trigger cannot be identified from the history, but the absence of an emotional or physical trigger does not exclude the diagnosis.
Although the exact pathogenesis of ABS remains unclear, it is likely that multiple factors are involved. Some of the suggested mechanisms are high levels of catecholamines, multivessel epicardial spasm, or coronary microvascular dysfunction.4 The catecholamine hypothesis has been supported by the finding that several patients with pheochromocytoma and subarachnoid hemorrhage also present with high levels of catecholamine and a cardiomyopathy resembling ABS. Furthermore, ABS has been reported in patients on catecholamine infusions and those treated with agents that inhibit reuptake of catecholamines.5
The presence of multivessel coronary spasm was suggested by early small studies in Japan, but more recent case series have not validated this hypothesis.5 The microvascular dysfunction hypothesis is supported by the presence of myocardial ischemia, diagnosed by ECG changes and elevated troponins, in the absence of significant coronary disease. However, it remains unclear whether this is a primary mechanism or a manifestation of a primary process.4 Microvascular dysfunction may be more likely related to impairment of myocardial relaxation with extramural coronary compression.
Signs and symptoms of ABS mimic those of AMI, with angina-like chest pain as the main presenting symptom in about 50% of cases.10 Other symptoms include dyspnea and less commonly, syncope or sudden cardiac death. Decompensated left heart failure occurs in 50% of patients, with severe hemodynamic compromise and cardiogenic shock not being uncommon. Other complications that may occur are tachyarrhythmias (atrial or ventricular) and ventricular thromboembolism.4
Common ECG changes in ABS include precordial ST segment elevations, symmetric T wave inversions, and nonspecific T wave changes.4,10 QT interval prolongation may be seen during the first days. Transient pathologic Q waves may be seen at presentation or afterward. These ECG changes tend to revert after weeks or months of presentation.
Elevation of cardiac biomarkers is usually present in laboratory data. Levels peak at 24 hours, and the degree of elevation is usually less than that seen in patients with an AMI.10 Most important, the degree of cardiac biomarker elevation is disproportionately low for the extent of involved coronary territory and left ventricular dysfunction. Other laboratory tests that are frequently altered are the BNP and pro-BNP levels, which are usually elevated due to transient left ventricular dysfunction. C-reactive protein elevates in most patients and indicates the presence of an acute inflammatory response.
Early coronary angiography should be performed in all patients with ABS to rule out the presence of a significant obstructive coronary lesion. Patients with ABS often have luminal irregularities or normal coronary vessels. However, concomitant obstructive coronary lesions may be found, especially in elderly patients.
The hallmark of ABS is a characteristic transient contractility abnormality of the left ventricle causing ballooning of the apex, which can be detected on left ventricular angiography or echocardiography. There are 3 distinct variants of ABS, according to the left ventricular myocardial wall segments involved.10 The classic form of takotsubo is characterized by hypokinesis, dyskinesis, or akinesis of the middle and apical segments of the left ventricle. The basal segment is usually spared and may be hyperdynamic. In the midventricular or apical sparing variant, the wall motion abnormalities are restricted to the midventricular segments, and apical contraction is preserved. This case resembles the atypical variant, because the midventricular segments were affected, whereas apical and basal regions were preserved. A rare variant of takotsubo exists with hypokinesis or akinesis of the base and preserved apical function.
Besides ABS and AMI, an important entity to consider in the differential diagnosis of transient wall motion abnormalities is regional myocarditis. Viral titers are helpful in excluding this condition. Furthermore, prolonged recovery is more commonly seen in myocarditis compared with ABS. Imaging studies are particularly helpful in this scenario.
Cardiac MRI demonstrates the wall motion abnormalities or apical ballooning typical for this condition and can differentiate ABS from myocarditis or MI. It is known that delayed myocardial enhancement is seen with myocardial fibrosis. Typically in ischemic cardiomyopathy, there is wall thinning with associated delayed enhancement that extends from the subendocardium to the epicardium (from 0%-90% of wall thickness) of a particular vascular territory. In myocarditis, the enhancement is usually seen in the involved intramyocardial (mesocardium) region, and the pattern is patchy. In ABS, the delayed enhancement is absent, because there is no fibrosis in the area of regional wall motion abnormalities, and wall thickness is usually normal.9,10
No evidence-based guidelines for treating ABS are currently available. Most patients are initially treated with antiplatelets/anticoagulant therapy, nitrates, and diuretics if the patient presents with heart failure. Patients should be admitted to an intensive care unit for close cardiac monitoring. Once ABS is diagnosed and significant coronary stenosis is excluded, patients should receive standard supportive care and optimal neurohormonal therapy. This should include beta blocker or combined alpha/beta blocker agents, an ACE-I or angiotensin receptor blocker, and diuretics if appropriate. Once left ventricular function (LVF) is recovered, therapy with inhibitors of the renin-angiotensin system may be discontinued, but patients should remain on long-term alpha or beta blocker therapy, because the sympathetic blockade provided by these agents may prevent recurrences of this disease.10
Prognosis is generally favorable, and most patients recover to normal LVF over weeks to months. It is important to assess the LVF 4 to 6 weeks after the patient is discharged to confirm the diagnosis of ABS. Recurrence may occur in up to 9% of cases.10 Long-term mortality is similar compared with the age-matched general population.
Conclusion
Apical ballooning syndrome is a relatively novel cardiomyopathy that has gained important attention among the cardiovascular community, mostly because its clinical presentation mimics that of an acute coronary syndrome. Awareness of this entity will result in a more focused diagnosis and appropriate treatment. Managing both cardiac and emotional components of this disease will have a permanent impact in the reversibility and secondary prevention of this cardiomyopathy.
Acknowledgments
Special thanks to the Radiology Service at the VA Caribbean Healthcare System, in particular Dr. Frances Aulet for interpretation of the cardiac MRI results and assistance with MRI images.
Author disclosures
The authors report no actual or potential conflicts of interest with regard to this article.
Disclaimer
The opinions expressed herein are those of the authors and do not necessarily reflect those of Federal Practitioner, Frontline Medical Communications Inc., the U.S. Government, or any of its agencies. This article may discuss unlabeled or investigational use of certain drugs. Please review complete prescribing information for specific drugs or drug combinations—including indications, contraindications, warnings, and adverse effects—before administering pharmacologic therapy to patients.
1. Dote K, Sato H, Tateishi H, Uchida T, Ishihara M. Myocardial stunning due to simultaneous multivessel coronary spasms: A review of 5 cases [in Japanese]. J Cardiol. 1991;21(2):203-214.
2. Donohue D, Movahed MR. Clinical characteristics, demographics and prognosis of transient left ventricular apical ballooning syndrome. Heart Fail Rev. 2005;9(4):311-316.
3. Afonso L, Bachour K, Awad K, Sandidge G. Takotsubo cardiomyopathy: Pathogenetic insights and myocardial perfusion kinetics using myocardial contrast echocardiography. Eur J Echocardiogr. 2008;9(6):849-854.
4. Buchholz S, Rudan G. Tako-tsubo syndrome on the rise: A review of the current literature. Postgrad Med J. 2007;83(978):261-264.
5. Hare J. The dilated, restrictive and infiltrative cardiomyopathies. Braunwald’s Heart Disease, A Textbook of Cardiovascular Medicine. 9th ed. Philadelphia, PA: Saunders; 2012:1562-1580.
6. Bybee KA, Prasad A, Barsness GW, et al. Clinical characteristics and thrombolysis in myocardial infarction frame counts in women with transient left ventricular apical ballooning syndrome. Am J Cardiol. 2004;94(3):343-346.
7. Ito K, Sugihara H, Katoh S, Azuma A, Nakagawa M. Assessment of Takotsubo (ampulla) cardiomyopathy using 99mTc-tetrofosmin myocardial SPECT—Comparison with acute coronary syndrome. Ann Nucl Med. 2003;17(2):115-122.
8. Prasad A, Lerman A, Rihal CS. Apical ballooning syndrome (Tako-Tsubo or stress cardiomyopathy): A mimic of acute myocardial infarction. Am Heart J. 2008;155(3):408-417.
9. Lange R, Hills D. Chemical cardiomyopathies. Braunwald’s Heart Disease, A Textbook of Cardiovascular Medicine. 10th ed. Philadelphia, PA: Saunders; 2014:1609-1611.
10. Gianni M, Dentali F, Grandi AM, Sumner G, Hiralal R, Lonn E. Apical ballooning syndrome or takotsubo cardiomyopathy: A systematic review. Eur Heart J. 2006;27(13):1523-1529.
Health Care Use Among Iraq and Afghanistan Veterans With Infectious Diseases
In 2010, the VA gave presumptive status to 9 infectious diseases that are endemic to southwest Asia and Afghanistan. This classification relieves the veteran of having to prove that an illness was connected to exposure during service in a specific region. The purpose of this secondary analysis is to determine the impact of the presumptive infectious disease (PID) ruling by the VHA by assessing the pre- and postruling health care use of veterans diagnosed with one of the infectious diseases.
Background
As of December 2012, 1.6 million veterans who served in Operation Enduring Freedom (OEF), Operation Iraqi Freedom (OIF), and Operation New Dawn (OND) were eligible to receive VHA care. The number of combat related injuries is commonly released to the public, but figures related to noncombat illnesses, such as infectious diseases, are reported less frequently. Sixteen percent of the 899,752 OEF/OIF/OND veterans who received VHA care through December 2012 were diagnosed with an infectious disease.1
Long-term disability stemming from any type of illness, disease, or injury is potentially compensable through VA disability compensation programs. The disability must be service-connected for a veteran to receive compensation; that is, it must be determined to be a likely by-product of “an illness, disease or injury incurred or aggravated while the soldier was on active military service.”2 The benefit application process takes time, because service connection must be established prior to determining entitlement to disability benefits.2
Congress mandated that the VA determine the illnesses that justified a presumption of service-connection based on exposure to hazards of Iraq and Afghanistan service. In response, the VA requested that the Institute of Medicine (IOM) conduct a review of the scientific and medical literature to determine the diseases related to hazards of service in southwest Asia and Afghanistan.
In a 2006 report, the IOM identified several diseases that were relevant to and known to have been diagnosed among military personnel during and after deployment in these regions. On September 29, 2010, responding to the report, VA added brucellosis, Campylobacter jejuni, Coxiella burnetti (Q fever), malaria, Mycobacterium tuberculosis (TB), nontyphoid Salmonella, Shigella, visceral leishmaniasis, and West Nile virus to the list of presumptive illnesses.3 The final rule was published in the Federal Register and is codified in 38 C.F.R. § 3.317(c).4
Classifying an illness as presumptive relieves the veteran of having to prove that their illness was connected to exposure during service in a specific region, “…[shifting] the burden of proof concerning whether a disease or disability was caused or aggravated due to service from the Veteran to the VA.”5 Based on latency periods, 7 of the 9 diseases must manifest to a > 10% degree of disability within a year of separation from a qualifying period of service. No date boundary was set on the period of presumption for TB or visceral leishmaniasis.6
Methods
Veterans are eligible for VHA care when they separate from active-duty service, or they are deactivated at the completion of their reserve or guard tour. Veterans eligible for health care were identified using a roster file from the DoD Defense Manpower Data Center (DMDC). This file also contained demographic (eg, sex, race) and service (eg, branch, rank) information. Inpatient and outpatient health care data were extracted from the VHA Office of Public Health’s quarterly files.
Study Population
OEF/OIF/OND veterans whose roster file records indicated a deployment to Iraq, Kuwait, Saudi Arabia, the neutral zone (between Iraq and Saudi Arabia), Bahrain, Qatar, The United Arab Emirates, Oman, Gulf of Aden, Gulf of Oman, waters of the Persian Gulf, the Arabian Sea, the Red Sea, and Afghanistan were eligible for the study. These veterans had to have separated from service between June 28, 2009, and December 29, 2011, and sought VHA care within a year of separation. Veterans with a human immunodeficiency virus diagnosis, an illness that is highly correlated with TB, were excluded from the study, as were deceased and Coast Guard veterans.
The final study population of 107,030 OEF/OIF/OND veterans was further divided into 2 mutually exclusive study groups by assessing the ICD-9-CM code in the first diagnostic position. The first group, the PID group, was given priority. To be included in this group, a veteran must have been diagnosed with ≥ 1 of the following presumptive diseases within a year of separation (ICD-9-CM codes): Brucellosis (023), Campylobacter jejuni (008.43), Coxiella burnetti/Q fever (083.0), malaria (084), nontyphoid Salmonella (003), Shigella (004), or West Nile virus (066.4). For TB (010-018) and visceral leishmaniasis (085.0), a diagnosis could occur any time after separation.
Related: DoD Healthy Base Initiative
The second infectious disease group included veterans diagnosed with any infectious disease (ICD-9-CM codes 001-139) that was not a PID. To be considered for inclusion in the other infectious disease group, a veteran must have been diagnosed with the illness at any point after separation. This group was created as a control group for comparing differences in health care use of the veterans diagnosed with a PID both before and after the rule change. The illnesses within each study group were distinct, thus no direct comparisons were made between the groups. Instead, the magnitude of the difference in use before and after the presumptive disease ruling was compared.
Statistical Analysis
It is possible to have multiple services performed during a single outpatient visit, services that will generate separate bills, thus appearing to be different visits. For the purposes of this study, only 1 visit per day was counted when constructing the monthly health care counts for the 12 months before and after the date of diagnosis of a PID or another infectious disease. A general linear model was created to assess differences in the number of outpatient visits pre- and postruling, adjusting for the number of unique illnesses a veteran had. To adjust for normality in the model, the inverse log of the count of outpatient visits was used in the procedure. P values were compared with an á level of 0.05 to determine significance.
Results
Among the 107,030 veterans receiving VHA care between June 28, 2009, and December 29, 2011, < 0.1% (n = 98) were in the PID group, and 7% (n = 7,603) were in the other infectious disease group (Tables 1 and 2). A significantly smaller proportion of active-duty (“regular”) veterans was in the PID group (50.0%) compared with the other infectious disease group (63.9%). Conversely, a significantly larger proportion of reserve or guard veterans werein the PID group (51.0%) compared with the other infectious disease group (36.1%) (P = .0089). The PID group included a higher proportion of Hispanic veterans (16.3%) and a lower proportion of black veterans (7.1%) than did the other infectious disease group.
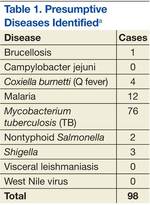
The opposite was observed in the other infectious disease group: There was a lower proportion of Hispanic veterans (12.6%) and a higher proportion of black veterans (17.0%). Veterans whose military occupation status indicated combat experience were highly represented in each of the disease groups, as were males. Army veterans were disproportionately represented in the PID group (76.5%) compared with the other infectious disease group (65.4%), whereas the opposite was true for Marine Corps veterans (13.3% and 18.9%, respectively)(Table 2).
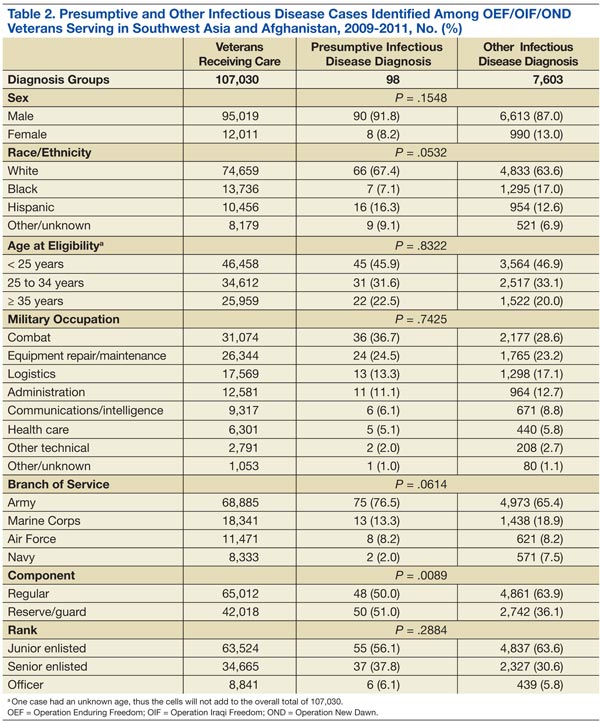
To assess the impact of the ruling on the health care-seeking behaviors of veterans, each group was further divided by the timing of diagnosis, specifically, before or after the PID ruling on September 29, 2010. Forty-five percent of the study population received a diagnosis prior to the ruling. Thirty-six percent of the PID group and 30% of the other infectious disease study groups were diagnosed before the ruling (Table 3).
Veterans in the other infectious disease group who were diagnosed after the PID ruling had a significantly higher total number of outpatient visits than did those diagnosed before the ruling (P < .05). A small increase was observed in the median number of outpatient visits among veterans diagnosed with a PID preruling (median = 7) compared with those diagnosed postruling (median = 8), but the difference was not statistically significant. Veterans in the preruling PID group received a diagnosis < 117 days (median value) after separation from service, whereas those in the postruling group received a diagnosis < 291 days (median value) after separation from service (Table 3).
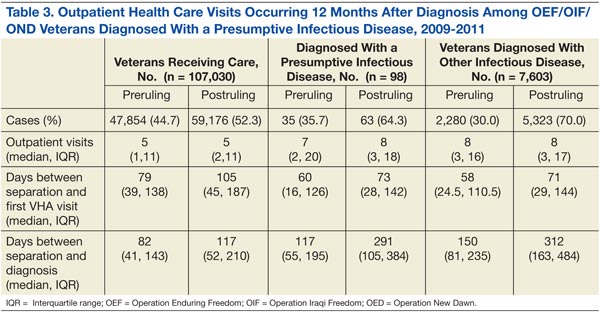
There was an increase in health care visits in the months directly before and after diagnosis, regardless of whether a veteran was diagnosed before or after the ruling. Figure 1 shows the total number of health care visits (visits for any condition) in the 12 months before and 12 months after a PID diagnosis, as well as the number of patients receiving care in those same months. In the months prior to receiving a diagnosis, the number of veterans receiving health care services followed the same trajectory as the total number of health care visits, regardless of the timing of the diagnosis. In the months after receiving a diagnosis, the trajectory for the total number of health care visits and the number of veterans generally followed the same path within the preruling group. In contrast, within the postruling group, the total number of visits was higher than the number of veterans, especially in the latter months, indicating that veterans were receiving services multiple times in a month.
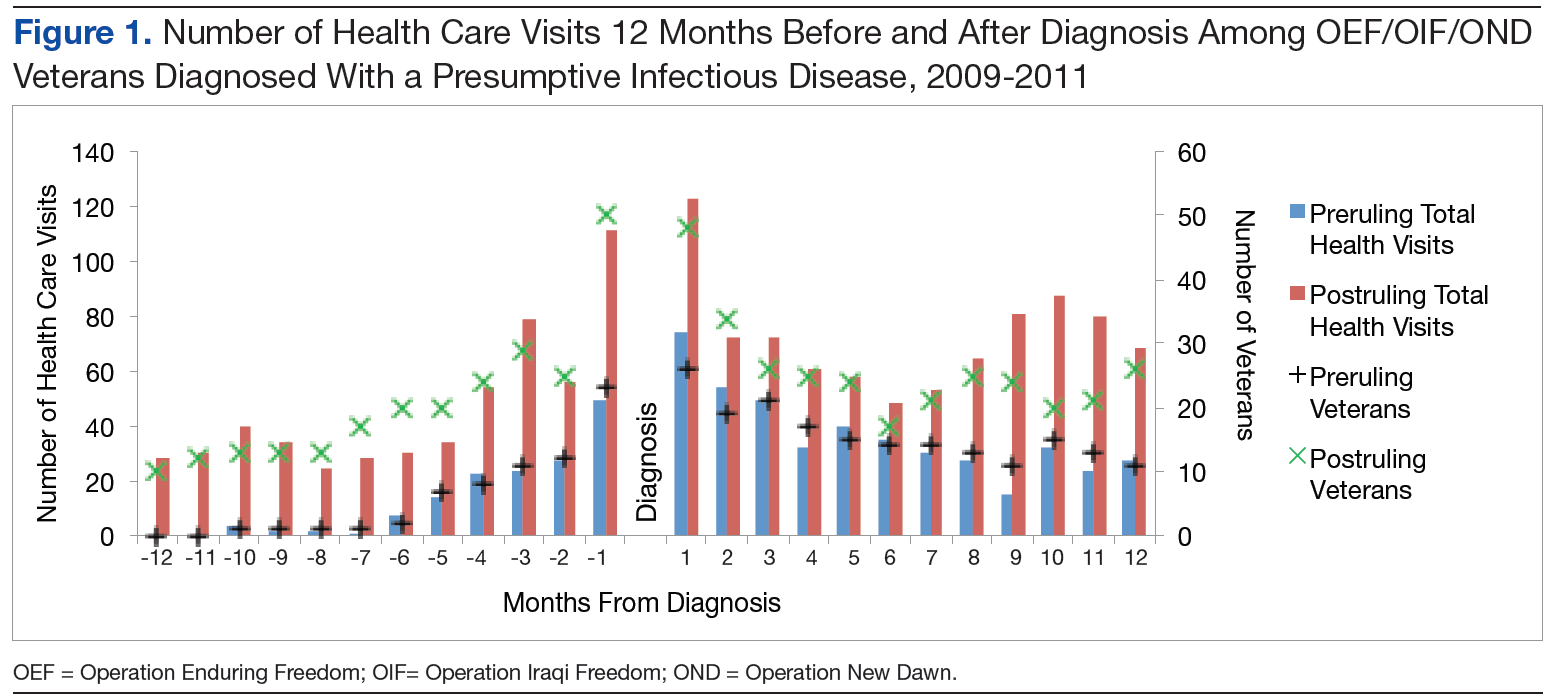
The patterns of health care use in the other infectious disease group were similar to those of the PID group, though the trajectories were more symmetrical for the other infectious disease pre- and postruling groups. There is a distinct increase in the total number of health care visits until diagnosis and a steady decrease in the 12 months after diagnosis with a leveling off of health care use toward the end of the observation period (Figure 2).
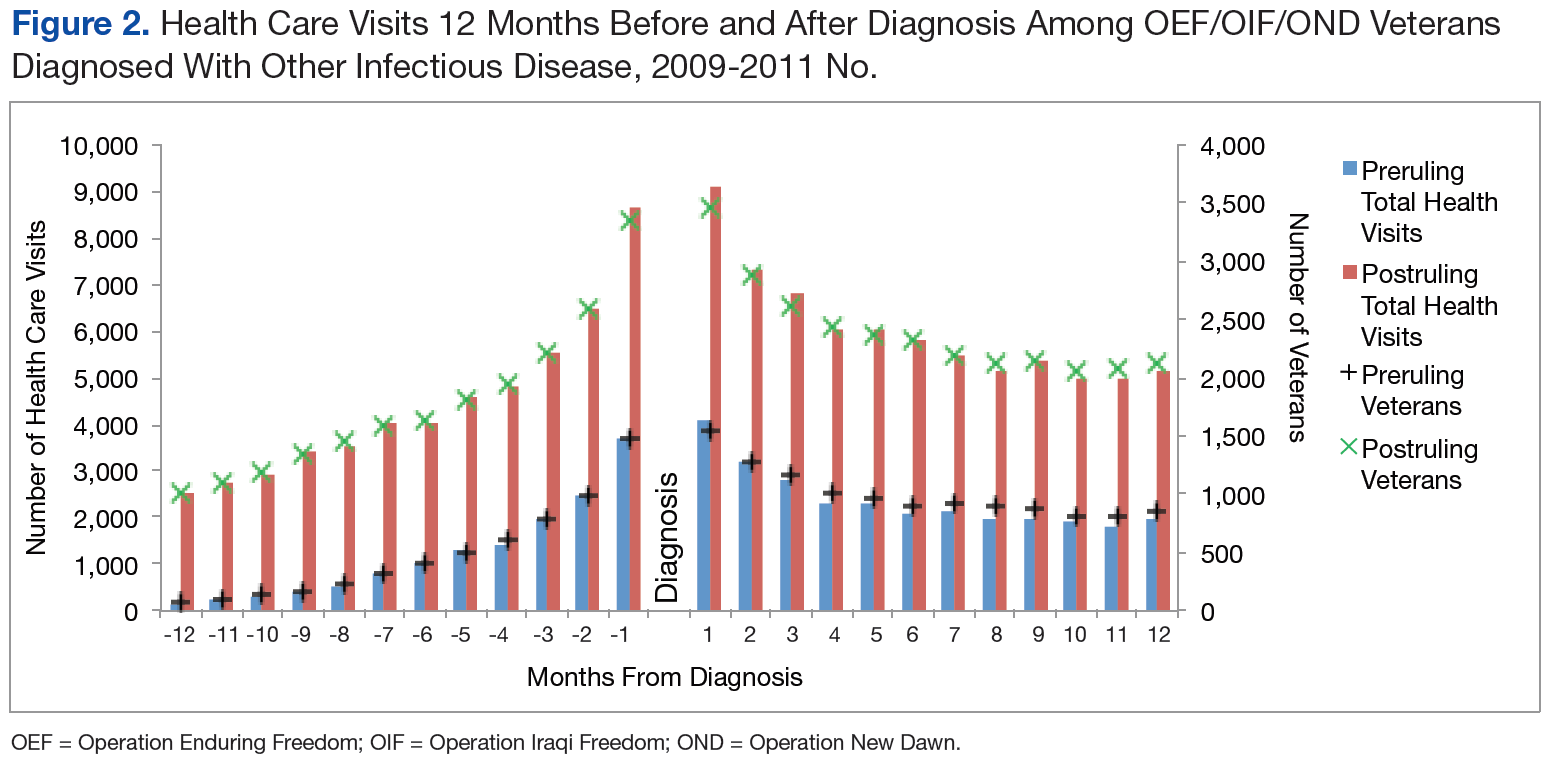
Discussion
The rate of PIDs in the U.S. was different from the observed rate in the study population, albeit a limited comparison. In the U.S. in 2010, the reported incidence per 100,000 persons was 0.04 for brucellosis, 13.52 for Campylobacter jejuni, 17.73 for nontyphoid Salmonella, and 0.2 for West Nile virus, vs no cases reported in the study.7,8 In contrast, the 2010-reported U.S. incidence rates per 100,000 persons with Q fever (0.04), malaria (0.58), and TB (3.64) were lower than those reported in the study population (3.32, 8.30, and 41.50 per 100,000 patients, respectively).7
Of the 107,030 OEF/OIF/OND veterans who received care during the study period, < 0.1% were diagnosed with a PIDs and 7% were diagnosed with a different infectious disease. Analysis indicated that 88 of the 98 PID were either TB or malaria cases. Thirty-six percent of the PID cases and 30% of the other infectious disease cases were diagnosed prior to the PID ruling. Veterans in the preruling PID and other infectious disease groups received a diagnosis within 4 or 5 months of becoming eligible for VHA services, whereas those in the postruling groups received a diagnosis within 10 months of eligibility, an observation that may have been caused by outliers and amplified by the small number of cases in the preruling PID group. However, this difference in time to diagnosis between the pre- and postruling groups does not seem to be a reflection of a delay in health care-seeking behavior in general: Veterans in both study groups sought VA services within 73 days of separating from active-duty service.
No significant difference in health care use was found between the pre- and postruling PID groups. When looking at the number of veterans receiving care each month and the total number of health care encounters, the ratio of encounters to veterans was less stable in the PID group than that of the other infectious disease group. Veterans with a PID received multiple outpatient services per month, especially in the postruling PID group. This may be a reflection of follow-up care needed for specific diseases.
Limitations
There are several limitations to note in the study. First, service members could have been diagnosed while still receiving health care services in the military health system, resulting in a low diagnosis rate within the VA. Second, the cases were identified solely based on ICD-9-CM codes; these are not confirmed diagnoses, and misclassification may occur. Future studies should consider incorporating laboratory results and other confirmatory methods of identification for case capture. A third limitation was the lack of availability of health care records outside of VHA. A large proportion of the study population was composed of the reserve/guard component. These veterans return to civilian jobs after separation and often have access to health care outside of VHA. Combined, these limitations affect the ability to identify the prevalence of infectious diseases among veterans.
Related: Women Using VA Health Care
Several findings could not be explored due to methodological limitations but warrant further exploration. First, the longer time period between eligibility and diagnosis post- vs preruling may be an indication that the ruling affected a veteran’s health care-seeking behavior. Second, it was possible that veterans presented with symptoms similar to one of the PIDs but were subsequently diagnosed with another infectious disease, which would affect the disease and use figures. Finally, studies should consider using confirmatory methods of diagnosis to assess the true prevalence of presumptive infectious diseases in the veteran population.
Conclusions
Very few PID cases were identified in the study population. This may be due to the limitation of the available data. However, some interesting findings such as a greater number of encounters for the infectious disease group post- vs preruling and differences in time between eligibility and diagnosis pre- and postruling were found and should be investigated further.
Author disclosures
The authors report no actual or potential conflicts of interest with regard to this article.
Disclaimer
The opinions expressed herein are those of the authors and do not necessarily reflect those of Federal Practitioner, Frontline Medical Communications Inc., the U.S. Government, or any of its agencies. This article may discuss unlabeled or investigational use of certain drugs. Please review the complete prescribing information for specific drugs or drug combinations—including indications, contraindications, warnings, and adverse effects—before administering pharmacologic therapy to patients.
1. Epidemiology Program, Post-Deployment Health Group, Office of Public Health, Veterans Health Administration, Department of Veterans Affairs. Analysis of VA Health Care Utilization Among Operation Enduring Freedom (OEF), Operation Iraqi Freedom (OIF), and Operation New Dawn (OED) Veterans: Cumulative from 1st Qtr FY 2002 through 1st Qtr FY 2013 (October 1, 2001—December 31, 2012). Washington, DC: Department of Veterans Affairs; 2013.
2. Bilmes L. Soldiers returning from Iraq and Afghanistan: The long-term costs of providing veterans medical care and disability benefits. KSG Faculty Research Working Paper Series RWP07-001, January 2007.
3. Institute of Medicine. Gulf War and Health, Volume 5: Infectious Diseases. Washington, DC: National Academies Press; 2007.
4. Department of Veterans Affairs. Presumption of service connection for Persian Gulf service. Fed Regist. 2010;75(188):59968-59972.
5. Panangala SV, Scott C; Congressional Research Service. CRS Report for Congress: Veterans Affairs: Presumptive Service Connection and Disability Compensation: September 13, 2010–R41405. Washington, DC: BiblioGov, 2013.
6. Fact Sheet 64-022-0312: Presumptive Disability for Nine Infectious Diseases Related to Military Service in Southwest Asia (1990-Present): Potential for Long-term Outcomes. U.S. Army Public Health Command. http://phc.amedd.army.mil/PHC%20Resource%20Library/PresumptiveDisability_NineDiseases.pdf
7. Centers for Disease Control and Prevention. Foodborne Diseases Active Surveillance Network (FoodNet): FoodNet Surveillance Report for 2010 (Final Report). Atlanta, Georgia: U.S. Department of Health and Human Services, Centers for Disease Control and Prevention; 2011.
8. Centers for Disease Control and Prevention. Summary of notifiable diseases—United States, 2010. MMWR Morb Mortal Wkly Rep. 2012;59(53):1-111.
In 2010, the VA gave presumptive status to 9 infectious diseases that are endemic to southwest Asia and Afghanistan. This classification relieves the veteran of having to prove that an illness was connected to exposure during service in a specific region. The purpose of this secondary analysis is to determine the impact of the presumptive infectious disease (PID) ruling by the VHA by assessing the pre- and postruling health care use of veterans diagnosed with one of the infectious diseases.
Background
As of December 2012, 1.6 million veterans who served in Operation Enduring Freedom (OEF), Operation Iraqi Freedom (OIF), and Operation New Dawn (OND) were eligible to receive VHA care. The number of combat related injuries is commonly released to the public, but figures related to noncombat illnesses, such as infectious diseases, are reported less frequently. Sixteen percent of the 899,752 OEF/OIF/OND veterans who received VHA care through December 2012 were diagnosed with an infectious disease.1
Long-term disability stemming from any type of illness, disease, or injury is potentially compensable through VA disability compensation programs. The disability must be service-connected for a veteran to receive compensation; that is, it must be determined to be a likely by-product of “an illness, disease or injury incurred or aggravated while the soldier was on active military service.”2 The benefit application process takes time, because service connection must be established prior to determining entitlement to disability benefits.2
Congress mandated that the VA determine the illnesses that justified a presumption of service-connection based on exposure to hazards of Iraq and Afghanistan service. In response, the VA requested that the Institute of Medicine (IOM) conduct a review of the scientific and medical literature to determine the diseases related to hazards of service in southwest Asia and Afghanistan.
In a 2006 report, the IOM identified several diseases that were relevant to and known to have been diagnosed among military personnel during and after deployment in these regions. On September 29, 2010, responding to the report, VA added brucellosis, Campylobacter jejuni, Coxiella burnetti (Q fever), malaria, Mycobacterium tuberculosis (TB), nontyphoid Salmonella, Shigella, visceral leishmaniasis, and West Nile virus to the list of presumptive illnesses.3 The final rule was published in the Federal Register and is codified in 38 C.F.R. § 3.317(c).4
Classifying an illness as presumptive relieves the veteran of having to prove that their illness was connected to exposure during service in a specific region, “…[shifting] the burden of proof concerning whether a disease or disability was caused or aggravated due to service from the Veteran to the VA.”5 Based on latency periods, 7 of the 9 diseases must manifest to a > 10% degree of disability within a year of separation from a qualifying period of service. No date boundary was set on the period of presumption for TB or visceral leishmaniasis.6
Methods
Veterans are eligible for VHA care when they separate from active-duty service, or they are deactivated at the completion of their reserve or guard tour. Veterans eligible for health care were identified using a roster file from the DoD Defense Manpower Data Center (DMDC). This file also contained demographic (eg, sex, race) and service (eg, branch, rank) information. Inpatient and outpatient health care data were extracted from the VHA Office of Public Health’s quarterly files.
Study Population
OEF/OIF/OND veterans whose roster file records indicated a deployment to Iraq, Kuwait, Saudi Arabia, the neutral zone (between Iraq and Saudi Arabia), Bahrain, Qatar, The United Arab Emirates, Oman, Gulf of Aden, Gulf of Oman, waters of the Persian Gulf, the Arabian Sea, the Red Sea, and Afghanistan were eligible for the study. These veterans had to have separated from service between June 28, 2009, and December 29, 2011, and sought VHA care within a year of separation. Veterans with a human immunodeficiency virus diagnosis, an illness that is highly correlated with TB, were excluded from the study, as were deceased and Coast Guard veterans.
The final study population of 107,030 OEF/OIF/OND veterans was further divided into 2 mutually exclusive study groups by assessing the ICD-9-CM code in the first diagnostic position. The first group, the PID group, was given priority. To be included in this group, a veteran must have been diagnosed with ≥ 1 of the following presumptive diseases within a year of separation (ICD-9-CM codes): Brucellosis (023), Campylobacter jejuni (008.43), Coxiella burnetti/Q fever (083.0), malaria (084), nontyphoid Salmonella (003), Shigella (004), or West Nile virus (066.4). For TB (010-018) and visceral leishmaniasis (085.0), a diagnosis could occur any time after separation.
Related: DoD Healthy Base Initiative
The second infectious disease group included veterans diagnosed with any infectious disease (ICD-9-CM codes 001-139) that was not a PID. To be considered for inclusion in the other infectious disease group, a veteran must have been diagnosed with the illness at any point after separation. This group was created as a control group for comparing differences in health care use of the veterans diagnosed with a PID both before and after the rule change. The illnesses within each study group were distinct, thus no direct comparisons were made between the groups. Instead, the magnitude of the difference in use before and after the presumptive disease ruling was compared.
Statistical Analysis
It is possible to have multiple services performed during a single outpatient visit, services that will generate separate bills, thus appearing to be different visits. For the purposes of this study, only 1 visit per day was counted when constructing the monthly health care counts for the 12 months before and after the date of diagnosis of a PID or another infectious disease. A general linear model was created to assess differences in the number of outpatient visits pre- and postruling, adjusting for the number of unique illnesses a veteran had. To adjust for normality in the model, the inverse log of the count of outpatient visits was used in the procedure. P values were compared with an á level of 0.05 to determine significance.
Results
Among the 107,030 veterans receiving VHA care between June 28, 2009, and December 29, 2011, < 0.1% (n = 98) were in the PID group, and 7% (n = 7,603) were in the other infectious disease group (Tables 1 and 2). A significantly smaller proportion of active-duty (“regular”) veterans was in the PID group (50.0%) compared with the other infectious disease group (63.9%). Conversely, a significantly larger proportion of reserve or guard veterans werein the PID group (51.0%) compared with the other infectious disease group (36.1%) (P = .0089). The PID group included a higher proportion of Hispanic veterans (16.3%) and a lower proportion of black veterans (7.1%) than did the other infectious disease group.
The opposite was observed in the other infectious disease group: There was a lower proportion of Hispanic veterans (12.6%) and a higher proportion of black veterans (17.0%). Veterans whose military occupation status indicated combat experience were highly represented in each of the disease groups, as were males. Army veterans were disproportionately represented in the PID group (76.5%) compared with the other infectious disease group (65.4%), whereas the opposite was true for Marine Corps veterans (13.3% and 18.9%, respectively)(Table 2).
To assess the impact of the ruling on the health care-seeking behaviors of veterans, each group was further divided by the timing of diagnosis, specifically, before or after the PID ruling on September 29, 2010. Forty-five percent of the study population received a diagnosis prior to the ruling. Thirty-six percent of the PID group and 30% of the other infectious disease study groups were diagnosed before the ruling (Table 3).
Veterans in the other infectious disease group who were diagnosed after the PID ruling had a significantly higher total number of outpatient visits than did those diagnosed before the ruling (P < .05). A small increase was observed in the median number of outpatient visits among veterans diagnosed with a PID preruling (median = 7) compared with those diagnosed postruling (median = 8), but the difference was not statistically significant. Veterans in the preruling PID group received a diagnosis < 117 days (median value) after separation from service, whereas those in the postruling group received a diagnosis < 291 days (median value) after separation from service (Table 3).
There was an increase in health care visits in the months directly before and after diagnosis, regardless of whether a veteran was diagnosed before or after the ruling. Figure 1 shows the total number of health care visits (visits for any condition) in the 12 months before and 12 months after a PID diagnosis, as well as the number of patients receiving care in those same months. In the months prior to receiving a diagnosis, the number of veterans receiving health care services followed the same trajectory as the total number of health care visits, regardless of the timing of the diagnosis. In the months after receiving a diagnosis, the trajectory for the total number of health care visits and the number of veterans generally followed the same path within the preruling group. In contrast, within the postruling group, the total number of visits was higher than the number of veterans, especially in the latter months, indicating that veterans were receiving services multiple times in a month.
The patterns of health care use in the other infectious disease group were similar to those of the PID group, though the trajectories were more symmetrical for the other infectious disease pre- and postruling groups. There is a distinct increase in the total number of health care visits until diagnosis and a steady decrease in the 12 months after diagnosis with a leveling off of health care use toward the end of the observation period (Figure 2).
Discussion
The rate of PIDs in the U.S. was different from the observed rate in the study population, albeit a limited comparison. In the U.S. in 2010, the reported incidence per 100,000 persons was 0.04 for brucellosis, 13.52 for Campylobacter jejuni, 17.73 for nontyphoid Salmonella, and 0.2 for West Nile virus, vs no cases reported in the study.7,8 In contrast, the 2010-reported U.S. incidence rates per 100,000 persons with Q fever (0.04), malaria (0.58), and TB (3.64) were lower than those reported in the study population (3.32, 8.30, and 41.50 per 100,000 patients, respectively).7
Of the 107,030 OEF/OIF/OND veterans who received care during the study period, < 0.1% were diagnosed with a PIDs and 7% were diagnosed with a different infectious disease. Analysis indicated that 88 of the 98 PID were either TB or malaria cases. Thirty-six percent of the PID cases and 30% of the other infectious disease cases were diagnosed prior to the PID ruling. Veterans in the preruling PID and other infectious disease groups received a diagnosis within 4 or 5 months of becoming eligible for VHA services, whereas those in the postruling groups received a diagnosis within 10 months of eligibility, an observation that may have been caused by outliers and amplified by the small number of cases in the preruling PID group. However, this difference in time to diagnosis between the pre- and postruling groups does not seem to be a reflection of a delay in health care-seeking behavior in general: Veterans in both study groups sought VA services within 73 days of separating from active-duty service.
No significant difference in health care use was found between the pre- and postruling PID groups. When looking at the number of veterans receiving care each month and the total number of health care encounters, the ratio of encounters to veterans was less stable in the PID group than that of the other infectious disease group. Veterans with a PID received multiple outpatient services per month, especially in the postruling PID group. This may be a reflection of follow-up care needed for specific diseases.
Limitations
There are several limitations to note in the study. First, service members could have been diagnosed while still receiving health care services in the military health system, resulting in a low diagnosis rate within the VA. Second, the cases were identified solely based on ICD-9-CM codes; these are not confirmed diagnoses, and misclassification may occur. Future studies should consider incorporating laboratory results and other confirmatory methods of identification for case capture. A third limitation was the lack of availability of health care records outside of VHA. A large proportion of the study population was composed of the reserve/guard component. These veterans return to civilian jobs after separation and often have access to health care outside of VHA. Combined, these limitations affect the ability to identify the prevalence of infectious diseases among veterans.
Related: Women Using VA Health Care
Several findings could not be explored due to methodological limitations but warrant further exploration. First, the longer time period between eligibility and diagnosis post- vs preruling may be an indication that the ruling affected a veteran’s health care-seeking behavior. Second, it was possible that veterans presented with symptoms similar to one of the PIDs but were subsequently diagnosed with another infectious disease, which would affect the disease and use figures. Finally, studies should consider using confirmatory methods of diagnosis to assess the true prevalence of presumptive infectious diseases in the veteran population.
Conclusions
Very few PID cases were identified in the study population. This may be due to the limitation of the available data. However, some interesting findings such as a greater number of encounters for the infectious disease group post- vs preruling and differences in time between eligibility and diagnosis pre- and postruling were found and should be investigated further.
Author disclosures
The authors report no actual or potential conflicts of interest with regard to this article.
Disclaimer
The opinions expressed herein are those of the authors and do not necessarily reflect those of Federal Practitioner, Frontline Medical Communications Inc., the U.S. Government, or any of its agencies. This article may discuss unlabeled or investigational use of certain drugs. Please review the complete prescribing information for specific drugs or drug combinations—including indications, contraindications, warnings, and adverse effects—before administering pharmacologic therapy to patients.
1. Epidemiology Program, Post-Deployment Health Group, Office of Public Health, Veterans Health Administration, Department of Veterans Affairs. Analysis of VA Health Care Utilization Among Operation Enduring Freedom (OEF), Operation Iraqi Freedom (OIF), and Operation New Dawn (OED) Veterans: Cumulative from 1st Qtr FY 2002 through 1st Qtr FY 2013 (October 1, 2001—December 31, 2012). Washington, DC: Department of Veterans Affairs; 2013.
2. Bilmes L. Soldiers returning from Iraq and Afghanistan: The long-term costs of providing veterans medical care and disability benefits. KSG Faculty Research Working Paper Series RWP07-001, January 2007.
3. Institute of Medicine. Gulf War and Health, Volume 5: Infectious Diseases. Washington, DC: National Academies Press; 2007.
4. Department of Veterans Affairs. Presumption of service connection for Persian Gulf service. Fed Regist. 2010;75(188):59968-59972.
5. Panangala SV, Scott C; Congressional Research Service. CRS Report for Congress: Veterans Affairs: Presumptive Service Connection and Disability Compensation: September 13, 2010–R41405. Washington, DC: BiblioGov, 2013.
6. Fact Sheet 64-022-0312: Presumptive Disability for Nine Infectious Diseases Related to Military Service in Southwest Asia (1990-Present): Potential for Long-term Outcomes. U.S. Army Public Health Command. http://phc.amedd.army.mil/PHC%20Resource%20Library/PresumptiveDisability_NineDiseases.pdf
7. Centers for Disease Control and Prevention. Foodborne Diseases Active Surveillance Network (FoodNet): FoodNet Surveillance Report for 2010 (Final Report). Atlanta, Georgia: U.S. Department of Health and Human Services, Centers for Disease Control and Prevention; 2011.
8. Centers for Disease Control and Prevention. Summary of notifiable diseases—United States, 2010. MMWR Morb Mortal Wkly Rep. 2012;59(53):1-111.
Reduced Degree of Irritation During a Second Cycle of Ingenol Mebutate Gel 0.015% for the Treatment of Actinic Keratosis
Actinic keratoses (AKs) are common skin lesions resulting from cumulative exposure to UV radiation and are associated with an increased risk for invasive squamous cell carcinoma1; therefore, diagnosis and treatment are important.2 Individual AKs are most frequently treated with cryosurgery, while topical agents including ingenol mebutate gel are used as field treatments on areas of confluent AKs of sun-damaged skin.2,3 Studies have shown that rates of complete clearance with topical therapy can be improved with more than a single treatment course.4-6
Although the mechanisms of action of ingenol mebutate on AKs are not fully understood, studies indicate that it induces cell death in proliferating keratinocytes, which suggests that it may act preferentially on AKs and not on healthy skin.7 The field treatment of AKs of the face and scalp using ingenol mebutate gel 0.015% involves a 3-day regimen,8 and clearance rates are similar to those observed with topical agents that are used for longer periods of time.3,9,10 Local skin reactions (LSRs) associated with application of ingenol mebutate gel 0.015% on the face and scalp generally are mild to moderate in intensity and resolve after 2 weeks without sequelae.3
The presumption that the cytotoxic actions of ingenol mebutate affect proliferating keratinocytes preferentially was the basis for this study. We hypothesized that application of a second sequential cycle of ingenol mebutate during AK treatment should produce lower LSR scores than the first application cycle due to the specific elimination of transformed keratinocytes from the treatment area. This open-label study compared the intensity of LSRs during 2 sequential cycles of treatment on the same site of the face or scalp using ingenol mebutate gel 0.015%.
Methods
Study Population
Eligible participants were adults with 4 to 8 clinically typical, visible, nonhypertrophic AKs in a 25-cm2 contiguous area of the face or scalp. Inclusion and exclusion criteria were the same as in the pivotal studies.3 The study was approved by the institutional review board at the Icahn School of Medicine at Mount Sinai (New York, New York). Enrollment took place from March 2013 to August 2013.
Study Design and Assessments
All participants were treated with 2 sequential 4-week cycles of ingenol mebutate gel 0.015% applied once daily for 3 consecutive days starting on the first day of each cycle (day 1 and day 29). Participants were evaluated at 11 visits (days 1, 2, 4, 8, 15, 29, 30, 32, 36, 43, and 56) during the 56-day study period (Figure 1). Eligibility, demographics, and medical history were assessed at day 1, and concomitant medications and adverse events (AEs) were evaluated at all visits. Using standardized photographic guides, 6 individual LSRs—erythema, flaking/scaling, crusting, swelling, vesiculation/pustulation, and erosion/ulceration—were assessed on a scale of 0 (none) to 4 (severe), with higher numbers indicating more severe reactions. For each participant, a composite score was calculated as the sum of the individual LSR scores.3 Throughout the study, 3 qualified evaluators assessed AK lesion count and graded the LSRs. The same evaluator assessed both treatment courses for each participant for the majority of assessments.
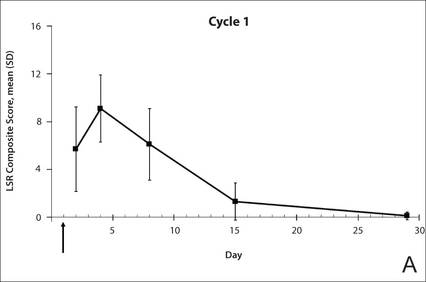
|

|
The primary end point of the study was to evaluate the degree of irritation in each of the 2 sequential cycles of ingenol mebutate treatment by assessing the mean area under the curve (AUC) of the composite LSR score over time following each of the 2 applications. Actinic keratoses were counted at baseline and at the end of each treatment cycle. The paired t test was used to compare AUCs of the composite LSR scores of the 2 cycles and to compare the changes in lesion counts from baseline to day 29 and from baseline to day 56. The complete clearance rates (number of participants with no AKs) at the end of cycles 1 and 2 were compared using a logistic regression model. Participant-perceived irritation and treatment satisfaction were evaluated using a 0 to 100 visual analog scale (VAS), with higher numbers indicating greater irritation and higher satisfaction. Participant-reported scores were summarized.
Results
Participant Characteristics
A total of 20 participants were enrolled in the study. At the completion of the study, 2 participants withdrew consent but allowed use of data from their completed assessments. Consequently, a total of 18 patients completed the entire study. The mean age was 75.35 years (median, 77.5 years; age range, 49–87 years). Most of the participants (15/20 [75%]) were men. All participants were white, and 2 were of Hispanic ethnicity. Of the 20 participants, 19 (95%) were Fitzpatrick skin type II, and 1 (5%) was Fitzpatrick skin type I. Most of the participants (16/20 [80%]) received treatment of lesions on the face. With the exception of 2 (10%) participants, all had received prior treatment of AKs, including cryosurgery (16/20 [80%]), imiquimod (5/20 [25%]), fluorouracil (2/20 [10%]), diclofenac (2/20 [10%]), and photodynamic therapy (2/20 [10%]); 8 (40%) participants had received more than 1 type of treatment.

LSRs in Cycles 1 and 2
The time course for the development and resolution of LSRs during both treatment cycles was similar. Local skin reactions were evident on day 2 in each cycle, peaked at 3 days after the application of the first dose, declined rapidly by the 15th day of the cycle, and returned to baseline by the end of each 4-week cycle (Figure 1). The mean (standard deviation [SD]) composite LSR score at 3 days after application of the first dose was higher in cycle 1 than in cycle 2 (9.1 [2.83] vs 5.0 [3.24])(Figure 1). The composite LSR score assessed over time based on the mean (SD) AUC was significantly lower in cycle 2 than in cycle 1 (40.5 [28.05] vs 83.6 [36.25])(P=.0002)(Table). Statistical differences in scores for individual reactions between the 2 cycles were not determined because of the risk for a spurious indication of significance from multiple comparisons in such a limited patient sample.
The percentage of participants who had a score greater than 1 for any of the 6 components of the LSR assessment was lower in cycle 2 than in cycle 1 at all of the assessed time points (Figure 2). In both cycles, the percentage of participants with an LSR score greater than 1 was highest 3 days after the application of the first dose in the cycle (day 4 or day 32, respectively). Erythema, flaking/scaling, and crusting were the most freq-uently observed reactions. At day 29, there were no participants with an LSR score greater than 1 in any of the 6 components. At day 29 and day 56, 94% (17/18) and 100% (18/18) of participants, respectively, had a score of 0 for all reactions.
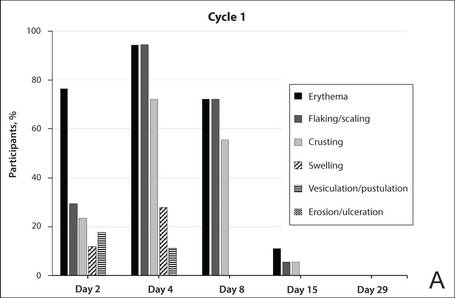
|
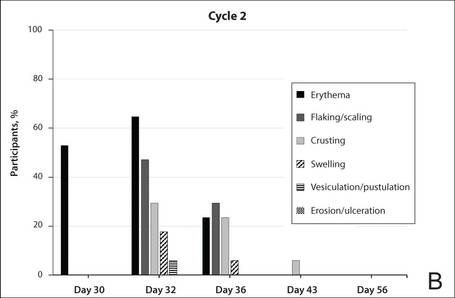
|
The photographs in Figure 3, taken 7 days after the application of the first dose of ingenol mebutate gel 0.015% in each cycle of treatment of AK lesions on the face, show that there was less flaking/scaling and crusting in cycle 2 than in cycle 1. A review of participant photographs from the third treatment day of each cycle showed that the areas of erythema were the same in both cycles. The other 5 LSRs—flaking/scaling, crusting, swelling, vesiculation/pustulation, and erosion/ulceration—were observed in different areas of the treated field in the 2 cycles when applicable.
Adverse Events
The few AEs that were reported were considered to be mild in severity. The AEs included application-site pain (n=5), application-site pruritus (n=3), and nasopharyngitis (n=1). No serious AEs were reported. After the first treatment cycle, 1 participant experienced hypopigmentation at the treatment site that persisted as faint hypopigmentation at the last study visit (day 56).
AK Lesion Count
The lesion count in all participants at baseline ranged from 4 to 8, with a mean (SD) of 5.9 (1.55). Mean lesion count was substantially reduced at the end of cycle 1 (0.9 [1.39]) and cycle 2 (0.3 [0.57]). The change in lesion count from baseline to day 56 was greater than the change from baseline to day 29 (-5.7 [1.61] vs -5.0 [1.57])(P=.0137). Complete clearance at day 29 and day 56 was achieved in 55.6% (10/18) and 77.8% (14/18) of participants, respectively. The difference in the clearance rate between day 29 and day 56 did not reach statistical significance, most likely due to the small sample size.
Participant-Reported Outcomes
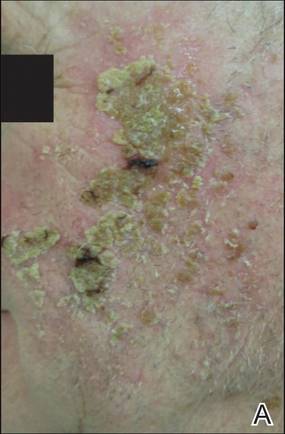
|

|
Visual analog scale scores for participant-perceived irritation were less than 50 on a scale of 0 to 100 during both application cycles. At 1 day and 3 days after application of the first dose of ingenol mebutate gel 0.015% in cycle 1, the mean (SD) VAS scores for irritation were 31.8 (37.06) and 37.9 (30.77), respectively. At the same time points in cycle 2, VAS scores were 44.2 (32.45) and 49.6 (26.90), respectively. No information was available regarding resolution of participant-perceived irritation, as irritation data were not collected after day 4 of each treatment cycle; therefore, P values were not determined. Participant satisfaction with treatment was high and nearly the same at the end of cycles 1 and 2 (VAS scores: 83.7 [12.73] and 83.8 [20.46], respectively).
Comment
Our findings show that a second course of treatment with ingenol mebutate gel 0.015% on the same site on the face or scalp produced a less intense inflammatory reaction than the first course of treatment. Composite LSR scores at each time point after the start of treatment were lower in cycle 2 than in cycle 1. The percentage of participants who demonstrated a severity score greater than 1 for any of the 6 components of the LSR assessment also was lower at time points in cycle 2 than in cycle 1. These results are consistent with the hypothesis that the activity of ingenol mebutate includes a mechanism that specifically targets transformed keratinocytes, which are reduced by the start of a second cycle of treatment.
The mechanism for the clinical efficacy of ingenol mebutate has not been fully described. Studies in preclinical models suggest at least 2 components, including direct cytotoxic effects on tumor cells and a localized inflammatory reaction that includes protein kinase C activation.11 Ingenol mebutate preferentially induces death in tumor cells and in proliferating undifferentiated keratinocytes.7,12 Cell death and protein kinase C activation lead to an inflammatory response dominated by neutrophils and other immunocompetent cells that add to the destruction of transformed cells.11
The reduced inflammatory response observed in participants during the second cycle of treatment in this study is consistent with the theory of a preferential action on transformed keratinocytes by ingenol mebutate. Once transformed keratinocytes are substantially cleared in cycle 1, fewer target cells remain, and therefore the inflammatory response is less intense in cycle 2. If ingenol mebutate were uniformly cytotoxic and inflammatory to all cells, the LSR scores in both cycles would be expected to be similar.
Assessment of participant-perceived irritation supplemented the measurement of the 6 visible manifestations of inflammation over each 4-week cycle. Participant-perceived irritation was recorded early in the cycles at 1 and 3 days after the first dose. Although it is difficult to standardize patient perceptions, VAS scores for irritation in cycle 2 were higher than those reported in cycle 1, which suggests an increased perception of irritation. The clinical relevance of this perception is not certain and may be due to the small number of participants and/or the time interval between the 2 treatment courses.
The results of this study were limited by the small patient sample. Additionally, LSR assessments were limited by the quality of the photographs. However, LSRs and AK clearance rates were similar to the pooled findings seen in the phase 3 studies of ingenol mebutate.3 Adverse events were predominantly conditions that occurred at the application site, as in phase 3 studies.3 Similarly, the time course of LSR development and resolution followed the same pattern as in those trials. The peak composite LSR score for the face and scalp was approximately 9 in both the present study (cycle 1) and in the pooled phase 3 studies.3
Conclusion
Ingenol mebutate gel 0.015% may specifically target and remove transformed proliferating keratinocytes, cumulatively reducing the burden of sun-damaged skin over the course of 2 treatment cycles. Patients may experience fewer LSRs on reapplication of ingenol mebutate to a previously treated site.
Acknowledgment
Editorial support was provided by Tanya MacNeil, PhD, of p-value communications, LLC, Cedar Knolls, New Jersey.
1. Criscione VD, Weinstock MA, Naylor MF, et al. Actinic keratoses: natural history and risk of malignant transformation in the Veterans Affairs Topical Tretinoin Chemoprevention Trial. Cancer. 2009;115:2523-2530.
2. Berman B, Cohen DE, Amini S. What is the role of field-directed therapy in the treatment of actinic keratosis? part 1: overview and investigational topical agents. Cutis. 2012;89:241-250.
3. Lebwohl M, Swanson N, Anderson LL, et al. Ingenol mebutate gel for actinic keratosis. N Engl J Med. 2012;366:1010-1019.
4. Alomar A, Bichel J, McRae S. Vehicle-controlled, randomized, double-blind study to assess safety and efficacy of imiquimod 5% cream applied once daily 3 days per week in one or two courses of treatment of actinic keratoses on the head. Br J Dermatol. 2007;157:133-141.
5. Jorizzo J, Dinehart S, Matheson R, et al. Vehicle-controlled, double-blind, randomized study of imiquimod 5% cream applied 3 days per week in one or two courses of treatment for actinic keratoses on the head. J Am Acad Dermatol. 2007;57:265-268.
6. Del Rosso JQ, Sofen H, Leshin B, et al. Safety and efficacy of multiple 16-week courses of topical imiquimod for the treatment of large areas of skin involved with actinic keratoses. J Clin Aesthet Dermatol. 2009;2:20-28.
7. Stahlhut M, Bertelsen M, Hoyer-Hansen M, et al. Ingenol mebutate: induced cell death patterns in normal and cancer epithelial cells. J Drugs Dermatol. 2012;11:1181-1192.
8. Picato gel 0.015%, 0.05% [package insert]. Parsippany, NJ: LEO Pharma; 2013.
9. Rivers JK, Arlette J, Shear N, et al. Topical treatment of actinic keratoses with 3.0% diclofenac in 2.5% hyaluronan gel. Br J Dermatol. 2002;146:94-100.
10. Swanson N, Abramovits W, Berman B, et al. Imiquimod 2.5% and 3.75% for the treatment of actinic keratoses: results of two placebo-controlled studies of daily application to the face and balding scalp for two 2-week cycles. J Am Acad Dermatol. 2010;62:582-590.
11. Challacombe JM, Suhrbier A, Parsons PG, et al. Neutrophils are a key component of the antitumor efficacy of topical chemotherapy with ingenol-3-angelate. J Immunol. 2006;177:8123-8132.
12. Ogbourne SM, Suhrbier A, Jones B, et al. Antitumor activity of 3-ingenyl angelate: plasma membrane and mitochondrial disruption and necrotic cell death. Cancer Res. 2004;64:2833-2839.
Actinic keratoses (AKs) are common skin lesions resulting from cumulative exposure to UV radiation and are associated with an increased risk for invasive squamous cell carcinoma1; therefore, diagnosis and treatment are important.2 Individual AKs are most frequently treated with cryosurgery, while topical agents including ingenol mebutate gel are used as field treatments on areas of confluent AKs of sun-damaged skin.2,3 Studies have shown that rates of complete clearance with topical therapy can be improved with more than a single treatment course.4-6
Although the mechanisms of action of ingenol mebutate on AKs are not fully understood, studies indicate that it induces cell death in proliferating keratinocytes, which suggests that it may act preferentially on AKs and not on healthy skin.7 The field treatment of AKs of the face and scalp using ingenol mebutate gel 0.015% involves a 3-day regimen,8 and clearance rates are similar to those observed with topical agents that are used for longer periods of time.3,9,10 Local skin reactions (LSRs) associated with application of ingenol mebutate gel 0.015% on the face and scalp generally are mild to moderate in intensity and resolve after 2 weeks without sequelae.3
The presumption that the cytotoxic actions of ingenol mebutate affect proliferating keratinocytes preferentially was the basis for this study. We hypothesized that application of a second sequential cycle of ingenol mebutate during AK treatment should produce lower LSR scores than the first application cycle due to the specific elimination of transformed keratinocytes from the treatment area. This open-label study compared the intensity of LSRs during 2 sequential cycles of treatment on the same site of the face or scalp using ingenol mebutate gel 0.015%.
Methods
Study Population
Eligible participants were adults with 4 to 8 clinically typical, visible, nonhypertrophic AKs in a 25-cm2 contiguous area of the face or scalp. Inclusion and exclusion criteria were the same as in the pivotal studies.3 The study was approved by the institutional review board at the Icahn School of Medicine at Mount Sinai (New York, New York). Enrollment took place from March 2013 to August 2013.
Study Design and Assessments
All participants were treated with 2 sequential 4-week cycles of ingenol mebutate gel 0.015% applied once daily for 3 consecutive days starting on the first day of each cycle (day 1 and day 29). Participants were evaluated at 11 visits (days 1, 2, 4, 8, 15, 29, 30, 32, 36, 43, and 56) during the 56-day study period (Figure 1). Eligibility, demographics, and medical history were assessed at day 1, and concomitant medications and adverse events (AEs) were evaluated at all visits. Using standardized photographic guides, 6 individual LSRs—erythema, flaking/scaling, crusting, swelling, vesiculation/pustulation, and erosion/ulceration—were assessed on a scale of 0 (none) to 4 (severe), with higher numbers indicating more severe reactions. For each participant, a composite score was calculated as the sum of the individual LSR scores.3 Throughout the study, 3 qualified evaluators assessed AK lesion count and graded the LSRs. The same evaluator assessed both treatment courses for each participant for the majority of assessments.
|
|
|
|
The primary end point of the study was to evaluate the degree of irritation in each of the 2 sequential cycles of ingenol mebutate treatment by assessing the mean area under the curve (AUC) of the composite LSR score over time following each of the 2 applications. Actinic keratoses were counted at baseline and at the end of each treatment cycle. The paired t test was used to compare AUCs of the composite LSR scores of the 2 cycles and to compare the changes in lesion counts from baseline to day 29 and from baseline to day 56. The complete clearance rates (number of participants with no AKs) at the end of cycles 1 and 2 were compared using a logistic regression model. Participant-perceived irritation and treatment satisfaction were evaluated using a 0 to 100 visual analog scale (VAS), with higher numbers indicating greater irritation and higher satisfaction. Participant-reported scores were summarized.
Results
Participant Characteristics
A total of 20 participants were enrolled in the study. At the completion of the study, 2 participants withdrew consent but allowed use of data from their completed assessments. Consequently, a total of 18 patients completed the entire study. The mean age was 75.35 years (median, 77.5 years; age range, 49–87 years). Most of the participants (15/20 [75%]) were men. All participants were white, and 2 were of Hispanic ethnicity. Of the 20 participants, 19 (95%) were Fitzpatrick skin type II, and 1 (5%) was Fitzpatrick skin type I. Most of the participants (16/20 [80%]) received treatment of lesions on the face. With the exception of 2 (10%) participants, all had received prior treatment of AKs, including cryosurgery (16/20 [80%]), imiquimod (5/20 [25%]), fluorouracil (2/20 [10%]), diclofenac (2/20 [10%]), and photodynamic therapy (2/20 [10%]); 8 (40%) participants had received more than 1 type of treatment.
LSRs in Cycles 1 and 2
The time course for the development and resolution of LSRs during both treatment cycles was similar. Local skin reactions were evident on day 2 in each cycle, peaked at 3 days after the application of the first dose, declined rapidly by the 15th day of the cycle, and returned to baseline by the end of each 4-week cycle (Figure 1). The mean (standard deviation [SD]) composite LSR score at 3 days after application of the first dose was higher in cycle 1 than in cycle 2 (9.1 [2.83] vs 5.0 [3.24])(Figure 1). The composite LSR score assessed over time based on the mean (SD) AUC was significantly lower in cycle 2 than in cycle 1 (40.5 [28.05] vs 83.6 [36.25])(P=.0002)(Table). Statistical differences in scores for individual reactions between the 2 cycles were not determined because of the risk for a spurious indication of significance from multiple comparisons in such a limited patient sample.
The percentage of participants who had a score greater than 1 for any of the 6 components of the LSR assessment was lower in cycle 2 than in cycle 1 at all of the assessed time points (Figure 2). In both cycles, the percentage of participants with an LSR score greater than 1 was highest 3 days after the application of the first dose in the cycle (day 4 or day 32, respectively). Erythema, flaking/scaling, and crusting were the most freq-uently observed reactions. At day 29, there were no participants with an LSR score greater than 1 in any of the 6 components. At day 29 and day 56, 94% (17/18) and 100% (18/18) of participants, respectively, had a score of 0 for all reactions.
|
|
|
|
The photographs in Figure 3, taken 7 days after the application of the first dose of ingenol mebutate gel 0.015% in each cycle of treatment of AK lesions on the face, show that there was less flaking/scaling and crusting in cycle 2 than in cycle 1. A review of participant photographs from the third treatment day of each cycle showed that the areas of erythema were the same in both cycles. The other 5 LSRs—flaking/scaling, crusting, swelling, vesiculation/pustulation, and erosion/ulceration—were observed in different areas of the treated field in the 2 cycles when applicable.
Adverse Events
The few AEs that were reported were considered to be mild in severity. The AEs included application-site pain (n=5), application-site pruritus (n=3), and nasopharyngitis (n=1). No serious AEs were reported. After the first treatment cycle, 1 participant experienced hypopigmentation at the treatment site that persisted as faint hypopigmentation at the last study visit (day 56).
AK Lesion Count
The lesion count in all participants at baseline ranged from 4 to 8, with a mean (SD) of 5.9 (1.55). Mean lesion count was substantially reduced at the end of cycle 1 (0.9 [1.39]) and cycle 2 (0.3 [0.57]). The change in lesion count from baseline to day 56 was greater than the change from baseline to day 29 (-5.7 [1.61] vs -5.0 [1.57])(P=.0137). Complete clearance at day 29 and day 56 was achieved in 55.6% (10/18) and 77.8% (14/18) of participants, respectively. The difference in the clearance rate between day 29 and day 56 did not reach statistical significance, most likely due to the small sample size.
Participant-Reported Outcomes
|
|
|
|
Visual analog scale scores for participant-perceived irritation were less than 50 on a scale of 0 to 100 during both application cycles. At 1 day and 3 days after application of the first dose of ingenol mebutate gel 0.015% in cycle 1, the mean (SD) VAS scores for irritation were 31.8 (37.06) and 37.9 (30.77), respectively. At the same time points in cycle 2, VAS scores were 44.2 (32.45) and 49.6 (26.90), respectively. No information was available regarding resolution of participant-perceived irritation, as irritation data were not collected after day 4 of each treatment cycle; therefore, P values were not determined. Participant satisfaction with treatment was high and nearly the same at the end of cycles 1 and 2 (VAS scores: 83.7 [12.73] and 83.8 [20.46], respectively).
Comment
Our findings show that a second course of treatment with ingenol mebutate gel 0.015% on the same site on the face or scalp produced a less intense inflammatory reaction than the first course of treatment. Composite LSR scores at each time point after the start of treatment were lower in cycle 2 than in cycle 1. The percentage of participants who demonstrated a severity score greater than 1 for any of the 6 components of the LSR assessment also was lower at time points in cycle 2 than in cycle 1. These results are consistent with the hypothesis that the activity of ingenol mebutate includes a mechanism that specifically targets transformed keratinocytes, which are reduced by the start of a second cycle of treatment.
The mechanism for the clinical efficacy of ingenol mebutate has not been fully described. Studies in preclinical models suggest at least 2 components, including direct cytotoxic effects on tumor cells and a localized inflammatory reaction that includes protein kinase C activation.11 Ingenol mebutate preferentially induces death in tumor cells and in proliferating undifferentiated keratinocytes.7,12 Cell death and protein kinase C activation lead to an inflammatory response dominated by neutrophils and other immunocompetent cells that add to the destruction of transformed cells.11
The reduced inflammatory response observed in participants during the second cycle of treatment in this study is consistent with the theory of a preferential action on transformed keratinocytes by ingenol mebutate. Once transformed keratinocytes are substantially cleared in cycle 1, fewer target cells remain, and therefore the inflammatory response is less intense in cycle 2. If ingenol mebutate were uniformly cytotoxic and inflammatory to all cells, the LSR scores in both cycles would be expected to be similar.
Assessment of participant-perceived irritation supplemented the measurement of the 6 visible manifestations of inflammation over each 4-week cycle. Participant-perceived irritation was recorded early in the cycles at 1 and 3 days after the first dose. Although it is difficult to standardize patient perceptions, VAS scores for irritation in cycle 2 were higher than those reported in cycle 1, which suggests an increased perception of irritation. The clinical relevance of this perception is not certain and may be due to the small number of participants and/or the time interval between the 2 treatment courses.
The results of this study were limited by the small patient sample. Additionally, LSR assessments were limited by the quality of the photographs. However, LSRs and AK clearance rates were similar to the pooled findings seen in the phase 3 studies of ingenol mebutate.3 Adverse events were predominantly conditions that occurred at the application site, as in phase 3 studies.3 Similarly, the time course of LSR development and resolution followed the same pattern as in those trials. The peak composite LSR score for the face and scalp was approximately 9 in both the present study (cycle 1) and in the pooled phase 3 studies.3
Conclusion
Ingenol mebutate gel 0.015% may specifically target and remove transformed proliferating keratinocytes, cumulatively reducing the burden of sun-damaged skin over the course of 2 treatment cycles. Patients may experience fewer LSRs on reapplication of ingenol mebutate to a previously treated site.
Acknowledgment
Editorial support was provided by Tanya MacNeil, PhD, of p-value communications, LLC, Cedar Knolls, New Jersey.
1. Criscione VD, Weinstock MA, Naylor MF, et al. Actinic keratoses: natural history and risk of malignant transformation in the Veterans Affairs Topical Tretinoin Chemoprevention Trial. Cancer. 2009;115:2523-2530.
2. Berman B, Cohen DE, Amini S. What is the role of field-directed therapy in the treatment of actinic keratosis? part 1: overview and investigational topical agents. Cutis. 2012;89:241-250.
3. Lebwohl M, Swanson N, Anderson LL, et al. Ingenol mebutate gel for actinic keratosis. N Engl J Med. 2012;366:1010-1019.
4. Alomar A, Bichel J, McRae S. Vehicle-controlled, randomized, double-blind study to assess safety and efficacy of imiquimod 5% cream applied once daily 3 days per week in one or two courses of treatment of actinic keratoses on the head. Br J Dermatol. 2007;157:133-141.
5. Jorizzo J, Dinehart S, Matheson R, et al. Vehicle-controlled, double-blind, randomized study of imiquimod 5% cream applied 3 days per week in one or two courses of treatment for actinic keratoses on the head. J Am Acad Dermatol. 2007;57:265-268.
6. Del Rosso JQ, Sofen H, Leshin B, et al. Safety and efficacy of multiple 16-week courses of topical imiquimod for the treatment of large areas of skin involved with actinic keratoses. J Clin Aesthet Dermatol. 2009;2:20-28.
7. Stahlhut M, Bertelsen M, Hoyer-Hansen M, et al. Ingenol mebutate: induced cell death patterns in normal and cancer epithelial cells. J Drugs Dermatol. 2012;11:1181-1192.
8. Picato gel 0.015%, 0.05% [package insert]. Parsippany, NJ: LEO Pharma; 2013.
9. Rivers JK, Arlette J, Shear N, et al. Topical treatment of actinic keratoses with 3.0% diclofenac in 2.5% hyaluronan gel. Br J Dermatol. 2002;146:94-100.
10. Swanson N, Abramovits W, Berman B, et al. Imiquimod 2.5% and 3.75% for the treatment of actinic keratoses: results of two placebo-controlled studies of daily application to the face and balding scalp for two 2-week cycles. J Am Acad Dermatol. 2010;62:582-590.
11. Challacombe JM, Suhrbier A, Parsons PG, et al. Neutrophils are a key component of the antitumor efficacy of topical chemotherapy with ingenol-3-angelate. J Immunol. 2006;177:8123-8132.
12. Ogbourne SM, Suhrbier A, Jones B, et al. Antitumor activity of 3-ingenyl angelate: plasma membrane and mitochondrial disruption and necrotic cell death. Cancer Res. 2004;64:2833-2839.
Practice Points
- Reapplication of ingenol mebutate gel 0.015% to the same treatment area on the face or scalp produced a less intense inflammatory reaction than the first treatment course.
- Ingenol mebutate may specifically target and remove transformed proliferating keratinocytes, cumulatively reducing the burden of sun-damaged skin over 2 treatment cycles.
- Almost all patients were either clear or almost clear of actinic keratosis lesions by 4 weeks following the second application of ingenol mebutate.
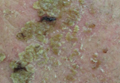
Incidence and Epidemiology of Onychomycosis in Patients Visiting a Tertiary Care Hospital in India
Onychomycosis is a chronic fungal infection of the nails. Dermatophytes are the most common etiologic agents, but yeasts and nondermatophyte molds also constitute a substantial number of cases.1 An accumulation of debris under distorted, deformed, thickened, and discolored nails, particularly with ragged and furrowed edges, strongly suggests tinea unguium.2 Candidal onychomycosis (CO) lacks gross distortion and accumulated detritus and mainly affects fingernails.3 Nondermatophytic molds cause 1.5% to 6% of cases of onychomycosis, mostly seen in toenails of elderly individuals with a history of trauma.4 Onychomycosis affects 5.5% of the world population5 and represents 20% to 40% of all onychopathies and approximately 30% of cutaneous mycotic infections.6
The incidence of onychomycosis ranges from 0.5% to 5% in the general population in India.7 The incidence is particularly high in warm humid climates such as India.8 Researchers have found certain habits of the population in the Indian subcontinent (eg, walking with bare feet, wearing ill-fitting shoes, nail-biting [eg, onychophagia], working with chemicals) to be contributing factors for onychomycosis.9 Several studies have shown that the prevalence of onychomycosis increases with age, possibly due to poor peripheral circulation, diabetes mellitus, repeated nail trauma, prolonged exposure to pathogenic fungi, suboptimal immune function, inactivity, or inability to trim the toenails and care for the feet.10 Nail infection is a cosmetic problem with serious physical and psychological morbidity and also serves as the fungal reservoir for skin infections. Besides destruction and disfigurement of the nail plate, onychomycosis can lead to self-consciousness and impairment of daily functioning.11
Nail dystrophy occurs secondary to various systemic disorders or can be associated with other dermatologic conditions. Nail discoloration and other onychia should be differentiated from onychomycosis by classifying nail lesions as distal lateral subungual onychomycosis, proximal subungual onychomycosis (PSO), CO, white superficial onychomycosis (WSO), and total dystrophic onychomycosis.12 Laboratory investigation is necessary to accurately differentiate between fungal infections and other skin diseases before starting treatment. Our hospital-based study sought to determine the incidence and epidemiology of onychomycosis with an analysis of 134 participants with clinically suspected onychomycosis. We evaluated prevalence based on age, sex, and occupation, as well as the most common pathogens.
Materials and Methods
Study Design and Participants
The study population consisted of 134 patients with clinically suspected onychomycosis who visited the dermatology department at the Veer Chandra Singh Garhwali Government Institute of Medical Sciences and Research Institute in Uttarakhand, India (October 2010 to October 2011). A thorough history was obtained and a detailed examination of the distorted nails was conducted in the microbiology laboratory. Patient history and demographic factors such as age, sex, occupation, and related history of risk factors for onychomycosis were recorded pro forma. Some of the details such as itching, family history of fungal infection, and prior cutaneous infections were recorded. Patients who were undergoing treatment with systemic or topical antifungal agents in the 4 weeks preceding the study period were excluded to rule out false-negative cases and to avoid the influence of antifungal agents on the disease course.
Assessments
Two samples were taken from each patient on different days. Participants were divided into 4 groups based on occupation: farmer, housewife, student, and other (eg, clerk, shopkeeper, painter). Clinical presentation of discoloration, onycholysis, subungual hyperkeratosis, and nail thickening affecting the distal and/or lateral nail plate was defined as distal lateral subungual onychomycosis; discoloration and onycholysis affecting the proximal part of the nail was defined as PSO; association with paronychia and distal and lateral onycholysis was defined as CO; white opaque patches on the nail surface were defined as WSO; and end-stage nail disease was defined as total dystrophic onychomycosis.
Prior to sampling, the nails were cleaned with a 70% alcohol solution. Nail clippings were obtained using presterilized nail clippers and a blunt no. 15 scalpel blade and were placed on sterilized black paper. Each nail sample was divided into 2 parts: one for direct microscopy and one for culture. Nail clippings were subjected to microscopic examination after clearing in 20% potassium hydroxide solution. The slides were examined for fungal hyphae, arthrospores, yeasts, and pseudohyphal forms. Culture was done with Emmons modification of Sabouraud dextrose agar (incubated at 27°C for molds and 37°C for yeasts) as well as with 0.4% chloramphenicol and 5% cycloheximide (incubated at 27°C). Culture tubes were examined daily for the first week and on alternate days thereafter for 4 weeks of incubation.
Dermatophytes were identified based on the colony morphology, growth rate, texture, border, and pigmentation in the obverse and reverse of culture media and microscopic examination using lactophenol cotton blue tease mount. Yeast colonies were identified microscopically with Gram stain, and species were identified by germ tube, carbohydrate assimilation, and fermentation tests.13 Nondermatophyte molds were identified by colony morphology, microscopic examination, and slide culture. Molds were considered as pathogens in the presence of the following criteria: (1) absence of other fungal growth in the same culture tube; (2) presence of mold growth in all 3 samples; and (3) presence of filaments identified on direct examination.
Results
Of 134 clinically suspected cases of onychomycosis, 78 (58.2%) were from fingernails and 56 (41.8%) from toenails. Clinical diagnosis was confirmed in 96 (71.6%) cases by both fungal culture and direct microscopy but was confirmed by direct microscopy alone in only 76 (56.7%) cases. False-negative results were found in 23.9% (32/134) of participants with direct microscopy and 9.0% (12/134) with fungal cultures. The results of direct microscopy and fungal culture are outlined in Table 1. The study included 78 (58.2%) males and 56 (41.8%) females with a mean age of 44 years. Highest prevalence (47.8%) was seen in participants older than 40 years and lowest prevalence (11.9%) in participants younger than 20 years. In total, 32.8% of participants were farmers, 31.3% were housewives, 14.9% were students, and 20.9% performed other occupations. Disease history at the time of first presentation varied from 1 month to more than 2 years; 33.6% of participants had a 1- to 6-month history of disease, while only 3.7% had a disease history of less than 1 month at presentation. The demographic data are further outlined in Table 2.
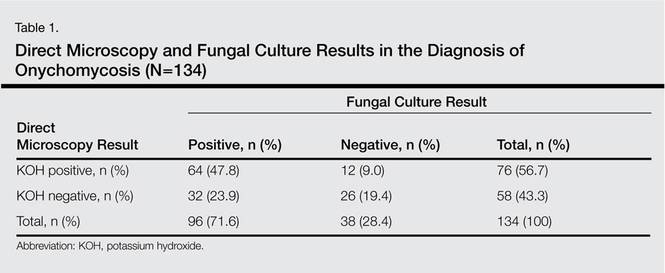

Distal lateral subungual onychomycosis was the most prevalent clinical pattern found in 66 (49.3%) participants; fungal isolates were found in 60 of these participants. The next most prevalent clinical pattern was PSO, which was found in 34 (25.4%) participants, 12 showing fungal growth. A clinical pattern of CO was noted in 28 (20.9%) participants, 22 showing fungal growth; WSO was noted in 10 (7.5%) participants, 2 showing fungal growth.
Of 96 culture-positive cases, dermatophytes were the most common pathogens isolated in 56 (58.3%) participants, followed by Candida species in 28 (29.2%) participants. Nondermatophyte molds were isolated in 12 (12.5%) participants. The various dermatophytes, Candida species, and nondermatophyte molds that were isolated on fungal culture are outlined in Table 3. Of the 96 participants with positive fungal cultures, 30 (31.2%) were farmers working with soil, 28 (29.2%) were housewives associated with wet work, 16 (16.7%) were students associated with increased physical exercise from extracurricular activity, and 22 (22.9%) were in other occupations (Table 4).
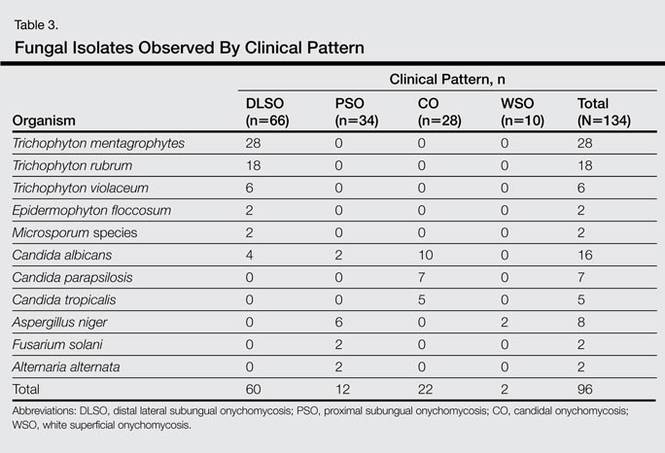
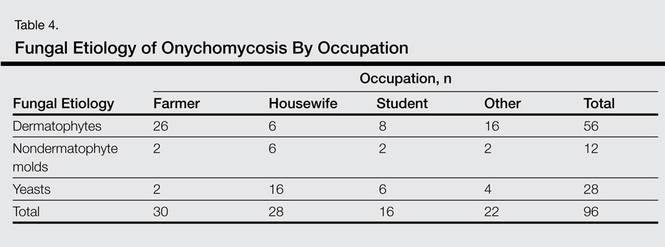
Comment
The term onychomycosis is derived from onyx, the Greek word for nail, and mykes, the Greek word for fungus. Onychomycosis is a chronic mycotic infection of the fingernails and toenails that can have a serious impact on patients’ quality of life. The fungi known to cause onychomycosis vary among geographic areas, primarily due to differences in climate.14 The isolation rate of onychomycosis in our hospital-based study was 71.6%, which is in accordance with various studies in India and abroad, including 60% in Karnataka, India5; 82.3% in Sikkim, India6; and 86.9% in Turkey.1 However, other studies have shown lower isolation rates of 39.5% in Central Delhi, India,15 and 37.6% in Himachal Pradesh, India.16 Some patients with onychomycosis may not seek medical attention, which may explain the difference in the prevalence of onychomycosis observed worldwide.17 The prevalence of onychomycosis by age also varies. In our study, participants older than 40 years showed the highest prevalence (47.8%), which is in accordance with other studies from India18 and abroad.19,20 In contrast, some Indian studies15,21,22 have reported a higher prevalence in younger adults (ie, 21–30 years), which may be attributed to greater self-consciousness about nail discoloration and disfigurement as well as increased physical activity and different shoe-wearing habits. A higher prevalence in older adults, as observed in our study as well some other studies,19,21 may be due to poor peripheral circulation, diabetes mellitus, repeated nail trauma, longer exposure to pathogenic fungi, suboptimal immune function, inactivity, and poor hygiene.10
In our study, suspected onychomycosis was more common in males (58.2%) than in females (41.8%). These results are in accordance with many of the studies in the worldwide literature.1,10,11,15,16,23-25 A higher isolation rate in males worldwide may be due to common use of occlusive footwear, more exposure to outdoor conditions, and increased physical activity, leading to an increased likelihood of trauma. The importance of trauma to the nails as a predisposing factor for onychomycosis is well established.24 In our study, the majority of males wore shoes regardless of occupation. Perspiration of the feet when wearing socks and/or shoes can generate a warm moist environment that promotes the growth of fungi and predisposes patients to onychomycosis. Similar observations have been reported by other investigators.21,22,25,26
The incidence of onychomycosis was almost evenly distributed among farmers, housewives, and the miscellaneous group, whereas a high isolation rate was noted among students. Of 20 students included in our study, onychomycosis was confirmed in 16, which may be related to an increased use of synthetic sports shoes and socks that retain sweat as well as vigorous physical activity frequently resulting in nail injuries among this patient population.11 Younger patients may be more conscious of their appearance and therefore may be more likely to seek treatment. Similar observations have been reported by other researchers.15,21,22
In our study, dermatophytes were the most commonly found pathogens (58.3%), which is comparable to other studies.15,18,22Trichophyton mentagrophytes was the most frequently isolated dermatophyte from cultures, which was in concordance with a study from Delhi.15 In some studies,18,20,22Trichophyton rubrum has been reported as the most prevalent dermatophyte, but we identified Trichophyton rubrum in only 18 participants, which can be attributed to variations in epidemiology based on geographic region. Nondermatophyte molds were isolated in 12.5% of participants, with Aspergillus niger being the most common isolate found in 8 cases. Other isolated species were Alternaria alternata and Fusarium solani found in 2 cases each. Aspergillus niger has been reported in worldwide studies as an important cause of onychomycosis.15,18,19,21,22
In 28 cases (29.2%) involving Candida species, Candida albicans, Candida parapsilosis, and Candida tropicalis were the most common pathogens, respectively, which is in accordance with many studies.15,20-22,25 In 28 cases of CO, females (n=16) were affected more than males (n=12). All of the females were housewives and C albicans was predominantly isolated from the fingernails. Household responsibilities involving kitchen work (eg, cutting and peeling vegetables, washing utensils, cleaning the house/laundry) may chronically expose housewives to moist environments and make them more prone to injury, thus facilitating easy entry of fungal agents.
Distal lateral subungual onychomycosis was the most prevalent clinical type found (n=66), which is comparable to other reports.20,22,25 Proximal subungual onychomycosis was the second most common type; however, a greater incidence has been reported by some researchers,23,24 while others have reported a lower incidence.20,21 Candidial onychomycosis and WSO were not common in our study, and PSO was not associated with any immunodeficiency disease, as reported by other researchers.15,20
Of 134 suspected cases of onychomycosis, 71.6% were confirmed by both direct microscopy and fungal culture, but only 56.7% were confirmed by direct microscopy alone. If we had relied on microscopy with potassium hydroxide only, we would have missed 23.9% of cases. Therefore, nail scrapings should always be subjected to fungal culture as well as direct microscopy, as both are necessary for accurate diagnosis and treatment of onychomycosis. If onychomycosis is not successfully treated, it can act as a reservoir of fungal infection affecting other parts of the body with the potential to pass infection on to others.
Conclusion
Clinical examination alone is not sufficient for diagnosing onychomycosis14,18,20; in many cases of suspected onychomycosis with nail changes, mycologic examination does not confirm fungal infection. In our study, only 71.6% of participants with nail changes proved to be of fungal etiology. Other researchers from different geographic locations have reported similar results with lower incidence (eg, 39.5%,15 37.6%,16 51.7%,18 45.3%21) of fungal etiology in such cases. Therefore, both clinical and mycologic examinations are important for establishing the diagnosis and selecting the most suitable antifungal agent, which is possible only if the underlying pathogen is correctly identified.
1. Yenişehirli G, Bulut Y, Sezer E, et al. Onychomycosis infections in the Middle Black Sea Region, Turkey. Int J Dermatol. 2009;48:956-959.
2. Kouskoukis CE, Scher RK, Ackerman AB. What histologic finding distinguishes onychomycosis and psoriasis? Am J Dermatopathol. 1983;5:501-503.
3. Rippon JW. Medical mycology. In: Wonsiewicz M, ed. The Pathogenic Fungi and the Pathogenic Actinomycetes. 3rd ed. Philadelphia, PA: WB Saunders; 1988:169-275.
4. Greer DL. Evolving role of nondermatophytes in onychomycosis. Int J Dermatol. 1995;34:521-524.
5. Murray SC, Dawber RP. Onychomycosis of toenails: orthopaedic and podiatric considerations. Australas J Dermatol. 2002;43:105-112.
6. Achten G, Wanet-Rouard J. Onychomycoses in the laboratory. Mykosen Suppl. 1978;1:125-127.
7. Sobhanadri C, Rao DT, Babu KS. Clinical and mycological study of superficial fungal infections at Government General Hospital: guntur and their response to treatment with hamycin, dermostatin and dermamycin. Indian J Dermatol Venereol. 1970;36:209-214.
8. Jain S, Sehgal VN. Commentary: onychomycosis: an epidemio-etiologic perspective. Int J Dermatol. 2000;39:100-103.
9. Sehgal VN, Aggarwal AK, Srivastava G, et al. Onychomycosis: a 3 year clinicomycologic hospital-based study. Skinmed. 2007;6:11-17.
10. Elewski BE, Charif MA. Prevalence of onychomycosis in patients attending a dermatology clinic in northeastern Ohio for the other conditions. Arch Dermatol. 1997;133:1172-1173.
11. Scher RK. Onychomycosis is more than a cosmetic problem. Br J Dermatol. 1994;130(suppl 43):S15.
12. Godoy-Martinez PG, Nunes FG, Tomimori-Yamashita J, et al. Onychomycosis in São Paulo, Brazil [published online ahead of print May 8, 2009]. Mycopathologia. 2009;168:111-116.
13. Larone DH. Medically Important Fungi: A Guide to Identification. 4th ed. Washington, DC: American Society for Microbiology Press; 2002.
14. Sehgal VN, Srivastava G, Dogra S, et al. Onychomycosis: an Asian perspective. Skinmed. 2010;8:37-45.
15. Sanjiv A, Shalini M, Charoo H. Etiological agents of onychomycosis from a tertiary care hospital in Central Delhi, India. Indian J Fund Appl Life Science. 2011;1:11-14.
16. Gupta M, Sharma NL, Kanga AK, et al. Onychomycosis: clinic-mycologic study of 130 patients from Himachal Pradesh, India. Indian J Dermatol Venereol Leprol. 2007;73:389-392.
17. Eleweski BE. Diagnostic techniques for confirming onychomycosis. J Am Acad Dermatol. 1996;35(3, pt 2):S6-S9.
18. Das NK, Ghosh P, Das S, et al. A study on the etiological agent and clinico-mycological correlation of fingernail onychomycosis in eastern India. Indian J Dermatol. 2008;53:75-79.
19. Bassiri-Jahromi S, Khaksar AA. Nondermatophytic moulds as a causative agent of onychomycosis in Tehran. Indian J Dermatol. 2010;55:140-143.
20. Bokhari MA, Hussain I, Jahangir M, et al. Onychomycosis in Lahore, Pakistan. Int J Dermatol. 1999;38:591-595.
21. Jesudanam TM, Rao GR, Lakshmi DJ, et al. Onychomycosis: a significant medical problem. Indian J Dermatol Venereol Leprol. 2002;68:326-329.
22. Ahmad M, Gupta S, Gupte S. A clinico-mycological study of onychomycosis. EDOJ. 2010;6:1-9.
23. Vinod S, Grover S, Dash K, et al. A clinico-mycological evaluation of onychomycosis. Indian J Dermatol Venereol Leprol. 2000;66:238-240.
24. Veer P, Patwardhan NS, Damle AS. Study of onychomycosis: prevailing fungi and pattern of infection. Indian J Med Microbiol. 2007;25:53-56.
25. Garg A, Venkatesh V, Singh M, et al. Onychomycosis in central India: a clinicoetiologic correlation. Int J Dermatol. 2004;43:498-502.
26. Adhikari L, Das Gupta A, Pal R, et al. Clinico-etiologic correlates of onychomycosis in Sikkim. Indian J Pathol Microbiol. 2009;52:194-197.
Onychomycosis is a chronic fungal infection of the nails. Dermatophytes are the most common etiologic agents, but yeasts and nondermatophyte molds also constitute a substantial number of cases.1 An accumulation of debris under distorted, deformed, thickened, and discolored nails, particularly with ragged and furrowed edges, strongly suggests tinea unguium.2 Candidal onychomycosis (CO) lacks gross distortion and accumulated detritus and mainly affects fingernails.3 Nondermatophytic molds cause 1.5% to 6% of cases of onychomycosis, mostly seen in toenails of elderly individuals with a history of trauma.4 Onychomycosis affects 5.5% of the world population5 and represents 20% to 40% of all onychopathies and approximately 30% of cutaneous mycotic infections.6
The incidence of onychomycosis ranges from 0.5% to 5% in the general population in India.7 The incidence is particularly high in warm humid climates such as India.8 Researchers have found certain habits of the population in the Indian subcontinent (eg, walking with bare feet, wearing ill-fitting shoes, nail-biting [eg, onychophagia], working with chemicals) to be contributing factors for onychomycosis.9 Several studies have shown that the prevalence of onychomycosis increases with age, possibly due to poor peripheral circulation, diabetes mellitus, repeated nail trauma, prolonged exposure to pathogenic fungi, suboptimal immune function, inactivity, or inability to trim the toenails and care for the feet.10 Nail infection is a cosmetic problem with serious physical and psychological morbidity and also serves as the fungal reservoir for skin infections. Besides destruction and disfigurement of the nail plate, onychomycosis can lead to self-consciousness and impairment of daily functioning.11
Nail dystrophy occurs secondary to various systemic disorders or can be associated with other dermatologic conditions. Nail discoloration and other onychia should be differentiated from onychomycosis by classifying nail lesions as distal lateral subungual onychomycosis, proximal subungual onychomycosis (PSO), CO, white superficial onychomycosis (WSO), and total dystrophic onychomycosis.12 Laboratory investigation is necessary to accurately differentiate between fungal infections and other skin diseases before starting treatment. Our hospital-based study sought to determine the incidence and epidemiology of onychomycosis with an analysis of 134 participants with clinically suspected onychomycosis. We evaluated prevalence based on age, sex, and occupation, as well as the most common pathogens.
Materials and Methods
Study Design and Participants
The study population consisted of 134 patients with clinically suspected onychomycosis who visited the dermatology department at the Veer Chandra Singh Garhwali Government Institute of Medical Sciences and Research Institute in Uttarakhand, India (October 2010 to October 2011). A thorough history was obtained and a detailed examination of the distorted nails was conducted in the microbiology laboratory. Patient history and demographic factors such as age, sex, occupation, and related history of risk factors for onychomycosis were recorded pro forma. Some of the details such as itching, family history of fungal infection, and prior cutaneous infections were recorded. Patients who were undergoing treatment with systemic or topical antifungal agents in the 4 weeks preceding the study period were excluded to rule out false-negative cases and to avoid the influence of antifungal agents on the disease course.
Assessments
Two samples were taken from each patient on different days. Participants were divided into 4 groups based on occupation: farmer, housewife, student, and other (eg, clerk, shopkeeper, painter). Clinical presentation of discoloration, onycholysis, subungual hyperkeratosis, and nail thickening affecting the distal and/or lateral nail plate was defined as distal lateral subungual onychomycosis; discoloration and onycholysis affecting the proximal part of the nail was defined as PSO; association with paronychia and distal and lateral onycholysis was defined as CO; white opaque patches on the nail surface were defined as WSO; and end-stage nail disease was defined as total dystrophic onychomycosis.
Prior to sampling, the nails were cleaned with a 70% alcohol solution. Nail clippings were obtained using presterilized nail clippers and a blunt no. 15 scalpel blade and were placed on sterilized black paper. Each nail sample was divided into 2 parts: one for direct microscopy and one for culture. Nail clippings were subjected to microscopic examination after clearing in 20% potassium hydroxide solution. The slides were examined for fungal hyphae, arthrospores, yeasts, and pseudohyphal forms. Culture was done with Emmons modification of Sabouraud dextrose agar (incubated at 27°C for molds and 37°C for yeasts) as well as with 0.4% chloramphenicol and 5% cycloheximide (incubated at 27°C). Culture tubes were examined daily for the first week and on alternate days thereafter for 4 weeks of incubation.
Dermatophytes were identified based on the colony morphology, growth rate, texture, border, and pigmentation in the obverse and reverse of culture media and microscopic examination using lactophenol cotton blue tease mount. Yeast colonies were identified microscopically with Gram stain, and species were identified by germ tube, carbohydrate assimilation, and fermentation tests.13 Nondermatophyte molds were identified by colony morphology, microscopic examination, and slide culture. Molds were considered as pathogens in the presence of the following criteria: (1) absence of other fungal growth in the same culture tube; (2) presence of mold growth in all 3 samples; and (3) presence of filaments identified on direct examination.
Results
Of 134 clinically suspected cases of onychomycosis, 78 (58.2%) were from fingernails and 56 (41.8%) from toenails. Clinical diagnosis was confirmed in 96 (71.6%) cases by both fungal culture and direct microscopy but was confirmed by direct microscopy alone in only 76 (56.7%) cases. False-negative results were found in 23.9% (32/134) of participants with direct microscopy and 9.0% (12/134) with fungal cultures. The results of direct microscopy and fungal culture are outlined in Table 1. The study included 78 (58.2%) males and 56 (41.8%) females with a mean age of 44 years. Highest prevalence (47.8%) was seen in participants older than 40 years and lowest prevalence (11.9%) in participants younger than 20 years. In total, 32.8% of participants were farmers, 31.3% were housewives, 14.9% were students, and 20.9% performed other occupations. Disease history at the time of first presentation varied from 1 month to more than 2 years; 33.6% of participants had a 1- to 6-month history of disease, while only 3.7% had a disease history of less than 1 month at presentation. The demographic data are further outlined in Table 2.
Distal lateral subungual onychomycosis was the most prevalent clinical pattern found in 66 (49.3%) participants; fungal isolates were found in 60 of these participants. The next most prevalent clinical pattern was PSO, which was found in 34 (25.4%) participants, 12 showing fungal growth. A clinical pattern of CO was noted in 28 (20.9%) participants, 22 showing fungal growth; WSO was noted in 10 (7.5%) participants, 2 showing fungal growth.
Of 96 culture-positive cases, dermatophytes were the most common pathogens isolated in 56 (58.3%) participants, followed by Candida species in 28 (29.2%) participants. Nondermatophyte molds were isolated in 12 (12.5%) participants. The various dermatophytes, Candida species, and nondermatophyte molds that were isolated on fungal culture are outlined in Table 3. Of the 96 participants with positive fungal cultures, 30 (31.2%) were farmers working with soil, 28 (29.2%) were housewives associated with wet work, 16 (16.7%) were students associated with increased physical exercise from extracurricular activity, and 22 (22.9%) were in other occupations (Table 4).
Comment
The term onychomycosis is derived from onyx, the Greek word for nail, and mykes, the Greek word for fungus. Onychomycosis is a chronic mycotic infection of the fingernails and toenails that can have a serious impact on patients’ quality of life. The fungi known to cause onychomycosis vary among geographic areas, primarily due to differences in climate.14 The isolation rate of onychomycosis in our hospital-based study was 71.6%, which is in accordance with various studies in India and abroad, including 60% in Karnataka, India5; 82.3% in Sikkim, India6; and 86.9% in Turkey.1 However, other studies have shown lower isolation rates of 39.5% in Central Delhi, India,15 and 37.6% in Himachal Pradesh, India.16 Some patients with onychomycosis may not seek medical attention, which may explain the difference in the prevalence of onychomycosis observed worldwide.17 The prevalence of onychomycosis by age also varies. In our study, participants older than 40 years showed the highest prevalence (47.8%), which is in accordance with other studies from India18 and abroad.19,20 In contrast, some Indian studies15,21,22 have reported a higher prevalence in younger adults (ie, 21–30 years), which may be attributed to greater self-consciousness about nail discoloration and disfigurement as well as increased physical activity and different shoe-wearing habits. A higher prevalence in older adults, as observed in our study as well some other studies,19,21 may be due to poor peripheral circulation, diabetes mellitus, repeated nail trauma, longer exposure to pathogenic fungi, suboptimal immune function, inactivity, and poor hygiene.10
In our study, suspected onychomycosis was more common in males (58.2%) than in females (41.8%). These results are in accordance with many of the studies in the worldwide literature.1,10,11,15,16,23-25 A higher isolation rate in males worldwide may be due to common use of occlusive footwear, more exposure to outdoor conditions, and increased physical activity, leading to an increased likelihood of trauma. The importance of trauma to the nails as a predisposing factor for onychomycosis is well established.24 In our study, the majority of males wore shoes regardless of occupation. Perspiration of the feet when wearing socks and/or shoes can generate a warm moist environment that promotes the growth of fungi and predisposes patients to onychomycosis. Similar observations have been reported by other investigators.21,22,25,26
The incidence of onychomycosis was almost evenly distributed among farmers, housewives, and the miscellaneous group, whereas a high isolation rate was noted among students. Of 20 students included in our study, onychomycosis was confirmed in 16, which may be related to an increased use of synthetic sports shoes and socks that retain sweat as well as vigorous physical activity frequently resulting in nail injuries among this patient population.11 Younger patients may be more conscious of their appearance and therefore may be more likely to seek treatment. Similar observations have been reported by other researchers.15,21,22
In our study, dermatophytes were the most commonly found pathogens (58.3%), which is comparable to other studies.15,18,22Trichophyton mentagrophytes was the most frequently isolated dermatophyte from cultures, which was in concordance with a study from Delhi.15 In some studies,18,20,22Trichophyton rubrum has been reported as the most prevalent dermatophyte, but we identified Trichophyton rubrum in only 18 participants, which can be attributed to variations in epidemiology based on geographic region. Nondermatophyte molds were isolated in 12.5% of participants, with Aspergillus niger being the most common isolate found in 8 cases. Other isolated species were Alternaria alternata and Fusarium solani found in 2 cases each. Aspergillus niger has been reported in worldwide studies as an important cause of onychomycosis.15,18,19,21,22
In 28 cases (29.2%) involving Candida species, Candida albicans, Candida parapsilosis, and Candida tropicalis were the most common pathogens, respectively, which is in accordance with many studies.15,20-22,25 In 28 cases of CO, females (n=16) were affected more than males (n=12). All of the females were housewives and C albicans was predominantly isolated from the fingernails. Household responsibilities involving kitchen work (eg, cutting and peeling vegetables, washing utensils, cleaning the house/laundry) may chronically expose housewives to moist environments and make them more prone to injury, thus facilitating easy entry of fungal agents.
Distal lateral subungual onychomycosis was the most prevalent clinical type found (n=66), which is comparable to other reports.20,22,25 Proximal subungual onychomycosis was the second most common type; however, a greater incidence has been reported by some researchers,23,24 while others have reported a lower incidence.20,21 Candidial onychomycosis and WSO were not common in our study, and PSO was not associated with any immunodeficiency disease, as reported by other researchers.15,20
Of 134 suspected cases of onychomycosis, 71.6% were confirmed by both direct microscopy and fungal culture, but only 56.7% were confirmed by direct microscopy alone. If we had relied on microscopy with potassium hydroxide only, we would have missed 23.9% of cases. Therefore, nail scrapings should always be subjected to fungal culture as well as direct microscopy, as both are necessary for accurate diagnosis and treatment of onychomycosis. If onychomycosis is not successfully treated, it can act as a reservoir of fungal infection affecting other parts of the body with the potential to pass infection on to others.
Conclusion
Clinical examination alone is not sufficient for diagnosing onychomycosis14,18,20; in many cases of suspected onychomycosis with nail changes, mycologic examination does not confirm fungal infection. In our study, only 71.6% of participants with nail changes proved to be of fungal etiology. Other researchers from different geographic locations have reported similar results with lower incidence (eg, 39.5%,15 37.6%,16 51.7%,18 45.3%21) of fungal etiology in such cases. Therefore, both clinical and mycologic examinations are important for establishing the diagnosis and selecting the most suitable antifungal agent, which is possible only if the underlying pathogen is correctly identified.
1. Yenişehirli G, Bulut Y, Sezer E, et al. Onychomycosis infections in the Middle Black Sea Region, Turkey. Int J Dermatol. 2009;48:956-959.
2. Kouskoukis CE, Scher RK, Ackerman AB. What histologic finding distinguishes onychomycosis and psoriasis? Am J Dermatopathol. 1983;5:501-503.
3. Rippon JW. Medical mycology. In: Wonsiewicz M, ed. The Pathogenic Fungi and the Pathogenic Actinomycetes. 3rd ed. Philadelphia, PA: WB Saunders; 1988:169-275.
4. Greer DL. Evolving role of nondermatophytes in onychomycosis. Int J Dermatol. 1995;34:521-524.
5. Murray SC, Dawber RP. Onychomycosis of toenails: orthopaedic and podiatric considerations. Australas J Dermatol. 2002;43:105-112.
6. Achten G, Wanet-Rouard J. Onychomycoses in the laboratory. Mykosen Suppl. 1978;1:125-127.
7. Sobhanadri C, Rao DT, Babu KS. Clinical and mycological study of superficial fungal infections at Government General Hospital: guntur and their response to treatment with hamycin, dermostatin and dermamycin. Indian J Dermatol Venereol. 1970;36:209-214.
8. Jain S, Sehgal VN. Commentary: onychomycosis: an epidemio-etiologic perspective. Int J Dermatol. 2000;39:100-103.
9. Sehgal VN, Aggarwal AK, Srivastava G, et al. Onychomycosis: a 3 year clinicomycologic hospital-based study. Skinmed. 2007;6:11-17.
10. Elewski BE, Charif MA. Prevalence of onychomycosis in patients attending a dermatology clinic in northeastern Ohio for the other conditions. Arch Dermatol. 1997;133:1172-1173.
11. Scher RK. Onychomycosis is more than a cosmetic problem. Br J Dermatol. 1994;130(suppl 43):S15.
12. Godoy-Martinez PG, Nunes FG, Tomimori-Yamashita J, et al. Onychomycosis in São Paulo, Brazil [published online ahead of print May 8, 2009]. Mycopathologia. 2009;168:111-116.
13. Larone DH. Medically Important Fungi: A Guide to Identification. 4th ed. Washington, DC: American Society for Microbiology Press; 2002.
14. Sehgal VN, Srivastava G, Dogra S, et al. Onychomycosis: an Asian perspective. Skinmed. 2010;8:37-45.
15. Sanjiv A, Shalini M, Charoo H. Etiological agents of onychomycosis from a tertiary care hospital in Central Delhi, India. Indian J Fund Appl Life Science. 2011;1:11-14.
16. Gupta M, Sharma NL, Kanga AK, et al. Onychomycosis: clinic-mycologic study of 130 patients from Himachal Pradesh, India. Indian J Dermatol Venereol Leprol. 2007;73:389-392.
17. Eleweski BE. Diagnostic techniques for confirming onychomycosis. J Am Acad Dermatol. 1996;35(3, pt 2):S6-S9.
18. Das NK, Ghosh P, Das S, et al. A study on the etiological agent and clinico-mycological correlation of fingernail onychomycosis in eastern India. Indian J Dermatol. 2008;53:75-79.
19. Bassiri-Jahromi S, Khaksar AA. Nondermatophytic moulds as a causative agent of onychomycosis in Tehran. Indian J Dermatol. 2010;55:140-143.
20. Bokhari MA, Hussain I, Jahangir M, et al. Onychomycosis in Lahore, Pakistan. Int J Dermatol. 1999;38:591-595.
21. Jesudanam TM, Rao GR, Lakshmi DJ, et al. Onychomycosis: a significant medical problem. Indian J Dermatol Venereol Leprol. 2002;68:326-329.
22. Ahmad M, Gupta S, Gupte S. A clinico-mycological study of onychomycosis. EDOJ. 2010;6:1-9.
23. Vinod S, Grover S, Dash K, et al. A clinico-mycological evaluation of onychomycosis. Indian J Dermatol Venereol Leprol. 2000;66:238-240.
24. Veer P, Patwardhan NS, Damle AS. Study of onychomycosis: prevailing fungi and pattern of infection. Indian J Med Microbiol. 2007;25:53-56.
25. Garg A, Venkatesh V, Singh M, et al. Onychomycosis in central India: a clinicoetiologic correlation. Int J Dermatol. 2004;43:498-502.
26. Adhikari L, Das Gupta A, Pal R, et al. Clinico-etiologic correlates of onychomycosis in Sikkim. Indian J Pathol Microbiol. 2009;52:194-197.
Practice Points
- Onychomycosis is a chronic fungal infection of the nails and represents 20% to 40% of all onycho-pathies worldwide.
- Apart from dermatophytes as etiologic agents, nondermatophyte molds and yeasts also can contribute to the disease.
- Categorization of onychomycosis clinically as well as mycologically will surely ensure better patient care.
- Avoiding certain habits (eg, walking with bare feet, wearing ill-fitting shoes, onychophagia) can decrease disease incidence.

Medication Warnings for Adults
Many computerized provider order entry (CPOE) systems suffer from having too much of a good thing. Few would question the beneficial effect of CPOE on medication order clarity, completeness, and transmission.[1, 2] When mechanisms for basic decision support have been added, however, such as allergy, interaction, and duplicate warnings, reductions in medication errors and adverse events have not been consistently achieved.[3, 4, 5, 6, 7] This is likely due in part to the fact that ordering providers override medication warnings at staggeringly high rates.[8, 9] Clinicians acknowledge that they are ignoring potentially valuable warnings,[10, 11] but suffer from alert fatigue due to the sheer number of messages, many of them judged by clinicians to be of low‐value.[11, 12]
Redesign of medication alert systems to increase their signal‐to‐noise ratio is badly needed,[13, 14, 15, 16] and will need to consider the clinical significance of alerts, their presentation, and context‐specific factors that potentially contribute to warning effectiveness.[17, 18, 19] Relatively few studies, however, have objectively looked at context factors such as the characteristics of providers, patients, medications, and warnings that are associated with provider responses to warnings,[9, 20, 21, 22, 23, 24, 25] and only 2 have studied how warning acceptance is associated with medication risk.[18, 26] We wished to explore these factors further. Warning acceptance has been shown to be higher, at least in the outpatient setting, when orders are entered by low‐volume prescribers for infrequently encountered warnings,[24] and there is some evidence that patients receive higher‐quality care during the day.[27] Significant attention has been placed in recent years on inappropriate prescribing in older patients,[28] and on creating a culture of safety in healthcare.[29] We therefore hypothesized that our providers would be more cautious, and medication warning acceptance rates would be higher, when orders were entered for patients who were older or with more complex medical problems, when they were entered during the day by caregivers who entered few orders, when the medications ordered were potentially associated with greater risk, and when the warnings themselves were infrequently encountered.
METHODS
Setting and Caregivers
Johns Hopkins Bayview Medical Center (JHBMC) is a 400‐bed academic medical center serving southeastern Baltimore, Maryland. Prescribing caregivers include residents and fellows who rotate to both JHBMC and Johns Hopkins Hospital, internal medicine hospitalists, other attending physicians (including teaching attendings for all departments, and hospitalists and clinical associates for departments other than internal medicine), and nurse practitioners and physician assistants from most JHBMC departments. Nearly 100% of patients on the surgery, obstetrics/gynecology, neurology, psychiatry, and chemical dependence services are hospitalized on units dedicated to their respective specialty, and the same is true for approximately 95% of medicine patients.
Order Entry
JHBMC began using a client‐server order entry system by MEDITECH (Westwood, MA) in July 2003. Provider order entry was phased in beginning in October 2003 and completed by the end of 2004. MEDITECH version 5.64 was being used during the study period. Medications may generate duplicate, interaction, allergy, adverse reaction, and dose warnings during a patient ordering session each time they are ordered. Duplicate warnings are generated when the same medication (no matter what route) is ordered that is either on their active medication list, was on the list in the preceding 24 hours, or that is being ordered simultaneously. A drug‐interaction database licensed from First DataBank (South San Francisco, CA) is utilized, and updated monthly, which classifies potential drug‐drug interactions as contraindicated, severe, intermediate, and mild. Those classified as contraindicated by First DataBank are included in the severe category in MEDITECH 5.64. During the study period, JHBMC's version of MEDITECH was configured so that providers were warned of potential severe and intermediate drug‐drug interactions, but not mild. No other customizations had been made. Patients' histories of allergies and other adverse responses to medications can be entered by any credentialed staff member. They are maintained together in an allergies section of the electronic medical record, but are identified as either allergy or adverse reactions at the time they are entered, and each generates its own warnings.
When more than 1 duplicate, interaction, allergy, or adverse reaction warning is generated for a particular medication, all appear listed on a single screen in identical fonts. No visual distinction is made between severe and intermediate drug‐drug interactions; for these, the category of medication ordered is followed by the category of the medication for which there is a potential interaction. A details button can be selected to learn specifically which medications are involved and the severity and nature of the potential interactions identified. In response to the warnings, providers can choose to either override them, erase the order, or replace the order by clicking 1 of 3 buttons at the bottom of the screen. Warnings are not repeated unless the medication is reordered for that patient. Dose warnings appear on a subsequent screen and are not addressed in this article.
Nurses are discouraged from entering verbal orders but do have the capacity to do so, at which time they encounter and must respond to the standard medication warnings, if any. Medical students are able to enter orders, at which time they also encounter and must respond to the standard medication warnings; their orders must then be cosigned by a licensed provider before they can be processed. Warnings encountered by nurses and medical students are not repeated at the time of cosignature by a licensed provider.
Data Collection
We collected data regarding all medication orders placed in our CPOE system from October 1, 2009 to April 20, 2010 for all adult patients. Intensive care unit (ICU) patients were excluded, in anticipation of a separate analysis. Hospitalizations under observation were also excluded. We then ran a report showing all medications that generated any number of warnings of any type (duplicate, interaction, allergy, or adverse reaction) for the same population. Warnings generated during readmissions that occurred at any point during the study period (ranging from 1 to 21 times) were excluded, because these patients likely had many, if not all, of the same medications ordered during their readmissions as during their initial hospitalization, which would unduly influence the analysis if retained.
There was wide variation in the number of warnings generated per medication and in the number of each warning type per medication that generated multiple warnings. Therefore, for ease of analysis and to ensure that we could accurately determine varying response to each individual warning type, we thereafter focused on the medications that generated single warnings during the study period. For each single warning we obtained patient name, account number, event date and time, hospital unit at the time of the event, ordered medication, ordering staff member, warning type, and staff member response to the warning (eg, override warning or erase order [accept the warning]). The response replace was used very infrequently, and therefore warnings that resulted in this response were excluded. Medications available in more than 1 form included the route of administration in their name, and from this they were categorized as parenteral or nonparenteral. All nonparenteral or parenteral forms of a given medication were grouped together as 1 medication (eg, morphine sustained release and morphine elixir were classified as a single‐medication, nonparenteral morphine). Medications were further categorized according to whether or not they were on the Institute for Safe Medication Practice (ISMP) List of High‐Alert Medications.[30]
The study was approved by the Johns Hopkins Institutional Review Board.
Analysis
We collected descriptive data about patients and providers. Age and length of stay (LOS) at the time of the event were determined based on the patients' admit date and date of birth, and grouped into quartiles. Hospital units were grouped according to which service or services they primarily served. Medications were grouped into quartiles according to the total number of warnings they generated during the study period. Warnings were dichotomously categorized according to whether they were overridden or accepted. Unpaired t tests were used to compare continuous variables for the 2 groups, and [2] tests were used to compare categorical variables. A multivariate logistic regression was then performed, using variables with a P value of <0.10 in the univariate analysis, to control for confounders and identify independent predictors of medication warning acceptance. All analyses were performed using Intercooled Stata 12 (StataCorp, College Station, TX).
RESULTS
A total of 259,656 medication orders were placed for adult non‐ICU patients during the 7‐month study period. Of those orders, 45,835 generated some number of medication warnings.[1, 2, 3, 4, 5, 6, 7, 8, 9, 10, 11, 12, 13, 14, 15, 16, 17, 18, 19, 20] The median number of warnings per patient was 4 (interquartile range [IQR]=28; mean=5.9, standard deviation [SD]=6.2), with a range from 1 to 84. The median number of warnings generated per provider during the study period was 36 (IQR=6106, mean=87.4, SD=133.7), with a range of 1 to 1096.
There were 40,391 orders placed for 454 medications for adult non‐ICU patients, which generated a single‐medication warning (excluding those with the response replace, which was used 20 times) during the 7‐month study period. Data regarding the patients and providers associated with the orders generating single warnings are shown in Table 1. Most patients were on medicine units, and most orders were entered by residents. Patients' LOS at the time the orders were placed ranged from 0 to 118 days (median=1, IQR=04; mean=4.0, SD=7.2). The median number of single warnings per patient was 4 (IQR=28; mean=6.1, SD=6.5), with a range from 1 to 84. The median number of single warnings generated per provider during the study period was 15 (IQR=373; mean=61.7, SD=109.6), with a range of 1 to 1057.
| No. (%) | |
|---|---|
| |
| Patients (N=6,646) | |
| Age | |
| 1545 years | 2,048 (31%) |
| 4657 years | 1,610 (24%) |
| 5872 years | 1,520 (23%) |
| 73104 years | 1,468 (22%) |
| Gender | |
| Male | 2,934 (44%) |
| Hospital unita | |
| Medicine | 2,992 (45%) |
| Surgery | 1,836 (28%) |
| Neuro/psych/chem dep | 1,337 (20%) |
| OB/GYN | 481 (7%) |
| Caregivers (N=655) | |
| Resident | 248 (38%)b |
| Nurse | 154 (24%) |
| Attending or other | 97 (15%) |
| NP/PA | 69 (11%) |
| IM hospitalist | 31 (5%) |
| Fellow | 27 (4%) |
| Medical student | 23 (4%) |
| Pharmacist | 6 (1%) |
Patient and caregiver characteristics for the medication orders that generated single warnings are shown in Table 2. The majority of medications were nonparenteral and not on the ISMP list (Table 3). Most warnings generated were either duplicate (47%) or interaction warnings (47%). Warnings of a particular type were repeated 14.5% of the time for a particular medication and patient (from 2 to 24 times, median=2, IQR=22, mean=2.7, SD=1.4), and 9.8% of the time for a particular caregiver, medication, and patient (from 2 to 18 times, median=2, IQR=22, mean=2.4, SD=1.1).
| Variable | No. of Warnings (%)a | No. of Warnings Accepted (%)a | P |
|---|---|---|---|
| |||
| Patient age | |||
| 1545 years | 10,881 (27) | 602 (5.5%) | <0.001 |
| 4657 years | 9,733 (24) | 382 (3.9%) | |
| 5872 years | 10,000 (25) | 308 (3.1%) | |
| 73104 years | 9,777 (24) | 262 (2.7%) | |
| Patient gender | |||
| Female | 23,395 (58) | 866 (3.7%) | 0.074 |
| Male | 16,996 (42) | 688 (4.1%) | |
| Patient length of stay | |||
| <1 day | 10,721 (27) | 660 (6.2%) | <0.001 |
| 1 day | 10,854 (27) | 385 (3.5%) | |
| 24 days | 10,424 (26) | 277 (2.7%) | |
| 5118 days | 8,392 (21) | 232 (2.8%) | |
| Patient hospital unit | |||
| Medicine | 20,057 (50) | 519 (2.6%) | <0.001 |
| Surgery | 10,274 (25) | 477 (4.6%) | |
| Neuro/psych/chem dep | 8,279 (21) | 417 (5.0%) | |
| OB/GYN | 1,781 (4) | 141 (7.9%) | |
| Ordering caregiver | |||
| Resident | 22,523 (56) | 700 (3.1%) | <0.001 |
| NP/PA | 7,534 (19) | 369 (4.9%) | |
| IM hospitalist | 5,048 (13) | 155 (3.1%) | |
| Attending | 3225 (8) | 219 (6.8%) | |
| Fellow | 910 (2) | 34 (3.7%) | |
| Nurse | 865 (2) | 58 (6.7%) | |
| Medical student | 265 (<1) | 17 (6.4%) | |
| Pharmacist | 21 (<1) | 2 (9.5%) | |
| Day ordered | |||
| Weekday | 31,499 (78%) | 1276 (4.1%) | <0.001 |
| Weekend | 8,892 (22%) | 278 (3.1%) | |
| Time ordered | |||
| 00000559 | 4,231 (11%) | 117 (2.8%) | <0.001 |
| 06001159 | 11,696 (29%) | 348 (3.0%) | |
| 12001759 | 15,879 (39%) | 722 (4.6%) | |
| 18002359 | 8,585 (21%) | 367 (4.3%) | |
| Administration route (no. of meds) | |||
| Nonparenteral (339) | 27,086 (67%) | 956 (3.5%) | <0.001 |
| Parenteral (115) | 13,305 (33%) | 598 (4.5%) | |
| ISMP List of High‐Alert Medications status (no. of meds)[30] | |||
| Not on ISMP list (394) | 27,503 (68%) | 1251 (4.5%) | <0.001 |
| On ISMP list (60) | 12,888 (32%) | 303 (2.4%) | |
| No. of warnings per med (no. of meds) | |||
| 11062133 (7) | 9,869 (24%) | 191 (1.9%) | <0.001 |
| 4681034 (13) | 10,014 (25%) | 331 (3.3%) | |
| 170444 (40) | 10,182 (25%) | 314 (3.1%) | |
| 1169 (394) | 10,326 (26%) | 718 (7.0%) | |
| Warning type (no. of meds)b | |||
| Duplicate (369) | 19,083 (47%) | 1041 (5.5%) | <0.001 |
| Interaction (315) | 18,894 (47%) | 254 (1.3%) | |
| Allergy (138) | 2,371 (6%) | 243 (10.0%) | |
| Adverse reaction (14) | 43 (0.1%) | 16 (37%) | |
| Variable | Adjusted OR | 95% CI |
|---|---|---|
| ||
| Patient age | ||
| 1545 years | 1.00 | Reference |
| 4657 years | 0.89 | 0.771.02 |
| 5872 years | 0.85 | 0.730.99 |
| 73104 years | 0.91 | 0.771.08 |
| Patient gender | ||
| Female | 1.00 | Reference |
| Male | 1.26 | 1.131.41 |
| Patient length of stay | ||
| <1 day | 1.00 | Reference |
| 1 day | 0.65 | 0.550.76 |
| 24 days | 0.49 | 0.420.58 |
| 5118 days | 0.49 | 0.410.58 |
| Patient hospital unit | ||
| Medicine | 1.00 | Reference |
| Surgery | 1.45 | 1.251.68 |
| Neuro/psych/chem dep | 1.35 | 1.151.58 |
| OB/GYN | 2.43 | 1.923.08 |
| Ordering caregiver | ||
| Resident | 1.00 | Reference |
| NP/PA | 1.63 | 1.421.88 |
| IM hospitalist | 1.24 | 1.021.50 |
| Attending | 1.83 | 1.542.18 |
| Fellow | 1.41 | 0.982.03 |
| Nurse | 1.92 | 1.442.57 |
| Medical student | 1.17 | 0.701.95 |
| Pharmacist | 3.08 | 0.6714.03 |
| Medication factors | ||
| Nonparenteral | 1.00 | Reference |
| Parenteral | 1.79 | 1.592.03 |
| HighAlert Medication status (no. of meds)[30] | ||
| Not on ISMP list | 1.00 | Reference |
| On ISMP list | 0.37 | 0.320.43 |
| No. of warnings per medication | ||
| 11062133 | 1.00 | Reference |
| 4681034 | 2.30 | 1.902.79 |
| 170444 | 2.25 | 1.852.73 |
| 1169 | 4.10 | 3.424.92 |
| Warning type | ||
| Duplicate | 1.00 | Reference |
| Interaction | 0.24 | 0.210.28 |
| Allergy | 2.28 | 1.942.68 |
| Adverse reaction | 9.24 | 4.5218.90 |
One thousand five hundred fifty‐four warnings were erased (ie, accepted by clinicians [4%]). In univariate analysis, only patient gender was not associated with warning acceptance. Patient age, LOS, hospital unit at the time of order entry, ordering caregiver type, day and time the medication was ordered, administration route, presence on the ISMP list, warning frequency, and warning type were all significantly associated with warning acceptance (Table 2).
Older patient age, longer LOS, presence of the medication on the ISMP list, and interaction warning type were all negatively associated with warning acceptance in multivariable analysis. Warning acceptance was positively associated with male patient gender, being on a service other than medicine, being a caregiver other than a resident, parenteral medications, lower warning frequency, and allergy or adverse reaction warning types (Table 3).
The 20 medications that generated the most single warnings are shown in Table 4. Medications on the ISMP list accounted for 8 of these top 20 medications. For most of them, duplicate and interaction warnings accounted for most of the warnings generated, except for parenteral hydromorphone, oral oxycodone, parenteral morphine, and oral hydromorphone, which each had more allergy than interaction warnings.
| Medication | ISMP Listb | No. of Warnings | Duplicate, No. (%)c | Interaction, No. (%)c | Allergy, No. (%)c | Adverse Reaction, No. (%)c |
|---|---|---|---|---|---|---|
| ||||||
| Hydromorphone injectable | Yes | 2,133 | 1,584 (74.3) | 127 (6.0) | 422 (19.8) | |
| Metoprolol | 1,432 | 550 (38.4) | 870 (60.8) | 12 (0.8) | ||
| Aspirin | 1,375 | 212 (15.4) | 1,096 (79.7) | 67 (4.9) | ||
| Oxycodone | Yes | 1,360 | 987 (72.6) | 364 (26.8) | 9 (0.7) | |
| Potassium chloride | 1,296 | 379 (29.2) | 917 (70.8) | |||
| Ondansetron injectable | 1,167 | 1,013 (86.8) | 153 (13.1) | 1 (0.1) | ||
| Aspart insulin injectable | Yes | 1,106 | 643 (58.1) | 463 (41.9) | ||
| Warfarin | Yes | 1,034 | 298 (28.8) | 736 (71.2) | ||
| Heparin injectable | Yes | 1,030 | 205 (19.9) | 816 (79.2) | 9 (0.3) | |
| Furosemide injectable | 980 | 438 (45.0) | 542 (55.3) | |||
| Lisinopril | 926 | 225 (24.3) | 698 (75.4) | 3 (0.3) | ||
| Acetaminophen | 860 | 686 (79.8) | 118 (13.7) | 54 (6.3) | 2 (0.2) | |
| Morphine injectable | Yes | 804 | 467 (58.1) | 100 (12.4) | 233 (29.0) | 4 (0.5) |
| Diazepam | 786 | 731 (93.0) | 41 (5.2) | 14 (1.8) | ||
| Glargine insulin injectable | Yes | 746 | 268 (35.9) | 478 (64.1) | ||
| Ibuprofen | 713 | 125 (17.5) | 529 (74.2) | 54 (7.6) | 5 (0.7) | |
| Hydromorphone | Yes | 594 | 372 (62.6) | 31 (5.2) | 187 (31.5) | 4 (0.7) |
| Furosemide | 586 | 273 (46.6) | 312 (53.2) | 1 (0.2) | ||
| Ketorolac injectable | 487 | 39 (8.0) | 423 (86.9) | 23 (4.7) | 2 (0.4) | |
| Prednisone | 468 | 166 (35.5) | 297 (63.5) | 5 (1.1) | ||
DISCUSSION
Medication warnings in our study were frequently overridden, particularly when encountered by residents, for patients with a long LOS and on the internal medicine service, and for medications generating the most warnings and on the ISMP list. Disturbingly, this means that potentially important warnings for medications with the highest potential for causing harm, for possibly the sickest and most complex patients, were those that were most often ignored by young physicians in training who should have had the most to gain from them. Of course, this is not entirely surprising. Despite our hope that a culture of safety would influence young physicians' actions when caring for these patients and prescribing these medications, these patients and medications are those for whom the most warnings are generated, and these physicians are the ones entering the most orders. Only 13% of the medications studied were on the ISMP list, but they generated 32% of the warnings. We controlled for number of warnings and ISMP list status, but not for warning validity. Most likely, high‐risk medications have been set up with more warnings, many of them of lower quality, in an errant but well‐intentioned effort to make them safer. If developers of CPOE systems want to gain serious traction in using decision support to promote prescribing safe medications, they must take substantial action to increase attention to important warnings and decrease the number of clinically insignificant, low‐value warnings encountered by active caregivers on a daily basis.
Only 2 prior studies, both by Seidling et al., have specifically looked at provider response to warnings for high risk medications. Interaction warnings were rarely accepted in 1,[18] as in our study; however, in contrast to our findings, warning acceptance in both studies was higher for drugs with dose‐dependent toxicity.[18, 26] The effect of physician experience on warning acceptance has been addressed in 2 prior studies. In Weingart et al., residents were more likely than staff physicians to erase medication orders when presented with allergy and interaction warnings in a primary care setting.[20] Long et al. found that physicians younger than 40 years were less likely than older physicians to accept duplicate warnings, but those who had been at the study hospital for a longer period of time were more likely to accept them.[23] The influence of patient LOS and service on warning acceptance has not previously been described. Further study is needed looking at each of these factors.
Individual hospitals tend to avoid making modifications to order entry warning systems, because monitoring and maintaining these changes is labor intensive. Some institutions may make the decision to turn off certain categories of alerts, such as intermediate interaction warnings, to minimize the noise their providers encounter. There are even tools for disabling individual alerts or groups of alerts, such as that available for purchase from our interaction database vendor.[31] However, institutions may fear litigation should an adverse event be attributed to a disabled warning.[15, 16] Clearly, a comprehensive, health system‐wide approach is warranted.[13, 15] To date, published efforts describing ways to improve the effectiveness of medication warning systems have focused on either heightening the clinical significance of alerts[14, 21, 22, 32, 33, 34, 35, 36] or altering their presentation and how providers experience them.[21, 36, 37, 38, 39, 40, 41, 42, 43] The single medication warnings our providers receive are all presented in an identical font, and presumably response to each would be different if they were better distinguished from each other. We also found that a small but significant number of warnings were repeated for a given patient and even a given provider. If the providers knew they would only be presented with warnings the first time they occurred for a given patient and medication, they might be more attuned to the remaining warnings. Previous studies describe context‐specific decision support for medication ordering[44, 45, 46]; however, only 1 has described the use of patient context factors to modify when or how warnings are presented to providers.[47] None have described tailoring allergy, duplicate, and interaction warnings according to medication or provider types. If further study confirms our findings, modulating basic warning systems according to severity of illness, provider experience, and medication risk could powerfully increase their effectiveness. Of course, this would be extremely challenging to achieve, and is likely outside the capabilities of most, if not all, CPOE systems, at least for now.
Our study has some limitations. First, it was limited to medications that generated a single warning. We did this for ease of analysis and so that we could ensure understanding of provider response to each warning type without bias from simultaneously occurring warnings; however, caregiver response to multiple warnings appearing simultaneously for a particular medication order might be quite different. Second, we did not include any assessment of the number of medications ordered by each provider type or for each patient, either of which could significantly affect provider response to warnings. Third, as previously noted, we did not include any assessment of the validity of the warnings, beyond the 4 main categories described, which could also significantly affect provider response. However, it should be noted that although the validity of interaction warnings varies significantly from 1 medication to another, the validity of duplicate, allergy, and adverse reaction warnings in the described system are essentially the same for all medications. Fourth, it is possible that providers did modify or even erase their orders even after selecting override in response to the warning; it is also possible that providers reentered the same order after choosing erase. Unfortunately auditing for actions such as these would be extremely laborious. Finally, the study was conducted at a single medical center using a single order‐entry system. The system in use at our medical center is in use at one‐third of the 6000 hospitals in the United States, though certainly not all are using our version. Even if a hospital was using the same CPOE version and interaction database as our institution, variations in patient population and local decisions modifying how the database interacts with the warning presentation system might affect reproducibility at that institution.
Commonly encountered medication warnings are overridden at extremely high rates, and in our study this was particularly so for medications on the ISMP list, when ordered by physicians in training. Warnings of little clinical significance must be identified and eliminated, the most important warnings need to be visually distinct to increase user attention, and further research should be done into the patient, provider, setting, and medication factors that affect user responses to warnings, so that they may be customized accordingly and their significance increased. Doing so will enable us to reap the maximum possible potential from our CPOE systems, and increase the CPOE's power to protect our most vulnerable patients from our most dangerous medications, particularly when cared for by our most inexperienced physicians.
Acknowledgements
The authors thank, in particular, Scott Carey, Research Informatics Manager, for assistance with data collection. Additional thanks go to Olga Sherman and Kathleen Ancinich for assistance with data collection and management.
Disclosures: This research was supported in part by the Johns Hopkins Institute for Clinical and Translational Research. All listed authors contributed substantially to the study conception and design, analysis and interpretation of data, drafting the article or revising it critically for important intellectual content, and final approval of the version to be published. No one who fulfills these criteria has been excluded from authorship. This research received no specific grant from any funding agency in the public, commercial, or not‐for‐profit sectors. The authors have no competing interests to declare.
- , , , et al., Effect of computerized physician order entry and a team intervention on prevention of serious medication errors. JAMA. 1998;280:1311–1316.
- , , , , , . Effects of computerized provider order entry on prescribing practices. Arch Intern Med. 2000;160:2741–2747.
- , , , et al. Effects of computerized clinician decision support systems on practitioner performance and patient outcomes: a systematic review. JAMA. 2005;293:1223–1238.
- , , , et al. The effect of computerized physician order entry with clinical decision support on the rates of adverse drug events: a systematic review. J Gen Intern Med. 2008;23:451–458.
- , , . The impact of computerized physician medication order entry in hospitalized patients—a systematic review. Int J Med Inform. 2008;77:365–376.
- , , , et al. What evidence supports the use of computerized alerts and prompts to improve clinicians' prescribing behavior? J Am Med Inform Assoc. 2009;16:531–538.
- , , , , . Does computerized provider order entry reduce prescribing errors for hospital inpatients? A systematic review. J Am Med Inform Assoc. 2009;16:613–623.
- , , , . Overriding of drug safety alerts in computerized physician order entry. J Am Med Inform Assoc. 2006;13:138–147.
- , , , , , . Evaluating clinical decision support systems: monitoring CPOE order check override rates in the Department of Veterans Affairs' Computerized Patient Record System. J Am Med Inform Assoc. 2008;15:620–626.
- , , . GPs' views on computerized drug interaction alerts: questionnaire survey. J Clin Pharm Ther. 2002;27:377–382.
- , , , et al. Clinicians' assessments of electronic medication safety alerts in ambulatory care. Arch Intern Med. 2009;169:1627–1632.
- , , , , . A mixed method study of the merits of e‐prescribing drug alerts in primary care. J Gen Intern Med. 2008;23:442–446.
- . CPOE and clinical decision support in hospitals: getting the benefits: comment on “Unintended effects of a computerized physician order entry nearly hard‐stop alert to prevent a drug interaction.” Arch Intern Med. 2010;170:1583–1584.
- , , . Critical drug‐drug interactions for use in electronic health records systems with computerized physician order entry: review of leading approaches. J Patient Saf. 2011;7:61–65.
- , , , , . Clinical decision support systems could be modified to reduce 'alert fatigue' while still minimizing the risk of litigation. Health Aff (Millwood). 2011;30:2310–2317.
- , , , . Critical issues associated with drug‐drug interactions: highlights of a multistakeholder conference. Am J Health Syst Pharm. 2011;68:941–946.
- , , , , , . Development of a context model to prioritize drug safety alerts in CPOE systems. BMC Med Inform Decis Mak. 2011;11:35.
- , , , et al. Factors influencing alert acceptance: a novel approach for predicting the success of clinical decision support. J Am Med Inform Assoc. 2011;18:479–484.
- , , , . How to improve the delivery of medication alerts within computerized physician order entry systems: an international Delphi study. J Am Med Inform Assoc. 2011;18:760–766.
- , , , , , . Physicians' decisions to override computerized drug alerts in primary care. Arch Intern Med. 2003;163:2625–2631.
- , , , et al. Improving acceptance of computerized prescribing alerts in ambulatory care. J Am Med Inform Assoc. 2006;13:5–11.
- , , , . Optimizing the acceptance of medication‐based alerts by physicians during CPOE implementation in a community hospital environment. AMIA Annu Symp Proc. 2007:701–705.
- , , , . The use of a CPOE log for the analysis of physicians' behavior when responding to drug‐duplication reminders. Int J Med Inform. 2008;77:499–506.
- , , , et al. Overrides of medication alerts in ambulatory care. Arch Intern Med. 2009;169:305–311.
- , , , , , . Drug safety alert generation and overriding in a large Dutch university medical centre. Pharmacoepidemiol Drug Saf. 2009;18:941–947.
- , , , et al. Patient‐specific electronic decision support reduces prescription of excessive doses. Qual Saf Health Care. 2010;19:e15.
- , , , et al. Survival from in‐hospital cardiac arrest during nights and weekends. JAMA. 2008;299:785–792.
- , . Managing medications in clinically complex elders: “There's got to be a happy medium.” JAMA. 2010;304:1592–1601.
- Agency for Healthcare Research and Quality. Safety culture. Available at: http://psnet.ahrq.gov/primer.aspx?primerID=5. Accessed October 29, 2013.
- Institute for Safe Medication Practice. List of High‐Alert Medications. Available at: http://www.ismp.org/Tools/highalertmedications.pdf. Accessed June 18, 2013.
- First Databank. FDB AlertSpace. Available at: http://www.fdbhealth.com/solutions/fdb‐alertspace. Accessed July 3, 2014.
- , , , et al. Improving allergy alerting in a computerized physician order entry system. Proc AMIA Symp. 2000:2–6.
- , , , , , . A clinical data warehouse‐based process for refining medication orders alerts. J Am Med Inform Assoc. 2012;19:782–785.
- , , , et al. Drug‐drug interactions that should be non‐interruptive in order to reduce alert fatigue in electronic health records. J Am Med Inform Assoc. 2013;20:489–493.
- , , , et al. High‐priority drug‐drug interactions for use in electronic health records. J Am Med Inform Assoc. 2012;19:735–743.
- , , , , . Design of decision support interventions for medication prescribing. Int J Med Inform. 2013;82:492–503.
- , , , et al. A randomized trial of the effectiveness of on‐demand versus computer‐triggered drug decision support in primary care. J Am Med Inform Assoc. 2008;15:430–438.
- , , , et al. Tiering drug‐drug interaction alerts by severity increases compliance rates. J Am Med Inform Assoc. 2009;16:40–46.
- , , , et al. A review of human factors principles for the design and implementation of medication safety alerts in clinical information systems. J Am Med Inform Assoc. 2010;17:493–501.
- , , , et al. Unintended effects of a computerized physician order entry nearly hard‐stop alert to prevent a drug interaction: a randomized controlled trial. Arch Intern Med. 2010;170:1578–1583.
- , , , , , . Randomized clinical trial of a customized electronic alert requiring an affirmative response compared to a control group receiving a commercial passive CPOE alert: NSAID—warfarin co‐prescribing as a test case. J Am Med Inform Assoc. 2010;17:411–415.
- , , , , . Making electronic prescribing alerts more effective: scenario‐based experimental study in junior doctors. J Am Med Inform Assoc. 2011;18:789–798.
- , , , et al. Development and preliminary evidence for the validity of an instrument assessing implementation of human‐factors principles in medication‐related decision‐support systems—I‐MeDeSA. J Am Med Inform Assoc. 2011;18(suppl 1):i62–i72.
- , , , et al. Medication‐related clinical decision support in computerized provider order entry systems: a review. J Am Med Inform Assoc. 2007;14:29–40.
- , , , et al. Physicians' perceptions on the usefulness of contextual information for prioritizing and presenting alerts in Computerized Physician Order Entry systems. BMC Med Inform Decis Mak. 2012;12:111.
- , , , et al. Computerized clinical decision support systems for drug prescribing and management: a decision‐maker‐researcher partnership systematic review. Implement Sci. 2011;6:89.
- , . A successful model and visual design for creating context‐aware drug‐drug interaction alerts. AMIA Annu Symp Proc. 2011;2011:339–348.
Many computerized provider order entry (CPOE) systems suffer from having too much of a good thing. Few would question the beneficial effect of CPOE on medication order clarity, completeness, and transmission.[1, 2] When mechanisms for basic decision support have been added, however, such as allergy, interaction, and duplicate warnings, reductions in medication errors and adverse events have not been consistently achieved.[3, 4, 5, 6, 7] This is likely due in part to the fact that ordering providers override medication warnings at staggeringly high rates.[8, 9] Clinicians acknowledge that they are ignoring potentially valuable warnings,[10, 11] but suffer from alert fatigue due to the sheer number of messages, many of them judged by clinicians to be of low‐value.[11, 12]
Redesign of medication alert systems to increase their signal‐to‐noise ratio is badly needed,[13, 14, 15, 16] and will need to consider the clinical significance of alerts, their presentation, and context‐specific factors that potentially contribute to warning effectiveness.[17, 18, 19] Relatively few studies, however, have objectively looked at context factors such as the characteristics of providers, patients, medications, and warnings that are associated with provider responses to warnings,[9, 20, 21, 22, 23, 24, 25] and only 2 have studied how warning acceptance is associated with medication risk.[18, 26] We wished to explore these factors further. Warning acceptance has been shown to be higher, at least in the outpatient setting, when orders are entered by low‐volume prescribers for infrequently encountered warnings,[24] and there is some evidence that patients receive higher‐quality care during the day.[27] Significant attention has been placed in recent years on inappropriate prescribing in older patients,[28] and on creating a culture of safety in healthcare.[29] We therefore hypothesized that our providers would be more cautious, and medication warning acceptance rates would be higher, when orders were entered for patients who were older or with more complex medical problems, when they were entered during the day by caregivers who entered few orders, when the medications ordered were potentially associated with greater risk, and when the warnings themselves were infrequently encountered.
METHODS
Setting and Caregivers
Johns Hopkins Bayview Medical Center (JHBMC) is a 400‐bed academic medical center serving southeastern Baltimore, Maryland. Prescribing caregivers include residents and fellows who rotate to both JHBMC and Johns Hopkins Hospital, internal medicine hospitalists, other attending physicians (including teaching attendings for all departments, and hospitalists and clinical associates for departments other than internal medicine), and nurse practitioners and physician assistants from most JHBMC departments. Nearly 100% of patients on the surgery, obstetrics/gynecology, neurology, psychiatry, and chemical dependence services are hospitalized on units dedicated to their respective specialty, and the same is true for approximately 95% of medicine patients.
Order Entry
JHBMC began using a client‐server order entry system by MEDITECH (Westwood, MA) in July 2003. Provider order entry was phased in beginning in October 2003 and completed by the end of 2004. MEDITECH version 5.64 was being used during the study period. Medications may generate duplicate, interaction, allergy, adverse reaction, and dose warnings during a patient ordering session each time they are ordered. Duplicate warnings are generated when the same medication (no matter what route) is ordered that is either on their active medication list, was on the list in the preceding 24 hours, or that is being ordered simultaneously. A drug‐interaction database licensed from First DataBank (South San Francisco, CA) is utilized, and updated monthly, which classifies potential drug‐drug interactions as contraindicated, severe, intermediate, and mild. Those classified as contraindicated by First DataBank are included in the severe category in MEDITECH 5.64. During the study period, JHBMC's version of MEDITECH was configured so that providers were warned of potential severe and intermediate drug‐drug interactions, but not mild. No other customizations had been made. Patients' histories of allergies and other adverse responses to medications can be entered by any credentialed staff member. They are maintained together in an allergies section of the electronic medical record, but are identified as either allergy or adverse reactions at the time they are entered, and each generates its own warnings.
When more than 1 duplicate, interaction, allergy, or adverse reaction warning is generated for a particular medication, all appear listed on a single screen in identical fonts. No visual distinction is made between severe and intermediate drug‐drug interactions; for these, the category of medication ordered is followed by the category of the medication for which there is a potential interaction. A details button can be selected to learn specifically which medications are involved and the severity and nature of the potential interactions identified. In response to the warnings, providers can choose to either override them, erase the order, or replace the order by clicking 1 of 3 buttons at the bottom of the screen. Warnings are not repeated unless the medication is reordered for that patient. Dose warnings appear on a subsequent screen and are not addressed in this article.
Nurses are discouraged from entering verbal orders but do have the capacity to do so, at which time they encounter and must respond to the standard medication warnings, if any. Medical students are able to enter orders, at which time they also encounter and must respond to the standard medication warnings; their orders must then be cosigned by a licensed provider before they can be processed. Warnings encountered by nurses and medical students are not repeated at the time of cosignature by a licensed provider.
Data Collection
We collected data regarding all medication orders placed in our CPOE system from October 1, 2009 to April 20, 2010 for all adult patients. Intensive care unit (ICU) patients were excluded, in anticipation of a separate analysis. Hospitalizations under observation were also excluded. We then ran a report showing all medications that generated any number of warnings of any type (duplicate, interaction, allergy, or adverse reaction) for the same population. Warnings generated during readmissions that occurred at any point during the study period (ranging from 1 to 21 times) were excluded, because these patients likely had many, if not all, of the same medications ordered during their readmissions as during their initial hospitalization, which would unduly influence the analysis if retained.
There was wide variation in the number of warnings generated per medication and in the number of each warning type per medication that generated multiple warnings. Therefore, for ease of analysis and to ensure that we could accurately determine varying response to each individual warning type, we thereafter focused on the medications that generated single warnings during the study period. For each single warning we obtained patient name, account number, event date and time, hospital unit at the time of the event, ordered medication, ordering staff member, warning type, and staff member response to the warning (eg, override warning or erase order [accept the warning]). The response replace was used very infrequently, and therefore warnings that resulted in this response were excluded. Medications available in more than 1 form included the route of administration in their name, and from this they were categorized as parenteral or nonparenteral. All nonparenteral or parenteral forms of a given medication were grouped together as 1 medication (eg, morphine sustained release and morphine elixir were classified as a single‐medication, nonparenteral morphine). Medications were further categorized according to whether or not they were on the Institute for Safe Medication Practice (ISMP) List of High‐Alert Medications.[30]
The study was approved by the Johns Hopkins Institutional Review Board.
Analysis
We collected descriptive data about patients and providers. Age and length of stay (LOS) at the time of the event were determined based on the patients' admit date and date of birth, and grouped into quartiles. Hospital units were grouped according to which service or services they primarily served. Medications were grouped into quartiles according to the total number of warnings they generated during the study period. Warnings were dichotomously categorized according to whether they were overridden or accepted. Unpaired t tests were used to compare continuous variables for the 2 groups, and [2] tests were used to compare categorical variables. A multivariate logistic regression was then performed, using variables with a P value of <0.10 in the univariate analysis, to control for confounders and identify independent predictors of medication warning acceptance. All analyses were performed using Intercooled Stata 12 (StataCorp, College Station, TX).
RESULTS
A total of 259,656 medication orders were placed for adult non‐ICU patients during the 7‐month study period. Of those orders, 45,835 generated some number of medication warnings.[1, 2, 3, 4, 5, 6, 7, 8, 9, 10, 11, 12, 13, 14, 15, 16, 17, 18, 19, 20] The median number of warnings per patient was 4 (interquartile range [IQR]=28; mean=5.9, standard deviation [SD]=6.2), with a range from 1 to 84. The median number of warnings generated per provider during the study period was 36 (IQR=6106, mean=87.4, SD=133.7), with a range of 1 to 1096.
There were 40,391 orders placed for 454 medications for adult non‐ICU patients, which generated a single‐medication warning (excluding those with the response replace, which was used 20 times) during the 7‐month study period. Data regarding the patients and providers associated with the orders generating single warnings are shown in Table 1. Most patients were on medicine units, and most orders were entered by residents. Patients' LOS at the time the orders were placed ranged from 0 to 118 days (median=1, IQR=04; mean=4.0, SD=7.2). The median number of single warnings per patient was 4 (IQR=28; mean=6.1, SD=6.5), with a range from 1 to 84. The median number of single warnings generated per provider during the study period was 15 (IQR=373; mean=61.7, SD=109.6), with a range of 1 to 1057.
| No. (%) | |
|---|---|
| |
| Patients (N=6,646) | |
| Age | |
| 1545 years | 2,048 (31%) |
| 4657 years | 1,610 (24%) |
| 5872 years | 1,520 (23%) |
| 73104 years | 1,468 (22%) |
| Gender | |
| Male | 2,934 (44%) |
| Hospital unita | |
| Medicine | 2,992 (45%) |
| Surgery | 1,836 (28%) |
| Neuro/psych/chem dep | 1,337 (20%) |
| OB/GYN | 481 (7%) |
| Caregivers (N=655) | |
| Resident | 248 (38%)b |
| Nurse | 154 (24%) |
| Attending or other | 97 (15%) |
| NP/PA | 69 (11%) |
| IM hospitalist | 31 (5%) |
| Fellow | 27 (4%) |
| Medical student | 23 (4%) |
| Pharmacist | 6 (1%) |
Patient and caregiver characteristics for the medication orders that generated single warnings are shown in Table 2. The majority of medications were nonparenteral and not on the ISMP list (Table 3). Most warnings generated were either duplicate (47%) or interaction warnings (47%). Warnings of a particular type were repeated 14.5% of the time for a particular medication and patient (from 2 to 24 times, median=2, IQR=22, mean=2.7, SD=1.4), and 9.8% of the time for a particular caregiver, medication, and patient (from 2 to 18 times, median=2, IQR=22, mean=2.4, SD=1.1).
| Variable | No. of Warnings (%)a | No. of Warnings Accepted (%)a | P |
|---|---|---|---|
| |||
| Patient age | |||
| 1545 years | 10,881 (27) | 602 (5.5%) | <0.001 |
| 4657 years | 9,733 (24) | 382 (3.9%) | |
| 5872 years | 10,000 (25) | 308 (3.1%) | |
| 73104 years | 9,777 (24) | 262 (2.7%) | |
| Patient gender | |||
| Female | 23,395 (58) | 866 (3.7%) | 0.074 |
| Male | 16,996 (42) | 688 (4.1%) | |
| Patient length of stay | |||
| <1 day | 10,721 (27) | 660 (6.2%) | <0.001 |
| 1 day | 10,854 (27) | 385 (3.5%) | |
| 24 days | 10,424 (26) | 277 (2.7%) | |
| 5118 days | 8,392 (21) | 232 (2.8%) | |
| Patient hospital unit | |||
| Medicine | 20,057 (50) | 519 (2.6%) | <0.001 |
| Surgery | 10,274 (25) | 477 (4.6%) | |
| Neuro/psych/chem dep | 8,279 (21) | 417 (5.0%) | |
| OB/GYN | 1,781 (4) | 141 (7.9%) | |
| Ordering caregiver | |||
| Resident | 22,523 (56) | 700 (3.1%) | <0.001 |
| NP/PA | 7,534 (19) | 369 (4.9%) | |
| IM hospitalist | 5,048 (13) | 155 (3.1%) | |
| Attending | 3225 (8) | 219 (6.8%) | |
| Fellow | 910 (2) | 34 (3.7%) | |
| Nurse | 865 (2) | 58 (6.7%) | |
| Medical student | 265 (<1) | 17 (6.4%) | |
| Pharmacist | 21 (<1) | 2 (9.5%) | |
| Day ordered | |||
| Weekday | 31,499 (78%) | 1276 (4.1%) | <0.001 |
| Weekend | 8,892 (22%) | 278 (3.1%) | |
| Time ordered | |||
| 00000559 | 4,231 (11%) | 117 (2.8%) | <0.001 |
| 06001159 | 11,696 (29%) | 348 (3.0%) | |
| 12001759 | 15,879 (39%) | 722 (4.6%) | |
| 18002359 | 8,585 (21%) | 367 (4.3%) | |
| Administration route (no. of meds) | |||
| Nonparenteral (339) | 27,086 (67%) | 956 (3.5%) | <0.001 |
| Parenteral (115) | 13,305 (33%) | 598 (4.5%) | |
| ISMP List of High‐Alert Medications status (no. of meds)[30] | |||
| Not on ISMP list (394) | 27,503 (68%) | 1251 (4.5%) | <0.001 |
| On ISMP list (60) | 12,888 (32%) | 303 (2.4%) | |
| No. of warnings per med (no. of meds) | |||
| 11062133 (7) | 9,869 (24%) | 191 (1.9%) | <0.001 |
| 4681034 (13) | 10,014 (25%) | 331 (3.3%) | |
| 170444 (40) | 10,182 (25%) | 314 (3.1%) | |
| 1169 (394) | 10,326 (26%) | 718 (7.0%) | |
| Warning type (no. of meds)b | |||
| Duplicate (369) | 19,083 (47%) | 1041 (5.5%) | <0.001 |
| Interaction (315) | 18,894 (47%) | 254 (1.3%) | |
| Allergy (138) | 2,371 (6%) | 243 (10.0%) | |
| Adverse reaction (14) | 43 (0.1%) | 16 (37%) | |
| Variable | Adjusted OR | 95% CI |
|---|---|---|
| ||
| Patient age | ||
| 1545 years | 1.00 | Reference |
| 4657 years | 0.89 | 0.771.02 |
| 5872 years | 0.85 | 0.730.99 |
| 73104 years | 0.91 | 0.771.08 |
| Patient gender | ||
| Female | 1.00 | Reference |
| Male | 1.26 | 1.131.41 |
| Patient length of stay | ||
| <1 day | 1.00 | Reference |
| 1 day | 0.65 | 0.550.76 |
| 24 days | 0.49 | 0.420.58 |
| 5118 days | 0.49 | 0.410.58 |
| Patient hospital unit | ||
| Medicine | 1.00 | Reference |
| Surgery | 1.45 | 1.251.68 |
| Neuro/psych/chem dep | 1.35 | 1.151.58 |
| OB/GYN | 2.43 | 1.923.08 |
| Ordering caregiver | ||
| Resident | 1.00 | Reference |
| NP/PA | 1.63 | 1.421.88 |
| IM hospitalist | 1.24 | 1.021.50 |
| Attending | 1.83 | 1.542.18 |
| Fellow | 1.41 | 0.982.03 |
| Nurse | 1.92 | 1.442.57 |
| Medical student | 1.17 | 0.701.95 |
| Pharmacist | 3.08 | 0.6714.03 |
| Medication factors | ||
| Nonparenteral | 1.00 | Reference |
| Parenteral | 1.79 | 1.592.03 |
| HighAlert Medication status (no. of meds)[30] | ||
| Not on ISMP list | 1.00 | Reference |
| On ISMP list | 0.37 | 0.320.43 |
| No. of warnings per medication | ||
| 11062133 | 1.00 | Reference |
| 4681034 | 2.30 | 1.902.79 |
| 170444 | 2.25 | 1.852.73 |
| 1169 | 4.10 | 3.424.92 |
| Warning type | ||
| Duplicate | 1.00 | Reference |
| Interaction | 0.24 | 0.210.28 |
| Allergy | 2.28 | 1.942.68 |
| Adverse reaction | 9.24 | 4.5218.90 |
One thousand five hundred fifty‐four warnings were erased (ie, accepted by clinicians [4%]). In univariate analysis, only patient gender was not associated with warning acceptance. Patient age, LOS, hospital unit at the time of order entry, ordering caregiver type, day and time the medication was ordered, administration route, presence on the ISMP list, warning frequency, and warning type were all significantly associated with warning acceptance (Table 2).
Older patient age, longer LOS, presence of the medication on the ISMP list, and interaction warning type were all negatively associated with warning acceptance in multivariable analysis. Warning acceptance was positively associated with male patient gender, being on a service other than medicine, being a caregiver other than a resident, parenteral medications, lower warning frequency, and allergy or adverse reaction warning types (Table 3).
The 20 medications that generated the most single warnings are shown in Table 4. Medications on the ISMP list accounted for 8 of these top 20 medications. For most of them, duplicate and interaction warnings accounted for most of the warnings generated, except for parenteral hydromorphone, oral oxycodone, parenteral morphine, and oral hydromorphone, which each had more allergy than interaction warnings.
| Medication | ISMP Listb | No. of Warnings | Duplicate, No. (%)c | Interaction, No. (%)c | Allergy, No. (%)c | Adverse Reaction, No. (%)c |
|---|---|---|---|---|---|---|
| ||||||
| Hydromorphone injectable | Yes | 2,133 | 1,584 (74.3) | 127 (6.0) | 422 (19.8) | |
| Metoprolol | 1,432 | 550 (38.4) | 870 (60.8) | 12 (0.8) | ||
| Aspirin | 1,375 | 212 (15.4) | 1,096 (79.7) | 67 (4.9) | ||
| Oxycodone | Yes | 1,360 | 987 (72.6) | 364 (26.8) | 9 (0.7) | |
| Potassium chloride | 1,296 | 379 (29.2) | 917 (70.8) | |||
| Ondansetron injectable | 1,167 | 1,013 (86.8) | 153 (13.1) | 1 (0.1) | ||
| Aspart insulin injectable | Yes | 1,106 | 643 (58.1) | 463 (41.9) | ||
| Warfarin | Yes | 1,034 | 298 (28.8) | 736 (71.2) | ||
| Heparin injectable | Yes | 1,030 | 205 (19.9) | 816 (79.2) | 9 (0.3) | |
| Furosemide injectable | 980 | 438 (45.0) | 542 (55.3) | |||
| Lisinopril | 926 | 225 (24.3) | 698 (75.4) | 3 (0.3) | ||
| Acetaminophen | 860 | 686 (79.8) | 118 (13.7) | 54 (6.3) | 2 (0.2) | |
| Morphine injectable | Yes | 804 | 467 (58.1) | 100 (12.4) | 233 (29.0) | 4 (0.5) |
| Diazepam | 786 | 731 (93.0) | 41 (5.2) | 14 (1.8) | ||
| Glargine insulin injectable | Yes | 746 | 268 (35.9) | 478 (64.1) | ||
| Ibuprofen | 713 | 125 (17.5) | 529 (74.2) | 54 (7.6) | 5 (0.7) | |
| Hydromorphone | Yes | 594 | 372 (62.6) | 31 (5.2) | 187 (31.5) | 4 (0.7) |
| Furosemide | 586 | 273 (46.6) | 312 (53.2) | 1 (0.2) | ||
| Ketorolac injectable | 487 | 39 (8.0) | 423 (86.9) | 23 (4.7) | 2 (0.4) | |
| Prednisone | 468 | 166 (35.5) | 297 (63.5) | 5 (1.1) | ||
DISCUSSION
Medication warnings in our study were frequently overridden, particularly when encountered by residents, for patients with a long LOS and on the internal medicine service, and for medications generating the most warnings and on the ISMP list. Disturbingly, this means that potentially important warnings for medications with the highest potential for causing harm, for possibly the sickest and most complex patients, were those that were most often ignored by young physicians in training who should have had the most to gain from them. Of course, this is not entirely surprising. Despite our hope that a culture of safety would influence young physicians' actions when caring for these patients and prescribing these medications, these patients and medications are those for whom the most warnings are generated, and these physicians are the ones entering the most orders. Only 13% of the medications studied were on the ISMP list, but they generated 32% of the warnings. We controlled for number of warnings and ISMP list status, but not for warning validity. Most likely, high‐risk medications have been set up with more warnings, many of them of lower quality, in an errant but well‐intentioned effort to make them safer. If developers of CPOE systems want to gain serious traction in using decision support to promote prescribing safe medications, they must take substantial action to increase attention to important warnings and decrease the number of clinically insignificant, low‐value warnings encountered by active caregivers on a daily basis.
Only 2 prior studies, both by Seidling et al., have specifically looked at provider response to warnings for high risk medications. Interaction warnings were rarely accepted in 1,[18] as in our study; however, in contrast to our findings, warning acceptance in both studies was higher for drugs with dose‐dependent toxicity.[18, 26] The effect of physician experience on warning acceptance has been addressed in 2 prior studies. In Weingart et al., residents were more likely than staff physicians to erase medication orders when presented with allergy and interaction warnings in a primary care setting.[20] Long et al. found that physicians younger than 40 years were less likely than older physicians to accept duplicate warnings, but those who had been at the study hospital for a longer period of time were more likely to accept them.[23] The influence of patient LOS and service on warning acceptance has not previously been described. Further study is needed looking at each of these factors.
Individual hospitals tend to avoid making modifications to order entry warning systems, because monitoring and maintaining these changes is labor intensive. Some institutions may make the decision to turn off certain categories of alerts, such as intermediate interaction warnings, to minimize the noise their providers encounter. There are even tools for disabling individual alerts or groups of alerts, such as that available for purchase from our interaction database vendor.[31] However, institutions may fear litigation should an adverse event be attributed to a disabled warning.[15, 16] Clearly, a comprehensive, health system‐wide approach is warranted.[13, 15] To date, published efforts describing ways to improve the effectiveness of medication warning systems have focused on either heightening the clinical significance of alerts[14, 21, 22, 32, 33, 34, 35, 36] or altering their presentation and how providers experience them.[21, 36, 37, 38, 39, 40, 41, 42, 43] The single medication warnings our providers receive are all presented in an identical font, and presumably response to each would be different if they were better distinguished from each other. We also found that a small but significant number of warnings were repeated for a given patient and even a given provider. If the providers knew they would only be presented with warnings the first time they occurred for a given patient and medication, they might be more attuned to the remaining warnings. Previous studies describe context‐specific decision support for medication ordering[44, 45, 46]; however, only 1 has described the use of patient context factors to modify when or how warnings are presented to providers.[47] None have described tailoring allergy, duplicate, and interaction warnings according to medication or provider types. If further study confirms our findings, modulating basic warning systems according to severity of illness, provider experience, and medication risk could powerfully increase their effectiveness. Of course, this would be extremely challenging to achieve, and is likely outside the capabilities of most, if not all, CPOE systems, at least for now.
Our study has some limitations. First, it was limited to medications that generated a single warning. We did this for ease of analysis and so that we could ensure understanding of provider response to each warning type without bias from simultaneously occurring warnings; however, caregiver response to multiple warnings appearing simultaneously for a particular medication order might be quite different. Second, we did not include any assessment of the number of medications ordered by each provider type or for each patient, either of which could significantly affect provider response to warnings. Third, as previously noted, we did not include any assessment of the validity of the warnings, beyond the 4 main categories described, which could also significantly affect provider response. However, it should be noted that although the validity of interaction warnings varies significantly from 1 medication to another, the validity of duplicate, allergy, and adverse reaction warnings in the described system are essentially the same for all medications. Fourth, it is possible that providers did modify or even erase their orders even after selecting override in response to the warning; it is also possible that providers reentered the same order after choosing erase. Unfortunately auditing for actions such as these would be extremely laborious. Finally, the study was conducted at a single medical center using a single order‐entry system. The system in use at our medical center is in use at one‐third of the 6000 hospitals in the United States, though certainly not all are using our version. Even if a hospital was using the same CPOE version and interaction database as our institution, variations in patient population and local decisions modifying how the database interacts with the warning presentation system might affect reproducibility at that institution.
Commonly encountered medication warnings are overridden at extremely high rates, and in our study this was particularly so for medications on the ISMP list, when ordered by physicians in training. Warnings of little clinical significance must be identified and eliminated, the most important warnings need to be visually distinct to increase user attention, and further research should be done into the patient, provider, setting, and medication factors that affect user responses to warnings, so that they may be customized accordingly and their significance increased. Doing so will enable us to reap the maximum possible potential from our CPOE systems, and increase the CPOE's power to protect our most vulnerable patients from our most dangerous medications, particularly when cared for by our most inexperienced physicians.
Acknowledgements
The authors thank, in particular, Scott Carey, Research Informatics Manager, for assistance with data collection. Additional thanks go to Olga Sherman and Kathleen Ancinich for assistance with data collection and management.
Disclosures: This research was supported in part by the Johns Hopkins Institute for Clinical and Translational Research. All listed authors contributed substantially to the study conception and design, analysis and interpretation of data, drafting the article or revising it critically for important intellectual content, and final approval of the version to be published. No one who fulfills these criteria has been excluded from authorship. This research received no specific grant from any funding agency in the public, commercial, or not‐for‐profit sectors. The authors have no competing interests to declare.
- , , , et al., Effect of computerized physician order entry and a team intervention on prevention of serious medication errors. JAMA. 1998;280:1311–1316.
- , , , , , . Effects of computerized provider order entry on prescribing practices. Arch Intern Med. 2000;160:2741–2747.
- , , , et al. Effects of computerized clinician decision support systems on practitioner performance and patient outcomes: a systematic review. JAMA. 2005;293:1223–1238.
- , , , et al. The effect of computerized physician order entry with clinical decision support on the rates of adverse drug events: a systematic review. J Gen Intern Med. 2008;23:451–458.
- , , . The impact of computerized physician medication order entry in hospitalized patients—a systematic review. Int J Med Inform. 2008;77:365–376.
- , , , et al. What evidence supports the use of computerized alerts and prompts to improve clinicians' prescribing behavior? J Am Med Inform Assoc. 2009;16:531–538.
- , , , , . Does computerized provider order entry reduce prescribing errors for hospital inpatients? A systematic review. J Am Med Inform Assoc. 2009;16:613–623.
- , , , . Overriding of drug safety alerts in computerized physician order entry. J Am Med Inform Assoc. 2006;13:138–147.
- , , , , , . Evaluating clinical decision support systems: monitoring CPOE order check override rates in the Department of Veterans Affairs' Computerized Patient Record System. J Am Med Inform Assoc. 2008;15:620–626.
- , , . GPs' views on computerized drug interaction alerts: questionnaire survey. J Clin Pharm Ther. 2002;27:377–382.
- , , , et al. Clinicians' assessments of electronic medication safety alerts in ambulatory care. Arch Intern Med. 2009;169:1627–1632.
- , , , , . A mixed method study of the merits of e‐prescribing drug alerts in primary care. J Gen Intern Med. 2008;23:442–446.
- . CPOE and clinical decision support in hospitals: getting the benefits: comment on “Unintended effects of a computerized physician order entry nearly hard‐stop alert to prevent a drug interaction.” Arch Intern Med. 2010;170:1583–1584.
- , , . Critical drug‐drug interactions for use in electronic health records systems with computerized physician order entry: review of leading approaches. J Patient Saf. 2011;7:61–65.
- , , , , . Clinical decision support systems could be modified to reduce 'alert fatigue' while still minimizing the risk of litigation. Health Aff (Millwood). 2011;30:2310–2317.
- , , , . Critical issues associated with drug‐drug interactions: highlights of a multistakeholder conference. Am J Health Syst Pharm. 2011;68:941–946.
- , , , , , . Development of a context model to prioritize drug safety alerts in CPOE systems. BMC Med Inform Decis Mak. 2011;11:35.
- , , , et al. Factors influencing alert acceptance: a novel approach for predicting the success of clinical decision support. J Am Med Inform Assoc. 2011;18:479–484.
- , , , . How to improve the delivery of medication alerts within computerized physician order entry systems: an international Delphi study. J Am Med Inform Assoc. 2011;18:760–766.
- , , , , , . Physicians' decisions to override computerized drug alerts in primary care. Arch Intern Med. 2003;163:2625–2631.
- , , , et al. Improving acceptance of computerized prescribing alerts in ambulatory care. J Am Med Inform Assoc. 2006;13:5–11.
- , , , . Optimizing the acceptance of medication‐based alerts by physicians during CPOE implementation in a community hospital environment. AMIA Annu Symp Proc. 2007:701–705.
- , , , . The use of a CPOE log for the analysis of physicians' behavior when responding to drug‐duplication reminders. Int J Med Inform. 2008;77:499–506.
- , , , et al. Overrides of medication alerts in ambulatory care. Arch Intern Med. 2009;169:305–311.
- , , , , , . Drug safety alert generation and overriding in a large Dutch university medical centre. Pharmacoepidemiol Drug Saf. 2009;18:941–947.
- , , , et al. Patient‐specific electronic decision support reduces prescription of excessive doses. Qual Saf Health Care. 2010;19:e15.
- , , , et al. Survival from in‐hospital cardiac arrest during nights and weekends. JAMA. 2008;299:785–792.
- , . Managing medications in clinically complex elders: “There's got to be a happy medium.” JAMA. 2010;304:1592–1601.
- Agency for Healthcare Research and Quality. Safety culture. Available at: http://psnet.ahrq.gov/primer.aspx?primerID=5. Accessed October 29, 2013.
- Institute for Safe Medication Practice. List of High‐Alert Medications. Available at: http://www.ismp.org/Tools/highalertmedications.pdf. Accessed June 18, 2013.
- First Databank. FDB AlertSpace. Available at: http://www.fdbhealth.com/solutions/fdb‐alertspace. Accessed July 3, 2014.
- , , , et al. Improving allergy alerting in a computerized physician order entry system. Proc AMIA Symp. 2000:2–6.
- , , , , , . A clinical data warehouse‐based process for refining medication orders alerts. J Am Med Inform Assoc. 2012;19:782–785.
- , , , et al. Drug‐drug interactions that should be non‐interruptive in order to reduce alert fatigue in electronic health records. J Am Med Inform Assoc. 2013;20:489–493.
- , , , et al. High‐priority drug‐drug interactions for use in electronic health records. J Am Med Inform Assoc. 2012;19:735–743.
- , , , , . Design of decision support interventions for medication prescribing. Int J Med Inform. 2013;82:492–503.
- , , , et al. A randomized trial of the effectiveness of on‐demand versus computer‐triggered drug decision support in primary care. J Am Med Inform Assoc. 2008;15:430–438.
- , , , et al. Tiering drug‐drug interaction alerts by severity increases compliance rates. J Am Med Inform Assoc. 2009;16:40–46.
- , , , et al. A review of human factors principles for the design and implementation of medication safety alerts in clinical information systems. J Am Med Inform Assoc. 2010;17:493–501.
- , , , et al. Unintended effects of a computerized physician order entry nearly hard‐stop alert to prevent a drug interaction: a randomized controlled trial. Arch Intern Med. 2010;170:1578–1583.
- , , , , , . Randomized clinical trial of a customized electronic alert requiring an affirmative response compared to a control group receiving a commercial passive CPOE alert: NSAID—warfarin co‐prescribing as a test case. J Am Med Inform Assoc. 2010;17:411–415.
- , , , , . Making electronic prescribing alerts more effective: scenario‐based experimental study in junior doctors. J Am Med Inform Assoc. 2011;18:789–798.
- , , , et al. Development and preliminary evidence for the validity of an instrument assessing implementation of human‐factors principles in medication‐related decision‐support systems—I‐MeDeSA. J Am Med Inform Assoc. 2011;18(suppl 1):i62–i72.
- , , , et al. Medication‐related clinical decision support in computerized provider order entry systems: a review. J Am Med Inform Assoc. 2007;14:29–40.
- , , , et al. Physicians' perceptions on the usefulness of contextual information for prioritizing and presenting alerts in Computerized Physician Order Entry systems. BMC Med Inform Decis Mak. 2012;12:111.
- , , , et al. Computerized clinical decision support systems for drug prescribing and management: a decision‐maker‐researcher partnership systematic review. Implement Sci. 2011;6:89.
- , . A successful model and visual design for creating context‐aware drug‐drug interaction alerts. AMIA Annu Symp Proc. 2011;2011:339–348.
© 2015 Society of Hospital Medicine
Effect of an RRT on Resident Perceptions
Rapid response teams (RRTs) have been promoted by patient safety and quality‐improvement organizations as a strategy to reduce preventable in‐hospital deaths.[1] To date, critical analysis of RRTs has focused primarily on their impact on quality‐of‐care metrics.[2, 3, 4] Comparatively few studies have examined the cultural and educational impact of RRTs, particularly at academic medical centers, and those that do exist have focused almost exclusively on perceptions of nurses rather than resident physicians.[5, 6, 7, 8, 9, 10]
Although a prior study found that internal medicine and general surgery residents believed that RRTs improved patient safety, they were largely ambivalent about the RRT's impact on education and training.[11] To date, there has been no focused assessment of resident physician impressions of an RRT across years of training and medical specialty to inform the use of this multidisciplinary team as a component of their residency education.
We sought to determine whether resident physicians at a tertiary care academic medical center perceive educational benefit from collaboration with the RRT and whether they feel that the RRT adversely affects clinical autonomy.
METHODS
The Hospital
Moffitt‐Long Hospital, the tertiary academic medical center of the University of California, San Francisco (UCSF), is a 600‐bed acute care hospital that provides comprehensive critical care services and serves as a major referral center in northern California. There are roughly 5000 admissions to the hospital annually. At the time the study was conducted, there were approximately 200 RRT calls per 1000 adult hospital discharges.
The Rapid Response Team
The RRT is called to assess, triage, and treat patients who have experienced a decline in their clinical status short of a cardiopulmonary arrest. The RRT has been operational at UCSF since June 1, 2007, and is composed of a dedicated critical care nurse and respiratory therapist available 24 hours a day, 7 days a week. The RRT can be activated by any concerned staff member based on vital sign abnormalities, decreased urine output, changes in mental status, or any significant concern about the trajectory of the patient's clinical course.
When the RRT is called on a given patient, the patient's primary physician (at our institution, a resident) is also called to the bedside and works alongside the RRT to address the patient's acute clinical needs. The primary physician, bedside nurse, and RRT discuss the plan of care for the patient, including clinical evaluation, management, and the need for additional monitoring or a transition to a higher level of care. Residents at our institution receive no formal instruction regarding the role of the RRT or curriculum on interfacing with the RRT, and they do not serve as members of the RRT as part of a clinical rotation.
The Survey Process
Study subjects were asked via e‐mail to participate in a brief online survey. Subjects were offered the opportunity to win a $100 gift certificate in return for their participation. Weekly e‐mail reminders were sent for a period of 3 months or until a given subject had completed the survey. The survey was administered over a 3‐month period, from March through May, to allow time for residents to work with the RRT during the academic year. The Committee on Human Research at the University of California San Francisco Medical Center approved the study.
Target Population
All residents in specialties that involved direct patient care and the potential to use the adult RRT were included in the study. This included residents in the fields of internal medicine, neurology, general surgery, orthopedic surgery, neurosurgery, plastic surgery, urology, and otolaryngology (Table 1). Residents in pediatrics and obstetrics and gynecology were excluded, as emergencies in their patients are addressed by a pediatric RRT and an obstetric anesthesiologist, respectively. Residents in anesthesiology were excluded as they do not care for nonintensive care unit (ICU) patients as part of the primary team and are not involved in RRT encounters.
| Demographic | No. (%) |
|---|---|
| |
| Medical specialty | |
| Internal medicine | 145 (61.4) |
| Neurology | 18 (7.6) |
| General surgery | 31 (13.1) |
| Orthopedic surgery | 17 (7.2) |
| Neurosurgery | 4 (1.7) |
| Plastic surgery | 2 (0.8) |
| Urology | 9 (3.8) |
| Otolaryngology | 10 (4.2) |
| Years of postgraduate training | Average 2.34 (SD 1.41) |
| 1 | 83 (35.2) |
| 2 | 60 (25.4) |
| 3 | 55 (23.3) |
| 4 | 20 (8.5) |
| 5 | 8 (3.4) |
| 6 | 5 (2.1) |
| 7 | 5 (2.1) |
| Gender | |
| Male | 133 (56.4) |
| Female | 102 (43.2) |
| Had exposure to RRT during training | |
| Yes | 106 (44.9) |
| No | 127 (53.8) |
| Had previously initiated a call to the RRT | |
| Yes | 106 (44.9) |
| No | 128 (54.2) |
Survey Design
The resident survey contained 20 RRT‐related items and 7 demographic and practice items. Responses for RRT‐related questions utilized a 5‐point Likert scale ranging from strongly disagree to strongly agree. The survey was piloted prior to administration to check comprehension and interpretation by physicians with experience in survey writing (for the full survey, see Supporting Information, Appendix, in the online version of this article).
Survey Objectives
The survey was designed to capture the experiences of residents who had cared for a patient for whom the RRT had been activated. Data collected included residents' perceptions of the impact of the RRT on their residency education and clinical autonomy, the quality of care provided, patient safety, and hospital‐wide culture. Potential barriers to use of the RRT were also examined.
Outcomes
The study's primary outcomes included the perceived educational benefit of the RRT and its perceived impact on clinical autonomy. Secondary outcomes included the effect of years of training and resident specialty on both the perceived educational benefit and impact on clinical autonomy among our study group.
Statistical Analysis
Responses to each survey item were described for each specialty, and subgroup analysis was conducted. For years of training, that item was dichotomized into either 1 year (henceforth referred to as interns) or greater than 1 year (henceforth referred to as upper‐level residents). Resident specialty was dichotomized into medical fields (internal medicine and neurology) or surgical fields. For statistical analysis, agreement statements were collapsed to either disagree (strongly disagree/disagree), neutral, or agree (strongly agree/agree). The influence of years of resident training and resident specialty was assessed for all items in the survey using 2 or Fisher exact tests as appropriate for the 3 agreement categories. Analysis was conducted using SPSS 21.0 (IBM Corp., Armonk, NY).
RESULTS
There were 246 responses to the survey of a possible 342, yielding a response rate of 72% (Table 2). Ten respondents stated that they had never cared for a patient where the RRT had been activated. Given their lack of exposure to the RRT, these respondents were excluded from the analysis, yielding a final sample size of 236. The demographic and clinical practice characteristics of respondents are shown in Table 1.
| The resident | Strongly Disagree/Disagree, n (%) | Neutral, n (%) | Agree/ Strongly Agree, n (%) |
|---|---|---|---|
| |||
| Is comfortable managing the unstable patient without the RRT | 104 (44.1) | 64 (27.1) | 66 (28.0) |
| And RRT work together to make treatment decisions | 10 (4.2) | 13 (5.5) | 208 (88.1) |
| Believes there are fewer opportunities to care for unstable floor patients due to the RRT | 188 (79.7) | 26 (11.0) | 17 (7.2) |
| Feels less prepared to care for unstable patients due to the RRT | 201 (85.2) | 22 (9.3) | 13 (5.5) |
| Feels that working with the RRT creates a valuable educational experience | 9 (3.8) | 39 (16.5) | 184 (78.0) |
| Feels that nurses caring for the unstable patient should always contact them prior to contacting the RRT | 123 (52.1) | 33 (14.0) | 76 (32.2) |
| Would be unhappy with nurses calling RRT prior to contacting them | 141 (59.7) | 44 (18.6) | 51 (21.6) |
| Perceives that the presence of RRT decreases residents' autonomy | 179 (75.8) | 25 (10.6) | 28 (11.9) |
Demographics and Primary Outcomes
Interns comprised 83 (35%) of the respondents; the average time in postgraduate training was 2.34 years (standard deviation=1.41). Of respondents, 163 (69%) were in medical fields, and 73 (31%) were in surgical fields. Overall responses to the survey are shown in Table 2, and subgroup analysis is shown in Table 3.
| The resident | 1 Year, n=83, n (%) | >1 Year, n=153, n (%) | P Value | Medical, n=163, n (%) | Surgical, n=73, n (%) | P Value |
|---|---|---|---|---|---|---|
| ||||||
| Is comfortable managing the unstable patient without the RRT | 0.01 | <0.01 | ||||
| Strongly disagree/disagree | 39 (47.6) | 65 (42.8) | 67 (41.6) | 37 (50.7) | ||
| Neutral | 29 (35.4) | 35 (23.0) | 56 (34.8) | 8 (11.0) | ||
| Agree/strongly agree | 14 (17.1) | 52 (34.2) | 38 (23.6) | 28 (38.4) | ||
| And RRT work together to make treatment decisions | 0.61 | 0.04 | ||||
| Strongly disagree/disagree | 2 (2.4) | 8 (5.4) | 4 (2.5) | 6 (8.7) | ||
| Neutral | 5 (6.1) | 8 (5.4) | 7 (4.3) | 6 (8.7) | ||
| Agree/strongly agree | 75 (91.5) | 137 (89.3) | 151 (93.2) | 57 (82.6) | ||
| Believes there are fewer opportunities to care for unstable floor patients due to the RRT | 0.05 | 0.04 | ||||
| Strongly disagree/disagree | 59 (72.8) | 129 (86.0) | 136 (85.5) | 52 (72.2) | ||
| Neutral | 13 (16.0) | 13 (8.7) | 15 (9.4) | 11 (15.3) | ||
| Agree/strongly agree | 9 (11.1) | 8 (5.3) | 8 (5.0) | 9 (12.5) | ||
| Feels less prepared to care for unstable patients due to the RRT | <0.01 | 0.79 | ||||
| Strongly disagree/disagree | 62 (74.7) | 139 (90.8) | 140 (85.9) | 61 (83.6) | ||
| Neutral | 14 (16.9) | 8 (5.2) | 15 (9.2) | 7 (9.6) | ||
| Agree/Strongly agree | 7 (8.4) | 6 (3.9) | 8 (4.9) | 5 (6.8) | ||
| Feels working with the RRT is a valuable educational experience | 0.61 | 0.01 | ||||
| Strongly disagree/disagree | 2 (2.4) | 7 (4.7) | 2 (1.2) | 7 (9.9) | ||
| Neutral | 12 (14.6) | 27 (18.0) | 25 (15.5) | 14 (19.7) | ||
| Agree/strongly agree | 68 (82.9) | 116 (77.3) | 134 (83.2) | 50 (70.4) | ||
| Feels nurses caring for unstable patients should always contact the resident prior to contacting the RRT | 0.49 | <0.01 | ||||
| Strongly disagree/disagree | 47 (57.3) | 76 (50.7) | 97 (60.2) | 26 (36.6) | ||
| Neutral | 9 (11.0) | 24 (16.0) | 26 (16.1) | 7 (9.9) | ||
| Agree/strongly agree | 26 (31.7) | 50 (33.3) | 38 (23.6) | 38 (53.5) | ||
| Would be unhappy with nurses calling RRT prior to contacting them | 0.81 | <0.01 | ||||
| Strongly disagree/disagree | 51 (61.4) | 90 (58.8) | 109 (66.9) | 32 (43.8) | ||
| Neutral | 16 (19.3) | 28 (18.3) | 30 (18.4) | 14 (19.2) | ||
| Agree/strongly agree | 16 (19.3) | 35 (22.9) | 24 (14.7) | 27 (37.0) | ||
| Perceives that the presence of the RRT decreases autonomy as a physician | 0.95 | 0.18 | ||||
| Strongly disagree/disagree | 63 (77.8) | 116 (76.8) | 127 (79.9) | 52 (71.2) | ||
| Neutral | 9 (11.1) | 16 (10.6) | 17 (10.7) | 8 (11.0) | ||
| Agree/strongly agree | 9 (11.1) | 19 (12.6) | 15 (9.4) | 13 (17.8) | ||
Effect of the RRT on Resident Education
Of all residents, 66 (28%) agreed that they felt comfortable managing an unstable patient without the assistance of the RRT. Surgical residents felt more comfortable managing an unstable patient alone (38%) compared medical residents (24%) (P<0.01). Interns felt less comfortable caring for unstable patients without the RRT's assistance (17%) compared with upper‐level residents (34%) (P=0.01).
Residents overall disagreed with the statement that the RRT left them feeling less prepared to care for unstable patients (n=201; 85%). More upper‐level residents disagreed with this assertion (91%) compared with interns (75%) (P<0.01). Responses to this question did not differ significantly between medical and surgical residents.
Upper‐level residents were more likely to disagree with the statement that the RRT resulted in fewer opportunities to care for unstable patients (n=129; 86%) compared with interns (n=59; 73%) (P=0.05). Medical residents were also more likely to disagree with this statement (n=136; 86%) compared with surgical residents (n=52; 72%) (P=0.04).
With respect to residents' overall impressions of the educational value of the RRT, 68 (83%) interns and 116 (77%) upper‐level residents agreed that it provided a valuable educational experience (P=0.61). Medical and surgical residents differed in this regard, with 134 (83%) medical residents and 50 (70%) surgical residents agreeing that the RRT provided a valuable educational experience (P=0.01).
Effect of the RRT on Clinical Autonomy
Of all residents, 123 (52%) disagreed that the bedside nurse should always contact the primary resident prior to calling the RRT; 76 (32%) agreed with this statement. Medicine residents were more likely to disagree with this approach (n=97; 60%) than were surgical residents (n=26; 36%) (P<0.01). There was no difference between interns and upper‐level residents in response to this question. Most of those who disagreed with this statement were medical residents, whereas most surgical residents (n=38; 54%) agreed that they should be contacted first (P<0.01).
There were no differences between interns and upper‐level residents with respect to perceptions of the RRT's impact on clinical autonomy: 11% of interns and 13% of residents agreed that the RRT decreased their clinical autonomy as a physician. There was no significant difference between medical and surgical residents' responses to this question.
The majority of residents (n=208; 88%) agreed that they and the RRT work together to make treatment decisions for patients. This was true regardless of year of training (P=0.61), but it was expressed more often among medical residents than surgical residents (n=151, 93% vs n=57, 83%; P=0.04).
DISCUSSION
Most studies examining the educational and cultural impact of RRTs exist in the nursing literature. These studies demonstrate that medical and surgical nurses are often reluctant to call the RRT for fear of criticism by the patient's physician.[5, 8, 9, 10, 11, 12, 13] In contrast, our data demonstrate that resident physicians across all levels of training and specialties have a positive view of the RRT and its role in patient care. The data support our hypothesis that although most residents perceive educational benefit from their interactions with the RRT, this perception is greater for less‐experienced residents and for those residents who routinely provide care for critically ill patients and serve as code team leaders. In addition, a minority of residents, irrespective of years of training or medical specialty, felt that the RRT negatively impacted their clinical autonomy.
Our data have several important implications. First, although over half of the residents surveyed had not been exposed to RRTs during medical school, and despite having no formal training on the role of the RRT during residency, most residents identified their interactions with the RRT as potential learning opportunities. This finding differs from that of Benin and colleagues, who suggested that RRTs might negatively impact residents' educational development and decrease opportunities for high‐stakes clinical reasoning by allowing the clinical decision‐making process to be driven by the RRT staff rather than the resident.[5] One possible explanation for this discrepancy is the variable makeup of the RRT at different institutions. At our medical center, the RRT is comprised of a critical care nurse and respiratory therapist, whereas at other institutions, the RRT may be led by a resident, fellow, attending hospitalist, or intensivist, any of whom might supersede the primary resident once the RRT is engaged.
In our study, the perceived educational benefit of the RRT was most pronounced with interns. Interns likely derive incrementally greater benefit from each encounter with an acutely decompensating patient than do senior residents, whether the RRT is present or not. Observing the actions of seasoned nurses and respiratory therapists may demonstrate new tools for interns to use in their management of such situations; for example, the RRT may suggest different modes of oxygen delivery or new diagnostic tests. The RRT also likely helps interns navigate the hospital system by assisting with decisions around escalation of care and serving as a liaison to ICU staff.
Our data also have implications for resident perceptions of clinical autonomy. Interns, far less experienced caring for unstable patients than upper‐level residents, expressed more concern about the RRT stripping them of opportunities to do so and about feeling less prepared to handle clinically deteriorating patients. Part of this perception may be due to interns feeling less comfortable taking charge of a patient's care in the presence of an experienced critical care nurse and respiratory therapist, both for reasons related to clinical experience and to a cultural hierarchy that often places the intern at the bottom of the authority spectrum. In addition, when the RRT is called on an intern's patient, the senior resident may accompany the intern to the bedside and guide the intern on his or her approach to the situation; in some cases, the senior resident may take charge, leaving the intern feeling less autonomous.
If training sessions could be developed to address not only clinical decision making, but also multidisciplinary team interactions and roles in the acute care setting, this may mitigate interns' concerns. Such curricula could also enhance residents' experience in interprofessional care, an aspect of clinical training that has become increasingly important in the age of limited duty hours and higher volume, and higher acuity inpatient censuses. An RRT model, like a code blue model, could be used in simulation‐based training to increase both comfort with use of the RRT and efficiency of the RRTresidentnurse team. Although our study did not address specifically residents' perceptions of multidisciplinary teams, this could be a promising area for further study.
For surgical residents, additional factors are likely at play. Surgical residents spend significant time in the operating room, reducing time present at the bedside and hindering the ability to respond swiftly when an RRT is called on their patient. This could cause surgical residents to feel less involved in the care of that patientsupported by our finding that fewer surgical residents felt able to collaborate with the RRTand also to derive less educational benefit and clinical satisfaction from the experience. Differences between medical and surgical postgraduate training also likely play a role, manifest by varying clinical roles and duration of training, and as such it may not be appropriate to draw direct comparisons between respective postgraduate year levels. In addition, differences in patients' medical complexity, varying allegiance to the traditional hierarchy of medical providers, and degree of familiarity with the RRT itself may impact surgical residents' comfort with the RRT.
Limitations of our study include that it was conducted at a single site and addressed a specific population of residents at our tertiary academic center. Though we achieved an excellent response rate, our subspecialty sample sizes were too small to allow for individual comparisons among those groups. Conducting a larger study at multiple institutions where the makeup of the RRT differs could provide further insight into how different clinical environments and different RRT models impact resident perceptions. Finally, we allowed each respondent to interpret both educational benefit and clinical autonomy in the context of their own level of training and clinical practice rather than providing strict definitions of these terms. There is no standardized definition of autonomy in the context of resident clinical practice, and we did not measure direct educational outcomes. Our study design therefore allowed only for measurement of perceptions of these concepts. Measurement of actual educational value of the RRTfor example, through direct clinical observation or by incorporating the RRT experience into an entrustable professional activitywould provide more quantitative evidence of the RRT's utility for our resident population. Future study in this area would help to support the development and ongoing assessment of RRT‐based curricula moving forward.
CONCLUSION
Our data show that resident physicians have a strongly favorable opinion of the RRT at our institution. Future studies should aim to quantify the educational benefit of RRTs for residents and identify areas for curricular development to enhance resident education as RRTs become more pervasive.
- Institute for Healthcare Improvement. Rapid response teams. Available at: http://www.ihi.org/topics/rapidresponseteams. Accessed May 5, 2014.
- , , , , . Rapid response teams: a systematic review and meta‐analysis. Arch Intern Med. 2010;170(1):18–26.
- , , , et al. Findings of the first consensus conference on medical emergency teams. Crit Care Med. 2006;34(9):2463–2478.
- , , , , , . Rapid response systems: a systematic review. Crit Care Med. 2007;35(5):1238–1243.
- , , , , . Defining impact of a rapid response team: qualitative study with nurses, physicians and hospital administrators. BMJ Qual Saf. 2012;21(5):391–398.
- , , . How RNs rescue patients: a qualitative study of RNs' perceived involvement in rapid response teams. Qual Saf Health Care. 2010;19(5):e13.
- , , , . Rapid response team approach to staff satisfaction. Orthop Nurs. 2008;27(5):266–271; quiz 272–273.
- , , , . Voices from the floor: nurses' perceptions of the medical emergency team. Intensive Crit Care Nurs. 2006;22(3):138–143.
- , , . Rapid response teams seen through the eyes of the nurse. Am J Nurs. 2010;110(6):28–34; quiz 35–36.
- , , , et al. What stops hospital clinical staff from following protocols? An analysis of the incidence and factors behind the failure of bedside clinical staff to activate the rapid response system in a multi‐campus Australian metropolitan healthcare service. BMJ Qual Saf. 2012;21(7):569–575.
- , , , et al. Resident and RN perceptions of the impact of a medical emergency team on education and patient safety in an academic medical center. Crit Care Med. 2009;37(12):3091–3096.
- , , , et al. Why don't hospital staff activate the rapid response system (RRS)? How frequently is it needed and can the process be improved? Implement Sci. 2011;6:39.
- , , , . Timing and teamwork–an observational pilot study of patients referred to a rapid response team with the aim of identifying factors amenable to re‐design of a rapid response system. Resuscitation. 2012;83(6):782–787.
Rapid response teams (RRTs) have been promoted by patient safety and quality‐improvement organizations as a strategy to reduce preventable in‐hospital deaths.[1] To date, critical analysis of RRTs has focused primarily on their impact on quality‐of‐care metrics.[2, 3, 4] Comparatively few studies have examined the cultural and educational impact of RRTs, particularly at academic medical centers, and those that do exist have focused almost exclusively on perceptions of nurses rather than resident physicians.[5, 6, 7, 8, 9, 10]
Although a prior study found that internal medicine and general surgery residents believed that RRTs improved patient safety, they were largely ambivalent about the RRT's impact on education and training.[11] To date, there has been no focused assessment of resident physician impressions of an RRT across years of training and medical specialty to inform the use of this multidisciplinary team as a component of their residency education.
We sought to determine whether resident physicians at a tertiary care academic medical center perceive educational benefit from collaboration with the RRT and whether they feel that the RRT adversely affects clinical autonomy.
METHODS
The Hospital
Moffitt‐Long Hospital, the tertiary academic medical center of the University of California, San Francisco (UCSF), is a 600‐bed acute care hospital that provides comprehensive critical care services and serves as a major referral center in northern California. There are roughly 5000 admissions to the hospital annually. At the time the study was conducted, there were approximately 200 RRT calls per 1000 adult hospital discharges.
The Rapid Response Team
The RRT is called to assess, triage, and treat patients who have experienced a decline in their clinical status short of a cardiopulmonary arrest. The RRT has been operational at UCSF since June 1, 2007, and is composed of a dedicated critical care nurse and respiratory therapist available 24 hours a day, 7 days a week. The RRT can be activated by any concerned staff member based on vital sign abnormalities, decreased urine output, changes in mental status, or any significant concern about the trajectory of the patient's clinical course.
When the RRT is called on a given patient, the patient's primary physician (at our institution, a resident) is also called to the bedside and works alongside the RRT to address the patient's acute clinical needs. The primary physician, bedside nurse, and RRT discuss the plan of care for the patient, including clinical evaluation, management, and the need for additional monitoring or a transition to a higher level of care. Residents at our institution receive no formal instruction regarding the role of the RRT or curriculum on interfacing with the RRT, and they do not serve as members of the RRT as part of a clinical rotation.
The Survey Process
Study subjects were asked via e‐mail to participate in a brief online survey. Subjects were offered the opportunity to win a $100 gift certificate in return for their participation. Weekly e‐mail reminders were sent for a period of 3 months or until a given subject had completed the survey. The survey was administered over a 3‐month period, from March through May, to allow time for residents to work with the RRT during the academic year. The Committee on Human Research at the University of California San Francisco Medical Center approved the study.
Target Population
All residents in specialties that involved direct patient care and the potential to use the adult RRT were included in the study. This included residents in the fields of internal medicine, neurology, general surgery, orthopedic surgery, neurosurgery, plastic surgery, urology, and otolaryngology (Table 1). Residents in pediatrics and obstetrics and gynecology were excluded, as emergencies in their patients are addressed by a pediatric RRT and an obstetric anesthesiologist, respectively. Residents in anesthesiology were excluded as they do not care for nonintensive care unit (ICU) patients as part of the primary team and are not involved in RRT encounters.
| Demographic | No. (%) |
|---|---|
| |
| Medical specialty | |
| Internal medicine | 145 (61.4) |
| Neurology | 18 (7.6) |
| General surgery | 31 (13.1) |
| Orthopedic surgery | 17 (7.2) |
| Neurosurgery | 4 (1.7) |
| Plastic surgery | 2 (0.8) |
| Urology | 9 (3.8) |
| Otolaryngology | 10 (4.2) |
| Years of postgraduate training | Average 2.34 (SD 1.41) |
| 1 | 83 (35.2) |
| 2 | 60 (25.4) |
| 3 | 55 (23.3) |
| 4 | 20 (8.5) |
| 5 | 8 (3.4) |
| 6 | 5 (2.1) |
| 7 | 5 (2.1) |
| Gender | |
| Male | 133 (56.4) |
| Female | 102 (43.2) |
| Had exposure to RRT during training | |
| Yes | 106 (44.9) |
| No | 127 (53.8) |
| Had previously initiated a call to the RRT | |
| Yes | 106 (44.9) |
| No | 128 (54.2) |
Survey Design
The resident survey contained 20 RRT‐related items and 7 demographic and practice items. Responses for RRT‐related questions utilized a 5‐point Likert scale ranging from strongly disagree to strongly agree. The survey was piloted prior to administration to check comprehension and interpretation by physicians with experience in survey writing (for the full survey, see Supporting Information, Appendix, in the online version of this article).
Survey Objectives
The survey was designed to capture the experiences of residents who had cared for a patient for whom the RRT had been activated. Data collected included residents' perceptions of the impact of the RRT on their residency education and clinical autonomy, the quality of care provided, patient safety, and hospital‐wide culture. Potential barriers to use of the RRT were also examined.
Outcomes
The study's primary outcomes included the perceived educational benefit of the RRT and its perceived impact on clinical autonomy. Secondary outcomes included the effect of years of training and resident specialty on both the perceived educational benefit and impact on clinical autonomy among our study group.
Statistical Analysis
Responses to each survey item were described for each specialty, and subgroup analysis was conducted. For years of training, that item was dichotomized into either 1 year (henceforth referred to as interns) or greater than 1 year (henceforth referred to as upper‐level residents). Resident specialty was dichotomized into medical fields (internal medicine and neurology) or surgical fields. For statistical analysis, agreement statements were collapsed to either disagree (strongly disagree/disagree), neutral, or agree (strongly agree/agree). The influence of years of resident training and resident specialty was assessed for all items in the survey using 2 or Fisher exact tests as appropriate for the 3 agreement categories. Analysis was conducted using SPSS 21.0 (IBM Corp., Armonk, NY).
RESULTS
There were 246 responses to the survey of a possible 342, yielding a response rate of 72% (Table 2). Ten respondents stated that they had never cared for a patient where the RRT had been activated. Given their lack of exposure to the RRT, these respondents were excluded from the analysis, yielding a final sample size of 236. The demographic and clinical practice characteristics of respondents are shown in Table 1.
| The resident | Strongly Disagree/Disagree, n (%) | Neutral, n (%) | Agree/ Strongly Agree, n (%) |
|---|---|---|---|
| |||
| Is comfortable managing the unstable patient without the RRT | 104 (44.1) | 64 (27.1) | 66 (28.0) |
| And RRT work together to make treatment decisions | 10 (4.2) | 13 (5.5) | 208 (88.1) |
| Believes there are fewer opportunities to care for unstable floor patients due to the RRT | 188 (79.7) | 26 (11.0) | 17 (7.2) |
| Feels less prepared to care for unstable patients due to the RRT | 201 (85.2) | 22 (9.3) | 13 (5.5) |
| Feels that working with the RRT creates a valuable educational experience | 9 (3.8) | 39 (16.5) | 184 (78.0) |
| Feels that nurses caring for the unstable patient should always contact them prior to contacting the RRT | 123 (52.1) | 33 (14.0) | 76 (32.2) |
| Would be unhappy with nurses calling RRT prior to contacting them | 141 (59.7) | 44 (18.6) | 51 (21.6) |
| Perceives that the presence of RRT decreases residents' autonomy | 179 (75.8) | 25 (10.6) | 28 (11.9) |
Demographics and Primary Outcomes
Interns comprised 83 (35%) of the respondents; the average time in postgraduate training was 2.34 years (standard deviation=1.41). Of respondents, 163 (69%) were in medical fields, and 73 (31%) were in surgical fields. Overall responses to the survey are shown in Table 2, and subgroup analysis is shown in Table 3.
| The resident | 1 Year, n=83, n (%) | >1 Year, n=153, n (%) | P Value | Medical, n=163, n (%) | Surgical, n=73, n (%) | P Value |
|---|---|---|---|---|---|---|
| ||||||
| Is comfortable managing the unstable patient without the RRT | 0.01 | <0.01 | ||||
| Strongly disagree/disagree | 39 (47.6) | 65 (42.8) | 67 (41.6) | 37 (50.7) | ||
| Neutral | 29 (35.4) | 35 (23.0) | 56 (34.8) | 8 (11.0) | ||
| Agree/strongly agree | 14 (17.1) | 52 (34.2) | 38 (23.6) | 28 (38.4) | ||
| And RRT work together to make treatment decisions | 0.61 | 0.04 | ||||
| Strongly disagree/disagree | 2 (2.4) | 8 (5.4) | 4 (2.5) | 6 (8.7) | ||
| Neutral | 5 (6.1) | 8 (5.4) | 7 (4.3) | 6 (8.7) | ||
| Agree/strongly agree | 75 (91.5) | 137 (89.3) | 151 (93.2) | 57 (82.6) | ||
| Believes there are fewer opportunities to care for unstable floor patients due to the RRT | 0.05 | 0.04 | ||||
| Strongly disagree/disagree | 59 (72.8) | 129 (86.0) | 136 (85.5) | 52 (72.2) | ||
| Neutral | 13 (16.0) | 13 (8.7) | 15 (9.4) | 11 (15.3) | ||
| Agree/strongly agree | 9 (11.1) | 8 (5.3) | 8 (5.0) | 9 (12.5) | ||
| Feels less prepared to care for unstable patients due to the RRT | <0.01 | 0.79 | ||||
| Strongly disagree/disagree | 62 (74.7) | 139 (90.8) | 140 (85.9) | 61 (83.6) | ||
| Neutral | 14 (16.9) | 8 (5.2) | 15 (9.2) | 7 (9.6) | ||
| Agree/Strongly agree | 7 (8.4) | 6 (3.9) | 8 (4.9) | 5 (6.8) | ||
| Feels working with the RRT is a valuable educational experience | 0.61 | 0.01 | ||||
| Strongly disagree/disagree | 2 (2.4) | 7 (4.7) | 2 (1.2) | 7 (9.9) | ||
| Neutral | 12 (14.6) | 27 (18.0) | 25 (15.5) | 14 (19.7) | ||
| Agree/strongly agree | 68 (82.9) | 116 (77.3) | 134 (83.2) | 50 (70.4) | ||
| Feels nurses caring for unstable patients should always contact the resident prior to contacting the RRT | 0.49 | <0.01 | ||||
| Strongly disagree/disagree | 47 (57.3) | 76 (50.7) | 97 (60.2) | 26 (36.6) | ||
| Neutral | 9 (11.0) | 24 (16.0) | 26 (16.1) | 7 (9.9) | ||
| Agree/strongly agree | 26 (31.7) | 50 (33.3) | 38 (23.6) | 38 (53.5) | ||
| Would be unhappy with nurses calling RRT prior to contacting them | 0.81 | <0.01 | ||||
| Strongly disagree/disagree | 51 (61.4) | 90 (58.8) | 109 (66.9) | 32 (43.8) | ||
| Neutral | 16 (19.3) | 28 (18.3) | 30 (18.4) | 14 (19.2) | ||
| Agree/strongly agree | 16 (19.3) | 35 (22.9) | 24 (14.7) | 27 (37.0) | ||
| Perceives that the presence of the RRT decreases autonomy as a physician | 0.95 | 0.18 | ||||
| Strongly disagree/disagree | 63 (77.8) | 116 (76.8) | 127 (79.9) | 52 (71.2) | ||
| Neutral | 9 (11.1) | 16 (10.6) | 17 (10.7) | 8 (11.0) | ||
| Agree/strongly agree | 9 (11.1) | 19 (12.6) | 15 (9.4) | 13 (17.8) | ||
Effect of the RRT on Resident Education
Of all residents, 66 (28%) agreed that they felt comfortable managing an unstable patient without the assistance of the RRT. Surgical residents felt more comfortable managing an unstable patient alone (38%) compared medical residents (24%) (P<0.01). Interns felt less comfortable caring for unstable patients without the RRT's assistance (17%) compared with upper‐level residents (34%) (P=0.01).
Residents overall disagreed with the statement that the RRT left them feeling less prepared to care for unstable patients (n=201; 85%). More upper‐level residents disagreed with this assertion (91%) compared with interns (75%) (P<0.01). Responses to this question did not differ significantly between medical and surgical residents.
Upper‐level residents were more likely to disagree with the statement that the RRT resulted in fewer opportunities to care for unstable patients (n=129; 86%) compared with interns (n=59; 73%) (P=0.05). Medical residents were also more likely to disagree with this statement (n=136; 86%) compared with surgical residents (n=52; 72%) (P=0.04).
With respect to residents' overall impressions of the educational value of the RRT, 68 (83%) interns and 116 (77%) upper‐level residents agreed that it provided a valuable educational experience (P=0.61). Medical and surgical residents differed in this regard, with 134 (83%) medical residents and 50 (70%) surgical residents agreeing that the RRT provided a valuable educational experience (P=0.01).
Effect of the RRT on Clinical Autonomy
Of all residents, 123 (52%) disagreed that the bedside nurse should always contact the primary resident prior to calling the RRT; 76 (32%) agreed with this statement. Medicine residents were more likely to disagree with this approach (n=97; 60%) than were surgical residents (n=26; 36%) (P<0.01). There was no difference between interns and upper‐level residents in response to this question. Most of those who disagreed with this statement were medical residents, whereas most surgical residents (n=38; 54%) agreed that they should be contacted first (P<0.01).
There were no differences between interns and upper‐level residents with respect to perceptions of the RRT's impact on clinical autonomy: 11% of interns and 13% of residents agreed that the RRT decreased their clinical autonomy as a physician. There was no significant difference between medical and surgical residents' responses to this question.
The majority of residents (n=208; 88%) agreed that they and the RRT work together to make treatment decisions for patients. This was true regardless of year of training (P=0.61), but it was expressed more often among medical residents than surgical residents (n=151, 93% vs n=57, 83%; P=0.04).
DISCUSSION
Most studies examining the educational and cultural impact of RRTs exist in the nursing literature. These studies demonstrate that medical and surgical nurses are often reluctant to call the RRT for fear of criticism by the patient's physician.[5, 8, 9, 10, 11, 12, 13] In contrast, our data demonstrate that resident physicians across all levels of training and specialties have a positive view of the RRT and its role in patient care. The data support our hypothesis that although most residents perceive educational benefit from their interactions with the RRT, this perception is greater for less‐experienced residents and for those residents who routinely provide care for critically ill patients and serve as code team leaders. In addition, a minority of residents, irrespective of years of training or medical specialty, felt that the RRT negatively impacted their clinical autonomy.
Our data have several important implications. First, although over half of the residents surveyed had not been exposed to RRTs during medical school, and despite having no formal training on the role of the RRT during residency, most residents identified their interactions with the RRT as potential learning opportunities. This finding differs from that of Benin and colleagues, who suggested that RRTs might negatively impact residents' educational development and decrease opportunities for high‐stakes clinical reasoning by allowing the clinical decision‐making process to be driven by the RRT staff rather than the resident.[5] One possible explanation for this discrepancy is the variable makeup of the RRT at different institutions. At our medical center, the RRT is comprised of a critical care nurse and respiratory therapist, whereas at other institutions, the RRT may be led by a resident, fellow, attending hospitalist, or intensivist, any of whom might supersede the primary resident once the RRT is engaged.
In our study, the perceived educational benefit of the RRT was most pronounced with interns. Interns likely derive incrementally greater benefit from each encounter with an acutely decompensating patient than do senior residents, whether the RRT is present or not. Observing the actions of seasoned nurses and respiratory therapists may demonstrate new tools for interns to use in their management of such situations; for example, the RRT may suggest different modes of oxygen delivery or new diagnostic tests. The RRT also likely helps interns navigate the hospital system by assisting with decisions around escalation of care and serving as a liaison to ICU staff.
Our data also have implications for resident perceptions of clinical autonomy. Interns, far less experienced caring for unstable patients than upper‐level residents, expressed more concern about the RRT stripping them of opportunities to do so and about feeling less prepared to handle clinically deteriorating patients. Part of this perception may be due to interns feeling less comfortable taking charge of a patient's care in the presence of an experienced critical care nurse and respiratory therapist, both for reasons related to clinical experience and to a cultural hierarchy that often places the intern at the bottom of the authority spectrum. In addition, when the RRT is called on an intern's patient, the senior resident may accompany the intern to the bedside and guide the intern on his or her approach to the situation; in some cases, the senior resident may take charge, leaving the intern feeling less autonomous.
If training sessions could be developed to address not only clinical decision making, but also multidisciplinary team interactions and roles in the acute care setting, this may mitigate interns' concerns. Such curricula could also enhance residents' experience in interprofessional care, an aspect of clinical training that has become increasingly important in the age of limited duty hours and higher volume, and higher acuity inpatient censuses. An RRT model, like a code blue model, could be used in simulation‐based training to increase both comfort with use of the RRT and efficiency of the RRTresidentnurse team. Although our study did not address specifically residents' perceptions of multidisciplinary teams, this could be a promising area for further study.
For surgical residents, additional factors are likely at play. Surgical residents spend significant time in the operating room, reducing time present at the bedside and hindering the ability to respond swiftly when an RRT is called on their patient. This could cause surgical residents to feel less involved in the care of that patientsupported by our finding that fewer surgical residents felt able to collaborate with the RRTand also to derive less educational benefit and clinical satisfaction from the experience. Differences between medical and surgical postgraduate training also likely play a role, manifest by varying clinical roles and duration of training, and as such it may not be appropriate to draw direct comparisons between respective postgraduate year levels. In addition, differences in patients' medical complexity, varying allegiance to the traditional hierarchy of medical providers, and degree of familiarity with the RRT itself may impact surgical residents' comfort with the RRT.
Limitations of our study include that it was conducted at a single site and addressed a specific population of residents at our tertiary academic center. Though we achieved an excellent response rate, our subspecialty sample sizes were too small to allow for individual comparisons among those groups. Conducting a larger study at multiple institutions where the makeup of the RRT differs could provide further insight into how different clinical environments and different RRT models impact resident perceptions. Finally, we allowed each respondent to interpret both educational benefit and clinical autonomy in the context of their own level of training and clinical practice rather than providing strict definitions of these terms. There is no standardized definition of autonomy in the context of resident clinical practice, and we did not measure direct educational outcomes. Our study design therefore allowed only for measurement of perceptions of these concepts. Measurement of actual educational value of the RRTfor example, through direct clinical observation or by incorporating the RRT experience into an entrustable professional activitywould provide more quantitative evidence of the RRT's utility for our resident population. Future study in this area would help to support the development and ongoing assessment of RRT‐based curricula moving forward.
CONCLUSION
Our data show that resident physicians have a strongly favorable opinion of the RRT at our institution. Future studies should aim to quantify the educational benefit of RRTs for residents and identify areas for curricular development to enhance resident education as RRTs become more pervasive.
- Institute for Healthcare Improvement. Rapid response teams. Available at: http://www.ihi.org/topics/rapidresponseteams. Accessed May 5, 2014.
- , , , , . Rapid response teams: a systematic review and meta‐analysis. Arch Intern Med. 2010;170(1):18–26.
- , , , et al. Findings of the first consensus conference on medical emergency teams. Crit Care Med. 2006;34(9):2463–2478.
- , , , , , . Rapid response systems: a systematic review. Crit Care Med. 2007;35(5):1238–1243.
- , , , , . Defining impact of a rapid response team: qualitative study with nurses, physicians and hospital administrators. BMJ Qual Saf. 2012;21(5):391–398.
- , , . How RNs rescue patients: a qualitative study of RNs' perceived involvement in rapid response teams. Qual Saf Health Care. 2010;19(5):e13.
- , , , . Rapid response team approach to staff satisfaction. Orthop Nurs. 2008;27(5):266–271; quiz 272–273.
- , , , . Voices from the floor: nurses' perceptions of the medical emergency team. Intensive Crit Care Nurs. 2006;22(3):138–143.
- , , . Rapid response teams seen through the eyes of the nurse. Am J Nurs. 2010;110(6):28–34; quiz 35–36.
- , , , et al. What stops hospital clinical staff from following protocols? An analysis of the incidence and factors behind the failure of bedside clinical staff to activate the rapid response system in a multi‐campus Australian metropolitan healthcare service. BMJ Qual Saf. 2012;21(7):569–575.
- , , , et al. Resident and RN perceptions of the impact of a medical emergency team on education and patient safety in an academic medical center. Crit Care Med. 2009;37(12):3091–3096.
- , , , et al. Why don't hospital staff activate the rapid response system (RRS)? How frequently is it needed and can the process be improved? Implement Sci. 2011;6:39.
- , , , . Timing and teamwork–an observational pilot study of patients referred to a rapid response team with the aim of identifying factors amenable to re‐design of a rapid response system. Resuscitation. 2012;83(6):782–787.
© 2015 Society of Hospital Medicine
Assessing the Reading Level of Online Sarcoma Patient Education Materials
The diagnosis of cancer is a life-changing event for the patient as well as the patient’s family, friends, and relatives. Once diagnosed, most cancer patients want more information about their prognosis, future procedures, and/or treatment options.1 Receiving such information has been shown to reduce patient anxiety, increase patient satisfaction with care, and improve self-care.2-6 With the evolution of the Internet, patients in general7-9 and, specifically, cancer patients10-17 have turned to websites and online patient education materials (PEMs) to gather more health information.
For online PEMs to convey health information, their reading level must match the health literacy of the individuals who access them. Health literacy is the ability of an individual to gather and comprehend information about their condition to make the best decisions for their health.18 According to a report by the Institute of Medicine, 90 million American adults cannot properly use the US health care system because they do not possess adequate health literacy.18 Additionally, 36% of adults in the United States have basic or less-than-basic health literacy.19 This is starkly contrasted with the 12% of US adults who have proficient health literacy. A 2012 survey showed that about 31% of individuals who look for health information on the Internet have a high school education or less.8 In order to address the low health literacy of adults, the National Institutes of Health (NIH) has recommended that online PEMs be written at a sixth- to seventh-grade reading level.20
Unfortunately, many online PEMs related to certain cancer21-25 and orthopedic conditions26-31 do not meet NIH recommendations. Only 1 study has specifically looked at PEMs related to an orthopedic cancer condition.32 Lam and colleagues32 evaluated the readability of osteosarcoma PEMs from 56 websites using only 2 readability instruments and identified 86% of the websites as having a greater than eighth-grade reading level. No study has thoroughly assessed the readability of PEMs about bone and soft-tissue sarcomas and related conditions nor has any used 10 different readability instruments. Since each readability instrument has different variables (eg, sentence length, number of paragraphs, or number of complex words), averaging the scores of 10 of these instruments may result in less bias.
The purpose of this study was to evaluate the readability of online PEMs concerning bone and soft-tissue sarcomas and related conditions. The online PEMs came from websites that sarcoma patients may visit to obtain information about their condition. Our hypothesis was that the majority of these online PEMs will have a higher reading level than the NIH recommendations.
Materials and Methods
In May 2013, we identified online PEMs that included background, diagnosis, tests, or treatments for bone and soft-tissue sarcomas and conditions that mimic bone sarcoma. We included articles from the Tumors section of the American Academy of Orthopaedic Surgeons (AAOS) website.33 A second source of online PEMs came from a list of academic training centers created through the American Medical Association’s Fellowship and Residency Electronic Internet Database (FREIDA) with search criteria narrowed to orthopedic surgery. If we did not find PEMs of bone and soft-tissue cancers in the orthopedic department of a given academic training center’s website, we searched its cancer center website. We chose 4 programs with PEMs relevant to bone and soft-tissue sarcomas from each region in FREIDA for a balanced representation, except for the Territory region because it had only 1 academic training center and no relevant PEMs. Specialized websites, including Bonetumor.org, Sarcoma Alliance (Sarcomaalliance.org), and Sarcoma Foundation of America (Curesarcoma.org), were also evaluated. Within the Sarcoma Specialists section of the Sarcoma Alliance website,34 sarcoma specialists who were not identified from the FREIDA search for academic training centers were selected for review.
Because 8 of 10 individuals looking for health information on the Internet start their investigation at search engines, we also looked for PEMs through a Google search (Google.com) of bone cancer, and evaluated the first 10 hits for PEMs.8 Of these 10 hits, 8 had relevant PEMs, which we searched for additional PEMs about bone and soft-tissue cancers and related conditions. We also conducted a Google search of the most common bone sarcoma and soft-tissue sarcoma, osteosarcoma and malignant fibrous histiocytoma, respectively, and found 2 additional websites with relevant PEMs. LaCoursiere and colleagues35 surveyed cancer patients who used the Internet and found that they preferred WebMD (Webmd.com) and Medscape (Medscape.com) as sources for content about their medical condition.35 WebMD had been identified in the Google search, and we gathered the PEMs from Medscape also. It is worth noting that some of these websites are written for patients as well as clinicians.
Text from these PEMs were copied and pasted into separate Microsoft Word documents (Microsoft, Redmond, Washington). Advertisements, pictures, picture text, hyperlinks, copyright notices, page navigation links, paragraphs with no text, and any text that was not related to the given condition were deleted from the document to format the text for the readability software. Then, each Microsoft Word document was uploaded into the software package Readability Studio Professional (RSP) Edition Version 2012.1 for Windows (Oleander Software, Vandalia, Ohio). The 10 distinct readability instruments that were used to gauge the readability of each document were the Flesch Reading Ease score (FRE), the New Fog Count, the New Automated Readability Index, the Coleman-Liau Index (CLI), the Fry readability graph, the New Dale-Chall formula (NDC), the Gunning Frequency of Gobbledygook (Gunning FOG), the Powers-Sumner-Kearl formula, the Simple Measure of Gobbledygook (SMOG), and the Raygor Estimate Graph.
The FRE’s formula takes the average number of words per sentence and average number of syllables per word to compute a score ranging from 0 to 100 with 0 being the hardest to read.36 The New Fog Count tallies the number of sentences, easy words, and hard words (polysyllables) to calculate the grade level of the document.37 The New Automated Readability Index takes the average characters per word and average words per sentence to calculate a grade level for the document.37 The CLI randomly samples a few hundred words from the document, averages the number of letters and sentences per sample, and calculates an estimated grade level.38 The Fry readability graph selects samples of 100 words from the document, averages the number of syllables and sentences per 100 words, plots these data points on a graph, with the intersection determining the reading level.39 The NDC uses a list of 3000 familiar words that most fourth-grade students know.40 The percentage of difficult words, which are not on the list of familiar words, and the average sentence length in words are used to calculate the reading grade level of the document. The Gunning FOG uses the average sentence length in words and the percentage of hard words from a sample of at least 100 words to determine the reading grade level of the document.41 The Powers-Sumner-Kearl formula uses the average sentence length and percentage of monosyllables from a 100-word sample passage to calculate the reading grade level.42 The SMOG formula counts the number of polysyllabic words from 30 sentences and calculates the reading grade level of the document.43 In contrast to other formulas that test for 50% to 75% comprehension, the SMOG formula tests for 100% comprehension. As a result, the SMOG formula generally assigns a reading level 2 grades higher than the Dale-Chall level. The Raygor Estimate Graph selects a 100-word passage, counts the number of sentences and number of words with 6 or more letters, and plots the 2 variables on a graph to determine the reading grade level.44 The software package calculated the results from each reading instrument and reported the mean grade level score
for each document.
Results
We identified a total of 72 websites with relevant PEMs and included them in this study. Of these 72 websites, 36 websites were academic training centers, 10 were Google search hits, and 21 were from the Sarcoma Alliance list of sarcoma specialists. The remaining 5 websites were AAOS, Bonetumor.org, Sarcoma Alliance, Sarcoma Foundation of America, and Medscape. A list of conditions and treatments that were considered relevant PEMs is found in Appendix 1. A total of 774 articles were obtained from the 72 websites.
None of the websites had a mean readability score of 7 (seventh grade) or lower (Figures 1A, 1B). Mid-America Sarcoma Institute’s PEMs had the lowest mean readability score, 8.9. The lowest readability score was 5.3, which the New Fog Count readability instrument calculated for Vanderbilt University Medical Center’s (VUMC’s) PEMs (Appendix 2). The mean readability score of all websites was 11.4 (range, 8.9-15.5) (Appendix 2).
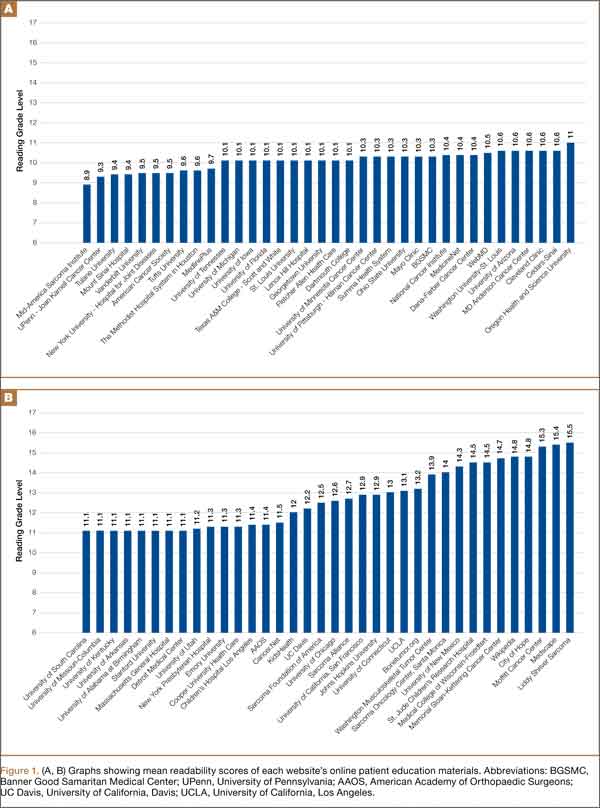
Seventy of 72 websites (97%) had PEMs that were fairly difficult or difficult, according to the FRE analysis (Figure 2). The American Cancer Society and Mid-America Sarcoma Institute had PEMs that were written in plain English. Sixty-nine of 72 websites (96%) had PEMs with a readability score of 10 or higher, according to the Raygor readability estimate (Figure 3). Using this instrument, the scores of the American Cancer Society and the University of Pennsylvania–Joan Karnell Cancer Center were 9; Mid-America Sarcoma Institute’s score was 8.
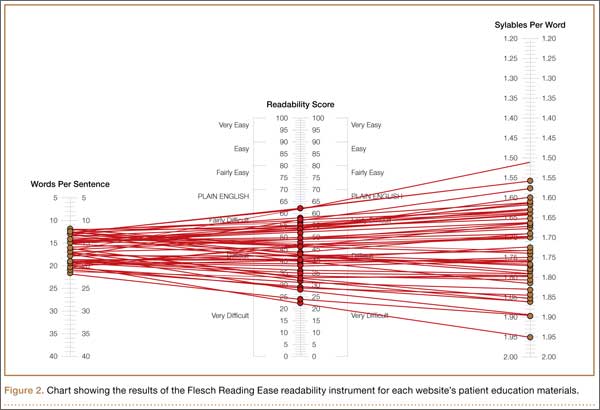
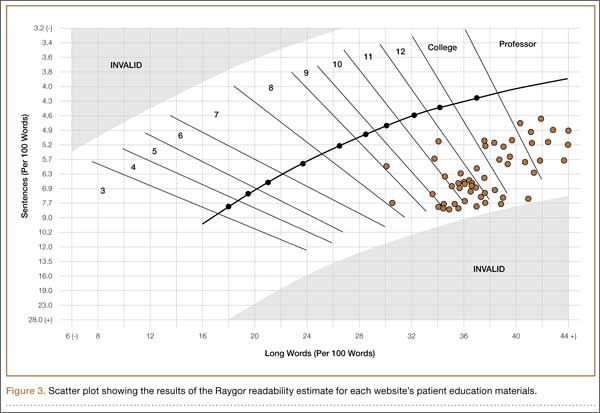
Discussion
Many cancer patients have turned to websites and online PEMs to gather health information about their condition.10-17 Basch and colleagues10 reported almost a decade ago that 44% of cancer patients, as well as 60% of their companions, used the Internet to find cancer-related information.10 When LaCoursiere and colleagues35 surveyed cancer patients, they found that patients handled their condition better and had less anxiety and uncertainty after using the Internet to find health information and support.35 In addition, many orthopedic patients, specifically 46% of orthopedic community outpatients,45 consult the Internet for information about their condition and future surgical procedures.46,47
This study comprehensively evaluated the readability of online PEMs of bone and soft-tissue sarcomas and related conditions by using 10 different readability instruments. After identifying 72 websites and 774 articles, we found that all 72 websites’ PEMs had a mean readability score that did not meet the NIH recommendation of writing PEMs at a sixth- to seventh-grade reading level. These results are consistent with studies evaluating the readability of online PEMs related to other cancer conditions21-25 and other orthopedic conditions.26-31
The combination of low health literacy of many US adults and high reading grade levels of the majority of online PEMs is not conducive to patients’ better understanding their condition(s). Even individuals with high reading skills prefer information that is simpler to read.48 In many areas of medicine, there is evidence that patients’ understanding of their condition has a positive impact on health outcomes, well-being, and the patient–physician relationship.49-61 Regarding cancer patients, Davis and colleagues54 and Peterson and colleagues57 showed that lower health literacy contributes to less knowledge and lower rates of breast54 and colorectal cancer57 screening tests. Even low health literacy of family caregivers of cancer patients can result in increased stress and lack of communication of important medical information between caregiver and physician.52 Among cancer patients, poor health literacy has been associated with mental distress60 as well as decreased compliance with treatment and lower involvement in clinical trials.55
The disparity between patients’ health literacy and the readability of online PEMs needs to be addressed by finding methods to improve patients’ understanding of their condition and to lower the readability scores of online PEMs. Better communication between patient and physician may improve patients’ comprehension of their condition and different aspects of their care.59,62-66 Doak and colleagues63 recommend giving cancer patients the most important information first; presenting information to patients in smaller doses; intermittently asking patients questions; and incorporating graphs, tables, and drawings into communication with patients.63 Additionally, allowing patients to repeat information they have just received/heard to the physician is another useful tool to improve patient education.62,64-66
Another way to address the disparity between patients’ health literacy and the readability of online PEMs is to reduce the reading grade level of existing PEMs. According to results from this study and others, the majority of online PEMs are above the reading grade level of a significant number of US adults. Many available and inexpensive readability instruments allow authors to assess their articles’ readability. Many writing guidelines also exist to help authors improve the readability of their PEMs.20,64,67-71 Living Word Vocabulary70 and Plain Language71 help authors replace complex words or medical terms with simpler words.29 Visual aids, audio, and video help patients with low health literacy remember the information.64
Efforts to improve PEM readability are effective. Of all the websites reviewed, VUMC was identified as having PEMs with the lowest readability score (5.3). This score was reported by the New Fog Count readability instrument, which accounts for the number of sentences, easy words, and hard words. In 2011, VUMC formed the Department of Patient Education to review and update its online and printed PEMs to make sure patients could read them.72 Additionally, the mean readability scores of the websites of the National Cancer Institute and MedlinePlus are in the top 50% of the websites included in this study. The NIH sponsors both sites, which follow the NIH guidelines for writing online PEMs at a reading level suitable for individuals with lower health literacy.20 These materials serve as potential models to improve the readability of PEMs, and, thus, help patients to better understand their condition, medical procedures, and/or treatment options.
To illustrate ways to improve the reading grade level of PEMs, we used the article “Ewing’s Sarcoma” from the AAOS website73 and followed the NIH guidelines to improve the reading grade level of the article.20 We identified complex words and defined them at an eighth-grade reading level. If that word was mentioned later in the article, simpler terminology was used instead of the initial complex word. For example, Ewing’s sarcoma was defined early and then referred to as bone tumor later in the article. We also identified every word that was 3 syllables or longer and used Microsoft Word’s thesaurus to replace those words with ones that were less than 3 syllables. Lastly, all sentences longer than 15 words were rewritten to be less than 15 words. After making these 3 changes to the article, the mean reading grade level dropped from 11.2 to 7.3.
This study has limitations. First, some readability instruments evaluate the number of syllables per word or polysyllabic words as part of their formula and, thus, can underestimate or overestimate the reading grade level of a document. Some readability formulas consider medical terms such as ulna, femur, or carpal as “easy” words because they have 2 syllables, but many laypersons may not comprehend these words. On the other hand, some readability formulas consider medical terms such as medications, diagnosis, or radiation as “hard” words because they contain 3 or more syllables, but the majority of laypersons likely comprehend these words. Second, the reading level of the patient population accessing those online sites was not assessed. Third, the readability instruments in this study did not evaluate the accuracy of the content, pictures, or tables of the PEMs. However, using 10 readability instruments allowed evaluation of many different readability aspects of the text. Fourth, because some websites identified in this study, such as Bonetumor.org, were written for patients as well as clinicians, the reading grade level of these sites may be higher than that of those sites written just for patients.
Conclusion
Because many orthopedic cancer patients rely on the Internet as a source of information, the need for online PEMs to match the reading skills of the patient population who accesses them is vital. However, this study shows that many organizations, academic training centers, and other entities need to update their online PEMs because all PEMs in this study had a mean readability grade level higher than the NIH recommendation. Further research needs to evaluate the effectiveness of other media, such as video, illustrations, and audio, to provide health information to patients. With many guidelines available that provide plans and advice to improve the readability of PEMs, research also must assess the most effective plans and advice in order to allow authors to focus their attention on 1 set of guidelines to improve the readability of their PEMs.
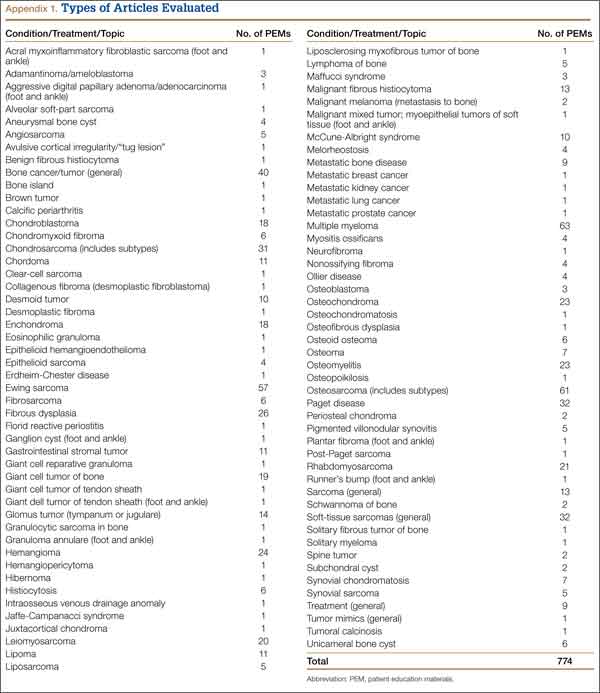
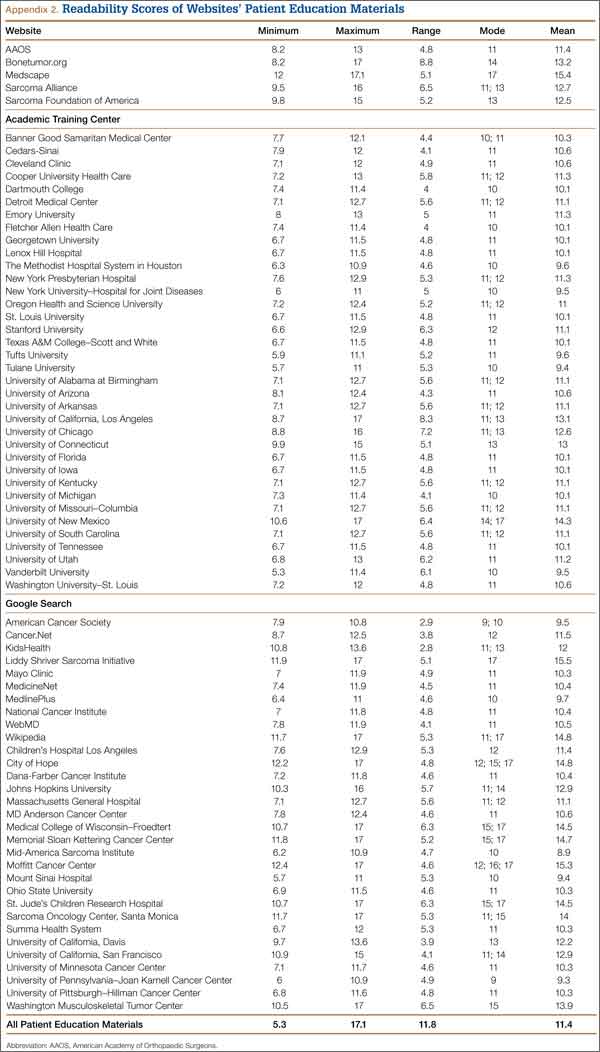
1. Piredda M, Rocci L, Gualandi R, Petitti T, Vincenzi B, De Marinis MG. Survey on learning needs and preferred sources of information to meet these needs in Italian oncology patients receiving chemotherapy. Eur J Oncol Nurs. 2008;12(2):120-126.
2. Fernsler JI, Cannon CA. The whys of patient education. Semin Oncol Nurs. 1991;7(2):79-86.
3. Glimelius B, Birgegård G, Hoffman K, Kvale G, Sjödén PO. Information to and communication with cancer patients: improvements and psychosocial correlates in a comprehensive care program for patients and their relatives. Patient Educ Couns. 1995;25(2):171-182.
4. Harris KA. The informational needs of patients with cancer and their families. Cancer Pract. 1998;6(1):39-46.
5. Jensen AB, Madsen B, Andersen P, Rose C. Information for cancer patients entering a clinical trial--an evaluation of an information strategy. Eur J Cancer. 1993;29A(16):2235-2238.
6. Wells ME, McQuellon RP, Hinkle JS, Cruz JM. Reducing anxiety in newly diagnosed cancer patients: a pilot program. Cancer Pract. 1995;3(2):100-104.
7. Diaz JA, Griffith RA, Ng JJ, Reinert SE, Friedmann PD, Moulton AW. Patients’ use of the Internet for medical information. J Gen Intern Med. 2002;17(3):180-185.
8. Fox S, Duggan M. Health Online 2013. Pew Research Center’s Internet and American Life Project. www.pewinternet.org/~/media//Files/Reports/PIP_HealthOnline.pdf. Published January 15, 2013. Accessed November 18. 2014.
9. Schwartz KL, Roe T, Northrup J, Meza J, Seifeldin R, Neale AV. Family medicine patients’ use of the Internet for health information: a MetroNet study. J Am Board Fam Med. 2006;19(1):39-45.
10. Basch EM, Thaler HT, Shi W, Yakren S, Schrag D. Use of information resources by patients with cancer and their companions. Cancer. 2004;100(11):2476-2483.
11. Huang GJ, Penson DF. Internet health resources and the cancer patient. Cancer Invest. 2008;26(2):202-207.
12. Metz JM, Devine P, Denittis A, et al. A multi-institutional study of Internet utilization by radiation oncology patients. Int J Radiat Oncol Biol Phys. 2003;56(4):1201-1205.
13. Peterson MW, Fretz PC. Patient use of the internet for information in a lung cancer clinic. Chest. 2003;123(2):452-457.
14. Satterlund MJ, McCaul KD, Sandgren AK. Information gathering over time by breast cancer patients. J Med Internet Res. 2003;5(3):e15.
15. Tustin N. The role of patient satisfaction in online health information seeking. J Health Commun. 2010;15(1):3-17.
16. Van de Poll-Franse LV, Van Eenbergen MC. Internet use by cancer survivors: current use and future wishes. Support Care Cancer. 2008;16(10):1189-1195.
17. Ziebland S, Chapple A, Dumelow C, Evans J, Prinjha S, Rozmovits L. How the internet affects patients’ experience of cancer: a qualitative study. BMJ. 2004;328(7439):564.
18. Committee on Health Literacy, Board on Neuroscience and Behavioral Health, Institute of Medicine. Nielsen-Bohlman L, Panzer AM, Kindig DA, eds. Health Literacy: A Prescription to End Confusion. Washington, DC: National Academies Press; 2004. Available at: www.nap.edu/openbook.php?record_id=10883. Accessed November 18, 2014.
19. Kutner M, Greenberg E, Ying J, Paulsen C. The Health Literacy of America’s Adults: Results from the 2003 National Assessment of Adult Literacy. NCES 2006-483. US Department of Education. Washington, DC: National Center for Education Statistics; 2006. Available at: www.nces.ed.gov/pubs2006/2006483.pdf. Accessed November 18, 2014.
20. How to write easy-to-read health materials. MedlinePlus website. www.nlm.nih.gov/medlineplus/etr.html. Updated February 13, 2013. Accessed November 18, 2014.
21. Ellimoottil C, Polcari A, Kadlec A, Gupta G. Readability of websites containing information about prostate cancer treatment options. J Urol. 2012;188(6):2171-2175.
22. Friedman DB, Hoffman-Goetz L, Arocha JF. Health literacy and the World Wide Web: comparing the readability of leading incident cancers on the Internet. Med Inform Internet Med. 2006;31(1):67-87.
23. Hoppe IC. Readability of patient information regarding breast cancer prevention from the Web site of the National Cancer Institute. J Cancer Educ. 2010;25(4):490-492.
24. Misra P, Kasabwala K, Agarwal N, Eloy JA, Liu JK. Readability analysis of internet-based patient information regarding skull base tumors. J Neurooncol. 2012;109(3):573-580.
25. Stinson JN, White M, Breakey V, et al. Perspectives on quality and content of information on the internet for adolescents with cancer. Pediatr Blood Cancer. 2011;57(1):97-104.
26. Badarudeen S, Sabharwal S. Readability of patient education materials from the American Academy of Orthopaedic Surgeons and Pediatric Orthopaedic Society of North America web sites. J Bone Joint Surg Am. 2008;90(1):199-204.
27. Bluman EM, Foley RP, Chiodo CP. Readability of the Patient Education Section of the AOFAS Website. Foot Ankle Int. 2009;30(4):287-291.
28. Polishchuk DL, Hashem J, Sabharwal S. Readability of online patient education materials on adult reconstruction Web sites. J Arthroplasty. 2012;27(5):716-719.
29. Sabharwal S, Badarudeen S, Unes Kunju S. Readability of online patient education materials from the AAOS web site. Clin Orthop. 2008;466(5):1245-1250.
30. Vives M, Young L, Sabharwal S. Readability of spine-related patient education materials from subspecialty organization and spine practitioner websites. Spine. 2009;34(25):2826-2831.
31. Wang SW, Capo JT, Orillaza N. Readability and comprehensibility of patient education material in hand-related web sites. J Hand Surg Am. 2009;34(7):1308-1315.
32. Lam CG, Roter DL, Cohen KJ. Survey of quality, readability, and social reach of websites on osteosarcoma in adolescents. Patient Educ Couns. 2013;90(1):82-87.
33. Tumors. Quinn RH, ed. OrthoInfo. American Academy of Orthopaedic Surgeons website. http://orthoinfo.aaos.org/menus/tumors.cfm. Accessed November 18, 2014.
34. Sarcoma specialists. Sarcoma Alliance website. sarcomaalliance.org/sarcoma-centers. Accessed November 18, 2014.
35. LaCoursiere SP, Knobf MT, McCorkle R. Cancer patients’ self-reported attitudes about the Internet. J Med Internet Res. 2005;7(3):e22.
36. Test your document’s readability. Microsoft Office website. office.microsoft.com/en-us/word-help/test-your-document-s-readability-HP010148506.aspx. Accessed November 18, 2014.
37. Kincaid JP, Fishburne RP, Rogers RL, Chissom BS. Derivation of new readability formulas (Automated Readability Index, Fog Count and Flesch Reading Ease Formula) for Navy enlisted personnel. Naval Technical Training Command. Research Branch Report 8-75. www.dtic.mil/dtic/tr/fulltext/u2/a006655.pdf. Published February 1975. Accessed November 18, 2014.
38. Coleman M, Liau TL. A computer readability formula designed for machine scoring. J Appl Psychol. 1975;60(2):283-284.
39. Fry E. Fry’s readability graph: clarifications, validity, and extension to Level 17. J Reading. 1977;21(3):242-252.
40. Chall JS, Dale E. Manual for the New Dale-Chall Readability Formula. Cambridge, MA: Brookline Books; 1995.
41. Gunning R. The Technique of Clear Writing. Rev. ed. New York, NY: McGraw-Hill; 1968.
42. Powers RD, Sumner WA, Kearl BE. A recalculation of four adult readability formulas. J Educ Psychol. 1958;49(2):99-105.
43. McLaughlin GH. SMOG grading—a new readability formula. J Reading. 1969;22,639-646.
44. Raygor L. The Raygor readability estimate: a quick and easy way to determine difficulty. In: Pearson PD, Hansen J, eds. Reading Theory, Research and Practice. Twenty-Sixth Yearbook of the National Reading Conference. Clemson, SC: National Reading Conference Inc; 1977:259-263.
45. Krempec J, Hall J, Biermann JS. Internet use by patients in orthopaedic surgery. Iowa Orthop J. 2003;23:80-82.
46. Beall MS, Golladay GJ, Greenfield ML, Hensinger RN, Biermann JS. Use of the Internet by pediatric orthopaedic outpatients. J Pediatr Orthop. 2002;22(2):261-264.
47. Beall MS, Beall MS, Greenfield ML, Biermann JS. Patient Internet use in a community outpatient orthopaedic practice. Iowa Orthop J. 2002;22:103-107.
48. Davis TC, Bocchini JA, Fredrickson D, et al. Parent comprehension of polio vaccine information pamphlets. Pediatrics. 1996;97(6 Pt 1):804-810.
49. Apter AJ, Wan F, Reisine S, et al. The association of health literacy with adherence and outcomes in moderate-severe asthma. J Allergy Clin Immunol. 2013;132(2):321-327.
50. Baker DW, Parker RM, Williams MV, Clark WS. Health literacy and the risk of hospital admission. J Gen Intern Med. 1998;13(12):791-798.
51. Berkman ND, Sheridan SL, Donahue KE, Halpern DJ, Crotty K. Low health literacy and health outcomes: an updated systematic review. Ann Intern Med. 2011;155(2):97-107.
52. Bevan JL, Pecchioni LL. Understanding the impact of family caregiver cancer literacy on patient health outcomes. Patient Educ Couns. 2008;71(3):356-364.
53. Corey MR, St Julien J, Miller C, et al. Patient education level affects functionality and long term mortality after major lower extremity amputation. Am J Surg. 2012;204(5):626-630.
54. Davis TC, Arnold C, Berkel HJ, Nandy I, Jackson RH, Glass J. Knowledge and attitude on screening mammography among low-literate, low-income women. Cancer. 1996;78(9):1912-1920.
55. Davis TC, Williams MV, Marin E, Parker RM, Glass J. Health literacy and cancer communication. CA Cancer J Clin. 2002;52(3):134-149.
56. Freedman RB, Jones SK, Lin A, Robin AL, Muir KW. Influence of parental health literacy and dosing responsibility on pediatric glaucoma medication adherence. Arch Ophthalmol. 2012;130(3):306-311.
57. Peterson NB, Dwyer KA, Mulvaney SA, Dietrich MS, Rothman RL. The influence of health literacy on colorectal cancer screening knowledge, beliefs and behavior. J Natl Med Assoc. 2007;99(10):1105-1112.
58. Peterson PN, Shetterly SM, Clarke CL, et al. Health literacy and outcomes among patients with heart failure. JAMA. 2011;305(16):1695-1701.
59. Rosas-salazar C, Apter AJ, Canino G, Celedón JC. Health literacy and asthma. J Allergy Clin Immunol. 2012;129(4):935-942.
60. Song L, Mishel M, Bensen JT, et al. How does health literacy affect quality of life among men with newly diagnosed clinically localized prostate cancer? Findings from the North Carolina-Louisiana Prostate Cancer Project (PCaP). Cancer. 2012;118(15):3842-3851.
61. Williams MV, Davis T, Parker RM, Weiss BD. The role of health literacy in patient-physician communication. Fam Med. 2002;34(5):383-389.
62. Badarudeen S, Sabharwal S. Assessing readability of patient education materials: current role in orthopaedics. Clin Orthop. 2010;468(10):2572-2580.
63. Doak CC, Doak LG, Friedell GH, Meade CD. Improving comprehension for cancer patients with low literacy skills: strategies for clinicians. CA Cancer J Clin. 1998;48(3):151-162.
64. Doak CC, Doak LG, Root JH. Teaching Patients With Low Literacy Skills. 2nd ed. Philadelphia, PA: JB Lippincott Company; 1996.
65. Kemp EC, Floyd MR, McCord-Duncan E, Lang F. Patients prefer the method of “tell back-collaborative inquiry” to assess understanding of medical information. J Am Board Fam Med. 2008;21(1):24-30.
66. Kripalani S, Bengtzen R, Henderson LE, Jacobson TA. Clinical research in low-literacy populations: using teach-back to assess comprehension of informed consent and privacy information. IRB. 2008;30(2):13-19.
67. Centers for Disease Control and Prevention. Simply Put: A Guide For Creating Easy-to-Understand Materials. 3rd ed. Atlanta, GA: Strategic and Proactive Communication Branch, Centers for Disease Control and Prevention, US Dept of Health and Human Services; 2009.
68. National Institutes of Health, National Cancer Institute. Clear & Simple: Developing Effective Print Materials for Low-Literate Readers. Devcompage website. http://devcompage.com/wp-content/uploads/2010/12/Clear_n_Simple.pdf Published March 2, 1998. Accessed December 1, 2014.
69. Weiss BD. Health Literacy and Patient Safety: Help Patients Understand. 2nd ed. Chicago, IL: American Medical Association and AMA Foundation; 2007:35-41.
70. Dale E, O’Rourke J. The Living Word Vocabulary. Newington, CT: World Book-Childcraft International, 1981.
71. Word suggestions. Plain Language website. www.plainlanguage.gov/howto/wordsuggestions/index.cfm. Accessed November 18, 2014.
72. Rivers K. Initiative aims to enhance patient communication materials. Reporter: Vanderbilt University Medical Center’s Weekly Newspaper. April 28, 2011. http://www.mc.vanderbilt.edu/reporter/index.html?ID=10649. Accessed November 18, 2014.
73. Ewing’s sarcoma. OrthoInfo. American Academy of Orthopaedic Surgeons website. http://orthoinfo.aaos.org/topic.cfm?topic=A00082. Last reviewed September 2011. Accessed November 18, 2014.
The diagnosis of cancer is a life-changing event for the patient as well as the patient’s family, friends, and relatives. Once diagnosed, most cancer patients want more information about their prognosis, future procedures, and/or treatment options.1 Receiving such information has been shown to reduce patient anxiety, increase patient satisfaction with care, and improve self-care.2-6 With the evolution of the Internet, patients in general7-9 and, specifically, cancer patients10-17 have turned to websites and online patient education materials (PEMs) to gather more health information.
For online PEMs to convey health information, their reading level must match the health literacy of the individuals who access them. Health literacy is the ability of an individual to gather and comprehend information about their condition to make the best decisions for their health.18 According to a report by the Institute of Medicine, 90 million American adults cannot properly use the US health care system because they do not possess adequate health literacy.18 Additionally, 36% of adults in the United States have basic or less-than-basic health literacy.19 This is starkly contrasted with the 12% of US adults who have proficient health literacy. A 2012 survey showed that about 31% of individuals who look for health information on the Internet have a high school education or less.8 In order to address the low health literacy of adults, the National Institutes of Health (NIH) has recommended that online PEMs be written at a sixth- to seventh-grade reading level.20
Unfortunately, many online PEMs related to certain cancer21-25 and orthopedic conditions26-31 do not meet NIH recommendations. Only 1 study has specifically looked at PEMs related to an orthopedic cancer condition.32 Lam and colleagues32 evaluated the readability of osteosarcoma PEMs from 56 websites using only 2 readability instruments and identified 86% of the websites as having a greater than eighth-grade reading level. No study has thoroughly assessed the readability of PEMs about bone and soft-tissue sarcomas and related conditions nor has any used 10 different readability instruments. Since each readability instrument has different variables (eg, sentence length, number of paragraphs, or number of complex words), averaging the scores of 10 of these instruments may result in less bias.
The purpose of this study was to evaluate the readability of online PEMs concerning bone and soft-tissue sarcomas and related conditions. The online PEMs came from websites that sarcoma patients may visit to obtain information about their condition. Our hypothesis was that the majority of these online PEMs will have a higher reading level than the NIH recommendations.
Materials and Methods
In May 2013, we identified online PEMs that included background, diagnosis, tests, or treatments for bone and soft-tissue sarcomas and conditions that mimic bone sarcoma. We included articles from the Tumors section of the American Academy of Orthopaedic Surgeons (AAOS) website.33 A second source of online PEMs came from a list of academic training centers created through the American Medical Association’s Fellowship and Residency Electronic Internet Database (FREIDA) with search criteria narrowed to orthopedic surgery. If we did not find PEMs of bone and soft-tissue cancers in the orthopedic department of a given academic training center’s website, we searched its cancer center website. We chose 4 programs with PEMs relevant to bone and soft-tissue sarcomas from each region in FREIDA for a balanced representation, except for the Territory region because it had only 1 academic training center and no relevant PEMs. Specialized websites, including Bonetumor.org, Sarcoma Alliance (Sarcomaalliance.org), and Sarcoma Foundation of America (Curesarcoma.org), were also evaluated. Within the Sarcoma Specialists section of the Sarcoma Alliance website,34 sarcoma specialists who were not identified from the FREIDA search for academic training centers were selected for review.
Because 8 of 10 individuals looking for health information on the Internet start their investigation at search engines, we also looked for PEMs through a Google search (Google.com) of bone cancer, and evaluated the first 10 hits for PEMs.8 Of these 10 hits, 8 had relevant PEMs, which we searched for additional PEMs about bone and soft-tissue cancers and related conditions. We also conducted a Google search of the most common bone sarcoma and soft-tissue sarcoma, osteosarcoma and malignant fibrous histiocytoma, respectively, and found 2 additional websites with relevant PEMs. LaCoursiere and colleagues35 surveyed cancer patients who used the Internet and found that they preferred WebMD (Webmd.com) and Medscape (Medscape.com) as sources for content about their medical condition.35 WebMD had been identified in the Google search, and we gathered the PEMs from Medscape also. It is worth noting that some of these websites are written for patients as well as clinicians.
Text from these PEMs were copied and pasted into separate Microsoft Word documents (Microsoft, Redmond, Washington). Advertisements, pictures, picture text, hyperlinks, copyright notices, page navigation links, paragraphs with no text, and any text that was not related to the given condition were deleted from the document to format the text for the readability software. Then, each Microsoft Word document was uploaded into the software package Readability Studio Professional (RSP) Edition Version 2012.1 for Windows (Oleander Software, Vandalia, Ohio). The 10 distinct readability instruments that were used to gauge the readability of each document were the Flesch Reading Ease score (FRE), the New Fog Count, the New Automated Readability Index, the Coleman-Liau Index (CLI), the Fry readability graph, the New Dale-Chall formula (NDC), the Gunning Frequency of Gobbledygook (Gunning FOG), the Powers-Sumner-Kearl formula, the Simple Measure of Gobbledygook (SMOG), and the Raygor Estimate Graph.
The FRE’s formula takes the average number of words per sentence and average number of syllables per word to compute a score ranging from 0 to 100 with 0 being the hardest to read.36 The New Fog Count tallies the number of sentences, easy words, and hard words (polysyllables) to calculate the grade level of the document.37 The New Automated Readability Index takes the average characters per word and average words per sentence to calculate a grade level for the document.37 The CLI randomly samples a few hundred words from the document, averages the number of letters and sentences per sample, and calculates an estimated grade level.38 The Fry readability graph selects samples of 100 words from the document, averages the number of syllables and sentences per 100 words, plots these data points on a graph, with the intersection determining the reading level.39 The NDC uses a list of 3000 familiar words that most fourth-grade students know.40 The percentage of difficult words, which are not on the list of familiar words, and the average sentence length in words are used to calculate the reading grade level of the document. The Gunning FOG uses the average sentence length in words and the percentage of hard words from a sample of at least 100 words to determine the reading grade level of the document.41 The Powers-Sumner-Kearl formula uses the average sentence length and percentage of monosyllables from a 100-word sample passage to calculate the reading grade level.42 The SMOG formula counts the number of polysyllabic words from 30 sentences and calculates the reading grade level of the document.43 In contrast to other formulas that test for 50% to 75% comprehension, the SMOG formula tests for 100% comprehension. As a result, the SMOG formula generally assigns a reading level 2 grades higher than the Dale-Chall level. The Raygor Estimate Graph selects a 100-word passage, counts the number of sentences and number of words with 6 or more letters, and plots the 2 variables on a graph to determine the reading grade level.44 The software package calculated the results from each reading instrument and reported the mean grade level score
for each document.
Results
We identified a total of 72 websites with relevant PEMs and included them in this study. Of these 72 websites, 36 websites were academic training centers, 10 were Google search hits, and 21 were from the Sarcoma Alliance list of sarcoma specialists. The remaining 5 websites were AAOS, Bonetumor.org, Sarcoma Alliance, Sarcoma Foundation of America, and Medscape. A list of conditions and treatments that were considered relevant PEMs is found in Appendix 1. A total of 774 articles were obtained from the 72 websites.
None of the websites had a mean readability score of 7 (seventh grade) or lower (Figures 1A, 1B). Mid-America Sarcoma Institute’s PEMs had the lowest mean readability score, 8.9. The lowest readability score was 5.3, which the New Fog Count readability instrument calculated for Vanderbilt University Medical Center’s (VUMC’s) PEMs (Appendix 2). The mean readability score of all websites was 11.4 (range, 8.9-15.5) (Appendix 2).
Seventy of 72 websites (97%) had PEMs that were fairly difficult or difficult, according to the FRE analysis (Figure 2). The American Cancer Society and Mid-America Sarcoma Institute had PEMs that were written in plain English. Sixty-nine of 72 websites (96%) had PEMs with a readability score of 10 or higher, according to the Raygor readability estimate (Figure 3). Using this instrument, the scores of the American Cancer Society and the University of Pennsylvania–Joan Karnell Cancer Center were 9; Mid-America Sarcoma Institute’s score was 8.
Discussion
Many cancer patients have turned to websites and online PEMs to gather health information about their condition.10-17 Basch and colleagues10 reported almost a decade ago that 44% of cancer patients, as well as 60% of their companions, used the Internet to find cancer-related information.10 When LaCoursiere and colleagues35 surveyed cancer patients, they found that patients handled their condition better and had less anxiety and uncertainty after using the Internet to find health information and support.35 In addition, many orthopedic patients, specifically 46% of orthopedic community outpatients,45 consult the Internet for information about their condition and future surgical procedures.46,47
This study comprehensively evaluated the readability of online PEMs of bone and soft-tissue sarcomas and related conditions by using 10 different readability instruments. After identifying 72 websites and 774 articles, we found that all 72 websites’ PEMs had a mean readability score that did not meet the NIH recommendation of writing PEMs at a sixth- to seventh-grade reading level. These results are consistent with studies evaluating the readability of online PEMs related to other cancer conditions21-25 and other orthopedic conditions.26-31
The combination of low health literacy of many US adults and high reading grade levels of the majority of online PEMs is not conducive to patients’ better understanding their condition(s). Even individuals with high reading skills prefer information that is simpler to read.48 In many areas of medicine, there is evidence that patients’ understanding of their condition has a positive impact on health outcomes, well-being, and the patient–physician relationship.49-61 Regarding cancer patients, Davis and colleagues54 and Peterson and colleagues57 showed that lower health literacy contributes to less knowledge and lower rates of breast54 and colorectal cancer57 screening tests. Even low health literacy of family caregivers of cancer patients can result in increased stress and lack of communication of important medical information between caregiver and physician.52 Among cancer patients, poor health literacy has been associated with mental distress60 as well as decreased compliance with treatment and lower involvement in clinical trials.55
The disparity between patients’ health literacy and the readability of online PEMs needs to be addressed by finding methods to improve patients’ understanding of their condition and to lower the readability scores of online PEMs. Better communication between patient and physician may improve patients’ comprehension of their condition and different aspects of their care.59,62-66 Doak and colleagues63 recommend giving cancer patients the most important information first; presenting information to patients in smaller doses; intermittently asking patients questions; and incorporating graphs, tables, and drawings into communication with patients.63 Additionally, allowing patients to repeat information they have just received/heard to the physician is another useful tool to improve patient education.62,64-66
Another way to address the disparity between patients’ health literacy and the readability of online PEMs is to reduce the reading grade level of existing PEMs. According to results from this study and others, the majority of online PEMs are above the reading grade level of a significant number of US adults. Many available and inexpensive readability instruments allow authors to assess their articles’ readability. Many writing guidelines also exist to help authors improve the readability of their PEMs.20,64,67-71 Living Word Vocabulary70 and Plain Language71 help authors replace complex words or medical terms with simpler words.29 Visual aids, audio, and video help patients with low health literacy remember the information.64
Efforts to improve PEM readability are effective. Of all the websites reviewed, VUMC was identified as having PEMs with the lowest readability score (5.3). This score was reported by the New Fog Count readability instrument, which accounts for the number of sentences, easy words, and hard words. In 2011, VUMC formed the Department of Patient Education to review and update its online and printed PEMs to make sure patients could read them.72 Additionally, the mean readability scores of the websites of the National Cancer Institute and MedlinePlus are in the top 50% of the websites included in this study. The NIH sponsors both sites, which follow the NIH guidelines for writing online PEMs at a reading level suitable for individuals with lower health literacy.20 These materials serve as potential models to improve the readability of PEMs, and, thus, help patients to better understand their condition, medical procedures, and/or treatment options.
To illustrate ways to improve the reading grade level of PEMs, we used the article “Ewing’s Sarcoma” from the AAOS website73 and followed the NIH guidelines to improve the reading grade level of the article.20 We identified complex words and defined them at an eighth-grade reading level. If that word was mentioned later in the article, simpler terminology was used instead of the initial complex word. For example, Ewing’s sarcoma was defined early and then referred to as bone tumor later in the article. We also identified every word that was 3 syllables or longer and used Microsoft Word’s thesaurus to replace those words with ones that were less than 3 syllables. Lastly, all sentences longer than 15 words were rewritten to be less than 15 words. After making these 3 changes to the article, the mean reading grade level dropped from 11.2 to 7.3.
This study has limitations. First, some readability instruments evaluate the number of syllables per word or polysyllabic words as part of their formula and, thus, can underestimate or overestimate the reading grade level of a document. Some readability formulas consider medical terms such as ulna, femur, or carpal as “easy” words because they have 2 syllables, but many laypersons may not comprehend these words. On the other hand, some readability formulas consider medical terms such as medications, diagnosis, or radiation as “hard” words because they contain 3 or more syllables, but the majority of laypersons likely comprehend these words. Second, the reading level of the patient population accessing those online sites was not assessed. Third, the readability instruments in this study did not evaluate the accuracy of the content, pictures, or tables of the PEMs. However, using 10 readability instruments allowed evaluation of many different readability aspects of the text. Fourth, because some websites identified in this study, such as Bonetumor.org, were written for patients as well as clinicians, the reading grade level of these sites may be higher than that of those sites written just for patients.
Conclusion
Because many orthopedic cancer patients rely on the Internet as a source of information, the need for online PEMs to match the reading skills of the patient population who accesses them is vital. However, this study shows that many organizations, academic training centers, and other entities need to update their online PEMs because all PEMs in this study had a mean readability grade level higher than the NIH recommendation. Further research needs to evaluate the effectiveness of other media, such as video, illustrations, and audio, to provide health information to patients. With many guidelines available that provide plans and advice to improve the readability of PEMs, research also must assess the most effective plans and advice in order to allow authors to focus their attention on 1 set of guidelines to improve the readability of their PEMs.
1. Piredda M, Rocci L, Gualandi R, Petitti T, Vincenzi B, De Marinis MG. Survey on learning needs and preferred sources of information to meet these needs in Italian oncology patients receiving chemotherapy. Eur J Oncol Nurs. 2008;12(2):120-126.
2. Fernsler JI, Cannon CA. The whys of patient education. Semin Oncol Nurs. 1991;7(2):79-86.
3. Glimelius B, Birgegård G, Hoffman K, Kvale G, Sjödén PO. Information to and communication with cancer patients: improvements and psychosocial correlates in a comprehensive care program for patients and their relatives. Patient Educ Couns. 1995;25(2):171-182.
4. Harris KA. The informational needs of patients with cancer and their families. Cancer Pract. 1998;6(1):39-46.
5. Jensen AB, Madsen B, Andersen P, Rose C. Information for cancer patients entering a clinical trial--an evaluation of an information strategy. Eur J Cancer. 1993;29A(16):2235-2238.
6. Wells ME, McQuellon RP, Hinkle JS, Cruz JM. Reducing anxiety in newly diagnosed cancer patients: a pilot program. Cancer Pract. 1995;3(2):100-104.
7. Diaz JA, Griffith RA, Ng JJ, Reinert SE, Friedmann PD, Moulton AW. Patients’ use of the Internet for medical information. J Gen Intern Med. 2002;17(3):180-185.
8. Fox S, Duggan M. Health Online 2013. Pew Research Center’s Internet and American Life Project. www.pewinternet.org/~/media//Files/Reports/PIP_HealthOnline.pdf. Published January 15, 2013. Accessed November 18. 2014.
9. Schwartz KL, Roe T, Northrup J, Meza J, Seifeldin R, Neale AV. Family medicine patients’ use of the Internet for health information: a MetroNet study. J Am Board Fam Med. 2006;19(1):39-45.
10. Basch EM, Thaler HT, Shi W, Yakren S, Schrag D. Use of information resources by patients with cancer and their companions. Cancer. 2004;100(11):2476-2483.
11. Huang GJ, Penson DF. Internet health resources and the cancer patient. Cancer Invest. 2008;26(2):202-207.
12. Metz JM, Devine P, Denittis A, et al. A multi-institutional study of Internet utilization by radiation oncology patients. Int J Radiat Oncol Biol Phys. 2003;56(4):1201-1205.
13. Peterson MW, Fretz PC. Patient use of the internet for information in a lung cancer clinic. Chest. 2003;123(2):452-457.
14. Satterlund MJ, McCaul KD, Sandgren AK. Information gathering over time by breast cancer patients. J Med Internet Res. 2003;5(3):e15.
15. Tustin N. The role of patient satisfaction in online health information seeking. J Health Commun. 2010;15(1):3-17.
16. Van de Poll-Franse LV, Van Eenbergen MC. Internet use by cancer survivors: current use and future wishes. Support Care Cancer. 2008;16(10):1189-1195.
17. Ziebland S, Chapple A, Dumelow C, Evans J, Prinjha S, Rozmovits L. How the internet affects patients’ experience of cancer: a qualitative study. BMJ. 2004;328(7439):564.
18. Committee on Health Literacy, Board on Neuroscience and Behavioral Health, Institute of Medicine. Nielsen-Bohlman L, Panzer AM, Kindig DA, eds. Health Literacy: A Prescription to End Confusion. Washington, DC: National Academies Press; 2004. Available at: www.nap.edu/openbook.php?record_id=10883. Accessed November 18, 2014.
19. Kutner M, Greenberg E, Ying J, Paulsen C. The Health Literacy of America’s Adults: Results from the 2003 National Assessment of Adult Literacy. NCES 2006-483. US Department of Education. Washington, DC: National Center for Education Statistics; 2006. Available at: www.nces.ed.gov/pubs2006/2006483.pdf. Accessed November 18, 2014.
20. How to write easy-to-read health materials. MedlinePlus website. www.nlm.nih.gov/medlineplus/etr.html. Updated February 13, 2013. Accessed November 18, 2014.
21. Ellimoottil C, Polcari A, Kadlec A, Gupta G. Readability of websites containing information about prostate cancer treatment options. J Urol. 2012;188(6):2171-2175.
22. Friedman DB, Hoffman-Goetz L, Arocha JF. Health literacy and the World Wide Web: comparing the readability of leading incident cancers on the Internet. Med Inform Internet Med. 2006;31(1):67-87.
23. Hoppe IC. Readability of patient information regarding breast cancer prevention from the Web site of the National Cancer Institute. J Cancer Educ. 2010;25(4):490-492.
24. Misra P, Kasabwala K, Agarwal N, Eloy JA, Liu JK. Readability analysis of internet-based patient information regarding skull base tumors. J Neurooncol. 2012;109(3):573-580.
25. Stinson JN, White M, Breakey V, et al. Perspectives on quality and content of information on the internet for adolescents with cancer. Pediatr Blood Cancer. 2011;57(1):97-104.
26. Badarudeen S, Sabharwal S. Readability of patient education materials from the American Academy of Orthopaedic Surgeons and Pediatric Orthopaedic Society of North America web sites. J Bone Joint Surg Am. 2008;90(1):199-204.
27. Bluman EM, Foley RP, Chiodo CP. Readability of the Patient Education Section of the AOFAS Website. Foot Ankle Int. 2009;30(4):287-291.
28. Polishchuk DL, Hashem J, Sabharwal S. Readability of online patient education materials on adult reconstruction Web sites. J Arthroplasty. 2012;27(5):716-719.
29. Sabharwal S, Badarudeen S, Unes Kunju S. Readability of online patient education materials from the AAOS web site. Clin Orthop. 2008;466(5):1245-1250.
30. Vives M, Young L, Sabharwal S. Readability of spine-related patient education materials from subspecialty organization and spine practitioner websites. Spine. 2009;34(25):2826-2831.
31. Wang SW, Capo JT, Orillaza N. Readability and comprehensibility of patient education material in hand-related web sites. J Hand Surg Am. 2009;34(7):1308-1315.
32. Lam CG, Roter DL, Cohen KJ. Survey of quality, readability, and social reach of websites on osteosarcoma in adolescents. Patient Educ Couns. 2013;90(1):82-87.
33. Tumors. Quinn RH, ed. OrthoInfo. American Academy of Orthopaedic Surgeons website. http://orthoinfo.aaos.org/menus/tumors.cfm. Accessed November 18, 2014.
34. Sarcoma specialists. Sarcoma Alliance website. sarcomaalliance.org/sarcoma-centers. Accessed November 18, 2014.
35. LaCoursiere SP, Knobf MT, McCorkle R. Cancer patients’ self-reported attitudes about the Internet. J Med Internet Res. 2005;7(3):e22.
36. Test your document’s readability. Microsoft Office website. office.microsoft.com/en-us/word-help/test-your-document-s-readability-HP010148506.aspx. Accessed November 18, 2014.
37. Kincaid JP, Fishburne RP, Rogers RL, Chissom BS. Derivation of new readability formulas (Automated Readability Index, Fog Count and Flesch Reading Ease Formula) for Navy enlisted personnel. Naval Technical Training Command. Research Branch Report 8-75. www.dtic.mil/dtic/tr/fulltext/u2/a006655.pdf. Published February 1975. Accessed November 18, 2014.
38. Coleman M, Liau TL. A computer readability formula designed for machine scoring. J Appl Psychol. 1975;60(2):283-284.
39. Fry E. Fry’s readability graph: clarifications, validity, and extension to Level 17. J Reading. 1977;21(3):242-252.
40. Chall JS, Dale E. Manual for the New Dale-Chall Readability Formula. Cambridge, MA: Brookline Books; 1995.
41. Gunning R. The Technique of Clear Writing. Rev. ed. New York, NY: McGraw-Hill; 1968.
42. Powers RD, Sumner WA, Kearl BE. A recalculation of four adult readability formulas. J Educ Psychol. 1958;49(2):99-105.
43. McLaughlin GH. SMOG grading—a new readability formula. J Reading. 1969;22,639-646.
44. Raygor L. The Raygor readability estimate: a quick and easy way to determine difficulty. In: Pearson PD, Hansen J, eds. Reading Theory, Research and Practice. Twenty-Sixth Yearbook of the National Reading Conference. Clemson, SC: National Reading Conference Inc; 1977:259-263.
45. Krempec J, Hall J, Biermann JS. Internet use by patients in orthopaedic surgery. Iowa Orthop J. 2003;23:80-82.
46. Beall MS, Golladay GJ, Greenfield ML, Hensinger RN, Biermann JS. Use of the Internet by pediatric orthopaedic outpatients. J Pediatr Orthop. 2002;22(2):261-264.
47. Beall MS, Beall MS, Greenfield ML, Biermann JS. Patient Internet use in a community outpatient orthopaedic practice. Iowa Orthop J. 2002;22:103-107.
48. Davis TC, Bocchini JA, Fredrickson D, et al. Parent comprehension of polio vaccine information pamphlets. Pediatrics. 1996;97(6 Pt 1):804-810.
49. Apter AJ, Wan F, Reisine S, et al. The association of health literacy with adherence and outcomes in moderate-severe asthma. J Allergy Clin Immunol. 2013;132(2):321-327.
50. Baker DW, Parker RM, Williams MV, Clark WS. Health literacy and the risk of hospital admission. J Gen Intern Med. 1998;13(12):791-798.
51. Berkman ND, Sheridan SL, Donahue KE, Halpern DJ, Crotty K. Low health literacy and health outcomes: an updated systematic review. Ann Intern Med. 2011;155(2):97-107.
52. Bevan JL, Pecchioni LL. Understanding the impact of family caregiver cancer literacy on patient health outcomes. Patient Educ Couns. 2008;71(3):356-364.
53. Corey MR, St Julien J, Miller C, et al. Patient education level affects functionality and long term mortality after major lower extremity amputation. Am J Surg. 2012;204(5):626-630.
54. Davis TC, Arnold C, Berkel HJ, Nandy I, Jackson RH, Glass J. Knowledge and attitude on screening mammography among low-literate, low-income women. Cancer. 1996;78(9):1912-1920.
55. Davis TC, Williams MV, Marin E, Parker RM, Glass J. Health literacy and cancer communication. CA Cancer J Clin. 2002;52(3):134-149.
56. Freedman RB, Jones SK, Lin A, Robin AL, Muir KW. Influence of parental health literacy and dosing responsibility on pediatric glaucoma medication adherence. Arch Ophthalmol. 2012;130(3):306-311.
57. Peterson NB, Dwyer KA, Mulvaney SA, Dietrich MS, Rothman RL. The influence of health literacy on colorectal cancer screening knowledge, beliefs and behavior. J Natl Med Assoc. 2007;99(10):1105-1112.
58. Peterson PN, Shetterly SM, Clarke CL, et al. Health literacy and outcomes among patients with heart failure. JAMA. 2011;305(16):1695-1701.
59. Rosas-salazar C, Apter AJ, Canino G, Celedón JC. Health literacy and asthma. J Allergy Clin Immunol. 2012;129(4):935-942.
60. Song L, Mishel M, Bensen JT, et al. How does health literacy affect quality of life among men with newly diagnosed clinically localized prostate cancer? Findings from the North Carolina-Louisiana Prostate Cancer Project (PCaP). Cancer. 2012;118(15):3842-3851.
61. Williams MV, Davis T, Parker RM, Weiss BD. The role of health literacy in patient-physician communication. Fam Med. 2002;34(5):383-389.
62. Badarudeen S, Sabharwal S. Assessing readability of patient education materials: current role in orthopaedics. Clin Orthop. 2010;468(10):2572-2580.
63. Doak CC, Doak LG, Friedell GH, Meade CD. Improving comprehension for cancer patients with low literacy skills: strategies for clinicians. CA Cancer J Clin. 1998;48(3):151-162.
64. Doak CC, Doak LG, Root JH. Teaching Patients With Low Literacy Skills. 2nd ed. Philadelphia, PA: JB Lippincott Company; 1996.
65. Kemp EC, Floyd MR, McCord-Duncan E, Lang F. Patients prefer the method of “tell back-collaborative inquiry” to assess understanding of medical information. J Am Board Fam Med. 2008;21(1):24-30.
66. Kripalani S, Bengtzen R, Henderson LE, Jacobson TA. Clinical research in low-literacy populations: using teach-back to assess comprehension of informed consent and privacy information. IRB. 2008;30(2):13-19.
67. Centers for Disease Control and Prevention. Simply Put: A Guide For Creating Easy-to-Understand Materials. 3rd ed. Atlanta, GA: Strategic and Proactive Communication Branch, Centers for Disease Control and Prevention, US Dept of Health and Human Services; 2009.
68. National Institutes of Health, National Cancer Institute. Clear & Simple: Developing Effective Print Materials for Low-Literate Readers. Devcompage website. http://devcompage.com/wp-content/uploads/2010/12/Clear_n_Simple.pdf Published March 2, 1998. Accessed December 1, 2014.
69. Weiss BD. Health Literacy and Patient Safety: Help Patients Understand. 2nd ed. Chicago, IL: American Medical Association and AMA Foundation; 2007:35-41.
70. Dale E, O’Rourke J. The Living Word Vocabulary. Newington, CT: World Book-Childcraft International, 1981.
71. Word suggestions. Plain Language website. www.plainlanguage.gov/howto/wordsuggestions/index.cfm. Accessed November 18, 2014.
72. Rivers K. Initiative aims to enhance patient communication materials. Reporter: Vanderbilt University Medical Center’s Weekly Newspaper. April 28, 2011. http://www.mc.vanderbilt.edu/reporter/index.html?ID=10649. Accessed November 18, 2014.
73. Ewing’s sarcoma. OrthoInfo. American Academy of Orthopaedic Surgeons website. http://orthoinfo.aaos.org/topic.cfm?topic=A00082. Last reviewed September 2011. Accessed November 18, 2014.
An Electronic Chemotherapy Ordering Process and Template
In May 2008 the Kansas City VAMC in Missouri, the Chemotherapy Quality Improvement Team (CQIT) was formed to evaluate and improve the chemotherapy delivery process in response to a significant medication error. At the first meeting, the team quickly determined that the chemotherapy ordering process should be improved. Up until that point, chemotherapy was ordered on handwritten, self-duplicating forms. The finished order forms were often difficult to read. Further, the forms were not consistent with American Society of Health-System Pharmacists (ASHP) Guidelines for Preventing Medication Errors with Antineoplastic Agents.1 A solution using existing technology was needed and obtaining third-party software was not an option at the time.
Chemotherapy Ordering Options
The VA Computerized Patient Record System (CPRS)
electronic health record system could not support the
complexity of chemotherapy orders without some adjustments.
One consideration was to build “order sets,”
to allow sequential ordering. With this approach, once
an order set was engaged, all the chosen medication orders
would automatically fire in sequence.
Order Sets
The order set method of standardization in chemotherapy ordering would channel all chemotherapy orders to the pharmacy through the computerized physician order entry (CPOE). However, a major drawback to building this type of order set was its lack of flexibility. A veteran’s care plan rarely adheres to the “standard” and modifications are the norm. The ASHP recommendations regarding chemotherapy order contents could not be honored.
The final product presented to the pharmacy as a clump of orders with no sequencing, no explanation of deviations from standards, base doses, or name of the desired regimen. With this approach, no diagnosis or stage of cancer was offered to allow a pharmacist to check for the appropriateness of the regimen. Also, a complete treatment summary was not communicated, so details, including base doses and calculated parameters, such as body surface area (BSA), were not available for order checks. Probably the biggest drawback was the intense amount of support a program like that required. Order sets are difficult to write and maintain in this age of drug shortages and in the evershifting terrain of medical oncology practice.
Progress Notes
Another alternative identified was to work within the CPRS-based electronic progress note functionality. This option offered a number of positive features. First, the finished product appeared in a visually appealing sequential document. An option existed for the provider to detail calculated parameters and to discuss variances from standard. Course number and order sequence could be communicated to the nursing staff. Best of all, using a 2-template strategy, a simple system was developed that allowed much of the order to be prewritten. Order entry required minimal physician time while producing a high-quality chemotherapy order that was consistent with the ASHP recommendations for safe chemotherapy ordering (Figures 1 and 2; to download a sample of the template and treatment note, visit (http://www.fedprac.com/AVAHO).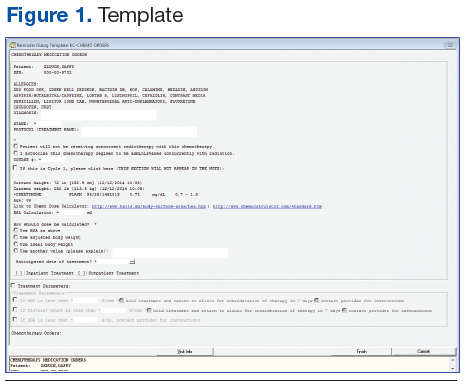
Once the Kansas City VAMC decided chemotherapy ordering should be implemented through the electronic progress note functionality, Information Resources Management (IRM) staff and the oncology pharmacist worked together to develop a templated process that would make the most sense and require the least work for all parties. Strong consideration was given to the amount of labor needed to support the process, because that had been observed as a stumbling block in other sites’ attempts to develop similar processes.
Chemotherapy Ordering Process
When the provider engages the dedicated progress note, the more complex of the 2 templates engages. The template automatically pulls in identifiers and allergies, height, weight, creatinine, and age data and offers links to 2 dose calculators. It also prompts providers for information that is required for all orders, such as diagnosis, stage, protocol title, treatment date, inpatient or outpatient, BSA calculation, BSA qualifier (total, ideal, or adjusted body weight, capped doses, etc). Providers must indicate whether the patient is also to receive radiation, and there is an option to provide retreatment parameters for multiday orders. Once this dialogue is completed, the information provided populates into the note.
After the first template is completed and has populated into the note, the provider moves to the “shared templates” in CPRS and selects a treatment-specific template. Currently, > 150 treatment templates are in use at the facility for routine medical oncology practice. A parallel process also exists that has been modified for investigational protocols. Once a treatment template is selected, the provider populates the required fields with doses and completes the progress note. The 2 templates flow together to create 1 seamless treatment note. Providers can deviate from the template standard by making changes in the text of the note before signing.

Breaking down the process to 2 separate templates was a critical decision for the continued success of this system. Several other facilities have attempted to develop 1-click templates for each treatment mode. The Kansas City VAMC, however, decided that requiring IRM to install and maintain a full template for each of the > 150 chemotherapy orders was impractical. Because the complex portion of the ordering process was isolated in the first template, the individual treatment templates could be very simple, prewritten forms with a blank field for dose information. These forms were built on a combination of clinical guidelines and local practice, and an oncology provider approved each before installation. Once the note has been generated, providers are free to enter notes and make modifications to the order to reflect the patient’s needs.
Due to the simplicity of the treatment templates, a new one can be installed in the shared file in minutes. Development of the initial library of templates took about 2 months. The order sets were developed from previously written chemotherapy orders and adapted to the electronic format. The new system went live 3.5 months after the concept was proposed, and handwritten chemotherapy orders are no longer accepted.
Creating forms for > 100 orders was a daunting task, particularly considering the need to consider both local practice and guideline recommendations with regards to both dosing of chemotherapy and supportive medications. Extensive physician involvement was required. At first it seemed to be too much work for something that might be an interim measure; however, any thirdparty solution would require a similar process, so now the facility is prepared if third-party chemotherapy ordering software is purchased.
Why Is This A Best Practice?
The ASHP guidelines promote the importance of chemotherapy order standardization. However, done without careful attention, facilities can standardize errors into practice. To prevent errors and double check documents, an additional process for handling the templates was developed. The pharmacy department developed new order templates, incorporating both local practices and accepted guidelines. The template is first sent to the oncology physician for careful review. On physician approval, it goes to IRM for installation into CPRS as well as to the Pharmacy and Therapeutics Committee for final review. This process provides permanent and accessible documentation of pre-implementation review.
The pharmacy and nursing staff are automatically notified when an order is signed. The new order is printed and reviewed by a pharmacist, and the ordered items are entered in the same system for processing. Providers frequently enter the orders in advance, allowing careful review and medication profiling to occur well before the patient arrives. The orders can be processed during off-peak hours, simplifying workload and potentially reducing errors.
The order format also offers an effective communication tool. Since the template is in a checklist format, the nursing staff are instructed clearly from the order how to administer the treatment. In fact, the practice is to take the order to the room and log all treatment times and details on the order sheet, facilitating highquality documentation of administration. This option was not available with handwritten orders.
The orders are templated sequentially; nurses give the medications in the order they are presented, preserving sequencing preferences for certain regimens. Calls and pages to clarify doses are kept to a minimum by prompting the provider to indicate parameters for retreatment and dosing preferences used (ideal body weight, etc).
The treatment templates were locally developed and based on provider practices. Although guidelines are helpful, they cannot be uniformly applied to all facilities. VA practice, for example, requires less aggressive pretreatment for nausea in many cases due to the nature of the population. Since this process was developed locally, it mirrors the prior common practices.
Experience With The Program
Both medical and nursing staff quickly accepted the new ordering system. It is estimated that veterans’ turnaround time has decreased by as much as 45 minutes. There are several ways the process saves patient time. Transportation of written orders has been eliminated, a frequent stumbling block in the process. The orders are now delivered immediately on signing to both pharmacy and nursing staff.
There is no more time lost clarifying poorly written, smudged, or otherwise illegible orders. The finished product is clear, legible, standardized, and readily available in CPRS for all authorized personnel to review. Problems are often identified well in advance of the patient’s arrival. Nurses are seldom surprised with add-on directives, since the orders are entered when the plan is made even if that is a week or more before the start of treatment. Electronic notification of new orders allows nursing staff to predict workload and schedule staffing and treatments accordingly.
Limitations
Although proud of this project as a creative and effective solution, the oncology department staff recognize that there are some limitations with the process that preclude its use as a permanent tool. The main limitation of this approach to chemotherapy ordering stems from use of the CPRS progress note module to create an order. One important feature of any order is that it can be changed or discontinued. Due to the permanence of progress notes, an addendum must be made to the order to qualify it as discontinued, since a progress note cannot be discontinued. The users within the system are aware of this limitation and are vigilant for new addenda to these notes, but it could open a window for error.
This process is also not consistent with the ideal that all orders be entered by CPOE. In a perfect world, on signing the note at the end of this process, the orders would automatically generate pharmacy orders for the drug items. Unfortunately, that level of automation is not available at this time. Within the current infrastructure, that functionality would be devastating to the flexibility that is of greater importance for this process. It is exactly this problem that has led to the consideration of third-party software solutions.
Conclusion
The chemotherapy ordering process at the Kansas City VAMC is an effective communication tool. Ultimately, a physician’s order for treatment is a one-way communication to pharmacy and nursing staff. This process streamlines the communication and minimizes the need for callbacks and clarifications. It also permits anyone with access to the patient’s CPRS record to be able to review the plan. And it creates a standardized treatment checklist for more consistent care. The ASHP strongly recommends standardizing oncology ordering practices, and checklists are a recognized tool for improving the quality of care.2 The simplicity of the process and the no-cost maintenance of the technology are added benefits.
A novel solution was needed to improve safety and efficiency of chemotherapy ordering. The pharmacy department was the key in developing such a solution at the Kansas City VAMC. A transparent, standardized process was developed and implemented within a relatively short time frame. Built within existing software/hardware capabilities, the project had an immediate return on investment and avoided the overhead costs associated with implementing third-party ordering systems. In addition the process decreased turnaround time and increased throughput of the ordering process. An added benefit is that if a better tool (third party or otherwise) becomes available, the Kansas City VAMC is ready on a moment’s notice.
Author disclosures
The authors report no actual or potential conflicts of interest with regard to this article.
Disclaimer
The opinions expressed herein are those of the authors and do not necessarily reflect those of Federal Practitioner, Frontline Medical Communications Inc., the U.S. Government, or any of its agencies. This article may discuss unlabeled or investigational use of certain drugs. Please review the complete prescribing information for specific drugs or drug combinations—including indications, contraindications,warnings, and adverse effects—before administering pharmacologic therapy to patients.
1. Griggs JJ, Mangu PB, Anderson H, et al. Appropriate chemotherapy dosing for obese adult patients with cancer: American Society of Clinical Oncology clinical practice guideline. J Clin Oncol. 2012;30(13):1553-1561.
2. Gawande A. The Checklist Manifesto: How to Get Things Right. Metropolitan Books: New York; 2009.
In May 2008 the Kansas City VAMC in Missouri, the Chemotherapy Quality Improvement Team (CQIT) was formed to evaluate and improve the chemotherapy delivery process in response to a significant medication error. At the first meeting, the team quickly determined that the chemotherapy ordering process should be improved. Up until that point, chemotherapy was ordered on handwritten, self-duplicating forms. The finished order forms were often difficult to read. Further, the forms were not consistent with American Society of Health-System Pharmacists (ASHP) Guidelines for Preventing Medication Errors with Antineoplastic Agents.1 A solution using existing technology was needed and obtaining third-party software was not an option at the time.
Chemotherapy Ordering Options
The VA Computerized Patient Record System (CPRS)
electronic health record system could not support the
complexity of chemotherapy orders without some adjustments.
One consideration was to build “order sets,”
to allow sequential ordering. With this approach, once
an order set was engaged, all the chosen medication orders
would automatically fire in sequence.
Order Sets
The order set method of standardization in chemotherapy ordering would channel all chemotherapy orders to the pharmacy through the computerized physician order entry (CPOE). However, a major drawback to building this type of order set was its lack of flexibility. A veteran’s care plan rarely adheres to the “standard” and modifications are the norm. The ASHP recommendations regarding chemotherapy order contents could not be honored.
The final product presented to the pharmacy as a clump of orders with no sequencing, no explanation of deviations from standards, base doses, or name of the desired regimen. With this approach, no diagnosis or stage of cancer was offered to allow a pharmacist to check for the appropriateness of the regimen. Also, a complete treatment summary was not communicated, so details, including base doses and calculated parameters, such as body surface area (BSA), were not available for order checks. Probably the biggest drawback was the intense amount of support a program like that required. Order sets are difficult to write and maintain in this age of drug shortages and in the evershifting terrain of medical oncology practice.
Progress Notes
Another alternative identified was to work within the CPRS-based electronic progress note functionality. This option offered a number of positive features. First, the finished product appeared in a visually appealing sequential document. An option existed for the provider to detail calculated parameters and to discuss variances from standard. Course number and order sequence could be communicated to the nursing staff. Best of all, using a 2-template strategy, a simple system was developed that allowed much of the order to be prewritten. Order entry required minimal physician time while producing a high-quality chemotherapy order that was consistent with the ASHP recommendations for safe chemotherapy ordering (Figures 1 and 2; to download a sample of the template and treatment note, visit (http://www.fedprac.com/AVAHO).
Once the Kansas City VAMC decided chemotherapy ordering should be implemented through the electronic progress note functionality, Information Resources Management (IRM) staff and the oncology pharmacist worked together to develop a templated process that would make the most sense and require the least work for all parties. Strong consideration was given to the amount of labor needed to support the process, because that had been observed as a stumbling block in other sites’ attempts to develop similar processes.
Chemotherapy Ordering Process
When the provider engages the dedicated progress note, the more complex of the 2 templates engages. The template automatically pulls in identifiers and allergies, height, weight, creatinine, and age data and offers links to 2 dose calculators. It also prompts providers for information that is required for all orders, such as diagnosis, stage, protocol title, treatment date, inpatient or outpatient, BSA calculation, BSA qualifier (total, ideal, or adjusted body weight, capped doses, etc). Providers must indicate whether the patient is also to receive radiation, and there is an option to provide retreatment parameters for multiday orders. Once this dialogue is completed, the information provided populates into the note.
After the first template is completed and has populated into the note, the provider moves to the “shared templates” in CPRS and selects a treatment-specific template. Currently, > 150 treatment templates are in use at the facility for routine medical oncology practice. A parallel process also exists that has been modified for investigational protocols. Once a treatment template is selected, the provider populates the required fields with doses and completes the progress note. The 2 templates flow together to create 1 seamless treatment note. Providers can deviate from the template standard by making changes in the text of the note before signing.
Breaking down the process to 2 separate templates was a critical decision for the continued success of this system. Several other facilities have attempted to develop 1-click templates for each treatment mode. The Kansas City VAMC, however, decided that requiring IRM to install and maintain a full template for each of the > 150 chemotherapy orders was impractical. Because the complex portion of the ordering process was isolated in the first template, the individual treatment templates could be very simple, prewritten forms with a blank field for dose information. These forms were built on a combination of clinical guidelines and local practice, and an oncology provider approved each before installation. Once the note has been generated, providers are free to enter notes and make modifications to the order to reflect the patient’s needs.
Due to the simplicity of the treatment templates, a new one can be installed in the shared file in minutes. Development of the initial library of templates took about 2 months. The order sets were developed from previously written chemotherapy orders and adapted to the electronic format. The new system went live 3.5 months after the concept was proposed, and handwritten chemotherapy orders are no longer accepted.
Creating forms for > 100 orders was a daunting task, particularly considering the need to consider both local practice and guideline recommendations with regards to both dosing of chemotherapy and supportive medications. Extensive physician involvement was required. At first it seemed to be too much work for something that might be an interim measure; however, any thirdparty solution would require a similar process, so now the facility is prepared if third-party chemotherapy ordering software is purchased.
Why Is This A Best Practice?
The ASHP guidelines promote the importance of chemotherapy order standardization. However, done without careful attention, facilities can standardize errors into practice. To prevent errors and double check documents, an additional process for handling the templates was developed. The pharmacy department developed new order templates, incorporating both local practices and accepted guidelines. The template is first sent to the oncology physician for careful review. On physician approval, it goes to IRM for installation into CPRS as well as to the Pharmacy and Therapeutics Committee for final review. This process provides permanent and accessible documentation of pre-implementation review.
The pharmacy and nursing staff are automatically notified when an order is signed. The new order is printed and reviewed by a pharmacist, and the ordered items are entered in the same system for processing. Providers frequently enter the orders in advance, allowing careful review and medication profiling to occur well before the patient arrives. The orders can be processed during off-peak hours, simplifying workload and potentially reducing errors.
The order format also offers an effective communication tool. Since the template is in a checklist format, the nursing staff are instructed clearly from the order how to administer the treatment. In fact, the practice is to take the order to the room and log all treatment times and details on the order sheet, facilitating highquality documentation of administration. This option was not available with handwritten orders.
The orders are templated sequentially; nurses give the medications in the order they are presented, preserving sequencing preferences for certain regimens. Calls and pages to clarify doses are kept to a minimum by prompting the provider to indicate parameters for retreatment and dosing preferences used (ideal body weight, etc).
The treatment templates were locally developed and based on provider practices. Although guidelines are helpful, they cannot be uniformly applied to all facilities. VA practice, for example, requires less aggressive pretreatment for nausea in many cases due to the nature of the population. Since this process was developed locally, it mirrors the prior common practices.
Experience With The Program
Both medical and nursing staff quickly accepted the new ordering system. It is estimated that veterans’ turnaround time has decreased by as much as 45 minutes. There are several ways the process saves patient time. Transportation of written orders has been eliminated, a frequent stumbling block in the process. The orders are now delivered immediately on signing to both pharmacy and nursing staff.
There is no more time lost clarifying poorly written, smudged, or otherwise illegible orders. The finished product is clear, legible, standardized, and readily available in CPRS for all authorized personnel to review. Problems are often identified well in advance of the patient’s arrival. Nurses are seldom surprised with add-on directives, since the orders are entered when the plan is made even if that is a week or more before the start of treatment. Electronic notification of new orders allows nursing staff to predict workload and schedule staffing and treatments accordingly.
Limitations
Although proud of this project as a creative and effective solution, the oncology department staff recognize that there are some limitations with the process that preclude its use as a permanent tool. The main limitation of this approach to chemotherapy ordering stems from use of the CPRS progress note module to create an order. One important feature of any order is that it can be changed or discontinued. Due to the permanence of progress notes, an addendum must be made to the order to qualify it as discontinued, since a progress note cannot be discontinued. The users within the system are aware of this limitation and are vigilant for new addenda to these notes, but it could open a window for error.
This process is also not consistent with the ideal that all orders be entered by CPOE. In a perfect world, on signing the note at the end of this process, the orders would automatically generate pharmacy orders for the drug items. Unfortunately, that level of automation is not available at this time. Within the current infrastructure, that functionality would be devastating to the flexibility that is of greater importance for this process. It is exactly this problem that has led to the consideration of third-party software solutions.
Conclusion
The chemotherapy ordering process at the Kansas City VAMC is an effective communication tool. Ultimately, a physician’s order for treatment is a one-way communication to pharmacy and nursing staff. This process streamlines the communication and minimizes the need for callbacks and clarifications. It also permits anyone with access to the patient’s CPRS record to be able to review the plan. And it creates a standardized treatment checklist for more consistent care. The ASHP strongly recommends standardizing oncology ordering practices, and checklists are a recognized tool for improving the quality of care.2 The simplicity of the process and the no-cost maintenance of the technology are added benefits.
A novel solution was needed to improve safety and efficiency of chemotherapy ordering. The pharmacy department was the key in developing such a solution at the Kansas City VAMC. A transparent, standardized process was developed and implemented within a relatively short time frame. Built within existing software/hardware capabilities, the project had an immediate return on investment and avoided the overhead costs associated with implementing third-party ordering systems. In addition the process decreased turnaround time and increased throughput of the ordering process. An added benefit is that if a better tool (third party or otherwise) becomes available, the Kansas City VAMC is ready on a moment’s notice.
Author disclosures
The authors report no actual or potential conflicts of interest with regard to this article.
Disclaimer
The opinions expressed herein are those of the authors and do not necessarily reflect those of Federal Practitioner, Frontline Medical Communications Inc., the U.S. Government, or any of its agencies. This article may discuss unlabeled or investigational use of certain drugs. Please review the complete prescribing information for specific drugs or drug combinations—including indications, contraindications,warnings, and adverse effects—before administering pharmacologic therapy to patients.
1. Griggs JJ, Mangu PB, Anderson H, et al. Appropriate chemotherapy dosing for obese adult patients with cancer: American Society of Clinical Oncology clinical practice guideline. J Clin Oncol. 2012;30(13):1553-1561.
2. Gawande A. The Checklist Manifesto: How to Get Things Right. Metropolitan Books: New York; 2009.