User login
Evaluation of Wound Healing After Direct Anterior Total Hip Arthroplasty With Use of a Novel Retraction Device
It is thought that, by placing more emphasis on soft-tissue preservation, minimally invasive surgery total hip arthroplasty (MIS-THA) results in less soft-tissue trauma, less blood loss, and earlier recovery.1-3 Despite these improvements over standard methods, there is a concern that the vigorous retraction needed for proper visualization through smaller incisions could injure soft tissues.4-7 Single-incision direct anterior THA (DA-THA) has gained in popularity because of the true intermuscular/internervous plane through which the procedure can be performed with relatively minimal muscle dissection using MIS techniques.8,9 This approach may offer quicker recovery and superior stability in comparison with nonintermuscular methods, which unavoidably cause more muscle damage.10-12
Although the evidence of these early gains is encouraging, several studies have found high complication rates with DA-THA.8,13-17 Noted disadvantages include a steep learning curve, lateral femoral cutaneous neurapraxia, need for a specialized table, and higher fracture and wound complication rates. Not surprisingly, with increased surgeon experience, the complication rate decreased substantially.14,15 However, wound-related complications remained steady, with 2 recent large studies reporting rates of 4.6% and 2.1%.14,15 The thin anterior skin, high tensional forces along the groin crease and perpendicular to the typical DA incision, and less resilient soft-tissue envelope are postulated reasons for wound-related issues, which are likely magnified in patients who are more obese.15,16
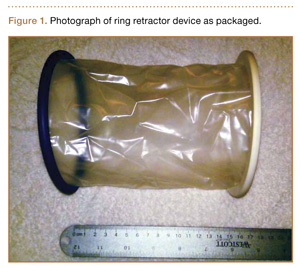
A novel device designed to lessen tissue damage is the ring retractor (Figure 1). Used initially in general surgery and obstetrics, it consists of 2 semirigid polymer rings connected by a flexible cylindrical polymer membrane.18-20 The lower ring is tucked and anchored underneath the wound edge, and then the upper ring is rolled down and cinched onto the skin. The resultant tension on the polymer sleeve—imparted by the rigidity of the ring—provides strong, evenly distributed wound-edge retraction. It also provides a physical barrier between the wound edge and the rest of the operative field. Proponents of the ring retractor claim increased wound-edge moisture, less bruising, and reduced local trauma compared with standard metal retractors alone.
Wound-edge retractor forces are doubled during MIS-THA compared with conventional THA.14-20 This may explain reports of worse scar cosmesis with MIS-THA. Given the theoretical benefits of minimized wound-edge trauma, the ring retractor may improve scar appearance compared with standard retraction alone. Any clinically relevant effect on cosmesis should be readily apparent to justify use of the retractor in this regard. Although some surgeons routinely use the device for primary THA, it has not been the subject of any recent orthopedic studies.
In the present study, we prospectively investigated wound cosmesis with and without use of the ring retractor in patients undergoing DA-THA.
Materials and Methods
This prospective, single-center, randomized study was reviewed and approved by the institutional review board at our facility. Consent was obtained from all participating patients.
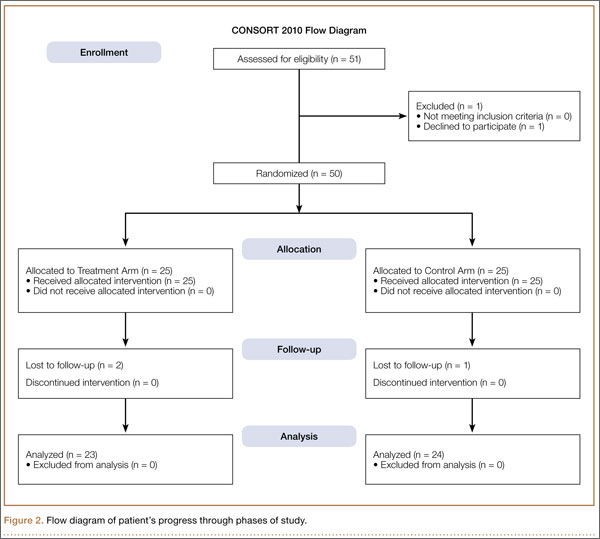
We evaluated 50 surgical incisions in 48 patients. Eligible participants were over age 18 years and undergoing primary DA-THA. Exclusion criteria included previous surgery on the affected hip, a pathological hip condition requiring an extensile exposure, systemic inflammatory illness, chronic corticosteroid use, and dermatologic abnormality of the incisional area. One patient was having simultaneous bilateral THAs, and another was having staged bilateral THAs. Each hip in these patients was given its own case number and treated separately. Of the 49 patients who met all the inclusion criteria, only 1 decided not to participate (Figure 2).
Stratified randomization with permuted block size (sex, body mass index [BMI]) was used to assign patients in a 1:1 ratio to either the treatment group or the control group. In the treatment group, the Protractor Incision Protector and Retractor (Gyrus ACMI, Southborough, Massachusetts) was used with standard metal retractors. In the control group, only standard metal retractors were used. Patients were blinded to their group assignments, and surgeons were informed about each assignment only after the initial incision was made.
Clinical research investigators were blinded to the groups’ prospectively collected data. Collection time points were preoperative clinical visit, day of surgery through discharge, and 2-, 6-, and 12-week postoperative follow-ups. Day-of-surgery data included estimated intraoperative blood loss, operative side, operative time, intraoperative complications, and American Society of Anesthesiologists (ASA) physical status classification. Total length of stay, pain scores (range, 0-10), estimated drain output, and blood-transfusion data were also recorded. To evaluate whether the device had any effect on short-term functional outcome, we collected Harris Hip Scores (HHS) and Short Form–12 (SF-12, Version 2) scores at the preoperative and 6-week postoperative visits. We also documented any wound-healing-related issues or complications that occurred up until the final visit.
To account for any effect of nutrition status on wound healing, we obtained pre-albumin and albumin levels and absolute lymphocyte counts from the preoperative electronic records. We used an albumin level under 3.5 g/dL and an absolute lymphocyte count under 1500/µL for our analysis, as these cutoffs have been associated with wound complications after primary THA.21 There is no similarly established threshold for pre-albumin level, so we used values under 20 mg/L based on comparable literature.22,23
At each postoperative visit, standardized high-resolution images were obtained. At the 12-week visit, patients completed 2 Likert scales regarding their overall opinion of their scars and how their scars compared with their expectations. They also ranked 5 separate THA-related outcomes in order of importance (Appendix).
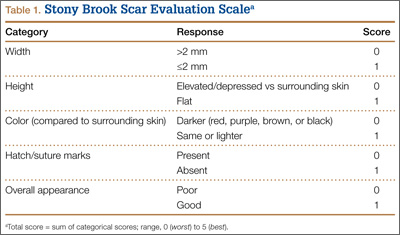
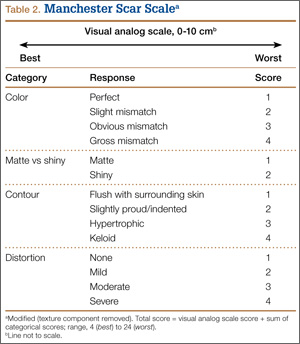
Photographs were evaluated by 2 blinded plastic surgeons (Dr. Friedman and Dr. Jack) using 2 grading systems—the Stony Brook Scar Evaluation Scale (SBSES)24 (Table 1) and a modified Manchester Scar Scale (MSS)25 (Table 2). We used these systems because they were photograph-based, psychometrically studied, and specifically designed to assess surgical incision healing with established validity and reliability.24-27 A particular advantage, strictly related to cosmetic outcome, is their validity in scoring scars from high-definition photographs in a different place or time. The SBSES, an ordinal wound evaluation scale that measures short-term cosmetic outcomes, consists of 6 items, each receiving 1 or 0 point, yielding a total score between 0 (worst) and 5 (best). The modified MSS includes a visual analog scale (VAS), which has a vertical hash marked on a 10-cm line and is scored between 0 (excellent) and 10 (poor) to 1 decimal point.26,28 This value is added to grades on color, surface appearance, contour, and distortion, resulting in a score between 4 (best) and 24 (worst). The primary outcome measures were Likert-scale responses obtained at final visit and SBSES/MSS scores for each visit; 12-week scores were the primary end point.
Operative Procedure
Experienced fellowship-trained orthopedic surgeons performed all procedures. A modified Hueter approach was used for exposure.9 Mean incision length was about 12 cm. For the treatment group, the ring retractor was inserted at the level of the tensor fascia, with the inferior ring resting between the fascia and the subcutaneous layer and the superior ring cinched over the skin (Figure 3). The device is made in 4 different sizes for incisions from 2.5 to 17 cm; our study population required only 1 size. Otherwise, the surgical protocol was based on that described by Matta and colleagues.8 Wound closure (over a drain) was performed according to a standardized protocol—running No. 1 Vicryl suture for the superficial tensor fascia, interrupted 2-0 Vicryl for the deep dermal layer, and subcutaneous 4-0 Monocryl for the skin followed by application of Dermabond (Ethicon, Somerville, New Jersey) and Tegaderm +Pad (3M, St. Paul, Minnesota) for outer dressing, which was replaced on postoperative day 2 and removed at the 2-week visit.
Statistical Methods
An a priori sample-size calculation was performed. Power performed in a base of a prior study that evaluated anterolateral and posterolateral THA scars using a VAS, a component of the MSS, suggested a sample size of 16 per group to detect the minimal clinically important difference of 1.5 cm: SD (σ) = 1.5 cm, α = 0.05, β = 0.20.29,30 In addition, a general estimate for detecting a 1-unit change on an ordinal scale (σ = 1.0, α = 0.05, β = 0.20) resulted in the same number. We conservatively decided to enroll 25 patients per arm in case of larger true variance.
The Wilcoxon rank sum test was used for comparisons of continuous data between groups. Differences between means were analyzed with 2-sided t tests. Categorical data were compared with the Pearson χ2 test or the Fisher exact test, as indicated. Ordinal ranking scores were compared with the Mantel-Haenszel test. Multivariate logistic regression was applied to identify the significant independent predictors of better scar grades for each surgeon by considering candidate variables with Ps < .20 in the univariate analysis.
Results
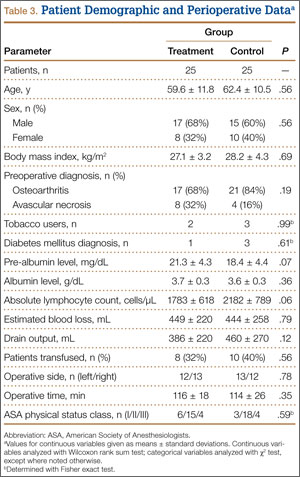
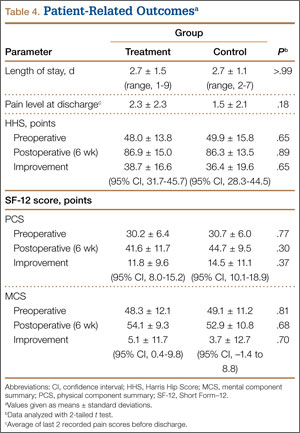
We found no differences in demographic or perioperative characteristics between treatment and control groups (Tables 3, 4). The groups showed similar mean improvements in their respective 6-week HHS (38.7 and 36.4 points; P = .65), SF-12 physical component summary scores (11.8 and 14.5 points; P = .37), and SF-12 mental component summary scores (5.1 and 3.7; P = .70).
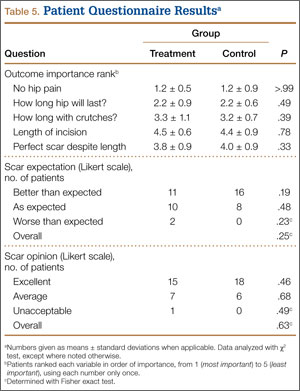
Patient questionnaire outcomes are listed in Table 5. For the control group, 25/25 image sets were obtained at the 2-week visit, 25/25 at the 6-week visit, and 24/25 at the 12-week visit. For the treatment group, there were 23/25, 24/25, and 23/25 images sets, respectively.
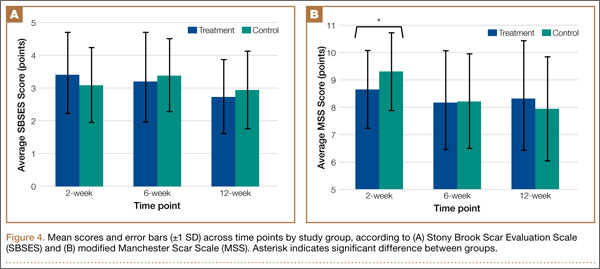
When surgeon scoring was analyzed separately, SBSES and MSS scores were similar between treatment and control groups, with 1 exception: 2-week MSS scores were better for the treatment group according to surgeon A (P = .026). When grades were averaged, SBSES scores were again similar at all time points (Figure 4A); MSS scores were better for the treatment group at 2 weeks (P = .036) and equivalent at all other time points (Figure 4B). For the SBSES, Spearman correlation coefficient ρ with 95% confidence interval (CI) was 0.37
(95% CI, 0.08-0.66) at 2 weeks, 0.48 (95% CI, 0.20-0.76) at 6 weeks, and 0.62 (95% CI, 0.33-0.91) at 12 weeks. Following the same pattern for the MSS, ρ was 0.20 (95% CI, –0.09 to 0.49), 0.51 (95% CI, 0.23-0.79), and 0.32 (95% CI, 0.03-0.61).
Independent multivariate analysis revealed that age over 65 years was a significant predictor of worse scores. On SBSES, the odds ratio (OR) was 1.15 (95% CI, 1.07-1.24) for surgeon A and 1.11 (95% CI, 1.05-1.18) for surgeon B. On MSS, the OR was 0.89 (95% CI, 0.84-0.94) for surgeon A and 0.95 (95% CI, 0.91-0.99) for surgeon B. The likelihood of having worse SBSES scores according to surgeon A was 4.72 times higher if the pre-albumin level was under 20 mg/L (95% CI, 1.15-19.36). Albumin level under 3.5 g/dL and absolute lymphocyte count under 1500 cells/µL were not found to be independent predictors of poorer scores.
Patients’ overall opinion (P = .63) and assessment of their scars relative to expectations (P = .25) on the Likert scales were not different between groups. More scars exceeded patients’ expectations and had more excellent ratings in the control group. The 2 groups were similar with regard to relative importance of various patient-related outcomes. Factors most important to overall outcome were relief of hip pain, followed by implant longevity and length of recovery. Least important were incision-related variables.
There were only 3 minor noninfectious wound complications (6%), 2 in the treatment group and 1 in the control group. In the treatment group, a 67-year-old man with diabetes (ASA class III; BMI, 32.1 kg/m2; received transfusion) had 2 small areas (<5 mm) of superficial ulceration at 6-week follow-up—one at the proximal aspect of the incision and the other near the midpoint along the flexion crease. Both lesions resolved by 12-week follow-up. Also in the treatment group, a 77-year-old woman (ASA class II; BMI, 24.9 kg/m2; received transfusion) at 6 weeks had a spitting suture, which was removed in clinic without further issue. In the control group, a 55-year-old woman (ASA class II; BMI, 27.4 kg/m2) had a suture reaction near the proximal aspect of her incision 3 weeks after surgery. This reaction, which presented as a mild, localized erythema without pain, tenderness, or drainage, resolved by 6-week follow-up. None of these wound complications required intervention beyond observation.
Discussion
This study was designed to provide a bipartisan measure of wound-healing cosmesis after DA-THA. Scar evaluation by blinded plastic surgeons served as a standardized, clinical assessment, whereas the patient questionnaire offered a more subjective appraisal. The modified MMS25 and the SBSES24 are the only 2 wound-grading systems designed and validated for photographic assessment of postsurgical scars. Most scar evaluation schemes pertain to burn or traumatic scars.26,27,31 As a result, many earlier studies intending to compare incisional scars used poorly suited evaluation systems.
The current literature includes reports on 3 studies with scoring-based scar assessment in THA; all used grading systems designed for either burns or traumatic wounds, but 2 also used a VAS.32-34 VASs have been validated for measuring wound cosmesis but are entirely subjective and without structure and provide no feedback as to why a scar was rated good or bad.24 Mow and colleagues32 prospectively compared scars after standard posterior or MIS approaches and found no differences according to a scoring system intended for burn scars. In our study population, we found no group differences in patients’ cosmesis of their scars.
Although scars can take a year or longer to fully mature, researchers from the University of Michigan discovered that scar appearance at 1 year correlates highly with cosmesis 12 weeks after closure, though poorly with cosmesis 10 days after closure.35 Therefore, any observed differences in scar cosmesis between groups at 12-week follow-up would likely persist, whereas differences at 2-week follow-up would have little bearing on ultimate appearance. For this reason, our primary outcome measure was healing process and cosmesis at 12 weeks. High wound complication rates have been reported for MIS-DA-THA.8,14-16 Jewett and Collis15 noted a 4.6% wound complication rate (3% noninfectious ulcerative dehiscence, 1.6% superficial infection), which is comparable to the 6% rate found in this study. However, there likely is some variability across studies in what constitutes a wound complication or superficial infection. Of our 3 wound complications—stitch reaction, spitting suture, small noninfectious ulceration—only the ulceration was of a severity similar to that reported by Jewett and Collis.15 Matta and colleagues8 reported only 3 wound complications (in 494 patients), all severe enough to require operative intervention. One explanation for this low complication rate is use of a ring retractor, as it is routinely depicted in their technique paper. However, no specific reference is made to gauge how often the device was used.
Rates of superficial infection after DA-THA range from 0.6% to 1.6% in 3 large observational studies (combined deep infection rate, 0.43%).8,14,15 In 2 of these studies, all patients with superficial infection underwent formal débridement, though none developed deep infection. A prospective randomized study of 221 patients who underwent colorectal surgery—where perioperative infectious morbidity ranges from 25% to 50%—found that ring retractor use significantly reduced superficial wound infection rates (8.1% vs 0%). A significant reduction in wound infection was shown in a similarly designed study involving 48 patients who had open appendectomy (14.6% vs 1.6%). The device had no effect on deep infection in either general surgery study. The wound infection rates reported in these general surgery studies are markedly higher than those in our study population. As a result, the effect of the ring retractor on wound infection in DA-THA may be less. Regardless of the effect on deep infection, fewer superficial infections, which often require operative intervention, would be of considerable benefit.
Below-threshold albumin level and absolute lymphocyte count have been associated with wound-healing complications after hip replacement.21 In the present study, pre-albumin level under 20 mg/L was the only nutritional marker predictive of poor wound appearance, but this finding was seen only in SBSES scores from surgeon A. Subgroup analysis did not reveal any relationship between wound appearance and any of the recorded demographic or perioperative variables, but for a small predictive influence with age over 65 years.
This study had some limitations. Our findings cannot be generalized to all patients who undergo THA, as only DA incisions were studied. Results also may not be generalizable to non-fellowship-trained orthopedists. In addition, selection bias likely resulted from including patients already selected for the DA approach. Using digital images for evaluation (vs real-life evaluation) may have affected reliability as well. Last, by not incorporating texture, we omitted a potentially informative feature from scoring.
It is paramount that surgeons undergo diligent training before undertaking this approach for minimizing unwanted results; furthermore, higher early complication rates level off with increased surgeon experience.14,36,37 We recommend meticulous soft-tissue handling, cautious retraction, and careful patient selection (relative contraindication for patients with an abdominal pannus overlying the incision) as primary measures for minimizing incisional trauma and potential wound-healing complications.38 Preservation of the tensor fascia is also crucial,39 as it is the only closable layer separating deep and superficial compartments. Without good closure of the tensor fascia, there is no containment or tamponade of deep bleeding, which can facilitate hematoma formation.
In the population studied, we found no significant long-term differences in cosmetic appearance (based on clinician or patient evaluation) between wounds managed with and without the ring retractor. Our data do not support routine use of the ring retractor, during DA-THA, for improved wound cosmesis. Whether the device has any significant role in reducing the number of wound complications in THA is yet to be determined. Last, the ring retractor may have a role in other areas of orthopedic surgery, such as hip fractures in the elderly or orthopedic oncology. In situations like these, where adequate nutrition and immunocompetency may be lacking, the added protection provided by the device may translate into a more notable benefit than in elective THA.
1. Laffosse JM, Chiron P, Tricoire JL, Giordano G, Molinier F, Puget J. Prospective and comparative study of minimally invasive posterior approach versus standard posterior approach in total hip replacement [in French]. Rev Chir Orthop Reparatrice Appar Mot. 2007;93(3):228-237.
2. Smith TO, Blake V, Hing CB. Minimally invasive versus conventional exposure for total hip arthroplasty: a systematic review and meta-analysis of clinical and radiological outcomes. Int Orthop. 2011;35(2):173-184.
3. Wright JM, Crockett HC, Delgado S, Lyman S, Madsen M, Sculco TP. Mini-incision for total hip arthroplasty: a prospective, controlled investigation with 5-year follow-up evaluation. J Arthroplasty. 2004;19(5):538-545.
4. Mardones R, Pagnano MW, Nemanich JP, Trousdale RT. The Frank Stinchfield Award: muscle damage after total hip arthroplasty done with the two-incision and mini-posterior techniques. Clin Orthop. 2005;(441):63-67.
5. Müller M, Tohtz S, Dewey M, Springer I, Perka C. Age-related appearance of muscle trauma in primary total hip arthroplasty and the benefit of a minimally invasive approach for patients older than 70 years. Int Orthop. 2011;35(2):165-171.
6. Noble PC, Johnston JD, Alexander JA, et al. Making minimally invasive THR safe: conclusions from biomechanical simulation and analysis. Int Orthop. 2007;31(suppl 1):S25-S28.
7. Bremer AK, Kalberer F, Pfirrmann CW, Dora C. Soft-tissue changes in hip abductor muscles and tendons after total hip replacement: comparison between the direct anterior and the transgluteal approaches. J Bone Joint Surg Br. 2011;93(7):886-889.
8. Matta JM, Shahrdar C, Ferguson T. Single-incision anterior approach for total hip arthroplasty on an orthopaedic table. Clin Orthop. 2005;(441):115-124.
9. Rachbauer F, Kain MSH, Leunig M. The history of the anterior approach to the hip. Orthop Clin North Am. 2009;40(3):311-320.
10. Bergin PF, Doppelt JD, Kephart CJ, et al. Comparison of minimally invasive direct anterior versus posterior total hip arthroplasty based on inflammation and muscle damage markers. J Bone Joint Surg Am. 2011;93(15):1392-1398.
11. Mayr E, Nogler M, Benedetti MG, et al. A prospective randomized assessment of earlier functional recovery in THA patients treated by minimally invasive direct anterior approach: a gait analysis study. Clin Biomech. 2009;24(10):812-818.
12. Meneghini RM, Pagnano MW, Trousdale RT, Hozack WJ. Muscle damage during MIS total hip arthroplasty: Smith-Petersen versus posterior approach. Clin Orthop. 2006;(453):293-298.
13. Sculco TP. Anterior approach in THA improves outcomes: opposes. Orthopedics. 2011;34(9):e459-e461.
14. Bhandari M, Matta JM, Dodgin D, et al; Anterior Total Hip Arthroplasty Collaborative Investigators. Outcomes following the single-incision anterior approach to total hip arthroplasty: a multicenter observational study. Orthop Clin North Am. 2009;40(3):329-342.
15. Jewett BA, Collis DK. High complication rate with anterior total hip arthroplasties on a fracture table. Clin Orthop. 2011;469(2):503-507.
16. Barton C, Kim PR. Complications of the direct anterior approach for total hip arthroplasty. Orthop Clin North Am. 2009;40(3):371-375.
17. Bender B, Nogler M, Hozack WJ. Direct anterior approach for total hip arthroplasty. Orthop Clin North Am. 2009;40(3):321-328.
18. Pelosi MA 2nd, Pelosi MA 3rd. Self-retaining abdominal retractor for minilaparotomy. Obstet Gynecol. 2000;96(5, pt 1):775-778.
19. Lee P, Waxman K, Taylor B, Yim S. Use of wound-protection system and postoperative wound-infection rates in open appendectomy: a randomized prospective trial. Arch Surg. 2009;144(9):872-875.
20. Horiuchi T, Tanishima H, Tamagawa K, et al. Randomized, controlled investigation of the anti-infective properties of the Alexis retractor/protector of incision sites. J Trauma. 2007;62(1):212-215.
21. Greene KA, Wilde AH, Stulberg BN. Preoperative nutritional status of total joint patients. Relationship to postoperative wound complications. J Arthroplasty. 1991;6(4):321-325.
22. Alijanipour P, Heller S, Parvizi J. Prevention of periprosthetic joint infection: what are the effective strategies? J Knee Surg. 2014;27(4):251-258.
23. Suarez JC, Slotkin EM, Alvarez AM, Szubski CR, Barsoum WK, Patel PD. Prospective, randomized trial to evaluate efficacy of a thrombin-based hemostaticagent in total knee arthroplasty. J Arthroplasty. 2014;29(10):1950-1955.
24. Singer AJ, Arora B, Dagum A, Valentine S, Hollander JE. Development and validation of a novel scar evaluation scale. Plast Reconstr Surg. 2007;120(7):1892-1897.
25. Beausang E, Floyd H, Dunn KW, Orton CI, Ferguson MW. A new quantitative scale for clinical scar assessment. Plast Reconstr Surg. 1998;102(6):1954-1961.
26. Durani P, McGrouther DA, Ferguson MW. Current scales for assessing human scarring: a review. J Plast Reconstr Aesthet Surg. 2009;62(6):713-720.
27. Fearmonti R, Bond J, Erdmann D, Levinson H. A review of scar scales and scar measuring devices. Eplasty. 2010;10:e43.
28. Duncan JA, Bond JS, Mason T, et al. Visual analogue scale scoring and ranking: a suitable and sensitive method for assessing scar quality? Plast Reconstr Surg. 2006;118(4):909-918.
29. Quinn JV, Wells GA. An assessment of clinical wound evaluation scales. Acad Emerg Med. 1998;5(6):583-586.
30. Livesey C, Wylde V, Descamps S, et al. Skin closure after total hip replacement: a randomised controlled trial of skin adhesive versus surgical staples. J Bone Joint Surg Br. 2009;91(6):725-729.
31. Atiyeh BS. Nonsurgical management of hypertrophic scars: evidence-based therapies, standard practices, and emerging methods. Aesthetic Plast Surg. 2007;31(5):468-492.
32. Mow CS, Woolson ST, Ngarmukos SG, Park EH, Lorenz HP. Comparison of scars from total hip replacements done with a standard or a mini-incision. Clin Orthop. 2005;(441):80-85.
33. Khan RJ, Fick D, Yao F, et al. A comparison of three methods of wound closure following arthroplasty: a prospective, randomised, controlled trial. J Bone Joint Surg Br. 2006;88(2):238-242.
34. Goldstein WM, Ali R, Branson JJ, Berland KA. Comparison of patient satisfaction with incision cosmesis after standard and minimally invasive total hip arthroplasty. Orthopedics. 2008;31(4):368.
35. Quinn J, Wells G, Sutcliffe T, et al. Tissue adhesive versus suture wound repair at 1 year: randomized clinical trial correlating early, 3-month, and 1-year cosmetic outcome. Ann Emerg Med. 1998;32(6):645-649.
36. Alberti LR, Petroianu A, Zac RI, Andrade JC Jr. The effect of surgical procedures on serum albumin concentration. Chirurgia (Bucur). 2008;103(1):39-43.
37. Berend KR, Lombardi AV Jr, Seng BE, Adams JB. Enhanced early outcomes with the anterior supine intermuscular approach in primary total hip arthroplasty. J Bone Joint Surg Am. 2009;91(suppl 6):107-120.
38. Mutnal A, Patel P, Cardona L, Suarez J. Periprosthetic Propionibacterium granulosum joint infection after direct anterior total hip arthroplasty: a case report. JBJS Case Connector. 2011;1(2):e10.
39. Alvarez AM, Suarez JC, Patel P, Benton EG. Fluoroscopic imaging of acetabular cup position during THA through a direct anterior approach. Orthopedics. 2013;36(10):776-777. Erratum in: Orthopedics. 2014;37(1):16.
It is thought that, by placing more emphasis on soft-tissue preservation, minimally invasive surgery total hip arthroplasty (MIS-THA) results in less soft-tissue trauma, less blood loss, and earlier recovery.1-3 Despite these improvements over standard methods, there is a concern that the vigorous retraction needed for proper visualization through smaller incisions could injure soft tissues.4-7 Single-incision direct anterior THA (DA-THA) has gained in popularity because of the true intermuscular/internervous plane through which the procedure can be performed with relatively minimal muscle dissection using MIS techniques.8,9 This approach may offer quicker recovery and superior stability in comparison with nonintermuscular methods, which unavoidably cause more muscle damage.10-12
Although the evidence of these early gains is encouraging, several studies have found high complication rates with DA-THA.8,13-17 Noted disadvantages include a steep learning curve, lateral femoral cutaneous neurapraxia, need for a specialized table, and higher fracture and wound complication rates. Not surprisingly, with increased surgeon experience, the complication rate decreased substantially.14,15 However, wound-related complications remained steady, with 2 recent large studies reporting rates of 4.6% and 2.1%.14,15 The thin anterior skin, high tensional forces along the groin crease and perpendicular to the typical DA incision, and less resilient soft-tissue envelope are postulated reasons for wound-related issues, which are likely magnified in patients who are more obese.15,16
A novel device designed to lessen tissue damage is the ring retractor (Figure 1). Used initially in general surgery and obstetrics, it consists of 2 semirigid polymer rings connected by a flexible cylindrical polymer membrane.18-20 The lower ring is tucked and anchored underneath the wound edge, and then the upper ring is rolled down and cinched onto the skin. The resultant tension on the polymer sleeve—imparted by the rigidity of the ring—provides strong, evenly distributed wound-edge retraction. It also provides a physical barrier between the wound edge and the rest of the operative field. Proponents of the ring retractor claim increased wound-edge moisture, less bruising, and reduced local trauma compared with standard metal retractors alone.
Wound-edge retractor forces are doubled during MIS-THA compared with conventional THA.14-20 This may explain reports of worse scar cosmesis with MIS-THA. Given the theoretical benefits of minimized wound-edge trauma, the ring retractor may improve scar appearance compared with standard retraction alone. Any clinically relevant effect on cosmesis should be readily apparent to justify use of the retractor in this regard. Although some surgeons routinely use the device for primary THA, it has not been the subject of any recent orthopedic studies.
In the present study, we prospectively investigated wound cosmesis with and without use of the ring retractor in patients undergoing DA-THA.
Materials and Methods
This prospective, single-center, randomized study was reviewed and approved by the institutional review board at our facility. Consent was obtained from all participating patients.
We evaluated 50 surgical incisions in 48 patients. Eligible participants were over age 18 years and undergoing primary DA-THA. Exclusion criteria included previous surgery on the affected hip, a pathological hip condition requiring an extensile exposure, systemic inflammatory illness, chronic corticosteroid use, and dermatologic abnormality of the incisional area. One patient was having simultaneous bilateral THAs, and another was having staged bilateral THAs. Each hip in these patients was given its own case number and treated separately. Of the 49 patients who met all the inclusion criteria, only 1 decided not to participate (Figure 2).
Stratified randomization with permuted block size (sex, body mass index [BMI]) was used to assign patients in a 1:1 ratio to either the treatment group or the control group. In the treatment group, the Protractor Incision Protector and Retractor (Gyrus ACMI, Southborough, Massachusetts) was used with standard metal retractors. In the control group, only standard metal retractors were used. Patients were blinded to their group assignments, and surgeons were informed about each assignment only after the initial incision was made.
Clinical research investigators were blinded to the groups’ prospectively collected data. Collection time points were preoperative clinical visit, day of surgery through discharge, and 2-, 6-, and 12-week postoperative follow-ups. Day-of-surgery data included estimated intraoperative blood loss, operative side, operative time, intraoperative complications, and American Society of Anesthesiologists (ASA) physical status classification. Total length of stay, pain scores (range, 0-10), estimated drain output, and blood-transfusion data were also recorded. To evaluate whether the device had any effect on short-term functional outcome, we collected Harris Hip Scores (HHS) and Short Form–12 (SF-12, Version 2) scores at the preoperative and 6-week postoperative visits. We also documented any wound-healing-related issues or complications that occurred up until the final visit.
To account for any effect of nutrition status on wound healing, we obtained pre-albumin and albumin levels and absolute lymphocyte counts from the preoperative electronic records. We used an albumin level under 3.5 g/dL and an absolute lymphocyte count under 1500/µL for our analysis, as these cutoffs have been associated with wound complications after primary THA.21 There is no similarly established threshold for pre-albumin level, so we used values under 20 mg/L based on comparable literature.22,23
At each postoperative visit, standardized high-resolution images were obtained. At the 12-week visit, patients completed 2 Likert scales regarding their overall opinion of their scars and how their scars compared with their expectations. They also ranked 5 separate THA-related outcomes in order of importance (Appendix).
Photographs were evaluated by 2 blinded plastic surgeons (Dr. Friedman and Dr. Jack) using 2 grading systems—the Stony Brook Scar Evaluation Scale (SBSES)24 (Table 1) and a modified Manchester Scar Scale (MSS)25 (Table 2). We used these systems because they were photograph-based, psychometrically studied, and specifically designed to assess surgical incision healing with established validity and reliability.24-27 A particular advantage, strictly related to cosmetic outcome, is their validity in scoring scars from high-definition photographs in a different place or time. The SBSES, an ordinal wound evaluation scale that measures short-term cosmetic outcomes, consists of 6 items, each receiving 1 or 0 point, yielding a total score between 0 (worst) and 5 (best). The modified MSS includes a visual analog scale (VAS), which has a vertical hash marked on a 10-cm line and is scored between 0 (excellent) and 10 (poor) to 1 decimal point.26,28 This value is added to grades on color, surface appearance, contour, and distortion, resulting in a score between 4 (best) and 24 (worst). The primary outcome measures were Likert-scale responses obtained at final visit and SBSES/MSS scores for each visit; 12-week scores were the primary end point.
Operative Procedure
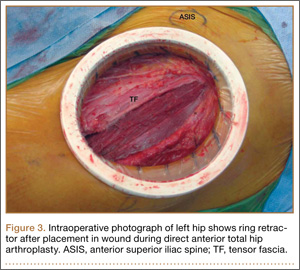
Experienced fellowship-trained orthopedic surgeons performed all procedures. A modified Hueter approach was used for exposure.9 Mean incision length was about 12 cm. For the treatment group, the ring retractor was inserted at the level of the tensor fascia, with the inferior ring resting between the fascia and the subcutaneous layer and the superior ring cinched over the skin (Figure 3). The device is made in 4 different sizes for incisions from 2.5 to 17 cm; our study population required only 1 size. Otherwise, the surgical protocol was based on that described by Matta and colleagues.8 Wound closure (over a drain) was performed according to a standardized protocol—running No. 1 Vicryl suture for the superficial tensor fascia, interrupted 2-0 Vicryl for the deep dermal layer, and subcutaneous 4-0 Monocryl for the skin followed by application of Dermabond (Ethicon, Somerville, New Jersey) and Tegaderm +Pad (3M, St. Paul, Minnesota) for outer dressing, which was replaced on postoperative day 2 and removed at the 2-week visit.
Statistical Methods
An a priori sample-size calculation was performed. Power performed in a base of a prior study that evaluated anterolateral and posterolateral THA scars using a VAS, a component of the MSS, suggested a sample size of 16 per group to detect the minimal clinically important difference of 1.5 cm: SD (σ) = 1.5 cm, α = 0.05, β = 0.20.29,30 In addition, a general estimate for detecting a 1-unit change on an ordinal scale (σ = 1.0, α = 0.05, β = 0.20) resulted in the same number. We conservatively decided to enroll 25 patients per arm in case of larger true variance.
The Wilcoxon rank sum test was used for comparisons of continuous data between groups. Differences between means were analyzed with 2-sided t tests. Categorical data were compared with the Pearson χ2 test or the Fisher exact test, as indicated. Ordinal ranking scores were compared with the Mantel-Haenszel test. Multivariate logistic regression was applied to identify the significant independent predictors of better scar grades for each surgeon by considering candidate variables with Ps < .20 in the univariate analysis.
Results
We found no differences in demographic or perioperative characteristics between treatment and control groups (Tables 3, 4). The groups showed similar mean improvements in their respective 6-week HHS (38.7 and 36.4 points; P = .65), SF-12 physical component summary scores (11.8 and 14.5 points; P = .37), and SF-12 mental component summary scores (5.1 and 3.7; P = .70).
Patient questionnaire outcomes are listed in Table 5. For the control group, 25/25 image sets were obtained at the 2-week visit, 25/25 at the 6-week visit, and 24/25 at the 12-week visit. For the treatment group, there were 23/25, 24/25, and 23/25 images sets, respectively.
When surgeon scoring was analyzed separately, SBSES and MSS scores were similar between treatment and control groups, with 1 exception: 2-week MSS scores were better for the treatment group according to surgeon A (P = .026). When grades were averaged, SBSES scores were again similar at all time points (Figure 4A); MSS scores were better for the treatment group at 2 weeks (P = .036) and equivalent at all other time points (Figure 4B). For the SBSES, Spearman correlation coefficient ρ with 95% confidence interval (CI) was 0.37
(95% CI, 0.08-0.66) at 2 weeks, 0.48 (95% CI, 0.20-0.76) at 6 weeks, and 0.62 (95% CI, 0.33-0.91) at 12 weeks. Following the same pattern for the MSS, ρ was 0.20 (95% CI, –0.09 to 0.49), 0.51 (95% CI, 0.23-0.79), and 0.32 (95% CI, 0.03-0.61).
Independent multivariate analysis revealed that age over 65 years was a significant predictor of worse scores. On SBSES, the odds ratio (OR) was 1.15 (95% CI, 1.07-1.24) for surgeon A and 1.11 (95% CI, 1.05-1.18) for surgeon B. On MSS, the OR was 0.89 (95% CI, 0.84-0.94) for surgeon A and 0.95 (95% CI, 0.91-0.99) for surgeon B. The likelihood of having worse SBSES scores according to surgeon A was 4.72 times higher if the pre-albumin level was under 20 mg/L (95% CI, 1.15-19.36). Albumin level under 3.5 g/dL and absolute lymphocyte count under 1500 cells/µL were not found to be independent predictors of poorer scores.
Patients’ overall opinion (P = .63) and assessment of their scars relative to expectations (P = .25) on the Likert scales were not different between groups. More scars exceeded patients’ expectations and had more excellent ratings in the control group. The 2 groups were similar with regard to relative importance of various patient-related outcomes. Factors most important to overall outcome were relief of hip pain, followed by implant longevity and length of recovery. Least important were incision-related variables.
There were only 3 minor noninfectious wound complications (6%), 2 in the treatment group and 1 in the control group. In the treatment group, a 67-year-old man with diabetes (ASA class III; BMI, 32.1 kg/m2; received transfusion) had 2 small areas (<5 mm) of superficial ulceration at 6-week follow-up—one at the proximal aspect of the incision and the other near the midpoint along the flexion crease. Both lesions resolved by 12-week follow-up. Also in the treatment group, a 77-year-old woman (ASA class II; BMI, 24.9 kg/m2; received transfusion) at 6 weeks had a spitting suture, which was removed in clinic without further issue. In the control group, a 55-year-old woman (ASA class II; BMI, 27.4 kg/m2) had a suture reaction near the proximal aspect of her incision 3 weeks after surgery. This reaction, which presented as a mild, localized erythema without pain, tenderness, or drainage, resolved by 6-week follow-up. None of these wound complications required intervention beyond observation.
Discussion
This study was designed to provide a bipartisan measure of wound-healing cosmesis after DA-THA. Scar evaluation by blinded plastic surgeons served as a standardized, clinical assessment, whereas the patient questionnaire offered a more subjective appraisal. The modified MMS25 and the SBSES24 are the only 2 wound-grading systems designed and validated for photographic assessment of postsurgical scars. Most scar evaluation schemes pertain to burn or traumatic scars.26,27,31 As a result, many earlier studies intending to compare incisional scars used poorly suited evaluation systems.
The current literature includes reports on 3 studies with scoring-based scar assessment in THA; all used grading systems designed for either burns or traumatic wounds, but 2 also used a VAS.32-34 VASs have been validated for measuring wound cosmesis but are entirely subjective and without structure and provide no feedback as to why a scar was rated good or bad.24 Mow and colleagues32 prospectively compared scars after standard posterior or MIS approaches and found no differences according to a scoring system intended for burn scars. In our study population, we found no group differences in patients’ cosmesis of their scars.
Although scars can take a year or longer to fully mature, researchers from the University of Michigan discovered that scar appearance at 1 year correlates highly with cosmesis 12 weeks after closure, though poorly with cosmesis 10 days after closure.35 Therefore, any observed differences in scar cosmesis between groups at 12-week follow-up would likely persist, whereas differences at 2-week follow-up would have little bearing on ultimate appearance. For this reason, our primary outcome measure was healing process and cosmesis at 12 weeks. High wound complication rates have been reported for MIS-DA-THA.8,14-16 Jewett and Collis15 noted a 4.6% wound complication rate (3% noninfectious ulcerative dehiscence, 1.6% superficial infection), which is comparable to the 6% rate found in this study. However, there likely is some variability across studies in what constitutes a wound complication or superficial infection. Of our 3 wound complications—stitch reaction, spitting suture, small noninfectious ulceration—only the ulceration was of a severity similar to that reported by Jewett and Collis.15 Matta and colleagues8 reported only 3 wound complications (in 494 patients), all severe enough to require operative intervention. One explanation for this low complication rate is use of a ring retractor, as it is routinely depicted in their technique paper. However, no specific reference is made to gauge how often the device was used.
Rates of superficial infection after DA-THA range from 0.6% to 1.6% in 3 large observational studies (combined deep infection rate, 0.43%).8,14,15 In 2 of these studies, all patients with superficial infection underwent formal débridement, though none developed deep infection. A prospective randomized study of 221 patients who underwent colorectal surgery—where perioperative infectious morbidity ranges from 25% to 50%—found that ring retractor use significantly reduced superficial wound infection rates (8.1% vs 0%). A significant reduction in wound infection was shown in a similarly designed study involving 48 patients who had open appendectomy (14.6% vs 1.6%). The device had no effect on deep infection in either general surgery study. The wound infection rates reported in these general surgery studies are markedly higher than those in our study population. As a result, the effect of the ring retractor on wound infection in DA-THA may be less. Regardless of the effect on deep infection, fewer superficial infections, which often require operative intervention, would be of considerable benefit.
Below-threshold albumin level and absolute lymphocyte count have been associated with wound-healing complications after hip replacement.21 In the present study, pre-albumin level under 20 mg/L was the only nutritional marker predictive of poor wound appearance, but this finding was seen only in SBSES scores from surgeon A. Subgroup analysis did not reveal any relationship between wound appearance and any of the recorded demographic or perioperative variables, but for a small predictive influence with age over 65 years.
This study had some limitations. Our findings cannot be generalized to all patients who undergo THA, as only DA incisions were studied. Results also may not be generalizable to non-fellowship-trained orthopedists. In addition, selection bias likely resulted from including patients already selected for the DA approach. Using digital images for evaluation (vs real-life evaluation) may have affected reliability as well. Last, by not incorporating texture, we omitted a potentially informative feature from scoring.
It is paramount that surgeons undergo diligent training before undertaking this approach for minimizing unwanted results; furthermore, higher early complication rates level off with increased surgeon experience.14,36,37 We recommend meticulous soft-tissue handling, cautious retraction, and careful patient selection (relative contraindication for patients with an abdominal pannus overlying the incision) as primary measures for minimizing incisional trauma and potential wound-healing complications.38 Preservation of the tensor fascia is also crucial,39 as it is the only closable layer separating deep and superficial compartments. Without good closure of the tensor fascia, there is no containment or tamponade of deep bleeding, which can facilitate hematoma formation.
In the population studied, we found no significant long-term differences in cosmetic appearance (based on clinician or patient evaluation) between wounds managed with and without the ring retractor. Our data do not support routine use of the ring retractor, during DA-THA, for improved wound cosmesis. Whether the device has any significant role in reducing the number of wound complications in THA is yet to be determined. Last, the ring retractor may have a role in other areas of orthopedic surgery, such as hip fractures in the elderly or orthopedic oncology. In situations like these, where adequate nutrition and immunocompetency may be lacking, the added protection provided by the device may translate into a more notable benefit than in elective THA.
It is thought that, by placing more emphasis on soft-tissue preservation, minimally invasive surgery total hip arthroplasty (MIS-THA) results in less soft-tissue trauma, less blood loss, and earlier recovery.1-3 Despite these improvements over standard methods, there is a concern that the vigorous retraction needed for proper visualization through smaller incisions could injure soft tissues.4-7 Single-incision direct anterior THA (DA-THA) has gained in popularity because of the true intermuscular/internervous plane through which the procedure can be performed with relatively minimal muscle dissection using MIS techniques.8,9 This approach may offer quicker recovery and superior stability in comparison with nonintermuscular methods, which unavoidably cause more muscle damage.10-12
Although the evidence of these early gains is encouraging, several studies have found high complication rates with DA-THA.8,13-17 Noted disadvantages include a steep learning curve, lateral femoral cutaneous neurapraxia, need for a specialized table, and higher fracture and wound complication rates. Not surprisingly, with increased surgeon experience, the complication rate decreased substantially.14,15 However, wound-related complications remained steady, with 2 recent large studies reporting rates of 4.6% and 2.1%.14,15 The thin anterior skin, high tensional forces along the groin crease and perpendicular to the typical DA incision, and less resilient soft-tissue envelope are postulated reasons for wound-related issues, which are likely magnified in patients who are more obese.15,16
A novel device designed to lessen tissue damage is the ring retractor (Figure 1). Used initially in general surgery and obstetrics, it consists of 2 semirigid polymer rings connected by a flexible cylindrical polymer membrane.18-20 The lower ring is tucked and anchored underneath the wound edge, and then the upper ring is rolled down and cinched onto the skin. The resultant tension on the polymer sleeve—imparted by the rigidity of the ring—provides strong, evenly distributed wound-edge retraction. It also provides a physical barrier between the wound edge and the rest of the operative field. Proponents of the ring retractor claim increased wound-edge moisture, less bruising, and reduced local trauma compared with standard metal retractors alone.
Wound-edge retractor forces are doubled during MIS-THA compared with conventional THA.14-20 This may explain reports of worse scar cosmesis with MIS-THA. Given the theoretical benefits of minimized wound-edge trauma, the ring retractor may improve scar appearance compared with standard retraction alone. Any clinically relevant effect on cosmesis should be readily apparent to justify use of the retractor in this regard. Although some surgeons routinely use the device for primary THA, it has not been the subject of any recent orthopedic studies.
In the present study, we prospectively investigated wound cosmesis with and without use of the ring retractor in patients undergoing DA-THA.
Materials and Methods
This prospective, single-center, randomized study was reviewed and approved by the institutional review board at our facility. Consent was obtained from all participating patients.
We evaluated 50 surgical incisions in 48 patients. Eligible participants were over age 18 years and undergoing primary DA-THA. Exclusion criteria included previous surgery on the affected hip, a pathological hip condition requiring an extensile exposure, systemic inflammatory illness, chronic corticosteroid use, and dermatologic abnormality of the incisional area. One patient was having simultaneous bilateral THAs, and another was having staged bilateral THAs. Each hip in these patients was given its own case number and treated separately. Of the 49 patients who met all the inclusion criteria, only 1 decided not to participate (Figure 2).
Stratified randomization with permuted block size (sex, body mass index [BMI]) was used to assign patients in a 1:1 ratio to either the treatment group or the control group. In the treatment group, the Protractor Incision Protector and Retractor (Gyrus ACMI, Southborough, Massachusetts) was used with standard metal retractors. In the control group, only standard metal retractors were used. Patients were blinded to their group assignments, and surgeons were informed about each assignment only after the initial incision was made.
Clinical research investigators were blinded to the groups’ prospectively collected data. Collection time points were preoperative clinical visit, day of surgery through discharge, and 2-, 6-, and 12-week postoperative follow-ups. Day-of-surgery data included estimated intraoperative blood loss, operative side, operative time, intraoperative complications, and American Society of Anesthesiologists (ASA) physical status classification. Total length of stay, pain scores (range, 0-10), estimated drain output, and blood-transfusion data were also recorded. To evaluate whether the device had any effect on short-term functional outcome, we collected Harris Hip Scores (HHS) and Short Form–12 (SF-12, Version 2) scores at the preoperative and 6-week postoperative visits. We also documented any wound-healing-related issues or complications that occurred up until the final visit.
To account for any effect of nutrition status on wound healing, we obtained pre-albumin and albumin levels and absolute lymphocyte counts from the preoperative electronic records. We used an albumin level under 3.5 g/dL and an absolute lymphocyte count under 1500/µL for our analysis, as these cutoffs have been associated with wound complications after primary THA.21 There is no similarly established threshold for pre-albumin level, so we used values under 20 mg/L based on comparable literature.22,23
At each postoperative visit, standardized high-resolution images were obtained. At the 12-week visit, patients completed 2 Likert scales regarding their overall opinion of their scars and how their scars compared with their expectations. They also ranked 5 separate THA-related outcomes in order of importance (Appendix).
Photographs were evaluated by 2 blinded plastic surgeons (Dr. Friedman and Dr. Jack) using 2 grading systems—the Stony Brook Scar Evaluation Scale (SBSES)24 (Table 1) and a modified Manchester Scar Scale (MSS)25 (Table 2). We used these systems because they were photograph-based, psychometrically studied, and specifically designed to assess surgical incision healing with established validity and reliability.24-27 A particular advantage, strictly related to cosmetic outcome, is their validity in scoring scars from high-definition photographs in a different place or time. The SBSES, an ordinal wound evaluation scale that measures short-term cosmetic outcomes, consists of 6 items, each receiving 1 or 0 point, yielding a total score between 0 (worst) and 5 (best). The modified MSS includes a visual analog scale (VAS), which has a vertical hash marked on a 10-cm line and is scored between 0 (excellent) and 10 (poor) to 1 decimal point.26,28 This value is added to grades on color, surface appearance, contour, and distortion, resulting in a score between 4 (best) and 24 (worst). The primary outcome measures were Likert-scale responses obtained at final visit and SBSES/MSS scores for each visit; 12-week scores were the primary end point.
Operative Procedure
Experienced fellowship-trained orthopedic surgeons performed all procedures. A modified Hueter approach was used for exposure.9 Mean incision length was about 12 cm. For the treatment group, the ring retractor was inserted at the level of the tensor fascia, with the inferior ring resting between the fascia and the subcutaneous layer and the superior ring cinched over the skin (Figure 3). The device is made in 4 different sizes for incisions from 2.5 to 17 cm; our study population required only 1 size. Otherwise, the surgical protocol was based on that described by Matta and colleagues.8 Wound closure (over a drain) was performed according to a standardized protocol—running No. 1 Vicryl suture for the superficial tensor fascia, interrupted 2-0 Vicryl for the deep dermal layer, and subcutaneous 4-0 Monocryl for the skin followed by application of Dermabond (Ethicon, Somerville, New Jersey) and Tegaderm +Pad (3M, St. Paul, Minnesota) for outer dressing, which was replaced on postoperative day 2 and removed at the 2-week visit.
Statistical Methods
An a priori sample-size calculation was performed. Power performed in a base of a prior study that evaluated anterolateral and posterolateral THA scars using a VAS, a component of the MSS, suggested a sample size of 16 per group to detect the minimal clinically important difference of 1.5 cm: SD (σ) = 1.5 cm, α = 0.05, β = 0.20.29,30 In addition, a general estimate for detecting a 1-unit change on an ordinal scale (σ = 1.0, α = 0.05, β = 0.20) resulted in the same number. We conservatively decided to enroll 25 patients per arm in case of larger true variance.
The Wilcoxon rank sum test was used for comparisons of continuous data between groups. Differences between means were analyzed with 2-sided t tests. Categorical data were compared with the Pearson χ2 test or the Fisher exact test, as indicated. Ordinal ranking scores were compared with the Mantel-Haenszel test. Multivariate logistic regression was applied to identify the significant independent predictors of better scar grades for each surgeon by considering candidate variables with Ps < .20 in the univariate analysis.
Results
We found no differences in demographic or perioperative characteristics between treatment and control groups (Tables 3, 4). The groups showed similar mean improvements in their respective 6-week HHS (38.7 and 36.4 points; P = .65), SF-12 physical component summary scores (11.8 and 14.5 points; P = .37), and SF-12 mental component summary scores (5.1 and 3.7; P = .70).
Patient questionnaire outcomes are listed in Table 5. For the control group, 25/25 image sets were obtained at the 2-week visit, 25/25 at the 6-week visit, and 24/25 at the 12-week visit. For the treatment group, there were 23/25, 24/25, and 23/25 images sets, respectively.
When surgeon scoring was analyzed separately, SBSES and MSS scores were similar between treatment and control groups, with 1 exception: 2-week MSS scores were better for the treatment group according to surgeon A (P = .026). When grades were averaged, SBSES scores were again similar at all time points (Figure 4A); MSS scores were better for the treatment group at 2 weeks (P = .036) and equivalent at all other time points (Figure 4B). For the SBSES, Spearman correlation coefficient ρ with 95% confidence interval (CI) was 0.37
(95% CI, 0.08-0.66) at 2 weeks, 0.48 (95% CI, 0.20-0.76) at 6 weeks, and 0.62 (95% CI, 0.33-0.91) at 12 weeks. Following the same pattern for the MSS, ρ was 0.20 (95% CI, –0.09 to 0.49), 0.51 (95% CI, 0.23-0.79), and 0.32 (95% CI, 0.03-0.61).
Independent multivariate analysis revealed that age over 65 years was a significant predictor of worse scores. On SBSES, the odds ratio (OR) was 1.15 (95% CI, 1.07-1.24) for surgeon A and 1.11 (95% CI, 1.05-1.18) for surgeon B. On MSS, the OR was 0.89 (95% CI, 0.84-0.94) for surgeon A and 0.95 (95% CI, 0.91-0.99) for surgeon B. The likelihood of having worse SBSES scores according to surgeon A was 4.72 times higher if the pre-albumin level was under 20 mg/L (95% CI, 1.15-19.36). Albumin level under 3.5 g/dL and absolute lymphocyte count under 1500 cells/µL were not found to be independent predictors of poorer scores.
Patients’ overall opinion (P = .63) and assessment of their scars relative to expectations (P = .25) on the Likert scales were not different between groups. More scars exceeded patients’ expectations and had more excellent ratings in the control group. The 2 groups were similar with regard to relative importance of various patient-related outcomes. Factors most important to overall outcome were relief of hip pain, followed by implant longevity and length of recovery. Least important were incision-related variables.
There were only 3 minor noninfectious wound complications (6%), 2 in the treatment group and 1 in the control group. In the treatment group, a 67-year-old man with diabetes (ASA class III; BMI, 32.1 kg/m2; received transfusion) had 2 small areas (<5 mm) of superficial ulceration at 6-week follow-up—one at the proximal aspect of the incision and the other near the midpoint along the flexion crease. Both lesions resolved by 12-week follow-up. Also in the treatment group, a 77-year-old woman (ASA class II; BMI, 24.9 kg/m2; received transfusion) at 6 weeks had a spitting suture, which was removed in clinic without further issue. In the control group, a 55-year-old woman (ASA class II; BMI, 27.4 kg/m2) had a suture reaction near the proximal aspect of her incision 3 weeks after surgery. This reaction, which presented as a mild, localized erythema without pain, tenderness, or drainage, resolved by 6-week follow-up. None of these wound complications required intervention beyond observation.
Discussion
This study was designed to provide a bipartisan measure of wound-healing cosmesis after DA-THA. Scar evaluation by blinded plastic surgeons served as a standardized, clinical assessment, whereas the patient questionnaire offered a more subjective appraisal. The modified MMS25 and the SBSES24 are the only 2 wound-grading systems designed and validated for photographic assessment of postsurgical scars. Most scar evaluation schemes pertain to burn or traumatic scars.26,27,31 As a result, many earlier studies intending to compare incisional scars used poorly suited evaluation systems.
The current literature includes reports on 3 studies with scoring-based scar assessment in THA; all used grading systems designed for either burns or traumatic wounds, but 2 also used a VAS.32-34 VASs have been validated for measuring wound cosmesis but are entirely subjective and without structure and provide no feedback as to why a scar was rated good or bad.24 Mow and colleagues32 prospectively compared scars after standard posterior or MIS approaches and found no differences according to a scoring system intended for burn scars. In our study population, we found no group differences in patients’ cosmesis of their scars.
Although scars can take a year or longer to fully mature, researchers from the University of Michigan discovered that scar appearance at 1 year correlates highly with cosmesis 12 weeks after closure, though poorly with cosmesis 10 days after closure.35 Therefore, any observed differences in scar cosmesis between groups at 12-week follow-up would likely persist, whereas differences at 2-week follow-up would have little bearing on ultimate appearance. For this reason, our primary outcome measure was healing process and cosmesis at 12 weeks. High wound complication rates have been reported for MIS-DA-THA.8,14-16 Jewett and Collis15 noted a 4.6% wound complication rate (3% noninfectious ulcerative dehiscence, 1.6% superficial infection), which is comparable to the 6% rate found in this study. However, there likely is some variability across studies in what constitutes a wound complication or superficial infection. Of our 3 wound complications—stitch reaction, spitting suture, small noninfectious ulceration—only the ulceration was of a severity similar to that reported by Jewett and Collis.15 Matta and colleagues8 reported only 3 wound complications (in 494 patients), all severe enough to require operative intervention. One explanation for this low complication rate is use of a ring retractor, as it is routinely depicted in their technique paper. However, no specific reference is made to gauge how often the device was used.
Rates of superficial infection after DA-THA range from 0.6% to 1.6% in 3 large observational studies (combined deep infection rate, 0.43%).8,14,15 In 2 of these studies, all patients with superficial infection underwent formal débridement, though none developed deep infection. A prospective randomized study of 221 patients who underwent colorectal surgery—where perioperative infectious morbidity ranges from 25% to 50%—found that ring retractor use significantly reduced superficial wound infection rates (8.1% vs 0%). A significant reduction in wound infection was shown in a similarly designed study involving 48 patients who had open appendectomy (14.6% vs 1.6%). The device had no effect on deep infection in either general surgery study. The wound infection rates reported in these general surgery studies are markedly higher than those in our study population. As a result, the effect of the ring retractor on wound infection in DA-THA may be less. Regardless of the effect on deep infection, fewer superficial infections, which often require operative intervention, would be of considerable benefit.
Below-threshold albumin level and absolute lymphocyte count have been associated with wound-healing complications after hip replacement.21 In the present study, pre-albumin level under 20 mg/L was the only nutritional marker predictive of poor wound appearance, but this finding was seen only in SBSES scores from surgeon A. Subgroup analysis did not reveal any relationship between wound appearance and any of the recorded demographic or perioperative variables, but for a small predictive influence with age over 65 years.
This study had some limitations. Our findings cannot be generalized to all patients who undergo THA, as only DA incisions were studied. Results also may not be generalizable to non-fellowship-trained orthopedists. In addition, selection bias likely resulted from including patients already selected for the DA approach. Using digital images for evaluation (vs real-life evaluation) may have affected reliability as well. Last, by not incorporating texture, we omitted a potentially informative feature from scoring.
It is paramount that surgeons undergo diligent training before undertaking this approach for minimizing unwanted results; furthermore, higher early complication rates level off with increased surgeon experience.14,36,37 We recommend meticulous soft-tissue handling, cautious retraction, and careful patient selection (relative contraindication for patients with an abdominal pannus overlying the incision) as primary measures for minimizing incisional trauma and potential wound-healing complications.38 Preservation of the tensor fascia is also crucial,39 as it is the only closable layer separating deep and superficial compartments. Without good closure of the tensor fascia, there is no containment or tamponade of deep bleeding, which can facilitate hematoma formation.
In the population studied, we found no significant long-term differences in cosmetic appearance (based on clinician or patient evaluation) between wounds managed with and without the ring retractor. Our data do not support routine use of the ring retractor, during DA-THA, for improved wound cosmesis. Whether the device has any significant role in reducing the number of wound complications in THA is yet to be determined. Last, the ring retractor may have a role in other areas of orthopedic surgery, such as hip fractures in the elderly or orthopedic oncology. In situations like these, where adequate nutrition and immunocompetency may be lacking, the added protection provided by the device may translate into a more notable benefit than in elective THA.
1. Laffosse JM, Chiron P, Tricoire JL, Giordano G, Molinier F, Puget J. Prospective and comparative study of minimally invasive posterior approach versus standard posterior approach in total hip replacement [in French]. Rev Chir Orthop Reparatrice Appar Mot. 2007;93(3):228-237.
2. Smith TO, Blake V, Hing CB. Minimally invasive versus conventional exposure for total hip arthroplasty: a systematic review and meta-analysis of clinical and radiological outcomes. Int Orthop. 2011;35(2):173-184.
3. Wright JM, Crockett HC, Delgado S, Lyman S, Madsen M, Sculco TP. Mini-incision for total hip arthroplasty: a prospective, controlled investigation with 5-year follow-up evaluation. J Arthroplasty. 2004;19(5):538-545.
4. Mardones R, Pagnano MW, Nemanich JP, Trousdale RT. The Frank Stinchfield Award: muscle damage after total hip arthroplasty done with the two-incision and mini-posterior techniques. Clin Orthop. 2005;(441):63-67.
5. Müller M, Tohtz S, Dewey M, Springer I, Perka C. Age-related appearance of muscle trauma in primary total hip arthroplasty and the benefit of a minimally invasive approach for patients older than 70 years. Int Orthop. 2011;35(2):165-171.
6. Noble PC, Johnston JD, Alexander JA, et al. Making minimally invasive THR safe: conclusions from biomechanical simulation and analysis. Int Orthop. 2007;31(suppl 1):S25-S28.
7. Bremer AK, Kalberer F, Pfirrmann CW, Dora C. Soft-tissue changes in hip abductor muscles and tendons after total hip replacement: comparison between the direct anterior and the transgluteal approaches. J Bone Joint Surg Br. 2011;93(7):886-889.
8. Matta JM, Shahrdar C, Ferguson T. Single-incision anterior approach for total hip arthroplasty on an orthopaedic table. Clin Orthop. 2005;(441):115-124.
9. Rachbauer F, Kain MSH, Leunig M. The history of the anterior approach to the hip. Orthop Clin North Am. 2009;40(3):311-320.
10. Bergin PF, Doppelt JD, Kephart CJ, et al. Comparison of minimally invasive direct anterior versus posterior total hip arthroplasty based on inflammation and muscle damage markers. J Bone Joint Surg Am. 2011;93(15):1392-1398.
11. Mayr E, Nogler M, Benedetti MG, et al. A prospective randomized assessment of earlier functional recovery in THA patients treated by minimally invasive direct anterior approach: a gait analysis study. Clin Biomech. 2009;24(10):812-818.
12. Meneghini RM, Pagnano MW, Trousdale RT, Hozack WJ. Muscle damage during MIS total hip arthroplasty: Smith-Petersen versus posterior approach. Clin Orthop. 2006;(453):293-298.
13. Sculco TP. Anterior approach in THA improves outcomes: opposes. Orthopedics. 2011;34(9):e459-e461.
14. Bhandari M, Matta JM, Dodgin D, et al; Anterior Total Hip Arthroplasty Collaborative Investigators. Outcomes following the single-incision anterior approach to total hip arthroplasty: a multicenter observational study. Orthop Clin North Am. 2009;40(3):329-342.
15. Jewett BA, Collis DK. High complication rate with anterior total hip arthroplasties on a fracture table. Clin Orthop. 2011;469(2):503-507.
16. Barton C, Kim PR. Complications of the direct anterior approach for total hip arthroplasty. Orthop Clin North Am. 2009;40(3):371-375.
17. Bender B, Nogler M, Hozack WJ. Direct anterior approach for total hip arthroplasty. Orthop Clin North Am. 2009;40(3):321-328.
18. Pelosi MA 2nd, Pelosi MA 3rd. Self-retaining abdominal retractor for minilaparotomy. Obstet Gynecol. 2000;96(5, pt 1):775-778.
19. Lee P, Waxman K, Taylor B, Yim S. Use of wound-protection system and postoperative wound-infection rates in open appendectomy: a randomized prospective trial. Arch Surg. 2009;144(9):872-875.
20. Horiuchi T, Tanishima H, Tamagawa K, et al. Randomized, controlled investigation of the anti-infective properties of the Alexis retractor/protector of incision sites. J Trauma. 2007;62(1):212-215.
21. Greene KA, Wilde AH, Stulberg BN. Preoperative nutritional status of total joint patients. Relationship to postoperative wound complications. J Arthroplasty. 1991;6(4):321-325.
22. Alijanipour P, Heller S, Parvizi J. Prevention of periprosthetic joint infection: what are the effective strategies? J Knee Surg. 2014;27(4):251-258.
23. Suarez JC, Slotkin EM, Alvarez AM, Szubski CR, Barsoum WK, Patel PD. Prospective, randomized trial to evaluate efficacy of a thrombin-based hemostaticagent in total knee arthroplasty. J Arthroplasty. 2014;29(10):1950-1955.
24. Singer AJ, Arora B, Dagum A, Valentine S, Hollander JE. Development and validation of a novel scar evaluation scale. Plast Reconstr Surg. 2007;120(7):1892-1897.
25. Beausang E, Floyd H, Dunn KW, Orton CI, Ferguson MW. A new quantitative scale for clinical scar assessment. Plast Reconstr Surg. 1998;102(6):1954-1961.
26. Durani P, McGrouther DA, Ferguson MW. Current scales for assessing human scarring: a review. J Plast Reconstr Aesthet Surg. 2009;62(6):713-720.
27. Fearmonti R, Bond J, Erdmann D, Levinson H. A review of scar scales and scar measuring devices. Eplasty. 2010;10:e43.
28. Duncan JA, Bond JS, Mason T, et al. Visual analogue scale scoring and ranking: a suitable and sensitive method for assessing scar quality? Plast Reconstr Surg. 2006;118(4):909-918.
29. Quinn JV, Wells GA. An assessment of clinical wound evaluation scales. Acad Emerg Med. 1998;5(6):583-586.
30. Livesey C, Wylde V, Descamps S, et al. Skin closure after total hip replacement: a randomised controlled trial of skin adhesive versus surgical staples. J Bone Joint Surg Br. 2009;91(6):725-729.
31. Atiyeh BS. Nonsurgical management of hypertrophic scars: evidence-based therapies, standard practices, and emerging methods. Aesthetic Plast Surg. 2007;31(5):468-492.
32. Mow CS, Woolson ST, Ngarmukos SG, Park EH, Lorenz HP. Comparison of scars from total hip replacements done with a standard or a mini-incision. Clin Orthop. 2005;(441):80-85.
33. Khan RJ, Fick D, Yao F, et al. A comparison of three methods of wound closure following arthroplasty: a prospective, randomised, controlled trial. J Bone Joint Surg Br. 2006;88(2):238-242.
34. Goldstein WM, Ali R, Branson JJ, Berland KA. Comparison of patient satisfaction with incision cosmesis after standard and minimally invasive total hip arthroplasty. Orthopedics. 2008;31(4):368.
35. Quinn J, Wells G, Sutcliffe T, et al. Tissue adhesive versus suture wound repair at 1 year: randomized clinical trial correlating early, 3-month, and 1-year cosmetic outcome. Ann Emerg Med. 1998;32(6):645-649.
36. Alberti LR, Petroianu A, Zac RI, Andrade JC Jr. The effect of surgical procedures on serum albumin concentration. Chirurgia (Bucur). 2008;103(1):39-43.
37. Berend KR, Lombardi AV Jr, Seng BE, Adams JB. Enhanced early outcomes with the anterior supine intermuscular approach in primary total hip arthroplasty. J Bone Joint Surg Am. 2009;91(suppl 6):107-120.
38. Mutnal A, Patel P, Cardona L, Suarez J. Periprosthetic Propionibacterium granulosum joint infection after direct anterior total hip arthroplasty: a case report. JBJS Case Connector. 2011;1(2):e10.
39. Alvarez AM, Suarez JC, Patel P, Benton EG. Fluoroscopic imaging of acetabular cup position during THA through a direct anterior approach. Orthopedics. 2013;36(10):776-777. Erratum in: Orthopedics. 2014;37(1):16.

Anemia Versus Transfusion: Does Blood Conservation Increase the Risk of Complications?
More than 13 million units of blood are transfused each year. Although transfusion can certainly be lifesaving, numerous studies over the past 20 years have shown significant, dose-dependent increases in morbidity, mortality, and cost with each unit of packed red blood cells (pRBCs) transfused.1 Transfusion is one of the most common interventions in the critically ill population; however the negative effects of transfusion-related infection are well documented in the recent literature.1-7 There is no question that transfusion of blood products can be lifesaving to acutely ill trauma patients, but there is little evidence regarding when transfusions are indicated in asymptomatic anemic patients who are no longer in need of acute resuscitation.
Several studies have analyzed healthy individuals with an isovolemic reduction in hemoglobin (Hgb) level to 5.0 g/dL.8,9 They have found no significant compromise in oxygen delivery to the tissues. Currently, there is a lack of clinical data to suggest adequate RBC transfusion endpoints in trauma surgery.10 Given the lack of evidence to support transfusion triggers for young, healthy, asymptomatic orthopedic trauma patients, we decided to investigate whether a more conservative transfusion strategy might be as safe as a more liberal strategy.
Materials and Methods
After obtaining approval from our institutional review board, we performed a retrospective observational cohort analysis of patients treated at a level I trauma center between September 2006 and February 2009. The trauma registry included all patients who underwent surgery performed by a single orthopedic fellowship–trained trauma surgeon. All patients who had a recorded Hgb level of 9.0 g/dL or less at any time during their admission were included; they were considered no longer volume-depleted after initial resuscitation. Exclusion criteria were age under 18 years or over 50 years; pregnancy; head injury; and preexisting heart, pulmonary, or renal disease.
Initially, 963 patients were identified as orthopedic trauma patients treated by Dr. Mullis within the defined period. After inclusion and exclusion criteria were used to limit this database, the charts of the 109 patients who met the above criteria were reviewed. By chart review or telephone follow-up, 104 patients with 1-year follow-up were identified, and their cases became the basis for our analysis. Demographic information, length of hospital stay, surgeries performed, number of pRBC units transfused, Hgb level prompting transfusion, lowest recorded Hgb level, complications, and Injury Severity Score (ISS) were recorded for each patient. Seventy-two patients (69%) were male, 32 (31%) female. Mean age of the study population was 33 years.
Patients were divided into 2 groups by lowest Hgb level before first transfusion—under 7.0 g/dL and 7.0 g/dL or higher—and then by whether they had been transfused. General guidelines for erythrocyte transfusion on the orthopedic trauma service included patients who were symptomatic at rest (headache, dizziness, or shortness of breath) and asymptomatic patients with Hgb levels under 5.0 g/dL. For patients with varying (lesser) degrees of anemia, transfusion typically depended on clinical symptoms and overall decrease in Hgb level from that recorded on admission.
Patient charts were reviewed for complications extending through a 1-year period after initial discharge from the inpatient service. Patients who had not received follow-up treatment through a known outpatient clinic were contacted by telephone to ascertain outcome. Overall, 5 of the 109 patients were lost at 1-year follow-up, leaving 104 patients with 1-year follow-up (95%). Primary outcome of the study was postoperative complications. Superficial wound infection was defined as cellulitis near the surgical site within 1 year, requiring oral antibiotics; deep wound infection was defined as any related infection within 1 year of injury, requiring intravenous antibiotics or surgical débridement in the operating room. The review for complications included superficial infection, deep infection, urinary tract infection, pneumonia, pulmonary embolism, deep venous thrombosis, acute renal failure or insufficiency, nonunion, delayed union, compartment syndrome, osteomyelitis, nerve palsy, anoxic brain injury, cardiac ischemia or infarct, pancreatitis, and death.
Statistical Methods
The primary focus of this analysis was to determine if patients’ risk of complication at 1-year follow-up was affected by anemia—lowest recorded Hgb level before first transfusion for transfused patients, or lowest Hgb level during hospital stay for nontransfused patients—or whether transfusion itself might be a risk factor for complication. Multiple logistic regression models were used to determine the likelihood each group would have a complication. The dependent variable was complication rate; the explanatory variables included whether the patient was transfused, anemia/Hgb level (under 7 g/dL vs 7 g/dL or higher), and the 2-way interaction. Other possible explanatory variables entered into the model were age, sex, ISS, and whether the patient had had multiple surgeries. As the sample size was small, these variables were entered into the regression model one at a time. Results are presented as odds ratios (ORs) with corresponding 95% confidence intervals (CIs) and P values. The analysis was performed with SAS Version 9.1 (SAS Institute, Cary, North Carolina). Tests were considered statistically significant with P < .05 and marginally significant with P < .10. OR above 1 indicated that the odds of a complication occurring were higher in the exposed group (transfused patients) than in the unexposed group (nontransfused patients).
Results
The charts of 104 patients were reviewed and included in this analysis. Sixty-two patients (60%) had received a transfusion; 42 (40%) had not. Before first transfusion, 21 (34%) of the 62 transfused patients had Hgb levels under 7.0 g/dL, and the other 41 (66%) had Hgb levels of 7.0 g/dL or higher. Of the 42 nontransfused patients, 8 (19%) had lowest Hgb levels under 7.0 g/dL, and the other 34 (81%) had Hgb levels of 7.0 g/dL or higher (Table 1).
The transfused patients, considering all levels of anemia, had a mean ISS of 16.1 (range, 1-45), a mean of 2.0 operations (range, 1-6), a mean hospital stay of 18 days (range, 1-73 days), and a mean age of 34 years (range, 18-50 years). The nontransfused patients, considering all levels of anemia, had a mean ISS of 14.1 (range, 4-43), a mean of 1.4 operations (range, 1-5), a mean hospital stay of 10 days (range, 1-42 days), and a mean age of 33 years (range, 18-50 years). In the transfusion group, the mean number of transfused pRBC units was 6.9 (range, 1-31), or 7.8 units for patients with Hgb levels under 7 g/dL and 6.4 units for patients with Hgb levels of 7 g/dL or higher. At 1-year follow-up, complications were observed in 41 (66%) of the 62 transfused patients and in 17 (40%) of the 42 nontransfused patients (Table 1). The different types of complications seen in each group are listed in Table 2.
Statistical Analysis
Patients were divided into 2 groups by Hgb level—under 7.0 g/dL and 7.0 g/dL or higher—and then by whether they received pRBC transfusion. In addition, which patients had a complication over a 1-year period were identified.
For each group, we calculated sample size, number of complications, complication rate, and 95% CI for proportions. For transfused patients with Hgb level of 7.0 g/dL or higher, the complication rate was 71% (29/41). For nontransfused patients with Hgb of 7.0 g/dL or higher, the complication rate was 41% (14/34). Similarly, for transfused patients with Hgb under 7.0 g/dL, the complication rate was 57% (12/21). Last, for nontransfused patients with Hgb under 7.0 g/dL, the complication rate was 38% (3/8) (Table 3).
Transfused patients had a significantly higher risk of complication (OR, 3.1; 95% CI, 1.4-7.1; P < .01). Severity of anemia was not found to be independently associated with increased risk of complication (OR, 0.6; 95% CI, 0.3-1.6; P = .33) (Table 4). The interaction term was removed and eliminated from further analysis, as it was not found to be significant (P = .45).
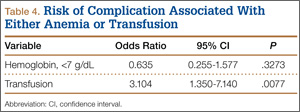
Furthermore, the possibility of confounding variables (eg, age, sex, ISS, number of surgeries performed) was considered by including them in the model one at a time. From these logistic regression models, which included whether patients were transfused and level of anemia, an increased risk of complication (OR, 1.8; 95% CI, 1.1-2.9; P = .02) was found for each additional surgery, while receiving transfusion remained statistically significant (OR, 2.5; 95% CI, 1.0-5.8; P < .04). Age, sex, and ISS were not shown to be significantly associated with an increased complication rate (Ps = .71, .32, and .13, respectively).
We performed a subanalysis of the transfused patients to determine the impact of number of units transfused on complication rate. Each additional unit of pRBCs transfused increased the risk of complication, indicating a dose-dependent response (OR, 1.3; 95% CI, 1.04-1.51; P = .02).
Discussion
Transfusion is a generally accepted and common intervention both in the intensive care unit and in the perioperative period. However, there is little evidence to support routine transfusion of asymptomatic orthopedic trauma patients who are no longer within the initial resuscitative period after trauma. Nevertheless, the practice is routinely done based on expert opinion (level 5 evidence). The anemia protocol for our orthopedic trauma service routinely allowed the Hgb levels of asymptomatic healthy patients to drop to under 7.0 g/dL without transfusion; when other services were consulted or were primary, however, these asymptomatic patients were still routinely transfused based on practitioners’ practice patterns and anecdotal experiences.
In hemodynamically unstable patients, there is no acceptable substitute for blood transfusion. Blood replacement remains essential in the case of acute hemorrhage. However, the complications associated with transfusion should lead us to avoid, or at least minimize, unnecessary transfusion in young asymptomatic patients who are not actively bleeding in the postresuscitative period. In our study, we did not seek causation of increased complications with transfusion but assessed whether the risk of anemia outweighed the risk of transfusion in young, healthy, asymptomatic trauma patients who were no longer in the initial resuscitation period.
Our study was designed to evaluate a conservative transfusion strategy used in orthopedic trauma patients. We hypothesized that the risk of anemia in these asymptomatic patients would be lower than the risk of transfusing asymptomatic patients in the perioperative period. In addition, we thought the level of anemia would play a less significant role in the postoperative complication rate relative to transfusion itself. Our results suggest that a more conservative transfusion strategy of allowing asymptomatic patients to become and remain anemic even to a Hgb level of 5 g/dL may be as safe as a more liberal transfusion strategy of keeping patients at a Hgb level higher than 7 g/dL. In general, the complication rate was 66% for transfused patients and 40% for nontransfused patients. These results remain significant after correcting for possible confounding factors, including age, sex, ISS, and number of surgeries.
The results of this study do not suggest that there may not be complications associated with anemia; a 40% complication rate even in the nontransfused group is high. One might expect that patients who had isolated injuries and never developed anemia with an Hgb level under 9 g/dL might have an even lower complication rate. In the group used for inclusion in this study, however, there was not a significant increased risk for patients who tolerated a lower anemia (Hgb, <7 g/dL), whereas transfusion to keep the Hgb level above 7 g/dL appeared to correlate with a significant risk of complication and appeared to be dose-dependent. It should be noted that the complications in both the transfusion and anemia groups are not necessarily related to transfusion or anemia, as many factors in a retrospective study cannot be controlled. These findings simply suggest that it might be as safe to use a conservative transfusion strategy as a liberal transfusion strategy in this patient population.
Although our study is retrospective, prospective randomized studies in the elderly and in the critical care population have shown conservative transfusion guidelines are at least as safe as liberal transfusion strategies.2,11 One study randomized intensive care unit patients with Hgb levels under 9.0 g/dL to 2 groups, one with liberal and the other with restrictive protocols for pRBC unit transfusion.2 The liberal group maintained Hgb levels between 10.0 and 12.0 g/dL, and the restricted group kept Hgb levels between 7.0 and 9.0 g/dL. Thirty-day mortality was significantly lower in less acutely ill patients and younger patients (<55 years old) in the restrictive group than in the liberal group. It was concluded that a restrictive strategy of RBC transfusion is at least as effective as, and possibly superior to, a liberal transfusion strategy in the critically ill when considering short- and long-term outcomes. Another prospective study randomized elderly patients (N = 2016) with hip fractures and cardiovascular risk factors to a liberal transfusion strategy (if Hgb level fell under 10 g/dL) or a restrictive transfusion strategy (if Hgb level fell under 8 g/dL). The study found no difference between the 2 groups.11
The deleterious effect of allogeneic blood transfusion on the immune system is complex and has been linked to the down-regulation of cellular immunity, including decreased function of natural killer cells, decreased function of macrophages and monocytes, and increased numbers of suppressor T cells.12,13 This minimized immune response has been associated with a multitude of infectious morbidities in various patient populations.7 A meta-analysis of 20 studies reviewing outcomes of the effects of transfusion on postoperative bacterial infection found strong evidence supporting a correlation.5 Their analysis found an OR of 5.3 (range, 5.0-5.4) for infectious complication after allogeneic transfusion in the trauma population, and an OR of 3.5 (range, 1.4-15.2) considering all patient populations.
Similar results showing increased risk of infectious morbidities associated with transfusion were found in other studies involving the critically ill, patients after hip arthroplasty, and cardiothoracic surgery and general trauma populations.1,3,4,14,15 Furthermore, these results were seen in a dose-dependent response leading to increased incidence of complication with each unit of blood transfused.
Our study did not focus only on infection but included other complications (eg, cardiac, renal, and brain ischemia) that might be associated with anemia or transfusion. It is intuitive that anemia can cause ischemic events but less intuitive that allogeneic transfusion can also cause ischemic events because of the poor deformability of the cells due to storage, which can lead to “sludging” in capillaries throughout the body.16 This has been shown to be important in animal models, but it is unclear what poses more risk in humans—anemia without transfusion or the initial insult from transfusion, before the body clears the “waste” from stored cells and the remaining viable cells gain oxygen-carrying capacity.
Our study has several limitations. The number of patients who had severe anemia (Hgb level, <7 g/dL) and were not transfused is relatively small compared with the numbers in the other groups used for comparison. Because our study was retrospective, we could only find associations and not prove causation. This is significant, as the higher complication rate seen with transfusions may only be caused by the transfusion as a predictor of a patient requiring more complex surgery with higher blood loss (and higher risk of complication) or other such risk factors that led to transfusion, but not the transfusion itself causing the complication. An attempt was made to remove this potential bias by controlling for age, sex, ISS, and whether the patient had multiple surgeries. However, there may have been other significant confounding variables not excluded. As complications were assessed by chart review, they may not include those that occurred at other institutions and that were never reported to the practitioners at our facility (though we did have the ability to search records of neighboring institutions electronically when electronic medical records were available). That no functional outcomes were included in this retrospective review might make the complication rate appear more or less sensitive than the patients’ own opinions regarding their outcomes. All these weaknesses could call into question whether the statistically significant higher risk associated with allogeneic transfusion found in this study is real, but the focus and reason for pursuing this study were to determine if permissive anemia was dangerous or would be associated with a higher risk of complications than routine allogeneic transfusion of asymptomatic patients to treat a laboratory value.
Strengths of the study include the review of a single surgeon’s practice with a written protocol in place for anemic orthopedic trauma patients. The 95% follow-up (104/109 patients) is good for this type of trauma population. Although this series is retrospective, it is reasonably large for a subgroup of young, healthy orthopedic trauma patients to study the effects of anemia or transfusion. Whether transfused or not, many of these patients tolerated Hgb levels under 7 g/dL, which gave a large enough comparison group to evaluate the independent effects of transfusion (or of using transfusion as a marker for complication risk) or anemia as a risk factor. As a result, it appears that a more conservative transfusion strategy may be as safe as a more liberal transfusion strategy. The results of this retrospective study were used to design a prospective multidisciplinary pilot study randomizing patients to either a liberal or a conservative transfusion strategy to determine which approach might carry higher risks of complications.
Conclusion
The results of this retrospective study suggest that a conservative transfusion strategy in a young, healthy, euvolemic asymptomatic patient who is not actively bleeding may be as safe as a liberal transfusion strategy and potentially may have fewer complications than does transfusion for a conventional laboratory value. Our study results do not suggest that transfusions should be held in patients who are symptomatic at rest or in patients who are being actively resuscitated, as transfusion can be lifesaving under these circumstances. A prospective randomized study has begun at our institution with enrollment expected to take 2 years with another year needed to complete 1-year follow-up of all patients.
1. Leal-Noval SR, Rincón-Ferrari MD, García-Curiel A, et al. Transfusion of blood components and postoperative infection in patients undergoing cardiac surgery. Chest. 2001;119(5):1461-1468.
2. Hébert PC, Wells G, Blajchman MA, et al. A multicenter, randomized, controlled clinical trial of transfusion requirements in critical care. Transfusion Requirements in Critical Care Investigators, Canadian Critical Care Trials Group. N Engl J Med. 1999;340(6):409-417.
3. Carson JL, Altman DG, Duff A, et al. Risk of bacterial infection associated with allogeneic blood transfusion among patients undergoing hip fracture repair. Transfusion. 1999;39(7):694-700.
4. Edna TH, Bjerkeset T. Association between blood transfusion and infection in injured patients. J Trauma. 1992;33(5):659-661.
5. Hill GE, Frawley WH, Griffith KE, Forestner JE, Minei JP. Allogeneic blood transfusion increases the risk of postoperative bacterial infection: a meta-analysis. J Trauma. 2003;54(5):908-914.
6. Vincent JL, Baron JF, Reinhart K, et al; ABC (Anemia and Blood Transfusion in Critical Care) Investigators. Anemia and blood transfusion in critically ill patients. JAMA. 2002;288(12):1499-1507.
7. Taylor RW, Manganaro L, O’Brien J, Trottier SJ, Parkar N, Veremakis C. Impact of allogenic packed red blood cell transfusion on nosocomial infection rates in the critically ill patient. Crit Care Med. 2002;30(10):2249-2254.
8. Leung JM, Weiskopf RB, Feiner J, et al. Electrocardiographic ST-segment changes during acute, severe isovolemic hemodilution in humans. Anesthesiology. 2000;93(4):1004-1010.
9. Weiskopf RB, Viele MK, Feiner J, et al. Human cardiovascular and metabolic response to acute, severe isovolemic anemia. JAMA. 1998;279(3):217-221.
10. Johnston P, Wynn-Jones H, Chakravarty D, Boyle A, Parker MJ. Is perioperative blood transfusion a risk factor for mortality or infection after hip fracture? J Orthop Trauma. 2006;20(10):675-679.
11. Carson JL, Terrin ML, Noveck H, et al. Liberal or restrictive transfusion in high-risk patients after hip surgery. N Engl J Med. 2011;365(26):2453-2462.
12. Blumberg N. Deleterious clinical effects of transfusion immunomodulation: proven beyond a reasonable doubt. Transfusion. 2005;45(2 suppl):33S-39S.
13. Triulzi DJ, Vanek K, Ryan DH, Blumberg N. A clinical and immunologic study of blood transfusion and postoperative bacterial infection in spinal surgery. Transfusion. 1992;32(6):517-524.
14. Shorr AF, Jackson WL. Transfusion practice and nosocomial infection: assessing the evidence. Curr Opin Crit Care. 2005;11(5):468-472.
15. Engoren MC, Habib RH, Zacharias A, Schwann TA, Riordan CJ, Durham SJ. Effect of blood transfusion on long-term survival after cardiac operation. Ann Thorac Surg. 2002;74(4):1180-1186.
16. Tsai AG, Cabrales P, Intaglietta M. Microvascular perfusion upon exchange transfusion with stored red blood cells in normovolemic anemic conditions. Transfusion. 2004;44(11):1626-1634.
More than 13 million units of blood are transfused each year. Although transfusion can certainly be lifesaving, numerous studies over the past 20 years have shown significant, dose-dependent increases in morbidity, mortality, and cost with each unit of packed red blood cells (pRBCs) transfused.1 Transfusion is one of the most common interventions in the critically ill population; however the negative effects of transfusion-related infection are well documented in the recent literature.1-7 There is no question that transfusion of blood products can be lifesaving to acutely ill trauma patients, but there is little evidence regarding when transfusions are indicated in asymptomatic anemic patients who are no longer in need of acute resuscitation.
Several studies have analyzed healthy individuals with an isovolemic reduction in hemoglobin (Hgb) level to 5.0 g/dL.8,9 They have found no significant compromise in oxygen delivery to the tissues. Currently, there is a lack of clinical data to suggest adequate RBC transfusion endpoints in trauma surgery.10 Given the lack of evidence to support transfusion triggers for young, healthy, asymptomatic orthopedic trauma patients, we decided to investigate whether a more conservative transfusion strategy might be as safe as a more liberal strategy.
Materials and Methods
After obtaining approval from our institutional review board, we performed a retrospective observational cohort analysis of patients treated at a level I trauma center between September 2006 and February 2009. The trauma registry included all patients who underwent surgery performed by a single orthopedic fellowship–trained trauma surgeon. All patients who had a recorded Hgb level of 9.0 g/dL or less at any time during their admission were included; they were considered no longer volume-depleted after initial resuscitation. Exclusion criteria were age under 18 years or over 50 years; pregnancy; head injury; and preexisting heart, pulmonary, or renal disease.
Initially, 963 patients were identified as orthopedic trauma patients treated by Dr. Mullis within the defined period. After inclusion and exclusion criteria were used to limit this database, the charts of the 109 patients who met the above criteria were reviewed. By chart review or telephone follow-up, 104 patients with 1-year follow-up were identified, and their cases became the basis for our analysis. Demographic information, length of hospital stay, surgeries performed, number of pRBC units transfused, Hgb level prompting transfusion, lowest recorded Hgb level, complications, and Injury Severity Score (ISS) were recorded for each patient. Seventy-two patients (69%) were male, 32 (31%) female. Mean age of the study population was 33 years.
Patients were divided into 2 groups by lowest Hgb level before first transfusion—under 7.0 g/dL and 7.0 g/dL or higher—and then by whether they had been transfused. General guidelines for erythrocyte transfusion on the orthopedic trauma service included patients who were symptomatic at rest (headache, dizziness, or shortness of breath) and asymptomatic patients with Hgb levels under 5.0 g/dL. For patients with varying (lesser) degrees of anemia, transfusion typically depended on clinical symptoms and overall decrease in Hgb level from that recorded on admission.
Patient charts were reviewed for complications extending through a 1-year period after initial discharge from the inpatient service. Patients who had not received follow-up treatment through a known outpatient clinic were contacted by telephone to ascertain outcome. Overall, 5 of the 109 patients were lost at 1-year follow-up, leaving 104 patients with 1-year follow-up (95%). Primary outcome of the study was postoperative complications. Superficial wound infection was defined as cellulitis near the surgical site within 1 year, requiring oral antibiotics; deep wound infection was defined as any related infection within 1 year of injury, requiring intravenous antibiotics or surgical débridement in the operating room. The review for complications included superficial infection, deep infection, urinary tract infection, pneumonia, pulmonary embolism, deep venous thrombosis, acute renal failure or insufficiency, nonunion, delayed union, compartment syndrome, osteomyelitis, nerve palsy, anoxic brain injury, cardiac ischemia or infarct, pancreatitis, and death.
Statistical Methods
The primary focus of this analysis was to determine if patients’ risk of complication at 1-year follow-up was affected by anemia—lowest recorded Hgb level before first transfusion for transfused patients, or lowest Hgb level during hospital stay for nontransfused patients—or whether transfusion itself might be a risk factor for complication. Multiple logistic regression models were used to determine the likelihood each group would have a complication. The dependent variable was complication rate; the explanatory variables included whether the patient was transfused, anemia/Hgb level (under 7 g/dL vs 7 g/dL or higher), and the 2-way interaction. Other possible explanatory variables entered into the model were age, sex, ISS, and whether the patient had had multiple surgeries. As the sample size was small, these variables were entered into the regression model one at a time. Results are presented as odds ratios (ORs) with corresponding 95% confidence intervals (CIs) and P values. The analysis was performed with SAS Version 9.1 (SAS Institute, Cary, North Carolina). Tests were considered statistically significant with P < .05 and marginally significant with P < .10. OR above 1 indicated that the odds of a complication occurring were higher in the exposed group (transfused patients) than in the unexposed group (nontransfused patients).
Results
The charts of 104 patients were reviewed and included in this analysis. Sixty-two patients (60%) had received a transfusion; 42 (40%) had not. Before first transfusion, 21 (34%) of the 62 transfused patients had Hgb levels under 7.0 g/dL, and the other 41 (66%) had Hgb levels of 7.0 g/dL or higher. Of the 42 nontransfused patients, 8 (19%) had lowest Hgb levels under 7.0 g/dL, and the other 34 (81%) had Hgb levels of 7.0 g/dL or higher (Table 1).
The transfused patients, considering all levels of anemia, had a mean ISS of 16.1 (range, 1-45), a mean of 2.0 operations (range, 1-6), a mean hospital stay of 18 days (range, 1-73 days), and a mean age of 34 years (range, 18-50 years). The nontransfused patients, considering all levels of anemia, had a mean ISS of 14.1 (range, 4-43), a mean of 1.4 operations (range, 1-5), a mean hospital stay of 10 days (range, 1-42 days), and a mean age of 33 years (range, 18-50 years). In the transfusion group, the mean number of transfused pRBC units was 6.9 (range, 1-31), or 7.8 units for patients with Hgb levels under 7 g/dL and 6.4 units for patients with Hgb levels of 7 g/dL or higher. At 1-year follow-up, complications were observed in 41 (66%) of the 62 transfused patients and in 17 (40%) of the 42 nontransfused patients (Table 1). The different types of complications seen in each group are listed in Table 2.
Statistical Analysis
Patients were divided into 2 groups by Hgb level—under 7.0 g/dL and 7.0 g/dL or higher—and then by whether they received pRBC transfusion. In addition, which patients had a complication over a 1-year period were identified.
For each group, we calculated sample size, number of complications, complication rate, and 95% CI for proportions. For transfused patients with Hgb level of 7.0 g/dL or higher, the complication rate was 71% (29/41). For nontransfused patients with Hgb of 7.0 g/dL or higher, the complication rate was 41% (14/34). Similarly, for transfused patients with Hgb under 7.0 g/dL, the complication rate was 57% (12/21). Last, for nontransfused patients with Hgb under 7.0 g/dL, the complication rate was 38% (3/8) (Table 3).
Transfused patients had a significantly higher risk of complication (OR, 3.1; 95% CI, 1.4-7.1; P < .01). Severity of anemia was not found to be independently associated with increased risk of complication (OR, 0.6; 95% CI, 0.3-1.6; P = .33) (Table 4). The interaction term was removed and eliminated from further analysis, as it was not found to be significant (P = .45).
Furthermore, the possibility of confounding variables (eg, age, sex, ISS, number of surgeries performed) was considered by including them in the model one at a time. From these logistic regression models, which included whether patients were transfused and level of anemia, an increased risk of complication (OR, 1.8; 95% CI, 1.1-2.9; P = .02) was found for each additional surgery, while receiving transfusion remained statistically significant (OR, 2.5; 95% CI, 1.0-5.8; P < .04). Age, sex, and ISS were not shown to be significantly associated with an increased complication rate (Ps = .71, .32, and .13, respectively).
We performed a subanalysis of the transfused patients to determine the impact of number of units transfused on complication rate. Each additional unit of pRBCs transfused increased the risk of complication, indicating a dose-dependent response (OR, 1.3; 95% CI, 1.04-1.51; P = .02).
Discussion
Transfusion is a generally accepted and common intervention both in the intensive care unit and in the perioperative period. However, there is little evidence to support routine transfusion of asymptomatic orthopedic trauma patients who are no longer within the initial resuscitative period after trauma. Nevertheless, the practice is routinely done based on expert opinion (level 5 evidence). The anemia protocol for our orthopedic trauma service routinely allowed the Hgb levels of asymptomatic healthy patients to drop to under 7.0 g/dL without transfusion; when other services were consulted or were primary, however, these asymptomatic patients were still routinely transfused based on practitioners’ practice patterns and anecdotal experiences.
In hemodynamically unstable patients, there is no acceptable substitute for blood transfusion. Blood replacement remains essential in the case of acute hemorrhage. However, the complications associated with transfusion should lead us to avoid, or at least minimize, unnecessary transfusion in young asymptomatic patients who are not actively bleeding in the postresuscitative period. In our study, we did not seek causation of increased complications with transfusion but assessed whether the risk of anemia outweighed the risk of transfusion in young, healthy, asymptomatic trauma patients who were no longer in the initial resuscitation period.
Our study was designed to evaluate a conservative transfusion strategy used in orthopedic trauma patients. We hypothesized that the risk of anemia in these asymptomatic patients would be lower than the risk of transfusing asymptomatic patients in the perioperative period. In addition, we thought the level of anemia would play a less significant role in the postoperative complication rate relative to transfusion itself. Our results suggest that a more conservative transfusion strategy of allowing asymptomatic patients to become and remain anemic even to a Hgb level of 5 g/dL may be as safe as a more liberal transfusion strategy of keeping patients at a Hgb level higher than 7 g/dL. In general, the complication rate was 66% for transfused patients and 40% for nontransfused patients. These results remain significant after correcting for possible confounding factors, including age, sex, ISS, and number of surgeries.
The results of this study do not suggest that there may not be complications associated with anemia; a 40% complication rate even in the nontransfused group is high. One might expect that patients who had isolated injuries and never developed anemia with an Hgb level under 9 g/dL might have an even lower complication rate. In the group used for inclusion in this study, however, there was not a significant increased risk for patients who tolerated a lower anemia (Hgb, <7 g/dL), whereas transfusion to keep the Hgb level above 7 g/dL appeared to correlate with a significant risk of complication and appeared to be dose-dependent. It should be noted that the complications in both the transfusion and anemia groups are not necessarily related to transfusion or anemia, as many factors in a retrospective study cannot be controlled. These findings simply suggest that it might be as safe to use a conservative transfusion strategy as a liberal transfusion strategy in this patient population.
Although our study is retrospective, prospective randomized studies in the elderly and in the critical care population have shown conservative transfusion guidelines are at least as safe as liberal transfusion strategies.2,11 One study randomized intensive care unit patients with Hgb levels under 9.0 g/dL to 2 groups, one with liberal and the other with restrictive protocols for pRBC unit transfusion.2 The liberal group maintained Hgb levels between 10.0 and 12.0 g/dL, and the restricted group kept Hgb levels between 7.0 and 9.0 g/dL. Thirty-day mortality was significantly lower in less acutely ill patients and younger patients (<55 years old) in the restrictive group than in the liberal group. It was concluded that a restrictive strategy of RBC transfusion is at least as effective as, and possibly superior to, a liberal transfusion strategy in the critically ill when considering short- and long-term outcomes. Another prospective study randomized elderly patients (N = 2016) with hip fractures and cardiovascular risk factors to a liberal transfusion strategy (if Hgb level fell under 10 g/dL) or a restrictive transfusion strategy (if Hgb level fell under 8 g/dL). The study found no difference between the 2 groups.11
The deleterious effect of allogeneic blood transfusion on the immune system is complex and has been linked to the down-regulation of cellular immunity, including decreased function of natural killer cells, decreased function of macrophages and monocytes, and increased numbers of suppressor T cells.12,13 This minimized immune response has been associated with a multitude of infectious morbidities in various patient populations.7 A meta-analysis of 20 studies reviewing outcomes of the effects of transfusion on postoperative bacterial infection found strong evidence supporting a correlation.5 Their analysis found an OR of 5.3 (range, 5.0-5.4) for infectious complication after allogeneic transfusion in the trauma population, and an OR of 3.5 (range, 1.4-15.2) considering all patient populations.
Similar results showing increased risk of infectious morbidities associated with transfusion were found in other studies involving the critically ill, patients after hip arthroplasty, and cardiothoracic surgery and general trauma populations.1,3,4,14,15 Furthermore, these results were seen in a dose-dependent response leading to increased incidence of complication with each unit of blood transfused.
Our study did not focus only on infection but included other complications (eg, cardiac, renal, and brain ischemia) that might be associated with anemia or transfusion. It is intuitive that anemia can cause ischemic events but less intuitive that allogeneic transfusion can also cause ischemic events because of the poor deformability of the cells due to storage, which can lead to “sludging” in capillaries throughout the body.16 This has been shown to be important in animal models, but it is unclear what poses more risk in humans—anemia without transfusion or the initial insult from transfusion, before the body clears the “waste” from stored cells and the remaining viable cells gain oxygen-carrying capacity.
Our study has several limitations. The number of patients who had severe anemia (Hgb level, <7 g/dL) and were not transfused is relatively small compared with the numbers in the other groups used for comparison. Because our study was retrospective, we could only find associations and not prove causation. This is significant, as the higher complication rate seen with transfusions may only be caused by the transfusion as a predictor of a patient requiring more complex surgery with higher blood loss (and higher risk of complication) or other such risk factors that led to transfusion, but not the transfusion itself causing the complication. An attempt was made to remove this potential bias by controlling for age, sex, ISS, and whether the patient had multiple surgeries. However, there may have been other significant confounding variables not excluded. As complications were assessed by chart review, they may not include those that occurred at other institutions and that were never reported to the practitioners at our facility (though we did have the ability to search records of neighboring institutions electronically when electronic medical records were available). That no functional outcomes were included in this retrospective review might make the complication rate appear more or less sensitive than the patients’ own opinions regarding their outcomes. All these weaknesses could call into question whether the statistically significant higher risk associated with allogeneic transfusion found in this study is real, but the focus and reason for pursuing this study were to determine if permissive anemia was dangerous or would be associated with a higher risk of complications than routine allogeneic transfusion of asymptomatic patients to treat a laboratory value.
Strengths of the study include the review of a single surgeon’s practice with a written protocol in place for anemic orthopedic trauma patients. The 95% follow-up (104/109 patients) is good for this type of trauma population. Although this series is retrospective, it is reasonably large for a subgroup of young, healthy orthopedic trauma patients to study the effects of anemia or transfusion. Whether transfused or not, many of these patients tolerated Hgb levels under 7 g/dL, which gave a large enough comparison group to evaluate the independent effects of transfusion (or of using transfusion as a marker for complication risk) or anemia as a risk factor. As a result, it appears that a more conservative transfusion strategy may be as safe as a more liberal transfusion strategy. The results of this retrospective study were used to design a prospective multidisciplinary pilot study randomizing patients to either a liberal or a conservative transfusion strategy to determine which approach might carry higher risks of complications.
Conclusion
The results of this retrospective study suggest that a conservative transfusion strategy in a young, healthy, euvolemic asymptomatic patient who is not actively bleeding may be as safe as a liberal transfusion strategy and potentially may have fewer complications than does transfusion for a conventional laboratory value. Our study results do not suggest that transfusions should be held in patients who are symptomatic at rest or in patients who are being actively resuscitated, as transfusion can be lifesaving under these circumstances. A prospective randomized study has begun at our institution with enrollment expected to take 2 years with another year needed to complete 1-year follow-up of all patients.
1. Leal-Noval SR, Rincón-Ferrari MD, García-Curiel A, et al. Transfusion of blood components and postoperative infection in patients undergoing cardiac surgery. Chest. 2001;119(5):1461-1468.
2. Hébert PC, Wells G, Blajchman MA, et al. A multicenter, randomized, controlled clinical trial of transfusion requirements in critical care. Transfusion Requirements in Critical Care Investigators, Canadian Critical Care Trials Group. N Engl J Med. 1999;340(6):409-417.
3. Carson JL, Altman DG, Duff A, et al. Risk of bacterial infection associated with allogeneic blood transfusion among patients undergoing hip fracture repair. Transfusion. 1999;39(7):694-700.
4. Edna TH, Bjerkeset T. Association between blood transfusion and infection in injured patients. J Trauma. 1992;33(5):659-661.
5. Hill GE, Frawley WH, Griffith KE, Forestner JE, Minei JP. Allogeneic blood transfusion increases the risk of postoperative bacterial infection: a meta-analysis. J Trauma. 2003;54(5):908-914.
6. Vincent JL, Baron JF, Reinhart K, et al; ABC (Anemia and Blood Transfusion in Critical Care) Investigators. Anemia and blood transfusion in critically ill patients. JAMA. 2002;288(12):1499-1507.
7. Taylor RW, Manganaro L, O’Brien J, Trottier SJ, Parkar N, Veremakis C. Impact of allogenic packed red blood cell transfusion on nosocomial infection rates in the critically ill patient. Crit Care Med. 2002;30(10):2249-2254.
8. Leung JM, Weiskopf RB, Feiner J, et al. Electrocardiographic ST-segment changes during acute, severe isovolemic hemodilution in humans. Anesthesiology. 2000;93(4):1004-1010.
9. Weiskopf RB, Viele MK, Feiner J, et al. Human cardiovascular and metabolic response to acute, severe isovolemic anemia. JAMA. 1998;279(3):217-221.
10. Johnston P, Wynn-Jones H, Chakravarty D, Boyle A, Parker MJ. Is perioperative blood transfusion a risk factor for mortality or infection after hip fracture? J Orthop Trauma. 2006;20(10):675-679.
11. Carson JL, Terrin ML, Noveck H, et al. Liberal or restrictive transfusion in high-risk patients after hip surgery. N Engl J Med. 2011;365(26):2453-2462.
12. Blumberg N. Deleterious clinical effects of transfusion immunomodulation: proven beyond a reasonable doubt. Transfusion. 2005;45(2 suppl):33S-39S.
13. Triulzi DJ, Vanek K, Ryan DH, Blumberg N. A clinical and immunologic study of blood transfusion and postoperative bacterial infection in spinal surgery. Transfusion. 1992;32(6):517-524.
14. Shorr AF, Jackson WL. Transfusion practice and nosocomial infection: assessing the evidence. Curr Opin Crit Care. 2005;11(5):468-472.
15. Engoren MC, Habib RH, Zacharias A, Schwann TA, Riordan CJ, Durham SJ. Effect of blood transfusion on long-term survival after cardiac operation. Ann Thorac Surg. 2002;74(4):1180-1186.
16. Tsai AG, Cabrales P, Intaglietta M. Microvascular perfusion upon exchange transfusion with stored red blood cells in normovolemic anemic conditions. Transfusion. 2004;44(11):1626-1634.
Effect of Hospitalist Discontinuity on AE
Although definitions vary, continuity of care can be thought of as the patient's experience of a continuous caring relationship with an identified healthcare professional.[1] Research in ambulatory settings has found that patients who see their primary care physician for a higher proportion of office visits have higher patient satisfaction, better hypertensive control, lower risk of hospitalization, and fewer emergency department visits.[2, 3, 4, 5] Continuity with a single hospital‐based physician is difficult to achieve because of the need to provide care 24 hours a day, 7 days a week. Key clinical information may be lost during physician‐to‐physician handoffs (eg, at admission, at the end of rotations on service) during hospitalization. Our research group recently found that lower hospital physician continuity was associated with modestly increased hospital costs, but also a trend toward lower readmissions.[6] We speculated that physicians newly taking over patient care from colleagues reassess diagnoses and treatment plans. This reassessment may identify errors missed by the previous hospital physician. Thus, discontinuity may theoretically help or hinder the provision of safe hospital care.
We sought to examine the relationship between hospital physician continuity and the incidence of adverse events (AEs). We combined data from 2 previously published studies by our research group; one investigated the relationship between hospital physician continuity and costs and 30‐day readmissions, the other assessed the impact of unit‐based interventions on AEs.[6, 7]
METHODS
Setting and Study Design
This retrospective, observational study was conducted at Northwestern Memorial Hospital, an 876‐bed tertiary care teaching hospital in Chicago, Illinois, and was approved by the institutional review board of Northwestern University. Subjects included patients admitted to an adult nonteaching hospitalist service between March 1, 2009 and December 31, 2011. Hospitalists on this service worked without resident physicians in rotations usually lasting 7 consecutive days beginning on Mondays and ending on Sundays. Hospitalists were allowed to switch portions of their schedule with one another, creating the possibility that certain rotations may have been slightly shorter or longer than 7 days. Hospitalists gave verbal sign‐out via telephone to the hospitalist taking over their service on the afternoon of the last day of their rotation. These handoffs customarily involved both hospitalists viewing the electronic health record during the discussion but were not standardized. Night hospitalists performed admissions and cross‐coverage each night from 7 pm to 7 am. Night hospitalists printed history and physicals for day hospitalists, but typically did not give verbal sign‐out on new admissions.
Acquisition of Study Population Data
We identified all patients admitted to the nonteaching hospitalist service using the Northwestern Medicine Enterprise Data Warehouse (EDW), an integrated repository of all clinical and research data sources on the campus. We excluded patients admitted under observation status, those initially admitted to other services (eg, intensive care, general surgery), those discharged from other services, and those cared for by advanced practice providers (ie, nurse practitioners and physician assistants).
Predictor Variables
We identified physicians completing the primary service history and physicals (H&P) and progress notes throughout patients' hospitalizations to calculate 2 measures of continuity: the Number of Physicians Index (NPI), and the Usual Provider of Continuity (UPC) Index.[8, 9] The NPI represented the total number of unique hospitalists completing H&Ps and/or progress notes for a patient. The UPC was calculated as the largest number of notes signed by a single hospitalist divided by the total number of hospitalist notes for a patient. For example, if Dr. John Smith wrote notes on the first 4 days of a patient's hospital stay, and Dr. Mary Jones wrote notes on the following 2 days (total stay=6 days), the NPI would be 2 and the UPC would be 0.67. Therefore, higher NPI and lower UPC designate lower continuity. Significant events occurring during the nighttime were documented in separate notes titled cross‐cover notes. These cross‐cover notes were not included in the calculation of NPI or UPC. In the rare event that 2 or more progress notes were written on the same day, we selected the one used for billing to calculate UPC and NPI.
Outcome Variables
We used AE data from a study we conducted to assess the impact of unit‐based interventions to improve teamwork and patient safety, the methods of which have been previously described.[7] Briefly, we used a 2‐stage medical record review similar to that performed in prior studies.[10, 11, 12, 13] In the first stage, we identified potential AEs using automated queries of the Northwestern Medicine EDW. These queries were based on screening criteria used in the Harvard Medical Practice Study and the Institute for Healthcare Improvement (IHI) Global Trigger Tool.[12, 13] Examples of queries included abnormal laboratory values (eg, international normalized ratio [INR] >6 after hospital day 2 and excluding patients with INR >4 on day 1), administration of rescue medications (eg, naloxone), certain types of incident reports (eg, pressure ulcer), International Classification of Diseases, Ninth Revision (ICD‐9) codes indicating hospital‐acquired conditions (eg, venous thromboembolism), and text searches of progress notes and discharge summaries using natural language processing.[14] Prior research by our group confirmed these automated screens identify a similar number of AEs as manual medical record screening.[14] For each patient with 1 or more potential AE, a research nurse performed a medical record abstraction and created a description of each potential AE.
In the second stage, 2 physician researchers independently reviewed each potential AE in a blinded fashion to determine whether or not an AE was present. An AE was defined as injury due to medical management rather than the natural history of the illness,[15] and included injuries that prolonged the hospital stay or produced disability as well as those resulting in transient disability or abnormal lab values.[16] After independent review, physician reviewers discussed discrepancies in their ratings to achieve consensus.
We tested the reliability of medical record abstractions in our prior study by conducting duplicate abstractions and consensus ratings for a randomly selected sample of 294 patients.[7] The inter‐rater reliability was good for determining the presence of AEs (=0.63).
Statistical Analyses
We calculated descriptive statistics for patient characteristics. Primary discharge diagnosis ICD‐9 codes were categorized using the Healthcare Cost and Utilization Project Clinical Classification Software.[17] We created multivariable logistic regression models with the independent variable being the measure of continuity (NPI or UPC) and the dependent variable being experiencing 1 or more AEs. Covariates included patient age, sex, race, payer, night admission, weekend admission, intensive care unit stay, Medicare Severity Diagnosis Related Group (MS‐DRG) weight, and total number of Elixhauser comorbidities.[18] The length of stay (LOS) was also included as a covariate, as longer LOS increases the probability of discontinuity and may increase the risk for AEs. Because MS‐DRG weight and LOS were highly correlated, we created several models; the first including both as continuous variables, the second including both categorized into quartiles, and a third excluding MS‐DRG weight and including LOS as a continuous variable. Our prior study assessing the impact of unit‐based interventions did not show a statistically significant difference in the pre‐ versus postintervention period, thus we did not include study period as a covariate.
RESULTS
Patient Characteristics
Our analyses included data from 474 hospitalizations. Patient characteristics are shown in Table 1. Patients were a mean 51.118.8 years of age, hospitalized for a mean 3.43.1 days, included 241 (50.8%) women, and 233 (49.2%) persons of nonwhite race. The mean and standard deviation of NPI and UPC were 2.51.0 and 0.60.2. Overall, 47 patients (9.9%) experienced 55 total AEs. AEs included 31 adverse drug events, 6 falls, 5 procedural injuries, 4 manifestations of poor glycemic control, 3 hospital‐acquired infections, 2 episodes of acute renal failure, 1 episode of delirium, 1 pressure ulcer, and 2 categorized as other.
| Characteristic | Value |
|---|---|
| |
| Mean age (SD), y | 55.1 (18.8) |
| Mean length of stay (SD), d | 3.4 (3.1) |
| Women, n (%) | 241 (50.8) |
| Nonwhite race, n (%) | 233 (49.2) |
| Payer, n (%) | |
| Private | 180 (38) |
| Medicare | 165 (34.8) |
| Medicaid | 47 (9.9) |
| Self‐pay/other | 82 (17.3) |
| Night admission, n (%) | 245 (51.7) |
| Weekend admission, n (%) | 135 (28.5) |
| Intensive care unit stay, n (%) | 18 (3.8) |
| Diagnosis, n (%) | |
| Diseases of the circulatory system | 95 (20.0) |
| Diseases of the digestive system | 65 (13.7) |
| Diseases of the respiratory system | 49 (10.3) |
| Injury and poisoning | 41 (8.7) |
| Diseases of the skin and soft tissue | 31 (6.5) |
| Symptoms, signs, and ill‐defined conditions and factors influencing health status | 28 (5.9) |
| Endocrine, nutritional, and metabolic diseases and immunity disorders | 25 (5.3) |
| Diseases of the genitourinary system | 24 (5.1) |
| Diseases of the musculoskeletal system and connective tissue | 23 (4.9) |
| Diseases of the nervous system | 23 (4.9) |
| Other | 70 (14.8) |
| Mean no. of Elixhauser comorbidities (SD) | 2.3 (1.7) |
| Mean MS‐DRG weight (SD) | 1.0 (1.0) |
| Mean NPI (SD) | 2.5 (1.0) |
| Mean UPC (SD) | 0.6 (0.2) |
Association Between Continuity and Adverse Events
In unadjusted models, each 1‐unit increase in the NPI (ie, less continuity) was significantly associated with the incidence of 1 or more AEs (odds ratio [OR]=1.75; P<0.001). However, UPC was not associated with incidence of AEs (OR=1.03; P=0.68) (Table 2). Across all adjusted models, neither NPI nor UPC was significantly associated with the incidence of AEs. The direction of the effect of discontinuity on AEs was inconsistent across models. Though all 3 adjusted models using NPI as the independent variable showed a trend toward increased odds of experiencing 1 or more AE with discontinuity, 2 of the 3 models using UPC showed trends in the opposite direction.
| NPI OR (95% CI)* | P Value | UPC OR (95% CI)* | P Value | ||
|---|---|---|---|---|---|
| |||||
| Unadjusted model | 1.75 (1.332.29) | <0.0001 | 1.03 (0.89‐1.21) | 0.68 | |
| Adjusted models | |||||
| Model 1 | MS‐DRG and LOS continuous | 1.16 (0.781.72) | 0.47 | 0.96 (0.791.14) | 0.60 |
| Model 2 | MS‐DRG and LOS in quartiles | 1.38 (0.981.94) | 0.07 | 1.05 (0.881.26) | 0.59 |
| Model 3 | MS‐DRG dropped, LOS continuous | 1.14 (0.771.70) | 0.51 | 0.95 (0.791.14) | 0.56 |
DISCUSSION
We found that hospitalist physician continuity was not associated with the incidence of AEs. Our findings are somewhat surprising because of the high value placed on continuity of care and patient safety concerns related to handoffs. Key clinical information may be lost when patient care is transitioned to a new hospitalist shortly after admission (eg, from a night hospitalist) or at the end of a rotation. Thus, it is logical to assume that discontinuity inherently increases the risk for harm. On the other hand, a physician newly taking over patient care from another may not be anchored to the initial diagnosis and treatment plan established by the first. This second look could potentially prevent missed/delayed diagnoses and optimize the plan of care.[19] These countervailing forces may explain our findings.
Several other potential explanations for our findings should be considered. First, the quality of handoffs may have been sufficient to overcome the potential for information loss. We feel this is unlikely given that little attention had been dedicated to improving the quality of patient handoffs among hospitalists in our institution. Notably, though a number of studies have evaluated resident physician handoffs, most of the work has focused on night coverage, and little is known about the quality of attending handoffs.[20] Second, access to a fully integrated electronic health record may have assisted hospitalists in complementing information received during handoffs. For example, a hospitalist about to start his or her rotation may have remotely accessed and reviewed patient medical records prior to receiving the phone handoff from the outgoing hospitalist. Third, other efforts to improve patient safety may have reduced the overall risk and provided some resilience in the system. Unit‐based interventions, including structured interdisciplinary rounds and nurse‐physician coleadership, improved teamwork climate and reduced AEs in the study hospital over time.[7]
Another factor to consider relates to the fact that hospital care is provided by teams of clinicians (eg, nurses, specialist physicians, therapists, social workers). Hospital teams are often large and have dynamic team membership. Similar to hospitalists, nurses, physician specialists, and other team members handoff care throughout the course of a patient's hospital stay. Yet, discontinuity for each professional type may occur at different times and frequencies. For example, a patient may be handed off from one hospitalist to another, yet the care continues with the same cardiologist or nurse. Future research should better characterize hospital team complexity (eg, size, relationships among members) and dynamics (eg, continuity for various professional types) and the impact of these factors on patient outcomes.
Our findings are important because hospitalist physician discontinuity is common during hospital stays. Hospital medicine groups vary in their staffing and scheduling models. Policies related to admission distribution and rotation length (consecutive days worked) systematically impact physician continuity. Few studies have evaluated the effect on continuity on hospitalized patient outcomes, and no prior research, to our knowledge, has explored the association of continuity on measures of patient safety.[6, 21, 22] Though our study might suggest that staffing models have little impact on patient safety, as previously mentioned, other team factors may influence patient outcomes.
Our study has several limitations. First, we assessed the impact of continuity on AEs in a single site. Although the 7 days on/7 days off model is the most common scheduling pattern used by adult hospital medicine groups,[23] staffing models and patient safety practices vary across hospitals, potentially limiting the generalizability of our study. Second, continuity can be defined and measured in a variety of ways. We used 2 different measures of physician continuity. As previously mentioned, assessing continuity of other clinicians may allow for a more complete understanding of the potential problems related to fragmentation of care. Third, this study excluded patients who experienced care transitions from other hospitals or other units within the hospital. Patients transferred from other hospitals are often complex, severely ill, and may be at higher risk for loss of key clinical information. Fourth, we used automated screens of an EDW to identify potential AEs. Although our prior research found that this method identified a similar number of AEs as manual medical record review screening, there was poor agreement between the 2 methods. Unfortunately, there is no gold standard to identify AEs. The EDW‐facilitated method allowed us to feasibly screen a larger number of charts, increasing statistical power, and minimized any potential bias that might occur during a manual review to identify potential AEs. Finally, we used data available from 2 prior studies and may have been underpowered to detect a significant association between continuity and AEs due to the relatively low percentage of patients experiencing an AE. In a post hoc power calculation, we estimated that we had 70% power to detect a 33% change in the proportion of patients with 1 or more AE for each 1‐unit increase in NPI, and 80% power to detect a 20% change for each 0.1‐unit decrease in UPC.
CONCLUSION
In conclusion, we found that hospitalist physician continuity was not associated with the incidence of AEs. We speculate that hospitalist continuity is only 1 of many team factors that may influence patient safety, and that prior efforts within our institution may have reduced our ability to detect an association. Future research should better characterize hospital team complexity and dynamics and the impact of these factors on patient outcomes.
Disclosures
This project was supported by a grant from the Agency for Healthcare Research and Quality and an Excellence in Academic Medicine Award, administered by Northwestern Memorial Hospital. The authors report no conflicts of interest.
- , , . What is “continuity of care”? J Health Serv Res Policy. 2006;11:248–250.
- , . Interpersonal continuity of care and care outcomes: a critical review. Ann Fam Med. 2005;3:159–166.
- , , , . The association between continuity of care and outcomes: a systematic and critical review. J Eval Clin Pract. 2010;16:947–956.
- , . Interpersonal continuity of care and patient satisfaction: a critical review. Ann Fam Med. 2004;2:445–451.
- , , , . Continuity of care in a family practice residency program. Impact on physician satisfaction. J Fam Pract. 1990;31:69–73.
- , , , et al. The impact of hospitalist discontinuity on hospital cost, readmissions, and patient satisfaction. J Gen Intern Med. 2014;29:1004–1008.
- , , , et al. Implementation of unit‐based interventions to improve teamwork and patient safety on a medical service [published online ahead of print June 11, 2014]. Am J Med Qual. doi: 10.1177/1062860614538093.
- . Measuring provider continuity in ambulatory care: an assessment of alternative approaches. Med Care. 1979;17:551–565.
- . Defining and measuring interpersonal continuity of care. Ann Fam Med. 2003;1:134–143.
- U.S. Department of Health and Human Services. Agency for Healthcare Research and Quality. Adverse events in hospitals: national incidence among medical beneficiaries. Available at: http://psnet.ahrq.gov/resource.aspx?resourceID=19811. Published November 2010. Accessed on December 15, 2014.
- , , , et al. “Global trigger tool” shows that adverse events in hospitals may be ten times greater than previously measured. Health Aff (Millwood). 2011;30:581–589.
- , , , et al. A study of medical injury and medical malpractice. N Engl J Med. 1989;321:480–484.
- , , , et al. Incidence and types of adverse events and negligent care in Utah and Colorado. Med Care. 2000;38:261–271.
- , , , et al. Comparison of traditional trigger tool to data warehouse based screening for identifying hospital adverse events. BMJ Qual Saf. 2013;22:130–138.
- , , , et al. Incidence of adverse events and negligence in hospitalized patients. Results of the Harvard Medical Practice Study I. N Engl J Med. 1991;324:370–376.
- , , . Safety of patients isolated for infection control. JAMA. 2003;290:1899–1905.
- HCUP Clinical Classification Software. Agency for Healthcare Research and Quality, Rockville, MD. http://www.hcup-us.ahrq.gov/toolssoftware/ccs/ccs.jsp. Accessed on December 15, 2014.
- , , , . Comorbidity measures for use with administrative data. Med Care. 1998;36:8–27.
- . Does continuity of care matter? No: discontinuity can improve patient care. West J Med. 2001;175:5.
- , , , , , . Hospitalist handoffs: a systematic review and task force recommendations. J Hosp Med. 2009;4:433–440.
- , , , , . The impact of fragmentation of hospitalist care on length of stay. J Hosp Med. 2010;5:335–338.
- , , . The Creating Incentives and Continuity Leading to Efficiency staffing model: a quality improvement initiative in hospital medicine. Mayo Clin Proc. 2012;87:364–371.
- Society of Hospital Medicine. 2014 state of hospital medicine report. Philadelphia, PA: Society of Hospital Medicine; 2014.
Although definitions vary, continuity of care can be thought of as the patient's experience of a continuous caring relationship with an identified healthcare professional.[1] Research in ambulatory settings has found that patients who see their primary care physician for a higher proportion of office visits have higher patient satisfaction, better hypertensive control, lower risk of hospitalization, and fewer emergency department visits.[2, 3, 4, 5] Continuity with a single hospital‐based physician is difficult to achieve because of the need to provide care 24 hours a day, 7 days a week. Key clinical information may be lost during physician‐to‐physician handoffs (eg, at admission, at the end of rotations on service) during hospitalization. Our research group recently found that lower hospital physician continuity was associated with modestly increased hospital costs, but also a trend toward lower readmissions.[6] We speculated that physicians newly taking over patient care from colleagues reassess diagnoses and treatment plans. This reassessment may identify errors missed by the previous hospital physician. Thus, discontinuity may theoretically help or hinder the provision of safe hospital care.
We sought to examine the relationship between hospital physician continuity and the incidence of adverse events (AEs). We combined data from 2 previously published studies by our research group; one investigated the relationship between hospital physician continuity and costs and 30‐day readmissions, the other assessed the impact of unit‐based interventions on AEs.[6, 7]
METHODS
Setting and Study Design
This retrospective, observational study was conducted at Northwestern Memorial Hospital, an 876‐bed tertiary care teaching hospital in Chicago, Illinois, and was approved by the institutional review board of Northwestern University. Subjects included patients admitted to an adult nonteaching hospitalist service between March 1, 2009 and December 31, 2011. Hospitalists on this service worked without resident physicians in rotations usually lasting 7 consecutive days beginning on Mondays and ending on Sundays. Hospitalists were allowed to switch portions of their schedule with one another, creating the possibility that certain rotations may have been slightly shorter or longer than 7 days. Hospitalists gave verbal sign‐out via telephone to the hospitalist taking over their service on the afternoon of the last day of their rotation. These handoffs customarily involved both hospitalists viewing the electronic health record during the discussion but were not standardized. Night hospitalists performed admissions and cross‐coverage each night from 7 pm to 7 am. Night hospitalists printed history and physicals for day hospitalists, but typically did not give verbal sign‐out on new admissions.
Acquisition of Study Population Data
We identified all patients admitted to the nonteaching hospitalist service using the Northwestern Medicine Enterprise Data Warehouse (EDW), an integrated repository of all clinical and research data sources on the campus. We excluded patients admitted under observation status, those initially admitted to other services (eg, intensive care, general surgery), those discharged from other services, and those cared for by advanced practice providers (ie, nurse practitioners and physician assistants).
Predictor Variables
We identified physicians completing the primary service history and physicals (H&P) and progress notes throughout patients' hospitalizations to calculate 2 measures of continuity: the Number of Physicians Index (NPI), and the Usual Provider of Continuity (UPC) Index.[8, 9] The NPI represented the total number of unique hospitalists completing H&Ps and/or progress notes for a patient. The UPC was calculated as the largest number of notes signed by a single hospitalist divided by the total number of hospitalist notes for a patient. For example, if Dr. John Smith wrote notes on the first 4 days of a patient's hospital stay, and Dr. Mary Jones wrote notes on the following 2 days (total stay=6 days), the NPI would be 2 and the UPC would be 0.67. Therefore, higher NPI and lower UPC designate lower continuity. Significant events occurring during the nighttime were documented in separate notes titled cross‐cover notes. These cross‐cover notes were not included in the calculation of NPI or UPC. In the rare event that 2 or more progress notes were written on the same day, we selected the one used for billing to calculate UPC and NPI.
Outcome Variables
We used AE data from a study we conducted to assess the impact of unit‐based interventions to improve teamwork and patient safety, the methods of which have been previously described.[7] Briefly, we used a 2‐stage medical record review similar to that performed in prior studies.[10, 11, 12, 13] In the first stage, we identified potential AEs using automated queries of the Northwestern Medicine EDW. These queries were based on screening criteria used in the Harvard Medical Practice Study and the Institute for Healthcare Improvement (IHI) Global Trigger Tool.[12, 13] Examples of queries included abnormal laboratory values (eg, international normalized ratio [INR] >6 after hospital day 2 and excluding patients with INR >4 on day 1), administration of rescue medications (eg, naloxone), certain types of incident reports (eg, pressure ulcer), International Classification of Diseases, Ninth Revision (ICD‐9) codes indicating hospital‐acquired conditions (eg, venous thromboembolism), and text searches of progress notes and discharge summaries using natural language processing.[14] Prior research by our group confirmed these automated screens identify a similar number of AEs as manual medical record screening.[14] For each patient with 1 or more potential AE, a research nurse performed a medical record abstraction and created a description of each potential AE.
In the second stage, 2 physician researchers independently reviewed each potential AE in a blinded fashion to determine whether or not an AE was present. An AE was defined as injury due to medical management rather than the natural history of the illness,[15] and included injuries that prolonged the hospital stay or produced disability as well as those resulting in transient disability or abnormal lab values.[16] After independent review, physician reviewers discussed discrepancies in their ratings to achieve consensus.
We tested the reliability of medical record abstractions in our prior study by conducting duplicate abstractions and consensus ratings for a randomly selected sample of 294 patients.[7] The inter‐rater reliability was good for determining the presence of AEs (=0.63).
Statistical Analyses
We calculated descriptive statistics for patient characteristics. Primary discharge diagnosis ICD‐9 codes were categorized using the Healthcare Cost and Utilization Project Clinical Classification Software.[17] We created multivariable logistic regression models with the independent variable being the measure of continuity (NPI or UPC) and the dependent variable being experiencing 1 or more AEs. Covariates included patient age, sex, race, payer, night admission, weekend admission, intensive care unit stay, Medicare Severity Diagnosis Related Group (MS‐DRG) weight, and total number of Elixhauser comorbidities.[18] The length of stay (LOS) was also included as a covariate, as longer LOS increases the probability of discontinuity and may increase the risk for AEs. Because MS‐DRG weight and LOS were highly correlated, we created several models; the first including both as continuous variables, the second including both categorized into quartiles, and a third excluding MS‐DRG weight and including LOS as a continuous variable. Our prior study assessing the impact of unit‐based interventions did not show a statistically significant difference in the pre‐ versus postintervention period, thus we did not include study period as a covariate.
RESULTS
Patient Characteristics
Our analyses included data from 474 hospitalizations. Patient characteristics are shown in Table 1. Patients were a mean 51.118.8 years of age, hospitalized for a mean 3.43.1 days, included 241 (50.8%) women, and 233 (49.2%) persons of nonwhite race. The mean and standard deviation of NPI and UPC were 2.51.0 and 0.60.2. Overall, 47 patients (9.9%) experienced 55 total AEs. AEs included 31 adverse drug events, 6 falls, 5 procedural injuries, 4 manifestations of poor glycemic control, 3 hospital‐acquired infections, 2 episodes of acute renal failure, 1 episode of delirium, 1 pressure ulcer, and 2 categorized as other.
| Characteristic | Value |
|---|---|
| |
| Mean age (SD), y | 55.1 (18.8) |
| Mean length of stay (SD), d | 3.4 (3.1) |
| Women, n (%) | 241 (50.8) |
| Nonwhite race, n (%) | 233 (49.2) |
| Payer, n (%) | |
| Private | 180 (38) |
| Medicare | 165 (34.8) |
| Medicaid | 47 (9.9) |
| Self‐pay/other | 82 (17.3) |
| Night admission, n (%) | 245 (51.7) |
| Weekend admission, n (%) | 135 (28.5) |
| Intensive care unit stay, n (%) | 18 (3.8) |
| Diagnosis, n (%) | |
| Diseases of the circulatory system | 95 (20.0) |
| Diseases of the digestive system | 65 (13.7) |
| Diseases of the respiratory system | 49 (10.3) |
| Injury and poisoning | 41 (8.7) |
| Diseases of the skin and soft tissue | 31 (6.5) |
| Symptoms, signs, and ill‐defined conditions and factors influencing health status | 28 (5.9) |
| Endocrine, nutritional, and metabolic diseases and immunity disorders | 25 (5.3) |
| Diseases of the genitourinary system | 24 (5.1) |
| Diseases of the musculoskeletal system and connective tissue | 23 (4.9) |
| Diseases of the nervous system | 23 (4.9) |
| Other | 70 (14.8) |
| Mean no. of Elixhauser comorbidities (SD) | 2.3 (1.7) |
| Mean MS‐DRG weight (SD) | 1.0 (1.0) |
| Mean NPI (SD) | 2.5 (1.0) |
| Mean UPC (SD) | 0.6 (0.2) |
Association Between Continuity and Adverse Events
In unadjusted models, each 1‐unit increase in the NPI (ie, less continuity) was significantly associated with the incidence of 1 or more AEs (odds ratio [OR]=1.75; P<0.001). However, UPC was not associated with incidence of AEs (OR=1.03; P=0.68) (Table 2). Across all adjusted models, neither NPI nor UPC was significantly associated with the incidence of AEs. The direction of the effect of discontinuity on AEs was inconsistent across models. Though all 3 adjusted models using NPI as the independent variable showed a trend toward increased odds of experiencing 1 or more AE with discontinuity, 2 of the 3 models using UPC showed trends in the opposite direction.
| NPI OR (95% CI)* | P Value | UPC OR (95% CI)* | P Value | ||
|---|---|---|---|---|---|
| |||||
| Unadjusted model | 1.75 (1.332.29) | <0.0001 | 1.03 (0.89‐1.21) | 0.68 | |
| Adjusted models | |||||
| Model 1 | MS‐DRG and LOS continuous | 1.16 (0.781.72) | 0.47 | 0.96 (0.791.14) | 0.60 |
| Model 2 | MS‐DRG and LOS in quartiles | 1.38 (0.981.94) | 0.07 | 1.05 (0.881.26) | 0.59 |
| Model 3 | MS‐DRG dropped, LOS continuous | 1.14 (0.771.70) | 0.51 | 0.95 (0.791.14) | 0.56 |
DISCUSSION
We found that hospitalist physician continuity was not associated with the incidence of AEs. Our findings are somewhat surprising because of the high value placed on continuity of care and patient safety concerns related to handoffs. Key clinical information may be lost when patient care is transitioned to a new hospitalist shortly after admission (eg, from a night hospitalist) or at the end of a rotation. Thus, it is logical to assume that discontinuity inherently increases the risk for harm. On the other hand, a physician newly taking over patient care from another may not be anchored to the initial diagnosis and treatment plan established by the first. This second look could potentially prevent missed/delayed diagnoses and optimize the plan of care.[19] These countervailing forces may explain our findings.
Several other potential explanations for our findings should be considered. First, the quality of handoffs may have been sufficient to overcome the potential for information loss. We feel this is unlikely given that little attention had been dedicated to improving the quality of patient handoffs among hospitalists in our institution. Notably, though a number of studies have evaluated resident physician handoffs, most of the work has focused on night coverage, and little is known about the quality of attending handoffs.[20] Second, access to a fully integrated electronic health record may have assisted hospitalists in complementing information received during handoffs. For example, a hospitalist about to start his or her rotation may have remotely accessed and reviewed patient medical records prior to receiving the phone handoff from the outgoing hospitalist. Third, other efforts to improve patient safety may have reduced the overall risk and provided some resilience in the system. Unit‐based interventions, including structured interdisciplinary rounds and nurse‐physician coleadership, improved teamwork climate and reduced AEs in the study hospital over time.[7]
Another factor to consider relates to the fact that hospital care is provided by teams of clinicians (eg, nurses, specialist physicians, therapists, social workers). Hospital teams are often large and have dynamic team membership. Similar to hospitalists, nurses, physician specialists, and other team members handoff care throughout the course of a patient's hospital stay. Yet, discontinuity for each professional type may occur at different times and frequencies. For example, a patient may be handed off from one hospitalist to another, yet the care continues with the same cardiologist or nurse. Future research should better characterize hospital team complexity (eg, size, relationships among members) and dynamics (eg, continuity for various professional types) and the impact of these factors on patient outcomes.
Our findings are important because hospitalist physician discontinuity is common during hospital stays. Hospital medicine groups vary in their staffing and scheduling models. Policies related to admission distribution and rotation length (consecutive days worked) systematically impact physician continuity. Few studies have evaluated the effect on continuity on hospitalized patient outcomes, and no prior research, to our knowledge, has explored the association of continuity on measures of patient safety.[6, 21, 22] Though our study might suggest that staffing models have little impact on patient safety, as previously mentioned, other team factors may influence patient outcomes.
Our study has several limitations. First, we assessed the impact of continuity on AEs in a single site. Although the 7 days on/7 days off model is the most common scheduling pattern used by adult hospital medicine groups,[23] staffing models and patient safety practices vary across hospitals, potentially limiting the generalizability of our study. Second, continuity can be defined and measured in a variety of ways. We used 2 different measures of physician continuity. As previously mentioned, assessing continuity of other clinicians may allow for a more complete understanding of the potential problems related to fragmentation of care. Third, this study excluded patients who experienced care transitions from other hospitals or other units within the hospital. Patients transferred from other hospitals are often complex, severely ill, and may be at higher risk for loss of key clinical information. Fourth, we used automated screens of an EDW to identify potential AEs. Although our prior research found that this method identified a similar number of AEs as manual medical record review screening, there was poor agreement between the 2 methods. Unfortunately, there is no gold standard to identify AEs. The EDW‐facilitated method allowed us to feasibly screen a larger number of charts, increasing statistical power, and minimized any potential bias that might occur during a manual review to identify potential AEs. Finally, we used data available from 2 prior studies and may have been underpowered to detect a significant association between continuity and AEs due to the relatively low percentage of patients experiencing an AE. In a post hoc power calculation, we estimated that we had 70% power to detect a 33% change in the proportion of patients with 1 or more AE for each 1‐unit increase in NPI, and 80% power to detect a 20% change for each 0.1‐unit decrease in UPC.
CONCLUSION
In conclusion, we found that hospitalist physician continuity was not associated with the incidence of AEs. We speculate that hospitalist continuity is only 1 of many team factors that may influence patient safety, and that prior efforts within our institution may have reduced our ability to detect an association. Future research should better characterize hospital team complexity and dynamics and the impact of these factors on patient outcomes.
Disclosures
This project was supported by a grant from the Agency for Healthcare Research and Quality and an Excellence in Academic Medicine Award, administered by Northwestern Memorial Hospital. The authors report no conflicts of interest.
- , , . What is “continuity of care”? J Health Serv Res Policy. 2006;11:248–250.
- , . Interpersonal continuity of care and care outcomes: a critical review. Ann Fam Med. 2005;3:159–166.
- , , , . The association between continuity of care and outcomes: a systematic and critical review. J Eval Clin Pract. 2010;16:947–956.
- , . Interpersonal continuity of care and patient satisfaction: a critical review. Ann Fam Med. 2004;2:445–451.
- , , , . Continuity of care in a family practice residency program. Impact on physician satisfaction. J Fam Pract. 1990;31:69–73.
- , , , et al. The impact of hospitalist discontinuity on hospital cost, readmissions, and patient satisfaction. J Gen Intern Med. 2014;29:1004–1008.
- , , , et al. Implementation of unit‐based interventions to improve teamwork and patient safety on a medical service [published online ahead of print June 11, 2014]. Am J Med Qual. doi: 10.1177/1062860614538093.
- . Measuring provider continuity in ambulatory care: an assessment of alternative approaches. Med Care. 1979;17:551–565.
- . Defining and measuring interpersonal continuity of care. Ann Fam Med. 2003;1:134–143.
- U.S. Department of Health and Human Services. Agency for Healthcare Research and Quality. Adverse events in hospitals: national incidence among medical beneficiaries. Available at: http://psnet.ahrq.gov/resource.aspx?resourceID=19811. Published November 2010. Accessed on December 15, 2014.
- , , , et al. “Global trigger tool” shows that adverse events in hospitals may be ten times greater than previously measured. Health Aff (Millwood). 2011;30:581–589.
- , , , et al. A study of medical injury and medical malpractice. N Engl J Med. 1989;321:480–484.
- , , , et al. Incidence and types of adverse events and negligent care in Utah and Colorado. Med Care. 2000;38:261–271.
- , , , et al. Comparison of traditional trigger tool to data warehouse based screening for identifying hospital adverse events. BMJ Qual Saf. 2013;22:130–138.
- , , , et al. Incidence of adverse events and negligence in hospitalized patients. Results of the Harvard Medical Practice Study I. N Engl J Med. 1991;324:370–376.
- , , . Safety of patients isolated for infection control. JAMA. 2003;290:1899–1905.
- HCUP Clinical Classification Software. Agency for Healthcare Research and Quality, Rockville, MD. http://www.hcup-us.ahrq.gov/toolssoftware/ccs/ccs.jsp. Accessed on December 15, 2014.
- , , , . Comorbidity measures for use with administrative data. Med Care. 1998;36:8–27.
- . Does continuity of care matter? No: discontinuity can improve patient care. West J Med. 2001;175:5.
- , , , , , . Hospitalist handoffs: a systematic review and task force recommendations. J Hosp Med. 2009;4:433–440.
- , , , , . The impact of fragmentation of hospitalist care on length of stay. J Hosp Med. 2010;5:335–338.
- , , . The Creating Incentives and Continuity Leading to Efficiency staffing model: a quality improvement initiative in hospital medicine. Mayo Clin Proc. 2012;87:364–371.
- Society of Hospital Medicine. 2014 state of hospital medicine report. Philadelphia, PA: Society of Hospital Medicine; 2014.
© 2014 Society of Hospital Medicine
Biomechanical Comparison of Hamstring Tendon Fixation Devices for Anterior Cruciate Ligament Reconstruction: Part 1. Five Femoral Devices
Anterior cruciate ligament (ACL) reconstruction remains one of the most common orthopedic procedures; almost 100,000 are performed in the United States each year, and they are among the procedures more commonly performed by surgeons specializing in sports medicine and by general orthopedists.1,2 Recent years have seen a trend toward replacing the gold standard of bone–patellar tendon–bone autograft with autograft or allograft hamstring tendon in ACL reconstruction.3 This shift is being made to try to avoid the donor-site morbidity of patellar tendon autografts and decrease the incidence of postoperative anterior knee pain. With increased use of hamstring grafts in ACL reconstruction, graft fixation strength has become a priority in attempts to optimize recovery and rehabilitation.4
Rigid fixation of hamstring grafts is now recognized as a crucial factor in the long-term success of ACL reconstruction. Grafts must withstand both early rehabilitation forces as high as 500 N5 and stresses to the native ACL during healing, which may take up to 12 weeks for soft-tissue incorporation.6
The challenge has been to engineer devices that provide stable, rigid graft fixation that allows expeditious tendon-to-bone healing and increased construct stiffness. Many new fixation devices are being marketed, and there is controversy regarding which provides the best stability and strength.7 Several studies have tested various fixation devices,8-16 but so far several devices have not been compared with one another.
We conducted a study to determine if femoral hamstring fixation devices used in ACL reconstruction differ in fixation strength. We hypothesized we would find no differences.
Materials and Methods
Fifty porcine femurs were harvested after the animals had been euthanized for other studies at our institution. Our study was approved by the institutional animal care and use committee. Specimens were stored at –25°C and, on day of testing, thawed to room temperature. Gracilis and semitendinosus tendon grafts were donated by a tissue bank (LifeNet Health, Virginia Beach, Virginia). The grafts were stored at –25°C; on day of testing, tendons were thawed to room temperature.
We evaluated 5 different femoral fixation devices (Figure 1): Delta screw and Bio-TransFix (Arthrex, Naples, Florida) and Bone Mulch screw, EZLoc, and Zip Loop (Arthrotek, Warsaw, Indiana). For each device, 10 ACL fixation constructs were tested.
Quadrupled human semitendinosus–gracilis tendon grafts were fixed into the femurs using the 5 femoral fixation devices. All fixations were done to manufacturer specifications.
Cyclic loading was followed by testing with the load-to-failure (LTF) protocol described by Kousa and colleagues.13 Specimens were tested in a custom load fixture (Figure 2). The base fixture used an adjustable angle vise mounted on a free rotary stage and a free x-y translation stage. This system allowed the load axis to be oriented to and aligned with the graft tunnel in the porcine femur, preventing off-axis or torsional loading of the grafts.
Pneumatic grips equipped with a custom pincer attachment allowed the graft to be grasped under a constant grip force during testing, regardless of graft thinning under tensile loads. Graft specimens were initially looped over a 3.8-mm horizontal metal shaft, and the 2 strands were double-looped at the graft insertion site. The 2 free strands were then drawn up around the metal shaft, and the shaft was placed above the serrated jaws. The metal shaft with enveloping tendon strands rested on a flat shelf at the top of the grip serrations. This configuration prevented the metal shaft and tendon strands from being pulled through the serrations when compressive force was applied to the jaws.
Before the study, the grip design was tested. There was no detectable relative motion of the strands at the grip end during graft testing to failure. The pincer attachment allowed close approach of the grips to the specimen at all femoral condyle orientations, so that a 25-mm length of exposed graft could be obtained for each specimen under initial conditions.
In the cyclic loading test, the load was applied parallel to the long axis of the femoral tunnel. A 50-N preload was initially applied to each specimen for 10 seconds, and the length of the exposed graft between grips and graft insertion was recorded. Subsequently, 1500 loading cycles between 50 N and 200 N at a rate of 1 cycle per 2 seconds (0.5 Hz) were performed. Standard force-displacement curves were then generated.
Specimens surviving the cyclic loading then underwent a single-cycle LTF test in which the load was applied parallel to the long axis of the drill hole at a rate of 50 mm per minute.
Residual displacement, stiffness, and ultimate LTF data were recorded from the force-displacement curves. Residual displacement data were generated from the cyclic loading test; residual displacement was determined by subtracting preload displacement from displacement at 1, 10, 50, 100, 250, 500, 1000, and 1500 cycles. Stiffness data were generated from the single-cycle LTF test; stiffness was defined as the linear region slope of the force-displacement curve corresponding to the steepest straight-line tangent to the loading curve. Ultimate LTF data were generated from the single-cycle LTF test; ultimate LTF was defined as the maximum load sustained by the specimen during a constant-displacement-rate tensile test for graft pullout.
Statistical analysis generated standard descriptive statistics: means, standard deviations, and proportions. One-way analysis of variance (ANOVA) was used to determine any statistically significant differences in stiffness, yield load, and residual displacement between the different fixation devices. Differences in force (load) between the single cycle and the cyclic loading test were determined by ANOVA. P < .05 was considered statistically significant for all tests.
Results
The modes of failure for the devices differed slightly (Table). Bone Mulch screw failed with a fracture through the femoral condyle extending to the bone tunnel. Zip Loop and EZLoc failed by pulling through their cortical attachment on the lateral femoral condyle. Bio-TransFix broke in the tunnel during LTF. Delta screw failed with slippage of the fixation device, and the tendons pulled out through the tunnel.
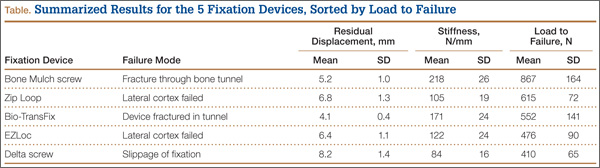
For the cyclic loading tests, only 2 of the 10 Delta screws completed the 1500-cycle loading test before failure. Of the 8 Delta screws that did not complete this testing, the majority failed after about 100 cycles. All 10 tests of Bone Mulch, Zip Loop, EZLoc, and Bio-TransFix completed the 1500-cycle loading test.
Residual displacement data were calculated from cyclic loading tests (Table). Mean (SD) residual displacement was lowest for Bio-TransFix at 4.1 (0.4) mm, followed by Bone Mulch at 5.2 (1.0) mm, EZLoc at 6.4 (1.1) mm, and Zip Loop at 6.8 (1.3) mm. Delta screws at 8.2 (1.4) mm had the highest residual displacement, though only 2 completed the cyclic tests. Bio-TransFix had significantly (P < .001) less residual displacement compared with EZLoc, Zip Loop, and Delta. Bone Mulch had significantly less residual displacement compared with Zip Loop (P < .05) and Delta (P < .01).
Stiffness data were calculated from LTF tests (Table). Mean (SD) stiffness was highest for Bone Mulch at 218 (25.9) N/mm, followed by Bio-TransFix at 171 (24.2) N/mm, EZLoc at 122 (24.1) N/mm, Zip Loop at 105 (18.9) N/mm, and Delta at 84 (16.4) N/mm. Bone Mulch had significantly (P < .001) higher stiffness compared with Bio-TransFix, EZLoc, Zip Loop, and Delta. Bio-TransFix had significantly (P < .001) higher stiffness compared with EZLoc, Zip Loop, and Delta.
Mean (SD) ultimate LTF was highest for Bone Mulch at 867 (164) N, followed by Zip Loop at 615 (72.3) N, Bio-TransFix at 552 (141) N, EZLoc at 476 (89.7) N, and Delta at 410 (65.3) N (Table). Bone Mulch failed at a statistically significantly (P < .001) higher load compared with Zip Loop, Bio-TransFix, EZLoc, and Delta. There were no significant differences in mean LTF among Zip Loop, Bio-TransFix, EZLoc, and Delta.
Discussion
In this biomechanical comparison of 5 different femoral fixation devices, the Bone Mulch screw had results superior to those of the other implants. Bone Mulch failed at higher LTF and higher stiffness. Bio-TransFix performed well and had residual displacement similar to that of Bone Mulch, but significantly lower LTF. Overall, EZLoc and Zip Loop were similar to each other in performance. The Delta (interference) screw performed poorly with respect to LTF, residual displacement, and stiffness; a large proportion of these screws failed early into cyclic loading.
Bone Mulch and Bio-TransFix overall outperformed the other fixation devices. These 2 devices are cortical-cancellous suspension devices, which provide transcondylar fixation and resist tensile forces perpendicular to the pullout force. Multiple biomechanical studies have found superior performance for these types of devices compared with various implants.10,13,15,16
Our results were similar to those of Kousa and colleagues,13 who found the Bone Mulch screw to provide highest LTF, highest stiffness, and lowest residual displacement. Another study found significantly higher stiffness for the Bone Mulch screw than for the Endobutton, a cortical suspensory fixation device.14 Bone Mulch failure modes differed, however. In the study by Kousa and colleagues,13 3 specimens failed with bending of the screw tip, and 7 failed with rupture of the tendon loop. All specimens in our study failed with fractures through the condyle. It is unclear why the failure modes differed, as we followed similar manufacturer protocols for inserting the device. It is possible the bone mass density of the porcine femurs differed between studies. This was not reported by Kousa and colleagues,13 and we did not perform testing either. However, all the porcine femurs were about the same age for testing of each device in this study.
Bio-TransFix has also been compared with various implants, but not in the same study. Brown and colleagues8 found the TransFix device significantly stiffer than the Endobutton CL. Shen and colleagues16 determined that TransFix had significantly lower residual displacement compared with Endobutton CL. Milano and colleagues15 compared multiple cortical suspensory fixation devices, including Endobutton CL, with TransFix and Bio-TransFix, and concluded the cortical-cancellous devices (TransFix, Bio-TransFix) offered the best and most predictable results in terms of elongation, fixation strength, and stiffness. TransFix has also been shown to be superior to interference screw fixation in biomechanical studies.10,15
Clinical outcomes of studies using TransFix for femoral fixation have been favorable, with improved Lysholm scores and improved laxity according to the KT-1000 test.17 However, multiple prospective studies have found no clinical difference in knee laxity between interference screw and Endobutton at 1- to 2-year follow-up18-20 and no difference in clinical outcome scores, such as the International Knee Documentation Committee score.11,18-20
Although these studies have shown no major clinical differences at short-term follow-up, the early aggressive rehabilitation period is the larger concern. Our study clearly demonstrated the biomechanical strength of transcondylar devices over other devices. The concern with transcondylar devices (vs other devices) is the increased difficulty that inexperienced surgeons have inserting them. In addition, when removed, transcondylar devices leave a large bone void.
In the present study, an important concern with femoral graft fixation is the poor performance of interference screws. Other authors recently expressed concern with using interference screws in soft-tissue ACL grafts—based on biomechanical study results of increased slippage, bone tunnel widening, and less strength.7 In the present study, Delta screws consistently performed poorest with respect to ultimate LTF, residual displacement, and stiffness. Only 20% of these screws completed 1500 cycles. Poor performance of interference screws has also been seen in other studies in tibial graft fixation21,22 and femoral graft fixation.13-15 Given their poor biomechanical properties, as seen in our study and these other studies, we think use of an interference screw alone is a poor choice for fixation.
Combined fixation techniques—interference screw plus other device(s)—may be used in clinical practice, but the present study did not evaluate any. In a biomechanical study, Yoo and colleagues23 compared an interference screw; an interference screw plus a cortical screw and a spiked washer; and a cortical screw and a spiked washer used alone in the tibia. Stiffness nearly doubled, residual displacement was less, and ultimate LTF was significantly higher in the group with the interference screw plus the cortical screw and the spiked washer. In a similar study involving femoral fixation, Oh and colleagues24 demonstrated improved stiffness, residual displacement, and LTF in cyclic testing with the combination of interference screw and Endobutton CL, compared with Endobutton CL alone. Further studies may include direct comparisons of additional femoral fixation techniques using more than 1 device.
The Zip Loop, or Toggle Loc with Zip Loop technology, is a suspensory cortical fixation device. It was initially designed for use in ACL fixation but has also been used in other surgeries, including distal biceps repair25 and ulnar collateral ligament reconstruction.26 The device itself is easy to use; more important, it allows for adjustment of graft length within the bone tunnel after deployment of the cortical fixation. Few biomechanical studies have been conducted with Zip Loop.9,12 The present study is the first to compare Zip Loop with devices other than suspensory cortical fixation devices. Zip Loop performed very well in LTF testing but had lower stiffness and higher residual displacement compared with the transcondylar fixation devices. Despite these findings, we have continued to use this device for femoral fixation in ACL reconstruction because of its ease of insertion, the ability to adjust graft tension within the bone tunnel, and the difficulties encountered inserting and removing transcondylar fixation.
We recognize the limitations in our study design with respect to how axial and cyclical loading compares with the physiologic orientation of the ACL during ambulation and running activities. This biomechanical study was not able to replicate these types of activities. However, it did provide good data supporting early rehabilitation with various fixation devices, though concern with use of interference screws remains.
Conclusion
Superior strength in fixation of hamstring grafts in the femur was demonstrated by Bone Mulch screws, followed closely by Bio-TransFix. Delta screws demonstrated poor displacement, stiffness, and LTF. When used as the sole femoral fixation device, a device with low LTF, decreased stiffness, and high residual displacement should be used cautiously in patients undergoing aggressive rehabilitation.
1. Dooley PJ, Chan DS, Dainty KN, Mohtadi NGH, Whelan DB. Patellar tendon versus hamstring autograft for anterior cruciate ligament rupture in adults. Cochrane Database Syst Rev. 2006;(2):CD005960.
2. Garrett WE Jr, Swiontkowski MF, Weinsten JN, et al. American Board of Orthopaedic Surgery Practice of the Orthopaedic Surgeon: part-II, certification examination case mix. J Bone Joint Surg Am. 2006;88(3):660-667.
3. West RV, Harner CD. Graft selection in anterior cruciate ligament reconstruction. J Am Acad Orthop Surg. 2005;13(3):197-207.
4. Hapa O, Barber FA. ACL fixation devices. Sports Med Arthrosc. 2009;17(4):217-223.
5. Walsh MP, Wijdicks CA, Parker JB, Hapa O, LaPrade RF. A comparison between a retrograde interference screw, suture button, and combined fixation on the tibial side in an all-inside anterior cruciate ligament reconstruction: a biomechanical study in a porcine model. Am J Sports Med. 2009;37(1):160-167.
6. Rodeo SA, Arnoczky SP, Torzilli PA, Hidaka C, Warren RF. Tendon-healing in a bone tunnel. A biomechanical and histological study in the dog. J Bone Joint Surg Am. 1993;75(12):1795-1803.
7. Prodromos CC, Fu FH, Howell SM, Johnson DH, Lawhorn K. Controversies in soft-tissue anterior cruciate ligament reconstruction: grafts, bundles, tunnels, fixation, and harvest. J Am Acad Orthop Surg. 2008;16(7):376-384.
8. Brown CH Jr, Wilson DR, Hecker AT, Ferragamo M. Graft-bone motion and tensile properties of hamstring and patellar tendon anterior cruciate ligament femoral graft fixation under cyclic loading. Arthroscopy. 2004;20(9):922-935.
9. Conner CS, Perez BA, Morris RP, Buckner JW, Buford WL Jr, Ivey FM. Three femoral fixation devices for anterior cruciate ligament reconstruction: comparison of fixation on the lateral cortex versus the anterior cortex. Arthroscopy. 2010;26(6):796-807.
10. Fabbriciani C, Mulas PD, Ziranu F, Deriu L, Zarelli D, Milano G. Mechanical analysis of fixation methods for anterior cruciate ligament reconstruction with hamstring tendon graft. An experimental study in sheep knees. Knee. 2005;12(2):135-138.
11. Harilainen A, Sandelin J, Jansson KA. Cross-pin femoral fixation versus metal interference screw fixation in anterior cruciate ligament reconstruction with hamstring tendons: results of a controlled prospective randomized study with 2-year follow-up. Arthroscopy. 2005;21(1):25-33.
12. Kamelger FS, Onder U, Schmoelz W, Tecklenburg K, Arora R, Fink C. Suspensory fixation of grafts in anterior cruciate ligament reconstruction: a biomechanical comparison of 3 implants. Arthroscopy. 2009;25(7):767-776.
13. Kousa P, Järvinen TL, Vihavainen M, Kannus P, Järvinen M. The fixation strength of six hamstring tendon graft fixation devices in anterior cruciate ligament reconstruction. Part I: femoral site. Am J Sports Med. 2003;31(2):174-181.
14. Kudo T, Tohyama H, Minami A, Yasuda K. The effect of cyclic loading on the biomechanical characteristics of the femur–graft–tibia complex after anterior cruciate ligament reconstruction using Bone Mulch screw/WasherLoc fixation. Clin Biomech. 2005;20(4):414-420.
15. Milano G, Mulas PD, Ziranu F, Piras S, Manunta A, Fabbriciani C. Comparison between different femoral fixation devices for ACL reconstruction with doubled hamstring tendon graft: a biomechanical analysis. Arthroscopy. 2006;22(6):660-668.
16. Shen HC, Chang JH, Lee CH, et al. Biomechanical comparison of cross-pin and Endobutton-CL femoral fixation of a flexor tendon graft for anterior cruciate ligament reconstruction—a porcine femur–graft–tibia complex study. J Surg Res. 2010;161(2):282-287.
17. Asik M, Sen C, Tuncay I, Erdil M, Avci C, Taser OF. The mid- to long-term results of the anterior cruciate ligament reconstruction with hamstring tendons using Transfix technique. Knee Surg Sports Traumatol Arthrosc. 2007;15(8):965-972.
18. Capuano L, Hardy P, Longo UG, Denaro V, Maffulli N. No difference in clinical results between femoral transfixation and bio-interference screw fixation in hamstring tendon ACL reconstruction. A preliminary study. Knee. 2008;15(3):174-179.
19. Price R, Stoney J, Brown G. Prospective randomized comparison of Endobutton versus cross-pin femoral fixation in hamstring anterior cruciate ligament reconstruction with 2-year follow-up. ANZ J Surg. 2010;80(3):162-165.
20. Rose T, Hepp P, Venus J, Stockmar C, Josten C, Lill H. Prospective randomized clinical comparison of femoral transfixation versus bioscrew fixation in hamstring tendon ACL reconstruction—a preliminary report. Knee Surg Sports Traumatol Arthrosc. 2006;14(8):730-738.
21. Kousa P, Järvinen TL, Vihavainen M, Kannus P, Järvinen M. The fixation strength of six hamstring tendon graft fixation devices in anterior cruciate ligament reconstruction. Part II: tibial site. Am J Sports Med. 2003;31(2):182-188.
22. Magen HE, Howell SM, Hull ML. Structural properties of six tibial fixation methods for anterior cruciate ligament soft tissue grafts. Am J Sports Med. 1999;27(1):35-43.
23. Yoo JC, Ahn JH, Kim JH, et al. Biomechanical testing of hybrid hamstring graft tibial fixation in anterior cruciate ligament reconstruction. Knee. 2006;13(6):455-459.
24. Oh YH, Namkoong S, Strauss EJ, et al. Hybrid femoral fixation of soft-tissue grafts in anterior cruciate ligament reconstruction using the Endobutton CL and bioabsorbable interference screws: a biomechanical study. Arthroscopy. 2006;22(11):1218-1224.
25. DiRaimo MJ Jr, Maney MD, Deitch JR. Distal biceps tendon repair using the Toggle Loc with Zip Loop. Orthopedics. 2008;31(12). doi: 10.3928/01477447-20081201-05.
26. Morgan RJ, Starman JS, Habet NA, et al. A biomechanical evaluation of ulnar collateral ligament reconstruction using a novel technique for ulnar-sided fixation. Am J Sports Med. 2010;38(7):1448-1455.
Anterior cruciate ligament (ACL) reconstruction remains one of the most common orthopedic procedures; almost 100,000 are performed in the United States each year, and they are among the procedures more commonly performed by surgeons specializing in sports medicine and by general orthopedists.1,2 Recent years have seen a trend toward replacing the gold standard of bone–patellar tendon–bone autograft with autograft or allograft hamstring tendon in ACL reconstruction.3 This shift is being made to try to avoid the donor-site morbidity of patellar tendon autografts and decrease the incidence of postoperative anterior knee pain. With increased use of hamstring grafts in ACL reconstruction, graft fixation strength has become a priority in attempts to optimize recovery and rehabilitation.4
Rigid fixation of hamstring grafts is now recognized as a crucial factor in the long-term success of ACL reconstruction. Grafts must withstand both early rehabilitation forces as high as 500 N5 and stresses to the native ACL during healing, which may take up to 12 weeks for soft-tissue incorporation.6
The challenge has been to engineer devices that provide stable, rigid graft fixation that allows expeditious tendon-to-bone healing and increased construct stiffness. Many new fixation devices are being marketed, and there is controversy regarding which provides the best stability and strength.7 Several studies have tested various fixation devices,8-16 but so far several devices have not been compared with one another.
We conducted a study to determine if femoral hamstring fixation devices used in ACL reconstruction differ in fixation strength. We hypothesized we would find no differences.
Materials and Methods
Fifty porcine femurs were harvested after the animals had been euthanized for other studies at our institution. Our study was approved by the institutional animal care and use committee. Specimens were stored at –25°C and, on day of testing, thawed to room temperature. Gracilis and semitendinosus tendon grafts were donated by a tissue bank (LifeNet Health, Virginia Beach, Virginia). The grafts were stored at –25°C; on day of testing, tendons were thawed to room temperature.
We evaluated 5 different femoral fixation devices (Figure 1): Delta screw and Bio-TransFix (Arthrex, Naples, Florida) and Bone Mulch screw, EZLoc, and Zip Loop (Arthrotek, Warsaw, Indiana). For each device, 10 ACL fixation constructs were tested.
Quadrupled human semitendinosus–gracilis tendon grafts were fixed into the femurs using the 5 femoral fixation devices. All fixations were done to manufacturer specifications.
Cyclic loading was followed by testing with the load-to-failure (LTF) protocol described by Kousa and colleagues.13 Specimens were tested in a custom load fixture (Figure 2). The base fixture used an adjustable angle vise mounted on a free rotary stage and a free x-y translation stage. This system allowed the load axis to be oriented to and aligned with the graft tunnel in the porcine femur, preventing off-axis or torsional loading of the grafts.
Pneumatic grips equipped with a custom pincer attachment allowed the graft to be grasped under a constant grip force during testing, regardless of graft thinning under tensile loads. Graft specimens were initially looped over a 3.8-mm horizontal metal shaft, and the 2 strands were double-looped at the graft insertion site. The 2 free strands were then drawn up around the metal shaft, and the shaft was placed above the serrated jaws. The metal shaft with enveloping tendon strands rested on a flat shelf at the top of the grip serrations. This configuration prevented the metal shaft and tendon strands from being pulled through the serrations when compressive force was applied to the jaws.
Before the study, the grip design was tested. There was no detectable relative motion of the strands at the grip end during graft testing to failure. The pincer attachment allowed close approach of the grips to the specimen at all femoral condyle orientations, so that a 25-mm length of exposed graft could be obtained for each specimen under initial conditions.
In the cyclic loading test, the load was applied parallel to the long axis of the femoral tunnel. A 50-N preload was initially applied to each specimen for 10 seconds, and the length of the exposed graft between grips and graft insertion was recorded. Subsequently, 1500 loading cycles between 50 N and 200 N at a rate of 1 cycle per 2 seconds (0.5 Hz) were performed. Standard force-displacement curves were then generated.
Specimens surviving the cyclic loading then underwent a single-cycle LTF test in which the load was applied parallel to the long axis of the drill hole at a rate of 50 mm per minute.
Residual displacement, stiffness, and ultimate LTF data were recorded from the force-displacement curves. Residual displacement data were generated from the cyclic loading test; residual displacement was determined by subtracting preload displacement from displacement at 1, 10, 50, 100, 250, 500, 1000, and 1500 cycles. Stiffness data were generated from the single-cycle LTF test; stiffness was defined as the linear region slope of the force-displacement curve corresponding to the steepest straight-line tangent to the loading curve. Ultimate LTF data were generated from the single-cycle LTF test; ultimate LTF was defined as the maximum load sustained by the specimen during a constant-displacement-rate tensile test for graft pullout.
Statistical analysis generated standard descriptive statistics: means, standard deviations, and proportions. One-way analysis of variance (ANOVA) was used to determine any statistically significant differences in stiffness, yield load, and residual displacement between the different fixation devices. Differences in force (load) between the single cycle and the cyclic loading test were determined by ANOVA. P < .05 was considered statistically significant for all tests.
Results
The modes of failure for the devices differed slightly (Table). Bone Mulch screw failed with a fracture through the femoral condyle extending to the bone tunnel. Zip Loop and EZLoc failed by pulling through their cortical attachment on the lateral femoral condyle. Bio-TransFix broke in the tunnel during LTF. Delta screw failed with slippage of the fixation device, and the tendons pulled out through the tunnel.
For the cyclic loading tests, only 2 of the 10 Delta screws completed the 1500-cycle loading test before failure. Of the 8 Delta screws that did not complete this testing, the majority failed after about 100 cycles. All 10 tests of Bone Mulch, Zip Loop, EZLoc, and Bio-TransFix completed the 1500-cycle loading test.
Residual displacement data were calculated from cyclic loading tests (Table). Mean (SD) residual displacement was lowest for Bio-TransFix at 4.1 (0.4) mm, followed by Bone Mulch at 5.2 (1.0) mm, EZLoc at 6.4 (1.1) mm, and Zip Loop at 6.8 (1.3) mm. Delta screws at 8.2 (1.4) mm had the highest residual displacement, though only 2 completed the cyclic tests. Bio-TransFix had significantly (P < .001) less residual displacement compared with EZLoc, Zip Loop, and Delta. Bone Mulch had significantly less residual displacement compared with Zip Loop (P < .05) and Delta (P < .01).
Stiffness data were calculated from LTF tests (Table). Mean (SD) stiffness was highest for Bone Mulch at 218 (25.9) N/mm, followed by Bio-TransFix at 171 (24.2) N/mm, EZLoc at 122 (24.1) N/mm, Zip Loop at 105 (18.9) N/mm, and Delta at 84 (16.4) N/mm. Bone Mulch had significantly (P < .001) higher stiffness compared with Bio-TransFix, EZLoc, Zip Loop, and Delta. Bio-TransFix had significantly (P < .001) higher stiffness compared with EZLoc, Zip Loop, and Delta.
Mean (SD) ultimate LTF was highest for Bone Mulch at 867 (164) N, followed by Zip Loop at 615 (72.3) N, Bio-TransFix at 552 (141) N, EZLoc at 476 (89.7) N, and Delta at 410 (65.3) N (Table). Bone Mulch failed at a statistically significantly (P < .001) higher load compared with Zip Loop, Bio-TransFix, EZLoc, and Delta. There were no significant differences in mean LTF among Zip Loop, Bio-TransFix, EZLoc, and Delta.
Discussion
In this biomechanical comparison of 5 different femoral fixation devices, the Bone Mulch screw had results superior to those of the other implants. Bone Mulch failed at higher LTF and higher stiffness. Bio-TransFix performed well and had residual displacement similar to that of Bone Mulch, but significantly lower LTF. Overall, EZLoc and Zip Loop were similar to each other in performance. The Delta (interference) screw performed poorly with respect to LTF, residual displacement, and stiffness; a large proportion of these screws failed early into cyclic loading.
Bone Mulch and Bio-TransFix overall outperformed the other fixation devices. These 2 devices are cortical-cancellous suspension devices, which provide transcondylar fixation and resist tensile forces perpendicular to the pullout force. Multiple biomechanical studies have found superior performance for these types of devices compared with various implants.10,13,15,16
Our results were similar to those of Kousa and colleagues,13 who found the Bone Mulch screw to provide highest LTF, highest stiffness, and lowest residual displacement. Another study found significantly higher stiffness for the Bone Mulch screw than for the Endobutton, a cortical suspensory fixation device.14 Bone Mulch failure modes differed, however. In the study by Kousa and colleagues,13 3 specimens failed with bending of the screw tip, and 7 failed with rupture of the tendon loop. All specimens in our study failed with fractures through the condyle. It is unclear why the failure modes differed, as we followed similar manufacturer protocols for inserting the device. It is possible the bone mass density of the porcine femurs differed between studies. This was not reported by Kousa and colleagues,13 and we did not perform testing either. However, all the porcine femurs were about the same age for testing of each device in this study.
Bio-TransFix has also been compared with various implants, but not in the same study. Brown and colleagues8 found the TransFix device significantly stiffer than the Endobutton CL. Shen and colleagues16 determined that TransFix had significantly lower residual displacement compared with Endobutton CL. Milano and colleagues15 compared multiple cortical suspensory fixation devices, including Endobutton CL, with TransFix and Bio-TransFix, and concluded the cortical-cancellous devices (TransFix, Bio-TransFix) offered the best and most predictable results in terms of elongation, fixation strength, and stiffness. TransFix has also been shown to be superior to interference screw fixation in biomechanical studies.10,15
Clinical outcomes of studies using TransFix for femoral fixation have been favorable, with improved Lysholm scores and improved laxity according to the KT-1000 test.17 However, multiple prospective studies have found no clinical difference in knee laxity between interference screw and Endobutton at 1- to 2-year follow-up18-20 and no difference in clinical outcome scores, such as the International Knee Documentation Committee score.11,18-20
Although these studies have shown no major clinical differences at short-term follow-up, the early aggressive rehabilitation period is the larger concern. Our study clearly demonstrated the biomechanical strength of transcondylar devices over other devices. The concern with transcondylar devices (vs other devices) is the increased difficulty that inexperienced surgeons have inserting them. In addition, when removed, transcondylar devices leave a large bone void.
In the present study, an important concern with femoral graft fixation is the poor performance of interference screws. Other authors recently expressed concern with using interference screws in soft-tissue ACL grafts—based on biomechanical study results of increased slippage, bone tunnel widening, and less strength.7 In the present study, Delta screws consistently performed poorest with respect to ultimate LTF, residual displacement, and stiffness. Only 20% of these screws completed 1500 cycles. Poor performance of interference screws has also been seen in other studies in tibial graft fixation21,22 and femoral graft fixation.13-15 Given their poor biomechanical properties, as seen in our study and these other studies, we think use of an interference screw alone is a poor choice for fixation.
Combined fixation techniques—interference screw plus other device(s)—may be used in clinical practice, but the present study did not evaluate any. In a biomechanical study, Yoo and colleagues23 compared an interference screw; an interference screw plus a cortical screw and a spiked washer; and a cortical screw and a spiked washer used alone in the tibia. Stiffness nearly doubled, residual displacement was less, and ultimate LTF was significantly higher in the group with the interference screw plus the cortical screw and the spiked washer. In a similar study involving femoral fixation, Oh and colleagues24 demonstrated improved stiffness, residual displacement, and LTF in cyclic testing with the combination of interference screw and Endobutton CL, compared with Endobutton CL alone. Further studies may include direct comparisons of additional femoral fixation techniques using more than 1 device.
The Zip Loop, or Toggle Loc with Zip Loop technology, is a suspensory cortical fixation device. It was initially designed for use in ACL fixation but has also been used in other surgeries, including distal biceps repair25 and ulnar collateral ligament reconstruction.26 The device itself is easy to use; more important, it allows for adjustment of graft length within the bone tunnel after deployment of the cortical fixation. Few biomechanical studies have been conducted with Zip Loop.9,12 The present study is the first to compare Zip Loop with devices other than suspensory cortical fixation devices. Zip Loop performed very well in LTF testing but had lower stiffness and higher residual displacement compared with the transcondylar fixation devices. Despite these findings, we have continued to use this device for femoral fixation in ACL reconstruction because of its ease of insertion, the ability to adjust graft tension within the bone tunnel, and the difficulties encountered inserting and removing transcondylar fixation.
We recognize the limitations in our study design with respect to how axial and cyclical loading compares with the physiologic orientation of the ACL during ambulation and running activities. This biomechanical study was not able to replicate these types of activities. However, it did provide good data supporting early rehabilitation with various fixation devices, though concern with use of interference screws remains.
Conclusion
Superior strength in fixation of hamstring grafts in the femur was demonstrated by Bone Mulch screws, followed closely by Bio-TransFix. Delta screws demonstrated poor displacement, stiffness, and LTF. When used as the sole femoral fixation device, a device with low LTF, decreased stiffness, and high residual displacement should be used cautiously in patients undergoing aggressive rehabilitation.
1. Dooley PJ, Chan DS, Dainty KN, Mohtadi NGH, Whelan DB. Patellar tendon versus hamstring autograft for anterior cruciate ligament rupture in adults. Cochrane Database Syst Rev. 2006;(2):CD005960.
2. Garrett WE Jr, Swiontkowski MF, Weinsten JN, et al. American Board of Orthopaedic Surgery Practice of the Orthopaedic Surgeon: part-II, certification examination case mix. J Bone Joint Surg Am. 2006;88(3):660-667.
3. West RV, Harner CD. Graft selection in anterior cruciate ligament reconstruction. J Am Acad Orthop Surg. 2005;13(3):197-207.
4. Hapa O, Barber FA. ACL fixation devices. Sports Med Arthrosc. 2009;17(4):217-223.
5. Walsh MP, Wijdicks CA, Parker JB, Hapa O, LaPrade RF. A comparison between a retrograde interference screw, suture button, and combined fixation on the tibial side in an all-inside anterior cruciate ligament reconstruction: a biomechanical study in a porcine model. Am J Sports Med. 2009;37(1):160-167.
6. Rodeo SA, Arnoczky SP, Torzilli PA, Hidaka C, Warren RF. Tendon-healing in a bone tunnel. A biomechanical and histological study in the dog. J Bone Joint Surg Am. 1993;75(12):1795-1803.
7. Prodromos CC, Fu FH, Howell SM, Johnson DH, Lawhorn K. Controversies in soft-tissue anterior cruciate ligament reconstruction: grafts, bundles, tunnels, fixation, and harvest. J Am Acad Orthop Surg. 2008;16(7):376-384.
8. Brown CH Jr, Wilson DR, Hecker AT, Ferragamo M. Graft-bone motion and tensile properties of hamstring and patellar tendon anterior cruciate ligament femoral graft fixation under cyclic loading. Arthroscopy. 2004;20(9):922-935.
9. Conner CS, Perez BA, Morris RP, Buckner JW, Buford WL Jr, Ivey FM. Three femoral fixation devices for anterior cruciate ligament reconstruction: comparison of fixation on the lateral cortex versus the anterior cortex. Arthroscopy. 2010;26(6):796-807.
10. Fabbriciani C, Mulas PD, Ziranu F, Deriu L, Zarelli D, Milano G. Mechanical analysis of fixation methods for anterior cruciate ligament reconstruction with hamstring tendon graft. An experimental study in sheep knees. Knee. 2005;12(2):135-138.
11. Harilainen A, Sandelin J, Jansson KA. Cross-pin femoral fixation versus metal interference screw fixation in anterior cruciate ligament reconstruction with hamstring tendons: results of a controlled prospective randomized study with 2-year follow-up. Arthroscopy. 2005;21(1):25-33.
12. Kamelger FS, Onder U, Schmoelz W, Tecklenburg K, Arora R, Fink C. Suspensory fixation of grafts in anterior cruciate ligament reconstruction: a biomechanical comparison of 3 implants. Arthroscopy. 2009;25(7):767-776.
13. Kousa P, Järvinen TL, Vihavainen M, Kannus P, Järvinen M. The fixation strength of six hamstring tendon graft fixation devices in anterior cruciate ligament reconstruction. Part I: femoral site. Am J Sports Med. 2003;31(2):174-181.
14. Kudo T, Tohyama H, Minami A, Yasuda K. The effect of cyclic loading on the biomechanical characteristics of the femur–graft–tibia complex after anterior cruciate ligament reconstruction using Bone Mulch screw/WasherLoc fixation. Clin Biomech. 2005;20(4):414-420.
15. Milano G, Mulas PD, Ziranu F, Piras S, Manunta A, Fabbriciani C. Comparison between different femoral fixation devices for ACL reconstruction with doubled hamstring tendon graft: a biomechanical analysis. Arthroscopy. 2006;22(6):660-668.
16. Shen HC, Chang JH, Lee CH, et al. Biomechanical comparison of cross-pin and Endobutton-CL femoral fixation of a flexor tendon graft for anterior cruciate ligament reconstruction—a porcine femur–graft–tibia complex study. J Surg Res. 2010;161(2):282-287.
17. Asik M, Sen C, Tuncay I, Erdil M, Avci C, Taser OF. The mid- to long-term results of the anterior cruciate ligament reconstruction with hamstring tendons using Transfix technique. Knee Surg Sports Traumatol Arthrosc. 2007;15(8):965-972.
18. Capuano L, Hardy P, Longo UG, Denaro V, Maffulli N. No difference in clinical results between femoral transfixation and bio-interference screw fixation in hamstring tendon ACL reconstruction. A preliminary study. Knee. 2008;15(3):174-179.
19. Price R, Stoney J, Brown G. Prospective randomized comparison of Endobutton versus cross-pin femoral fixation in hamstring anterior cruciate ligament reconstruction with 2-year follow-up. ANZ J Surg. 2010;80(3):162-165.
20. Rose T, Hepp P, Venus J, Stockmar C, Josten C, Lill H. Prospective randomized clinical comparison of femoral transfixation versus bioscrew fixation in hamstring tendon ACL reconstruction—a preliminary report. Knee Surg Sports Traumatol Arthrosc. 2006;14(8):730-738.
21. Kousa P, Järvinen TL, Vihavainen M, Kannus P, Järvinen M. The fixation strength of six hamstring tendon graft fixation devices in anterior cruciate ligament reconstruction. Part II: tibial site. Am J Sports Med. 2003;31(2):182-188.
22. Magen HE, Howell SM, Hull ML. Structural properties of six tibial fixation methods for anterior cruciate ligament soft tissue grafts. Am J Sports Med. 1999;27(1):35-43.
23. Yoo JC, Ahn JH, Kim JH, et al. Biomechanical testing of hybrid hamstring graft tibial fixation in anterior cruciate ligament reconstruction. Knee. 2006;13(6):455-459.
24. Oh YH, Namkoong S, Strauss EJ, et al. Hybrid femoral fixation of soft-tissue grafts in anterior cruciate ligament reconstruction using the Endobutton CL and bioabsorbable interference screws: a biomechanical study. Arthroscopy. 2006;22(11):1218-1224.
25. DiRaimo MJ Jr, Maney MD, Deitch JR. Distal biceps tendon repair using the Toggle Loc with Zip Loop. Orthopedics. 2008;31(12). doi: 10.3928/01477447-20081201-05.
26. Morgan RJ, Starman JS, Habet NA, et al. A biomechanical evaluation of ulnar collateral ligament reconstruction using a novel technique for ulnar-sided fixation. Am J Sports Med. 2010;38(7):1448-1455.
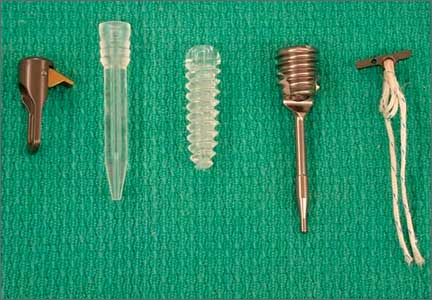
Health-Related Quality-of-Life Scores, Spine-Related Symptoms, and Reoperations in Young Adults 7 to 17 Years After Surgical Treatment of Adolescent Idiopathic Scoliosis
The goal of surgical treatment of adolescent idiopathic scoliosis (AIS) is to prevent disability associated with curve progression.1 Early studies tended to focus on radiographic measures, such as curve correction and sagittal balance, rather than on improvements in quality of life (QOL).2-5 Although studies have reported on QOL in patients treated surgically for scoliosis,6-11 these studies were largely limited by small sample size and inclusion of patients with congenital and neuromuscular scoliosis,9 lack of a generic measure of QOL,6,7 or lack of surgical treatment of patients in the cohort.10
We conducted a study to determine disease-specific and general health-related QOL (HR-QOL) in young adults who underwent surgical correction of their spinal deformity during adolescence and to evaluate associated complications and reoperations.
Materials and Methods
After obtaining institutional review board approval, we queried the surgical database of a large metropolitan tertiary referral center for consecutive patients who had undergone spine deformity correction between the ages of 10 and 17 years (January 1993–December 2003). Hospital and medical records were retrospectively reviewed to confirm the diagnosis of AIS. Patients with congenital, neuromuscular, juvenile, or infantile scoliosis were excluded. Patients with intraspinal pathology (eg, tethered cord, syringomyelia), developmental delay, chromosomal abnormality, or congenital heart disease were also excluded. Patients were contacted by mail or telephone, and the Scoliosis Research Society–22R (SRS-22R)12-15 and the Short Form–12 (SF-12)16 were administered. Standard demographic and surgical data were also collected.
The SRS-22R is a scoliosis-specific HR-QOL questionnaire with 22 items, 5 domains (pain, activity, appearance, mental, satisfaction), and a total score.12-15 Each domain score ranges from 1 to 5 (higher scores indicating better outcomes). The SRS-22R is the outcome instrument most widely used to measure HR-QOL changes in patients with scoliosis, and it is available in several languages.17-26
The SF-12, a 12-item self-administered short-form health status survey developed in the Medical Outcomes Study, measures patient-based health status. Two composite scores can be calculated: physical composite summary (PCS) and mental composite summary (MCS).16 Using norm-based scoring, all domain scales have a mean (SD) of 50 (10) based on the general 1998 US population. Thus, scores under 50 fall below the general population mean.
In addition, patients were surveyed to determine the incidence of spine-related symptoms and complaints, including activity limitations, rib prominence, waistline asymmetry, back pain, limited range of motion (ROM), shortness of breath, wound/scar problems, lung disease/asthma, heart disease, high blood pressure, and arthritis. Data regarding postoperative treatment regimens of physical therapy, narcotic pain medication, spinal/epidural injections, and nonsteroidal anti-inflammatory drug (NSAID) use were collected. Patients were also queried regarding their current working status and smoking status.
Standard demographic and surgical data were collected from hospital and office charts and radiographs. Data collected included history of bracing, age at index surgery, number of levels fused, surgical approach (anterior, posterior, combined), postoperative complications (eg, ileus, wound infection, anemia, pneumonia), and immediate preoperative and final postoperative radiographic measures. Data on need for subsequent revision surgery and indications for revision surgery were also collected.
Preoperative and latest follow-up radiographs were measured to determine curve magnitude, sagittal and coronal balance, and percentage curve correction. Coronal balance was defined as the distance between a plumb line drawn vertically from the spinous process of C7 and the central sacral line on full-length posteroanterior radiographs. Sagittal balance was defined as the distance of a plumb line drawn vertically from the center of the body of C7 and the posterosuperior endplate of S1.27
Regression analysis was performed to identify factors predictive of SRS-22R total scores. Factors included in the analysis were sex, age at surgery, Lenke type, surgery type (anterior, posterior, anteroposterior), number of levels fused, lowest instrumented vertebra, perioperative complications, percentage curve correction, postoperative coronal and sagittal balance, smoking status, and need for revision surgery. Although age and sex were considered variables outside the surgeon’s control, they were included in the model, as previous studies have shown that SRS scores varied by age and sex both in adolescents28 and adults.29 Significance was set at P < .01. All data analysis was performed with IBM SPSS Version 19.0 (Somers, New York).
Results
Of the 384 postoperative patients identified for study inclusion, 134 (35%) completed surveys. Sixteen patients with nonidiopathic scoliosis were excluded, leaving 118 available for analysis. Of the remaining patients, 248 (64%) could not be contacted because of a change in address or phone number. Two patients (1%) were unwilling to complete survey requests. There was no statistically significant difference in demographics between patients with and without follow-up data available. Demographics are summarized in Table 1. There were 109 females (92%). Mean (SD) age at surgery was 14.1 (1.9) years. Only 37 (31%) were braced before surgery. Table 2 summarizes the radiographic data. Mean (SD) major Cobb angle was 49.7° (7.8°). Eighty-five patients (72%) underwent posterior fusion with instrumentation using hooks only; another 16 (14%) had anterior-only surgery, and another 17 (14%) had combined anterior-posterior surgery. A mean of 7.8 levels were fused. Index surgery data and lowest instrumented vertebra distribution are summarized in Table 3. Mean (SD) percentage curve correction was 48.9% (8.4%).
Seven patients had a total of 8 perioperative complications: anemia requiring transfusion (2), ileus necessitating nasogastric tube insertion (2), superficial wound infection treated with oral antibiotics and local wound care (2), wound drainage and erythema (1), and pneumonia (1). Mean (SD) length of clinical and radiographic follow-up was 57.9 (36.3) months.
Table 4 summarizes the long-term complications. Of the 38 patients with long-term complications, 14 required reoperation. The indications were disc herniation (2 patients), painful instrumentation (7), crankshaft phenomenon (1), nonunion (1), and adjacent-level degeneration (3). Both disc herniations were at L5–S1, several segments below the distal extent of the fusion. Of the 7 patients who had painful instrumentation removed, 6 had the entire construct removed, and 1 had the proximal half of a rod taken out. The 3 patients with adjacent-level degeneration had stenosis at the distal end of the construct—at L5–S1 (2 patients) or L2–L3 (1 patient).
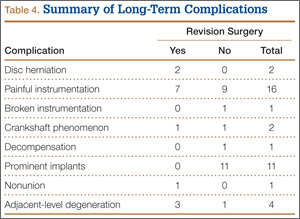
Mean (SD) time between surgery and completion of the surveys/questionnaires was 12.7 (3.2) years (range, 10-18 years). Mean age of respondents was 26.8 years. Twenty-five respondents (21%) were smokers. Mean (SD) outcome scores were 50.9 (9.4) for SF-12 PCS and 49.4 (10.2) for SF-12 MCS. Eighteen patients (15%) had SF-12 PCS scores 1 SD below normal, and 15 (13%) had SF-12 MCS scores 1 SD below normal. Mean (SD) SRS-22R Total score was 4.0 (0.7). Means, standard deviations, and distribution of SRS domain scores are summarized in Table 5. Of the variables, only current smoking (P < .001) was predictive of SRS-22R Total scores, accounting for 20% of their variability (Table 6).
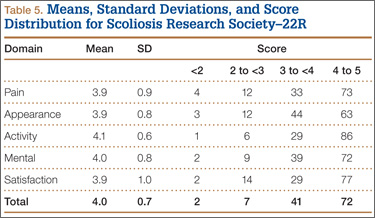
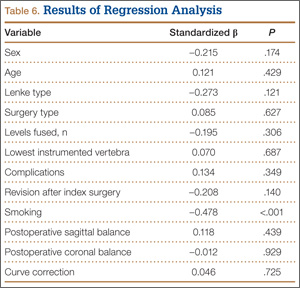
One hundred patients (85%) had jobs, mostly desk jobs. The postoperative limitations most commonly reported are summarized in Table 7. These included at least intermittent back pain in 90 patients (76%), limited ROM in 52 (44%), and activity limitations in 54 (46%). Less common limitations were waistline imbalance in 41 (35%), rib prominence in 28 (24%), wound/scar problems in 18 (15%), and shortness of breath in 18 (15%). Other related medical problems were lung disease/asthma in 11 (9%), osteoarthritis/degenerative arthritis in 11 (9%), heart disease in 3 (3%), and high blood pressure in 2 (2%).
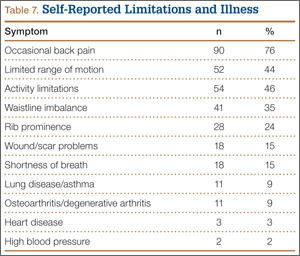
A minority of patients also participated in postoperative treatment regimens. The most common treatment was regular use of NSAIDs (25 patients, 21%). Other treatments were physical therapy (14, 12%), narcotic pain medication use (5, 4%), and epidural steroid injections (5, 4%). Table 8 summarizes the postoperative treatments used by patients with scoliosis.
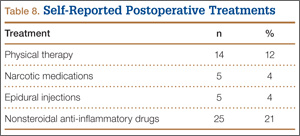
Discussion
A major concern about prophylactic interventions for diseases is that the treatment will harm the patient. This is especially true for major spine surgery performed on adolescents with minimal symptoms. Although the incidence of perioperative complications in children undergoing corrective spinal surgery for AIS has been reported,30-32 the effect of the surgery on the disease-specific HR-QOL outcomes of these individuals as young adults has not been previously studied. Over the past few decades, a paradigm shift in understanding health and disability has occurred, with increased emphasis being placed on HR-QOL outcomes measures and understanding disability as relating to a measureable impact of the functioning of an individual after a change in health or environment. This change was substantiated when the World Health Organization endorsed the International Classification of Functioning, Disability and Health.33 In light of this shift, we present the disease-specific and general HR-QOL outcomes of young adults who had undergone surgical correction for spinal deformity during adolescence, as well as their associated complications and reoperations, in an attempt to identify targets for improvement.
Our patient-reported outcomes demonstrated a high incidence of occasional back pain, activity-related complaints, and limited ROM. Comparison of our cohort’s SRS-22R outcomes with previously published normative values for the unaffected adolescent population28,34 suggests worse scores for the disease-specific SRS-22R domains of pain and appearance. In 2012, Daubs and colleagues34 reported that normative scores on various SRS-22 domains were statistically lower with age (scores decreased from age 10 to age 19 years). Both Verma and colleagues28 and Daubs and colleagues34 reported lower scores for females than for males. Therefore, it is unclear whether the differences observed in our cohort may be accounted for by the larger proportion of females compared with the normative data.
General health scores on the SF-12 were similar to the population norm (mean [SD]) of 50 (10) referenced by Ware and colleagues.16 These findings suggest that, though pain and appearance may be statistically lower in our cohort—as measured with the SRS-22R—the cohort’s spine-related symptoms do not seem to lower its general health. Eighty-five percent of the patients were working at the time of the survey, further supporting a relatively normal level of overall function. In a retrospective review by Takayama and colleagues,9 similar results were found with regard to working after AIS fusion surgery. Of 32 patients treated surgically for scoliosis, at a mean of 21.1 years after the index fusion 27 (84.4%) were or had been engaged in various occupations without marked difficulty.
Our results in a cohort of patients with segmental instrumentation using hooks are similar to results in other studies of long-term HR-QOL measures in patients with AIS and Harrington rod instrumentation. Danielsson and Nachemson35 evaluated patients with surgically treated AIS with at least 20-year follow-up and reported that, in their surgical cohort with a mean age of 39.7 years, mean SF-36 PCS score was 50.9, and mean SF-36 MCS score was 50.2. In a recent study of patients with AIS and Harrington rod instrumentation, those of a mean age of 32.3 years had a mean score of 50.9 for both SF-36 PCS and SF-36 MCS.36
Regression analysis identified only smoking as a predictor of SRS-22R Total scores. This finding, that smokers have a lower health state, is expected even in the general population.37 Interestingly, bracing before surgery, Lenke type, surgery type, number of levels fused, lowest instrumented vertebra, incidence of perioperative complications, percentage curve correction, postoperative sagittal and coronal balance, and need for revision surgery did not influence HR-QOL measures in this cohort.
Our cohort’s incidence of occasional back pain was 76% (90/118 patients). Other reports have had similar findings. In 2012, Bas and colleagues38 studied self-reported pain in 126 consecutive patients with scoliosis and instrumented fusion. In their cohort, “most participants reported ‘no pain’ (38.5%) or ‘mild pain’ (30.8%) and 72.1% of participants reported a current work/school activity level of 100% normal.” Also in 2012, Rushton and Grevitt39 reported on a review and statistical analysis of the literature on HR-QOL in adolescents with untreated AIS and in unaffected adolescents. Their goal was to identify whether there were any differences in HR-QOL and, if so, whether they were clinically relevant. The authors concluded that pain and self-image tended to be statistically lower among cohorts with AIS but that only self-image was consistently different clinically between untreated patients with AIS and their unaffected peers.
Cosmetic complaints, though less common than functional concerns, affected a substantial percentage of our cohort. Waistline imbalance complaints were more common than rib prominence or scar-related complaints. The validity of patient-reported waistline imbalance is not known but may contribute to the SRS-22R outcomes in this cohort, particularly with regard to appearance scores. Respiratory symptoms, particularly those related to shortness of breath, were reported by 15% of patients. Respiratory symptoms may be in part secondary to underlying lung disease; smoking was reported by 21% of patients and asthma by 9%.
Few additional postoperative treatments were reported by patients. The most common treatment was regular use of NSAIDs (21%), followed by postoperative physical therapy (12%). Opiate medication use and spinal injections were rare—consistent with results reported by Danielsson and Nachemson35 in 2003.
Implant-related complaints, including painful instrumentation (13%) and implant prominence (9%), were some of the most common complaints in our study group. Although not all symptomatic instrumentation required surgical revision, 7 (50%) of the 14 additional spine surgeries were related to painful and/or prominent posterior instrumentation. Additional spine surgery was reported in 11.9% of our patients. Other indications for reoperation were disc herniation, crankshaft phenomenon, nonunion, and adjacent-level degeneration. Our rate of revision surgery is supported by the literature. In 2009, Luhmann and colleagues40 reported that 41 (3.9%) of 1057 primary spine fusions for idiopathic scoliosis required reoperation; the indications included infection (16/1057, 1.5%), pseudarthrosis (12, 1.1%), and painful/prominent implant (7, 0.7%). Richards and colleagues41 similarly reported on 1046 patients who underwent fusion for AIS. Of these patients, 135 underwent 172 repeat surgical interventions (12.9% reoperation rate), with 29 (21.5%) of the 135 undergoing 2 or more separate procedures. The most common reasons for reoperation were infection, symptomatic implant, and pseudarthrosis. The authors concluded that repeat surgeries were relatively common after the initial surgical procedures. Having a clearer understanding of instrumentation-related complaints and reoperations may lead to improvement in this surgeon-controlled variable.
There are limitations to this study. The data regarding clinical courses were collected by retrospective chart review, which has known limitations. To offset this, we collected prospective outcome data with use of the SF-12, the SRS-22R, and a spine-related complaints questionnaire. No control group was available for comparison of outcomes in our cohort. We used the SF-12 and previously published normative values for the SRS-22R for comparison with population norms. Such comparisons have inherent limitations, as the groups vary by sex and mean age; our cohort was primarily female and more than a decade older than the controls.
Only 35% of the patients who met the inclusion criteria had complete data that could be included in our analysis. Although there was no statistically significant difference in demographics between patients with and without follow-up data available, this low response rate could have introduced selection bias. Ideally, patients should have been seen in clinic, standing radiographs should have been taken, and pulmonary function tests should have been performed. However, these patients were asymptomatic, and ethical and insurance issues prevented those actions. Thus, any radiographic changes occurring over the intervening years, from the last clinic visit to completion of the surveys, were not documented. This situation may or may not have limited our findings, as other authors have found low correlation between radiographic outcomes and clinical outcome measures.13,14,19,36 During the period when these surgeries were performed, segmental spine instrumentation with hooks was the standard of care for deformity correction in AIS; therefore, all posterior instrumentations were done with hook-only segmental fixation. Current pedicle screw–based techniques that allow for additional correction of the deformity may provide different outcomes in the future.
We think that, despite the inherent limitations of this study, our data will be useful in the treatment of AIS. Our results suggest that postoperative spinal complaints are common and that, compared with an unaffected adolescent population, patients with AIS score significantly lower on pain and appearance domains of outcomes testing at a mean of 12.7 years after index fusion. Nevertheless, the outcomes do not seem to be of sufficient severity to affect general health and QOL as measured by outcomes testing.
Spinal deformity correction is performed to prevent impaired pulmonary function and spine-related disability later in life.42,43 Thus, longer-term studies, involving patients in their fifth and sixth decades of life, are needed to determine whether patients with AIS will have QOL outcomes, pulmonary function, and spine-related problems similar to those in the general population. In this cohort of young adults, smoking status was the only predictor of HR-QOL measures, and spinal deformity correction did not lead to decreased HR-QOL.
1. Tsutsui S, Pawelek J, Bastrom T, et al. Dissecting the effects of spinal fusion and deformity magnitude on quality of life in patients with adolescent idiopathic scoliosis. Spine. 2009;34(18):E653-E658.
2. Bonnett C, Brown JC, Cross B, Barron R. Posterior spinal fusion with Harrington rod instrumentation in 100 consecutive patients. Contemp Orthop. 1980;2:396-399.
3. Harrington PR, Dixon JR. An eleven year clinical investigation of Harrington instrument. Clin Orthop. 1973;(93):113-130.
4. Mielke CH, Lonstein JE, Denis F, Vandenbrink K, Winter RB. Surgical treatment of adolescent idiopathic scoliosis. A comparative analysis. J Bone Joint Surg Am. 1989;71(8):1170-1177.
5. Moskowitz A, Moe JH, Winter RB, Binner H. Long-term follow-up of scoliosis fusion. J Bone Joint Surg Am. 1980;62(3):529-554.
6. Akazawa T, Minami S, Kotani T, Nemoto T, Koshi T, Takahashi K. Health-related quality of life and low back pain of patients surgically treated for scoliosis after 21 years or more of follow-up: comparison among non-idiopathic scoliosis, idiopathic scoliosis, and healthy subjects. Spine. 2012;37(22):1899-1903.
7. Akazawa T, Minami S, Kotani T, Nemoto T, Koshi T, Takahashi K. Long-term clinical outcomes of surgery for adolescent idiopathic scoliosis 21 to 41 years later. Spine. 2012;37(5):402-405.
8. Pehrsson K, Bake B, Larsson S, Nachemson A. Lung function in adult idiopathic scoliosis: a 20 year follow up. Thorax. 1991;46(7):474-478.
9. Takayama K, Nakamura H, Matsuda H. Quality of life in patients treated surgically for scoliosis: longer than sixteen-year follow-up. Spine. 2009;34(20):2179-2184.
10. Weinstein SL, Dolan LA, Cheng JC, Danielsson A, Morcuende JA. Adolescent idiopathic scoliosis. Lancet. 2008;371(9623):1527-1537.
11. Westrick ER, Ward WT. Adolescent idiopathic scoliosis: 5-year to 20-year evidence-based surgical results. J Pediatr Orthop. 2011;31(1 suppl):S61-S68.
12. Asher MA, Lai SM, Glattes RC, Burton DC, Alanay A, Bago J. Refinement of the SRS-22 health-related quality of life questionnaire Function domain. Spine. 2006;31(5):593-597.
13. Asher M, Min Lai S, Burton D, Manna B. Scoliosis Research Society–22 patient questionnaire: responsiveness to change associated with surgical treatment. Spine. 2003;28(1):70-73.
14. Asher M, Min Lai S, Burton D, Manna B. The reliability and concurrent validity of the Scoliosis Research Society–22 patient questionnaire for idiopathic scoliosis. Spine. 2003;28(1):63-69.
15. Asher M, Min Lai S, Burton D, Manna B. Discrimination validity of the Scoliosis Research Society–22 patient questionnaire: relationship to idiopathic scoliosis curve pattern and curve size. Spine. 2003;28(1):74-78.
16. Ware J Jr, Kosinski M, Keller SD. A 12-item short-form health survey: construction of scales and preliminary tests of reliability and validity. Med Care. 1996;34(3):220-233.
17. Alanay A, Cil A, Berk H, et al. Reliability and validity of adapted Turkish version of Scoliosis Research Society–22 (SRS-22) questionnaire. Spine. 2005;30(21):2464-2468.
18. Beauséjour M, Joncas J, Goulet L, et al. Reliability and validity of adapted French Canadian version of Scoliosis Research Society outcomes questionnaire (SRS-22) in Quebec. Spine. 2009;34(6):623-628.
19. Climent JM, Bago J, Ey A, Perez-Grueso FJ, Izquierdo E. Validity of the Spanish version of the Scoliosis Research Society–22 (SRS-22) patient questionnaire. Spine. 2005;30(6):705-709.
20. Glowacki M, Misterska E, Laurentowska M, Mankowski P. Polish adaptation of Scoliosis Research Society–22 questionnaire. Spine. 2009;34(10):1060-1065.
21. Hashimoto H, Sase T, Arai Y, Maruyama T, Isobe K, Shouno Y. Validation of a Japanese version of the Scoliosis Research Society–22 patient questionnaire among idiopathic scoliosis patients in Japan. Spine. 2007;32(4):E141-E146.
22. Li M, Wang CF, Gu SX, et al. Adapted simplified Chinese (mainland) version of Scoliosis Research Society–22 questionnaire. Spine. 2009;34(12):1321-1324.
23. Monticone M, Carabalona R, Negrini S. Reliability of the Scoliosis Research Society–22 patient questionnaire (Italian version) in mild adolescent vertebral deformities. Eura Medicophys. 2004;40(3):191-197.
24. Niemeyer T, Schubert C, Halm HF, Herberts T, Leichtle C, Gesicki M. Validity and reliability of an adapted German version of Scoliosis Research Society–22 questionnaire. Spine. 2009;34(8):818-821.
25. Lai SM, Asher M, Burton D. Estimating SRS-22 quality of life measures with SF-36: application in idiopathic scoliosis. Spine. 2006;31(4):473-478.
26. Glattes RC, Burton DC, Lai SM, Frasier E, Asher MA. The reliability and concurrent validity of the Scoliosis Research Society–22R patient questionnaire compared with the Child Health Questionnaire–CF87 patient questionnaire for adolescent spinal deformity. Spine. 2007;32(16):1778-1784.
27. Blanke KM, Kuklo TR, Lenke LG, et al. Adolescent idiopathic scoliosis. In O’Brien MF, Kuklo TR, Blanke KM, Lenke LG, eds. Spinal Deformity Study Group Radiographic Measurement Manual. Memphis, TN: Medtronic; 2004.
28. Verma K, Lonner B, Hoashi JS, et al. Demographic factors affect Scoliosis Research Society–22 performance in healthy adolescents: a comparative baseline for adolescents with idiopathic scoliosis. Spine. 2010;35(24):2134-2139.
29. Baldus C, Bridwell KH, Harrast J, et al. Age-gender matched comparison of SRS instrument scores between adult deformity and normal adults: are all SRS domains disease specific? Spine. 2008;33(20):2214-2218.
30. Brown CA, Lenke LG, Bridwell KH, Geideman WM, Hasan SA, Blanke K. Complication of pediatric thoracolumbar and lumbar pedicle screws. Spine. 1998;23(14):1566-1571.
31. Coe JD, Arlet V, Donaldson W, et al. Complications in spinal fusion for adolescent idiopathic scoliosis in the new millennium. A report of the Scoliosis Research Society Morbidity and Mortality Committee. Spine. 2006;31(3):345-349.
32. Fu KM, Smith JS, Polly DW, et al. Scoliosis Research Society Morbidity and Mortality Committee. Morbidity and mortality associated with spinal surgery in children: a review of the Scoliosis Research Society morbidity and mortality database. J Neurosurg Pediatr. 2011;7(1):37-41.
33. World Health Organization. International Classification of Functioning, Disability and Health: ICF Short Version. Geneva, Switzerland: World Health Organization; 2001.
34. Daubs M, Lawrence B, Hung M, et al. Scoliosis Research Society–22 results in 3,052 healthy adolescents age ten to 19 years. Abstract presented at: 47th Annual Meeting and Course of the Scoliosis Research Society; September 5-8, 2012; Chicago, IL. Abstract 72.
35. Danielsson AL, Nachemson AL. Back pain and function 23 years after fusion for adolescent idiopathic scoliosis: a case–control study—part II. Spine. 2003;28(18):E373-E383.
36. Götze C, Liljenqvist UR, Slomka A, Götze HG, Steinbeck J. Quality of life and back pain: outcome 16.7 years after Harrington instrumentation. Spine. 2002;27(13):1456-1463.
37. Quercioli C, Messina G, Barbini E, Carriero G, Fanì M, Nante N. Importance of sociodemographic and morbidity aspects in measuring health-related quality of life: performances of three tools: comparison of three questionnaire scores. Eur J Health Econ. 2009;10(4):389-397.
38. Bas T, Franco N, Bas P, Bas JL. Pain and disability following fusion for idiopathic adolescent scoliosis: prevalence and associated factors. Evid Based Spine Care J. 2012;3(2):17-24.
39. Rushton PR, Grevitt MP. Comparison of untreated adolescent idiopathic scoliosis with normal controls: a review and statistical analysis of the literature. Spine. 2013;38(9):778-785.
40. Luhmann SJ, Lenke LG, Bridwell KH, Schootman M. Revision surgery after primary spine fusion for idiopathic scoliosis. Spine. 2009;34(20):2191-2197.
41. Richards BS, Hasley BP, Casey VF. Repeat surgical interventions following “definitive” instrumentation and fusion for idiopathic scoliosis. Spine. 2006;31(26):3018-3026.
42. Bjure J, Grimby G, Kasalický J, Lindh M, Nachemson A. Respiratory impairment and airway closure in patients with untreated idiopathic scoliosis. Thorax. 1970;25(4):451-456.
43. Haefeli M, Elfering A, Kilian R, Min K, Boos N. Nonoperative treatment for adolescent idiopathic scoliosis: a 10- to 60-year follow-up with special reference to health-related quality of life. Spine. 2006;31(3):355-366.
The goal of surgical treatment of adolescent idiopathic scoliosis (AIS) is to prevent disability associated with curve progression.1 Early studies tended to focus on radiographic measures, such as curve correction and sagittal balance, rather than on improvements in quality of life (QOL).2-5 Although studies have reported on QOL in patients treated surgically for scoliosis,6-11 these studies were largely limited by small sample size and inclusion of patients with congenital and neuromuscular scoliosis,9 lack of a generic measure of QOL,6,7 or lack of surgical treatment of patients in the cohort.10
We conducted a study to determine disease-specific and general health-related QOL (HR-QOL) in young adults who underwent surgical correction of their spinal deformity during adolescence and to evaluate associated complications and reoperations.
Materials and Methods
After obtaining institutional review board approval, we queried the surgical database of a large metropolitan tertiary referral center for consecutive patients who had undergone spine deformity correction between the ages of 10 and 17 years (January 1993–December 2003). Hospital and medical records were retrospectively reviewed to confirm the diagnosis of AIS. Patients with congenital, neuromuscular, juvenile, or infantile scoliosis were excluded. Patients with intraspinal pathology (eg, tethered cord, syringomyelia), developmental delay, chromosomal abnormality, or congenital heart disease were also excluded. Patients were contacted by mail or telephone, and the Scoliosis Research Society–22R (SRS-22R)12-15 and the Short Form–12 (SF-12)16 were administered. Standard demographic and surgical data were also collected.
The SRS-22R is a scoliosis-specific HR-QOL questionnaire with 22 items, 5 domains (pain, activity, appearance, mental, satisfaction), and a total score.12-15 Each domain score ranges from 1 to 5 (higher scores indicating better outcomes). The SRS-22R is the outcome instrument most widely used to measure HR-QOL changes in patients with scoliosis, and it is available in several languages.17-26
The SF-12, a 12-item self-administered short-form health status survey developed in the Medical Outcomes Study, measures patient-based health status. Two composite scores can be calculated: physical composite summary (PCS) and mental composite summary (MCS).16 Using norm-based scoring, all domain scales have a mean (SD) of 50 (10) based on the general 1998 US population. Thus, scores under 50 fall below the general population mean.
In addition, patients were surveyed to determine the incidence of spine-related symptoms and complaints, including activity limitations, rib prominence, waistline asymmetry, back pain, limited range of motion (ROM), shortness of breath, wound/scar problems, lung disease/asthma, heart disease, high blood pressure, and arthritis. Data regarding postoperative treatment regimens of physical therapy, narcotic pain medication, spinal/epidural injections, and nonsteroidal anti-inflammatory drug (NSAID) use were collected. Patients were also queried regarding their current working status and smoking status.
Standard demographic and surgical data were collected from hospital and office charts and radiographs. Data collected included history of bracing, age at index surgery, number of levels fused, surgical approach (anterior, posterior, combined), postoperative complications (eg, ileus, wound infection, anemia, pneumonia), and immediate preoperative and final postoperative radiographic measures. Data on need for subsequent revision surgery and indications for revision surgery were also collected.
Preoperative and latest follow-up radiographs were measured to determine curve magnitude, sagittal and coronal balance, and percentage curve correction. Coronal balance was defined as the distance between a plumb line drawn vertically from the spinous process of C7 and the central sacral line on full-length posteroanterior radiographs. Sagittal balance was defined as the distance of a plumb line drawn vertically from the center of the body of C7 and the posterosuperior endplate of S1.27
Regression analysis was performed to identify factors predictive of SRS-22R total scores. Factors included in the analysis were sex, age at surgery, Lenke type, surgery type (anterior, posterior, anteroposterior), number of levels fused, lowest instrumented vertebra, perioperative complications, percentage curve correction, postoperative coronal and sagittal balance, smoking status, and need for revision surgery. Although age and sex were considered variables outside the surgeon’s control, they were included in the model, as previous studies have shown that SRS scores varied by age and sex both in adolescents28 and adults.29 Significance was set at P < .01. All data analysis was performed with IBM SPSS Version 19.0 (Somers, New York).
Results
Of the 384 postoperative patients identified for study inclusion, 134 (35%) completed surveys. Sixteen patients with nonidiopathic scoliosis were excluded, leaving 118 available for analysis. Of the remaining patients, 248 (64%) could not be contacted because of a change in address or phone number. Two patients (1%) were unwilling to complete survey requests. There was no statistically significant difference in demographics between patients with and without follow-up data available. Demographics are summarized in Table 1. There were 109 females (92%). Mean (SD) age at surgery was 14.1 (1.9) years. Only 37 (31%) were braced before surgery. Table 2 summarizes the radiographic data. Mean (SD) major Cobb angle was 49.7° (7.8°). Eighty-five patients (72%) underwent posterior fusion with instrumentation using hooks only; another 16 (14%) had anterior-only surgery, and another 17 (14%) had combined anterior-posterior surgery. A mean of 7.8 levels were fused. Index surgery data and lowest instrumented vertebra distribution are summarized in Table 3. Mean (SD) percentage curve correction was 48.9% (8.4%).
Seven patients had a total of 8 perioperative complications: anemia requiring transfusion (2), ileus necessitating nasogastric tube insertion (2), superficial wound infection treated with oral antibiotics and local wound care (2), wound drainage and erythema (1), and pneumonia (1). Mean (SD) length of clinical and radiographic follow-up was 57.9 (36.3) months.
Table 4 summarizes the long-term complications. Of the 38 patients with long-term complications, 14 required reoperation. The indications were disc herniation (2 patients), painful instrumentation (7), crankshaft phenomenon (1), nonunion (1), and adjacent-level degeneration (3). Both disc herniations were at L5–S1, several segments below the distal extent of the fusion. Of the 7 patients who had painful instrumentation removed, 6 had the entire construct removed, and 1 had the proximal half of a rod taken out. The 3 patients with adjacent-level degeneration had stenosis at the distal end of the construct—at L5–S1 (2 patients) or L2–L3 (1 patient).
Mean (SD) time between surgery and completion of the surveys/questionnaires was 12.7 (3.2) years (range, 10-18 years). Mean age of respondents was 26.8 years. Twenty-five respondents (21%) were smokers. Mean (SD) outcome scores were 50.9 (9.4) for SF-12 PCS and 49.4 (10.2) for SF-12 MCS. Eighteen patients (15%) had SF-12 PCS scores 1 SD below normal, and 15 (13%) had SF-12 MCS scores 1 SD below normal. Mean (SD) SRS-22R Total score was 4.0 (0.7). Means, standard deviations, and distribution of SRS domain scores are summarized in Table 5. Of the variables, only current smoking (P < .001) was predictive of SRS-22R Total scores, accounting for 20% of their variability (Table 6).
One hundred patients (85%) had jobs, mostly desk jobs. The postoperative limitations most commonly reported are summarized in Table 7. These included at least intermittent back pain in 90 patients (76%), limited ROM in 52 (44%), and activity limitations in 54 (46%). Less common limitations were waistline imbalance in 41 (35%), rib prominence in 28 (24%), wound/scar problems in 18 (15%), and shortness of breath in 18 (15%). Other related medical problems were lung disease/asthma in 11 (9%), osteoarthritis/degenerative arthritis in 11 (9%), heart disease in 3 (3%), and high blood pressure in 2 (2%).
A minority of patients also participated in postoperative treatment regimens. The most common treatment was regular use of NSAIDs (25 patients, 21%). Other treatments were physical therapy (14, 12%), narcotic pain medication use (5, 4%), and epidural steroid injections (5, 4%). Table 8 summarizes the postoperative treatments used by patients with scoliosis.
Discussion
A major concern about prophylactic interventions for diseases is that the treatment will harm the patient. This is especially true for major spine surgery performed on adolescents with minimal symptoms. Although the incidence of perioperative complications in children undergoing corrective spinal surgery for AIS has been reported,30-32 the effect of the surgery on the disease-specific HR-QOL outcomes of these individuals as young adults has not been previously studied. Over the past few decades, a paradigm shift in understanding health and disability has occurred, with increased emphasis being placed on HR-QOL outcomes measures and understanding disability as relating to a measureable impact of the functioning of an individual after a change in health or environment. This change was substantiated when the World Health Organization endorsed the International Classification of Functioning, Disability and Health.33 In light of this shift, we present the disease-specific and general HR-QOL outcomes of young adults who had undergone surgical correction for spinal deformity during adolescence, as well as their associated complications and reoperations, in an attempt to identify targets for improvement.
Our patient-reported outcomes demonstrated a high incidence of occasional back pain, activity-related complaints, and limited ROM. Comparison of our cohort’s SRS-22R outcomes with previously published normative values for the unaffected adolescent population28,34 suggests worse scores for the disease-specific SRS-22R domains of pain and appearance. In 2012, Daubs and colleagues34 reported that normative scores on various SRS-22 domains were statistically lower with age (scores decreased from age 10 to age 19 years). Both Verma and colleagues28 and Daubs and colleagues34 reported lower scores for females than for males. Therefore, it is unclear whether the differences observed in our cohort may be accounted for by the larger proportion of females compared with the normative data.
General health scores on the SF-12 were similar to the population norm (mean [SD]) of 50 (10) referenced by Ware and colleagues.16 These findings suggest that, though pain and appearance may be statistically lower in our cohort—as measured with the SRS-22R—the cohort’s spine-related symptoms do not seem to lower its general health. Eighty-five percent of the patients were working at the time of the survey, further supporting a relatively normal level of overall function. In a retrospective review by Takayama and colleagues,9 similar results were found with regard to working after AIS fusion surgery. Of 32 patients treated surgically for scoliosis, at a mean of 21.1 years after the index fusion 27 (84.4%) were or had been engaged in various occupations without marked difficulty.
Our results in a cohort of patients with segmental instrumentation using hooks are similar to results in other studies of long-term HR-QOL measures in patients with AIS and Harrington rod instrumentation. Danielsson and Nachemson35 evaluated patients with surgically treated AIS with at least 20-year follow-up and reported that, in their surgical cohort with a mean age of 39.7 years, mean SF-36 PCS score was 50.9, and mean SF-36 MCS score was 50.2. In a recent study of patients with AIS and Harrington rod instrumentation, those of a mean age of 32.3 years had a mean score of 50.9 for both SF-36 PCS and SF-36 MCS.36
Regression analysis identified only smoking as a predictor of SRS-22R Total scores. This finding, that smokers have a lower health state, is expected even in the general population.37 Interestingly, bracing before surgery, Lenke type, surgery type, number of levels fused, lowest instrumented vertebra, incidence of perioperative complications, percentage curve correction, postoperative sagittal and coronal balance, and need for revision surgery did not influence HR-QOL measures in this cohort.
Our cohort’s incidence of occasional back pain was 76% (90/118 patients). Other reports have had similar findings. In 2012, Bas and colleagues38 studied self-reported pain in 126 consecutive patients with scoliosis and instrumented fusion. In their cohort, “most participants reported ‘no pain’ (38.5%) or ‘mild pain’ (30.8%) and 72.1% of participants reported a current work/school activity level of 100% normal.” Also in 2012, Rushton and Grevitt39 reported on a review and statistical analysis of the literature on HR-QOL in adolescents with untreated AIS and in unaffected adolescents. Their goal was to identify whether there were any differences in HR-QOL and, if so, whether they were clinically relevant. The authors concluded that pain and self-image tended to be statistically lower among cohorts with AIS but that only self-image was consistently different clinically between untreated patients with AIS and their unaffected peers.
Cosmetic complaints, though less common than functional concerns, affected a substantial percentage of our cohort. Waistline imbalance complaints were more common than rib prominence or scar-related complaints. The validity of patient-reported waistline imbalance is not known but may contribute to the SRS-22R outcomes in this cohort, particularly with regard to appearance scores. Respiratory symptoms, particularly those related to shortness of breath, were reported by 15% of patients. Respiratory symptoms may be in part secondary to underlying lung disease; smoking was reported by 21% of patients and asthma by 9%.
Few additional postoperative treatments were reported by patients. The most common treatment was regular use of NSAIDs (21%), followed by postoperative physical therapy (12%). Opiate medication use and spinal injections were rare—consistent with results reported by Danielsson and Nachemson35 in 2003.
Implant-related complaints, including painful instrumentation (13%) and implant prominence (9%), were some of the most common complaints in our study group. Although not all symptomatic instrumentation required surgical revision, 7 (50%) of the 14 additional spine surgeries were related to painful and/or prominent posterior instrumentation. Additional spine surgery was reported in 11.9% of our patients. Other indications for reoperation were disc herniation, crankshaft phenomenon, nonunion, and adjacent-level degeneration. Our rate of revision surgery is supported by the literature. In 2009, Luhmann and colleagues40 reported that 41 (3.9%) of 1057 primary spine fusions for idiopathic scoliosis required reoperation; the indications included infection (16/1057, 1.5%), pseudarthrosis (12, 1.1%), and painful/prominent implant (7, 0.7%). Richards and colleagues41 similarly reported on 1046 patients who underwent fusion for AIS. Of these patients, 135 underwent 172 repeat surgical interventions (12.9% reoperation rate), with 29 (21.5%) of the 135 undergoing 2 or more separate procedures. The most common reasons for reoperation were infection, symptomatic implant, and pseudarthrosis. The authors concluded that repeat surgeries were relatively common after the initial surgical procedures. Having a clearer understanding of instrumentation-related complaints and reoperations may lead to improvement in this surgeon-controlled variable.
There are limitations to this study. The data regarding clinical courses were collected by retrospective chart review, which has known limitations. To offset this, we collected prospective outcome data with use of the SF-12, the SRS-22R, and a spine-related complaints questionnaire. No control group was available for comparison of outcomes in our cohort. We used the SF-12 and previously published normative values for the SRS-22R for comparison with population norms. Such comparisons have inherent limitations, as the groups vary by sex and mean age; our cohort was primarily female and more than a decade older than the controls.
Only 35% of the patients who met the inclusion criteria had complete data that could be included in our analysis. Although there was no statistically significant difference in demographics between patients with and without follow-up data available, this low response rate could have introduced selection bias. Ideally, patients should have been seen in clinic, standing radiographs should have been taken, and pulmonary function tests should have been performed. However, these patients were asymptomatic, and ethical and insurance issues prevented those actions. Thus, any radiographic changes occurring over the intervening years, from the last clinic visit to completion of the surveys, were not documented. This situation may or may not have limited our findings, as other authors have found low correlation between radiographic outcomes and clinical outcome measures.13,14,19,36 During the period when these surgeries were performed, segmental spine instrumentation with hooks was the standard of care for deformity correction in AIS; therefore, all posterior instrumentations were done with hook-only segmental fixation. Current pedicle screw–based techniques that allow for additional correction of the deformity may provide different outcomes in the future.
We think that, despite the inherent limitations of this study, our data will be useful in the treatment of AIS. Our results suggest that postoperative spinal complaints are common and that, compared with an unaffected adolescent population, patients with AIS score significantly lower on pain and appearance domains of outcomes testing at a mean of 12.7 years after index fusion. Nevertheless, the outcomes do not seem to be of sufficient severity to affect general health and QOL as measured by outcomes testing.
Spinal deformity correction is performed to prevent impaired pulmonary function and spine-related disability later in life.42,43 Thus, longer-term studies, involving patients in their fifth and sixth decades of life, are needed to determine whether patients with AIS will have QOL outcomes, pulmonary function, and spine-related problems similar to those in the general population. In this cohort of young adults, smoking status was the only predictor of HR-QOL measures, and spinal deformity correction did not lead to decreased HR-QOL.
1. Tsutsui S, Pawelek J, Bastrom T, et al. Dissecting the effects of spinal fusion and deformity magnitude on quality of life in patients with adolescent idiopathic scoliosis. Spine. 2009;34(18):E653-E658.
2. Bonnett C, Brown JC, Cross B, Barron R. Posterior spinal fusion with Harrington rod instrumentation in 100 consecutive patients. Contemp Orthop. 1980;2:396-399.
3. Harrington PR, Dixon JR. An eleven year clinical investigation of Harrington instrument. Clin Orthop. 1973;(93):113-130.
4. Mielke CH, Lonstein JE, Denis F, Vandenbrink K, Winter RB. Surgical treatment of adolescent idiopathic scoliosis. A comparative analysis. J Bone Joint Surg Am. 1989;71(8):1170-1177.
5. Moskowitz A, Moe JH, Winter RB, Binner H. Long-term follow-up of scoliosis fusion. J Bone Joint Surg Am. 1980;62(3):529-554.
6. Akazawa T, Minami S, Kotani T, Nemoto T, Koshi T, Takahashi K. Health-related quality of life and low back pain of patients surgically treated for scoliosis after 21 years or more of follow-up: comparison among non-idiopathic scoliosis, idiopathic scoliosis, and healthy subjects. Spine. 2012;37(22):1899-1903.
7. Akazawa T, Minami S, Kotani T, Nemoto T, Koshi T, Takahashi K. Long-term clinical outcomes of surgery for adolescent idiopathic scoliosis 21 to 41 years later. Spine. 2012;37(5):402-405.
8. Pehrsson K, Bake B, Larsson S, Nachemson A. Lung function in adult idiopathic scoliosis: a 20 year follow up. Thorax. 1991;46(7):474-478.
9. Takayama K, Nakamura H, Matsuda H. Quality of life in patients treated surgically for scoliosis: longer than sixteen-year follow-up. Spine. 2009;34(20):2179-2184.
10. Weinstein SL, Dolan LA, Cheng JC, Danielsson A, Morcuende JA. Adolescent idiopathic scoliosis. Lancet. 2008;371(9623):1527-1537.
11. Westrick ER, Ward WT. Adolescent idiopathic scoliosis: 5-year to 20-year evidence-based surgical results. J Pediatr Orthop. 2011;31(1 suppl):S61-S68.
12. Asher MA, Lai SM, Glattes RC, Burton DC, Alanay A, Bago J. Refinement of the SRS-22 health-related quality of life questionnaire Function domain. Spine. 2006;31(5):593-597.
13. Asher M, Min Lai S, Burton D, Manna B. Scoliosis Research Society–22 patient questionnaire: responsiveness to change associated with surgical treatment. Spine. 2003;28(1):70-73.
14. Asher M, Min Lai S, Burton D, Manna B. The reliability and concurrent validity of the Scoliosis Research Society–22 patient questionnaire for idiopathic scoliosis. Spine. 2003;28(1):63-69.
15. Asher M, Min Lai S, Burton D, Manna B. Discrimination validity of the Scoliosis Research Society–22 patient questionnaire: relationship to idiopathic scoliosis curve pattern and curve size. Spine. 2003;28(1):74-78.
16. Ware J Jr, Kosinski M, Keller SD. A 12-item short-form health survey: construction of scales and preliminary tests of reliability and validity. Med Care. 1996;34(3):220-233.
17. Alanay A, Cil A, Berk H, et al. Reliability and validity of adapted Turkish version of Scoliosis Research Society–22 (SRS-22) questionnaire. Spine. 2005;30(21):2464-2468.
18. Beauséjour M, Joncas J, Goulet L, et al. Reliability and validity of adapted French Canadian version of Scoliosis Research Society outcomes questionnaire (SRS-22) in Quebec. Spine. 2009;34(6):623-628.
19. Climent JM, Bago J, Ey A, Perez-Grueso FJ, Izquierdo E. Validity of the Spanish version of the Scoliosis Research Society–22 (SRS-22) patient questionnaire. Spine. 2005;30(6):705-709.
20. Glowacki M, Misterska E, Laurentowska M, Mankowski P. Polish adaptation of Scoliosis Research Society–22 questionnaire. Spine. 2009;34(10):1060-1065.
21. Hashimoto H, Sase T, Arai Y, Maruyama T, Isobe K, Shouno Y. Validation of a Japanese version of the Scoliosis Research Society–22 patient questionnaire among idiopathic scoliosis patients in Japan. Spine. 2007;32(4):E141-E146.
22. Li M, Wang CF, Gu SX, et al. Adapted simplified Chinese (mainland) version of Scoliosis Research Society–22 questionnaire. Spine. 2009;34(12):1321-1324.
23. Monticone M, Carabalona R, Negrini S. Reliability of the Scoliosis Research Society–22 patient questionnaire (Italian version) in mild adolescent vertebral deformities. Eura Medicophys. 2004;40(3):191-197.
24. Niemeyer T, Schubert C, Halm HF, Herberts T, Leichtle C, Gesicki M. Validity and reliability of an adapted German version of Scoliosis Research Society–22 questionnaire. Spine. 2009;34(8):818-821.
25. Lai SM, Asher M, Burton D. Estimating SRS-22 quality of life measures with SF-36: application in idiopathic scoliosis. Spine. 2006;31(4):473-478.
26. Glattes RC, Burton DC, Lai SM, Frasier E, Asher MA. The reliability and concurrent validity of the Scoliosis Research Society–22R patient questionnaire compared with the Child Health Questionnaire–CF87 patient questionnaire for adolescent spinal deformity. Spine. 2007;32(16):1778-1784.
27. Blanke KM, Kuklo TR, Lenke LG, et al. Adolescent idiopathic scoliosis. In O’Brien MF, Kuklo TR, Blanke KM, Lenke LG, eds. Spinal Deformity Study Group Radiographic Measurement Manual. Memphis, TN: Medtronic; 2004.
28. Verma K, Lonner B, Hoashi JS, et al. Demographic factors affect Scoliosis Research Society–22 performance in healthy adolescents: a comparative baseline for adolescents with idiopathic scoliosis. Spine. 2010;35(24):2134-2139.
29. Baldus C, Bridwell KH, Harrast J, et al. Age-gender matched comparison of SRS instrument scores between adult deformity and normal adults: are all SRS domains disease specific? Spine. 2008;33(20):2214-2218.
30. Brown CA, Lenke LG, Bridwell KH, Geideman WM, Hasan SA, Blanke K. Complication of pediatric thoracolumbar and lumbar pedicle screws. Spine. 1998;23(14):1566-1571.
31. Coe JD, Arlet V, Donaldson W, et al. Complications in spinal fusion for adolescent idiopathic scoliosis in the new millennium. A report of the Scoliosis Research Society Morbidity and Mortality Committee. Spine. 2006;31(3):345-349.
32. Fu KM, Smith JS, Polly DW, et al. Scoliosis Research Society Morbidity and Mortality Committee. Morbidity and mortality associated with spinal surgery in children: a review of the Scoliosis Research Society morbidity and mortality database. J Neurosurg Pediatr. 2011;7(1):37-41.
33. World Health Organization. International Classification of Functioning, Disability and Health: ICF Short Version. Geneva, Switzerland: World Health Organization; 2001.
34. Daubs M, Lawrence B, Hung M, et al. Scoliosis Research Society–22 results in 3,052 healthy adolescents age ten to 19 years. Abstract presented at: 47th Annual Meeting and Course of the Scoliosis Research Society; September 5-8, 2012; Chicago, IL. Abstract 72.
35. Danielsson AL, Nachemson AL. Back pain and function 23 years after fusion for adolescent idiopathic scoliosis: a case–control study—part II. Spine. 2003;28(18):E373-E383.
36. Götze C, Liljenqvist UR, Slomka A, Götze HG, Steinbeck J. Quality of life and back pain: outcome 16.7 years after Harrington instrumentation. Spine. 2002;27(13):1456-1463.
37. Quercioli C, Messina G, Barbini E, Carriero G, Fanì M, Nante N. Importance of sociodemographic and morbidity aspects in measuring health-related quality of life: performances of three tools: comparison of three questionnaire scores. Eur J Health Econ. 2009;10(4):389-397.
38. Bas T, Franco N, Bas P, Bas JL. Pain and disability following fusion for idiopathic adolescent scoliosis: prevalence and associated factors. Evid Based Spine Care J. 2012;3(2):17-24.
39. Rushton PR, Grevitt MP. Comparison of untreated adolescent idiopathic scoliosis with normal controls: a review and statistical analysis of the literature. Spine. 2013;38(9):778-785.
40. Luhmann SJ, Lenke LG, Bridwell KH, Schootman M. Revision surgery after primary spine fusion for idiopathic scoliosis. Spine. 2009;34(20):2191-2197.
41. Richards BS, Hasley BP, Casey VF. Repeat surgical interventions following “definitive” instrumentation and fusion for idiopathic scoliosis. Spine. 2006;31(26):3018-3026.
42. Bjure J, Grimby G, Kasalický J, Lindh M, Nachemson A. Respiratory impairment and airway closure in patients with untreated idiopathic scoliosis. Thorax. 1970;25(4):451-456.
43. Haefeli M, Elfering A, Kilian R, Min K, Boos N. Nonoperative treatment for adolescent idiopathic scoliosis: a 10- to 60-year follow-up with special reference to health-related quality of life. Spine. 2006;31(3):355-366.
Calcipotriene 0.005%–Betamethasone Dipropionate 0.064% Ointment Versus Topical Suspension in the Treatment of Plaque Psoriasis: A Randomized Pilot Study of Patient Preference
Psoriasis is a chronic relapsing inflammatory skin and joint disease that affects 1% to 3% of the US population.1 In cases of mild to moderate disease, topical agents including corticosteroids, vitamin D analogues, and retinoids are the mainstay of therapy. The need for long-term treatment can be frustrating for patients and treatment adherence often is problematic, resulting in poor outcomes. Reported adherence rates to topical psoriasis treatments range from 27% to 73%.2-6
Topical agents for treatment of psoriasis are available in various formulations, including creams, lotions, gels, ointments, solutions, and shampoos. For topical psoriasis therapies, vehicle formulation plays a major role in both delivery of the active drug and treatment adherence. Patients often cite poor cosmetic characteristics (eg, product feels too sticky or greasy, product feels unpleasant/has a bad texture, product is too messy, product application is too time consuming/takes too long to rub in) as reasons for poor treatment adherence.2,6-9 Psoriasis patients tend to prefer formulations that are not as messy such as solutions and foams versus creams, gels, and ointments.10
Ointments have been favored by physicians for the treatment of psoriasis because of the belief that their occlusive properties result in greater potency; however, a systematic review of clinical trials of different formulations of clobetasol propionate did not find that ointments were more effective than other vehicles.11 Furthermore, if a patient finds an ointment to be cosmetically unacceptable, he/she will be less inclined to use the medication as prescribed, regardless of its potency.
The objective of this study was to conduct a preliminary assessment of patient preference for ointment versus topical suspension formulations of calcipotriene 0.005%–betamethasone dipropionate 0.064% for treatment of plaque psoriasis. The specific attributes that were found to be appealing or unappealing by participants for each formulation also were evaluated.
Methods
Study Design and Participants
This open-label, investigator-blinded, crossover, prospective, single-center study evaluated patient preference for ointment versus topical suspension formulations of calcipo-triene 0.005%–betamethasone dipropionate 0.064% in the treatment of plaque psoriasis. The study protocol was approved by the Wake Forest School of Medicine (Winston-Salem, North Carolina) institutional review board.
Participants were recruited from the Wake Forest School of Medicine dermatology clinic. Inclusion criteria included men and women with mild to moderate plaque-type psoriasis who were 18 years of age or older; participants also were required to have an investigator global assessment (IGA) score of 2 (mild) or 3 (moderate) on a 5-point scale and 1% to 10% body surface involvement on the trunk or extremities.
Exclusion criteria included use of a topical or systemic psoriasis treatment within 2 or 4 weeks of baseline, respectively. Women who were pregnant, breastfeeding, planning to become pregnant, or could potentially become pregnant and were not using a medically accepted form of contraception also were excluded from the study. Patients with other serious skin conditions or any other chronic medical conditions that were not well controlled also were considered ineligible.
As a pilot study, a sample size of 20 participants was needed based on available funding.
Assessments
At baseline, the diagnosis of plaque-type psoriasis in each participant was confirmed by the investigator. Each participant’s medical history was obtained and all prior and current medications were reviewed to ensure eligibility criteria were met. Female participants of childbearing potential also underwent a urine pregnancy test. Consent was obtained from all enrolled participants. Investigators assessed the severity of psoriasis at baseline using the IGA.
All participants then were randomized (1:1 randomization) for treatment with either calcipotriene 0.005%–betamethasone dipropionate 0.064% ointment or calcipotriene 0.005%–betamethasone dipropionate 0.064% topical suspension. A simple random sampling chart was prepared and used by the study staff to determine treatment group allotment. Participants were instructed to apply the assigned study drug to affected areas of the body, excluding the scalp, face, and intertriginous areas, once daily for 3 days. Participants and study staff were aware of the study product being used, while investigators remained blinded. Participants also were asked to maintain a daily medication diary noting when the medication was applied.
Participants returned on day 3 for crossover treatment. Participants were asked to complete a subjective participant preference survey and study staff reviewed concomitant medications and adverse events. The packaging for the initial study drug was collected and weighed, and the crossover drug was dispensed to each participant to be applied once daily for 3 days.
Participants returned on day 6 or 7 for follow-up and were again asked to complete the subjective participant preference survey; study staff reviewed concomitant medications and adverse events. The packaging for the crossover study drug was collected and weighed, and the participant’s medication diary also was collected.
Subjective Participant Preference Survey
The subjective participant preference survey consisted of 15 questions relating to the participant’s experience with the study drug (eg, how the product felt to touch, amount of greasiness, time it took to apply). The final survey question asked participants to rate the overall appeal of the vehicle. Participants responded to the questions using a 7-point grading scale (1=extremely unappealing; 4=neutral; 7=extremely appealing). Total preference scores could range from 15 to 105.
End Points
The primary end point was the mean total preference score for each study drug obtained from the subjective participant preference surveys. Secondary end points included median values for individual survey questions and treatment adherence, which was measured from self-reported medication diary entries.
Statistical Analysis
Participant characteristics were reported with percentages for dichotomous data and median and ranges for other data. Subjective participant preference survey scores were calculated by taking the mean (standard deviation [SD]) sum of the scores for each individual survey item for both products. A generalized linear model that accounted for possible carryover and period effects was used to compare the difference of individual participant scores for the 2 products using SAS software. The mean (SD) amount of product used was reported and correlated to the preference score using a Spearman rank correlation. Total and individual survey scores were compared between sexes using Wilcoxon rank sum tests.
Results
Participants were enrolled in and completed the study from January 2013 to March 2013. The Figure presents a diagram of the Consolidated Standards of Reporting Trials. Thirty patients were screened; 10 patients did not meet eligibility criteria. Twenty patients were enrolled in the study with 10 patients randomized to each study arm. All 20 participants completed the study.
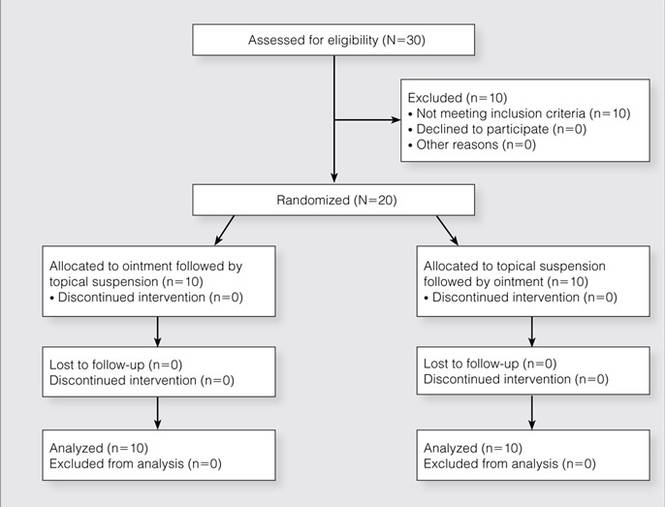
Participant demographics are described in Table 1. The median age was 48 years (range 29–64 years). The majority of participants were male (13/20) and white (18/20). The median IGA score was 3 (range, 2–3).
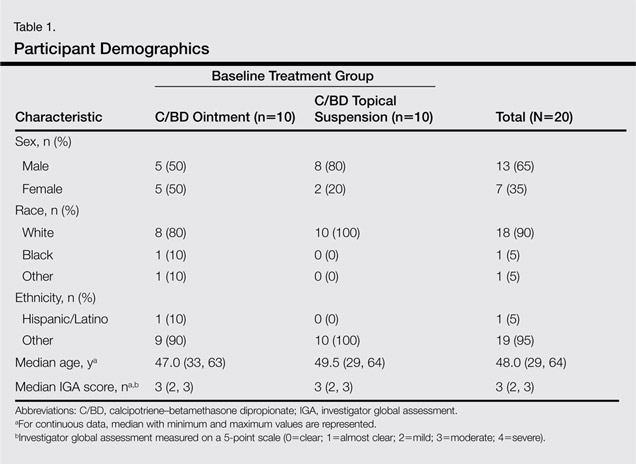
The mean (SD) total preference score for the calcipotriene 0.005%–betamethasone dipropionate 0.064% ointment formulation was 73.5 (19.4) and 80 (20.2) for the topical suspension formulation. The difference between means was -6.5 (95% confidence interval, -19.7-6.8; P=.32 after adjusting for possible carryover and period effects). Participants used a mean (SD) of 11 (11.4) g of product per study arm for the ointment formulation and 8.8 (6.6) g for the topical suspension formulation. There was no correlation between the amount of product used and preference for product (Spearman r=-0.01; P=.94). No statistically significant difference in product preference among men versus women was noted when considering total preference score or median scores of individual survey questions. Median overall appeal rating for the ointment formulation was 5 (slightly appealing) versus 6 (moderately appealing) for the topical suspension formulation, approaching statistical significance with P=.06 (Table 2). No significant carryover effects from one product to the other were noted (P=.64). The mean (SD) total preference scores were 81.1 (18.4) and 77.6 (21.2) in participants who used the topical suspension first followed by the ointment. In participants who used the ointment first followed by the topical suspension, the mean (SD) total preference scores were 69.4 (17.6) and 78.9 (22.8). Self-reported treatment adherence according to the participant’s daily medication diary was 100%.
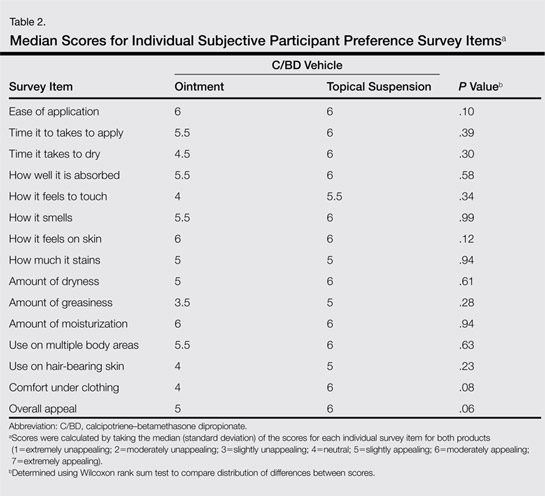
Adverse effects during the study included 1 report of neck and back muscle pain and 1 report of sinusitis; neither was considered to be related to the study drugs.
Comment
Psoriasis is a chronic disease that can be difficult to treat, and treatment compliance often is poor. Multiple topical agents often are needed for adequate disease control, and adherence can be an even greater hurdle than with monotherapy. Combination products such as calcipotriene–betamethasone dipropionate offer the potential advantage of once-daily application. Adherence to once-daily application regimens for treatment of psoriasis has been shown to be greater than twice-daily application (82% vs 44%).4 However, the vehicle may be an adherence barrier for some patients.
Calcipotriene 0.005%–betamethasone dipropionate 0.064% topical suspension originally was indicated for the treatment of psoriasis of the scalp; however, it is now also indicated for treatment of psoriasis of the body.12 This topical suspension formulation is less messy, which could potentially be more cosmetically appealing and useful for improving treatment adherence.
Overall, the participants in our small pilot study showed a preference for the topical suspension versus the ointment formulation. The difference was substantial but was not statistically significant. This result is consistent with a previous study in which patients were found to prefer solutions that were less greasy compared to messy sticky ointments.10 Although the topical suspension received a higher average rating from participants for how it felt to touch and how it felt under clothing than the ointment and the ointment was rated on average as more greasy (none of these individual items achieved statistical significance), the calcipotriene–betamethasone dipropionate ointment was still rated as slightly appealing overall (Table 2). This result supports the need for physicians to discuss individual patient preferences when choosing the most appropriate vehicle for topical psoriasis treatment.
In our study, participants were found to use less product during treatment with the topical suspension versus the ointment, likely because the topical suspension formulation is thinner and spreads easier; however, participants rated the ease of application of the 2 products equally (Table 2). Ease of application was rated moderately appealing and time to apply was rated slightly to moderately appealing, which is important because patients often cite these factors as barriers to treatment adherence.2,6,13
The occlusive properties of ointment formulations provide moisturization by preventing water loss, a property that can be desirable when treating psoriatic plaques. Unlike the ointment, which was formulated with petrolatum and mineral oil, the calcipotriene–betamethasone dipropionate topical suspension was formulated with hydrogenated castor oil and mineral oil to provide moisturization. Nevertheless, participants found both the ointment and topical suspension to be moderately appealing (median score, 6; P=.94) for moisturization.
Limitations of this pilot study include the small sample size, which restricted the extent of subgroup analyses and the generalizability of our results. The small sample size also may or may not have contributed to the lack of statistical significance in the majority of the outcomes. This study provides pilot data that can be used to define a larger study; however, we do not think that a larger study is needed, as patients can be offered both vehicles in a practical clinical setting and can choose the product that is right for them. The short treatment duration of 3 days for each formulation also is a limitation, as a patient’s preference may change over time with longer use of the product. Treatment efficacy, which was not measured in this study, also could have an effect on patient preference, which could be assessed over a longer treatment period. Additionally, the study drugs may not be representative of all ointments or topical suspensions in their cosmetic appeal.
Conclusion
In this small cohort of plaque psoriasis patients, a calcipotriene–betamethasone dipropionate topical suspension was preferred over an ointment formulation, but in clinical practice it may be best to allow patients to choose the vehicle formulation that is most desirable on an individual basis. The topical suspension provides clinicians with an alternative that not only has the benefits of a combination product but also has been found to be appealing to patients.
1. Parisi R, Symmons DP, Griffiths CE, et al. Global epidemiology of psoriasis: a systematic review of incidence and prevalence. J Invest Dermatol. 2013;133:377-385.
2. Brown KK, Rehmus WE, Kimball AB. Determining the relative importance of patient motivations for nonadherence to topical corticosteroid therapy in psoriasis. J Am Acad Dermatol. 2006;55:607-613.
3. Carroll CL, Feldman SR, Camacho FT, et al. Adherence to topical therapy decreases during the course of an 8-week psoriasis clinical trial: commonly used methods of measuring adherence to topical therapy overestimate actual use. J Am Acad Dermatol. 2004;51:212-216.
4. Zaghloul SS, Goodfield MJ. Objective assessment of compliance with psoriasis treatment. Arch Dermatol. 2004;140:408-414.
5. Richards HL, Fortune DG, O’Sullivan TM, et al. Patients with psoriasis and their compliance with medication. J Am Acad Dermatol. 1999;41:581-583.
6. Fouere S, Adjadj L, Pawin H. How patients experience psoriasis: results from a European survey. J Eur Acad Dermatol Venereol. 2005;19:S2-S6.
7. van de Kerkhof PC, Steegers-Theunissen RP, Kuipers MV. Evaluation of topical drug treatment in psoriasis. Dermatology. 1998;197:31-36.
8. Devaux S, Castela A, Archier E, et al. Adherence to topical treatment in psoriasis: a systematic literature review. J Eur Acad Dermatol Venereol. 2012;26(suppl 3):S61-S67.
9. Chan SA, Hussain F, Lawson LG, et al. Factors affecting adherence to treatment of psoriasis: comparing biologic therapy to other modalities. J Dermatolog Treat. 2013;24:64-69.
10. Housman TS, Mellen BG, Rapp SR, et al. Patients with psoriasis prefer solution and foam vehicles: a quantitative assessment of vehicle preference. Cutis. 2002;70:327-332.
11. Warino L, Balkrishnan R, Feldman SR. Clobetasol propionate for psoriasis: are ointments really more potent? J Drugs Dermatol. 2006;5:527-532.
12. Menter A, Gold LS, Bukhalo M, et al. Calcipotriene plus betamethasone dipropionate topical suspension for the treatment of mild to moderate psoriasis vulgaris on the body: a randomized, double-blind, vehicle-controlled trial. J Drugs Dermatol. 2013;12:92-98.
13. Krueger G, Koo J, Lebwohl M, et al. The impact of psoriasis on quality of life: results of a 1998 National Psoriasis Foundation patient-membership survey. Arch Dermatol. 2001;137:280-284.
Psoriasis is a chronic relapsing inflammatory skin and joint disease that affects 1% to 3% of the US population.1 In cases of mild to moderate disease, topical agents including corticosteroids, vitamin D analogues, and retinoids are the mainstay of therapy. The need for long-term treatment can be frustrating for patients and treatment adherence often is problematic, resulting in poor outcomes. Reported adherence rates to topical psoriasis treatments range from 27% to 73%.2-6
Topical agents for treatment of psoriasis are available in various formulations, including creams, lotions, gels, ointments, solutions, and shampoos. For topical psoriasis therapies, vehicle formulation plays a major role in both delivery of the active drug and treatment adherence. Patients often cite poor cosmetic characteristics (eg, product feels too sticky or greasy, product feels unpleasant/has a bad texture, product is too messy, product application is too time consuming/takes too long to rub in) as reasons for poor treatment adherence.2,6-9 Psoriasis patients tend to prefer formulations that are not as messy such as solutions and foams versus creams, gels, and ointments.10
Ointments have been favored by physicians for the treatment of psoriasis because of the belief that their occlusive properties result in greater potency; however, a systematic review of clinical trials of different formulations of clobetasol propionate did not find that ointments were more effective than other vehicles.11 Furthermore, if a patient finds an ointment to be cosmetically unacceptable, he/she will be less inclined to use the medication as prescribed, regardless of its potency.
The objective of this study was to conduct a preliminary assessment of patient preference for ointment versus topical suspension formulations of calcipotriene 0.005%–betamethasone dipropionate 0.064% for treatment of plaque psoriasis. The specific attributes that were found to be appealing or unappealing by participants for each formulation also were evaluated.
Methods
Study Design and Participants
This open-label, investigator-blinded, crossover, prospective, single-center study evaluated patient preference for ointment versus topical suspension formulations of calcipo-triene 0.005%–betamethasone dipropionate 0.064% in the treatment of plaque psoriasis. The study protocol was approved by the Wake Forest School of Medicine (Winston-Salem, North Carolina) institutional review board.
Participants were recruited from the Wake Forest School of Medicine dermatology clinic. Inclusion criteria included men and women with mild to moderate plaque-type psoriasis who were 18 years of age or older; participants also were required to have an investigator global assessment (IGA) score of 2 (mild) or 3 (moderate) on a 5-point scale and 1% to 10% body surface involvement on the trunk or extremities.
Exclusion criteria included use of a topical or systemic psoriasis treatment within 2 or 4 weeks of baseline, respectively. Women who were pregnant, breastfeeding, planning to become pregnant, or could potentially become pregnant and were not using a medically accepted form of contraception also were excluded from the study. Patients with other serious skin conditions or any other chronic medical conditions that were not well controlled also were considered ineligible.
As a pilot study, a sample size of 20 participants was needed based on available funding.
Assessments
At baseline, the diagnosis of plaque-type psoriasis in each participant was confirmed by the investigator. Each participant’s medical history was obtained and all prior and current medications were reviewed to ensure eligibility criteria were met. Female participants of childbearing potential also underwent a urine pregnancy test. Consent was obtained from all enrolled participants. Investigators assessed the severity of psoriasis at baseline using the IGA.
All participants then were randomized (1:1 randomization) for treatment with either calcipotriene 0.005%–betamethasone dipropionate 0.064% ointment or calcipotriene 0.005%–betamethasone dipropionate 0.064% topical suspension. A simple random sampling chart was prepared and used by the study staff to determine treatment group allotment. Participants were instructed to apply the assigned study drug to affected areas of the body, excluding the scalp, face, and intertriginous areas, once daily for 3 days. Participants and study staff were aware of the study product being used, while investigators remained blinded. Participants also were asked to maintain a daily medication diary noting when the medication was applied.
Participants returned on day 3 for crossover treatment. Participants were asked to complete a subjective participant preference survey and study staff reviewed concomitant medications and adverse events. The packaging for the initial study drug was collected and weighed, and the crossover drug was dispensed to each participant to be applied once daily for 3 days.
Participants returned on day 6 or 7 for follow-up and were again asked to complete the subjective participant preference survey; study staff reviewed concomitant medications and adverse events. The packaging for the crossover study drug was collected and weighed, and the participant’s medication diary also was collected.
Subjective Participant Preference Survey
The subjective participant preference survey consisted of 15 questions relating to the participant’s experience with the study drug (eg, how the product felt to touch, amount of greasiness, time it took to apply). The final survey question asked participants to rate the overall appeal of the vehicle. Participants responded to the questions using a 7-point grading scale (1=extremely unappealing; 4=neutral; 7=extremely appealing). Total preference scores could range from 15 to 105.
End Points
The primary end point was the mean total preference score for each study drug obtained from the subjective participant preference surveys. Secondary end points included median values for individual survey questions and treatment adherence, which was measured from self-reported medication diary entries.
Statistical Analysis
Participant characteristics were reported with percentages for dichotomous data and median and ranges for other data. Subjective participant preference survey scores were calculated by taking the mean (standard deviation [SD]) sum of the scores for each individual survey item for both products. A generalized linear model that accounted for possible carryover and period effects was used to compare the difference of individual participant scores for the 2 products using SAS software. The mean (SD) amount of product used was reported and correlated to the preference score using a Spearman rank correlation. Total and individual survey scores were compared between sexes using Wilcoxon rank sum tests.
Results
Participants were enrolled in and completed the study from January 2013 to March 2013. The Figure presents a diagram of the Consolidated Standards of Reporting Trials. Thirty patients were screened; 10 patients did not meet eligibility criteria. Twenty patients were enrolled in the study with 10 patients randomized to each study arm. All 20 participants completed the study.
Participant demographics are described in Table 1. The median age was 48 years (range 29–64 years). The majority of participants were male (13/20) and white (18/20). The median IGA score was 3 (range, 2–3).
The mean (SD) total preference score for the calcipotriene 0.005%–betamethasone dipropionate 0.064% ointment formulation was 73.5 (19.4) and 80 (20.2) for the topical suspension formulation. The difference between means was -6.5 (95% confidence interval, -19.7-6.8; P=.32 after adjusting for possible carryover and period effects). Participants used a mean (SD) of 11 (11.4) g of product per study arm for the ointment formulation and 8.8 (6.6) g for the topical suspension formulation. There was no correlation between the amount of product used and preference for product (Spearman r=-0.01; P=.94). No statistically significant difference in product preference among men versus women was noted when considering total preference score or median scores of individual survey questions. Median overall appeal rating for the ointment formulation was 5 (slightly appealing) versus 6 (moderately appealing) for the topical suspension formulation, approaching statistical significance with P=.06 (Table 2). No significant carryover effects from one product to the other were noted (P=.64). The mean (SD) total preference scores were 81.1 (18.4) and 77.6 (21.2) in participants who used the topical suspension first followed by the ointment. In participants who used the ointment first followed by the topical suspension, the mean (SD) total preference scores were 69.4 (17.6) and 78.9 (22.8). Self-reported treatment adherence according to the participant’s daily medication diary was 100%.
Adverse effects during the study included 1 report of neck and back muscle pain and 1 report of sinusitis; neither was considered to be related to the study drugs.
Comment
Psoriasis is a chronic disease that can be difficult to treat, and treatment compliance often is poor. Multiple topical agents often are needed for adequate disease control, and adherence can be an even greater hurdle than with monotherapy. Combination products such as calcipotriene–betamethasone dipropionate offer the potential advantage of once-daily application. Adherence to once-daily application regimens for treatment of psoriasis has been shown to be greater than twice-daily application (82% vs 44%).4 However, the vehicle may be an adherence barrier for some patients.
Calcipotriene 0.005%–betamethasone dipropionate 0.064% topical suspension originally was indicated for the treatment of psoriasis of the scalp; however, it is now also indicated for treatment of psoriasis of the body.12 This topical suspension formulation is less messy, which could potentially be more cosmetically appealing and useful for improving treatment adherence.
Overall, the participants in our small pilot study showed a preference for the topical suspension versus the ointment formulation. The difference was substantial but was not statistically significant. This result is consistent with a previous study in which patients were found to prefer solutions that were less greasy compared to messy sticky ointments.10 Although the topical suspension received a higher average rating from participants for how it felt to touch and how it felt under clothing than the ointment and the ointment was rated on average as more greasy (none of these individual items achieved statistical significance), the calcipotriene–betamethasone dipropionate ointment was still rated as slightly appealing overall (Table 2). This result supports the need for physicians to discuss individual patient preferences when choosing the most appropriate vehicle for topical psoriasis treatment.
In our study, participants were found to use less product during treatment with the topical suspension versus the ointment, likely because the topical suspension formulation is thinner and spreads easier; however, participants rated the ease of application of the 2 products equally (Table 2). Ease of application was rated moderately appealing and time to apply was rated slightly to moderately appealing, which is important because patients often cite these factors as barriers to treatment adherence.2,6,13
The occlusive properties of ointment formulations provide moisturization by preventing water loss, a property that can be desirable when treating psoriatic plaques. Unlike the ointment, which was formulated with petrolatum and mineral oil, the calcipotriene–betamethasone dipropionate topical suspension was formulated with hydrogenated castor oil and mineral oil to provide moisturization. Nevertheless, participants found both the ointment and topical suspension to be moderately appealing (median score, 6; P=.94) for moisturization.
Limitations of this pilot study include the small sample size, which restricted the extent of subgroup analyses and the generalizability of our results. The small sample size also may or may not have contributed to the lack of statistical significance in the majority of the outcomes. This study provides pilot data that can be used to define a larger study; however, we do not think that a larger study is needed, as patients can be offered both vehicles in a practical clinical setting and can choose the product that is right for them. The short treatment duration of 3 days for each formulation also is a limitation, as a patient’s preference may change over time with longer use of the product. Treatment efficacy, which was not measured in this study, also could have an effect on patient preference, which could be assessed over a longer treatment period. Additionally, the study drugs may not be representative of all ointments or topical suspensions in their cosmetic appeal.
Conclusion
In this small cohort of plaque psoriasis patients, a calcipotriene–betamethasone dipropionate topical suspension was preferred over an ointment formulation, but in clinical practice it may be best to allow patients to choose the vehicle formulation that is most desirable on an individual basis. The topical suspension provides clinicians with an alternative that not only has the benefits of a combination product but also has been found to be appealing to patients.
1. Parisi R, Symmons DP, Griffiths CE, et al. Global epidemiology of psoriasis: a systematic review of incidence and prevalence. J Invest Dermatol. 2013;133:377-385.
2. Brown KK, Rehmus WE, Kimball AB. Determining the relative importance of patient motivations for nonadherence to topical corticosteroid therapy in psoriasis. J Am Acad Dermatol. 2006;55:607-613.
3. Carroll CL, Feldman SR, Camacho FT, et al. Adherence to topical therapy decreases during the course of an 8-week psoriasis clinical trial: commonly used methods of measuring adherence to topical therapy overestimate actual use. J Am Acad Dermatol. 2004;51:212-216.
4. Zaghloul SS, Goodfield MJ. Objective assessment of compliance with psoriasis treatment. Arch Dermatol. 2004;140:408-414.
5. Richards HL, Fortune DG, O’Sullivan TM, et al. Patients with psoriasis and their compliance with medication. J Am Acad Dermatol. 1999;41:581-583.
6. Fouere S, Adjadj L, Pawin H. How patients experience psoriasis: results from a European survey. J Eur Acad Dermatol Venereol. 2005;19:S2-S6.
7. van de Kerkhof PC, Steegers-Theunissen RP, Kuipers MV. Evaluation of topical drug treatment in psoriasis. Dermatology. 1998;197:31-36.
8. Devaux S, Castela A, Archier E, et al. Adherence to topical treatment in psoriasis: a systematic literature review. J Eur Acad Dermatol Venereol. 2012;26(suppl 3):S61-S67.
9. Chan SA, Hussain F, Lawson LG, et al. Factors affecting adherence to treatment of psoriasis: comparing biologic therapy to other modalities. J Dermatolog Treat. 2013;24:64-69.
10. Housman TS, Mellen BG, Rapp SR, et al. Patients with psoriasis prefer solution and foam vehicles: a quantitative assessment of vehicle preference. Cutis. 2002;70:327-332.
11. Warino L, Balkrishnan R, Feldman SR. Clobetasol propionate for psoriasis: are ointments really more potent? J Drugs Dermatol. 2006;5:527-532.
12. Menter A, Gold LS, Bukhalo M, et al. Calcipotriene plus betamethasone dipropionate topical suspension for the treatment of mild to moderate psoriasis vulgaris on the body: a randomized, double-blind, vehicle-controlled trial. J Drugs Dermatol. 2013;12:92-98.
13. Krueger G, Koo J, Lebwohl M, et al. The impact of psoriasis on quality of life: results of a 1998 National Psoriasis Foundation patient-membership survey. Arch Dermatol. 2001;137:280-284.
Practice Points
- Patient preference plays an important role in adherence to treatment regimens in chronic skin diseases such as psoriasis.
- The topical suspension formulation of calcipotriene 0.005%–betamethasone dipropionate 0.064% was preferred by psoriasis patients over the ointment; however, the availability of the 2 formulations provides patients with options and allows them to choose which product they prefer.
Mutual Alignment Trumps Merger for Joint VA/DoD Health Care Programs
The VA and the DoD operate completely independent health care systems. Integrated provision of health care for the populations served is a compellingly attractive goal given the obvious overlaps, but has proven deceptively difficult to implement.
Despite efforts begun in 1998 to accomplish a reliable, comprehensive, bidirectional exchange of patient-specific health care information between systems, 16 years later this has yet to be reliably available. In most locales, VHA practitioners cannot easily access details of the medical care provided to DoD personnel. Attempts to merge the 2 electronic medical record (EMR) systems have also been fraught with difficulty.1 Even at the new, joint VHA/DoD Captain James A. Lovell Federal Health Care Center in North Chicago, Illinois (which opened in October 2010 to serve a mix of active-duty servicemen, TRICARE beneficiaries, and VA enrollees under a single roof), care using a single EMR system has not been possible.
The Institute of Medicine, in an invited review, has specifically criticized the unsatisfactory, piecemeal EMR integration.2 On February 5, 2013, the Secretary of the VA and the Secretary of Defense formally abandoned efforts to construct a single VA/DoD integrated EMR system by 2017. Instead, both organizations would, in then Secretary of Defense Leon Panetta’s words, “…focus our immediate efforts on integrating VA and DoD health data as quickly as possible, by focusing on interoperability and using existing solutions.”3
Joint VA/DoD health care programs in Northern California have abandoned merged structures in favor of mutual alignment. The practical value of aligning care systems is to extract benefit from structured, economically rational, win-win collaborations, as opposed to the forced merger approach. Mutual alignment generates relatively prompt, reliable results, to the benefit of all concerned.
Related: Developing Joint VA and DoD Health Programs
This report details a consistently favorable experience with this philosophy, which has considerable relevance as federal and nonfederal systems explore future joint ventures. Specifically, this report describes the substantial multiyear savings from a combination of various DoD/VA Joint Incentive Fund (JIF) and Sharing Agreement projects conducted by the VA Northern California Health Care System (VANCHCS) and the U.S. Air Force (USAF) 60th Medical Group’s (60MDG’s) David Grant Medical Center (DGMC).
Background and Methods
VA Northern California Health Care System currently serves 92,000 unique veteran patients in a service area of 40,000 square miles through a network of facilities and clinics at 9 sites across northern California. Rapid year-over-year growth of VANCHCS continues, and in fiscal year (FY) 2013, so-called unique enrolled veterans increased by 4.7%. David Grant Medical Center is a 116-bed DoD flagship hospital at Travis Air Force Base in Fairfield, California, which is home to the 60MDG. In 2013, VANCHCS and DGMC celebrated the 20th year of collaborative projects.
Congressional mandates encompassed in sections 101, 1701, 1782, 1783, and 8111 of Title 38, United States Code, as well as sections 1074, 1079, 1086, 1104, and Chapter 61 of Title 10, United States Code, have been addressed through a variety of DoD and VA Health Care Resource Sharing Program directives. The most recent instruction covering these agreements was reissued on January 23, 2012 (DoD instruction 6010.23). Sharing Agreements and joint ventures are permitted when such arrangements “…will improve access to quality health care or increase cost-effectiveness of the health care provided … to beneficiaries of both departments.” A Joint Executive Council (JEC), co-chaired by the VA Deputy Secretary and the DoD Acting Under Secretary of Defense for Personnel and Readiness, oversees joint VA/DoD activities.
The collaborative initiatives described in this article have all blossomed into sustainable, ongoing, valuable programs. Aided by JIF grants, they transitioned to standard VHA and DoD budgetary mechanisms in the third year of operation. For the VHA, such ongoing funding is accomplished through the Veterans Equitable Resource Allocation (VERA) budgeting system. Despite overall national/regional advantages, this funding model can result in substantial fiscal pressure for rapidly growing VHA systems, such as VANCHCS. DoD facilities and deployable operational teams, such as the 60MDG, are funded through separate DoD mechanisms. TRICARE services are funded through an entirely different budget. The complexities of this process preclude easy summary in this paper.
Recognizing that new collaborative initiatives inevitably add fiscal stress to involved facilities, the JEC has periodically offered 2-year competitive grant funding on a national basis to support winning proposals. Such JIF grants offer financial support to initiate potentially value-added collaborations. The VHA and DoD equally fund the annual award pool for these JIF grants. In response to periodic solicitations, VHA facilities team with DoD partners to jointly submit concept proposals.
Proposals emerging from separate review, revision, and approval by VHA/VA and USAF/DoD leadership are subjected to a rigorous business case analysis. The JEC then competitively scores the proposals according to transparent weighted criteria. High-scoring proposals enjoy support for renovation, equipment, and personnel for a transition period of 2 years. In the third year of ongoing operation, VHA funding (ie, VERA funding) and DoD funding, sometimes modified by a specific Memoranda of Understanding, pay for the third year, based on the workload during the first year of the program. As a result of third-year reimbursement based on previous volume and care provided, productivity under any new JIF-funded program is financially incentivized from day 1.
Each JIF proposal enumerates specific workload targets and time lines. In northern California, at quarterly intervals, a local VANCHCS-DGMC Joint Venture Executive Management Team (EMT) formally reviews clinical and financial metrics. This local EMT also reports results to the national-level JEC. Clinical metrics for most programs include visit count, consult count, procedure count, and the number of individuals treated in a given year, with breakdown tallies according to patients’ VA or DoD affiliation. Financial metrics include personnel costs, equipment costs, and revenue generated or saved. Savings for VHA patients can be calculated using CPT codes, Diagnosis Related Groups (DRG), and set CHAMPUS Maximum Allowable Charge (CMAC) rates, as calculated by the TRICARE Management Calculator (TMA Calculator).
Personnel serving in joint, integrated programs remain employees of either VHA or DoD, according to the staffing plan specified in the original JIF grant. Beyond the 2-year term of the original JIF grant, VANCHCS and DGMC can jointly adjust/expand staffing to meet increasing demand and programmatic needs. Personnel in joint programs work side by side and treat patients equally regardless of VA or DoD affiliation.
By agreement, EMR orders and EMR patient care documentation are entered according to norms for the organization where the care is delivered (usually DGMC for new inpatient programs). This facilitates identical treatment of patients in JIF programs. However, specific accommodations for inadequate cross talk between VHA and DoD EMR systems have proven necessary. Such accommodations have added cost, but not to a degree that jeopardizes any particular venture.
Findings
The mutual alignment approach shows a uniformly favorable 9-year experience with 9 joint VA/DoD clinical programs initiated through JIF grants totaling $29.6 million. Formal JIF closeout reports at the 2-year mark are available for 5 programs and document positive return on investment (ROI) for all programs averaging 83%.
The Joint Neurosurgery Program, planned through a 2005 JIF grant and implemented in 2006, offers a practical example of mutual alignment at work. Pre-JIF, both organizations had limited neurosurgery capability. War-related deployments undermined DGMC service, and ongoing community care expenses beyond $1.5 million per year for DoD beneficiaries seemed inevitable. VANCHCS in 2004-2005 referred nearly all cases to either neighboring VA systems or to community hospitals, suffering both lost VERA revenue on one hand and direct cost on the other. Unreliable care, long wait times, inefficiency, and dissatisfaction plagued the arrangements, which the staff at VANCHCS considered unacceptable.
Combining forces to provide better care made sense, but reorganizing for a fully merged Neurosurgical Service revealed daunting roadblocks. Eventually, merger frustration conceived a more productive, outcome-oriented, practical philosophy: mutual alignment. We recognized that minimizing change, flexibly capitalizing on opportunity, and reinforcing areas of strength could best achieve mutual joint goals. This mind-set facilitated speedy program assembly, in a “can do” collaborative atmosphere, and with gratifyingly little disruption.
Joint Neurosurgery JIF
The joint Neurosurgery JIF fused outpatient clinics to 1 hub location (a VA clinic adjacent to DGMC), left VA and DoD EMR arrangements intact, and established a single site (DGMC) for inpatient neurosurgical procedures. Dual-trained practitioners accessed both DoD and VA EMR systems, often using side-by-side computer stations. Inpatient work, by mutual agreement, used the DoD EMR exclusively. On inpatient discharge, however, a duplicate care summary was entered into the VHA CPRS EMR system.
Using JIF grants, a sophisticated image-guided surgery system was installed at DGMC, an underused operating room (OR) at DGMC was dedicated to neurosurgery, instruments were purchased, and VA nurses were hired to augment OR/ward/intensive care unit staffing at DGMC to support neurosurgical needs. The 3-year neurosurgery JIF budget totaled $5.5 million, 90% of which was dedicated to salaries for additional personnel to expand the service at DGMC. Deliverables included volume increases of 1,100 neurosurgical consultations per year, and at least 100 major procedures per year.
At the completion of the first 3 years of operation, the final report of the JIF noted a 12% ROI. In the post-JIF sustainment years, as joint volume increased further, the program added an additional VA neurosurgeon, a physician assistant, and other staff. Volume has steadily expanded, with 318 major neurosurgical procedures completed in FY 2013. In maintenance mode, consultations remain essentially free to each organization; VANCHCS is reimbursed for salary/benefits for hospital-based VHA personnel working at DGMC; and DGMC charges VANCHCS 75% of CMAC rates for the inpatient care delivered. The arrangement remains financially desirable for both organizations. For FY 2013 the joint relationship in neurosurgery generated a 22% ROI, saving taxpayers nearly $1 million per year. Most important, patients received prompt, excellent care. Waiting times for elective consults were routinely < 14 days, emergency care was reliably available, outcomes were excellent, and satisfaction at all levels have vastly improved.
Measuring Program Success
The funded and implemented JIF programs have all been successful, with positive ROI ranging from 10% to 284% (Table 1). Newer programs lacking a final closeout report are all on track for positive ROI. One additional JIF program, for a joint hematology-oncology center, was delayed by staffing challenges but has now commenced.
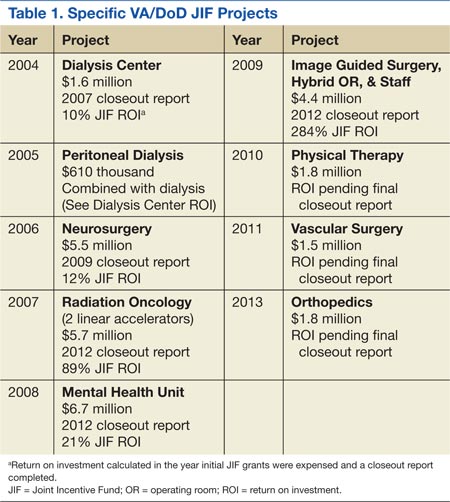
Over the past 7 years, outpatient volume and services provided by DGMC have increased. Outpatient support services provided by VANCHCS for DoD personnel at remote sites, while still substantial, diminished (Figures 1 and 2). Such changes reflect intentional concentration at DGMC. Also, a VHA pharmacy service provided to USAF personnel at a site distant from DGMC was intentionally downsized to embrace a mailed-medication program.
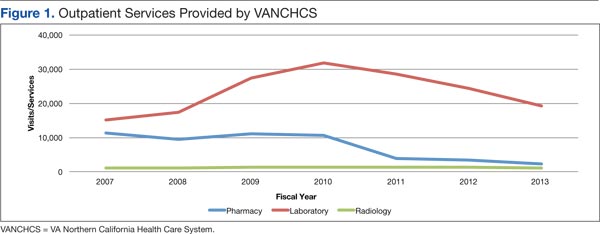
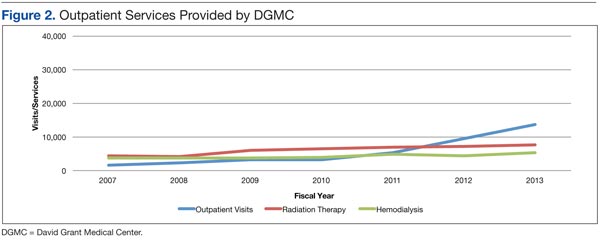
Inpatient hospital discharges for VHA enrollees and bed-days of care at DGMC have increased substantially (Figure 3). As a result of sharing programs and JIF programs, VHA enrollees currently account for about 40% of total hospital census at DGMC. About 108 professionals paid by VANCHCS currently work at DGMC. In most cases, as formalized in specific post-JIF sustainment agreements, VANCHCS is reimbursed for clinical staff salary and benefits if such staff are working at DGMC within a JIF program. For inpatient and procedural care, unless charges are specifically excluded as part of specific JIF agreements, VANCHCS pays DGMC at a rate of 75% of CMAC (ie, about 75% of Medicare rates) for every admission. Given geographic constraints, a VHA mandate to keep waits for specialty care under 14 days, and finite assistance levels from other VAMCs in VISN 21, a majority of these cases would otherwise be treated in community fee programs (at a higher cost of 100% of CMAC plus professional fees).
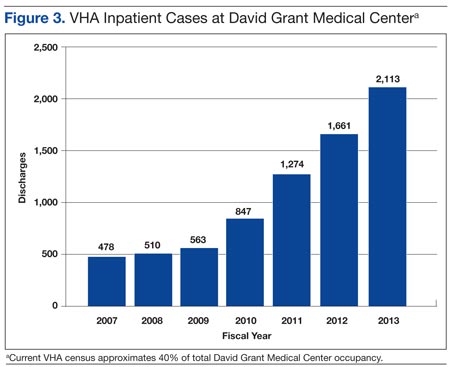
Volume has grown in all such programs (Table 2). Growth in the category of “open cardiac procedures,” however, has been intentionally limited by a VISN 21 requirement that care for VHA patients be provided only when existing VISN 21 cardiac programs cannot accommodate a particular case.
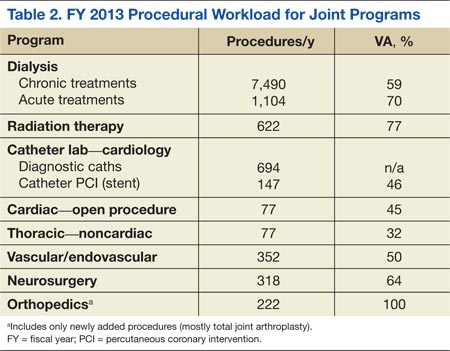
Since FY 2011, as a result of improved analytics, VANCHCS has been able to calculate its global savings (cost avoidance) stemming from all JIF and other sharing programs. Calculating the difference between community fee cost and DGMC cost as about 25% of CMAC (which offers a floor estimate of actual savings), these ongoing programs now save the VANCHCS $7.78 million per year (Table 3).
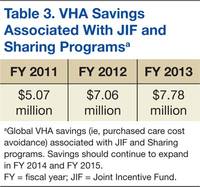
Positive overall federal ROI (ie, ROI from the taxpayer’s perspective), measured in dollars, is reported at the end of year 3 for every JIF-funded program. Substantial additional ROI could be captured by other metrics, such as timeliness of care and patient satisfaction, and would be favorable for all listed programs (data not shown).
Discussion
Had VANCHCS and DGMC attempted a merged information and management structure for the JIF programs, implementation would have been seriously delayed, if not entirely thwarted. Instead, by explicitly aligning efforts around each organization’s existing capabilities, assets and attributes, new valuable services were quickly developed. Patients now receive high-quality treatment in specialty areas not previously offered (and in some instances, not previously offered by either system).
As noted previously, the DoD and the VHA health care systems vary considerably. For DGMC and the 60MDG, during a time of war, optimal triage practices, safe/speedy transport, and the reliable delivery of appropriate trauma care for the injured warrior represent core missions. The VHA, on the other hand, is dedicated to the well-being, health, and lifetime medical-surgical care of enrolled veterans. The VHA population has relatively high numbers of elderly patients with serious chronic health conditions, such as heart disease, vascular disease, and cancer. VHA also provides subacute and rehabilitative care for younger veterans who served more recently in Iraq and Afghanistan. Overall, the VHA population stands quite distinct from that of our young active-duty forces and their dependents.
The VHA patient population (6.3 million patients receiving treatment and over 8.7 million enrolled) greatly exceeds that of the DoD. For this and other reasons, experience, current skills, and training differ considerably between VHA and DoD practitioners. For active-duty DoD practitioners, especially surgeons, the JIF projects provide avenues for development/maintenance of skills. Further, the JIF-enabled influx of VHA personnel at DGMC enhances staffing at DGMC, thereby improving the capacity of DGMC and the 60MDG’s potential surge capacity. Finally, ongoing joint programs have fostered provider relationships, academic opportunities, and training for DoD personnel between deployments.
The effort also helps personnel satisfy new, quantitative, procedural volume standards (aka currency standards) for DoD/USAF surgeons. For VANCHCS, which is seriously pressed for acute inpatient capacity, the DGMC facility space and beds supporting the joint programs represent an attractive alternative to other options, such as new hospital construction, distant transfers, or reliance on community care (Table 4).
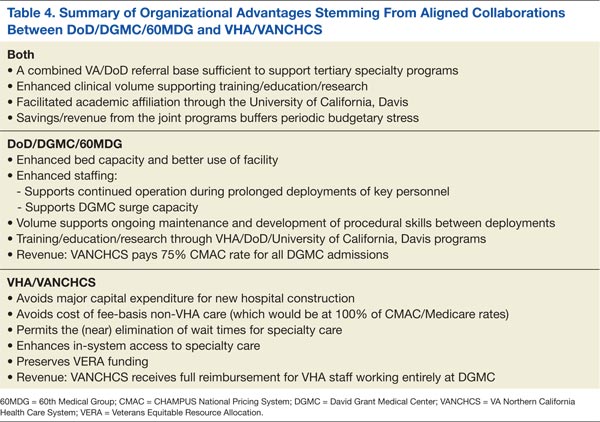
The JIF submission process encourages thoughtful planning and specific identification of resources necessary for success. The intra-and extra-organizational review process, as well as competitive national-level scoring, encourages thrift and innovation. Funded project proposals are generally compelling. Some JIF programs are constructed anew, combining space, bed capacity, and commitment with the requisite staffing, equipment, and team development to ensure safe startup. Examples include the neurosurgery and heart-lung-vascular programs. Others, like the orthopedics program, expand existing capabilities. In each instance, the new programs benefit all concerned: the federal taxpayer, each organization, and patients.
Outside Support and New Programs
The UC Davis Health System (UCDHS), through high-level education, training, and staffing, has explicitly supported these joint programs. Reliable, safe initiation, particularly for the cardiac and vascular programs, would not have been otherwise possible. Key staff members often hold academic faculty appointments, teach, write, and participate in UCDHS programs at all levels. Research in trauma care and other topics has also been facilitated. The positive relationship has supported joint program infrastructure, recruitment, and enhanced/maintained quality.
Multiple successful JIF collaborations and sharing projects, have generated a further, unforeseen benefit: The emergence of an intra-agency, financially relevant, federal market for innovative proposals. This has been coupled in the northern California setting with an emerging willingness by both organizations to potentially sustain a short-term loss for long-term financial or programmatic gain. Strict accounting between organizations, with real dollars going back and forth, has created pools of uncommitted profit, which organizational leaders can use to fund proposals not previously feasible given otherwise daunting fiscal constraints.
One recent example is a non-JIF program for patients requiring general surgery care. Under a no-load pilot program, some DoD surgeons work without additional compensation at VANCHCS facilities, and some general surgery operations are performed at DGMC. This serves to both maintain DoD practitioners’ clinical volume between deployments, and simultaneously address temporary VHA backlogs. Previous and current sharing agreement revenue, complemented by goodwill, supports the exchange. In this particular instance, previous JIF experience has cultivated innovation. Analysis and market discipline will determine its fate.
Limitations
Obstacles thwarting potential joint projects include inadequate projected case volume, logistical constraints, and inadequate ROI. Geographic challenges also limit collaboration in certain areas. The VANCHCS system covers 40,000 square miles. Emergency acute care for a patient mandates use of the nearest capable facility, often a local nonfederal facility. Inadequate communication between VHA and DoD EMR systems, exacerbated by privacy and security protections initiated by both organizations, also tends to block collaboration.
Notwithstanding the alignment over merger philosophy, merged information systems, or at least a faster, more reliable cross talk tool would certainly help. Bidirectional Healthcare Information Exchange (BHIE), if implemented more reliably, might still work. As a work-around, practitioners in joint programs usually practice with a VHA computer and a DoD computer side by side in order to obtain complete information for a given patient. Providers view this as ridiculous. However, all involved respect the need for intact DoD and VHA firewall/security systems.
These collaborative ventures have been created in a unique budgetary environment. Wars end. Congress adjusts budgets. Health care systems change. One or the other partner periodically experiences serious budgetary stress. However, the back-and-forth revenue streams described here tend to smooth the transitions. Despite budgetary and programmatic stress, we are maintaining/expanding all of the joint programs described herein. These programs deliver sustained, cost-effective care with improved access for veterans and military beneficiaries alike and continue to do so through planned, mutually aligned effort, not merger.
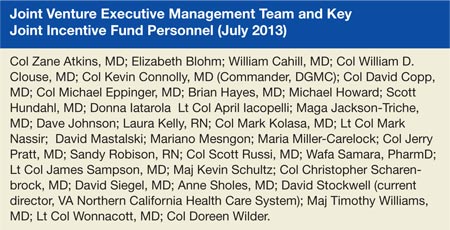
Acknowledgements
Current and former commanders of the 60th Medical Group at DGMC: Col Rawson Wood (current commander); Col Kevin Connelly, MD ; Col Brian Hayes, MD; Col Lee Payne, MD.
Current and former directors of VANCHCS: David Stockwell (current director); Brian O’Neill, MD; Lawrence Sandler; Lucille Swanson. UC Davis: Kenneth W. Kizer, MD, MPH, The Institute for Population Health Improvement, and The Center for Veterans and Military Health.
Author disclosures
The author reports no actual or potential conflicts of interest with regard to this article.
Disclaimer
The opinions expressed herein are those of the author and do not necessarily reflect those of Federal Practitioner, Frontline Medical Communications Inc., the U.S. Government, or any of its agencies. This article may discuss unlabeled or investigational use of certain drugs. Please review the complete prescribing information for specific drugs or drug combinations—including indications, contraindications, warnings, and adverse effects—before administering pharmacologic therapy to patients.
1. Panangala SV, Jansen DJ. Departments of Defense and Veterans Affairs: Status of the Integrated Electronic Health Record (iEHR). Federation of American Scientists Website. http://fas.org/sgp/crs/misc/R42970.pdf. Published February 26, 2013. Accessed November 11, 2014.
2. Committee on Evaluation of the Lovell Federal Health Care Center Merger; Board on the Health of Select Populations; Institute of Medicine. Evaluation of the Lovell Federal Health Care Center Merger: Findings, Conclusions and Recommendations (2012). The National Academies Press Website. http://www.iom.edu/evaluatinglovell. Released October 12, 2012. Accessed November 5, 2014.
3. U.S. Department of Defense. Remarks by Secretary Panetta and Secretary Shinseki from the Department of Veterans Affairs [News transcript]. U.S. Department of Defense Website. http://www.defense.gov/Transcripts/Transcript.aspx?TranscriptID=5187. Published February 5, 2013. Accessed November 5, 2014.
The VA and the DoD operate completely independent health care systems. Integrated provision of health care for the populations served is a compellingly attractive goal given the obvious overlaps, but has proven deceptively difficult to implement.
Despite efforts begun in 1998 to accomplish a reliable, comprehensive, bidirectional exchange of patient-specific health care information between systems, 16 years later this has yet to be reliably available. In most locales, VHA practitioners cannot easily access details of the medical care provided to DoD personnel. Attempts to merge the 2 electronic medical record (EMR) systems have also been fraught with difficulty.1 Even at the new, joint VHA/DoD Captain James A. Lovell Federal Health Care Center in North Chicago, Illinois (which opened in October 2010 to serve a mix of active-duty servicemen, TRICARE beneficiaries, and VA enrollees under a single roof), care using a single EMR system has not been possible.
The Institute of Medicine, in an invited review, has specifically criticized the unsatisfactory, piecemeal EMR integration.2 On February 5, 2013, the Secretary of the VA and the Secretary of Defense formally abandoned efforts to construct a single VA/DoD integrated EMR system by 2017. Instead, both organizations would, in then Secretary of Defense Leon Panetta’s words, “…focus our immediate efforts on integrating VA and DoD health data as quickly as possible, by focusing on interoperability and using existing solutions.”3
Joint VA/DoD health care programs in Northern California have abandoned merged structures in favor of mutual alignment. The practical value of aligning care systems is to extract benefit from structured, economically rational, win-win collaborations, as opposed to the forced merger approach. Mutual alignment generates relatively prompt, reliable results, to the benefit of all concerned.
Related: Developing Joint VA and DoD Health Programs
This report details a consistently favorable experience with this philosophy, which has considerable relevance as federal and nonfederal systems explore future joint ventures. Specifically, this report describes the substantial multiyear savings from a combination of various DoD/VA Joint Incentive Fund (JIF) and Sharing Agreement projects conducted by the VA Northern California Health Care System (VANCHCS) and the U.S. Air Force (USAF) 60th Medical Group’s (60MDG’s) David Grant Medical Center (DGMC).
Background and Methods
VA Northern California Health Care System currently serves 92,000 unique veteran patients in a service area of 40,000 square miles through a network of facilities and clinics at 9 sites across northern California. Rapid year-over-year growth of VANCHCS continues, and in fiscal year (FY) 2013, so-called unique enrolled veterans increased by 4.7%. David Grant Medical Center is a 116-bed DoD flagship hospital at Travis Air Force Base in Fairfield, California, which is home to the 60MDG. In 2013, VANCHCS and DGMC celebrated the 20th year of collaborative projects.
Congressional mandates encompassed in sections 101, 1701, 1782, 1783, and 8111 of Title 38, United States Code, as well as sections 1074, 1079, 1086, 1104, and Chapter 61 of Title 10, United States Code, have been addressed through a variety of DoD and VA Health Care Resource Sharing Program directives. The most recent instruction covering these agreements was reissued on January 23, 2012 (DoD instruction 6010.23). Sharing Agreements and joint ventures are permitted when such arrangements “…will improve access to quality health care or increase cost-effectiveness of the health care provided … to beneficiaries of both departments.” A Joint Executive Council (JEC), co-chaired by the VA Deputy Secretary and the DoD Acting Under Secretary of Defense for Personnel and Readiness, oversees joint VA/DoD activities.
The collaborative initiatives described in this article have all blossomed into sustainable, ongoing, valuable programs. Aided by JIF grants, they transitioned to standard VHA and DoD budgetary mechanisms in the third year of operation. For the VHA, such ongoing funding is accomplished through the Veterans Equitable Resource Allocation (VERA) budgeting system. Despite overall national/regional advantages, this funding model can result in substantial fiscal pressure for rapidly growing VHA systems, such as VANCHCS. DoD facilities and deployable operational teams, such as the 60MDG, are funded through separate DoD mechanisms. TRICARE services are funded through an entirely different budget. The complexities of this process preclude easy summary in this paper.
Recognizing that new collaborative initiatives inevitably add fiscal stress to involved facilities, the JEC has periodically offered 2-year competitive grant funding on a national basis to support winning proposals. Such JIF grants offer financial support to initiate potentially value-added collaborations. The VHA and DoD equally fund the annual award pool for these JIF grants. In response to periodic solicitations, VHA facilities team with DoD partners to jointly submit concept proposals.
Proposals emerging from separate review, revision, and approval by VHA/VA and USAF/DoD leadership are subjected to a rigorous business case analysis. The JEC then competitively scores the proposals according to transparent weighted criteria. High-scoring proposals enjoy support for renovation, equipment, and personnel for a transition period of 2 years. In the third year of ongoing operation, VHA funding (ie, VERA funding) and DoD funding, sometimes modified by a specific Memoranda of Understanding, pay for the third year, based on the workload during the first year of the program. As a result of third-year reimbursement based on previous volume and care provided, productivity under any new JIF-funded program is financially incentivized from day 1.
Each JIF proposal enumerates specific workload targets and time lines. In northern California, at quarterly intervals, a local VANCHCS-DGMC Joint Venture Executive Management Team (EMT) formally reviews clinical and financial metrics. This local EMT also reports results to the national-level JEC. Clinical metrics for most programs include visit count, consult count, procedure count, and the number of individuals treated in a given year, with breakdown tallies according to patients’ VA or DoD affiliation. Financial metrics include personnel costs, equipment costs, and revenue generated or saved. Savings for VHA patients can be calculated using CPT codes, Diagnosis Related Groups (DRG), and set CHAMPUS Maximum Allowable Charge (CMAC) rates, as calculated by the TRICARE Management Calculator (TMA Calculator).
Personnel serving in joint, integrated programs remain employees of either VHA or DoD, according to the staffing plan specified in the original JIF grant. Beyond the 2-year term of the original JIF grant, VANCHCS and DGMC can jointly adjust/expand staffing to meet increasing demand and programmatic needs. Personnel in joint programs work side by side and treat patients equally regardless of VA or DoD affiliation.
By agreement, EMR orders and EMR patient care documentation are entered according to norms for the organization where the care is delivered (usually DGMC for new inpatient programs). This facilitates identical treatment of patients in JIF programs. However, specific accommodations for inadequate cross talk between VHA and DoD EMR systems have proven necessary. Such accommodations have added cost, but not to a degree that jeopardizes any particular venture.
Findings
The mutual alignment approach shows a uniformly favorable 9-year experience with 9 joint VA/DoD clinical programs initiated through JIF grants totaling $29.6 million. Formal JIF closeout reports at the 2-year mark are available for 5 programs and document positive return on investment (ROI) for all programs averaging 83%.
The Joint Neurosurgery Program, planned through a 2005 JIF grant and implemented in 2006, offers a practical example of mutual alignment at work. Pre-JIF, both organizations had limited neurosurgery capability. War-related deployments undermined DGMC service, and ongoing community care expenses beyond $1.5 million per year for DoD beneficiaries seemed inevitable. VANCHCS in 2004-2005 referred nearly all cases to either neighboring VA systems or to community hospitals, suffering both lost VERA revenue on one hand and direct cost on the other. Unreliable care, long wait times, inefficiency, and dissatisfaction plagued the arrangements, which the staff at VANCHCS considered unacceptable.
Combining forces to provide better care made sense, but reorganizing for a fully merged Neurosurgical Service revealed daunting roadblocks. Eventually, merger frustration conceived a more productive, outcome-oriented, practical philosophy: mutual alignment. We recognized that minimizing change, flexibly capitalizing on opportunity, and reinforcing areas of strength could best achieve mutual joint goals. This mind-set facilitated speedy program assembly, in a “can do” collaborative atmosphere, and with gratifyingly little disruption.
Joint Neurosurgery JIF
The joint Neurosurgery JIF fused outpatient clinics to 1 hub location (a VA clinic adjacent to DGMC), left VA and DoD EMR arrangements intact, and established a single site (DGMC) for inpatient neurosurgical procedures. Dual-trained practitioners accessed both DoD and VA EMR systems, often using side-by-side computer stations. Inpatient work, by mutual agreement, used the DoD EMR exclusively. On inpatient discharge, however, a duplicate care summary was entered into the VHA CPRS EMR system.
Using JIF grants, a sophisticated image-guided surgery system was installed at DGMC, an underused operating room (OR) at DGMC was dedicated to neurosurgery, instruments were purchased, and VA nurses were hired to augment OR/ward/intensive care unit staffing at DGMC to support neurosurgical needs. The 3-year neurosurgery JIF budget totaled $5.5 million, 90% of which was dedicated to salaries for additional personnel to expand the service at DGMC. Deliverables included volume increases of 1,100 neurosurgical consultations per year, and at least 100 major procedures per year.
At the completion of the first 3 years of operation, the final report of the JIF noted a 12% ROI. In the post-JIF sustainment years, as joint volume increased further, the program added an additional VA neurosurgeon, a physician assistant, and other staff. Volume has steadily expanded, with 318 major neurosurgical procedures completed in FY 2013. In maintenance mode, consultations remain essentially free to each organization; VANCHCS is reimbursed for salary/benefits for hospital-based VHA personnel working at DGMC; and DGMC charges VANCHCS 75% of CMAC rates for the inpatient care delivered. The arrangement remains financially desirable for both organizations. For FY 2013 the joint relationship in neurosurgery generated a 22% ROI, saving taxpayers nearly $1 million per year. Most important, patients received prompt, excellent care. Waiting times for elective consults were routinely < 14 days, emergency care was reliably available, outcomes were excellent, and satisfaction at all levels have vastly improved.
Measuring Program Success
The funded and implemented JIF programs have all been successful, with positive ROI ranging from 10% to 284% (Table 1). Newer programs lacking a final closeout report are all on track for positive ROI. One additional JIF program, for a joint hematology-oncology center, was delayed by staffing challenges but has now commenced.
Over the past 7 years, outpatient volume and services provided by DGMC have increased. Outpatient support services provided by VANCHCS for DoD personnel at remote sites, while still substantial, diminished (Figures 1 and 2). Such changes reflect intentional concentration at DGMC. Also, a VHA pharmacy service provided to USAF personnel at a site distant from DGMC was intentionally downsized to embrace a mailed-medication program.
Inpatient hospital discharges for VHA enrollees and bed-days of care at DGMC have increased substantially (Figure 3). As a result of sharing programs and JIF programs, VHA enrollees currently account for about 40% of total hospital census at DGMC. About 108 professionals paid by VANCHCS currently work at DGMC. In most cases, as formalized in specific post-JIF sustainment agreements, VANCHCS is reimbursed for clinical staff salary and benefits if such staff are working at DGMC within a JIF program. For inpatient and procedural care, unless charges are specifically excluded as part of specific JIF agreements, VANCHCS pays DGMC at a rate of 75% of CMAC (ie, about 75% of Medicare rates) for every admission. Given geographic constraints, a VHA mandate to keep waits for specialty care under 14 days, and finite assistance levels from other VAMCs in VISN 21, a majority of these cases would otherwise be treated in community fee programs (at a higher cost of 100% of CMAC plus professional fees).
Volume has grown in all such programs (Table 2). Growth in the category of “open cardiac procedures,” however, has been intentionally limited by a VISN 21 requirement that care for VHA patients be provided only when existing VISN 21 cardiac programs cannot accommodate a particular case.
Since FY 2011, as a result of improved analytics, VANCHCS has been able to calculate its global savings (cost avoidance) stemming from all JIF and other sharing programs. Calculating the difference between community fee cost and DGMC cost as about 25% of CMAC (which offers a floor estimate of actual savings), these ongoing programs now save the VANCHCS $7.78 million per year (Table 3).
Positive overall federal ROI (ie, ROI from the taxpayer’s perspective), measured in dollars, is reported at the end of year 3 for every JIF-funded program. Substantial additional ROI could be captured by other metrics, such as timeliness of care and patient satisfaction, and would be favorable for all listed programs (data not shown).
Discussion
Had VANCHCS and DGMC attempted a merged information and management structure for the JIF programs, implementation would have been seriously delayed, if not entirely thwarted. Instead, by explicitly aligning efforts around each organization’s existing capabilities, assets and attributes, new valuable services were quickly developed. Patients now receive high-quality treatment in specialty areas not previously offered (and in some instances, not previously offered by either system).
As noted previously, the DoD and the VHA health care systems vary considerably. For DGMC and the 60MDG, during a time of war, optimal triage practices, safe/speedy transport, and the reliable delivery of appropriate trauma care for the injured warrior represent core missions. The VHA, on the other hand, is dedicated to the well-being, health, and lifetime medical-surgical care of enrolled veterans. The VHA population has relatively high numbers of elderly patients with serious chronic health conditions, such as heart disease, vascular disease, and cancer. VHA also provides subacute and rehabilitative care for younger veterans who served more recently in Iraq and Afghanistan. Overall, the VHA population stands quite distinct from that of our young active-duty forces and their dependents.
The VHA patient population (6.3 million patients receiving treatment and over 8.7 million enrolled) greatly exceeds that of the DoD. For this and other reasons, experience, current skills, and training differ considerably between VHA and DoD practitioners. For active-duty DoD practitioners, especially surgeons, the JIF projects provide avenues for development/maintenance of skills. Further, the JIF-enabled influx of VHA personnel at DGMC enhances staffing at DGMC, thereby improving the capacity of DGMC and the 60MDG’s potential surge capacity. Finally, ongoing joint programs have fostered provider relationships, academic opportunities, and training for DoD personnel between deployments.
The effort also helps personnel satisfy new, quantitative, procedural volume standards (aka currency standards) for DoD/USAF surgeons. For VANCHCS, which is seriously pressed for acute inpatient capacity, the DGMC facility space and beds supporting the joint programs represent an attractive alternative to other options, such as new hospital construction, distant transfers, or reliance on community care (Table 4).
The JIF submission process encourages thoughtful planning and specific identification of resources necessary for success. The intra-and extra-organizational review process, as well as competitive national-level scoring, encourages thrift and innovation. Funded project proposals are generally compelling. Some JIF programs are constructed anew, combining space, bed capacity, and commitment with the requisite staffing, equipment, and team development to ensure safe startup. Examples include the neurosurgery and heart-lung-vascular programs. Others, like the orthopedics program, expand existing capabilities. In each instance, the new programs benefit all concerned: the federal taxpayer, each organization, and patients.
Outside Support and New Programs
The UC Davis Health System (UCDHS), through high-level education, training, and staffing, has explicitly supported these joint programs. Reliable, safe initiation, particularly for the cardiac and vascular programs, would not have been otherwise possible. Key staff members often hold academic faculty appointments, teach, write, and participate in UCDHS programs at all levels. Research in trauma care and other topics has also been facilitated. The positive relationship has supported joint program infrastructure, recruitment, and enhanced/maintained quality.
Multiple successful JIF collaborations and sharing projects, have generated a further, unforeseen benefit: The emergence of an intra-agency, financially relevant, federal market for innovative proposals. This has been coupled in the northern California setting with an emerging willingness by both organizations to potentially sustain a short-term loss for long-term financial or programmatic gain. Strict accounting between organizations, with real dollars going back and forth, has created pools of uncommitted profit, which organizational leaders can use to fund proposals not previously feasible given otherwise daunting fiscal constraints.
One recent example is a non-JIF program for patients requiring general surgery care. Under a no-load pilot program, some DoD surgeons work without additional compensation at VANCHCS facilities, and some general surgery operations are performed at DGMC. This serves to both maintain DoD practitioners’ clinical volume between deployments, and simultaneously address temporary VHA backlogs. Previous and current sharing agreement revenue, complemented by goodwill, supports the exchange. In this particular instance, previous JIF experience has cultivated innovation. Analysis and market discipline will determine its fate.
Limitations
Obstacles thwarting potential joint projects include inadequate projected case volume, logistical constraints, and inadequate ROI. Geographic challenges also limit collaboration in certain areas. The VANCHCS system covers 40,000 square miles. Emergency acute care for a patient mandates use of the nearest capable facility, often a local nonfederal facility. Inadequate communication between VHA and DoD EMR systems, exacerbated by privacy and security protections initiated by both organizations, also tends to block collaboration.
Notwithstanding the alignment over merger philosophy, merged information systems, or at least a faster, more reliable cross talk tool would certainly help. Bidirectional Healthcare Information Exchange (BHIE), if implemented more reliably, might still work. As a work-around, practitioners in joint programs usually practice with a VHA computer and a DoD computer side by side in order to obtain complete information for a given patient. Providers view this as ridiculous. However, all involved respect the need for intact DoD and VHA firewall/security systems.
These collaborative ventures have been created in a unique budgetary environment. Wars end. Congress adjusts budgets. Health care systems change. One or the other partner periodically experiences serious budgetary stress. However, the back-and-forth revenue streams described here tend to smooth the transitions. Despite budgetary and programmatic stress, we are maintaining/expanding all of the joint programs described herein. These programs deliver sustained, cost-effective care with improved access for veterans and military beneficiaries alike and continue to do so through planned, mutually aligned effort, not merger.
Acknowledgements
Current and former commanders of the 60th Medical Group at DGMC: Col Rawson Wood (current commander); Col Kevin Connelly, MD ; Col Brian Hayes, MD; Col Lee Payne, MD.
Current and former directors of VANCHCS: David Stockwell (current director); Brian O’Neill, MD; Lawrence Sandler; Lucille Swanson. UC Davis: Kenneth W. Kizer, MD, MPH, The Institute for Population Health Improvement, and The Center for Veterans and Military Health.
Author disclosures
The author reports no actual or potential conflicts of interest with regard to this article.
Disclaimer
The opinions expressed herein are those of the author and do not necessarily reflect those of Federal Practitioner, Frontline Medical Communications Inc., the U.S. Government, or any of its agencies. This article may discuss unlabeled or investigational use of certain drugs. Please review the complete prescribing information for specific drugs or drug combinations—including indications, contraindications, warnings, and adverse effects—before administering pharmacologic therapy to patients.
1. Panangala SV, Jansen DJ. Departments of Defense and Veterans Affairs: Status of the Integrated Electronic Health Record (iEHR). Federation of American Scientists Website. http://fas.org/sgp/crs/misc/R42970.pdf. Published February 26, 2013. Accessed November 11, 2014.
2. Committee on Evaluation of the Lovell Federal Health Care Center Merger; Board on the Health of Select Populations; Institute of Medicine. Evaluation of the Lovell Federal Health Care Center Merger: Findings, Conclusions and Recommendations (2012). The National Academies Press Website. http://www.iom.edu/evaluatinglovell. Released October 12, 2012. Accessed November 5, 2014.
3. U.S. Department of Defense. Remarks by Secretary Panetta and Secretary Shinseki from the Department of Veterans Affairs [News transcript]. U.S. Department of Defense Website. http://www.defense.gov/Transcripts/Transcript.aspx?TranscriptID=5187. Published February 5, 2013. Accessed November 5, 2014.

Diabetes Patient-Centered Medical Home Approach
Type 2 diabetes mellitus (T2DM) is a significant, growing health problem that results in increased morbidity and mortality. In adults, T2DM accounts for about 90% to 95% of all diagnosed cases of diabetes.1 Diabetes is the leading cause of kidney failure and blindness; moreover, diabetic patients are 2 to 4 times more likely to die of complications of heart disease and/or have a stroke.2 Other complications of diabetes include nervous system damage and nontraumatic lower limb amputation. Increased morbidity and mortality not only diminishes quality of life (QOL) for patients with diabetes, but also produces a financial health care burden. The cost of diabetes in the U.S. in 2012 was more than $245 billion compared with $174 billion in 2007.1
The Centers for Disease Control and Prevention (CDC) predicts that 1 in 3 American adults will develop diabetes by 2050; thus, optimal approaches to diabetic care need to be developed and evaluated to determine best practices.3,4 Better control of blood sugar, cholesterol, and blood pressure levels in people with diabetes will help reduce the risk of complications of kidney disease, eye disease, nervous system disease, heart attack, and stroke.5 Optimal approaches to diabetes management must now be developed to prepare for the forecasted increase of T2DM.
A review of the literature confirms that lack of continuity of care often leads to patient dissatisfaction with health care, to fragmented health care, and a greater propensity to disregard a defined health care treatment plan.6,7 In addition to improved patient satisfaction and adherence to medical management, improved continuity of care is cost-effective. A longitudinal study based on claims data from 2000 to 2008, using the continuity of care index, indicated that improved continuity of care was associated with less health care waste and lower health care expenses for patients with T2DM.8 An average savings of $737 in total health care expenses per person was achieved with better continuity of care.8 These studies demonstrate that improving continuity of care improves outcomes in patients with diabetes and helps prevent excessive health care costs and waste.
Medical Center NonContinuity
Lack of continuity of care has been identified as a potential obstacle to optimal diabetic outcomes at William Beaumont Army Medical Center (WBAMC) in El Paso, Texas, based on a recent data analysis provided by TRICARE Regional Office West.9,10 As of March 2010, 56,936 patients were enrolled in TRICARE Prime. Of these patients, only 29.92% had appointments with their assigned primary care manager (PCM).9
In 2009, WBAMC developed a database to track the Healthcare Effectiveness Data and Information Set (HEDIS) measures to monitor A1c as well as other indicators of performance of health care services, such as mammography, Pap smear, bone densitometry, and colorectal screening. A recent American Diabetic Association expert committee recommendation endorsed the use of A1c value > 6.5% to confirm the diagnosis of diabetes.11 The A1c test may be confirmed with a repeat test unless clinical symptoms exist or the patient has random glucose levels > 200 mg/dL. Importantly, individuals with an A1c between 6% and 6.5% have a higher risk for developing diabetes and may be diagnosed with prediabetes.3
From 2008 to 2009, the HEDIS database tracking the progress of A1c demonstrated a 0.3% positive change and improvement in A1c ≤ 9% (normal 4%-6%). The goal for people with diabetes is A1c < 7%. Uncontrolled diabetes, (ie, A1c > 9%), is associated with greater diabetes-related complications.12 Using the HEDIS benchmark of ≥ 9%, the HEDIS A1c data for fiscal year (FY) 2008 were 71.1 (p50) and 81 (p90), and for FY 2009 were 72.2 (p50) and 81.3 (p90), reflecting p90 0.3% improvement.13 Therefore, these data reflect poor outcomes of patients with T2DM with A1c levels that were not controlled at WBAMC.
Uncontrolled diabetes accrues significant health care costs and adverse diabetic outcomes.10 Consequently, the WBAMC clinical operations division, which was tasked to monitor the HEDIS database, identified and contacted individuals to schedule health care appointments. The primary endeavor was an attempt to substantially increase benchmarks and maintain levels of A1c < 9%, demonstrate improvement in quality of care, and reduce health care costs. Unfortunately, these goals were not met for the aggregate of patients with T2DM.
Figure 1 illustrates how the diabetic population at WBAMC had experienced decreased continuity of care and the adverse effects on their diabetes management. Figure 1 also illustrates how beneficiaries of TRICARE are assigned a PCM and how this process results in a lack of continuity of care for patients with T2DM. An Army medical center (MEDCEN) typically uses PCMs who may be a physician, nurse practitioner (NP), or physician assistant. Unfortunately, the majority of these PCMs are active-duty military or civil service personnel who commonly undergo permanent change of station moves or deployments every 3 years. Additionally, military providers are often rotated through department-chief positions, thereby dissolving their patient relationships.
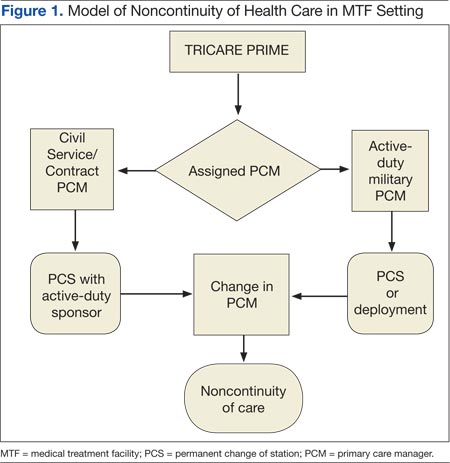
Frequent rotations offer a valid means to foster leadership skills much needed in a military conflict zone and maximize military professional development; however, rotations also contribute to the lack of continuity of patient care. This PCM instability and the distinctive military dynamic volatility are characteristic of standard military operating procedure and are unlikely to change.
New solutions are needed to promote improved continuity of care for patients with diabetes at a MEDCEN. According to Lt Gen Eric Schoomaker, former Surgeon General of the Army, “The Patient-Centered Medical Home concept is being adopted throughout the military health system.”14 The goal of the trend toward patient-centered medical home (PCMH) care delivery is to improve access to high-quality health care services.13
Patient-Centered Medical Home
The term patient-centered medical home was introduced in 1967 by the American Academy of Pediatrics (AAP).15 In 2008, PCMH principles became integral in most health care reform initiatives.16 In most PCMH models, increased continuity of care is the single common denominator of practice. Continuity of care is defined as intensified integration, coordination, and sharing of information between disciplines that result in improved patient outcomes.10,17,18
In 2007, a consensus statement was provided by the American Academy of Family Practice, the AAP, American College of Physicians, and the American Osteopathic Association stating that quality and safety are hallmarks of the PCMH and may improve outcomes for chronic disease, such as diabetes.19
Quality improvement is vital in health care organizations because of demands by government agencies, health maintenance organizations, and the public to continually improve services and to provide the highest quality health care at the best cost.20 Diabetes has become a public health crisis, as previously discussed, and a comprehensive approach to care management is essential. Developing an optimal process for diabetes health care and methods for evaluation of the delivery process is foundational for all stakeholders involved, including health care organizations, health care providers, and patients.20
Diabetic outcomes were evaluated at a recent 2-year trial PCMH approach T2DM clinic at a MEDCEN at WBAMC. The purpose of the project was to determine whether a PCMH approach improves disease management compared with routine primary care management.
Methods
The process and manner of care delivery was the focus of this analysis and evaluation, not clinician knowledge of treatment management. A comparison of care delivery approaches of PCM management and PCMH care delivery is displayed in the Table. The treatment algorithm for T2DM was not in question, because guidelines for practice are established based on scientific evidence, and medication management is based on evidence-based practice.21,22 Evaluation consisted of T2DM delivery of care process and the efficacy of outcome achieved by the specified delivery of care: (a) increased access to care; (b) intensive, repeated education; and (3) a multidisciplinary approach focused on patient empowerment. The following is a description of the specified delivery of care.
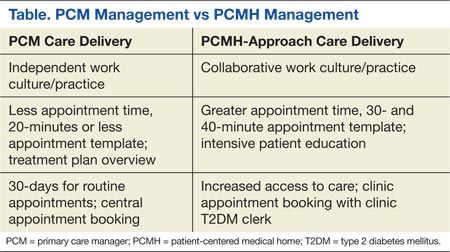
Increased Access to Care
Increased access to care addressed through frequent telecommunication provided by the registered nurse (RN) case manager who regularly called patients within 72 hours of insulin adjustment or 24 hours for insulin initiation or significant medication changes. Additionally, the diabetes team providers requested a follow-up appointment in 1 week when injectable medication was added or changes were made in insulin management. One exception was for the addition of livaglutide, in which a 2-week follow-up was made, to allow for titration of the medication. For oral medication adjustment, a 1-month follow-up was generally made, with a 2-month follow-up when a glucose histogram indicated optimal glycemic control, an average blood glucose of 7% (estimated average glucose of 154 mg/dL) or less. Time for appointments was increased by 10 minutes for a total of 30-minute appointments, compared with 20 minutes for PCM delivery.
Informational continuity was thought to be improved by use of an electronic medical record (EMR), allowing for an uninterrupted patient record. Providers were expected to document medication reconciliation with a clear explanation of medication adjustments listed in the plan. Patient teaching was documented, describing the specific patient education concerns addressed. Other data included a glucometer statistical report from the last appointment to the current appointment, to track negative or positive changes in glycemic control.
Patient Education
The management technique used in the clinic was intensive, repeated education with the goal of improving learning and retention with repeated instruction and positive reinforcement. Skinner theorized that learning is the acquisition of new behavior through conditioning (eg, repeated instruction), is in close proximity of time, and is likely to result in learning retention, which remain relevant education practice.23,24 The T2DM clinic operates on Skinner’s principles of repeated, intensive education. For example, patients must bring their glucometer to every appointment. The statistical analysis downloaded from the glucometer provides immediate reinforcement and information about patients’ glycemic control. Patients are typically excited to see an improvement from previous levels and are encouraged to continue behavior modification. Conversely, statistical analysis demonstrating poor glycemic control generally encourages the patient to make needed lifestyle changes. Thus, changes in behavior due to intensive, repeated education, followed by a reinforcing stimulus results in an increased probability of that behavior occurring in the future.23,25 The interdisciplinary team provides education during each T2DM patient encounter.
Multidisciplinary Approach
The multidisciplinary team formed at the trial T2DM clinic consisted of a medical doctor, family NP, pharmacist, RN, licensed vocational nurse, and registered dietician. The team members were each encouraged to obtain Certified Diabetes Educator (CDE) certification. For the first 6 months of developing the clinic, staff scheduled weekly team-building meetings to encourage esprit de corps. The weekly meetings were also used to discuss difficult patient cases. The RN case manager provided the patients with individualized plans to help them meet specified goals and provided easy accessibility for patient questions and concerns. The pharmacist was integral in helping patients understand the role of their medication and was also certified to make medication adjustments related to diabetes.
A recent Institute of Medicine (IOM) report encouraged the expansion of roles for nurse practitioners (NPs) in coordination and primary care delivery.26 The IOM collaborative statement is based on numerous studies showing that NPs provided equivalent quality of care compared with that of primary care physicians in routine chronic disease management.26 Nurse case managers functioned as an integral part of the intensive therapy involved in the landmark Diabetes Control and Complication Trial.27
The intended policy analysis and outcome evaluation was confined to data collected from a disease-specific (T2DM) clinic with a PCMH approach developed April 2011 at WBAMC. Data were obtained from the WBAMC database designed to track the HEDIS measures.
Enrollees of the clinic were restricted to patients diagnosed with T2DM who were TRICARE beneficiaries. Males and females, aged > 20 years with an established A1c > 6.5% comprised the patient population of the clinic. Individuals who were managed by WBAMC or were TRICARE standard beneficiaries were excluded from the study. Because patients with T1DM have a different pathology than those with T2DM, they were referred to endocrinology. Patients with gestational diabetes were referred to obstetrics for management.
Data Collection
Existing data in the Armed Forces Health Longitudinal Technology Application (AHLTA) EMR were used for this analysis. Data were accessed by a Common Access Card (CAC card) enhanced security system accessed only through secure CAC applications.
Diabetic outcomes of glycemic control as measured by the A1c value were examined prior to clinic enrollment (time 1: PCM care delivery) and subsequently (time 2: PCMH care delivery) at the health care provider’s discretion. The second time varied between 2 and 6 months, depending on (1) provider need to determine quickly (2 months) whether a downward trend was occurring because of multiple comorbidities; (2) provider discretion to wait an additional 3 months (A1c turnover x 2 = 6 months), while medication adjustments are being made; and (3) according to feasibility of follow-up based on patient’s scheduling. Low-density lipoprotein cholesterol (LDL-C) was also examined at both PCM care delivery and PCMH care delivery.
The endpoints of a reduction in A1c by 1% and an LDL-C that is ≤ 100 mg/dL determined improved diabetes outcomes. Existing data (eg, glycemic control [A1c], lipid control [LDL-C]), from April 1, 2011, to December 31, 2011, were logged in a clinic database. These data served to demonstrate the effectiveness of the T2DM PCMH approach to clinic management. The PCMH principles that were examined included the standard operating procedure for the T2DM-PCMH clinic: frequent appointments > 2 in a 3-month period), a multidisciplinary team, and intensive, repeated education.
Data analysis was conducted with descriptive statistics (frequencies, means, SDs) and t test analysis to determine relationships between variables of A1c, LDL-C, and frequency of visits. Improved diabetic outcomes, as previously defined, inferred that developing principles of a T2DM-PCMH clinic based on the principles of a PCMH provided a solution to optimal T2DM management compared with routine primary care delivery, consisting of a TRICARE-assigned PCM.
Results
A total of 638 unique patients were seen at the T2DM-PCMH clinic. Of these, 237 patient records in the database met the inclusion criteria and were acceptable for analysis and evaluation. Patients were omitted for the following reasons: 255 patients did not meet protocol of a minimum 2 visits during the evaluation period, 77 patients were omitted due to no second A1c available, 65 patients did not meet the clinic protocol of a A1c of > 6.5%, and 4 were omitted because no A1c was available for pre- or postanalysis. Data analysis and evaluation of the remaining 237 acceptable patients demonstrated that a T2DM-PCMH approach provided improved diabetic care compared with routine, PCM management.
Patients enrolled at the WBAMC T2DM clinic demonstrated clinically significant improvement (P < .001), and 80.5% achieved > 1% improvement in glycemic control. The greatest number of visits of 26 visits, an outlier not typical of the frequency of patient visits, was attributed to brittle T2DM requiring more frequent monitoring. Most patients had 3 T2DM-PCMH clinic appointments (2 were the minimum visits described in clinic protocol).
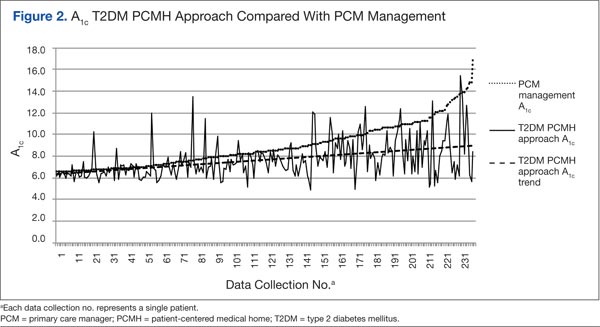
Low-density lipoprotein cholesterol levels were analyzed to determine whether patients with diabetes managed at the WBAMC T2DM clinic also had improved lipid control. A total of 638 patients had an initial LDL-C level drawn prior to clinic management. Of these patients, 282 were acceptable for analysis (Figure 2). Low-density lipoprotein cholesterol data were omitted because 93 did not have a paired pre- and postvalues, 8 values were invalid due to nonfasting laboratory status; and 255 values were omitted due to having < 2 clinic visits. Results of the data analysis demonstrated that LDL-C was well managed by the T2DM clinic, with levels ≤ 100 mg/dL (P < .001) (Figure 3).
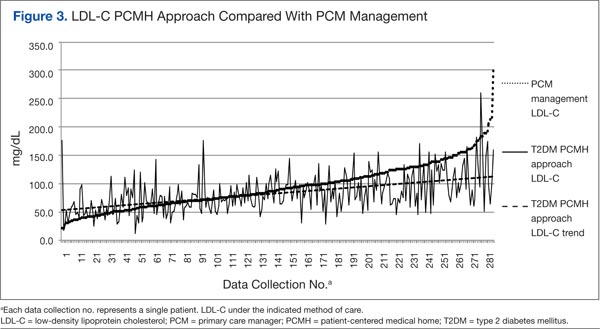
Discussion
The WBAMC T2DM clinic was formed as a trial clinic at a medical treatment facility (MTF) MEDCEN due to the failure of routine PCM care to improve outcomes in the management of the diabetes population (A1c < 7.0%). Overall, improved endpoints of A1c, LDL-C were achieved with the disease-specific PCMH approach compared with routine PCM approach. The results indicate that disease-specific management leads to improved diabetic endpoints (A1c reduction by at least 1% and LDL-C < 100 mg/dL). The clinic’s protocol (listed in the methods) was intended to improve continuity.
A review of the literature confirmed that continuity of care is integral to patient satisfaction and improved diabetes management.8,10,17,28,29 The results of the study were consistent with those in the literature. The review of the literature established that patients who develop a trusting relationship with the health care provider as the T2DM clinic promoted (eg, frequent patient appointments, telecommunication by nurse, and patient participation) are more likely to follow medical therapy and take a proactive role in disease management.6,28,30
Conclusion
This study demonstrated that PCMH-delivered care offers a solution to suboptimal management of chronic disease, such as T2DM, and that chronic disease is best managed by implementation of a disease-specific PCMH. It is recommended that a MTF develop other disease-specific PCMH and pilot-test these programs. Long-term follow-up studies and additional data collection, such as blood pressure control, abdominal circumference, body mass index, and triglyceride levels would be useful to determine effectiveness.
Based on principles of a PCMH, the efficacy of the T2DM clinic at WBAMC demonstrated that improved diabetes management was achieved by increased continuity of care; intensive, repeated patient education; and a multidisciplinary team approach. The CDC identifies self-management training as foundational to improving health outcomes and QOL for individuals with diabetes.1 Primary care providers in a MTF may improve diabetic patient outcomes by referring patients to a T2DM clinic, such as the WBAMC T2DM clinic. The multidisciplinary team facilitated patient empowerment by educating patients on the management of their disease and the problem-solving and coping skills required to manage a chronic disease.
The WBAMC T2DM-PCMH based mission of fostering patient empowerment and a team approach is a comprehensive approach to diabetes care. Currently, the PCMH model is being adapted by the military in the latest health care reform initiatives.14 However, the move toward the PCMH model does not incorporate disease-specific PCMH clinics. This study demonstrates that the disease-specific PCMH approach provides improved disease management and may be effective in other chronic disease management. A benefit of the T2DM-PCMH approach is the reduced burden of escalating health care costs related to increased morbidity and mortality, which is associated with the growing health care problem of poorly controlled T2DM.1,4,31
The disease-specific clinic evaluated at WBAMC provides an effective solution to fragmented health care for the optimal management of T2DM. The clinic’s conceptual framework of increased access to care, with consistent education at closer time intervals when compared with PCM management resulted in improved continuity and T2DM control. Future research in this area should assess measurable cost reduction. Improved disease management as demonstrated by the T2DM disease-specific clinic at WBAMC provides sufficient incentive to incorporate similar T2DM continuity clinics and changes throughout MTFs.
Author disclosures
The authors report no actual or potential conflicts of interest with regard to this article.
Disclaimer
The opinions expressed herein are those of the authors and do not necessarily reflect those of Federal Practitioner, Frontline Medical Communications Inc., the U.S. Government, or any of its agencies. This article may discuss unlabeled or investigational use of certain drugs. Please review the complete prescribing information for specific drugs or drug combinations—including indications, contraindications, warnings, and adverse effects—before administering pharmacologic therapy to patients.
1. Centers for Disease Control and Prevention (CDC). National Diabetes Fact Sheet, 2014. CDC Website. http://www.cdc.gov/diabetes/data/statistics/2014StatisticsReport.html. Updated October 24, 2014. Accessed November 6, 2014.
2. American Diabetes Association. National Diabetes Fact Sheet. Statistics about diabetes. American Diabetes Association Website. http://www.diabetes.org/diabetes-basics/diabetes-statistics. Released June 10, 2014. Accessed November 6, 2014.
3. Centers for Disease Control and Prevention (CDC). Number of Americans with diabetes rises to nearly 26 million [press release]. CDC Website. http://www.cdc.gov/media/releases/2011/p0126_diabetes.html. Published January 26, 2011. Accessed November 6, 2014.
4. Huang ES, Basu A, O’Grady M, Capretta JC. Projecting the future diabetes population size and related costs for the U.S. Diabetes Care. 2009;32(12):2225-2229.
5. National Library of Medicine. Diabetes. PubMed Website. http://www.ncbi.nlm.nih.gov/pubmedhealth/PMH0002194. Reviewed May 24, 2013. Accessed November 6, 2014.
6. Chu-Weininger MY, Balkrishnan R. Consumer satisfaction with primary care provider choice and associated trust. BMC Health Serv Res. 2006;6:139.
7. Alazri MH, Neal RD, Heywood P, Leese B. Patients’ experience of continuity of care of type 2 diabetes: A focus group study in primary care. Br J Gen Prac. 2006;56(528):488-495.
8. Chen CC, Chen SH. Better continuity of care reduces costs for diabetic patients. Am J Manag Care. 2011;17(6):420-427.
9. TRICARE Regional Office-West. Military Treatment Facility (MTF) Profile of William Beaumont Army Medical Center, FY2010 Q2. El Paso, TX. Published March 2010.
10. Worrall G, Knight J. Continuity of care is good for elderly people with diabetes: Retrospective cohort study of mortality and hospitalization. Can Fam Physician. 2011;57(1):e6-e20.
11. Kerr M. ADA 2009: Expert committee recommends use of hemoglobin A1c for diagnosis. Medscape Website. http://www.medscape.com/viewarticle/704021. Published June 7, 2009. Accessed November 7, 2014.
12. Drexler AJ. Lessons learned from landmark trials of type 2 diabetes mellitus and potential applications to clinical practice. Postgrad Med. 2003;Spec No:15-26.
13. Office of Evidence-Based Practice Quality Management Division U.S. Army Medical Command. Population Health: Update of HEDIS measures. U.S. Army Medical Department Office of Quality Management Website. https://www.qmo.amedd.army.mil/HEDIS/HEDIS_MeasuresAcrossAMEDD.pdf. Published April 2010. Accessed November 2014.
14. Schoomaker E. Army medicine: Bringing value and inspiring trust. U.S. Medicine. 2011:10-13.
15. Sia C, Tonniges TF, Osterhus E, Taba S. History of the medical home concept. Pediatrics. 2004;113(5 suppl):1473-1478.
16. Kugler JP. Military Health System Patient Centered Medical Home Guide. Defense Health Agency Website. http://www.tricare.mil/tma/ocmo/download/MHSPCMHGuide.pdf. Published June 2011. Accessed November 11, 2014.
17. Naithani S, Gulliford M. Morgan M. Patients’ perceptions and experiences of ‘continuity of care’ in diabetes. Health Expect. 2006;9(2):118-129.
18. O’Malley AS, Cunningham PJ. Patient experiences with coordination of care: The benefit of continuity and primary care physician as referral source. J Gen Intern Med. 2009;24(2):170-177.
19. American Academy of Family Practice, American Academy of Pediatrics, American College of Physicians, and the American Osteopathic Association. Joint principles of the patient-centered medical home. American Academy of Family Practice Website. http://www.aafp.org/dam/AAFP/documents/practice_management/pcmh/initiatives/PCMHJoint.pdf. Published February 2007. Accessed November 7, 2014.
20. Meyer JA, Silow-Carroll S, Kutyla T, Stepnick LS, Rybowski LS. Hospital Quality: Ingredients for Success--Overview and Lessons Learned. New York, New York: The Commonwealth Fund; 2004.
21. Polit DF, Beck CT. Nursing Research: Generating and Assessing Evidence for Nursing Practice. 8th ed. Philadelphia, PA: Lippincott, Williams & Wilkins; 2008.
22. American Association of Clinical Endocrinologists. American Association of Clinical Endocrinologists Medical Guidelines for Clinical Practice. American Association of Clinical Endocrinologists Website. https://www.aace.com/files/dm-guidelines-ccp.pdf. Accessed November 7, 2014.
23. Skinner BF. The Behavior of Organisms: An Experimental Analysis. New York, NY: Appleton-Century; 1938.
24. Staddon JE, Cerutti DT. Operant conditioning. Annu Rev Psychol. 2003;54:115-144.
25. Bruner RF. Repetition Is the First Principle of All Learning. Social Science Research network Website. http://papers.ssrn.com/sol3/papers.cfm?abstract_id=224340. Posted August 26, 2001. Accessed November 7, 2014.
26. Institute of Medicine. The Future Of Nursing: Leading Change, Advancing Health. Washington, DC: National Academics Press; 2011.
27. Willens D, Cripps R, Wilson A, Wolff K, Rothman R. Interdisciplinary team care for diabetic patients by primary care physicians, advance practice nurses and clinical pharmacists. Clin Diabetes. 2011;29(2):60-68.
28. Renders CM, Valk GD, Griffin S, Wagner EH, Eijk JT, Assendelft WJ. Interventions to improve the management of diabetes mellitus in primary care, outpatient and community settings. Cochrane Database Syst Rev. 2001;(1):CD001481.
29. Health Affairs. Patient-centered medical homes. Health Affairs Website. http://www.healthaffairs.org. Dated September 14, 2010. Accessed November 7, 2014.
30. Berry LL, Parish JT, Janakiraman R, et al. Patients’ commitment to their primary physician and why it matters. Ann Fam Med. 2008;6(1):6-13.
31. Glasgow RE, Wagner EH, Kaplan RM, Vinicor F, Smith L, Norman J. If diabetes is a public health problem, why not treat it as one? A population-based approach to chronic illness. Ann Behav Med. 1999;21(2):159-170.
Type 2 diabetes mellitus (T2DM) is a significant, growing health problem that results in increased morbidity and mortality. In adults, T2DM accounts for about 90% to 95% of all diagnosed cases of diabetes.1 Diabetes is the leading cause of kidney failure and blindness; moreover, diabetic patients are 2 to 4 times more likely to die of complications of heart disease and/or have a stroke.2 Other complications of diabetes include nervous system damage and nontraumatic lower limb amputation. Increased morbidity and mortality not only diminishes quality of life (QOL) for patients with diabetes, but also produces a financial health care burden. The cost of diabetes in the U.S. in 2012 was more than $245 billion compared with $174 billion in 2007.1
The Centers for Disease Control and Prevention (CDC) predicts that 1 in 3 American adults will develop diabetes by 2050; thus, optimal approaches to diabetic care need to be developed and evaluated to determine best practices.3,4 Better control of blood sugar, cholesterol, and blood pressure levels in people with diabetes will help reduce the risk of complications of kidney disease, eye disease, nervous system disease, heart attack, and stroke.5 Optimal approaches to diabetes management must now be developed to prepare for the forecasted increase of T2DM.
A review of the literature confirms that lack of continuity of care often leads to patient dissatisfaction with health care, to fragmented health care, and a greater propensity to disregard a defined health care treatment plan.6,7 In addition to improved patient satisfaction and adherence to medical management, improved continuity of care is cost-effective. A longitudinal study based on claims data from 2000 to 2008, using the continuity of care index, indicated that improved continuity of care was associated with less health care waste and lower health care expenses for patients with T2DM.8 An average savings of $737 in total health care expenses per person was achieved with better continuity of care.8 These studies demonstrate that improving continuity of care improves outcomes in patients with diabetes and helps prevent excessive health care costs and waste.
Medical Center NonContinuity
Lack of continuity of care has been identified as a potential obstacle to optimal diabetic outcomes at William Beaumont Army Medical Center (WBAMC) in El Paso, Texas, based on a recent data analysis provided by TRICARE Regional Office West.9,10 As of March 2010, 56,936 patients were enrolled in TRICARE Prime. Of these patients, only 29.92% had appointments with their assigned primary care manager (PCM).9
In 2009, WBAMC developed a database to track the Healthcare Effectiveness Data and Information Set (HEDIS) measures to monitor A1c as well as other indicators of performance of health care services, such as mammography, Pap smear, bone densitometry, and colorectal screening. A recent American Diabetic Association expert committee recommendation endorsed the use of A1c value > 6.5% to confirm the diagnosis of diabetes.11 The A1c test may be confirmed with a repeat test unless clinical symptoms exist or the patient has random glucose levels > 200 mg/dL. Importantly, individuals with an A1c between 6% and 6.5% have a higher risk for developing diabetes and may be diagnosed with prediabetes.3
From 2008 to 2009, the HEDIS database tracking the progress of A1c demonstrated a 0.3% positive change and improvement in A1c ≤ 9% (normal 4%-6%). The goal for people with diabetes is A1c < 7%. Uncontrolled diabetes, (ie, A1c > 9%), is associated with greater diabetes-related complications.12 Using the HEDIS benchmark of ≥ 9%, the HEDIS A1c data for fiscal year (FY) 2008 were 71.1 (p50) and 81 (p90), and for FY 2009 were 72.2 (p50) and 81.3 (p90), reflecting p90 0.3% improvement.13 Therefore, these data reflect poor outcomes of patients with T2DM with A1c levels that were not controlled at WBAMC.
Uncontrolled diabetes accrues significant health care costs and adverse diabetic outcomes.10 Consequently, the WBAMC clinical operations division, which was tasked to monitor the HEDIS database, identified and contacted individuals to schedule health care appointments. The primary endeavor was an attempt to substantially increase benchmarks and maintain levels of A1c < 9%, demonstrate improvement in quality of care, and reduce health care costs. Unfortunately, these goals were not met for the aggregate of patients with T2DM.
Figure 1 illustrates how the diabetic population at WBAMC had experienced decreased continuity of care and the adverse effects on their diabetes management. Figure 1 also illustrates how beneficiaries of TRICARE are assigned a PCM and how this process results in a lack of continuity of care for patients with T2DM. An Army medical center (MEDCEN) typically uses PCMs who may be a physician, nurse practitioner (NP), or physician assistant. Unfortunately, the majority of these PCMs are active-duty military or civil service personnel who commonly undergo permanent change of station moves or deployments every 3 years. Additionally, military providers are often rotated through department-chief positions, thereby dissolving their patient relationships.
Frequent rotations offer a valid means to foster leadership skills much needed in a military conflict zone and maximize military professional development; however, rotations also contribute to the lack of continuity of patient care. This PCM instability and the distinctive military dynamic volatility are characteristic of standard military operating procedure and are unlikely to change.
New solutions are needed to promote improved continuity of care for patients with diabetes at a MEDCEN. According to Lt Gen Eric Schoomaker, former Surgeon General of the Army, “The Patient-Centered Medical Home concept is being adopted throughout the military health system.”14 The goal of the trend toward patient-centered medical home (PCMH) care delivery is to improve access to high-quality health care services.13
Patient-Centered Medical Home
The term patient-centered medical home was introduced in 1967 by the American Academy of Pediatrics (AAP).15 In 2008, PCMH principles became integral in most health care reform initiatives.16 In most PCMH models, increased continuity of care is the single common denominator of practice. Continuity of care is defined as intensified integration, coordination, and sharing of information between disciplines that result in improved patient outcomes.10,17,18
In 2007, a consensus statement was provided by the American Academy of Family Practice, the AAP, American College of Physicians, and the American Osteopathic Association stating that quality and safety are hallmarks of the PCMH and may improve outcomes for chronic disease, such as diabetes.19
Quality improvement is vital in health care organizations because of demands by government agencies, health maintenance organizations, and the public to continually improve services and to provide the highest quality health care at the best cost.20 Diabetes has become a public health crisis, as previously discussed, and a comprehensive approach to care management is essential. Developing an optimal process for diabetes health care and methods for evaluation of the delivery process is foundational for all stakeholders involved, including health care organizations, health care providers, and patients.20
Diabetic outcomes were evaluated at a recent 2-year trial PCMH approach T2DM clinic at a MEDCEN at WBAMC. The purpose of the project was to determine whether a PCMH approach improves disease management compared with routine primary care management.
Methods
The process and manner of care delivery was the focus of this analysis and evaluation, not clinician knowledge of treatment management. A comparison of care delivery approaches of PCM management and PCMH care delivery is displayed in the Table. The treatment algorithm for T2DM was not in question, because guidelines for practice are established based on scientific evidence, and medication management is based on evidence-based practice.21,22 Evaluation consisted of T2DM delivery of care process and the efficacy of outcome achieved by the specified delivery of care: (a) increased access to care; (b) intensive, repeated education; and (3) a multidisciplinary approach focused on patient empowerment. The following is a description of the specified delivery of care.
Increased Access to Care
Increased access to care addressed through frequent telecommunication provided by the registered nurse (RN) case manager who regularly called patients within 72 hours of insulin adjustment or 24 hours for insulin initiation or significant medication changes. Additionally, the diabetes team providers requested a follow-up appointment in 1 week when injectable medication was added or changes were made in insulin management. One exception was for the addition of livaglutide, in which a 2-week follow-up was made, to allow for titration of the medication. For oral medication adjustment, a 1-month follow-up was generally made, with a 2-month follow-up when a glucose histogram indicated optimal glycemic control, an average blood glucose of 7% (estimated average glucose of 154 mg/dL) or less. Time for appointments was increased by 10 minutes for a total of 30-minute appointments, compared with 20 minutes for PCM delivery.
Informational continuity was thought to be improved by use of an electronic medical record (EMR), allowing for an uninterrupted patient record. Providers were expected to document medication reconciliation with a clear explanation of medication adjustments listed in the plan. Patient teaching was documented, describing the specific patient education concerns addressed. Other data included a glucometer statistical report from the last appointment to the current appointment, to track negative or positive changes in glycemic control.
Patient Education
The management technique used in the clinic was intensive, repeated education with the goal of improving learning and retention with repeated instruction and positive reinforcement. Skinner theorized that learning is the acquisition of new behavior through conditioning (eg, repeated instruction), is in close proximity of time, and is likely to result in learning retention, which remain relevant education practice.23,24 The T2DM clinic operates on Skinner’s principles of repeated, intensive education. For example, patients must bring their glucometer to every appointment. The statistical analysis downloaded from the glucometer provides immediate reinforcement and information about patients’ glycemic control. Patients are typically excited to see an improvement from previous levels and are encouraged to continue behavior modification. Conversely, statistical analysis demonstrating poor glycemic control generally encourages the patient to make needed lifestyle changes. Thus, changes in behavior due to intensive, repeated education, followed by a reinforcing stimulus results in an increased probability of that behavior occurring in the future.23,25 The interdisciplinary team provides education during each T2DM patient encounter.
Multidisciplinary Approach
The multidisciplinary team formed at the trial T2DM clinic consisted of a medical doctor, family NP, pharmacist, RN, licensed vocational nurse, and registered dietician. The team members were each encouraged to obtain Certified Diabetes Educator (CDE) certification. For the first 6 months of developing the clinic, staff scheduled weekly team-building meetings to encourage esprit de corps. The weekly meetings were also used to discuss difficult patient cases. The RN case manager provided the patients with individualized plans to help them meet specified goals and provided easy accessibility for patient questions and concerns. The pharmacist was integral in helping patients understand the role of their medication and was also certified to make medication adjustments related to diabetes.
A recent Institute of Medicine (IOM) report encouraged the expansion of roles for nurse practitioners (NPs) in coordination and primary care delivery.26 The IOM collaborative statement is based on numerous studies showing that NPs provided equivalent quality of care compared with that of primary care physicians in routine chronic disease management.26 Nurse case managers functioned as an integral part of the intensive therapy involved in the landmark Diabetes Control and Complication Trial.27
The intended policy analysis and outcome evaluation was confined to data collected from a disease-specific (T2DM) clinic with a PCMH approach developed April 2011 at WBAMC. Data were obtained from the WBAMC database designed to track the HEDIS measures.
Enrollees of the clinic were restricted to patients diagnosed with T2DM who were TRICARE beneficiaries. Males and females, aged > 20 years with an established A1c > 6.5% comprised the patient population of the clinic. Individuals who were managed by WBAMC or were TRICARE standard beneficiaries were excluded from the study. Because patients with T1DM have a different pathology than those with T2DM, they were referred to endocrinology. Patients with gestational diabetes were referred to obstetrics for management.
Data Collection
Existing data in the Armed Forces Health Longitudinal Technology Application (AHLTA) EMR were used for this analysis. Data were accessed by a Common Access Card (CAC card) enhanced security system accessed only through secure CAC applications.
Diabetic outcomes of glycemic control as measured by the A1c value were examined prior to clinic enrollment (time 1: PCM care delivery) and subsequently (time 2: PCMH care delivery) at the health care provider’s discretion. The second time varied between 2 and 6 months, depending on (1) provider need to determine quickly (2 months) whether a downward trend was occurring because of multiple comorbidities; (2) provider discretion to wait an additional 3 months (A1c turnover x 2 = 6 months), while medication adjustments are being made; and (3) according to feasibility of follow-up based on patient’s scheduling. Low-density lipoprotein cholesterol (LDL-C) was also examined at both PCM care delivery and PCMH care delivery.
The endpoints of a reduction in A1c by 1% and an LDL-C that is ≤ 100 mg/dL determined improved diabetes outcomes. Existing data (eg, glycemic control [A1c], lipid control [LDL-C]), from April 1, 2011, to December 31, 2011, were logged in a clinic database. These data served to demonstrate the effectiveness of the T2DM PCMH approach to clinic management. The PCMH principles that were examined included the standard operating procedure for the T2DM-PCMH clinic: frequent appointments > 2 in a 3-month period), a multidisciplinary team, and intensive, repeated education.
Data analysis was conducted with descriptive statistics (frequencies, means, SDs) and t test analysis to determine relationships between variables of A1c, LDL-C, and frequency of visits. Improved diabetic outcomes, as previously defined, inferred that developing principles of a T2DM-PCMH clinic based on the principles of a PCMH provided a solution to optimal T2DM management compared with routine primary care delivery, consisting of a TRICARE-assigned PCM.
Results
A total of 638 unique patients were seen at the T2DM-PCMH clinic. Of these, 237 patient records in the database met the inclusion criteria and were acceptable for analysis and evaluation. Patients were omitted for the following reasons: 255 patients did not meet protocol of a minimum 2 visits during the evaluation period, 77 patients were omitted due to no second A1c available, 65 patients did not meet the clinic protocol of a A1c of > 6.5%, and 4 were omitted because no A1c was available for pre- or postanalysis. Data analysis and evaluation of the remaining 237 acceptable patients demonstrated that a T2DM-PCMH approach provided improved diabetic care compared with routine, PCM management.
Patients enrolled at the WBAMC T2DM clinic demonstrated clinically significant improvement (P < .001), and 80.5% achieved > 1% improvement in glycemic control. The greatest number of visits of 26 visits, an outlier not typical of the frequency of patient visits, was attributed to brittle T2DM requiring more frequent monitoring. Most patients had 3 T2DM-PCMH clinic appointments (2 were the minimum visits described in clinic protocol).
Low-density lipoprotein cholesterol levels were analyzed to determine whether patients with diabetes managed at the WBAMC T2DM clinic also had improved lipid control. A total of 638 patients had an initial LDL-C level drawn prior to clinic management. Of these patients, 282 were acceptable for analysis (Figure 2). Low-density lipoprotein cholesterol data were omitted because 93 did not have a paired pre- and postvalues, 8 values were invalid due to nonfasting laboratory status; and 255 values were omitted due to having < 2 clinic visits. Results of the data analysis demonstrated that LDL-C was well managed by the T2DM clinic, with levels ≤ 100 mg/dL (P < .001) (Figure 3).
Discussion
The WBAMC T2DM clinic was formed as a trial clinic at a medical treatment facility (MTF) MEDCEN due to the failure of routine PCM care to improve outcomes in the management of the diabetes population (A1c < 7.0%). Overall, improved endpoints of A1c, LDL-C were achieved with the disease-specific PCMH approach compared with routine PCM approach. The results indicate that disease-specific management leads to improved diabetic endpoints (A1c reduction by at least 1% and LDL-C < 100 mg/dL). The clinic’s protocol (listed in the methods) was intended to improve continuity.
A review of the literature confirmed that continuity of care is integral to patient satisfaction and improved diabetes management.8,10,17,28,29 The results of the study were consistent with those in the literature. The review of the literature established that patients who develop a trusting relationship with the health care provider as the T2DM clinic promoted (eg, frequent patient appointments, telecommunication by nurse, and patient participation) are more likely to follow medical therapy and take a proactive role in disease management.6,28,30
Conclusion
This study demonstrated that PCMH-delivered care offers a solution to suboptimal management of chronic disease, such as T2DM, and that chronic disease is best managed by implementation of a disease-specific PCMH. It is recommended that a MTF develop other disease-specific PCMH and pilot-test these programs. Long-term follow-up studies and additional data collection, such as blood pressure control, abdominal circumference, body mass index, and triglyceride levels would be useful to determine effectiveness.
Based on principles of a PCMH, the efficacy of the T2DM clinic at WBAMC demonstrated that improved diabetes management was achieved by increased continuity of care; intensive, repeated patient education; and a multidisciplinary team approach. The CDC identifies self-management training as foundational to improving health outcomes and QOL for individuals with diabetes.1 Primary care providers in a MTF may improve diabetic patient outcomes by referring patients to a T2DM clinic, such as the WBAMC T2DM clinic. The multidisciplinary team facilitated patient empowerment by educating patients on the management of their disease and the problem-solving and coping skills required to manage a chronic disease.
The WBAMC T2DM-PCMH based mission of fostering patient empowerment and a team approach is a comprehensive approach to diabetes care. Currently, the PCMH model is being adapted by the military in the latest health care reform initiatives.14 However, the move toward the PCMH model does not incorporate disease-specific PCMH clinics. This study demonstrates that the disease-specific PCMH approach provides improved disease management and may be effective in other chronic disease management. A benefit of the T2DM-PCMH approach is the reduced burden of escalating health care costs related to increased morbidity and mortality, which is associated with the growing health care problem of poorly controlled T2DM.1,4,31
The disease-specific clinic evaluated at WBAMC provides an effective solution to fragmented health care for the optimal management of T2DM. The clinic’s conceptual framework of increased access to care, with consistent education at closer time intervals when compared with PCM management resulted in improved continuity and T2DM control. Future research in this area should assess measurable cost reduction. Improved disease management as demonstrated by the T2DM disease-specific clinic at WBAMC provides sufficient incentive to incorporate similar T2DM continuity clinics and changes throughout MTFs.
Author disclosures
The authors report no actual or potential conflicts of interest with regard to this article.
Disclaimer
The opinions expressed herein are those of the authors and do not necessarily reflect those of Federal Practitioner, Frontline Medical Communications Inc., the U.S. Government, or any of its agencies. This article may discuss unlabeled or investigational use of certain drugs. Please review the complete prescribing information for specific drugs or drug combinations—including indications, contraindications, warnings, and adverse effects—before administering pharmacologic therapy to patients.
1. Centers for Disease Control and Prevention (CDC). National Diabetes Fact Sheet, 2014. CDC Website. http://www.cdc.gov/diabetes/data/statistics/2014StatisticsReport.html. Updated October 24, 2014. Accessed November 6, 2014.
2. American Diabetes Association. National Diabetes Fact Sheet. Statistics about diabetes. American Diabetes Association Website. http://www.diabetes.org/diabetes-basics/diabetes-statistics. Released June 10, 2014. Accessed November 6, 2014.
3. Centers for Disease Control and Prevention (CDC). Number of Americans with diabetes rises to nearly 26 million [press release]. CDC Website. http://www.cdc.gov/media/releases/2011/p0126_diabetes.html. Published January 26, 2011. Accessed November 6, 2014.
4. Huang ES, Basu A, O’Grady M, Capretta JC. Projecting the future diabetes population size and related costs for the U.S. Diabetes Care. 2009;32(12):2225-2229.
5. National Library of Medicine. Diabetes. PubMed Website. http://www.ncbi.nlm.nih.gov/pubmedhealth/PMH0002194. Reviewed May 24, 2013. Accessed November 6, 2014.
6. Chu-Weininger MY, Balkrishnan R. Consumer satisfaction with primary care provider choice and associated trust. BMC Health Serv Res. 2006;6:139.
7. Alazri MH, Neal RD, Heywood P, Leese B. Patients’ experience of continuity of care of type 2 diabetes: A focus group study in primary care. Br J Gen Prac. 2006;56(528):488-495.
8. Chen CC, Chen SH. Better continuity of care reduces costs for diabetic patients. Am J Manag Care. 2011;17(6):420-427.
9. TRICARE Regional Office-West. Military Treatment Facility (MTF) Profile of William Beaumont Army Medical Center, FY2010 Q2. El Paso, TX. Published March 2010.
10. Worrall G, Knight J. Continuity of care is good for elderly people with diabetes: Retrospective cohort study of mortality and hospitalization. Can Fam Physician. 2011;57(1):e6-e20.
11. Kerr M. ADA 2009: Expert committee recommends use of hemoglobin A1c for diagnosis. Medscape Website. http://www.medscape.com/viewarticle/704021. Published June 7, 2009. Accessed November 7, 2014.
12. Drexler AJ. Lessons learned from landmark trials of type 2 diabetes mellitus and potential applications to clinical practice. Postgrad Med. 2003;Spec No:15-26.
13. Office of Evidence-Based Practice Quality Management Division U.S. Army Medical Command. Population Health: Update of HEDIS measures. U.S. Army Medical Department Office of Quality Management Website. https://www.qmo.amedd.army.mil/HEDIS/HEDIS_MeasuresAcrossAMEDD.pdf. Published April 2010. Accessed November 2014.
14. Schoomaker E. Army medicine: Bringing value and inspiring trust. U.S. Medicine. 2011:10-13.
15. Sia C, Tonniges TF, Osterhus E, Taba S. History of the medical home concept. Pediatrics. 2004;113(5 suppl):1473-1478.
16. Kugler JP. Military Health System Patient Centered Medical Home Guide. Defense Health Agency Website. http://www.tricare.mil/tma/ocmo/download/MHSPCMHGuide.pdf. Published June 2011. Accessed November 11, 2014.
17. Naithani S, Gulliford M. Morgan M. Patients’ perceptions and experiences of ‘continuity of care’ in diabetes. Health Expect. 2006;9(2):118-129.
18. O’Malley AS, Cunningham PJ. Patient experiences with coordination of care: The benefit of continuity and primary care physician as referral source. J Gen Intern Med. 2009;24(2):170-177.
19. American Academy of Family Practice, American Academy of Pediatrics, American College of Physicians, and the American Osteopathic Association. Joint principles of the patient-centered medical home. American Academy of Family Practice Website. http://www.aafp.org/dam/AAFP/documents/practice_management/pcmh/initiatives/PCMHJoint.pdf. Published February 2007. Accessed November 7, 2014.
20. Meyer JA, Silow-Carroll S, Kutyla T, Stepnick LS, Rybowski LS. Hospital Quality: Ingredients for Success--Overview and Lessons Learned. New York, New York: The Commonwealth Fund; 2004.
21. Polit DF, Beck CT. Nursing Research: Generating and Assessing Evidence for Nursing Practice. 8th ed. Philadelphia, PA: Lippincott, Williams & Wilkins; 2008.
22. American Association of Clinical Endocrinologists. American Association of Clinical Endocrinologists Medical Guidelines for Clinical Practice. American Association of Clinical Endocrinologists Website. https://www.aace.com/files/dm-guidelines-ccp.pdf. Accessed November 7, 2014.
23. Skinner BF. The Behavior of Organisms: An Experimental Analysis. New York, NY: Appleton-Century; 1938.
24. Staddon JE, Cerutti DT. Operant conditioning. Annu Rev Psychol. 2003;54:115-144.
25. Bruner RF. Repetition Is the First Principle of All Learning. Social Science Research network Website. http://papers.ssrn.com/sol3/papers.cfm?abstract_id=224340. Posted August 26, 2001. Accessed November 7, 2014.
26. Institute of Medicine. The Future Of Nursing: Leading Change, Advancing Health. Washington, DC: National Academics Press; 2011.
27. Willens D, Cripps R, Wilson A, Wolff K, Rothman R. Interdisciplinary team care for diabetic patients by primary care physicians, advance practice nurses and clinical pharmacists. Clin Diabetes. 2011;29(2):60-68.
28. Renders CM, Valk GD, Griffin S, Wagner EH, Eijk JT, Assendelft WJ. Interventions to improve the management of diabetes mellitus in primary care, outpatient and community settings. Cochrane Database Syst Rev. 2001;(1):CD001481.
29. Health Affairs. Patient-centered medical homes. Health Affairs Website. http://www.healthaffairs.org. Dated September 14, 2010. Accessed November 7, 2014.
30. Berry LL, Parish JT, Janakiraman R, et al. Patients’ commitment to their primary physician and why it matters. Ann Fam Med. 2008;6(1):6-13.
31. Glasgow RE, Wagner EH, Kaplan RM, Vinicor F, Smith L, Norman J. If diabetes is a public health problem, why not treat it as one? A population-based approach to chronic illness. Ann Behav Med. 1999;21(2):159-170.
Pulmonary Vein Thrombosis Associated With Metastatic Carcinoma
Pulmonary vein thrombosis (PVT) is rare and underdiagnosed in clinical practice. It has been described following lobectomy, lung transplant, and in association with metastatic carcinoma.1-4 Some cases have been described as idiopathic.5-7 Its exact incidence is unknown, and treatment depends on etiology. On the other hand, pulmonary artery thromboembolism is a well-known entity with identified risk factors as well as clearly defined modalities of management. The following is a case of PVT, which occurred in the setting of small cell carcinoma of the lung (SCLC) and mantle cell lymphoma of the small intestine.
CASE PRESENTATION
A 66-year-old male veteran with a past medical history of type 2 diabetes mellitus, hypertension, and chronic obstructive pulmonary disease, who had a 40 pack-year history of cigarette smoking, was admitted to the hospital for severe, sudden onset abdominal pain. The pain was localized in the right lower quadrant and then became generalized. It was sharp, aggravated by movement, and relieved by rest. The patient reported being constipated for the past couple of days.
A review of systems revealed that he had been coughing for about 3 days prior to admission. A computed tomography (CT) scan of the abdomen showed pneumoperitoneum and a mass with mural thickening around the distal ileum/cecal area (Figure 1). There was also a partially visualized mass in the infrahilar area of the right lower lobe and bilateral adrenal masses seen on the scan. A chest CT with contrast was then performed, which showed a 7.5 x 6.6 x 6.6-cm mass in the right lower lobe posterior to the right hilum. The mass encased the right mainstem bronchus, and there was a low-density-filling defect in the inferior branch of the right pulmonary vein (Figure 2). An echocardiography did not show any thrombus within the atria or ventricles.
The patient underwent emergent exploratory laparotomy for bowel perforation. The operative finding was a small perforation of the small intestine with an associated mass. There were metastatic lesions throughout the abdomen. A partial small bowel resection was performed. Post exploratory laparotomy, a fiberoptic bronchoscopy was performed, which revealed a 1-cm fungating lesion at the takeoff of the superior segment of the right lower lobe. Brushings were obtained from the mass. The pathology of the lung mass was small cell carcinoma, whereas that of the bowel mass was mantle cell lymphoma. Brain magnetic resonance imaging revealed that he had metastasis to the brain with a 4-cm mass in the cerebellum. He was anticoagulated with heparin for the PVT. Based on his poor functional status and his overall clinical condition, his prognosis was poor. He received hospice care and died 3 months later.
DISCUSSION
Pulmonary vein thrombosis is a rare condition. The incidence is unclear, as most of the literature includes case reports. The majority of PVT cases are reported following lobectomy for malignancy and lung transplantation.1-3 The incidence following lung transplant was reported in the early postoperative period to be 15% in a center during the first 2 years of the study.3 Pulmonary vein thrombosis has also been described following metastatic cancer, such as liposarcoma.4
This patient’s case was discovered in the setting of SCLC and mantle cell lymphoma of the small intestine. Small cell carcinoma of the lung was reported to invade the pulmonary vein into the left atrium.8 In this patient, the left atrium was not invaded. There have been cases of spontaneous or idiopathic PVT described, presenting as abdominal pain, hemoptysis, and chest pain.5-7 No precipitating causes were detected in these patients.
The pathogenesis of PVT from a tumor is unclear, although several theories have been postulated: It could result from direct extension of the tumor into the vein, from compression of the vein by the tumor, or from epithelial damage as a result of tumor invasion. The tumor thrombus has been described to extend into the right atrium.6,8 The mechanism of thrombosis remains unclear in the patient postlobectomy or postlung transplantation, although intraoperative torsion and injury of vessels are implicated. Similar to deep vein thrombosis, PVT could also result from intimal damage or sluggish flow in the pulmonary stump in the postoperative patient.2,9,10
The presentation of PVT is usually nonspecific, including dyspnea, cough, pleuritic chest pain, and hemoptysis. It has been reported as causing massive hemoptysis due to acute pulmonary infarction.7 Acute PVT occurring postoperatively in the lung transplant patient may be disastrous and lead to early postoperative allograft failure.11 Pulmonary vein thrombosis may also present more insidiously with recurrent pulmonary edema and pulmonary fibrosis.12 This patient presented with abdominal pain; further workup led to the finding of a lung mass. Pulmonary vein thrombosis has been reported to result in systemic emboli, resulting in cerebrovascular accidents, or it can manifest as aseptic and tumor emboli.2,5,10,13,14
Newer CT techniques have made identifying PVT possible in a similar manner to which pulmonary arterial emboli are detected by using the pulmonary venous phase of a contrast CT of the chest.5 Echocardiography may demonstrate the extension of the thrombus into the atrium; a transesophageal echocardiogram would be preferable over a transthoracic echocardiogram. Magnetic resonance imaging of the chest is another useful modality for diagnosis, because it is able to distinguish between a bland thrombus and a tumor thrombus in the pulmonary vein.15
Treatment of PVT depends on the overall clinical condition of the patient. Irrespective of the etiology, a review of the literature does not indicate the preferred duration of anticoagulation or preference for modality of anticoagulation between oral vitamin K antagonists or heparin—low molecular or unfractionated.1,3-6 Patients who develop PVT following malignancy are usually anticoagulated with therapy for the cancer. The treatment of PVT in the setting of lung transplant is more challenging and includes systemic heparinization, thrombolytics, and surgical thrombectomy.3,11,16 The majority of the literature includes case reports with varying morbidity and mortality, depending on the etiology. Ninety-day mortality of 38% was reported following lung transplant.3
CONCLUSION
Pulmonary vein thrombosis presents in a nonspecific manner. The diagnosis is now more readily made with the advent of a variety of diagnostic modalities, especially with transesophageal echocardiography, which may be performed at the bedside in the intensive care unit. The treatment remains challenging with mortality dependent on the etiology. A diagnosis of PVT needs to be considered in patients with appropriate risk factors. A high index of suspicion will enable the diagnosis in the proper clinical scenario.
Author disclosures
The authors report no actual or potential conflicts of interest with regard to this article.
Disclaimer
The opinions expressed herein are those of the authors and do not necessarily reflect those of Federal Practitioner, Frontline Medical Communications Inc., the U.S. Government, or any of its agencies. This article may discuss unlabeled or investigational use of certain drugs. Please review complete prescribing information for specific drugs or drug combinations—including indications, contraindications, warnings, and adverse effects—before administering pharmacologic therapy to patients.
1. Genta PR, Ho N, Beyruti R, Takagaki TY, Terra-Filho M. Pulmonary vein thrombosis after bilobectomy and development of collateral circulation. Thorax. 2003;58(6):550-551.
2. Ohtaka K, Hida Y, Kaga K, et al. Pulmonary vein thrombosis after video-assisted thoracoscopic left upper lobectomy. J Thorac Cardiovasc Surg. 2012;143(1):e3-e5.
3. Schulman LL, Anandarangam T, Leibowitz DW, et al. Four-year prospective study of pulmonary venous thrombosis after lung transplantation. J Am Soc Echocardiogr. 2001;14(8):806-812.
4. Tamizifar B, Zadeh MR, Foroghi E. Pulmonary vein thrombosis after metastatic liposarcoma. Med Arh. 2012;66(1):68-69.
5. Selvidge SD, Gavant ML. Idiopathic pulmonary vein thrombosis: Detection by CT and MR imaging. AJR Am J Roentgenol. 1999;172(6):1639-1641.
6. Wu JP, Wu Q, Yang Y, DU ZZ, Sun HF. Idiopathic pulmonary vein thrombosis extending to left atrium: A case report with a literature review. Chin Med J (Engl). 2012;125(6):1197-1200.
7. Alexander GR, Reddi A, Reddy D. Idiopathic pulmonary vein thrombosis: A rare cause of massive hemoptysis. Ann Thorac Surg. 2009;88(1):281-283.
8. Chan V, Neumann D. Small cell lung carcinoma invading the pulmonary vein and left atrium as imaged by PET/CT. Eur J Nucl Med Mol Imaging. 2005;32(12):1493.
9. Burri E, Duwe J, Kull C, Glaser C, Maurer CA. Pulmonary vein thrombosis after lower lobectomy of the left lung. J Cardiovasc Surg (Torino). 2006;47(5):609-612.
10. Schwalm S, Ward RP, Spencer KT. Transient ischemic attack in a patient with pulmonary vein thrombosis after left upper lobectomy for squamous cell lung cancer. J Am Soc Echocardiogr. 2004;17(5):487-488.
11. Cywinski JB, Wallace L, Parker BM. Pulmonary vein thrombosis after sequential double-lung transplantation. J Cardiothorac Vasc Anesth. 2005;19(2):225-227.
12. Cavaco RA, Kaul S, Chapman T, et al. Idiopathic pulmonary fibrosis associated with pulmonary vein thrombosis: A case report. Cases J. 2009;2:9156.
13. Kim NH, Roldan CA, Shively BK. Pulmonary vein thrombosis. Chest. 1993;104(2):624-626.
14. Uhlmann EJ, Dunitz JM, Fiol ME. Pulmonary vein thrombosis after lung transplantation presenting as stroke. J Heart Lung Transplant. 2009;28(2):209-210.
15. Hricak H, Amparo E, Fisher MR, Crooks L, Higgins CB. Abdominal venous system: Assessment using MR. Radiology. 1985;156(2):415-422.
16. Nagahiro I, Horton M, Wilson M, Bennetts J, Spratt P, Glanville AR. Pulmonary vein thrombosis treated successfully by thrombectomy after bilateral sequential lung transplantation: Report of a case. Surg Today. 2003;33(4):282-284.
Pulmonary vein thrombosis (PVT) is rare and underdiagnosed in clinical practice. It has been described following lobectomy, lung transplant, and in association with metastatic carcinoma.1-4 Some cases have been described as idiopathic.5-7 Its exact incidence is unknown, and treatment depends on etiology. On the other hand, pulmonary artery thromboembolism is a well-known entity with identified risk factors as well as clearly defined modalities of management. The following is a case of PVT, which occurred in the setting of small cell carcinoma of the lung (SCLC) and mantle cell lymphoma of the small intestine.
CASE PRESENTATION
A 66-year-old male veteran with a past medical history of type 2 diabetes mellitus, hypertension, and chronic obstructive pulmonary disease, who had a 40 pack-year history of cigarette smoking, was admitted to the hospital for severe, sudden onset abdominal pain. The pain was localized in the right lower quadrant and then became generalized. It was sharp, aggravated by movement, and relieved by rest. The patient reported being constipated for the past couple of days.
A review of systems revealed that he had been coughing for about 3 days prior to admission. A computed tomography (CT) scan of the abdomen showed pneumoperitoneum and a mass with mural thickening around the distal ileum/cecal area (Figure 1). There was also a partially visualized mass in the infrahilar area of the right lower lobe and bilateral adrenal masses seen on the scan. A chest CT with contrast was then performed, which showed a 7.5 x 6.6 x 6.6-cm mass in the right lower lobe posterior to the right hilum. The mass encased the right mainstem bronchus, and there was a low-density-filling defect in the inferior branch of the right pulmonary vein (Figure 2). An echocardiography did not show any thrombus within the atria or ventricles.
The patient underwent emergent exploratory laparotomy for bowel perforation. The operative finding was a small perforation of the small intestine with an associated mass. There were metastatic lesions throughout the abdomen. A partial small bowel resection was performed. Post exploratory laparotomy, a fiberoptic bronchoscopy was performed, which revealed a 1-cm fungating lesion at the takeoff of the superior segment of the right lower lobe. Brushings were obtained from the mass. The pathology of the lung mass was small cell carcinoma, whereas that of the bowel mass was mantle cell lymphoma. Brain magnetic resonance imaging revealed that he had metastasis to the brain with a 4-cm mass in the cerebellum. He was anticoagulated with heparin for the PVT. Based on his poor functional status and his overall clinical condition, his prognosis was poor. He received hospice care and died 3 months later.
DISCUSSION
Pulmonary vein thrombosis is a rare condition. The incidence is unclear, as most of the literature includes case reports. The majority of PVT cases are reported following lobectomy for malignancy and lung transplantation.1-3 The incidence following lung transplant was reported in the early postoperative period to be 15% in a center during the first 2 years of the study.3 Pulmonary vein thrombosis has also been described following metastatic cancer, such as liposarcoma.4
This patient’s case was discovered in the setting of SCLC and mantle cell lymphoma of the small intestine. Small cell carcinoma of the lung was reported to invade the pulmonary vein into the left atrium.8 In this patient, the left atrium was not invaded. There have been cases of spontaneous or idiopathic PVT described, presenting as abdominal pain, hemoptysis, and chest pain.5-7 No precipitating causes were detected in these patients.
The pathogenesis of PVT from a tumor is unclear, although several theories have been postulated: It could result from direct extension of the tumor into the vein, from compression of the vein by the tumor, or from epithelial damage as a result of tumor invasion. The tumor thrombus has been described to extend into the right atrium.6,8 The mechanism of thrombosis remains unclear in the patient postlobectomy or postlung transplantation, although intraoperative torsion and injury of vessels are implicated. Similar to deep vein thrombosis, PVT could also result from intimal damage or sluggish flow in the pulmonary stump in the postoperative patient.2,9,10
The presentation of PVT is usually nonspecific, including dyspnea, cough, pleuritic chest pain, and hemoptysis. It has been reported as causing massive hemoptysis due to acute pulmonary infarction.7 Acute PVT occurring postoperatively in the lung transplant patient may be disastrous and lead to early postoperative allograft failure.11 Pulmonary vein thrombosis may also present more insidiously with recurrent pulmonary edema and pulmonary fibrosis.12 This patient presented with abdominal pain; further workup led to the finding of a lung mass. Pulmonary vein thrombosis has been reported to result in systemic emboli, resulting in cerebrovascular accidents, or it can manifest as aseptic and tumor emboli.2,5,10,13,14
Newer CT techniques have made identifying PVT possible in a similar manner to which pulmonary arterial emboli are detected by using the pulmonary venous phase of a contrast CT of the chest.5 Echocardiography may demonstrate the extension of the thrombus into the atrium; a transesophageal echocardiogram would be preferable over a transthoracic echocardiogram. Magnetic resonance imaging of the chest is another useful modality for diagnosis, because it is able to distinguish between a bland thrombus and a tumor thrombus in the pulmonary vein.15
Treatment of PVT depends on the overall clinical condition of the patient. Irrespective of the etiology, a review of the literature does not indicate the preferred duration of anticoagulation or preference for modality of anticoagulation between oral vitamin K antagonists or heparin—low molecular or unfractionated.1,3-6 Patients who develop PVT following malignancy are usually anticoagulated with therapy for the cancer. The treatment of PVT in the setting of lung transplant is more challenging and includes systemic heparinization, thrombolytics, and surgical thrombectomy.3,11,16 The majority of the literature includes case reports with varying morbidity and mortality, depending on the etiology. Ninety-day mortality of 38% was reported following lung transplant.3
CONCLUSION
Pulmonary vein thrombosis presents in a nonspecific manner. The diagnosis is now more readily made with the advent of a variety of diagnostic modalities, especially with transesophageal echocardiography, which may be performed at the bedside in the intensive care unit. The treatment remains challenging with mortality dependent on the etiology. A diagnosis of PVT needs to be considered in patients with appropriate risk factors. A high index of suspicion will enable the diagnosis in the proper clinical scenario.
Author disclosures
The authors report no actual or potential conflicts of interest with regard to this article.
Disclaimer
The opinions expressed herein are those of the authors and do not necessarily reflect those of Federal Practitioner, Frontline Medical Communications Inc., the U.S. Government, or any of its agencies. This article may discuss unlabeled or investigational use of certain drugs. Please review complete prescribing information for specific drugs or drug combinations—including indications, contraindications, warnings, and adverse effects—before administering pharmacologic therapy to patients.
1. Genta PR, Ho N, Beyruti R, Takagaki TY, Terra-Filho M. Pulmonary vein thrombosis after bilobectomy and development of collateral circulation. Thorax. 2003;58(6):550-551.
2. Ohtaka K, Hida Y, Kaga K, et al. Pulmonary vein thrombosis after video-assisted thoracoscopic left upper lobectomy. J Thorac Cardiovasc Surg. 2012;143(1):e3-e5.
3. Schulman LL, Anandarangam T, Leibowitz DW, et al. Four-year prospective study of pulmonary venous thrombosis after lung transplantation. J Am Soc Echocardiogr. 2001;14(8):806-812.
4. Tamizifar B, Zadeh MR, Foroghi E. Pulmonary vein thrombosis after metastatic liposarcoma. Med Arh. 2012;66(1):68-69.
5. Selvidge SD, Gavant ML. Idiopathic pulmonary vein thrombosis: Detection by CT and MR imaging. AJR Am J Roentgenol. 1999;172(6):1639-1641.
6. Wu JP, Wu Q, Yang Y, DU ZZ, Sun HF. Idiopathic pulmonary vein thrombosis extending to left atrium: A case report with a literature review. Chin Med J (Engl). 2012;125(6):1197-1200.
7. Alexander GR, Reddi A, Reddy D. Idiopathic pulmonary vein thrombosis: A rare cause of massive hemoptysis. Ann Thorac Surg. 2009;88(1):281-283.
8. Chan V, Neumann D. Small cell lung carcinoma invading the pulmonary vein and left atrium as imaged by PET/CT. Eur J Nucl Med Mol Imaging. 2005;32(12):1493.
9. Burri E, Duwe J, Kull C, Glaser C, Maurer CA. Pulmonary vein thrombosis after lower lobectomy of the left lung. J Cardiovasc Surg (Torino). 2006;47(5):609-612.
10. Schwalm S, Ward RP, Spencer KT. Transient ischemic attack in a patient with pulmonary vein thrombosis after left upper lobectomy for squamous cell lung cancer. J Am Soc Echocardiogr. 2004;17(5):487-488.
11. Cywinski JB, Wallace L, Parker BM. Pulmonary vein thrombosis after sequential double-lung transplantation. J Cardiothorac Vasc Anesth. 2005;19(2):225-227.
12. Cavaco RA, Kaul S, Chapman T, et al. Idiopathic pulmonary fibrosis associated with pulmonary vein thrombosis: A case report. Cases J. 2009;2:9156.
13. Kim NH, Roldan CA, Shively BK. Pulmonary vein thrombosis. Chest. 1993;104(2):624-626.
14. Uhlmann EJ, Dunitz JM, Fiol ME. Pulmonary vein thrombosis after lung transplantation presenting as stroke. J Heart Lung Transplant. 2009;28(2):209-210.
15. Hricak H, Amparo E, Fisher MR, Crooks L, Higgins CB. Abdominal venous system: Assessment using MR. Radiology. 1985;156(2):415-422.
16. Nagahiro I, Horton M, Wilson M, Bennetts J, Spratt P, Glanville AR. Pulmonary vein thrombosis treated successfully by thrombectomy after bilateral sequential lung transplantation: Report of a case. Surg Today. 2003;33(4):282-284.
Home-Based Video Telehealth for Veterans With Dementia

For nearly 4 decades, the unifying focus of the 2-site New England Geriatric Research Education and Clinical Center (GRECC) has been on dementia and related disorders. Veterans with dementia are an extremely vulnerable population with high rates of health care use that is projected to total > $203 billion in the U.S. in 2013.1 Their caregivers are also among the most burdened, having provided about 17.5 billion hours of unpaid care in 2012, which is valued at more than $216 billion.1 Additionally, spouses, who are the most common caregivers of persons with dementia, often experience poor health outcomes related to the experience of living with the afflicted spouse.2
Currently > 200,000 VA patients have dementia, and that number is expected to increase.3 Dementia is largely a disease of the elderly; thus, many veterans with dementia also have other medical and orthopedic conditions that increase their frailty and decrease their mobility. Behavioral and psychological symptoms are present in > 75% of people with dementia, contributing to the relative isolation of both those with dementia and their families.4
Disruption in routine and removal from familiar surroundings can cause many patients, particularly in the moderate stages of dementia, to become disoriented and agitated. For these patients, VA clinics can be unsettling and may reveal behavior that is not the same as the veterans’ behavior at home. For these reasons, veterans with dementia likely may benefit from remote access to health care via telehealth. However, current telehealth applications for this population are vastly underdeveloped.
Video Dementia Management
Many GRECCs and other VA geriatric programs provide video-based dementia evaluations and management at community-based outpatient clinics (CBOCs) affiliated with their medical centers. At this point, close to a dozen GRECC and geriatric programs nationally have geriatric psychiatrists, geriatricians, or neurologists conducting such visits from their office or clinic space with video links to a telehealth-enabled room in the corresponding CBOC.
The visits usually entail having the veteran and, when appropriate, a family member check in at the local CBOC for the appointment and receiving assistance throughout the video visit from the telehealth technician at the CBOC.
The technician assists with the technical aspects of the encounter, including establishing and maintaining the video link to the VA medical center (VAMC), and often is trained to administer a brief standardized mental status assessment. The telehealth technician also helps pass along the physician’s written recommendations to the veteran and family once the recommendation summary has been sent by e-mail or printed on the CBOC printer. These VAMC-CBOC video telehealth programs have been very popular with veterans, particularly those in rural settings, since traveling to the CBOC is usually more convenient.
Home-based Video Program
While CBOC-based video telehealth programs expand the population of veterans able to benefit from specialty dementia care, any travel out of the home can be challenging or disruptive for many veterans and their families. In addition, the performance and demeanor of a veteran with dementia in a clinic setting is sometimes different from that which the family describes as their more typical behavior at home.
A new in-home video telehealth program developed by the GRECC at the Edith Nourse Rogers Memorial Veterans Hospital in Bedford is addressing these issues. The Bedford site of the New England GRECC offers in-home clinical video telehealth services to community-dwelling veterans and caregivers as an extension of their Interdisciplinary Memory Assessment Continuity Clinic (IMACC). Currently, the percentage of IMACC veterans/caregivers who have voluntarily signed up for the program is nearly 30%. About 70% of the families that have enrolled to date have their video visits with their spouse caregivers.
Veterans participating in the home video telehealth program have had at least 1 in-person visit at the Bedford IMACC before being invited to join. Veterans and their caregivers are invited to participate in the GRECC home telehealth program either at the time of an in-person IMACC visit or afterward via a telephone call from either a provider or a member of the telehealth staff.
Telehealth visits are offered as a supplement to regularly scheduled in-person visits, not as a substitute. The frequency of telehealth visits is individualized, depending on the medical status of the veteran and preferences of the caregiver. Some participating families, finding the telehealth format much more convenient, have asked whether they could postpone upcoming in-person visits at the VAMC. Many patients are particularly interested in minimizing medical visits in the winter months in New England.
Case Example
A male World War II veteran with moderate stage dementia lived with his wife in an apartment down the street from his adult son and daughter-in-law. His son and daughter-in-law visited and helped with the veteran’s care most days, but his wife was his primary caregiver. However, due to her own mobility issues, she was unable to attend the veteran’s in-person IMACC initial evaluation or subsequent follow-up visit.
This family enthusiastically embraced the opportunity to participate in the home video telehealth program and had multiple telehealth visits. During these video encounters, the veteran, his wife, and his son and daughter-in-law were present. The clinician, communicating via computer from the Bedford VAMC, was able to hear from all the caregivers, observe the veteran as he interacted with each person, and watch as he walked within the comfort and familiarity of his home.
Based on these observations, the veteran was clearly at risk for falls. The clinician ordered a home safety consultation as a result. Thus the home video telehealth program allowed this veteran’s mobility-impaired wife to participate directly in his dementia care. It gave the clinician an opportunity to spot potential fall risks within the veteran’s home before a disabling fall and provided the entire family with additional, convenient dementia-related care beyond the standard in-person VAMC visits.
Establishing Home Video Links
Veterans must already have broadband Internet access and a home computer or laptop to participate in the program. To assess the connectivity status and computer comfort level of the family, a Bedford VAMC telehealth technician calls the caregiver to assess their computer, operating system, presence of a webcam, and Internet service provider.
In addition to assessing the equipment necessary for the telehealth visit, the Bedford VAMC telehealth team also determines whether or not the caregiver has had experience with videoconferencing. Based on this information, the proper level of support is given to the family for both the initial software and, when necessary, VA-provided webcam installation.
On a few occasions, program staff have visited the veteran’s home to install the software and camera. Thus the telehealth program is fit to the family needs and resources to ensure a successful visit. The Bedford VAMC telehealth team provides enrolled families with live phone-based support for download and installation of the VA-approved videoconferencing software and webcam. For each scheduled video telehealth visit, a telehealth technician is available via phone to assist the caregiver with initiating the video call to the clinician.
Next Steps
GRECC neurologist Lauren Moo, MD, is leading this telehealth initiative as a clinical demonstration project and is studying implementation of the service. Dr. Moo is collecting data on whether IMACC veterans/caregivers accept or decline enrollment and their reasons for declining. The goal is to empirically determine the degree to which age, Internet access, and other variables are barriers to wider adoption.
Dr. Moo predicts that the improved access to clinical care offered by home video telehealth will translate into reduced hotline calls, emergency department visits, and delay in community living center placement. Easier access should facilitate earlier intervention for common dementia-related issues, such as fall risk, behavioral symptoms, and disruption of circadian rhythm, thereby improving quality of life and reducing overall health care utilization for this growing population of veterans.
There is the perception that geriatric veterans are not “wired” for Internet-based communications or lack the technical proficiency to use current and evolving technologies. However, a recent national survey suggests that while only 34% of those aged > 75 years use the Internet, there has been a significant jump in the percentage of Americans aged ≥ 65 years that use the Internet or e-mail: from 40% in 2010 to 53% in 2012.5
Once online, 70% of adults aged ≥ 65 years use the Internet on a typical day, suggesting that when given the necessary tools and training, seniors are enthusiastic technology adopters.5 Thus, it is anticipated that the number of geriatric veterans interested in and able to take advantage of the in-home video visit format will grow rapidly in the near future. The initial enrollment rate at Bedford of 30% is expected to grow as families and providers become more familiar with this modality.
The Bedford VAMC is in an urban/suburban region with multiple Internet service providers, a relatively educated population, and comparatively low levels of poverty. As such, the Bedford VAMC veterans with dementia and their caregivers are likely a best-case scenario population in which to pilot this dementia home telehealth program. If the preliminary success of this pilot program is sustained, expansion to a broader range of home telehealth services, such as social work and home safety assessments, to more rural settings would be the logical next steps.
Author disclosures
The authors report no actual or potential conflicts of interest with regard to this article.
Disclaimer
The opinions expressed herein are those of the authors and do not necessarily reflect those of Federal Practitioner, Frontline Medical Communications Inc., the U.S. Government, or any of its agencies. This article may discuss unlabeled or investigational use of certain drugs. Please review the complete prescribing information for specific drugs or drug combinations—including indications, contraindications, warnings, and adverse effects—before administering pharmacologic therapy to patients.
1. Thies W, Bleiler L; Alzheimer’s Association. 2013 Alzheimer’s disease facts and figures. Alzheimers Dement. 2013;9(2):208-245.
2. Kolanowski AM, Fick D, Waller JL, Shea D. Spouses of persons with dementia: Their healthcare problems, utilization, and costs. Res Nurs Health. 2004;27(5):296-306.
3. Veterans Health Administration Office of the Assistant Deputy Under Secretary for Health for Policy and Planning. Projections of the prevalence and incidence of dementias including Alzheimer’s Disease for the total, enrolled, and patient veteran populations age 65 or over. U.S. Department of Veterans Affairs Website. http://www4.va.gov/healthpolicyplanning/dementia/Dem022004.pdf. Published February 20, 2004. Accessed October 10, 2014.
4. Lyketsos CG, Lopez O, Jones B, Fitzpatrick AL, Breitner J, DeKosky S. Prevalence of neuropsychiatric symptoms in dementia and mild cognitive impairment: Results from the cardiovascular health study. JAMA. 2002;288(12):1475-1483.
5. Zickuhr K, Madden M. Older adults and Internet use. Pew Research Center’s Internet & American Life Project Website. http://pewinternet.org/Reports/2012/Older-adults-and-internet-use.aspx. Updated June 6, 2012. Accessed October 17, 2014.
For nearly 4 decades, the unifying focus of the 2-site New England Geriatric Research Education and Clinical Center (GRECC) has been on dementia and related disorders. Veterans with dementia are an extremely vulnerable population with high rates of health care use that is projected to total > $203 billion in the U.S. in 2013.1 Their caregivers are also among the most burdened, having provided about 17.5 billion hours of unpaid care in 2012, which is valued at more than $216 billion.1 Additionally, spouses, who are the most common caregivers of persons with dementia, often experience poor health outcomes related to the experience of living with the afflicted spouse.2
Currently > 200,000 VA patients have dementia, and that number is expected to increase.3 Dementia is largely a disease of the elderly; thus, many veterans with dementia also have other medical and orthopedic conditions that increase their frailty and decrease their mobility. Behavioral and psychological symptoms are present in > 75% of people with dementia, contributing to the relative isolation of both those with dementia and their families.4
Disruption in routine and removal from familiar surroundings can cause many patients, particularly in the moderate stages of dementia, to become disoriented and agitated. For these patients, VA clinics can be unsettling and may reveal behavior that is not the same as the veterans’ behavior at home. For these reasons, veterans with dementia likely may benefit from remote access to health care via telehealth. However, current telehealth applications for this population are vastly underdeveloped.
Video Dementia Management
Many GRECCs and other VA geriatric programs provide video-based dementia evaluations and management at community-based outpatient clinics (CBOCs) affiliated with their medical centers. At this point, close to a dozen GRECC and geriatric programs nationally have geriatric psychiatrists, geriatricians, or neurologists conducting such visits from their office or clinic space with video links to a telehealth-enabled room in the corresponding CBOC.
The visits usually entail having the veteran and, when appropriate, a family member check in at the local CBOC for the appointment and receiving assistance throughout the video visit from the telehealth technician at the CBOC.
The technician assists with the technical aspects of the encounter, including establishing and maintaining the video link to the VA medical center (VAMC), and often is trained to administer a brief standardized mental status assessment. The telehealth technician also helps pass along the physician’s written recommendations to the veteran and family once the recommendation summary has been sent by e-mail or printed on the CBOC printer. These VAMC-CBOC video telehealth programs have been very popular with veterans, particularly those in rural settings, since traveling to the CBOC is usually more convenient.
Home-based Video Program
While CBOC-based video telehealth programs expand the population of veterans able to benefit from specialty dementia care, any travel out of the home can be challenging or disruptive for many veterans and their families. In addition, the performance and demeanor of a veteran with dementia in a clinic setting is sometimes different from that which the family describes as their more typical behavior at home.
A new in-home video telehealth program developed by the GRECC at the Edith Nourse Rogers Memorial Veterans Hospital in Bedford is addressing these issues. The Bedford site of the New England GRECC offers in-home clinical video telehealth services to community-dwelling veterans and caregivers as an extension of their Interdisciplinary Memory Assessment Continuity Clinic (IMACC). Currently, the percentage of IMACC veterans/caregivers who have voluntarily signed up for the program is nearly 30%. About 70% of the families that have enrolled to date have their video visits with their spouse caregivers.
Veterans participating in the home video telehealth program have had at least 1 in-person visit at the Bedford IMACC before being invited to join. Veterans and their caregivers are invited to participate in the GRECC home telehealth program either at the time of an in-person IMACC visit or afterward via a telephone call from either a provider or a member of the telehealth staff.
Telehealth visits are offered as a supplement to regularly scheduled in-person visits, not as a substitute. The frequency of telehealth visits is individualized, depending on the medical status of the veteran and preferences of the caregiver. Some participating families, finding the telehealth format much more convenient, have asked whether they could postpone upcoming in-person visits at the VAMC. Many patients are particularly interested in minimizing medical visits in the winter months in New England.
Case Example
A male World War II veteran with moderate stage dementia lived with his wife in an apartment down the street from his adult son and daughter-in-law. His son and daughter-in-law visited and helped with the veteran’s care most days, but his wife was his primary caregiver. However, due to her own mobility issues, she was unable to attend the veteran’s in-person IMACC initial evaluation or subsequent follow-up visit.
This family enthusiastically embraced the opportunity to participate in the home video telehealth program and had multiple telehealth visits. During these video encounters, the veteran, his wife, and his son and daughter-in-law were present. The clinician, communicating via computer from the Bedford VAMC, was able to hear from all the caregivers, observe the veteran as he interacted with each person, and watch as he walked within the comfort and familiarity of his home.
Based on these observations, the veteran was clearly at risk for falls. The clinician ordered a home safety consultation as a result. Thus the home video telehealth program allowed this veteran’s mobility-impaired wife to participate directly in his dementia care. It gave the clinician an opportunity to spot potential fall risks within the veteran’s home before a disabling fall and provided the entire family with additional, convenient dementia-related care beyond the standard in-person VAMC visits.
Establishing Home Video Links
Veterans must already have broadband Internet access and a home computer or laptop to participate in the program. To assess the connectivity status and computer comfort level of the family, a Bedford VAMC telehealth technician calls the caregiver to assess their computer, operating system, presence of a webcam, and Internet service provider.
In addition to assessing the equipment necessary for the telehealth visit, the Bedford VAMC telehealth team also determines whether or not the caregiver has had experience with videoconferencing. Based on this information, the proper level of support is given to the family for both the initial software and, when necessary, VA-provided webcam installation.
On a few occasions, program staff have visited the veteran’s home to install the software and camera. Thus the telehealth program is fit to the family needs and resources to ensure a successful visit. The Bedford VAMC telehealth team provides enrolled families with live phone-based support for download and installation of the VA-approved videoconferencing software and webcam. For each scheduled video telehealth visit, a telehealth technician is available via phone to assist the caregiver with initiating the video call to the clinician.
Next Steps
GRECC neurologist Lauren Moo, MD, is leading this telehealth initiative as a clinical demonstration project and is studying implementation of the service. Dr. Moo is collecting data on whether IMACC veterans/caregivers accept or decline enrollment and their reasons for declining. The goal is to empirically determine the degree to which age, Internet access, and other variables are barriers to wider adoption.
Dr. Moo predicts that the improved access to clinical care offered by home video telehealth will translate into reduced hotline calls, emergency department visits, and delay in community living center placement. Easier access should facilitate earlier intervention for common dementia-related issues, such as fall risk, behavioral symptoms, and disruption of circadian rhythm, thereby improving quality of life and reducing overall health care utilization for this growing population of veterans.
There is the perception that geriatric veterans are not “wired” for Internet-based communications or lack the technical proficiency to use current and evolving technologies. However, a recent national survey suggests that while only 34% of those aged > 75 years use the Internet, there has been a significant jump in the percentage of Americans aged ≥ 65 years that use the Internet or e-mail: from 40% in 2010 to 53% in 2012.5
Once online, 70% of adults aged ≥ 65 years use the Internet on a typical day, suggesting that when given the necessary tools and training, seniors are enthusiastic technology adopters.5 Thus, it is anticipated that the number of geriatric veterans interested in and able to take advantage of the in-home video visit format will grow rapidly in the near future. The initial enrollment rate at Bedford of 30% is expected to grow as families and providers become more familiar with this modality.
The Bedford VAMC is in an urban/suburban region with multiple Internet service providers, a relatively educated population, and comparatively low levels of poverty. As such, the Bedford VAMC veterans with dementia and their caregivers are likely a best-case scenario population in which to pilot this dementia home telehealth program. If the preliminary success of this pilot program is sustained, expansion to a broader range of home telehealth services, such as social work and home safety assessments, to more rural settings would be the logical next steps.
Author disclosures
The authors report no actual or potential conflicts of interest with regard to this article.
Disclaimer
The opinions expressed herein are those of the authors and do not necessarily reflect those of Federal Practitioner, Frontline Medical Communications Inc., the U.S. Government, or any of its agencies. This article may discuss unlabeled or investigational use of certain drugs. Please review the complete prescribing information for specific drugs or drug combinations—including indications, contraindications, warnings, and adverse effects—before administering pharmacologic therapy to patients.
1. Thies W, Bleiler L; Alzheimer’s Association. 2013 Alzheimer’s disease facts and figures. Alzheimers Dement. 2013;9(2):208-245.
2. Kolanowski AM, Fick D, Waller JL, Shea D. Spouses of persons with dementia: Their healthcare problems, utilization, and costs. Res Nurs Health. 2004;27(5):296-306.
3. Veterans Health Administration Office of the Assistant Deputy Under Secretary for Health for Policy and Planning. Projections of the prevalence and incidence of dementias including Alzheimer’s Disease for the total, enrolled, and patient veteran populations age 65 or over. U.S. Department of Veterans Affairs Website. http://www4.va.gov/healthpolicyplanning/dementia/Dem022004.pdf. Published February 20, 2004. Accessed October 10, 2014.
4. Lyketsos CG, Lopez O, Jones B, Fitzpatrick AL, Breitner J, DeKosky S. Prevalence of neuropsychiatric symptoms in dementia and mild cognitive impairment: Results from the cardiovascular health study. JAMA. 2002;288(12):1475-1483.
5. Zickuhr K, Madden M. Older adults and Internet use. Pew Research Center’s Internet & American Life Project Website. http://pewinternet.org/Reports/2012/Older-adults-and-internet-use.aspx. Updated June 6, 2012. Accessed October 17, 2014.