User login
Audit and Feedback: A Quality Improvement Study to Improve Antimicrobial Stewardship
Antibiotics are commonly overused for several viral respiratory conditions where antibiotic treatment is not clinically indicated. For example, a 2016 study by Fleming-Dutra and colleagues showed that at least 30% of all antibiotics prescribed in an outpatient setting were inappropriate and for acute bronchitis, antibiotic prescriptions were inappropriate in 50% of cases.1 Acute bronchitis is predominantly a viral illness where antibiotics should be rarely used.2-8 The Healthcare Effectiveness Data and Information Set has measured the avoidance of antibiotic treatment in adults with acute bronchitis since 2006. The National Committee for Quality Assurance reported in 2018 that about 75% of adults received antibiotics for acute bronchitis.9 Inappropriate antibiotic use contributes to antimicrobial resistance, resulting in the increase of morbidity and mortality of treatable infections.10 Reducing inappropriate antibiotic use in outpatient settings is a high-priority public health issue and is a Healthy People 2030 objective.11
Antimicrobial Stewardship
Antimicrobial stewardship programs measure and track how antibiotics are prescribed by health care providers (HCPs) and used by patients. The Centers for Disease Control and Prevention (CDC) created a framework for outpatient antimicrobial stewardship programs by outlining 4 core elements: (1) commitment from every person involved in patient care to act as an antibiotic steward; (2) policies and interventions to promote appropriate antibiotic prescribing practices; (3) antibiotic prescription tracking and reporting; and (4) appropriate antibiotic use education.12
Audit and feedback (A&F) is a form of antibiotic prescription tracking and reporting that involves measuring and comparing a HCP’s performance (ie, antibiotic prescribing) with a standard, and the results of this audit are shared with the HCP. This strategy is based on the belief that a HCP is motivated to modify practice habits when given feedback showing that his or her performance is inconsistent with targeted expectations. A&F is most effective when feedback is provided by a supervisor or respected peer, presented more than once, individualized, delivered in both verbal and written formats, and includes explicit targets and an action plan.13,14
This study focuses on an antimicrobial stewardship program implemented in an outpatient Indian Health Service ambulatory care clinic in the Pacific Northwest. The clinic was staffed by 9 HCPs serving about 12,000 American Indian and Alaskan Native patients. The clinic includes a full-service pharmacy where nearly all prescriptions issued by in-house HCPs are filled. The clinic’s antibiotic prescribing rate for adult patients with acute bronchitis was similar to the national mean in 2018 (75%).9 The study objective was to reduce the rate of potentially inappropriate (not guideline-concordant) antibiotic prescribing in patients with acute bronchitis without underlying chronic lung disease or evidence of bacterial infection through A&F.
Methods
The antimicrobial stewardship program was implemented by 3 pharmacists, including a pharmacy resident. HCPs received education by pharmacy staff on evidence-based prescribing for adult acute bronchitis and quarterly feedback on antibiotic prescribing rates. All prescribing and dispensing records necessary for the program were available in the clinic electronic health record. The rate of potentially inappropriate antibiotic prescribing was calculated as the proportion of eligible bronchitis cases who received antibiotics.
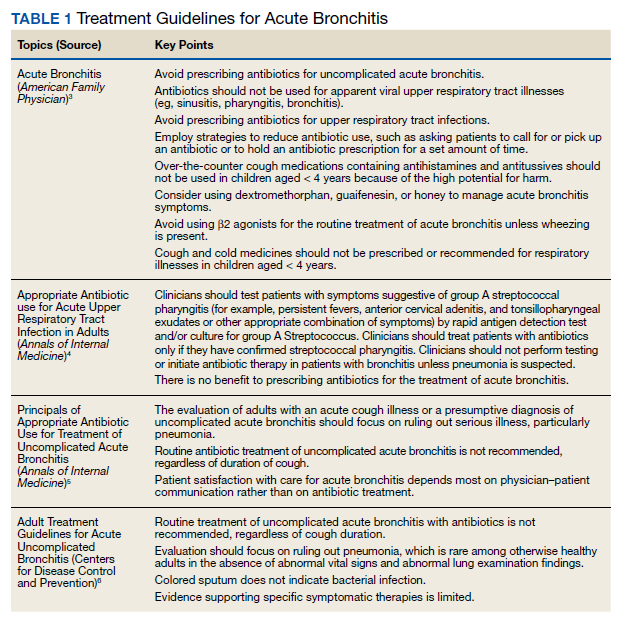
In October 2018, a 60-minute educational session was provided by 2 pharmacists to HCPs. The material covered an overview of acute bronchitis presentation, diagnosis, treatment (Table 1), and a comparison of national and local prescribing data (baseline audit).2-4 The educational session concluded with prescription strategies to reduce inappropriate antibiotic prescribing, including but not limited to: delayed prescriptions, patient and caregiver education, use of nonantibiotic medications to control symptoms, and use of A&F reports.5-8 At the conclusion of the session, HCPs committed to engage in the antimicrobial stewardship program.
Audit
To determine the total number of eligible bronchitis cases (denominator), a visit report was generated by a pharmacist for a primary diagnosis of acute bronchitis using International Statistical Classification of Diseases, Tenth Revision (ICD 10) codes (J20.3 - J20.9) for the review period. Only adults aged ≥ 18 years were included. Patients with a chronic lung disease (eg, chronic obstructive pulmonary disease, asthma) and those who had a concomitant bacterial infection (eg, urinary tract infection, cellulitis) were excluded. A visit for acute bronchitis that included additional ICD 10 codes indicating the patient had a chronic lung disease or concomitant bacterial infection were used to determine exclusion. The remaining patients who received a potentially inappropriate antibiotic prescription (numerator) were those who were prescribed or dispensed antibiotics on the date of service.
Feedback
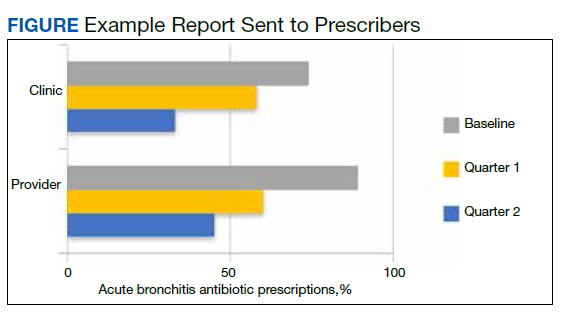
Baseline data were presented to HCPs during the educational session in October 2018. Prospective audits were performed quarterly thereafter (January, April, and July) by the pharmacy resident using the criteria described above. Audit data were compiled into personalized reports and provided to HCPs by the pharmacy resident with written and verbal individual feedback. Written feedback was sent by email to each HCP containing the HCP’s rate, the clinic rate in aggregate, rates from the prior year and quarter(s) for comparison, and clinical pearls from the guidelines (Figure). Verbal feedback included a review of the written feedback and answering any questions concerning the report.
Implementation
Study periods were chosen to coincide with the pharmacy residency training year, which starts in July and ends in June. The start date of October 2018 differed from the start of the residency year (July 2018) owing to delays in obtaining permissions. A&F and analysis of prescribing rates continued through the end of the residency year, for total duration of 9 months (October 1, 2018 to June 30, 2019). For ease of reporting, quarterly reports followed the federal government’s fiscal year (FY) which runs from October 1 of the prior calendar year through September 30 of the year being described. HCPs received 4 feedback reports: baseline (October 1, 2018 - June 30, 2018) in October 2018, quarter 1 (October 1, 2018 - December 31, 2018) in January 2019, quarter 2 (January 1, 2019 - March 31, 2019) in April 2019, and quarter 3 (April 1, 2019 - June 30, 2019) in July 2019.
Statistical Analysis
Prescribing rates were compared between identical 9 -month periods. A 2-sample binomial test for proportions was used to derive an approximate CI of prescribing rates at the patient level. However, to account for clustering of patients within HCP panels and dependence of observations over study periods stemming from examining the same HCPs within each of the periods, the Wilcoxon signed rank test for paired data was used to evaluate prescribing rates at the HCP level. Statistical analysis was performed using R statistical software version 4.0.3. Differences were considered significant at P < .05 set a priori.
This study was approved by the Portland Area Indian Health Service Institutional Review Board (Study ID: 1316730).
Results
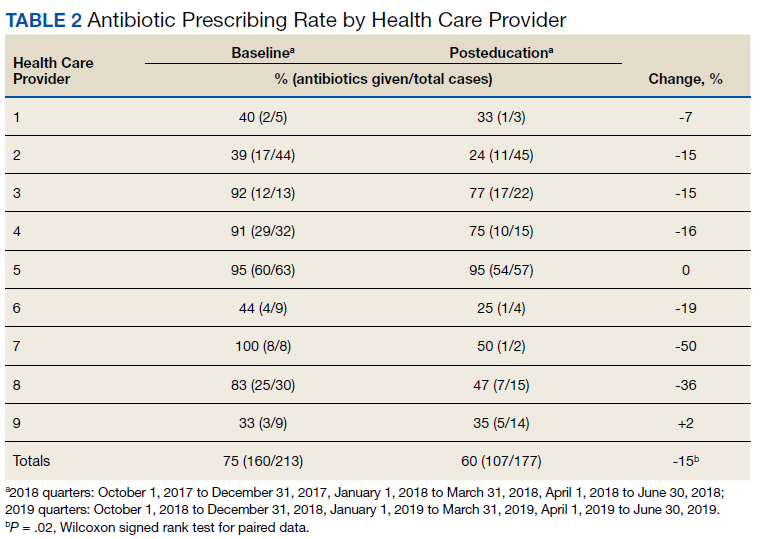
All 9 HCPs who see adult patients at the clinic agreed to participate and were all fully present in each study period. Among HCPs, there were 5 physicians and 4 physician assistants or nurse practitioners. There was a total of 213 visits that met study criteria during the baseline period (October 1, 2017 to June 30, 2018) and 177 visits in the posteducation period (October 1, 2018 to June 30, 2019). The total number of acute bronchitis encounters varied by HCP (Ranges, 5-63 [baseline] and 2-57 [posteducation]); however, the relative number of encounters each HCP contributed was similar in each study period (Table 2). The pharmacy resident spent about 2 hours each quarter to generate 9 feedback reports, 1 for each HCP.
Antibiotic Prescribing
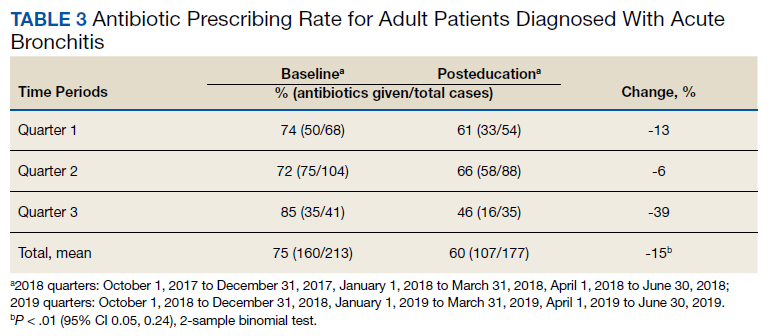
Antibiotic prescribing rates decreased from 75% at baseline to 60% at posteducation month 9 (absolute difference, -15% [95% CI, 5 - 24%]; P ≤ .01) (Table 3). The clinic rate was lower for each quarter in FY 2019 (posteducation) compared with the same quarter of FY 2018 (baseline), with the lowest rate observed in the final quarter of the study. Comparing pre- and post- A&F, the rates for HCPs prescribing antibiotics were lower for 7 HCPs, unchanged for 1 HCP, and slightly increased for 1 HCP(P = .02).
Discussion
Acute bronchitis remains a common diagnosis where antibiotics are prescribed despite being a predominately viral illness. Guidelines and evidence-based practices advise against antibiotics for this diagnosis. According to the American Academy of Family Physicians, antibiotics are reserved for cases where chronic lung disease is present as these patients are at a high risk of developing pneumonia.3 The decision to prescribe antibiotics is complex and driven by several interdependent factors, such as patient expectations, health system limitations, clinician training, and specialty.15 HCPs may more aggressively treat acute bronchitis among American Indian/Alaskan Native (AI/AN) people due to a high risk of developing serious complications from respiratory illnesses.16 A clinician’s background, usual patient cohort (ie, mostly pediatric or geriatric), and time spent in urgent care or in activities outside of patient care (administration) may account for the difference in patient encounters by HCP for acute bronchitis.
Following the CDC framework, this antimicrobial stewardship program helped empower people involved in patient care (eg, pharmacists, HCPs), educate staff on proper use of antibiotics for acute bronchitis, and track and report antibiotic prescribing through the A&F process. Educational interventions coupled with ongoing A&F are reproducible by other health care facilities and are not usually time consuming. This study showcases a successful example of implementing A&F in an antimicrobial stewardship quality improvement project that could be translated toward other conditions (eg, sinusitis, urinary tract infection, community-acquired pneumonia).
In a similar study, Meeker and colleagues used a variation of an A&F intervention using a monthly email showing peer comparisons to notify clinicians who were prescribing too many unnecessary antibiotics for common respiratory illnesses that did not require antibiotics, such as the common cold.17 The peer comparison intervention arm emailed a rank order that listed prescribers by the number of prescriptions for common respiratory illnesses. This intervention demonstrated a reduction of 5.2% in inappropriate antibiotic prescribing.
Limitations
This quality improvement study had several limitations. The study did not account for the duration of symptoms as a factor to judge appropriateness. Although this was identified early in the study, it was unavoidable since there was no report that could extract the duration of symptoms in the electronic health record. Future studies should consider a manual review of each encounter to overcome this limitation. Another limitation was that only three-quarters of the year and not the entire year were reviewed. Future studies should include longer time frames to measure the durability of changes to antibiotic prescriptions. Lastly, the study did not assess diagnosis shifting (the practice of changing the proportion of antibiotic-appropriate acute respiratory tract infection diagnosis over time), effects of patient demographics (patient age and sex were not recorded), or any sustained effect on prescribing rates after the study ended.
Conclusions
Clinician education coupled with A&F are components of the CDC’s framework for an effective antimicrobial stewardship program. The intervention seem to be an effective means toward reducing inappropriate antibiotic prescribing for acute bronchitis and has the potential for application to other antimicrobial stewardship initiatives. The present study adds to the growing body of evidence on the importance and impact an antimicrobial stewardship program has on a clinic or health system.
Acknowledgment
The results of this study have been reported at the 2019 IHS Southwest Regional Pharmacy Continuing Education Seminar, April 12-14, 2019.
1. Fleming-Dutra KE, Hersh AL, Shapiro DJ, et al. Prevalence of inappropriate antibiotic prescriptions among US ambulatory care visits, 2010-2011. JAMA. 2016;315(17):1864-1873. doi:10.1001/jama.2016.4151
2. Barnett ML, Linder JA. Antibiotic prescribing for adults with acute bronchitis in the United States, 1996-2010. JAMA. 2014;311(19):2020-2022. doi:10.1001/jama.2013.286141
3. Kinkade S, Long NA. Acute bronchitis. Am Fam Physician. 2016;94(7):560-565.
4. Harris AM, Hicks LA, Qaseem A; High Value Care Task Force of the American College of Physicians and for the Centers for Disease Control and Prevention. Appropriate antibiotic use for acute respiratory tract infection in adults: advice for high-value care from the American College of Physicians and the Centers for Disease Control and Prevention. Ann Intern Med. 2016;164(6):425-434. doi:10.7326/M15-1840
5. Gonzales R, Bartlett JG, Besser RE, et al. Principles of appropriate antibiotic use for treatment of uncomplicated acute bronchitis: background. Ann Intern Med. 2001;134(6):521-529. doi:10.7326/0003-4819-134-6-200103200-00021
6. Centers for Disease Control and Prevention. Adult outpatient treatment recommendations. Updated October 3, 2017. Accessed May 19, 2021. www.cdc.gov/antibiotic-use/community/for-hcp/outpatient-hcp/adult-treatment-rec.html
7. Braman SS. Chronic cough due to chronic bronchitis: ACCP evidence-based clinical practice guidelines. Chest. 2006;129(1 suppl):104S-115S. doi:10.1378/chest.129.1_suppl.104S
8. Petersen I, Johnson AM, Islam A, Duckworth G, Livermore DM, Hayward AC. Protective effect of antibiotics against serious complications of common respiratory tract infections: retrospective cohort study with the UK General Practice Research Database. BMJ. 2007;335(7627):982. doi:10.1136/bmj.39345.405243.BE
9. National Committee for Quality Assurance. Avoidance of antibiotic treatment in adults with acute bronchitis (AAB). Accessed May 19, 2021. https://www.ncqa.org/hedis/measures/avoidance-of-antibiotic-treatment-in-adults-with-acute-bronchitis
10. Centers for Disease Control and Prevention. Antibiotic resistance threats in the United States, 2013. Published April 23, 2013. Accessed May 19, 2021. https://www.cdc.gov/drugresistance/threat-report-2013/pdf/ar-threats-2013-508.pdf
11. US Department of Health and Human Services, Office of Disease Prevention and Health Promotion. Healthy People 2030: reduce inappropriate antibiotic use in outpatient settings — HAI‑D01. Accessed May 19, 2021. https://health.gov/healthypeople/objectives-and-data/browse-objectives/healthcare-associated-infections/reduce-inappropriate-antibiotic-use-outpatient-settings-hai-d01
12. Sanchez GV, Fleming-Dutra KE, Roberts RM, Hicks LA. Core elements of outpatient antibiotic stewardship. MMWR Recomm Rep. 2016;65(6):1-12. Published 2016 Nov 11. doi:10.15585/mmwr.rr6506a1
13. Ivers N, Jamtvedt G, Flottorp S, et al. Audit and feedback: effects on professional practice and healthcare outcomes. Cochrane Database Syst Rev. 2012;(6):CD000259. Published 2012 Jun 13. doi:10.1002/14651858.CD000259.pub3
14. Ivers NM, Grimshaw JM, Jamtvedt G, et al. Growing literature, stagnant science? Systematic review, meta-regression and cumulative analysis of audit and feedback interventions in health care. J Gen Intern Med. 2014;29(11):1534-1541. doi:10.1007/s11606-014-2913-y
15. Ranji SR, Steinman MA, Shojania KG, et al. Closing the Quality Gap: A Critical Analysis of Quality Improvement Strategies. Vol. 4: Antibiotic Prescribing Behavior. Agency for Healthcare Research and Quality (US); 2006. Accessed May 20, 2021. https://www.ncbi.nlm.nih.gov/books/NBK43956/
16. Groom AV, Hennessy TW, Singleton RJ, Butler JC, Holve S, Cheek JE. Pneumonia and influenza mortality among American Indian and Alaska Native people, 1990-2009. Am J Public Health. 2014;104 Suppl 3(suppl 3):S460-S469. doi:10.2105/AJPH.2013.301740
17. Meeker D, Linder JA, Fox CR, et al. Effect of behavioral interventions on inappropriate antibiotic prescribing among primary care practices: a randomized clinical trial. JAMA. 2016;315(6):562-570. doi:10.1001/jama.2016.0275
Antibiotics are commonly overused for several viral respiratory conditions where antibiotic treatment is not clinically indicated. For example, a 2016 study by Fleming-Dutra and colleagues showed that at least 30% of all antibiotics prescribed in an outpatient setting were inappropriate and for acute bronchitis, antibiotic prescriptions were inappropriate in 50% of cases.1 Acute bronchitis is predominantly a viral illness where antibiotics should be rarely used.2-8 The Healthcare Effectiveness Data and Information Set has measured the avoidance of antibiotic treatment in adults with acute bronchitis since 2006. The National Committee for Quality Assurance reported in 2018 that about 75% of adults received antibiotics for acute bronchitis.9 Inappropriate antibiotic use contributes to antimicrobial resistance, resulting in the increase of morbidity and mortality of treatable infections.10 Reducing inappropriate antibiotic use in outpatient settings is a high-priority public health issue and is a Healthy People 2030 objective.11
Antimicrobial Stewardship
Antimicrobial stewardship programs measure and track how antibiotics are prescribed by health care providers (HCPs) and used by patients. The Centers for Disease Control and Prevention (CDC) created a framework for outpatient antimicrobial stewardship programs by outlining 4 core elements: (1) commitment from every person involved in patient care to act as an antibiotic steward; (2) policies and interventions to promote appropriate antibiotic prescribing practices; (3) antibiotic prescription tracking and reporting; and (4) appropriate antibiotic use education.12
Audit and feedback (A&F) is a form of antibiotic prescription tracking and reporting that involves measuring and comparing a HCP’s performance (ie, antibiotic prescribing) with a standard, and the results of this audit are shared with the HCP. This strategy is based on the belief that a HCP is motivated to modify practice habits when given feedback showing that his or her performance is inconsistent with targeted expectations. A&F is most effective when feedback is provided by a supervisor or respected peer, presented more than once, individualized, delivered in both verbal and written formats, and includes explicit targets and an action plan.13,14
This study focuses on an antimicrobial stewardship program implemented in an outpatient Indian Health Service ambulatory care clinic in the Pacific Northwest. The clinic was staffed by 9 HCPs serving about 12,000 American Indian and Alaskan Native patients. The clinic includes a full-service pharmacy where nearly all prescriptions issued by in-house HCPs are filled. The clinic’s antibiotic prescribing rate for adult patients with acute bronchitis was similar to the national mean in 2018 (75%).9 The study objective was to reduce the rate of potentially inappropriate (not guideline-concordant) antibiotic prescribing in patients with acute bronchitis without underlying chronic lung disease or evidence of bacterial infection through A&F.
Methods
The antimicrobial stewardship program was implemented by 3 pharmacists, including a pharmacy resident. HCPs received education by pharmacy staff on evidence-based prescribing for adult acute bronchitis and quarterly feedback on antibiotic prescribing rates. All prescribing and dispensing records necessary for the program were available in the clinic electronic health record. The rate of potentially inappropriate antibiotic prescribing was calculated as the proportion of eligible bronchitis cases who received antibiotics.
In October 2018, a 60-minute educational session was provided by 2 pharmacists to HCPs. The material covered an overview of acute bronchitis presentation, diagnosis, treatment (Table 1), and a comparison of national and local prescribing data (baseline audit).2-4 The educational session concluded with prescription strategies to reduce inappropriate antibiotic prescribing, including but not limited to: delayed prescriptions, patient and caregiver education, use of nonantibiotic medications to control symptoms, and use of A&F reports.5-8 At the conclusion of the session, HCPs committed to engage in the antimicrobial stewardship program.
Audit
To determine the total number of eligible bronchitis cases (denominator), a visit report was generated by a pharmacist for a primary diagnosis of acute bronchitis using International Statistical Classification of Diseases, Tenth Revision (ICD 10) codes (J20.3 - J20.9) for the review period. Only adults aged ≥ 18 years were included. Patients with a chronic lung disease (eg, chronic obstructive pulmonary disease, asthma) and those who had a concomitant bacterial infection (eg, urinary tract infection, cellulitis) were excluded. A visit for acute bronchitis that included additional ICD 10 codes indicating the patient had a chronic lung disease or concomitant bacterial infection were used to determine exclusion. The remaining patients who received a potentially inappropriate antibiotic prescription (numerator) were those who were prescribed or dispensed antibiotics on the date of service.
Feedback
Baseline data were presented to HCPs during the educational session in October 2018. Prospective audits were performed quarterly thereafter (January, April, and July) by the pharmacy resident using the criteria described above. Audit data were compiled into personalized reports and provided to HCPs by the pharmacy resident with written and verbal individual feedback. Written feedback was sent by email to each HCP containing the HCP’s rate, the clinic rate in aggregate, rates from the prior year and quarter(s) for comparison, and clinical pearls from the guidelines (Figure). Verbal feedback included a review of the written feedback and answering any questions concerning the report.
Implementation
Study periods were chosen to coincide with the pharmacy residency training year, which starts in July and ends in June. The start date of October 2018 differed from the start of the residency year (July 2018) owing to delays in obtaining permissions. A&F and analysis of prescribing rates continued through the end of the residency year, for total duration of 9 months (October 1, 2018 to June 30, 2019). For ease of reporting, quarterly reports followed the federal government’s fiscal year (FY) which runs from October 1 of the prior calendar year through September 30 of the year being described. HCPs received 4 feedback reports: baseline (October 1, 2018 - June 30, 2018) in October 2018, quarter 1 (October 1, 2018 - December 31, 2018) in January 2019, quarter 2 (January 1, 2019 - March 31, 2019) in April 2019, and quarter 3 (April 1, 2019 - June 30, 2019) in July 2019.
Statistical Analysis
Prescribing rates were compared between identical 9 -month periods. A 2-sample binomial test for proportions was used to derive an approximate CI of prescribing rates at the patient level. However, to account for clustering of patients within HCP panels and dependence of observations over study periods stemming from examining the same HCPs within each of the periods, the Wilcoxon signed rank test for paired data was used to evaluate prescribing rates at the HCP level. Statistical analysis was performed using R statistical software version 4.0.3. Differences were considered significant at P < .05 set a priori.
This study was approved by the Portland Area Indian Health Service Institutional Review Board (Study ID: 1316730).
Results
All 9 HCPs who see adult patients at the clinic agreed to participate and were all fully present in each study period. Among HCPs, there were 5 physicians and 4 physician assistants or nurse practitioners. There was a total of 213 visits that met study criteria during the baseline period (October 1, 2017 to June 30, 2018) and 177 visits in the posteducation period (October 1, 2018 to June 30, 2019). The total number of acute bronchitis encounters varied by HCP (Ranges, 5-63 [baseline] and 2-57 [posteducation]); however, the relative number of encounters each HCP contributed was similar in each study period (Table 2). The pharmacy resident spent about 2 hours each quarter to generate 9 feedback reports, 1 for each HCP.
Antibiotic Prescribing
Antibiotic prescribing rates decreased from 75% at baseline to 60% at posteducation month 9 (absolute difference, -15% [95% CI, 5 - 24%]; P ≤ .01) (Table 3). The clinic rate was lower for each quarter in FY 2019 (posteducation) compared with the same quarter of FY 2018 (baseline), with the lowest rate observed in the final quarter of the study. Comparing pre- and post- A&F, the rates for HCPs prescribing antibiotics were lower for 7 HCPs, unchanged for 1 HCP, and slightly increased for 1 HCP(P = .02).
Discussion
Acute bronchitis remains a common diagnosis where antibiotics are prescribed despite being a predominately viral illness. Guidelines and evidence-based practices advise against antibiotics for this diagnosis. According to the American Academy of Family Physicians, antibiotics are reserved for cases where chronic lung disease is present as these patients are at a high risk of developing pneumonia.3 The decision to prescribe antibiotics is complex and driven by several interdependent factors, such as patient expectations, health system limitations, clinician training, and specialty.15 HCPs may more aggressively treat acute bronchitis among American Indian/Alaskan Native (AI/AN) people due to a high risk of developing serious complications from respiratory illnesses.16 A clinician’s background, usual patient cohort (ie, mostly pediatric or geriatric), and time spent in urgent care or in activities outside of patient care (administration) may account for the difference in patient encounters by HCP for acute bronchitis.
Following the CDC framework, this antimicrobial stewardship program helped empower people involved in patient care (eg, pharmacists, HCPs), educate staff on proper use of antibiotics for acute bronchitis, and track and report antibiotic prescribing through the A&F process. Educational interventions coupled with ongoing A&F are reproducible by other health care facilities and are not usually time consuming. This study showcases a successful example of implementing A&F in an antimicrobial stewardship quality improvement project that could be translated toward other conditions (eg, sinusitis, urinary tract infection, community-acquired pneumonia).
In a similar study, Meeker and colleagues used a variation of an A&F intervention using a monthly email showing peer comparisons to notify clinicians who were prescribing too many unnecessary antibiotics for common respiratory illnesses that did not require antibiotics, such as the common cold.17 The peer comparison intervention arm emailed a rank order that listed prescribers by the number of prescriptions for common respiratory illnesses. This intervention demonstrated a reduction of 5.2% in inappropriate antibiotic prescribing.
Limitations
This quality improvement study had several limitations. The study did not account for the duration of symptoms as a factor to judge appropriateness. Although this was identified early in the study, it was unavoidable since there was no report that could extract the duration of symptoms in the electronic health record. Future studies should consider a manual review of each encounter to overcome this limitation. Another limitation was that only three-quarters of the year and not the entire year were reviewed. Future studies should include longer time frames to measure the durability of changes to antibiotic prescriptions. Lastly, the study did not assess diagnosis shifting (the practice of changing the proportion of antibiotic-appropriate acute respiratory tract infection diagnosis over time), effects of patient demographics (patient age and sex were not recorded), or any sustained effect on prescribing rates after the study ended.
Conclusions
Clinician education coupled with A&F are components of the CDC’s framework for an effective antimicrobial stewardship program. The intervention seem to be an effective means toward reducing inappropriate antibiotic prescribing for acute bronchitis and has the potential for application to other antimicrobial stewardship initiatives. The present study adds to the growing body of evidence on the importance and impact an antimicrobial stewardship program has on a clinic or health system.
Acknowledgment
The results of this study have been reported at the 2019 IHS Southwest Regional Pharmacy Continuing Education Seminar, April 12-14, 2019.
1. Fleming-Dutra KE, Hersh AL, Shapiro DJ, et al. Prevalence of inappropriate antibiotic prescriptions among US ambulatory care visits, 2010-2011. JAMA. 2016;315(17):1864-1873. doi:10.1001/jama.2016.4151
2. Barnett ML, Linder JA. Antibiotic prescribing for adults with acute bronchitis in the United States, 1996-2010. JAMA. 2014;311(19):2020-2022. doi:10.1001/jama.2013.286141
3. Kinkade S, Long NA. Acute bronchitis. Am Fam Physician. 2016;94(7):560-565.
4. Harris AM, Hicks LA, Qaseem A; High Value Care Task Force of the American College of Physicians and for the Centers for Disease Control and Prevention. Appropriate antibiotic use for acute respiratory tract infection in adults: advice for high-value care from the American College of Physicians and the Centers for Disease Control and Prevention. Ann Intern Med. 2016;164(6):425-434. doi:10.7326/M15-1840
5. Gonzales R, Bartlett JG, Besser RE, et al. Principles of appropriate antibiotic use for treatment of uncomplicated acute bronchitis: background. Ann Intern Med. 2001;134(6):521-529. doi:10.7326/0003-4819-134-6-200103200-00021
6. Centers for Disease Control and Prevention. Adult outpatient treatment recommendations. Updated October 3, 2017. Accessed May 19, 2021. www.cdc.gov/antibiotic-use/community/for-hcp/outpatient-hcp/adult-treatment-rec.html
7. Braman SS. Chronic cough due to chronic bronchitis: ACCP evidence-based clinical practice guidelines. Chest. 2006;129(1 suppl):104S-115S. doi:10.1378/chest.129.1_suppl.104S
8. Petersen I, Johnson AM, Islam A, Duckworth G, Livermore DM, Hayward AC. Protective effect of antibiotics against serious complications of common respiratory tract infections: retrospective cohort study with the UK General Practice Research Database. BMJ. 2007;335(7627):982. doi:10.1136/bmj.39345.405243.BE
9. National Committee for Quality Assurance. Avoidance of antibiotic treatment in adults with acute bronchitis (AAB). Accessed May 19, 2021. https://www.ncqa.org/hedis/measures/avoidance-of-antibiotic-treatment-in-adults-with-acute-bronchitis
10. Centers for Disease Control and Prevention. Antibiotic resistance threats in the United States, 2013. Published April 23, 2013. Accessed May 19, 2021. https://www.cdc.gov/drugresistance/threat-report-2013/pdf/ar-threats-2013-508.pdf
11. US Department of Health and Human Services, Office of Disease Prevention and Health Promotion. Healthy People 2030: reduce inappropriate antibiotic use in outpatient settings — HAI‑D01. Accessed May 19, 2021. https://health.gov/healthypeople/objectives-and-data/browse-objectives/healthcare-associated-infections/reduce-inappropriate-antibiotic-use-outpatient-settings-hai-d01
12. Sanchez GV, Fleming-Dutra KE, Roberts RM, Hicks LA. Core elements of outpatient antibiotic stewardship. MMWR Recomm Rep. 2016;65(6):1-12. Published 2016 Nov 11. doi:10.15585/mmwr.rr6506a1
13. Ivers N, Jamtvedt G, Flottorp S, et al. Audit and feedback: effects on professional practice and healthcare outcomes. Cochrane Database Syst Rev. 2012;(6):CD000259. Published 2012 Jun 13. doi:10.1002/14651858.CD000259.pub3
14. Ivers NM, Grimshaw JM, Jamtvedt G, et al. Growing literature, stagnant science? Systematic review, meta-regression and cumulative analysis of audit and feedback interventions in health care. J Gen Intern Med. 2014;29(11):1534-1541. doi:10.1007/s11606-014-2913-y
15. Ranji SR, Steinman MA, Shojania KG, et al. Closing the Quality Gap: A Critical Analysis of Quality Improvement Strategies. Vol. 4: Antibiotic Prescribing Behavior. Agency for Healthcare Research and Quality (US); 2006. Accessed May 20, 2021. https://www.ncbi.nlm.nih.gov/books/NBK43956/
16. Groom AV, Hennessy TW, Singleton RJ, Butler JC, Holve S, Cheek JE. Pneumonia and influenza mortality among American Indian and Alaska Native people, 1990-2009. Am J Public Health. 2014;104 Suppl 3(suppl 3):S460-S469. doi:10.2105/AJPH.2013.301740
17. Meeker D, Linder JA, Fox CR, et al. Effect of behavioral interventions on inappropriate antibiotic prescribing among primary care practices: a randomized clinical trial. JAMA. 2016;315(6):562-570. doi:10.1001/jama.2016.0275
High Rate of Inappropriate Fecal Immunochemical Testing at a Large Veterans Affairs Health Care System
Colonoscopies and annual fecal immunochemical tests (FITs), are 2 of the preferred modalities for colorectal cancer (CRC) screening endorsed by the US Preventive Services Task Forces as well as the US Multi-Society Task Force of Colorectal Cancer, which represents the American Gastroenterological Association, American College of Gastroenterology, and the American Society of Gastrointestinal Endoscopy.1,2 The recommendations include proper patient selection (patients aged 50 - 75 years with a life expectancy of at least 10 years), and a discussion with the patient regarding both options.
Background
It is known that patients with a positive FIT are at an increased risk for CRC. Lee and colleagues found that patients who do not undergo subsequent colonoscopy after a positive FIT have a 1.64 relative risk of death from colon cancer compared with those who undergo follow-up colonoscopy.3 Studies also have shown that longer wait times (10 months vs 1 month) between a positive FIT and colonoscopy also are associated with a higher risk of CRC.4 FIT utilize antibodies specific for the globin moiety of human hemoglobin and measure the development of antibody-globin complexes using immunoassay techniques. FIT has largely replaced the fecal occult blood test (FOBT), which depends on the detection of heme in feces through oxidation.
A US Department of Veterans Affairs (VA) study found that a longer time to colonoscopy was associated with a higher risk of neoplasia in veterans with a positive FOBT (odds ratio [OR], 1.10).5 It is thus crucial that a positive FOBT or FIT be investigated with follow-up colonoscopy. However, a retrospective study at a single safety-net hospital in San Francisco found that only 55.6% of patients with a positive FIT completed colonoscopy within 1 year.6 Importantly, almost half the patients examined in this study lacked documentation of the result of the FIT or counseling regarding the significance of the positive FIT by the patient’s primary care provider who ordered the test. A VA study looked at veterans aged > 70 years at 4 VA medical centers who did not receive a follow-up colonoscopy within 1 year and reported that 26% of patients studied had a documented refusal to undergo colonoscopy.7
It also is clear that FOBT is used inappropriately for colon cancer screening in some patients. A 2005 single-center VA study looked at inappropriate fecal occult blood tests and found that 18% of veterans for whom FOBTs were ordered had a severe comorbid illness, 13% had signs or symptoms of gastrointestinal (GI) blood loss, and 7% had a history of colorectal neoplasia or inflammatory bowel disease.8 An additional national VA study looked at all veterans aged ≥ 50 years who underwent FOBT or screening colonoscopy between 2009 and 2011 and found 26% to be inappropriate (13.9% of veterans not due for screening, 7.8% with limited life expectancy, and 11% receiving a FOBT when colonoscopy was indicated).9
An often-misunderstood additional requirement in utilizing FIT for CRC screening is that negative tests should be repeated annually.2 A study from Kaiser Permanente in California found that 75.3 to 86.1% of eligible patients underwent yearly FIT.10 In this study, programmatic FIT detected 80.4% of all patients with CRC detected within 1 year of testing.
Since most of the VA-specific studies are based on inappropriate or inadequate use of FOBT, we feel it is essential that further data be gained on appropriate and inappropriate testing. The aim of this study is to determine the frequency at which improper FIT occurs because of failure to obtain serial FIT over time with a negative result, failure to follow-up a positive FIT result with a diagnostic colonoscopy, or performance of FIT in veterans undergoing a recent colonoscopy with adequate bowel preparation. This quality assurance study received an institutional review board exemption from the VA Pittsburgh Healthcare System (VAPHS) in Pennsylvania.
Methods
VAPHS has a data repository of all veterans served within the health care system, which was queried for all veterans who underwent a FIT in the system from January 1, 2015 through December 31, 2017 as well as the number and results of FITs during the interval. In addition, the data repository was also queried specifically for veterans who had at least 1 colonoscopy as well as FIT between 2015 and 2017. The ordering location for each FIT also was queried.
We made 3 calculations for this study. First, we measured the rate of a negative initial FIT in 2015 and/or 2016 followed by a second FIT in 2016 and/or 2017 in a random selection of veterans (3% SE, 95% CI). Demographics were compared in an equal random number of veterans who did and did not have a follow up FIT (5% SE, 95% CI of all negative FIT). Second, we measured the rate of completing colonoscopy following a positive FIT in a random selection of veterans (3% SE, 95% SI). Finally, we calculated FITs following a colonoscopy for all veterans.
Using a power analysis with a 3% SE and 95% CI for sample size calculation and accounting for the approximate 50% exclusion rate from the final eligible population of veterans with at least 1 negative FIT, a random sample of 1,742 patient charts with a negative FIT in the interval were then reviewed to determine the frequency with which they underwent multiple FITs in the interval as well as for the presence of exclusionary factors. Because of the large number of veterans involved in this category, a more detailed demographics review was performed of a subset of these patients using a 95% CI and 5% SE. Using a 95% CI and 3% SE, 445 veterans with a positive FIT in the interval were reviewed to determine the frequency at which they underwent a follow-up diagnostic colonoscopy.
Because of a relatively small sample size, all 108 veterans who underwent a colonoscopy followed by a FIT were reviewed to determine the reason for follow-up FIT. In addition, in veterans who then went on to have a subsequent repeat colonoscopy, the examination findings were recorded.
Results
From January 1, 2015 to December 31, 2017, 6,766 FIT, were ordered at VAPHS. Of these, 4,391 unique veterans had at least 1 negative FIT during the period and 709 unique veterans had a positive FIT. There were 832 veterans who had both a FIT and colonoscopy during the study period. Of these, 108 had a colonoscopy with a subsequent FIT (Figure).
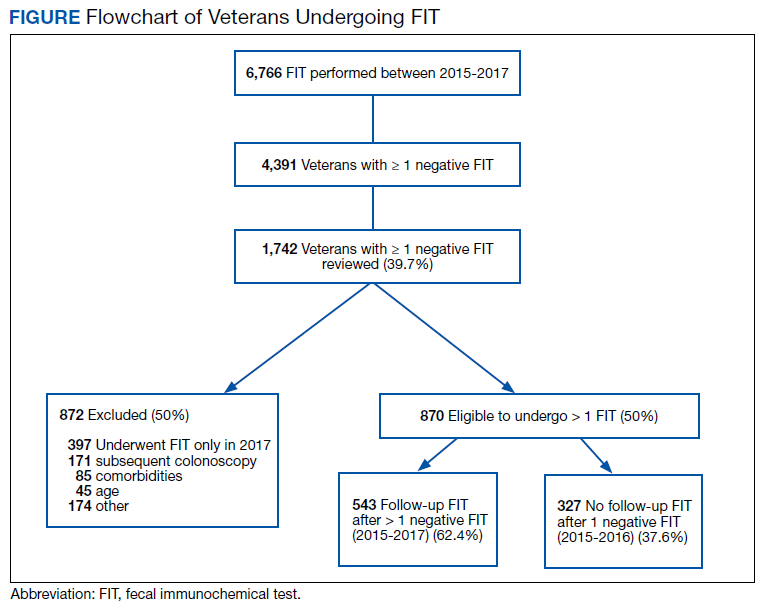
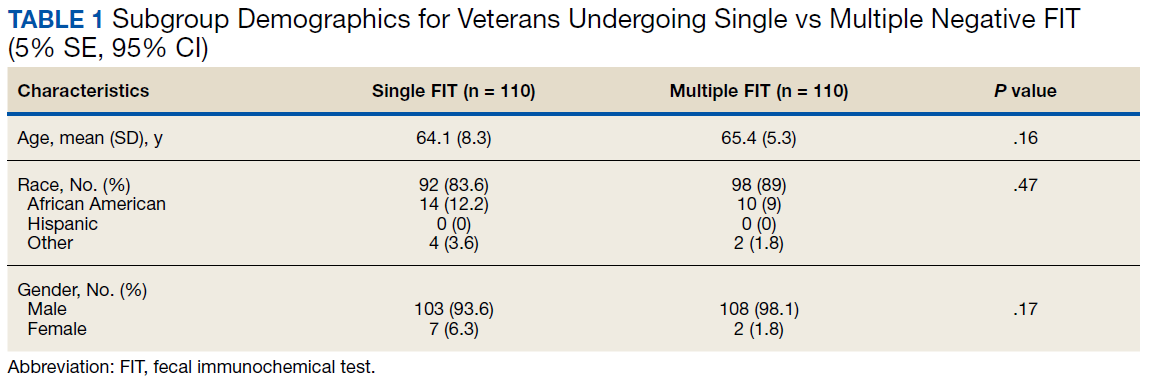
Of 1,742 randomly selected veterans with at least 1 negative FIT in the study interval, 870 were eligible for multiple FITs during this period as they were in the appropriate screening age (50-75 years or 85 years based on an assessment of life expectancy by the ordering health care provider [HCP]), did not have exclusionary comorbidities to multiple FIT, were not lost to follow-up, and had at least 1 negative FIT collected from 2015 to 2016 (veterans who only had a FIT in 2017 were excluded from this aim to avoid confounding). Of these 870 veterans, 543 (62.4%) underwent at least 2 FITs during the study period. In a demographic comparison of 110 veterans with 1 FIT and 110 veterans with > 1 FIT, there were no statistically significant differences in demographics (Table 1).
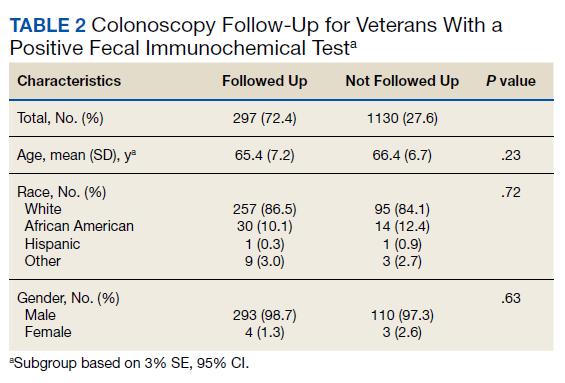
In a random chart review of 410 veterans with a positive FIT, 113 (27.5%) veterans did not undergo a subsequent colonoscopy within 1 year due to patient refusal, failure to schedule, or failure to keep colonoscopy appointment. There were no differences in demographics between those that underwent a diagnostic colonoscopy and those that did not (Table 2).
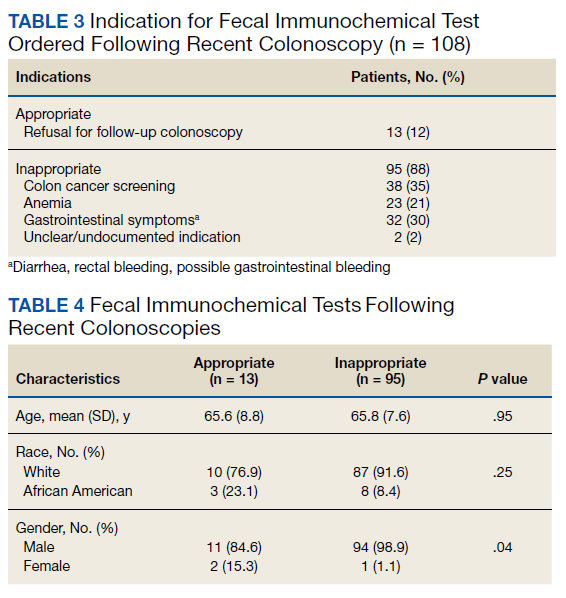
Of the 108 patients with a FIT following colonoscopy in the study interval, 97 FITs were negative. Ninety-five of the 108 FITs (88%) were judged to be inappropriate, having been performed for indications, including 38 for colon cancer screening, 23 for anemia, 32 for GI symptoms (eg, diarrhea, rectal bleeding, possible GI bleeding), and 2 for unclear indications. Thirteen FITs were deemed appropriate, as they were performed on veterans who refused to have a repeat colonoscopy following an examination with inadequate bowel preparation (Table 3). There was no difference in age or race between these 2 groups, although there was a statistically significant difference in gender (Table 4).
There were 19 patients who had a colonoscopy following a prior colonoscopy and subsequent positive FIT in the interval. Eight patients had no significant findings, 10 had nonadvanced adenomas, and 1 had an advanced adenoma (this patient had inadequate preparation with recommendation to repeat colonoscopy in 1 year).
While not a specific aim of the study we were able to identify certain HCPs by clinic location who systematically performed inappropriate or appropriate FIT. There were 47 separate ordering locations for the 95 inappropriate FIT following recent colonoscopy. Of these, 1 location was responsible for ordering 20 (21%) inappropriate FIT. Eight locations accounted for 51% of all the inappropriately ordered FIT. Two clinics seemed to be high performers in regard to overall appropriate vs inappropriate FIT use. The appropriate FIT rate for these locations was 30 of 33 (90.9%) and 26 of 28 (92.8%), respectively.
Discussion
In this retrospective study, we found that a large percentage of veterans eligible for colon cancer screening utilizing FIT did not undergo appropriate screening. Almost 40% of veterans in a 3-year interval received only 1 FIT. This seemed to occur due to a combination of patient refusal and inadequate education by HCPs regarding how to screen appropriately for CRC using FIT. This occurred despite a reminder in the VA Computerized Patient Record System regarding CRC screening.
There did not seem to be significant differences in demographics between those who were screened appropriately vs inappropriately. While there was a statistically significant difference in gender between those who had an appropriate FIT following recent colonoscopy (2 of 13 were female) and those who had an inappropriate FIT after recent colonoscopy (1 of 95 was a female), we are uncertain of the significance of this finding given the small number of female veterans in the analysis.
We do believe that the ratio of veterans in our study with a single FIT likely underestimates the true prevalence. To avoid confounding from factors such as inadequate prior follow-up in the study interval, we excluded veterans who underwent FIT only in 2017 for this analysis. As such, a significant percentage of these veterans were actually eligible to be screened throughout the study interval.
In spite of recommendations regarding the need for diagnostic colonoscopy following a positive FIT, we found that more than one-quarter of patients did not undergo colonoscopy. Although this number is an improvement over previously published literature that found almost half of patients at a safety-net hospital did not undergo diagnostic colonoscopy following a positive FIT, this is still clearly suboptimal.6
VAPHS has a mandate that all patients with a positive FIT be scheduled for colonoscopy within 30 days, either at VAPHS or in the community. An alert is sent to both ordering HCP regarding the positive FIT as well as to the GI department. In addition to contact from the ordering HCP, all veterans also are contacted by either a physician or nurse practitioner GI provider to provide test results and an explanation of its clinical significance and to facilitate colonoscopy scheduling. If a patient cannot be reached by telephone, the patient is sent a certified letter from the GI department regarding the significance of a positive FIT and instructions for scheduling a colonoscopy.
Despite this outreach, 27.5% of veterans did not have a diagnostic colonoscopy following a positive FIT. This suggests that there may be inadequate education and counseling of veterans at the time of the FIT order about the subsequent series of events and need for diagnostic colonoscopy following a positive FIT. If a patient refuses to undergo a colonoscopy under any circumstances (including after a positive FIT), the utility of placing a FIT order is questionable.
There is also a need for more education of ordering HCPs on appropriate indications for FITs. We found that 35% of FIT ordered after a recent colonoscopy were done for the purpose of CRC screening, despite clear guidelines recommending against this. In addition, another 50% of FIT ordered after recent colonoscopy was done either for evaluation of GI symptoms like diarrhea and rectal bleeding or in the evaluation of anemia, both of which are inappropriate uses for FIT. Since FIT is an antibody test against globin, the protein component of hemoglobin that degrades during passage through the small bowel, it is not a useful test for the evaluation of upper GI or small bowel bleeding. A relatively recent database study in the Netherlands looking at the diagnosis of upper GI malignancies within 3 years of a positive FIT found a < 1% rate.11
In our study, albeit limited by the small number of veterans undergoing a repeat colonoscopy following a prior colonoscopy and subsequent positive FIT, there were few significant findings. Only 1 veteran had an advanced adenoma detected, and this veteran had already been recommended a repeat colonoscopy in 1 year due to an inadequate bowel preparation on the last examination.
Lastly, we found that certain HCPs (based on ordering clinic location) systematically performed improper FIT compared with other HCPs. This presumably is due to a lack of education on appropriate FIT usage and suggests opportunity for educational and/or systems interventions.
Limitations
While our study strengths include a relatively large number of veterans and detailed review of individual patient data, it has multiple limitations. As a retrospective chart review-based study, incomplete or inaccurate data are a possibility. It is possible that patients underwent repeat FIT or underwent colonoscopy outside of the VA system and never recorded into the VA records. In addition, there is likely a sampling bias in this study as only veterans who underwent at least 1 FIT in the interval were included. These patients may be different from those who choose to undergo colonoscopy for CRC screening or from those who do not undergo screening at all.
Conclusions
A large percentage of patients underwent improper FIT at a tertiary referral academic VA medical center. Additional education and systems interventions are necessary to improve both provider and patient adherence to appropriate CRC screening. For example, one measure may include providing HCPs with a list of their patients not up-to-date with CRC screening that was shown to increase patient participation in FIT screening compared with patients who received usual care in a 2017 study.12 In addition, a 2018 study showed that a digital health intervention that allows patients to self-order tests (eg, on an iPad) can increase CRC screening rates.13
Author Contributions
Adam Gluskin: Study concept and design; acquisition of data; analysis and interpretation of data; drafting of the manuscript. Jeffrey Dueker: Study concept and design; analysis and interpretation of data; statistical analysis; critical revision of the manuscript for important intellectual content. Asif Khalid: Study concept and design; analysis and interpretation of data; drafting of the manuscripts; critical revision of the manuscript for important intellectual content; study supervision.
1. US Preventive Services Task Force, Bibbins-Domingo K, Grossman DC, et al. Screening for Colorectal Cancer: US Preventive Services Task Force recommendation statement [published correction appears in JAMA. 2016 Aug 2;316(5):545] [published correction appears in JAMA. 2017 Jun 6;317(21):2239]. JAMA. 2016;315(23):2564-2575. doi:10.1001/jama.2016.5989
2. Rex DK, Boland CR, Dominitz JA, et al. Colorectal cancer screening: recommendations for physicians and patients from the U.S. Multi-Society Task Force on Colorectal Cancer. Gastroenterology. 2017;153(1):307-323. doi:10.1053/j.gastro.2017.05.013
3. Lee YC, Li-Sheng Chen S, Ming-Fang Yen A, et al. Association between colorectal cancer mortality and gradient fecal hemoglobin concentration in colonoscopy noncompliers. J Natl Cancer Inst. 2017;109(5):djw269. doi:10.1093/jnci/djw269
4. Corley DA, Jensen CD, Quinn VP, et al. Association between time to colonoscopy after a positive fecal test result and risk of colorectal cancer and cancer stage at diagnosis. JAMA. 2017;317(16):1631-1641. doi:10.1001/jama.2017.3634
5. Gellad ZF, Almirall D, Provenzale D, Fisher DA. Time from positive screening fecal occult blood test to colonoscopy and risk of neoplasia. Dig Dis Sci. 2009;54(11):2497-2502. doi:10.1007/s10620-008-0653-8
6. Issaka RB, Singh MH, Oshima SM, et al. Inadequate utilization of diagnostic colonoscopy following abnormal FIT results in an integrated safety-net System. Am J Gastroenterol. 2017;112(2):375-382. doi:10.1038/ajg.2016.555
7. Carlson CM, Kirby KA, Casadei MA, Partin MR, Kistler CE, Walter LC. Lack of follow-up after fecal occult blood testing in older adults: inappropriate screening or failure to follow up?. Arch Intern Med. 2011;171(3):249-256. doi:10.1001/archinternmed.2010.372
8. Fisher DA, Judd L, Sanford NS. Inappropriate colorectal cancer screening: findings and implications. Am J Gastroenterol. 2005;100(11):2526-2530. doi:10.1111/j.1572-0241.2005.00322.x
9. Powell AA, Saini SD, Breitenstein MK, Noorbaloochi S, Cutting A, Fisher DA, Bloomfield HE, Halek K, Partin MR. Rates and correlates of potentially inappropriate colorectal cancer screening in the Veterans Health Administration. J Gen Intern Med. 2015 Jun;30(6):732-41. doi: 10.1007/s11606-014-3163-8
10. Jensen CD, Corley DA, Quinn VP, et al. Fecal immunochemical test program performance over 4 rounds of annual screening: a retrospective cohort study. Ann Intern Med. 2016;164(7):456-463. doi:10.7326/M15-0983
11. van der Vlugt M, Grobbee EJ, Bossuyt PM, et al. Risk of oral and upper gastrointestinal cancers in persons with positive results from a fecal immunochemical test in a colorectal cancer screening program. Clin Gastroenterol Hepatol. 2018;16(8):1237-1243.e2. doi:10.1016/j.cgh.2018.01.037
12. Rat C, Pogu C, Le Donné D, et al. Effect of physician notification regarding nonadherence to colorectal cancer screening on patient participation in fecal immunochemical test cancer screening: a randomized clinical trial. JAMA. 2017;318(9):816-824. doi:10.1001/jama.2017.11387
13. Miller DP Jr, Denizard-Thompson N, Weaver KE, et al. Effect of a digital health intervention on receipt of colorectal cancer screening in vulnerable patients: a randomized controlled trial. Ann Intern Med. 2018;168(8):550-557. doi:10.7326/M17-2315
Colonoscopies and annual fecal immunochemical tests (FITs), are 2 of the preferred modalities for colorectal cancer (CRC) screening endorsed by the US Preventive Services Task Forces as well as the US Multi-Society Task Force of Colorectal Cancer, which represents the American Gastroenterological Association, American College of Gastroenterology, and the American Society of Gastrointestinal Endoscopy.1,2 The recommendations include proper patient selection (patients aged 50 - 75 years with a life expectancy of at least 10 years), and a discussion with the patient regarding both options.
Background
It is known that patients with a positive FIT are at an increased risk for CRC. Lee and colleagues found that patients who do not undergo subsequent colonoscopy after a positive FIT have a 1.64 relative risk of death from colon cancer compared with those who undergo follow-up colonoscopy.3 Studies also have shown that longer wait times (10 months vs 1 month) between a positive FIT and colonoscopy also are associated with a higher risk of CRC.4 FIT utilize antibodies specific for the globin moiety of human hemoglobin and measure the development of antibody-globin complexes using immunoassay techniques. FIT has largely replaced the fecal occult blood test (FOBT), which depends on the detection of heme in feces through oxidation.
A US Department of Veterans Affairs (VA) study found that a longer time to colonoscopy was associated with a higher risk of neoplasia in veterans with a positive FOBT (odds ratio [OR], 1.10).5 It is thus crucial that a positive FOBT or FIT be investigated with follow-up colonoscopy. However, a retrospective study at a single safety-net hospital in San Francisco found that only 55.6% of patients with a positive FIT completed colonoscopy within 1 year.6 Importantly, almost half the patients examined in this study lacked documentation of the result of the FIT or counseling regarding the significance of the positive FIT by the patient’s primary care provider who ordered the test. A VA study looked at veterans aged > 70 years at 4 VA medical centers who did not receive a follow-up colonoscopy within 1 year and reported that 26% of patients studied had a documented refusal to undergo colonoscopy.7
It also is clear that FOBT is used inappropriately for colon cancer screening in some patients. A 2005 single-center VA study looked at inappropriate fecal occult blood tests and found that 18% of veterans for whom FOBTs were ordered had a severe comorbid illness, 13% had signs or symptoms of gastrointestinal (GI) blood loss, and 7% had a history of colorectal neoplasia or inflammatory bowel disease.8 An additional national VA study looked at all veterans aged ≥ 50 years who underwent FOBT or screening colonoscopy between 2009 and 2011 and found 26% to be inappropriate (13.9% of veterans not due for screening, 7.8% with limited life expectancy, and 11% receiving a FOBT when colonoscopy was indicated).9
An often-misunderstood additional requirement in utilizing FIT for CRC screening is that negative tests should be repeated annually.2 A study from Kaiser Permanente in California found that 75.3 to 86.1% of eligible patients underwent yearly FIT.10 In this study, programmatic FIT detected 80.4% of all patients with CRC detected within 1 year of testing.
Since most of the VA-specific studies are based on inappropriate or inadequate use of FOBT, we feel it is essential that further data be gained on appropriate and inappropriate testing. The aim of this study is to determine the frequency at which improper FIT occurs because of failure to obtain serial FIT over time with a negative result, failure to follow-up a positive FIT result with a diagnostic colonoscopy, or performance of FIT in veterans undergoing a recent colonoscopy with adequate bowel preparation. This quality assurance study received an institutional review board exemption from the VA Pittsburgh Healthcare System (VAPHS) in Pennsylvania.
Methods
VAPHS has a data repository of all veterans served within the health care system, which was queried for all veterans who underwent a FIT in the system from January 1, 2015 through December 31, 2017 as well as the number and results of FITs during the interval. In addition, the data repository was also queried specifically for veterans who had at least 1 colonoscopy as well as FIT between 2015 and 2017. The ordering location for each FIT also was queried.
We made 3 calculations for this study. First, we measured the rate of a negative initial FIT in 2015 and/or 2016 followed by a second FIT in 2016 and/or 2017 in a random selection of veterans (3% SE, 95% CI). Demographics were compared in an equal random number of veterans who did and did not have a follow up FIT (5% SE, 95% CI of all negative FIT). Second, we measured the rate of completing colonoscopy following a positive FIT in a random selection of veterans (3% SE, 95% SI). Finally, we calculated FITs following a colonoscopy for all veterans.
Using a power analysis with a 3% SE and 95% CI for sample size calculation and accounting for the approximate 50% exclusion rate from the final eligible population of veterans with at least 1 negative FIT, a random sample of 1,742 patient charts with a negative FIT in the interval were then reviewed to determine the frequency with which they underwent multiple FITs in the interval as well as for the presence of exclusionary factors. Because of the large number of veterans involved in this category, a more detailed demographics review was performed of a subset of these patients using a 95% CI and 5% SE. Using a 95% CI and 3% SE, 445 veterans with a positive FIT in the interval were reviewed to determine the frequency at which they underwent a follow-up diagnostic colonoscopy.
Because of a relatively small sample size, all 108 veterans who underwent a colonoscopy followed by a FIT were reviewed to determine the reason for follow-up FIT. In addition, in veterans who then went on to have a subsequent repeat colonoscopy, the examination findings were recorded.
Results
From January 1, 2015 to December 31, 2017, 6,766 FIT, were ordered at VAPHS. Of these, 4,391 unique veterans had at least 1 negative FIT during the period and 709 unique veterans had a positive FIT. There were 832 veterans who had both a FIT and colonoscopy during the study period. Of these, 108 had a colonoscopy with a subsequent FIT (Figure).
Of 1,742 randomly selected veterans with at least 1 negative FIT in the study interval, 870 were eligible for multiple FITs during this period as they were in the appropriate screening age (50-75 years or 85 years based on an assessment of life expectancy by the ordering health care provider [HCP]), did not have exclusionary comorbidities to multiple FIT, were not lost to follow-up, and had at least 1 negative FIT collected from 2015 to 2016 (veterans who only had a FIT in 2017 were excluded from this aim to avoid confounding). Of these 870 veterans, 543 (62.4%) underwent at least 2 FITs during the study period. In a demographic comparison of 110 veterans with 1 FIT and 110 veterans with > 1 FIT, there were no statistically significant differences in demographics (Table 1).
In a random chart review of 410 veterans with a positive FIT, 113 (27.5%) veterans did not undergo a subsequent colonoscopy within 1 year due to patient refusal, failure to schedule, or failure to keep colonoscopy appointment. There were no differences in demographics between those that underwent a diagnostic colonoscopy and those that did not (Table 2).
Of the 108 patients with a FIT following colonoscopy in the study interval, 97 FITs were negative. Ninety-five of the 108 FITs (88%) were judged to be inappropriate, having been performed for indications, including 38 for colon cancer screening, 23 for anemia, 32 for GI symptoms (eg, diarrhea, rectal bleeding, possible GI bleeding), and 2 for unclear indications. Thirteen FITs were deemed appropriate, as they were performed on veterans who refused to have a repeat colonoscopy following an examination with inadequate bowel preparation (Table 3). There was no difference in age or race between these 2 groups, although there was a statistically significant difference in gender (Table 4).
There were 19 patients who had a colonoscopy following a prior colonoscopy and subsequent positive FIT in the interval. Eight patients had no significant findings, 10 had nonadvanced adenomas, and 1 had an advanced adenoma (this patient had inadequate preparation with recommendation to repeat colonoscopy in 1 year).
While not a specific aim of the study we were able to identify certain HCPs by clinic location who systematically performed inappropriate or appropriate FIT. There were 47 separate ordering locations for the 95 inappropriate FIT following recent colonoscopy. Of these, 1 location was responsible for ordering 20 (21%) inappropriate FIT. Eight locations accounted for 51% of all the inappropriately ordered FIT. Two clinics seemed to be high performers in regard to overall appropriate vs inappropriate FIT use. The appropriate FIT rate for these locations was 30 of 33 (90.9%) and 26 of 28 (92.8%), respectively.
Discussion
In this retrospective study, we found that a large percentage of veterans eligible for colon cancer screening utilizing FIT did not undergo appropriate screening. Almost 40% of veterans in a 3-year interval received only 1 FIT. This seemed to occur due to a combination of patient refusal and inadequate education by HCPs regarding how to screen appropriately for CRC using FIT. This occurred despite a reminder in the VA Computerized Patient Record System regarding CRC screening.
There did not seem to be significant differences in demographics between those who were screened appropriately vs inappropriately. While there was a statistically significant difference in gender between those who had an appropriate FIT following recent colonoscopy (2 of 13 were female) and those who had an inappropriate FIT after recent colonoscopy (1 of 95 was a female), we are uncertain of the significance of this finding given the small number of female veterans in the analysis.
We do believe that the ratio of veterans in our study with a single FIT likely underestimates the true prevalence. To avoid confounding from factors such as inadequate prior follow-up in the study interval, we excluded veterans who underwent FIT only in 2017 for this analysis. As such, a significant percentage of these veterans were actually eligible to be screened throughout the study interval.
In spite of recommendations regarding the need for diagnostic colonoscopy following a positive FIT, we found that more than one-quarter of patients did not undergo colonoscopy. Although this number is an improvement over previously published literature that found almost half of patients at a safety-net hospital did not undergo diagnostic colonoscopy following a positive FIT, this is still clearly suboptimal.6
VAPHS has a mandate that all patients with a positive FIT be scheduled for colonoscopy within 30 days, either at VAPHS or in the community. An alert is sent to both ordering HCP regarding the positive FIT as well as to the GI department. In addition to contact from the ordering HCP, all veterans also are contacted by either a physician or nurse practitioner GI provider to provide test results and an explanation of its clinical significance and to facilitate colonoscopy scheduling. If a patient cannot be reached by telephone, the patient is sent a certified letter from the GI department regarding the significance of a positive FIT and instructions for scheduling a colonoscopy.
Despite this outreach, 27.5% of veterans did not have a diagnostic colonoscopy following a positive FIT. This suggests that there may be inadequate education and counseling of veterans at the time of the FIT order about the subsequent series of events and need for diagnostic colonoscopy following a positive FIT. If a patient refuses to undergo a colonoscopy under any circumstances (including after a positive FIT), the utility of placing a FIT order is questionable.
There is also a need for more education of ordering HCPs on appropriate indications for FITs. We found that 35% of FIT ordered after a recent colonoscopy were done for the purpose of CRC screening, despite clear guidelines recommending against this. In addition, another 50% of FIT ordered after recent colonoscopy was done either for evaluation of GI symptoms like diarrhea and rectal bleeding or in the evaluation of anemia, both of which are inappropriate uses for FIT. Since FIT is an antibody test against globin, the protein component of hemoglobin that degrades during passage through the small bowel, it is not a useful test for the evaluation of upper GI or small bowel bleeding. A relatively recent database study in the Netherlands looking at the diagnosis of upper GI malignancies within 3 years of a positive FIT found a < 1% rate.11
In our study, albeit limited by the small number of veterans undergoing a repeat colonoscopy following a prior colonoscopy and subsequent positive FIT, there were few significant findings. Only 1 veteran had an advanced adenoma detected, and this veteran had already been recommended a repeat colonoscopy in 1 year due to an inadequate bowel preparation on the last examination.
Lastly, we found that certain HCPs (based on ordering clinic location) systematically performed improper FIT compared with other HCPs. This presumably is due to a lack of education on appropriate FIT usage and suggests opportunity for educational and/or systems interventions.
Limitations
While our study strengths include a relatively large number of veterans and detailed review of individual patient data, it has multiple limitations. As a retrospective chart review-based study, incomplete or inaccurate data are a possibility. It is possible that patients underwent repeat FIT or underwent colonoscopy outside of the VA system and never recorded into the VA records. In addition, there is likely a sampling bias in this study as only veterans who underwent at least 1 FIT in the interval were included. These patients may be different from those who choose to undergo colonoscopy for CRC screening or from those who do not undergo screening at all.
Conclusions
A large percentage of patients underwent improper FIT at a tertiary referral academic VA medical center. Additional education and systems interventions are necessary to improve both provider and patient adherence to appropriate CRC screening. For example, one measure may include providing HCPs with a list of their patients not up-to-date with CRC screening that was shown to increase patient participation in FIT screening compared with patients who received usual care in a 2017 study.12 In addition, a 2018 study showed that a digital health intervention that allows patients to self-order tests (eg, on an iPad) can increase CRC screening rates.13
Author Contributions
Adam Gluskin: Study concept and design; acquisition of data; analysis and interpretation of data; drafting of the manuscript. Jeffrey Dueker: Study concept and design; analysis and interpretation of data; statistical analysis; critical revision of the manuscript for important intellectual content. Asif Khalid: Study concept and design; analysis and interpretation of data; drafting of the manuscripts; critical revision of the manuscript for important intellectual content; study supervision.
1. US Preventive Services Task Force, Bibbins-Domingo K, Grossman DC, et al. Screening for Colorectal Cancer: US Preventive Services Task Force recommendation statement [published correction appears in JAMA. 2016 Aug 2;316(5):545] [published correction appears in JAMA. 2017 Jun 6;317(21):2239]. JAMA. 2016;315(23):2564-2575. doi:10.1001/jama.2016.5989
2. Rex DK, Boland CR, Dominitz JA, et al. Colorectal cancer screening: recommendations for physicians and patients from the U.S. Multi-Society Task Force on Colorectal Cancer. Gastroenterology. 2017;153(1):307-323. doi:10.1053/j.gastro.2017.05.013
3. Lee YC, Li-Sheng Chen S, Ming-Fang Yen A, et al. Association between colorectal cancer mortality and gradient fecal hemoglobin concentration in colonoscopy noncompliers. J Natl Cancer Inst. 2017;109(5):djw269. doi:10.1093/jnci/djw269
4. Corley DA, Jensen CD, Quinn VP, et al. Association between time to colonoscopy after a positive fecal test result and risk of colorectal cancer and cancer stage at diagnosis. JAMA. 2017;317(16):1631-1641. doi:10.1001/jama.2017.3634
5. Gellad ZF, Almirall D, Provenzale D, Fisher DA. Time from positive screening fecal occult blood test to colonoscopy and risk of neoplasia. Dig Dis Sci. 2009;54(11):2497-2502. doi:10.1007/s10620-008-0653-8
6. Issaka RB, Singh MH, Oshima SM, et al. Inadequate utilization of diagnostic colonoscopy following abnormal FIT results in an integrated safety-net System. Am J Gastroenterol. 2017;112(2):375-382. doi:10.1038/ajg.2016.555
7. Carlson CM, Kirby KA, Casadei MA, Partin MR, Kistler CE, Walter LC. Lack of follow-up after fecal occult blood testing in older adults: inappropriate screening or failure to follow up?. Arch Intern Med. 2011;171(3):249-256. doi:10.1001/archinternmed.2010.372
8. Fisher DA, Judd L, Sanford NS. Inappropriate colorectal cancer screening: findings and implications. Am J Gastroenterol. 2005;100(11):2526-2530. doi:10.1111/j.1572-0241.2005.00322.x
9. Powell AA, Saini SD, Breitenstein MK, Noorbaloochi S, Cutting A, Fisher DA, Bloomfield HE, Halek K, Partin MR. Rates and correlates of potentially inappropriate colorectal cancer screening in the Veterans Health Administration. J Gen Intern Med. 2015 Jun;30(6):732-41. doi: 10.1007/s11606-014-3163-8
10. Jensen CD, Corley DA, Quinn VP, et al. Fecal immunochemical test program performance over 4 rounds of annual screening: a retrospective cohort study. Ann Intern Med. 2016;164(7):456-463. doi:10.7326/M15-0983
11. van der Vlugt M, Grobbee EJ, Bossuyt PM, et al. Risk of oral and upper gastrointestinal cancers in persons with positive results from a fecal immunochemical test in a colorectal cancer screening program. Clin Gastroenterol Hepatol. 2018;16(8):1237-1243.e2. doi:10.1016/j.cgh.2018.01.037
12. Rat C, Pogu C, Le Donné D, et al. Effect of physician notification regarding nonadherence to colorectal cancer screening on patient participation in fecal immunochemical test cancer screening: a randomized clinical trial. JAMA. 2017;318(9):816-824. doi:10.1001/jama.2017.11387
13. Miller DP Jr, Denizard-Thompson N, Weaver KE, et al. Effect of a digital health intervention on receipt of colorectal cancer screening in vulnerable patients: a randomized controlled trial. Ann Intern Med. 2018;168(8):550-557. doi:10.7326/M17-2315
Outcomes Following Implementation of a Hospital-Wide, Multicomponent Delirium Care Pathway
Delirium is an acute disturbance in mental status characterized by fluctuations in cognition and attention that affects more than 2.6 million hospitalized older adults in the United States annually, a rate that is expected to increase as the population ages.1-4 Hospital-acquired delirium is associated with poor outcomes, including prolonged hospital length of stay (LOS), loss of independence, cognitive impairment, and even death.5-10 Individuals who develop delirium do poorly after hospital discharge and are more likely to be readmitted within 30 days.11 Approximately 30% to 40% of hospital-acquired delirium cases are preventable.10,12 However, programs designed to prevent delirium and associated complications, such as increased LOS, have demonstrated variable success.12-14 Many studies are limited by small sample sizes, lack of generalizability to different hospitalized patient populations, poor adherence, or reliance on outside funding.12,13,15-18
Delirium prevention programs face several challenges because delirium could be caused by a variety of risk factors and precipitants.19,20 Some risk factors that occur frequently among hospitalized patients can be mitigated, such as sensory impairment, immobility from physical restraints or urinary catheters, and polypharmacy.20,21 Effective delirium care pathways targeting these risk factors must be multifaceted, interdisciplinary, and interprofessional. Accurate risk assessment is critical to allocate resources to high-risk patients. Delirium affects patients in all medical and surgical disciplines, and often is underdiagnosed.19,22 Comprehensive screening is necessary to identify cases early and track outcomes, and educational efforts must reach all providers in the hospital. These challenges require a systematic, pragmatic approach to change.
The purpose of this study was to evaluate the association between a delirium care pathway and clinical outcomes for hospitalized patients. We hypothesized that this program would be associated with reduced hospital LOS, with secondary benefits to hospitalization costs, odds of 30-day readmission, and delirium rates.
METHODS
Study Design
In this retrospective cohort study, we compared clinical outcomes the year before and after implementation of a delirium care pathway across seven hospital units. The study period spanned October 1, 2015, through February 28, 2019. The study was approved by the University of California, San Francisco Institutional Review Board (#13-12500).
Multicomponent Delirium Care Pathway
The delirium care pathway was developed collaboratively among geriatrics, hospital medicine, neurology, anesthesiology, surgery, and psychiatry services, with an interprofessional team of physicians, nurses, pharmacists, and physical and occupational therapists. This pathway was implemented in units consecutively, approximately every 4 months in the following order: neurosciences, medicine, cardiology, general surgery, specialty surgery, hematology-oncology, and transplant. The same implementation education protocols were performed in each unit. The pathway consisted of several components targeting delirium prevention and management (Appendix Figure 1 and Appendix Figure 2). Systematic screening for delirium was introduced as part of the multicomponent intervention. Nursing staff assessed each patient’s risk of developing delirium at admission using the AWOL score, a validated delirium prediction tool.23 AWOL consists of: patient Age, spelling “World” backwards correctly, Orientation, and assessment of iLlness severity by the nurse. For patients who spoke a language other than English, spelling of “world” backwards was translated to his or her primary language, or if this was not possible, the task was modified to serial 7s (subtracting 7 from 100 in a serial fashion). This modification has been validated for use in other languages.24 Patients at high risk for delirium based on an AWOL score ≥2 received a multidisciplinary intervention with four components: (1) notifying the primary team by pager and electronic medical record (EMR), (2) a nurse-led, evidence-based, nonpharmacologic multicomponent intervention,25 (3) placement of a delirium order set by the physician, and (4) review of medications by the unit pharmacist who adjusted administration timing to occur during waking hours and placed a note in the EMR notifying the primary team of potentially deliriogenic medications. The delirium order set reinforced the nonpharmacologic multicomponent intervention through a nursing order, placed an automatic consult to occupational therapy, and included options to order physical therapy, order speech/language therapy, obtain vital signs three times daily with minimal night interruptions, remove an indwelling bladder catheter, and prescribe melatonin as a sleep aid.
The bedside nurse screened all patients for active delirium every 12-hour shift using the Nursing Delirium Screening Scale (NuDESC) and entered the results into the EMR.23,26 Capturing NuDESC results in the EMR allowed communication across medical providers as well as monitoring of screening adherence. Each nurse received two in-person trainings in staff meetings and one-to-one instruction during the first week of implementation. All nurses were required to complete a 15-minute training module and had the option of completing an additional 1-hour continuing medical education module. If a patient was transferred to the intensive care unit (ICU), delirium was identified through use of the ICU-specific Confusion Assessment Method (CAM-ICU) assessments, which the bedside nurse performed each shift throughout the intervention period.27 Nurses were instructed to call the primary team physician after every positive screen. Before each unit’s implementation start date, physicians with patients on that unit received education through a combination of grand rounds, resident lectures and seminars, and a pocket card on delirium evaluation and management.
Participants and Eligibility Criteria
We included all patients aged ≥50 years hospitalized for >1 day on each hospital unit (Figure). We included adults aged ≥50 years to maximize the number of participants for this study while also capturing a population at risk for delirium. Because the delirium care pathway was unit-based and the pathway was rolled out sequentially across units, only patients who were admitted to and discharged from the same unit were included to better isolate the effect of the pathway. Patients who were transferred to the ICU were only included if they were discharged from the original unit of admission. Only the first hospitalization was included for patients with multiple hospitalizations during the study period.

Patient Characteristics
Patient demographics and clinical data were collected after discharge through Clarity and Vizient electronic databases (Table 1 and Table 2). All Elixhauser comorbidities were included except for the following International Classification of Disease, Tenth Revision, Clinical Modification (ICD-10) codes that overlapped with a delirium diagnosis: G31.2, G93.89, G93.9, G94, R41.0, and R41.82 (Appendix Table 1). Severity of illness was obtained from Vizient, which calculates illness severity based on clinical and claims data (Appendix Table 1).

Delirium Metrics
Delirium screening was introduced as part of the multicomponent intervention, and therefore delirium rates before the intervention could not be determined. Trends in delirium prevalence and incidence after the intervention are reported. Prevalent delirium was defined as a single score of ≥2 on the nurse-administered NuDESC or a positive CAM-ICU at any point during the hospital stay. Incident delirium was identified if the first NuDESC score was negative and any subsequent NuDESC or CAM-ICU score was positive.

Outcomes
The primary study outcome was hospital LOS across all participants. Secondary outcomes included total direct cost and odds of 30-day hospital readmission. Readmissions tracked as part of hospital quality reporting were obtained from Vizient and were not captured if they occurred at another hospital. We also examined rates of safety attendant and restraint use during the study period, defined as the number of safety attendant days or restraint days per 1,000 patient days.
Because previous studies have demonstrated the effectiveness of multicomponent delirium interventions among elderly general medical patients,12 we also investigated these same outcomes in the medicine unit alone.
Statistical Analysis
The date of intervention implementation was determined for each hospital unit, which was defined as time(0) [t(0)]. The 12-month postintervention period was divided into four 3-month epochs to assess for trends. Data were aggregated across the seven units using t(0) as the start date, agnostic to the calendar month. Demographic and clinical characteristics were collected for the 12-months before t(0) and the four 3-month epochs after t(0). Univariate analysis of outcome variables comparing trends across the same epochs were conducted in the same manner, except for the rate of delirium, which was measured after t(0) and therefore could not be compared with the preintervention period.
Multivariable models were adjusted for age, sex, race/ethnicity, admission category, Elixhauser comorbidities, severity of illness quartile, and number days spent in the ICU. Admission category referred to whether the admission was emergent, urgent, or elective/unknown. Because it took 3 months after t(0) for each unit to reach a delirium screening compliance rate of 90%, the intervention was only considered fully implemented after this period. A ramp-up variable was set to 0 for admissions occurring prior to the intervention to t(0), 1/3 for admissions occurring 1 month post intervention, 2/3 for 2 months post intervention, and 1 for admissions occurring 3 to 12 months post intervention. In this way, the coefficient for the ramp-up variable estimated the postintervention versus preintervention effect. Numerical outcomes (LOS, cost) were log transformed to reduce skewness and analyzed using linear models. Coefficients were back-transformed to provide interpretations as proportional change in the median outcomes.
For LOS and readmission, we assessed secular trends by including admission date and admission date squared, in case the trend was nonlinear, as possible predictors; admission date was the specific date—not time from t(0)—to account for secular trends and allow contemporaneous controls in the analysis. To be conservative, we retained secular terms (first considering the quadratic and then the linear) if P <.10. The categorical outcome (30-day readmission) was analyzed using a logistic model. Count variables (delirium, safety attendants, restraints) were analyzed using Poisson regression models with a log link, and coefficients were back-transformed to provide rate ratio interpretations. Because delirium was not measured before t(0), and because the intervention was considered to take 3 months to become fully effective, baseline delirium rates were defined as those in the first 3 months adjusted by the ramp-up variable. For each outcome we included hospital unit, a ramp-up variable (measuring the pre- vs postintervention effect), and their interaction. If there was no statistically significant interaction, we presented the outcome for all units combined. If the interaction was statistically significant, we looked for consistency across units and reported results for all units combined when consistent, along with site-specific results. If the results were not consistent across the units, we provided site-specific results only. All statistical analyses were performed using SAS software, version 9.4 (SAS Institute Inc).
RESULTS
Participant Demographics and Clinical Characteristics
A total of 22,708 individuals were included in this study, with 11,018 in the preintervention period (Table 1 and Table 2). Most patients were cared for on the general surgery unit (n = 5,899), followed by the medicine unit (n = 4,923). The smallest number of patients were cared for on the hematology-oncology unit (n = 1,709). Across the five epochs, patients were of similar age and sex, and spent a similar number of days in the ICU. The population was diverse with regard to race and ethnicity; there were minor differences in admission category. There were also minor differences in severity of illness and some comorbidities between timepoints (Appendix Table 1).
Delirium Metrics
Delirium prevalence was 13.0% during the first epoch post intervention, followed by 12.0%, 11.7%, and 13.0% in the subsequent epochs (P = .91). Incident delirium occurred in 6.1% of patients during the first epoch post intervention, followed by 5.3%, 5.3%, and 5.8% in the subsequent epochs (P = .63).
Primary Outcome
Epoch-level data for LOS before and after the intervention is shown in Appendix Table 2. The mean unadjusted LOS for all units combined did not decrease after the intervention, but in the adjusted model, the mean LOS decreased by 2% after the intervention (P = .0087; Table 3).

Secondary Outcomes
The odds of 30-day readmission decreased by 14% (P = .0002) in the adjusted models for all units combined (Table 3). There was no statistically significant reduction in adjusted total direct hospitalization cost or rate of restraint use. The safety attendant results showed strong effect modification across sites; the site-specific estimates are provided in Appendix Table 3. However, the estimated values all showed reductions, and a number were large and statistically significant.
Medicine Unit Outcomes
On the medicine unit alone, we observed a statistically significant reduction in LOS of 9% after implementation of the delirium care pathway (P = .028) in the adjusted model (Table 3). There was an associated 7% proportional decrease in total direct cost (P = .0002). Reductions in 30-day readmission and safety attendant use did not remain statistically significant in the adjusted models.
DISCUSSION
Implementation of a hospital-wide multicomponent delirium care pathway was associated with reduced hospital LOS and 30-day hospital readmission in a study of 22,708 hospitalized adults at a tertiary care, university hospital in Northern California, encompassing both medical and surgical acute care patients. When evaluating general medicine patients alone, pathway implementation was associated with reductions in LOS and total direct cost. The cost savings of 7% among medical patients translates to median savings of $1,237 per hospitalization. This study—one of the largest to date examining implementation of a hospital-wide delirium care pathway—supports use of a multicomponent delirium care pathway for older adults hospitalized for a range of conditions.
Multicomponent pathways for delirium prevention and management are increasingly being used in hospital settings. The United Kingdom National Institute for Health and Care Excellence guidelines recommend delirium assessment and intervention by a multidisciplinary team within 24 hours of hospital admission for those at risk.25 These guidelines are based on evidence accumulated in clinical studies over the past 30 years suggesting that multicomponent interventions reduce incident delirium by 30% to 40% among medical and surgical patients.12,13,25,28
Although multicomponent delirium care pathways are associated with improved patient outcomes, the specific clinical benefits might vary across patient populations. Here, we found larger reductions in LOS and total direct cost among medicine patients. Medical patients might respond more robustly to nonpharmacologic multicomponent delirium interventions because of differing delirium etiologies (eg, constipation and sleep deprivation in a medical patient vs seizures or encephalitis in a neurosciences patient). Another explanation for the difference observed in total direct cost might be the inclusion of surgical units in the total study population. For example, not all hospital days are equivalent in cost for patients on a surgical unit.29 For patients requiring surgical care, most of the hospitalization cost might be incurred during the initial days of hospitalization, when there are perioperative costs; therefore, reduced LOS might have a lower economic impact.29 Multicomponent, nonpharmacologic delirium interventions encourage discontinuing restraints. As a result, one might expect a need for more frequent safety attendant use and an associated cost increase. However, we found that the estimated unit-specific values for safety attendant use showed reductions, which were large and highly statistically significant. For all units combined and the medicine unit alone, we found that the rate of restraint use decreased, although the change was not statistically significant. It is possible that some of the interventions taught to nurses and physicians as part of care pathway implementation, such as the use of family support for at-risk and delirious patients, led to a reduction in both safety attendants and restraints.
Our study had several strengths. This is one of the largest hospital-based delirium interventions studied, both in terms of its scope across seven diverse medical and surgical hospital units and the number of hospitalized patients studied. This intervention did not require additional staff or creating a specialized ward. Adherence to the pathway, as measured by risk assessment and delirium screening, was high (>90%) 3 months after implementation. This allowed for robust outcome ascertainment. The patient population’s characteristics and rates of delirium were stable over time. Because different hospital units incorporated the multicomponent delirium care pathway at different times, limiting enrollment to patients admitted and discharged from the same unit isolated the analysis to patients exposed to the pathway on each unit. This design also limited potential influence of other hospital quality improvement projects that might have occurred at the same time.
The primary limitation of this study is that screening for delirium was introduced as part of the multicomponent intervention. This decision was made to maximize buy-in from bedside nurses performing delirium screening because this addition to their workflow was explicitly linked to delirium prevention and management measures. Delirium could not be ascertained preintervention from the EMR because it is a clinical diagnosis and is coded inadequately.30 We could only measure the change in delirium metrics after implementation of the delirium care pathway. Because baseline delirium rates before the intervention were not measured systematically, conclusions about the intervention’s association with delirium metrics are limited. All other outcomes were measured before and after the intervention.
Although the comprehensive delirium screening program and high rate of adherence are a methodologic strength of this study, a second limitation is the use of the NuDESC. Our previous research demonstrated that the NuDESC has low sensitivity but high specificity and positive predictive value,26 which might underestimate delirium rates in this study. However, any underestimation should be stable over time and temporal trends should remain meaningful. This could allow more widespread study of delirium among hospitalized individuals. Because this care pathway was hospital-wide, it was important to ensure both consistency of screening and longevity of the initiative, and it was necessary to select a delirium assessment tool that was efficient and validated for nursing implementation. For these reasons, the NuDESC was an appropriate choice.
It is possible that our results could be influenced by unmeasured confounders. For example, although we incorporated Elixhauser medical comorbidities and illness severity into our model, we were unable to adjust for baseline functional status or frailty. Baseline functional status and frailty were not reliably recorded in the EMR, although these are potential confounders when investigating clinical outcomes including hospital readmission.
CONCLUSION
Implementation of a systematic, hospital-wide multicomponent delirium care pathway is associated with reductions in hospital LOS and 30-day readmission. In general medicine units, the reduction in LOS and associated cost savings were robust. These results demonstrate the feasibility and effectiveness of implementing an interprofessional, multidisciplinary multicomponent delirium care pathway through medical center funding to benefit patients and the hospital system.
Acknowledgments
The authors thank the many hospital staff members, especially the nurses, pharmacists, therapists, and patient care assistants, who helped implement the multicomponent delirium care pathway. All persons who have contributed significantly to this work are listed as authors of this work.
1. Bidwell J. Interventions for preventing delirium in hospitalized non-ICU patients: A Cochrane review summary. Int J Nurs Stud. 2017;70:142-143. https://doi.org/ 10.1016/j.ijnurstu.2016.11.010
2. Maldonado JR. Delirium in the acute care setting: characteristics, diagnosis and treatment. Crit Care Clin. 2008;24(4):657-722, vii. https://doi.org/10.1016/j.ccc.2008.05.008
3. Field RR, Wall MH. Delirium: past, present, and future. Semin Cardiothorac Vasc Anesth. 2013;17(3):170-179. https://doi.org/10.1177/1089253213476957
4. Oh ST, Park JY. Postoperative delirium. Korean J Anesthesiol. 2019;72(1):4-12. https://doi.org/10.4097/kja.d.18.00073.1
5. Francis J, Martin D, Kapoor WN. A prospective study of delirium in hospitalized elderly. JAMA. 1990;263(8):1097-1101.
6. Salluh JI, Soares M, Teles JM, et al. Delirium epidemiology in critical care (DECCA): an international study. Crit Care. 2010;14(6):R210. https://doi.org/10.1186/cc9333
7. Ely EW, Shintani A, Truman B, et al. Delirium as a predictor of mortality in mechanically ventilated patients in the intensive care unit. JAMA. 2004;291(14):1753-1762. https://doi.org/
8. McCusker J, Cole MG, Dendukuri N, Belzile E. Does delirium increase hospital stay? J Am Geriatr Soc. 2003;51(11):1539-1546. https://doi.org/10.1001/jama.291.14.1753
9. Inouye SK, Rushing JT, Foreman MD, Palmer RM, Pompei P. Does delirium contribute to poor hospital outcomes? A three-site epidemiologic study. J Gen Intern Med. 1998;13(4):234-242. https://doi.org/10.1046/j.1525-1497.1998.00073.x
10. Siddiqi N, House AO, Holmes JD. Occurrence and outcome of delirium in medical in-patients: a systematic literature review. Age Ageing. 2006;35(4):350-364. https://doi.org/10.1093/ageing/afl005
11. LaHue SC, Douglas VC, Kuo T, et al. Association between inpatient delirium and hospital readmission in patients >/= 65 years of age: a retrospective cohort study. J Hosp Med. 2019;14(4):201-206. https://doi.org/10.12788/jhm.3130
12. Hshieh TT, Yue J, Oh E, et al. Effectiveness of multicomponent nonpharmacological delirium interventions: a meta-analysis. JAMA Intern Med. 2015;175(4):512-520. https://doi.org/10.1001/jamainternmed.2014.7779
13. Inouye SK, Bogardus ST, Jr., Charpentier PA, et al. A multicomponent intervention to prevent delirium in hospitalized older patients. N Engl J Med. 1999;340(9):669-676. https://doi.org/10.1056/NEJM199903043400901
14. Marcantonio ER, Flacker JM, Wright RJ, Resnick NM. Reducing delirium after hip fracture: a randomized trial. J Am Geriatr Soc. 2001;49(5):516-522. https://doi.org/
15. Alhaidari AA, Allen-Narker RA. An evolving approach to delirium: A mixed-methods process evaluation of a hospital-wide delirium program in New Zealand. Australas J Ageing. 2017. https://doi.org/10.1046/j.1532-5415.2001.49108.x
16. Holroyd-Leduc JM, Khandwala F, Sink KM. How can delirium best be prevented and managed in older patients in hospital? CMAJ. 2010;182(5):465-470. https://doi.org/10.1503/cmaj.080519
17. Siddiqi N, Stockdale R, Britton AM, Holmes J. Interventions for preventing delirium in hospitalised patients. Cochrane Database Syst Rev. 2007(2):CD005563. https://doi.org/ 10.1002/14651858.CD005563.pub2
18. Siddiqi N, Harrison JK, Clegg A, et al. Interventions for preventing delirium in hospitalised non-ICU patients. Cochrane Database Syst Rev. 2016;3:CD005563. https://doi.org/10.1002/14651858.CD005563.pub3
19. Inouye SK, Westendorp RG, Saczynski JS. Delirium in elderly people. Lancet. 2014;383(9920):911-922. https://doi.org/10.1016/S0140-6736(13)60688-1
20. Inouye SK, Charpentier PA. Precipitating factors for delirium in hospitalized elderly persons. Predictive model and interrelationship with baseline vulnerability. JAMA. 1996;275(11):852-857.
21. LaHue SC, Liu VX. Loud and clear: sensory impairment, delirium, and functional recovery in critical illness. Am J Respir Crit Care Med. 2016;194(3):252-253. https://doi.org/10.1164/rccm.201602-0372ED
22. Ritter SRF, Cardoso AF, Lins MMP, Zoccoli TLV, Freitas MPD, Camargos EF. Underdiagnosis of delirium in the elderly in acute care hospital settings: lessons not learned. Psychogeriatrics. 2018;18(4):268-275. https://doi.org/10.1111/psyg.12324
23. Douglas VC, Hessler CS, Dhaliwal G, et al. The AWOL tool: derivation and validation of a delirium prediction rule. J Hosp Med. 2013;8(9):493-499. https://doi.org/10.1002/jhm.2062
24. Tombaugh TN, McDowell I, Kristjansson B, Hubley AM. Mini-Mental State Examination (MMSE) and the modified MMSE (3MS): A psychometric comparison and normative data. Psychol Assessment. 1996;8(1):48-59. https://doi.org/10.1037/1040-3590.8.1.48
25. Young J, Murthy L, Westby M, Akunne A, O’Mahony R, Guideline Development Group. Diagnosis, prevention, and management of delirium: summary of NICE guidance. BMJ. 2010;341:c3704. https://doi.org/10.1136/bmj.c3704
26. Hargrave A, Bastiaens J, Bourgeois JA, et al. Validation of a nurse-based delirium-screening tool for hospitalized patients. Psychosomatics. 2017;58(6):594-603. https://doi.org/10.1016/j.psym.2017.05.005
27. Ely EW, Inouye SK, Bernard GR, et al. Delirium in mechanically ventilated patients: validity and reliability of the confusion assessment method for the intensive care unit (CAM-ICU). JAMA. 2001;286(21):2703-2710. https://doi.org/10.1001/jama.286.21.2703
28. Strijbos MJ, Steunenberg B, van der Mast RC, Inouye SK, Schuurmans MJ. Design and methods of the Hospital Elder Life Program (HELP), a multicomponent targeted intervention to prevent delirium in hospitalized older patients: efficacy and cost-effectiveness in Dutch health care. BMC Geriatr. 2013;13:78. https://doi.org/10.1186/1471-2318-13-78
29. Taheri PA, Butz DA, Greenfield LJ. Length of stay has minimal impact on the cost of hospital admission. J Am Coll Surg. 2000;191(2):123-130. https://doi.org/10.1016/s1072-7515(00)00352-5
30. Fong TG, Tulebaev SR, Inouye SK. Delirium in elderly adults: diagnosis, prevention and treatment. Nat Rev Neurol. 2009;5(4):210-220. https://doi.org/10.1038/nrneurol.2009.24
Delirium is an acute disturbance in mental status characterized by fluctuations in cognition and attention that affects more than 2.6 million hospitalized older adults in the United States annually, a rate that is expected to increase as the population ages.1-4 Hospital-acquired delirium is associated with poor outcomes, including prolonged hospital length of stay (LOS), loss of independence, cognitive impairment, and even death.5-10 Individuals who develop delirium do poorly after hospital discharge and are more likely to be readmitted within 30 days.11 Approximately 30% to 40% of hospital-acquired delirium cases are preventable.10,12 However, programs designed to prevent delirium and associated complications, such as increased LOS, have demonstrated variable success.12-14 Many studies are limited by small sample sizes, lack of generalizability to different hospitalized patient populations, poor adherence, or reliance on outside funding.12,13,15-18
Delirium prevention programs face several challenges because delirium could be caused by a variety of risk factors and precipitants.19,20 Some risk factors that occur frequently among hospitalized patients can be mitigated, such as sensory impairment, immobility from physical restraints or urinary catheters, and polypharmacy.20,21 Effective delirium care pathways targeting these risk factors must be multifaceted, interdisciplinary, and interprofessional. Accurate risk assessment is critical to allocate resources to high-risk patients. Delirium affects patients in all medical and surgical disciplines, and often is underdiagnosed.19,22 Comprehensive screening is necessary to identify cases early and track outcomes, and educational efforts must reach all providers in the hospital. These challenges require a systematic, pragmatic approach to change.
The purpose of this study was to evaluate the association between a delirium care pathway and clinical outcomes for hospitalized patients. We hypothesized that this program would be associated with reduced hospital LOS, with secondary benefits to hospitalization costs, odds of 30-day readmission, and delirium rates.
METHODS
Study Design
In this retrospective cohort study, we compared clinical outcomes the year before and after implementation of a delirium care pathway across seven hospital units. The study period spanned October 1, 2015, through February 28, 2019. The study was approved by the University of California, San Francisco Institutional Review Board (#13-12500).
Multicomponent Delirium Care Pathway
The delirium care pathway was developed collaboratively among geriatrics, hospital medicine, neurology, anesthesiology, surgery, and psychiatry services, with an interprofessional team of physicians, nurses, pharmacists, and physical and occupational therapists. This pathway was implemented in units consecutively, approximately every 4 months in the following order: neurosciences, medicine, cardiology, general surgery, specialty surgery, hematology-oncology, and transplant. The same implementation education protocols were performed in each unit. The pathway consisted of several components targeting delirium prevention and management (Appendix Figure 1 and Appendix Figure 2). Systematic screening for delirium was introduced as part of the multicomponent intervention. Nursing staff assessed each patient’s risk of developing delirium at admission using the AWOL score, a validated delirium prediction tool.23 AWOL consists of: patient Age, spelling “World” backwards correctly, Orientation, and assessment of iLlness severity by the nurse. For patients who spoke a language other than English, spelling of “world” backwards was translated to his or her primary language, or if this was not possible, the task was modified to serial 7s (subtracting 7 from 100 in a serial fashion). This modification has been validated for use in other languages.24 Patients at high risk for delirium based on an AWOL score ≥2 received a multidisciplinary intervention with four components: (1) notifying the primary team by pager and electronic medical record (EMR), (2) a nurse-led, evidence-based, nonpharmacologic multicomponent intervention,25 (3) placement of a delirium order set by the physician, and (4) review of medications by the unit pharmacist who adjusted administration timing to occur during waking hours and placed a note in the EMR notifying the primary team of potentially deliriogenic medications. The delirium order set reinforced the nonpharmacologic multicomponent intervention through a nursing order, placed an automatic consult to occupational therapy, and included options to order physical therapy, order speech/language therapy, obtain vital signs three times daily with minimal night interruptions, remove an indwelling bladder catheter, and prescribe melatonin as a sleep aid.
The bedside nurse screened all patients for active delirium every 12-hour shift using the Nursing Delirium Screening Scale (NuDESC) and entered the results into the EMR.23,26 Capturing NuDESC results in the EMR allowed communication across medical providers as well as monitoring of screening adherence. Each nurse received two in-person trainings in staff meetings and one-to-one instruction during the first week of implementation. All nurses were required to complete a 15-minute training module and had the option of completing an additional 1-hour continuing medical education module. If a patient was transferred to the intensive care unit (ICU), delirium was identified through use of the ICU-specific Confusion Assessment Method (CAM-ICU) assessments, which the bedside nurse performed each shift throughout the intervention period.27 Nurses were instructed to call the primary team physician after every positive screen. Before each unit’s implementation start date, physicians with patients on that unit received education through a combination of grand rounds, resident lectures and seminars, and a pocket card on delirium evaluation and management.
Participants and Eligibility Criteria
We included all patients aged ≥50 years hospitalized for >1 day on each hospital unit (Figure). We included adults aged ≥50 years to maximize the number of participants for this study while also capturing a population at risk for delirium. Because the delirium care pathway was unit-based and the pathway was rolled out sequentially across units, only patients who were admitted to and discharged from the same unit were included to better isolate the effect of the pathway. Patients who were transferred to the ICU were only included if they were discharged from the original unit of admission. Only the first hospitalization was included for patients with multiple hospitalizations during the study period.
Patient Characteristics
Patient demographics and clinical data were collected after discharge through Clarity and Vizient electronic databases (Table 1 and Table 2). All Elixhauser comorbidities were included except for the following International Classification of Disease, Tenth Revision, Clinical Modification (ICD-10) codes that overlapped with a delirium diagnosis: G31.2, G93.89, G93.9, G94, R41.0, and R41.82 (Appendix Table 1). Severity of illness was obtained from Vizient, which calculates illness severity based on clinical and claims data (Appendix Table 1).
Delirium Metrics
Delirium screening was introduced as part of the multicomponent intervention, and therefore delirium rates before the intervention could not be determined. Trends in delirium prevalence and incidence after the intervention are reported. Prevalent delirium was defined as a single score of ≥2 on the nurse-administered NuDESC or a positive CAM-ICU at any point during the hospital stay. Incident delirium was identified if the first NuDESC score was negative and any subsequent NuDESC or CAM-ICU score was positive.
Outcomes
The primary study outcome was hospital LOS across all participants. Secondary outcomes included total direct cost and odds of 30-day hospital readmission. Readmissions tracked as part of hospital quality reporting were obtained from Vizient and were not captured if they occurred at another hospital. We also examined rates of safety attendant and restraint use during the study period, defined as the number of safety attendant days or restraint days per 1,000 patient days.
Because previous studies have demonstrated the effectiveness of multicomponent delirium interventions among elderly general medical patients,12 we also investigated these same outcomes in the medicine unit alone.
Statistical Analysis
The date of intervention implementation was determined for each hospital unit, which was defined as time(0) [t(0)]. The 12-month postintervention period was divided into four 3-month epochs to assess for trends. Data were aggregated across the seven units using t(0) as the start date, agnostic to the calendar month. Demographic and clinical characteristics were collected for the 12-months before t(0) and the four 3-month epochs after t(0). Univariate analysis of outcome variables comparing trends across the same epochs were conducted in the same manner, except for the rate of delirium, which was measured after t(0) and therefore could not be compared with the preintervention period.
Multivariable models were adjusted for age, sex, race/ethnicity, admission category, Elixhauser comorbidities, severity of illness quartile, and number days spent in the ICU. Admission category referred to whether the admission was emergent, urgent, or elective/unknown. Because it took 3 months after t(0) for each unit to reach a delirium screening compliance rate of 90%, the intervention was only considered fully implemented after this period. A ramp-up variable was set to 0 for admissions occurring prior to the intervention to t(0), 1/3 for admissions occurring 1 month post intervention, 2/3 for 2 months post intervention, and 1 for admissions occurring 3 to 12 months post intervention. In this way, the coefficient for the ramp-up variable estimated the postintervention versus preintervention effect. Numerical outcomes (LOS, cost) were log transformed to reduce skewness and analyzed using linear models. Coefficients were back-transformed to provide interpretations as proportional change in the median outcomes.
For LOS and readmission, we assessed secular trends by including admission date and admission date squared, in case the trend was nonlinear, as possible predictors; admission date was the specific date—not time from t(0)—to account for secular trends and allow contemporaneous controls in the analysis. To be conservative, we retained secular terms (first considering the quadratic and then the linear) if P <.10. The categorical outcome (30-day readmission) was analyzed using a logistic model. Count variables (delirium, safety attendants, restraints) were analyzed using Poisson regression models with a log link, and coefficients were back-transformed to provide rate ratio interpretations. Because delirium was not measured before t(0), and because the intervention was considered to take 3 months to become fully effective, baseline delirium rates were defined as those in the first 3 months adjusted by the ramp-up variable. For each outcome we included hospital unit, a ramp-up variable (measuring the pre- vs postintervention effect), and their interaction. If there was no statistically significant interaction, we presented the outcome for all units combined. If the interaction was statistically significant, we looked for consistency across units and reported results for all units combined when consistent, along with site-specific results. If the results were not consistent across the units, we provided site-specific results only. All statistical analyses were performed using SAS software, version 9.4 (SAS Institute Inc).
RESULTS
Participant Demographics and Clinical Characteristics
A total of 22,708 individuals were included in this study, with 11,018 in the preintervention period (Table 1 and Table 2). Most patients were cared for on the general surgery unit (n = 5,899), followed by the medicine unit (n = 4,923). The smallest number of patients were cared for on the hematology-oncology unit (n = 1,709). Across the five epochs, patients were of similar age and sex, and spent a similar number of days in the ICU. The population was diverse with regard to race and ethnicity; there were minor differences in admission category. There were also minor differences in severity of illness and some comorbidities between timepoints (Appendix Table 1).
Delirium Metrics
Delirium prevalence was 13.0% during the first epoch post intervention, followed by 12.0%, 11.7%, and 13.0% in the subsequent epochs (P = .91). Incident delirium occurred in 6.1% of patients during the first epoch post intervention, followed by 5.3%, 5.3%, and 5.8% in the subsequent epochs (P = .63).
Primary Outcome
Epoch-level data for LOS before and after the intervention is shown in Appendix Table 2. The mean unadjusted LOS for all units combined did not decrease after the intervention, but in the adjusted model, the mean LOS decreased by 2% after the intervention (P = .0087; Table 3).
Secondary Outcomes
The odds of 30-day readmission decreased by 14% (P = .0002) in the adjusted models for all units combined (Table 3). There was no statistically significant reduction in adjusted total direct hospitalization cost or rate of restraint use. The safety attendant results showed strong effect modification across sites; the site-specific estimates are provided in Appendix Table 3. However, the estimated values all showed reductions, and a number were large and statistically significant.
Medicine Unit Outcomes
On the medicine unit alone, we observed a statistically significant reduction in LOS of 9% after implementation of the delirium care pathway (P = .028) in the adjusted model (Table 3). There was an associated 7% proportional decrease in total direct cost (P = .0002). Reductions in 30-day readmission and safety attendant use did not remain statistically significant in the adjusted models.
DISCUSSION
Implementation of a hospital-wide multicomponent delirium care pathway was associated with reduced hospital LOS and 30-day hospital readmission in a study of 22,708 hospitalized adults at a tertiary care, university hospital in Northern California, encompassing both medical and surgical acute care patients. When evaluating general medicine patients alone, pathway implementation was associated with reductions in LOS and total direct cost. The cost savings of 7% among medical patients translates to median savings of $1,237 per hospitalization. This study—one of the largest to date examining implementation of a hospital-wide delirium care pathway—supports use of a multicomponent delirium care pathway for older adults hospitalized for a range of conditions.
Multicomponent pathways for delirium prevention and management are increasingly being used in hospital settings. The United Kingdom National Institute for Health and Care Excellence guidelines recommend delirium assessment and intervention by a multidisciplinary team within 24 hours of hospital admission for those at risk.25 These guidelines are based on evidence accumulated in clinical studies over the past 30 years suggesting that multicomponent interventions reduce incident delirium by 30% to 40% among medical and surgical patients.12,13,25,28
Although multicomponent delirium care pathways are associated with improved patient outcomes, the specific clinical benefits might vary across patient populations. Here, we found larger reductions in LOS and total direct cost among medicine patients. Medical patients might respond more robustly to nonpharmacologic multicomponent delirium interventions because of differing delirium etiologies (eg, constipation and sleep deprivation in a medical patient vs seizures or encephalitis in a neurosciences patient). Another explanation for the difference observed in total direct cost might be the inclusion of surgical units in the total study population. For example, not all hospital days are equivalent in cost for patients on a surgical unit.29 For patients requiring surgical care, most of the hospitalization cost might be incurred during the initial days of hospitalization, when there are perioperative costs; therefore, reduced LOS might have a lower economic impact.29 Multicomponent, nonpharmacologic delirium interventions encourage discontinuing restraints. As a result, one might expect a need for more frequent safety attendant use and an associated cost increase. However, we found that the estimated unit-specific values for safety attendant use showed reductions, which were large and highly statistically significant. For all units combined and the medicine unit alone, we found that the rate of restraint use decreased, although the change was not statistically significant. It is possible that some of the interventions taught to nurses and physicians as part of care pathway implementation, such as the use of family support for at-risk and delirious patients, led to a reduction in both safety attendants and restraints.
Our study had several strengths. This is one of the largest hospital-based delirium interventions studied, both in terms of its scope across seven diverse medical and surgical hospital units and the number of hospitalized patients studied. This intervention did not require additional staff or creating a specialized ward. Adherence to the pathway, as measured by risk assessment and delirium screening, was high (>90%) 3 months after implementation. This allowed for robust outcome ascertainment. The patient population’s characteristics and rates of delirium were stable over time. Because different hospital units incorporated the multicomponent delirium care pathway at different times, limiting enrollment to patients admitted and discharged from the same unit isolated the analysis to patients exposed to the pathway on each unit. This design also limited potential influence of other hospital quality improvement projects that might have occurred at the same time.
The primary limitation of this study is that screening for delirium was introduced as part of the multicomponent intervention. This decision was made to maximize buy-in from bedside nurses performing delirium screening because this addition to their workflow was explicitly linked to delirium prevention and management measures. Delirium could not be ascertained preintervention from the EMR because it is a clinical diagnosis and is coded inadequately.30 We could only measure the change in delirium metrics after implementation of the delirium care pathway. Because baseline delirium rates before the intervention were not measured systematically, conclusions about the intervention’s association with delirium metrics are limited. All other outcomes were measured before and after the intervention.
Although the comprehensive delirium screening program and high rate of adherence are a methodologic strength of this study, a second limitation is the use of the NuDESC. Our previous research demonstrated that the NuDESC has low sensitivity but high specificity and positive predictive value,26 which might underestimate delirium rates in this study. However, any underestimation should be stable over time and temporal trends should remain meaningful. This could allow more widespread study of delirium among hospitalized individuals. Because this care pathway was hospital-wide, it was important to ensure both consistency of screening and longevity of the initiative, and it was necessary to select a delirium assessment tool that was efficient and validated for nursing implementation. For these reasons, the NuDESC was an appropriate choice.
It is possible that our results could be influenced by unmeasured confounders. For example, although we incorporated Elixhauser medical comorbidities and illness severity into our model, we were unable to adjust for baseline functional status or frailty. Baseline functional status and frailty were not reliably recorded in the EMR, although these are potential confounders when investigating clinical outcomes including hospital readmission.
CONCLUSION
Implementation of a systematic, hospital-wide multicomponent delirium care pathway is associated with reductions in hospital LOS and 30-day readmission. In general medicine units, the reduction in LOS and associated cost savings were robust. These results demonstrate the feasibility and effectiveness of implementing an interprofessional, multidisciplinary multicomponent delirium care pathway through medical center funding to benefit patients and the hospital system.
Acknowledgments
The authors thank the many hospital staff members, especially the nurses, pharmacists, therapists, and patient care assistants, who helped implement the multicomponent delirium care pathway. All persons who have contributed significantly to this work are listed as authors of this work.
1. Bidwell J. Interventions for preventing delirium in hospitalized non-ICU patients: A Cochrane review summary. Int J Nurs Stud. 2017;70:142-143. https://doi.org/ 10.1016/j.ijnurstu.2016.11.010
2. Maldonado JR. Delirium in the acute care setting: characteristics, diagnosis and treatment. Crit Care Clin. 2008;24(4):657-722, vii. https://doi.org/10.1016/j.ccc.2008.05.008
3. Field RR, Wall MH. Delirium: past, present, and future. Semin Cardiothorac Vasc Anesth. 2013;17(3):170-179. https://doi.org/10.1177/1089253213476957
4. Oh ST, Park JY. Postoperative delirium. Korean J Anesthesiol. 2019;72(1):4-12. https://doi.org/10.4097/kja.d.18.00073.1
5. Francis J, Martin D, Kapoor WN. A prospective study of delirium in hospitalized elderly. JAMA. 1990;263(8):1097-1101.
6. Salluh JI, Soares M, Teles JM, et al. Delirium epidemiology in critical care (DECCA): an international study. Crit Care. 2010;14(6):R210. https://doi.org/10.1186/cc9333
7. Ely EW, Shintani A, Truman B, et al. Delirium as a predictor of mortality in mechanically ventilated patients in the intensive care unit. JAMA. 2004;291(14):1753-1762. https://doi.org/
8. McCusker J, Cole MG, Dendukuri N, Belzile E. Does delirium increase hospital stay? J Am Geriatr Soc. 2003;51(11):1539-1546. https://doi.org/10.1001/jama.291.14.1753
9. Inouye SK, Rushing JT, Foreman MD, Palmer RM, Pompei P. Does delirium contribute to poor hospital outcomes? A three-site epidemiologic study. J Gen Intern Med. 1998;13(4):234-242. https://doi.org/10.1046/j.1525-1497.1998.00073.x
10. Siddiqi N, House AO, Holmes JD. Occurrence and outcome of delirium in medical in-patients: a systematic literature review. Age Ageing. 2006;35(4):350-364. https://doi.org/10.1093/ageing/afl005
11. LaHue SC, Douglas VC, Kuo T, et al. Association between inpatient delirium and hospital readmission in patients >/= 65 years of age: a retrospective cohort study. J Hosp Med. 2019;14(4):201-206. https://doi.org/10.12788/jhm.3130
12. Hshieh TT, Yue J, Oh E, et al. Effectiveness of multicomponent nonpharmacological delirium interventions: a meta-analysis. JAMA Intern Med. 2015;175(4):512-520. https://doi.org/10.1001/jamainternmed.2014.7779
13. Inouye SK, Bogardus ST, Jr., Charpentier PA, et al. A multicomponent intervention to prevent delirium in hospitalized older patients. N Engl J Med. 1999;340(9):669-676. https://doi.org/10.1056/NEJM199903043400901
14. Marcantonio ER, Flacker JM, Wright RJ, Resnick NM. Reducing delirium after hip fracture: a randomized trial. J Am Geriatr Soc. 2001;49(5):516-522. https://doi.org/
15. Alhaidari AA, Allen-Narker RA. An evolving approach to delirium: A mixed-methods process evaluation of a hospital-wide delirium program in New Zealand. Australas J Ageing. 2017. https://doi.org/10.1046/j.1532-5415.2001.49108.x
16. Holroyd-Leduc JM, Khandwala F, Sink KM. How can delirium best be prevented and managed in older patients in hospital? CMAJ. 2010;182(5):465-470. https://doi.org/10.1503/cmaj.080519
17. Siddiqi N, Stockdale R, Britton AM, Holmes J. Interventions for preventing delirium in hospitalised patients. Cochrane Database Syst Rev. 2007(2):CD005563. https://doi.org/ 10.1002/14651858.CD005563.pub2
18. Siddiqi N, Harrison JK, Clegg A, et al. Interventions for preventing delirium in hospitalised non-ICU patients. Cochrane Database Syst Rev. 2016;3:CD005563. https://doi.org/10.1002/14651858.CD005563.pub3
19. Inouye SK, Westendorp RG, Saczynski JS. Delirium in elderly people. Lancet. 2014;383(9920):911-922. https://doi.org/10.1016/S0140-6736(13)60688-1
20. Inouye SK, Charpentier PA. Precipitating factors for delirium in hospitalized elderly persons. Predictive model and interrelationship with baseline vulnerability. JAMA. 1996;275(11):852-857.
21. LaHue SC, Liu VX. Loud and clear: sensory impairment, delirium, and functional recovery in critical illness. Am J Respir Crit Care Med. 2016;194(3):252-253. https://doi.org/10.1164/rccm.201602-0372ED
22. Ritter SRF, Cardoso AF, Lins MMP, Zoccoli TLV, Freitas MPD, Camargos EF. Underdiagnosis of delirium in the elderly in acute care hospital settings: lessons not learned. Psychogeriatrics. 2018;18(4):268-275. https://doi.org/10.1111/psyg.12324
23. Douglas VC, Hessler CS, Dhaliwal G, et al. The AWOL tool: derivation and validation of a delirium prediction rule. J Hosp Med. 2013;8(9):493-499. https://doi.org/10.1002/jhm.2062
24. Tombaugh TN, McDowell I, Kristjansson B, Hubley AM. Mini-Mental State Examination (MMSE) and the modified MMSE (3MS): A psychometric comparison and normative data. Psychol Assessment. 1996;8(1):48-59. https://doi.org/10.1037/1040-3590.8.1.48
25. Young J, Murthy L, Westby M, Akunne A, O’Mahony R, Guideline Development Group. Diagnosis, prevention, and management of delirium: summary of NICE guidance. BMJ. 2010;341:c3704. https://doi.org/10.1136/bmj.c3704
26. Hargrave A, Bastiaens J, Bourgeois JA, et al. Validation of a nurse-based delirium-screening tool for hospitalized patients. Psychosomatics. 2017;58(6):594-603. https://doi.org/10.1016/j.psym.2017.05.005
27. Ely EW, Inouye SK, Bernard GR, et al. Delirium in mechanically ventilated patients: validity and reliability of the confusion assessment method for the intensive care unit (CAM-ICU). JAMA. 2001;286(21):2703-2710. https://doi.org/10.1001/jama.286.21.2703
28. Strijbos MJ, Steunenberg B, van der Mast RC, Inouye SK, Schuurmans MJ. Design and methods of the Hospital Elder Life Program (HELP), a multicomponent targeted intervention to prevent delirium in hospitalized older patients: efficacy and cost-effectiveness in Dutch health care. BMC Geriatr. 2013;13:78. https://doi.org/10.1186/1471-2318-13-78
29. Taheri PA, Butz DA, Greenfield LJ. Length of stay has minimal impact on the cost of hospital admission. J Am Coll Surg. 2000;191(2):123-130. https://doi.org/10.1016/s1072-7515(00)00352-5
30. Fong TG, Tulebaev SR, Inouye SK. Delirium in elderly adults: diagnosis, prevention and treatment. Nat Rev Neurol. 2009;5(4):210-220. https://doi.org/10.1038/nrneurol.2009.24
© 2021 Society of Hospital Medicine
HbA1c Change in Patients With and Without Gaps in Pharmacist Visits at a Safety-Net Resident Physician Primary Care Clinic
From Titus Family Department of Clinical Pharmacy, School of Pharmacy, University of Southern California, Los Angeles, CA (Drs. Chu and Ma and Mimi Lou), and Department of Family Medicine, Keck Medicine, University of Southern California, Los Angeles, CA (Dr. Suh).
Objective: The objective of this study is to describe HbA1c changes in patients who maintained continuous pharmacist care vs patients who had a gap in pharmacist care of 3 months or longer.
Methods: This retrospective study was conducted from October 1, 2018, to September 30, 2019. Electronic health record data from an academic-affiliated, safety-net resident physician primary care clinic were collected to observe HbA1c changes between patients with continuous pharmacist care and patients who had a gap of 3 months or longer in pharmacist care. A total of 189 patients met the inclusion criteria and were divided into 2 groups: those with continuous care and those with gaps in care. Data were analyzed using the Mann-Whitney test for continuous variables and the χ2 (or Fisher exact) test for categorical variables. The differences-in-differences model was used to compare the changes in HbA1c between the 2 groups.
Results: There was no significant difference in changes in HbA1c between the continuous care group and the gaps in care group, although the mean magnitude of HbA1c changes was numerically greater in the continuous care group (-1.48% vs -0.97%). Overall, both groups showed improvement in their HbA1c levels and had similar numbers of primary care physician visits and acute care utilizations, while the gaps in care group had longer duration with pharmacists and between the adjacent pharmacist visits.
Conclusion: Maintaining continuous, regular visits with a pharmacist at a safety-net resident physician primary care clinic did not show a significant difference in HbA1c changes compared to having gaps in pharmacist care. Future studies on socioeconomic and behavioral burden on HbA1c improvement and on pharmacist visits in these populations should be explored.
Keywords: clinical pharmacist; diabetes management; continuous visit; primary care clinic.
Pharmacists have unique skills in identifying and resolving problems related to the safety and efficacy of drug therapy while addressing medication adherence and access for patients. Their expertise is especially important to meet the care needs of a growing population with chronic conditions amidst a primary care physician shortage.1 As health care systems move toward value-based care, emphasis on improvement in quality and health measures have become central in care delivery. Pharmacists have been integrated into team-based care in primary care settings, but the value-based shift has opened more opportunities for pharmacists to address unmet quality standards.2-5
Many studies have reported that the integration of pharmacists into team-based care improves health outcomes and reduces overall health care costs.6-9 Specifically, when pharmacists were added to primary care teams to provide diabetes management, hemoglobin HbA1c levels were reduced compared to teams without pharmacists.10-13 Offering pharmacist visits as often as every 2 weeks to 3 months, with each patient having an average of 4.7 visits, resulted in improved therapeutic outcomes.3,7 During visits, pharmacists address the need for additional drug therapy, deprescribe unnecessary therapy, correct insufficient doses or durations, and switch patients to more cost-efficient drug therapy.9 Likewise, patients who visit pharmacists in addition to seeing their primary care physician can have medication-related concerns resolved and improve their therapeutic outcomes.10,11
Not much is known about the magnitude of HbA1c change based on the regularity of pharmacist visits. Although pharmacists offer follow-up appointments in reasonable time intervals, patients do not keep every appointment for a variety of reasons, including forgetfulness, personal issues, and a lack of transportation.14 Such missed appointments can negatively impact health outcomes.14-16 The purpose of this study is to describe HbA1c changes in patients who maintained continuous, regular pharmacist visits without a 3-month gap and in patients who had history of inconsistent pharmacist visits with a gap of 3 months or longer. Furthermore, this study describes the frequency of health care utilization for these 2 groups.
Methods
Setting
The Internal Medicine resident physician primary care clinic is 1 of 2 adult primary care clinics at an academic, urban, public medical center. It is in the heart of East Los Angeles, where predominantly Spanish-speaking and minority populations reside. The clinic has approximately 19000 empaneled patients and is the largest resident primary care clinic in the public health system. The clinical pharmacy service addresses unmet quality standards, specifically HbA1c. The clinical pharmacists are co-located and collaborate with resident physicians, attending physicians, care managers, nurses, social workers, and community health workers at the clinic. They operate under collaborative practice agreements with prescriptive authority, except for controlled substances, specialty drugs, and antipsychotic medications.
Pharmacist visit
Patients are primarily referred by resident physicians to clinical pharmacists when their HbA1c level is above 8% for an extended period, when poor adherence and low health literacy are evident regardless of HbA1c level, or when a complex medication regimen requires comprehensive medication review and reconciliation. The referral occurs through warm handoff by resident physicians as well as clinic nurses, and it is embedded in the clinic flow. Patients continue their visits with resident physicians for issues other than their referral to clinical pharmacists. The visits with pharmacists are appointment-based, occur independently from resident physician visits, and continue until the patient’s HbA1c level or adherence is optimized. Clinical pharmacists continue to follow up with patients who may have reached their target HbA1c level but still are deemed unstable due to inconsistency in their self-management and medication adherence.
After the desirable HbA1c target is achieved along with full adherence to medications and self-management, clinical pharmacists will hand off patients back to resident physicians. At each visit, pharmacists perform a comprehensive medication assessment and reconciliation that includes adjusting medication therapy, placing orders for necessary laboratory tests and prescriptions, and assessing medication adherence. They also evaluate patients’ signs and symptoms for hyperglycemic complications, hypoglycemia, and other potential treatment-related adverse events. These are all within the pharmacist’s scope of practice in comprehensive medication management. Patient education is provided with the teach-back method and includes lifestyle modifications and medication counseling (Table 1). Pharmacists offer face-to-face visits as frequently as every 1 to 2 weeks to every 4 to 6 weeks, depending on the level of complexity and the severity of a patient’s conditions and medications. For patients whose HbA1c has reached the target range but have not been deemed stable, pharmacists continue to check in with them every 2 months. Phone visits are also utilized as an additional care delivery method for patients having difficulty showing up for face-to-face visits or needing quick assessment of medication adherence and responses to changes in drug treatment in between the face-to-face visits. The maximal interval between pharmacist visits is offered no longer than every 8 weeks. Patients are contacted via phone or mail by the nursing staff to reschedule if they miss their appointments with pharmacists. Every pharmacy visit is documented in the patient’s electronic medical record.

Study design
This is a retrospective study describing the HbA1c changes in a patient group that maintained pharmacist visits, with each interval less than 3 months, and in another group, who had a history of a 3-month or longer gap between pharmacist visits. The data were obtained from patients’ electronic medical records during the study period of October 1, 2018, and September 30, 2019, and collected using a HIPAA-compliant, electronic data storage website, REDCap. The institutional review board approval was obtained under HS-19-00929. Patients 18 years and older who were referred by primary care resident physicians for diabetes management, and had 2 or more visits with a pharmacist within the study period, were included. Patients were excluded if they had only 1 HbA1c drawn during the study period, were referred to a pharmacist for reasons other than diabetes management, were concurrently managed by an endocrinologist, had only 1 visit with a pharmacist, or had no visits with their primary care resident physician for over a year. The patients were then divided into 2 groups: continuous care cohort (CCC) and gap in care cohort (GCC). Both face-to-face and phone visits were counted as pharmacist visits for each group.
Outcomes
The primary outcome was the change in HbA1c from baseline between the 2 groups. Baseline HbA1c was considered as the HbA1c value obtained within 3 months prior to, or within 1 month, of the first visit with the pharmacist during the study period. The final HbA1c was considered the value measured within 1 month of, or 3 months after, the patient’s last visit with the pharmacist during the study period.
Several subgroup analyses were conducted to examine the relationship between HbA1c and each group. Among patients whose baseline HbA1c was ≥ 8%, we looked at the percentage of patients reaching HbA1c < 8%, the percentage of patients showing any level of improvement in HbA1c, and the change in HbA1c for each group. We also looked at the percentage of patients with baseline HbA1c < 8% maintaining the level throughout the study period and the change in HbA1c for each group. Additionally, we looked at health care utilization, which included pharmacist visits, primary care physician visits, emergency room and urgent care visits, and hospitalizations for each group. The latter 3 types of utilization were grouped as acute care utilization and further analyzed for visit reasons, which were subsequently categorized as diabetes related and non-diabetes related. The diabetes related reasons linking to acute care utilization were defined as any episodes related to hypoglycemia, diabetic ketoacidosis (DKA), hyperosmolar hyperglycemic state (HHS), foot ulcers, retinopathy, and osteomyelitis infection. All other reasons leading to acute care utilization were categorized as non-diabetes related.
Statistical analysis
Descriptive analyses were conducted using the Mann-Whitney test for continuous data and χ2 (or Fisher exact) test for categorical data. A basic difference-in-differences (D-I-D) method was used to compare the changes of HbA1c between the CCC and GCC over 2 time points: baseline and final measurements. The repeated measures ANOVA was used for analyzing D-I-D. P < .05 was considered significant. Statistical analyses were performed using SAS version 9.4 (SAS Institute, Cary, NC).

Results
Baseline data
A total of 1272 patients were identified within the study period, and 189 met the study inclusion criteria. The CCC included 132 patients, the GCC 57. The mean age of patients in both groups was similar at 57 years old (P = .39). Most patients had Medicaid as their primary insurance. About one-third of patients in each group experienced clinical atherosclerotic cardiovascular disease, and about 12% overall had chronic kidney disease stage 3 and higher. The average number of days that patients were under pharmacist care during the study period was longer in the GCC compared to the CCC, and it was statistically significant (P < .001) (Table 2). The mean ± SD baseline HbA1c for the CCC and GCC was 10.0% ± 2.0% and 9.9% ± 1.7%, respectively, and the difference was not statistically significant (P = .93). About 86% of patients in the CCC and 90% in the GCC had a baseline HbA1c of ≥ 8%.

HbA1c
The mean change in HbA1c between the 2 groups was not statistically significant (-1.5% ± 2.0% in the CCC vs -1.0% ± 2.1% in the GCC, P = .36) (Table 3). However, an absolute mean HbA1c reduction of 1.3% was observed in both groups combined at the end of the study. Figure 1 shows a D-I-D model of the 2 groups. Based on the output, the P value of .11 on the interaction term (time*group) indicates that the D-I-D in HbA1c change from baseline to final between the CCC and GCC is not statistically different. However, the magnitude of the difference calculated from the LSMEANS results showed a trend. The HbA1c from baseline to final measurement of patients in the GCC declined by 0.97 percentage points (from 9.94% to 8.97%), while those in the CCC saw their HbA1c decline by 1.48 percentage points (from 9.96% to 8.48%), for a D-I-D of 0.51. In other words, those in the GCC had an HbA1c that decreased by 0.51% less than that of patients in the CCC, suggesting that the CCC shows a steeper line declining from baseline to final HbA1c compared to the GCC, whose line declines less sharply.

In the subgroup analysis of patients whose baseline HbA1c was ≥ 8%, about 42% in the CCC and 37% in the GCC achieved an HbA1c < 8% (P = .56) (Table 4). Approximately 83% of patients in the CCC had some degree of HbA1c improvement—the final HbA1c was lower than their baseline HbA1c—whereas this was observed in about 75% of patients in the GCC (P = .19). Of patients whose baseline HbA1c was < 8%, there was no significant difference in proportion of patients maintaining an HbA1c < 8% between the groups (P = .57), although some increases in HbA1c and HbA1c changes were observed in the GCC (Table 5).

Health care utilization
Patients in the CCC visited pharmacists 5 times on average over 12 months, whereas patients in the GCC had an average of 6 visits (5 ± 2.6 in the CCC vs 6 ± 2.6 in the GCC, P = .01) (Table 6). The mean length between any 2 adjacent visits was significantly different, averaging about 33 days in the CCC compared to 64 days in the GCC (33.2 ± 10 in the CCC vs 63.7 ± 39.4 in the GCC, P < .001). As shown in Figure 2, the GCC shows wider ranges between any adjacent pharmacy visits throughout until the 10th visit. Both groups had a similar number of visits with primary care physicians during the same time period (4.6 ± 1.86 in the CCC vs 4.3 ± 2.51 in the GCC, P = .44). About 30% of patients in the CCC and 47% in the GCC had at least 1 visit to the emergency room or urgent care or had at least 1 hospital admission, for a total of 124 acute care utilizations between the 2 groups combined. Only a small fraction of acute care visits with or without hospitalizations were related to diabetes and its complications (23.1% in the CCC vs 22.0% in the GCC).

Discussion
This is a real-world study that describes HbA1c changes in patients who maintained pharmacy visits regularly and in those who had a history of a 3-month or longer gap in pharmacy visits. Although the study did not show statistically significant differences in HbA1c reduction between the 2 groups, pharmacists’ care, overall, provided mean HbA1c reductions of 1.3%. This result is consistent with those from multiple previous studies.10-13 It is worth noting that the final HbA1c was numerically lower in patients who followed up with pharmacists regularly than in patients with gaps in visits, with a difference of about 0.5 percentage points. This difference is considered clinically significant,17 and potentially could be even greater if the study duration was longer, as depicted by the slope of HbA1c reductions in the D-I-D model (Figure 1).

Previous studies have shown that pharmacist visits are conducted in shorter intervals than primary care physician visits to provide closer follow-up and to resolve any medication-related problems that may hinder therapeutic outcome improvements.3-4,7-9 Increasing access via pharmacists is particularly important in this clinic, where resident physician continuity and access is challenging. The pharmacist-driven program described in this study does not deviate from the norm, and this study confirms that pharmacist care, regardless of gaps in pharmacist visits, may still be beneficial.
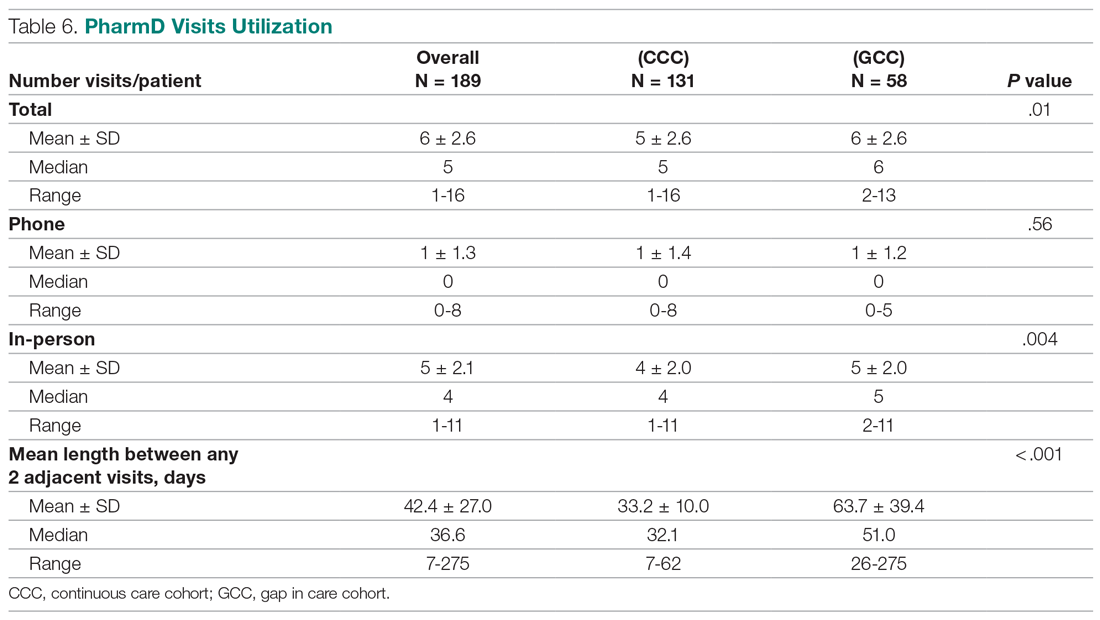
Another notable finding from this study was that although the average number of pharmacist visits per patient was significantly different, this difference of 1 visit did not result in a statistically significant improvement in HbA1c. In fact, the average number of pharmacist visits per patient seemed to be within the reported range by Choe et al in a similar setting.7 Conversely, patients with a history of a gap in pharmacist visits spent longer durations under pharmacist care compared to those who had continuous follow-up. This could mean that it may take longer times or 1 additional visit to achieve similar HbA1c results with continuous pharmacist care. Higher number of visits with pharmacists in the group with the history of gaps between pharmacist visits could have been facilitated by resident physicians, as both groups had a similar number of visits with them. Although this is not conclusive, identifying the optimal number of visits with pharmacists in this underserved population could be beneficial in strategizing pharmacist visits. Acute care utilization was not different between the 2 groups, and most cases that led to acute care utilization were not directly related to diabetes or its complications.
The average HbA1c at the end of the study did not measure < 8%, a target that was reached by less than half of patients from each group; however, this study is a snapshot of a series of ongoing clinical pharmacy services. About 25% of our patients started their first visit with a pharmacist less than 6 months from the study end date, and these patients may not have had enough time with pharmacists for their HbA1c to reach below the target goal. In addition, most patients in this clinic were enrolled in public health plans and may carry a significant burden of social and behavioral factors that can affect diabetes management.18,19 These patients may need longer care by pharmacists along with other integrated services, such as behavioral health and social work, to achieve optimal HbA1c levels.20
There are several limitations to this study, including the lack of a propensity matched control group of patients who only had resident physician visits; thus, it is hard to test the true impact of continuous or intermittent pharmacist visits on the therapeutic outcomes. The study also does not address potential social, economic, and physical environment factors that might have contributed to pharmacist visits and to overall diabetes care. These factors can negatively impact diabetes control and addressing them could help with an individualized diabetes management approach.17,18 Additionally, by nature of being a descriptive study, the results may be subject to undetermined confounding factors.
Conclusion
Patients maintaining continuous pharmacist visits do not have statistically significant differences in change in HbA1c compared to patients who had a history of 3-month or longer gaps in pharmacist visits at a resident physician primary care safety-net clinic. However, patients with diabetes will likely derive a benefit in HbA1c reduction regardless of regularity of pharmacist care. This finding still holds true in collaboration with resident physicians who also regularly meet with patients.
The study highlights that it is important to integrate clinical pharmacists into primary care teams for improved therapeutic outcomes. It is our hope that regular visits to pharmacists can be a gateway for behavioral health and social work referrals, thereby addressing pharmacist-identified social barriers. Furthermore, exploration of socioeconomic and behavioral barriers to pharmacist visits is necessary to address and improve the patient experience, health care delivery, and health outcomes.
Acknowledgments: The authors thank Roxanna Perez, PharmD, Amy Li, and Julie Dopheide, PharmD, BCPP, FASHP for their contributions to this project.
Corresponding author: Michelle Koun Lee Chu, PharmD, BCACP, APh, Titus Family Department of Clinical Pharmacy, School of Pharmacy, University of Southern California, 1985 Zonal Ave, Los Angeles, CA 90089-9121; lee118@usc.edu.
Financial disclosures: None.
1. Manolakis PG, Skelton JB. Pharmacists’ contributions to primary care in the United States collaborating to address unmet patient care needs: the emerging role for pharmacists to address the shortage of primary care providers. Am J Pharm Educ. 2010;74(10):S7.
2. Scott MA, Hitch B, Ray L, Colvin G. Integration of pharmacists into a patient-centered medical home. J Am Pharm Assoc (2003). 2011;51(2):161‐166.
3. Wong SL, Barner JC, Sucic K, et al. Integration of pharmacists into patient-centered medical homes in federally qualified health centers in Texas. J Am Pharm Assoc (2003). 2017;57(3):375‐381.
4. Sapp ECH, Francis SM, Hincapie AL. Implementation of pharmacist-driven comprehensive medication management as part of an interdisciplinary team in primary care physicians’ offices. Am J Accountable Care. 2020;8(1):8-11.
5. Cowart K, Olson K. Impact of pharmacist care provision in value-based care settings: How are we measuring value-added services? J Am Pharm Assoc (2003). 2019;59(1):125-128.
6. Centers for Disease Control and Prevention. Pharmacy: Collaborative Practice Agreements to Enable Drug Therapy Management. January 16, 2018. Accessed April 17, 2021. https://www.cdc.gov/dhdsp/pubs/guides/best-practices/pharmacist-cdtm.htm
7. Choe HM, Farris KB, Stevenson JG, et al. Patient-centered medical home: developing, expanding, and sustaining a role for pharmacists. Am J Health Syst Pharm. 2012;69(12):1063-1071.
8. Coe AB, Choe HM. Pharmacists supporting population health in patient-centered medical homes. Am J Health Syst Pharm. 2017;74(18):1461-1466.
9. Luder HR, Shannon P, Kirby J, Frede SM. Community pharmacist collaboration with a patient-centered medical home: establishment of a patient-centered medical neighborhood and payment model. J Am Pharm Assoc (2003). 2018;58(1):44-50.
10. Matzke GR, Moczygemba LR, Williams KJ, et al. Impact of a pharmacist–physician collaborative care model on patient outcomes and health services utilization. 10.05Am J Health Syst Pharm. 2018;75(14):1039-1047.
11. Aneese NJ, Halalau A, Muench S, et al. Impact of a pharmacist-managed diabetes clinic on quality measures. Am J Manag Care. 2018;24(4 Spec No.):SP116-SP119.
12. Prudencio J, Cutler T, Roberts S, et al. The effect of clinical 10.05pharmacist-led comprehensive medication management on chronic disease state goal attainment in a patient-centered medical home. J Manag Care Spec Pharm. 2018;24(5):423-429.
13. Edwards HD, Webb RD, Scheid DC, et al. A pharmacist visit improves diabetes standards in a patient-centered medical home (PCMH). Am J Med Qual. 2012;27(6) 529-534.
14. Ullah S, Rajan S, Liu T, et al. Why do patients miss their appointments at primary care clinics? J Fam Med Dis Prev. 2018;4:090.
15. Moore CG, Wilson-Witherspoon P, Probst JC. Time and money: effects of no-shows at a family practice residency clinic. Fam Med. 2001;33(7):522-527.
16. Kheirkhah P, Feng Q, Travis LM, et al. Prevalence, predictors and economic consequences of no-shows. BMC Health Serv Res. 2016;16:13.
17. Little RR, Rohlfing C. The long and winding road to optimal HbA10.051c10.05 measurement. Clin Chim Acta. 2013;418:63-71.
18. Hill J, Nielsen M, Fox MH. Understanding the social factors that contribute to diabetes: a means to informing health care and social policies for the chronically ill. Perm J. 2013;17(2):67-72.
19. Gonzalez-Zacarias AA, Mavarez-Martinez A, Arias-Morales CE, et al. Impact of demographic, socioeconomic, and psychological factors on glycemic self-management in adults with type 2 diabetes mellitus. Front Public Health. 2016;4:195.
20. Pantalone KM, Misra-Hebert AD, Hobbs TD, et al. The probability of A1c goal attainment in patients with uncontrolled type 2 diabetes in a large integrated delivery system: a prediction model. Diabetes Care. 2020;43:1910-1919.
From Titus Family Department of Clinical Pharmacy, School of Pharmacy, University of Southern California, Los Angeles, CA (Drs. Chu and Ma and Mimi Lou), and Department of Family Medicine, Keck Medicine, University of Southern California, Los Angeles, CA (Dr. Suh).
Objective: The objective of this study is to describe HbA1c changes in patients who maintained continuous pharmacist care vs patients who had a gap in pharmacist care of 3 months or longer.
Methods: This retrospective study was conducted from October 1, 2018, to September 30, 2019. Electronic health record data from an academic-affiliated, safety-net resident physician primary care clinic were collected to observe HbA1c changes between patients with continuous pharmacist care and patients who had a gap of 3 months or longer in pharmacist care. A total of 189 patients met the inclusion criteria and were divided into 2 groups: those with continuous care and those with gaps in care. Data were analyzed using the Mann-Whitney test for continuous variables and the χ2 (or Fisher exact) test for categorical variables. The differences-in-differences model was used to compare the changes in HbA1c between the 2 groups.
Results: There was no significant difference in changes in HbA1c between the continuous care group and the gaps in care group, although the mean magnitude of HbA1c changes was numerically greater in the continuous care group (-1.48% vs -0.97%). Overall, both groups showed improvement in their HbA1c levels and had similar numbers of primary care physician visits and acute care utilizations, while the gaps in care group had longer duration with pharmacists and between the adjacent pharmacist visits.
Conclusion: Maintaining continuous, regular visits with a pharmacist at a safety-net resident physician primary care clinic did not show a significant difference in HbA1c changes compared to having gaps in pharmacist care. Future studies on socioeconomic and behavioral burden on HbA1c improvement and on pharmacist visits in these populations should be explored.
Keywords: clinical pharmacist; diabetes management; continuous visit; primary care clinic.
Pharmacists have unique skills in identifying and resolving problems related to the safety and efficacy of drug therapy while addressing medication adherence and access for patients. Their expertise is especially important to meet the care needs of a growing population with chronic conditions amidst a primary care physician shortage.1 As health care systems move toward value-based care, emphasis on improvement in quality and health measures have become central in care delivery. Pharmacists have been integrated into team-based care in primary care settings, but the value-based shift has opened more opportunities for pharmacists to address unmet quality standards.2-5
Many studies have reported that the integration of pharmacists into team-based care improves health outcomes and reduces overall health care costs.6-9 Specifically, when pharmacists were added to primary care teams to provide diabetes management, hemoglobin HbA1c levels were reduced compared to teams without pharmacists.10-13 Offering pharmacist visits as often as every 2 weeks to 3 months, with each patient having an average of 4.7 visits, resulted in improved therapeutic outcomes.3,7 During visits, pharmacists address the need for additional drug therapy, deprescribe unnecessary therapy, correct insufficient doses or durations, and switch patients to more cost-efficient drug therapy.9 Likewise, patients who visit pharmacists in addition to seeing their primary care physician can have medication-related concerns resolved and improve their therapeutic outcomes.10,11
Not much is known about the magnitude of HbA1c change based on the regularity of pharmacist visits. Although pharmacists offer follow-up appointments in reasonable time intervals, patients do not keep every appointment for a variety of reasons, including forgetfulness, personal issues, and a lack of transportation.14 Such missed appointments can negatively impact health outcomes.14-16 The purpose of this study is to describe HbA1c changes in patients who maintained continuous, regular pharmacist visits without a 3-month gap and in patients who had history of inconsistent pharmacist visits with a gap of 3 months or longer. Furthermore, this study describes the frequency of health care utilization for these 2 groups.
Methods
Setting
The Internal Medicine resident physician primary care clinic is 1 of 2 adult primary care clinics at an academic, urban, public medical center. It is in the heart of East Los Angeles, where predominantly Spanish-speaking and minority populations reside. The clinic has approximately 19000 empaneled patients and is the largest resident primary care clinic in the public health system. The clinical pharmacy service addresses unmet quality standards, specifically HbA1c. The clinical pharmacists are co-located and collaborate with resident physicians, attending physicians, care managers, nurses, social workers, and community health workers at the clinic. They operate under collaborative practice agreements with prescriptive authority, except for controlled substances, specialty drugs, and antipsychotic medications.
Pharmacist visit
Patients are primarily referred by resident physicians to clinical pharmacists when their HbA1c level is above 8% for an extended period, when poor adherence and low health literacy are evident regardless of HbA1c level, or when a complex medication regimen requires comprehensive medication review and reconciliation. The referral occurs through warm handoff by resident physicians as well as clinic nurses, and it is embedded in the clinic flow. Patients continue their visits with resident physicians for issues other than their referral to clinical pharmacists. The visits with pharmacists are appointment-based, occur independently from resident physician visits, and continue until the patient’s HbA1c level or adherence is optimized. Clinical pharmacists continue to follow up with patients who may have reached their target HbA1c level but still are deemed unstable due to inconsistency in their self-management and medication adherence.
After the desirable HbA1c target is achieved along with full adherence to medications and self-management, clinical pharmacists will hand off patients back to resident physicians. At each visit, pharmacists perform a comprehensive medication assessment and reconciliation that includes adjusting medication therapy, placing orders for necessary laboratory tests and prescriptions, and assessing medication adherence. They also evaluate patients’ signs and symptoms for hyperglycemic complications, hypoglycemia, and other potential treatment-related adverse events. These are all within the pharmacist’s scope of practice in comprehensive medication management. Patient education is provided with the teach-back method and includes lifestyle modifications and medication counseling (Table 1). Pharmacists offer face-to-face visits as frequently as every 1 to 2 weeks to every 4 to 6 weeks, depending on the level of complexity and the severity of a patient’s conditions and medications. For patients whose HbA1c has reached the target range but have not been deemed stable, pharmacists continue to check in with them every 2 months. Phone visits are also utilized as an additional care delivery method for patients having difficulty showing up for face-to-face visits or needing quick assessment of medication adherence and responses to changes in drug treatment in between the face-to-face visits. The maximal interval between pharmacist visits is offered no longer than every 8 weeks. Patients are contacted via phone or mail by the nursing staff to reschedule if they miss their appointments with pharmacists. Every pharmacy visit is documented in the patient’s electronic medical record.
Study design
This is a retrospective study describing the HbA1c changes in a patient group that maintained pharmacist visits, with each interval less than 3 months, and in another group, who had a history of a 3-month or longer gap between pharmacist visits. The data were obtained from patients’ electronic medical records during the study period of October 1, 2018, and September 30, 2019, and collected using a HIPAA-compliant, electronic data storage website, REDCap. The institutional review board approval was obtained under HS-19-00929. Patients 18 years and older who were referred by primary care resident physicians for diabetes management, and had 2 or more visits with a pharmacist within the study period, were included. Patients were excluded if they had only 1 HbA1c drawn during the study period, were referred to a pharmacist for reasons other than diabetes management, were concurrently managed by an endocrinologist, had only 1 visit with a pharmacist, or had no visits with their primary care resident physician for over a year. The patients were then divided into 2 groups: continuous care cohort (CCC) and gap in care cohort (GCC). Both face-to-face and phone visits were counted as pharmacist visits for each group.
Outcomes
The primary outcome was the change in HbA1c from baseline between the 2 groups. Baseline HbA1c was considered as the HbA1c value obtained within 3 months prior to, or within 1 month, of the first visit with the pharmacist during the study period. The final HbA1c was considered the value measured within 1 month of, or 3 months after, the patient’s last visit with the pharmacist during the study period.
Several subgroup analyses were conducted to examine the relationship between HbA1c and each group. Among patients whose baseline HbA1c was ≥ 8%, we looked at the percentage of patients reaching HbA1c < 8%, the percentage of patients showing any level of improvement in HbA1c, and the change in HbA1c for each group. We also looked at the percentage of patients with baseline HbA1c < 8% maintaining the level throughout the study period and the change in HbA1c for each group. Additionally, we looked at health care utilization, which included pharmacist visits, primary care physician visits, emergency room and urgent care visits, and hospitalizations for each group. The latter 3 types of utilization were grouped as acute care utilization and further analyzed for visit reasons, which were subsequently categorized as diabetes related and non-diabetes related. The diabetes related reasons linking to acute care utilization were defined as any episodes related to hypoglycemia, diabetic ketoacidosis (DKA), hyperosmolar hyperglycemic state (HHS), foot ulcers, retinopathy, and osteomyelitis infection. All other reasons leading to acute care utilization were categorized as non-diabetes related.
Statistical analysis
Descriptive analyses were conducted using the Mann-Whitney test for continuous data and χ2 (or Fisher exact) test for categorical data. A basic difference-in-differences (D-I-D) method was used to compare the changes of HbA1c between the CCC and GCC over 2 time points: baseline and final measurements. The repeated measures ANOVA was used for analyzing D-I-D. P < .05 was considered significant. Statistical analyses were performed using SAS version 9.4 (SAS Institute, Cary, NC).
Results
Baseline data
A total of 1272 patients were identified within the study period, and 189 met the study inclusion criteria. The CCC included 132 patients, the GCC 57. The mean age of patients in both groups was similar at 57 years old (P = .39). Most patients had Medicaid as their primary insurance. About one-third of patients in each group experienced clinical atherosclerotic cardiovascular disease, and about 12% overall had chronic kidney disease stage 3 and higher. The average number of days that patients were under pharmacist care during the study period was longer in the GCC compared to the CCC, and it was statistically significant (P < .001) (Table 2). The mean ± SD baseline HbA1c for the CCC and GCC was 10.0% ± 2.0% and 9.9% ± 1.7%, respectively, and the difference was not statistically significant (P = .93). About 86% of patients in the CCC and 90% in the GCC had a baseline HbA1c of ≥ 8%.
HbA1c
The mean change in HbA1c between the 2 groups was not statistically significant (-1.5% ± 2.0% in the CCC vs -1.0% ± 2.1% in the GCC, P = .36) (Table 3). However, an absolute mean HbA1c reduction of 1.3% was observed in both groups combined at the end of the study. Figure 1 shows a D-I-D model of the 2 groups. Based on the output, the P value of .11 on the interaction term (time*group) indicates that the D-I-D in HbA1c change from baseline to final between the CCC and GCC is not statistically different. However, the magnitude of the difference calculated from the LSMEANS results showed a trend. The HbA1c from baseline to final measurement of patients in the GCC declined by 0.97 percentage points (from 9.94% to 8.97%), while those in the CCC saw their HbA1c decline by 1.48 percentage points (from 9.96% to 8.48%), for a D-I-D of 0.51. In other words, those in the GCC had an HbA1c that decreased by 0.51% less than that of patients in the CCC, suggesting that the CCC shows a steeper line declining from baseline to final HbA1c compared to the GCC, whose line declines less sharply.
In the subgroup analysis of patients whose baseline HbA1c was ≥ 8%, about 42% in the CCC and 37% in the GCC achieved an HbA1c < 8% (P = .56) (Table 4). Approximately 83% of patients in the CCC had some degree of HbA1c improvement—the final HbA1c was lower than their baseline HbA1c—whereas this was observed in about 75% of patients in the GCC (P = .19). Of patients whose baseline HbA1c was < 8%, there was no significant difference in proportion of patients maintaining an HbA1c < 8% between the groups (P = .57), although some increases in HbA1c and HbA1c changes were observed in the GCC (Table 5).
Health care utilization
Patients in the CCC visited pharmacists 5 times on average over 12 months, whereas patients in the GCC had an average of 6 visits (5 ± 2.6 in the CCC vs 6 ± 2.6 in the GCC, P = .01) (Table 6). The mean length between any 2 adjacent visits was significantly different, averaging about 33 days in the CCC compared to 64 days in the GCC (33.2 ± 10 in the CCC vs 63.7 ± 39.4 in the GCC, P < .001). As shown in Figure 2, the GCC shows wider ranges between any adjacent pharmacy visits throughout until the 10th visit. Both groups had a similar number of visits with primary care physicians during the same time period (4.6 ± 1.86 in the CCC vs 4.3 ± 2.51 in the GCC, P = .44). About 30% of patients in the CCC and 47% in the GCC had at least 1 visit to the emergency room or urgent care or had at least 1 hospital admission, for a total of 124 acute care utilizations between the 2 groups combined. Only a small fraction of acute care visits with or without hospitalizations were related to diabetes and its complications (23.1% in the CCC vs 22.0% in the GCC).
Discussion
This is a real-world study that describes HbA1c changes in patients who maintained pharmacy visits regularly and in those who had a history of a 3-month or longer gap in pharmacy visits. Although the study did not show statistically significant differences in HbA1c reduction between the 2 groups, pharmacists’ care, overall, provided mean HbA1c reductions of 1.3%. This result is consistent with those from multiple previous studies.10-13 It is worth noting that the final HbA1c was numerically lower in patients who followed up with pharmacists regularly than in patients with gaps in visits, with a difference of about 0.5 percentage points. This difference is considered clinically significant,17 and potentially could be even greater if the study duration was longer, as depicted by the slope of HbA1c reductions in the D-I-D model (Figure 1).
Previous studies have shown that pharmacist visits are conducted in shorter intervals than primary care physician visits to provide closer follow-up and to resolve any medication-related problems that may hinder therapeutic outcome improvements.3-4,7-9 Increasing access via pharmacists is particularly important in this clinic, where resident physician continuity and access is challenging. The pharmacist-driven program described in this study does not deviate from the norm, and this study confirms that pharmacist care, regardless of gaps in pharmacist visits, may still be beneficial.
Another notable finding from this study was that although the average number of pharmacist visits per patient was significantly different, this difference of 1 visit did not result in a statistically significant improvement in HbA1c. In fact, the average number of pharmacist visits per patient seemed to be within the reported range by Choe et al in a similar setting.7 Conversely, patients with a history of a gap in pharmacist visits spent longer durations under pharmacist care compared to those who had continuous follow-up. This could mean that it may take longer times or 1 additional visit to achieve similar HbA1c results with continuous pharmacist care. Higher number of visits with pharmacists in the group with the history of gaps between pharmacist visits could have been facilitated by resident physicians, as both groups had a similar number of visits with them. Although this is not conclusive, identifying the optimal number of visits with pharmacists in this underserved population could be beneficial in strategizing pharmacist visits. Acute care utilization was not different between the 2 groups, and most cases that led to acute care utilization were not directly related to diabetes or its complications.
The average HbA1c at the end of the study did not measure < 8%, a target that was reached by less than half of patients from each group; however, this study is a snapshot of a series of ongoing clinical pharmacy services. About 25% of our patients started their first visit with a pharmacist less than 6 months from the study end date, and these patients may not have had enough time with pharmacists for their HbA1c to reach below the target goal. In addition, most patients in this clinic were enrolled in public health plans and may carry a significant burden of social and behavioral factors that can affect diabetes management.18,19 These patients may need longer care by pharmacists along with other integrated services, such as behavioral health and social work, to achieve optimal HbA1c levels.20
There are several limitations to this study, including the lack of a propensity matched control group of patients who only had resident physician visits; thus, it is hard to test the true impact of continuous or intermittent pharmacist visits on the therapeutic outcomes. The study also does not address potential social, economic, and physical environment factors that might have contributed to pharmacist visits and to overall diabetes care. These factors can negatively impact diabetes control and addressing them could help with an individualized diabetes management approach.17,18 Additionally, by nature of being a descriptive study, the results may be subject to undetermined confounding factors.
Conclusion
Patients maintaining continuous pharmacist visits do not have statistically significant differences in change in HbA1c compared to patients who had a history of 3-month or longer gaps in pharmacist visits at a resident physician primary care safety-net clinic. However, patients with diabetes will likely derive a benefit in HbA1c reduction regardless of regularity of pharmacist care. This finding still holds true in collaboration with resident physicians who also regularly meet with patients.
The study highlights that it is important to integrate clinical pharmacists into primary care teams for improved therapeutic outcomes. It is our hope that regular visits to pharmacists can be a gateway for behavioral health and social work referrals, thereby addressing pharmacist-identified social barriers. Furthermore, exploration of socioeconomic and behavioral barriers to pharmacist visits is necessary to address and improve the patient experience, health care delivery, and health outcomes.
Acknowledgments: The authors thank Roxanna Perez, PharmD, Amy Li, and Julie Dopheide, PharmD, BCPP, FASHP for their contributions to this project.
Corresponding author: Michelle Koun Lee Chu, PharmD, BCACP, APh, Titus Family Department of Clinical Pharmacy, School of Pharmacy, University of Southern California, 1985 Zonal Ave, Los Angeles, CA 90089-9121; lee118@usc.edu.
Financial disclosures: None.
1. Manolakis PG, Skelton JB. Pharmacists’ contributions to primary care in the United States collaborating to address unmet patient care needs: the emerging role for pharmacists to address the shortage of primary care providers. Am J Pharm Educ. 2010;74(10):S7.
2. Scott MA, Hitch B, Ray L, Colvin G. Integration of pharmacists into a patient-centered medical home. J Am Pharm Assoc (2003). 2011;51(2):161‐166.
3. Wong SL, Barner JC, Sucic K, et al. Integration of pharmacists into patient-centered medical homes in federally qualified health centers in Texas. J Am Pharm Assoc (2003). 2017;57(3):375‐381.
4. Sapp ECH, Francis SM, Hincapie AL. Implementation of pharmacist-driven comprehensive medication management as part of an interdisciplinary team in primary care physicians’ offices. Am J Accountable Care. 2020;8(1):8-11.
5. Cowart K, Olson K. Impact of pharmacist care provision in value-based care settings: How are we measuring value-added services? J Am Pharm Assoc (2003). 2019;59(1):125-128.
6. Centers for Disease Control and Prevention. Pharmacy: Collaborative Practice Agreements to Enable Drug Therapy Management. January 16, 2018. Accessed April 17, 2021. https://www.cdc.gov/dhdsp/pubs/guides/best-practices/pharmacist-cdtm.htm
7. Choe HM, Farris KB, Stevenson JG, et al. Patient-centered medical home: developing, expanding, and sustaining a role for pharmacists. Am J Health Syst Pharm. 2012;69(12):1063-1071.
8. Coe AB, Choe HM. Pharmacists supporting population health in patient-centered medical homes. Am J Health Syst Pharm. 2017;74(18):1461-1466.
9. Luder HR, Shannon P, Kirby J, Frede SM. Community pharmacist collaboration with a patient-centered medical home: establishment of a patient-centered medical neighborhood and payment model. J Am Pharm Assoc (2003). 2018;58(1):44-50.
10. Matzke GR, Moczygemba LR, Williams KJ, et al. Impact of a pharmacist–physician collaborative care model on patient outcomes and health services utilization. 10.05Am J Health Syst Pharm. 2018;75(14):1039-1047.
11. Aneese NJ, Halalau A, Muench S, et al. Impact of a pharmacist-managed diabetes clinic on quality measures. Am J Manag Care. 2018;24(4 Spec No.):SP116-SP119.
12. Prudencio J, Cutler T, Roberts S, et al. The effect of clinical 10.05pharmacist-led comprehensive medication management on chronic disease state goal attainment in a patient-centered medical home. J Manag Care Spec Pharm. 2018;24(5):423-429.
13. Edwards HD, Webb RD, Scheid DC, et al. A pharmacist visit improves diabetes standards in a patient-centered medical home (PCMH). Am J Med Qual. 2012;27(6) 529-534.
14. Ullah S, Rajan S, Liu T, et al. Why do patients miss their appointments at primary care clinics? J Fam Med Dis Prev. 2018;4:090.
15. Moore CG, Wilson-Witherspoon P, Probst JC. Time and money: effects of no-shows at a family practice residency clinic. Fam Med. 2001;33(7):522-527.
16. Kheirkhah P, Feng Q, Travis LM, et al. Prevalence, predictors and economic consequences of no-shows. BMC Health Serv Res. 2016;16:13.
17. Little RR, Rohlfing C. The long and winding road to optimal HbA10.051c10.05 measurement. Clin Chim Acta. 2013;418:63-71.
18. Hill J, Nielsen M, Fox MH. Understanding the social factors that contribute to diabetes: a means to informing health care and social policies for the chronically ill. Perm J. 2013;17(2):67-72.
19. Gonzalez-Zacarias AA, Mavarez-Martinez A, Arias-Morales CE, et al. Impact of demographic, socioeconomic, and psychological factors on glycemic self-management in adults with type 2 diabetes mellitus. Front Public Health. 2016;4:195.
20. Pantalone KM, Misra-Hebert AD, Hobbs TD, et al. The probability of A1c goal attainment in patients with uncontrolled type 2 diabetes in a large integrated delivery system: a prediction model. Diabetes Care. 2020;43:1910-1919.
Impact of Hospitalist Programs on Perceived Care Quality, Interprofessional Collaboration, and Communication: Lessons from Implementation of 3 Hospital Medicine Programs in Canada
From the Fraser Health Authority, Surrey, BC, Canada (Drs. Yousefi and Paletta), and Catalyst Consulting Inc., Vancouver, BC, Canada (Elayne McIvor).
Objective: Despite the ongoing growth in the number of hospitalist programs in Canada, their impact on the quality of interprofessional communication, teamwork, and staff satisfaction is not well known. This study aimed to evaluate perceptions of frontline care providers and hospital managers about the impact of the implementation of 3 new hospitalist services on care quality, teamwork, and interprofessional communication.
Design: We used an online survey and semistructured interviews to evaluate respondents’ views on quality of interprofessional communication and collaboration, impact of the new services on quality of care, and overall staff satisfaction with the new inpatient care model.
Setting: Integrated Regional Health Authority in British Columbia, Canada.
Participants: Participants included hospital administrators, frontline care providers (across a range of professions), and hospital and community-based physicians.
Results: The majority of respondents reported high levels of satisfaction with their new hospital medicine services. They identified improvements in interprofessional collaboration and communication between hospitalists and other professionals, which were attributed to enhanced onsite presence of physicians. They also perceived improvements in quality of care and efficiency. On the other hand, they identified a number of challenges with the change process, and raised concerns about the impact of patient handoffs on care quality and efficiency.
Conclusion: Across 3 very different acute care settings, the implementation of a hospitalist service was widely perceived to have resulted in improved teamwork, quality of care, and interprofessional communication.
Keywords: hospital medicine; hospitalist; teamwork; interprofessional collaboration.
Over the past 2 decades, the hospitalist model has become prevalent in Canada and internationally.1 Hospitalist care has been associated with improvements in efficiency and quality of care.2-6 However, less is known about its impact on the quality of interprofessional communication, teamwork, and staff satisfaction. In a 2012 study of a specialized orthopedic facility in the Greater Toronto Area (GTA), Ontario, Webster et al found a pervasive perception among interviewees that the addition of a hospitalist resulted in improved patient safety, expedited transfers, enhanced communication with Primary Care Providers (PCPs), and better continuity of care.7 They also identified enhanced collaboration among providers since the addition of the hospitalist to the care team. In another study of 5 community hospitals in the GTA, Conn et al8 found that staff on General Internal Medicine wards where hospitalists worked described superior interprofessional collaboration, deeper interpersonal relationships between physicians and other care team members, and a higher sense of “team-based care.”
Fraser Health Authority (FH) is an integrated regional health system with one of the largest regional Hospital Medicine (HM) networks in Canada.9 Over the past 2 decades, FH has implemented a number of HM services in its acute care facilities across a range of small and large community and academic hospitals. More recently, 3 hospitalist services were implemented over a 2-year period: new HM services in a tertiary referral center (Site A, July 2016) and a small community hospital (Site B, December 2016), and reintroduction of a hospitalist service in a medium-sized community hospital (Site C, January 2017). This provided a unique opportunity to assess the impact of the implementation of the hospitalist model across a range of facilities. The main objectives of this evaluation were to understand the level of physician, nursing, allied staff, and hospital administration satisfaction with the new hospitalist model, as well as the perceived impact of the service on efficiency and quality of care. As such, FH engaged an external consultant (EM) to conduct a comprehensive evaluation of the introduction of its latest HM services.
Methods
Setting
Hospital medicine services are currently available in 10 of 12 acute care facilities within the FH system. The 3 sites described in this evaluation constitute the most recent sites where a hospitalist service was implemented.
Site A is a 272-bed tertiary referral center situated in a rapidly growing community. At the time of our evaluation, 21 Full Time Equivalent (FTE) hospitalists cared for an average of 126 patients, which constituted the majority of adult medical patients. Each day, 8 individuals rounded on admitted patients (average individual census: 16) with another person providing in-house, evening, and overnight coverage. An additional flexible shift during the early afternoon helped with Emergency Department (ED) admissions.
Site B is small, 45-bed community hospital in a semi-rural community. The hospitalist service began in December 2016, with 4 FTE hospitalists caring for an average of 28 patients daily. This constituted 2 hospitalists rounding daily on admitted patients, with on-call coverage provided from home.
Site C is a 188-bed community hospital with a hospitalist service initially introduced in 2005. In 2016, the program was disbanded and the site moved back to a primarily community-based model, in which family physicians in the community were invited to assume the care of hospitalized patients. However, the hospitalist program had to be reintroduced in January 2017 due to poor uptake among PCPs in the community. At the time of evaluation, 19 FTE hospitalists (with 7 hospitalists working daily) provided most responsible physician care to a daily census of 116 patients (average individual census: 16). The program also covered ED admissions in-house until midnight, with overnight call provided from home.
Approach
We adopted a utilization-focused evaluation approach to guide our investigation. In this approach, the assessment is deliberately planned and conducted in a way that it maximizes the likelihood that findings would be used by the organization to inform learning, adaptations, and decision-making.11 To enable this, the evaluator identified the primary intended recipients and engaged them at the start of the evaluation process to understand the main intended uses of the project. Moreover, the evaluator ensured that these intended uses of the evaluation guided all other decisions made throughout the process.
We collected data using an online survey of the staff at the 3 facilities, complemented by a series of semistructured qualitative interviews with FH administrators and frontline providers.
Online survey
We conducted an open online survey of a broad range of stakeholders who worked in the 3 facilities. To develop the questionnaire, we searched our department’s archives for previous surveys conducted from 2001 to 2005. We also interviewed the regional HM program management team to identify priority areas and reached out to the local leadership of the 3 acute care facilities for their input and support of the project. We refined the survey through several iterations, seeking input from experts in the FH Department of Evaluation and Research. The final questionnaire contained 10 items, including a mix of closed- and open-ended questions (Appendix A).
To reach the target audience, we collaborated with each hospital’s local leadership as well as the Divisions of Family Practice (DFP) that support local community PCPs in each hospital community.10 Existing email lists were compiled to create a master electronic survey distribution list. The initial invitation and 3 subsequent reminders were disseminated to the following target groups: hospital physicians (both hospitalists and nonhospitalists), PCPs, nursing and other allied professionals, administrators, and DFP leadership.
The survey consent form, background information, questions, and online platform (SimpleSurvey, Montreal, QC) were approved by FH’s Privacy Department. All respondents were required to provide their consent and able to withdraw at any time. Survey responses were kept anonymous and confidential, with results captured automatically into a spreadsheet by the survey platform. As an incentive for participation, respondents had the opportunity to win 1 of 3 $100 Visa gift cards. Personal contact information provided for the prize draw was collected in a separate survey that could not link back to respondents’ answers. The survey was trialed several times by the evaluation team to address any technical challenges before dissemination to the targeted participants.
Qualitative interviews
We conducted semistructured interviews with a purposive sample of FH administrators and frontline providers (Appendix B). The interview questions broadly mirrored the survey but allowed for more in-depth exploration of constructs. Interviewees were recruited through email invitations to selected senior and mid-level local and regional administrators, asking interviewees to refer our team to other contacts, and inviting survey respondents to voluntarily participate in a follow-up interview. One of the authors (EM), a Credentialed Evaluator, conducted all the one-time interviews either in-person at the individual participant’s workplace or by telephone. She did not have pre-existing relationships with any of the interviewees. Interviews were recorded and transcribed for analysis. Interviewees were required to consent to participate and understood that they could withdraw at any point. They were not offered incentives to participate. Interviews were carried out until thematic saturation was reached.
Analysis
A content analysis approach was employed for all qualitative data, which included open-ended responses from the online survey and interview transcripts. One of the authors (EM) conducted the analysis. The following steps were followed in the inductive content analysis process: repeated reading of the raw data, generation of initial thematic codes, organizing and sorting codes into categories (ie, main vs subcategories), coding of all data, quantifying codes, and interpreting themes. When responding to open-ended questions, respondents often provided multiple answers per question. Each of the respondents’ answers were coded. In alignment with the inductive nature of the analysis process, themes emerged organically from the data rather than the researchers using preconceived theories and categories to code the text. This was achieved by postponing the review of relevant literature on the topic until after the analysis was complete and using an external evaluation consultant (with no prior relationship to FH and limited theoretical knowledge of the topic matter) to analyze the data. Descriptive statistics were run on quantitative data in SPSS (v.24, IBM, Armonk, NY). For survey responses to be included in the analysis, the respondents needed to indicate which site they worked at and were required to answer at least 1 other survey question. One interviewee was excluded from the analysis since they were not familiar with the hospitalist model at their site.
Ethics approval
The evaluation protocol was reviewed by FH Department of Evaluation and Research and was deemed exempt from formal research ethics review.
Results
A total of 377 individuals responded to the online survey between January 8 and February 28, 2018 (response rate 14%). The distribution of respondents generally reflected the size of the respective acute care facilities. Compared to the overall sampled population, fewer nurses participated in the survey (45% vs 64%) while the rate of participation for Unit Clerks (14% vs 16%) and allied professionals (12% vs 16%) were similar.
")
Out of the 45 people approached for an interview, a total of 38 were conducted from January 3 to March 5, 2018 (response rate 84%). The interviews lasted an average of 42 minutes. Interviewees represented a range of administrative and health professional roles (Figure 1). Some interviewees held multiple positions.

Satisfaction with HM service
Across all sites, survey respondents reported high levels of satisfaction with their respective HM services and identified positive impacts on their job satisfaction (Figure 2). Almost all interviewees similarly expressed high satisfaction levels with their HM services (95%; n = 36).
")
Perceptions of HM service performance
Survey respondents rated the strength of hospitalists’ interprofessional communication and collaboration with other physicians and with care teams. Roughly two-thirds reported that overall hospitalist communication was “good” or “very good.” We also asked participants to rate the frequency at which hospitalists met best practice expectations related to interprofessional teamwork. Across all sites, similar proportions of respondents (23% to 39%) reported that these best practices were met “most of the time” or “always” (Figure 3). Survey questions also assessed perceptions of respondents about the quality and safety of care provided by hospitalists (Figure 4).
")
Perceptions of the impact of the HM service postimplementation
The majority of survey respondents reported improvements in the quality of communication, professional relationships, and coordination of inpatient care at transition points after the implementation of the HM service (Figure 5). This was also reflected in interviews, where some indicated that it was easier to communicate with hospitalists due to their on-site presence, accessibility, and 24/7 availability (n = 21). They also described improved collaboration within the care teams (n = 7), and easier communication with hospitalists because they were approachable, willing, and receptive (n = 4).
")
We also asked the survey respondents to assess the impact of the new hospitalist model on different dimensions of care quality, including patient satisfaction, patient experience, efficiency, and overall quality of care (Figure 6). Findings were comparable across these dimensions, with roughly 50-60% of respondents noting positive changes compared to before the implementation of the programs. However, most interviewees identified both positive and negative effects in these areas. Positive impacts included hospitalist on-site presence leading to better accessibility and timeliness of care (n = 5), hospitalists providing continuity to patients/families by working for weeklong rotations (n = 6), hospitalists being particularly skilled at managing complex clinical presentations (n = 2), and hospitalists being able to spend more time with patients (n = 2). On the other hand, some interviewees noted that patients and families did not like seeing multiple doctors due to frequent handoffs between hospitalists (n = 12). They also raised concerns that hospitalists did not know patients’ histories or had relationships with them, potentially leading to longer length of stay and unnecessary investigations (n = 8).
")
Site-to-site ratings of satisfaction and performance
Survey respondents’ satisfaction and performance ratings varied substantially site-to-site. Across all areas assessed, ratings were consistently highest at Site B (the smallest institution in our evaluation and the most recent addition to the HM network in the health authority). These differences were statistically significant across all survey questions asked.
Discussion
Findings from this study provide insight into the experiences of frontline health care professionals and administrators with the implementation of new HM services across a range of small to large acute care facilities. They indicate that the majority of respondents reported high levels of satisfaction with their hospitalist services. Most also indicated that the service had resulted in improvements compared to prior inpatient care models.
Over half of the survey respondents, and the majority of interviewees, reported a positive impact on interprofessional communication and collaboration. This was largely attributed to enhanced accessibility and availability of hospitalists:
- "Being on-site lends itself to better communication because they’re accessible. Hospitalists always answer the phone, but the general practitioners (GP) don’t always since they may be with other patients." (Dietician, Site A)
- "A big strength is that we have physician presence on the unit all day during scheduled hours, which makes us more accessible to nurses and more able to follow up on patients that we have concerns about." (Physician Leader, Site B)
However, the ratings dropped substantially when they were asked to assess adherence to specific best practices of such communication and collaboration, such as participation in daily check-ins or attendance at team care rounds (Figure 3). Interdisciplinary clinical rounds have been identified as a tool to improve the effectiveness of care teams.12 A number of elements have been identified as key components of effective rounds.13 Bedside rounds have also been found to enhance communication and teamwork.14,15 In our study, the discrepancy between overall high levels of satisfaction with hospitalists’ communication/collaboration despite low scores on participation in more concrete activities may illustrate the importance of informal and ad hoc opportunities for interactions between hospitalists and other care providers that result from the enhanced presence of hospitalists on care units.8 Outside of formal rounds, hospitalists have the ability to interact with other care providers throughout their shifts. Prior studies have shown that hospitalists spend a significant portion of their time communicating with other care team members throughout their workdays.16 At the same time, the amount of time spent on communication should be balanced against the need for provision of direct care at the bedside. Future research should aim to identify the right balance between these competing priorities, and to understand the nature and quality of the communication between various care providers.
We also aimed to understand the perceptions of study participants about the impact of the HM service on quality of care. Survey participants not only expressed reasonable satisfaction with various aspects of hospitalists’ performance, but also described a positive impact on care quality after the implementation of their new services. This was also reflected in the interviews:
- "The clinical knowledge of the new hospitalists is far better. Some are internal medicine trained, so they bring better knowledge and skills. I feel comfortable that they can take patients and manage them. I wasn’t always comfortable with doing that in the past." (Emergency Physician, Site C)
- "Hospitalists are really familiar with acute care and how it works. They’ve become more familiar with the discharge planning system and thus know more about the resources available. And even something as simple as knowing which forms to use." (Dietician, Site A)
It must be noted that these observations should ideally be corroborated through a robust before-after analysis of various quality measures. While such an analysis was beyond the scope of our current project, we have previously demonstrated that across our network (including the 3 sites included in our evaluation) hospitalist care is associated with lower mortality and readmission rates.4 Our findings appear to confirm previous suggestions that hospitalists’ dedicated focus on inpatient care may allow them to develop enhanced skills in the management of common conditions in the acute care setting17 which can be perceived to be of value to other hospital-based care providers.
The issue of frequent handover among hospitalists was the most commonly identified challenge by both survey respondents and interviewees:
- "They’re very reluctant to discharge patients if it’s their first day with the patient. Even if the previous hospitalist said they were ready for discharge, the new doc wants to run all of their own tests before they feel comfortable. Maybe it’s a trust issue between hospitalists when they hand patients over. It’s also being personally liable for patients if you discharge them." (Patient Care Coordinator, Site A)
- "Communication is an issue. There’s lots of turnover in hospitalists. Relationships were closer with GPs because we had so much more interaction with particular individuals." (Hospitalist Physician Leader, Site A)
It must be noted that we conducted our evaluation in a relatively short time span (within 2 years) after the 3 services were implemented. Developing trust among a large number of hospitalists newly recruited to these programs can take time and may be a factor that can explain the reluctance of some to discharge patients after handoffs. However, concerns about discontinuity of care inherent in the hospitalist model are not new.18,19 Better continuity has been associated with higher probability of patient discharges20 and improved outcomes.21 To address this challenge, the hospitalist community has focused on defining the core competencies associated with high quality handovers,22 and deliberate efforts to improve the quality of handoffs through quality improvement methodologies.23 Our study participants similarly identified these measures as potential solutions. Despite this, addressing hospitalist continuity of care remains a pressing challenge for the broader hospitalist community.24
Our evaluation has a number of methodological limitations. First, the survey response rate was only 14%, which raises questions about nonresponse bias and the representativeness of the findings to the larger population of interest. While the distribution of respondents was largely similar to the overall sampled population, a number of factors may have impacted our response rate. For example, we were only able to distribute our survey to health care providers’ institutional email addresses. Moreover, while we provided incentives for participation and sent out a number of reminders, we solely relied on one communication modality (ie, electronic communication) and did not utilize other methods (such as posters, reminder at meetings, in-person invitations). Second, while the survey included a number of open-ended questions, many of these responses were at times brief and difficult to interpret and were not included in the analysis. Third, all data collected were self-reported. For example, we could not corroborate comments about participation in interdisciplinary rounds by objective measures such as attendance records or direct observation. Self-report data is subjective in nature and is vulnerable to a range of biases, such as social desirability bias.25 Finally, patient satisfaction and experience with hospitalist care were not assessed by patients themselves. Ideally, standardized cross-site indicators should validate our patient-related results.
As mentioned above, hospitalist performance ratings varied substantially from site-to-site and were consistently higher at Site B (a small community hospital in a semi-rural area), followed by Site C (a medium-sized community hospital) and Site A (a tertiary referral center). The variability in program ratings and perceived hospitalist impacts between sites could be due to a variety of factors, such as the degree of change between the past and current models at each site, differences in hospitalist hiring processes, hospital size and culture, and differences in service design and operations. It may also be related to the timing of the introduction of the HM service, as Site B was the most recent site where the service was established. As such, there may be an element of recall bias behind the observed discrepancies. This highlights the importance of local context on respondent perceptions and suggests that our results may not be generalizable to other institutions with different attributes and characteristics.
Conclusion
Findings from this study have demonstrated that the recent hospitalist services in our health system have improved overall levels of interprofessional communication and teamwork, as well as perceptions of care quality among the majority of participants who reported high levels of satisfaction with their programs. Our findings further highlight the issue of frequent handovers among hospitalists as a pressing and ongoing challenge.
Corresponding Author: Vandad Yousefi, MD, CCFP, Past Regional Department Head – Hospital Medicine, Fraser Health Authority, Central City Tower, Suite 400, 13450 – 102nd Ave, Surrey, BC V3T 0H1; vandad.yousefi@fraserhealth.ca.
Financial disclosures: This project was funded by the Fraser Health Authority, which provided the funding for hiring of the external consultant to design, implement, and analyze the results of the evaluation program in collaboration with the Regional Hospitalist Program at Fraser Health.
1. Yousefi V, Wilton D. Re-designing Hospital Care: Learning from the Experience of Hospital Medicine in Canada. Journal of Global Health Care Systems. 2011;1(3).
2. White HL. Assessing the Prevalence, Penetration and Performance of Hospital Physicians in Ontario: Implications for the Quality and Efficiency of Inpatient Care. Doctoral Thesis; 2016.
3. Yousefi V, Chong CA. Does implementation of a hospitalist program in a Canadian community hospital improve measures of quality of care and utilization? An observational comparative analysis of hospitalists vs. traditional care providers. BMC Health Serv Res. 2013;13:204.
4. Yousefi V, Hejazi S, Lam A. Impact of Hospitalists on Care Outcomes in a Large Integrated Health System in British Columbia. Journal of Clinical Outcomes Management. 2020;27(2):59-72.
5. Salim SA, Elmaraezy A, Pamarthy A, et al. Impact of hospitalists on the efficiency of inpatient care and patient satisfaction: a systematic review and meta-analysis. J Community Hosp Intern Med Perspect. 2019;9(2):121-134.
6. Peterson MC. A systematic review of outcomes and quality measures in adult patients cared for by hospitalists vs nonhospitalists. Mayo Clinic Proc. 2009;84(3):248-254.
7. Webster F, Bremner S, Jackson M, et al. The impact of a hospitalist on role boundaries in an orthopedic environment. J Multidiscip Healthc. 2012;5:249-256.
8. Gotlib Conn L, Reeves S, Dainty K, et al. Interprofessional communication with hospitalist and consultant physicians in general internal medicine: a qualitative study. BMC Health Serv Res. 2012; 12:437.
9. About Fraser Health. Fraser Health Authority. Updated 2018. Accessed January 30, 2019. https://www.fraserhealth.ca/about-us/about-fraser-health#.XFJrl9JKiUk
10. Divisions of Family Practice. Accessed May 2, 2020. https://www.divisionsbc.ca/provincial/about-us
11. Patton MQ. Essentials of Utilization-Focused Evaluation. 2012. Sage Publications, Inc; 2011.
12. Buljac-Samardzic M, Doekhie KD, van Wijngaarden JDH. Interventions to improve team effectiveness within health care: a systematic review of the past decade. Hum Resour Health. 2020;18(1):2.
13. Verhaegh KJ, Seller-Boersma A, Simons R, et al. An exploratory study of healthcare professionals’ perceptions of interprofessional communication and collaboration. J Interprof Care. 2017;31(3):397-400.
14. O’Leary KJ, Johnson JK, Manojlovich M, et al. Redesigning systems to improve teamwork and quality for hospitalized patients (RESET): study protocol evaluating the effect of mentored implementation to redesign clinical microsystems. BMC Health Serv Res. 2019;19(1):293.
15. Stein J, Payne C, Methvin A, et al. Reorganizing a hospital ward as an accountable care unit. J Hosp Med. 2015;10(1):36-40.
16. Yousefi V. How Canadian hospitalists spend their time - A work-sampling study within a hospital medicine program in Ontario. Journal of Clinical Outcomes Management. 2011;18(4):159.
17. Marinella MA: Hospitalists-Where They Came from, Who They Are, and What They Do. Hosp Physician. 2002;38(5):32-36.
18. Wachter RM. An introduction to the hospitalist model. Ann Intern Med. 1999;130(4 Pt 2):338-342.
19. Wachter RM, Goldman L. The hospitalist movement 5 years later. JAMA. 2002;287(4):487-494.
20. van Walraven C. The Influence of Inpatient Physician Continuity on Hospital Discharge. J Gen Intern Med. 2019;34(9):1709-1714.
21. Goodwin JS, Li S, Kuo YF. Association of the Work Schedules of Hospitalists With Patient Outcomes of Hospitalization. JAMA Intern Med. 2020;180(2):215-222.
22. Nichani S, Fitterman N, Lukela M, Crocker J, the Society of Hospital Medicine, Patient Handoff. 2017 Hospital Medicine Revised Core Competencies. J Hosp Med. 2017;4:S74.
23. Lo HY, Mullan PC, Lye C, et al. A QI initiative: implementing a patient handoff checklist for pediatric hospitalist attendings. BMJ Qual Improv Rep. 2016;5(1):u212920.w5661.
24. Wachter RM, Goldman L. Zero to 50,000 - The 20th Anniversary of the Hospitalist. N Engl J Med. 2016;375(11):1009-1011.
25. Grimm, P. Social Desirability Bias. In: Sheth J, Malhotra N, eds. Wiley International Encyclopedia of Marketing. John Wiley & Sons, Ltd; 2010.
From the Fraser Health Authority, Surrey, BC, Canada (Drs. Yousefi and Paletta), and Catalyst Consulting Inc., Vancouver, BC, Canada (Elayne McIvor).
Objective: Despite the ongoing growth in the number of hospitalist programs in Canada, their impact on the quality of interprofessional communication, teamwork, and staff satisfaction is not well known. This study aimed to evaluate perceptions of frontline care providers and hospital managers about the impact of the implementation of 3 new hospitalist services on care quality, teamwork, and interprofessional communication.
Design: We used an online survey and semistructured interviews to evaluate respondents’ views on quality of interprofessional communication and collaboration, impact of the new services on quality of care, and overall staff satisfaction with the new inpatient care model.
Setting: Integrated Regional Health Authority in British Columbia, Canada.
Participants: Participants included hospital administrators, frontline care providers (across a range of professions), and hospital and community-based physicians.
Results: The majority of respondents reported high levels of satisfaction with their new hospital medicine services. They identified improvements in interprofessional collaboration and communication between hospitalists and other professionals, which were attributed to enhanced onsite presence of physicians. They also perceived improvements in quality of care and efficiency. On the other hand, they identified a number of challenges with the change process, and raised concerns about the impact of patient handoffs on care quality and efficiency.
Conclusion: Across 3 very different acute care settings, the implementation of a hospitalist service was widely perceived to have resulted in improved teamwork, quality of care, and interprofessional communication.
Keywords: hospital medicine; hospitalist; teamwork; interprofessional collaboration.
Over the past 2 decades, the hospitalist model has become prevalent in Canada and internationally.1 Hospitalist care has been associated with improvements in efficiency and quality of care.2-6 However, less is known about its impact on the quality of interprofessional communication, teamwork, and staff satisfaction. In a 2012 study of a specialized orthopedic facility in the Greater Toronto Area (GTA), Ontario, Webster et al found a pervasive perception among interviewees that the addition of a hospitalist resulted in improved patient safety, expedited transfers, enhanced communication with Primary Care Providers (PCPs), and better continuity of care.7 They also identified enhanced collaboration among providers since the addition of the hospitalist to the care team. In another study of 5 community hospitals in the GTA, Conn et al8 found that staff on General Internal Medicine wards where hospitalists worked described superior interprofessional collaboration, deeper interpersonal relationships between physicians and other care team members, and a higher sense of “team-based care.”
Fraser Health Authority (FH) is an integrated regional health system with one of the largest regional Hospital Medicine (HM) networks in Canada.9 Over the past 2 decades, FH has implemented a number of HM services in its acute care facilities across a range of small and large community and academic hospitals. More recently, 3 hospitalist services were implemented over a 2-year period: new HM services in a tertiary referral center (Site A, July 2016) and a small community hospital (Site B, December 2016), and reintroduction of a hospitalist service in a medium-sized community hospital (Site C, January 2017). This provided a unique opportunity to assess the impact of the implementation of the hospitalist model across a range of facilities. The main objectives of this evaluation were to understand the level of physician, nursing, allied staff, and hospital administration satisfaction with the new hospitalist model, as well as the perceived impact of the service on efficiency and quality of care. As such, FH engaged an external consultant (EM) to conduct a comprehensive evaluation of the introduction of its latest HM services.
Methods
Setting
Hospital medicine services are currently available in 10 of 12 acute care facilities within the FH system. The 3 sites described in this evaluation constitute the most recent sites where a hospitalist service was implemented.
Site A is a 272-bed tertiary referral center situated in a rapidly growing community. At the time of our evaluation, 21 Full Time Equivalent (FTE) hospitalists cared for an average of 126 patients, which constituted the majority of adult medical patients. Each day, 8 individuals rounded on admitted patients (average individual census: 16) with another person providing in-house, evening, and overnight coverage. An additional flexible shift during the early afternoon helped with Emergency Department (ED) admissions.
Site B is small, 45-bed community hospital in a semi-rural community. The hospitalist service began in December 2016, with 4 FTE hospitalists caring for an average of 28 patients daily. This constituted 2 hospitalists rounding daily on admitted patients, with on-call coverage provided from home.
Site C is a 188-bed community hospital with a hospitalist service initially introduced in 2005. In 2016, the program was disbanded and the site moved back to a primarily community-based model, in which family physicians in the community were invited to assume the care of hospitalized patients. However, the hospitalist program had to be reintroduced in January 2017 due to poor uptake among PCPs in the community. At the time of evaluation, 19 FTE hospitalists (with 7 hospitalists working daily) provided most responsible physician care to a daily census of 116 patients (average individual census: 16). The program also covered ED admissions in-house until midnight, with overnight call provided from home.
Approach
We adopted a utilization-focused evaluation approach to guide our investigation. In this approach, the assessment is deliberately planned and conducted in a way that it maximizes the likelihood that findings would be used by the organization to inform learning, adaptations, and decision-making.11 To enable this, the evaluator identified the primary intended recipients and engaged them at the start of the evaluation process to understand the main intended uses of the project. Moreover, the evaluator ensured that these intended uses of the evaluation guided all other decisions made throughout the process.
We collected data using an online survey of the staff at the 3 facilities, complemented by a series of semistructured qualitative interviews with FH administrators and frontline providers.
Online survey
We conducted an open online survey of a broad range of stakeholders who worked in the 3 facilities. To develop the questionnaire, we searched our department’s archives for previous surveys conducted from 2001 to 2005. We also interviewed the regional HM program management team to identify priority areas and reached out to the local leadership of the 3 acute care facilities for their input and support of the project. We refined the survey through several iterations, seeking input from experts in the FH Department of Evaluation and Research. The final questionnaire contained 10 items, including a mix of closed- and open-ended questions (Appendix A).
To reach the target audience, we collaborated with each hospital’s local leadership as well as the Divisions of Family Practice (DFP) that support local community PCPs in each hospital community.10 Existing email lists were compiled to create a master electronic survey distribution list. The initial invitation and 3 subsequent reminders were disseminated to the following target groups: hospital physicians (both hospitalists and nonhospitalists), PCPs, nursing and other allied professionals, administrators, and DFP leadership.
The survey consent form, background information, questions, and online platform (SimpleSurvey, Montreal, QC) were approved by FH’s Privacy Department. All respondents were required to provide their consent and able to withdraw at any time. Survey responses were kept anonymous and confidential, with results captured automatically into a spreadsheet by the survey platform. As an incentive for participation, respondents had the opportunity to win 1 of 3 $100 Visa gift cards. Personal contact information provided for the prize draw was collected in a separate survey that could not link back to respondents’ answers. The survey was trialed several times by the evaluation team to address any technical challenges before dissemination to the targeted participants.
Qualitative interviews
We conducted semistructured interviews with a purposive sample of FH administrators and frontline providers (Appendix B). The interview questions broadly mirrored the survey but allowed for more in-depth exploration of constructs. Interviewees were recruited through email invitations to selected senior and mid-level local and regional administrators, asking interviewees to refer our team to other contacts, and inviting survey respondents to voluntarily participate in a follow-up interview. One of the authors (EM), a Credentialed Evaluator, conducted all the one-time interviews either in-person at the individual participant’s workplace or by telephone. She did not have pre-existing relationships with any of the interviewees. Interviews were recorded and transcribed for analysis. Interviewees were required to consent to participate and understood that they could withdraw at any point. They were not offered incentives to participate. Interviews were carried out until thematic saturation was reached.
Analysis
A content analysis approach was employed for all qualitative data, which included open-ended responses from the online survey and interview transcripts. One of the authors (EM) conducted the analysis. The following steps were followed in the inductive content analysis process: repeated reading of the raw data, generation of initial thematic codes, organizing and sorting codes into categories (ie, main vs subcategories), coding of all data, quantifying codes, and interpreting themes. When responding to open-ended questions, respondents often provided multiple answers per question. Each of the respondents’ answers were coded. In alignment with the inductive nature of the analysis process, themes emerged organically from the data rather than the researchers using preconceived theories and categories to code the text. This was achieved by postponing the review of relevant literature on the topic until after the analysis was complete and using an external evaluation consultant (with no prior relationship to FH and limited theoretical knowledge of the topic matter) to analyze the data. Descriptive statistics were run on quantitative data in SPSS (v.24, IBM, Armonk, NY). For survey responses to be included in the analysis, the respondents needed to indicate which site they worked at and were required to answer at least 1 other survey question. One interviewee was excluded from the analysis since they were not familiar with the hospitalist model at their site.
Ethics approval
The evaluation protocol was reviewed by FH Department of Evaluation and Research and was deemed exempt from formal research ethics review.
Results
A total of 377 individuals responded to the online survey between January 8 and February 28, 2018 (response rate 14%). The distribution of respondents generally reflected the size of the respective acute care facilities. Compared to the overall sampled population, fewer nurses participated in the survey (45% vs 64%) while the rate of participation for Unit Clerks (14% vs 16%) and allied professionals (12% vs 16%) were similar.
Out of the 45 people approached for an interview, a total of 38 were conducted from January 3 to March 5, 2018 (response rate 84%). The interviews lasted an average of 42 minutes. Interviewees represented a range of administrative and health professional roles (Figure 1). Some interviewees held multiple positions.
Satisfaction with HM service
Across all sites, survey respondents reported high levels of satisfaction with their respective HM services and identified positive impacts on their job satisfaction (Figure 2). Almost all interviewees similarly expressed high satisfaction levels with their HM services (95%; n = 36).
Perceptions of HM service performance
Survey respondents rated the strength of hospitalists’ interprofessional communication and collaboration with other physicians and with care teams. Roughly two-thirds reported that overall hospitalist communication was “good” or “very good.” We also asked participants to rate the frequency at which hospitalists met best practice expectations related to interprofessional teamwork. Across all sites, similar proportions of respondents (23% to 39%) reported that these best practices were met “most of the time” or “always” (Figure 3). Survey questions also assessed perceptions of respondents about the quality and safety of care provided by hospitalists (Figure 4).
Perceptions of the impact of the HM service postimplementation
The majority of survey respondents reported improvements in the quality of communication, professional relationships, and coordination of inpatient care at transition points after the implementation of the HM service (Figure 5). This was also reflected in interviews, where some indicated that it was easier to communicate with hospitalists due to their on-site presence, accessibility, and 24/7 availability (n = 21). They also described improved collaboration within the care teams (n = 7), and easier communication with hospitalists because they were approachable, willing, and receptive (n = 4).
We also asked the survey respondents to assess the impact of the new hospitalist model on different dimensions of care quality, including patient satisfaction, patient experience, efficiency, and overall quality of care (Figure 6). Findings were comparable across these dimensions, with roughly 50-60% of respondents noting positive changes compared to before the implementation of the programs. However, most interviewees identified both positive and negative effects in these areas. Positive impacts included hospitalist on-site presence leading to better accessibility and timeliness of care (n = 5), hospitalists providing continuity to patients/families by working for weeklong rotations (n = 6), hospitalists being particularly skilled at managing complex clinical presentations (n = 2), and hospitalists being able to spend more time with patients (n = 2). On the other hand, some interviewees noted that patients and families did not like seeing multiple doctors due to frequent handoffs between hospitalists (n = 12). They also raised concerns that hospitalists did not know patients’ histories or had relationships with them, potentially leading to longer length of stay and unnecessary investigations (n = 8).
Site-to-site ratings of satisfaction and performance
Survey respondents’ satisfaction and performance ratings varied substantially site-to-site. Across all areas assessed, ratings were consistently highest at Site B (the smallest institution in our evaluation and the most recent addition to the HM network in the health authority). These differences were statistically significant across all survey questions asked.
Discussion
Findings from this study provide insight into the experiences of frontline health care professionals and administrators with the implementation of new HM services across a range of small to large acute care facilities. They indicate that the majority of respondents reported high levels of satisfaction with their hospitalist services. Most also indicated that the service had resulted in improvements compared to prior inpatient care models.
Over half of the survey respondents, and the majority of interviewees, reported a positive impact on interprofessional communication and collaboration. This was largely attributed to enhanced accessibility and availability of hospitalists:
- "Being on-site lends itself to better communication because they’re accessible. Hospitalists always answer the phone, but the general practitioners (GP) don’t always since they may be with other patients." (Dietician, Site A)
- "A big strength is that we have physician presence on the unit all day during scheduled hours, which makes us more accessible to nurses and more able to follow up on patients that we have concerns about." (Physician Leader, Site B)
However, the ratings dropped substantially when they were asked to assess adherence to specific best practices of such communication and collaboration, such as participation in daily check-ins or attendance at team care rounds (Figure 3). Interdisciplinary clinical rounds have been identified as a tool to improve the effectiveness of care teams.12 A number of elements have been identified as key components of effective rounds.13 Bedside rounds have also been found to enhance communication and teamwork.14,15 In our study, the discrepancy between overall high levels of satisfaction with hospitalists’ communication/collaboration despite low scores on participation in more concrete activities may illustrate the importance of informal and ad hoc opportunities for interactions between hospitalists and other care providers that result from the enhanced presence of hospitalists on care units.8 Outside of formal rounds, hospitalists have the ability to interact with other care providers throughout their shifts. Prior studies have shown that hospitalists spend a significant portion of their time communicating with other care team members throughout their workdays.16 At the same time, the amount of time spent on communication should be balanced against the need for provision of direct care at the bedside. Future research should aim to identify the right balance between these competing priorities, and to understand the nature and quality of the communication between various care providers.
We also aimed to understand the perceptions of study participants about the impact of the HM service on quality of care. Survey participants not only expressed reasonable satisfaction with various aspects of hospitalists’ performance, but also described a positive impact on care quality after the implementation of their new services. This was also reflected in the interviews:
- "The clinical knowledge of the new hospitalists is far better. Some are internal medicine trained, so they bring better knowledge and skills. I feel comfortable that they can take patients and manage them. I wasn’t always comfortable with doing that in the past." (Emergency Physician, Site C)
- "Hospitalists are really familiar with acute care and how it works. They’ve become more familiar with the discharge planning system and thus know more about the resources available. And even something as simple as knowing which forms to use." (Dietician, Site A)
It must be noted that these observations should ideally be corroborated through a robust before-after analysis of various quality measures. While such an analysis was beyond the scope of our current project, we have previously demonstrated that across our network (including the 3 sites included in our evaluation) hospitalist care is associated with lower mortality and readmission rates.4 Our findings appear to confirm previous suggestions that hospitalists’ dedicated focus on inpatient care may allow them to develop enhanced skills in the management of common conditions in the acute care setting17 which can be perceived to be of value to other hospital-based care providers.
The issue of frequent handover among hospitalists was the most commonly identified challenge by both survey respondents and interviewees:
- "They’re very reluctant to discharge patients if it’s their first day with the patient. Even if the previous hospitalist said they were ready for discharge, the new doc wants to run all of their own tests before they feel comfortable. Maybe it’s a trust issue between hospitalists when they hand patients over. It’s also being personally liable for patients if you discharge them." (Patient Care Coordinator, Site A)
- "Communication is an issue. There’s lots of turnover in hospitalists. Relationships were closer with GPs because we had so much more interaction with particular individuals." (Hospitalist Physician Leader, Site A)
It must be noted that we conducted our evaluation in a relatively short time span (within 2 years) after the 3 services were implemented. Developing trust among a large number of hospitalists newly recruited to these programs can take time and may be a factor that can explain the reluctance of some to discharge patients after handoffs. However, concerns about discontinuity of care inherent in the hospitalist model are not new.18,19 Better continuity has been associated with higher probability of patient discharges20 and improved outcomes.21 To address this challenge, the hospitalist community has focused on defining the core competencies associated with high quality handovers,22 and deliberate efforts to improve the quality of handoffs through quality improvement methodologies.23 Our study participants similarly identified these measures as potential solutions. Despite this, addressing hospitalist continuity of care remains a pressing challenge for the broader hospitalist community.24
Our evaluation has a number of methodological limitations. First, the survey response rate was only 14%, which raises questions about nonresponse bias and the representativeness of the findings to the larger population of interest. While the distribution of respondents was largely similar to the overall sampled population, a number of factors may have impacted our response rate. For example, we were only able to distribute our survey to health care providers’ institutional email addresses. Moreover, while we provided incentives for participation and sent out a number of reminders, we solely relied on one communication modality (ie, electronic communication) and did not utilize other methods (such as posters, reminder at meetings, in-person invitations). Second, while the survey included a number of open-ended questions, many of these responses were at times brief and difficult to interpret and were not included in the analysis. Third, all data collected were self-reported. For example, we could not corroborate comments about participation in interdisciplinary rounds by objective measures such as attendance records or direct observation. Self-report data is subjective in nature and is vulnerable to a range of biases, such as social desirability bias.25 Finally, patient satisfaction and experience with hospitalist care were not assessed by patients themselves. Ideally, standardized cross-site indicators should validate our patient-related results.
As mentioned above, hospitalist performance ratings varied substantially from site-to-site and were consistently higher at Site B (a small community hospital in a semi-rural area), followed by Site C (a medium-sized community hospital) and Site A (a tertiary referral center). The variability in program ratings and perceived hospitalist impacts between sites could be due to a variety of factors, such as the degree of change between the past and current models at each site, differences in hospitalist hiring processes, hospital size and culture, and differences in service design and operations. It may also be related to the timing of the introduction of the HM service, as Site B was the most recent site where the service was established. As such, there may be an element of recall bias behind the observed discrepancies. This highlights the importance of local context on respondent perceptions and suggests that our results may not be generalizable to other institutions with different attributes and characteristics.
Conclusion
Findings from this study have demonstrated that the recent hospitalist services in our health system have improved overall levels of interprofessional communication and teamwork, as well as perceptions of care quality among the majority of participants who reported high levels of satisfaction with their programs. Our findings further highlight the issue of frequent handovers among hospitalists as a pressing and ongoing challenge.
Corresponding Author: Vandad Yousefi, MD, CCFP, Past Regional Department Head – Hospital Medicine, Fraser Health Authority, Central City Tower, Suite 400, 13450 – 102nd Ave, Surrey, BC V3T 0H1; vandad.yousefi@fraserhealth.ca.
Financial disclosures: This project was funded by the Fraser Health Authority, which provided the funding for hiring of the external consultant to design, implement, and analyze the results of the evaluation program in collaboration with the Regional Hospitalist Program at Fraser Health.
1. Yousefi V, Wilton D. Re-designing Hospital Care: Learning from the Experience of Hospital Medicine in Canada. Journal of Global Health Care Systems. 2011;1(3).
2. White HL. Assessing the Prevalence, Penetration and Performance of Hospital Physicians in Ontario: Implications for the Quality and Efficiency of Inpatient Care. Doctoral Thesis; 2016.
3. Yousefi V, Chong CA. Does implementation of a hospitalist program in a Canadian community hospital improve measures of quality of care and utilization? An observational comparative analysis of hospitalists vs. traditional care providers. BMC Health Serv Res. 2013;13:204.
4. Yousefi V, Hejazi S, Lam A. Impact of Hospitalists on Care Outcomes in a Large Integrated Health System in British Columbia. Journal of Clinical Outcomes Management. 2020;27(2):59-72.
5. Salim SA, Elmaraezy A, Pamarthy A, et al. Impact of hospitalists on the efficiency of inpatient care and patient satisfaction: a systematic review and meta-analysis. J Community Hosp Intern Med Perspect. 2019;9(2):121-134.
6. Peterson MC. A systematic review of outcomes and quality measures in adult patients cared for by hospitalists vs nonhospitalists. Mayo Clinic Proc. 2009;84(3):248-254.
7. Webster F, Bremner S, Jackson M, et al. The impact of a hospitalist on role boundaries in an orthopedic environment. J Multidiscip Healthc. 2012;5:249-256.
8. Gotlib Conn L, Reeves S, Dainty K, et al. Interprofessional communication with hospitalist and consultant physicians in general internal medicine: a qualitative study. BMC Health Serv Res. 2012; 12:437.
9. About Fraser Health. Fraser Health Authority. Updated 2018. Accessed January 30, 2019. https://www.fraserhealth.ca/about-us/about-fraser-health#.XFJrl9JKiUk
10. Divisions of Family Practice. Accessed May 2, 2020. https://www.divisionsbc.ca/provincial/about-us
11. Patton MQ. Essentials of Utilization-Focused Evaluation. 2012. Sage Publications, Inc; 2011.
12. Buljac-Samardzic M, Doekhie KD, van Wijngaarden JDH. Interventions to improve team effectiveness within health care: a systematic review of the past decade. Hum Resour Health. 2020;18(1):2.
13. Verhaegh KJ, Seller-Boersma A, Simons R, et al. An exploratory study of healthcare professionals’ perceptions of interprofessional communication and collaboration. J Interprof Care. 2017;31(3):397-400.
14. O’Leary KJ, Johnson JK, Manojlovich M, et al. Redesigning systems to improve teamwork and quality for hospitalized patients (RESET): study protocol evaluating the effect of mentored implementation to redesign clinical microsystems. BMC Health Serv Res. 2019;19(1):293.
15. Stein J, Payne C, Methvin A, et al. Reorganizing a hospital ward as an accountable care unit. J Hosp Med. 2015;10(1):36-40.
16. Yousefi V. How Canadian hospitalists spend their time - A work-sampling study within a hospital medicine program in Ontario. Journal of Clinical Outcomes Management. 2011;18(4):159.
17. Marinella MA: Hospitalists-Where They Came from, Who They Are, and What They Do. Hosp Physician. 2002;38(5):32-36.
18. Wachter RM. An introduction to the hospitalist model. Ann Intern Med. 1999;130(4 Pt 2):338-342.
19. Wachter RM, Goldman L. The hospitalist movement 5 years later. JAMA. 2002;287(4):487-494.
20. van Walraven C. The Influence of Inpatient Physician Continuity on Hospital Discharge. J Gen Intern Med. 2019;34(9):1709-1714.
21. Goodwin JS, Li S, Kuo YF. Association of the Work Schedules of Hospitalists With Patient Outcomes of Hospitalization. JAMA Intern Med. 2020;180(2):215-222.
22. Nichani S, Fitterman N, Lukela M, Crocker J, the Society of Hospital Medicine, Patient Handoff. 2017 Hospital Medicine Revised Core Competencies. J Hosp Med. 2017;4:S74.
23. Lo HY, Mullan PC, Lye C, et al. A QI initiative: implementing a patient handoff checklist for pediatric hospitalist attendings. BMJ Qual Improv Rep. 2016;5(1):u212920.w5661.
24. Wachter RM, Goldman L. Zero to 50,000 - The 20th Anniversary of the Hospitalist. N Engl J Med. 2016;375(11):1009-1011.
25. Grimm, P. Social Desirability Bias. In: Sheth J, Malhotra N, eds. Wiley International Encyclopedia of Marketing. John Wiley & Sons, Ltd; 2010.
Implementation of a Symptom–Triggered Protocol for Severe Alcohol Withdrawal Treatment in a Medical Step-down Unit
From Stamford Hospital, Stamford, CT.
Objective: This single-center, quasi-experimental study of adult patients admitted or transferred to a medical step-down unit with alcohol withdrawal diagnoses sought to determine if symptom–triggered therapy (STT) is more effective than combined fixed-scheduled (FS) and STT in severe alcohol withdrawal.
Methods: In the preintervention group (72 episodes), patients were treated with FS and STT based on physician preference. In the postintervention group (69 episodes), providers were required to utilize only the STT protocol.
Results: Implementation of the intervention was associated with a significant reduction in average (per patient) cumulative benzodiazepine dose, from 250 mg to 96 mg (P < .001) and a decrease in average length of stay from 8.0 days to 5.1 days (P < .001). Secondary safety measures included a reduction in the proportion of patients who experienced delirium tremens from 47.5% to 22.5% (P < .001), and a reduction in intubation rates from 13.8% to 1.3% (P = .003).
Conclusion: The STT protocol proved to be more effective and safer in treating severe alcohol withdrawal patients than usual care employing STT with FS. We believe the successful implementation of a STT protocol in high-acuity patients requires frequent monitoring to assess withdrawal severity combined with appropriate and timely dosing of benzodiazepines.
Keywords: alcohol withdrawal delirium; alcohol withdrawal syndrome; treatment protocol; benzodiazepine; lorazepam.
Management of severe alcohol withdrawal and delirium tremens (DT) is challenging and requires significant resources, including close monitoring and intensive treatment, frequently in an intensive care unit (ICU).1 Early diagnosis and therapeutic intervention are important to limit potential complications associated with DT.2 Benzodiazepines are first-line therapeutic agents, but the definition of optimal use and dosing regimens has been limited, due to a lack of randomized controlled trials. In lower acuity patients admitted to a detoxification unit, systematic symptom–triggered benzodiazepine therapy (STT) has been established to be more effective than fixed-schedule (FS) dosing.3-5 Patients treated using STT require lower total benzodiazepine dosing and achieve shorter treatment durations. However, in higher-acuity patients admitted to general medical services, analyses have not shown an advantage of STT over combined FS and STT.6
Methods
The purpose of this study was to determine whether implementation of STT is more effective than FS dosing combined with episodic STT in the management of hospitalized high-acuity alcohol withdrawal patients. We conducted a preintervention and postintervention quasi-experimental study in the step-down unit (SDU) of a 305-bed community teaching hospital. The study population consisted of adult inpatients 18 years or older admitted or transferred to the 12-bed SDU with alcohol withdrawal, as defined by primary or secondary International Classification of Diseases, Tenth Revision diagnoses. SDU admission criteria included patients with prior DT or those who had received multiple doses of benzodiazepines in the emergency department. In-hospital transfer to the SDU was at the physician’s discretion, if the patient required escalating doses of benzodiazepines or the use of increasing resources, such as those for behavioral emergencies. The majority of patients admitted or transferred to the SDU were assigned to medical house staff teams under hospitalist supervision, and, on occasion, under community physicians. The nurse-to-patient ratio in the SDU was 1:3.
Study groups
The preintervention group consisted of 80 successive treatment episodes involving patients admitted or transferred to the SDU from
In the preintervention group, fixed, scheduled doses of lorazepam or chlordiazepoxide and as-needed lorazepam were prescribed and adjusted based upon physician judgment. Monitoring of symptom severity was scored using the revised Clinical Institute Withdrawal Assessment for Alcohol scale (CIWA-Ar). Benzodiazepine dosing occurred if the CIWA-Ar score had increased 2 or more points from the last score.
In the postintervention group, the STT protocol included the creation of a standardized physician order set for benzodiazepine “sliding scale” administration. The STT protocol allowed for escalating doses for higher withdrawal scores. Symptom severity was scored using MINDS (Minnesota Detoxification Scale) criteria.1 Lorazepam as-needed dosing was based upon MINDS scores. A MINDS score less than 10 resulted in no medication, MINDS 10-12 required 2 mg, MINDS 13-16 required 4 mg, MINDS 17-19 required 6 mg, and MINDS 20 required 8 mg and a call to the physician. Transfer to the ICU was recommended if the MINDS score was ≥ 20 for 3 consecutive hours. Monitoring intervals occurred more frequently at 30 minutes unless the MINDS score was less than 10. After 7 days, the MINDS protocol was recommended to be discontinued, as the patient might have had iatrogenic delirium.
The STT protocol was introduced during a didactic session for the hospitalists and a separate session for internal medicine and family residents. Each registered nurse working in the SDU was trained in the use of the STT protocol and MINDS during nursing huddles.
Patients were excluded from evaluation if they were transferred to the SDU after 7 or more days in the hospital, if they had stayed in the hospital more than 30 days, were chronically on benzodiazepine therapy (to avoid confounding withdrawal symptoms), or if they left the hospital against medical advice (AMA). To avoid bias in the results, the patients with early discontinuation of treatment were included in analyses of secondary outcomes, thus resulting in all 80 episodes analyzed.
Measures and data
The primary outcome measure was benzodiazepine dose intensity, expressed in total lorazepam-equivalents. Secondary measures included average length of stay (including general medical, surgical, and ICU days), seizure incidence, DT incidence, sitter use, behavioral emergency responses, rates of leaving AMA, intubation, transfer to the ICU, and death.
Benzodiazepine dosing and length of stay were obtained from the data warehouse of the hospital’s electronic health record (EHR; Meditech). Benzodiazepine dosing was expressed in total lorazepam-equivalents, with conversion as follows: lorazepam orally and intravenously 1 mg = chlordiazepoxide 25 mg = diazepam 5 mg. All other measures were obtained from chart review of the patients’ EMR entries. The Stamford Hospital Institutional Review Board approved this study.
Analysis
Data analyses for this study were performed using SPSS version 25.0 (IBM). Categorical data were reported as frequency (count) and percent within category. Continuous data were reported as mean (SD). Categorical data were analyzed using χ2 analysis; continuous data were analyzed using t-tests. A P value of .05 was considered significant for each analysis.
Results
During the preintervention period, 72 episodes (58 patients) met inclusion criteria, and 69 episodes (55 patients) met inclusion criteria during the postintervention period. Ten patients were represented in both groups. Eight preintervention episodes were excluded from the primary analysis because the patient left AMA. Eleven postintervention episodes were excluded: 9 due to patients leaving AMA, 1 due to chronic benzodiazepine usage, and 1 due to transfer to the SDU unit after 7 days. Baseline characteristics and medication use profiles of the preintervention and postintervention groups are summarized in Table 1.

Implementation of the intervention was associated with a significant reduction in average (per patient) cumulative benzodiazepine dose, from 250 mg to 96 mg (P < .001), as shown in Table 2. Average length of stay decreased from 8.0 days to 5.1 days (P < .001). Secondary safety measures were notable for a reduction in DT incidence, from 47.5% to 22.5% (P < .001), and lower rates of intubation, from 13.8% to 1.3% (P = .003). Seven-day readmission rates were 0% preintervention and 1.4% postintervention.

Discussion
We found that hospitalized patients with severe alcohol withdrawal treated with STT required fewer benzodiazepines and had a lower length of stay than patients treated with a conventional combined STT and FS regimen. Implementation of the change from the STT and FS approach to the STT approach in the SDU resulted in concerns that waiting for symptoms to appear could result in more severe withdrawal and prolonged treatment.3 To address this, the intervention included monitoring and dosing every 30 minutes, as compared to monitoring and dosing every 1 hour preintervention. In addition, a sliding-scale approach to match alcohol withdrawal score with dosage was employed in postintervention patients.
Employment of the STT protocol also resulted in decreased complications, including lower rates of DT and transfer to the ICU. This new intervention resulted in significantly decreased time required to control severe symptoms. In the preintervention phase, if a patient’s symptoms escalated despite administration of the as-needed dose of benzodiazepine, there was often a delay in administration of additional doses due to the time needed for nurses to reach a physician and subsequent placement of a new order. In the postintervention phase, the STT protocol allowed nursing staff to give benzodiazepines without delay when needed. We believe this reduced the number of calls by nursing staff to physicians requesting additional medications, and that this improved teamwork when managing these patients.
As part of the intervention, a decision was made to use the MINDS scale rather than the CIWA-Ar scale to assess withdrawal severity. This was because the CIWA-Ar has only been validated in patients with uncomplicated alcohol withdrawal syndrome and has not been researched extensively in patients requiring ICU-level care.1 MINDS assessment has proven to be reliable and reflects severity of withdrawal. Furthermore, MINDS requires less time to administer—3 to 5 minutes vs 5 to 15 minutes for the CIWA-Ar scale. CIWA-Ar, unlike MINDS, requires subjective input from the patient, which is less reliable for higher acuity patients. Our study is unique in that it focused on high-acuity patients and it showed both a significant reduction in quantity of benzodiazepines prescribed and length of stay. Previous studies on lower acuity patients in detoxification units have confirmed that STT is more effective than a FS approach.3-5 In patients of higher acuity, STT has not proven to be superior.
A key lesson learned was the need for proper education of nursing staff. Concurrent nursing audits were necessary to ensure that scoring was performed in an accurate and timely manner. In addition, it was challenging to predict which patients might develop DTs versus those requiring a brief inpatient stay. While there was initial concern that an STT protocol could result in underdosing, we found that patients had fewer DT episodes and fewer ICU transfers.
This study had several limitations. These include a relatively small sample size and the data being less recent. As there has been no intervening change to the therapeutic paradigm of DT treatment, the findings remain pertinent to the present time. The study employed a simple pre/post design and was conducted in a single setting. We are not aware of any temporal or local trends likely to influence these results. Admissions and transfers to the SDU for severe alcohol withdrawal were based on physician discretion. However, patient characteristics in both groups were similar (Table 1). We note that the postintervention STT protocol allowed for more frequent benzodiazepine dosing, though benzodiazepine use did decrease. Different alcohol withdrawal scores (MINDS vs. CIWA-Ar) were used for postintervention and preintervention, although previous research has shown that MINDS and CIWA-Ar scores correlate well.7 Finally, some patients of higher acuity and complexity were excluded, potentially limiting the generalizability of our results.
Conclusion
Our STT protocol proved to be more effective and safer in treating severe alcohol withdrawal patients than usual care employing STT with FS. We believe the successful implementation of a STT protocol in high-acuity patients also requires frequent monitoring using the MINDS scale, integrated with benzodiazepine sliding-scale dosing to match symptom severity. This bundled approach resulted in a significant reduction of benzodiazepine usage and reduced length of stay. Timely treatment of these patients also reduced the percent of patients developing DTs, and reduced intubation rates and transfers to the ICU. Further studies may be warranted at other sites to confirm the effectiveness of this STT protocol.
Corresponding author: Paul W. Huang, MD, Stamford Hospital, One Hospital Plaza, PO Box 9317, Stamford, CT 06904; phuang@stamhealth.org.
Financial disclosures: None.
1. DeCarolis DD, Rice KL, Ho L, et al. Symptom-driven lorazepam protocol for treatment of severe alcohol withdrawal delirium in the intensive care unit. Pharmacotherapy. 2007;27(4):510-518.
2. DeBellis R, Smith BS, Choi S, Malloy M. Management of delirium tremens. J Intensive Care Med. 2005;20(3):164-173.
3. Saitz R, Mayo-Smith MF, Roberts MS, et al. Individualized treatment for alcohol withdrawal. A randomized double-blind controlled trial. JAMA. 1994;272(7):519-523.
4. Sachdeva A, Chandra M, Deshpande SN. A comparative study of fixed tapering dose regimen versus symptom-triggered regimen of lorazepam for alcohol detoxification. Alcohol Alcohol. 2014;49(3):287-291.
5. Daeppen JB, Gache P, Landry U, et al. Symptom-triggered vs fixed-schedule doses of benzodiazepine for alcohol withdrawal: a randomized treatment trial. Arch Intern Med. 2002;162(10):1117-1121.
6. Jaeger TM, Lohr RH, Pankratz VS. Symptom-triggered therapy for alcohol withdrawal syndrome in medical inpatients. Mayo Clin Proc. 2001;76(7):695-701.
7. Littlefield AJ, Heavner MS, Eng CC, et al. Correlation Between mMINDS and CIWA-Ar Scoring Tools in Patients With Alcohol Withdrawal Syndrome. Am J Crit Care. 2018;27(4):280-286.
From Stamford Hospital, Stamford, CT.
Objective: This single-center, quasi-experimental study of adult patients admitted or transferred to a medical step-down unit with alcohol withdrawal diagnoses sought to determine if symptom–triggered therapy (STT) is more effective than combined fixed-scheduled (FS) and STT in severe alcohol withdrawal.
Methods: In the preintervention group (72 episodes), patients were treated with FS and STT based on physician preference. In the postintervention group (69 episodes), providers were required to utilize only the STT protocol.
Results: Implementation of the intervention was associated with a significant reduction in average (per patient) cumulative benzodiazepine dose, from 250 mg to 96 mg (P < .001) and a decrease in average length of stay from 8.0 days to 5.1 days (P < .001). Secondary safety measures included a reduction in the proportion of patients who experienced delirium tremens from 47.5% to 22.5% (P < .001), and a reduction in intubation rates from 13.8% to 1.3% (P = .003).
Conclusion: The STT protocol proved to be more effective and safer in treating severe alcohol withdrawal patients than usual care employing STT with FS. We believe the successful implementation of a STT protocol in high-acuity patients requires frequent monitoring to assess withdrawal severity combined with appropriate and timely dosing of benzodiazepines.
Keywords: alcohol withdrawal delirium; alcohol withdrawal syndrome; treatment protocol; benzodiazepine; lorazepam.
Management of severe alcohol withdrawal and delirium tremens (DT) is challenging and requires significant resources, including close monitoring and intensive treatment, frequently in an intensive care unit (ICU).1 Early diagnosis and therapeutic intervention are important to limit potential complications associated with DT.2 Benzodiazepines are first-line therapeutic agents, but the definition of optimal use and dosing regimens has been limited, due to a lack of randomized controlled trials. In lower acuity patients admitted to a detoxification unit, systematic symptom–triggered benzodiazepine therapy (STT) has been established to be more effective than fixed-schedule (FS) dosing.3-5 Patients treated using STT require lower total benzodiazepine dosing and achieve shorter treatment durations. However, in higher-acuity patients admitted to general medical services, analyses have not shown an advantage of STT over combined FS and STT.6
Methods
The purpose of this study was to determine whether implementation of STT is more effective than FS dosing combined with episodic STT in the management of hospitalized high-acuity alcohol withdrawal patients. We conducted a preintervention and postintervention quasi-experimental study in the step-down unit (SDU) of a 305-bed community teaching hospital. The study population consisted of adult inpatients 18 years or older admitted or transferred to the 12-bed SDU with alcohol withdrawal, as defined by primary or secondary International Classification of Diseases, Tenth Revision diagnoses. SDU admission criteria included patients with prior DT or those who had received multiple doses of benzodiazepines in the emergency department. In-hospital transfer to the SDU was at the physician’s discretion, if the patient required escalating doses of benzodiazepines or the use of increasing resources, such as those for behavioral emergencies. The majority of patients admitted or transferred to the SDU were assigned to medical house staff teams under hospitalist supervision, and, on occasion, under community physicians. The nurse-to-patient ratio in the SDU was 1:3.
Study groups
The preintervention group consisted of 80 successive treatment episodes involving patients admitted or transferred to the SDU from
In the preintervention group, fixed, scheduled doses of lorazepam or chlordiazepoxide and as-needed lorazepam were prescribed and adjusted based upon physician judgment. Monitoring of symptom severity was scored using the revised Clinical Institute Withdrawal Assessment for Alcohol scale (CIWA-Ar). Benzodiazepine dosing occurred if the CIWA-Ar score had increased 2 or more points from the last score.
In the postintervention group, the STT protocol included the creation of a standardized physician order set for benzodiazepine “sliding scale” administration. The STT protocol allowed for escalating doses for higher withdrawal scores. Symptom severity was scored using MINDS (Minnesota Detoxification Scale) criteria.1 Lorazepam as-needed dosing was based upon MINDS scores. A MINDS score less than 10 resulted in no medication, MINDS 10-12 required 2 mg, MINDS 13-16 required 4 mg, MINDS 17-19 required 6 mg, and MINDS 20 required 8 mg and a call to the physician. Transfer to the ICU was recommended if the MINDS score was ≥ 20 for 3 consecutive hours. Monitoring intervals occurred more frequently at 30 minutes unless the MINDS score was less than 10. After 7 days, the MINDS protocol was recommended to be discontinued, as the patient might have had iatrogenic delirium.
The STT protocol was introduced during a didactic session for the hospitalists and a separate session for internal medicine and family residents. Each registered nurse working in the SDU was trained in the use of the STT protocol and MINDS during nursing huddles.
Patients were excluded from evaluation if they were transferred to the SDU after 7 or more days in the hospital, if they had stayed in the hospital more than 30 days, were chronically on benzodiazepine therapy (to avoid confounding withdrawal symptoms), or if they left the hospital against medical advice (AMA). To avoid bias in the results, the patients with early discontinuation of treatment were included in analyses of secondary outcomes, thus resulting in all 80 episodes analyzed.
Measures and data
The primary outcome measure was benzodiazepine dose intensity, expressed in total lorazepam-equivalents. Secondary measures included average length of stay (including general medical, surgical, and ICU days), seizure incidence, DT incidence, sitter use, behavioral emergency responses, rates of leaving AMA, intubation, transfer to the ICU, and death.
Benzodiazepine dosing and length of stay were obtained from the data warehouse of the hospital’s electronic health record (EHR; Meditech). Benzodiazepine dosing was expressed in total lorazepam-equivalents, with conversion as follows: lorazepam orally and intravenously 1 mg = chlordiazepoxide 25 mg = diazepam 5 mg. All other measures were obtained from chart review of the patients’ EMR entries. The Stamford Hospital Institutional Review Board approved this study.
Analysis
Data analyses for this study were performed using SPSS version 25.0 (IBM). Categorical data were reported as frequency (count) and percent within category. Continuous data were reported as mean (SD). Categorical data were analyzed using χ2 analysis; continuous data were analyzed using t-tests. A P value of .05 was considered significant for each analysis.
Results
During the preintervention period, 72 episodes (58 patients) met inclusion criteria, and 69 episodes (55 patients) met inclusion criteria during the postintervention period. Ten patients were represented in both groups. Eight preintervention episodes were excluded from the primary analysis because the patient left AMA. Eleven postintervention episodes were excluded: 9 due to patients leaving AMA, 1 due to chronic benzodiazepine usage, and 1 due to transfer to the SDU unit after 7 days. Baseline characteristics and medication use profiles of the preintervention and postintervention groups are summarized in Table 1.
Implementation of the intervention was associated with a significant reduction in average (per patient) cumulative benzodiazepine dose, from 250 mg to 96 mg (P < .001), as shown in Table 2. Average length of stay decreased from 8.0 days to 5.1 days (P < .001). Secondary safety measures were notable for a reduction in DT incidence, from 47.5% to 22.5% (P < .001), and lower rates of intubation, from 13.8% to 1.3% (P = .003). Seven-day readmission rates were 0% preintervention and 1.4% postintervention.
Discussion
We found that hospitalized patients with severe alcohol withdrawal treated with STT required fewer benzodiazepines and had a lower length of stay than patients treated with a conventional combined STT and FS regimen. Implementation of the change from the STT and FS approach to the STT approach in the SDU resulted in concerns that waiting for symptoms to appear could result in more severe withdrawal and prolonged treatment.3 To address this, the intervention included monitoring and dosing every 30 minutes, as compared to monitoring and dosing every 1 hour preintervention. In addition, a sliding-scale approach to match alcohol withdrawal score with dosage was employed in postintervention patients.
Employment of the STT protocol also resulted in decreased complications, including lower rates of DT and transfer to the ICU. This new intervention resulted in significantly decreased time required to control severe symptoms. In the preintervention phase, if a patient’s symptoms escalated despite administration of the as-needed dose of benzodiazepine, there was often a delay in administration of additional doses due to the time needed for nurses to reach a physician and subsequent placement of a new order. In the postintervention phase, the STT protocol allowed nursing staff to give benzodiazepines without delay when needed. We believe this reduced the number of calls by nursing staff to physicians requesting additional medications, and that this improved teamwork when managing these patients.
As part of the intervention, a decision was made to use the MINDS scale rather than the CIWA-Ar scale to assess withdrawal severity. This was because the CIWA-Ar has only been validated in patients with uncomplicated alcohol withdrawal syndrome and has not been researched extensively in patients requiring ICU-level care.1 MINDS assessment has proven to be reliable and reflects severity of withdrawal. Furthermore, MINDS requires less time to administer—3 to 5 minutes vs 5 to 15 minutes for the CIWA-Ar scale. CIWA-Ar, unlike MINDS, requires subjective input from the patient, which is less reliable for higher acuity patients. Our study is unique in that it focused on high-acuity patients and it showed both a significant reduction in quantity of benzodiazepines prescribed and length of stay. Previous studies on lower acuity patients in detoxification units have confirmed that STT is more effective than a FS approach.3-5 In patients of higher acuity, STT has not proven to be superior.
A key lesson learned was the need for proper education of nursing staff. Concurrent nursing audits were necessary to ensure that scoring was performed in an accurate and timely manner. In addition, it was challenging to predict which patients might develop DTs versus those requiring a brief inpatient stay. While there was initial concern that an STT protocol could result in underdosing, we found that patients had fewer DT episodes and fewer ICU transfers.
This study had several limitations. These include a relatively small sample size and the data being less recent. As there has been no intervening change to the therapeutic paradigm of DT treatment, the findings remain pertinent to the present time. The study employed a simple pre/post design and was conducted in a single setting. We are not aware of any temporal or local trends likely to influence these results. Admissions and transfers to the SDU for severe alcohol withdrawal were based on physician discretion. However, patient characteristics in both groups were similar (Table 1). We note that the postintervention STT protocol allowed for more frequent benzodiazepine dosing, though benzodiazepine use did decrease. Different alcohol withdrawal scores (MINDS vs. CIWA-Ar) were used for postintervention and preintervention, although previous research has shown that MINDS and CIWA-Ar scores correlate well.7 Finally, some patients of higher acuity and complexity were excluded, potentially limiting the generalizability of our results.
Conclusion
Our STT protocol proved to be more effective and safer in treating severe alcohol withdrawal patients than usual care employing STT with FS. We believe the successful implementation of a STT protocol in high-acuity patients also requires frequent monitoring using the MINDS scale, integrated with benzodiazepine sliding-scale dosing to match symptom severity. This bundled approach resulted in a significant reduction of benzodiazepine usage and reduced length of stay. Timely treatment of these patients also reduced the percent of patients developing DTs, and reduced intubation rates and transfers to the ICU. Further studies may be warranted at other sites to confirm the effectiveness of this STT protocol.
Corresponding author: Paul W. Huang, MD, Stamford Hospital, One Hospital Plaza, PO Box 9317, Stamford, CT 06904; phuang@stamhealth.org.
Financial disclosures: None.
1. DeCarolis DD, Rice KL, Ho L, et al. Symptom-driven lorazepam protocol for treatment of severe alcohol withdrawal delirium in the intensive care unit. Pharmacotherapy. 2007;27(4):510-518.
2. DeBellis R, Smith BS, Choi S, Malloy M. Management of delirium tremens. J Intensive Care Med. 2005;20(3):164-173.
3. Saitz R, Mayo-Smith MF, Roberts MS, et al. Individualized treatment for alcohol withdrawal. A randomized double-blind controlled trial. JAMA. 1994;272(7):519-523.
4. Sachdeva A, Chandra M, Deshpande SN. A comparative study of fixed tapering dose regimen versus symptom-triggered regimen of lorazepam for alcohol detoxification. Alcohol Alcohol. 2014;49(3):287-291.
5. Daeppen JB, Gache P, Landry U, et al. Symptom-triggered vs fixed-schedule doses of benzodiazepine for alcohol withdrawal: a randomized treatment trial. Arch Intern Med. 2002;162(10):1117-1121.
6. Jaeger TM, Lohr RH, Pankratz VS. Symptom-triggered therapy for alcohol withdrawal syndrome in medical inpatients. Mayo Clin Proc. 2001;76(7):695-701.
7. Littlefield AJ, Heavner MS, Eng CC, et al. Correlation Between mMINDS and CIWA-Ar Scoring Tools in Patients With Alcohol Withdrawal Syndrome. Am J Crit Care. 2018;27(4):280-286.
Morning Discharges and Patient Length of Stay in Inpatient General Internal Medicine
There is substantial interest in improving patient flow and reducing hospital length of stay (LOS).1-4 Impaired hospital flow may negatively impact both patient satisfaction and safety through, for example, emergency department (ED) overcrowding.5,6 Impaired hospital flow is associated with downstream effects on patient care, hospital costs, and availability of beds.7-9
A number of quality-improvement interventions aim to improve patient flow, including efforts to increase the number of discharges that occur before noon.10,11 Morning discharges have been hypothesized to free hospital beds earlier, thus reducing ED wait times for incoming patients and increasing beds for elective surgeries.11 Morning discharges may also be more predictable for staff and patients. However, it is unclear whether efforts to increase the number of morning discharges have a negative impact on inpatient LOS by incentivizing physicians to keep patients in the hospital for an extra night to facilitate discharge in the early morning rather than the late afternoon. Morning discharges have been associated with both increased12 and decreased LOS.10,11,13-15
The purpose of this study was to examine the associations between morning discharges and ED LOS and hospital LOS in general internal medicine (GIM) at seven hospitals. GIM patients represent nearly 40% of ED admissions to a hospital,16 and thus are an important determinant of patient flow through the ED and hospital. We hypothesized that patients who were admitted to GIM on days with more morning discharges would have shorter ED LOS and hospital LOS.
METHODS
Design, Setting, and Participants
This was a retrospective cohort study conducted using the General Medicine Inpatient Initiative (GEMINI) clinical dataset.16 The dataset includes all GIM admissions at seven large hospital sites in Toronto and Mississauga, Ontario, Canada. These include five academic hospitals and two community-based teaching hospitals. Each hospital is publicly funded and provides tertiary and/or quaternary care to diverse multiethnic populations. Research ethics board approval was obtained from all participating sites.
GIM care is delivered by several interdisciplinary clinical teams functioning in parallel. Attending physicians are predominantly internists who practice as hospitalists in discrete service blocks, typically lasting 2 weeks at a time. Although GIM patients are preferentially admitted to GIM wards, participating hospitals did not have strict policies regarding cohorting GIM patients to specific wards (ie, holding patients in ED until a specific bed becomes available) that would confound the association between morning discharge and ED wait times. Approximately 75% of GIM patients are cared for on dedicated GIM wards at participating hospitals, with the remainder cared for on other medical or surgical wards.
We included all hospitalized patients who were admitted to hospital and discharged from GIM between April 1, 2010, and October 31, 2017, from the seven GEMINI hospitals. We included only patients admitted through the ED. As such, we did not include elective admissions or interfacility transfers who would not experience ED wait times. We excluded patients who were discharged without a provincial health insurance number (N = 2,169; 1.1% of total sample) because they could not be linked across visits to measure readmissions.
Data Source
The GEMINI dataset has been rigorously validated and previously described in detail.16 GEMINI collects both administrative health data reported to the Canadian Institute for Health Information (including data about patient demographics, comorbidities, and discharge destination) as well as electronic clinical data extracted from hospital computer systems (including attending physicians, in-hospital patient room transfers, and laboratory test results). Data are collected for each individual hospital encounter, and the provincial health insurance number is used to link patients across encounters.
Exposures and Outcomes
The two primary outcomes were ED LOS and hospital LOS. ED LOS was calculated as the difference between the time from triage by nursing staff to a patient’s exit from the ED, measured in hours. We also examined 30-day readmission to GIM at any participating hospital as a balancing measure against premature discharges and inpatient mortality because it could modify hospital LOS.
Patient Characteristics
Baseline patient characteristics were measured, including age, sex, Charlson Comorbidity Index score,17 day of admission (categorized as weekend/holiday or weekday), time of admission to hospital (
Statistical Analysis
The study population and physician characteristics were summarized with descriptive statistics. The balance of baseline patient characteristics across morning discharge quartiles was assessed using standardized differences. A standardized difference of less than 0.1 reflects good balance.20
Unadjusted estimates of patient outcomes were reported across morning discharge quartiles. To model the overall association between morning discharge and outcomes, the number of morning GIM discharges on the day of admission was subtracted from the mean number of morning discharges at each hospital and considered as a continuous exposure. We used generalized linear mixed models to estimate the effect of morning discharges on patient outcomes. We fit negative binomial regression models with log link to examine the association between the number of morning discharges (centered by subtracting the hospital mean) and the two main outcomes, ED LOS and hospital LOS. Given the overdispersion of the study population due to the unequal mean and variance, a negative binomial model was preferred over a Poisson regression, as the mean and variance were not equal.21 For our secondary outcomes of binary measures (30-day readmission and morality), we fit logistic regression models. Adjustment for multiple comparisons was not performed.
Multivariable analysis was conducted to adjust for the baseline characteristics described above as well as the total number of GIM discharges on the day of admission and GIM census on the day of admission. Hospital and study month (to account for secular time trends) were included as fixed effects, and patients and admitting physicians were included as crossed random effects to account for the nested structure of admissions within patients and admissions within physicians within hospitals.
A sensitivity analysis was performed to assess for nonlinear associations between morning discharges and the four outcomes (hospital LOS, ED LOS, in-hospital mortality, and readmission) by inputting the term as a restricted cubic spline, with up to five knots
RESULTS
Study Population and Patient Characteristics
The study population consisted of 189,781 hospitalizations involving 115,630 unique patients. The median patient age was 73 years (interquartile range [IQR], 57-84), 50.3% were female, 43.8% had a high Charlson Comorbidity Index score, and 11.1% were admitted to GIM in the prior 30 days (Table 1). The median ED LOS was 14.5 hours (IQR, 10.0-23.1), and the mean was 18.1 hours (SD, 12.2). The median hospital LOS was 4.6 days (IQR, 2.4-9.0), and the mean was 8.6 days (SD, 18.7).

In total, 36,043 (19.0%) discharges occurred between 8:00
Outcomes
Unadjusted clinical outcomes by number of morning discharges are presented in Table 2. The median unadjusted ED LOS was 14.4 (SD, 14.1), 14.3 (SD, 13.2), 14.5 (SD, 13.0), and 14.8 (SD, 13.0) hours for the first to fourth quartiles (fewest to largest number of morning discharges), respectively. The median unadjusted hospital LOS was 4.6 (SD, 6.5), 4.6 (SD, 6.9), 4.7 (SD, 6.4), and 4.6 (SD, 6.4) days for the first to fourth quartiles, respectively.

Unadjusted inpatient mortality was 6.1%, 5.5%, 5.5%, and 5.2% across the first to fourth quartiles, respectively. Unadjusted 30-day readmission to GIM was 12.2%, 12.6%, 12.6%, and 12.5% across the first to fourth quartiles, respectively.
After multivariable adjustment, there was no significant association between morning discharge and hospital LOS (aRR, 1.000; 95% CI, 0.996-1.000; P = .997), ED LOS (aRR, 0.999; 95% CI, 0.997-1.000; P = .307), in-hospital mortality (aRR, 0.967; 95% CI, 0.920-1.020; P =.183), or 30-day readmission (aRR, 1.010; 95% CI, 0.991-1.020; P = .471) (Table 3, Appendix Table 2, Appendix Table 3, Appendix Table 4, Appendix Table 5). When examining each hospital separately, we found that morning discharge was significantly associated with hospital LOS at only one hospital (Hospital D; aRR, 0.981; 95% CI, 0.966-0.996; P = .013). Morning discharge was statistically significantly associated with ED LOS at three hospitals (A, B, and C), but the aRR was at least 0.99 in all three cases (Table 4).

In sensitivity analyses, we found no improvements in model fit when adding spline terms to the model, suggesting no significant nonlinear associations between morning discharges and the outcomes of interest.

DISCUSSION
This large multicenter cohort study found no significant overall association between the number of morning discharges and ED or hospital LOS in GIM. At one hospital, there was a 1.9% reduction in adjusted ED LOS for every additional morning discharge, but no difference in hospital LOS. We also did not observe differences in readmission or inpatient mortality associated with the number of morning discharges. Our observational findings suggest that there is unlikely to be a strong association between morning discharge and patient throughput in GIM. Given that there may be other downstream benefits of morning discharge, such as freeing beds for daytime surgeries,23 further research is needed to determine the effectiveness of specific interventions.
Several studies have posited morning discharge as a method of improving both patient care and hospital flow metrics.10,11,13-15,23 Quality improvement initiatives targeting morning discharges have included stakeholder meetings, incentives programs, discharge-centered breakfast programs, and creating deadlines for discharge orders.24-29 Although these initiatives have gained support, critics have suggested that their supporting evidence is not robust. Werthemier et al10 found a 9.0% reduction of observed to expected LOS associated with increasing the number of early discharges. However, a response article suggested that their findings were confounded by other hospital initiatives, such as allocation of medical and social services to weekends.30 Other observational studies have concluded that hospital LOS is not affected by the number of morning discharges, but this research has been limited by single-center analysis and relatively smaller sample sizes.12 Our study further calls into question the association between morning discharge and patient throughput.
An additional reason for the controversy is that physicians may actively work to discharge patients late in the day to avoid an additional night in hospital. A qualitative study by Minichiello et al31 evaluated staff perceptions regarding afternoon discharges. Physicians and medical students believed that afternoon discharges were a result of waiting for test results and procedures, with staff aiming to discharge patients immediately after obtaining results or finishing necessary procedures. As such, there are concerns that incentivizing morning discharge may lead physicians in the opposite direction, to consciously or unconsciously keep patients overnight in order to facilitate an early morning discharge.30
Our study’s greatest strength was the large sample size over 7 years at seven hospitals in two cities, including both academic and community hospitals with different models of care. To our knowledge, this is the first cohort study that has analyzed the association between early discharge and LOS using multiple centers. To avoid the confounding and reverse causality that may exist when examining the relationship between LOS and morning discharge at the patient level (eg, patients who stay in hospital longer may have more “planned” discharges and leave in the morning), we examined the association based on variation across different days within the GIM service of each hospital. Further, we included robust risk adjustment using clinical and laboratory data. Finally, since our study included a diverse patient population served by participating centers in a system with universal insurance for hospital care, our findings are likely generalizable to other urban and suburban hospitals.
There are several important limitations of our analysis. First, we could only include GIM patients, who represent nearly 40% of ED admissions to hospital at participating centers. A more holistic analysis across all hospital services could be justified; however, given that many quality improvement initiatives occur at the level of a single hospital service, we felt our approach would be informative for future research and improvement efforts. Approximately 75% of GIM patients at participating hospitals were cared for on a GIM ward, with 25% cared for on off-service units. We were unable to include the total hospital census in our models, and this could affect LOS and waiting times for GIM patients, particularly those admitted to off-service units. GIM census is likely highly correlated with hospital census, and we were able to adjust for this. Nevertheless, this remains an important potential source of unmeasured confounding. Second, we did not model the effects of morning discharges from GIM on patient-flow measures for non-GIM patients. Given the lack of effects for GIM patients, who would be more likely to be directly affected, it is unlikely that large effects would be seen for other hospital patients, but we did not measure effects on surgical delays or cancellations, for example.23 Third, we report 30-day readmission to GIM at participating hospitals only, rather than all readmissions. However, prior research in our region demonstrated that 82% of hospital readmissions occur to the same site.32 Thus, our measure, which includes admission to any participating hospital, likely captures more than 80% of all readmissions, and this was a secondary outcome in our analysis. Finally, qualitative metrics, such as patient or provider satisfaction, were not measured in our study. Earlier discharge may impact patient care in other ways by being more predictable for staff, improving bed allocation for daytime procedures, making medication pick-ups easier to arrange, or making consultations with allied health services more convenient.11,28,33 Conversely, if pressured to discharge before noon, providers may feel rushed to complete tasks and may face disruptions to typical workflow.24 As such, future research is needed to provide a more complete understanding of the impact of early-morning discharge beyond hospital flow.
CONCLUSION
The number of morning discharges was not significantly associated with shorter ED LOS or hospital LOS for GIM patients. Our observational findings suggest that increasing morning discharges alone may not substantially improve patient flow in GIM. Further research is needed to evaluate specific morning discharge interventions and assess hospital-wide effects.
1. Trzeciak S, Rivers EP. Emergency department overcrowding in the United States: an emerging threat to patient safety and public health. Emerg Med J. 2003;20(5):402-405. https://doi.org/10.1136/emj.20.5.402
2. McKenna P, Heslin SM, Viccellio P, Mallon WK, Hernandez C, Morley EJ. Emergency department and hospital crowding: causes, consequences, and cures. Clin Exp Emerg Med. 2019;6(3):189-195. https://doi.org/10.15441/ceem.18.022
3. Bernstein SL, Aronsky D, Duseja R, et al. The effect of emergency department crowding on clinically oriented outcomes. Acad Emerg Med. 2009;16(1):1-10. https://doi.org/10.1111/j.1553-2712.2008.00295.x
4. Derlet RW, Richards JR. Overcrowding in the nation’s emergency departments: complex causes and disturbing effects. Ann Emerg Med. 2000;35(1):63-68. https://doi.org/10.1016/s0196-0644(00)70105-3
5. Pines JM, Iyer S, Disbot M, Hollander JE, Shofer FS, Datner EM. The effect of emergency department crowding on patient satisfaction for admitted patients. Acad Emerg Med. 2008;15(9):825-831. https://doi.org/10.1111/j.1553-2712.2008.00200.x
6. Carter EJ, Pouch SM, Larson EL. The relationship between emergency department crowding and patient outcomes: a systematic review. J Nurs Scholarsh. 2014;46(2):106-115. https://doi.org/10.1111/jnu.1205
7. Bueno H, Ross JS, Wang Y, et al. Trends in length of stay and short-term outcomes among Medicare patients hospitalized for heart failure, 1993-2006. JAMA. 2010;303(21):2141-2147. https://doi.org/10.1001/jama.2010.748
8. Rotter T, Kinsman L, James E, et al. Clinical pathways: effects on professional practice, patient outcomes, length of stay and hospital costs. Cochrane Database Syst Rev. 2010;(3):Cd006632. https://doi.org/ 10.1002/14651858.CD006632.pub2
9. Zodda D, Underwood J. Improving emergency department throughput: evidence-based strategies aimed at reducing boarding and overcrowding. Phys Leadership J. 2019;6(3):70-73.
10. Wertheimer B, Jacobs REA, Bailey M, et al. Discharge before noon: an achievable hospital goal. J Hosp Med. 2014;9(4):210-214. https://doi.org/10.1002/jhm.2154
11. Kane M, Weinacker A, Arthofer R, et al. A multidisciplinary initiative to increase inpatient discharges before noon. J Nurs Adm. 2016;46(12):630-635. https://doi.org/10.1097/NNA.0000000000000418
12. Rajkomar A, Valencia V, Novelero M, Mourad M, Auerbach A. The association between discharge before noon and length of stay in medical and surgical patients. J Hosp Med. 2016;11(12):859-861. https://doi.org/10.1002/jhm.2529
13. Patel H, Morduchowicz S, Mourad M. Using a systematic framework of interventions to improve early discharges. Jt Comm J Qual Patient Saf. 2017;43(4):189-196. https://doi.org/10.1016/j.jcjq.2016.12.003
14. El-Eid GR, Kaddoum R, Tamim H, Hitti EA. Improving hospital discharge time: a successful implementation of Six Sigma methodology. Medicine (Baltimore). 2015;94(12):e633. https://doi.org/10.1097/MD.0000000000000633
15. Mathews KS, Corso P, Bacon S, Jenq GY. Using the red/yellow/green discharge tool to improve the timeliness of hospital discharges. Jt Comm J Qual Patient Saf. 2014;40(6):243-252. https://doi.org/10.1016/s1553-7250(14)40033-3
16. Verma AA, Pasricha SV, Jung HY, et al. Assessing the quality of clinical and administrative data extracted from hospitals: the General Medicine Inpatient Initiative (GEMINI) experience. J Am Med Inform Assoc. 2021; 28(3):578-587. doi: 10.1093/jamia/ocaa225.
17. Quan H, Li B, Couris CM, et al. Updating and validating the Charlson comorbidity index and score for risk adjustment in hospital discharge abstracts using data from 6 countries. Am J Epidemiol. 2011;173(60:676-682. https://doi.org/10.1093/aje/kwq433
18. Escobar GJ, Greene JD, Scheirer P, Gardner MN, Draper D, Kipnis P. Risk-adjusting hospital inpatient mortality using automated inpatient, outpatient, and laboratory databases. Med Care. 2008;46(3):232-239. https://doi.org/10.1097/MLR.0b013e3181589bb6
19. Austin PC. Using the standardized difference to compare the prevalence of a binary variable between two groups in observational research. Commun Stat Simul Comput. 2009;38(60:1228-1234. https://doi.org/10.1080/03610910902859574
20. van Walraven C, Escobar GJ, Greene JD, Forster AJ. The Kaiser Permanente inpatient risk adjustment methodology was valid in an external patient population. J Clin Epidemiol. 2010;63(7):798-803. https://doi.org/10.1016/j.jclinepi.2009.08.020
21. Hilbe JM. Negative binomial regression. In: Modeling Count Data. Cambridge University Press. 2014:126-160.
22. Harrell FE Jr. Regression Modeling Strategies: With Applications to Linear Models, Logistic and Ordinal Regression, and Survival Analysis. 2nd ed. Springer; 2015.
23. Durvasula R, Kayihan A, Del Bene S, et al. A multidisciplinary care pathway significantly increases the number of early morning discharges in a large academic medical center. Qual Manag Health Care. 2015;24(1):45-51. https://doi.org/10.1097/QMH.0000000000000049
24. Goolsarran N, Olowo G, Ling Y, Abbasi S, Taub E, Teressa G. Outcomes of a resident-led early hospital discharge intervention. J Gen Intern Med. 2020;35(2):437-443. https://doi.org/10.1007/s11606-019-05563-w
25. Beck MJ, Okerblom D, Kumar A, Bandyopadhyay S, Scalzi LV. Lean intervention improves patient discharge times, improves emergency department throughput and reduces congestion. Hosp Pract (1995). 2016;44(5):252-259. https://doi.org/10.1080/21548331.2016.1254559
26. Karling A, Tang KW. Discharge before noon: a study in a medical emergency ward. 2015. Accessed February 11, 2021. http://publications.lib.chalmers.se/records/fulltext/231873/231873.pdf
27. Mathews K, Corso P, Bacon S, Jenq GY. Using the red/yellow/green discharge tool to improve the timeliness of hospital discharges. Jt Comm J Qual Patient Saf. 2014;40(6):243-252. https://doi.org/10.1016/s1553-7250(14)40033-3
28. Goodson AS, DeGuzman, PB, Honeycutt A, Summy C, Manly F. Total joint replacement discharge brunch: meeting patient education needs and a hospital initiative of discharge by noon. Orthop Nurs. 2014;33(3):159-162. https://doi.org/10.1097/NOR.0000000000000048
29. Kravet SJ, Levine RB, Rubin HR, Wright SM. Discharging patients earlier in the day: a concept worth evaluating. Health Care Manag (Frederick). 2007;26(2):142-146. https://doi.org/10.1097/01.HCM.0000268617.33491.60
30. Shine D. Discharge before noon: an urban legend. Am J Med. 2015;128(5):445-446. https://doi.org/10.1016/j.amjmed.2014.12.011
31. Minichiello TM, Auerbach AD, Wachter RM. Caregiver perceptions of the reasons for delayed hospital discharge. Eff Clin Pract. 2001;4(6):250-255.
32. Staples JA, Thiruchelvam D, Redelmeier DA. Site of hospital readmission and mortality: a population-based retrospective cohort study. CMAJ Open. 2014;2:E77-E85. https://doi.org/10.9778/cmajo.20130053
33. Bowles KH, Foust JB, Naylor MD. Hospital discharge referral decision making: a multidisciplinary perspective. Appl Nurs Res. 2003;16(3):134-143. https://doi.org/10.1016/s0897-1897(03)00048-x
There is substantial interest in improving patient flow and reducing hospital length of stay (LOS).1-4 Impaired hospital flow may negatively impact both patient satisfaction and safety through, for example, emergency department (ED) overcrowding.5,6 Impaired hospital flow is associated with downstream effects on patient care, hospital costs, and availability of beds.7-9
A number of quality-improvement interventions aim to improve patient flow, including efforts to increase the number of discharges that occur before noon.10,11 Morning discharges have been hypothesized to free hospital beds earlier, thus reducing ED wait times for incoming patients and increasing beds for elective surgeries.11 Morning discharges may also be more predictable for staff and patients. However, it is unclear whether efforts to increase the number of morning discharges have a negative impact on inpatient LOS by incentivizing physicians to keep patients in the hospital for an extra night to facilitate discharge in the early morning rather than the late afternoon. Morning discharges have been associated with both increased12 and decreased LOS.10,11,13-15
The purpose of this study was to examine the associations between morning discharges and ED LOS and hospital LOS in general internal medicine (GIM) at seven hospitals. GIM patients represent nearly 40% of ED admissions to a hospital,16 and thus are an important determinant of patient flow through the ED and hospital. We hypothesized that patients who were admitted to GIM on days with more morning discharges would have shorter ED LOS and hospital LOS.
METHODS
Design, Setting, and Participants
This was a retrospective cohort study conducted using the General Medicine Inpatient Initiative (GEMINI) clinical dataset.16 The dataset includes all GIM admissions at seven large hospital sites in Toronto and Mississauga, Ontario, Canada. These include five academic hospitals and two community-based teaching hospitals. Each hospital is publicly funded and provides tertiary and/or quaternary care to diverse multiethnic populations. Research ethics board approval was obtained from all participating sites.
GIM care is delivered by several interdisciplinary clinical teams functioning in parallel. Attending physicians are predominantly internists who practice as hospitalists in discrete service blocks, typically lasting 2 weeks at a time. Although GIM patients are preferentially admitted to GIM wards, participating hospitals did not have strict policies regarding cohorting GIM patients to specific wards (ie, holding patients in ED until a specific bed becomes available) that would confound the association between morning discharge and ED wait times. Approximately 75% of GIM patients are cared for on dedicated GIM wards at participating hospitals, with the remainder cared for on other medical or surgical wards.
We included all hospitalized patients who were admitted to hospital and discharged from GIM between April 1, 2010, and October 31, 2017, from the seven GEMINI hospitals. We included only patients admitted through the ED. As such, we did not include elective admissions or interfacility transfers who would not experience ED wait times. We excluded patients who were discharged without a provincial health insurance number (N = 2,169; 1.1% of total sample) because they could not be linked across visits to measure readmissions.
Data Source
The GEMINI dataset has been rigorously validated and previously described in detail.16 GEMINI collects both administrative health data reported to the Canadian Institute for Health Information (including data about patient demographics, comorbidities, and discharge destination) as well as electronic clinical data extracted from hospital computer systems (including attending physicians, in-hospital patient room transfers, and laboratory test results). Data are collected for each individual hospital encounter, and the provincial health insurance number is used to link patients across encounters.
Exposures and Outcomes
The two primary outcomes were ED LOS and hospital LOS. ED LOS was calculated as the difference between the time from triage by nursing staff to a patient’s exit from the ED, measured in hours. We also examined 30-day readmission to GIM at any participating hospital as a balancing measure against premature discharges and inpatient mortality because it could modify hospital LOS.
Patient Characteristics
Baseline patient characteristics were measured, including age, sex, Charlson Comorbidity Index score,17 day of admission (categorized as weekend/holiday or weekday), time of admission to hospital (
Statistical Analysis
The study population and physician characteristics were summarized with descriptive statistics. The balance of baseline patient characteristics across morning discharge quartiles was assessed using standardized differences. A standardized difference of less than 0.1 reflects good balance.20
Unadjusted estimates of patient outcomes were reported across morning discharge quartiles. To model the overall association between morning discharge and outcomes, the number of morning GIM discharges on the day of admission was subtracted from the mean number of morning discharges at each hospital and considered as a continuous exposure. We used generalized linear mixed models to estimate the effect of morning discharges on patient outcomes. We fit negative binomial regression models with log link to examine the association between the number of morning discharges (centered by subtracting the hospital mean) and the two main outcomes, ED LOS and hospital LOS. Given the overdispersion of the study population due to the unequal mean and variance, a negative binomial model was preferred over a Poisson regression, as the mean and variance were not equal.21 For our secondary outcomes of binary measures (30-day readmission and morality), we fit logistic regression models. Adjustment for multiple comparisons was not performed.
Multivariable analysis was conducted to adjust for the baseline characteristics described above as well as the total number of GIM discharges on the day of admission and GIM census on the day of admission. Hospital and study month (to account for secular time trends) were included as fixed effects, and patients and admitting physicians were included as crossed random effects to account for the nested structure of admissions within patients and admissions within physicians within hospitals.
A sensitivity analysis was performed to assess for nonlinear associations between morning discharges and the four outcomes (hospital LOS, ED LOS, in-hospital mortality, and readmission) by inputting the term as a restricted cubic spline, with up to five knots
RESULTS
Study Population and Patient Characteristics
The study population consisted of 189,781 hospitalizations involving 115,630 unique patients. The median patient age was 73 years (interquartile range [IQR], 57-84), 50.3% were female, 43.8% had a high Charlson Comorbidity Index score, and 11.1% were admitted to GIM in the prior 30 days (Table 1). The median ED LOS was 14.5 hours (IQR, 10.0-23.1), and the mean was 18.1 hours (SD, 12.2). The median hospital LOS was 4.6 days (IQR, 2.4-9.0), and the mean was 8.6 days (SD, 18.7).
In total, 36,043 (19.0%) discharges occurred between 8:00
Outcomes
Unadjusted clinical outcomes by number of morning discharges are presented in Table 2. The median unadjusted ED LOS was 14.4 (SD, 14.1), 14.3 (SD, 13.2), 14.5 (SD, 13.0), and 14.8 (SD, 13.0) hours for the first to fourth quartiles (fewest to largest number of morning discharges), respectively. The median unadjusted hospital LOS was 4.6 (SD, 6.5), 4.6 (SD, 6.9), 4.7 (SD, 6.4), and 4.6 (SD, 6.4) days for the first to fourth quartiles, respectively.
Unadjusted inpatient mortality was 6.1%, 5.5%, 5.5%, and 5.2% across the first to fourth quartiles, respectively. Unadjusted 30-day readmission to GIM was 12.2%, 12.6%, 12.6%, and 12.5% across the first to fourth quartiles, respectively.
After multivariable adjustment, there was no significant association between morning discharge and hospital LOS (aRR, 1.000; 95% CI, 0.996-1.000; P = .997), ED LOS (aRR, 0.999; 95% CI, 0.997-1.000; P = .307), in-hospital mortality (aRR, 0.967; 95% CI, 0.920-1.020; P =.183), or 30-day readmission (aRR, 1.010; 95% CI, 0.991-1.020; P = .471) (Table 3, Appendix Table 2, Appendix Table 3, Appendix Table 4, Appendix Table 5). When examining each hospital separately, we found that morning discharge was significantly associated with hospital LOS at only one hospital (Hospital D; aRR, 0.981; 95% CI, 0.966-0.996; P = .013). Morning discharge was statistically significantly associated with ED LOS at three hospitals (A, B, and C), but the aRR was at least 0.99 in all three cases (Table 4).
In sensitivity analyses, we found no improvements in model fit when adding spline terms to the model, suggesting no significant nonlinear associations between morning discharges and the outcomes of interest.
DISCUSSION
This large multicenter cohort study found no significant overall association between the number of morning discharges and ED or hospital LOS in GIM. At one hospital, there was a 1.9% reduction in adjusted ED LOS for every additional morning discharge, but no difference in hospital LOS. We also did not observe differences in readmission or inpatient mortality associated with the number of morning discharges. Our observational findings suggest that there is unlikely to be a strong association between morning discharge and patient throughput in GIM. Given that there may be other downstream benefits of morning discharge, such as freeing beds for daytime surgeries,23 further research is needed to determine the effectiveness of specific interventions.
Several studies have posited morning discharge as a method of improving both patient care and hospital flow metrics.10,11,13-15,23 Quality improvement initiatives targeting morning discharges have included stakeholder meetings, incentives programs, discharge-centered breakfast programs, and creating deadlines for discharge orders.24-29 Although these initiatives have gained support, critics have suggested that their supporting evidence is not robust. Werthemier et al10 found a 9.0% reduction of observed to expected LOS associated with increasing the number of early discharges. However, a response article suggested that their findings were confounded by other hospital initiatives, such as allocation of medical and social services to weekends.30 Other observational studies have concluded that hospital LOS is not affected by the number of morning discharges, but this research has been limited by single-center analysis and relatively smaller sample sizes.12 Our study further calls into question the association between morning discharge and patient throughput.
An additional reason for the controversy is that physicians may actively work to discharge patients late in the day to avoid an additional night in hospital. A qualitative study by Minichiello et al31 evaluated staff perceptions regarding afternoon discharges. Physicians and medical students believed that afternoon discharges were a result of waiting for test results and procedures, with staff aiming to discharge patients immediately after obtaining results or finishing necessary procedures. As such, there are concerns that incentivizing morning discharge may lead physicians in the opposite direction, to consciously or unconsciously keep patients overnight in order to facilitate an early morning discharge.30
Our study’s greatest strength was the large sample size over 7 years at seven hospitals in two cities, including both academic and community hospitals with different models of care. To our knowledge, this is the first cohort study that has analyzed the association between early discharge and LOS using multiple centers. To avoid the confounding and reverse causality that may exist when examining the relationship between LOS and morning discharge at the patient level (eg, patients who stay in hospital longer may have more “planned” discharges and leave in the morning), we examined the association based on variation across different days within the GIM service of each hospital. Further, we included robust risk adjustment using clinical and laboratory data. Finally, since our study included a diverse patient population served by participating centers in a system with universal insurance for hospital care, our findings are likely generalizable to other urban and suburban hospitals.
There are several important limitations of our analysis. First, we could only include GIM patients, who represent nearly 40% of ED admissions to hospital at participating centers. A more holistic analysis across all hospital services could be justified; however, given that many quality improvement initiatives occur at the level of a single hospital service, we felt our approach would be informative for future research and improvement efforts. Approximately 75% of GIM patients at participating hospitals were cared for on a GIM ward, with 25% cared for on off-service units. We were unable to include the total hospital census in our models, and this could affect LOS and waiting times for GIM patients, particularly those admitted to off-service units. GIM census is likely highly correlated with hospital census, and we were able to adjust for this. Nevertheless, this remains an important potential source of unmeasured confounding. Second, we did not model the effects of morning discharges from GIM on patient-flow measures for non-GIM patients. Given the lack of effects for GIM patients, who would be more likely to be directly affected, it is unlikely that large effects would be seen for other hospital patients, but we did not measure effects on surgical delays or cancellations, for example.23 Third, we report 30-day readmission to GIM at participating hospitals only, rather than all readmissions. However, prior research in our region demonstrated that 82% of hospital readmissions occur to the same site.32 Thus, our measure, which includes admission to any participating hospital, likely captures more than 80% of all readmissions, and this was a secondary outcome in our analysis. Finally, qualitative metrics, such as patient or provider satisfaction, were not measured in our study. Earlier discharge may impact patient care in other ways by being more predictable for staff, improving bed allocation for daytime procedures, making medication pick-ups easier to arrange, or making consultations with allied health services more convenient.11,28,33 Conversely, if pressured to discharge before noon, providers may feel rushed to complete tasks and may face disruptions to typical workflow.24 As such, future research is needed to provide a more complete understanding of the impact of early-morning discharge beyond hospital flow.
CONCLUSION
The number of morning discharges was not significantly associated with shorter ED LOS or hospital LOS for GIM patients. Our observational findings suggest that increasing morning discharges alone may not substantially improve patient flow in GIM. Further research is needed to evaluate specific morning discharge interventions and assess hospital-wide effects.
1. Trzeciak S, Rivers EP. Emergency department overcrowding in the United States: an emerging threat to patient safety and public health. Emerg Med J. 2003;20(5):402-405. https://doi.org/10.1136/emj.20.5.402
2. McKenna P, Heslin SM, Viccellio P, Mallon WK, Hernandez C, Morley EJ. Emergency department and hospital crowding: causes, consequences, and cures. Clin Exp Emerg Med. 2019;6(3):189-195. https://doi.org/10.15441/ceem.18.022
3. Bernstein SL, Aronsky D, Duseja R, et al. The effect of emergency department crowding on clinically oriented outcomes. Acad Emerg Med. 2009;16(1):1-10. https://doi.org/10.1111/j.1553-2712.2008.00295.x
4. Derlet RW, Richards JR. Overcrowding in the nation’s emergency departments: complex causes and disturbing effects. Ann Emerg Med. 2000;35(1):63-68. https://doi.org/10.1016/s0196-0644(00)70105-3
5. Pines JM, Iyer S, Disbot M, Hollander JE, Shofer FS, Datner EM. The effect of emergency department crowding on patient satisfaction for admitted patients. Acad Emerg Med. 2008;15(9):825-831. https://doi.org/10.1111/j.1553-2712.2008.00200.x
6. Carter EJ, Pouch SM, Larson EL. The relationship between emergency department crowding and patient outcomes: a systematic review. J Nurs Scholarsh. 2014;46(2):106-115. https://doi.org/10.1111/jnu.1205
7. Bueno H, Ross JS, Wang Y, et al. Trends in length of stay and short-term outcomes among Medicare patients hospitalized for heart failure, 1993-2006. JAMA. 2010;303(21):2141-2147. https://doi.org/10.1001/jama.2010.748
8. Rotter T, Kinsman L, James E, et al. Clinical pathways: effects on professional practice, patient outcomes, length of stay and hospital costs. Cochrane Database Syst Rev. 2010;(3):Cd006632. https://doi.org/ 10.1002/14651858.CD006632.pub2
9. Zodda D, Underwood J. Improving emergency department throughput: evidence-based strategies aimed at reducing boarding and overcrowding. Phys Leadership J. 2019;6(3):70-73.
10. Wertheimer B, Jacobs REA, Bailey M, et al. Discharge before noon: an achievable hospital goal. J Hosp Med. 2014;9(4):210-214. https://doi.org/10.1002/jhm.2154
11. Kane M, Weinacker A, Arthofer R, et al. A multidisciplinary initiative to increase inpatient discharges before noon. J Nurs Adm. 2016;46(12):630-635. https://doi.org/10.1097/NNA.0000000000000418
12. Rajkomar A, Valencia V, Novelero M, Mourad M, Auerbach A. The association between discharge before noon and length of stay in medical and surgical patients. J Hosp Med. 2016;11(12):859-861. https://doi.org/10.1002/jhm.2529
13. Patel H, Morduchowicz S, Mourad M. Using a systematic framework of interventions to improve early discharges. Jt Comm J Qual Patient Saf. 2017;43(4):189-196. https://doi.org/10.1016/j.jcjq.2016.12.003
14. El-Eid GR, Kaddoum R, Tamim H, Hitti EA. Improving hospital discharge time: a successful implementation of Six Sigma methodology. Medicine (Baltimore). 2015;94(12):e633. https://doi.org/10.1097/MD.0000000000000633
15. Mathews KS, Corso P, Bacon S, Jenq GY. Using the red/yellow/green discharge tool to improve the timeliness of hospital discharges. Jt Comm J Qual Patient Saf. 2014;40(6):243-252. https://doi.org/10.1016/s1553-7250(14)40033-3
16. Verma AA, Pasricha SV, Jung HY, et al. Assessing the quality of clinical and administrative data extracted from hospitals: the General Medicine Inpatient Initiative (GEMINI) experience. J Am Med Inform Assoc. 2021; 28(3):578-587. doi: 10.1093/jamia/ocaa225.
17. Quan H, Li B, Couris CM, et al. Updating and validating the Charlson comorbidity index and score for risk adjustment in hospital discharge abstracts using data from 6 countries. Am J Epidemiol. 2011;173(60:676-682. https://doi.org/10.1093/aje/kwq433
18. Escobar GJ, Greene JD, Scheirer P, Gardner MN, Draper D, Kipnis P. Risk-adjusting hospital inpatient mortality using automated inpatient, outpatient, and laboratory databases. Med Care. 2008;46(3):232-239. https://doi.org/10.1097/MLR.0b013e3181589bb6
19. Austin PC. Using the standardized difference to compare the prevalence of a binary variable between two groups in observational research. Commun Stat Simul Comput. 2009;38(60:1228-1234. https://doi.org/10.1080/03610910902859574
20. van Walraven C, Escobar GJ, Greene JD, Forster AJ. The Kaiser Permanente inpatient risk adjustment methodology was valid in an external patient population. J Clin Epidemiol. 2010;63(7):798-803. https://doi.org/10.1016/j.jclinepi.2009.08.020
21. Hilbe JM. Negative binomial regression. In: Modeling Count Data. Cambridge University Press. 2014:126-160.
22. Harrell FE Jr. Regression Modeling Strategies: With Applications to Linear Models, Logistic and Ordinal Regression, and Survival Analysis. 2nd ed. Springer; 2015.
23. Durvasula R, Kayihan A, Del Bene S, et al. A multidisciplinary care pathway significantly increases the number of early morning discharges in a large academic medical center. Qual Manag Health Care. 2015;24(1):45-51. https://doi.org/10.1097/QMH.0000000000000049
24. Goolsarran N, Olowo G, Ling Y, Abbasi S, Taub E, Teressa G. Outcomes of a resident-led early hospital discharge intervention. J Gen Intern Med. 2020;35(2):437-443. https://doi.org/10.1007/s11606-019-05563-w
25. Beck MJ, Okerblom D, Kumar A, Bandyopadhyay S, Scalzi LV. Lean intervention improves patient discharge times, improves emergency department throughput and reduces congestion. Hosp Pract (1995). 2016;44(5):252-259. https://doi.org/10.1080/21548331.2016.1254559
26. Karling A, Tang KW. Discharge before noon: a study in a medical emergency ward. 2015. Accessed February 11, 2021. http://publications.lib.chalmers.se/records/fulltext/231873/231873.pdf
27. Mathews K, Corso P, Bacon S, Jenq GY. Using the red/yellow/green discharge tool to improve the timeliness of hospital discharges. Jt Comm J Qual Patient Saf. 2014;40(6):243-252. https://doi.org/10.1016/s1553-7250(14)40033-3
28. Goodson AS, DeGuzman, PB, Honeycutt A, Summy C, Manly F. Total joint replacement discharge brunch: meeting patient education needs and a hospital initiative of discharge by noon. Orthop Nurs. 2014;33(3):159-162. https://doi.org/10.1097/NOR.0000000000000048
29. Kravet SJ, Levine RB, Rubin HR, Wright SM. Discharging patients earlier in the day: a concept worth evaluating. Health Care Manag (Frederick). 2007;26(2):142-146. https://doi.org/10.1097/01.HCM.0000268617.33491.60
30. Shine D. Discharge before noon: an urban legend. Am J Med. 2015;128(5):445-446. https://doi.org/10.1016/j.amjmed.2014.12.011
31. Minichiello TM, Auerbach AD, Wachter RM. Caregiver perceptions of the reasons for delayed hospital discharge. Eff Clin Pract. 2001;4(6):250-255.
32. Staples JA, Thiruchelvam D, Redelmeier DA. Site of hospital readmission and mortality: a population-based retrospective cohort study. CMAJ Open. 2014;2:E77-E85. https://doi.org/10.9778/cmajo.20130053
33. Bowles KH, Foust JB, Naylor MD. Hospital discharge referral decision making: a multidisciplinary perspective. Appl Nurs Res. 2003;16(3):134-143. https://doi.org/10.1016/s0897-1897(03)00048-x
© 2021 Society of Hospital Medicine
A Resident-Led Intervention to Increase Initiation of Buprenorphine Maintenance for Hospitalized Patients With Opioid Use Disorder
Nearly 48,000 Americans died from overdoses involving opioids in 2018, continuing a national crisis that has led to 446,000 deaths since 1999.1 Annually, opioids are responsible for more than 500,000 admissions, approximately 1% of all hospitalizations, costing the United States nearly $15 billion.2,3 Among hospitalized patients, chronic opioid use is associated with increased mortality, severe infectious complications, and higher rates of readmission.4 Opioid use disorder (OUD) is a chronic, relapsing medical condition with biopsychosocial origins and significant morbidity and mortality.5 Opioid agonist therapy (OAT) with buprenorphine or methadone maintenance, the evidence-based standard of treatment, reduces the mortality rate by half, decreases overdoses and hospital readmissions, and improves retention in care.6-10
OAT maintenance refers to using buprenorphine or methadone for long-term treatment of OUD rather than for acute treatment of opioid withdrawal. Despite evidence supporting OAT maintenance, clinicians start medications for only 11% to 15% of hospitalized patients with OUD, depending on practice contexts.11,12 Three significant barriers—stigma, insufficient clinician education, and restrictive regulations—prevent clinicians from starting OAT.13 Clinicians who do not have the Drug Enforcement Administration (DEA)–issued DATA-2000 waiver (X-waiver) for outpatient prescribing can order buprenorphine for admitted patients but cannot prescribe it at discharge.14 In hospitals where they exist, addiction medicine consult services offer primary teams guidance on pharmacotherapy, leading to reduced hospital readmissions and increased engagement in outpatient addiction treatment.15-17 However, in most hospitals around the country, such specialty services do not exist.18 In some hospitals without addiction medicine consult services, hospitalists with expertise in OUD have started assisting primary teams in starting OAT, but to our knowledge, no prior studies have described the impact of these interventions on patients or clinician experience with OAT.19
This quality improvement project aimed to increase the rate at which internal medicine resident teams at Johns Hopkins Hospital (JHH) in Baltimore, Maryland, started hospitalized patients with OUD on buprenorphine maintenance. We hypothesized that resident education and measures to increase the availability of X-waivered physicians would increase the rate of initiating buprenorphine maintenance. We additionally hypothesized that these interventions would increase knowledge about and comfort with buprenorphine across the residency. This represents the first study to examine the effects of clinician education and a team of X-waivered residents and hospitalists who assist in starting buprenorphine maintenance in a hospital without an addiction medicine consult service.
METHODS
Setting
This study took place from July 2018 to June 2019 at JHH, a large, academic, urban hospital in Baltimore. Prior to the intervention, internal medicine residents at JHH commonly used short courses of buprenorphine to treat withdrawal, but they did not have access to hospital-specific resources to assist with starting maintenance OAT. During the study period, JHH had a Substance Use Disorders team staffed by peer recovery specialists that could be consulted by hospitalists and residents to provide psychosocial support and link admitted patients to treatment after discharge. There were no providers on the team to guide pharmacotherapy or to write discharge buprenorphine prescriptions. The Osler Medical Residency Training Program at JHH has 140 internal medicine residents and 16 combined medicine-pediatrics residents. All residents receive 1 hour of formal education about opioid use disorder annually. In addition, 28 of those 156 residents, those in the Urban Health Primary Care track, spend 1 month on an Addiction Medicine rotation in which they complete the 8-hour training required to receive the X-waiver. Those residents are encouraged to apply for the X-waiver once they obtain a medical license subsidized by a Health Resources & Services Administration (HRSA) grant. Four internal medicine attending physicians on teaching services and one resident had X-waivers prior to the intervention.
Intervention
In November 2018, we administered a survey to residents to identify barriers to starting buprenorphine maintenance and to measure knowledge and confidence with using buprenorphine for OUD (Appendix Figure 1 and Figure 2). We focused on buprenorphine because providers at JHH were familiar with this medication and because Baltimore has widespread access to buprenorphine, with more than 490 local buprenorphine providers.20 Five residents piloted the survey and provided feedback. We then administered the survey to all internal medicine and medicine-pediatrics residents. Based on the results, we developed a targeted educational conference and also created the Buprenorphine Bridge Team (BBT).
In January 2019, we presented the educational conference for residents devoted to the use of buprenorphine for OUD and introduced the BBT. The conference started with a patient testimonial and included peer recovery specialists, pharmacists, nurses, and social workers. We summarized the evidence for buprenorphine and offered a practical guide to start treatment in a one-page protocol. This protocol included guidance on selecting patients, shared decision-making around OUD treatment, avoiding precipitated withdrawal, dosing buprenorphine, and establishing follow-up (Appendix Figure 3). We asked for input on this protocol from nursing leadership, social work teams, and peer recovery specialists. Dosing was adapted from the Guidelines from the American Society of Addiction Medicine, with expert input from physicians from the Addiction Medicine Consult service at Johns Hopkins Bayview Medical Center, also in Baltimore.5 We instructed residents to obtain discharge buprenorphine prescriptions from an X-waivered physician on their team or from the newly established BBT. We asked resident teams to set up a postdischarge appointment for patients with an X-waivered provider, either in a community practice or at the JHH After Care Clinic, a transitional care clinic for discharged patients.21
The BBT is a resident-led group of X-waivered JHH residents and hospitalists who volunteer to write discharge buprenorphine prescriptions for patients. The BBT serves to ensure primary teams have access to an X-waivered prescriber. It is not a consult service. We asked primary teams to contact the BBT after initiating buprenorphine and after securing a follow-up appointment. In response to each request, a member of the BBT reviews the patient chart, confirms the follow-up plan, writes a prescription for buprenorphine along with intranasal naloxone, and leaves a brief note. During the 6-month postintervention period, the team consisted of three residents and three hospitalist attendings. Each week, two members (residents or attendings) staffed the team Monday to Friday, 8
In May 2019, 5 months after the education session and implementation of the BBT, we administered a follow-up survey.
Outcomes
As a secondary outcome, we measured engagement in OUD treatment after discharge by calculating the proportion of patients started on buprenorphine who filled a buprenorphine prescription within 30 days after discharge. We chose 30 days based on the National Committee for Quality Assurance’s Healthcare Effectiveness Data and Information Set (HEDIS) measure for engagement of treatment for alcohol and other drugs.23 We obtained the data from the Chesapeake Regional Information System for our Patients (CRISP) Prescription Drug Monitoring Program, which monitors all prescriptions for controlled substances dispensed in Maryland and five neighboring states. As a balancing measure, we counted patients newly started on methadone maintenance for OUD before and after the intervention. Additional secondary process outcomes included frequency of BBT requests, the volume of buprenorphine prescriptions written by the team, and time required to complete a BBT request.
Clinician-level outcomes, measured with electronically administered pre- and postintervention surveys to residents, included knowledge about and comfort with buprenorphine. Of the 16 questions in the pre- and postimplementation surveys, we analyzed the 6 questions concerning knowledge and comfort that remained identical in the pre- and postintervention surveys and used 5-point Likert scale responses. As an incentive, we randomly distributed three $50 gift cards to survey completers.
Analysis
We used an interrupted time series analysis to evaluate the association between the intervention bundle and a change in the rate that medical teams started patients with OUD on buprenorphine maintenance. This approach allowed us to control for preintervention trends. To evaluate the impact of our interventions, our pre- and postintervention periods include the same residents during the 2018-2019 academic year. Both periods consisted of twelve 2-week intervals (preintervention: July 26, 2019, to January 9, 2019; postintervention: January 10, 2019, to June 26, 2019).
To evaluate for changes in engagement in OUD treatment after discharge, we used two-sample t tests. To evaluate for changes in resident-reported comfort and knowledge with initiating buprenorphine maintenance, we used Wilcoxon rank sum tests for survey data and Wilcoxon signed rank tests for paired data. All analyses employed two-sided P values with statistical significance evaluated at the .05 alpha level. We analyzed data using R version 3.6.3 (Foundation for Statistical Computing). The Institutional Review Board at JHH reviewed and approved the study protocol as a quality improvement project (IRB00193365).

Before the intervention, 13 of the 30 patients (40%) newly started on buprenorphine maintenance during their admission filled a follow-up buprenorphine prescription within 30 days of discharge. After the intervention, 31 of 64 patients (46%) filled a buprenorphine prescription within 30 days (P = .612). Two patients were started on methadone maintenance, one prior to and one after the intervention.
During the 6-month postintervention period, the BBT received 75 requests and wrote 70 prescriptions for buprenorphine. The median time required to complete a BBT request was 15 minutes (minimum, 5 minutes; maximum, 60 minutes).
Of 156 internal medicine and medicine-pediatrics residents, 89 residents (57%) completed the baseline survey and 66 residents (42%) completed the follow-up survey. Forty residents completed both surveys. After the intervention, residents were significantly more likely to feel comfortable dosing buprenorphine (P < .0001) and counseling patients about its use (P = .0237) and were more likely to report ease of establishing follow-up (P < .0001). Self-reported knowledge about preventing precipitated withdrawal increased significantly (P = .0191), as did knowledge about the effectiveness of buprenorphine (P = .0003) independent of formal drug counseling (P = .0066) (Table). Paired survey data also found statistically significant results for all questions except those about preventing precipitated withdrawal and efficacy. For the latter, respondents who completed both surveys were more knowledgeable before the intervention than the overall group that completed the baseline survey (Appendix Table).

This study shows how a resident-led quality improvement project comprising clinician education and implementation of a novel BBT was associated with an increased rate of starting buprenorphine maintenance in hospitalized patients with OUD and improved resident knowledge about and comfort with buprenorphine. To our knowledge, this is the first study demonstrating how education and a team of X-waivered generalists can help primary teams initiate and discharge patients on buprenorphine maintenance in a hospital without an addiction medicine consult service.
Prior to the intervention, resident internal medicine teams at JHH started 10% of hospitalized patients with OUD on buprenorphine maintenance, consistent with prior studies showing rates of 11% to 15% for initiating OAT for hospitalized patients.11,12 After the intervention, the rate of initiating buprenorphine maintenance more than doubled, rising to 24% of eligible patients. Resident internal medicine teams at JHH started buprenorphine maintenance for 37 more patients over the 24-week postintervention period than would have been predicted prior to the intervention, or an additional three patients every 2 weeks.
Between 40% and 46% of hospitalized patients newly started on buprenorphine maintenance filled an outpatient buprenorphine prescription within 30 days of discharge. We are not aware of comparative data for 30-day follow-up for hospitalized patients newly started on buprenorphine maintenance. Data from other contexts show 5% to 10% of veterans were engaged in addiction treatment 30 days after initiation from inpatient or outpatient encounters. An analysis of an academic medical center in Oregon found engagement with an addiction medicine consult service increased after hospital engagement for patients with any substance use disorder from 23% to 39% using the 34-day HEDIS measure for engagement.17,24,25
The BBT required approximately 15 minutes per request and wrote an average of three prescriptions per week, demonstrating the feasibility of this approach and the high demand for this service. One strength of our approach is that residents gained experience starting buprenorphine independently using the aforementioned protocol instead of deferring to a full consult service. It is likely that this resident engagement in initiating longitudinal OUD care contributed to the success of this initiative, as did existing resident familiarity with using buprenorphine for opioid withdrawal.
This approach to resident education—promoting direct, first-person experience with medications in a clinical context—aligns with recommendations from a recent review about substance use disorder education for health professionals.26 Our interventions increased resident knowledge and comfort with buprenorphine, consistent with prior studies showing increased resident confidence in management of substance use disorders after curricular innovations.24,25
A few contextual features were essential for this project’s viability. Maryland allows American medical graduates to obtain a medical license after 1 year of postgraduate training. This allowed three residents to obtain X-waivers. These residents had access to HRSA funding to subsidize the expenses of applying for state licensure and DEA registration. BBT members volunteered their time while working on other services. Last, we were able to take advantage of buprenorphine-providing clinics in Baltimore, including the JHH After Care Clinic, to accept patients for follow-up appointments after discharge.
Limitations
The BBT required motivated clinicians willing to volunteer for additional clinical responsibilities during inpatient rotations and supportive faculty and residency leadership. Attending physicians, nurse practitioners, or physician assistants could staff a similar BBT in hospitals without residents or in hospitals where residents cannot obtain DEA registration. Crucially, other hospitals may not have access to practices with X-waivered physicians for outpatient follow-up. A recent study found X-waivered primary care physicians were less likely to be affiliated with hospital health systems. Other studies have shown limitations in access to buprenorphine at the county level based on geography and racial/ethnic segregation.27-29
Most patients hospitalized with OUD did not have ICD-10 codes associated with OUD. We addressed this by assuming patients had OUD if buprenorphine or methadone was ordered during their hospitalization, even if the medication was never administered. This may have overcounted patients prescribed these medications for indications other than OUD, and it may have undercounted patients with OUD for whom buprenorphine or methadone were never considered. The opioid withdrawal order set at JHH automatically offers an option to use buprenorphine to treat withdrawal. Patients with OUD for whom buprenorphine or methadone were never ordered likely did not experience withdrawal or were in withdrawal so mild that it escaped the attention of the team, which limits the generalizability of our intervention.
We identified several limitations to the internal validity of our study. First, we used a before-and-after study design without a control group. We could not ethically withhold access to evidence-based, mortality-reducing medications from patients. Without a control group, we cannot rule out the possibility that underlying temporal trends made residents more likely to start buprenorphine maintenance independent of our intervention. We attempted to control for unmeasured confounders by using an interrupted time series analysis to control for preintervention trends, comparing the same group of residents before and after our interventions, and selecting an intervention period during which residents were given only educational sessions and materials provided by our team. Our results may be biased by clustered data because certain residents may have been more likely to initiate buprenorphine, but these effects are likely marginal because resident schedules are balanced between outpatient and inpatient rotations during each 6-month period.
Finally, this project focused on buprenorphine, not on other medications for OUD, including methadone or naltrexone, or nonpharmacologic treatments for OUD.
Sustainability and Next Steps
Since the start of the BBT in January 2019, five additional PGY-2 residents obtained their medical licenses and X-waivers. These residents, with the support of two attending hospitalists, led the BBT and coordinated education sessions that were incorporated into the curriculum during the 2019-2020 academic year. These educational sessions will continue indefinitely. In 2020, JHH started an Addiction Medicine Consult Service staffed by physicians, NPs, and a pharmacist. The BBT continues to operate in conjunction with this service.
We found substantial variability in the rate of buprenorphine maintenance initiation despite our interventions. This is an area for future improvement. In a free-response prompt in our follow-up survey, residents requested additional education sessions and an order set to assist with initiation of buprenorphine. To address these gaps, three educational sessions were added, one of which included education on starting methadone maintenance therapy. We also added a new order set for starting buprenorphine maintenance. We hypothesize that these interventions will improve consistency.
In order for a similar program to be disseminated to other institutions, educational initiatives and a team of dedicated X-waivered prescribers are key. Materials to assist with this process are available in the Appendix.
CONCLUSION
This study shows how a resident-led intervention comprising clinician education and a team of X-waivered generalists was associated with improved treatment of OUD for hospitalized patients. We encourage residents and all clinicians at other hospitals without addiction medicine consult services to design, implement, and study similar interventions that directly increase the use of buprenorphine or methadone maintenance to treat OUD.
Preliminary results from this project were presented at the AMERSA National Conference on November 7, 2019.
1. Wilson N, Kariisa M, Seth P, Iv HS, Davis NL. Drug and opioid-involved overdose deaths – United States, 2017–2018. MMWR Morb Mortal Wkly Rep. 2020;69(11):290-297. http://dx.doi.org/10.15585/mmwr.mm6911a4
2. Berk J, Rogers KM, Wilson DJ, Thakrar A, Feldman L. Missed opportunities for treatment of opioid use disorder in the hospital setting: updating an outdated policy. J Hosp Med. 2020;15(10):619-621. https://doi.org/10.12788/jhm.3352
3. Ronan MV, Herzig SJ. Hospitalizations related to opioid abuse/dependence and associated serious infections increased sharply, 2002–12. Health Aff (Millwood). 2016;35(5):832-837. https://doi.org/10.1377/hlthaff.2015.1424
4. Mosher HJ, Jiang L, Vaughan Sarrazin MS, Cram P, Kaboli PJ, Vander Weg MW. Prevalence and characteristics of hospitalized adults on chronic opioid therapy. J Hosp Med. 2014;9(2):82-87. https://doi.org/10.1002/jhm.2113
5. Crotty K, Freedman KI, Kampman KM. Executive summary of the focused update of the ASAM national practice guideline for the treatment of opioid use disorder. J Addict Med. 2020;14(2):99-112. https://doi.org/10.1097/adm.0000000000000635
6. Leshner AI, Mancher M, eds. Medications for Opioid Use Disorder Save Lives. The National Academies Press; 2019. https://www.nap.edu/catalog/25310
7. Sordo L, Barrio G, Bravo MJ, et al. Mortality risk during and after opioid substitution treatment: systematic review and meta-analysis of cohort studies. BMJ. 2017;357: j1550. https://doi.org/10.1136/bmj.j1550
8. Larochelle MR, Bernson D, Land T, et al. Medication for opioid use disorder after nonfatal opioid overdose and association with mortality. Ann Intern Med. 2018;169(3):137-145. https://dx.doi.org/10.7326%2FM17-3107
9. Schuckit MA. Treatment of opioid-use disorders. N Engl J Med. 2016;375(4):357-368. https://doi.org/10.1056/nejmra1604339
10. Moreno JL, Wakeman SE, Duprey MS, Roberts RJ, Jacobson JS, Devlin JW. Predictors for 30-day and 90-day hospital readmission among patients with opioid use disorder. J Addict Med. 2019;13(4):306-313. https://doi.org/10.1097/adm.0000000000000499
11. Rosenthal ES, Karchmer AW, Theisen-Toupal J, Castillo RA, Rowley CF. Suboptimal addiction interventions for patients hospitalized with injection drug use-associated infective endocarditis. Am J Med. 2016;129(5):481-485. https://doi.org/10.1016/j.amjmed.2015.09.024
12. Priest KC, Lovejoy TI, Englander H, Shull S, McCarty D. Opioid agonist therapy during hospitalization within the Veterans Health Administration: a pragmatic retrospective cohort analysis. J Gen Intern Med. 2020;35(8):2365-2374. https://doi.org/10.1007/s11606-020-05815-0
13. Madras BK, Ahmad NJ, Wen J, Sharfstein J; Prevention, Treatment, and Recovery Working Group of the Action Collaborative on Countering the U.S. Opioid Epidemic. Improving access to evidence-based medical treatment for opioid use disorder: strategies to address key barriers within the treatment system. NAM Perspectives. April 27, 2020. https://doi.org/10.31478/202004b
14. Fiscella K, Wakeman SE, Beletsky L. Buprenorphine deregulation and mainstreaming treatment for opioid use disorder: x the X Waiver. JAMA Psychiatry. 2019;76(3):229-230. https://doi.org/10.1001/jamapsychiatry.2018.3685
15. Priest KC, McCarty D. Role of the hospital in the 21st century opioid overdose epidemic: the addiction medicine consult service. J Addict Med. 2019;13(2):104-112. https://doi.org/10.1097/adm.0000000000000496
16. Weimer M, Morford K, Donroe J. Treatment of opioid use disorder in the acute hospital setting: a critical review of the literature (2014–2019). Curr Addict Rep. 2019;6(4):339-354.
17. Englander H, Dobbertin K, Lind BK, et al. Inpatient addiction medicine consultation and post-hospital substance use disorder treatment engagement: a propensity-matched analysis. J Gen Intern Med. 2019;34(12):2796-2803. https://doi.org/10.1007/s11606-019-05251-9
18. Englander H, Priest KC, Snyder H, Martin M, Calcaterra S, Gregg J. A call to action: hospitalists’ role in addressing substance use disorder. J Hosp Med. 2019;14(3):E1-E4. https://doi.org/10.12788/jhm.3311
19. Bottner R, Moriates C, Tirado C. The role of hospitalists in treating opioid use disorder. J Addict Med. 2020;14(2):178. https://doi.org/10.1097/adm.0000000000000545
20. Behavioral health treatment services locator. Substance Abuse and Mental Health Services Administration. Accessed May 14, 2020. https://findtreatment.samhsa.gov/
21. Groesbeck K, Whiteman LN, Stewart RW. Reducing readmission rates by improving transitional care. South Med J. 2015;108(12):758-760. https://doi.org/10.14423/smj.0000000000000376
22. Heslin KC, Owens PL, Karaca Z, Barrett ML, Moore BJ, Elixhauser A. Trends in opioid-related inpatient stays shifted after the US transitioned to ICD-10-CM diagnosis coding in 2015 Med Care. 2017;55(11):918-923. https://doi.org/10.1097/mlr.0000000000000805
23. Initiation and engagement of alcohol and other drug abuse or dependence treatment (IET). NCQA. Accessed April 20, 2020. https://www.ncqa.org/hedis/measures/initiation-and-engagement-of-alcohol-and-other-drug-abuse-or-dependence-treatment/
24. Wyse JJ, Robbins JL, McGinnis KA, et al. Predictors of timely opioid agonist treatment initiation among veterans with and without HIV. Drug Alcohol Depend. 2019;198:70-75. https://doi.org/10.1016/j.drugalcdep.2019.01.038
25. Harris AHS, Humphreys K, Finney JW. Veterans Affairs facility performance on Washington Circle indicators and casemix-adjusted effectiveness. J Subst Abuse Treat. 2007;33(4):333-339. https://doi.org/10.1016/j.jsat.2006.12.015
26. Muzyk A, Smothers ZPW, Andolsek KM, et al. Interprofessional substance use disorder education in health professions education programs: a scoping review. Acad Med. 2020;95(3):470-480. https://doi.org/10.1097/acm.0000000000003053
27. Saloner B, Lin L, Simon K. Geographic location of buprenorphine-waivered physicians and integration with health systems. J Subst Abuse Treat. 2020;115:108034. https://doi.org/10.1016/j.jsat.2020.108034
28. Jones CW, Christman Z, Smith CM, et al. Comparison between buprenorphine provider availability and opioid deaths among US counties. J Subst Abuse Treat. 2018;93:19-25. https://doi.org/10.1016/j.jsat.2018.07.008
29. Goedel WC, Shapiro A, Cerdá M, Tsai JW, Hadland SE, Marshall BDL. Association of racial/ethnic segregation with treatment capacity for opioid use disorder in counties in the United States. JAMA Netw Open. 2020;3(4):e203711. https://doi.org/10.1001/jamanetworkopen.2020.3711
Nearly 48,000 Americans died from overdoses involving opioids in 2018, continuing a national crisis that has led to 446,000 deaths since 1999.1 Annually, opioids are responsible for more than 500,000 admissions, approximately 1% of all hospitalizations, costing the United States nearly $15 billion.2,3 Among hospitalized patients, chronic opioid use is associated with increased mortality, severe infectious complications, and higher rates of readmission.4 Opioid use disorder (OUD) is a chronic, relapsing medical condition with biopsychosocial origins and significant morbidity and mortality.5 Opioid agonist therapy (OAT) with buprenorphine or methadone maintenance, the evidence-based standard of treatment, reduces the mortality rate by half, decreases overdoses and hospital readmissions, and improves retention in care.6-10
OAT maintenance refers to using buprenorphine or methadone for long-term treatment of OUD rather than for acute treatment of opioid withdrawal. Despite evidence supporting OAT maintenance, clinicians start medications for only 11% to 15% of hospitalized patients with OUD, depending on practice contexts.11,12 Three significant barriers—stigma, insufficient clinician education, and restrictive regulations—prevent clinicians from starting OAT.13 Clinicians who do not have the Drug Enforcement Administration (DEA)–issued DATA-2000 waiver (X-waiver) for outpatient prescribing can order buprenorphine for admitted patients but cannot prescribe it at discharge.14 In hospitals where they exist, addiction medicine consult services offer primary teams guidance on pharmacotherapy, leading to reduced hospital readmissions and increased engagement in outpatient addiction treatment.15-17 However, in most hospitals around the country, such specialty services do not exist.18 In some hospitals without addiction medicine consult services, hospitalists with expertise in OUD have started assisting primary teams in starting OAT, but to our knowledge, no prior studies have described the impact of these interventions on patients or clinician experience with OAT.19
This quality improvement project aimed to increase the rate at which internal medicine resident teams at Johns Hopkins Hospital (JHH) in Baltimore, Maryland, started hospitalized patients with OUD on buprenorphine maintenance. We hypothesized that resident education and measures to increase the availability of X-waivered physicians would increase the rate of initiating buprenorphine maintenance. We additionally hypothesized that these interventions would increase knowledge about and comfort with buprenorphine across the residency. This represents the first study to examine the effects of clinician education and a team of X-waivered residents and hospitalists who assist in starting buprenorphine maintenance in a hospital without an addiction medicine consult service.
METHODS
Setting
This study took place from July 2018 to June 2019 at JHH, a large, academic, urban hospital in Baltimore. Prior to the intervention, internal medicine residents at JHH commonly used short courses of buprenorphine to treat withdrawal, but they did not have access to hospital-specific resources to assist with starting maintenance OAT. During the study period, JHH had a Substance Use Disorders team staffed by peer recovery specialists that could be consulted by hospitalists and residents to provide psychosocial support and link admitted patients to treatment after discharge. There were no providers on the team to guide pharmacotherapy or to write discharge buprenorphine prescriptions. The Osler Medical Residency Training Program at JHH has 140 internal medicine residents and 16 combined medicine-pediatrics residents. All residents receive 1 hour of formal education about opioid use disorder annually. In addition, 28 of those 156 residents, those in the Urban Health Primary Care track, spend 1 month on an Addiction Medicine rotation in which they complete the 8-hour training required to receive the X-waiver. Those residents are encouraged to apply for the X-waiver once they obtain a medical license subsidized by a Health Resources & Services Administration (HRSA) grant. Four internal medicine attending physicians on teaching services and one resident had X-waivers prior to the intervention.
Intervention
In November 2018, we administered a survey to residents to identify barriers to starting buprenorphine maintenance and to measure knowledge and confidence with using buprenorphine for OUD (Appendix Figure 1 and Figure 2). We focused on buprenorphine because providers at JHH were familiar with this medication and because Baltimore has widespread access to buprenorphine, with more than 490 local buprenorphine providers.20 Five residents piloted the survey and provided feedback. We then administered the survey to all internal medicine and medicine-pediatrics residents. Based on the results, we developed a targeted educational conference and also created the Buprenorphine Bridge Team (BBT).
In January 2019, we presented the educational conference for residents devoted to the use of buprenorphine for OUD and introduced the BBT. The conference started with a patient testimonial and included peer recovery specialists, pharmacists, nurses, and social workers. We summarized the evidence for buprenorphine and offered a practical guide to start treatment in a one-page protocol. This protocol included guidance on selecting patients, shared decision-making around OUD treatment, avoiding precipitated withdrawal, dosing buprenorphine, and establishing follow-up (Appendix Figure 3). We asked for input on this protocol from nursing leadership, social work teams, and peer recovery specialists. Dosing was adapted from the Guidelines from the American Society of Addiction Medicine, with expert input from physicians from the Addiction Medicine Consult service at Johns Hopkins Bayview Medical Center, also in Baltimore.5 We instructed residents to obtain discharge buprenorphine prescriptions from an X-waivered physician on their team or from the newly established BBT. We asked resident teams to set up a postdischarge appointment for patients with an X-waivered provider, either in a community practice or at the JHH After Care Clinic, a transitional care clinic for discharged patients.21
The BBT is a resident-led group of X-waivered JHH residents and hospitalists who volunteer to write discharge buprenorphine prescriptions for patients. The BBT serves to ensure primary teams have access to an X-waivered prescriber. It is not a consult service. We asked primary teams to contact the BBT after initiating buprenorphine and after securing a follow-up appointment. In response to each request, a member of the BBT reviews the patient chart, confirms the follow-up plan, writes a prescription for buprenorphine along with intranasal naloxone, and leaves a brief note. During the 6-month postintervention period, the team consisted of three residents and three hospitalist attendings. Each week, two members (residents or attendings) staffed the team Monday to Friday, 8
In May 2019, 5 months after the education session and implementation of the BBT, we administered a follow-up survey.
Outcomes
As a secondary outcome, we measured engagement in OUD treatment after discharge by calculating the proportion of patients started on buprenorphine who filled a buprenorphine prescription within 30 days after discharge. We chose 30 days based on the National Committee for Quality Assurance’s Healthcare Effectiveness Data and Information Set (HEDIS) measure for engagement of treatment for alcohol and other drugs.23 We obtained the data from the Chesapeake Regional Information System for our Patients (CRISP) Prescription Drug Monitoring Program, which monitors all prescriptions for controlled substances dispensed in Maryland and five neighboring states. As a balancing measure, we counted patients newly started on methadone maintenance for OUD before and after the intervention. Additional secondary process outcomes included frequency of BBT requests, the volume of buprenorphine prescriptions written by the team, and time required to complete a BBT request.
Clinician-level outcomes, measured with electronically administered pre- and postintervention surveys to residents, included knowledge about and comfort with buprenorphine. Of the 16 questions in the pre- and postimplementation surveys, we analyzed the 6 questions concerning knowledge and comfort that remained identical in the pre- and postintervention surveys and used 5-point Likert scale responses. As an incentive, we randomly distributed three $50 gift cards to survey completers.
Analysis
We used an interrupted time series analysis to evaluate the association between the intervention bundle and a change in the rate that medical teams started patients with OUD on buprenorphine maintenance. This approach allowed us to control for preintervention trends. To evaluate the impact of our interventions, our pre- and postintervention periods include the same residents during the 2018-2019 academic year. Both periods consisted of twelve 2-week intervals (preintervention: July 26, 2019, to January 9, 2019; postintervention: January 10, 2019, to June 26, 2019).
To evaluate for changes in engagement in OUD treatment after discharge, we used two-sample t tests. To evaluate for changes in resident-reported comfort and knowledge with initiating buprenorphine maintenance, we used Wilcoxon rank sum tests for survey data and Wilcoxon signed rank tests for paired data. All analyses employed two-sided P values with statistical significance evaluated at the .05 alpha level. We analyzed data using R version 3.6.3 (Foundation for Statistical Computing). The Institutional Review Board at JHH reviewed and approved the study protocol as a quality improvement project (IRB00193365).
Before the intervention, 13 of the 30 patients (40%) newly started on buprenorphine maintenance during their admission filled a follow-up buprenorphine prescription within 30 days of discharge. After the intervention, 31 of 64 patients (46%) filled a buprenorphine prescription within 30 days (P = .612). Two patients were started on methadone maintenance, one prior to and one after the intervention.
During the 6-month postintervention period, the BBT received 75 requests and wrote 70 prescriptions for buprenorphine. The median time required to complete a BBT request was 15 minutes (minimum, 5 minutes; maximum, 60 minutes).
Of 156 internal medicine and medicine-pediatrics residents, 89 residents (57%) completed the baseline survey and 66 residents (42%) completed the follow-up survey. Forty residents completed both surveys. After the intervention, residents were significantly more likely to feel comfortable dosing buprenorphine (P < .0001) and counseling patients about its use (P = .0237) and were more likely to report ease of establishing follow-up (P < .0001). Self-reported knowledge about preventing precipitated withdrawal increased significantly (P = .0191), as did knowledge about the effectiveness of buprenorphine (P = .0003) independent of formal drug counseling (P = .0066) (Table). Paired survey data also found statistically significant results for all questions except those about preventing precipitated withdrawal and efficacy. For the latter, respondents who completed both surveys were more knowledgeable before the intervention than the overall group that completed the baseline survey (Appendix Table).
This study shows how a resident-led quality improvement project comprising clinician education and implementation of a novel BBT was associated with an increased rate of starting buprenorphine maintenance in hospitalized patients with OUD and improved resident knowledge about and comfort with buprenorphine. To our knowledge, this is the first study demonstrating how education and a team of X-waivered generalists can help primary teams initiate and discharge patients on buprenorphine maintenance in a hospital without an addiction medicine consult service.
Prior to the intervention, resident internal medicine teams at JHH started 10% of hospitalized patients with OUD on buprenorphine maintenance, consistent with prior studies showing rates of 11% to 15% for initiating OAT for hospitalized patients.11,12 After the intervention, the rate of initiating buprenorphine maintenance more than doubled, rising to 24% of eligible patients. Resident internal medicine teams at JHH started buprenorphine maintenance for 37 more patients over the 24-week postintervention period than would have been predicted prior to the intervention, or an additional three patients every 2 weeks.
Between 40% and 46% of hospitalized patients newly started on buprenorphine maintenance filled an outpatient buprenorphine prescription within 30 days of discharge. We are not aware of comparative data for 30-day follow-up for hospitalized patients newly started on buprenorphine maintenance. Data from other contexts show 5% to 10% of veterans were engaged in addiction treatment 30 days after initiation from inpatient or outpatient encounters. An analysis of an academic medical center in Oregon found engagement with an addiction medicine consult service increased after hospital engagement for patients with any substance use disorder from 23% to 39% using the 34-day HEDIS measure for engagement.17,24,25
The BBT required approximately 15 minutes per request and wrote an average of three prescriptions per week, demonstrating the feasibility of this approach and the high demand for this service. One strength of our approach is that residents gained experience starting buprenorphine independently using the aforementioned protocol instead of deferring to a full consult service. It is likely that this resident engagement in initiating longitudinal OUD care contributed to the success of this initiative, as did existing resident familiarity with using buprenorphine for opioid withdrawal.
This approach to resident education—promoting direct, first-person experience with medications in a clinical context—aligns with recommendations from a recent review about substance use disorder education for health professionals.26 Our interventions increased resident knowledge and comfort with buprenorphine, consistent with prior studies showing increased resident confidence in management of substance use disorders after curricular innovations.24,25
A few contextual features were essential for this project’s viability. Maryland allows American medical graduates to obtain a medical license after 1 year of postgraduate training. This allowed three residents to obtain X-waivers. These residents had access to HRSA funding to subsidize the expenses of applying for state licensure and DEA registration. BBT members volunteered their time while working on other services. Last, we were able to take advantage of buprenorphine-providing clinics in Baltimore, including the JHH After Care Clinic, to accept patients for follow-up appointments after discharge.
Limitations
The BBT required motivated clinicians willing to volunteer for additional clinical responsibilities during inpatient rotations and supportive faculty and residency leadership. Attending physicians, nurse practitioners, or physician assistants could staff a similar BBT in hospitals without residents or in hospitals where residents cannot obtain DEA registration. Crucially, other hospitals may not have access to practices with X-waivered physicians for outpatient follow-up. A recent study found X-waivered primary care physicians were less likely to be affiliated with hospital health systems. Other studies have shown limitations in access to buprenorphine at the county level based on geography and racial/ethnic segregation.27-29
Most patients hospitalized with OUD did not have ICD-10 codes associated with OUD. We addressed this by assuming patients had OUD if buprenorphine or methadone was ordered during their hospitalization, even if the medication was never administered. This may have overcounted patients prescribed these medications for indications other than OUD, and it may have undercounted patients with OUD for whom buprenorphine or methadone were never considered. The opioid withdrawal order set at JHH automatically offers an option to use buprenorphine to treat withdrawal. Patients with OUD for whom buprenorphine or methadone were never ordered likely did not experience withdrawal or were in withdrawal so mild that it escaped the attention of the team, which limits the generalizability of our intervention.
We identified several limitations to the internal validity of our study. First, we used a before-and-after study design without a control group. We could not ethically withhold access to evidence-based, mortality-reducing medications from patients. Without a control group, we cannot rule out the possibility that underlying temporal trends made residents more likely to start buprenorphine maintenance independent of our intervention. We attempted to control for unmeasured confounders by using an interrupted time series analysis to control for preintervention trends, comparing the same group of residents before and after our interventions, and selecting an intervention period during which residents were given only educational sessions and materials provided by our team. Our results may be biased by clustered data because certain residents may have been more likely to initiate buprenorphine, but these effects are likely marginal because resident schedules are balanced between outpatient and inpatient rotations during each 6-month period.
Finally, this project focused on buprenorphine, not on other medications for OUD, including methadone or naltrexone, or nonpharmacologic treatments for OUD.
Sustainability and Next Steps
Since the start of the BBT in January 2019, five additional PGY-2 residents obtained their medical licenses and X-waivers. These residents, with the support of two attending hospitalists, led the BBT and coordinated education sessions that were incorporated into the curriculum during the 2019-2020 academic year. These educational sessions will continue indefinitely. In 2020, JHH started an Addiction Medicine Consult Service staffed by physicians, NPs, and a pharmacist. The BBT continues to operate in conjunction with this service.
We found substantial variability in the rate of buprenorphine maintenance initiation despite our interventions. This is an area for future improvement. In a free-response prompt in our follow-up survey, residents requested additional education sessions and an order set to assist with initiation of buprenorphine. To address these gaps, three educational sessions were added, one of which included education on starting methadone maintenance therapy. We also added a new order set for starting buprenorphine maintenance. We hypothesize that these interventions will improve consistency.
In order for a similar program to be disseminated to other institutions, educational initiatives and a team of dedicated X-waivered prescribers are key. Materials to assist with this process are available in the Appendix.
CONCLUSION
This study shows how a resident-led intervention comprising clinician education and a team of X-waivered generalists was associated with improved treatment of OUD for hospitalized patients. We encourage residents and all clinicians at other hospitals without addiction medicine consult services to design, implement, and study similar interventions that directly increase the use of buprenorphine or methadone maintenance to treat OUD.
Preliminary results from this project were presented at the AMERSA National Conference on November 7, 2019.
1. Wilson N, Kariisa M, Seth P, Iv HS, Davis NL. Drug and opioid-involved overdose deaths – United States, 2017–2018. MMWR Morb Mortal Wkly Rep. 2020;69(11):290-297. http://dx.doi.org/10.15585/mmwr.mm6911a4
2. Berk J, Rogers KM, Wilson DJ, Thakrar A, Feldman L. Missed opportunities for treatment of opioid use disorder in the hospital setting: updating an outdated policy. J Hosp Med. 2020;15(10):619-621. https://doi.org/10.12788/jhm.3352
3. Ronan MV, Herzig SJ. Hospitalizations related to opioid abuse/dependence and associated serious infections increased sharply, 2002–12. Health Aff (Millwood). 2016;35(5):832-837. https://doi.org/10.1377/hlthaff.2015.1424
4. Mosher HJ, Jiang L, Vaughan Sarrazin MS, Cram P, Kaboli PJ, Vander Weg MW. Prevalence and characteristics of hospitalized adults on chronic opioid therapy. J Hosp Med. 2014;9(2):82-87. https://doi.org/10.1002/jhm.2113
5. Crotty K, Freedman KI, Kampman KM. Executive summary of the focused update of the ASAM national practice guideline for the treatment of opioid use disorder. J Addict Med. 2020;14(2):99-112. https://doi.org/10.1097/adm.0000000000000635
6. Leshner AI, Mancher M, eds. Medications for Opioid Use Disorder Save Lives. The National Academies Press; 2019. https://www.nap.edu/catalog/25310
7. Sordo L, Barrio G, Bravo MJ, et al. Mortality risk during and after opioid substitution treatment: systematic review and meta-analysis of cohort studies. BMJ. 2017;357: j1550. https://doi.org/10.1136/bmj.j1550
8. Larochelle MR, Bernson D, Land T, et al. Medication for opioid use disorder after nonfatal opioid overdose and association with mortality. Ann Intern Med. 2018;169(3):137-145. https://dx.doi.org/10.7326%2FM17-3107
9. Schuckit MA. Treatment of opioid-use disorders. N Engl J Med. 2016;375(4):357-368. https://doi.org/10.1056/nejmra1604339
10. Moreno JL, Wakeman SE, Duprey MS, Roberts RJ, Jacobson JS, Devlin JW. Predictors for 30-day and 90-day hospital readmission among patients with opioid use disorder. J Addict Med. 2019;13(4):306-313. https://doi.org/10.1097/adm.0000000000000499
11. Rosenthal ES, Karchmer AW, Theisen-Toupal J, Castillo RA, Rowley CF. Suboptimal addiction interventions for patients hospitalized with injection drug use-associated infective endocarditis. Am J Med. 2016;129(5):481-485. https://doi.org/10.1016/j.amjmed.2015.09.024
12. Priest KC, Lovejoy TI, Englander H, Shull S, McCarty D. Opioid agonist therapy during hospitalization within the Veterans Health Administration: a pragmatic retrospective cohort analysis. J Gen Intern Med. 2020;35(8):2365-2374. https://doi.org/10.1007/s11606-020-05815-0
13. Madras BK, Ahmad NJ, Wen J, Sharfstein J; Prevention, Treatment, and Recovery Working Group of the Action Collaborative on Countering the U.S. Opioid Epidemic. Improving access to evidence-based medical treatment for opioid use disorder: strategies to address key barriers within the treatment system. NAM Perspectives. April 27, 2020. https://doi.org/10.31478/202004b
14. Fiscella K, Wakeman SE, Beletsky L. Buprenorphine deregulation and mainstreaming treatment for opioid use disorder: x the X Waiver. JAMA Psychiatry. 2019;76(3):229-230. https://doi.org/10.1001/jamapsychiatry.2018.3685
15. Priest KC, McCarty D. Role of the hospital in the 21st century opioid overdose epidemic: the addiction medicine consult service. J Addict Med. 2019;13(2):104-112. https://doi.org/10.1097/adm.0000000000000496
16. Weimer M, Morford K, Donroe J. Treatment of opioid use disorder in the acute hospital setting: a critical review of the literature (2014–2019). Curr Addict Rep. 2019;6(4):339-354.
17. Englander H, Dobbertin K, Lind BK, et al. Inpatient addiction medicine consultation and post-hospital substance use disorder treatment engagement: a propensity-matched analysis. J Gen Intern Med. 2019;34(12):2796-2803. https://doi.org/10.1007/s11606-019-05251-9
18. Englander H, Priest KC, Snyder H, Martin M, Calcaterra S, Gregg J. A call to action: hospitalists’ role in addressing substance use disorder. J Hosp Med. 2019;14(3):E1-E4. https://doi.org/10.12788/jhm.3311
19. Bottner R, Moriates C, Tirado C. The role of hospitalists in treating opioid use disorder. J Addict Med. 2020;14(2):178. https://doi.org/10.1097/adm.0000000000000545
20. Behavioral health treatment services locator. Substance Abuse and Mental Health Services Administration. Accessed May 14, 2020. https://findtreatment.samhsa.gov/
21. Groesbeck K, Whiteman LN, Stewart RW. Reducing readmission rates by improving transitional care. South Med J. 2015;108(12):758-760. https://doi.org/10.14423/smj.0000000000000376
22. Heslin KC, Owens PL, Karaca Z, Barrett ML, Moore BJ, Elixhauser A. Trends in opioid-related inpatient stays shifted after the US transitioned to ICD-10-CM diagnosis coding in 2015 Med Care. 2017;55(11):918-923. https://doi.org/10.1097/mlr.0000000000000805
23. Initiation and engagement of alcohol and other drug abuse or dependence treatment (IET). NCQA. Accessed April 20, 2020. https://www.ncqa.org/hedis/measures/initiation-and-engagement-of-alcohol-and-other-drug-abuse-or-dependence-treatment/
24. Wyse JJ, Robbins JL, McGinnis KA, et al. Predictors of timely opioid agonist treatment initiation among veterans with and without HIV. Drug Alcohol Depend. 2019;198:70-75. https://doi.org/10.1016/j.drugalcdep.2019.01.038
25. Harris AHS, Humphreys K, Finney JW. Veterans Affairs facility performance on Washington Circle indicators and casemix-adjusted effectiveness. J Subst Abuse Treat. 2007;33(4):333-339. https://doi.org/10.1016/j.jsat.2006.12.015
26. Muzyk A, Smothers ZPW, Andolsek KM, et al. Interprofessional substance use disorder education in health professions education programs: a scoping review. Acad Med. 2020;95(3):470-480. https://doi.org/10.1097/acm.0000000000003053
27. Saloner B, Lin L, Simon K. Geographic location of buprenorphine-waivered physicians and integration with health systems. J Subst Abuse Treat. 2020;115:108034. https://doi.org/10.1016/j.jsat.2020.108034
28. Jones CW, Christman Z, Smith CM, et al. Comparison between buprenorphine provider availability and opioid deaths among US counties. J Subst Abuse Treat. 2018;93:19-25. https://doi.org/10.1016/j.jsat.2018.07.008
29. Goedel WC, Shapiro A, Cerdá M, Tsai JW, Hadland SE, Marshall BDL. Association of racial/ethnic segregation with treatment capacity for opioid use disorder in counties in the United States. JAMA Netw Open. 2020;3(4):e203711. https://doi.org/10.1001/jamanetworkopen.2020.3711
© 2021 Society of Hospital Medicine