User login
The financial advantages of medical scribes extend beyond increased visits
ABSTRACT
Purpose Medical scribes are known to increase revenue by increasing visits to a medical practice. We examined whether medical scribes are associated with markers of financial benefit independent of increased visits.
Methods We conducted a pre- and post-observational study with a control group, examining changes in the percentage of visits (1) coded as level of service 4 or 5, (2) with at least 1 hierarchical condition category code billed, and (3) at which orders for 3 pay-for-performance quality measures (screening for breast, cervical, and colon cancer) were placed, if due. We looked at changes in outcomes among scribed providers and compared them to nonscribed providers. We used generalized estimating equations with robust standard errors to account for repeated measures and the hierarchical nature of the data, controlling for patient demographics.
Results We examined 41,371 visits to 17 scribed providers and 230,297 visits to 78 nonscribed providers. In adjusted analyses, and compared to nonscribed providers, scribes were associated with an increase of:
- Frutiger LT Std9.2 percentage points in level-of-service 4 or 5 billing (Frutiger LT StdP < .001)
- 3.6 percentage points in hierarchical condition category coding (Frutiger LT StdP < .001)
- 4.0 percentage points in breast cancer screening orders (Frutiger LT StdP = .01)
- 4.9 percentage points in colon cancer screening orders (Frutiger LT StdPFrutiger LT Std = .04).
Conclusions This study suggests that scribes are associated with financial benefit in addition to increased visit volume. Primary care practices should consider the financial benefit of scribes independent of their ability to add patient volume.
Increasingly, medical scribes are used in ambulatory care settings across the United States.1 Scribes are trained personnel who accompany providers during visits to provide documentation support and assist with other administrative tasks. They are associated with reduced documentation time for providers2-6 and improved provider satisfaction,7-11 without detriment to4-16 (or with possible improvement in17-20) patient satisfaction in ambulatory care settings. At the same time, concerns remain that using scribes might inhibit patient communication, harm clinical reasoning, reduce the effectiveness of clinical decision-support tools, and simply serve as a work-around to fixing inefficiencies in the electronic medical record (EMR).21-23
A driving force for the increased use of medical scribes is the expectation that they reduce the cost of providing care. Cost-efficiency is typically described as resulting from a reduction in physician time per patient seen, which allows increased patient volume and, in turn, drives increased physician productivity.2,8,10,18,24-27 Whether scribes result in cost savings remains unclear; some papers suggest that scribes are cost efficient in ambulatory care,2,10,18 while others have been unable to identify cost savings, particularly in primary care.4
One reason why scribes might not be associated with cost savings is that their financial benefit might be undercounted. Studies that focus on increased volume miss the opportunity to capture financial benefits conferred through mechanisms that are independent of seeing more patients:
- Scribes might help providers address and document more, and more complex, medical problems, allowing higher level-of-service (LOS) billing. For example, a provider chooses a lower LOS because they have insufficiently documented a visit to support a higher LOS; by assisting with documentation, the scribe might allow the provider to choose a higher LOS.
- Scribes might prompt a provider to use decision-support tools for risk coding (using appropriate medical codes to capture the patient’s level of medical complexity), thereby increasing reimbursement.
- Scribes might extend the time available during the visit for the provider to address pay-for-performance quality measures, such as cancer screening.
Continue to: Making visits count, not counting visits
Making visits count, not counting visits. In this study, we examined whether medical scribes in primary care are associated with improved markers of revenue that are independent of seeing more patients. Specifically, we examined whether scribes are associated with increased LOS coding, risk coding, and orders for pay-for-performance measures for all primary care visits and for nonpreventive primary care visits.
Methods
Design
This observational study compared the change in outcomes before implementation of scribes and during implementation of scribes, between scribed providers and nonscribed providers. We compared visits during the year prior to the implementation of scribes (July 2017–June 2018) with the year during their implementation (July 2018–2019).
The Cambridge Health Alliance Institutional Review Board considered this study exempt from review.
Setting
This study was conducted at a safety-net community academic health system that uses an EMR developed by Epic Systems [Verona, WI]. This EMR includes decision-support tools that prompt providers when pay-for-performance quality measures are due and when hierarchical condition category (HCC) codes—ie, specific diagnoses used by Medicare and other payers to reimburse providers for the complexity of their patients—might apply to the visit.
These EMR decision-support tools use algorithms that draw on age, gender, diagnoses that were billed previously or are on the problem list, laboratory findings, and prior imaging. They alert physicians when a patient is due for pay-for-performance quality measures, such as cancer screenings, and when HCC codes might be applicable.
Continue to: During the study period...
During the study period, the EMR decision-support tool for HCC coding underwent several changes designed to improve HCC coding. In addition, systematic changes to primary care visits took place, leading to an increase in the number of patients seen and screenings required.
Outcomes
We examined 2 categories of outcomes that confer financial benefit to many institutions: billing measures and pay-for-performance measures.
Billing measures included the percentage of visits (1) coded as LOS 4 or 5 and (2) with at least 1 HCC code billed (among those for which the decision-support tool identified at least 1 potential HCC code).
Pay-for-performance measures. We examined whether any of 3 pay-for-performance quality measures were addressed during the visit, selecting 3 that are commonly addressed by primary care providers (PCPs) and that require PCPs to sign an order for screening during a primary care visit: breast cancer (mammography order), cervical cancer (Papanicolaou smear order), and colon cancer (an order for fecal occult blood testing or colonoscopy).
Intervention
Scribes were employees of Cambridge Health Alliance who had recently graduated from college and were interested in a career as a health care professional. Scribes received 3 days of training on how to function effectively in their role; 1 day of training in EMR functionality; and 2 hours of training on decision-support tools for pay-for-performance quality measures and risk coding. Scribes continued learning on the job through feedback from supervising PCPs. Scribes documented patient encounters, recording histories and findings on the physical exam and transcribing discussion of treatment plans and the PCP’s instructions to patients.
Continue to: The 14 scribes worked with 17 physician...
The 14 scribes worked with 17 physician and nurse practitioner PCPs beginning in July 2018. Participation by PCPs was voluntary; they received no compensation for participating in the scribe program. PCPs were not required to see additional patients to participate. PCPs who chose to work with a scribe were similar to those who declined a scribe, as regards gender, race, type of provider (MD or NP), tenure at the institution, and percentage of time in clinical work (see Table W-1).
The control group comprised providers who elected not to work with a scribe but who worked in the same clinics as the intervention providers.
Scribes were assigned to a PCP based on availability during the PCP’s scheduled hours and worked with 1 PCP throughout the intervention (except for 1 PCP who worked with 2 scribes). All PCPs worked with their scribe(s) part time; on average, 49% of intervention PCPs’ visits were scribed.
Inclusion and exclusion criteria
Because the first year at an institution is a learning period for PCPs, we excluded those who worked at the institution for < 1 year before the start of the scribe program (n = 12). Based on the extensive clinical experience of 1 PCP (WA) with scribes, we excluded the first 200 visits or 6 weeks (whichever occurred first) with a scribe among all scribed providers, to account for an initial learning period (n = 2202, of 15,372 scribed visits [14%]). We also excluded 2 providers who left during the pre-intervention period or were in the intervention period for < 1 month.
To ensure that we captured visits to providers with clinically significant exposure to scribes, we required scribed providers to have ≥ 20% of their visits scribed during the intervention period. To minimize the potential for contamination, we excluded nonscribed visits to scribed providers during the intervention period (n = 2211), because such nonscribed visits were largely due to visits outside the scribe’s scheduled time.
Continue to: Analysis
Analysis
We compared demographic characteristics for patients and providers using the chi-square test for categorical variables and the t test for continuous variables. We compared the change in outcomes from before implementation of scribes to during implementation of scribes among scribed providers, compared to nonscribed providers, using generalized estimating equations with robust standard errors to account for repeated measures (ie, multiple visits by the same patients) and the hierarchical nature of the data (ie, patients nested within providers). We then recalculated these estimates, controlling for patient demographics (age, gender, race, and ethnicity). We repeated these analyses for patients presenting for nonpreventive visits.
Results
Visit characteristics
We examined 271,768 visits, including 41,371 visits to 17 scribed providers and 230,397 visits to 78 nonscribed providers (Table 1). Patients were most likely to be female, > 21 years of age, have English as their language of care, and be non-White. Most visits were by established patients and were nonpreventive.

We noted no clinically significant differences in characteristics between visits with scribed providers and visits with nonscribed providers, and over time. Patient complexity measures, including care management enrollment and hospital admissions, were also similar between groups, and over time.
Billing measures
HCC coding. In 28.6% of visits, the decision-support tool identified at least 1 potential HCC code. Among these, the percentage of visits with at least 1 HCC code billed increased by 10.1 percentage points (from 3.9% before implementation of scribes to 14.0%) among scribed providers, compared to increasing by 6.5 percentage points (from 2.9% before implementation to 9.3%) among nonscribed providers (TABLE 2). Scribes were therefore associated with an additional 3.6 percentage-point increase in visits with at least 1 HCC code billed (P < .0001)—a difference that remained significant after adjusting for patient demographics (P < .0001).

LOS coding. Scribed providers increased the number of visits billed as LOS 4 or 5 by 9.6 percentage points (from 47.3% before implementation to 56.8%); during the same period, nonscribed providers increased the number of visits billed as LOS 4 or 5 by 1.3 percentage points (from 46.5% before implementation to 47.8%) (TABLE 2). Scribes were therefore associated with an additional 8.3 percentage points in LOS 4 or 5 billing (P < .001) (TABLE 2). This difference remained significant after adjusting for patient demographics (P < .001).
Continue to: Pay-for-performance quality measures
Pay-for-performance quality measures
Breast cancer screening. Scribed providers increased the number of visits at which breast cancer screening was ordered by 2.7 percentage points (from 17.3% before implementation of scribes to 20.0%); during the same period, the number of visits at which breast cancer screening was ordered by nonscribed providers decreased by 1.9 percentage points (from 19.5% to 17.6%). Scribes were therefore associated with an increase of 4.6 percentage points in breast cancer screening orders, compared to nonscribed providers (P < .003) (TABLE 2). That difference remained significant after adjusting for patient demographics (P = .01).
Colon cancer screening. Similarly, scribed providers increased the number of visits at which colon cancer screening was ordered by 1.2 percentage points (from 19.2% before implementation of scribes to 20.3%); during the same period, the number of visits at which colon cancer screening was ordered by nonscribed providers decreased by 2.7 percentage points (from 18.5% to 15.9%) (P = .112). After adjusting for patient demographics, scribes were associated with an increase of 4.9 percentage points in colon cancer screening orders, compared to nonscribed providers (P = .044) (TABLE 2).
Cervical cancer screening. The rate at which cervical cancer screening was ordered did not change among scribed providers and decreased (by 2.5 percentage points) among nonscribed providers—a difference that was not statistically significant (P = .26).
Nonpreventive visits. Our findings overall did not change in analyses focused on nonpreventive visits, in which scribes were associated with an increase of 8.2 percentage points in LOS 4 or 5 billing (P < .001); an increase of 3.1 percentage points in HCC coding (P < .001); and an increase of 3.2 percentage points in breast cancer screening orders (P = .03) (TABLE 3). Although scribes were associated with an increase of 1.5 percentage points in cervical cancer screening orders and an increase of 3.1 percentage points in colon cancer screening orders, these increases did not reach statistical significance.

Discussion
We found that implementation of scribes is associated with (1) an increase in LOS coding and risk coding and (2) a higher frequency of addressing 2 of 3 pay-for-performance quality measures in primary care. In adjusted analyses in our study, and compared to nonscribed providers, scribes were associated with an additional 9.2 percentage points in LOS 4 or 5 billing; 3.6 percentage points in HCC coding; 4.0 percentage points in breast cancer screening orders; and 4.9 percentage points in colon cancer screening orders. Cervical cancer screening orders followed a similar pattern, with an increase of 2.3 percentage points in the adjusted screening order rate among scribed providers, compared to nonscribed providers, during implementation of scribes—although the increase was not significant. These findings did not change in analyses focused on nonpreventive visits.
Continue to: Our findings are consistent
Our findings are consistent with those of earlier studies. Prior examinations in ambulatory specialties found that scribes increased HCC coding,4 LOS billing,24 and pay-for-performance metrics.18 The only study to examine these areas in primary care found that scribes were associated with increased pay-for-performance measure documentation,20 a change that is necessary but insufficient to realize increased pay-for-performance revenue. Therefore, our study confirms, for the first time, that PCPs can better address pay-for-performance measures, LOS billing, and HCC coding when working with a scribe in primary care.
Demands on primary care visits are increasing.28 Physicians are required to provide more documentation; there is greater emphasis on PCPs meeting pay-for-performance measures; and there are more data in the EMR to review. In this context, addressing pay-for-performance measures and gaps in risk coding is likely to be increasingly challenging. Our study suggests that scribes might provide a mechanism to increase risk coding, LOS billing, and pay-for-performance measures, despite increased demands on primary care visits.
Increase in LOS billing. In the settings in which we work, a fee-for-service LOS 4 primary care visit generates, on average, $20 to $75 more in revenue than an LOS 3 visit. Using an average of $50 additional revenue for LOS 4 billing, we estimate that a full-time scribe is associated with roughly $7,000 in additional revenue annually. We arrived at this estimate using an average of 1500 visits at LOS ≤ 3 for every PCP full-time equivalent. A 9.2 percentage–point increase in LOS 4 billing would lead to roughly 140 additional LOS 4 visits, with each visit generating an additional $50 in revenue.
This analysis does not account for increased revenue associated with increased pay for HCC coding identified in our study.
Furthermore, in our conservative assumption, the entire increase in LOS billing was from level 3 to level 4; in fact, a small percentage of that increase would be from level 2 and another small percentage would be to level 5—both of which would generate additional revenue. Our assumption therefore underestimates the full financial value associated with scribes in the absence of increased patient volume. Nonetheless, the assumption suggests that increases in LOS billing offset a substantial percentage of a scribe’s salary.
Continue to: Limitations of this study
Limitations of this study. Our study should be interpreted in the context of several limitations:
- The study was conducted at 1 institution. Our findings might not be generalizable beyond this setting.
- The study measures the impact of scribes when providers work with scribes part time. Because providers who utilize a scribe for all, or nearly all, their visits are likely to use a scribe more efficiently, our study might underestimate the full impact of a scribe.
- In some settings, team members such as medical assistants are trained to assist with documentation and other responsibilities (such as closing care gaps) in addition to other patient care responsibilities.29-32 The extent to which our findings transfer to other models is unclear; studies comparing the impact of other models (which might provide even stronger outcomes) to the impact of medical scribes would be an interesting area for further research.
- In addition to the variability of models, there is likely variability in the quality and interactions of medical scribes, which might impact outcomes. We did not examine the qualities of scribes that led to outcomes in this study.
- We examined the impact of scribes on quality measure–ordering behaviors of providers, not on whether quality measures actually improved. Because scribes are associated with more face-to-face time with patients,27 they might allow for increased attention being paid by physicians to barriers to pay-for-performance measures (eg, patient education). This could increase the likelihood that patients complete a multitude of screenings, and thus improve adherence and follow-up. However, the impact of scribes on quality measures is a topic for future study.
Value beyond volume. Any limitations notwithstanding, our study suggests that scribes are associated with financial benefit in addition to the benefit of increased volume. Primary care practices should therefore consider the financial benefit of scribes independent of their ability to add patient volume. By recognizing this additive value, primary care practices might more fully capture the benefit of scribes, which might then allow practices to employ scribes with less demand to increase volume. This added support without increased volume would, in turn, likely reduce provider burnout (and the costly associated turnover) and increase patient satisfaction, leading to a synergistic financial benefit.
CORRESPONDENCE
Wayne Altman, MD, FAAFP, Tufts University School of Medicine, 200 Harrison Avenue, Boston, MA 02111; wayne. altman@tufts.edu
1. Gellert GA, Ramirez R, Webster SL. The rise of the medical scribe industry: implications for the advancement of electronic health records. JAMA. 2015;313:1315-1316. doi: 10.1001/jama.2014.1712
2. Cho J, Sanchez K, Ganor O, et al. Utilizing a physician scribe in a pediatric plastic surgical practice: a time-driven activity-based costing study. Plast Reconstr Surg Glob Open. 2019;7:e2460. doi: 10.1097/GOX.0000000000002460
3. Danak SU, Guetterman TC, Plegue MA, et al. Influence of scribes on patient-physician communication in primary care encounters: mixed methods study. JMIR Med Inform. 2019;7:e14797. doi: 10.2196/14797
4. Martel ML, Imdieke BH, Holm KM, et al. Developing a medical scribe program at an academic hospital: the Hennepin County Medical Center experience. Jt Comm J Qual Patient Saf. 2018;44:238-249. doi: 10.1016/j.jcjq.2018.01.001
5. Mishra P, Kiang JC, Grant RW. Association of medical scribes in primary care with physician workflow and patient experience. JAMA Intern Med. 2018;178:1467-1472. doi: 10.1001/ jamainternmed.2018.3956
6. Taylor KA, McQuilkin D, Hughes RG. Medical scribe impact on patient and provider experience. Mil Med. 2019;184:388-393. doi: 10.1093/milmed/usz030
7. Gidwani R, Nguyen C, Kofoed A, et al. Impact of scribes on physician satisfaction, patient satisfaction, and charting efficiency: a randomized controlled trial. Ann Fam Med. 2017;15:427-433. doi: 10.1370/afm.2122.
8. Heckman J, Mukamal KJ, Christensen A, et al. Medical scribes, provider and patient experience, and patient throughput: a trial in an academic general internal medicine practice. J Gen Intern Med. 2019;35:770-774. doi: 10.1007/s11606-019-05352-5
9. Koshy S, Feustel PJ, Hong M, et al. Scribes in an ambulatory urology practice: patient and physician satisfaction. J Urol. 2010;184:258-262. doi: 10.1016/j.juro.2010.03.040
10. McCormick BJ, Deal A, Borawski KM, et al. Implementation of medical scribes in an academic urology practice: an analysis of productivity, revenue, and satisfaction. World J Urol. 2018;36:1691-1697. doi: 10.1007/s00345-018-2293-8
11. Pozdnyakova A, Laiteerapong N, Volerman A, et al. Impact of medical scribes on physician and patient satisfaction in primary care. J Gen Intern Med. Jul 2018;33:1109-1115. doi: 10.1007/ s11606-018-4434-6
12. Bank AJ, Obetz C, Konrardy A, et al. Impact of scribes on patient interaction, productivity, and revenue in a cardiology clinic: a prospective study. Clinicoecon Outcomes Res. 2013;5:399-406. doi: 10.2147/CEOR.S49010
13. Danila MI, Melnick JA, Curtis JR, et al. Use of scribes for documentation assistance in rheumatology and endocrinology clinics: impact on clinic workflow and patient and physician satisfaction. J Clin Rheumatol. 2018;24:116-121. doi: 10.1097/ RHU.0000000000000620
14. Keefe KR, Levi JR, Brook CD. The impact of medical scribes on patient satisfaction in an academic otolaryngology clinic. Ann Otol Rhinol Laryngol. 2020;129:238-244. doi: 10.1177/0003489419884337
15. Lowry C, Orr K, Embry B, et al. Primary care scribes: writing a new story for safety net clinics. BMJ Open Qual. 2017;6:e000124. doi: 10.1136/bmjoq-2017-000124
16. Rohlfing ML, Keefe KR, Komshian SR, et al. Clinical scribes and their association with patient experience in the otolaryngology clinic. Laryngoscope. 2020;130:e134-e139. doi: 10.1002/ lary.28075
17. Arya R, Salovich DM, Ohman-Strickland P, et al. Impact of scribes on performance indicators in the emergency department. Acad Emerg Med. 2010;17:490-494. doi: 10.1111/j.1553- 2712.2010.00718.x
18. Ewelukwa O, Perez R, Carter LE, et al. Incorporation of scribes into the inflammatory bowel disease clinic improves quality of care and physician productivity. Inflamm Bowel Dis. 2018;24: 552-557. doi: 10.1093/ibd/izx078
19. Misra-Hebert AD, Yan C, Rothberg MB. Physician, scribe, and patient perspectives on clinical scribes in primary care. J Gen Intern Med. 2017;32:244. doi: 10.1007/s11606-016-3888-7
20. Platt J, Altman W. Can medical scribes improve quality measure documentation? J Fam Pract. Jun 2019;68:e1-e7.
21. Guglielmo WJ. What a scribe can do for you. Med Econ. Jan 6 2006;83:42,44-46.
22. Richmond M. Don’t use scribes for order entry. Emergency Medicine News. 2009;31:6-7. doi: 10.1097/01.EEM.0000360578.87654.cc
23. Schiff GD, Zucker L. Medical scribes: salvation for primary care or workaround for poor EMR usability? J Gen Intern Med. 2016;31:979-981. doi: 10.1007/s11606-016-3788-x
24. Bank AJ, Gage RM. Annual impact of scribes on physician productivity and revenue in a cardiology clinic. Clinicoecon Outcomes Res. 2015;7:489-495. doi: 10.2147/CEOR.S89329
25. Heaton HA, Castaneda-Guarderas A, Trotter ER, et al. Effect of scribes on patient throughput, revenue, and patient and provider satisfaction: a systematic review and meta-analysis. Am J Emerg Med. 2016;34:2018-2028. doi: 10.1016/j.ajem.2016.07.056
26. Earls ST, Savageau JA, Begley S, et al. Can scribes boost FPs’ efficiency and job satisfaction? J Fam Pract. 2017;66:206-214.
27. Zallman L, Finnegan K, Roll D, et al. Impact of medical scribes in primary care on productivity, face-to-face time, and patient comfort. J Am Board Fam Med. 2018;31:612-619. doi: 10.3122/ jabfm.2018.04.170325
28. Abbo ED, Zhang Q, Zelder M, et al. The increasing number of clinical items addressed during the time of adult primary care visits. J Gen Intern Med. 2008;23:2058-2065. doi: 10.1007/s11606- 008-0805-8
29. Ammann Howard K, Helé K, Salibi N, et al. Adapting the EHR scribe model to community health centers: the experience of Shasta Community Health Center’s pilot. Blue Shield of California Foundation; 2012. Accessed April 28, 2021. https:// blueshieldcafoundation.org/sites/default/files/publications/ downloadable/Shasta%20EHR%20Scribes%20Final%20Report.pdf
30. Anderson P, Halley MD. A new approach to making your doctor– nurse team more productive. Fam Pract Manag. 2008;15:35-40.
31. Blash L, Dower C, Chapman SA. University of Utah community clinics—medical assistant teams enhance patient-centered, physician-efficient care. Center for the Health Professions at UCSF; April 2011. Revised November 2011. Accessed April 28, 2021. https://healthforce.ucsf.edu/sites/healthforce.ucsf.edu/ files/publication-pdf/3.1%202011_04_University_of_Utah_Community_Clinics--Medical_Assistant_Teams_Enhance_PatientCentered_Physician-Efficient%20Care.pdf
32. Reuben DB, Knudsen J, Senelick W, et al. The effect of a physician partner program on physician efficiency and patient satisfaction. JAMA Intern Med. 2014;174:1190-1193. doi: 10.1001/ jamainternmed.2014.1315
ABSTRACT
Purpose Medical scribes are known to increase revenue by increasing visits to a medical practice. We examined whether medical scribes are associated with markers of financial benefit independent of increased visits.
Methods We conducted a pre- and post-observational study with a control group, examining changes in the percentage of visits (1) coded as level of service 4 or 5, (2) with at least 1 hierarchical condition category code billed, and (3) at which orders for 3 pay-for-performance quality measures (screening for breast, cervical, and colon cancer) were placed, if due. We looked at changes in outcomes among scribed providers and compared them to nonscribed providers. We used generalized estimating equations with robust standard errors to account for repeated measures and the hierarchical nature of the data, controlling for patient demographics.
Results We examined 41,371 visits to 17 scribed providers and 230,297 visits to 78 nonscribed providers. In adjusted analyses, and compared to nonscribed providers, scribes were associated with an increase of:
- Frutiger LT Std9.2 percentage points in level-of-service 4 or 5 billing (Frutiger LT StdP < .001)
- 3.6 percentage points in hierarchical condition category coding (Frutiger LT StdP < .001)
- 4.0 percentage points in breast cancer screening orders (Frutiger LT StdP = .01)
- 4.9 percentage points in colon cancer screening orders (Frutiger LT StdPFrutiger LT Std = .04).
Conclusions This study suggests that scribes are associated with financial benefit in addition to increased visit volume. Primary care practices should consider the financial benefit of scribes independent of their ability to add patient volume.
Increasingly, medical scribes are used in ambulatory care settings across the United States.1 Scribes are trained personnel who accompany providers during visits to provide documentation support and assist with other administrative tasks. They are associated with reduced documentation time for providers2-6 and improved provider satisfaction,7-11 without detriment to4-16 (or with possible improvement in17-20) patient satisfaction in ambulatory care settings. At the same time, concerns remain that using scribes might inhibit patient communication, harm clinical reasoning, reduce the effectiveness of clinical decision-support tools, and simply serve as a work-around to fixing inefficiencies in the electronic medical record (EMR).21-23
A driving force for the increased use of medical scribes is the expectation that they reduce the cost of providing care. Cost-efficiency is typically described as resulting from a reduction in physician time per patient seen, which allows increased patient volume and, in turn, drives increased physician productivity.2,8,10,18,24-27 Whether scribes result in cost savings remains unclear; some papers suggest that scribes are cost efficient in ambulatory care,2,10,18 while others have been unable to identify cost savings, particularly in primary care.4
One reason why scribes might not be associated with cost savings is that their financial benefit might be undercounted. Studies that focus on increased volume miss the opportunity to capture financial benefits conferred through mechanisms that are independent of seeing more patients:
- Scribes might help providers address and document more, and more complex, medical problems, allowing higher level-of-service (LOS) billing. For example, a provider chooses a lower LOS because they have insufficiently documented a visit to support a higher LOS; by assisting with documentation, the scribe might allow the provider to choose a higher LOS.
- Scribes might prompt a provider to use decision-support tools for risk coding (using appropriate medical codes to capture the patient’s level of medical complexity), thereby increasing reimbursement.
- Scribes might extend the time available during the visit for the provider to address pay-for-performance quality measures, such as cancer screening.
Continue to: Making visits count, not counting visits
Making visits count, not counting visits. In this study, we examined whether medical scribes in primary care are associated with improved markers of revenue that are independent of seeing more patients. Specifically, we examined whether scribes are associated with increased LOS coding, risk coding, and orders for pay-for-performance measures for all primary care visits and for nonpreventive primary care visits.
Methods
Design
This observational study compared the change in outcomes before implementation of scribes and during implementation of scribes, between scribed providers and nonscribed providers. We compared visits during the year prior to the implementation of scribes (July 2017–June 2018) with the year during their implementation (July 2018–2019).
The Cambridge Health Alliance Institutional Review Board considered this study exempt from review.
Setting
This study was conducted at a safety-net community academic health system that uses an EMR developed by Epic Systems [Verona, WI]. This EMR includes decision-support tools that prompt providers when pay-for-performance quality measures are due and when hierarchical condition category (HCC) codes—ie, specific diagnoses used by Medicare and other payers to reimburse providers for the complexity of their patients—might apply to the visit.
These EMR decision-support tools use algorithms that draw on age, gender, diagnoses that were billed previously or are on the problem list, laboratory findings, and prior imaging. They alert physicians when a patient is due for pay-for-performance quality measures, such as cancer screenings, and when HCC codes might be applicable.
Continue to: During the study period...
During the study period, the EMR decision-support tool for HCC coding underwent several changes designed to improve HCC coding. In addition, systematic changes to primary care visits took place, leading to an increase in the number of patients seen and screenings required.
Outcomes
We examined 2 categories of outcomes that confer financial benefit to many institutions: billing measures and pay-for-performance measures.
Billing measures included the percentage of visits (1) coded as LOS 4 or 5 and (2) with at least 1 HCC code billed (among those for which the decision-support tool identified at least 1 potential HCC code).
Pay-for-performance measures. We examined whether any of 3 pay-for-performance quality measures were addressed during the visit, selecting 3 that are commonly addressed by primary care providers (PCPs) and that require PCPs to sign an order for screening during a primary care visit: breast cancer (mammography order), cervical cancer (Papanicolaou smear order), and colon cancer (an order for fecal occult blood testing or colonoscopy).
Intervention
Scribes were employees of Cambridge Health Alliance who had recently graduated from college and were interested in a career as a health care professional. Scribes received 3 days of training on how to function effectively in their role; 1 day of training in EMR functionality; and 2 hours of training on decision-support tools for pay-for-performance quality measures and risk coding. Scribes continued learning on the job through feedback from supervising PCPs. Scribes documented patient encounters, recording histories and findings on the physical exam and transcribing discussion of treatment plans and the PCP’s instructions to patients.
Continue to: The 14 scribes worked with 17 physician...
The 14 scribes worked with 17 physician and nurse practitioner PCPs beginning in July 2018. Participation by PCPs was voluntary; they received no compensation for participating in the scribe program. PCPs were not required to see additional patients to participate. PCPs who chose to work with a scribe were similar to those who declined a scribe, as regards gender, race, type of provider (MD or NP), tenure at the institution, and percentage of time in clinical work (see Table W-1).
The control group comprised providers who elected not to work with a scribe but who worked in the same clinics as the intervention providers.
Scribes were assigned to a PCP based on availability during the PCP’s scheduled hours and worked with 1 PCP throughout the intervention (except for 1 PCP who worked with 2 scribes). All PCPs worked with their scribe(s) part time; on average, 49% of intervention PCPs’ visits were scribed.
Inclusion and exclusion criteria
Because the first year at an institution is a learning period for PCPs, we excluded those who worked at the institution for < 1 year before the start of the scribe program (n = 12). Based on the extensive clinical experience of 1 PCP (WA) with scribes, we excluded the first 200 visits or 6 weeks (whichever occurred first) with a scribe among all scribed providers, to account for an initial learning period (n = 2202, of 15,372 scribed visits [14%]). We also excluded 2 providers who left during the pre-intervention period or were in the intervention period for < 1 month.
To ensure that we captured visits to providers with clinically significant exposure to scribes, we required scribed providers to have ≥ 20% of their visits scribed during the intervention period. To minimize the potential for contamination, we excluded nonscribed visits to scribed providers during the intervention period (n = 2211), because such nonscribed visits were largely due to visits outside the scribe’s scheduled time.
Continue to: Analysis
Analysis
We compared demographic characteristics for patients and providers using the chi-square test for categorical variables and the t test for continuous variables. We compared the change in outcomes from before implementation of scribes to during implementation of scribes among scribed providers, compared to nonscribed providers, using generalized estimating equations with robust standard errors to account for repeated measures (ie, multiple visits by the same patients) and the hierarchical nature of the data (ie, patients nested within providers). We then recalculated these estimates, controlling for patient demographics (age, gender, race, and ethnicity). We repeated these analyses for patients presenting for nonpreventive visits.
Results
Visit characteristics
We examined 271,768 visits, including 41,371 visits to 17 scribed providers and 230,397 visits to 78 nonscribed providers (Table 1). Patients were most likely to be female, > 21 years of age, have English as their language of care, and be non-White. Most visits were by established patients and were nonpreventive.
We noted no clinically significant differences in characteristics between visits with scribed providers and visits with nonscribed providers, and over time. Patient complexity measures, including care management enrollment and hospital admissions, were also similar between groups, and over time.
Billing measures
HCC coding. In 28.6% of visits, the decision-support tool identified at least 1 potential HCC code. Among these, the percentage of visits with at least 1 HCC code billed increased by 10.1 percentage points (from 3.9% before implementation of scribes to 14.0%) among scribed providers, compared to increasing by 6.5 percentage points (from 2.9% before implementation to 9.3%) among nonscribed providers (TABLE 2). Scribes were therefore associated with an additional 3.6 percentage-point increase in visits with at least 1 HCC code billed (P < .0001)—a difference that remained significant after adjusting for patient demographics (P < .0001).
LOS coding. Scribed providers increased the number of visits billed as LOS 4 or 5 by 9.6 percentage points (from 47.3% before implementation to 56.8%); during the same period, nonscribed providers increased the number of visits billed as LOS 4 or 5 by 1.3 percentage points (from 46.5% before implementation to 47.8%) (TABLE 2). Scribes were therefore associated with an additional 8.3 percentage points in LOS 4 or 5 billing (P < .001) (TABLE 2). This difference remained significant after adjusting for patient demographics (P < .001).
Continue to: Pay-for-performance quality measures
Pay-for-performance quality measures
Breast cancer screening. Scribed providers increased the number of visits at which breast cancer screening was ordered by 2.7 percentage points (from 17.3% before implementation of scribes to 20.0%); during the same period, the number of visits at which breast cancer screening was ordered by nonscribed providers decreased by 1.9 percentage points (from 19.5% to 17.6%). Scribes were therefore associated with an increase of 4.6 percentage points in breast cancer screening orders, compared to nonscribed providers (P < .003) (TABLE 2). That difference remained significant after adjusting for patient demographics (P = .01).
Colon cancer screening. Similarly, scribed providers increased the number of visits at which colon cancer screening was ordered by 1.2 percentage points (from 19.2% before implementation of scribes to 20.3%); during the same period, the number of visits at which colon cancer screening was ordered by nonscribed providers decreased by 2.7 percentage points (from 18.5% to 15.9%) (P = .112). After adjusting for patient demographics, scribes were associated with an increase of 4.9 percentage points in colon cancer screening orders, compared to nonscribed providers (P = .044) (TABLE 2).
Cervical cancer screening. The rate at which cervical cancer screening was ordered did not change among scribed providers and decreased (by 2.5 percentage points) among nonscribed providers—a difference that was not statistically significant (P = .26).
Nonpreventive visits. Our findings overall did not change in analyses focused on nonpreventive visits, in which scribes were associated with an increase of 8.2 percentage points in LOS 4 or 5 billing (P < .001); an increase of 3.1 percentage points in HCC coding (P < .001); and an increase of 3.2 percentage points in breast cancer screening orders (P = .03) (TABLE 3). Although scribes were associated with an increase of 1.5 percentage points in cervical cancer screening orders and an increase of 3.1 percentage points in colon cancer screening orders, these increases did not reach statistical significance.
Discussion
We found that implementation of scribes is associated with (1) an increase in LOS coding and risk coding and (2) a higher frequency of addressing 2 of 3 pay-for-performance quality measures in primary care. In adjusted analyses in our study, and compared to nonscribed providers, scribes were associated with an additional 9.2 percentage points in LOS 4 or 5 billing; 3.6 percentage points in HCC coding; 4.0 percentage points in breast cancer screening orders; and 4.9 percentage points in colon cancer screening orders. Cervical cancer screening orders followed a similar pattern, with an increase of 2.3 percentage points in the adjusted screening order rate among scribed providers, compared to nonscribed providers, during implementation of scribes—although the increase was not significant. These findings did not change in analyses focused on nonpreventive visits.
Continue to: Our findings are consistent
Our findings are consistent with those of earlier studies. Prior examinations in ambulatory specialties found that scribes increased HCC coding,4 LOS billing,24 and pay-for-performance metrics.18 The only study to examine these areas in primary care found that scribes were associated with increased pay-for-performance measure documentation,20 a change that is necessary but insufficient to realize increased pay-for-performance revenue. Therefore, our study confirms, for the first time, that PCPs can better address pay-for-performance measures, LOS billing, and HCC coding when working with a scribe in primary care.
Demands on primary care visits are increasing.28 Physicians are required to provide more documentation; there is greater emphasis on PCPs meeting pay-for-performance measures; and there are more data in the EMR to review. In this context, addressing pay-for-performance measures and gaps in risk coding is likely to be increasingly challenging. Our study suggests that scribes might provide a mechanism to increase risk coding, LOS billing, and pay-for-performance measures, despite increased demands on primary care visits.
Increase in LOS billing. In the settings in which we work, a fee-for-service LOS 4 primary care visit generates, on average, $20 to $75 more in revenue than an LOS 3 visit. Using an average of $50 additional revenue for LOS 4 billing, we estimate that a full-time scribe is associated with roughly $7,000 in additional revenue annually. We arrived at this estimate using an average of 1500 visits at LOS ≤ 3 for every PCP full-time equivalent. A 9.2 percentage–point increase in LOS 4 billing would lead to roughly 140 additional LOS 4 visits, with each visit generating an additional $50 in revenue.
This analysis does not account for increased revenue associated with increased pay for HCC coding identified in our study.
Furthermore, in our conservative assumption, the entire increase in LOS billing was from level 3 to level 4; in fact, a small percentage of that increase would be from level 2 and another small percentage would be to level 5—both of which would generate additional revenue. Our assumption therefore underestimates the full financial value associated with scribes in the absence of increased patient volume. Nonetheless, the assumption suggests that increases in LOS billing offset a substantial percentage of a scribe’s salary.
Continue to: Limitations of this study
Limitations of this study. Our study should be interpreted in the context of several limitations:
- The study was conducted at 1 institution. Our findings might not be generalizable beyond this setting.
- The study measures the impact of scribes when providers work with scribes part time. Because providers who utilize a scribe for all, or nearly all, their visits are likely to use a scribe more efficiently, our study might underestimate the full impact of a scribe.
- In some settings, team members such as medical assistants are trained to assist with documentation and other responsibilities (such as closing care gaps) in addition to other patient care responsibilities.29-32 The extent to which our findings transfer to other models is unclear; studies comparing the impact of other models (which might provide even stronger outcomes) to the impact of medical scribes would be an interesting area for further research.
- In addition to the variability of models, there is likely variability in the quality and interactions of medical scribes, which might impact outcomes. We did not examine the qualities of scribes that led to outcomes in this study.
- We examined the impact of scribes on quality measure–ordering behaviors of providers, not on whether quality measures actually improved. Because scribes are associated with more face-to-face time with patients,27 they might allow for increased attention being paid by physicians to barriers to pay-for-performance measures (eg, patient education). This could increase the likelihood that patients complete a multitude of screenings, and thus improve adherence and follow-up. However, the impact of scribes on quality measures is a topic for future study.
Value beyond volume. Any limitations notwithstanding, our study suggests that scribes are associated with financial benefit in addition to the benefit of increased volume. Primary care practices should therefore consider the financial benefit of scribes independent of their ability to add patient volume. By recognizing this additive value, primary care practices might more fully capture the benefit of scribes, which might then allow practices to employ scribes with less demand to increase volume. This added support without increased volume would, in turn, likely reduce provider burnout (and the costly associated turnover) and increase patient satisfaction, leading to a synergistic financial benefit.
CORRESPONDENCE
Wayne Altman, MD, FAAFP, Tufts University School of Medicine, 200 Harrison Avenue, Boston, MA 02111; wayne. altman@tufts.edu
1. Gellert GA, Ramirez R, Webster SL. The rise of the medical scribe industry: implications for the advancement of electronic health records. JAMA. 2015;313:1315-1316. doi: 10.1001/jama.2014.1712
2. Cho J, Sanchez K, Ganor O, et al. Utilizing a physician scribe in a pediatric plastic surgical practice: a time-driven activity-based costing study. Plast Reconstr Surg Glob Open. 2019;7:e2460. doi: 10.1097/GOX.0000000000002460
3. Danak SU, Guetterman TC, Plegue MA, et al. Influence of scribes on patient-physician communication in primary care encounters: mixed methods study. JMIR Med Inform. 2019;7:e14797. doi: 10.2196/14797
4. Martel ML, Imdieke BH, Holm KM, et al. Developing a medical scribe program at an academic hospital: the Hennepin County Medical Center experience. Jt Comm J Qual Patient Saf. 2018;44:238-249. doi: 10.1016/j.jcjq.2018.01.001
5. Mishra P, Kiang JC, Grant RW. Association of medical scribes in primary care with physician workflow and patient experience. JAMA Intern Med. 2018;178:1467-1472. doi: 10.1001/ jamainternmed.2018.3956
6. Taylor KA, McQuilkin D, Hughes RG. Medical scribe impact on patient and provider experience. Mil Med. 2019;184:388-393. doi: 10.1093/milmed/usz030
7. Gidwani R, Nguyen C, Kofoed A, et al. Impact of scribes on physician satisfaction, patient satisfaction, and charting efficiency: a randomized controlled trial. Ann Fam Med. 2017;15:427-433. doi: 10.1370/afm.2122.
8. Heckman J, Mukamal KJ, Christensen A, et al. Medical scribes, provider and patient experience, and patient throughput: a trial in an academic general internal medicine practice. J Gen Intern Med. 2019;35:770-774. doi: 10.1007/s11606-019-05352-5
9. Koshy S, Feustel PJ, Hong M, et al. Scribes in an ambulatory urology practice: patient and physician satisfaction. J Urol. 2010;184:258-262. doi: 10.1016/j.juro.2010.03.040
10. McCormick BJ, Deal A, Borawski KM, et al. Implementation of medical scribes in an academic urology practice: an analysis of productivity, revenue, and satisfaction. World J Urol. 2018;36:1691-1697. doi: 10.1007/s00345-018-2293-8
11. Pozdnyakova A, Laiteerapong N, Volerman A, et al. Impact of medical scribes on physician and patient satisfaction in primary care. J Gen Intern Med. Jul 2018;33:1109-1115. doi: 10.1007/ s11606-018-4434-6
12. Bank AJ, Obetz C, Konrardy A, et al. Impact of scribes on patient interaction, productivity, and revenue in a cardiology clinic: a prospective study. Clinicoecon Outcomes Res. 2013;5:399-406. doi: 10.2147/CEOR.S49010
13. Danila MI, Melnick JA, Curtis JR, et al. Use of scribes for documentation assistance in rheumatology and endocrinology clinics: impact on clinic workflow and patient and physician satisfaction. J Clin Rheumatol. 2018;24:116-121. doi: 10.1097/ RHU.0000000000000620
14. Keefe KR, Levi JR, Brook CD. The impact of medical scribes on patient satisfaction in an academic otolaryngology clinic. Ann Otol Rhinol Laryngol. 2020;129:238-244. doi: 10.1177/0003489419884337
15. Lowry C, Orr K, Embry B, et al. Primary care scribes: writing a new story for safety net clinics. BMJ Open Qual. 2017;6:e000124. doi: 10.1136/bmjoq-2017-000124
16. Rohlfing ML, Keefe KR, Komshian SR, et al. Clinical scribes and their association with patient experience in the otolaryngology clinic. Laryngoscope. 2020;130:e134-e139. doi: 10.1002/ lary.28075
17. Arya R, Salovich DM, Ohman-Strickland P, et al. Impact of scribes on performance indicators in the emergency department. Acad Emerg Med. 2010;17:490-494. doi: 10.1111/j.1553- 2712.2010.00718.x
18. Ewelukwa O, Perez R, Carter LE, et al. Incorporation of scribes into the inflammatory bowel disease clinic improves quality of care and physician productivity. Inflamm Bowel Dis. 2018;24: 552-557. doi: 10.1093/ibd/izx078
19. Misra-Hebert AD, Yan C, Rothberg MB. Physician, scribe, and patient perspectives on clinical scribes in primary care. J Gen Intern Med. 2017;32:244. doi: 10.1007/s11606-016-3888-7
20. Platt J, Altman W. Can medical scribes improve quality measure documentation? J Fam Pract. Jun 2019;68:e1-e7.
21. Guglielmo WJ. What a scribe can do for you. Med Econ. Jan 6 2006;83:42,44-46.
22. Richmond M. Don’t use scribes for order entry. Emergency Medicine News. 2009;31:6-7. doi: 10.1097/01.EEM.0000360578.87654.cc
23. Schiff GD, Zucker L. Medical scribes: salvation for primary care or workaround for poor EMR usability? J Gen Intern Med. 2016;31:979-981. doi: 10.1007/s11606-016-3788-x
24. Bank AJ, Gage RM. Annual impact of scribes on physician productivity and revenue in a cardiology clinic. Clinicoecon Outcomes Res. 2015;7:489-495. doi: 10.2147/CEOR.S89329
25. Heaton HA, Castaneda-Guarderas A, Trotter ER, et al. Effect of scribes on patient throughput, revenue, and patient and provider satisfaction: a systematic review and meta-analysis. Am J Emerg Med. 2016;34:2018-2028. doi: 10.1016/j.ajem.2016.07.056
26. Earls ST, Savageau JA, Begley S, et al. Can scribes boost FPs’ efficiency and job satisfaction? J Fam Pract. 2017;66:206-214.
27. Zallman L, Finnegan K, Roll D, et al. Impact of medical scribes in primary care on productivity, face-to-face time, and patient comfort. J Am Board Fam Med. 2018;31:612-619. doi: 10.3122/ jabfm.2018.04.170325
28. Abbo ED, Zhang Q, Zelder M, et al. The increasing number of clinical items addressed during the time of adult primary care visits. J Gen Intern Med. 2008;23:2058-2065. doi: 10.1007/s11606- 008-0805-8
29. Ammann Howard K, Helé K, Salibi N, et al. Adapting the EHR scribe model to community health centers: the experience of Shasta Community Health Center’s pilot. Blue Shield of California Foundation; 2012. Accessed April 28, 2021. https:// blueshieldcafoundation.org/sites/default/files/publications/ downloadable/Shasta%20EHR%20Scribes%20Final%20Report.pdf
30. Anderson P, Halley MD. A new approach to making your doctor– nurse team more productive. Fam Pract Manag. 2008;15:35-40.
31. Blash L, Dower C, Chapman SA. University of Utah community clinics—medical assistant teams enhance patient-centered, physician-efficient care. Center for the Health Professions at UCSF; April 2011. Revised November 2011. Accessed April 28, 2021. https://healthforce.ucsf.edu/sites/healthforce.ucsf.edu/ files/publication-pdf/3.1%202011_04_University_of_Utah_Community_Clinics--Medical_Assistant_Teams_Enhance_PatientCentered_Physician-Efficient%20Care.pdf
32. Reuben DB, Knudsen J, Senelick W, et al. The effect of a physician partner program on physician efficiency and patient satisfaction. JAMA Intern Med. 2014;174:1190-1193. doi: 10.1001/ jamainternmed.2014.1315

Evaluation of Pharmacologic Interventions for Weight Management in a Veteran Population
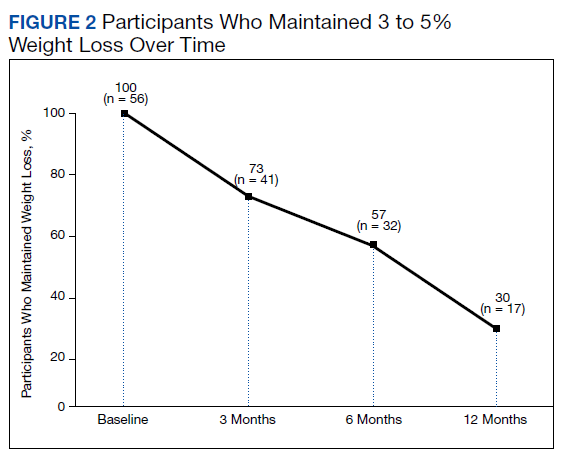
The American Heart Association, the American College of Cardiology, and the Obesity Society define overweight as a body mass index (BMI) of 25 to 29.9 and obesity as a BMI ≥ 30. Morbid obesity is defined as a BMI ≥ 35 or 40.2,3 Based on these BMI cutoffs, the Endocrine Society recommends diet and lifestyle as the foundation of weight management and pharmacotherapy for those with a BMI ≥ 30 without comorbidities. In patients with a BMI ≥ 27, weight management medications may be considered if a patient has comorbid hypertension, T2DM, dyslipidemia, metabolic syndrome, obstructive sleep apnea, or nonalcoholic fatty liver disease. Patients with BMI > 40 are eligible for weight loss surgery.4
Lifestyle and dietary interventions are the foundation of current weight management guidelines from the Endocrine Society.4 At a minimum, guidelines recommended enrolling motivated patients in a high-intensity lifestyle intervention class of at least 14 sessions in the first 6 months to reach a goal weight loss of 5 to 10% from baseline and to maintain a reduction of 3 to 5% from baseline.3 Medications are recommended as an adjunct to lifestyle and dietary changes. Most weight management medications work in the brain to stimulate satiety signaling, which helps motivated patients adhere to their dietary interventions, assist those who have been unsuccessful in earlier weight loss attempts, and help maintain weight.3,4
Guidelines recommend 7 weight management medications, including orlistat (both prescription strength and over-the-counter), liraglutide, phentermine, phentermine/topiramate, lorcaserin, and naltrexone/bupropion. Using medications to assist with weight loss increases likelihood that patients will achieve 5 to 10% weight loss from baseline.5,6 Studies looking at long-term effects of these medications on weight loss have found improvements in blood pressure (BP), biomarkers for cardiovascular disease, and T2DM-related comorbidities.3,5,7
Positive effects on comorbidities have been found to be related to drug class and mechanism of action (MOA); those that also are approved for T2DM have demonstrated the most favorable cardiovascular effects.7 Other medications that work as stimulants or as modulators of serotonin pathways are associated with increased risks, prompting the US Food and Drug Administration (FDA) to remove some medications from the market.7,8 In January 2020, lorcaserin was taken off the market because of increased risk of cancer found in postmarketing surveillance.9 The benefit of weight loss must be weighed against the risk of medication use.
Monthly follow-up is recommended with weight management medications in the beginning to assess safety and efficacy; medications should be discontinued if weight loss is inadequate in the first 3 months.1,3,4 Limited studies have assessed the long-term use of weight management medications in a real-world setting. Medications are prescribed for weight management at Veteran Health Indiana (VHI) in outpatient clinics, including primary care, endocrinology, and gastrointestinal (GI) specialties. However, prescribing practices, outcomes, and adherence to guideline recommendations have not been studied. Data from this study will be used to better understand how VHI can serve its veterans through diet, lifestyle, and pharmacologic interventions.
Methods
We conducted a single-center, retrospective chart review for patients started on weight management medications at VHI. A patient list was generated based on prescription fills from June 1, 2017 to June 30, 2019. All data were obtained using the Computerized Patient Record System and patients were not contacted. This study was approved by the Indiana University Health Institutional Review Board and the VHI Research and Development Committee.
At the time of study, orlistat, liraglutide, phentermine/topiramate,
Patients were included in the study if they received a prescription of any 1 of the 5 available medications during the enrollment period. Patients were excluded if they received a prescription from or were treated by a civilian health care provider, if they never used the medication, or if their weight loss was attributed to a cancer diagnosis. These criteria produced 86 patients of whom 96 unique weight loss prescriptions were generated. Data were collected for each instance of medication use so that some patients were included multiple times. In this case, data collection for the failed medication ended when failure was documented, and new data points began when new medication was prescribed; all data collected were per medication, not per patient. This method was used to account for medication failure and provide accurate weight loss results based on medication choice within this institution.
The primary outcomes included total weight loss and weight loss as a percentage of baseline weight at 3, 6, 12, and > 12 months of therapy. Secondary outcomes included weight loss of 5% from baseline, rate of successful weight maintenance after initial weight loss of 5% from baseline, adverse drug reaction (ADR) monitoring, and use of weight management medications across clinics at VHI.
Demographic data included race, age, sex, baseline weight, BMI, and comorbid medical conditions. Comorbidities were collected based on the most recent primary care clinical note before initiating medication. Medication data collected included medications used to manage comorbidities. Data related to weight management medication included prescribing clinic, reason for medication discontinuation, or bariatric surgery intervention if applicable.
Efficacy outcome data included weight and BMI across therapy duration. Safety outcomes data included heart rate, BP, and ADRs that resulted in medication discontinuation as documented in the electronic health record (EHR).
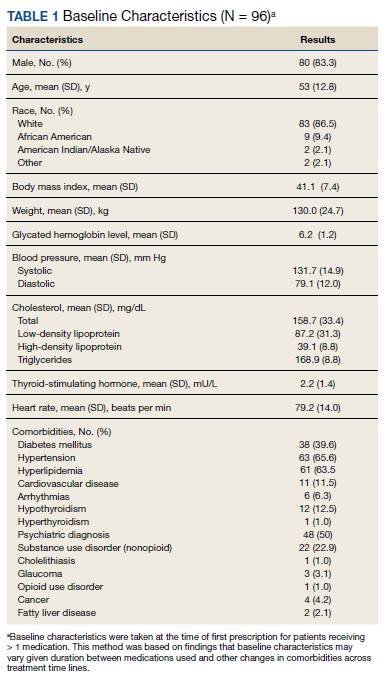
We used descriptive statistics, including mean, standard deviation (SD), range, and percentage. For continuous data, Kruskal-Wallis tests were used because of nonparametric data distribution among the different medications with a prespecified α = 0.05. With the observed sample sizes and SDs in this study, post hoc poststudy power calculations showed that the study had 80% power at a 5% significance level to detect weight changes of 8.6 kg, 7.3 kg, and 12.4 kg at 3, 6, and 12 months, respectively, using nonparametric tests.
Results
A total of 86 patients were identified based on prescription fills, which produced 99 unique instances of medication use. Of the 99 identified, 3 met exclusion criteria and were not included in the final analysis. Among included veterans, 16 were female and 80 were male (Table 1). Most of those included identified as White race (86%), male (83%), and mean age 53 years. At baseline, mean weight was 130 kg and mean BMI 41.
Comorbidities and Medication Use
Hypertension (66%), hyperlipidemia (64%), and psychiatric diagnoses (50%) were most common comorbid conditions. Substance use (23%) and T2DM (40%) were the most common comorbidities influencing medication choice. Substance use evaluation included amphetamines and cocaine for this analysis.
Phentermine/topiramate is the preferred first-line agent unless patients have contraindications for use, in which case naltrexone/bupropion is recommended, based on guidelines for weight management medications within the VHI system. However, for patients with comorbid T2DM, liraglutide is preferred because of its beneficial effects for both weight loss and blood glucose control.2 Most patients at VHI were started on liraglutide (44%) or phentermine/topiramate (42%), which was in line with recommendations. Our sample included ≥ 1 prescription for each medication available at our facility, although the number of patients on each medication was not equal. Of note, the one patient taking lorcaserin at the time of study discontinued therapy in response to recent FDA guidance.9
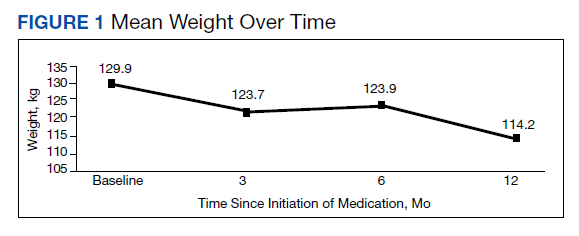
Medications for comorbid conditions could contribute to weight gain. Of the patient sample, β blockers (n = 24) and anticonvulsants, including gabapentin and pregabalin (n = 22) were the most common Other medications that could have contributed to weight gain included sulfonylureas (n = 5), antipsychotics (n = 4), tricyclic antidepressants (n = 2), and hormone replacement therapies (n = 2).
Primary Outcomes
The mean weight of participants dropped from 129.9 to 114.2 kg over the 12 months of weight management medication therapy for a absolute difference of 15.8 kg (Figure 1 and eTable 1 available at doi:10.12788/fp.0117). Weight loss was recorded at 3, 6, 12, and > 12 months of weight management therapy. At each time point, weight loss was statistically significant (P < .001) compared with baseline (Table 2), even though not every patient had weight loss records at each time point.
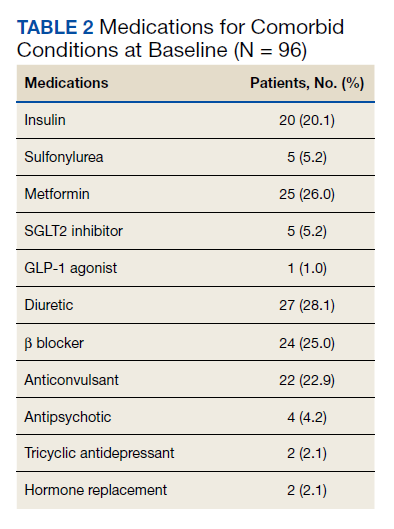
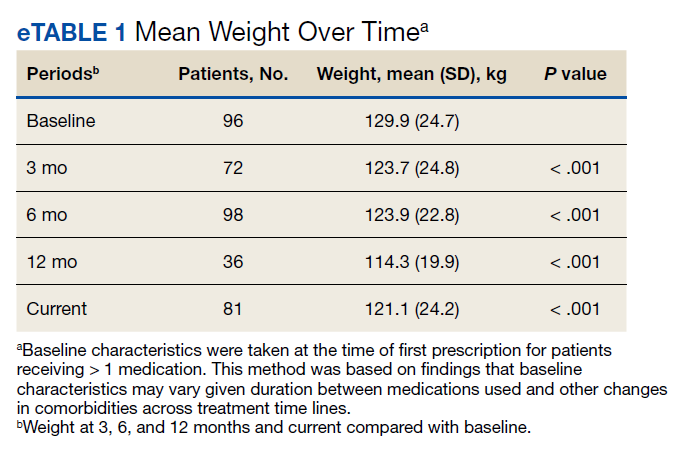
When classified by medication choice,
Secondary Outcomes
More than one-half of the patients analyzed lost 5 to 10% from baseline while taking weight management medication.

Among patients who lost at least 5% from baseline, we performed further analysis to assess weight maintenance of 3 to 5% from baseline for 12 months.

We found that most of our prescriptions (n = 50) were entered by the endocrinology department in conjunction with the MOVE! program (eTable 3 available at doi:10.12788/fp.0117). All 4 of our primary care clinics prescribed weight loss medication; however, 1 clinic prescribed the most. Other prescriptions came from community-based outpatient clinics or other specialties, including gastroenterology, orthopedics, and sleep medicine.
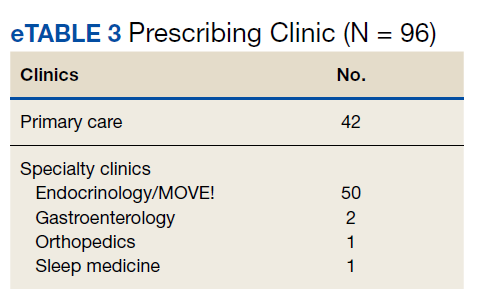
Nineteen (18%) patients experienced an adverse event (AE) that led to medication discontinuation, which was recorded in their chart (eTable 4 available at doi:10.12788/fp.0117). Most common AEs were GI upset with liraglutide or orlistat or dull aching and pain with phentermine/topiramate. Two severe AEs occurred: One patient experienced a change in mental health status and suicide attempt with naltrexone/bupropion; and 1 patient discontinued phentermine/topiramate because of a change in neurologic status.
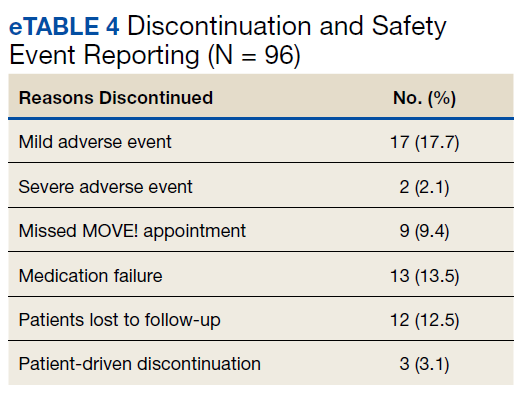
Primarily medications were stopped because of inadequate weight loss (n = 13), and most patients tried additional medications. However, 1 medication failure resulted in sleeve gastrectomy. Other reasons for medication discontinuation included missed MOVE! appointments, patient lost to follow-up, and patient-elected discontinuation.
Discussion
This study evaluated the use and outcomes of weight management medication among veterans at VHI. The study aimed to better understand the efficacy and safety of these medications while exposing potential weaknesses in care and to promote avenues to improve weight loss and maintenance.
Clinical trials for weight management medications reported weight loss of 8 to 10 kg over 56 weeks: 21 to 63% of patients losing at least 5% from baseline weight.10-14 The findings from our study found a higher average weight loss (−15.8 kg) than that reported in trials and a consistent percentage of patients (58.3%) who achieved at least 5% weight loss. It is promising to see that when used in a noncontrolled setting, these medications were able to produce weight loss consistent with results seen in large, controlled trials.
Pi-Sunyer and colleagues found continued weight loss after the initial 5% weight loss to an eventual 10% weight loss in many patients.10 Additionally, Smith and colleagues found that nearly 68% of their participants who took lorcaserin were able to maintain 3 to 5% weight loss over 12 months.13 Sjöström and colleagues acknowledged that many patients taking orlistat for an extended period began to gain weight, although at one-half the rate than that seen in the placebo group.12 This study found that fewer patients were able to maintain their weight loss over 12 months, with only 30% of patients maintaining 3 to 5% weight loss from baseline. This difference in weight maintenance likely was because of the uncontrolled nature of this study. Once patients reach their initial weight loss goal, even the most motivated patients will have trouble maintaining that weight.4 Despite the challenges associated with maintaining weight loss, the quality of life benefits patients gained and potential reductions in health care spending support using resources to improve these outcomes.2,14,15
Pi-Sunyer and colleagues reported high incidences of nausea (40%), vomiting (16%), diarrhea (21%), and constipation (20%) with liraglutide.10 Sjöström and colleagues reported 7% of patients experienced GI upset with orlistat.12 Comparatively, only 17% of our patients reported AEs that required discontinuation, including GI upset. One patient in our study discontinued naltrexone/bupropion because of a significant change in mental status and suicide attempt. Clinical trials did not report a greater risk of depression or suicidality compared with placebo; however, there is a warning on the labeling of naltrexone/bupropion for increased suicidality with the use of antidepressant agents.16,17 The neurologic AE that required discontinuation of phentermine/topiramate at our institution is unique based on published information.11,18
The data from this study reinforced the observation that weight maintenance is the most challenging aspect of weight loss. Although our data showed clinically meaningful weight loss from baseline, many patients regained their weight, and some exceeded their baseline weight. Beyond providing these medications, this evidence suggests the need for close, continued follow-up through patients’ weight loss journey.
Limitations
Because this is a retrospective chart review, data collection was influenced by and limited to information that had been recorded in the EHR. AEs that resulted in medication discontinuation were assessed from the patient’s chart, which might not be correct if providers did not update the records. Follow-up was not always scheduled at regular intervals after medication initiation, resulting in varying sample numbers at each time point, potentially interfering with true weight loss averages. Although not included in this analysis, it might be beneficial to evaluate adherence to recommendations for follow-up with laboratory and weight monitoring to better capture where future monitoring can be improved. Second, there was an unbalanced number of patients taking each medication. Specifically, we saw a change in weight with orlistat that exceeded what is consistently seen in larger, more controlled trials. Although this is an effect of the real world, small sample sizes cannot be generalized to the larger population and might result in data reflecting that of an outlier. Last, there is a lack of generalizability because of the veteran population demographic, which is more male and lacks ethnic diversity. This study also was carried out at a single, educational tertiary medical center, which might not apply to all populations.
Conclusions
Despite the limitations discussed, this study shows that the use of weight management medications in a general veteran population produces initial weight loss consistent with previous studies. However, there is room for continued improvement in follow-up strategies to promote greater weight maintenance after initial weight loss. Considering the high health care costs, personal burden, and potential long-term complications associated with obesity, efforts to promote development of programs that support weight management and maintenance are imperative.
Acknowledgment
This material is the result of work supported with resources and the use of facilities at Veteran Health Indiana.
1. Centers for Disease Control and Prevention. Adult obesity facts. Accessed April 2020. https://www.cdc.gov/obesity/data/adult.html
2. The Management of Overweight and Obesity Working Group. VA/DoD Clinical Practice Guideline for Screening and Management of Overweight and Obesity. Accessed March 13, 2021. https://www.healthquality.va.gov/guidelines/CD/obesity/VADoDCPGManagementOfOverweightAndObesityFinal.pdf
3. Jensen MD, Ryan DH, Apovian CM, et al; American College of Cardiology/American Heart Association Task Force on Practice Guidelines; Obesity Society. 2013 AHA/ACC/TOS guideline for the management of overweight and obesity in adults: a report of the American College of Cardiology/American Heart Association Task Force on Practice Guidelines and the Obesity Society. J Am Coll Cardiol. 2014;63(25, pt B):2985-3023. doi:10.1016/j.jacc.2013.11.004
4. Apovian CM, Aronne LJ, Bessesen DH, et al; Endocrine Society. Pharmacological management of obesity: an Endocrine Society clinical practice guideline. J Clin Endocrinol Metab 2015;100(2):342-362. doi:10.1210/jc.2014-3415
5. Rucker D, Padwal R, Li SK, Curioni C, Lau DCW. Long term pharmacotherapy for obesity and overweight: updated meta-analysis. BMJ. 2007;335(7631):1194-1199. doi:10.1136/bmj.39385.413113.25
6. Siebenhofer A, Winterholer, S, Jeitler K, et al. Long-term effects of weight-reducing drugs in people with hypertension. Cochrane Database Syst Rev 2021;1:CD007654. doi:10.1002/14651858.CD007654.pub5
7. Bramante CT, Raatz S, Bomber EM, Oberle MM, Ryder JR. Cardiovascular risks and benefits of medications used for weight loss. Front Endocrinol (Lausanne). 2020;10:883. doi:10.3389/fendo.2019.00883
8. Christensen R, Kristensen PK, Bartels EM, Bliddal H, Astrup A. Efficacy and safety of the weight-loss drug rimonabant: a meta-analysis of randomized trials. Lancet. 2007;370(9600):1706-1713. doi:10.1016/S0140-6736(07)61721-8
9. US Food and Drug Administration. FDA requests the withdrawal of the weight-loss drug Blevique, Belvique XR (lorcaserin) from the market. Accessed April 2020. https://www.fda.gov/drugs/drug-safety-and-availability/fda-requests-withdrawal-weight-loss-drug-belviq-belviq-xr-lorcaserin-market
10. Pi-Sunyer X, Astrup A, Fujioka K, et al; SCALE Obesity and Prediabetes NN8022-1839 Study Group. A randomized, controlled trial of 3.0 mg of liraglutide in weight management. N Engl J Med. 2015;373(1):11-22. doi:10.1056/NEJMoa1411892
11. Gadde KM, Allison DB, Ryan DH, et al. Effects of low-dose, controlled-release phentermine plus topiramate combination on weight and associated comorbidities in overweight and obese adults (CONQUER): a randomized, placebo-controlled, phase 3 trial. Lancet. 2011;377(9774):1341-1352. doi:10.1016/S0140-6736(11)60205-5
12. Sjöström L, Rissanen A, Andersen T, et al. Randomised placebo-controlled trial of orlistat for weight loss and prevention of weight regain in obese patients. European Multicentre Orlistat Study Group. Lancet. 1998;352(9123):167-172. doi:10.1016/s0140-6736(97)11509-4
13. Smith SR, Weissman NJ, Anderson CM, et al; Behavioral Modification and Lorcaserin for Overweight and Obesity Management (BLOOM) Study Group. Multicenter, placebo-controlled trial of lorcaserin for weight loss. N Engl J Med. 2010;363(3):245-256. doi:10.1056/NEJMoa0909809
14. Warkentin LM, Das D, Majumdar SR, Johnson JA, Padwal RS. The effect of weight loss on health-related quality of life: systematic review and meta-analysis of randomized trials. Obes Rev. 2014;15(3):169-182. doi:10.1111/obr.12113
15. Finkelstein EA, Trogdon JG, Cohen JW, Dietz W. Annual medical spending attributable to obesity: payer-and service-specific estimates. Health Aff (Millwood). 2009;28(5):w822-831. doi:10.1377/hlthaff.28.5.w822
16. Greenway FL, Fujioka K, Plodkowski RA, et al; COR-I Study Group. Effect of naltrexone plus bupropion on weight loss in overweight and obese adults (COR-I): a multicenter, randomized, double-blind, placebo-controlled phase 3 trial. Lancet. 2010;376(9741):595-605. doi:10.1016/S0140-6736(10)60888-4
17. Contrave. Prescribing information. Nalpropion Pharmaceuticals, Inc; 2019.
18. Qsymia. Prescribing information. VIVUS Inc; 2018.
The American Heart Association, the American College of Cardiology, and the Obesity Society define overweight as a body mass index (BMI) of 25 to 29.9 and obesity as a BMI ≥ 30. Morbid obesity is defined as a BMI ≥ 35 or 40.2,3 Based on these BMI cutoffs, the Endocrine Society recommends diet and lifestyle as the foundation of weight management and pharmacotherapy for those with a BMI ≥ 30 without comorbidities. In patients with a BMI ≥ 27, weight management medications may be considered if a patient has comorbid hypertension, T2DM, dyslipidemia, metabolic syndrome, obstructive sleep apnea, or nonalcoholic fatty liver disease. Patients with BMI > 40 are eligible for weight loss surgery.4
Lifestyle and dietary interventions are the foundation of current weight management guidelines from the Endocrine Society.4 At a minimum, guidelines recommended enrolling motivated patients in a high-intensity lifestyle intervention class of at least 14 sessions in the first 6 months to reach a goal weight loss of 5 to 10% from baseline and to maintain a reduction of 3 to 5% from baseline.3 Medications are recommended as an adjunct to lifestyle and dietary changes. Most weight management medications work in the brain to stimulate satiety signaling, which helps motivated patients adhere to their dietary interventions, assist those who have been unsuccessful in earlier weight loss attempts, and help maintain weight.3,4
Guidelines recommend 7 weight management medications, including orlistat (both prescription strength and over-the-counter), liraglutide, phentermine, phentermine/topiramate, lorcaserin, and naltrexone/bupropion. Using medications to assist with weight loss increases likelihood that patients will achieve 5 to 10% weight loss from baseline.5,6 Studies looking at long-term effects of these medications on weight loss have found improvements in blood pressure (BP), biomarkers for cardiovascular disease, and T2DM-related comorbidities.3,5,7
Positive effects on comorbidities have been found to be related to drug class and mechanism of action (MOA); those that also are approved for T2DM have demonstrated the most favorable cardiovascular effects.7 Other medications that work as stimulants or as modulators of serotonin pathways are associated with increased risks, prompting the US Food and Drug Administration (FDA) to remove some medications from the market.7,8 In January 2020, lorcaserin was taken off the market because of increased risk of cancer found in postmarketing surveillance.9 The benefit of weight loss must be weighed against the risk of medication use.
Monthly follow-up is recommended with weight management medications in the beginning to assess safety and efficacy; medications should be discontinued if weight loss is inadequate in the first 3 months.1,3,4 Limited studies have assessed the long-term use of weight management medications in a real-world setting. Medications are prescribed for weight management at Veteran Health Indiana (VHI) in outpatient clinics, including primary care, endocrinology, and gastrointestinal (GI) specialties. However, prescribing practices, outcomes, and adherence to guideline recommendations have not been studied. Data from this study will be used to better understand how VHI can serve its veterans through diet, lifestyle, and pharmacologic interventions.
Methods
We conducted a single-center, retrospective chart review for patients started on weight management medications at VHI. A patient list was generated based on prescription fills from June 1, 2017 to June 30, 2019. All data were obtained using the Computerized Patient Record System and patients were not contacted. This study was approved by the Indiana University Health Institutional Review Board and the VHI Research and Development Committee.
At the time of study, orlistat, liraglutide, phentermine/topiramate,
Patients were included in the study if they received a prescription of any 1 of the 5 available medications during the enrollment period. Patients were excluded if they received a prescription from or were treated by a civilian health care provider, if they never used the medication, or if their weight loss was attributed to a cancer diagnosis. These criteria produced 86 patients of whom 96 unique weight loss prescriptions were generated. Data were collected for each instance of medication use so that some patients were included multiple times. In this case, data collection for the failed medication ended when failure was documented, and new data points began when new medication was prescribed; all data collected were per medication, not per patient. This method was used to account for medication failure and provide accurate weight loss results based on medication choice within this institution.
The primary outcomes included total weight loss and weight loss as a percentage of baseline weight at 3, 6, 12, and > 12 months of therapy. Secondary outcomes included weight loss of 5% from baseline, rate of successful weight maintenance after initial weight loss of 5% from baseline, adverse drug reaction (ADR) monitoring, and use of weight management medications across clinics at VHI.
Demographic data included race, age, sex, baseline weight, BMI, and comorbid medical conditions. Comorbidities were collected based on the most recent primary care clinical note before initiating medication. Medication data collected included medications used to manage comorbidities. Data related to weight management medication included prescribing clinic, reason for medication discontinuation, or bariatric surgery intervention if applicable.
Efficacy outcome data included weight and BMI across therapy duration. Safety outcomes data included heart rate, BP, and ADRs that resulted in medication discontinuation as documented in the electronic health record (EHR).
We used descriptive statistics, including mean, standard deviation (SD), range, and percentage. For continuous data, Kruskal-Wallis tests were used because of nonparametric data distribution among the different medications with a prespecified α = 0.05. With the observed sample sizes and SDs in this study, post hoc poststudy power calculations showed that the study had 80% power at a 5% significance level to detect weight changes of 8.6 kg, 7.3 kg, and 12.4 kg at 3, 6, and 12 months, respectively, using nonparametric tests.
Results
A total of 86 patients were identified based on prescription fills, which produced 99 unique instances of medication use. Of the 99 identified, 3 met exclusion criteria and were not included in the final analysis. Among included veterans, 16 were female and 80 were male (Table 1). Most of those included identified as White race (86%), male (83%), and mean age 53 years. At baseline, mean weight was 130 kg and mean BMI 41.
Comorbidities and Medication Use
Hypertension (66%), hyperlipidemia (64%), and psychiatric diagnoses (50%) were most common comorbid conditions. Substance use (23%) and T2DM (40%) were the most common comorbidities influencing medication choice. Substance use evaluation included amphetamines and cocaine for this analysis.
Phentermine/topiramate is the preferred first-line agent unless patients have contraindications for use, in which case naltrexone/bupropion is recommended, based on guidelines for weight management medications within the VHI system. However, for patients with comorbid T2DM, liraglutide is preferred because of its beneficial effects for both weight loss and blood glucose control.2 Most patients at VHI were started on liraglutide (44%) or phentermine/topiramate (42%), which was in line with recommendations. Our sample included ≥ 1 prescription for each medication available at our facility, although the number of patients on each medication was not equal. Of note, the one patient taking lorcaserin at the time of study discontinued therapy in response to recent FDA guidance.9
Medications for comorbid conditions could contribute to weight gain. Of the patient sample, β blockers (n = 24) and anticonvulsants, including gabapentin and pregabalin (n = 22) were the most common Other medications that could have contributed to weight gain included sulfonylureas (n = 5), antipsychotics (n = 4), tricyclic antidepressants (n = 2), and hormone replacement therapies (n = 2).
Primary Outcomes
The mean weight of participants dropped from 129.9 to 114.2 kg over the 12 months of weight management medication therapy for a absolute difference of 15.8 kg (Figure 1 and eTable 1 available at doi:10.12788/fp.0117). Weight loss was recorded at 3, 6, 12, and > 12 months of weight management therapy. At each time point, weight loss was statistically significant (P < .001) compared with baseline (Table 2), even though not every patient had weight loss records at each time point.
When classified by medication choice,
Secondary Outcomes
More than one-half of the patients analyzed lost 5 to 10% from baseline while taking weight management medication.
Among patients who lost at least 5% from baseline, we performed further analysis to assess weight maintenance of 3 to 5% from baseline for 12 months.
We found that most of our prescriptions (n = 50) were entered by the endocrinology department in conjunction with the MOVE! program (eTable 3 available at doi:10.12788/fp.0117). All 4 of our primary care clinics prescribed weight loss medication; however, 1 clinic prescribed the most. Other prescriptions came from community-based outpatient clinics or other specialties, including gastroenterology, orthopedics, and sleep medicine.
Nineteen (18%) patients experienced an adverse event (AE) that led to medication discontinuation, which was recorded in their chart (eTable 4 available at doi:10.12788/fp.0117). Most common AEs were GI upset with liraglutide or orlistat or dull aching and pain with phentermine/topiramate. Two severe AEs occurred: One patient experienced a change in mental health status and suicide attempt with naltrexone/bupropion; and 1 patient discontinued phentermine/topiramate because of a change in neurologic status.
Primarily medications were stopped because of inadequate weight loss (n = 13), and most patients tried additional medications. However, 1 medication failure resulted in sleeve gastrectomy. Other reasons for medication discontinuation included missed MOVE! appointments, patient lost to follow-up, and patient-elected discontinuation.
Discussion
This study evaluated the use and outcomes of weight management medication among veterans at VHI. The study aimed to better understand the efficacy and safety of these medications while exposing potential weaknesses in care and to promote avenues to improve weight loss and maintenance.
Clinical trials for weight management medications reported weight loss of 8 to 10 kg over 56 weeks: 21 to 63% of patients losing at least 5% from baseline weight.10-14 The findings from our study found a higher average weight loss (−15.8 kg) than that reported in trials and a consistent percentage of patients (58.3%) who achieved at least 5% weight loss. It is promising to see that when used in a noncontrolled setting, these medications were able to produce weight loss consistent with results seen in large, controlled trials.
Pi-Sunyer and colleagues found continued weight loss after the initial 5% weight loss to an eventual 10% weight loss in many patients.10 Additionally, Smith and colleagues found that nearly 68% of their participants who took lorcaserin were able to maintain 3 to 5% weight loss over 12 months.13 Sjöström and colleagues acknowledged that many patients taking orlistat for an extended period began to gain weight, although at one-half the rate than that seen in the placebo group.12 This study found that fewer patients were able to maintain their weight loss over 12 months, with only 30% of patients maintaining 3 to 5% weight loss from baseline. This difference in weight maintenance likely was because of the uncontrolled nature of this study. Once patients reach their initial weight loss goal, even the most motivated patients will have trouble maintaining that weight.4 Despite the challenges associated with maintaining weight loss, the quality of life benefits patients gained and potential reductions in health care spending support using resources to improve these outcomes.2,14,15
Pi-Sunyer and colleagues reported high incidences of nausea (40%), vomiting (16%), diarrhea (21%), and constipation (20%) with liraglutide.10 Sjöström and colleagues reported 7% of patients experienced GI upset with orlistat.12 Comparatively, only 17% of our patients reported AEs that required discontinuation, including GI upset. One patient in our study discontinued naltrexone/bupropion because of a significant change in mental status and suicide attempt. Clinical trials did not report a greater risk of depression or suicidality compared with placebo; however, there is a warning on the labeling of naltrexone/bupropion for increased suicidality with the use of antidepressant agents.16,17 The neurologic AE that required discontinuation of phentermine/topiramate at our institution is unique based on published information.11,18
The data from this study reinforced the observation that weight maintenance is the most challenging aspect of weight loss. Although our data showed clinically meaningful weight loss from baseline, many patients regained their weight, and some exceeded their baseline weight. Beyond providing these medications, this evidence suggests the need for close, continued follow-up through patients’ weight loss journey.
Limitations
Because this is a retrospective chart review, data collection was influenced by and limited to information that had been recorded in the EHR. AEs that resulted in medication discontinuation were assessed from the patient’s chart, which might not be correct if providers did not update the records. Follow-up was not always scheduled at regular intervals after medication initiation, resulting in varying sample numbers at each time point, potentially interfering with true weight loss averages. Although not included in this analysis, it might be beneficial to evaluate adherence to recommendations for follow-up with laboratory and weight monitoring to better capture where future monitoring can be improved. Second, there was an unbalanced number of patients taking each medication. Specifically, we saw a change in weight with orlistat that exceeded what is consistently seen in larger, more controlled trials. Although this is an effect of the real world, small sample sizes cannot be generalized to the larger population and might result in data reflecting that of an outlier. Last, there is a lack of generalizability because of the veteran population demographic, which is more male and lacks ethnic diversity. This study also was carried out at a single, educational tertiary medical center, which might not apply to all populations.
Conclusions
Despite the limitations discussed, this study shows that the use of weight management medications in a general veteran population produces initial weight loss consistent with previous studies. However, there is room for continued improvement in follow-up strategies to promote greater weight maintenance after initial weight loss. Considering the high health care costs, personal burden, and potential long-term complications associated with obesity, efforts to promote development of programs that support weight management and maintenance are imperative.
Acknowledgment
This material is the result of work supported with resources and the use of facilities at Veteran Health Indiana.
1. Centers for Disease Control and Prevention. Adult obesity facts. Accessed April 2020. https://www.cdc.gov/obesity/data/adult.html
2. The Management of Overweight and Obesity Working Group. VA/DoD Clinical Practice Guideline for Screening and Management of Overweight and Obesity. Accessed March 13, 2021. https://www.healthquality.va.gov/guidelines/CD/obesity/VADoDCPGManagementOfOverweightAndObesityFinal.pdf
3. Jensen MD, Ryan DH, Apovian CM, et al; American College of Cardiology/American Heart Association Task Force on Practice Guidelines; Obesity Society. 2013 AHA/ACC/TOS guideline for the management of overweight and obesity in adults: a report of the American College of Cardiology/American Heart Association Task Force on Practice Guidelines and the Obesity Society. J Am Coll Cardiol. 2014;63(25, pt B):2985-3023. doi:10.1016/j.jacc.2013.11.004
4. Apovian CM, Aronne LJ, Bessesen DH, et al; Endocrine Society. Pharmacological management of obesity: an Endocrine Society clinical practice guideline. J Clin Endocrinol Metab 2015;100(2):342-362. doi:10.1210/jc.2014-3415
5. Rucker D, Padwal R, Li SK, Curioni C, Lau DCW. Long term pharmacotherapy for obesity and overweight: updated meta-analysis. BMJ. 2007;335(7631):1194-1199. doi:10.1136/bmj.39385.413113.25
6. Siebenhofer A, Winterholer, S, Jeitler K, et al. Long-term effects of weight-reducing drugs in people with hypertension. Cochrane Database Syst Rev 2021;1:CD007654. doi:10.1002/14651858.CD007654.pub5
7. Bramante CT, Raatz S, Bomber EM, Oberle MM, Ryder JR. Cardiovascular risks and benefits of medications used for weight loss. Front Endocrinol (Lausanne). 2020;10:883. doi:10.3389/fendo.2019.00883
8. Christensen R, Kristensen PK, Bartels EM, Bliddal H, Astrup A. Efficacy and safety of the weight-loss drug rimonabant: a meta-analysis of randomized trials. Lancet. 2007;370(9600):1706-1713. doi:10.1016/S0140-6736(07)61721-8
9. US Food and Drug Administration. FDA requests the withdrawal of the weight-loss drug Blevique, Belvique XR (lorcaserin) from the market. Accessed April 2020. https://www.fda.gov/drugs/drug-safety-and-availability/fda-requests-withdrawal-weight-loss-drug-belviq-belviq-xr-lorcaserin-market
10. Pi-Sunyer X, Astrup A, Fujioka K, et al; SCALE Obesity and Prediabetes NN8022-1839 Study Group. A randomized, controlled trial of 3.0 mg of liraglutide in weight management. N Engl J Med. 2015;373(1):11-22. doi:10.1056/NEJMoa1411892
11. Gadde KM, Allison DB, Ryan DH, et al. Effects of low-dose, controlled-release phentermine plus topiramate combination on weight and associated comorbidities in overweight and obese adults (CONQUER): a randomized, placebo-controlled, phase 3 trial. Lancet. 2011;377(9774):1341-1352. doi:10.1016/S0140-6736(11)60205-5
12. Sjöström L, Rissanen A, Andersen T, et al. Randomised placebo-controlled trial of orlistat for weight loss and prevention of weight regain in obese patients. European Multicentre Orlistat Study Group. Lancet. 1998;352(9123):167-172. doi:10.1016/s0140-6736(97)11509-4
13. Smith SR, Weissman NJ, Anderson CM, et al; Behavioral Modification and Lorcaserin for Overweight and Obesity Management (BLOOM) Study Group. Multicenter, placebo-controlled trial of lorcaserin for weight loss. N Engl J Med. 2010;363(3):245-256. doi:10.1056/NEJMoa0909809
14. Warkentin LM, Das D, Majumdar SR, Johnson JA, Padwal RS. The effect of weight loss on health-related quality of life: systematic review and meta-analysis of randomized trials. Obes Rev. 2014;15(3):169-182. doi:10.1111/obr.12113
15. Finkelstein EA, Trogdon JG, Cohen JW, Dietz W. Annual medical spending attributable to obesity: payer-and service-specific estimates. Health Aff (Millwood). 2009;28(5):w822-831. doi:10.1377/hlthaff.28.5.w822
16. Greenway FL, Fujioka K, Plodkowski RA, et al; COR-I Study Group. Effect of naltrexone plus bupropion on weight loss in overweight and obese adults (COR-I): a multicenter, randomized, double-blind, placebo-controlled phase 3 trial. Lancet. 2010;376(9741):595-605. doi:10.1016/S0140-6736(10)60888-4
17. Contrave. Prescribing information. Nalpropion Pharmaceuticals, Inc; 2019.
18. Qsymia. Prescribing information. VIVUS Inc; 2018.
Outcomes Associated With Pharmacist- Led Consult Service for Opioid Tapering and Pharmacotherapy
In the late 1980s and early 1990s, an emphasis on better pain management led health care professionals (HCPs) to increase prescribing of opioids to better manage patient’s pain. In 1991, 76 million prescriptions were written for opioids in the United States, and by 2011, the number had nearly tripled to 219 million.1 Overdose rates increased as well, nearly tripling from 1999 to 2014.2 Of the 52,404 US deaths from drug overdoses in the in 2015, 63% involved an opioid.2
Opioid Safety Initiative
In response to the growing opioid epidemic, the US Department of Veterans Affairs (VA) created the Opioid Safety Initiative in 2014.3 This comprehensive, multifaceted initiative was designed to improve the care and safety of veterans managed with opioid therapy and promote rational opioid prescribing and monitoring. In 2016 the Centers for Disease Control and Prevention (CDC) issued guidelines for opioid prescriptions, and the following year the VA and the US Department of Defense (DoD) updated the VA/DoD Clinical Practice Guidelines for Opioid Therapy for Chronic Pain (VA/DoD guidelines).4,5 After the release of these guidelines, the use of opioid tapers expanded. However, due to public outcry of forced opioid tapering in 2019, the US Food and Drug Administration updated its opioid labeling requirements to provide clearer guidance on opioid tapers for tolerant patients.6,7
As a result, HCPs began to develop various strategies to balance the safety and efficacy of opioid use in patients with chronic pain. The West Palm Beach VA Medical Center (WPBVAMC) in Florida has a Pain Clinic that includes 2 pain management clinical pharmacy specialists (CPSs) with specialized training in pain management, who are uniquely qualified to assess and evaluate medication therapy in complex pain patient cases. These CPSs were involved in the face-to-face management of patients requiring specialized pain care and participated in a pain pharmacy electronic consult (eConsult) service to document pain management consultative recommendations for patients appropriate for management at the primary care level. This formalized process increased specialty pain care access for veterans whose pain was managed by primary care providers (PCPs).
The pain pharmacy eConsult service was initiated at the WPBVAMC in June 2013 to assist PCPs in the management of outpatients with chronic pain. The eConsult service includes evaluation of a patient’s electronic health records (EHRs) by CPSs. The eConsult service also provided PCPs with the option to engage a pharmacist who could provide recommendations for opioid dosing conversion, opioid tapering, pain pharmacotherapy, or drug screen interpretation, without the necessity for an additional patient visit.
Subsequent to the release of the 2016 CDC (and later the 2017 VA/DoD) guidelines recommending reducing morphine equivalent daily dose (MEDD) levels, the WPBVAMC had a large increase in pain eConsult requests for opioid tapering and opioid pharmacotherapy. A 3.4-fold increase in requests occurred in March, April, and May vs the following 9 months, and a nearly 4-fold increase in requests for opioid tapers during the same period. However, the impact of the completed eConsults was unclear. Therefore, the primary objective of this study was to assess the effect of CPS services for opioid tapering and opioid pharmacotherapy by quantifying the number of recommendations accepted/implemented by PCPs. The secondary objectives included evaluating harms associated with the recommendations (eg, increase in visits to the emergency department [ED], hospitalizations, suicide attempts, or PCP visits) and provider satisfaction.
Methods
A retrospective chart review was completed to assess data of patients from the WPBVAMC and its associated community-based outpatient clinics (CBOCs). The project was approved by the WPBVAMC Scientific Advisory Committee as part of the facility’s performance improvement efforts.
Included patients had a pain pharmacy eConsult placed between April 1, 2016 and March 31, 2017. EHRs were reviewed and only eConsults for opioid pharmacotherapy recommendation or opioid tapers were evaluated. eConsults were excluded if the request was discontinued, completed by a HCP other than the pain CPS, or placed for an opioid dose conversion, nonopioid pharmacotherapy, or drug screen interpretation.
Data for analyses were entered into Microsoft Excel 2016 and were securely saved and accessible to relevant researchers. Patient protected health information used during patient care remained confidential.
Demographic data were collected, including age, gender, race, pertinent medical comorbidities (eg, diabetes mellitus, sleep apnea), and mental health comorbidities. Pain scores were collected at baseline and 6-months postconsult. Pain medications used by patients were noted at baseline and 6 months postconsult, including concomitant opioid and benzodiazepine use, MEDD, and other pain medication. The duration of time needed by pain CPS to complete each eConsult and total time from eConsult entered to HCP implementation of the initial recommendation was collected. The number of actionable recommendations (eg, changes in drug therapy, urine drug screens [UDSs], and referrals to other services also were recorded and reviewed 6 months postconsult to determine the number and percentage of recommendations implemented by the HCP. The EHR was examined to determine adverse events (AEs) (eg, any documentation of suicide attempt, calls to the Veterans Crisis Line, or death 6 month postconsult). Collected data also included new eConsults, the reason for opioid tapering either by HCP or patient, and assessment of economic harms (count of the number of visits to ED, hospitalizations, or unscheduled PCP visits with uncontrolled pain as chief reason within 6 months postconsult). Last, PCPs were sent a survey to assess their satisfaction with the pain eConsult service.
Results
Of 517 eConsults received from April 1, 2016 to March 31, 2017, 285 (55.1%) met inclusion criteria (Figure). Using a random number generator, 100 eConsults were further reviewed for outcomes of interest.
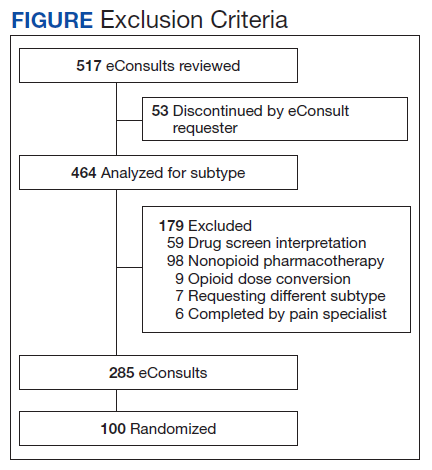
In this cohort, the mean age was 61 years, 87% were male, and 80% were White individuals. Most patients (83%) had ≥ 1 mental health comorbidity, and 53% had ≥ 2, with depressive symptoms, tobacco use, and/or posttraumatic stress disorder the most common diagnoses (Table 1). Eighty-seven percent of eConsults were for opioid tapers and the remaining 13% were for opioid pharmacotherapy.
The median pain score at time of consult was 6 on a 10-point scale, with no change at 6 months postconsult. However, 41% of patients overall had a median 3.3-point drop in pain score, 17% had no change in pain score, and 42% had a median 2.6-point increase in pain score.
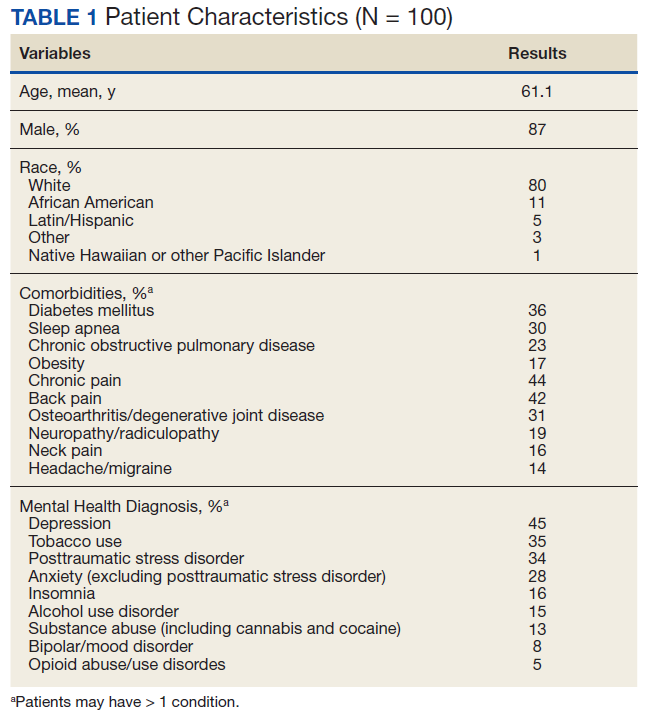
At time of consult, 24% of patients had an opioid and benzodiazepine prescribed concurrently. At the time of the initial request, the mean MEDD was 177.5 mg (median, 165; range, 0-577.5). At 6 months postconsult, the average MEDD was 71 mg (median, 90; range, 0-450) for a mean 44% MEDD decrease. Eighteen percent of patients had no change in MEDD, and 5% had an increase.
One concern was the number of patients whose pain management regimen consisted of either opioids as monotherapy or a combination of opioids and skeletal muscle relaxants (SMRs), which can increase the opioid overdose risk and are not indicated for long-term use (except for baclofen for spasticity). Thirty-five percent of patients were taking either opioid monotherapy or opioids and SMRs for chronic pain management at time of consult and 28% were taking opioid monotherapy or opioids and SMRs 6 months postconsult.
Electronic Consults
Table 2 describes the reasons eConsults were requested. The most common reason was to taper the dose to be in compliance with the CDC 2016 guideline recommendation of MEDD < 90 mg, which was later increased to 100 mg by the VA/DoD guideline.
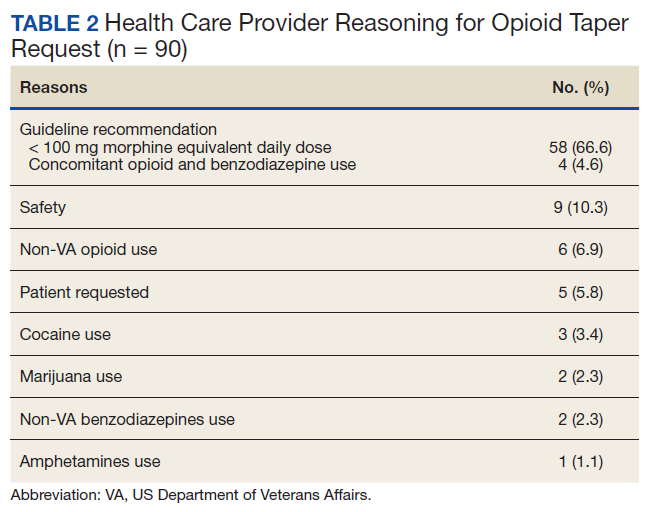
On average, eConsults were completed within a mean of 11.5 days of the PCP request, including nights and weekends. The CPS spent a mean 66.8 minutes to complete each eConsult. Once the eConsult was completed, PCPs took a mean of 9 days to initiate the primary recommendation. This 9-day average does not include 11 eConsults with no accepted recommendations and 11 eConsults for which the PCP implemented the primary recommendation before the CPS completed the consult, most likely due to a phone call or direct contact with the CPS at the time the eConsult was ordered.
A mean 3.5 actionable recommendations were made by the CPS and a mean 1.6 recommendations were implemented within 6 months by the PCP. At least 1 recommendation was accepted/implemented for 89% of patients, with a mean 55% recommendations that were accepted/implemented. Eleven percent of the eConsult final recommendations were not accepted by PCPs and clear documentation of the reasons were not provided.
Adverse Outcomes
In the 6 months postconsult, 11 patients (7 men and 4 women) experienced 32 AEs (Table 3). Eight patients had 15 ED visits, with 3 of the visits resulting in hospitalizations, 8 patients had 9 unscheduled PCP visits, 1 patient reported suicidal ideation and 2 patients made a total of 4 calls to the Veterans Crisis Line. There were also 2 deaths; however, both were due to end-stage disease (cirrhosis and amyotrophic lateral sclerosis) and not believed to be related to eConsult recommendations.
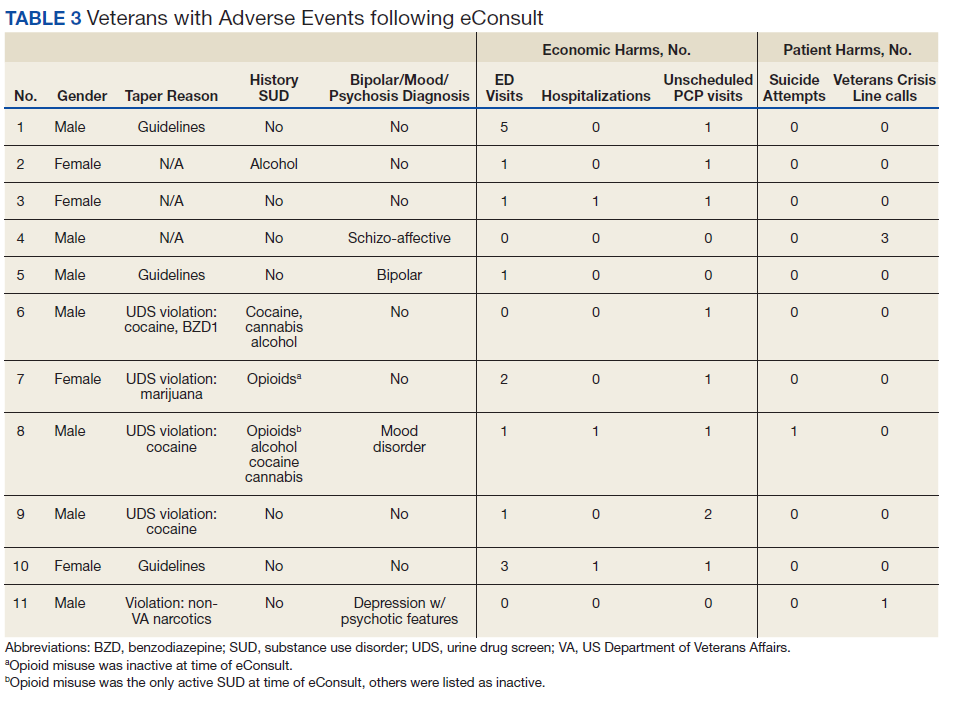
Eight patients had a history of substance use disorders (SUDs) and 8 had a history of a mood disorder or psychosis. One patient had both SUD and a mood/psychosis-related mental health disorder, including a reported suicidal attempt/ideation at an ED visit and a subsequent hospitalization. A similar number of AEs occurred in patients with decreases in MEDD of 0 to 24% compared with those that received more aggressive tapers of 75 to 100% (Table 4).
Nine patients were reconsulted, with only 1 secondary to the PCP not implementing recommendations from the initial consult. No factors were found that correlated with likelihood of a patient being reconsulted.
Surveys on PCP satisfaction with the eConsult service were completed by 29 of the 55 PCPs. PCP feedback was generally positive with nearly 90% of PCPs planning to use the service in the future as well as recommending use to other providers.
PCPs also were given the option to indicate the most important factor for overall satisfaction with eConsult service (time, access, safety, expectations or confidence). Safety was provider’s top choice with time being a close second.
Discussion
Most (89%) PCPs accepted at least 1 recommendation from the completed eConsult, and MEDDs decreased by 60%, likely reducing the patient’s risk of overdose or other AEs from opioids. There also was a slight reduction in patient’s mean pain scores; however, 41% had a decrease and 42% had an increase in pain scores. There was no clear relationship when pain scores were compared with MEDDs, likely giving credence to the idea that pain scores are largely subjective and an unreliable surrogate marker for assessing effectiveness of analgesic regimens.
Eleven patients experienced AEs, including 1 patient for whom the recommendations were not implemented by the PCP. Eight of the 11 had multiple AEs. One interesting finding was that 7 of the 11 patients with an AE tested positive for unexpected substances on routine UDS or were arrested for driving while intoxicated (DWI). However, only 3 of the 7 had an active SUD diagnosis. With 25% of the AEs coming from patients with a history of SUD, it is important that any history of SUD be documented in the EHR. Maintaining this documentation can be especially difficult if patients switch VA medical centers or receive services outside the VA. Thorough and accurate history and chart review should ideally be completed before prescribing opioids.
Guidelines
While the PCPs were following VA/DoD and CDC recommendations for opioid tapering to < 100 or 90 mg MEDD, respectively, there is weak evidence in these guidelines to support specific MEDD cutoffs. The CDC guidelines even state, “a single dosage threshold for safe opioid use could not be identified.”5 One of the largest issues when using MEDD as a cutoff is the lack of agreement on its calculation. In 2014, Nuckols and colleagues al conducted a study to compare the existing guidelines on the use of opioids for chronic pain. While 13 guidelines were considered eligible, most recommendations were supported only by observational data or expert recommendations, and there was no consensus on what constitutes a “morphine equivalent.”8 Currently there is no universally accepted opioid-conversion method, resulting in a substantial problem when calculating a MEDD.9 A survey of 8 online opioid dose conversion tools found a -55% to +242% variation.10 As Fudin and colleagues concluded in response to the large variations found in these various analyses, the studies “unequivocally disqualify the validity of embracing MEDD to assess risk in any meaningful statistical way.”11 Pharmacogenetics, drug tolerance, drug-drug interactions, body surface area, and organ function are patient- specific factors that are not taken into consideration when relying solely on a MEDD calculation. Tapering to lowest functional dose rather than a specific number or cutoff may be a more effective way to treat patients, and providers should use the guidelines as recommendations and not a hardline mandate.
At 6 months, 6 patients were receiving no pain medications from the VA, and 24 of the patients were tapered from their opiate to discontinuation. It is unclear whether patients are no longer taking opioids or switched their care to non-VA providers to receive medications, including opioids, privately. This is difficult to verify, though a prescription drug monitoring program (PDMP) could be used to assess patient adherence. As many of the patients that were tapered due to identification of aberrant behaviors, lack of continuity of care across health care systems may result in future patient harm.
The results of this analysis highlight the importance of checking PDMP databases and routine UDSs when prescribing opioids—there can be serious safety concerns if patients are taking other prescribed or illicit medications. However, care must be taken; there were 2 instances of patients’ chronic opioid prescriptions discontinued by their VA provider after a review of the PDMP showed they had received non-VA opioids. In both cases, the quantity and doses received were small (counts of ≤ 12) and were received more than 6 months prior to the check of the PDMP. While this constitutes a breach of the Informed Consent for long-term opioid use, if there are no other concerning behaviors, it may be more prudent to review the informed consent with the patient and discuss why the behavior is a breach to ensure that patients and PCPs continue to work as a team to manage chronic pain.
Limitations
The study population was one limitation of this project. While data suggest that chronic pain affects women more than men, this study’s population was only 13% female. Thirty percent of the women in this study had an AE compared with only 8% of the men. Additional limitations included use of problem list for comorbidities, as lists may be inaccurate or outdated, and limiting the monitoring of AE to only 6 months. As some tapers were not initiated immediately and some taper schedules can last several months to years; therefor, outcomes may have been higher if patients were followed longer. Many of the patients with AEs had increased ED visits or unscheduled primary care visits as the tapers went on and their pain worsened, but the visits were outside the 6-month time frame for data collection. An additional weakness of this review included assessing a pain score, but not functional status, which may be a better predictor of the effectiveness of a patient’s pain management regimen. This assessment is needed in future studies for more reliable data. Finally, PCP survey results also should be viewed with caution. The current survey had only 29 respondents, and the 2014 survey had only 10 respondents and did not include CBOC providers.
Conclusion
A pain eConsult service managed by CPSs specializing in pain management can assist patients and PCPs with opioid therapy recommendations in a safe and timely manner, reducing risk of overdose secondary to high dose opioid therapy and with limited harm to patients.
1. National Institute on Drug Abuse. Increased drug availability is associated with increased use and overdose. Published June 9, 2020. Accessed February 19, 2021. https://www.drugabuse.gov/publications/research-reports/prescription-opioids-heroin/increased-drug-availability-associated-increased-use-overdose
2. Rudd RA, Seth P, David F, Scholl L. Increases in drug and opioid-involved overdose deaths - United States, 2010-2015. MMWR Morb Mortal Wkly Rep. 2016;65(50-51):1445-1452. Published 2016 Dec 30.doi:10.15585/mmwr.mm655051e1
3. US Department of Veterans Affairs, Office of Inspector General. Healthcare inspection – VA patterns of dispensing take-home opioids and monitoring patients on opioid therapy. Report 14-00895-163. Published May 14, 2014. Accessed February 2, 2021. https://www.va.gov/oig/pubs/VAOIG-14-00895-163.pdf
4. US Department of Veterans Affairs, US Department of Defense, Opioid Therapy for Chronic Pain Work Group. VA/DoD clinical practice guidelines for opioid therapy for chronic pain. Version 3.0. Published December 2017. Accessed February 2, 2021. https://www.va.gov/HOMELESS/nchav/resources/docs/mental-health/substance-abuse/VA_DoD-CLINICAL-PRACTICE-GUIDELINE-FOR-OPIOID-THERAPY-FOR-CHRONIC-PAIN-508.pdf
5. Dowell D, Haegerich TM, Chou R. CDC Guideline for Prescribing Opioids for Chronic Pain - United States, 2016 [published correction appears in MMWR Recomm Rep. 2016;65(11):295]. MMWR Recomm Rep. 2016;65(1):1-49. Published 2016 Mar 18. doi:10.15585/mmwr.rr6501e1.
6. US Food and Drug Administration. (2019). FDA identifies harm reported from sudden discontinuation of opioid pain medicines and requires label changes to guide prescribers on gradual, individualized tapering. Updated April 17, 2019. Accessed February 2, 2021. https://www.fda.gov/drugs/fda-drug-safety-podcasts/fda-identifies-harm-reported-sudden-discontinuation-opioid-pain-medicines-and-requires-label-changes
7. Dowell D, Haegerich T, Chou R. No Shortcuts to Safer Opioid Prescribing. N Engl J Med. 2019;380(24):2285-2287. doi:10.1056/NEJMp1904190
8. Nuckols TK, Anderson L, Popescu I, et al. Opioid prescribing: a systematic review and critical appraisal of guidelines for chronic pain. Ann Intern Med. 2014;160(1):38-47. doi:10.7326/0003-4819-160-1-201401070-00732
9. Rennick A, Atkinson T, Cimino NM, Strassels SA, McPherson ML, Fudin J. Variability in Opioid Equivalence Calculations. Pain Med. 2016;17(5):892-898. doi:10.1111/pme.12920
10. Shaw K, Fudin J. Evaluation and comparison of online equianalgesic opioid dose conversion calculators. Pract Pain Manag. 2013;13(7):61-66.
11. Fudin J, Pratt Cleary J, Schatman ME. The MEDD myth: the impact of pseudoscience on pain research and prescribing-guideline development. J Pain Res. 2016;9:153-156. Published 2016 Mar 23. doi:10.2147/JPR.S107794
In the late 1980s and early 1990s, an emphasis on better pain management led health care professionals (HCPs) to increase prescribing of opioids to better manage patient’s pain. In 1991, 76 million prescriptions were written for opioids in the United States, and by 2011, the number had nearly tripled to 219 million.1 Overdose rates increased as well, nearly tripling from 1999 to 2014.2 Of the 52,404 US deaths from drug overdoses in the in 2015, 63% involved an opioid.2
Opioid Safety Initiative
In response to the growing opioid epidemic, the US Department of Veterans Affairs (VA) created the Opioid Safety Initiative in 2014.3 This comprehensive, multifaceted initiative was designed to improve the care and safety of veterans managed with opioid therapy and promote rational opioid prescribing and monitoring. In 2016 the Centers for Disease Control and Prevention (CDC) issued guidelines for opioid prescriptions, and the following year the VA and the US Department of Defense (DoD) updated the VA/DoD Clinical Practice Guidelines for Opioid Therapy for Chronic Pain (VA/DoD guidelines).4,5 After the release of these guidelines, the use of opioid tapers expanded. However, due to public outcry of forced opioid tapering in 2019, the US Food and Drug Administration updated its opioid labeling requirements to provide clearer guidance on opioid tapers for tolerant patients.6,7
As a result, HCPs began to develop various strategies to balance the safety and efficacy of opioid use in patients with chronic pain. The West Palm Beach VA Medical Center (WPBVAMC) in Florida has a Pain Clinic that includes 2 pain management clinical pharmacy specialists (CPSs) with specialized training in pain management, who are uniquely qualified to assess and evaluate medication therapy in complex pain patient cases. These CPSs were involved in the face-to-face management of patients requiring specialized pain care and participated in a pain pharmacy electronic consult (eConsult) service to document pain management consultative recommendations for patients appropriate for management at the primary care level. This formalized process increased specialty pain care access for veterans whose pain was managed by primary care providers (PCPs).
The pain pharmacy eConsult service was initiated at the WPBVAMC in June 2013 to assist PCPs in the management of outpatients with chronic pain. The eConsult service includes evaluation of a patient’s electronic health records (EHRs) by CPSs. The eConsult service also provided PCPs with the option to engage a pharmacist who could provide recommendations for opioid dosing conversion, opioid tapering, pain pharmacotherapy, or drug screen interpretation, without the necessity for an additional patient visit.
Subsequent to the release of the 2016 CDC (and later the 2017 VA/DoD) guidelines recommending reducing morphine equivalent daily dose (MEDD) levels, the WPBVAMC had a large increase in pain eConsult requests for opioid tapering and opioid pharmacotherapy. A 3.4-fold increase in requests occurred in March, April, and May vs the following 9 months, and a nearly 4-fold increase in requests for opioid tapers during the same period. However, the impact of the completed eConsults was unclear. Therefore, the primary objective of this study was to assess the effect of CPS services for opioid tapering and opioid pharmacotherapy by quantifying the number of recommendations accepted/implemented by PCPs. The secondary objectives included evaluating harms associated with the recommendations (eg, increase in visits to the emergency department [ED], hospitalizations, suicide attempts, or PCP visits) and provider satisfaction.
Methods
A retrospective chart review was completed to assess data of patients from the WPBVAMC and its associated community-based outpatient clinics (CBOCs). The project was approved by the WPBVAMC Scientific Advisory Committee as part of the facility’s performance improvement efforts.
Included patients had a pain pharmacy eConsult placed between April 1, 2016 and March 31, 2017. EHRs were reviewed and only eConsults for opioid pharmacotherapy recommendation or opioid tapers were evaluated. eConsults were excluded if the request was discontinued, completed by a HCP other than the pain CPS, or placed for an opioid dose conversion, nonopioid pharmacotherapy, or drug screen interpretation.
Data for analyses were entered into Microsoft Excel 2016 and were securely saved and accessible to relevant researchers. Patient protected health information used during patient care remained confidential.
Demographic data were collected, including age, gender, race, pertinent medical comorbidities (eg, diabetes mellitus, sleep apnea), and mental health comorbidities. Pain scores were collected at baseline and 6-months postconsult. Pain medications used by patients were noted at baseline and 6 months postconsult, including concomitant opioid and benzodiazepine use, MEDD, and other pain medication. The duration of time needed by pain CPS to complete each eConsult and total time from eConsult entered to HCP implementation of the initial recommendation was collected. The number of actionable recommendations (eg, changes in drug therapy, urine drug screens [UDSs], and referrals to other services also were recorded and reviewed 6 months postconsult to determine the number and percentage of recommendations implemented by the HCP. The EHR was examined to determine adverse events (AEs) (eg, any documentation of suicide attempt, calls to the Veterans Crisis Line, or death 6 month postconsult). Collected data also included new eConsults, the reason for opioid tapering either by HCP or patient, and assessment of economic harms (count of the number of visits to ED, hospitalizations, or unscheduled PCP visits with uncontrolled pain as chief reason within 6 months postconsult). Last, PCPs were sent a survey to assess their satisfaction with the pain eConsult service.
Results
Of 517 eConsults received from April 1, 2016 to March 31, 2017, 285 (55.1%) met inclusion criteria (Figure). Using a random number generator, 100 eConsults were further reviewed for outcomes of interest.
In this cohort, the mean age was 61 years, 87% were male, and 80% were White individuals. Most patients (83%) had ≥ 1 mental health comorbidity, and 53% had ≥ 2, with depressive symptoms, tobacco use, and/or posttraumatic stress disorder the most common diagnoses (Table 1). Eighty-seven percent of eConsults were for opioid tapers and the remaining 13% were for opioid pharmacotherapy.
The median pain score at time of consult was 6 on a 10-point scale, with no change at 6 months postconsult. However, 41% of patients overall had a median 3.3-point drop in pain score, 17% had no change in pain score, and 42% had a median 2.6-point increase in pain score.
At time of consult, 24% of patients had an opioid and benzodiazepine prescribed concurrently. At the time of the initial request, the mean MEDD was 177.5 mg (median, 165; range, 0-577.5). At 6 months postconsult, the average MEDD was 71 mg (median, 90; range, 0-450) for a mean 44% MEDD decrease. Eighteen percent of patients had no change in MEDD, and 5% had an increase.
One concern was the number of patients whose pain management regimen consisted of either opioids as monotherapy or a combination of opioids and skeletal muscle relaxants (SMRs), which can increase the opioid overdose risk and are not indicated for long-term use (except for baclofen for spasticity). Thirty-five percent of patients were taking either opioid monotherapy or opioids and SMRs for chronic pain management at time of consult and 28% were taking opioid monotherapy or opioids and SMRs 6 months postconsult.
Electronic Consults
Table 2 describes the reasons eConsults were requested. The most common reason was to taper the dose to be in compliance with the CDC 2016 guideline recommendation of MEDD < 90 mg, which was later increased to 100 mg by the VA/DoD guideline.
On average, eConsults were completed within a mean of 11.5 days of the PCP request, including nights and weekends. The CPS spent a mean 66.8 minutes to complete each eConsult. Once the eConsult was completed, PCPs took a mean of 9 days to initiate the primary recommendation. This 9-day average does not include 11 eConsults with no accepted recommendations and 11 eConsults for which the PCP implemented the primary recommendation before the CPS completed the consult, most likely due to a phone call or direct contact with the CPS at the time the eConsult was ordered.
A mean 3.5 actionable recommendations were made by the CPS and a mean 1.6 recommendations were implemented within 6 months by the PCP. At least 1 recommendation was accepted/implemented for 89% of patients, with a mean 55% recommendations that were accepted/implemented. Eleven percent of the eConsult final recommendations were not accepted by PCPs and clear documentation of the reasons were not provided.
Adverse Outcomes
In the 6 months postconsult, 11 patients (7 men and 4 women) experienced 32 AEs (Table 3). Eight patients had 15 ED visits, with 3 of the visits resulting in hospitalizations, 8 patients had 9 unscheduled PCP visits, 1 patient reported suicidal ideation and 2 patients made a total of 4 calls to the Veterans Crisis Line. There were also 2 deaths; however, both were due to end-stage disease (cirrhosis and amyotrophic lateral sclerosis) and not believed to be related to eConsult recommendations.
Eight patients had a history of substance use disorders (SUDs) and 8 had a history of a mood disorder or psychosis. One patient had both SUD and a mood/psychosis-related mental health disorder, including a reported suicidal attempt/ideation at an ED visit and a subsequent hospitalization. A similar number of AEs occurred in patients with decreases in MEDD of 0 to 24% compared with those that received more aggressive tapers of 75 to 100% (Table 4).
Nine patients were reconsulted, with only 1 secondary to the PCP not implementing recommendations from the initial consult. No factors were found that correlated with likelihood of a patient being reconsulted.
Surveys on PCP satisfaction with the eConsult service were completed by 29 of the 55 PCPs. PCP feedback was generally positive with nearly 90% of PCPs planning to use the service in the future as well as recommending use to other providers.
PCPs also were given the option to indicate the most important factor for overall satisfaction with eConsult service (time, access, safety, expectations or confidence). Safety was provider’s top choice with time being a close second.
Discussion
Most (89%) PCPs accepted at least 1 recommendation from the completed eConsult, and MEDDs decreased by 60%, likely reducing the patient’s risk of overdose or other AEs from opioids. There also was a slight reduction in patient’s mean pain scores; however, 41% had a decrease and 42% had an increase in pain scores. There was no clear relationship when pain scores were compared with MEDDs, likely giving credence to the idea that pain scores are largely subjective and an unreliable surrogate marker for assessing effectiveness of analgesic regimens.
Eleven patients experienced AEs, including 1 patient for whom the recommendations were not implemented by the PCP. Eight of the 11 had multiple AEs. One interesting finding was that 7 of the 11 patients with an AE tested positive for unexpected substances on routine UDS or were arrested for driving while intoxicated (DWI). However, only 3 of the 7 had an active SUD diagnosis. With 25% of the AEs coming from patients with a history of SUD, it is important that any history of SUD be documented in the EHR. Maintaining this documentation can be especially difficult if patients switch VA medical centers or receive services outside the VA. Thorough and accurate history and chart review should ideally be completed before prescribing opioids.
Guidelines
While the PCPs were following VA/DoD and CDC recommendations for opioid tapering to < 100 or 90 mg MEDD, respectively, there is weak evidence in these guidelines to support specific MEDD cutoffs. The CDC guidelines even state, “a single dosage threshold for safe opioid use could not be identified.”5 One of the largest issues when using MEDD as a cutoff is the lack of agreement on its calculation. In 2014, Nuckols and colleagues al conducted a study to compare the existing guidelines on the use of opioids for chronic pain. While 13 guidelines were considered eligible, most recommendations were supported only by observational data or expert recommendations, and there was no consensus on what constitutes a “morphine equivalent.”8 Currently there is no universally accepted opioid-conversion method, resulting in a substantial problem when calculating a MEDD.9 A survey of 8 online opioid dose conversion tools found a -55% to +242% variation.10 As Fudin and colleagues concluded in response to the large variations found in these various analyses, the studies “unequivocally disqualify the validity of embracing MEDD to assess risk in any meaningful statistical way.”11 Pharmacogenetics, drug tolerance, drug-drug interactions, body surface area, and organ function are patient- specific factors that are not taken into consideration when relying solely on a MEDD calculation. Tapering to lowest functional dose rather than a specific number or cutoff may be a more effective way to treat patients, and providers should use the guidelines as recommendations and not a hardline mandate.
At 6 months, 6 patients were receiving no pain medications from the VA, and 24 of the patients were tapered from their opiate to discontinuation. It is unclear whether patients are no longer taking opioids or switched their care to non-VA providers to receive medications, including opioids, privately. This is difficult to verify, though a prescription drug monitoring program (PDMP) could be used to assess patient adherence. As many of the patients that were tapered due to identification of aberrant behaviors, lack of continuity of care across health care systems may result in future patient harm.
The results of this analysis highlight the importance of checking PDMP databases and routine UDSs when prescribing opioids—there can be serious safety concerns if patients are taking other prescribed or illicit medications. However, care must be taken; there were 2 instances of patients’ chronic opioid prescriptions discontinued by their VA provider after a review of the PDMP showed they had received non-VA opioids. In both cases, the quantity and doses received were small (counts of ≤ 12) and were received more than 6 months prior to the check of the PDMP. While this constitutes a breach of the Informed Consent for long-term opioid use, if there are no other concerning behaviors, it may be more prudent to review the informed consent with the patient and discuss why the behavior is a breach to ensure that patients and PCPs continue to work as a team to manage chronic pain.
Limitations
The study population was one limitation of this project. While data suggest that chronic pain affects women more than men, this study’s population was only 13% female. Thirty percent of the women in this study had an AE compared with only 8% of the men. Additional limitations included use of problem list for comorbidities, as lists may be inaccurate or outdated, and limiting the monitoring of AE to only 6 months. As some tapers were not initiated immediately and some taper schedules can last several months to years; therefor, outcomes may have been higher if patients were followed longer. Many of the patients with AEs had increased ED visits or unscheduled primary care visits as the tapers went on and their pain worsened, but the visits were outside the 6-month time frame for data collection. An additional weakness of this review included assessing a pain score, but not functional status, which may be a better predictor of the effectiveness of a patient’s pain management regimen. This assessment is needed in future studies for more reliable data. Finally, PCP survey results also should be viewed with caution. The current survey had only 29 respondents, and the 2014 survey had only 10 respondents and did not include CBOC providers.
Conclusion
A pain eConsult service managed by CPSs specializing in pain management can assist patients and PCPs with opioid therapy recommendations in a safe and timely manner, reducing risk of overdose secondary to high dose opioid therapy and with limited harm to patients.
1. National Institute on Drug Abuse. Increased drug availability is associated with increased use and overdose. Published June 9, 2020. Accessed February 19, 2021. https://www.drugabuse.gov/publications/research-reports/prescription-opioids-heroin/increased-drug-availability-associated-increased-use-overdose
2. Rudd RA, Seth P, David F, Scholl L. Increases in drug and opioid-involved overdose deaths - United States, 2010-2015. MMWR Morb Mortal Wkly Rep. 2016;65(50-51):1445-1452. Published 2016 Dec 30.doi:10.15585/mmwr.mm655051e1
3. US Department of Veterans Affairs, Office of Inspector General. Healthcare inspection – VA patterns of dispensing take-home opioids and monitoring patients on opioid therapy. Report 14-00895-163. Published May 14, 2014. Accessed February 2, 2021. https://www.va.gov/oig/pubs/VAOIG-14-00895-163.pdf
4. US Department of Veterans Affairs, US Department of Defense, Opioid Therapy for Chronic Pain Work Group. VA/DoD clinical practice guidelines for opioid therapy for chronic pain. Version 3.0. Published December 2017. Accessed February 2, 2021. https://www.va.gov/HOMELESS/nchav/resources/docs/mental-health/substance-abuse/VA_DoD-CLINICAL-PRACTICE-GUIDELINE-FOR-OPIOID-THERAPY-FOR-CHRONIC-PAIN-508.pdf
5. Dowell D, Haegerich TM, Chou R. CDC Guideline for Prescribing Opioids for Chronic Pain - United States, 2016 [published correction appears in MMWR Recomm Rep. 2016;65(11):295]. MMWR Recomm Rep. 2016;65(1):1-49. Published 2016 Mar 18. doi:10.15585/mmwr.rr6501e1.
6. US Food and Drug Administration. (2019). FDA identifies harm reported from sudden discontinuation of opioid pain medicines and requires label changes to guide prescribers on gradual, individualized tapering. Updated April 17, 2019. Accessed February 2, 2021. https://www.fda.gov/drugs/fda-drug-safety-podcasts/fda-identifies-harm-reported-sudden-discontinuation-opioid-pain-medicines-and-requires-label-changes
7. Dowell D, Haegerich T, Chou R. No Shortcuts to Safer Opioid Prescribing. N Engl J Med. 2019;380(24):2285-2287. doi:10.1056/NEJMp1904190
8. Nuckols TK, Anderson L, Popescu I, et al. Opioid prescribing: a systematic review and critical appraisal of guidelines for chronic pain. Ann Intern Med. 2014;160(1):38-47. doi:10.7326/0003-4819-160-1-201401070-00732
9. Rennick A, Atkinson T, Cimino NM, Strassels SA, McPherson ML, Fudin J. Variability in Opioid Equivalence Calculations. Pain Med. 2016;17(5):892-898. doi:10.1111/pme.12920
10. Shaw K, Fudin J. Evaluation and comparison of online equianalgesic opioid dose conversion calculators. Pract Pain Manag. 2013;13(7):61-66.
11. Fudin J, Pratt Cleary J, Schatman ME. The MEDD myth: the impact of pseudoscience on pain research and prescribing-guideline development. J Pain Res. 2016;9:153-156. Published 2016 Mar 23. doi:10.2147/JPR.S107794
Weight Gain in Veterans Taking Duloxetine, Pregabalin, or Both for the Treatment of Neuropathy
Neuropathy is the result of damage to the nervous system. This dysfunction generally occurs in peripheral nerves, which are the circuits that transmit signals to the brain and spinal cord. The peripheral nervous system is responsible for controlling motor and autonomic nerves and conduction of sensory information. Injury to the nervous system can lead to changes in nerve fiber sensitivity and malfunctioning of nerve stimuli pathways. Neuropathy may be a sequela of a wide variety of diseases, including diabetes mellitus (DM), autoimmune disorders, infections, and cancer. Also, neuropathy can be caused by medications, trauma, exposure to toxins, classified idiopathic.1-5
Peripheral neuropathy is a common condition with an estimated incidence of > 3 million cases in the United States per year.4 The burden of neuropathy may be greater among veterans, due to a higher prevalence of type 2 DM (T2DM) and an aging population. Manifestations of neuropathy include weakness, numbness, burning or tingling sensations, and lingering pain.3,5 This can lead to limited mobility and decreased quality of life. Neuropathy can be debilitating, but several medications can be used to alleviate symptoms—including duloxetine and pregabalin. The American Diabetes Association recommends either agent as initial treatment for neuropathic pain in patients with DM.2 As with all medication use, the benefits and risks of treatment must be assessed prior to initiation of therapy.
The Centers for Disease Control and Prevention estimates > 70% of adults in the United States are overweight or obese.6 Excessive weight gain causes a higher risk of developing certain comorbidities, such as coronary artery disease, cerebrovascular accident, T2DM, and cancer, and all can lead to premature death. It is important to avoid excessive weight gain whenever possible, especially in patients already at a high risk for developing these diseases.
The correlation of weight gain in patients taking duloxetine, pregabalin, or both is not well studied. Duloxetine has the potential to cause weight gain or weight loss, with reports of > 1% incidence for either effect.7 Clinical significance of weight changes caused by duloxetine is uncertain.Pregabalin is more likely to cause weight gain, with a reported incidence between 2 and 14%.8 Weight gain may be associated with dose and duration; 1 study demonstrated an average weight gain of about 11 lb after 2 years of pregabalin treatment.8 The medical literature lacks information regarding weight gain associated with combination therapy of duloxetine and pregabalin. The objective of this study was to investigate the association of weight gain in veterans taking duloxetine, pregabalin, or both for the treatment of neuropathy.
Methods
A retrospective, single-center, chart review was conducted at the Sioux Falls Veterans Affairs Health Care System (SFVAHCS). Data were collected through manual chart review of US Department of Veterans Affairs (VA) electronic health records (EHRs). Patients included were veterans aged 18 to 89 years who were initiated on duloxetine and/or pregabalin between October 2015 and September 2018.
The primary end point of this study was the change in body weight, expressed in pounds, after 12 to 18 months of treatment. If multiple weights were obtained during the 12- to 18-month period, the weight recorded closest to 12 months was used. The secondary end points included the percent change in body weight and dose effect, which evaluated change in weight at doses of duloxetine > 60 mg/d, and pregabalin at doses > 300 mg/d. Duration of effect was evaluated as a secondary end point; contrary to the primary end point, the weight furthest from 12 months was recorded. The change in hemoglobin A1c (HbA1c) in patients with prediabetes and DM also was investigated as a secondary end point. Last, involvement in the Managing Overweight Veterans Everywhere (MOVE!) weight management program at SFVAHCS and its effect on weight gain was reviewed.
Baseline characteristics were collected to determine the variability between each study group. Data collected during the study included age, sex, race, weight, BMI, HbA1c, eGFR, DM diagnosis, insulin therapy prescription, duration of use, and MOVE! program participation.
Statistical Analysis
The primary and secondary end points were analyzed using an analysis of variance statistical test. Results were considered statistically significant at P < .05.
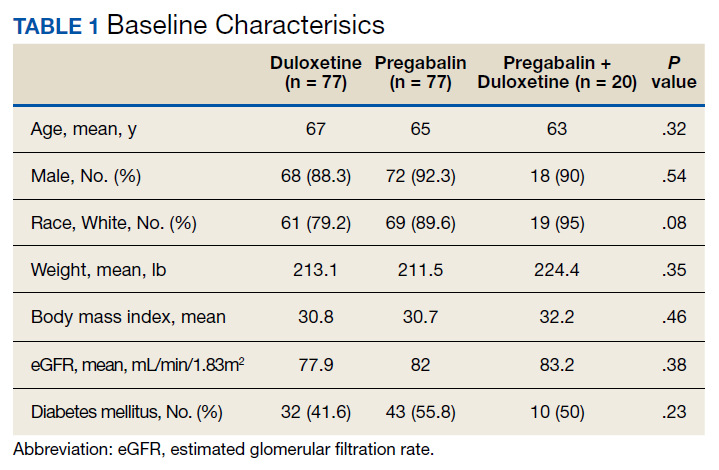
Results
A total of 174 participants were included in this study, with 77 in each monotherapy group, and 22 in the combination therapy group. More than 300 patients were excluded from the study due to prespecified inclusion and exclusion criteria. Baseline characteristics were similar among the 3 groups, with no statistically significant differences identified (Table 1).
Primary End Point
The change in body weight after 12 to 18 months of treatment was –0.8 lb in the duloxetine group, +2.9 lb in the pregabalin group, and +5.5 lb in the pregabalin plus duloxetine group (P = .12) (Figure).
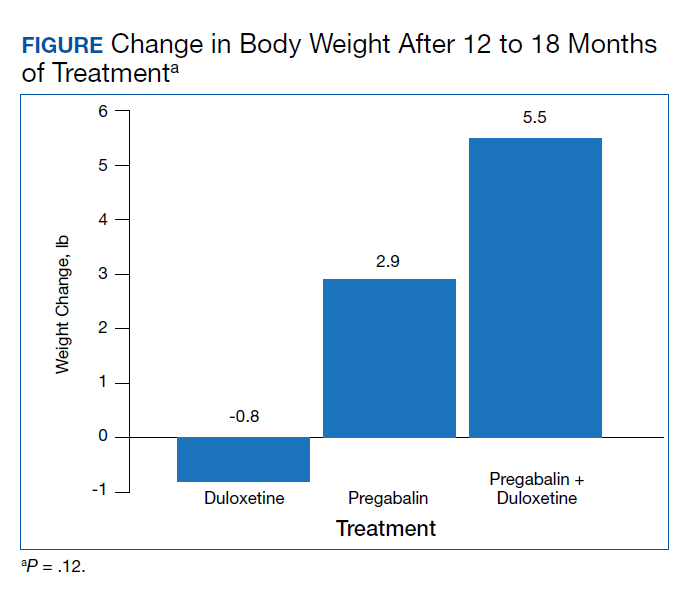
Secondary End Points
The percent change in body weight after 12 to 18 months of treatment was −0.3% in the duloxetine group, +1.5% in the pregabalin group, and +2.0% in the duloxetine plus pregabalin group (P = .18). The change in body weight beyond 12 months of treatment was −0.9 lb in the duloxetine group, +3.6 lb in the pregabalin group, and +8.5 lb in the duloxetine plus pregabalin group (P = .05). The change in HbA1c in patients with DM and pre-DM was −0.1% in the duloxetine group, +0.3% in the pregabalin group, and −0.3% in the duloxetine plus pregabalin group (P = .14). The change in body weight in patients who received increased doses of the study agents was −2.8 lb in the duloxetine group and +6.5 lb in the pregabalin group (P = .05). Among veterans who participated in MOVE!, change in body weight after 12 to 18 months of treatment was +1.5 lb in the duloxetine group, +4.9 lb in the pregabalin group, and +3.4 lb in the pregabalin plus duloxetine group (P = .91)(Table 2).
Discussion
The purpose of this retrospective chart review was to evaluate the association of weight gain in veterans taking duloxetine and/or pregabalin for the treatment of neuropathy. Although the primary end point, weight gain after 12 to 18 months of therapy, was not statistically significant, we found notable trends and associations worthy of discussion.
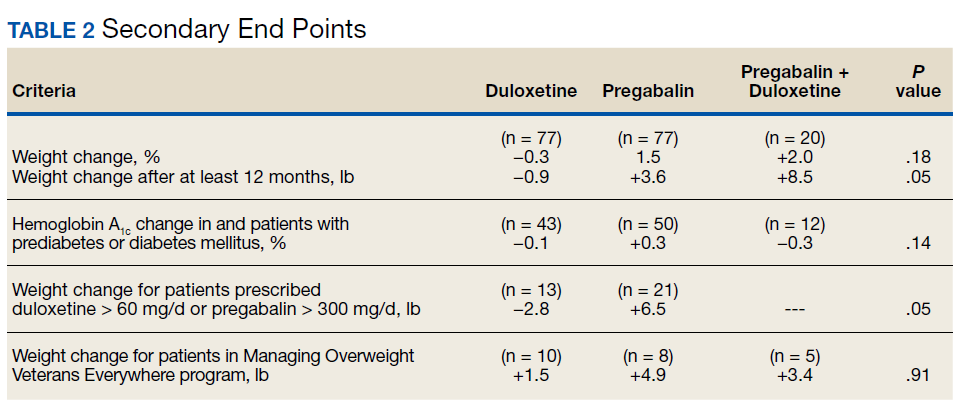
The secondary end point of the difference in weight gain in veterans taking duloxetine, pregabalin, or both for a treatment duration > 12 months was statistically significant. For this secondary end point, the weight recorded was when the study agent(s) were discontinued or the most recent weight obtained if participants still had an active prescription; the average duration of treatment in the 3 study groups was about 24 months. These weights differed from the primary end point, in which weight closest to 12 months of therapy was recorded.
The other secondary end point that was statistically significant was the difference in weight gain in patients who were on higher doses of duloxetine or pregabalin. This specifically examined participants who were on doses of duloxetine > 60 mg/d and pregabalin > 300 mg/d. Duloxetine was associated with weight loss, whereas pregabalin was associated with weight gain, with a difference of about 10 lb between the groups. The significance of this secondary end point demonstrates that increased doses of duloxetine and pregabalin are more associated with changes in weight compared with standard doses.
The secondary end points of percent change in body weight, change in HBA1c in patients with DM and prediabetes, and weight gain in patients who participated in the MOVE! weight management program were not statistically significant among the 3 study groups. Given the relatively small sample sizes, more significant differences in the evaluation of the primary and secondary end points may have been observed with a larger patient population.
Study investigators made additional observations beyond the primary and secondary end points. Most notably, > 300 patients were excluded from this study because they did not continue treatment beyond 12 months. The investigators found this number staggering, as it may imply that veterans were not satisfied with treatment agent(s) within 1 year of initiation, which could be due to lack of efficacy or intolerable adverse effects.
The mechanism of why combination therapy of duloxetine and pregabalin may be more associated with weight gain compared with either agent alone is unknown. Since this study found duloxetine to be more associated with weight loss, the mechanism does not seem to be an additive effect. The alternative hypothesis proposed prior to the completion of this study stemmed from an observation seen by health care providers at SFVAHCS.
Limitations
The retrospective nature of the study does not provide proof of causation but does demonstrate association. There was no control group, and the study design did not allow for randomization of participants. Additionally, since the study was completed at a single center, there was potential for selection bias. Future studies could benefit from pursuing a multicenter study design, which may provide a higher level of external validity. There are several confounding factors that have the potential to influence changes in weight, all of which cannot feasibly be accounted for. Since participants were ambulatory veterans, medication adherence could not be confirmed.
Conclusions
There was no difference in weight gain in veterans who took duloxetine, pregabalin, or both for treatment of neuropathy after 12 to 18 months of therapy. However, there was a difference in weight gain between the 3 groups when therapy lasted > 12 months. The combination therapy of pregabalin and duloxetine was associated with the most amount of weight gain, followed by pregabalin alone. Duloxetine monotherapy had minimal impact on weight.
In veterans who took increased doses of duloxetine or pregabalin, there was a statistically significant difference in weight between the monotherapy groups, with pregabalin associated with weight gain and duloxetine associated with weight loss.
For patients in which weight gain may be a concern, it would be reasonable to prefer duloxetine rather than pregabalin for initial treatment of neuropathy. Pregabalin should be used at the lowest effective dose to minimize risk of weight gain. Combination therapy of duloxetine and pregabalin for the treatment of neuropathy seems to be associated with the most amount of weight gain compared with either therapy alone. Association of changes in weight is greater as treatment duration lasts beyond 12 months.
1. Onakpoya IJ, Thomas ET, Lee JJ, Goldacre B, Heneghan CJ. Benefits and harms of pregabalin in the management of neuropathic pain: a rapid review and meta-analysis of randomised clinical trials. BMJ Open. 2019;9(1):e023600. Published 2019 Jan 21. doi:10.1136/bmjopen-2018-023600
2. American Diabetes Association. 11. Microvascular Complications and Foot Care: Standards of Medical Care in Diabetes-2019. Diabetes Care. 2019;42(suppl 1):S124-S138. doi:10.2337/dc19-S011
3. Baumann TJ, Herndon CM, Strickland JM. Pain Management. In: DiPiro JT, Talbert RL, Yee GC, Matzke GR, Wells BG, Posey LM, eds. Pharmacotherapy: A Pathophysiologic Approach. 9th ed. New York, NY: McGraw-Hill; 2014:925.
4. National Institute of Neurological Disorders and Stroke. Peripheral neuropathy fact sheet. Updated March 16, 2020. Accessed March 10, 2021. https://www.ninds.nih.gov/Disorders/Patient-Caregiver-Education/Fact-Sheets/Peripheral-Neuropathy-Fact-Sheet
5. Feldman EL. Patient education: diabetic neuropathy (beyond the basics). Updated January 20, 2021. Accessed April 21, 2021. https://www.uptodate.com/contents/diabetic-neuropathy-beyond-the-basics
6. Centers for Disease Control and Prevention. Overweight and obesity. Updated October 29, 2020. Accessed March 10, 2021. https://www.cdc.gov/obesity/index.html
7. Cymbalta (duloxetine) [prescribing information]. Eli Lilly and Company; April 2020.
8. Lyrica (pregabalin) [prescribing information]. Parke-Davis, Division of Pfizer Inc; June 2020.
Neuropathy is the result of damage to the nervous system. This dysfunction generally occurs in peripheral nerves, which are the circuits that transmit signals to the brain and spinal cord. The peripheral nervous system is responsible for controlling motor and autonomic nerves and conduction of sensory information. Injury to the nervous system can lead to changes in nerve fiber sensitivity and malfunctioning of nerve stimuli pathways. Neuropathy may be a sequela of a wide variety of diseases, including diabetes mellitus (DM), autoimmune disorders, infections, and cancer. Also, neuropathy can be caused by medications, trauma, exposure to toxins, classified idiopathic.1-5
Peripheral neuropathy is a common condition with an estimated incidence of > 3 million cases in the United States per year.4 The burden of neuropathy may be greater among veterans, due to a higher prevalence of type 2 DM (T2DM) and an aging population. Manifestations of neuropathy include weakness, numbness, burning or tingling sensations, and lingering pain.3,5 This can lead to limited mobility and decreased quality of life. Neuropathy can be debilitating, but several medications can be used to alleviate symptoms—including duloxetine and pregabalin. The American Diabetes Association recommends either agent as initial treatment for neuropathic pain in patients with DM.2 As with all medication use, the benefits and risks of treatment must be assessed prior to initiation of therapy.
The Centers for Disease Control and Prevention estimates > 70% of adults in the United States are overweight or obese.6 Excessive weight gain causes a higher risk of developing certain comorbidities, such as coronary artery disease, cerebrovascular accident, T2DM, and cancer, and all can lead to premature death. It is important to avoid excessive weight gain whenever possible, especially in patients already at a high risk for developing these diseases.
The correlation of weight gain in patients taking duloxetine, pregabalin, or both is not well studied. Duloxetine has the potential to cause weight gain or weight loss, with reports of > 1% incidence for either effect.7 Clinical significance of weight changes caused by duloxetine is uncertain.Pregabalin is more likely to cause weight gain, with a reported incidence between 2 and 14%.8 Weight gain may be associated with dose and duration; 1 study demonstrated an average weight gain of about 11 lb after 2 years of pregabalin treatment.8 The medical literature lacks information regarding weight gain associated with combination therapy of duloxetine and pregabalin. The objective of this study was to investigate the association of weight gain in veterans taking duloxetine, pregabalin, or both for the treatment of neuropathy.
Methods
A retrospective, single-center, chart review was conducted at the Sioux Falls Veterans Affairs Health Care System (SFVAHCS). Data were collected through manual chart review of US Department of Veterans Affairs (VA) electronic health records (EHRs). Patients included were veterans aged 18 to 89 years who were initiated on duloxetine and/or pregabalin between October 2015 and September 2018.
The primary end point of this study was the change in body weight, expressed in pounds, after 12 to 18 months of treatment. If multiple weights were obtained during the 12- to 18-month period, the weight recorded closest to 12 months was used. The secondary end points included the percent change in body weight and dose effect, which evaluated change in weight at doses of duloxetine > 60 mg/d, and pregabalin at doses > 300 mg/d. Duration of effect was evaluated as a secondary end point; contrary to the primary end point, the weight furthest from 12 months was recorded. The change in hemoglobin A1c (HbA1c) in patients with prediabetes and DM also was investigated as a secondary end point. Last, involvement in the Managing Overweight Veterans Everywhere (MOVE!) weight management program at SFVAHCS and its effect on weight gain was reviewed.
Baseline characteristics were collected to determine the variability between each study group. Data collected during the study included age, sex, race, weight, BMI, HbA1c, eGFR, DM diagnosis, insulin therapy prescription, duration of use, and MOVE! program participation.
Statistical Analysis
The primary and secondary end points were analyzed using an analysis of variance statistical test. Results were considered statistically significant at P < .05.
Results
A total of 174 participants were included in this study, with 77 in each monotherapy group, and 22 in the combination therapy group. More than 300 patients were excluded from the study due to prespecified inclusion and exclusion criteria. Baseline characteristics were similar among the 3 groups, with no statistically significant differences identified (Table 1).
Primary End Point
The change in body weight after 12 to 18 months of treatment was –0.8 lb in the duloxetine group, +2.9 lb in the pregabalin group, and +5.5 lb in the pregabalin plus duloxetine group (P = .12) (Figure).
Secondary End Points
The percent change in body weight after 12 to 18 months of treatment was −0.3% in the duloxetine group, +1.5% in the pregabalin group, and +2.0% in the duloxetine plus pregabalin group (P = .18). The change in body weight beyond 12 months of treatment was −0.9 lb in the duloxetine group, +3.6 lb in the pregabalin group, and +8.5 lb in the duloxetine plus pregabalin group (P = .05). The change in HbA1c in patients with DM and pre-DM was −0.1% in the duloxetine group, +0.3% in the pregabalin group, and −0.3% in the duloxetine plus pregabalin group (P = .14). The change in body weight in patients who received increased doses of the study agents was −2.8 lb in the duloxetine group and +6.5 lb in the pregabalin group (P = .05). Among veterans who participated in MOVE!, change in body weight after 12 to 18 months of treatment was +1.5 lb in the duloxetine group, +4.9 lb in the pregabalin group, and +3.4 lb in the pregabalin plus duloxetine group (P = .91)(Table 2).
Discussion
The purpose of this retrospective chart review was to evaluate the association of weight gain in veterans taking duloxetine and/or pregabalin for the treatment of neuropathy. Although the primary end point, weight gain after 12 to 18 months of therapy, was not statistically significant, we found notable trends and associations worthy of discussion.
The secondary end point of the difference in weight gain in veterans taking duloxetine, pregabalin, or both for a treatment duration > 12 months was statistically significant. For this secondary end point, the weight recorded was when the study agent(s) were discontinued or the most recent weight obtained if participants still had an active prescription; the average duration of treatment in the 3 study groups was about 24 months. These weights differed from the primary end point, in which weight closest to 12 months of therapy was recorded.
The other secondary end point that was statistically significant was the difference in weight gain in patients who were on higher doses of duloxetine or pregabalin. This specifically examined participants who were on doses of duloxetine > 60 mg/d and pregabalin > 300 mg/d. Duloxetine was associated with weight loss, whereas pregabalin was associated with weight gain, with a difference of about 10 lb between the groups. The significance of this secondary end point demonstrates that increased doses of duloxetine and pregabalin are more associated with changes in weight compared with standard doses.
The secondary end points of percent change in body weight, change in HBA1c in patients with DM and prediabetes, and weight gain in patients who participated in the MOVE! weight management program were not statistically significant among the 3 study groups. Given the relatively small sample sizes, more significant differences in the evaluation of the primary and secondary end points may have been observed with a larger patient population.
Study investigators made additional observations beyond the primary and secondary end points. Most notably, > 300 patients were excluded from this study because they did not continue treatment beyond 12 months. The investigators found this number staggering, as it may imply that veterans were not satisfied with treatment agent(s) within 1 year of initiation, which could be due to lack of efficacy or intolerable adverse effects.
The mechanism of why combination therapy of duloxetine and pregabalin may be more associated with weight gain compared with either agent alone is unknown. Since this study found duloxetine to be more associated with weight loss, the mechanism does not seem to be an additive effect. The alternative hypothesis proposed prior to the completion of this study stemmed from an observation seen by health care providers at SFVAHCS.
Limitations
The retrospective nature of the study does not provide proof of causation but does demonstrate association. There was no control group, and the study design did not allow for randomization of participants. Additionally, since the study was completed at a single center, there was potential for selection bias. Future studies could benefit from pursuing a multicenter study design, which may provide a higher level of external validity. There are several confounding factors that have the potential to influence changes in weight, all of which cannot feasibly be accounted for. Since participants were ambulatory veterans, medication adherence could not be confirmed.
Conclusions
There was no difference in weight gain in veterans who took duloxetine, pregabalin, or both for treatment of neuropathy after 12 to 18 months of therapy. However, there was a difference in weight gain between the 3 groups when therapy lasted > 12 months. The combination therapy of pregabalin and duloxetine was associated with the most amount of weight gain, followed by pregabalin alone. Duloxetine monotherapy had minimal impact on weight.
In veterans who took increased doses of duloxetine or pregabalin, there was a statistically significant difference in weight between the monotherapy groups, with pregabalin associated with weight gain and duloxetine associated with weight loss.
For patients in which weight gain may be a concern, it would be reasonable to prefer duloxetine rather than pregabalin for initial treatment of neuropathy. Pregabalin should be used at the lowest effective dose to minimize risk of weight gain. Combination therapy of duloxetine and pregabalin for the treatment of neuropathy seems to be associated with the most amount of weight gain compared with either therapy alone. Association of changes in weight is greater as treatment duration lasts beyond 12 months.
1. Onakpoya IJ, Thomas ET, Lee JJ, Goldacre B, Heneghan CJ. Benefits and harms of pregabalin in the management of neuropathic pain: a rapid review and meta-analysis of randomised clinical trials. BMJ Open. 2019;9(1):e023600. Published 2019 Jan 21. doi:10.1136/bmjopen-2018-023600
2. American Diabetes Association. 11. Microvascular Complications and Foot Care: Standards of Medical Care in Diabetes-2019. Diabetes Care. 2019;42(suppl 1):S124-S138. doi:10.2337/dc19-S011
3. Baumann TJ, Herndon CM, Strickland JM. Pain Management. In: DiPiro JT, Talbert RL, Yee GC, Matzke GR, Wells BG, Posey LM, eds. Pharmacotherapy: A Pathophysiologic Approach. 9th ed. New York, NY: McGraw-Hill; 2014:925.
4. National Institute of Neurological Disorders and Stroke. Peripheral neuropathy fact sheet. Updated March 16, 2020. Accessed March 10, 2021. https://www.ninds.nih.gov/Disorders/Patient-Caregiver-Education/Fact-Sheets/Peripheral-Neuropathy-Fact-Sheet
5. Feldman EL. Patient education: diabetic neuropathy (beyond the basics). Updated January 20, 2021. Accessed April 21, 2021. https://www.uptodate.com/contents/diabetic-neuropathy-beyond-the-basics
6. Centers for Disease Control and Prevention. Overweight and obesity. Updated October 29, 2020. Accessed March 10, 2021. https://www.cdc.gov/obesity/index.html
7. Cymbalta (duloxetine) [prescribing information]. Eli Lilly and Company; April 2020.
8. Lyrica (pregabalin) [prescribing information]. Parke-Davis, Division of Pfizer Inc; June 2020.
Standardization of the Discharge Process for Inpatient Hematology and Oncology Using Plan-Do-Study-Act Methodology Improves Follow-Up and Patient Hand-Off
Hematology and oncology patients are a complex patient population that requires timely follow-up to prevent clinical decompensation and delays in treatment. Previous reports have demonstrated that outpatient follow-up within 14 days is associated with decreased 30-day readmissions. The magnitude of this effect is greater for higher-risk patients.1 Therefore, patients being discharged from the hematology and oncology inpatient service should be seen by a hematology and oncology provider within 14 days of discharge. Patients who do not require close oncologic follow-up should be seen by a primary care provider (PCP) within this timeframe.
Background
The Institute of Medicine (IOM) identified the need to focus on quality improvement and patient safety with a 1999 report, To Err Is Human.2 Tremendous strides have been made in the areas of quality improvement and patient safety over the past 2 decades. In a 2013 report, the IOM further identified hematology and oncology care as an area of need due to a combination of growing demand, complexity of cancer and cancer treatment, shrinking workforce, and rising costs. The report concluded that cancer care is not as patient-centered, accessible, coordinated, or evidence based as it could be, with detrimental impacts on patients.3 Patients with cancer have been identified as a high-risk population for hospital readmissions.4,5 Lack of timely follow-up and failed hand-offs have been identified as factors contributing to poor outcomes at time of discharge.6-10
Upon internal review of baseline performance data, we identified areas needing improvement in the discharge process. These included time to hematology and oncology follow-up appointment, percent of patients with PCP appointments scheduled at time of discharge, and electronically alerts for the outpatient hematologist/oncologist to discharge summaries. It was determined that patients discharged from the inpatient service were seen a mean 17 days later by their outpatient hematology and oncology provider and the time to the follow-up appointment varied substantially, with some patients being seen several weeks to months after discharge. Furthermore, only 68% of patients had a primary care appointment scheduled at the time of discharge. These data along with review of data reported in the medical literature supported our initiative for improvement in the transition from inpatient to outpatient care for our hematology and oncology patients.
Plan-Do-Study-Act (PDSA) quality improvement methodology was used to create and implement several interventions to standardize the discharge process for this patient population, with the primary goal of decreasing the mean time to hematology and oncology follow-up from 17 days by 12% to fewer than 14 days. Patients who do not require close oncologic follow-up should be seen by a PCP within this timeframe. Otherwise, PCP follow-up within at least 6 months should be made. Secondary aims included (1) an increase in scheduled PCP visits at time of discharge from 68% to > 90%; and (2) an increase in communication of the discharge summary via electronic alerting of the outpatient hematology and oncology physician from 20% to > 90%. Herein, we report our experience and results of this quality improvement initiative
Methods
The Institutional Review Board at Edward Hines Veteran Affairs Hospital in Hines, Illinois reviewed this single-center study and deemed it to be exempt from oversight. Using PDSA quality improvement methodology, a multidisciplinary team of hematology and oncology staff developed and implemented a standardized discharge process. The multidisciplinary team included a robust representation of inpatient and outpatient staff caring for the hematology and oncology patient population, including attending physicians, fellows, residents, advanced practice nurses, registered nurses, clinical pharmacists, patient care coordinators, clinic schedulers, clinical applications coordinators, quality support staff, and a systems redesign coach. Hospital leadership including chief of staff, chief of medicine, and chief of nursing participated as the management guidance team. Several interviews and group meetings were conducted and a multidisciplinary team collaboratively developed and implemented the interventions and monitored the results.
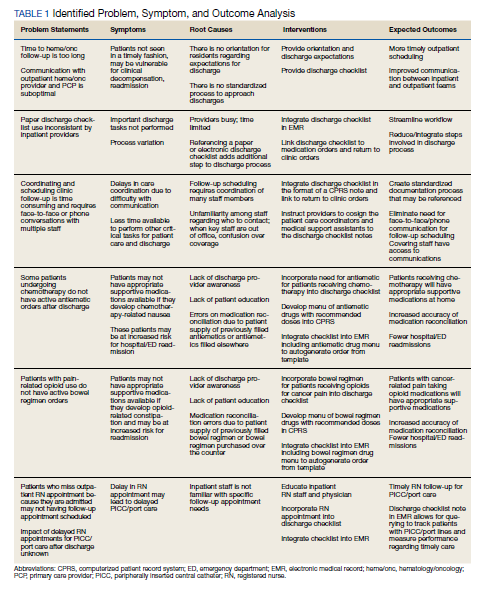
Outcome measures were identified, including time to hematology and oncology clinic visit, primary care follow-up scheduling, and communication of discharge to the outpatient hematology and oncology physician. Baseline data were collected and reviewed. The multidisciplinary team developed a process flow map to understand the steps and resources involved with the transition from inpatient to outpatient care. Gap analysis and root cause analysis were performed. A solutions approach was applied to develop interventions. Table 1 shows a summary of the identified problems, symptoms, associated causes, the interventions aimed to address the problems, and expected outcomes. Rotating resident physicians were trained through online and in-person education. The multidisciplinary team met intermittently to monitor outcomes, provide feedback, further refine interventions, and develop additional interventions.
PDSA Cycle 1
A standardized discharge process was developed in the form of guidelines and expectations. These include an explanation of unique features of the hematology and oncology service and expectations of medication reconciliation with emphasis placed on antiemetics, antimicrobial prophylaxis, and bowel regimen when appropriate, outpatient hematology and oncology follow-up within 14 days, primary care follow-up, communication with the outpatient hematology and oncology physician, written discharge instructions, and bedside teaching when appropriate.
PDSA Cycle 2
Based on team member feedback and further discussions, a discharge checklist was developed. This checklist was available online, reviewed in person, and posted in the team room for rotating residents to use for discharge planning and when discharging patients (Figure 1).
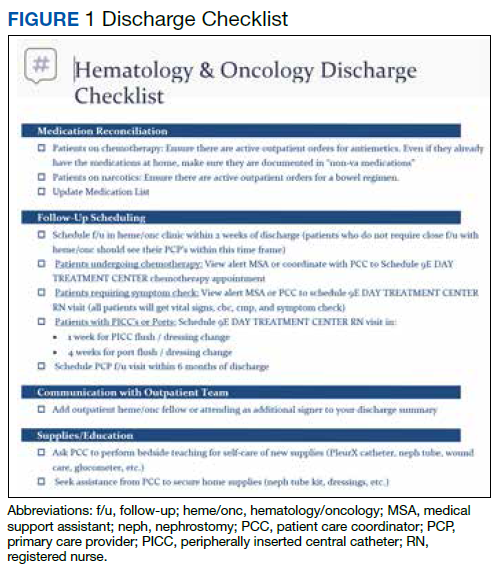
PDSA Cycle 3
Based on ongoing user feedback, group discussions, and data monitoring, the discharge checklist was further refined and updated. An electronic clinical decision support tool was developed and integrated into the electronic medical record (EMR) in the form of a discharge checklist note template directly linked to orders. The tool is a computerized patient record system (CPRS) note template that prompts users to select whether medications or return to clinic orders are needed and offers a menu of frequently used medications. If any of the selections are chosen within the note template, an order is generated automatically in the chart that requires only the user’s signature. Furthermore, the patient care coordinator reviews the prescribed follow-up and works with the medical support assistant to make these appointments. The physician is contacted only when an appointment cannot be made. Therefore, this tool allows many additional actions to be bypassed such as generating medication and return to clinic orders individually and calling schedulers to make follow-up appointments (Figure 2).
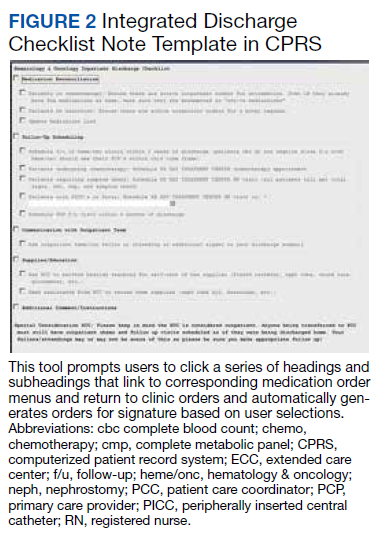
Data Analysis
All patients discharged during the 2-month period prior to and discharged after the implementation of the standardized process were reviewed. Patients who followed up with hematology and oncology at another facility, enrolled in hospice, or died during admission were excluded. Follow-up appointment scheduling data and communication between inpatient and outpatient providers were reviewed. Data were analyzed using XmR statistical process control chart and Fisher’s Exact Test using GraphPad. Control limits were calculated for each PDSA cycle as the mean ± the average of the moving range multiplied by 2.66. All data were included in the analysis.
Results
A total of 142 consecutive patients were reviewed from May 1, 2018 to August 31, 2018 and January 1, 2019 to April 30, 2019, including 58 patients prior to the intervention and 84 patients during PDSA cycles. There was a gap in data collection between September 1, 2018 and December 31, 2018 due to limited team member availability. All data were collected by 2 reviewers—a postgraduate year (PGY)-4 chief resident and a PGY-2 internal medicine resident. The median age of patients in the preintervention group was 72 years and 69 years in the postintervention group. All patients were men. Baseline data revealed a mean 17 days to hematology and oncology follow-up. Primary care visits were scheduled for 68% of patients at the time of discharge. The outpatient hematology and oncology physician was alerted electronically to the discharge summary for 20% of the patients (Table 2).
The primary endpoint of time to hematology and oncology follow-up appointment improved to 13 days in PDSA cycles 1 and 2 and 10 days in PDSA cycle 3. The target of mean 14 days to follow-up was achieved. The statistical process control chart shows 5 shifts with clusters of ≥ 7 points below the mean revealing a true signal or change in the data and demonstrating that an improvement was seen (Figure 3). Furthermore, the statistical process control chart demonstrates upper control limit decreased from 58 days at baseline to 21 days in PDSA cycle 3, suggesting a decrease in variation.
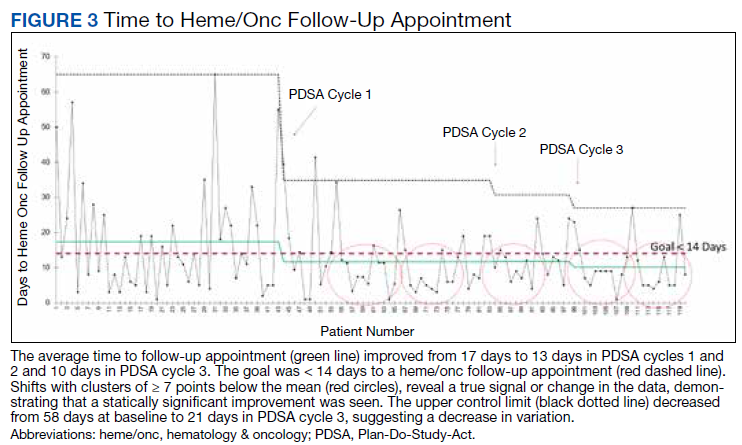
Regarding secondary endpoints, the outpatient hematology and oncology attending physician and/or fellow was alerted electronically to the discharge summary for 62% of patients compared with 20% at baseline (P = .01), and primary care appointments were scheduled for 77% of patients after the intervention compared with 68% at baseline (P = .88) (Table 2).
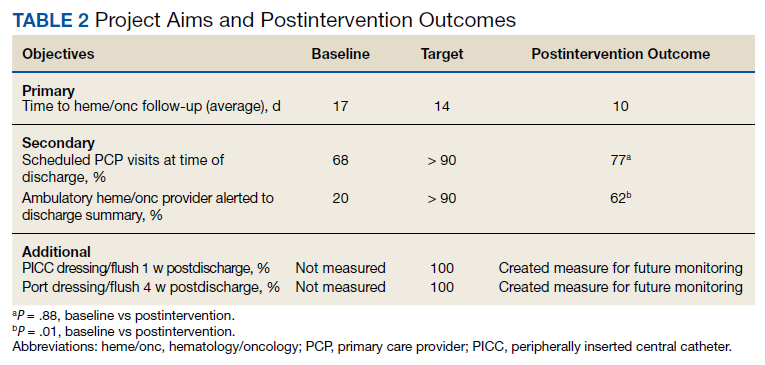
Through ongoing meetings, discussions, and feedback, we identified additional objectives unique to this patient population that had no performance measurement. These included peripherally inserted central catheter (PICC) care nursing visits scheduled 1 week after discharge and port care nursing visits scheduled 4 weeks after discharge. These visits allow nursing staff to dress and flush these catheters for routine maintenance per institutional policy. The implementation of the discharge checklist note creates a mechanism of tracking performance in meeting this goal moving forward, whereas no method was in place to track this metric.
Discussion
The 2013 IOM report Delivering High-Quality Cancer Care: Charting a New Course for a System in Crisis found that that cancer care is not as patient-centered, accessible, coordinated, or evidence-based as it could be, with detrimental impacts on patients.3 The document offered a conceptual framework to improve quality of cancer care that includes the translation of evidence into clinical practice, quality measurement, and performance improvement, as well as using advances in information technology to enhance quality measurement and performance improvement. Our quality initiative uses this framework to work toward the goal as stated by the IOM report: to deliver “comprehensive, patient-centered, evidence-based, high-quality cancer care that is accessible and affordable.”3
Two large studies that evaluated risk factors for 15-day and 30-day hospital readmissions identified cancer diagnosis as a risk factor for increased hospital readmission, highlighting the need to identify strategies to improve the discharge process for these patients.4,5 Timely outpatient follow-up and better patient hand-off may improve clinical outcomes among this high-risk patient population after hospital discharge. Multiple studies have demonstrated that timely follow-up is associated with fewer readmissions.1,8-10 A study by Forster and colleagues that evaluated postdischarge adverse events (AEs) revealed a 23% incidence of AEs with 12% of these identified as preventable. Postdischarge monitoring was deemed inadequate among these patients, with closer follow-up and improved hand-offs between inpatient and outpatient medical teams identified as possible interventions to improve postdischarge patient monitoring and to prevent AEs.7
The present quality initiative to standardize the discharge process for the hematology and oncology service decreased time to hematology and oncology follow-up appointment, improved communication between inpatient and outpatient teams, and decreased process variation. Timelier follow-up for this complex patient population likely will prevent clinical decompensation, delays in treatment, and directly improve patient access to care.
The multidisciplinary nature of this effort was instrumental to successful completion. In a complex health care system, it is challenging to truly understand a problem and identify possible solutions without the perspective of all members of the care team. The involvement of team members with training in quality improvement methodology was important to evaluate and develop interventions in a systematic way. Furthermore, the support and involvement of leadership is important in order to allocate resources appropriately to achieve system changes that improve care. Using quality improvement methodology, the team was able to map our processes and perform gap and root cause analyses. Strategies were identified to improve our performance using a solutions approach. Changes were implemented with continued intermittent meetings for monitoring of progression and discussion of how interventions could be made more efficient, effective, and user friendly. The primary goal was ultimately achieved.
Integration of intervention into the EMR embodies the IOM’s call to use advances in information technology to enhance the quality and delivery of care, quality measurement, and performance improvement.3 This intervention offered the strongest system changes as an electronic clinical decision support tool was developed and embedded into the EMR in the form of a Discharge Checklist Note that is linked to associated orders. This intervention was the most robust, as it provided objective data regarding utilization of the checklist, offered a more efficient way to communicate with team members regarding discharge needs, and streamlined the workflow for the discharging provider. Furthermore, this electronic tool created the ability to measure other important aspects in the care of this patient population that we previously had no mechanism of measuring: timely nursing appointments for routine care of PICC lines and ports.
Limitations
The absence of clinical endpoints was a limitation of this study. The present study was unable to evaluate the effect of the intervention on readmission rates, emergency department visits, hospital length of stay, cost, or mortality. Coordinating this multidisciplinary effort required much time and planning, and additional resources were not available to evaluate these clinical endpoints. Further studies are needed to evaluate whether the increased patient access and closer follow-up would result in improvement in these clinical endpoints. Another consideration for future improvement projects would be to include patients in the multidisciplinary team. The patient perspective would be invaluable in identifying gaps in care delivery and strategies aimed at improving care delivery.
Conclusions
This quality initiative to standardize the discharge process for the hematology and oncology service decreased time to the initial hematology and oncology follow-up appointment, improved communication between inpatient and outpatient teams, and decreased process variation. Timelier follow-up for this complex patient population likely will prevent clinical decompensation, delays in treatment, and directly improve patient access to care.
Acknowledgments
We thank our patients for whom we hope our process improvement efforts will ultimately benefit. We thank all the hematology and oncology staff at Edward Hines Jr. VA Hospital and Loyola University Medical Center residents and fellows who care for our patients and participated in the multidisciplinary team to improve care for our patients. We thank the following professionals for their uncompensated assistance in the coordination and execution of this initiative: Robert Kutter, MS, and Meghan O’Halloran, MD.
1. Jackson C, Shahsahebi M, Wedlake T, DuBard CA. Timeliness of outpatient follow-up: an evidence-based approach for planning after hospital discharge. Ann Fam Med. 2015;13(2):115-122. doi:10.1370/afm.1753
2. Kohn LT, Corrigan J, Donaldson MS, eds. To Err Is Human: Building a Safer Health System. Washington, DC: National Academy Press; 2000.
3. Levit LA, Balogh E, Nass SJ, Ganz P, Institute of Medicine (U.S.), eds. Delivering High-Quality Cancer Care: Charting a New Course for a System in Crisis. Washington, DC: National Academies Press; 2013.
4. Allaudeen N, Vidyarthi A, Maselli J, Auerbach A. Redefining readmission risk factors for general medicine patients. J Hosp Med. 2011;6(2):54-60. doi:10.1002/jhm.805
5. Dorajoo SR, See V, Chan CT, et al. Identifying potentially avoidable readmissions: a medication-based 15-day readmission risk stratification algorithm. Pharmacotherapy. 2017;37(3):268-277. doi:10.1002/phar.1896
6. Kripalani S, LeFevre F, Phillips CO, Williams MV, Basaviah P, Baker DW. Deficits in communication and information transfer between hospital-based and primary care physicians: implications for patient safety and continuity of care. JAMA. 2007;297(8):831-841. doi:10.1001/jama.297.8.831
7. Forster AJ, Clark HD, Menard A, et al. Adverse events among medical patients after discharge from hospital [published correction appears in CMAJ. 2004 March 2;170(5):771]. CMAJ. 2004;170(3):345-349.
8. Hernandez AF, Greiner MA, Fonarow GC, et al. Relationship between early physician follow-up and 30-day readmission among Medicare beneficiaries hospitalized for heart failure. JAMA. 2010;303(17):1716-1722. doi:10.1001/jama.2010.533
9. Misky GJ, Wald HL, Coleman EA. Post-hospitalization transitions: examining the effects of timing of primary care provider follow-up. J Hosp Med. 2010;5(7):392-397. doi:10.1002/jhm.666
10. Sharma G, Kuo YF, Freeman JL, Zhang DD, Goodwin JS. Outpatient follow-up visit and 30-day emergency department visit and readmission in patients hospitalized for chronic obstructive pulmonary disease. Arch Intern Med. 2010;170(18):1664-1670. doi:10.1001/archinternmed.2010.345
Hematology and oncology patients are a complex patient population that requires timely follow-up to prevent clinical decompensation and delays in treatment. Previous reports have demonstrated that outpatient follow-up within 14 days is associated with decreased 30-day readmissions. The magnitude of this effect is greater for higher-risk patients.1 Therefore, patients being discharged from the hematology and oncology inpatient service should be seen by a hematology and oncology provider within 14 days of discharge. Patients who do not require close oncologic follow-up should be seen by a primary care provider (PCP) within this timeframe.
Background
The Institute of Medicine (IOM) identified the need to focus on quality improvement and patient safety with a 1999 report, To Err Is Human.2 Tremendous strides have been made in the areas of quality improvement and patient safety over the past 2 decades. In a 2013 report, the IOM further identified hematology and oncology care as an area of need due to a combination of growing demand, complexity of cancer and cancer treatment, shrinking workforce, and rising costs. The report concluded that cancer care is not as patient-centered, accessible, coordinated, or evidence based as it could be, with detrimental impacts on patients.3 Patients with cancer have been identified as a high-risk population for hospital readmissions.4,5 Lack of timely follow-up and failed hand-offs have been identified as factors contributing to poor outcomes at time of discharge.6-10
Upon internal review of baseline performance data, we identified areas needing improvement in the discharge process. These included time to hematology and oncology follow-up appointment, percent of patients with PCP appointments scheduled at time of discharge, and electronically alerts for the outpatient hematologist/oncologist to discharge summaries. It was determined that patients discharged from the inpatient service were seen a mean 17 days later by their outpatient hematology and oncology provider and the time to the follow-up appointment varied substantially, with some patients being seen several weeks to months after discharge. Furthermore, only 68% of patients had a primary care appointment scheduled at the time of discharge. These data along with review of data reported in the medical literature supported our initiative for improvement in the transition from inpatient to outpatient care for our hematology and oncology patients.
Plan-Do-Study-Act (PDSA) quality improvement methodology was used to create and implement several interventions to standardize the discharge process for this patient population, with the primary goal of decreasing the mean time to hematology and oncology follow-up from 17 days by 12% to fewer than 14 days. Patients who do not require close oncologic follow-up should be seen by a PCP within this timeframe. Otherwise, PCP follow-up within at least 6 months should be made. Secondary aims included (1) an increase in scheduled PCP visits at time of discharge from 68% to > 90%; and (2) an increase in communication of the discharge summary via electronic alerting of the outpatient hematology and oncology physician from 20% to > 90%. Herein, we report our experience and results of this quality improvement initiative
Methods
The Institutional Review Board at Edward Hines Veteran Affairs Hospital in Hines, Illinois reviewed this single-center study and deemed it to be exempt from oversight. Using PDSA quality improvement methodology, a multidisciplinary team of hematology and oncology staff developed and implemented a standardized discharge process. The multidisciplinary team included a robust representation of inpatient and outpatient staff caring for the hematology and oncology patient population, including attending physicians, fellows, residents, advanced practice nurses, registered nurses, clinical pharmacists, patient care coordinators, clinic schedulers, clinical applications coordinators, quality support staff, and a systems redesign coach. Hospital leadership including chief of staff, chief of medicine, and chief of nursing participated as the management guidance team. Several interviews and group meetings were conducted and a multidisciplinary team collaboratively developed and implemented the interventions and monitored the results.
Outcome measures were identified, including time to hematology and oncology clinic visit, primary care follow-up scheduling, and communication of discharge to the outpatient hematology and oncology physician. Baseline data were collected and reviewed. The multidisciplinary team developed a process flow map to understand the steps and resources involved with the transition from inpatient to outpatient care. Gap analysis and root cause analysis were performed. A solutions approach was applied to develop interventions. Table 1 shows a summary of the identified problems, symptoms, associated causes, the interventions aimed to address the problems, and expected outcomes. Rotating resident physicians were trained through online and in-person education. The multidisciplinary team met intermittently to monitor outcomes, provide feedback, further refine interventions, and develop additional interventions.
PDSA Cycle 1
A standardized discharge process was developed in the form of guidelines and expectations. These include an explanation of unique features of the hematology and oncology service and expectations of medication reconciliation with emphasis placed on antiemetics, antimicrobial prophylaxis, and bowel regimen when appropriate, outpatient hematology and oncology follow-up within 14 days, primary care follow-up, communication with the outpatient hematology and oncology physician, written discharge instructions, and bedside teaching when appropriate.
PDSA Cycle 2
Based on team member feedback and further discussions, a discharge checklist was developed. This checklist was available online, reviewed in person, and posted in the team room for rotating residents to use for discharge planning and when discharging patients (Figure 1).
PDSA Cycle 3
Based on ongoing user feedback, group discussions, and data monitoring, the discharge checklist was further refined and updated. An electronic clinical decision support tool was developed and integrated into the electronic medical record (EMR) in the form of a discharge checklist note template directly linked to orders. The tool is a computerized patient record system (CPRS) note template that prompts users to select whether medications or return to clinic orders are needed and offers a menu of frequently used medications. If any of the selections are chosen within the note template, an order is generated automatically in the chart that requires only the user’s signature. Furthermore, the patient care coordinator reviews the prescribed follow-up and works with the medical support assistant to make these appointments. The physician is contacted only when an appointment cannot be made. Therefore, this tool allows many additional actions to be bypassed such as generating medication and return to clinic orders individually and calling schedulers to make follow-up appointments (Figure 2).
Data Analysis
All patients discharged during the 2-month period prior to and discharged after the implementation of the standardized process were reviewed. Patients who followed up with hematology and oncology at another facility, enrolled in hospice, or died during admission were excluded. Follow-up appointment scheduling data and communication between inpatient and outpatient providers were reviewed. Data were analyzed using XmR statistical process control chart and Fisher’s Exact Test using GraphPad. Control limits were calculated for each PDSA cycle as the mean ± the average of the moving range multiplied by 2.66. All data were included in the analysis.
Results
A total of 142 consecutive patients were reviewed from May 1, 2018 to August 31, 2018 and January 1, 2019 to April 30, 2019, including 58 patients prior to the intervention and 84 patients during PDSA cycles. There was a gap in data collection between September 1, 2018 and December 31, 2018 due to limited team member availability. All data were collected by 2 reviewers—a postgraduate year (PGY)-4 chief resident and a PGY-2 internal medicine resident. The median age of patients in the preintervention group was 72 years and 69 years in the postintervention group. All patients were men. Baseline data revealed a mean 17 days to hematology and oncology follow-up. Primary care visits were scheduled for 68% of patients at the time of discharge. The outpatient hematology and oncology physician was alerted electronically to the discharge summary for 20% of the patients (Table 2).
The primary endpoint of time to hematology and oncology follow-up appointment improved to 13 days in PDSA cycles 1 and 2 and 10 days in PDSA cycle 3. The target of mean 14 days to follow-up was achieved. The statistical process control chart shows 5 shifts with clusters of ≥ 7 points below the mean revealing a true signal or change in the data and demonstrating that an improvement was seen (Figure 3). Furthermore, the statistical process control chart demonstrates upper control limit decreased from 58 days at baseline to 21 days in PDSA cycle 3, suggesting a decrease in variation.
Regarding secondary endpoints, the outpatient hematology and oncology attending physician and/or fellow was alerted electronically to the discharge summary for 62% of patients compared with 20% at baseline (P = .01), and primary care appointments were scheduled for 77% of patients after the intervention compared with 68% at baseline (P = .88) (Table 2).
Through ongoing meetings, discussions, and feedback, we identified additional objectives unique to this patient population that had no performance measurement. These included peripherally inserted central catheter (PICC) care nursing visits scheduled 1 week after discharge and port care nursing visits scheduled 4 weeks after discharge. These visits allow nursing staff to dress and flush these catheters for routine maintenance per institutional policy. The implementation of the discharge checklist note creates a mechanism of tracking performance in meeting this goal moving forward, whereas no method was in place to track this metric.
Discussion
The 2013 IOM report Delivering High-Quality Cancer Care: Charting a New Course for a System in Crisis found that that cancer care is not as patient-centered, accessible, coordinated, or evidence-based as it could be, with detrimental impacts on patients.3 The document offered a conceptual framework to improve quality of cancer care that includes the translation of evidence into clinical practice, quality measurement, and performance improvement, as well as using advances in information technology to enhance quality measurement and performance improvement. Our quality initiative uses this framework to work toward the goal as stated by the IOM report: to deliver “comprehensive, patient-centered, evidence-based, high-quality cancer care that is accessible and affordable.”3
Two large studies that evaluated risk factors for 15-day and 30-day hospital readmissions identified cancer diagnosis as a risk factor for increased hospital readmission, highlighting the need to identify strategies to improve the discharge process for these patients.4,5 Timely outpatient follow-up and better patient hand-off may improve clinical outcomes among this high-risk patient population after hospital discharge. Multiple studies have demonstrated that timely follow-up is associated with fewer readmissions.1,8-10 A study by Forster and colleagues that evaluated postdischarge adverse events (AEs) revealed a 23% incidence of AEs with 12% of these identified as preventable. Postdischarge monitoring was deemed inadequate among these patients, with closer follow-up and improved hand-offs between inpatient and outpatient medical teams identified as possible interventions to improve postdischarge patient monitoring and to prevent AEs.7
The present quality initiative to standardize the discharge process for the hematology and oncology service decreased time to hematology and oncology follow-up appointment, improved communication between inpatient and outpatient teams, and decreased process variation. Timelier follow-up for this complex patient population likely will prevent clinical decompensation, delays in treatment, and directly improve patient access to care.
The multidisciplinary nature of this effort was instrumental to successful completion. In a complex health care system, it is challenging to truly understand a problem and identify possible solutions without the perspective of all members of the care team. The involvement of team members with training in quality improvement methodology was important to evaluate and develop interventions in a systematic way. Furthermore, the support and involvement of leadership is important in order to allocate resources appropriately to achieve system changes that improve care. Using quality improvement methodology, the team was able to map our processes and perform gap and root cause analyses. Strategies were identified to improve our performance using a solutions approach. Changes were implemented with continued intermittent meetings for monitoring of progression and discussion of how interventions could be made more efficient, effective, and user friendly. The primary goal was ultimately achieved.
Integration of intervention into the EMR embodies the IOM’s call to use advances in information technology to enhance the quality and delivery of care, quality measurement, and performance improvement.3 This intervention offered the strongest system changes as an electronic clinical decision support tool was developed and embedded into the EMR in the form of a Discharge Checklist Note that is linked to associated orders. This intervention was the most robust, as it provided objective data regarding utilization of the checklist, offered a more efficient way to communicate with team members regarding discharge needs, and streamlined the workflow for the discharging provider. Furthermore, this electronic tool created the ability to measure other important aspects in the care of this patient population that we previously had no mechanism of measuring: timely nursing appointments for routine care of PICC lines and ports.
Limitations
The absence of clinical endpoints was a limitation of this study. The present study was unable to evaluate the effect of the intervention on readmission rates, emergency department visits, hospital length of stay, cost, or mortality. Coordinating this multidisciplinary effort required much time and planning, and additional resources were not available to evaluate these clinical endpoints. Further studies are needed to evaluate whether the increased patient access and closer follow-up would result in improvement in these clinical endpoints. Another consideration for future improvement projects would be to include patients in the multidisciplinary team. The patient perspective would be invaluable in identifying gaps in care delivery and strategies aimed at improving care delivery.
Conclusions
This quality initiative to standardize the discharge process for the hematology and oncology service decreased time to the initial hematology and oncology follow-up appointment, improved communication between inpatient and outpatient teams, and decreased process variation. Timelier follow-up for this complex patient population likely will prevent clinical decompensation, delays in treatment, and directly improve patient access to care.
Acknowledgments
We thank our patients for whom we hope our process improvement efforts will ultimately benefit. We thank all the hematology and oncology staff at Edward Hines Jr. VA Hospital and Loyola University Medical Center residents and fellows who care for our patients and participated in the multidisciplinary team to improve care for our patients. We thank the following professionals for their uncompensated assistance in the coordination and execution of this initiative: Robert Kutter, MS, and Meghan O’Halloran, MD.
1. Jackson C, Shahsahebi M, Wedlake T, DuBard CA. Timeliness of outpatient follow-up: an evidence-based approach for planning after hospital discharge. Ann Fam Med. 2015;13(2):115-122. doi:10.1370/afm.1753
2. Kohn LT, Corrigan J, Donaldson MS, eds. To Err Is Human: Building a Safer Health System. Washington, DC: National Academy Press; 2000.
3. Levit LA, Balogh E, Nass SJ, Ganz P, Institute of Medicine (U.S.), eds. Delivering High-Quality Cancer Care: Charting a New Course for a System in Crisis. Washington, DC: National Academies Press; 2013.
4. Allaudeen N, Vidyarthi A, Maselli J, Auerbach A. Redefining readmission risk factors for general medicine patients. J Hosp Med. 2011;6(2):54-60. doi:10.1002/jhm.805
5. Dorajoo SR, See V, Chan CT, et al. Identifying potentially avoidable readmissions: a medication-based 15-day readmission risk stratification algorithm. Pharmacotherapy. 2017;37(3):268-277. doi:10.1002/phar.1896
6. Kripalani S, LeFevre F, Phillips CO, Williams MV, Basaviah P, Baker DW. Deficits in communication and information transfer between hospital-based and primary care physicians: implications for patient safety and continuity of care. JAMA. 2007;297(8):831-841. doi:10.1001/jama.297.8.831
7. Forster AJ, Clark HD, Menard A, et al. Adverse events among medical patients after discharge from hospital [published correction appears in CMAJ. 2004 March 2;170(5):771]. CMAJ. 2004;170(3):345-349.
8. Hernandez AF, Greiner MA, Fonarow GC, et al. Relationship between early physician follow-up and 30-day readmission among Medicare beneficiaries hospitalized for heart failure. JAMA. 2010;303(17):1716-1722. doi:10.1001/jama.2010.533
9. Misky GJ, Wald HL, Coleman EA. Post-hospitalization transitions: examining the effects of timing of primary care provider follow-up. J Hosp Med. 2010;5(7):392-397. doi:10.1002/jhm.666
10. Sharma G, Kuo YF, Freeman JL, Zhang DD, Goodwin JS. Outpatient follow-up visit and 30-day emergency department visit and readmission in patients hospitalized for chronic obstructive pulmonary disease. Arch Intern Med. 2010;170(18):1664-1670. doi:10.1001/archinternmed.2010.345
Factors Associated with Radiation Toxicity and Survival in Patients with Presumed Early-Stage Non-Small Cell Lung Cancer Receiving Empiric Stereotactic Ablative Radiotherapy
Stereotactic ablative radiotherapy (SABR) has become the standard of care for inoperable early-stage non-small cell lung cancer (NSCLC). Many patients are unable to undergo a biopsy safely because of poor pulmonary function or underlying emphysema and are then empirically treated with radiotherapy if they meet criteria. In these patients, local control can be achieved with SABR with minimal toxicity.1 Considering that median overall survival (OS) among patients with untreated stage I NSCLC has been reported to be as low as 9 months, early treatment with SABR could lead to increased survival of 29 to 60 months.2-4
The RTOG 0236 trial showed a median OS of 48 months and the randomized phase III CHISEL trial showed a median OS of 60 months; however, these survival data were reported in patients who were able to safely undergo a biopsy and had confirmed NSCLC.4,5 For patients without a diagnosis confirmed by biopsy and who are treated with empiric SABR, patient factors that influence radiation toxicity and OS are not well defined.
It is not clear if empiric radiation benefits survival or if treatment causes decline in lung function, considering that underlying chronic lung disease precludes these patients from biopsy. The purpose of this study was to evaluate the factors associated with radiation toxicity with empiric SABR and to evaluate OS in this population without a biopsy-confirmed diagnosis.
Methods
This was a single center retrospective review of patients treated at the radiation oncology department at the Kansas City Veterans Affairs Medical Center from August 2014 to February 2019. Data were collected on 69 patients with pulmonary nodules identified by chest computed tomography (CT) and/or positron emission tomography (PET)-CT that were highly suspicious for primary NSCLC.
These patients were presented at a multidisciplinary meeting that involved pulmonologists, oncologists, radiation oncologists, and thoracic surgeons. Patients were deemed to be poor candidates for biopsy because of severe underlying emphysema, which would put them at high risk for pneumothorax with a percutaneous needle biopsy, or were unable to tolerate general anesthesia for navigational bronchoscopy or surgical biopsy because of poor lung function. These patients were diagnosed with presumed stage I NSCLC using the criteria: minimum of 2 sequential CT scans with enlarging nodule; absence of metastases on PET-CT; the single nodule had to be fluorodeoxyglucose avid with a minimum standardized uptake value of 2.5, and absence of clinical history or physical examination consistent with small cell lung cancer or infection.
After a consensus was reached that patients met these criteria, individuals were referred for empiric SABR. Follow-up visits were at 1 month, 3 months, and every 6 months. Variables analyzed included: patient demographics, pre- and posttreatment pulmonary function tests (PFT) when available, pre-treatment oxygen use, tumor size and location (peripheral, central, or ultra-central), radiation doses, and grade of toxicity as defined by Human and Health Services Common Terminology Criteria for Adverse Events version 5.0 (dyspnea and cough both counted as pulmonary toxicity): acute ≤ 90 days and late > 90 days (Table 1).
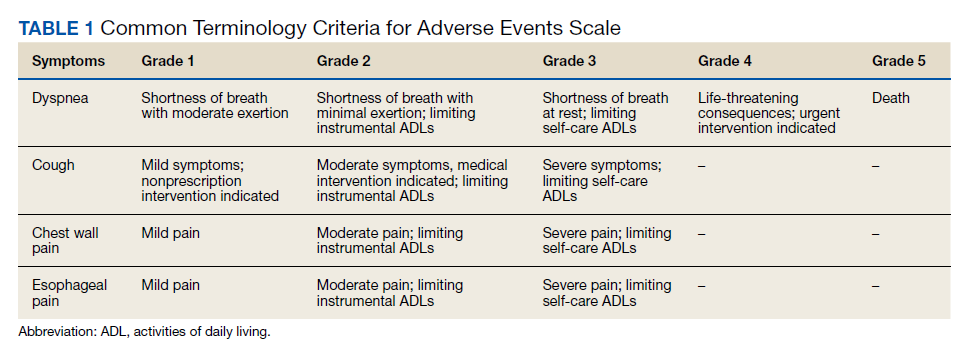
SPSS versions 24 and 26 were used for statistical analysis. Median and range were obtained for continuous variables with a normal distribution. Kaplan-Meier log-rank testing was used to analyze OS. χ2 and Mann-Whitney U tests were used to analyze association between independent variables and OS. Analysis of significant findings were repeated with operable patients excluded for further analysis.
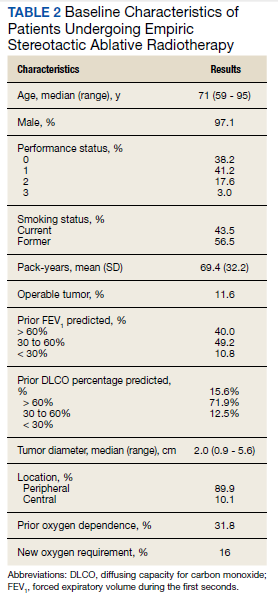
Results
The median follow-up was 18 months (range, 1 to 54). The median age was 71 years (range, 59 to 95) (Table 2). Most patients (97.1%) were male. The majority of patients (79.4%) had a 0 or 1 for the Eastern Cooperative Oncology group performance status, indicating fully active or restricted in physically strenuous activity but ambulatory and able to perform light work. All patients were either current or former smokers with an average pack-year history of 69.4. Only 11.6% of patients had operable disease, but received empiric SABR because they declined surgery. Four patients did not have pretreatment spirometry available and 37 did not have pretreatment diffusing capacity for carbon monoxide (DLCO) data.
Most patients had a pretreatment forced expiratory volume during the first seconds (FEV1) value and DLCO < 60% of predicted (60% and 84% of the patients, respectively). The median tumor diameter was 2 cm. Of the 68.2% of patients who did not have chronic hypoxemic respiratory failure before SABR, 16% developed a new requirement for supplemental oxygen. Sixty-two tumors (89.9%) were peripheral. There were 4 local recurrences (5.7%), 10 regional (different lobe and nodal) failures (14.3%), and 15 distant metastases (21.4%).
Nineteen of 67 patients (26.3%) had acute toxicity of which 9 had acute grade ≥ 2 toxicity; information regarding toxicity was missing on 2 patients. Thirty-two of 65 (49.9%) patients had late toxicity of which 20 (30.8%) had late grade ≥ 2 toxicity. The main factor associated with development of acute toxicity was pretreatment oxygendependence (P = .047). This was not significant when comparing only inoperable patients. Twenty patients (29.9%) developed some type of acute toxicity; pulmonary toxicity was most common (22.4%) (Table 3). All patients with acute toxicity also developed late toxicity except for 1 who died before 3 months. Predominantly, the deaths in our sample were from causes other than the malignancy or treatment, such as sepsis, deconditioning after a fall, cardiovascular complications, etc. Acute toxicity of grade ≥ 2 was significantly associated with late toxicity (P < .001 for both) in both operable and inoperable patients (P < .001).
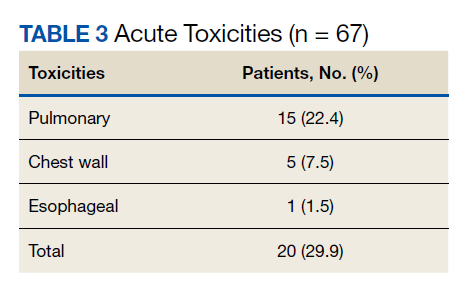
Development of any acute toxicity grade ≥ 2 was significantly associated with oxygendependence at baseline (P = .003), central location (P < .001), and new oxygen requirement (P = .02). Only central tumor location was found to be significant (P = .001) within the inoperable cohort. There were no significant differences in outcome based on pulmonary function testing (FEV1, forced vital capacity, or DLCO) or the analyzed PFT subgroups (FEV1 < 1.0 L, FEV1 < 1.5 L, FEV1 < 30%, and FEV1 < 35%).
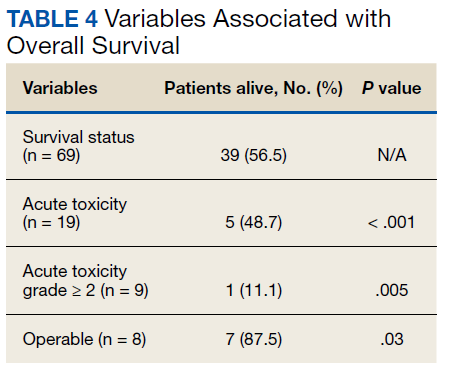
At the time of data collection, 30 patients were deceased (43.5%). There was a statistically significant association between OS and operability (P = .03; Table 4, Figure 1). Decreased OS was significantly associated with acute toxicity (P = .001) and acute toxicity grade ≥ 2 (P = .005; Figures 2 and 3). For the inoperable patients, both acute toxicity (P < .001) and acute toxicity grade ≥ 2 (P = .026) remained significant.
Discussion
SABR is an effective treatment for inoperable early-stage NSCLC, however its therapeutic ratio in a more frail population who cannot withstand biopsy is not well established. Additionally, the prevalence of benign disease in patients with solitary pulmonary nodules can be between 9% and 21%.6 Haidar and colleagues looked at 55 patients who received empiric SABR and found a median OS of 30.2 months with an 8.7% risk of local failure, 13% risk of regional failure with 8.7% acute toxicity, and 13% chronic toxicity.7 Data from Harkenrider and colleagues (n = 34) revealed similar results with a 2-year OS of 85%, local control of 97.1%, and regional control of 80%. The authors noted no grade ≥ 3 acute toxicities and an incidence of grade ≥ 3 late toxicities of 8.8%.1 These findings are concordant with our study results, confirming the safety and efficacy of SABR. Furthermore, a National Cancer Database analysis of observation vs empiric SABR found an OS of 10.1 months and 29 months respectively, with a hazard ratio of 0.64 (P < .001).3 Additionally, Fischer-Valuck and colleagues (n = 88) compared biopsy confirmed vs unbiopsied patients treated with SABR and found no difference in the 3-year local progression-free survival (93.1% vs 94.1%), regional lymph node metastasis and distant metastases free survival (92.5% vs 87.4%), or OS (59.9% vs 58.9%).8 With a median OS of ≤ 1 year for untreated stage I NSCLC,these studies support treating patients with empiric SABR.4
Other researchers have sought parameters to identify patients for whom radiation therapy would be too toxic. Guckenberger and colleagues aimed to establish a lower limit of pretreatment PFT to exclude patients and found only a 7% incidence of grade ≥ 2 adverse effects and toxicity did not increase with lower pulmonary function.9 They concluded that SABR was safe even for patients with poor pulmonary function. Other institutions have confirmed such findings and have been unable to find a cut-off PFT to exclude patients from empiric SABR.10,11 An analysis from the RTOG 0236 trial also noted that poor baseline PFT could not predict pulmonary toxicity or survival. Additionally, the study demonstrated only minimal decreases in patients’ FEV1 (5.8%) and DLCO (6%) at 2 years.12
Our study sought to identify a cut-off on FEV1 or DLCO that could be associated with increased toxicity. We also evaluated the incidence of acute toxicities grade ≥ 2 by stratifying patients according to FEV1 into subgroups: FEV1 < 1.0 L, FEV1 < 1.5 L, FEV1 < 30% of predicted and FEV1 < 35% of predicted. However, similar to other studies, we did not find any value that was significantly associated with increased toxicity that could preclude empiric SABR. One possible reason is that no treatment is offered for patients with extremely poor lung function as deemed by clinical judgement, therefore data on these patients is unavailable. In contradiction to other studies, our study found that oxygen dependence before treatment was significantly associated with development of acute toxicities. The exact mechanism for this association is unknown and could not be elucidated by baseline PFT. One possible explanation is that SABR could lead to oxygen free radical generation. In addition, our study indicated that those who developed acute toxicities had worse OS.
Limitations
Our study is limited by caveats of a retrospective study and its small sample size, but is in line with the reported literature (ranging from 33 to 88 patients).1,7,8 Another limitation is that data on pretreatment DLCO was missing in 37 patients and the lack of statistical robustness in terms of the smaller inoperable cohort, which limits the analyses of these factors in regards to anticipated morbidity from SABR. Also, given this is data collected from the US Department of Veterans Affairs, only 3% of our sample was female.
Conclusions
Empiric SABR for patients with presumed early-stage NSCLC appears to be safe and might positively impact OS. Development of any acute toxicity grade ≥ 2 was significantly associated with dependence on supplemental oxygen before treatment, central tumor location, and development of new oxygen requirement. No association was found in patients with poor pulmonary function before treatment because we could not find a FEV1 or DLCO cutoff that could preclude patients from empiric SABR. Considering the poor survival of untreated early-stage NSCLC, coupled with the efficacy and safety of empiric SABR for those with presumed disease, definitive SABR should be offered selectively within this patient population.
Acknowledgments
Drs. Park, Whiting and Castillo contributed to data collection. Drs. Park, Govindan and Castillo contributed to the statistical analysis and writing the first draft and final manuscript. Drs. Park, Govindan, Huang, and Reddy contributed to the discussion section.
1. Harkenrider MM, Bertke MH, Dunlap NE. Stereotactic body radiation therapy for unbiopsied early-stage lung cancer: a multi-institutional analysis. Am J Clin Oncol. 2014;37(4):337-342. doi:10.1097/COC.0b013e318277d822
2. Raz DJ, Zell JA, Ou SH, Gandara DR, Anton-Culver H, Jablons DM. Natural history of stage I non-small cell lung cancer: implications for early detection. Chest. 2007;132(1):193-199. doi:10.1378/chest.06-3096
3. Nanda RH, Liu Y, Gillespie TW, et al. Stereotactic body radiation therapy versus no treatment for early stage non-small cell lung cancer in medically inoperable elderly patients: a National Cancer Data Base analysis. Cancer. 2015;121(23):4222-4230. doi:10.1002/cncr.29640
4. Ball D, Mai GT, Vinod S, et al. Stereotactic ablative radiotherapy versus standard radiotherapy in stage 1 non-small-cell lung cancer (TROG 09.02 CHISEL): a phase 3, open-label, randomised controlled trial. Lancet Oncol. 2019;20(4):494-503. doi:10.1016/S1470-2045(18)30896-9
5. Timmerman R, Paulus R, Galvin J, et al. Stereotactic body radiation therapy for inoperable early stage lung cancer. JAMA. 2010;303(11):1070-1076. doi:10.1001/jama.2010.261
6. Smith MA, Battafarano RJ, Meyers BF, Zoole JB, Cooper JD, Patterson GA. Prevalence of benign disease in patients undergoing resection for suspected lung cancer. Ann Thorac Surg. 2006;81(5):1824-1828. doi:10.1016/j.athoracsur.2005.11.010
7. Haidar YM, Rahn DA 3rd, Nath S, et al. Comparison of outcomes following stereotactic body radiotherapy for nonsmall cell lung cancer in patients with and without pathological confirmation. Ther Adv Respir Dis. 2014;8(1):3-12. doi:10.1177/1753465813512545
8. Fischer-Valuck BW, Boggs H, Katz S, Durci M, Acharya S, Rosen LR. Comparison of stereotactic body radiation therapy for biopsy-proven versus radiographically diagnosed early-stage non-small lung cancer: a single-institution experience. Tumori. 2015;101(3):287-293. doi:10.5301/tj.5000279
9. Guckenberger M, Kestin LL, Hope AJ, et al. Is there a lower limit of pretreatment pulmonary function for safe and effective stereotactic body radiotherapy for early-stage non-small cell lung cancer? J Thorac Oncol. 2012;7:542-551. doi:10.1097/JTO.0b013e31824165d7
10. Wang J, Cao J, Yuan S, et al. Poor baseline pulmonary function may not increase the risk of radiation-induced lung toxicity. Int J Radiat Oncol Biol Phys. 2013;85(3):798-804. doi:10.1016/j.ijrobp.2012.06.040
11. Henderson M, McGarry R, Yiannoutsos C, et al. Baseline pulmonary function as a predictor for survival and decline in pulmonary function over time in patients undergoing stereotactic body radiotherapy for the treatment of stage I non-small-cell lung cancer. Int J Radiat Oncol Biol Phys. 2008;72(2):404-409. doi:10.1016/j.ijrobp.2007.12.051
12. Stanic S, Paulus R, Timmerman RD, et al. No clinically significant changes in pulmonary function following stereotactic body radiation therapy for early- stage peripheral non-small cell lung cancer: an analysis of RTOG 0236. Int J Radiat Oncol Biol Phys. 2014;88(5):1092-1099. doi:10.1016/j.ijrobp.2013.12.050
Stereotactic ablative radiotherapy (SABR) has become the standard of care for inoperable early-stage non-small cell lung cancer (NSCLC). Many patients are unable to undergo a biopsy safely because of poor pulmonary function or underlying emphysema and are then empirically treated with radiotherapy if they meet criteria. In these patients, local control can be achieved with SABR with minimal toxicity.1 Considering that median overall survival (OS) among patients with untreated stage I NSCLC has been reported to be as low as 9 months, early treatment with SABR could lead to increased survival of 29 to 60 months.2-4
The RTOG 0236 trial showed a median OS of 48 months and the randomized phase III CHISEL trial showed a median OS of 60 months; however, these survival data were reported in patients who were able to safely undergo a biopsy and had confirmed NSCLC.4,5 For patients without a diagnosis confirmed by biopsy and who are treated with empiric SABR, patient factors that influence radiation toxicity and OS are not well defined.
It is not clear if empiric radiation benefits survival or if treatment causes decline in lung function, considering that underlying chronic lung disease precludes these patients from biopsy. The purpose of this study was to evaluate the factors associated with radiation toxicity with empiric SABR and to evaluate OS in this population without a biopsy-confirmed diagnosis.
Methods
This was a single center retrospective review of patients treated at the radiation oncology department at the Kansas City Veterans Affairs Medical Center from August 2014 to February 2019. Data were collected on 69 patients with pulmonary nodules identified by chest computed tomography (CT) and/or positron emission tomography (PET)-CT that were highly suspicious for primary NSCLC.
These patients were presented at a multidisciplinary meeting that involved pulmonologists, oncologists, radiation oncologists, and thoracic surgeons. Patients were deemed to be poor candidates for biopsy because of severe underlying emphysema, which would put them at high risk for pneumothorax with a percutaneous needle biopsy, or were unable to tolerate general anesthesia for navigational bronchoscopy or surgical biopsy because of poor lung function. These patients were diagnosed with presumed stage I NSCLC using the criteria: minimum of 2 sequential CT scans with enlarging nodule; absence of metastases on PET-CT; the single nodule had to be fluorodeoxyglucose avid with a minimum standardized uptake value of 2.5, and absence of clinical history or physical examination consistent with small cell lung cancer or infection.
After a consensus was reached that patients met these criteria, individuals were referred for empiric SABR. Follow-up visits were at 1 month, 3 months, and every 6 months. Variables analyzed included: patient demographics, pre- and posttreatment pulmonary function tests (PFT) when available, pre-treatment oxygen use, tumor size and location (peripheral, central, or ultra-central), radiation doses, and grade of toxicity as defined by Human and Health Services Common Terminology Criteria for Adverse Events version 5.0 (dyspnea and cough both counted as pulmonary toxicity): acute ≤ 90 days and late > 90 days (Table 1).
SPSS versions 24 and 26 were used for statistical analysis. Median and range were obtained for continuous variables with a normal distribution. Kaplan-Meier log-rank testing was used to analyze OS. χ2 and Mann-Whitney U tests were used to analyze association between independent variables and OS. Analysis of significant findings were repeated with operable patients excluded for further analysis.
Results
The median follow-up was 18 months (range, 1 to 54). The median age was 71 years (range, 59 to 95) (Table 2). Most patients (97.1%) were male. The majority of patients (79.4%) had a 0 or 1 for the Eastern Cooperative Oncology group performance status, indicating fully active or restricted in physically strenuous activity but ambulatory and able to perform light work. All patients were either current or former smokers with an average pack-year history of 69.4. Only 11.6% of patients had operable disease, but received empiric SABR because they declined surgery. Four patients did not have pretreatment spirometry available and 37 did not have pretreatment diffusing capacity for carbon monoxide (DLCO) data.
Most patients had a pretreatment forced expiratory volume during the first seconds (FEV1) value and DLCO < 60% of predicted (60% and 84% of the patients, respectively). The median tumor diameter was 2 cm. Of the 68.2% of patients who did not have chronic hypoxemic respiratory failure before SABR, 16% developed a new requirement for supplemental oxygen. Sixty-two tumors (89.9%) were peripheral. There were 4 local recurrences (5.7%), 10 regional (different lobe and nodal) failures (14.3%), and 15 distant metastases (21.4%).
Nineteen of 67 patients (26.3%) had acute toxicity of which 9 had acute grade ≥ 2 toxicity; information regarding toxicity was missing on 2 patients. Thirty-two of 65 (49.9%) patients had late toxicity of which 20 (30.8%) had late grade ≥ 2 toxicity. The main factor associated with development of acute toxicity was pretreatment oxygendependence (P = .047). This was not significant when comparing only inoperable patients. Twenty patients (29.9%) developed some type of acute toxicity; pulmonary toxicity was most common (22.4%) (Table 3). All patients with acute toxicity also developed late toxicity except for 1 who died before 3 months. Predominantly, the deaths in our sample were from causes other than the malignancy or treatment, such as sepsis, deconditioning after a fall, cardiovascular complications, etc. Acute toxicity of grade ≥ 2 was significantly associated with late toxicity (P < .001 for both) in both operable and inoperable patients (P < .001).
Development of any acute toxicity grade ≥ 2 was significantly associated with oxygendependence at baseline (P = .003), central location (P < .001), and new oxygen requirement (P = .02). Only central tumor location was found to be significant (P = .001) within the inoperable cohort. There were no significant differences in outcome based on pulmonary function testing (FEV1, forced vital capacity, or DLCO) or the analyzed PFT subgroups (FEV1 < 1.0 L, FEV1 < 1.5 L, FEV1 < 30%, and FEV1 < 35%).
At the time of data collection, 30 patients were deceased (43.5%). There was a statistically significant association between OS and operability (P = .03; Table 4, Figure 1). Decreased OS was significantly associated with acute toxicity (P = .001) and acute toxicity grade ≥ 2 (P = .005; Figures 2 and 3). For the inoperable patients, both acute toxicity (P < .001) and acute toxicity grade ≥ 2 (P = .026) remained significant.
Discussion
SABR is an effective treatment for inoperable early-stage NSCLC, however its therapeutic ratio in a more frail population who cannot withstand biopsy is not well established. Additionally, the prevalence of benign disease in patients with solitary pulmonary nodules can be between 9% and 21%.6 Haidar and colleagues looked at 55 patients who received empiric SABR and found a median OS of 30.2 months with an 8.7% risk of local failure, 13% risk of regional failure with 8.7% acute toxicity, and 13% chronic toxicity.7 Data from Harkenrider and colleagues (n = 34) revealed similar results with a 2-year OS of 85%, local control of 97.1%, and regional control of 80%. The authors noted no grade ≥ 3 acute toxicities and an incidence of grade ≥ 3 late toxicities of 8.8%.1 These findings are concordant with our study results, confirming the safety and efficacy of SABR. Furthermore, a National Cancer Database analysis of observation vs empiric SABR found an OS of 10.1 months and 29 months respectively, with a hazard ratio of 0.64 (P < .001).3 Additionally, Fischer-Valuck and colleagues (n = 88) compared biopsy confirmed vs unbiopsied patients treated with SABR and found no difference in the 3-year local progression-free survival (93.1% vs 94.1%), regional lymph node metastasis and distant metastases free survival (92.5% vs 87.4%), or OS (59.9% vs 58.9%).8 With a median OS of ≤ 1 year for untreated stage I NSCLC,these studies support treating patients with empiric SABR.4
Other researchers have sought parameters to identify patients for whom radiation therapy would be too toxic. Guckenberger and colleagues aimed to establish a lower limit of pretreatment PFT to exclude patients and found only a 7% incidence of grade ≥ 2 adverse effects and toxicity did not increase with lower pulmonary function.9 They concluded that SABR was safe even for patients with poor pulmonary function. Other institutions have confirmed such findings and have been unable to find a cut-off PFT to exclude patients from empiric SABR.10,11 An analysis from the RTOG 0236 trial also noted that poor baseline PFT could not predict pulmonary toxicity or survival. Additionally, the study demonstrated only minimal decreases in patients’ FEV1 (5.8%) and DLCO (6%) at 2 years.12
Our study sought to identify a cut-off on FEV1 or DLCO that could be associated with increased toxicity. We also evaluated the incidence of acute toxicities grade ≥ 2 by stratifying patients according to FEV1 into subgroups: FEV1 < 1.0 L, FEV1 < 1.5 L, FEV1 < 30% of predicted and FEV1 < 35% of predicted. However, similar to other studies, we did not find any value that was significantly associated with increased toxicity that could preclude empiric SABR. One possible reason is that no treatment is offered for patients with extremely poor lung function as deemed by clinical judgement, therefore data on these patients is unavailable. In contradiction to other studies, our study found that oxygen dependence before treatment was significantly associated with development of acute toxicities. The exact mechanism for this association is unknown and could not be elucidated by baseline PFT. One possible explanation is that SABR could lead to oxygen free radical generation. In addition, our study indicated that those who developed acute toxicities had worse OS.
Limitations
Our study is limited by caveats of a retrospective study and its small sample size, but is in line with the reported literature (ranging from 33 to 88 patients).1,7,8 Another limitation is that data on pretreatment DLCO was missing in 37 patients and the lack of statistical robustness in terms of the smaller inoperable cohort, which limits the analyses of these factors in regards to anticipated morbidity from SABR. Also, given this is data collected from the US Department of Veterans Affairs, only 3% of our sample was female.
Conclusions
Empiric SABR for patients with presumed early-stage NSCLC appears to be safe and might positively impact OS. Development of any acute toxicity grade ≥ 2 was significantly associated with dependence on supplemental oxygen before treatment, central tumor location, and development of new oxygen requirement. No association was found in patients with poor pulmonary function before treatment because we could not find a FEV1 or DLCO cutoff that could preclude patients from empiric SABR. Considering the poor survival of untreated early-stage NSCLC, coupled with the efficacy and safety of empiric SABR for those with presumed disease, definitive SABR should be offered selectively within this patient population.
Acknowledgments
Drs. Park, Whiting and Castillo contributed to data collection. Drs. Park, Govindan and Castillo contributed to the statistical analysis and writing the first draft and final manuscript. Drs. Park, Govindan, Huang, and Reddy contributed to the discussion section.
1. Harkenrider MM, Bertke MH, Dunlap NE. Stereotactic body radiation therapy for unbiopsied early-stage lung cancer: a multi-institutional analysis. Am J Clin Oncol. 2014;37(4):337-342. doi:10.1097/COC.0b013e318277d822
2. Raz DJ, Zell JA, Ou SH, Gandara DR, Anton-Culver H, Jablons DM. Natural history of stage I non-small cell lung cancer: implications for early detection. Chest. 2007;132(1):193-199. doi:10.1378/chest.06-3096
3. Nanda RH, Liu Y, Gillespie TW, et al. Stereotactic body radiation therapy versus no treatment for early stage non-small cell lung cancer in medically inoperable elderly patients: a National Cancer Data Base analysis. Cancer. 2015;121(23):4222-4230. doi:10.1002/cncr.29640
4. Ball D, Mai GT, Vinod S, et al. Stereotactic ablative radiotherapy versus standard radiotherapy in stage 1 non-small-cell lung cancer (TROG 09.02 CHISEL): a phase 3, open-label, randomised controlled trial. Lancet Oncol. 2019;20(4):494-503. doi:10.1016/S1470-2045(18)30896-9
5. Timmerman R, Paulus R, Galvin J, et al. Stereotactic body radiation therapy for inoperable early stage lung cancer. JAMA. 2010;303(11):1070-1076. doi:10.1001/jama.2010.261
6. Smith MA, Battafarano RJ, Meyers BF, Zoole JB, Cooper JD, Patterson GA. Prevalence of benign disease in patients undergoing resection for suspected lung cancer. Ann Thorac Surg. 2006;81(5):1824-1828. doi:10.1016/j.athoracsur.2005.11.010
7. Haidar YM, Rahn DA 3rd, Nath S, et al. Comparison of outcomes following stereotactic body radiotherapy for nonsmall cell lung cancer in patients with and without pathological confirmation. Ther Adv Respir Dis. 2014;8(1):3-12. doi:10.1177/1753465813512545
8. Fischer-Valuck BW, Boggs H, Katz S, Durci M, Acharya S, Rosen LR. Comparison of stereotactic body radiation therapy for biopsy-proven versus radiographically diagnosed early-stage non-small lung cancer: a single-institution experience. Tumori. 2015;101(3):287-293. doi:10.5301/tj.5000279
9. Guckenberger M, Kestin LL, Hope AJ, et al. Is there a lower limit of pretreatment pulmonary function for safe and effective stereotactic body radiotherapy for early-stage non-small cell lung cancer? J Thorac Oncol. 2012;7:542-551. doi:10.1097/JTO.0b013e31824165d7
10. Wang J, Cao J, Yuan S, et al. Poor baseline pulmonary function may not increase the risk of radiation-induced lung toxicity. Int J Radiat Oncol Biol Phys. 2013;85(3):798-804. doi:10.1016/j.ijrobp.2012.06.040
11. Henderson M, McGarry R, Yiannoutsos C, et al. Baseline pulmonary function as a predictor for survival and decline in pulmonary function over time in patients undergoing stereotactic body radiotherapy for the treatment of stage I non-small-cell lung cancer. Int J Radiat Oncol Biol Phys. 2008;72(2):404-409. doi:10.1016/j.ijrobp.2007.12.051
12. Stanic S, Paulus R, Timmerman RD, et al. No clinically significant changes in pulmonary function following stereotactic body radiation therapy for early- stage peripheral non-small cell lung cancer: an analysis of RTOG 0236. Int J Radiat Oncol Biol Phys. 2014;88(5):1092-1099. doi:10.1016/j.ijrobp.2013.12.050
Impact of an Oral Antineoplastic Renewal Clinic on Medication Possession Ratio and Cost-Savings
Evaluation of oral antineoplastic agent (OAN) adherence patterns have identified correlations between nonadherence or over-adherence and poorer disease-related outcomes. Multiple studies have focused on imatinib use in chronic myeloid leukemia (CML) due to its continuous, long-term use. A study by Ganesan and colleagues found that nonadherence to imatinib showed a significant decrease in 5-year event-free survival between 76.7% of adherent participants compared with 59.8% of nonadherent participants.1 This study found that 44% of patients who were adherent to imatinib achieved complete cytogenetic response vs only 26% of patients who were nonadherent. In another study of imatinib for CML, major molecular response (MMR) was strongly correlated with adherence and no patients with adherence < 80% were able to achieve MMR.2 Similarly, in studies of tamoxifen for breast cancer, < 80% adherence resulted in a 10% decrease in survival when compared to those who were more adherent.3,4
In addition to the clinical implications of nonadherence, there can be a significant cost associated with suboptimal use of these medications. The price of a single dose of OAN medication may cost as much as $440.5
The benefits of multidisciplinary care teams have been identified in many studies.6,7 While studies are limited in oncology, pharmacists provide vital contributions to the oncology multidisciplinary team when managing OANs as these health care professionals have expert knowledge of the medications, potential adverse events (AEs), and necessary monitoring parameters.8 In one study, patients seen by the pharmacist-led oral chemotherapy management program experienced improved clinical outcomes and response to therapy when compared with preintervention patients (early molecular response, 88.9% vs 54.8%, P = .01; major molecular response, 83.3% vs 57.6%, P = .06).9 During the study, 318 AEs were reported, leading to 235 pharmacist interventions to ameliorate AEs and improve adherence.
The primary objective of this study was to measure the impact of a pharmacist-driven OAN renewal clinic on medication adherence. The secondary objective was to estimate cost-savings of this new service.
Methods
Prior to July 2014, several limitations were identified related to OAN prescribing and monitoring at the Richard L. Roudebush Veterans Affairs Medical Center in Indianapolis, Indiana (RLRVAMC). The prescription ordering process relied primarily on the patient to initiate refills, rather than the prescriber OAN prescriptions also lacked consistency for number of refills or quantities dispensed. Furthermore, ordering of antineoplastic products was not limited to hematology/oncology providers. Patients were identified with significant supply on hand at the time of medication discontinuation, creating concerns for medication waste, tolerability, and nonadherence.
As a result, opportunities were identified to improve the prescribing process, recommended monitoring, toxicity and tolerability evaluation, medication reconciliation, and medication adherence. In July of 2014, the RLRVAMC adopted a new chemotherapy order entry system capable of restricting prescriptions to hematology/oncology providers and limiting dispensed quantities and refill amounts. A comprehensive pharmacist driven OAN renewal clinic was implemented on September 1, 2014 with the goal of improving long-term adherence and tolerability, in addition to minimizing medication waste.
Patients were eligible for enrollment in the clinic if they had a cancer diagnosis and were concomitantly prescribed an OAN outlined in Table 1. All eligible patients were automatically enrolled in the clinic when they were deemed stable on their OAN by a hematology/oncology pharmacy specialist. Stability was defined as ≤ Grade 1 symptoms associated with the toxicities of OAN therapy managed with or without intervention as defined by the Common Terminology Criteria for Adverse Events (CTCAE) version 4.03. Once enrolled in the renewal clinic, patients were called by an oncology pharmacy resident (PGY2) 1 week prior to any OAN refill due date. Patients were asked a series of 5 adherence and tolerability questions (Table 2) to evaluate renewal criteria for approval or need for further evaluation. These questions were developed based on targeted information and published reports on monitoring adherence.10,11 Criteria for renewal included: < 10% self-reported missed doses of the OAN during the previous dispensing period, no hospitalizations or emergency department visits since most recent hematology/oncology provider appointment, no changes to concomitant medication therapies, and no new or worsening medication-related AEs. Patients meeting all criteria were given a 30-day supply of OAN. Prescribing, dispensing, and delivery of OAN were facilitated by the pharmacist. Patient cases that did not meet criteria for renewal were escalated to the hematology/oncology provider or oncology clinical pharmacy specialist for further evaluation.
Study Design and Setting
This was a pre/post retrospective cohort, quality improvement study of patients enrolled in the RLRVAMC OAN pharmacist renewal clinic. The study was deemed exempt from institutional review board (IRB) by the US Department of Veterans Affairs (VA) Research and Development Department.
Study Population
Patients were included in the preimplementation group if they had received at least 2 prescriptions of an eligible OAN. Therapy for the preimplementation group was required to be a monthly duration > 21 days and between the dates of September 1, 2013 and August 31, 2014. Patients were included in the postimplementation group if they had received at least 2 prescriptions of the studied OANs between September 1, 2014 and January 31, 2015. Patients were excluded if they had filled < 2 prescriptions of OAN; were managed by a non-VA oncologist or hematologist; or received an OAN other than those listed in Table 1.
Data Collection
For all patients in both the pre- and postimplementation cohorts, a standardized data collection tool was used to collect the following via electronic health record review by a PGY2 oncology resident: age, race, gender, oral antineoplastic agent, refill dates, days’ supply, estimated unit cost per dose cancer diagnosis, distance from the RLRVAMC, copay status, presence of hospitalizations/ED visits/dosage reductions, discontinuation rates, reasons for discontinuation, and total number of current prescriptions. The presence or absence of dosage reductions were collected to identify concerns for tolerability, but only the original dose for the preimplementation group and dosage at time of clinic enrollment for the postimplementation group was included in the analysis.
Outcomes and Statistical Analyses
The primary outcome was medication adherence defined as the median medication possession ratio (MPR) before and after implementation of the clinic. Secondary outcomes included the proportion of patients who were adherent from before implementation to after implementation and estimated cost-savings of this clinic after implementation. MPR was used to estimate medication adherence by taking the cumulative day supply of medication on hand divided by the number of days on therapy.12 Number of days on therapy was determined by taking the difference on the start date of the new medication regimen and the discontinuation date of the same regimen. Patients were grouped by adherence into one of the following categories: < 0.8, 0.8 to 0.89, 0.9 to 1, and > 1.1. Patients were considered adherent if they reported taking ≥ 90% (MPR ≥ 0.9) of prescribed doses, adopted from the study by Anderson and colleagues.12 A patient with an MPR > 1, likely due to filling prior to the anticipated refill date, was considered 100% adherent (MPR = 1). If a patient switched OAN during the study, both agents were included as separate entities.
A conservative estimate of cost-savings was made by multiplying the RLRVAMC cost per unit of medication at time of initial prescription fill by the number of units taken each day multiplied by the total days’ supply on hand at time of therapy discontinuation. Patients with an MPR < 1 at time of therapy discontinuation were assumed to have zero remaining units on hand and zero cost savings was estimated. Waste, for purposes of cost-savings, was calculated for all MPR values > 1. Additional supply anticipated to be on hand from dose reductions was not included in the estimated cost of unused medication.
Descriptive statistics compared demographic characteristics between the pre- and postimplementation groups. MPR data were not normally distributed, which required the use of nonparametric Mann-Whitney U tests to compare pre- and postMPRs. Pearson χ2 compared the proportion of adherent patients between groups while descriptive statistics were used to estimate cost savings. Significance was determined based on a P value < .05. IBM SPSS Statistics software was used for all statistical analyses. As this was a complete sample of all eligible subjects, no sample size calculation was performed.
Results
In the preimplementation period, 246 patients received an OAN and 61 patients received an OAN in the postimplementation period (Figure 1). Of the 246 patients in the preimplementation period, 98 were eligible and included in the preimplementation group. Similarly, of the 61 patients in the postimplementation period, 35 patients met inclusion criteria for the postimplementation group. The study population was predominantly male with an average age of approximately 70 years in both groups (Table 3). More than 70% of the population in each group was White. No statistically significant differences between groups were identified. The most commonly prescribed OAN in the preimplementation group were abiraterone, imatinib, and enzalutamide (Table 3). In the postimplementation group, the most commonly prescribed agents were abiraterone, imatinib, pazopanib, and dasatinib. No significant differences were observed in prescribing of individual agents between the pre- and postimplementation groups or other characteristics that may affect adherence including patient copay status, number of concomitant medications, and driving distance from the RLRVAMC.
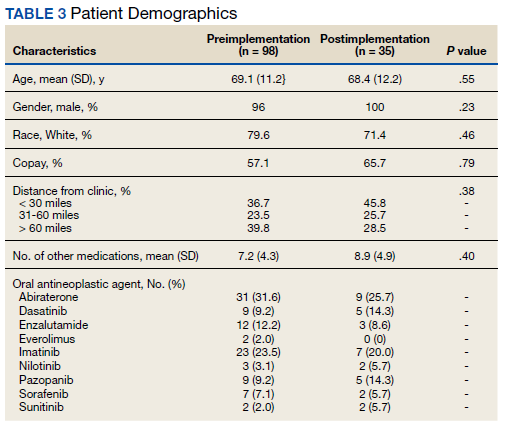
Thirty-six (36.7%) patients in the preimplementation group were considered nonadherent (MPR < 0.9) and 18 (18.4%) had an MPR < 0.8. Fifteen (15.3%) patients in the preimplementation clinic were considered overadherent (MPR > 1.1). Forty-seven (47.9%) patients in the preimplementation group were considered adherent (MPR 0.9 - 1.1) while all 35 (100%) patients in the postimplementation group were considered adherent (MPR 0.9 - 1.1). No non- or overadherent patients were identified in the postimplementation group (Figure 2). The median MPR for all patients in the preimplementation group was 0.94 compared with 1.06 (P < .001) in the postimplementation group.
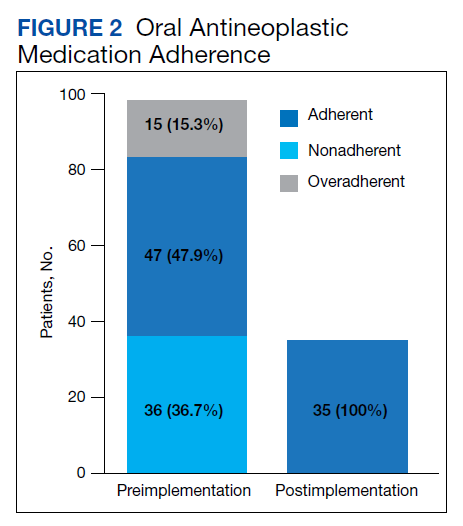
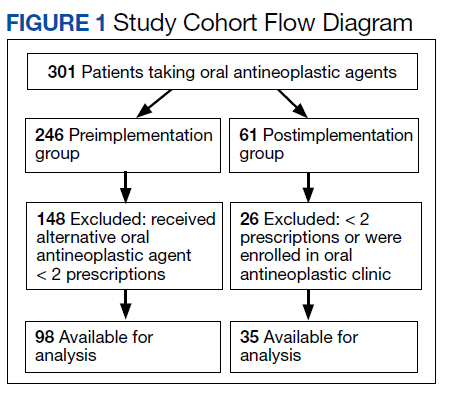
Thirty-five (35.7%) patients had therapy discontinued or held in the preimplementation group compared with 2 (5.7%) patients in the postimplementation group (P < .001). Reasons for discontinuation in the preimplementation group included disease progression (n = 27), death (n = 3), lost to follow up (n = 2), and intolerability of therapy (n = 3). Both patients that discontinued therapy in the postimplementation group did so due to disease progression. Of the 35 patients who had their OAN discontinued or held in the preimplementation group, 14 patients had excess supply on hand at time of discontinuation. The estimated value of the unused medication was $37,890. Nine (25%) of the 35 patients who discontinued therapy had a dosage reduction during the course of therapy and the additional supply was not included in the cost estimate. Similarly, 1 of the 2 patients in the postimplementation group had their OAN discontinued during study. The cost of oversupply of medication at the time of therapy discontinuation was estimated at $1,555. No patients in the postimplementation group had dose reductions. After implementation of the OAN renewal clinic, the total cost savings between pre ($37,890) and postimplementation ($1,555) groups was $36,355.
Discussion
OANs are widely used therapies, with more than 25 million doses administered per year in the United States alone.12 The use of these agents will continue to grow as more targeted agents become available and patients request more convenient treatment options. The role for hematology/oncology clinical pharmacy services must adapt to this increased usage of OANs, including increasing pharmacist involvement in medication education, adherence and tolerability assessments, and proactive drug interaction monitoring.However, additional research is needed to determine optimal management strategies.
Our study aimed to compare OAN adherence among patients at a tertiary care VA hospital before and after implementation of a renewal clinic. The preimplementation population had a median MPR of 0.94 compared with 1.06 in the postimplementation group (P < .001). Although an ideal MPR is 1.0, we aimed for a slightly higher MPR to allow a supply buffer in the event of prescription delivery delays, as more than 90% of prescriptions are mailed to patients from a regional mail-order pharmacy. Importantly, the median MPRs do not adequately convey the impact from this clinic. The proportion of patients who were considered adherent to OANs increased from 47.9% in the preimplementation to 100% in the postimplementation period. These finding suggest that the clinical pharmacist role to assess and encourage adherence through monitoring tolerability of these OANs improved the overall medication taking experience of these patients.
Upon initial evaluation of adherence pre- and postimplementation, median adherence rates in both groups appeared to be above goal at 0.94 and 1.06 respectively. Patients in the postimplementation group intentionally received a 5- to 7-day supply buffer to account for potential prescription delivery delays due to holidays and inclement weather. This would indicate that the patients in the postimplementation group would have 15% oversupply due to the 5-day supply buffer. After correcting for patients with confounding reasons for excess (dose reductions, breaks in treatment, etc.), the median MPR in the prerefill clinic group decreased to 0.9 and the MPR in the postrefill clinic group increased slightly to 1.08. Although the median adherence rate in both the pre- and postimplementation groups were above goal of 0.90, 36% of the patients in the preimplementation group were considered nonadherent (MPR < 0.9) compared with no patients in the postimplementation group. Therefore, our intervention to improve patient adherence appeared to be beneficial at our institution.
In addition to improving adherence, one of the goals of the renewal clinic was to minimize excess supply at the time of therapy discontinuation. This was accomplished by aligning medication fills with medical visits and objective monitoring, as well as limiting supply to no more than 30 days. Of the patients in the postimplementation group, only 1 patient had remaining medication at the time of therapy discontinuation compared with 14 patients in the preimplementation group. The estimated cost savings from excess supply was $36,335. Limiting the amount of unused supply not only saves money for the patient and the institution, but also decreases opportunity for improper hazardous waste disposal and unnecessary exposure of hazardous materials to others.
Our results show the pharmacist intervention in the coordination of renewals improved adherence, minimized medication waste, and saved money. The cost of pharmacist time participating in the refill clinic was not calculated. Each visit was completed in approximately 5 minutes, with subsequent documentation and coordination taking an additional 5 to 10 minutes. During the launch of this service, the oncology pharmacy resident provided all coverage of the clinic. Oversite of the resident was provided by hematology/oncology clinical pharmacy specialists. We have continued to utilize pharmacy resident coverage since that time to meet education needs and keep the estimated cost per visit low. Another option in the case that pharmacy residents are not available would be utilization of a pharmacy technician, intern, or professional student to conduct the adherence and tolerability phone assessments. Our escalation protocol allows intervention by clinical pharmacy specialist and/or other health care providers when necessary. Trainees have only required basic training on how to use the protocol.
Limitations
Due to this study’s retrospective design, an inherent limitation is dependence on prescriber and refill records for documentation of initiation and discontinuation dates. Therefore, only the association of impact of pharmacist intervention on medication adherence can be determined as opposed to causation. We did not take into account discrepancies in day supply secondary to ‘held’ therapies, dose reductions, or doses supplied during an inpatient admission, which may alter estimates of MPR and cost-savings data. Patients in the postimplementation group intentionally received a 5 to 7-day supply buffer to account for potential prescription delivery delays due to holidays and inclement weather. This would indicate that the patients in the postimplementation group would have 15% oversupply due to the 5-day supply buffer, thereby skewing MPR values. This study did not account for cost avoidance resulting from early identification and management of toxicity. Finally, the postimplementation data only spans 4 months and a longer duration of time is needed to more accurately determine sustainability of renewal clinic interventions and provide comprehensive evaluation of cost-avoidance.
Conclusion
Implementation of an OAN renewal clinic was associated with an increase in MPR, improved proportion of patients considered adherent, and an estimated $36,335 cost-savings. However, prospective evaluation and a longer study duration are needed to determine causality of improved adherence and cost-savings associated with a pharmacist-driven OAN renewal clinic.
1. Ganesan P, Sagar TG, Dubashi B, et al. Nonadherence to imatinib adversely affects event free survival in chronic phase chronic myeloid leukemia. Am J Hematol 2011; 86: 471-474. doi:10.1002/ajh.22019
2. Marin D, Bazeos A, Mahon FX, et al. Adherence is the critical factor for achieving molecular responses in patients with chronic myeloid leukemia who achieve complete cytogenetic responses on imatinib. J Clin Oncol 2010; 28: 2381-2388. doi:10.1200/JCO.2009.26.3087
3. McCowan C, Shearer J, Donnan PT, et al. Cohort study examining tamoxifen adherence and its relationship to mortality in women with breast cancer. Br J Cancer 2008; 99: 1763-1768. doi:10.1038/sj.bjc.6604758
4. Lexicomp Online. Sunitinib. Hudson, Ohio: Lexi-Comp, Inc; August 20, 2019.
5. Babiker A, El Husseini M, Al Nemri A, et al. Health care professional development: Working as a team to improve patient care. Sudan J Paediatr. 2014;14(2):9-16.
6. Spence MM, Makarem AF, Reyes SL, et al. Evaluation of an outpatient pharmacy clinical services program on adherence and clinical outcomes among patients with diabetes and/or coronary artery disease. J Manag Care Spec Pharm. 2014;20(10):1036-1045. doi:10.18553/jmcp.2014.20.10.1036
7. Holle LM, Puri S, Clement JM. Physician-pharmacist collaboration for oral chemotherapy monitoring: Insights from an academic genitourinary oncology practice. J Oncol Pharm Pract 2015; doi:10.1177/1078155215581524
8. Muluneh B, Schneider M, Faso A, et al. Improved Adherence Rates and Clinical Outcomes of an Integrated, Closed-Loop, Pharmacist-Led Oral Chemotherapy Management Program. Journal of Oncology Practice. 2018;14(6):371-333. doi:10.1200/JOP.17.00039.
9. Font R, Espinas JA, Gil-Gil M, et al. Prescription refill, patient self-report and physician report in assessing adherence to oral endocrine therapy in early breast cancer patients: a retrospective cohort study in Catalonia, Spain. British Journal of Cancer. 2012 ;107(8):1249-1256. doi:10.1038/bjc.2012.389.
10. Anderson KR, Chambers CR, Lam N, et al. Medication adherence among adults prescribed imatinib, dasatinib, or nilotinib for the treatment of chronic myeloid leukemia. J Oncol Pharm Practice. 2015;21(1):19–25. doi:10.1177/1078155213520261
11. Weingart SN, Brown E, Bach PB, et al. NCCN Task Force Report: oral chemotherapy. J Natl Compr Canc Netw. 2008;6(3): S1-S14.
Evaluation of oral antineoplastic agent (OAN) adherence patterns have identified correlations between nonadherence or over-adherence and poorer disease-related outcomes. Multiple studies have focused on imatinib use in chronic myeloid leukemia (CML) due to its continuous, long-term use. A study by Ganesan and colleagues found that nonadherence to imatinib showed a significant decrease in 5-year event-free survival between 76.7% of adherent participants compared with 59.8% of nonadherent participants.1 This study found that 44% of patients who were adherent to imatinib achieved complete cytogenetic response vs only 26% of patients who were nonadherent. In another study of imatinib for CML, major molecular response (MMR) was strongly correlated with adherence and no patients with adherence < 80% were able to achieve MMR.2 Similarly, in studies of tamoxifen for breast cancer, < 80% adherence resulted in a 10% decrease in survival when compared to those who were more adherent.3,4
In addition to the clinical implications of nonadherence, there can be a significant cost associated with suboptimal use of these medications. The price of a single dose of OAN medication may cost as much as $440.5
The benefits of multidisciplinary care teams have been identified in many studies.6,7 While studies are limited in oncology, pharmacists provide vital contributions to the oncology multidisciplinary team when managing OANs as these health care professionals have expert knowledge of the medications, potential adverse events (AEs), and necessary monitoring parameters.8 In one study, patients seen by the pharmacist-led oral chemotherapy management program experienced improved clinical outcomes and response to therapy when compared with preintervention patients (early molecular response, 88.9% vs 54.8%, P = .01; major molecular response, 83.3% vs 57.6%, P = .06).9 During the study, 318 AEs were reported, leading to 235 pharmacist interventions to ameliorate AEs and improve adherence.
The primary objective of this study was to measure the impact of a pharmacist-driven OAN renewal clinic on medication adherence. The secondary objective was to estimate cost-savings of this new service.
Methods
Prior to July 2014, several limitations were identified related to OAN prescribing and monitoring at the Richard L. Roudebush Veterans Affairs Medical Center in Indianapolis, Indiana (RLRVAMC). The prescription ordering process relied primarily on the patient to initiate refills, rather than the prescriber OAN prescriptions also lacked consistency for number of refills or quantities dispensed. Furthermore, ordering of antineoplastic products was not limited to hematology/oncology providers. Patients were identified with significant supply on hand at the time of medication discontinuation, creating concerns for medication waste, tolerability, and nonadherence.
As a result, opportunities were identified to improve the prescribing process, recommended monitoring, toxicity and tolerability evaluation, medication reconciliation, and medication adherence. In July of 2014, the RLRVAMC adopted a new chemotherapy order entry system capable of restricting prescriptions to hematology/oncology providers and limiting dispensed quantities and refill amounts. A comprehensive pharmacist driven OAN renewal clinic was implemented on September 1, 2014 with the goal of improving long-term adherence and tolerability, in addition to minimizing medication waste.
Patients were eligible for enrollment in the clinic if they had a cancer diagnosis and were concomitantly prescribed an OAN outlined in Table 1. All eligible patients were automatically enrolled in the clinic when they were deemed stable on their OAN by a hematology/oncology pharmacy specialist. Stability was defined as ≤ Grade 1 symptoms associated with the toxicities of OAN therapy managed with or without intervention as defined by the Common Terminology Criteria for Adverse Events (CTCAE) version 4.03. Once enrolled in the renewal clinic, patients were called by an oncology pharmacy resident (PGY2) 1 week prior to any OAN refill due date. Patients were asked a series of 5 adherence and tolerability questions (Table 2) to evaluate renewal criteria for approval or need for further evaluation. These questions were developed based on targeted information and published reports on monitoring adherence.10,11 Criteria for renewal included: < 10% self-reported missed doses of the OAN during the previous dispensing period, no hospitalizations or emergency department visits since most recent hematology/oncology provider appointment, no changes to concomitant medication therapies, and no new or worsening medication-related AEs. Patients meeting all criteria were given a 30-day supply of OAN. Prescribing, dispensing, and delivery of OAN were facilitated by the pharmacist. Patient cases that did not meet criteria for renewal were escalated to the hematology/oncology provider or oncology clinical pharmacy specialist for further evaluation.
Study Design and Setting
This was a pre/post retrospective cohort, quality improvement study of patients enrolled in the RLRVAMC OAN pharmacist renewal clinic. The study was deemed exempt from institutional review board (IRB) by the US Department of Veterans Affairs (VA) Research and Development Department.
Study Population
Patients were included in the preimplementation group if they had received at least 2 prescriptions of an eligible OAN. Therapy for the preimplementation group was required to be a monthly duration > 21 days and between the dates of September 1, 2013 and August 31, 2014. Patients were included in the postimplementation group if they had received at least 2 prescriptions of the studied OANs between September 1, 2014 and January 31, 2015. Patients were excluded if they had filled < 2 prescriptions of OAN; were managed by a non-VA oncologist or hematologist; or received an OAN other than those listed in Table 1.
Data Collection
For all patients in both the pre- and postimplementation cohorts, a standardized data collection tool was used to collect the following via electronic health record review by a PGY2 oncology resident: age, race, gender, oral antineoplastic agent, refill dates, days’ supply, estimated unit cost per dose cancer diagnosis, distance from the RLRVAMC, copay status, presence of hospitalizations/ED visits/dosage reductions, discontinuation rates, reasons for discontinuation, and total number of current prescriptions. The presence or absence of dosage reductions were collected to identify concerns for tolerability, but only the original dose for the preimplementation group and dosage at time of clinic enrollment for the postimplementation group was included in the analysis.
Outcomes and Statistical Analyses
The primary outcome was medication adherence defined as the median medication possession ratio (MPR) before and after implementation of the clinic. Secondary outcomes included the proportion of patients who were adherent from before implementation to after implementation and estimated cost-savings of this clinic after implementation. MPR was used to estimate medication adherence by taking the cumulative day supply of medication on hand divided by the number of days on therapy.12 Number of days on therapy was determined by taking the difference on the start date of the new medication regimen and the discontinuation date of the same regimen. Patients were grouped by adherence into one of the following categories: < 0.8, 0.8 to 0.89, 0.9 to 1, and > 1.1. Patients were considered adherent if they reported taking ≥ 90% (MPR ≥ 0.9) of prescribed doses, adopted from the study by Anderson and colleagues.12 A patient with an MPR > 1, likely due to filling prior to the anticipated refill date, was considered 100% adherent (MPR = 1). If a patient switched OAN during the study, both agents were included as separate entities.
A conservative estimate of cost-savings was made by multiplying the RLRVAMC cost per unit of medication at time of initial prescription fill by the number of units taken each day multiplied by the total days’ supply on hand at time of therapy discontinuation. Patients with an MPR < 1 at time of therapy discontinuation were assumed to have zero remaining units on hand and zero cost savings was estimated. Waste, for purposes of cost-savings, was calculated for all MPR values > 1. Additional supply anticipated to be on hand from dose reductions was not included in the estimated cost of unused medication.
Descriptive statistics compared demographic characteristics between the pre- and postimplementation groups. MPR data were not normally distributed, which required the use of nonparametric Mann-Whitney U tests to compare pre- and postMPRs. Pearson χ2 compared the proportion of adherent patients between groups while descriptive statistics were used to estimate cost savings. Significance was determined based on a P value < .05. IBM SPSS Statistics software was used for all statistical analyses. As this was a complete sample of all eligible subjects, no sample size calculation was performed.
Results
In the preimplementation period, 246 patients received an OAN and 61 patients received an OAN in the postimplementation period (Figure 1). Of the 246 patients in the preimplementation period, 98 were eligible and included in the preimplementation group. Similarly, of the 61 patients in the postimplementation period, 35 patients met inclusion criteria for the postimplementation group. The study population was predominantly male with an average age of approximately 70 years in both groups (Table 3). More than 70% of the population in each group was White. No statistically significant differences between groups were identified. The most commonly prescribed OAN in the preimplementation group were abiraterone, imatinib, and enzalutamide (Table 3). In the postimplementation group, the most commonly prescribed agents were abiraterone, imatinib, pazopanib, and dasatinib. No significant differences were observed in prescribing of individual agents between the pre- and postimplementation groups or other characteristics that may affect adherence including patient copay status, number of concomitant medications, and driving distance from the RLRVAMC.
Thirty-six (36.7%) patients in the preimplementation group were considered nonadherent (MPR < 0.9) and 18 (18.4%) had an MPR < 0.8. Fifteen (15.3%) patients in the preimplementation clinic were considered overadherent (MPR > 1.1). Forty-seven (47.9%) patients in the preimplementation group were considered adherent (MPR 0.9 - 1.1) while all 35 (100%) patients in the postimplementation group were considered adherent (MPR 0.9 - 1.1). No non- or overadherent patients were identified in the postimplementation group (Figure 2). The median MPR for all patients in the preimplementation group was 0.94 compared with 1.06 (P < .001) in the postimplementation group.
Thirty-five (35.7%) patients had therapy discontinued or held in the preimplementation group compared with 2 (5.7%) patients in the postimplementation group (P < .001). Reasons for discontinuation in the preimplementation group included disease progression (n = 27), death (n = 3), lost to follow up (n = 2), and intolerability of therapy (n = 3). Both patients that discontinued therapy in the postimplementation group did so due to disease progression. Of the 35 patients who had their OAN discontinued or held in the preimplementation group, 14 patients had excess supply on hand at time of discontinuation. The estimated value of the unused medication was $37,890. Nine (25%) of the 35 patients who discontinued therapy had a dosage reduction during the course of therapy and the additional supply was not included in the cost estimate. Similarly, 1 of the 2 patients in the postimplementation group had their OAN discontinued during study. The cost of oversupply of medication at the time of therapy discontinuation was estimated at $1,555. No patients in the postimplementation group had dose reductions. After implementation of the OAN renewal clinic, the total cost savings between pre ($37,890) and postimplementation ($1,555) groups was $36,355.
Discussion
OANs are widely used therapies, with more than 25 million doses administered per year in the United States alone.12 The use of these agents will continue to grow as more targeted agents become available and patients request more convenient treatment options. The role for hematology/oncology clinical pharmacy services must adapt to this increased usage of OANs, including increasing pharmacist involvement in medication education, adherence and tolerability assessments, and proactive drug interaction monitoring.However, additional research is needed to determine optimal management strategies.
Our study aimed to compare OAN adherence among patients at a tertiary care VA hospital before and after implementation of a renewal clinic. The preimplementation population had a median MPR of 0.94 compared with 1.06 in the postimplementation group (P < .001). Although an ideal MPR is 1.0, we aimed for a slightly higher MPR to allow a supply buffer in the event of prescription delivery delays, as more than 90% of prescriptions are mailed to patients from a regional mail-order pharmacy. Importantly, the median MPRs do not adequately convey the impact from this clinic. The proportion of patients who were considered adherent to OANs increased from 47.9% in the preimplementation to 100% in the postimplementation period. These finding suggest that the clinical pharmacist role to assess and encourage adherence through monitoring tolerability of these OANs improved the overall medication taking experience of these patients.
Upon initial evaluation of adherence pre- and postimplementation, median adherence rates in both groups appeared to be above goal at 0.94 and 1.06 respectively. Patients in the postimplementation group intentionally received a 5- to 7-day supply buffer to account for potential prescription delivery delays due to holidays and inclement weather. This would indicate that the patients in the postimplementation group would have 15% oversupply due to the 5-day supply buffer. After correcting for patients with confounding reasons for excess (dose reductions, breaks in treatment, etc.), the median MPR in the prerefill clinic group decreased to 0.9 and the MPR in the postrefill clinic group increased slightly to 1.08. Although the median adherence rate in both the pre- and postimplementation groups were above goal of 0.90, 36% of the patients in the preimplementation group were considered nonadherent (MPR < 0.9) compared with no patients in the postimplementation group. Therefore, our intervention to improve patient adherence appeared to be beneficial at our institution.
In addition to improving adherence, one of the goals of the renewal clinic was to minimize excess supply at the time of therapy discontinuation. This was accomplished by aligning medication fills with medical visits and objective monitoring, as well as limiting supply to no more than 30 days. Of the patients in the postimplementation group, only 1 patient had remaining medication at the time of therapy discontinuation compared with 14 patients in the preimplementation group. The estimated cost savings from excess supply was $36,335. Limiting the amount of unused supply not only saves money for the patient and the institution, but also decreases opportunity for improper hazardous waste disposal and unnecessary exposure of hazardous materials to others.
Our results show the pharmacist intervention in the coordination of renewals improved adherence, minimized medication waste, and saved money. The cost of pharmacist time participating in the refill clinic was not calculated. Each visit was completed in approximately 5 minutes, with subsequent documentation and coordination taking an additional 5 to 10 minutes. During the launch of this service, the oncology pharmacy resident provided all coverage of the clinic. Oversite of the resident was provided by hematology/oncology clinical pharmacy specialists. We have continued to utilize pharmacy resident coverage since that time to meet education needs and keep the estimated cost per visit low. Another option in the case that pharmacy residents are not available would be utilization of a pharmacy technician, intern, or professional student to conduct the adherence and tolerability phone assessments. Our escalation protocol allows intervention by clinical pharmacy specialist and/or other health care providers when necessary. Trainees have only required basic training on how to use the protocol.
Limitations
Due to this study’s retrospective design, an inherent limitation is dependence on prescriber and refill records for documentation of initiation and discontinuation dates. Therefore, only the association of impact of pharmacist intervention on medication adherence can be determined as opposed to causation. We did not take into account discrepancies in day supply secondary to ‘held’ therapies, dose reductions, or doses supplied during an inpatient admission, which may alter estimates of MPR and cost-savings data. Patients in the postimplementation group intentionally received a 5 to 7-day supply buffer to account for potential prescription delivery delays due to holidays and inclement weather. This would indicate that the patients in the postimplementation group would have 15% oversupply due to the 5-day supply buffer, thereby skewing MPR values. This study did not account for cost avoidance resulting from early identification and management of toxicity. Finally, the postimplementation data only spans 4 months and a longer duration of time is needed to more accurately determine sustainability of renewal clinic interventions and provide comprehensive evaluation of cost-avoidance.
Conclusion
Implementation of an OAN renewal clinic was associated with an increase in MPR, improved proportion of patients considered adherent, and an estimated $36,335 cost-savings. However, prospective evaluation and a longer study duration are needed to determine causality of improved adherence and cost-savings associated with a pharmacist-driven OAN renewal clinic.
1. Ganesan P, Sagar TG, Dubashi B, et al. Nonadherence to imatinib adversely affects event free survival in chronic phase chronic myeloid leukemia. Am J Hematol 2011; 86: 471-474. doi:10.1002/ajh.22019
2. Marin D, Bazeos A, Mahon FX, et al. Adherence is the critical factor for achieving molecular responses in patients with chronic myeloid leukemia who achieve complete cytogenetic responses on imatinib. J Clin Oncol 2010; 28: 2381-2388. doi:10.1200/JCO.2009.26.3087
3. McCowan C, Shearer J, Donnan PT, et al. Cohort study examining tamoxifen adherence and its relationship to mortality in women with breast cancer. Br J Cancer 2008; 99: 1763-1768. doi:10.1038/sj.bjc.6604758
4. Lexicomp Online. Sunitinib. Hudson, Ohio: Lexi-Comp, Inc; August 20, 2019.
5. Babiker A, El Husseini M, Al Nemri A, et al. Health care professional development: Working as a team to improve patient care. Sudan J Paediatr. 2014;14(2):9-16.
6. Spence MM, Makarem AF, Reyes SL, et al. Evaluation of an outpatient pharmacy clinical services program on adherence and clinical outcomes among patients with diabetes and/or coronary artery disease. J Manag Care Spec Pharm. 2014;20(10):1036-1045. doi:10.18553/jmcp.2014.20.10.1036
7. Holle LM, Puri S, Clement JM. Physician-pharmacist collaboration for oral chemotherapy monitoring: Insights from an academic genitourinary oncology practice. J Oncol Pharm Pract 2015; doi:10.1177/1078155215581524
8. Muluneh B, Schneider M, Faso A, et al. Improved Adherence Rates and Clinical Outcomes of an Integrated, Closed-Loop, Pharmacist-Led Oral Chemotherapy Management Program. Journal of Oncology Practice. 2018;14(6):371-333. doi:10.1200/JOP.17.00039.
9. Font R, Espinas JA, Gil-Gil M, et al. Prescription refill, patient self-report and physician report in assessing adherence to oral endocrine therapy in early breast cancer patients: a retrospective cohort study in Catalonia, Spain. British Journal of Cancer. 2012 ;107(8):1249-1256. doi:10.1038/bjc.2012.389.
10. Anderson KR, Chambers CR, Lam N, et al. Medication adherence among adults prescribed imatinib, dasatinib, or nilotinib for the treatment of chronic myeloid leukemia. J Oncol Pharm Practice. 2015;21(1):19–25. doi:10.1177/1078155213520261
11. Weingart SN, Brown E, Bach PB, et al. NCCN Task Force Report: oral chemotherapy. J Natl Compr Canc Netw. 2008;6(3): S1-S14.