User login
E-cigarettes: Safe to recommend to patients?
Most people assume that electronic cigarettes (e-cigarettes) are safer than conventional tobacco products. Nevertheless, we should not encourage addicted smokers to try “vaping” as an alternative to nicotine replacement therapy, and we should discourage never-smokers from taking up vaping as vigorously as we try to discourage them from taking up smoking.
This article examines the prevailing assumptions and the evidence regarding the safety of e-cigarettes and traditional nicotine replacement therapy.
SMOKING IS DECLINING BUT FAR FROM GONE
While smoking rates have been declining over the past 50 years, the burden of disease attributable to tobacco use remains high. In the United States, it is estimated that nearly 6 million of those currently under the age of 18 will die of tobacco-related illnesses.1 In the 50 years since the US surgeon general first reported on the health concerns related to tobacco, smoking has claimed the lives of nearly 21 million Americans1 and continues to kill more than 400,000 every year.2
Even though the risks of smoking are well known, smoking remains one of the most difficult habits to quit. Indeed, about half of all smokers attempt to quit each year, but very few succeed.3
NICOTINE REPLACEMENT: GUM, PATCHES…E-CIGARETTES?
Nicotine replacement therapy was born out of the thought that, though nicotine is responsible for tobacco’s addictive quality, most tobacco-related disease is attributable to the 7,000 other substances found in tobacco smoke.4 Nicotine polacrilex gum was approved by the US Food and Drug Administration (FDA) in 1984, and nicotine transdermal film was approved in 1991.5
Nicotine replacement therapy, in the form of patches and gum, has been shown to improve the odds of successfully quitting smoking by a factor of nearly 1.5 to 2.6 Nicotine patches and gum were initially prescription medications but became available over the counter in 1996.7 They quickly became first-line agents for smoking cessation, and their over-the-counter availability softened any potential concerns about the possible deleterious health consequences of nicotine itself.
E-cigarettes—devices that generate a nicotine vapor that can be inhaled in a fashion that mimics the experience of smoking—were introduced in China in 2004.8 By 2012, sales of these devices in the United States had reached $500 million and in 2013 were expected to top $1 billion.9,10
E-cigarette manufacturers make no therapeutic claims about their products, thus allowing them to escape regulation by the FDA as nicotine replacement therapy. A recent FDA proposal, however, is likely to change their “protected” status.11 Despite the lack of regulation up to this point, patients generally assume that e-cigarettes are just another form of nicotine replacement therapy, even though they contain substances other than nicotine.
WHAT’S IN E-CIGARETTES?
Nicotine, which is bad in itself
E-cigarettes contain nicotine in varying amounts (some cartridges contain none at all). Though nicotine replacement therapy is less harmful than tobacco, nicotine by itself is associated with its own health problems, notably cancer, cardiovascular disease, birth defects (possibly), and poisoning.
Carcinogenesis. Nicotine plays a direct role in carcinogenesis through a variety of mechanisms, including increasing the activity of tumor growth-promoting transcription factors, decreasing apoptosis, and increasing angiogenesis in tumors.12 Additionally, specific types of nicotinic acetylcholine receptors— eg, alpha 7 receptors, which are stimulated by nicotine—are found in many malignant tumors and are thought to play a role in tumor progression.12 Blockade of alpha 7 nicotinic acetylcholine receptors has been shown to decrease the growth of certain cancers.12
However, these findings were from in vitro studies, and the concerns they raised have not been reflected in in vivo studies. Despite having been on the market for 30 years, nicotine replacement therapy has as yet not been associated with any “real world” increase in cancer risk.
Smoking is one of the leading risk factors for cervical cancer, and nicotine itself may play a contributing role. Nicotine has been shown to increase cellular proliferation in cervical cancer.13 Some evidence suggests that it may also play a role in the lymphogenic metastasis of cervical cancer.13
Cardiovascular disease. Nicotine has been linked to cardiovascular disease. It directly affects the heart’s rate and rhythm via nicotinic acetylcholine receptors in the peripheral autonomic nervous system. It impairs endothelial-dependent dilation of blood vessels in response to nitric oxide, and this inhibition in the coronary arteries may contribute to smoking-related heart disease.14,15 Nicotine has also been shown to raise serum cholesterol levels, increase clot formation, and contribute to plaque formation by increasing vascular smooth muscle.14
Possible teratogenic effect. There is some theoretical concern regarding exposure to nicotine in utero, as nicotinic acetylcholine receptors develop before neurons, and nicotine may therefore interfere with the natural influence of acetylcholine on the development of this system.14
Direct toxicity. Nicotine is toxic at high levels. The overdose potential associated with nicotine is particularly worrisome with e-cigarettes, as the nicotine solution they use is typically supplied in 5-mL, 10-mL, or 20-mL vials that range in concentration from 8.5 to 22.2 mg of nicotine per mL.16 The fatal single dose range of nicotine has been reported at 30 to 60 mg in adults and 10 mg in children and can be achieved by oral, intravenous, or transdermal absorption,16 so one vial, if consumed orally, could be fatal.
The number of calls to US poison control centers regarding e-cigarettes has increased, closely paralleling their rise in popularity. In 2010, there were only 30 e-cigarette related calls to poison control centers; in 2011 the number increased to 269, and in 2012 it had reached 459 and included one fatality that was deemed a suicide.17–19 Even though such toxic nicotine overdoses are rare, physicians should exercise caution and avoid recommending e-cigarettes to individuals with mental confusion, psychotic disorders, or suicidality, who might consume an entire vial.
Possible positive effects? Smoking is one of the worst things that people can do to their body, but the picture is complicated by a few possible positive effects. In the brain, although smoking increases the risk of Alzheimer disease, it is associated with a lower risk of Parkinson disease. In the bowel, it increases the risk of Crohn disease but may decrease the risk of ulcerative colitis. Gahring and Rogers20 pointed out that neuronal nicotinic receptors are present in nonneuronal cells throughout the body and proposed that expression of these receptors may play a role in mediating the consequences of nicotine use, both good and bad. The lesson may be that nicotine is very active in the body, its effects are complicated and still incompletely understood, and therefore we should not encourage people to inhale nicotine products ad lib.
Additives
E-cigarettes typically contain propylene glycol, flavorings, and glycerine. One study that analyzed the additive contents of e-cigarettes found that propylene glycol accounted for 66% of the fluid, glycerine 24%, and flavorings less than 0.1%.21 Propylene glycol is the substance typically used in theater fog machines and is used to generate the vapor in e-cigarettes. Other substances such as tobacco-specific nitrosamines and diethylene glycol have also been found in e-cigarettes in small amounts.22
Propylene glycol, ‘generally recognized as safe’
Propylene glycol has been used in theater fog machines for years—think Phantom of the Opera. It is also widely used as a solvent in many consumer products and pharmaceuticals. The FDA classified it as “generally recognized as safe” on the basis of one study conducted in rats and monkeys over 60 years ago.23 As other authors have noted, however, a major manufacturer of propylene glycol recommends that exposure to propylene glycol mist be avoided.24,25 Potential concern over propylene glycol mist was heightened when it was discovered that of all industries, the entertainment business ranked first in terms of work-related asthma symptoms and had the fifth-highest rate of wheezing.26,27
Studies conducted over the last several decades have raised numerous health concerns about the safety of propylene glycol (Table 1).26,28–36 The studies of propylene glycol fog are particularly important, as they most closely resemble the route of exposure in e-cigarette users.
Wieslander et al28 exposed 27 volunteers to propylene glycol mist for 1 minute in an aircraft simulator under training conditions. Exposures were high, ranging from 176 to 851 mg/m3 (mean = 309 mg/m3). Four volunteers who developed a cough exhibited evidence of airway obstruction as indicated by a 5% decrease in forced expiratory volume in 1 second (FEV1), while the rest did not exhibit any change in FEV1.
Moline et al29 conducted a non-peer-reviewed study for the Actors Equity Association and the League of American Theaters and Producers of 439 actors exposed to theater fog. They found statistically significant evidence of throat and vocal cord inflammation with prolonged peak exposure to glycols and recommended that actors not be exposed to glycol concentrations exceeding 40 mg/m3.
Varughese et al26 conducted a study in 101 volunteers at 19 sites. The mean concentration of glycol-based fog was much lower than that in the studies by Wieslander et al28 and Moline et al,29 at 0.49 mg/m3 (the maximum was 3.22 mg/m3). The investigators concluded that glycol-based fog was associated with deleterious respiratory effects and that employees’ exposure should be limited.
The health issues related to propylene glycol are unique to e-cigarettes compared with nicotine replacement therapy. Unfortunately, the most applicable data available are from studies of persons exposed to theater fog, which involved periodic exposure and likely do not emulate the deep inhalation, multiple times daily, of propylene glycol by e-cigarette smokers. A 2014 review of the chemistry of contaminants in e-cigarettes37 concluded that estimated levels of propylene glycol exposure in e-cigarette users come close to the threshold limit value set by the American Conference of Governmental Industrial Hygienists, and should merit concern.
These studies and real-life experience in the theater, while limited in scope, should give physicians pause and should cause increased awareness of the possibility of e-cigarette-induced pulmonary and upper airway complications. If such complications should occur, discontinuation of vaping should be advised.
Contaminants
The issue of adulterants is common to both e-cigarettes and nicotine replacement therapy. Several unlisted substances have been found in analyzed samples of e-cigarette fluid, including tobacco-specific nitrosamines (TSNAs), diethylene glycol (found in only one e-cigarette cartridge), cotinine, anabasine, myosmine, and beta-nicotyrine.22 The tobacco-specific nitrosamines N´-nitrosonornicotine (NNN), 4-(methylnitrosamino)-1-(3-pyridyl)-1-butanone (NNK), N-nitrosoanabasine, and nitrosoanatabine have been found in five e-cigarette cartridge samples from two manufacturers in amounts similar to those found in nicotine replacement products.22
Goniewicz et al38 tested the vapor generated by 12 e-cigarette brands and found trace amounts of TSNAs. NNN was present in the vapor of eight of the samples in concentrations ranging from 0.8 to 4.3 ng per 150 puffs, and NNK in the vapor of nine of the samples in concentrations ranging from 1.1 to 28.3 ng per 150 puffs. Neither NNN nor NNK was found in blank samples nor with the Nicorette inhalator tested in the same study.38
Because TNSAs can be formed from nicotine and its metabolites, there is also concern that cancer-causing nitrosamines may be formed from nicotine after it is absorbed into the body (ie, endogenously). While endogenous formation of NNK from nicotine has never been demonstrated, endogenous formation of NNN has been seen in some nicotine patch users.39 The presence of these nitrosamines has raised concern that e-cigarettes and nicotine replacement therapy may have carcinogenic potential. The amounts of tobacco-specific nitrosamines found in e-cigarettes are also found in some nicotine replacement products.40
Investigators have examined a possible connection between e-cigarettes and potentially carcinogenic carbonyl compounds, including formaldehyde, acetaldehyde, and acrolein. Formaldehyde (a known carcinogen) and acetaldehyde (a potential carcinogen) have been detected in e-cigarette cartridges and vapor.38,41–43 Acrolein, a mucosal irritant, has been found in e-cigarette vapor.38,43 Goniewicz et al38 suggested that acrolein may be formed by the heating of the glycerin contained in the e-cigarette solution.
An extensive review of the studies of possible contaminant exposures (including polycylic aromatic hydrocarbons, TSNAs, volatile organic compounds, diethylene glycol, and inorganic compounds) with e-cigarette use according to occupational hygiene standards concluded that there was no cause for concern about increased health risk.37 The study by Goniewicz et al also concluded that using e-cigarettes instead of traditional cigarettes may significantly reduce exposure to some tobacco-specific toxins.38
E-CIGARETTES VS NICOTINE REPLACEMENT
Traditional nicotine replacement therapy products are regulated by the FDA and therefore standardized in terms of their contents. E-cigarettes, on the other hand, are unregulated vehicles for supplying nicotine, and may pose other health risks. One such risk is related to exposure to propylene glycol, which has never been studied under conditions (in terms of mode of delivery, frequency of dosing, and total duration of exposure) that approximate the exposure associated with e-cigarettes. Furthermore, the high concentration of nicotine in e-cigarette fluid poses a real risk of toxicity and potentially fatal overdose.
Nicotine replacement therapy and e-cigarettes both maintain addiction to nicotine if used in a harm-reduction strategy as a maintenance medication. Whether the ongoing nicotine addiction makes it more likely that individuals would switch back and forth between nicotine replacement and tobacco-based products is not clear. Also not known is whether e-cigarettes may serve as the “gateway drug” by which teens enter into nicotine addiction, but we believe that the potential exists, as these products are potentially more appealing in terms of the lack of pungent smell, the perception of safety, and the variety of flavors of e-cigarettes.
The efficacy of nicotine replacement therapy in improving smoking cessation has been reviewed extensively elsewhere37 and is beyond the scope of this article. E-cigarettes may be appealing to many cigarette smokers because they deliver smokeless nicotine, and they more closely emulate the actual experience of smoking compared with traditional nicotine replacement therapy. Though some evidence suggests that e-cigarettes may be modestly effective in helping tobacco smokers quit nicotine, they are not FDA-approved for smoking cessation and are not marketed for that indication.44 Medical practitioners should see them for what they are: a new nicotine product with a novel delivery system that is not approved as treatment. Because of the inherent risks involved with e-cigarettes, medical practitioners are best advised to remain neutral on the relative value of e-cigarettes and should continue to motivate patients to discontinue nicotine use altogether.
- US Department of Health and Human Services, Centers for Disease Control and Prevention, National Center for Chronic Disease Prevention and Health Promotion, Office on Smoking and Health. The health consequences of smoking—50 years of progress: a report of the Surgeon General. Atlanta, GA; 2014.
- Batra A, Klingler K, Landfeldt B, Friederich HM, Westin A, Danielsson T. Smoking reduction treatment with 4-mg nicotine gum: a double-blind, randomized, placebo-controlled study. Clin Pharmacol Ther 2005; 78:689–696.
- Blondal T, Gudmundsson LJ, Olafsdottir I, Gustavsson G, Westin A. Nicotine nasal spray with nicotine patch for smoking cessation: randomised trial with six year follow up. BMJ 1999; 318:285–288.
- US Department of Health and Human Services, Centers for Disease Control and Prevention, National Center for Chronic Disease Prevention and Health Promotion, Office on Smoking and Health. How tobacco smoke causes disease: the biology and behavioral basis for smoking-attributable disease: a report of the Surgeon General. Atlanta, GA; 2010.
- US Food and Drug Administration (FDA). Drugs@FDA. FDA approved drug products. www.accessdata.fda.gov/scripts/cder/drugsatfda/. Accessed May 31, 2015.
- Stead LF, Perera R, Bullen C, et al. Nicotine replacement therapy for smoking cessation. Cochrane Database Syst Rev 2012; 11:CD000146.
- US Department of Health and Human Services, Food and Drug Administration. Now available without a prescription. www.fda.gov/Drugs/ResourcesForYou/Consumers/ucm143547.htm. Accessed May 31, 2015.
- McQueen A, Tower S, Sumner W. Interviews with “vapers”: implications for future research with electronic cigarettes. Nicotine Tob Res 2011; 13:860–867.
- Kamerow D. Big Tobacco lights up e-cigarettes. BMJ 2013; 346:f3418.
- Robehmed N. E-cigarette sales surpass $1 billion as big tobacco moves in. Forbes. www.forbes.com/sites/natalierobehmed/2013/09/17/e-cigarette-sales-surpass-1-billion-as-big-tobacco-moves-in/. Accessed May 31, 2015.
- US Department of Health and Human Services, Food and Drug Administration. Deeming tobacco products to be subject to the Federal Food, Drug, and Cosmetic Act, as amended by the family smoking prevention and tobacco control act; regulations on the sale and distribution of tobacco products and required warning statements for tobacco products; proposed rule. Federal Register 2014; 79:23141–23207.
- Petros WP, Younis IR, Ford JN, Weed SA. Effects of tobacco smoking and nicotine on cancer treatment. Pharmacotherapy 2012; 32:920–931.
- Lane D, Gray EA, Mathur RS, Mathur SP. Up-regulation of vascular endothelial growth factor-C by nicotine in cervical cancer cell lines. Am J Reprod Immunol 2005; 53:153–158.
- Ginzel KH, Maritz GS, Marks DF, et al. Critical review: nicotine for the fetus, the infant and the adolescent? J Health Psychol 2007; 12:215–224.
- Neunteufl T, Heher S, Kostner K, et al. Contribution of nicotine to acute endothelial dysfunction in long-term smokers. J Am Coll Cardiol 2002; 39:251–256.
- Cameron JM, Howell DN, White JR, Andrenyak DM, Layton ME, Roll JM. Variable and potentially fatal amounts of nicotine in e-cigarette nicotine solutions. Tob Control 2014; 23:77–78.
- Bronstein AC, Spyker DA, Cantilena LR Jr, Green JL, Rumack BH, Dart RC. 2010 Annual Report of the American Association of Poison Control Centers’ National Poison Data System (NPDS): 28th Annual Report. Clin Toxicol (Phila) 2011; 49:910–941.
- Bronstein AC, Spyker DA, Cantilena LR Jr, Rumack BH, Dart RC. 2011 Annual Report of the American Association of Poison Control Centers’ National Poison Data System (NPDS): 29th Annual Report. Clin Toxicol (Phila) 2012; 50:911–1164.
- Mowry JB, Spyker DA, Cantilena LR Jr, Bailey JE, Ford M. 2012 Annual Report of the American Association of Poison Control Centers’ National Poison Data System (NPDS): 30th Annual Report. Clin Toxicol (Phila) 2013; 51:949–1229.
- Gahring LC, Rogers SW. Neuronal nicotinic acetylcholine receptor expression and function on nonneuronal cells. AAPS J 2006; 7:E885–E894.
- Pellegrino RM, Tinghino B, Mangiaracina G, et al. Electronic cigarettes: an evaluation of exposure to chemicals and fine particulate matter (PM). Ann Ig 2012; 24:279–288.
- Westenberger BJ. Evaluation of e-cigarettes. St. Louis, MO: Department of Health and Human Services, Food and Drug Administration, Center for Drug Evaluation and Research, Division of Pharmaceutical Analysis, 2009. www.fda.gov/downloads/drugs/scienceresearch/ucm173250.pdf. Accessed May 31, 2015.
- Robertson OH, Loosli CG, Puck TT, et al. Tests for the chronic toxicity of propylene glycol and triethylene glycol on monkeys and rats by vapor inhalation and oral administration. J Pharmacol Exp Ther 1947; 91:52–76.
- Riker CA, Lee K, Darville A, Hahn EJ. E-cigarettes: promise or peril? Nurs Clin North Am 2012; 47:159–171.
- Dow Chemical Company. A Guide to Glycols. http://msdssearch.dow.com/PublishedLiteratureDOWCOM/dh_091b/0901b8038091b508.pdf?filepath=propyleneglycol/pdfs/noreg/117-01682.pdf&fromPage=GetDoc. Accessed May 31, 2015.
- Varughese S, Teschke K, Brauer M, Chow Y, van Netten C, Kennedy SM. Effects of theatrical smokes and fogs on respiratory health in the entertainment industry. Am J Ind Med 2005; 47:411–418.
- Arif AA, Whitehead LW, Delclos GL, Tortolero SR, Lee ES. Prevalence and risk factors of work related asthma by industry among United States workers: data from the third national health and nutrition examination survey (1988-94). Occup Environ Med 2002; 59:505–511.
- Wieslander G, Norbäck D, Lindgren T. Experimental exposure to propylene glycol mist in aviation emergency training: acute ocular and respiratory effects. Occup Environ Med 2001; 58:649–655.
- Moline JM, Golden Al, Highland JH, Wilmarth KR, Kao AS. Health effects evaluation of theatrical smoke, haze and pyrotechnics. Prepared for Actor’s Equity Pension and Health Trust Funds. www.equityleague.org/PDF/smokehaze/execsummary.pdf. Accessed May 31, 2015.
- Funk JO, Maibach HI. Propylene glycol dermatitis: re-evaluation of an old problem. Contact Dermatitis 1994; 31:236–241.
- Connolly M, Buckley DA. Contact dermatitis from propylene glycol in ECG electrodes, complicated by medicament allergy. Contact Dermatitis 2004; 50:42.
- Skaare A, Kjaerheim V, Barkvoll P, Rølla G. Skin reactions and irritation potential of four commercial toothpastes. Acta Odontol Scand 1997; 55:133–136.
- Peleg O, Bar-Oz B, Arad I. Coma in a premature infant associated with the transdermal absorption of propylene glycol. Acta Paediatr 1998; 87:1195–1196.
- Fisher AA. Systemic contact dermatitis caused by ingestion of certain foods in propylene glycol-sensitive patients. Am J Contact Dermat 1996; 7:259.
- Demey HE, Daelemans RA, Verpooten GA, et al. Propylene glycol-induced side effects during intravenous nitroglycerin therapy. Intensive Care Med 1988; 14:221–226.
- Demey H, Daelemans R, De Broe ME, Bossaert L. Propyleneglycol intoxication due to intravenous nitroglycerin. Lancet 1984; 1:1360.
- Burstyn I. Peering through the mist: systematic review of what the chemistry of contaminants in electronic cigarettes tells us about health risks. BMC Public Health 2014;14:18.
- Goniewicz ML, Knysak J, Gawron M, et al. Levels of selected carcinogens and toxicants in vapour from electronic cigarettes. Tob Control 2014; 23:133–139.
- Stepanov I, Carmella SG, Han S, et al. Evidence for endogenous formation of N’-nitrosonornicotine in some long-term nicotine patch users. Nicotine Tob Res 2009; 11:99–105.
- Cahn Z, Siegel M. Electronic cigarettes as a harm reduction strategy for tobacco control: a step forward or a repeat of past mistakes? J Public Health Policy 2011; 32:16–31.
- Coulson H. Analysis of components from Gamucci electronic cigarette cartridges, tobacco flavor regular smoking liquid 2009. Report number: E98D. LPD Lab Service. March 3, 2009. http://truthaboutecigs.com/science/7.pdf. Accessed May 31, 2015.
- Laugesen M. Safety report on the Ruyan e-cigarette cartridge and inhaled aerosol. Christchurch, New Zealand: Health New Zealand Ltd., October 30, 2008. www.healthnz.co.nz/RuyanCartridgeReport30-Oct-08.pdf. Accessed May 31, 2015.
- Uchiyama S, Inaba Y, Kunugita N. Determination of acrolein and other carbonyls in cigarette smoke using coupled silica cartridges impregnated with hydroquinone and 2,4-dinitrophenylhydrazine. J Chromatogr A 2010; 1217:4383–4388.
- Bhatnagar A, Whitsel LP, Ribisl KM, et al; American Heart Association Advocacy Coordinating Committee, Council on Cardiovascular and Stroke Nursing, Council on Clinical Cardiology, and Council on Quality of Care and Outcomes Research. Electronic cigarettes: a policy statement from the American Heart Association. Circulation 2014; 130:1418–1436.
Most people assume that electronic cigarettes (e-cigarettes) are safer than conventional tobacco products. Nevertheless, we should not encourage addicted smokers to try “vaping” as an alternative to nicotine replacement therapy, and we should discourage never-smokers from taking up vaping as vigorously as we try to discourage them from taking up smoking.
This article examines the prevailing assumptions and the evidence regarding the safety of e-cigarettes and traditional nicotine replacement therapy.
SMOKING IS DECLINING BUT FAR FROM GONE
While smoking rates have been declining over the past 50 years, the burden of disease attributable to tobacco use remains high. In the United States, it is estimated that nearly 6 million of those currently under the age of 18 will die of tobacco-related illnesses.1 In the 50 years since the US surgeon general first reported on the health concerns related to tobacco, smoking has claimed the lives of nearly 21 million Americans1 and continues to kill more than 400,000 every year.2
Even though the risks of smoking are well known, smoking remains one of the most difficult habits to quit. Indeed, about half of all smokers attempt to quit each year, but very few succeed.3
NICOTINE REPLACEMENT: GUM, PATCHES…E-CIGARETTES?
Nicotine replacement therapy was born out of the thought that, though nicotine is responsible for tobacco’s addictive quality, most tobacco-related disease is attributable to the 7,000 other substances found in tobacco smoke.4 Nicotine polacrilex gum was approved by the US Food and Drug Administration (FDA) in 1984, and nicotine transdermal film was approved in 1991.5
Nicotine replacement therapy, in the form of patches and gum, has been shown to improve the odds of successfully quitting smoking by a factor of nearly 1.5 to 2.6 Nicotine patches and gum were initially prescription medications but became available over the counter in 1996.7 They quickly became first-line agents for smoking cessation, and their over-the-counter availability softened any potential concerns about the possible deleterious health consequences of nicotine itself.
E-cigarettes—devices that generate a nicotine vapor that can be inhaled in a fashion that mimics the experience of smoking—were introduced in China in 2004.8 By 2012, sales of these devices in the United States had reached $500 million and in 2013 were expected to top $1 billion.9,10
E-cigarette manufacturers make no therapeutic claims about their products, thus allowing them to escape regulation by the FDA as nicotine replacement therapy. A recent FDA proposal, however, is likely to change their “protected” status.11 Despite the lack of regulation up to this point, patients generally assume that e-cigarettes are just another form of nicotine replacement therapy, even though they contain substances other than nicotine.
WHAT’S IN E-CIGARETTES?
Nicotine, which is bad in itself
E-cigarettes contain nicotine in varying amounts (some cartridges contain none at all). Though nicotine replacement therapy is less harmful than tobacco, nicotine by itself is associated with its own health problems, notably cancer, cardiovascular disease, birth defects (possibly), and poisoning.
Carcinogenesis. Nicotine plays a direct role in carcinogenesis through a variety of mechanisms, including increasing the activity of tumor growth-promoting transcription factors, decreasing apoptosis, and increasing angiogenesis in tumors.12 Additionally, specific types of nicotinic acetylcholine receptors— eg, alpha 7 receptors, which are stimulated by nicotine—are found in many malignant tumors and are thought to play a role in tumor progression.12 Blockade of alpha 7 nicotinic acetylcholine receptors has been shown to decrease the growth of certain cancers.12
However, these findings were from in vitro studies, and the concerns they raised have not been reflected in in vivo studies. Despite having been on the market for 30 years, nicotine replacement therapy has as yet not been associated with any “real world” increase in cancer risk.
Smoking is one of the leading risk factors for cervical cancer, and nicotine itself may play a contributing role. Nicotine has been shown to increase cellular proliferation in cervical cancer.13 Some evidence suggests that it may also play a role in the lymphogenic metastasis of cervical cancer.13
Cardiovascular disease. Nicotine has been linked to cardiovascular disease. It directly affects the heart’s rate and rhythm via nicotinic acetylcholine receptors in the peripheral autonomic nervous system. It impairs endothelial-dependent dilation of blood vessels in response to nitric oxide, and this inhibition in the coronary arteries may contribute to smoking-related heart disease.14,15 Nicotine has also been shown to raise serum cholesterol levels, increase clot formation, and contribute to plaque formation by increasing vascular smooth muscle.14
Possible teratogenic effect. There is some theoretical concern regarding exposure to nicotine in utero, as nicotinic acetylcholine receptors develop before neurons, and nicotine may therefore interfere with the natural influence of acetylcholine on the development of this system.14
Direct toxicity. Nicotine is toxic at high levels. The overdose potential associated with nicotine is particularly worrisome with e-cigarettes, as the nicotine solution they use is typically supplied in 5-mL, 10-mL, or 20-mL vials that range in concentration from 8.5 to 22.2 mg of nicotine per mL.16 The fatal single dose range of nicotine has been reported at 30 to 60 mg in adults and 10 mg in children and can be achieved by oral, intravenous, or transdermal absorption,16 so one vial, if consumed orally, could be fatal.
The number of calls to US poison control centers regarding e-cigarettes has increased, closely paralleling their rise in popularity. In 2010, there were only 30 e-cigarette related calls to poison control centers; in 2011 the number increased to 269, and in 2012 it had reached 459 and included one fatality that was deemed a suicide.17–19 Even though such toxic nicotine overdoses are rare, physicians should exercise caution and avoid recommending e-cigarettes to individuals with mental confusion, psychotic disorders, or suicidality, who might consume an entire vial.
Possible positive effects? Smoking is one of the worst things that people can do to their body, but the picture is complicated by a few possible positive effects. In the brain, although smoking increases the risk of Alzheimer disease, it is associated with a lower risk of Parkinson disease. In the bowel, it increases the risk of Crohn disease but may decrease the risk of ulcerative colitis. Gahring and Rogers20 pointed out that neuronal nicotinic receptors are present in nonneuronal cells throughout the body and proposed that expression of these receptors may play a role in mediating the consequences of nicotine use, both good and bad. The lesson may be that nicotine is very active in the body, its effects are complicated and still incompletely understood, and therefore we should not encourage people to inhale nicotine products ad lib.
Additives
E-cigarettes typically contain propylene glycol, flavorings, and glycerine. One study that analyzed the additive contents of e-cigarettes found that propylene glycol accounted for 66% of the fluid, glycerine 24%, and flavorings less than 0.1%.21 Propylene glycol is the substance typically used in theater fog machines and is used to generate the vapor in e-cigarettes. Other substances such as tobacco-specific nitrosamines and diethylene glycol have also been found in e-cigarettes in small amounts.22
Propylene glycol, ‘generally recognized as safe’
Propylene glycol has been used in theater fog machines for years—think Phantom of the Opera. It is also widely used as a solvent in many consumer products and pharmaceuticals. The FDA classified it as “generally recognized as safe” on the basis of one study conducted in rats and monkeys over 60 years ago.23 As other authors have noted, however, a major manufacturer of propylene glycol recommends that exposure to propylene glycol mist be avoided.24,25 Potential concern over propylene glycol mist was heightened when it was discovered that of all industries, the entertainment business ranked first in terms of work-related asthma symptoms and had the fifth-highest rate of wheezing.26,27
Studies conducted over the last several decades have raised numerous health concerns about the safety of propylene glycol (Table 1).26,28–36 The studies of propylene glycol fog are particularly important, as they most closely resemble the route of exposure in e-cigarette users.
Wieslander et al28 exposed 27 volunteers to propylene glycol mist for 1 minute in an aircraft simulator under training conditions. Exposures were high, ranging from 176 to 851 mg/m3 (mean = 309 mg/m3). Four volunteers who developed a cough exhibited evidence of airway obstruction as indicated by a 5% decrease in forced expiratory volume in 1 second (FEV1), while the rest did not exhibit any change in FEV1.
Moline et al29 conducted a non-peer-reviewed study for the Actors Equity Association and the League of American Theaters and Producers of 439 actors exposed to theater fog. They found statistically significant evidence of throat and vocal cord inflammation with prolonged peak exposure to glycols and recommended that actors not be exposed to glycol concentrations exceeding 40 mg/m3.
Varughese et al26 conducted a study in 101 volunteers at 19 sites. The mean concentration of glycol-based fog was much lower than that in the studies by Wieslander et al28 and Moline et al,29 at 0.49 mg/m3 (the maximum was 3.22 mg/m3). The investigators concluded that glycol-based fog was associated with deleterious respiratory effects and that employees’ exposure should be limited.
The health issues related to propylene glycol are unique to e-cigarettes compared with nicotine replacement therapy. Unfortunately, the most applicable data available are from studies of persons exposed to theater fog, which involved periodic exposure and likely do not emulate the deep inhalation, multiple times daily, of propylene glycol by e-cigarette smokers. A 2014 review of the chemistry of contaminants in e-cigarettes37 concluded that estimated levels of propylene glycol exposure in e-cigarette users come close to the threshold limit value set by the American Conference of Governmental Industrial Hygienists, and should merit concern.
These studies and real-life experience in the theater, while limited in scope, should give physicians pause and should cause increased awareness of the possibility of e-cigarette-induced pulmonary and upper airway complications. If such complications should occur, discontinuation of vaping should be advised.
Contaminants
The issue of adulterants is common to both e-cigarettes and nicotine replacement therapy. Several unlisted substances have been found in analyzed samples of e-cigarette fluid, including tobacco-specific nitrosamines (TSNAs), diethylene glycol (found in only one e-cigarette cartridge), cotinine, anabasine, myosmine, and beta-nicotyrine.22 The tobacco-specific nitrosamines N´-nitrosonornicotine (NNN), 4-(methylnitrosamino)-1-(3-pyridyl)-1-butanone (NNK), N-nitrosoanabasine, and nitrosoanatabine have been found in five e-cigarette cartridge samples from two manufacturers in amounts similar to those found in nicotine replacement products.22
Goniewicz et al38 tested the vapor generated by 12 e-cigarette brands and found trace amounts of TSNAs. NNN was present in the vapor of eight of the samples in concentrations ranging from 0.8 to 4.3 ng per 150 puffs, and NNK in the vapor of nine of the samples in concentrations ranging from 1.1 to 28.3 ng per 150 puffs. Neither NNN nor NNK was found in blank samples nor with the Nicorette inhalator tested in the same study.38
Because TNSAs can be formed from nicotine and its metabolites, there is also concern that cancer-causing nitrosamines may be formed from nicotine after it is absorbed into the body (ie, endogenously). While endogenous formation of NNK from nicotine has never been demonstrated, endogenous formation of NNN has been seen in some nicotine patch users.39 The presence of these nitrosamines has raised concern that e-cigarettes and nicotine replacement therapy may have carcinogenic potential. The amounts of tobacco-specific nitrosamines found in e-cigarettes are also found in some nicotine replacement products.40
Investigators have examined a possible connection between e-cigarettes and potentially carcinogenic carbonyl compounds, including formaldehyde, acetaldehyde, and acrolein. Formaldehyde (a known carcinogen) and acetaldehyde (a potential carcinogen) have been detected in e-cigarette cartridges and vapor.38,41–43 Acrolein, a mucosal irritant, has been found in e-cigarette vapor.38,43 Goniewicz et al38 suggested that acrolein may be formed by the heating of the glycerin contained in the e-cigarette solution.
An extensive review of the studies of possible contaminant exposures (including polycylic aromatic hydrocarbons, TSNAs, volatile organic compounds, diethylene glycol, and inorganic compounds) with e-cigarette use according to occupational hygiene standards concluded that there was no cause for concern about increased health risk.37 The study by Goniewicz et al also concluded that using e-cigarettes instead of traditional cigarettes may significantly reduce exposure to some tobacco-specific toxins.38
E-CIGARETTES VS NICOTINE REPLACEMENT
Traditional nicotine replacement therapy products are regulated by the FDA and therefore standardized in terms of their contents. E-cigarettes, on the other hand, are unregulated vehicles for supplying nicotine, and may pose other health risks. One such risk is related to exposure to propylene glycol, which has never been studied under conditions (in terms of mode of delivery, frequency of dosing, and total duration of exposure) that approximate the exposure associated with e-cigarettes. Furthermore, the high concentration of nicotine in e-cigarette fluid poses a real risk of toxicity and potentially fatal overdose.
Nicotine replacement therapy and e-cigarettes both maintain addiction to nicotine if used in a harm-reduction strategy as a maintenance medication. Whether the ongoing nicotine addiction makes it more likely that individuals would switch back and forth between nicotine replacement and tobacco-based products is not clear. Also not known is whether e-cigarettes may serve as the “gateway drug” by which teens enter into nicotine addiction, but we believe that the potential exists, as these products are potentially more appealing in terms of the lack of pungent smell, the perception of safety, and the variety of flavors of e-cigarettes.
The efficacy of nicotine replacement therapy in improving smoking cessation has been reviewed extensively elsewhere37 and is beyond the scope of this article. E-cigarettes may be appealing to many cigarette smokers because they deliver smokeless nicotine, and they more closely emulate the actual experience of smoking compared with traditional nicotine replacement therapy. Though some evidence suggests that e-cigarettes may be modestly effective in helping tobacco smokers quit nicotine, they are not FDA-approved for smoking cessation and are not marketed for that indication.44 Medical practitioners should see them for what they are: a new nicotine product with a novel delivery system that is not approved as treatment. Because of the inherent risks involved with e-cigarettes, medical practitioners are best advised to remain neutral on the relative value of e-cigarettes and should continue to motivate patients to discontinue nicotine use altogether.
- US Department of Health and Human Services, Centers for Disease Control and Prevention, National Center for Chronic Disease Prevention and Health Promotion, Office on Smoking and Health. The health consequences of smoking—50 years of progress: a report of the Surgeon General. Atlanta, GA; 2014.
- Batra A, Klingler K, Landfeldt B, Friederich HM, Westin A, Danielsson T. Smoking reduction treatment with 4-mg nicotine gum: a double-blind, randomized, placebo-controlled study. Clin Pharmacol Ther 2005; 78:689–696.
- Blondal T, Gudmundsson LJ, Olafsdottir I, Gustavsson G, Westin A. Nicotine nasal spray with nicotine patch for smoking cessation: randomised trial with six year follow up. BMJ 1999; 318:285–288.
- US Department of Health and Human Services, Centers for Disease Control and Prevention, National Center for Chronic Disease Prevention and Health Promotion, Office on Smoking and Health. How tobacco smoke causes disease: the biology and behavioral basis for smoking-attributable disease: a report of the Surgeon General. Atlanta, GA; 2010.
- US Food and Drug Administration (FDA). Drugs@FDA. FDA approved drug products. www.accessdata.fda.gov/scripts/cder/drugsatfda/. Accessed May 31, 2015.
- Stead LF, Perera R, Bullen C, et al. Nicotine replacement therapy for smoking cessation. Cochrane Database Syst Rev 2012; 11:CD000146.
- US Department of Health and Human Services, Food and Drug Administration. Now available without a prescription. www.fda.gov/Drugs/ResourcesForYou/Consumers/ucm143547.htm. Accessed May 31, 2015.
- McQueen A, Tower S, Sumner W. Interviews with “vapers”: implications for future research with electronic cigarettes. Nicotine Tob Res 2011; 13:860–867.
- Kamerow D. Big Tobacco lights up e-cigarettes. BMJ 2013; 346:f3418.
- Robehmed N. E-cigarette sales surpass $1 billion as big tobacco moves in. Forbes. www.forbes.com/sites/natalierobehmed/2013/09/17/e-cigarette-sales-surpass-1-billion-as-big-tobacco-moves-in/. Accessed May 31, 2015.
- US Department of Health and Human Services, Food and Drug Administration. Deeming tobacco products to be subject to the Federal Food, Drug, and Cosmetic Act, as amended by the family smoking prevention and tobacco control act; regulations on the sale and distribution of tobacco products and required warning statements for tobacco products; proposed rule. Federal Register 2014; 79:23141–23207.
- Petros WP, Younis IR, Ford JN, Weed SA. Effects of tobacco smoking and nicotine on cancer treatment. Pharmacotherapy 2012; 32:920–931.
- Lane D, Gray EA, Mathur RS, Mathur SP. Up-regulation of vascular endothelial growth factor-C by nicotine in cervical cancer cell lines. Am J Reprod Immunol 2005; 53:153–158.
- Ginzel KH, Maritz GS, Marks DF, et al. Critical review: nicotine for the fetus, the infant and the adolescent? J Health Psychol 2007; 12:215–224.
- Neunteufl T, Heher S, Kostner K, et al. Contribution of nicotine to acute endothelial dysfunction in long-term smokers. J Am Coll Cardiol 2002; 39:251–256.
- Cameron JM, Howell DN, White JR, Andrenyak DM, Layton ME, Roll JM. Variable and potentially fatal amounts of nicotine in e-cigarette nicotine solutions. Tob Control 2014; 23:77–78.
- Bronstein AC, Spyker DA, Cantilena LR Jr, Green JL, Rumack BH, Dart RC. 2010 Annual Report of the American Association of Poison Control Centers’ National Poison Data System (NPDS): 28th Annual Report. Clin Toxicol (Phila) 2011; 49:910–941.
- Bronstein AC, Spyker DA, Cantilena LR Jr, Rumack BH, Dart RC. 2011 Annual Report of the American Association of Poison Control Centers’ National Poison Data System (NPDS): 29th Annual Report. Clin Toxicol (Phila) 2012; 50:911–1164.
- Mowry JB, Spyker DA, Cantilena LR Jr, Bailey JE, Ford M. 2012 Annual Report of the American Association of Poison Control Centers’ National Poison Data System (NPDS): 30th Annual Report. Clin Toxicol (Phila) 2013; 51:949–1229.
- Gahring LC, Rogers SW. Neuronal nicotinic acetylcholine receptor expression and function on nonneuronal cells. AAPS J 2006; 7:E885–E894.
- Pellegrino RM, Tinghino B, Mangiaracina G, et al. Electronic cigarettes: an evaluation of exposure to chemicals and fine particulate matter (PM). Ann Ig 2012; 24:279–288.
- Westenberger BJ. Evaluation of e-cigarettes. St. Louis, MO: Department of Health and Human Services, Food and Drug Administration, Center for Drug Evaluation and Research, Division of Pharmaceutical Analysis, 2009. www.fda.gov/downloads/drugs/scienceresearch/ucm173250.pdf. Accessed May 31, 2015.
- Robertson OH, Loosli CG, Puck TT, et al. Tests for the chronic toxicity of propylene glycol and triethylene glycol on monkeys and rats by vapor inhalation and oral administration. J Pharmacol Exp Ther 1947; 91:52–76.
- Riker CA, Lee K, Darville A, Hahn EJ. E-cigarettes: promise or peril? Nurs Clin North Am 2012; 47:159–171.
- Dow Chemical Company. A Guide to Glycols. http://msdssearch.dow.com/PublishedLiteratureDOWCOM/dh_091b/0901b8038091b508.pdf?filepath=propyleneglycol/pdfs/noreg/117-01682.pdf&fromPage=GetDoc. Accessed May 31, 2015.
- Varughese S, Teschke K, Brauer M, Chow Y, van Netten C, Kennedy SM. Effects of theatrical smokes and fogs on respiratory health in the entertainment industry. Am J Ind Med 2005; 47:411–418.
- Arif AA, Whitehead LW, Delclos GL, Tortolero SR, Lee ES. Prevalence and risk factors of work related asthma by industry among United States workers: data from the third national health and nutrition examination survey (1988-94). Occup Environ Med 2002; 59:505–511.
- Wieslander G, Norbäck D, Lindgren T. Experimental exposure to propylene glycol mist in aviation emergency training: acute ocular and respiratory effects. Occup Environ Med 2001; 58:649–655.
- Moline JM, Golden Al, Highland JH, Wilmarth KR, Kao AS. Health effects evaluation of theatrical smoke, haze and pyrotechnics. Prepared for Actor’s Equity Pension and Health Trust Funds. www.equityleague.org/PDF/smokehaze/execsummary.pdf. Accessed May 31, 2015.
- Funk JO, Maibach HI. Propylene glycol dermatitis: re-evaluation of an old problem. Contact Dermatitis 1994; 31:236–241.
- Connolly M, Buckley DA. Contact dermatitis from propylene glycol in ECG electrodes, complicated by medicament allergy. Contact Dermatitis 2004; 50:42.
- Skaare A, Kjaerheim V, Barkvoll P, Rølla G. Skin reactions and irritation potential of four commercial toothpastes. Acta Odontol Scand 1997; 55:133–136.
- Peleg O, Bar-Oz B, Arad I. Coma in a premature infant associated with the transdermal absorption of propylene glycol. Acta Paediatr 1998; 87:1195–1196.
- Fisher AA. Systemic contact dermatitis caused by ingestion of certain foods in propylene glycol-sensitive patients. Am J Contact Dermat 1996; 7:259.
- Demey HE, Daelemans RA, Verpooten GA, et al. Propylene glycol-induced side effects during intravenous nitroglycerin therapy. Intensive Care Med 1988; 14:221–226.
- Demey H, Daelemans R, De Broe ME, Bossaert L. Propyleneglycol intoxication due to intravenous nitroglycerin. Lancet 1984; 1:1360.
- Burstyn I. Peering through the mist: systematic review of what the chemistry of contaminants in electronic cigarettes tells us about health risks. BMC Public Health 2014;14:18.
- Goniewicz ML, Knysak J, Gawron M, et al. Levels of selected carcinogens and toxicants in vapour from electronic cigarettes. Tob Control 2014; 23:133–139.
- Stepanov I, Carmella SG, Han S, et al. Evidence for endogenous formation of N’-nitrosonornicotine in some long-term nicotine patch users. Nicotine Tob Res 2009; 11:99–105.
- Cahn Z, Siegel M. Electronic cigarettes as a harm reduction strategy for tobacco control: a step forward or a repeat of past mistakes? J Public Health Policy 2011; 32:16–31.
- Coulson H. Analysis of components from Gamucci electronic cigarette cartridges, tobacco flavor regular smoking liquid 2009. Report number: E98D. LPD Lab Service. March 3, 2009. http://truthaboutecigs.com/science/7.pdf. Accessed May 31, 2015.
- Laugesen M. Safety report on the Ruyan e-cigarette cartridge and inhaled aerosol. Christchurch, New Zealand: Health New Zealand Ltd., October 30, 2008. www.healthnz.co.nz/RuyanCartridgeReport30-Oct-08.pdf. Accessed May 31, 2015.
- Uchiyama S, Inaba Y, Kunugita N. Determination of acrolein and other carbonyls in cigarette smoke using coupled silica cartridges impregnated with hydroquinone and 2,4-dinitrophenylhydrazine. J Chromatogr A 2010; 1217:4383–4388.
- Bhatnagar A, Whitsel LP, Ribisl KM, et al; American Heart Association Advocacy Coordinating Committee, Council on Cardiovascular and Stroke Nursing, Council on Clinical Cardiology, and Council on Quality of Care and Outcomes Research. Electronic cigarettes: a policy statement from the American Heart Association. Circulation 2014; 130:1418–1436.
KEY POINTS
- Although the vapor from e-cigarettes does not contain any tobacco combustion products, which are believed to be responsible for most of the adverse health effects of smoking, it does contain nicotine, which is addictive and poses health risks by itself.
- E-cigarette vapor also contains propylene glycol, which has not been adequately studied with regard to its safety when inhaled deeply and repeatedly. Also present are a variety of additives and contaminants.
- E-cigarette manufacturers make no therapeutic claims about their products, and therefore the US Food and Drug Administration does not regulate them as it does nicotine replacement therapy.

Starting insulin in patients with type 2 diabetes: An individualized approach
Insulin therapy is one of the most effective tools clinicians can use to help patients reach their individualized hemoglobin A1c target. However, decisions about when and how to start insulin therapy have to be individualized to the needs and goals of each patient. Many insulin options are available, one of the most common being the addition of basal insulin to oral antidiabetic drugs. Although patients are often reluctant to start insulin, this reluctance can be overcome through patient education and hands-on training.
Here, we review hemoglobin A1c targets, factors that determine when to start insulin therapy, and the different regimens that can be used.
MOST PATIENTS EVENTUALLY NEED INSULIN
Type 2 diabetes mellitus is a chronic progressive disease associated with insulin resistance, beta-cell dysfunction, and decreased insulin secretion. Consequently, most patients eventually require insulin therapy to reduce the risk of long-term complications.

The efficacy of therapy can be assessed by measuring hemoglobin A1c, an important marker of the chronic hyperglycemic state. The hemoglobin A1c value can be reported as a ratio (%) standardized against the results of the Diabetes Control and Complications Trial,1 or as International Federation of Clinical Chemistry units (mmol/mol).2 Table 1 shows the relationship between hemoglobin A1c and average glucose values.3
WHAT IS AN APPROPRIATE HEMOGLOBIN A1c TARGET?
The short answer is, “It depends.”
Currently, the American Association of Clinical Endocrinologists (AACE) supports a hemoglobin A1c goal of less than 6.5% for otherwise healthy patients but states that the goal should be individualized for patients with concurrent illnesses or at risk of hypoglycemia.4
On the other hand, the American Diabetes Association (ADA) recommends a higher hemoglobin A1c target of less than 7% for most adults with type 2 diabetes mellitus.5 This value was shown to be associated with a reduction in the microvascular and macrovascular complications of diabetes.
Yet when three large trials6–8 recently compared intensive and standard glucose control regimens, tighter glucose control failed to improve cardiovascular outcomes. Moreover, in one of the trials,7 patients receiving intensive treatment had a higher rate of all-cause mortality. Details:
- Action in Diabetes and Vascular Disease (ADVANCE): 11,140 patients; average hemoglobin A1c levels 6.5% vs 7.3%6
- Action to Control Cardiovascular Risk in Diabetes (ACCORD): 10,251 patients; average hemoglobin A1c levels 6.4% vs 7.5%7
- Veterans Affairs Diabetes Trial (VADT): 1,791 patients; average hemoglobin A1c levels 6.9% vs 8.4%.8
Similarly, a 2013 Cochrane review9 that included 28 randomized controlled trials concluded that intensive control (in 18,717 patients) did not decrease all-cause and cardiovascular mortality rates compared with traditional glucose control (in 16,195 patients), and it increased the risk of hypoglycemia and serious adverse events.
As a result, the ADA5 states that a hemoglobin A1c target less than 6.5% is optional for patients with a long life expectancy, short duration of diabetes, low risk of hypoglycemia, and no significant cardiovascular disease. The ADA further defines a hemoglobin A1c goal of less than 8% for patients with a history of severe hypoglycemia, limited life expectancy, advanced microvascular or macrovascular complications, extensive comorbid conditions, and long-standing diabetes.
Therefore, the AACE and ADA are moving away from “one-size-fits-all” goals and toward individualizing their recommendations.
WHEN SHOULD INSULIN BE STARTED?
Physicians should consider the needs and preferences of each patient and individualize the treatment. The most recent recommendations from the ADA5 stress the importance of a patient-centered approach, with multiple factors taken into account. These include the patient’s attitude, expected compliance with treatment, risk of hypoglycemia, disease duration, life expectancy, and comorbidities, and the side effects of oral medications and insulin.
Compared with previous guidelines, there are fewer rules on how and when to start insulin therapy. But absolute and relative indications for insulin therapy should be considered in patients with the following:
Absolute indications for insulin
- Ketoacidosis or catabolic symptoms, including ketonuria
- Newly diagnosed type 2 diabetes with pronounced hyperglycemia (glucose ≥ 300 mg/dL or hemoglobin A1c ≥ 10.0%) with or without severe symptoms, including weight loss, polyuria, or polydipsia10
- Uncontrolled type 2 diabetes mellitus despite using one, two, or more oral antidiabetic drugs or glucagon-like peptide 1 (GLP-1) receptor agonists
- Gestational diabetes
- Preference for insulin.
Relative indications for insulin
- Hospitalized for surgery or acute illnesses
- Advanced renal or hepatic disease
- Inability to afford the cost or tolerate the side effects of oral antidiabetic drugs and GLP-1 receptor agonists.

Depending on the situation, blood glucose is measured fasting, before meals, or after meals after initiating or adjusting insulin regimens (Table 2).
WHAT ARE THE INSULIN REGIMENS?
Basal insulin
In the early stages of type 2 diabetes, metformin alone or in combination with another oral antidiabetic drug or with a GLP-1 receptor agonist is often used along with healthy eating, weight control, and increased physical activity.
When the target hemoglobin A1c cannot be achieved with one or two noninsulin drugs, the ADA suggests basal insulin be added to metformin or a two-medication regimen that includes metformin (Table 3). However, recent evidence suggests that combining a GLP-1 receptor agonist with basal insulin, in a regimen without metformin, is safe and improves glycemic control without hypoglycemia or weight gain.11
While a total daily dose of insulin of 0.1 to 0.2 units/kg could be initially used in patients with a hemoglobin A1c level less than 8%, a higher dose of 0.2 to 0.3 units/kg is required if the hemoglobin A1c level is between 8% and 10%. The dose can be titrated once or twice weekly if the fasting glucose is above the target level (usually < 130 mg/dL). If hypoglycemia develops (glucose < 70 mg/dL), the insulin dose should be reduced by 10% to 20%.10
Available basal insulins include glargine, detemir, and neutral protamine Hagedorn (NPH) (Table 4).12–14 Because glargine and detemir offer better pharmacokinetic properties, less variability in response, and less risk of hypoglycemia, they are preferred over NPH. Glargine has a relatively constant plasma concentration over 24 hours, allowing once-daily dosing at any time during the day (Figure 1).15 The dose should be taken at the same time every day. Detemir and NPH are usually taken once or twice daily.

Patients treated once daily should take the dose with the evening meal or at bedtime. Patients who require a twice-daily regimen can take the first dose with breakfast and the second one with the evening meal, at bedtime, or 12 hours after the morning dose.
The randomized Treat-to-Target trial,16 in 756 patients, showed that both glargine and NPH, when added to oral therapy in patients with type 2 diabetes, achieve the target hemoglobin A1c, but NPH is associated with more episodes of nocturnal hypoglycemia. Similar results were found when NPH was compared with detemir insulin.17
A Cochrane review18 suggested that glargine and detemir are similar in efficacy and safety. However, detemir often needs to be injected twice daily, in a higher dose, and is associated with less weight gain. Furthermore, a meta-analysis of 46 randomized clinical trials19 showed that the weight increase at 1 year is less in patients treated with basal than with twice-daily or prandial regimens.
A noninterventional longitudinal study20 in 2,179 patients newly started on insulin showed that the mean weight increase at 1 year was 1.78 kg, and 24% of patients gained more than 5 kg. However, the factors independently associated with the weight gain were a higher hemoglobin A1c at baseline, a higher insulin dose at baseline and at 1 year, and a lower baseline body mass index, but not the type of insulin regimen.
Currently, a new class of ultralong-acting basal insulins is being studied. Insulins in this class are approved in other countries, but the US Food and Drug Administration requires additional data for approval. Ultralong-acting insulins are expected to reduce the risk of hypoglycemia, specifically the risk of nocturnal episodes. Also, given their longer duration of action and stable steady-state pharmacokinetics, they will offer flexibility in the dose timing.21
Basal-bolus regimens
Basal insulin often does not control postprandial hyperglycemia. The need for multiple doses of insulin (including one or more preprandial doses) is suggested by postprandial glucose values above target (usually > 180 mg/dL) or by a hemoglobin A1c above goal despite well-controlled fasting glucose levels. This usually becomes evident when the total daily dose of basal insulin exceeds 0.5 units/kg. Patients newly diagnosed with diabetes who have a hemoglobin A1c higher than 10% may also respond better to an initial basal-bolus regimen.
Available bolus insulins include lispro, aspart, glulisine, regular insulin, and the newly approved Technosphere inhaled regular insulin (Table 4).12–14 They can be taken before each meal, and the total bolus dose usually represents 50% of the total daily dose.22 Rapid-acting insulins have faster onset, shorter duration of action, and more predictable pharmacokinetics, which makes them preferable to regular insulin (Figure 1).15 Inhaled insulin is another option, but it is contraindicated in patients with chronic obstructive pulmonary disease or asthma because of the increased risk of acute bronchospasm.12
Alternatively, the transition to a basal-bolus regimen can be accomplished with a single dose of bolus insulin before the main meal, using a dose that represents approximately 10% of the total daily dose. Additional bolus doses can be added later based on the glycemic control. The adjustment of the preprandial insulin dose is done once or twice weekly, based on the postprandial glucose levels.10
Premixed combinations of long- and short-acting insulins in ratios of 50% to 50%, 70% to 30%, or 75% to 25% can be considered in patients who cannot adhere to a complex insulin regimen. A propensity-matched comparison of different insulin regimens (basal, premixed, mealtime plus basal, and mealtime) in patients with type 2 diabetes revealed that the hemoglobin A1c reduction was similar between the different groups.23 However, the number of hypoglycemic episodes was higher in the premixed insulin group, and the weight gain was less in the basal insulin group.
While premixed insulins require fewer injections, they do not provide dosing flexibility. In other words, dose adjustments for premixed insulins lead to increases in both basal and bolus amounts even though a dose adjustment is needed for only one insulin type. Thus, this is a common reason for increased hypoglycemic episodes.
Continuous subcutaneous insulin infusion
A meta-analysis showed that continuous subcutaneous insulin infusion (ie, use of an insulin pump) was similar to intensive therapy with multiple daily insulin injections in terms of glycemic control and hypoglycemia.24 Since both options can lead to similar glucose control, additional factors to consider when initiating insulin infusion include lifestyle and technical expertise. Some patients may or may not prefer having a pump attached for nearly all daily activities. Additionally, this type of therapy is complex and requires significant training to ensure efficacy and safety.25
WHAT IS THE COST OF INSULIN THERAPY?
A final factor to keep in mind when initiating insulin is cost (Table 4).12–14 Asking patients to check their prescription insurance formulary is important to ensure that an affordable option is selected. If patients do not have prescription insurance, medication assistance programs could be an option. However, if a patient is considering an insulin pump, insurance coverage is essential. Depending on the manufacturer, insulin pumps cost about $6,000 to $7,000, and the additional monthly supplies for the pump are also expensive.
If patients are engaged when considering and selecting insulin therapy, the likelihood of treatment success is greater.26–28
- The Diabetes Control and Complications Trial Research Group. The effect of intensive treatment of diabetes on the development and progression of long-term complications in insulin-dependent diabetes mellitus. N Engl J Med 1993; 329:977–986.
- Hanas R, John WG; International HbA1c Consensus Committee. 2013 Update on the worldwide standardization of the hemoglobin A1c measurement. Pediatr Diabetes 2014; 15:e1–e2.
- Nathan DM, Kuenen J, Borg R, Zheng H, Schoenfeld D, Heine RJ; A1c-Derived Average Glucose Study Group. Translating the A1C assay into estimated average glucose values. Diabetes Care 2008; 31:1473–1478.
- Garber AJ, Abrahamson MJ, Barzilay JI, et al; American Association of Clinical Endocrinologists. AACE comprehensive diabetes management algorithm 2013. Endocr Pract 2013; 19:327–336.
- American Diabetes Association. Standards of medical care in diabetes—2014. Diabetes Care 2014; 37(suppl 1):S14–S80.
- ADVANCE Collaborative Group; Patel A, MacMahon S, Chalmers J, et al. Intensive blood glucose control and vascular outcomes in patients with type 2 diabetes. N Engl J Med 2008; 358:2560–2572.
- Action to Control Cardiovascular Risk in Diabetes Study Group; Gerstein HC, Miller ME, Byington RP, et al. Effects of intensive glucose lowering in type 2 diabetes. N Engl J Med 2008; 358:2545–2559.
- Duckworth W, Abraira C, Moritz T, et al; VADT Investigators. Glucose control and vascular complications in veterans with type 2 diabetes. N Engl J Med 2009; 360:129–139.
- Hemmingsen B, Lund SS, Gluud C, et al. Targeting intensive glycaemic control versus targeting conventional glycaemic control for type 2 diabetes mellitus. Cochrane Database Syst Rev 2013; 11:CD008143.
- Inzucchi SE, Bergenstal RM, Buse JB, et al; American Diabetes Association (ADA); European Association for the Study of Diabetes (EASD). Management of hyperglycemia in type 2 diabetes: a patient-centered approach: position statement of the American Diabetes Association (ADA) and the European Association for the Study of Diabetes (EASD). Diabetes Care 2012; 35:1364–1379.
- Vora J, Bain SC, Damci T, et al. Incretin-based therapy in combination with basal insulin: a promising tactic for the treatment of type 2 diabetes. Diabetes Metab 2013; 39:6–15.
- Nuffer W, Trujillo JM, Ellis SL. Technosphere insulin (Afrezza): a new, inhaled prandial insulin. Ann Pharmacother 2015; 49:99–106.
- Pharmacist’s Letter/Prescriber’s Letter. Comparison of insulins and injectable diabetes meds. PL Detail-Document #281107 November 2012. www.PharmacistsLetter.com. Accessed July 2, 2015
- Lexicomp Online. www.wolterskluwercdi.com/lexicomp-online/. Accessed July 2, 2015.
- Hirsch IB. Insulin analogues. N Engl J Med 2005; 352:174-183.
- Riddle MC, Rosenstock J, Gerich J; Insulin Glargine 4002 Study Investigators. The treat-to-target trial: randomized addition of glargine or human NPH insulin to oral therapy of type 2 diabetic patients. Diabetes Care 2003; 26:3080–3086.
- Hermansen K, Davies M, Derezinski T, Martinez Ravn G, Clauson P, Home P. A 26-week, randomized, parallel, treat-to-target trial comparing insulin detemir with NPH insulin as add-on therapy to oral glucose-lowering drugs in insulin-naive people with type 2 diabetes. Diabetes Care 2006; 29:1269–1274.
- Swinnen SG, Simon AC, Holleman F, Hoekstra JB, Devries JH. Insulin detemir versus insulin glargine for type 2 diabetes mellitus. Cochrane Database Syst Rev 2011; 7:CD006383.
- Pontiroli AE, Miele L, Morabito A. Increase of body weight during the first year of intensive insulin treatment in type 2 diabetes: systematic review and meta-analysis. Diabetes Obes Metab 2011; 13:1008–1019.
- Balkau B, Home PD, Vincent M, Marre M, Freemantle N. Factors associated with weight gain in people with type 2 diabetes starting on insulin. Diabetes Care 2014; 37:2108–2113.
- Garber AJ. Will the next generation of basal insulins offer clinical advantages? Diabetes Obes Metab 2014; 16:483–491.
- Tamaki M, Shimizu T, Kanazawa A, et al. Effects of changes in basal/total daily insulin ratio in type 2 diabetes patients on intensive insulin therapy including insulin glargine (JUN-LAN Study 6). Diabetes Res Clin Pract 2008; 81:e1–e3.
- Freemantle N, Balkau B, Home PD. A propensity score matched comparison of different insulin regimens 1 year after beginning insulin in people with type 2 diabetes. Diabetes Obes Metab 2013; 15:1120–1127.
- Yeh HC, Brown TT, Maruthur N, et al. Comparative effectiveness and safety of methods of insulin delivery and glucose monitoring for diabetes mellitus: a systematic review and meta-analysis. Ann Intern Med 2012; 157:336–347.
- Schade DS, Valentine V. To pump or not to pump. Diabetes Care 2002; 25:2100–2102.
- Liu L, Lee MJ, Brateanu A. Improved A1C and lipid profile in patients referred to diabetes education programs in a wide health care network: a retrospective study. Diabetes Spectr 2014; 27:297–303.
- Funnell MM, Kruger DF, Spencer M. Self-management support for insulin therapy in type 2 diabetes. Diabetes Educ 2004; 30:274–280.
- Norris SL, Engelgau MM, Narayan KM. Effectiveness of self-management training in type 2 diabetes: a systematic review of randomized controlled trials. Diabetes Care 2001; 24:561–587.
Insulin therapy is one of the most effective tools clinicians can use to help patients reach their individualized hemoglobin A1c target. However, decisions about when and how to start insulin therapy have to be individualized to the needs and goals of each patient. Many insulin options are available, one of the most common being the addition of basal insulin to oral antidiabetic drugs. Although patients are often reluctant to start insulin, this reluctance can be overcome through patient education and hands-on training.
Here, we review hemoglobin A1c targets, factors that determine when to start insulin therapy, and the different regimens that can be used.
MOST PATIENTS EVENTUALLY NEED INSULIN
Type 2 diabetes mellitus is a chronic progressive disease associated with insulin resistance, beta-cell dysfunction, and decreased insulin secretion. Consequently, most patients eventually require insulin therapy to reduce the risk of long-term complications.
The efficacy of therapy can be assessed by measuring hemoglobin A1c, an important marker of the chronic hyperglycemic state. The hemoglobin A1c value can be reported as a ratio (%) standardized against the results of the Diabetes Control and Complications Trial,1 or as International Federation of Clinical Chemistry units (mmol/mol).2 Table 1 shows the relationship between hemoglobin A1c and average glucose values.3
WHAT IS AN APPROPRIATE HEMOGLOBIN A1c TARGET?
The short answer is, “It depends.”
Currently, the American Association of Clinical Endocrinologists (AACE) supports a hemoglobin A1c goal of less than 6.5% for otherwise healthy patients but states that the goal should be individualized for patients with concurrent illnesses or at risk of hypoglycemia.4
On the other hand, the American Diabetes Association (ADA) recommends a higher hemoglobin A1c target of less than 7% for most adults with type 2 diabetes mellitus.5 This value was shown to be associated with a reduction in the microvascular and macrovascular complications of diabetes.
Yet when three large trials6–8 recently compared intensive and standard glucose control regimens, tighter glucose control failed to improve cardiovascular outcomes. Moreover, in one of the trials,7 patients receiving intensive treatment had a higher rate of all-cause mortality. Details:
- Action in Diabetes and Vascular Disease (ADVANCE): 11,140 patients; average hemoglobin A1c levels 6.5% vs 7.3%6
- Action to Control Cardiovascular Risk in Diabetes (ACCORD): 10,251 patients; average hemoglobin A1c levels 6.4% vs 7.5%7
- Veterans Affairs Diabetes Trial (VADT): 1,791 patients; average hemoglobin A1c levels 6.9% vs 8.4%.8
Similarly, a 2013 Cochrane review9 that included 28 randomized controlled trials concluded that intensive control (in 18,717 patients) did not decrease all-cause and cardiovascular mortality rates compared with traditional glucose control (in 16,195 patients), and it increased the risk of hypoglycemia and serious adverse events.
As a result, the ADA5 states that a hemoglobin A1c target less than 6.5% is optional for patients with a long life expectancy, short duration of diabetes, low risk of hypoglycemia, and no significant cardiovascular disease. The ADA further defines a hemoglobin A1c goal of less than 8% for patients with a history of severe hypoglycemia, limited life expectancy, advanced microvascular or macrovascular complications, extensive comorbid conditions, and long-standing diabetes.
Therefore, the AACE and ADA are moving away from “one-size-fits-all” goals and toward individualizing their recommendations.
WHEN SHOULD INSULIN BE STARTED?
Physicians should consider the needs and preferences of each patient and individualize the treatment. The most recent recommendations from the ADA5 stress the importance of a patient-centered approach, with multiple factors taken into account. These include the patient’s attitude, expected compliance with treatment, risk of hypoglycemia, disease duration, life expectancy, and comorbidities, and the side effects of oral medications and insulin.
Compared with previous guidelines, there are fewer rules on how and when to start insulin therapy. But absolute and relative indications for insulin therapy should be considered in patients with the following:
Absolute indications for insulin
- Ketoacidosis or catabolic symptoms, including ketonuria
- Newly diagnosed type 2 diabetes with pronounced hyperglycemia (glucose ≥ 300 mg/dL or hemoglobin A1c ≥ 10.0%) with or without severe symptoms, including weight loss, polyuria, or polydipsia10
- Uncontrolled type 2 diabetes mellitus despite using one, two, or more oral antidiabetic drugs or glucagon-like peptide 1 (GLP-1) receptor agonists
- Gestational diabetes
- Preference for insulin.
Relative indications for insulin
- Hospitalized for surgery or acute illnesses
- Advanced renal or hepatic disease
- Inability to afford the cost or tolerate the side effects of oral antidiabetic drugs and GLP-1 receptor agonists.
Depending on the situation, blood glucose is measured fasting, before meals, or after meals after initiating or adjusting insulin regimens (Table 2).
WHAT ARE THE INSULIN REGIMENS?
Basal insulin
In the early stages of type 2 diabetes, metformin alone or in combination with another oral antidiabetic drug or with a GLP-1 receptor agonist is often used along with healthy eating, weight control, and increased physical activity.
When the target hemoglobin A1c cannot be achieved with one or two noninsulin drugs, the ADA suggests basal insulin be added to metformin or a two-medication regimen that includes metformin (Table 3). However, recent evidence suggests that combining a GLP-1 receptor agonist with basal insulin, in a regimen without metformin, is safe and improves glycemic control without hypoglycemia or weight gain.11
While a total daily dose of insulin of 0.1 to 0.2 units/kg could be initially used in patients with a hemoglobin A1c level less than 8%, a higher dose of 0.2 to 0.3 units/kg is required if the hemoglobin A1c level is between 8% and 10%. The dose can be titrated once or twice weekly if the fasting glucose is above the target level (usually < 130 mg/dL). If hypoglycemia develops (glucose < 70 mg/dL), the insulin dose should be reduced by 10% to 20%.10
Available basal insulins include glargine, detemir, and neutral protamine Hagedorn (NPH) (Table 4).12–14 Because glargine and detemir offer better pharmacokinetic properties, less variability in response, and less risk of hypoglycemia, they are preferred over NPH. Glargine has a relatively constant plasma concentration over 24 hours, allowing once-daily dosing at any time during the day (Figure 1).15 The dose should be taken at the same time every day. Detemir and NPH are usually taken once or twice daily.
Patients treated once daily should take the dose with the evening meal or at bedtime. Patients who require a twice-daily regimen can take the first dose with breakfast and the second one with the evening meal, at bedtime, or 12 hours after the morning dose.
The randomized Treat-to-Target trial,16 in 756 patients, showed that both glargine and NPH, when added to oral therapy in patients with type 2 diabetes, achieve the target hemoglobin A1c, but NPH is associated with more episodes of nocturnal hypoglycemia. Similar results were found when NPH was compared with detemir insulin.17
A Cochrane review18 suggested that glargine and detemir are similar in efficacy and safety. However, detemir often needs to be injected twice daily, in a higher dose, and is associated with less weight gain. Furthermore, a meta-analysis of 46 randomized clinical trials19 showed that the weight increase at 1 year is less in patients treated with basal than with twice-daily or prandial regimens.
A noninterventional longitudinal study20 in 2,179 patients newly started on insulin showed that the mean weight increase at 1 year was 1.78 kg, and 24% of patients gained more than 5 kg. However, the factors independently associated with the weight gain were a higher hemoglobin A1c at baseline, a higher insulin dose at baseline and at 1 year, and a lower baseline body mass index, but not the type of insulin regimen.
Currently, a new class of ultralong-acting basal insulins is being studied. Insulins in this class are approved in other countries, but the US Food and Drug Administration requires additional data for approval. Ultralong-acting insulins are expected to reduce the risk of hypoglycemia, specifically the risk of nocturnal episodes. Also, given their longer duration of action and stable steady-state pharmacokinetics, they will offer flexibility in the dose timing.21
Basal-bolus regimens
Basal insulin often does not control postprandial hyperglycemia. The need for multiple doses of insulin (including one or more preprandial doses) is suggested by postprandial glucose values above target (usually > 180 mg/dL) or by a hemoglobin A1c above goal despite well-controlled fasting glucose levels. This usually becomes evident when the total daily dose of basal insulin exceeds 0.5 units/kg. Patients newly diagnosed with diabetes who have a hemoglobin A1c higher than 10% may also respond better to an initial basal-bolus regimen.
Available bolus insulins include lispro, aspart, glulisine, regular insulin, and the newly approved Technosphere inhaled regular insulin (Table 4).12–14 They can be taken before each meal, and the total bolus dose usually represents 50% of the total daily dose.22 Rapid-acting insulins have faster onset, shorter duration of action, and more predictable pharmacokinetics, which makes them preferable to regular insulin (Figure 1).15 Inhaled insulin is another option, but it is contraindicated in patients with chronic obstructive pulmonary disease or asthma because of the increased risk of acute bronchospasm.12
Alternatively, the transition to a basal-bolus regimen can be accomplished with a single dose of bolus insulin before the main meal, using a dose that represents approximately 10% of the total daily dose. Additional bolus doses can be added later based on the glycemic control. The adjustment of the preprandial insulin dose is done once or twice weekly, based on the postprandial glucose levels.10
Premixed combinations of long- and short-acting insulins in ratios of 50% to 50%, 70% to 30%, or 75% to 25% can be considered in patients who cannot adhere to a complex insulin regimen. A propensity-matched comparison of different insulin regimens (basal, premixed, mealtime plus basal, and mealtime) in patients with type 2 diabetes revealed that the hemoglobin A1c reduction was similar between the different groups.23 However, the number of hypoglycemic episodes was higher in the premixed insulin group, and the weight gain was less in the basal insulin group.
While premixed insulins require fewer injections, they do not provide dosing flexibility. In other words, dose adjustments for premixed insulins lead to increases in both basal and bolus amounts even though a dose adjustment is needed for only one insulin type. Thus, this is a common reason for increased hypoglycemic episodes.
Continuous subcutaneous insulin infusion
A meta-analysis showed that continuous subcutaneous insulin infusion (ie, use of an insulin pump) was similar to intensive therapy with multiple daily insulin injections in terms of glycemic control and hypoglycemia.24 Since both options can lead to similar glucose control, additional factors to consider when initiating insulin infusion include lifestyle and technical expertise. Some patients may or may not prefer having a pump attached for nearly all daily activities. Additionally, this type of therapy is complex and requires significant training to ensure efficacy and safety.25
WHAT IS THE COST OF INSULIN THERAPY?
A final factor to keep in mind when initiating insulin is cost (Table 4).12–14 Asking patients to check their prescription insurance formulary is important to ensure that an affordable option is selected. If patients do not have prescription insurance, medication assistance programs could be an option. However, if a patient is considering an insulin pump, insurance coverage is essential. Depending on the manufacturer, insulin pumps cost about $6,000 to $7,000, and the additional monthly supplies for the pump are also expensive.
If patients are engaged when considering and selecting insulin therapy, the likelihood of treatment success is greater.26–28
- The Diabetes Control and Complications Trial Research Group. The effect of intensive treatment of diabetes on the development and progression of long-term complications in insulin-dependent diabetes mellitus. N Engl J Med 1993; 329:977–986.
- Hanas R, John WG; International HbA1c Consensus Committee. 2013 Update on the worldwide standardization of the hemoglobin A1c measurement. Pediatr Diabetes 2014; 15:e1–e2.
- Nathan DM, Kuenen J, Borg R, Zheng H, Schoenfeld D, Heine RJ; A1c-Derived Average Glucose Study Group. Translating the A1C assay into estimated average glucose values. Diabetes Care 2008; 31:1473–1478.
- Garber AJ, Abrahamson MJ, Barzilay JI, et al; American Association of Clinical Endocrinologists. AACE comprehensive diabetes management algorithm 2013. Endocr Pract 2013; 19:327–336.
- American Diabetes Association. Standards of medical care in diabetes—2014. Diabetes Care 2014; 37(suppl 1):S14–S80.
- ADVANCE Collaborative Group; Patel A, MacMahon S, Chalmers J, et al. Intensive blood glucose control and vascular outcomes in patients with type 2 diabetes. N Engl J Med 2008; 358:2560–2572.
- Action to Control Cardiovascular Risk in Diabetes Study Group; Gerstein HC, Miller ME, Byington RP, et al. Effects of intensive glucose lowering in type 2 diabetes. N Engl J Med 2008; 358:2545–2559.
- Duckworth W, Abraira C, Moritz T, et al; VADT Investigators. Glucose control and vascular complications in veterans with type 2 diabetes. N Engl J Med 2009; 360:129–139.
- Hemmingsen B, Lund SS, Gluud C, et al. Targeting intensive glycaemic control versus targeting conventional glycaemic control for type 2 diabetes mellitus. Cochrane Database Syst Rev 2013; 11:CD008143.
- Inzucchi SE, Bergenstal RM, Buse JB, et al; American Diabetes Association (ADA); European Association for the Study of Diabetes (EASD). Management of hyperglycemia in type 2 diabetes: a patient-centered approach: position statement of the American Diabetes Association (ADA) and the European Association for the Study of Diabetes (EASD). Diabetes Care 2012; 35:1364–1379.
- Vora J, Bain SC, Damci T, et al. Incretin-based therapy in combination with basal insulin: a promising tactic for the treatment of type 2 diabetes. Diabetes Metab 2013; 39:6–15.
- Nuffer W, Trujillo JM, Ellis SL. Technosphere insulin (Afrezza): a new, inhaled prandial insulin. Ann Pharmacother 2015; 49:99–106.
- Pharmacist’s Letter/Prescriber’s Letter. Comparison of insulins and injectable diabetes meds. PL Detail-Document #281107 November 2012. www.PharmacistsLetter.com. Accessed July 2, 2015
- Lexicomp Online. www.wolterskluwercdi.com/lexicomp-online/. Accessed July 2, 2015.
- Hirsch IB. Insulin analogues. N Engl J Med 2005; 352:174-183.
- Riddle MC, Rosenstock J, Gerich J; Insulin Glargine 4002 Study Investigators. The treat-to-target trial: randomized addition of glargine or human NPH insulin to oral therapy of type 2 diabetic patients. Diabetes Care 2003; 26:3080–3086.
- Hermansen K, Davies M, Derezinski T, Martinez Ravn G, Clauson P, Home P. A 26-week, randomized, parallel, treat-to-target trial comparing insulin detemir with NPH insulin as add-on therapy to oral glucose-lowering drugs in insulin-naive people with type 2 diabetes. Diabetes Care 2006; 29:1269–1274.
- Swinnen SG, Simon AC, Holleman F, Hoekstra JB, Devries JH. Insulin detemir versus insulin glargine for type 2 diabetes mellitus. Cochrane Database Syst Rev 2011; 7:CD006383.
- Pontiroli AE, Miele L, Morabito A. Increase of body weight during the first year of intensive insulin treatment in type 2 diabetes: systematic review and meta-analysis. Diabetes Obes Metab 2011; 13:1008–1019.
- Balkau B, Home PD, Vincent M, Marre M, Freemantle N. Factors associated with weight gain in people with type 2 diabetes starting on insulin. Diabetes Care 2014; 37:2108–2113.
- Garber AJ. Will the next generation of basal insulins offer clinical advantages? Diabetes Obes Metab 2014; 16:483–491.
- Tamaki M, Shimizu T, Kanazawa A, et al. Effects of changes in basal/total daily insulin ratio in type 2 diabetes patients on intensive insulin therapy including insulin glargine (JUN-LAN Study 6). Diabetes Res Clin Pract 2008; 81:e1–e3.
- Freemantle N, Balkau B, Home PD. A propensity score matched comparison of different insulin regimens 1 year after beginning insulin in people with type 2 diabetes. Diabetes Obes Metab 2013; 15:1120–1127.
- Yeh HC, Brown TT, Maruthur N, et al. Comparative effectiveness and safety of methods of insulin delivery and glucose monitoring for diabetes mellitus: a systematic review and meta-analysis. Ann Intern Med 2012; 157:336–347.
- Schade DS, Valentine V. To pump or not to pump. Diabetes Care 2002; 25:2100–2102.
- Liu L, Lee MJ, Brateanu A. Improved A1C and lipid profile in patients referred to diabetes education programs in a wide health care network: a retrospective study. Diabetes Spectr 2014; 27:297–303.
- Funnell MM, Kruger DF, Spencer M. Self-management support for insulin therapy in type 2 diabetes. Diabetes Educ 2004; 30:274–280.
- Norris SL, Engelgau MM, Narayan KM. Effectiveness of self-management training in type 2 diabetes: a systematic review of randomized controlled trials. Diabetes Care 2001; 24:561–587.
KEY POINTS
- In deciding a patient’s hemoglobin A1c goal and whether it is time to start insulin therapy, one should take into account the patient’s age, life expectancy, concurrent illnesses, risk of hypoglycemia, and other factors.
- When the target hemoglobin A1c is not achieved with metformin or a two-drug regimen that includes metformin, the American Diabetes Association recommends adding a daily dose of basal insulin.
- Eventually, preprandial bolus doses may need to be added to the insulin regimen to control postprandial blood glucose levels and hemoglobin A1c.

Diuretics for hypertension: Hydrochlorothiazide or chlorthalidone?
The thiazide diuretic hydrochlorothiazide and the thiazidelike diuretic chlorthalidone are two old drugs that are still useful. Although similar, they differ in important ways still not fully appreciated more than a half century after they were introduced.
Most hypertension guidelines recommend thiazide diuretics as one of the classes of agents that can be used either as initial antihypertensive drug therapy or as part of combination therapy.1–3
In the United States, hydrochlorothiazide is used more often than chlorthalidone, but many clinical trials of antihypertensive therapy have used chlorthalidone.4,5 In recent years, particularly after the publication of the Antihypertensive and Lipid-Lowering Treatment to Prevent Heart Attack Trial (ALLHAT), interest in chlorthalidone has been increasing, and new data are now available comparing these two diuretics.6 While current US guidelines do not recommend one over the other, British guidelines prefer chlorthalidone.7
This review summarizes the data comparing the two drugs’ pharmacology, antihypertensive effect, and impact on clinical outcomes to help guide clinicians in choosing antihypertensive drug therapy.
PHARMACOLOGY AND MECHANISM OF ACTION
Many of the differences in effectiveness and adverse effects of hydrochlorothiazide and chlorthalidone are thought to be due to their different pharmacodynamic and pharmacokinetic effects.
Pharmacodynamic effects

Hydrochlorothiazide and chlorthalidone differ significantly in chemical structure (Figure 1), but both contain a sulfonamide group that inhibits carbonic anhydrase activity, which may be associated with lower vascular contractility. Both drugs are concentrated in the kidney and secreted into the tubular lumen8; therefore, their therapeutic diuretic effects are often achieved with relatively low plasma concentrations.
Both drugs inhibit the sodium-chloride cotransporter in the luminal membrane of the distal convoluted tubule of the ascending loop of Henle, leading to a modest natriuresis and diuresis. The exact mechanism by which they lower blood pressure is not known: while the initial response is from diuresis and volume changes, long-term reduction in blood pressure is through uncertain mechanisms. In addition, chlorthalidone may have beneficial effects on endothelial function and oxidative stress.9,10
Both drugs also increase secretion of potassium and hydrogen ions and promote increased reabsorption of calcium through increased expression of a sodium-calcium exchange channel.8 Chlorthalidone may cause more inhibition of carbonic anhydrase than hydrochlorothiazide, which can lead to lower intracellular pH and cell volume. This effect may in part explain a pleiotropic effect of chlorthalidone, ie, inhibition of platelet function, which in turn may contribute to this drug’s beneficial effect on cardiovascular outcomes.9
Pharmacokinetic differences
Hydrochlorothiazide and chlorthalidone have important differences in their pharmacokinetic properties (Table 1).11
Hydrochlorothiazide has its onset of action in about 2 hours, and it reaches its peak in 4 to 6 hours. Though its duration of action is short—up to 12 hours—its pharmacodynamic response can be much longer than predicted by its kinetics, allowing once-daily dosing.8
Chlorthalidone has a longer duration of action than hydrochlorothiazide. This may be because it has a very high volume of distribution, since it is taken up into red blood cells and is bound to carbonic anhydrase.12 This may result in a “drug reservoir” that keeps drug levels higher for a longer time.13 Its long duration of action makes it a favorable choice for patients who have difficulty adhering to medication instructions. In addition, a missed dose is unlikely to have a “rebound” effect like that seen with some other antihypertensive agents. However, both chlorthalidone and hydrochlorothiazide are effective if taken once daily.
BLOOD PRESSURE-LOWERING
Both hydrochlorothiazide and chlorthalidone are effective antihypertensive agents. Table 2 summarizes findings from studies that evaluated their blood pressure-lowering effect at various doses.14–33 However, relatively few studies have directly compared these two agents’ effects on blood pressure.
Ernst et al,34 in a small study (but probably the best one to address this issue), compared chlorthalidone 12.5 mg/day (force-titrated to 25 mg/day) and hydrochlorothiazide 25 mg/day (force-titrated to 50 mg/day) in untreated hypertensive patients. After 8 weeks, ambulatory blood pressure monitoring indicated a greater reduction from baseline in systolic blood pressure with chlorthalidone 25 mg/day than with hydrochlorothiazide 50 mg/day (24-hour mean –12.4 vs –7.4 mm Hg, P = .05). Interestingly, the change in nighttime blood pressure was greater in the chlorthalidone group (–13.5 mm Hg) than in the hydrochlorothiazide group (–6.4 mm Hg; P = .009). These data suggest that at the doses studied, chlorthalidone is more effective than hydrochlorothiazide in lowering systolic blood pressure.
Bakris et al,35 using a different study design, compared the single-pill combination of azilsartan medoxomil and chlorthalidone vs coadministration of azilsartan medoxomil and hydrochlorothiazide in participants with stage 2 primary hypertension (≥ 160/100 mm Hg). Systolic blood pressure, as measured in the clinic, declined more with the chlorthalidone combination (–35.1 mm Hg) than with the hydrochlorothiazide combination (–29.5 mm Hg, mean difference –5.6 mm Hg, P < .001).
Meta-analyses also support the conclusion that chlorthalidone is more potent than hydrochlorothiazide in lowering blood pressure.35,36 Several studies have shown that chlorthalidone at the same dose is 1.5 to 2 times as potent as hydrochlorothiazide.33,36,37 Therefore, for clinical purposes, it is reasonable to consider chlorthalidone 12.5 mg daily as similar to 25 mg of hydrochlorothiazide daily.
ADVERSE EFFECTS
Electrolyte disturbances are a common adverse effect of thiazide diuretics.
Hypokalemia. All thiazide diuretics cause potassium wasting. The frequency of hypokalemia depends on the dose, frequency of administration, diet, and other pharmacologic agents used.
Two large clinical trials, the Systolic Hypertension in the Elderly Program and ALLHAT, found that chlorthalidone caused hypokalemia requiring therapy in about 6% to 8% of patients.38,39 Chlorthalidone therapy was associated with a lowering of serum potassium levels of 0.2 to 0.5 mmol/L.36 In ALLHAT, chlorthalidone was associated with a reduction in potassium levels of approximately 0.2 mmol/L after 4 years.38
All diuretics require monitoring of electrolytes, especially during the first 2 weeks of therapy. Once a steady state is reached, patients are not usually at risk of hypokalemia unless the dose is increased, extrarenal losses of potassium increase, or dietary potassium is reduced.
Other electrolyte changes. Thiazide and thiazide-like diuretics can cause other metabolic and endocrine abnormalities such as hypochloremic alkalosis, hyponatremia, and hypercalcemia.40,41 They can also cause photosensitivity and can precipitate gout.42
Observational studies have suggested that metabolic adverse effects such as hypokalemia and hyperuricemia are more common with chlorthalidone than with hydrochlorothiazide.43 It is prudent to monitor laboratory values periodically in patients on diuretic therapy.
DRUG INTERACTIONS
The drug interaction profiles of hydrochlorothiazide and chlorthalidone are also similar. The most common interactions are pharmacodynamic interactions resulting from potassium depletion caused by the diuretics.
Antiarrythymic drugs. Hypokalemia is a risk factor for arrhythmias such as torsades de pointes, and the risk is magnified with concomitant therapy with antiarrhythmic agents that prolong the QT interval independently of serum potassium concentration (eg, sotalol, dronedarone, ibutilide, propafenone). Therefore, combinations of drugs that can cause hypokalemia (eg, diuretics) and antiarrhythmic agents require vigilant monitoring of potassium and appropriate replenishment.44
Dofetilide is a class III antiarrhythmic agent and, like other antiarrhythmic drugs, carries a risk of QT prolongation and torsades de pointes, which is magnified by hypokalemia.45 In addition, dofetilide undergoes active tubular secretion in the kidney via the cation transport system, which is inhibited by hydrochlorothiazide.45 The resulting increase in plasma concentrations of dofetilide may magnify the risk of arrhythmias. Chlorthalidone has not been specifically studied in combination with dofetilide, but thiazide diuretics in general are thought to have a similar effect on tubular secretion and, therefore, should be considered similar to hydrochlorothiazide in this regard.
Digoxin. Similarly, digoxin toxicity may be enhanced in hypokalemia. As with antiarrhythmic agents, serum potassium should be carefully monitored and replenished appropriately when diuretics are used in combination with digoxin.
Lithium is reabsorbed in the proximal tubule along with sodium. Diuretics including hydrochlorothiazide and chlorthalidone that alter sodium reabsorption can also alter lithium absorption.46 When sodium reabsorption is decreased, lithium ion reabsorption is increased and may result in lithium toxicity. Although this combination is not contraindicated, monitoring of serum lithium concentrations and clinical signs and symptoms of lithium toxicity is recommended during initiation and dose adjustments of thiazide diuretics.
Nonsteroidal anti-inflammatory drugs can decrease the natriuretic, diuretic, and antihypertensive effects of both hydrochlorothiazide and chlorthalidone.47
Renin-angiotensin-aldosterone system antagonists, ie, angiotensin-converting enzyme inhibitors, angiotensin II receptor blockers, and the renin inhibitor aliskiren, have potentially beneficial interactions with hydrochlorothiazide and chlorthalidone, producing additive decreases in blood pressure when coadministered with these diuretics. These effects may be particularly potent early in concomitant therapy and allow use of lower doses of diuretics, typically 12.5 mg of hydrochlorothiazide in combination therapy.
LONG-TERM EFFECTS ON CARDIOVASCULAR EVENTS
The long-term goal in treating hypertension is to lower the risk of cardiovascular disease. Therefore, the clinician needs to consider the effect of antihypertensive drug therapy on long-term clinical outcomes.
Antihypertensive drug therapy based on thiazide diuretics has been shown to lower cardiovascular risk when compared with placebo.48 In addition, the effect of chlorthalidone-based antihypertensive therapy was similar to that of other antihypertensive drug classes in preventing most cardiovascular outcomes in ALLHAT.4
However, no study has directly compared hydrochlorothiazide and chlorthalidone with the primary outcome of reduction in long-term cardiovascular events. The data to date come from observational studies and meta-analyses. For example, in a retrospective analysis of the Multiple Risk Factor Intervention Trial, cardiovascular events were significantly fewer in those receiving chlorthalidone vs hydrochlorothiazide (P = .0016).43
In a systematic review and meta-analysis, chlorthalidone was associated with a 23% lower risk of heart failure and a 21% lower risk of all cardiovascular events.49
However, a Canadian observational study of 29,873 patients found no difference in the composite outcome of death or hospitalization for heart failure, stroke, or myocardial infarction between chlorthalidone recipients (3.2 events per 100 person-years) and hydrochlorothiazide recipients (3.4 events per 100 person-years; adjusted hazard ratio 0.93, 95% confidence interval 0.81–1.06).50
In summary, it is unclear whether chlorthalidone or hydrochlorothiazide is superior in preventing cardiovascular events.
SUMMARY
Thiazide and thiazidelike diuretics play an important role in managing hypertension in most patients. The eighth Joint National Committee guidelines do not recommend either hydrochlorothiazide or chlorthalidone over the other. The target dose recommendations are hydrochlorothiazide 25 to 50 mg or chlorthalidone 12.5 to 25 mg daily, with lower doses considered for the elderly.
There are important differences between hydrochlorothiazide and chlorthalidone in pharmacology, potency, and frequency of metabolic side effects. Clinicians should consider these factors to tailor the choice of thiazide diuretic therapy in hypertensive patients.
- James PA, Oparil S, Carter BL, et al. 2014 evidence-based guideline for the management of high blood pressure in adults: report from the panel members appointed to the Eighth Joint National Committee (JNC 8). JAMA 2014; 311:507–520.
- Dasgupta K, Quinn RR, Zarnke KB, et al; Canadian Hypertension Education Program. The 2014 Canadian Hypertension Education Program recommendations for blood pressure measurement, diagnosis, assessment of risk, prevention, and treatment of hypertension. Can J Cardiol 2014; 30:485–501.
- Mancia G, Fagard R, Narkiewicz K, et al. 2013 ESH/ESC guidelines for the management of arterial hypertension: the Task Force for the Management of Arterial Hypertension of the European Society of Hypertension (ESH) and of the European Society of Cardiology (ESC). Eur Heart J 2013; 34:2159–2219.
- ALLHAT Officers and Coordinators for the ALLHAT Collaborative Research Group; The Antihypertensive and Lipid-Lowering Treatment to Prevent Heart Attack Trial. Major outcomes in high-risk hypertensive patients randomized to angiotensin-converting enzyme inhibitor or calcium channel blocker vs diuretic: the Antihypertensive and Lipid-Lowering Treatment to Prevent Heart Attack Trial (ALLHAT). JAMA 2002; 288:2981–2997.
- Prevention of stroke by antihypertensive drug treatment in older persons with isolated systolic hypertension. Final results of the Systolic Hypertension in the Elderly Program (SHEP). SHEP Cooperative Research Group. JAMA 1991; 265:3255–3264.
- Roush GC, Kaur R, Ernst ME. Diuretics: a review and update. J Cardiovasc Pharmacol Ther 2014; 19:5–13.
- McCormack T, Krause T, O’Flynn N. Management of hypertension in adults in primary care: NICE guideline. Br J Gen Pract 2012; 62:163–164.
- Bhattacharaya M, Alper SL. Pharmacology of volume regulation. In: Golan DE, Tashjian AH Jr, Armstrong EJ, Armstrong AW, editors. Principles of Pharmacology: The pathophysiologic Basis of Drug Therapy. 3rd ed. Philadelphia, PA: Wolters Kluwer Health/Lippincott Williams & Wilkins; 2012:332–352.
- Woodman R, Brown C, Lockette W. Chlorthalidone decreases platelet aggregation and vascular permeability and promotes angiogenesis. Hypertension 2010; 56:463–470.
- Sato K, Dohi Y, Kojima M, Takase H, Suzuki S, Ito S. Antioxidative effects of thiazide diuretics in refractory hypertensive patients. A randomized crossover trial of chlortalidone and trichlormethiazide. Arzneimittelforschung 2010; 60:612–616.
- US National Library of Medicine. Dailymed. dailymed.nlm.nih.gov. Accessed May 14, 2015.
- Collste P, Garle M, Rawlins MD, Sjöqvist F. Interindividual differences in chlorthalidone concentration in plasma and red cells of man after single and multiple doses. Eur J Clin Pharmacol 1976; 9:319–325.
- Roush GC, Buddharaju V, Ernst ME, Holford TR. Chlorthalidone: mechanisms of action and effect on cardiovascular events. Curr Hypertens Rep 2013; 15:514–521.
- Pool JL, Cushman WC, Saini RK, Nwachuku CE, Battikha JP. Use of the factorial design and quadratic response surface models to evaluate the fosinopril and hydrochlorothiazide combination therapy in hypertension. Am J Hypertens 1997; 10:117–123.
- Pool JL, Glazer R, Weinberger M, Alvarado R, Huang J, Graff A. Comparison of valsartan/hydrochlorothiazide combination therapy at doses up to 320/25 mg versus monotherapy: a double-blind, placebo-controlled study followed by long-term combination therapy in hypertensive adults. Clin Ther 2007; 29:61–73.
- Horie Y, Higaki J, Takeuchi M. Design, statistical analysis and sample size calculation of dose response study of telmisartan and hydrochlorothiazide. Contemp Clin Trials 2007; 28:647–653.
- Chrysant SG. Antihypertensive effectiveness of low-dose lisinopril-hydrochlorothiazide combination. A large multicenter study. Lisinopril-Hydrochlorothiazide Group. Arch Intern Med 1994; 154:737–743.
- Lacourcière Y, Arnott W. Placebo-controlled comparison of the effects of nebivolol and low-dose hydrochlorothiazide as monotherapies and in combination on blood pressure and lipid profile in hypertensive patients. J Hum Hypertens 1994; 8:283–288.
- Villamil A, Chrysant SG, Calhoun D, et al. Renin inhibition with aliskiren provides additive antihypertensive efficacy when used in combination with hydrochlorothiazide. J Hypertens 2007; 25:217–226.
- McGill JB, Reilly PA. Telmisartan plus hydrochlorothiazide versus telmisartan or hydrochlorothiazide monotherapy in patients with mild to moderate hypertension: a multicenter, randomized, double-blind, placebo-controlled, parallel-group trial. Clin Ther 2001; 23:833–850.
- Weir MR, Weber MA, Punzi HA, Serfer HM, Rosenblatt S, Cady WJ. A dose escalation trial comparing the combination of diltiazem SR and hydrochlorothiazide with the monotherapies in patients with essential hypertension. J Hum Hypertens 1992; 6:133–138.
- Goldberg MR, Rockhold FW, Offen WW, Dornseif BE. Dose-effect and concentration-effect relationships of pinacidil and hydrochlorothiazide in hypertension. Clin Pharmacol Ther 1989; 46:208–218.
- Papademetriou V, Hainer JW, Sugg J, Munzer D; ATTACH Study Group. Factorial antihypertensive study of an extended-release metoprolol and hydrochlorothiazide combination. Am J Hypertens 2006; 19:1217–1225.
- Chrysant SG, Chrysant GS. Antihypertensive efficacy of olmesartan medoxomil alone and in combination with hydrochlorothiazide. Expert Opin Pharmacother 2004; 5:657–667.
- Kochar M, Guthrie R, Triscari J, Kassler-Taub K, Reeves RA. Matrix study of irbesartan with hydrochlorothiazide in mild-to-moderate hypertension. Am J Hypertens 1999; 12:797–805.
- Benz JR, Black HR, Graff A, Reed A, Fitzsimmons S, Shi Y. Valsartan and hydrochlorothiazide in patients with essential hypertension. A multiple dose, double-blind, placebo controlled trial comparing combination therapy with monotherapy. J Hum Hypertens 1998; 12:861–866.
- Jounela AJ, Lilja M, Lumme J, et al. Relation between low dose of hydrochlorothiazide, antihypertensive effect and adverse effects. Blood Press 1994; 3:231–235.
- Scholze J, Breitstadt A, Cairns V, et al. Short report: ramipril and hydrochlorothiazide combination therapy in hypertension: a clinical trial of factorial design. East Germany Collaborative Trial Group. J Hypertens 1993; 11:217–221.
- Canter D, Frank GJ, Knapp LE, Phelps M, Quade M, Texter M. Quinapril and hydrochlorothiazide combination for control of hypertension: assessment by factorial design. Quinapril Investigator Group. J Hum Hypertens 1994; 8:155–162.
- Vardan S, Mehrotra KG, Mookherjee S, Willsey GA, Gens JD, Green DE. Efficacy and reduced metabolic side effects of a 15-mg chlorthalidone formulation in the treatment of mild hypertension. A multicenter study. JAMA 1987; 258:484–488.
- Materson BJ, Oster JR, Michael UF, et al. Dose response to chlorthalidone in patients with mild hypertension. Efficacy of a lower dose. Clin Pharmacol Ther 1978; 24:192–198.
- Morledge JH, Ettinger B, Aranda J, et al. Isolated systolic hypertension in the elderly. A placebo-controlled, dose-response evaluation of chlorthalidone. J Am Geriatr Soc 1986; 34:199–206.
- Peterzan MA, Hardy R, Chaturvedi N, Hughes AD. Meta-analysis of dose-response relationships for hydrochlorothiazide, chlorthalidone, and bendroflumethiazide on blood pressure, serum potassium, and urate. Hypertension 2012; 59:1104–1109.
- Ernst ME, Carter BL, Goerdt CJ, et al. Comparative antihypertensive effects of hydrochlorothiazide and chlorthalidone on ambulatory and office blood pressure. Hypertension 2006; 47:352–358.
- Bakris GL, Sica D, White WB, et al. Antihypertensive efficacy of hydrochlorothiazide vs chlorthalidone combined with azilsartan medoxomil. Am J Med 2012; 25:1229.e1–1229.e10.
- Ernst ME, Carter BL, Zheng S, Grimm RH Jr. Meta-analysis of dose-response characteristics of hydrochlorothiazide and chlorthalidone: effects on systolic blood pressure and potassium. Am J Hypertens 2010; 23:440–446.
- Carter BL, Ernst ME, Cohen JD. Hydrochlorothiazide versus chlorthalidone: evidence supporting their interchangeability. Hypertension 2004; 43:4–9.
- Alderman MH, Piller LB, Ford CE, et al; Antihypertensive and Lipid-Lowering Treatment to Prevent Heart Attack Trial Collaborative Research Group. Clinical significance of incident hypokalemia and hyperkalemia in treated hypertensive patients in the Antihypertensive and Lipid-Lowering Treatment to Prevent Heart Attack Trial. Hypertension 2012; 59:926–933.
- Franse LV, Pahor M, Di Bari M, Somes GW, Cushman WC, Applegate WB. Hypokalemia associated with diuretic use and cardiovascular events in the Systolic Hypertension in the Elderly Program. Hypertension 2000; 35:1025–1030.
- Egom EE, Chirico D, Clark AL. A review of thiazide-induced hyponatraemia. Clin Med 2011; 11:448–451.
- Palmer BF. Metabolic complications associated with use of diuretics. Semin Nephrol 2011; 31:542–552.
- Hueskes BA, Roovers EA, Mantel-Teeuwisse AK, Janssens HJ, van de Lisdonk EH, Janssen M. Use of diuretics and the risk of gouty arthritis: a systematic review. Semin Arthritis Rheum 2012; 41:879–889.
- Dorsch MP, Gillespie BW, Erickson SR, Bleske BE, Weder AB. Chlorthalidone reduces cardiovascular events compared with hydrochlorothiazide: a retrospective cohort analysis. Hypertension 2011; 57:689–694.
- Trinkley KE, Page RL 2nd, Lien H, Yamanouye K, Tisdale JE. QT interval prolongation and the risk of torsades de pointes: essentials for clinicians. Curr Med Res Opin 2013; 29:1719–1726.
- Crist LW, Dixon DL. Considerations for dofetilide use in the elderly. Consult Pharm 2014; 29:270–274.
- Handler J. Lithium and antihypertensive medication: a potentially dangerous interaction. J Clin Hypertens (Greenwich) 2009; 11:738–742.
- Pavlicević I, Kuzmanić M, Rumboldt M, Rumboldt Z. Interaction between antihypertensives and NSAIDs in primary care: a controlled trial. Can J Clin Pharmacol 2008; 15:e372–e382.
- Psaty BM, Smith NL, Siscovick DS, et al. Health outcomes associated with antihypertensive therapies used as first-line agents. A systematic review and meta-analysis. JAMA 1997; 277:739–745.
- Roush GC, Holford TR, Guddati AK. Chlorthalidone compared with hydrochlorothiazide in reducing cardiovascular events: systematic review and network meta-analyses. Hypertension 2012; 59:1110–1117.
- Dhalla IA, Gomes T, Yao Z, et al. Chlorthalidone versus hydrochlorothiazide for the treatment of hypertension in older adults: a population-based cohort study. Ann Intern Med 2013; 158:447–455.
The thiazide diuretic hydrochlorothiazide and the thiazidelike diuretic chlorthalidone are two old drugs that are still useful. Although similar, they differ in important ways still not fully appreciated more than a half century after they were introduced.
Most hypertension guidelines recommend thiazide diuretics as one of the classes of agents that can be used either as initial antihypertensive drug therapy or as part of combination therapy.1–3
In the United States, hydrochlorothiazide is used more often than chlorthalidone, but many clinical trials of antihypertensive therapy have used chlorthalidone.4,5 In recent years, particularly after the publication of the Antihypertensive and Lipid-Lowering Treatment to Prevent Heart Attack Trial (ALLHAT), interest in chlorthalidone has been increasing, and new data are now available comparing these two diuretics.6 While current US guidelines do not recommend one over the other, British guidelines prefer chlorthalidone.7
This review summarizes the data comparing the two drugs’ pharmacology, antihypertensive effect, and impact on clinical outcomes to help guide clinicians in choosing antihypertensive drug therapy.
PHARMACOLOGY AND MECHANISM OF ACTION
Many of the differences in effectiveness and adverse effects of hydrochlorothiazide and chlorthalidone are thought to be due to their different pharmacodynamic and pharmacokinetic effects.
Pharmacodynamic effects
Hydrochlorothiazide and chlorthalidone differ significantly in chemical structure (Figure 1), but both contain a sulfonamide group that inhibits carbonic anhydrase activity, which may be associated with lower vascular contractility. Both drugs are concentrated in the kidney and secreted into the tubular lumen8; therefore, their therapeutic diuretic effects are often achieved with relatively low plasma concentrations.
Both drugs inhibit the sodium-chloride cotransporter in the luminal membrane of the distal convoluted tubule of the ascending loop of Henle, leading to a modest natriuresis and diuresis. The exact mechanism by which they lower blood pressure is not known: while the initial response is from diuresis and volume changes, long-term reduction in blood pressure is through uncertain mechanisms. In addition, chlorthalidone may have beneficial effects on endothelial function and oxidative stress.9,10
Both drugs also increase secretion of potassium and hydrogen ions and promote increased reabsorption of calcium through increased expression of a sodium-calcium exchange channel.8 Chlorthalidone may cause more inhibition of carbonic anhydrase than hydrochlorothiazide, which can lead to lower intracellular pH and cell volume. This effect may in part explain a pleiotropic effect of chlorthalidone, ie, inhibition of platelet function, which in turn may contribute to this drug’s beneficial effect on cardiovascular outcomes.9
Pharmacokinetic differences
Hydrochlorothiazide and chlorthalidone have important differences in their pharmacokinetic properties (Table 1).11
Hydrochlorothiazide has its onset of action in about 2 hours, and it reaches its peak in 4 to 6 hours. Though its duration of action is short—up to 12 hours—its pharmacodynamic response can be much longer than predicted by its kinetics, allowing once-daily dosing.8
Chlorthalidone has a longer duration of action than hydrochlorothiazide. This may be because it has a very high volume of distribution, since it is taken up into red blood cells and is bound to carbonic anhydrase.12 This may result in a “drug reservoir” that keeps drug levels higher for a longer time.13 Its long duration of action makes it a favorable choice for patients who have difficulty adhering to medication instructions. In addition, a missed dose is unlikely to have a “rebound” effect like that seen with some other antihypertensive agents. However, both chlorthalidone and hydrochlorothiazide are effective if taken once daily.
BLOOD PRESSURE-LOWERING
Both hydrochlorothiazide and chlorthalidone are effective antihypertensive agents. Table 2 summarizes findings from studies that evaluated their blood pressure-lowering effect at various doses.14–33 However, relatively few studies have directly compared these two agents’ effects on blood pressure.
Ernst et al,34 in a small study (but probably the best one to address this issue), compared chlorthalidone 12.5 mg/day (force-titrated to 25 mg/day) and hydrochlorothiazide 25 mg/day (force-titrated to 50 mg/day) in untreated hypertensive patients. After 8 weeks, ambulatory blood pressure monitoring indicated a greater reduction from baseline in systolic blood pressure with chlorthalidone 25 mg/day than with hydrochlorothiazide 50 mg/day (24-hour mean –12.4 vs –7.4 mm Hg, P = .05). Interestingly, the change in nighttime blood pressure was greater in the chlorthalidone group (–13.5 mm Hg) than in the hydrochlorothiazide group (–6.4 mm Hg; P = .009). These data suggest that at the doses studied, chlorthalidone is more effective than hydrochlorothiazide in lowering systolic blood pressure.
Bakris et al,35 using a different study design, compared the single-pill combination of azilsartan medoxomil and chlorthalidone vs coadministration of azilsartan medoxomil and hydrochlorothiazide in participants with stage 2 primary hypertension (≥ 160/100 mm Hg). Systolic blood pressure, as measured in the clinic, declined more with the chlorthalidone combination (–35.1 mm Hg) than with the hydrochlorothiazide combination (–29.5 mm Hg, mean difference –5.6 mm Hg, P < .001).
Meta-analyses also support the conclusion that chlorthalidone is more potent than hydrochlorothiazide in lowering blood pressure.35,36 Several studies have shown that chlorthalidone at the same dose is 1.5 to 2 times as potent as hydrochlorothiazide.33,36,37 Therefore, for clinical purposes, it is reasonable to consider chlorthalidone 12.5 mg daily as similar to 25 mg of hydrochlorothiazide daily.
ADVERSE EFFECTS
Electrolyte disturbances are a common adverse effect of thiazide diuretics.
Hypokalemia. All thiazide diuretics cause potassium wasting. The frequency of hypokalemia depends on the dose, frequency of administration, diet, and other pharmacologic agents used.
Two large clinical trials, the Systolic Hypertension in the Elderly Program and ALLHAT, found that chlorthalidone caused hypokalemia requiring therapy in about 6% to 8% of patients.38,39 Chlorthalidone therapy was associated with a lowering of serum potassium levels of 0.2 to 0.5 mmol/L.36 In ALLHAT, chlorthalidone was associated with a reduction in potassium levels of approximately 0.2 mmol/L after 4 years.38
All diuretics require monitoring of electrolytes, especially during the first 2 weeks of therapy. Once a steady state is reached, patients are not usually at risk of hypokalemia unless the dose is increased, extrarenal losses of potassium increase, or dietary potassium is reduced.
Other electrolyte changes. Thiazide and thiazide-like diuretics can cause other metabolic and endocrine abnormalities such as hypochloremic alkalosis, hyponatremia, and hypercalcemia.40,41 They can also cause photosensitivity and can precipitate gout.42
Observational studies have suggested that metabolic adverse effects such as hypokalemia and hyperuricemia are more common with chlorthalidone than with hydrochlorothiazide.43 It is prudent to monitor laboratory values periodically in patients on diuretic therapy.
DRUG INTERACTIONS
The drug interaction profiles of hydrochlorothiazide and chlorthalidone are also similar. The most common interactions are pharmacodynamic interactions resulting from potassium depletion caused by the diuretics.
Antiarrythymic drugs. Hypokalemia is a risk factor for arrhythmias such as torsades de pointes, and the risk is magnified with concomitant therapy with antiarrhythmic agents that prolong the QT interval independently of serum potassium concentration (eg, sotalol, dronedarone, ibutilide, propafenone). Therefore, combinations of drugs that can cause hypokalemia (eg, diuretics) and antiarrhythmic agents require vigilant monitoring of potassium and appropriate replenishment.44
Dofetilide is a class III antiarrhythmic agent and, like other antiarrhythmic drugs, carries a risk of QT prolongation and torsades de pointes, which is magnified by hypokalemia.45 In addition, dofetilide undergoes active tubular secretion in the kidney via the cation transport system, which is inhibited by hydrochlorothiazide.45 The resulting increase in plasma concentrations of dofetilide may magnify the risk of arrhythmias. Chlorthalidone has not been specifically studied in combination with dofetilide, but thiazide diuretics in general are thought to have a similar effect on tubular secretion and, therefore, should be considered similar to hydrochlorothiazide in this regard.
Digoxin. Similarly, digoxin toxicity may be enhanced in hypokalemia. As with antiarrhythmic agents, serum potassium should be carefully monitored and replenished appropriately when diuretics are used in combination with digoxin.
Lithium is reabsorbed in the proximal tubule along with sodium. Diuretics including hydrochlorothiazide and chlorthalidone that alter sodium reabsorption can also alter lithium absorption.46 When sodium reabsorption is decreased, lithium ion reabsorption is increased and may result in lithium toxicity. Although this combination is not contraindicated, monitoring of serum lithium concentrations and clinical signs and symptoms of lithium toxicity is recommended during initiation and dose adjustments of thiazide diuretics.
Nonsteroidal anti-inflammatory drugs can decrease the natriuretic, diuretic, and antihypertensive effects of both hydrochlorothiazide and chlorthalidone.47
Renin-angiotensin-aldosterone system antagonists, ie, angiotensin-converting enzyme inhibitors, angiotensin II receptor blockers, and the renin inhibitor aliskiren, have potentially beneficial interactions with hydrochlorothiazide and chlorthalidone, producing additive decreases in blood pressure when coadministered with these diuretics. These effects may be particularly potent early in concomitant therapy and allow use of lower doses of diuretics, typically 12.5 mg of hydrochlorothiazide in combination therapy.
LONG-TERM EFFECTS ON CARDIOVASCULAR EVENTS
The long-term goal in treating hypertension is to lower the risk of cardiovascular disease. Therefore, the clinician needs to consider the effect of antihypertensive drug therapy on long-term clinical outcomes.
Antihypertensive drug therapy based on thiazide diuretics has been shown to lower cardiovascular risk when compared with placebo.48 In addition, the effect of chlorthalidone-based antihypertensive therapy was similar to that of other antihypertensive drug classes in preventing most cardiovascular outcomes in ALLHAT.4
However, no study has directly compared hydrochlorothiazide and chlorthalidone with the primary outcome of reduction in long-term cardiovascular events. The data to date come from observational studies and meta-analyses. For example, in a retrospective analysis of the Multiple Risk Factor Intervention Trial, cardiovascular events were significantly fewer in those receiving chlorthalidone vs hydrochlorothiazide (P = .0016).43
In a systematic review and meta-analysis, chlorthalidone was associated with a 23% lower risk of heart failure and a 21% lower risk of all cardiovascular events.49
However, a Canadian observational study of 29,873 patients found no difference in the composite outcome of death or hospitalization for heart failure, stroke, or myocardial infarction between chlorthalidone recipients (3.2 events per 100 person-years) and hydrochlorothiazide recipients (3.4 events per 100 person-years; adjusted hazard ratio 0.93, 95% confidence interval 0.81–1.06).50
In summary, it is unclear whether chlorthalidone or hydrochlorothiazide is superior in preventing cardiovascular events.
SUMMARY
Thiazide and thiazidelike diuretics play an important role in managing hypertension in most patients. The eighth Joint National Committee guidelines do not recommend either hydrochlorothiazide or chlorthalidone over the other. The target dose recommendations are hydrochlorothiazide 25 to 50 mg or chlorthalidone 12.5 to 25 mg daily, with lower doses considered for the elderly.
There are important differences between hydrochlorothiazide and chlorthalidone in pharmacology, potency, and frequency of metabolic side effects. Clinicians should consider these factors to tailor the choice of thiazide diuretic therapy in hypertensive patients.
- James PA, Oparil S, Carter BL, et al. 2014 evidence-based guideline for the management of high blood pressure in adults: report from the panel members appointed to the Eighth Joint National Committee (JNC 8). JAMA 2014; 311:507–520.
- Dasgupta K, Quinn RR, Zarnke KB, et al; Canadian Hypertension Education Program. The 2014 Canadian Hypertension Education Program recommendations for blood pressure measurement, diagnosis, assessment of risk, prevention, and treatment of hypertension. Can J Cardiol 2014; 30:485–501.
- Mancia G, Fagard R, Narkiewicz K, et al. 2013 ESH/ESC guidelines for the management of arterial hypertension: the Task Force for the Management of Arterial Hypertension of the European Society of Hypertension (ESH) and of the European Society of Cardiology (ESC). Eur Heart J 2013; 34:2159–2219.
- ALLHAT Officers and Coordinators for the ALLHAT Collaborative Research Group; The Antihypertensive and Lipid-Lowering Treatment to Prevent Heart Attack Trial. Major outcomes in high-risk hypertensive patients randomized to angiotensin-converting enzyme inhibitor or calcium channel blocker vs diuretic: the Antihypertensive and Lipid-Lowering Treatment to Prevent Heart Attack Trial (ALLHAT). JAMA 2002; 288:2981–2997.
- Prevention of stroke by antihypertensive drug treatment in older persons with isolated systolic hypertension. Final results of the Systolic Hypertension in the Elderly Program (SHEP). SHEP Cooperative Research Group. JAMA 1991; 265:3255–3264.
- Roush GC, Kaur R, Ernst ME. Diuretics: a review and update. J Cardiovasc Pharmacol Ther 2014; 19:5–13.
- McCormack T, Krause T, O’Flynn N. Management of hypertension in adults in primary care: NICE guideline. Br J Gen Pract 2012; 62:163–164.
- Bhattacharaya M, Alper SL. Pharmacology of volume regulation. In: Golan DE, Tashjian AH Jr, Armstrong EJ, Armstrong AW, editors. Principles of Pharmacology: The pathophysiologic Basis of Drug Therapy. 3rd ed. Philadelphia, PA: Wolters Kluwer Health/Lippincott Williams & Wilkins; 2012:332–352.
- Woodman R, Brown C, Lockette W. Chlorthalidone decreases platelet aggregation and vascular permeability and promotes angiogenesis. Hypertension 2010; 56:463–470.
- Sato K, Dohi Y, Kojima M, Takase H, Suzuki S, Ito S. Antioxidative effects of thiazide diuretics in refractory hypertensive patients. A randomized crossover trial of chlortalidone and trichlormethiazide. Arzneimittelforschung 2010; 60:612–616.
- US National Library of Medicine. Dailymed. dailymed.nlm.nih.gov. Accessed May 14, 2015.
- Collste P, Garle M, Rawlins MD, Sjöqvist F. Interindividual differences in chlorthalidone concentration in plasma and red cells of man after single and multiple doses. Eur J Clin Pharmacol 1976; 9:319–325.
- Roush GC, Buddharaju V, Ernst ME, Holford TR. Chlorthalidone: mechanisms of action and effect on cardiovascular events. Curr Hypertens Rep 2013; 15:514–521.
- Pool JL, Cushman WC, Saini RK, Nwachuku CE, Battikha JP. Use of the factorial design and quadratic response surface models to evaluate the fosinopril and hydrochlorothiazide combination therapy in hypertension. Am J Hypertens 1997; 10:117–123.
- Pool JL, Glazer R, Weinberger M, Alvarado R, Huang J, Graff A. Comparison of valsartan/hydrochlorothiazide combination therapy at doses up to 320/25 mg versus monotherapy: a double-blind, placebo-controlled study followed by long-term combination therapy in hypertensive adults. Clin Ther 2007; 29:61–73.
- Horie Y, Higaki J, Takeuchi M. Design, statistical analysis and sample size calculation of dose response study of telmisartan and hydrochlorothiazide. Contemp Clin Trials 2007; 28:647–653.
- Chrysant SG. Antihypertensive effectiveness of low-dose lisinopril-hydrochlorothiazide combination. A large multicenter study. Lisinopril-Hydrochlorothiazide Group. Arch Intern Med 1994; 154:737–743.
- Lacourcière Y, Arnott W. Placebo-controlled comparison of the effects of nebivolol and low-dose hydrochlorothiazide as monotherapies and in combination on blood pressure and lipid profile in hypertensive patients. J Hum Hypertens 1994; 8:283–288.
- Villamil A, Chrysant SG, Calhoun D, et al. Renin inhibition with aliskiren provides additive antihypertensive efficacy when used in combination with hydrochlorothiazide. J Hypertens 2007; 25:217–226.
- McGill JB, Reilly PA. Telmisartan plus hydrochlorothiazide versus telmisartan or hydrochlorothiazide monotherapy in patients with mild to moderate hypertension: a multicenter, randomized, double-blind, placebo-controlled, parallel-group trial. Clin Ther 2001; 23:833–850.
- Weir MR, Weber MA, Punzi HA, Serfer HM, Rosenblatt S, Cady WJ. A dose escalation trial comparing the combination of diltiazem SR and hydrochlorothiazide with the monotherapies in patients with essential hypertension. J Hum Hypertens 1992; 6:133–138.
- Goldberg MR, Rockhold FW, Offen WW, Dornseif BE. Dose-effect and concentration-effect relationships of pinacidil and hydrochlorothiazide in hypertension. Clin Pharmacol Ther 1989; 46:208–218.
- Papademetriou V, Hainer JW, Sugg J, Munzer D; ATTACH Study Group. Factorial antihypertensive study of an extended-release metoprolol and hydrochlorothiazide combination. Am J Hypertens 2006; 19:1217–1225.
- Chrysant SG, Chrysant GS. Antihypertensive efficacy of olmesartan medoxomil alone and in combination with hydrochlorothiazide. Expert Opin Pharmacother 2004; 5:657–667.
- Kochar M, Guthrie R, Triscari J, Kassler-Taub K, Reeves RA. Matrix study of irbesartan with hydrochlorothiazide in mild-to-moderate hypertension. Am J Hypertens 1999; 12:797–805.
- Benz JR, Black HR, Graff A, Reed A, Fitzsimmons S, Shi Y. Valsartan and hydrochlorothiazide in patients with essential hypertension. A multiple dose, double-blind, placebo controlled trial comparing combination therapy with monotherapy. J Hum Hypertens 1998; 12:861–866.
- Jounela AJ, Lilja M, Lumme J, et al. Relation between low dose of hydrochlorothiazide, antihypertensive effect and adverse effects. Blood Press 1994; 3:231–235.
- Scholze J, Breitstadt A, Cairns V, et al. Short report: ramipril and hydrochlorothiazide combination therapy in hypertension: a clinical trial of factorial design. East Germany Collaborative Trial Group. J Hypertens 1993; 11:217–221.
- Canter D, Frank GJ, Knapp LE, Phelps M, Quade M, Texter M. Quinapril and hydrochlorothiazide combination for control of hypertension: assessment by factorial design. Quinapril Investigator Group. J Hum Hypertens 1994; 8:155–162.
- Vardan S, Mehrotra KG, Mookherjee S, Willsey GA, Gens JD, Green DE. Efficacy and reduced metabolic side effects of a 15-mg chlorthalidone formulation in the treatment of mild hypertension. A multicenter study. JAMA 1987; 258:484–488.
- Materson BJ, Oster JR, Michael UF, et al. Dose response to chlorthalidone in patients with mild hypertension. Efficacy of a lower dose. Clin Pharmacol Ther 1978; 24:192–198.
- Morledge JH, Ettinger B, Aranda J, et al. Isolated systolic hypertension in the elderly. A placebo-controlled, dose-response evaluation of chlorthalidone. J Am Geriatr Soc 1986; 34:199–206.
- Peterzan MA, Hardy R, Chaturvedi N, Hughes AD. Meta-analysis of dose-response relationships for hydrochlorothiazide, chlorthalidone, and bendroflumethiazide on blood pressure, serum potassium, and urate. Hypertension 2012; 59:1104–1109.
- Ernst ME, Carter BL, Goerdt CJ, et al. Comparative antihypertensive effects of hydrochlorothiazide and chlorthalidone on ambulatory and office blood pressure. Hypertension 2006; 47:352–358.
- Bakris GL, Sica D, White WB, et al. Antihypertensive efficacy of hydrochlorothiazide vs chlorthalidone combined with azilsartan medoxomil. Am J Med 2012; 25:1229.e1–1229.e10.
- Ernst ME, Carter BL, Zheng S, Grimm RH Jr. Meta-analysis of dose-response characteristics of hydrochlorothiazide and chlorthalidone: effects on systolic blood pressure and potassium. Am J Hypertens 2010; 23:440–446.
- Carter BL, Ernst ME, Cohen JD. Hydrochlorothiazide versus chlorthalidone: evidence supporting their interchangeability. Hypertension 2004; 43:4–9.
- Alderman MH, Piller LB, Ford CE, et al; Antihypertensive and Lipid-Lowering Treatment to Prevent Heart Attack Trial Collaborative Research Group. Clinical significance of incident hypokalemia and hyperkalemia in treated hypertensive patients in the Antihypertensive and Lipid-Lowering Treatment to Prevent Heart Attack Trial. Hypertension 2012; 59:926–933.
- Franse LV, Pahor M, Di Bari M, Somes GW, Cushman WC, Applegate WB. Hypokalemia associated with diuretic use and cardiovascular events in the Systolic Hypertension in the Elderly Program. Hypertension 2000; 35:1025–1030.
- Egom EE, Chirico D, Clark AL. A review of thiazide-induced hyponatraemia. Clin Med 2011; 11:448–451.
- Palmer BF. Metabolic complications associated with use of diuretics. Semin Nephrol 2011; 31:542–552.
- Hueskes BA, Roovers EA, Mantel-Teeuwisse AK, Janssens HJ, van de Lisdonk EH, Janssen M. Use of diuretics and the risk of gouty arthritis: a systematic review. Semin Arthritis Rheum 2012; 41:879–889.
- Dorsch MP, Gillespie BW, Erickson SR, Bleske BE, Weder AB. Chlorthalidone reduces cardiovascular events compared with hydrochlorothiazide: a retrospective cohort analysis. Hypertension 2011; 57:689–694.
- Trinkley KE, Page RL 2nd, Lien H, Yamanouye K, Tisdale JE. QT interval prolongation and the risk of torsades de pointes: essentials for clinicians. Curr Med Res Opin 2013; 29:1719–1726.
- Crist LW, Dixon DL. Considerations for dofetilide use in the elderly. Consult Pharm 2014; 29:270–274.
- Handler J. Lithium and antihypertensive medication: a potentially dangerous interaction. J Clin Hypertens (Greenwich) 2009; 11:738–742.
- Pavlicević I, Kuzmanić M, Rumboldt M, Rumboldt Z. Interaction between antihypertensives and NSAIDs in primary care: a controlled trial. Can J Clin Pharmacol 2008; 15:e372–e382.
- Psaty BM, Smith NL, Siscovick DS, et al. Health outcomes associated with antihypertensive therapies used as first-line agents. A systematic review and meta-analysis. JAMA 1997; 277:739–745.
- Roush GC, Holford TR, Guddati AK. Chlorthalidone compared with hydrochlorothiazide in reducing cardiovascular events: systematic review and network meta-analyses. Hypertension 2012; 59:1110–1117.
- Dhalla IA, Gomes T, Yao Z, et al. Chlorthalidone versus hydrochlorothiazide for the treatment of hypertension in older adults: a population-based cohort study. Ann Intern Med 2013; 158:447–455.
KEY POINTS
- Chlorthalidone has a longer duration of action and a longer half-life than hydrochlorothiazide.
- Chlorthalidone may be more potent than hydrochlorothiazide in lowering blood pressure, but it also may be associated with more metabolic adverse effects, such as hypokalemia.
- No study has conclusively shown either drug to be better in preventing adverse clinical outcomes.
- These differences should be considered when making choices about thiazide diuretic therapy for hypertension.

What the Supreme Court ruling in King v. Burwell means for women’s health

In a widely anticipated judgment on the Affordable Care Act (ACA), the US Supreme Court ruled 6-3 in favor of the law on June 26, 2015. The case at hand, King v. Burwell, challenged whether individuals purchasing health insurance through federal exchanges were eligible for federal premium subsidies. This ruling cemented the ACA into law and avoided a potential calamity in the private health insurance market. Let’s take a closer look.
What the case was about
The ACA allows states to set up their own health insurance exchanges or participate in a federally run exchange. Although the drafters of the ACA had expected each state to set up its own exchange, two-thirds of the states declined to do so, many in opposition to the ACA. As a result, 7 million citizens in 34 states now purchase their health insurance through federally created exchanges.
The plaintiffs in King v. Burwell argued that, because the legislation refers to those enrolled “through an Exchange established by the State,” individuals in states with federally run exchanges are not eligible for subsidies.
The law states:
(A) the monthly premiums for such month for 1 or more qualified health plans offered in the individual market within a State which cover the taxpayer, the taxpayer’s spouse, or any dependent (as defined in section 152) of the taxpayer and which were enrolled in through an Exchange established by the State under 1311 of the Patient Protection and Affordable Care Act…[emphasis added].
The Supreme Court was asked to decide whether to adhere to those exact words or to honor Congress’ intent to allow individuals to purchase subsidized insurance on any type of exchange.
What might have happened
We’ve explored in previous articles the interconnectedness of many sections of the ACA. Nowhere is that interconnectedness more clearly demonstrated than here. In order to ensure that private health insurers provide better coverage, the law requires them to abide by important consumer protections, including the elimination of “preexisting condition” exclusions. In order to prevent adverse selection and keep insurers solvent under these new rules, all individuals are required to have health care coverage—the individual mandate. If everyone is required to purchase health insurance, it has to be affordable, so lower-income individuals were promised subsidies, paid for 100% by the federal government, to help them cover their premiums when insurance is purchased through an exchange. Take away the subsidies and the whole thing starts to unravel.
The Urban Institute estimated that a Supreme Court ruling in favor of King, which would have eliminated the subsidies in states using a federal exchange, would have reduced federal tax subsidies by $29 billion in 2016, making coverage unaffordable for many and increasing the ranks of the uninsured by 8.2 million people.1
Louise Sheiner and Brendan Mochoruk of the Brookings Institute speculated that healthy individuals would disproportionately leave the marketplace, triggering 35% increases in insurance premiums for those remaining, as well as significant increases in premiums for those who just lost their subsidies.2 Many observers, including these experts, forecast that insurance companies would exit the federal exchanges altogether, triggering a health insurance “death spiral”: As premiums rise, the healthiest customers leave the marketplace, causing premiums to rise more, causing more healthy people to leave, and so on.
Clearly, this Supreme Court decision has had dramatic, long-term, real-world effects on millions of Americans. On the national level, 6,387,789 individuals were at risk of losing their tax credits if the Supreme Court had ruled in favor of King. That number represents more than $1.7 billion in total monthly tax credits. For a look at how a judgment in favor of King would have affected subsidies on a state-by-state basis, see TABLE 1.
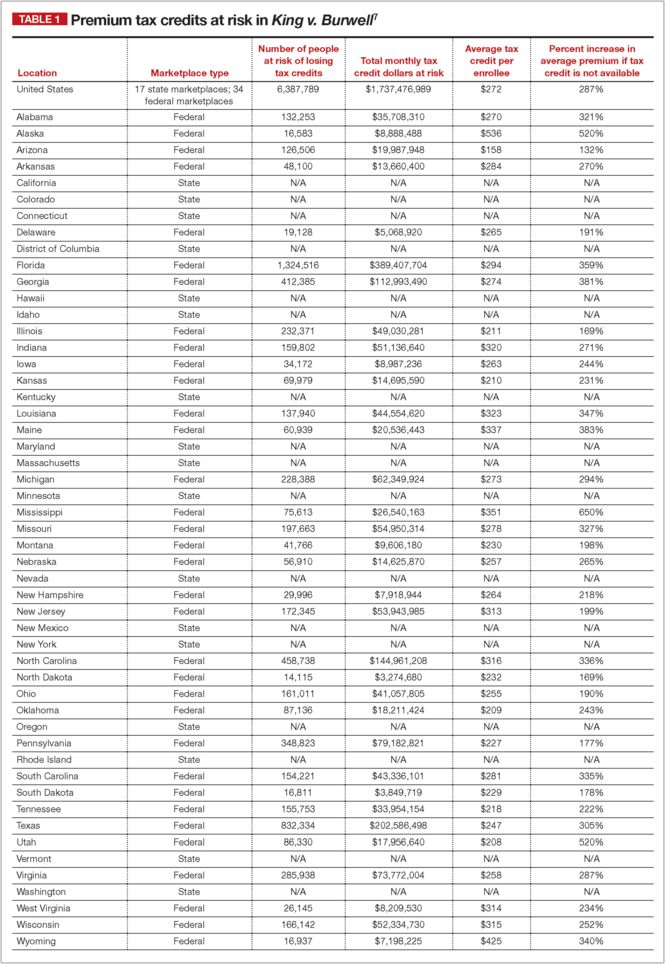
What other commentators are saying about the King v. Burwell decision
In his majority opinion, Chief Justice John Roberts noted that the “meaning of the phrase ‘established by the State’ is not so clear.” And as Amy Howe articulated on SCOTUSblog: “if the phrase…is in fact not clear…then the next step is to look at the Affordable Care Act more broadly to determine what Congress meant by the phrase. And when you do that, the Court reasoned, it becomes apparent that Congress actually intended for the subsidies to be available to everyone who buys health insurance on an exchange, no matter who created it. If the subsidies weren’t available in the states with federal exchanges, the Court explained, the insurance markets in those states simply wouldn’t work properly: without the subsidies, almost all of the people who purchased insurance on the exchanges would no longer be required to purchase insurance because it would be too expensive. This would create a ‘death spiral’….”
—Amy Howe, SCOTUSblog3
“Additional court challenges to other ACA provisions are still possible, but King’s six-member majority shows little appetite for challenges threatening the Act’s core structure. Even Scalia’s dissent recognizes that the ACA may one day ‘attain the enduring status of the Social Security Act.’ Thus, the decision may usher in a new era of policy maturity, in which efforts to undermine the ACA diminish, as focus shifts to efforts to implement and improve it.”
—Mark A. Hall, JD, New England Journal of Medicine4
“With the Court upholding the administration’s interpretation of the law, the Obama administration has little reason to accede to
Republican proposals. The Court’s decision effectively puts the future of the ACA on hold until the 2016 elections, when the people will decide whether to stay the course or to chart a very different path.”
—Timothy Jost, Health Affairs5
“A case that 6 months ago seemed to offer the Court’s conservatives a low-risk opportunity to accomplish what they almost did in 2012—kill the Affordable Care Act—became suffused with danger, for the millions of newly insured Americans, of course, but also for the Supreme Court itself. Ideology came face to face with reality, and reality prevailed.”
—Linda Greenhouse, New York Times6
How premium subsidies work
Premium subsidies are actually tax credits. Individuals and families can qualify for them to purchase any type of health insurance offered on an exchange, except catastrophic coverage. To receive the premium tax credit for coverage starting in 2015, a marketplace enrollee must:
- have a household income that is 1 to4 times the federal poverty level. In 2015, the range of incomes that qualify for subsidies is $11,670 for an individual and $23,850 for a family of 4 at 100% of the federal poverty level. At 400% of the federal poverty level, it is $46,680 for an individual and $95,400 for a family of 4.
- lack access to affordable coverage through an employer (including a family member’s employer)
- be ineligible for coverage through Medicare, Medicaid, the Children’s Health Insurance Program, or other forms of public assistance
- have US citizenship or proof of legal residency
- file taxes jointly if married.
The premium tax credit caps the amount that an individual or family must spend on their monthly payments for health insurance. The cap depends on the family’s income; lower-income families have a lower cap. The amount of the tax credit remains the same, so a person who purchases a more expensive plan pays the cost difference (TABLE 2).
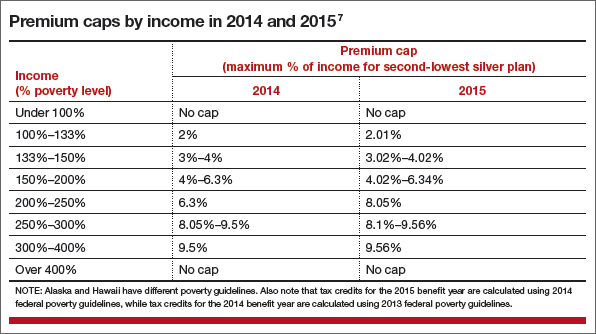
The ruling’s effect on women’s health
On June 26, American College of Obstetricians and Gynecologists President Mark S. DeFrancesco, MD, MBA, hailed the Supreme Court decision, saying, “Importantly, recent data have shown that newly insured adults under the ACA were more likely to be women. Those who did gain coverage through the ACA reported better access to health care and better financial security from medical costs.”
“Without question, many women enrollees were able to purchase health insurance coverage due, in part, to the ACA subsidies that helped make this purchase affordable. In fact, government data have suggested that roughly 85% of health exchange enrollees received subsidies,” Dr. DeFrancesco said.
“If the Supreme Court had overturned this important assistance, approximately 4.8 million women would have been unable to afford the coverage that they need. The impact also would have been widespread; as these women were forced to leave the insurance marketplace, it is likely that premiums throughout the marketplace would have risen dramatically,” he continued.
“Instead, patients—especially the low- and moderate-income American women who have particularly benefited from ACA subsidies—will continue to have the peace of mind that comes with insurance coverage.”
Share your thoughts! Send your Letter to the Editor to rbarbieri@frontlinemedcom.com. Please include your name and the city and state in which you practice.
1. Blumberg LJ, Buettgens M, Holahan J. The implications of a Supreme Court finding for the plaintiff in King v. Burwell: 8.2 million more uninsured and 35% higher premiums. Urban Institute. http://www.urban.org/research/publication/implications-supreme-court-finding-plaintiff-king-vs-burwell-82-million-more-uninsured-and-35-higher-premiums. Published January 8, 2015. Accessed July 2, 2015.
2. Sheiner L, Mochoruk B. King v. Burwell explained. Brookings Institute. http://www.brookings.edu/blogs/health360/posts/2015/03/03-king-v-burwell-explainer-sheiner. Published March 3, 2015. Accessed July 2, 2015.
3. Howe A. Court backs Obama administration on health care subsidies: In plain English. SCOTUSblog. http://www.scotusblog.com/2015/06/court-backs-obama-administration-on-health-care-subsidies-in-plain-english/. Published June 25, 2015. Accessed July 1, 2015.
4. Hall MA. King v. Burwell—ACA Armageddon averted. N Engl J Med. http://www.nejm.org/doi/full/10.1056/NEJMp1504077. Published July 1, 2015. Accessed July 2, 2015.
5. Jost T. Implementing health reform: The Supreme Court upholds tax credits in the federal exchange. Health Affairs blog. http://healthaffairs.org/blog/2015/06/25/implementing-health-reform-the-supreme-court-upholds-tax-credits-in-the-federal-exchange/. Published June 25, 2015. Accessed July 1, 2015.
6. Greenhouse L. The Roberts Court’s reality check. New York Times. http://www.nytimes.com/2015/06/26/opinion/the-roberts-courts-reality-check.html. Published June 25, 2015. Accessed July 1, 2015.
7. Henry J. Kaiser Family Foundation. Explaining health care reform: questions about health insurance subsidies. Table 2. http://kff.org/health-reform/issue-brief/explaining-health-care-reform-questions-about-health/. Published October 27, 2014. Accessed July 2, 2015.

Lucia DiVenere, MA
Ms. DiVenere is Officer, Government and Political Affairs, at the American Congress of Obstetricians and Gynecologists in Washington, DC.
The author reports no financial relationships relevant to this article.
Lucia DiVenere, MA
Ms. DiVenere is Officer, Government and Political Affairs, at the American Congress of Obstetricians and Gynecologists in Washington, DC.
The author reports no financial relationships relevant to this article.
Lucia DiVenere, MA
Ms. DiVenere is Officer, Government and Political Affairs, at the American Congress of Obstetricians and Gynecologists in Washington, DC.
The author reports no financial relationships relevant to this article.
In a widely anticipated judgment on the Affordable Care Act (ACA), the US Supreme Court ruled 6-3 in favor of the law on June 26, 2015. The case at hand, King v. Burwell, challenged whether individuals purchasing health insurance through federal exchanges were eligible for federal premium subsidies. This ruling cemented the ACA into law and avoided a potential calamity in the private health insurance market. Let’s take a closer look.
What the case was about
The ACA allows states to set up their own health insurance exchanges or participate in a federally run exchange. Although the drafters of the ACA had expected each state to set up its own exchange, two-thirds of the states declined to do so, many in opposition to the ACA. As a result, 7 million citizens in 34 states now purchase their health insurance through federally created exchanges.
The plaintiffs in King v. Burwell argued that, because the legislation refers to those enrolled “through an Exchange established by the State,” individuals in states with federally run exchanges are not eligible for subsidies.
The law states:
(A) the monthly premiums for such month for 1 or more qualified health plans offered in the individual market within a State which cover the taxpayer, the taxpayer’s spouse, or any dependent (as defined in section 152) of the taxpayer and which were enrolled in through an Exchange established by the State under 1311 of the Patient Protection and Affordable Care Act…[emphasis added].
The Supreme Court was asked to decide whether to adhere to those exact words or to honor Congress’ intent to allow individuals to purchase subsidized insurance on any type of exchange.
What might have happened
We’ve explored in previous articles the interconnectedness of many sections of the ACA. Nowhere is that interconnectedness more clearly demonstrated than here. In order to ensure that private health insurers provide better coverage, the law requires them to abide by important consumer protections, including the elimination of “preexisting condition” exclusions. In order to prevent adverse selection and keep insurers solvent under these new rules, all individuals are required to have health care coverage—the individual mandate. If everyone is required to purchase health insurance, it has to be affordable, so lower-income individuals were promised subsidies, paid for 100% by the federal government, to help them cover their premiums when insurance is purchased through an exchange. Take away the subsidies and the whole thing starts to unravel.
The Urban Institute estimated that a Supreme Court ruling in favor of King, which would have eliminated the subsidies in states using a federal exchange, would have reduced federal tax subsidies by $29 billion in 2016, making coverage unaffordable for many and increasing the ranks of the uninsured by 8.2 million people.1
Louise Sheiner and Brendan Mochoruk of the Brookings Institute speculated that healthy individuals would disproportionately leave the marketplace, triggering 35% increases in insurance premiums for those remaining, as well as significant increases in premiums for those who just lost their subsidies.2 Many observers, including these experts, forecast that insurance companies would exit the federal exchanges altogether, triggering a health insurance “death spiral”: As premiums rise, the healthiest customers leave the marketplace, causing premiums to rise more, causing more healthy people to leave, and so on.
Clearly, this Supreme Court decision has had dramatic, long-term, real-world effects on millions of Americans. On the national level, 6,387,789 individuals were at risk of losing their tax credits if the Supreme Court had ruled in favor of King. That number represents more than $1.7 billion in total monthly tax credits. For a look at how a judgment in favor of King would have affected subsidies on a state-by-state basis, see TABLE 1.
What other commentators are saying about the King v. Burwell decision
In his majority opinion, Chief Justice John Roberts noted that the “meaning of the phrase ‘established by the State’ is not so clear.” And as Amy Howe articulated on SCOTUSblog: “if the phrase…is in fact not clear…then the next step is to look at the Affordable Care Act more broadly to determine what Congress meant by the phrase. And when you do that, the Court reasoned, it becomes apparent that Congress actually intended for the subsidies to be available to everyone who buys health insurance on an exchange, no matter who created it. If the subsidies weren’t available in the states with federal exchanges, the Court explained, the insurance markets in those states simply wouldn’t work properly: without the subsidies, almost all of the people who purchased insurance on the exchanges would no longer be required to purchase insurance because it would be too expensive. This would create a ‘death spiral’….”
—Amy Howe, SCOTUSblog3
“Additional court challenges to other ACA provisions are still possible, but King’s six-member majority shows little appetite for challenges threatening the Act’s core structure. Even Scalia’s dissent recognizes that the ACA may one day ‘attain the enduring status of the Social Security Act.’ Thus, the decision may usher in a new era of policy maturity, in which efforts to undermine the ACA diminish, as focus shifts to efforts to implement and improve it.”
—Mark A. Hall, JD, New England Journal of Medicine4
“With the Court upholding the administration’s interpretation of the law, the Obama administration has little reason to accede to
Republican proposals. The Court’s decision effectively puts the future of the ACA on hold until the 2016 elections, when the people will decide whether to stay the course or to chart a very different path.”
—Timothy Jost, Health Affairs5
“A case that 6 months ago seemed to offer the Court’s conservatives a low-risk opportunity to accomplish what they almost did in 2012—kill the Affordable Care Act—became suffused with danger, for the millions of newly insured Americans, of course, but also for the Supreme Court itself. Ideology came face to face with reality, and reality prevailed.”
—Linda Greenhouse, New York Times6
How premium subsidies work
Premium subsidies are actually tax credits. Individuals and families can qualify for them to purchase any type of health insurance offered on an exchange, except catastrophic coverage. To receive the premium tax credit for coverage starting in 2015, a marketplace enrollee must:
- have a household income that is 1 to4 times the federal poverty level. In 2015, the range of incomes that qualify for subsidies is $11,670 for an individual and $23,850 for a family of 4 at 100% of the federal poverty level. At 400% of the federal poverty level, it is $46,680 for an individual and $95,400 for a family of 4.
- lack access to affordable coverage through an employer (including a family member’s employer)
- be ineligible for coverage through Medicare, Medicaid, the Children’s Health Insurance Program, or other forms of public assistance
- have US citizenship or proof of legal residency
- file taxes jointly if married.
The premium tax credit caps the amount that an individual or family must spend on their monthly payments for health insurance. The cap depends on the family’s income; lower-income families have a lower cap. The amount of the tax credit remains the same, so a person who purchases a more expensive plan pays the cost difference (TABLE 2).
The ruling’s effect on women’s health
On June 26, American College of Obstetricians and Gynecologists President Mark S. DeFrancesco, MD, MBA, hailed the Supreme Court decision, saying, “Importantly, recent data have shown that newly insured adults under the ACA were more likely to be women. Those who did gain coverage through the ACA reported better access to health care and better financial security from medical costs.”
“Without question, many women enrollees were able to purchase health insurance coverage due, in part, to the ACA subsidies that helped make this purchase affordable. In fact, government data have suggested that roughly 85% of health exchange enrollees received subsidies,” Dr. DeFrancesco said.
“If the Supreme Court had overturned this important assistance, approximately 4.8 million women would have been unable to afford the coverage that they need. The impact also would have been widespread; as these women were forced to leave the insurance marketplace, it is likely that premiums throughout the marketplace would have risen dramatically,” he continued.
“Instead, patients—especially the low- and moderate-income American women who have particularly benefited from ACA subsidies—will continue to have the peace of mind that comes with insurance coverage.”
Share your thoughts! Send your Letter to the Editor to rbarbieri@frontlinemedcom.com. Please include your name and the city and state in which you practice.
1. Blumberg LJ, Buettgens M, Holahan J. The implications of a Supreme Court finding for the plaintiff in King v. Burwell: 8.2 million more uninsured and 35% higher premiums. Urban Institute. http://www.urban.org/research/publication/implications-supreme-court-finding-plaintiff-king-vs-burwell-82-million-more-uninsured-and-35-higher-premiums. Published January 8, 2015. Accessed July 2, 2015.
2. Sheiner L, Mochoruk B. King v. Burwell explained. Brookings Institute. http://www.brookings.edu/blogs/health360/posts/2015/03/03-king-v-burwell-explainer-sheiner. Published March 3, 2015. Accessed July 2, 2015.
3. Howe A. Court backs Obama administration on health care subsidies: In plain English. SCOTUSblog. http://www.scotusblog.com/2015/06/court-backs-obama-administration-on-health-care-subsidies-in-plain-english/. Published June 25, 2015. Accessed July 1, 2015.
4. Hall MA. King v. Burwell—ACA Armageddon averted. N Engl J Med. http://www.nejm.org/doi/full/10.1056/NEJMp1504077. Published July 1, 2015. Accessed July 2, 2015.
5. Jost T. Implementing health reform: The Supreme Court upholds tax credits in the federal exchange. Health Affairs blog. http://healthaffairs.org/blog/2015/06/25/implementing-health-reform-the-supreme-court-upholds-tax-credits-in-the-federal-exchange/. Published June 25, 2015. Accessed July 1, 2015.
6. Greenhouse L. The Roberts Court’s reality check. New York Times. http://www.nytimes.com/2015/06/26/opinion/the-roberts-courts-reality-check.html. Published June 25, 2015. Accessed July 1, 2015.
7. Henry J. Kaiser Family Foundation. Explaining health care reform: questions about health insurance subsidies. Table 2. http://kff.org/health-reform/issue-brief/explaining-health-care-reform-questions-about-health/. Published October 27, 2014. Accessed July 2, 2015.

Ultrasound and Pleural Effusions
Hospitalists commonly encounter pleural effusions, and their detection and characterization by point‐of‐care ultrasound can guide management. Approximately 44% to 57% of hospitalized patients with bacterial pneumonia,[1, 2] and up to 62% of intensive care unit (ICU) patients[3] have a pleural effusion. For patients with a parapneumonic effusion, hospitalists can use ultrasound to quantify and characterize pleural fluid to determine whether diagnostic or therapeutic drainage is indicated, as well as guide performance of thoracentesis. For patients with lung cancer, detection of a malignant pleural effusion changes staging to stage IV, regardless of tumor size or lymph node involvement, and hospitalists may discuss more appropriate treatment options with patients and consultants.
Routine use of pleural ultrasonography may help hospitalists provide high‐value care by reducing ancillary testing, including computerized tomography (CT) scans that expose patients to ionizing radiation, and reducing complications of thoracentesis. However, many hospitalists may not be familiar with the use of point‐of‐care ultrasound. A national survey in 2012 revealed only 25% of internal medicine residencies have formal curricula to teach point‐of‐care ultrasonography.[4] The purpose of this review is to provide an overview of how point‐of‐care ultrasound can be utilized by hospitalists in the care of patients with pleural effusions. We review the literature on the diagnosis and evaluation of pleural effusions with ultrasound, as well as techniques to examine and drain the pleural space.
DIAGNOSIS OF PLEURAL EFFUSION
History and Physical Exam
Pleural effusions are most commonly associated with heart failure, pneumonia, cancer, pulmonary embolism, viral disease, coronary artery bypass surgery, and cirrhosis with ascites. The most common symptoms related to pleural effusion are nonspecific and often indistinguishable from those of the underlying disease process, including cough, dyspnea, and pleuritic chest pain.[5]
Diagnostic accuracy of a physical examination to detect pleural fluid is highly dependent on the size of the effusion and is unlikely to detect effusions <300 mL. A systematic review found the most accurate physical exam findings to rule in a pleural effusion were dullness to percussion (positive likelihood ratio [LR]: 8.7; 95% CI: 2.2‐33.8) and asymmetric chest expansion (positive LR: 8.1; 95% CI: 5.2‐12.7). Normal tactile vocal fremitus was the most accurate physical exam finding to rule out a pleural effusion (negative LR: 0.21; 95% CI: 0.12‐0.37).[6] A major limitation of all these studies is that physical exam was compared to chest radiography as the reference standard, and posterior‐anterior chest radiographs are not sensitive for detection of pleural effusions until 200 mL of fluid has accumulated.[7] Further, chest percussion penetrates to a maximum depth of 6 cm, and its utility is limited in obese patients.[8] Characteristics of pleural fluid that can change management, such as loculations, cannot be detected by physical exam.
Chest Radiography
Chest radiography has traditionally been used to diagnose pleural effusions. Free‐flowing pleural fluid collects in the most dependent portions of the thorax, initially in the subpulmonic space followed by the costophrenic recesses. Pleural fluid is detectable in the costophrenic recesses on lateral upright chest radiograph after 50 mL has accumulated. On standard posterior‐anterior chest radiograph, blunting of the costophrenic recesses and obliteration of the hemidiaphragm are seen when >200 mL and >500 mL of pleural fluid have accumulated, respectively.[7] However, upright chest radiographs can miss a considerable number of effusions, including as many as 10% of parapneumonic effusions large enough to indicate need for drainage.[9] Supine anterior‐posterior chest radiographs can miss a significant proportion of large effusions seen on chest CT,[10] ultrasound,[11] and lateral decubitus radiographs.[12] Pleural effusions are frequently mistaken for parenchymal opacities on portable anterior‐posterior chest radiographs.[10]
Computerized Tomography
Chest CT serves as the reference standard in most modern diagnostic accuracy studies. Limitations of chest CT include difficulty distinguishing small effusions from pleural thickening, dependent atelectasis, or tumor; lower sensitivity for detecting pleural fluid septations compared to ultrasound[13]; exposure of patients to approximately 7 mSv of ionizing radiation (the equivalent radiation dose of 350 chest radiographs)[14]; high cost; and need to transport patients to radiology departments where CT scanners are located.
Pleural Ultrasonography
Ultrasound can rapidly differentiate conditions that demonstrate a nonspecific, radiopaque appearance of lower lung fields on chest radiographs, including pleural effusions, pneumonia, atelectasis, elevated hemidiaphragm, and lung or pleural masses. Advantages of point‐of‐care ultrasound include the ability of hospitalists to acquire and interpret images at the bedside and integrate findings into clinical decision making immediately. Multiple studies have demonstrated superior diagnostic accuracy of ultrasound compared to chest radiography for detection of pleural effusions. Pleural ultrasound can detect physiologic amounts of pleural fluid (5 mL),[15] but a minimal volume of 20 mL is more reliably detected,[16] and ultrasound is 100% sensitive for effusions >100 mL.[17] In a prospective study of critically ill patients with acute respiratory distress syndrome, the diagnostic accuracy of ultrasound for pleural effusions was superior (93%) compared to auscultation (61%) and anterior‐posterior chest radiograph (47%), using chest CT as the reference standard.[18] A meta‐analysis of 4 studies calculated a pooled sensitivity and specificity of ultrasound for detection of pleural effusions as 93% (95% CI: 89%‐96%) and 96% (95% CI: 95%‐98%), respectively.[18, 19, 20, 21, 22] Ultrasound has the additional benefit of characterizing underlying lung parenchyma, which is well described in the literature but beyond the scope of this review.[23]
Sensitivity and specificity of chest radiography and ultrasonography to detect a pleural effusion are displayed in Table 1.[9, 10, 11, 12, 18, 20, 21, 22, 24, 25, 26]
| Exam | Reference Standard | Sensitivity | Specificity | Study | |
|---|---|---|---|---|---|
| |||||
| Chest radiograph | Supine AP | Upright PA/lateral | 92% | Woodring[24] | |
| Lateral decubitus XR | 67% | 70% | Ruskin[12] | ||
| Ultrasound | 82% | 82% | Emamian[11] | ||
| Ultrasound or thoracentesis | 33% | Kocijancic[25] | |||
| CT | 39% | 85% | Lichtenstein[18] | ||
| CT | 66% | 89% | Kitazano[10] | ||
| CT | 65% | 81% | Xirouchaki[26] | ||
| CT | 78% | 76% | Brixey[9] | ||
| Lateral decubitus | Ultrasound or thoracentesis | 94% | 100% | Kocijancic[25] | |
| Upright PA | CT | 82% | 81% | Brixey[9] | |
| Lateral upright | CT | 86% | 88% | Brixey[9] | |
| Ultrasound | Cardiology | CT | 93% | 88% | Kataoka[20] |
| Point of care | CT or tube thoracostomy | 96% | 100% | Ma[21] | |
| CT | 92% | 93% | Lichtenstein[18] | ||
| CT | 94% | 99% | Rocco[22] | ||
| CT | 100% | 100% | Xirouchaki[26] | ||
PLEURAL ULTRASOUND EXAMINATION
A pleural ultrasound exam may be performed as part of a complete lung ultrasound exam, such as the BLUE (Bedside Lung Ultrasound in Emergency) protocol,[27] or a focused exam to evaluate a suspected or known pleural effusion seen on chest radiograph or CT scan.[27] Free‐flowing pleural effusions accumulate in the most dependent portions of the thorax, most commonly, the posterolateral costophrenic recesses in semirecumbent or seated patients, but anteriorly in mechanically ventilated patients in a prone position.
A low‐frequency (25 MHz) phased‐array transducer is generally preferred for imaging in between the ribs. High‐frequency linear transducers do not provide adequate penetration to visualize deep structures, but do provide superior visualization of the pleural line to assess pleural thickness, measure pleural depth, and evaluate for pneumothorax.
Pleural effusions are best evaluated starting at the level of the diaphragm. Place the transducer in a longitudinal plane on the posterior axillary line at the level of the diaphragm with the transducer orientation marker (notch) pointed cephalad (Figure 1). Five structures must be definitively identified to diagnose a pleural effusion: liver/spleen, diaphragm, pleural fluid, lung, and chest wall (Figure 2A). Large pleural effusions compress the adjacent lung causing atelectasis, which gives the lung a tissue‐like echogenicity similar to the liver (Figure 2B). Static air bronchograms are commonly seen in atelectatic lung bases with pleural effusions.[28]

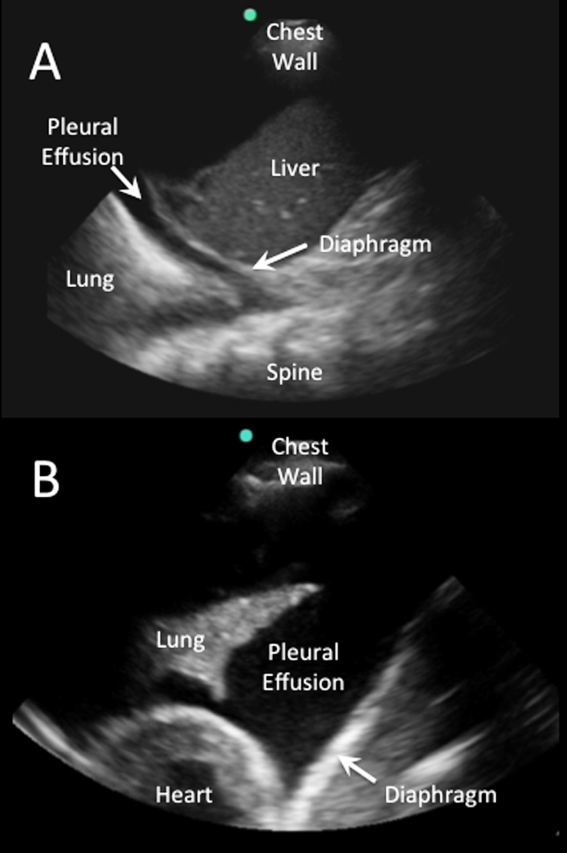
Color flow Doppler and M‐mode ultrasound may be utilized as adjuncts to routine 2‐dimensional ultrasonography. Free‐flowing pleural effusions will demonstrate flow by color Doppler (Figure 3A). Using M‐mode ultrasound, the lung can been seen moving within a pleural effusion to and from the chest wall (sinusoid sign).[29] Absence of flow or movement is seen with dense pleural loculations, pleural thickening, and peripheral lung or pleural masses (Figure 3B).
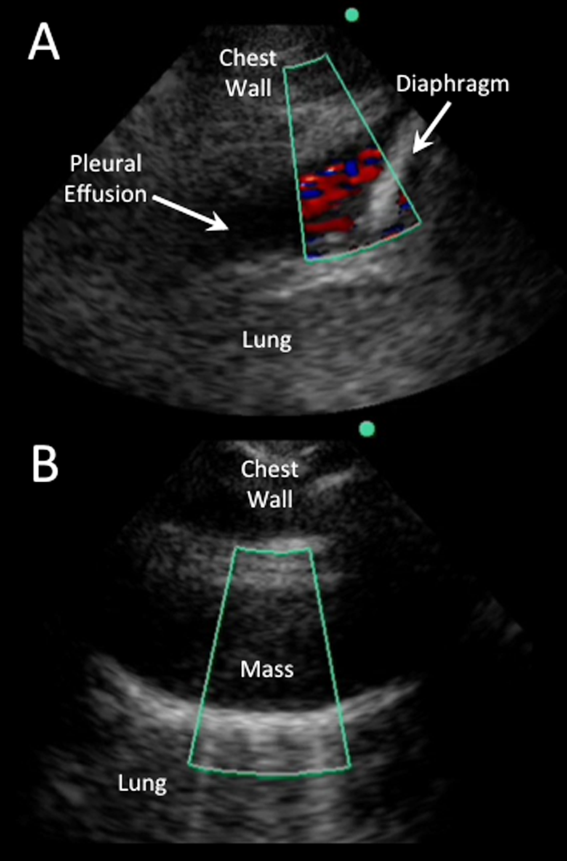
CHARACTERIZATION OF PLEURAL EFFUSION
Pleural Fluid Volume
Quantification of pleural fluid volume has been proposed using formulas with sonographic measurements.[30, 31, 32] These formulas are most accurate for moderate‐sized effusions but have not been validated beyond individual study cohorts. The largest study (n = 150) found a strong correlation between calculated and actual volumes drained by thoracentesis (r2 = 0.79; P < 0.001) using the formula (Volume [mL] = 16 parietal to visceral pleura distance (mm) at the mid‐diaphragm).[31] Although an accurate quantitative pleural fluid volume assessment may be possible, these formulas are not commonly used in clinical practice. A qualitative assessment is adequate for most clinical decision making using categories of minimal, small, moderate, or large volume.
Simple Versus Complex Effusions
Based on its sonographic appearance, pleural effusions are categorized as simple or complex. Simple pleural effusions are anechoic and usually transudative. Complex pleural effusions are subcategorized as homogeneously or heterogeneously echogenic, with or without septations, and are more often exudative.[33]
Effusions with heterogeneous echogenicity with swirling echoes suggest high cellular content that is often associated with malignancy.[34] Fibrinous stranding, septations, and loculations also suggest an exudative effusion (Figure 4A), and are more readily identified and characterized on lung ultrasound than CT scan.[35]
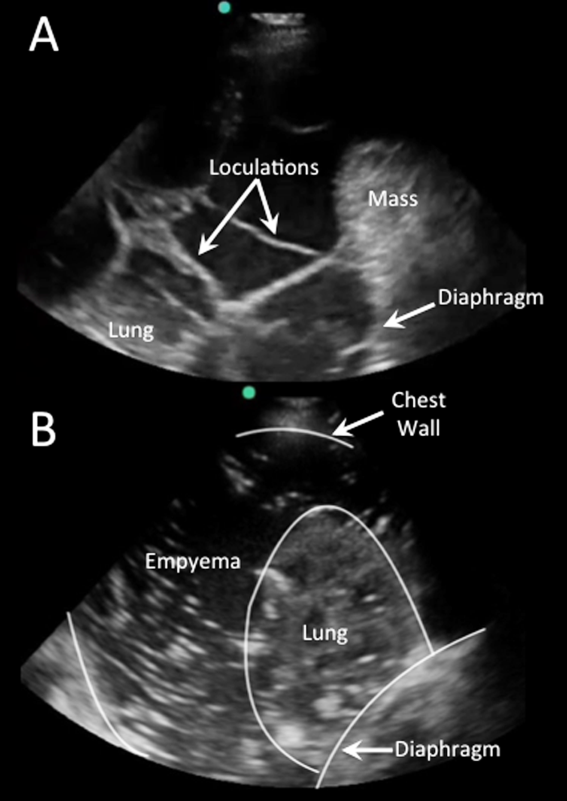
Homogenously echogenic effusions are most often due to hemothorax or empyema.[36] The high cell count of a hemothorax creates a layering effect in costophrenic recesses (hematocrit sign). Empyemas develop from complex effusions that organize into collections of pus and usually have a homogeneously echogenic, speckled appearance (Figure 4B). Sonographic evidence of septations in the presence of empyema predicts the need for intrapleural fibrinolytic therapy, longer duration of drainage, and possible surgical intervention.[37]
Isolated dense loculations may be challenging to differentiate from peripheral lung or pleural lesions, such as abscess or tumor.
Pleural Thickness
Normal visceral and parietal pleura are apposed and 0.2 to 0.3 mm thick.[38] Pleural effusions with parietal pleural thickness >10 mm, pleural nodularity, and diaphragmatic thickness >7 mm predicted underlying malignancy with high specificity and positive predictive value in 1 study.[39] As many as 20% of anechoic lesions of the pleura are solid rather than fluid. Color flow Doppler ultrasound can differentiate small pleural effusions from solid pleural abnormalities with sensitivity and specificity of 89% and 100%, respectively.[40]
PLEURAL FLUID DRAINAGE
Since its first description in 1967, use of ultrasound guidance for thoracentesis has evolved to become the standard of care in many hospitals in the United States.[41] The British Thoracic Society guidelines recommend that all thoracenteses be performed with ultrasound guidance.[42] The American College of Graduate Medical Education now requires proficiency in the use of ultrasound for thoracentesis and pleural catheter insertion by pulmonary and critical care fellows.[43]
The impetus for these recommendations stems from increased procedural success and decreased complications associated with ultrasound‐guided drainage of pleural effusions. A study evaluating thoracentesis site selection based on physical exam and chest radiographs demonstrated inaccurate site selection in 15% of patients, and use of ultrasound for site selection prevented possible accidental organ puncture in 10% of all cases.[44] The success rate of thoracentesis for small pleural effusions has been shown to increase from 66% to 90% with ultrasound guidance.[42] Using ultrasound, the distance from the skin to parietal and visceral pleura can be measured to determine whether thoracentesis can be safely performed, and to guide selection of an adequate length needle (Figure 5). A minimum pleural effusion depth of 1.5 cm between the visceral and parietal pleura has been recommended to perform diagnostic thoracentesis.[28] Diagnostic thoracentesis of complex septated pleural effusions or empyemas may be performed with a straight needle, but therapeutic drainage often requires temporary insertion of a catheter. Traditionally, large‐bore chest tubes (>24 F) had been advocated to drain viscid pus, but recent evidence suggests that small‐bore catheters (1014 F) with instillation of thrombolytics may be as effective and performed with less discomfort.[45] Video‐assisted thoracoscopy to lyse septations and evacuate infected materials is indicated when chest tube drainage has failed.
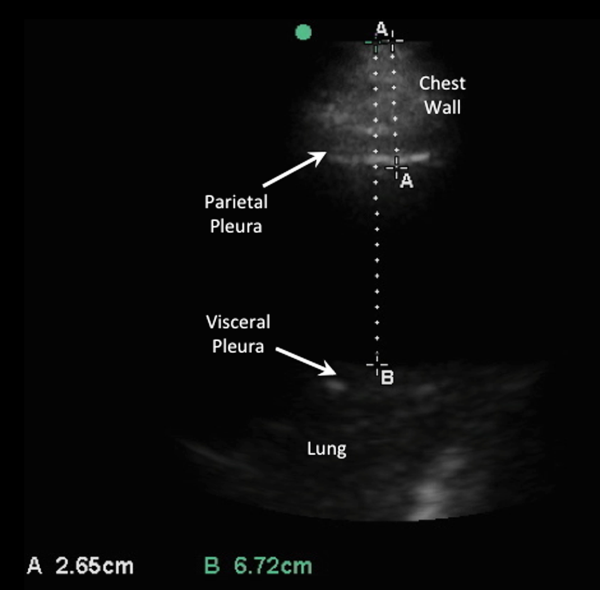
The most common complication of pleural drainage is pneumothorax. A meta‐analysis demonstrated a reduction in post‐thoracentesis pneumothorax rates from 9% to 4% with use of ultrasound.[46] Transporting patients to radiology for ultrasound marking has not been shown to decrease pneumothorax rates compared to thoracentesis without ultrasound guidance, likely due to changes in patient position and prolonged delays between marking and drainage.[47] Postprocedure pneumothorax can be ruled out if lung sliding is visualized. A meta‐analysis demonstrated superior sensitivity and similar specificity of pleural ultrasonography versus chest radiography to detect pneumothorax (sensitivity 91% vs 50% and specificity 98% vs 99%, respectively).[48] Real‐time ultrasound guidance for thoracentesis, or use of ultrasound to track the needle tip, has not been well studied but may be performed by experienced proceduralists to drain small effusions.
FUTURE RESEARCH
Future research should focus on the clinical effectiveness of point‐of‐care pleural ultrasonography when integrated with other diagnostic tools, and application of new ultrasound technologies to evaluate pleural diseases. Routine use of point‐of‐care ultrasound as the primary imaging modality in a medical ICU demonstrated a highly statistically significant reduction in chest x‐rays (3.75 vs 0.82, P < 0.0001) and chest CT scans (0.10 vs 0.04, P = 0.0007).[49] Similar studies have yet to be performed with the use of ultrasound specifically in the management of pleural diseases. Thus, clinical effectiveness studies are needed to assess the impact of routine use of pleural ultrasound on the initiation of appropriate therapies, length of stay, and costs in the management of pleural disease.
Point‐of‐care pleural ultrasound findings need to be evaluated in the context of other clinical findings and diagnostic tests. Certain ultrasound findings have been associated with exudative pleural effusions, but whether exudative and transudative effusions can be differentiated noninvasively using ultrasound findings alone, or in combination with other clinical data, warrants investigation. Similar to severity of illness scores, models that incorporate clinical, laboratory, and ultrasound findings need to be developed to guide treatment decisions, such as type of drainage procedure, as well as prognostication.
Finally, new technologies may advance the utility of point‐of‐care pleural ultrasonography. Even though 3‐dimensional ultrasonography has been available for over 2 decades, comparative studies of conventional 2‐dimensional versus 3‐dimensional ultrasonography to characterize pleural effusions have yet to be performed. Furthermore, computer‐aided detection has been shown to facilitate interpretation of ultrasound images, but this technology has yet to be applied to pleural ultrasonography.
CONCLUSIONS
Point‐of‐care pleural ultrasound is a powerful bedside tool in the hospitalist's armamentarium that is superior to physical examination and chest radiographs in the detection and characterization of pleural effusions. Furthermore, ultrasound performs similarly when compared to CT scans but offers the advantages of decreased cost, avoidance of ionizing radiation, and availability at the bedside. Ultrasound guidance reduces complications and increases the success rate of pleural drainage procedures, leading to improved patient safety. As clinical effectiveness studies emerge revealing its true value, point‐of‐care pleural ultrasonography is likely to become the standard diagnostic tool to evaluate and manage patients with pleural effusions.
Disclosures: Dr. Restrepo is partially supported by award number K23HL096054 from the National Heart, Lung, and Blood Institute. The content is solely the responsibility of the authors and does not necessarily represent the official views of the National Heart, Lung, and Blood Institute or the National Institutes of Health. The authors report no conflicts of interest.
- , , , . Parapneumonic effusions. Am J Med. 1980;69(4):507–512.
- , , . The incidence and clinical correlates of parapneumonic effusions in pneumococcal pneumonia. Chest. 1978;74(2):170–173.
- , , , , . Pleural effusions in the medical ICU: prevalence, causes, and clinical implications. Chest. 1997;111(4):1018–1023.
- , , , . Point‐of‐care ultrasound in internal medicine: a national survey of educational leadership. J Grad Med Educ. 2013;5(3):498–502.
- . Pleural Diseases. Philadelphia, PA: Lippincott Williams 2007.
- , , . Does this patient have a pleural effusion? JAMA. 2009;301(3):309–317.
- , , , . Pleural fluid volume estimation: a chest radiograph prediction rule. Acad Radiol. 1996;3(2):103–109.
- , . Accuracy of the physical examination in evaluating pleural effusion. Cleve Clin J Med. 2008;75(4):297–303.
- , , , , . The efficacy of chest radiographs in detecting parapneumonic effusions. Respirology. 2011;16(6):1000–1004.
- , , , , . Differentiation of pleural effusions from parenchymal opacities: accuracy of bedside chest radiography. AJR Am J Roentgenol. 2010;194(2):407–412.
- , , , . Accuracy of the diagnosis of pleural effusion on supine chest X‐ray. Eur Radiol. 1997;7(1):57–60.
- , , , . Detection of pleural effusions on supine chest radiographs. AJR Am J Roentgenol. 1987;148(4):681–683.
- , , , , . Multiloculated pleural effusion detected by ultrasound only in a critically‐ill patient. Am J Case Rep. 2013;14:63–66.
- , , , et al. Exposure to low‐dose ionizing radiation from medical imaging procedures. N Engl J Med. 2009;361(9):849–857.
- , , . The diagnosis of pleural effusion by ultrasonic and radiologic techniques. Chest. 1976;70(1):33–37.
- , , , , , . Ultrasound in blunt abdominal and thoracic trauma. J Trauma. 1993;34(4):488–495.
- , , , et al. Application of color Doppler ultrasound in the study of small pleural effusion. Med Ultrason. 2010;12(1):12–16.
- , , , , , . Comparative diagnostic performances of auscultation, chest radiography, and lung ultrasonography in acute respiratory distress syndrome. Anesthesiology. 2004;100(1):9–15.
- , , , , . Diagnostic accuracy of sonography for pleural effusion: systematic review. Sao Paulo Med J. 2010;128(2):90–95.
- , . The role of thoracic ultrasonography for evaluation of patients with decompensated chronic heart failure. J Am Coll Cardiol. 2000;35(6):1638–1646.
- , . Trauma ultrasound examination versus chest radiography in the detection of hemothorax. Ann Emerg Med. 1997;29(3):312–315; discussion 315–316.
- , , , et al. Diagnostic accuracy of bedside ultrasonography in the ICU: feasibility of detecting pulmonary effusion and lung contusion in patients on respiratory support after severe blunt thoracic trauma. Acta Anaesthesiol Scand. 2008;52(6):776–784.
- . Lung ultrasound in the critically ill. Ann Intensive Care. 2014;4(1):1.
- . Recognition of pleural effusion on supine radiographs: how much fluid is required? AJR. Am J Roentgenol. 1984;142(1):59–64.
- , , . Chest sonography versus lateral decubitus radiography in the diagnosis of small pleural effusions. J Clin Ultrasound. 2003;31(2):69–74.
- , , , , . Impact of lung ultrasound on clinical decision making in critically ill patients. Intensive Care Med. 2014;40(1):57–65.
- . Lung ultrasound in acute respiratory failure an introduction to the BLUE‐protocol. Minerva Anestesiol. 2009;75(5):313–317.
- , , . Point‐of‐Care Ultrasound. 1st ed. Philadelphia, PA: Saunders; 2014.
- , , , et al. International evidence‐based recommendations for point‐of‐care lung ultrasound. Intensive Care Med. 2012;38(4):577–591.
- , , , et al. Ultrasound estimation of volume of pleural fluid in mechanically ventilated patients. Intensive Care Med. 2006;32(2):318–321.
- , , . Ultrasound estimation of volume of postoperative pleural effusion in cardiac surgery patients. Interact Cardiovasc Thorac Surg. 2010;10(2):204–207.
- , , , et al. Multiplane ultrasound approach to quantify pleural effusion at the bedside. Intensive Care Med. 2010;36(4):656–664.
- , , , , , . Value of sonography in determining the nature of pleural effusion: analysis of 320 cases. AJR Am J Roentgenol. 1992;159(1):29–33.
- , , , , , . Echogenic swirling pattern as a predictor of malignant pleural effusions in patients with malignancies. Chest. 2004;126(1):129–134.
- , . Imaging the pleura: sonography, CT, and MR imaging. AJR Am J Roentgenol. 1991;156(6):1145–1153.
- , , , et al. Pleural effusions in febrile medical ICU patients: chest ultrasound study. Chest. 2004;126(4):1274–1280.
- , , , , . Sonographic septation: a useful prognostic indicator of acute thoracic empyema. J Ultrasound Med. 2000;19(12):837–843.
- . Sonography of the pleura [in German]. Ultraschall Med. 2010;31(1):8–22, quiz 23–25.
- , , . Thoracic ultrasound in the diagnosis of malignant pleural effusion. Thorax. 2009;64(2):139–143.
- , , , . “Fluid color” sign: a useful indicator for discrimination between pleural thickening and pleural effusion. J Ultrasound Med. 1995;14(10):767–769.
- , , . Reflected ultrasound in the detection and localization of pleural effusion. JAMA. 1967;200(5):399–402.
- , , , . Pleural procedures and thoracic ultrasound: British Thoracic Society Pleural Disease Guideline 2010. Thorax. 2010;65(suppl 2):ii61–ii76.
- Accreditation Council for Graduate Medical Education. http://www.acgme.org/acgmeweb. Accessed January 15, 2015.
- , , . Accuracy of pleural puncture sites: a prospective comparison of clinical examination with ultrasound. Chest. 2003;123(2):436–441.
- , , , , , . A double blind randomized cross over trial comparing rate of decortication and efficacy of intrapleural instillation of alteplase vs placebo in patients with empyemas and complicated parapneumonic effusions. Respir Med. 2012;106(5):716–723.
- , , , . Pneumothorax following thoracentesis: a systematic review and meta‐analysis. Arch Intern Med. 2010;170(4):332–339.
- , , , , , . Factors affecting the development of pneumothorax associated with thoracentesis. AJR Am J Roentgenol. 1991;156(5):917–920.
- , , . Test characteristics of ultrasonography for the detection of pneumothorax: a systematic review and meta‐analysis. Chest. 2012;141(3):703–708.
- , , , et al. The effect of point‐of‐care ultrasonography on imaging studies in the medical ICU: a comparative study. Chest. 2014;146(6):1574–1577.
Hospitalists commonly encounter pleural effusions, and their detection and characterization by point‐of‐care ultrasound can guide management. Approximately 44% to 57% of hospitalized patients with bacterial pneumonia,[1, 2] and up to 62% of intensive care unit (ICU) patients[3] have a pleural effusion. For patients with a parapneumonic effusion, hospitalists can use ultrasound to quantify and characterize pleural fluid to determine whether diagnostic or therapeutic drainage is indicated, as well as guide performance of thoracentesis. For patients with lung cancer, detection of a malignant pleural effusion changes staging to stage IV, regardless of tumor size or lymph node involvement, and hospitalists may discuss more appropriate treatment options with patients and consultants.
Routine use of pleural ultrasonography may help hospitalists provide high‐value care by reducing ancillary testing, including computerized tomography (CT) scans that expose patients to ionizing radiation, and reducing complications of thoracentesis. However, many hospitalists may not be familiar with the use of point‐of‐care ultrasound. A national survey in 2012 revealed only 25% of internal medicine residencies have formal curricula to teach point‐of‐care ultrasonography.[4] The purpose of this review is to provide an overview of how point‐of‐care ultrasound can be utilized by hospitalists in the care of patients with pleural effusions. We review the literature on the diagnosis and evaluation of pleural effusions with ultrasound, as well as techniques to examine and drain the pleural space.
DIAGNOSIS OF PLEURAL EFFUSION
History and Physical Exam
Pleural effusions are most commonly associated with heart failure, pneumonia, cancer, pulmonary embolism, viral disease, coronary artery bypass surgery, and cirrhosis with ascites. The most common symptoms related to pleural effusion are nonspecific and often indistinguishable from those of the underlying disease process, including cough, dyspnea, and pleuritic chest pain.[5]
Diagnostic accuracy of a physical examination to detect pleural fluid is highly dependent on the size of the effusion and is unlikely to detect effusions <300 mL. A systematic review found the most accurate physical exam findings to rule in a pleural effusion were dullness to percussion (positive likelihood ratio [LR]: 8.7; 95% CI: 2.2‐33.8) and asymmetric chest expansion (positive LR: 8.1; 95% CI: 5.2‐12.7). Normal tactile vocal fremitus was the most accurate physical exam finding to rule out a pleural effusion (negative LR: 0.21; 95% CI: 0.12‐0.37).[6] A major limitation of all these studies is that physical exam was compared to chest radiography as the reference standard, and posterior‐anterior chest radiographs are not sensitive for detection of pleural effusions until 200 mL of fluid has accumulated.[7] Further, chest percussion penetrates to a maximum depth of 6 cm, and its utility is limited in obese patients.[8] Characteristics of pleural fluid that can change management, such as loculations, cannot be detected by physical exam.
Chest Radiography
Chest radiography has traditionally been used to diagnose pleural effusions. Free‐flowing pleural fluid collects in the most dependent portions of the thorax, initially in the subpulmonic space followed by the costophrenic recesses. Pleural fluid is detectable in the costophrenic recesses on lateral upright chest radiograph after 50 mL has accumulated. On standard posterior‐anterior chest radiograph, blunting of the costophrenic recesses and obliteration of the hemidiaphragm are seen when >200 mL and >500 mL of pleural fluid have accumulated, respectively.[7] However, upright chest radiographs can miss a considerable number of effusions, including as many as 10% of parapneumonic effusions large enough to indicate need for drainage.[9] Supine anterior‐posterior chest radiographs can miss a significant proportion of large effusions seen on chest CT,[10] ultrasound,[11] and lateral decubitus radiographs.[12] Pleural effusions are frequently mistaken for parenchymal opacities on portable anterior‐posterior chest radiographs.[10]
Computerized Tomography
Chest CT serves as the reference standard in most modern diagnostic accuracy studies. Limitations of chest CT include difficulty distinguishing small effusions from pleural thickening, dependent atelectasis, or tumor; lower sensitivity for detecting pleural fluid septations compared to ultrasound[13]; exposure of patients to approximately 7 mSv of ionizing radiation (the equivalent radiation dose of 350 chest radiographs)[14]; high cost; and need to transport patients to radiology departments where CT scanners are located.
Pleural Ultrasonography
Ultrasound can rapidly differentiate conditions that demonstrate a nonspecific, radiopaque appearance of lower lung fields on chest radiographs, including pleural effusions, pneumonia, atelectasis, elevated hemidiaphragm, and lung or pleural masses. Advantages of point‐of‐care ultrasound include the ability of hospitalists to acquire and interpret images at the bedside and integrate findings into clinical decision making immediately. Multiple studies have demonstrated superior diagnostic accuracy of ultrasound compared to chest radiography for detection of pleural effusions. Pleural ultrasound can detect physiologic amounts of pleural fluid (5 mL),[15] but a minimal volume of 20 mL is more reliably detected,[16] and ultrasound is 100% sensitive for effusions >100 mL.[17] In a prospective study of critically ill patients with acute respiratory distress syndrome, the diagnostic accuracy of ultrasound for pleural effusions was superior (93%) compared to auscultation (61%) and anterior‐posterior chest radiograph (47%), using chest CT as the reference standard.[18] A meta‐analysis of 4 studies calculated a pooled sensitivity and specificity of ultrasound for detection of pleural effusions as 93% (95% CI: 89%‐96%) and 96% (95% CI: 95%‐98%), respectively.[18, 19, 20, 21, 22] Ultrasound has the additional benefit of characterizing underlying lung parenchyma, which is well described in the literature but beyond the scope of this review.[23]
Sensitivity and specificity of chest radiography and ultrasonography to detect a pleural effusion are displayed in Table 1.[9, 10, 11, 12, 18, 20, 21, 22, 24, 25, 26]
| Exam | Reference Standard | Sensitivity | Specificity | Study | |
|---|---|---|---|---|---|
| |||||
| Chest radiograph | Supine AP | Upright PA/lateral | 92% | Woodring[24] | |
| Lateral decubitus XR | 67% | 70% | Ruskin[12] | ||
| Ultrasound | 82% | 82% | Emamian[11] | ||
| Ultrasound or thoracentesis | 33% | Kocijancic[25] | |||
| CT | 39% | 85% | Lichtenstein[18] | ||
| CT | 66% | 89% | Kitazano[10] | ||
| CT | 65% | 81% | Xirouchaki[26] | ||
| CT | 78% | 76% | Brixey[9] | ||
| Lateral decubitus | Ultrasound or thoracentesis | 94% | 100% | Kocijancic[25] | |
| Upright PA | CT | 82% | 81% | Brixey[9] | |
| Lateral upright | CT | 86% | 88% | Brixey[9] | |
| Ultrasound | Cardiology | CT | 93% | 88% | Kataoka[20] |
| Point of care | CT or tube thoracostomy | 96% | 100% | Ma[21] | |
| CT | 92% | 93% | Lichtenstein[18] | ||
| CT | 94% | 99% | Rocco[22] | ||
| CT | 100% | 100% | Xirouchaki[26] | ||
PLEURAL ULTRASOUND EXAMINATION
A pleural ultrasound exam may be performed as part of a complete lung ultrasound exam, such as the BLUE (Bedside Lung Ultrasound in Emergency) protocol,[27] or a focused exam to evaluate a suspected or known pleural effusion seen on chest radiograph or CT scan.[27] Free‐flowing pleural effusions accumulate in the most dependent portions of the thorax, most commonly, the posterolateral costophrenic recesses in semirecumbent or seated patients, but anteriorly in mechanically ventilated patients in a prone position.
A low‐frequency (25 MHz) phased‐array transducer is generally preferred for imaging in between the ribs. High‐frequency linear transducers do not provide adequate penetration to visualize deep structures, but do provide superior visualization of the pleural line to assess pleural thickness, measure pleural depth, and evaluate for pneumothorax.
Pleural effusions are best evaluated starting at the level of the diaphragm. Place the transducer in a longitudinal plane on the posterior axillary line at the level of the diaphragm with the transducer orientation marker (notch) pointed cephalad (Figure 1). Five structures must be definitively identified to diagnose a pleural effusion: liver/spleen, diaphragm, pleural fluid, lung, and chest wall (Figure 2A). Large pleural effusions compress the adjacent lung causing atelectasis, which gives the lung a tissue‐like echogenicity similar to the liver (Figure 2B). Static air bronchograms are commonly seen in atelectatic lung bases with pleural effusions.[28]
Color flow Doppler and M‐mode ultrasound may be utilized as adjuncts to routine 2‐dimensional ultrasonography. Free‐flowing pleural effusions will demonstrate flow by color Doppler (Figure 3A). Using M‐mode ultrasound, the lung can been seen moving within a pleural effusion to and from the chest wall (sinusoid sign).[29] Absence of flow or movement is seen with dense pleural loculations, pleural thickening, and peripheral lung or pleural masses (Figure 3B).
CHARACTERIZATION OF PLEURAL EFFUSION
Pleural Fluid Volume
Quantification of pleural fluid volume has been proposed using formulas with sonographic measurements.[30, 31, 32] These formulas are most accurate for moderate‐sized effusions but have not been validated beyond individual study cohorts. The largest study (n = 150) found a strong correlation between calculated and actual volumes drained by thoracentesis (r2 = 0.79; P < 0.001) using the formula (Volume [mL] = 16 parietal to visceral pleura distance (mm) at the mid‐diaphragm).[31] Although an accurate quantitative pleural fluid volume assessment may be possible, these formulas are not commonly used in clinical practice. A qualitative assessment is adequate for most clinical decision making using categories of minimal, small, moderate, or large volume.
Simple Versus Complex Effusions
Based on its sonographic appearance, pleural effusions are categorized as simple or complex. Simple pleural effusions are anechoic and usually transudative. Complex pleural effusions are subcategorized as homogeneously or heterogeneously echogenic, with or without septations, and are more often exudative.[33]
Effusions with heterogeneous echogenicity with swirling echoes suggest high cellular content that is often associated with malignancy.[34] Fibrinous stranding, septations, and loculations also suggest an exudative effusion (Figure 4A), and are more readily identified and characterized on lung ultrasound than CT scan.[35]
Homogenously echogenic effusions are most often due to hemothorax or empyema.[36] The high cell count of a hemothorax creates a layering effect in costophrenic recesses (hematocrit sign). Empyemas develop from complex effusions that organize into collections of pus and usually have a homogeneously echogenic, speckled appearance (Figure 4B). Sonographic evidence of septations in the presence of empyema predicts the need for intrapleural fibrinolytic therapy, longer duration of drainage, and possible surgical intervention.[37]
Isolated dense loculations may be challenging to differentiate from peripheral lung or pleural lesions, such as abscess or tumor.
Pleural Thickness
Normal visceral and parietal pleura are apposed and 0.2 to 0.3 mm thick.[38] Pleural effusions with parietal pleural thickness >10 mm, pleural nodularity, and diaphragmatic thickness >7 mm predicted underlying malignancy with high specificity and positive predictive value in 1 study.[39] As many as 20% of anechoic lesions of the pleura are solid rather than fluid. Color flow Doppler ultrasound can differentiate small pleural effusions from solid pleural abnormalities with sensitivity and specificity of 89% and 100%, respectively.[40]
PLEURAL FLUID DRAINAGE
Since its first description in 1967, use of ultrasound guidance for thoracentesis has evolved to become the standard of care in many hospitals in the United States.[41] The British Thoracic Society guidelines recommend that all thoracenteses be performed with ultrasound guidance.[42] The American College of Graduate Medical Education now requires proficiency in the use of ultrasound for thoracentesis and pleural catheter insertion by pulmonary and critical care fellows.[43]
The impetus for these recommendations stems from increased procedural success and decreased complications associated with ultrasound‐guided drainage of pleural effusions. A study evaluating thoracentesis site selection based on physical exam and chest radiographs demonstrated inaccurate site selection in 15% of patients, and use of ultrasound for site selection prevented possible accidental organ puncture in 10% of all cases.[44] The success rate of thoracentesis for small pleural effusions has been shown to increase from 66% to 90% with ultrasound guidance.[42] Using ultrasound, the distance from the skin to parietal and visceral pleura can be measured to determine whether thoracentesis can be safely performed, and to guide selection of an adequate length needle (Figure 5). A minimum pleural effusion depth of 1.5 cm between the visceral and parietal pleura has been recommended to perform diagnostic thoracentesis.[28] Diagnostic thoracentesis of complex septated pleural effusions or empyemas may be performed with a straight needle, but therapeutic drainage often requires temporary insertion of a catheter. Traditionally, large‐bore chest tubes (>24 F) had been advocated to drain viscid pus, but recent evidence suggests that small‐bore catheters (1014 F) with instillation of thrombolytics may be as effective and performed with less discomfort.[45] Video‐assisted thoracoscopy to lyse septations and evacuate infected materials is indicated when chest tube drainage has failed.
The most common complication of pleural drainage is pneumothorax. A meta‐analysis demonstrated a reduction in post‐thoracentesis pneumothorax rates from 9% to 4% with use of ultrasound.[46] Transporting patients to radiology for ultrasound marking has not been shown to decrease pneumothorax rates compared to thoracentesis without ultrasound guidance, likely due to changes in patient position and prolonged delays between marking and drainage.[47] Postprocedure pneumothorax can be ruled out if lung sliding is visualized. A meta‐analysis demonstrated superior sensitivity and similar specificity of pleural ultrasonography versus chest radiography to detect pneumothorax (sensitivity 91% vs 50% and specificity 98% vs 99%, respectively).[48] Real‐time ultrasound guidance for thoracentesis, or use of ultrasound to track the needle tip, has not been well studied but may be performed by experienced proceduralists to drain small effusions.
FUTURE RESEARCH
Future research should focus on the clinical effectiveness of point‐of‐care pleural ultrasonography when integrated with other diagnostic tools, and application of new ultrasound technologies to evaluate pleural diseases. Routine use of point‐of‐care ultrasound as the primary imaging modality in a medical ICU demonstrated a highly statistically significant reduction in chest x‐rays (3.75 vs 0.82, P < 0.0001) and chest CT scans (0.10 vs 0.04, P = 0.0007).[49] Similar studies have yet to be performed with the use of ultrasound specifically in the management of pleural diseases. Thus, clinical effectiveness studies are needed to assess the impact of routine use of pleural ultrasound on the initiation of appropriate therapies, length of stay, and costs in the management of pleural disease.
Point‐of‐care pleural ultrasound findings need to be evaluated in the context of other clinical findings and diagnostic tests. Certain ultrasound findings have been associated with exudative pleural effusions, but whether exudative and transudative effusions can be differentiated noninvasively using ultrasound findings alone, or in combination with other clinical data, warrants investigation. Similar to severity of illness scores, models that incorporate clinical, laboratory, and ultrasound findings need to be developed to guide treatment decisions, such as type of drainage procedure, as well as prognostication.
Finally, new technologies may advance the utility of point‐of‐care pleural ultrasonography. Even though 3‐dimensional ultrasonography has been available for over 2 decades, comparative studies of conventional 2‐dimensional versus 3‐dimensional ultrasonography to characterize pleural effusions have yet to be performed. Furthermore, computer‐aided detection has been shown to facilitate interpretation of ultrasound images, but this technology has yet to be applied to pleural ultrasonography.
CONCLUSIONS
Point‐of‐care pleural ultrasound is a powerful bedside tool in the hospitalist's armamentarium that is superior to physical examination and chest radiographs in the detection and characterization of pleural effusions. Furthermore, ultrasound performs similarly when compared to CT scans but offers the advantages of decreased cost, avoidance of ionizing radiation, and availability at the bedside. Ultrasound guidance reduces complications and increases the success rate of pleural drainage procedures, leading to improved patient safety. As clinical effectiveness studies emerge revealing its true value, point‐of‐care pleural ultrasonography is likely to become the standard diagnostic tool to evaluate and manage patients with pleural effusions.
Disclosures: Dr. Restrepo is partially supported by award number K23HL096054 from the National Heart, Lung, and Blood Institute. The content is solely the responsibility of the authors and does not necessarily represent the official views of the National Heart, Lung, and Blood Institute or the National Institutes of Health. The authors report no conflicts of interest.
- , , , . Parapneumonic effusions. Am J Med. 1980;69(4):507–512.
- , , . The incidence and clinical correlates of parapneumonic effusions in pneumococcal pneumonia. Chest. 1978;74(2):170–173.
- , , , , . Pleural effusions in the medical ICU: prevalence, causes, and clinical implications. Chest. 1997;111(4):1018–1023.
- , , , . Point‐of‐care ultrasound in internal medicine: a national survey of educational leadership. J Grad Med Educ. 2013;5(3):498–502.
- . Pleural Diseases. Philadelphia, PA: Lippincott Williams 2007.
- , , . Does this patient have a pleural effusion? JAMA. 2009;301(3):309–317.
- , , , . Pleural fluid volume estimation: a chest radiograph prediction rule. Acad Radiol. 1996;3(2):103–109.
- , . Accuracy of the physical examination in evaluating pleural effusion. Cleve Clin J Med. 2008;75(4):297–303.
- , , , , . The efficacy of chest radiographs in detecting parapneumonic effusions. Respirology. 2011;16(6):1000–1004.
- , , , , . Differentiation of pleural effusions from parenchymal opacities: accuracy of bedside chest radiography. AJR Am J Roentgenol. 2010;194(2):407–412.
- , , , . Accuracy of the diagnosis of pleural effusion on supine chest X‐ray. Eur Radiol. 1997;7(1):57–60.
- , , , . Detection of pleural effusions on supine chest radiographs. AJR Am J Roentgenol. 1987;148(4):681–683.
- , , , , . Multiloculated pleural effusion detected by ultrasound only in a critically‐ill patient. Am J Case Rep. 2013;14:63–66.
- , , , et al. Exposure to low‐dose ionizing radiation from medical imaging procedures. N Engl J Med. 2009;361(9):849–857.
- , , . The diagnosis of pleural effusion by ultrasonic and radiologic techniques. Chest. 1976;70(1):33–37.
- , , , , , . Ultrasound in blunt abdominal and thoracic trauma. J Trauma. 1993;34(4):488–495.
- , , , et al. Application of color Doppler ultrasound in the study of small pleural effusion. Med Ultrason. 2010;12(1):12–16.
- , , , , , . Comparative diagnostic performances of auscultation, chest radiography, and lung ultrasonography in acute respiratory distress syndrome. Anesthesiology. 2004;100(1):9–15.
- , , , , . Diagnostic accuracy of sonography for pleural effusion: systematic review. Sao Paulo Med J. 2010;128(2):90–95.
- , . The role of thoracic ultrasonography for evaluation of patients with decompensated chronic heart failure. J Am Coll Cardiol. 2000;35(6):1638–1646.
- , . Trauma ultrasound examination versus chest radiography in the detection of hemothorax. Ann Emerg Med. 1997;29(3):312–315; discussion 315–316.
- , , , et al. Diagnostic accuracy of bedside ultrasonography in the ICU: feasibility of detecting pulmonary effusion and lung contusion in patients on respiratory support after severe blunt thoracic trauma. Acta Anaesthesiol Scand. 2008;52(6):776–784.
- . Lung ultrasound in the critically ill. Ann Intensive Care. 2014;4(1):1.
- . Recognition of pleural effusion on supine radiographs: how much fluid is required? AJR. Am J Roentgenol. 1984;142(1):59–64.
- , , . Chest sonography versus lateral decubitus radiography in the diagnosis of small pleural effusions. J Clin Ultrasound. 2003;31(2):69–74.
- , , , , . Impact of lung ultrasound on clinical decision making in critically ill patients. Intensive Care Med. 2014;40(1):57–65.
- . Lung ultrasound in acute respiratory failure an introduction to the BLUE‐protocol. Minerva Anestesiol. 2009;75(5):313–317.
- , , . Point‐of‐Care Ultrasound. 1st ed. Philadelphia, PA: Saunders; 2014.
- , , , et al. International evidence‐based recommendations for point‐of‐care lung ultrasound. Intensive Care Med. 2012;38(4):577–591.
- , , , et al. Ultrasound estimation of volume of pleural fluid in mechanically ventilated patients. Intensive Care Med. 2006;32(2):318–321.
- , , . Ultrasound estimation of volume of postoperative pleural effusion in cardiac surgery patients. Interact Cardiovasc Thorac Surg. 2010;10(2):204–207.
- , , , et al. Multiplane ultrasound approach to quantify pleural effusion at the bedside. Intensive Care Med. 2010;36(4):656–664.
- , , , , , . Value of sonography in determining the nature of pleural effusion: analysis of 320 cases. AJR Am J Roentgenol. 1992;159(1):29–33.
- , , , , , . Echogenic swirling pattern as a predictor of malignant pleural effusions in patients with malignancies. Chest. 2004;126(1):129–134.
- , . Imaging the pleura: sonography, CT, and MR imaging. AJR Am J Roentgenol. 1991;156(6):1145–1153.
- , , , et al. Pleural effusions in febrile medical ICU patients: chest ultrasound study. Chest. 2004;126(4):1274–1280.
- , , , , . Sonographic septation: a useful prognostic indicator of acute thoracic empyema. J Ultrasound Med. 2000;19(12):837–843.
- . Sonography of the pleura [in German]. Ultraschall Med. 2010;31(1):8–22, quiz 23–25.
- , , . Thoracic ultrasound in the diagnosis of malignant pleural effusion. Thorax. 2009;64(2):139–143.
- , , , . “Fluid color” sign: a useful indicator for discrimination between pleural thickening and pleural effusion. J Ultrasound Med. 1995;14(10):767–769.
- , , . Reflected ultrasound in the detection and localization of pleural effusion. JAMA. 1967;200(5):399–402.
- , , , . Pleural procedures and thoracic ultrasound: British Thoracic Society Pleural Disease Guideline 2010. Thorax. 2010;65(suppl 2):ii61–ii76.
- Accreditation Council for Graduate Medical Education. http://www.acgme.org/acgmeweb. Accessed January 15, 2015.
- , , . Accuracy of pleural puncture sites: a prospective comparison of clinical examination with ultrasound. Chest. 2003;123(2):436–441.
- , , , , , . A double blind randomized cross over trial comparing rate of decortication and efficacy of intrapleural instillation of alteplase vs placebo in patients with empyemas and complicated parapneumonic effusions. Respir Med. 2012;106(5):716–723.
- , , , . Pneumothorax following thoracentesis: a systematic review and meta‐analysis. Arch Intern Med. 2010;170(4):332–339.
- , , , , , . Factors affecting the development of pneumothorax associated with thoracentesis. AJR Am J Roentgenol. 1991;156(5):917–920.
- , , . Test characteristics of ultrasonography for the detection of pneumothorax: a systematic review and meta‐analysis. Chest. 2012;141(3):703–708.
- , , , et al. The effect of point‐of‐care ultrasonography on imaging studies in the medical ICU: a comparative study. Chest. 2014;146(6):1574–1577.

Update in Sepsis Management
Sepsis is one of the oldest and most elusive syndromes in medicine, and remains a significant contributor to morbidity, mortality, and healthcare expenditure.[1] A 1992 American College of Chest Physicians and Society of Critical Care Medicine consensus conference statement introduced the systemic inflammatory response syndrome (SIRS) into the medical lexicon, along with definitions of sepsis, severe sepsis, and septic shock.[2] A 2003 consensus panel expanded the list of signs and symptoms associated with sepsis, and warned that the findings of SIRS do not differentiate sepsis from other noninfectious conditions.[3] The terminology is important, as these definitions resulted in a shift of the label of the syndrome of infection complicated by end‐organ dysfunction from sepsis to severe sepsis or septic shock. Overlap of these terms has implications for categorizing such infections for the purpose of investigation, estimating epidemiology and outcome, and coding, billing, and reimbursement.[1]
Traditional definitions of the spectrum of sepsis disorders are outlined in Table 1,[2, 3] and it is important to note that an update to these definitions is anticipated in the near future. A recent publication has called into question the sensitivity and categorical requirement of at least 2 SIRS criteria to define severe sepsis.[4] This study of more than 1 million patients from 172 intensive care units (ICUs) in Australia and New Zealand from 2000 to 2013 found that the cutoff of 2 SIRS criteria to define severe sepsis excluded 1 in 8 patients with infection and end‐organ hypoperfusion. SIRS‐negative severe sepsis patients experienced the same mortality as SIRS‐positive patients. In addition, adjusted analysis determined a stepwise increase in mortality risk associated with each additional SIRS criterion without a transition point in risk noted at 2.[4]
| Definition | |
|---|---|
| |
| SIRS | The systemic inflammatory response to a variety of severe insults. Requires 2 of the following: |
| Temperature >38C or <36C | |
| Heart rate >90 beats/minute | |
| Respiratory rate >20 breaths/minute or partial pressure of carbon dioxide (PaCO2) <32 mm Hg | |
| White blood cell count >12,000 or <4,000 cells/L or 10% immature (band) forms | |
| Sepsis | The systemic response to infection, with SIRS criteria met in the setting of documented or strongly suspected infection |
| Severe sepsis | Sepsis associated with organ dysfunction, hypoperfusion (including but not limited to lactic acidosis, oliguria, or acute alteration in mental status), or hypotension (systolic blood pressure <90 mm Hg or >40 mm Hg below baseline). |
| Septic shock | Sepsis‐induced hypotension despite adequate volume resuscitation (2030 mL/kg) with perfusion abnormalities including but not limited to lactic acidosis, oliguria, or acute alteration in mental status |
From 1979 through 2000, there were over 10 million reported cases of sepsis, which accounted for 1.3% of all hospitalizations in the United States.[5] Normalized to the population distribution of the 2000 US Census, there was an annualized increase in sepsis cases of 8.7%. A 2011 report revealed rates of hospitalization for patients with septicemia or sepsis in the United States more than doubled from 2000 through 2008.[6] Patients with sepsis experienced longer length of stay than other inpatients and were 8 times more likely to die during hospitalization.[6] Estimates of severe sepsis incidence are complicated by how acute organ dysfunction is defined and whether it is related to infection. As of 2001, the number of severe sepsis cases in the United States was believed to exceed 750,000 and comprise approximately 10% of ICU admissions.[1] The incidence of severe sepsis cases in the United States continues to rise.[7, 8, 9] However, a more than doubling of the use of sepsis International Classification of Diseases, Ninth Revision, Clinical Modification (ICD‐9‐CM) codes from 2004 through 2009 has also been noted.[8] Based on ICD‐9‐CM codes indicating the presence of sepsis and organ system failure, the number of severe sepsis hospitalizations per 100,000 persons in the United States increased from 143 in 2000 to 343 in 2007.[7] Total hospital costs for patients with severe sepsis were estimated to increase 57%, from $15.4 billion in 2003 to $24.3 billion in 2007.[9] The Agency for Healthcare Research and Quality considered septicemia the most expensive medical condition in the United States in a 2011 data brief, with annual aggregate hospital costs exceeding $20 billion.[10]
Although many hospitalists care for patients in the ICU and other higher acuity or step‐down units, a significant proportion of patients with severe sepsis receive care on a general medical floor.[11, 12, 13] Sepsis is also clearly not an issue restricted to patients on internal medicine services. Of over 360,000 general surgery patients from 2005 to 2007, the incidences of sepsis (2.3%) and septic shock (1.6%) greatly exceeded those of pulmonary embolism (0.3%) and myocardial infarction (0.2%). In this cohort, the need for emergency surgery and the presence of any comorbidity increased the number of sepsis cases.[14]
Despite difficulties obtaining exact estimates of case numbers, the following appears true: the spectrum of sepsis disorders (including severe sepsis and septic shock) remains a common, costly, and increasing clinical entity that is encountered by hospital medicine physicians in a variety inpatient settings. This review will provide an update for hospitalists based on many important studies that have been published since the last review of this topic in this journal.[15] The expanding evidence base in sepsis includes early goal‐directed therapy (EGDT), clinical endpoints, and bundles of care for sepsis; antibiotics (choice and timing); volume resuscitation; ICU considerations, including the use of insulin and corticosteroids; and mortality, complications, and the advent of the condition of sepsis survivorship.
EARLY GOAL‐DIRECTED THERAPY
A 2001 prospective, randomized trial of EGDT initiated in the emergency department (ED) for patients with severe sepsis and septic shock resulted in an impressive 16% reduction of in‐hospital mortality compared to standard therapy.[16] The intervention protocol included central venous catheter placement and a 500‐mL bolus of crystalloid every 30 minutes to establish a central venous pressure (CVP) of 8 to 12 mm Hg. Vasopressors were used to maintain a mean arterial pressure (MAP) greater than 65 mm Hg, and patients with a MAP greater than 90 mm Hg were given vasodilators. Patients with a central venous oxygen saturation (Scv02) of less than 70% received red blood cell transfusion with a goal hematocrit of 30%. If central venous oxygen saturation remained less than 70% despite these interventions, dobutamine was used for inotropic effect until this goal was achieved or was limited by tachycardia or hypotension.[16]
These results prompted inclusion of the specific hemodynamic targets (CVP, MAP, and Scv02) into the original 2004 Surviving Sepsis Campaign guidelines and spurred a decade of interest worldwide.[17] The incremental importance of these individual components in managing severe sepsis and septic shock has since come under scrutiny. A recent randomized trial suggested that EGDT guided by venous lactate clearance of >10% was noninferior to the goal Scv02 of >70%. However, only 10% of the study population required transfusion or dobutamine.[18, 19] Prospective ICU data on lactate‐guided therapy[20] supported the revised 2012 Surviving Sepsis Campaign (SSC) guidelines to recommend lactate normalization as part of initial resuscitation efforts, particularly when Scv02 is not available.[21] Lactate measurement may assist in recognition of cases of severe sepsis or septic shock and provide valuable triage information, as serum lactate has been shown to predict mortality from severe sepsis independent of shock or organ failure.[22] In a retrospective study of patients presenting to the ED with sepsis, a lactate >4 mmol/L was associated with progression to septic shock within 4 to 48 hours.[23]
Our understanding of the specific benefits of EGDT is far from complete, as 3 recent large prospective, multicenter, randomized trials ProCESS (Protocolized Care for Early Septic Shock), ARISE (Australasian Resuscitation In Sepsis Evaluation), and ProMISe (Protocolised Management in Sepsis) did not show EGDT protocols to be superior to usual care.[24, 25, 26] Interpreted collectively, the benefit of EGDT may not be from targeting specific physiologic parameters, but rather from the early recognition of sepsis and the appropriate use of well‐supported interventions like aggressive fluid resuscitation and early/efficacious antibiotics.[27]
Although the precise benefit of EGDT as a package versus its individual components remains in question, we have a decade of experience in delivering this care as an integral component of the bundles put forth in the SSC guidelines.[28] Observational and retrospective studies have shown increased compliance with guidelines and improved mortality after implementing these protocols, although early bundles for severe sepsis included therapies that have subsequently been called into question on an individual basis like drotrecogin alfa (activated) and glucocorticoid therapy.[29, 30, 31] The mortality benefit from sepsis bundles deserves further explanation, although education and early recognition are likely contributory.[32]
Several studies evaluated individual components of EGDT. The TRISS (Transfusion Requirements in Septic Shock) trial randomized ICU patients with septic shock to 2 different red blood cell transfusion strategies, and found no mortality benefit or reduction in ischemic events for patients transfused at a hemoglobin of 9 g/dL compared to the 7 g/dL threshold.[33] The SEPSISPAM (Assessment of Two Levels of Arterial Pressure on Survival in Patients With Septic Shock) trial compared the MAP goal of 65 to 70 mm Hg to 80 to 85 mm Hg for patients with septic shock in a randomized, multicenter trial.[34] Although there was no difference in 28‐day mortality, more atrial fibrillation was diagnosed in the higher target group. For patients with chronic hypertension, targeting the higher MAP led to less renal injury and reduced the need for renal‐replacement therapy.[34, 35] Identifying specific subsets of patients with sepsis who benefit most from particular therapies should help clinicians set patient‐specific goals and targets.
Although we can expect additional studies to provide further guidance, it is reasonable at present to adhere to protocols designed to improve timely sepsis detection and management with aggressive volume resuscitation, early/efficacious antibiotic administration, and effective infection source control.
ANTIBIOTICS AND SOURCE CONTROL
Administration of broad‐spectrum antibiotics has long been the cornerstone of sepsis management. Timely antibiotic infusion is an integral part of the 2004 and 2012 SSC guidelines,[17, 21] with the caveat that blood cultures should be obtained prior to antibiotic therapy provided that no significant delay (>45 minutes) occurs.[21] Recent studies have begun to address fundamental clinical questions, including the timing of antibiotic administration and the efficacy of empiric antibiotic choice. A landmark retrospective cohort study of ICU patients with septic shock demonstrated survival to hospital discharge was highest in patients who received antibiotics within the first hour of hypotension.[36] Survival decreased on average by 7.6% with each hour that antibiotics were delayed. Only 50% of patients with septic shock in this study received effective antibiotic therapy within 6 hours of documented hypotension.[36] A subsequent retrospective, single‐center cohort study of ED patients with severe sepsis or septic shock undergoing EGDT showed a mortality benefit when antibiotics were administered within the first hour. However, it did not demonstrate a statistically significant decline in survival on an hourly basis thereafter.[37]
A prospective, multicenter ED trial that included patients with severe sepsis in addition to septic shock[38] did not show a mortality benefit to administration of antibiotics within the first hour. In‐hospital mortality risk for patients undergoing EGDT was similar across patients in whom time to antibiotics was delayed up to 6 hours after triage.[36, 38] However, patients with severe sepsis in whom antibiotics were delayed until shock was recognized faced a statistically significant increased risk of death (odds ratio = 2.35; 95% confidence interval = 1.12‐4.53).[38, 39] A retrospective study of 28,150 patients from the SSC database demonstrated a statistically significant increase in mortality for each hour that empiric antibiotics were delayed.[40] Importantly, this trend was preserved regardless of location of sepsis diagnosis (ED, ICU, and hospital ward) and across illness severity. Though there remains debate about the critical importance of the golden hour for antibiotic administration, overall current evidence supports early empiric antibiotics in severe sepsis and septic shock.
Choosing an empiric antibiotic regimen, based on infection source and host factors, also plays a key role in sepsis outcomes. A retrospective study of patients with septic shock from 1996 to 2005 showed that inappropriate initial antibiotics (based on eventual in vitro culture sensitivities or evaluation of clinical syndrome) were used 20% of the time and resulted in a 5‐fold reduction in survival.[41] A retrospective cohort study of patients with gram‐negative bacteremia and severe sepsis or septic shock found prior antibiotic exposure within 90 days to be an independent risk factor for drug resistance and in‐hospital mortality.[42] However, careful consideration of side effects should also influence choice of initial antibiotic therapy. A Cochrane review citing 69 trials and containing 7863 subjects with sepsis compared empiric ‐lactam therapy to ‐lactamaminoglycoside combination therapy.[43] All‐cause mortality and clinical failure was similar in both groups, as was the rate of resistance. Importantly, nephrotoxicity was significantly less in the ‐lactam monotherapy group.[43]
Infection source control is an essential component of sepsis management that should occur simultaneously with antibiotic administration. The 2012 SSC guidelines promote infection source control within 12 hours of diagnosis, with consideration of the risks and benefits therein and preference for interventions with the lowest associated physiologic insult.[21] Intravascular access devices should be recognized as a common source of infection, and should be removed after alternative access has been established.[21]
FLUID RESUSCITATION
Volume resuscitation is an essential component of sepsis management, regardless of algorithm or endpoint. Three main types of nonblood product fluid resuscitation have been used: crystalloid (saline and Ringer's solutions), colloid (typically an albumin‐containing solution), and synthetic volume expanders (hydroxyethyl starch [HES] and similar compounds).
Multiple large studies confirmed the lack of a favorable riskbenefit ratio with synthetic volume expanders. Among nearly 800 patients with severe sepsis who were randomized to receive either Ringer's acetate or HES 130/0.4, a significantly higher number of patients receiving HES died (51% vs 43%, relative risk [RR] = 1.17), and required renal‐replacement therapy (22% vs 16%, RR = 1.35). One patient in each group was dialysis dependent at 90 days.[44] An additional multicenter, prospective study of HES versus 0.9% (normal) saline for fluid resuscitation in the ICU found no significant difference in mortality (18% vs 17%, P = 0.26), but did note a higher need for renal‐replacement therapy in the HES group (7.0% vs 5.8%, RR = 1.21).[45] A systematic review incorporating 9 trials that randomized approximately 3400 patients with sepsis receiving either HES, crystalloid, or colloid showed no difference in mortality, although there was an excess risk for renal‐replacement therapy (RR = 1.36), serious adverse events (RR = 1.30), and red blood cell transfusion (RR = 1.29) in patients receiving HES.[46] A second, larger systematic review concluded that HES was associated with an increased mortality compared with crystalloids, albumin, or gelatin (RR = 1.09). Additionally, an increase in renal failure (RR = 1.27) and renal‐replacement therapy (RR = 1.32) was also noted.[47]
The debate between crystalloid and colloid (namely albumin) for fluid resuscitation is ongoing, with recent important additions to the literature. The SAFE (Saline Versus Albumin Fluid Evaluation) study investigators in 2004 randomized nearly 7000 patients to receive either 4% albumin solution or normal saline. At 28 days, no significant differences were found in mortality, new organ failure, ICU and hospital length of stay, days of mechanical ventilation, or days of renal‐replacement therapy.[48] In 2014, another multicenter prospective study of 1800 patients with severe sepsis or septic shock in 100 ICUs in Italy compared 20% albumin and crystalloid solution to crystalloid solution alone. Mortality, end‐organ dysfunction, and ICU length of stay did not differ between groups.[49] Two 2014 systematic reviews and meta‐analyses on fluid resuscitation produced somewhat differing conclusions. Patel et al. evaluated data from 16 randomized trials including more than 4000 patients receiving albumin for volume resuscitation in adults with sepsis. Albumin provided no significant survival advantage in total or in any subgroup, regardless of severity of illness or baseline albumin level, thus arguing against its routine use.[50] Rochwerg et al. evaluated 14 studies with approximately 19,000 patients using Bayesian network meta‐analysis technique. This study concluded that albumin is associated with reduced mortality compared with other fluids, and also that balanced crystalloids (eg, Ringer's lactate and similar) may have lower mortality than normal saline.[51] A chloride‐restrictive resuscitation approach has also been associated with a lower incidence of acute kidney injury in critically ill adults.[52]
The SSC confirmed its recommendations of a minimum of 30 mL/kg of crystalloids as the initial fluid of choice in sepsis in 2012, but added a suggestion for the addition of albumin in patients requiring substantial amounts of crystalloid.[21] The currently available data suggest crystalloid fluids to be the best‐supported initial fluid in the management of sepsis, and that synthetic colloids should be avoided. Prospective data are still required to answer questions regarding the potential advantages of albumin or balanced and/or chloride‐restricted crystalloids.
ICU CONSIDERATIONS
Appropriate management of patients with the syndrome of sepsis, severe sepsis, and septic shock on the hospital ward requires a working knowledge of recent research conducted in the ICU setting. Although conclusions based on data from patients with septic shock might not be generalizable to less severe cases of sepsis, recent trials on glucose control and corticosteroids deserve consideration.
Intensive insulin treatment in the medical ICU is no longer standard practice. In the NICE‐SUGAR (Normoglycaemia in Intensive Care Evaluation and Survival Using Glucose Algorithm Regulation) trial, a large, multicenter randomized controlled trial of ICU patients, close to 20% of patients had severe sepsis at the time of randomization.[53] This subgroup did not benefit from intensive glucose control (a target of 81108 mg/dL) in terms of 90‐day mortality.[53] In contrast to prior studies of glycemic control in the critically ill, the intensive treatment group overall suffered increased mortality.[54] The COIITSS (Combination of Corticotherapy and Intensive Insulin Therapy for Septic Shock) trial looked at intensive insulin therapy in patients with septic shock being treated with corticosteroids, a group particularly at risk for hyperglycemia. In this study, intensive insulin therapy did not improve in‐hospital mortality.[55] Based on these and other ICU data, the current SSC recommendation is to target a blood glucose of 180 mg/dL for patients with severe sepsis.[21, 56]
The use of corticosteroids to treat the host response in septic shock has been re‐evaluated.[57] The 2004 SSC guidelines recommended hydrocortisone therapy for 7 days in patients with septic shock requiring vasopressor support after fluid resuscitation.[17] This recommendation was based on data from a placebo‐controlled multicenter trial in France that showed improved shock reversal and reduced mortality in patients with septic shock who were treated with hydrocortisone and fludricortisone.[58] Of note, these patients were enrolled on the basis of hypotension despite intravenous fluids and the initiation of 1 vasopressor. The benefit of corticosteroids was seen only in patients deemed to have relative adrenal insufficiency based on response corticotropin testing.[58] However, the CORTICUS (Corticosteroid Therapy of Septic Shock) study, a subsequent multicenter, placebo‐controlled, randomized controlled trial failed to show a benefit to corticotropin testing in identifying patients with septic shock who would benefit from corticorsteroids.[59] The corticosteroid treatment arm similarly benefited from faster shock reversal, but at the expense of increased superinfection.[59] Although underpowered, CORTICUS did not show a survival benefit to corticosteroids in septic shock.[59] The most recent SSC guidelines do not recommend corticotropin (adrenocorticotropic hormone) stimulation testing and do not advise corticosteroids in septic shock if fluid resuscitation and vasopressor therapy restore hemodynamic stability during initial resuscitation.[21] Future studies may clarify subpopulations of patients with sepsis who benefit from corticosteroids.
OUTCOMES: MORTALITY AND COMPLICATIONS
An understanding of the currently available information regarding the morbidity and mortality associated with severe sepsis is essential for the practicing hospitalist. Whether transferring care of patients to or receiving patients from the ICU, hospitalists must lead discussions with patients and families regarding prognosis, especially as it informs disposition. Hospitalists are often asked to make projections on outcome as well as the timing and venue of disposition. Clarification of patient wishes and goals of care remains an essential first step in the care of septic patients. Recently published studies provide prognostic information, including mortality (both short and long term) as well as complications associated with severe sepsis.
The attributable mortality for severe sepsis has been predominantly reported to date as short‐term (usually in‐hospital). A meta‐analysis of US patients from 1991 to 2009 demonstrated a 3% annual decline in the short‐term (28 day) mortality from severe sepsis using 2 previously validated algorithms. Data from 36 trials (and approximately 14,000 patients) revealed a decrease in mortality from 47% in the period from 1991 to 1995 to 29% from 2006 to 2009.[60] Although the methods employed (sepsis definitions and ICD‐9‐CM codes) can have a significant impact on estimates of mortality, these results corroborate a progressive decline in short‐term mortality from severe sepsis in the United States between 2004 and 2009 using 4 validated algorithms.[8] Outside the United States, a recent retrospective analysis of more than 1 million patients with severe sepsis treated in the ICU in Australia and New Zealand from 2000 to 2012 also demonstrated a decrease in adjusted in‐hospital mortality. In this study, short‐term mortality declined yearly, with an odds ratio of death of 0.49 in 2012 compared with 2000.[61] Hospital case volume has also been shown to impact rates of inpatient death, with higher‐volume centers demonstrating lower mortality attributed to severe sepsis.[62, 63]
The sufficiency of short‐term mortality as the sole metric for severe sepsis outcome has been more recently questioned.[64, 65] The extent to which full recovery and significant morbidity are affected relative to the change in death rate is unknown, and as such, more data on morbidity and longer‐term mortality are necessary. A Danish study examined data from several registries of patients with severe sepsis. Compared with community‐matched controls, patients with severe sepsis had an increased risk of death at 30 days (hazard ratio [HR] = 90.8), from 30 days to 1 year (HR = 2.7), and 1 to 4 years (HR = 2.3) after discharge.[66] Older survivors of severe sepsis also appear to have higher healthcare utilization in the year following discharge. An analysis of older severe sepsis survivors showed a striking increase in healthcare use relative to their prior resource use, driven primarily by higher number of days in inpatient healthcare facilities. Survivors of severe sepsis also had a significantly higher 90‐day and 1‐year mortality than matched controls.[67]
Increased attention is currently being given to sepsis‐related complications, especially functional and cognitive impairments in older patients. Sepsis survivorship is a swiftly mounting public health issue for older Americans.[68] An 8‐year follow‐up of older sepsis survivors demonstrated a significant increase in the odds of both physical and cognitive dysfunction. During this period, moderate‐to‐severe cognitive dysfunction increased 3‐fold (6.1% before sepsis, 16.7% after).[69] The mechanism by which this dysfunction occurs is unknown, as are the relative contributions of infection site/etiology, ICU length of stay, and extent of organ dysfunction. New functional impairment has been demonstrated in patients with severe sepsis initially admitted to a general floor, even with good baseline function,[12] as well as decreased quality of life in sepsis survivors.[65, 70] Another study showed more admissions complicated by severe sepsis resulted in discharge to a long‐term care facility in 2007 compared to 2000.[7]
Additional organ‐specific consequences of severe sepsis have also been recently suggested. A retrospective analysis showed an increase in the incidence of new‐onset atrial fibrillation in severe sepsis, with an associated increase in risk of in‐hospital stroke and death. New‐onset atrial fibrillation was present in 5.9% of patients with severe sepsis, compared with 0.65% in patients without. Severe sepsis patients with new‐onset atrial fibrillation had an increased risk of in‐hospital stroke (adjusted odds ratio = 2.70) and mortality (adjusted RR = 1.07).[71] These findings suggest association only, and further investigation is warranted. It remains to be seen whether interventions to restore sinus rhythm or anticoagulation are warranted. Preoperative sepsis (within 48 hours) has also been proposed as a risk for postoperative (30 day) arterial (myocardial infarction, stroke) and venous (deep venous thrombosis, pulmonary embolism) thromboembolism. The authors of this study suggest deferral of elective surgery or specific attention to postoperative thromboprophylaxis in patients in whom procedures must occur.[72] This has particular relevance for those septic patients in whom surgical source control is indicated.
Estimates regarding mortality and specific complications attributable to severe sepsis are ongoing, though clearly with a new focus upon metrics other than short‐term mortality. Furthermore, recent data to suggest source of infection as a major driver of mortality in septic shock[73] may contribute to the evolution of the conceptualization of sepsis similar to that of cancer: a heterogeneous collection of disease, among which mortality is determined by specific subtypes. At present, this much appears clear: the previously held notion that survival of a septic insult is unlikely to have future implications is under siege.[74] The extent to which complications and increased longer‐term mortality may reflect generally poorer health at the time of infection versus a sequelae of the survived episode itself is not yet known.
CONCLUSIONS
The past decade of sepsis research has led to significant findings that will change clinical practice for hospital medicine practitioners. Although the incidence of severe sepsis in the United States has continued to rise, in‐hospital mortality has declined; in this context, the management of the spectrum of sepsis disorders is no longer restricted to the ICU, and the entity of sepsis survivorship has blossomed. Prompt recognition of sepsis and improvements in supportive care are likely responsible for improved patient outcomes. EGDT has been called into question as a protocol whose benefit lies not in specific targets or endpoints, but rather in the early recognition of sepsis, appropriate fluid resuscitation, and early/effective antibiotics. Synthetic volume expanders, intensive insulin therapy, and routine use of corticosteroids are no longer recommended.
Hospitalists are a critical link in providing timely, evidence‐based care for patients with sepsis from initial recognition to post‐ICU recovery. Specialized care for the survivors of septic shock is a burgeoning area, and hospitalists are integral in the management of the sequelae of multiorgan failure.
Disclosure: Nothing to report.
- , . Severe sepsis and septic shock. N Engl J Med. 2013;369(9):840–851.
- , , , et al. Definitions for sepsis and organ failure and guidelines for the use of innovative therapies in sepsis. The ACCP/SCCM Consensus Conference Committee. American College of Chest Physicians/Society of Critical Care Medicine. Chest. 1992;101(6):1644–1655.
- , , , et al.; SCCM/ESICM/ACCP/ATS/SIS. 2001 SCCM/ESICM/ACCP/ATS/SIS International Sepsis Definitions Conference. Crit Care Med. 2003;31(4):1250–1256.
- , , , , . Systemic inflammatory response syndrome criteria in defining severe sepsis. N Engl J Med. 2015;372(17):1629–1638.
- , , , . The epidemiology of sepsis in the United States from 1979 through 2000. N Engl J Med. 2003;348(16):1546–1554.
- , , , . Inpatient care for septicemia or sepsis: A challenge for patients and hospitals. NCHS data brief, no 62. Hyattsville, MD: National Center for Health Statistics. 2011.
- , , , et al.; Milwaukee Initiative in Critical Care Outcomes Research Group of Investigators. Nationwide trends of severe sepsis in the 21st century (2000–2007). Chest. 2011;140(5):1223–1231.
- , , , . Benchmarking the incidence and mortality of severe sepsis in the united states. Crit Care Med. 2013;41(5):1167–1174.
- , , , , , . Hospitalizations, costs, and outcomes of severe sepsis in the United States 2003 to 2007. Crit Care Med. 2012;40(3):754–761.
- , . National inpatient hospital costs: the most expensive conditions by payer, 2011. HCUP statistical brief #160. Rockville, MD: Agency for Healthcare Research and Quality, 2013. Available at: http://www.hcup‐us.ahrq.gov/reports/statbriefs/sb160.pdf. Accessed March 15, 2015.
- , , , et al. Sepsis incidence and outcome: contrasting the intensive care unit with the hospital ward. Crit Care Med. 2007;35(5):1284–1289.
- , , , et al. Functional outcomes of general medical patients with severe sepsis. BMC Infect Dis. 2013;13:588.
- , , , et al. The epidemiology of acute organ system dysfunction from severe sepsis outside of the intensive care unit. J Hosp Med. 2013;8(5):243–247.
- , , , , , . Sepsis in general surgery: the 2005–2007 national surgical quality improvement program perspective. Arch Surg. 2010;145(7):695–700.
- . Evidence‐based sepsis therapy: a hospitalist perspective. J Hosp Med. 2006;1(5):285–295.
- , , , et al. Early goal‐directed therapy in the treatment of severe sepsis and septic shock. N Engl J Med. 2001;345(19):1368–1377.
- , , , et al. Surviving sepsis campaign guidelines for management of severe sepsis and septic shock. Crit Care Med. 2004;32(3):858–873.
- , , , et al. Lactate clearance vs central venous oxygen saturation as goals of early sepsis therapy: a randomized clinical trial. JAMA. 2010;303(8):739–746.
- . Disassembling goal‐directed therapy for sepsis: a first step. JAMA. 2010;303(8):777–779.
- , , , et al. Early lactate‐guided therapy in intensive care unit patients: a multicenter, open‐label, randomized controlled trial. Am J Respir Crit Care Med. 2010;182(6):752–761.
- , , , et al. Surviving sepsis campaign: International guidelines for management of severe sepsis and septic shock: 2012. Crit Care Med. 2013;41(2):580–637.
- , , , et al. Serum lactate is associated with mortality in severe sepsis independent of organ failure and shock. Crit Care Med. 2009;37(5):1670–1677.
- , , , et al. Predictors of patients who present to the emergency department with sepsis and progress to septic shock between 4 and 48 hours of emergency department arrival. Crit Care Med. 2015;43(5):983–988.
- ARISE Investigators; ANZICS Clinical Trials Group, , , , et al. Goal‐directed resuscitation for patients with early septic shock. N Engl J Med. 2014;371(16):1496–1506.
- ProCESS Investigators, , , , et al. A randomized trial of protocol‐based care for early septic shock. N Engl J Med. 2014;370(18):1683–1693.
- , , , et al.; ProMISe Trial Investigators. Trial of early, goal‐directed resuscitation for septic shock. N Engl J Med. 2015;372(14):1301–1311.
- . The ProCESS trial—a new era of sepsis management. N Engl J Med. 2014;370(18):1750–1751.
- , . The role of bundles in sepsis care. Crit Care Clin. 2006;22(3):521–529, x.
- , , , et al. The surviving sepsis campaign: results of an international guideline‐based performance improvement program targeting severe sepsis. Crit Care Med. 2010;38(2):367–374.
- , , , et al. Multicenter implementation of a severe sepsis and septic shock treatment bundle. Am J Respir Crit Care Med. 2013;188(1):77–82.
- , , , et al. The GENESIS project (Generalized early sepsis intervention strategies): a multicenter quality improvement collaborative. J Intensive Care Med. 2013;28(6):355–368.
- , . Early recognition and treatment of severe sepsis. Am J Respir Crit Care Med. 2013;188(1):7–8.
- , , , et al. Lower versus higher hemoglobin threshold for transfusion in septic shock. N Engl J Med. 2014;371(15):1381–1391.
- , , , et al. High versus low blood‐pressure target in patients with septic shock. N Engl J Med. 2014;370(17):1583–1593.
- . Is there a good MAP for septic shock? N Engl J Med. 2014;370(17):1649–1651.
- , , , et al. Duration of hypotension before initiation of effective antimicrobial therapy is the critical determinant of survival in human septic shock. Crit Care Med. 2006;34(6):1589–1596.
- , , , et al. Impact of time to antibiotics on survival in patients with severe sepsis or septic shock in whom early goal‐directed therapy was initiated in the emergency department. Crit Care Med. 2010;38(4):1045–1053.
- , , , et al. Association between timing of antibiotic administration and mortality from septic shock in patients treated with a quantitative resuscitation protocol. Crit Care Med. 2011;39(9):2066–2071.
- , . Antibiotics in sepsis: timing, appropriateness, and (of course) timely recognition of appropriateness. Crit Care Med. 2011;39(9):2184–2186.
- , , , et al. Empiric antibiotic treatment reduces mortality in severe sepsis and septic shock from the first hour: results from a guideline‐based performance improvement program. Crit Care Med. 2014;42(8):1749–1755.
- , , , et al. Initiation of inappropriate antimicrobial therapy results in a fivefold reduction of survival in human septic shock. Chest. 2009;136(5):1237–1248.
- , , , , , . Impact of previous antibiotic therapy on outcome of gram‐negative severe sepsis. Crit Care Med. 2011;39(8):1859–1865.
- , , , . Beta lactam antibiotic monotherapy versus beta lactam‐aminoglycoside antibiotic combination therapy for sepsis. Cochrane Database Syst Rev. 2014;1:CD003344.
- , , , et al. Hydroxyethyl starch 130/0.42 versus ringer's acetate in severe sepsis. N Engl J Med. 2012;367(2):124–134.
- , , , et al.; CHEST Investigators; Australian and New Zealand Intensive Care Society Clinical Trials Group. Hydroxyethyl starch or saline for fluid resuscitation in intensive care. N Engl J Med. 2012;367(20):1901–1911.
- , , , et al. Hydroxyethyl starch 130/0.38–0.45 versus crystalloid or albumin in patients with sepsis: systematic review with meta‐analysis and trial sequential analysis. BMJ. 2013;346:f839.
- , , , et al. Association of hydroxyethyl starch administration with mortality and acute kidney injury in critically ill patients requiring volume resuscitation: a systematic review and meta‐analysis. JAMA. 2013;309(7):678–688.
- , , , , , ; SAFE Study Investigators. A comparison of albumin and saline for fluid resuscitation in the intensive care unit. N Engl J Med. 2004;350(22):2247–2256.
- , , , et al. Albumin replacement in patients with severe sepsis or septic shock. N Engl J Med. 2014;370(15):1412–1421.
- , , , . Randomised trials of human albumin for adults with sepsis: systematic review and meta‐analysis with trial sequential analysis of all‐cause mortality. BMJ. 2014;349:g4561.
- , , , et al. Fluid resuscitation in sepsis: a systematic review and network meta‐analysis. Ann Intern Med. 2014;161(5):347–355.
- , , , , , . Association between a chloride‐liberal vs chloride‐restrictive intravenous fluid administration strategy and kidney injury in critically ill adults. JAMA. 2012;308(15):1566–1572.
- NICE‐SUGAR Study Investigators, , , , et al. Intensive versus conventional glucose control in critically ill patients. N Engl J Med. 2009;360(13):1283–1297.
- , . Glucose control in the ICU—how tight is too tight? N Engl J Med. 2009;360(13):1346–1349.
- COIITSS Study Investigators, , , , et al. Corticosteroid treatment and intensive insulin therapy for septic shock in adults: a randomized controlled trial. JAMA. 2010;303(4):341–348.
- , , , et al. Intensive insulin therapy and mortality among critically ill patients: a meta‐analysis including NICE‐SUGAR study data. CMAJ. 2009;180(8):821–827.
- , , , et al. Corticosteroids in the treatment of severe sepsis and septic shock in adults: a systematic review. JAMA. 2009;301(22):2362–2375.
- , , , et al. Effect of treatment with low doses of hydrocortisone and fludrocortisone on mortality in patients with septic shock. JAMA. 2002;288(7):862–871.
- , , , et al. Hydrocortisone therapy for patients with septic shock. N Engl J Med. 2008;358(2):111–124.
- , , , , . Two decades of mortality trends among patients with severe sepsis: a comparative meta‐analysis. Crit Care Med. 2014;42(3):625–631.
- , , , , . Mortality related to severe sepsis and septic shock among critically ill patients in Australia and New Zealand, 2000–2012. JAMA. 2014;311(13):1308–1316.
- , , , , , . The relationship between hospital volume and mortality in severe sepsis. Am J Respir Crit Care Med. 2014;190(6):665–674.
- , . Hospital case volume and outcomes among patients hospitalized with severe sepsis. Am J Respir Crit Care Med. 2014;189(5):548–555.
- , . Declining case fatality rates for severe sepsis: Good data bring good news with ambiguous implications. JAMA. 2014;311(13):1295–1297.
- , , , , , . Long‐term mortality and quality of life in sepsis: a systematic review. Crit Care Med. 2010;38(5):1276–1283.
- , , , , , . Short‐ and long‐term mortality in patients with community‐acquired severe sepsis and septic shock. Scand J Infect Dis. 2013;45(8):577–583.
- , , , , . Increased 1‐year healthcare use in survivors of severe sepsis. Am J Respir Crit Care Med. 2014;190(1):62–69.
- , , , . Population burden of long‐term survivorship after severe sepsis in older Americans. J Am Geriatr Soc. 2012;60(6):1070–1077.
- , , , . Long‐term cognitive impairment and functional disability among survivors of severe sepsis. JAMA. 2010;304(16):1787–1794.
- , , , , ; Finnsepsis Study Group. Long‐term outcome and quality‐adjusted life years after severe sepsis. Crit Care Med. 2009;37(4):1268–1274.
- , , , , . Incident stroke and mortality associated with new‐onset atrial fibrillation in patients hospitalized with severe sepsis. JAMA. 2011;306(20):2248–2254.
- , , , . Impact of sepsis on risk of postoperative arterial and venous thromboses: large prospective cohort study. BMJ. 2014;349:g5334.
- , , , , , ; Co‐operative Antimicrobial Therapy of Septic Shock Database Research Group. Association between source of infection and hospital mortality in patients who have septic shock. Am J Respir Crit Care Med. 2014;189(10):1204–1213.
- . The lingering consequences of sepsis: a hidden public health disaster? JAMA. 2010;304(16):1833–1834.
Sepsis is one of the oldest and most elusive syndromes in medicine, and remains a significant contributor to morbidity, mortality, and healthcare expenditure.[1] A 1992 American College of Chest Physicians and Society of Critical Care Medicine consensus conference statement introduced the systemic inflammatory response syndrome (SIRS) into the medical lexicon, along with definitions of sepsis, severe sepsis, and septic shock.[2] A 2003 consensus panel expanded the list of signs and symptoms associated with sepsis, and warned that the findings of SIRS do not differentiate sepsis from other noninfectious conditions.[3] The terminology is important, as these definitions resulted in a shift of the label of the syndrome of infection complicated by end‐organ dysfunction from sepsis to severe sepsis or septic shock. Overlap of these terms has implications for categorizing such infections for the purpose of investigation, estimating epidemiology and outcome, and coding, billing, and reimbursement.[1]
Traditional definitions of the spectrum of sepsis disorders are outlined in Table 1,[2, 3] and it is important to note that an update to these definitions is anticipated in the near future. A recent publication has called into question the sensitivity and categorical requirement of at least 2 SIRS criteria to define severe sepsis.[4] This study of more than 1 million patients from 172 intensive care units (ICUs) in Australia and New Zealand from 2000 to 2013 found that the cutoff of 2 SIRS criteria to define severe sepsis excluded 1 in 8 patients with infection and end‐organ hypoperfusion. SIRS‐negative severe sepsis patients experienced the same mortality as SIRS‐positive patients. In addition, adjusted analysis determined a stepwise increase in mortality risk associated with each additional SIRS criterion without a transition point in risk noted at 2.[4]
| Definition | |
|---|---|
| |
| SIRS | The systemic inflammatory response to a variety of severe insults. Requires 2 of the following: |
| Temperature >38C or <36C | |
| Heart rate >90 beats/minute | |
| Respiratory rate >20 breaths/minute or partial pressure of carbon dioxide (PaCO2) <32 mm Hg | |
| White blood cell count >12,000 or <4,000 cells/L or 10% immature (band) forms | |
| Sepsis | The systemic response to infection, with SIRS criteria met in the setting of documented or strongly suspected infection |
| Severe sepsis | Sepsis associated with organ dysfunction, hypoperfusion (including but not limited to lactic acidosis, oliguria, or acute alteration in mental status), or hypotension (systolic blood pressure <90 mm Hg or >40 mm Hg below baseline). |
| Septic shock | Sepsis‐induced hypotension despite adequate volume resuscitation (2030 mL/kg) with perfusion abnormalities including but not limited to lactic acidosis, oliguria, or acute alteration in mental status |
From 1979 through 2000, there were over 10 million reported cases of sepsis, which accounted for 1.3% of all hospitalizations in the United States.[5] Normalized to the population distribution of the 2000 US Census, there was an annualized increase in sepsis cases of 8.7%. A 2011 report revealed rates of hospitalization for patients with septicemia or sepsis in the United States more than doubled from 2000 through 2008.[6] Patients with sepsis experienced longer length of stay than other inpatients and were 8 times more likely to die during hospitalization.[6] Estimates of severe sepsis incidence are complicated by how acute organ dysfunction is defined and whether it is related to infection. As of 2001, the number of severe sepsis cases in the United States was believed to exceed 750,000 and comprise approximately 10% of ICU admissions.[1] The incidence of severe sepsis cases in the United States continues to rise.[7, 8, 9] However, a more than doubling of the use of sepsis International Classification of Diseases, Ninth Revision, Clinical Modification (ICD‐9‐CM) codes from 2004 through 2009 has also been noted.[8] Based on ICD‐9‐CM codes indicating the presence of sepsis and organ system failure, the number of severe sepsis hospitalizations per 100,000 persons in the United States increased from 143 in 2000 to 343 in 2007.[7] Total hospital costs for patients with severe sepsis were estimated to increase 57%, from $15.4 billion in 2003 to $24.3 billion in 2007.[9] The Agency for Healthcare Research and Quality considered septicemia the most expensive medical condition in the United States in a 2011 data brief, with annual aggregate hospital costs exceeding $20 billion.[10]
Although many hospitalists care for patients in the ICU and other higher acuity or step‐down units, a significant proportion of patients with severe sepsis receive care on a general medical floor.[11, 12, 13] Sepsis is also clearly not an issue restricted to patients on internal medicine services. Of over 360,000 general surgery patients from 2005 to 2007, the incidences of sepsis (2.3%) and septic shock (1.6%) greatly exceeded those of pulmonary embolism (0.3%) and myocardial infarction (0.2%). In this cohort, the need for emergency surgery and the presence of any comorbidity increased the number of sepsis cases.[14]
Despite difficulties obtaining exact estimates of case numbers, the following appears true: the spectrum of sepsis disorders (including severe sepsis and septic shock) remains a common, costly, and increasing clinical entity that is encountered by hospital medicine physicians in a variety inpatient settings. This review will provide an update for hospitalists based on many important studies that have been published since the last review of this topic in this journal.[15] The expanding evidence base in sepsis includes early goal‐directed therapy (EGDT), clinical endpoints, and bundles of care for sepsis; antibiotics (choice and timing); volume resuscitation; ICU considerations, including the use of insulin and corticosteroids; and mortality, complications, and the advent of the condition of sepsis survivorship.
EARLY GOAL‐DIRECTED THERAPY
A 2001 prospective, randomized trial of EGDT initiated in the emergency department (ED) for patients with severe sepsis and septic shock resulted in an impressive 16% reduction of in‐hospital mortality compared to standard therapy.[16] The intervention protocol included central venous catheter placement and a 500‐mL bolus of crystalloid every 30 minutes to establish a central venous pressure (CVP) of 8 to 12 mm Hg. Vasopressors were used to maintain a mean arterial pressure (MAP) greater than 65 mm Hg, and patients with a MAP greater than 90 mm Hg were given vasodilators. Patients with a central venous oxygen saturation (Scv02) of less than 70% received red blood cell transfusion with a goal hematocrit of 30%. If central venous oxygen saturation remained less than 70% despite these interventions, dobutamine was used for inotropic effect until this goal was achieved or was limited by tachycardia or hypotension.[16]
These results prompted inclusion of the specific hemodynamic targets (CVP, MAP, and Scv02) into the original 2004 Surviving Sepsis Campaign guidelines and spurred a decade of interest worldwide.[17] The incremental importance of these individual components in managing severe sepsis and septic shock has since come under scrutiny. A recent randomized trial suggested that EGDT guided by venous lactate clearance of >10% was noninferior to the goal Scv02 of >70%. However, only 10% of the study population required transfusion or dobutamine.[18, 19] Prospective ICU data on lactate‐guided therapy[20] supported the revised 2012 Surviving Sepsis Campaign (SSC) guidelines to recommend lactate normalization as part of initial resuscitation efforts, particularly when Scv02 is not available.[21] Lactate measurement may assist in recognition of cases of severe sepsis or septic shock and provide valuable triage information, as serum lactate has been shown to predict mortality from severe sepsis independent of shock or organ failure.[22] In a retrospective study of patients presenting to the ED with sepsis, a lactate >4 mmol/L was associated with progression to septic shock within 4 to 48 hours.[23]
Our understanding of the specific benefits of EGDT is far from complete, as 3 recent large prospective, multicenter, randomized trials ProCESS (Protocolized Care for Early Septic Shock), ARISE (Australasian Resuscitation In Sepsis Evaluation), and ProMISe (Protocolised Management in Sepsis) did not show EGDT protocols to be superior to usual care.[24, 25, 26] Interpreted collectively, the benefit of EGDT may not be from targeting specific physiologic parameters, but rather from the early recognition of sepsis and the appropriate use of well‐supported interventions like aggressive fluid resuscitation and early/efficacious antibiotics.[27]
Although the precise benefit of EGDT as a package versus its individual components remains in question, we have a decade of experience in delivering this care as an integral component of the bundles put forth in the SSC guidelines.[28] Observational and retrospective studies have shown increased compliance with guidelines and improved mortality after implementing these protocols, although early bundles for severe sepsis included therapies that have subsequently been called into question on an individual basis like drotrecogin alfa (activated) and glucocorticoid therapy.[29, 30, 31] The mortality benefit from sepsis bundles deserves further explanation, although education and early recognition are likely contributory.[32]
Several studies evaluated individual components of EGDT. The TRISS (Transfusion Requirements in Septic Shock) trial randomized ICU patients with septic shock to 2 different red blood cell transfusion strategies, and found no mortality benefit or reduction in ischemic events for patients transfused at a hemoglobin of 9 g/dL compared to the 7 g/dL threshold.[33] The SEPSISPAM (Assessment of Two Levels of Arterial Pressure on Survival in Patients With Septic Shock) trial compared the MAP goal of 65 to 70 mm Hg to 80 to 85 mm Hg for patients with septic shock in a randomized, multicenter trial.[34] Although there was no difference in 28‐day mortality, more atrial fibrillation was diagnosed in the higher target group. For patients with chronic hypertension, targeting the higher MAP led to less renal injury and reduced the need for renal‐replacement therapy.[34, 35] Identifying specific subsets of patients with sepsis who benefit most from particular therapies should help clinicians set patient‐specific goals and targets.
Although we can expect additional studies to provide further guidance, it is reasonable at present to adhere to protocols designed to improve timely sepsis detection and management with aggressive volume resuscitation, early/efficacious antibiotic administration, and effective infection source control.
ANTIBIOTICS AND SOURCE CONTROL
Administration of broad‐spectrum antibiotics has long been the cornerstone of sepsis management. Timely antibiotic infusion is an integral part of the 2004 and 2012 SSC guidelines,[17, 21] with the caveat that blood cultures should be obtained prior to antibiotic therapy provided that no significant delay (>45 minutes) occurs.[21] Recent studies have begun to address fundamental clinical questions, including the timing of antibiotic administration and the efficacy of empiric antibiotic choice. A landmark retrospective cohort study of ICU patients with septic shock demonstrated survival to hospital discharge was highest in patients who received antibiotics within the first hour of hypotension.[36] Survival decreased on average by 7.6% with each hour that antibiotics were delayed. Only 50% of patients with septic shock in this study received effective antibiotic therapy within 6 hours of documented hypotension.[36] A subsequent retrospective, single‐center cohort study of ED patients with severe sepsis or septic shock undergoing EGDT showed a mortality benefit when antibiotics were administered within the first hour. However, it did not demonstrate a statistically significant decline in survival on an hourly basis thereafter.[37]
A prospective, multicenter ED trial that included patients with severe sepsis in addition to septic shock[38] did not show a mortality benefit to administration of antibiotics within the first hour. In‐hospital mortality risk for patients undergoing EGDT was similar across patients in whom time to antibiotics was delayed up to 6 hours after triage.[36, 38] However, patients with severe sepsis in whom antibiotics were delayed until shock was recognized faced a statistically significant increased risk of death (odds ratio = 2.35; 95% confidence interval = 1.12‐4.53).[38, 39] A retrospective study of 28,150 patients from the SSC database demonstrated a statistically significant increase in mortality for each hour that empiric antibiotics were delayed.[40] Importantly, this trend was preserved regardless of location of sepsis diagnosis (ED, ICU, and hospital ward) and across illness severity. Though there remains debate about the critical importance of the golden hour for antibiotic administration, overall current evidence supports early empiric antibiotics in severe sepsis and septic shock.
Choosing an empiric antibiotic regimen, based on infection source and host factors, also plays a key role in sepsis outcomes. A retrospective study of patients with septic shock from 1996 to 2005 showed that inappropriate initial antibiotics (based on eventual in vitro culture sensitivities or evaluation of clinical syndrome) were used 20% of the time and resulted in a 5‐fold reduction in survival.[41] A retrospective cohort study of patients with gram‐negative bacteremia and severe sepsis or septic shock found prior antibiotic exposure within 90 days to be an independent risk factor for drug resistance and in‐hospital mortality.[42] However, careful consideration of side effects should also influence choice of initial antibiotic therapy. A Cochrane review citing 69 trials and containing 7863 subjects with sepsis compared empiric ‐lactam therapy to ‐lactamaminoglycoside combination therapy.[43] All‐cause mortality and clinical failure was similar in both groups, as was the rate of resistance. Importantly, nephrotoxicity was significantly less in the ‐lactam monotherapy group.[43]
Infection source control is an essential component of sepsis management that should occur simultaneously with antibiotic administration. The 2012 SSC guidelines promote infection source control within 12 hours of diagnosis, with consideration of the risks and benefits therein and preference for interventions with the lowest associated physiologic insult.[21] Intravascular access devices should be recognized as a common source of infection, and should be removed after alternative access has been established.[21]
FLUID RESUSCITATION
Volume resuscitation is an essential component of sepsis management, regardless of algorithm or endpoint. Three main types of nonblood product fluid resuscitation have been used: crystalloid (saline and Ringer's solutions), colloid (typically an albumin‐containing solution), and synthetic volume expanders (hydroxyethyl starch [HES] and similar compounds).
Multiple large studies confirmed the lack of a favorable riskbenefit ratio with synthetic volume expanders. Among nearly 800 patients with severe sepsis who were randomized to receive either Ringer's acetate or HES 130/0.4, a significantly higher number of patients receiving HES died (51% vs 43%, relative risk [RR] = 1.17), and required renal‐replacement therapy (22% vs 16%, RR = 1.35). One patient in each group was dialysis dependent at 90 days.[44] An additional multicenter, prospective study of HES versus 0.9% (normal) saline for fluid resuscitation in the ICU found no significant difference in mortality (18% vs 17%, P = 0.26), but did note a higher need for renal‐replacement therapy in the HES group (7.0% vs 5.8%, RR = 1.21).[45] A systematic review incorporating 9 trials that randomized approximately 3400 patients with sepsis receiving either HES, crystalloid, or colloid showed no difference in mortality, although there was an excess risk for renal‐replacement therapy (RR = 1.36), serious adverse events (RR = 1.30), and red blood cell transfusion (RR = 1.29) in patients receiving HES.[46] A second, larger systematic review concluded that HES was associated with an increased mortality compared with crystalloids, albumin, or gelatin (RR = 1.09). Additionally, an increase in renal failure (RR = 1.27) and renal‐replacement therapy (RR = 1.32) was also noted.[47]
The debate between crystalloid and colloid (namely albumin) for fluid resuscitation is ongoing, with recent important additions to the literature. The SAFE (Saline Versus Albumin Fluid Evaluation) study investigators in 2004 randomized nearly 7000 patients to receive either 4% albumin solution or normal saline. At 28 days, no significant differences were found in mortality, new organ failure, ICU and hospital length of stay, days of mechanical ventilation, or days of renal‐replacement therapy.[48] In 2014, another multicenter prospective study of 1800 patients with severe sepsis or septic shock in 100 ICUs in Italy compared 20% albumin and crystalloid solution to crystalloid solution alone. Mortality, end‐organ dysfunction, and ICU length of stay did not differ between groups.[49] Two 2014 systematic reviews and meta‐analyses on fluid resuscitation produced somewhat differing conclusions. Patel et al. evaluated data from 16 randomized trials including more than 4000 patients receiving albumin for volume resuscitation in adults with sepsis. Albumin provided no significant survival advantage in total or in any subgroup, regardless of severity of illness or baseline albumin level, thus arguing against its routine use.[50] Rochwerg et al. evaluated 14 studies with approximately 19,000 patients using Bayesian network meta‐analysis technique. This study concluded that albumin is associated with reduced mortality compared with other fluids, and also that balanced crystalloids (eg, Ringer's lactate and similar) may have lower mortality than normal saline.[51] A chloride‐restrictive resuscitation approach has also been associated with a lower incidence of acute kidney injury in critically ill adults.[52]
The SSC confirmed its recommendations of a minimum of 30 mL/kg of crystalloids as the initial fluid of choice in sepsis in 2012, but added a suggestion for the addition of albumin in patients requiring substantial amounts of crystalloid.[21] The currently available data suggest crystalloid fluids to be the best‐supported initial fluid in the management of sepsis, and that synthetic colloids should be avoided. Prospective data are still required to answer questions regarding the potential advantages of albumin or balanced and/or chloride‐restricted crystalloids.
ICU CONSIDERATIONS
Appropriate management of patients with the syndrome of sepsis, severe sepsis, and septic shock on the hospital ward requires a working knowledge of recent research conducted in the ICU setting. Although conclusions based on data from patients with septic shock might not be generalizable to less severe cases of sepsis, recent trials on glucose control and corticosteroids deserve consideration.
Intensive insulin treatment in the medical ICU is no longer standard practice. In the NICE‐SUGAR (Normoglycaemia in Intensive Care Evaluation and Survival Using Glucose Algorithm Regulation) trial, a large, multicenter randomized controlled trial of ICU patients, close to 20% of patients had severe sepsis at the time of randomization.[53] This subgroup did not benefit from intensive glucose control (a target of 81108 mg/dL) in terms of 90‐day mortality.[53] In contrast to prior studies of glycemic control in the critically ill, the intensive treatment group overall suffered increased mortality.[54] The COIITSS (Combination of Corticotherapy and Intensive Insulin Therapy for Septic Shock) trial looked at intensive insulin therapy in patients with septic shock being treated with corticosteroids, a group particularly at risk for hyperglycemia. In this study, intensive insulin therapy did not improve in‐hospital mortality.[55] Based on these and other ICU data, the current SSC recommendation is to target a blood glucose of 180 mg/dL for patients with severe sepsis.[21, 56]
The use of corticosteroids to treat the host response in septic shock has been re‐evaluated.[57] The 2004 SSC guidelines recommended hydrocortisone therapy for 7 days in patients with septic shock requiring vasopressor support after fluid resuscitation.[17] This recommendation was based on data from a placebo‐controlled multicenter trial in France that showed improved shock reversal and reduced mortality in patients with septic shock who were treated with hydrocortisone and fludricortisone.[58] Of note, these patients were enrolled on the basis of hypotension despite intravenous fluids and the initiation of 1 vasopressor. The benefit of corticosteroids was seen only in patients deemed to have relative adrenal insufficiency based on response corticotropin testing.[58] However, the CORTICUS (Corticosteroid Therapy of Septic Shock) study, a subsequent multicenter, placebo‐controlled, randomized controlled trial failed to show a benefit to corticotropin testing in identifying patients with septic shock who would benefit from corticorsteroids.[59] The corticosteroid treatment arm similarly benefited from faster shock reversal, but at the expense of increased superinfection.[59] Although underpowered, CORTICUS did not show a survival benefit to corticosteroids in septic shock.[59] The most recent SSC guidelines do not recommend corticotropin (adrenocorticotropic hormone) stimulation testing and do not advise corticosteroids in septic shock if fluid resuscitation and vasopressor therapy restore hemodynamic stability during initial resuscitation.[21] Future studies may clarify subpopulations of patients with sepsis who benefit from corticosteroids.
OUTCOMES: MORTALITY AND COMPLICATIONS
An understanding of the currently available information regarding the morbidity and mortality associated with severe sepsis is essential for the practicing hospitalist. Whether transferring care of patients to or receiving patients from the ICU, hospitalists must lead discussions with patients and families regarding prognosis, especially as it informs disposition. Hospitalists are often asked to make projections on outcome as well as the timing and venue of disposition. Clarification of patient wishes and goals of care remains an essential first step in the care of septic patients. Recently published studies provide prognostic information, including mortality (both short and long term) as well as complications associated with severe sepsis.
The attributable mortality for severe sepsis has been predominantly reported to date as short‐term (usually in‐hospital). A meta‐analysis of US patients from 1991 to 2009 demonstrated a 3% annual decline in the short‐term (28 day) mortality from severe sepsis using 2 previously validated algorithms. Data from 36 trials (and approximately 14,000 patients) revealed a decrease in mortality from 47% in the period from 1991 to 1995 to 29% from 2006 to 2009.[60] Although the methods employed (sepsis definitions and ICD‐9‐CM codes) can have a significant impact on estimates of mortality, these results corroborate a progressive decline in short‐term mortality from severe sepsis in the United States between 2004 and 2009 using 4 validated algorithms.[8] Outside the United States, a recent retrospective analysis of more than 1 million patients with severe sepsis treated in the ICU in Australia and New Zealand from 2000 to 2012 also demonstrated a decrease in adjusted in‐hospital mortality. In this study, short‐term mortality declined yearly, with an odds ratio of death of 0.49 in 2012 compared with 2000.[61] Hospital case volume has also been shown to impact rates of inpatient death, with higher‐volume centers demonstrating lower mortality attributed to severe sepsis.[62, 63]
The sufficiency of short‐term mortality as the sole metric for severe sepsis outcome has been more recently questioned.[64, 65] The extent to which full recovery and significant morbidity are affected relative to the change in death rate is unknown, and as such, more data on morbidity and longer‐term mortality are necessary. A Danish study examined data from several registries of patients with severe sepsis. Compared with community‐matched controls, patients with severe sepsis had an increased risk of death at 30 days (hazard ratio [HR] = 90.8), from 30 days to 1 year (HR = 2.7), and 1 to 4 years (HR = 2.3) after discharge.[66] Older survivors of severe sepsis also appear to have higher healthcare utilization in the year following discharge. An analysis of older severe sepsis survivors showed a striking increase in healthcare use relative to their prior resource use, driven primarily by higher number of days in inpatient healthcare facilities. Survivors of severe sepsis also had a significantly higher 90‐day and 1‐year mortality than matched controls.[67]
Increased attention is currently being given to sepsis‐related complications, especially functional and cognitive impairments in older patients. Sepsis survivorship is a swiftly mounting public health issue for older Americans.[68] An 8‐year follow‐up of older sepsis survivors demonstrated a significant increase in the odds of both physical and cognitive dysfunction. During this period, moderate‐to‐severe cognitive dysfunction increased 3‐fold (6.1% before sepsis, 16.7% after).[69] The mechanism by which this dysfunction occurs is unknown, as are the relative contributions of infection site/etiology, ICU length of stay, and extent of organ dysfunction. New functional impairment has been demonstrated in patients with severe sepsis initially admitted to a general floor, even with good baseline function,[12] as well as decreased quality of life in sepsis survivors.[65, 70] Another study showed more admissions complicated by severe sepsis resulted in discharge to a long‐term care facility in 2007 compared to 2000.[7]
Additional organ‐specific consequences of severe sepsis have also been recently suggested. A retrospective analysis showed an increase in the incidence of new‐onset atrial fibrillation in severe sepsis, with an associated increase in risk of in‐hospital stroke and death. New‐onset atrial fibrillation was present in 5.9% of patients with severe sepsis, compared with 0.65% in patients without. Severe sepsis patients with new‐onset atrial fibrillation had an increased risk of in‐hospital stroke (adjusted odds ratio = 2.70) and mortality (adjusted RR = 1.07).[71] These findings suggest association only, and further investigation is warranted. It remains to be seen whether interventions to restore sinus rhythm or anticoagulation are warranted. Preoperative sepsis (within 48 hours) has also been proposed as a risk for postoperative (30 day) arterial (myocardial infarction, stroke) and venous (deep venous thrombosis, pulmonary embolism) thromboembolism. The authors of this study suggest deferral of elective surgery or specific attention to postoperative thromboprophylaxis in patients in whom procedures must occur.[72] This has particular relevance for those septic patients in whom surgical source control is indicated.
Estimates regarding mortality and specific complications attributable to severe sepsis are ongoing, though clearly with a new focus upon metrics other than short‐term mortality. Furthermore, recent data to suggest source of infection as a major driver of mortality in septic shock[73] may contribute to the evolution of the conceptualization of sepsis similar to that of cancer: a heterogeneous collection of disease, among which mortality is determined by specific subtypes. At present, this much appears clear: the previously held notion that survival of a septic insult is unlikely to have future implications is under siege.[74] The extent to which complications and increased longer‐term mortality may reflect generally poorer health at the time of infection versus a sequelae of the survived episode itself is not yet known.
CONCLUSIONS
The past decade of sepsis research has led to significant findings that will change clinical practice for hospital medicine practitioners. Although the incidence of severe sepsis in the United States has continued to rise, in‐hospital mortality has declined; in this context, the management of the spectrum of sepsis disorders is no longer restricted to the ICU, and the entity of sepsis survivorship has blossomed. Prompt recognition of sepsis and improvements in supportive care are likely responsible for improved patient outcomes. EGDT has been called into question as a protocol whose benefit lies not in specific targets or endpoints, but rather in the early recognition of sepsis, appropriate fluid resuscitation, and early/effective antibiotics. Synthetic volume expanders, intensive insulin therapy, and routine use of corticosteroids are no longer recommended.
Hospitalists are a critical link in providing timely, evidence‐based care for patients with sepsis from initial recognition to post‐ICU recovery. Specialized care for the survivors of septic shock is a burgeoning area, and hospitalists are integral in the management of the sequelae of multiorgan failure.
Disclosure: Nothing to report.
- , . Severe sepsis and septic shock. N Engl J Med. 2013;369(9):840–851.
- , , , et al. Definitions for sepsis and organ failure and guidelines for the use of innovative therapies in sepsis. The ACCP/SCCM Consensus Conference Committee. American College of Chest Physicians/Society of Critical Care Medicine. Chest. 1992;101(6):1644–1655.
- , , , et al.; SCCM/ESICM/ACCP/ATS/SIS. 2001 SCCM/ESICM/ACCP/ATS/SIS International Sepsis Definitions Conference. Crit Care Med. 2003;31(4):1250–1256.
- , , , , . Systemic inflammatory response syndrome criteria in defining severe sepsis. N Engl J Med. 2015;372(17):1629–1638.
- , , , . The epidemiology of sepsis in the United States from 1979 through 2000. N Engl J Med. 2003;348(16):1546–1554.
- , , , . Inpatient care for septicemia or sepsis: A challenge for patients and hospitals. NCHS data brief, no 62. Hyattsville, MD: National Center for Health Statistics. 2011.
- , , , et al.; Milwaukee Initiative in Critical Care Outcomes Research Group of Investigators. Nationwide trends of severe sepsis in the 21st century (2000–2007). Chest. 2011;140(5):1223–1231.
- , , , . Benchmarking the incidence and mortality of severe sepsis in the united states. Crit Care Med. 2013;41(5):1167–1174.
- , , , , , . Hospitalizations, costs, and outcomes of severe sepsis in the United States 2003 to 2007. Crit Care Med. 2012;40(3):754–761.
- , . National inpatient hospital costs: the most expensive conditions by payer, 2011. HCUP statistical brief #160. Rockville, MD: Agency for Healthcare Research and Quality, 2013. Available at: http://www.hcup‐us.ahrq.gov/reports/statbriefs/sb160.pdf. Accessed March 15, 2015.
- , , , et al. Sepsis incidence and outcome: contrasting the intensive care unit with the hospital ward. Crit Care Med. 2007;35(5):1284–1289.
- , , , et al. Functional outcomes of general medical patients with severe sepsis. BMC Infect Dis. 2013;13:588.
- , , , et al. The epidemiology of acute organ system dysfunction from severe sepsis outside of the intensive care unit. J Hosp Med. 2013;8(5):243–247.
- , , , , , . Sepsis in general surgery: the 2005–2007 national surgical quality improvement program perspective. Arch Surg. 2010;145(7):695–700.
- . Evidence‐based sepsis therapy: a hospitalist perspective. J Hosp Med. 2006;1(5):285–295.
- , , , et al. Early goal‐directed therapy in the treatment of severe sepsis and septic shock. N Engl J Med. 2001;345(19):1368–1377.
- , , , et al. Surviving sepsis campaign guidelines for management of severe sepsis and septic shock. Crit Care Med. 2004;32(3):858–873.
- , , , et al. Lactate clearance vs central venous oxygen saturation as goals of early sepsis therapy: a randomized clinical trial. JAMA. 2010;303(8):739–746.
- . Disassembling goal‐directed therapy for sepsis: a first step. JAMA. 2010;303(8):777–779.
- , , , et al. Early lactate‐guided therapy in intensive care unit patients: a multicenter, open‐label, randomized controlled trial. Am J Respir Crit Care Med. 2010;182(6):752–761.
- , , , et al. Surviving sepsis campaign: International guidelines for management of severe sepsis and septic shock: 2012. Crit Care Med. 2013;41(2):580–637.
- , , , et al. Serum lactate is associated with mortality in severe sepsis independent of organ failure and shock. Crit Care Med. 2009;37(5):1670–1677.
- , , , et al. Predictors of patients who present to the emergency department with sepsis and progress to septic shock between 4 and 48 hours of emergency department arrival. Crit Care Med. 2015;43(5):983–988.
- ARISE Investigators; ANZICS Clinical Trials Group, , , , et al. Goal‐directed resuscitation for patients with early septic shock. N Engl J Med. 2014;371(16):1496–1506.
- ProCESS Investigators, , , , et al. A randomized trial of protocol‐based care for early septic shock. N Engl J Med. 2014;370(18):1683–1693.
- , , , et al.; ProMISe Trial Investigators. Trial of early, goal‐directed resuscitation for septic shock. N Engl J Med. 2015;372(14):1301–1311.
- . The ProCESS trial—a new era of sepsis management. N Engl J Med. 2014;370(18):1750–1751.
- , . The role of bundles in sepsis care. Crit Care Clin. 2006;22(3):521–529, x.
- , , , et al. The surviving sepsis campaign: results of an international guideline‐based performance improvement program targeting severe sepsis. Crit Care Med. 2010;38(2):367–374.
- , , , et al. Multicenter implementation of a severe sepsis and septic shock treatment bundle. Am J Respir Crit Care Med. 2013;188(1):77–82.
- , , , et al. The GENESIS project (Generalized early sepsis intervention strategies): a multicenter quality improvement collaborative. J Intensive Care Med. 2013;28(6):355–368.
- , . Early recognition and treatment of severe sepsis. Am J Respir Crit Care Med. 2013;188(1):7–8.
- , , , et al. Lower versus higher hemoglobin threshold for transfusion in septic shock. N Engl J Med. 2014;371(15):1381–1391.
- , , , et al. High versus low blood‐pressure target in patients with septic shock. N Engl J Med. 2014;370(17):1583–1593.
- . Is there a good MAP for septic shock? N Engl J Med. 2014;370(17):1649–1651.
- , , , et al. Duration of hypotension before initiation of effective antimicrobial therapy is the critical determinant of survival in human septic shock. Crit Care Med. 2006;34(6):1589–1596.
- , , , et al. Impact of time to antibiotics on survival in patients with severe sepsis or septic shock in whom early goal‐directed therapy was initiated in the emergency department. Crit Care Med. 2010;38(4):1045–1053.
- , , , et al. Association between timing of antibiotic administration and mortality from septic shock in patients treated with a quantitative resuscitation protocol. Crit Care Med. 2011;39(9):2066–2071.
- , . Antibiotics in sepsis: timing, appropriateness, and (of course) timely recognition of appropriateness. Crit Care Med. 2011;39(9):2184–2186.
- , , , et al. Empiric antibiotic treatment reduces mortality in severe sepsis and septic shock from the first hour: results from a guideline‐based performance improvement program. Crit Care Med. 2014;42(8):1749–1755.
- , , , et al. Initiation of inappropriate antimicrobial therapy results in a fivefold reduction of survival in human septic shock. Chest. 2009;136(5):1237–1248.
- , , , , , . Impact of previous antibiotic therapy on outcome of gram‐negative severe sepsis. Crit Care Med. 2011;39(8):1859–1865.
- , , , . Beta lactam antibiotic monotherapy versus beta lactam‐aminoglycoside antibiotic combination therapy for sepsis. Cochrane Database Syst Rev. 2014;1:CD003344.
- , , , et al. Hydroxyethyl starch 130/0.42 versus ringer's acetate in severe sepsis. N Engl J Med. 2012;367(2):124–134.
- , , , et al.; CHEST Investigators; Australian and New Zealand Intensive Care Society Clinical Trials Group. Hydroxyethyl starch or saline for fluid resuscitation in intensive care. N Engl J Med. 2012;367(20):1901–1911.
- , , , et al. Hydroxyethyl starch 130/0.38–0.45 versus crystalloid or albumin in patients with sepsis: systematic review with meta‐analysis and trial sequential analysis. BMJ. 2013;346:f839.
- , , , et al. Association of hydroxyethyl starch administration with mortality and acute kidney injury in critically ill patients requiring volume resuscitation: a systematic review and meta‐analysis. JAMA. 2013;309(7):678–688.
- , , , , , ; SAFE Study Investigators. A comparison of albumin and saline for fluid resuscitation in the intensive care unit. N Engl J Med. 2004;350(22):2247–2256.
- , , , et al. Albumin replacement in patients with severe sepsis or septic shock. N Engl J Med. 2014;370(15):1412–1421.
- , , , . Randomised trials of human albumin for adults with sepsis: systematic review and meta‐analysis with trial sequential analysis of all‐cause mortality. BMJ. 2014;349:g4561.
- , , , et al. Fluid resuscitation in sepsis: a systematic review and network meta‐analysis. Ann Intern Med. 2014;161(5):347–355.
- , , , , , . Association between a chloride‐liberal vs chloride‐restrictive intravenous fluid administration strategy and kidney injury in critically ill adults. JAMA. 2012;308(15):1566–1572.
- NICE‐SUGAR Study Investigators, , , , et al. Intensive versus conventional glucose control in critically ill patients. N Engl J Med. 2009;360(13):1283–1297.
- , . Glucose control in the ICU—how tight is too tight? N Engl J Med. 2009;360(13):1346–1349.
- COIITSS Study Investigators, , , , et al. Corticosteroid treatment and intensive insulin therapy for septic shock in adults: a randomized controlled trial. JAMA. 2010;303(4):341–348.
- , , , et al. Intensive insulin therapy and mortality among critically ill patients: a meta‐analysis including NICE‐SUGAR study data. CMAJ. 2009;180(8):821–827.
- , , , et al. Corticosteroids in the treatment of severe sepsis and septic shock in adults: a systematic review. JAMA. 2009;301(22):2362–2375.
- , , , et al. Effect of treatment with low doses of hydrocortisone and fludrocortisone on mortality in patients with septic shock. JAMA. 2002;288(7):862–871.
- , , , et al. Hydrocortisone therapy for patients with septic shock. N Engl J Med. 2008;358(2):111–124.
- , , , , . Two decades of mortality trends among patients with severe sepsis: a comparative meta‐analysis. Crit Care Med. 2014;42(3):625–631.
- , , , , . Mortality related to severe sepsis and septic shock among critically ill patients in Australia and New Zealand, 2000–2012. JAMA. 2014;311(13):1308–1316.
- , , , , , . The relationship between hospital volume and mortality in severe sepsis. Am J Respir Crit Care Med. 2014;190(6):665–674.
- , . Hospital case volume and outcomes among patients hospitalized with severe sepsis. Am J Respir Crit Care Med. 2014;189(5):548–555.
- , . Declining case fatality rates for severe sepsis: Good data bring good news with ambiguous implications. JAMA. 2014;311(13):1295–1297.
- , , , , , . Long‐term mortality and quality of life in sepsis: a systematic review. Crit Care Med. 2010;38(5):1276–1283.
- , , , , , . Short‐ and long‐term mortality in patients with community‐acquired severe sepsis and septic shock. Scand J Infect Dis. 2013;45(8):577–583.
- , , , , . Increased 1‐year healthcare use in survivors of severe sepsis. Am J Respir Crit Care Med. 2014;190(1):62–69.
- , , , . Population burden of long‐term survivorship after severe sepsis in older Americans. J Am Geriatr Soc. 2012;60(6):1070–1077.
- , , , . Long‐term cognitive impairment and functional disability among survivors of severe sepsis. JAMA. 2010;304(16):1787–1794.
- , , , , ; Finnsepsis Study Group. Long‐term outcome and quality‐adjusted life years after severe sepsis. Crit Care Med. 2009;37(4):1268–1274.
- , , , , . Incident stroke and mortality associated with new‐onset atrial fibrillation in patients hospitalized with severe sepsis. JAMA. 2011;306(20):2248–2254.
- , , , . Impact of sepsis on risk of postoperative arterial and venous thromboses: large prospective cohort study. BMJ. 2014;349:g5334.
- , , , , , ; Co‐operative Antimicrobial Therapy of Septic Shock Database Research Group. Association between source of infection and hospital mortality in patients who have septic shock. Am J Respir Crit Care Med. 2014;189(10):1204–1213.
- . The lingering consequences of sepsis: a hidden public health disaster? JAMA. 2010;304(16):1833–1834.
Managing hospitalized methadone–maintained patients
Methadone maintenance therapy is widely used for helping patients recover from an opioid use disorder. When these patients develop an acute medical problem that requires hospitalization, there often is confusion among providers regarding methadone pharmacology, regulations, and general safety issues. We have observed that the lack of awareness of these practices can lead to poor medical and surgical outcomes, increased length of stay, and diminished patient satisfaction.
Consider the following common pitfalls—all of which we have encountered on our psychiatry consult service—and ways to avoid them when treating methadone-maintained patients.
Don’t give a full methadone maintenance dosage without verifying the dosage and the date when it was last administered. Methadone typically has a long, but variable, half-life, with ranges of 4 to 130 hours being reported.1 Do not rush to give the full dose without verification from the patient’s methadone maintenance treatment program (MMTP). Small doses—not to exceed 40 mg in 24 hours—can be administered until you verify the dosage. Multiple days of missed dosing result in decreased tolerance and will require a dosage reduction.
Consult with the MMTP when restarting methadone in a patient who has missed any days of outpatient dosing. Because methadone can take days to reach a serum steady state, it can cause oversedation or obtundation after it’s restarted in a person who has lost tolerance due to multiple consecutive days of missed doses.
Don’t automatically give the full, verified dose if the patient appears sedated. A variety of other substances (benzodiazepines, heroin, tricyclic antidepressants) can increase the effects of methadone. Even the verified methadone maintenance dosage may need to be reduced or held until these other substances are cleared from the patient’s system.
Don’t be afraid to adjust the methadone dosage if medically indicated. Medically hospitalized patients might be placed on medications that can alter methadone metabolism. The primary enzyme responsible for methadone metabolism is cytochrome P450 3A4, which can create significant drug-drug interactions with rifampin, carbamazepine, phenytoin, and barbiturates, among others.2
Don’t taper methadone just because the patient does not want to be on it any longer. A patient’s methadone dosage should be adjusted in the hospital only if there is an acute medical indication to do so. Otherwise, all dosage changes must be made on an outpatient basis at the MMTP.
Don’t be afraid to give opioids to treat acute pain. Methadone maintenance does not treat acute pain. In fact, compared with the general population, these patients likely will need a higher-than-expected opioid dosage to treat acute pain.3
Don’t initiate methadone maintenance in the hospital. Methadone maintenance can be initiated only at an MMTP that has been certified by appropriate federal and state agencies.4 Small doses of methadone can be given to treat or prevent opioid withdrawal in patients admitted to the hospital for conditions other than an opioid use disorder. An exception: A pregnant woman with an opioid use disorder who seeks methadone initiation in the hospital.
Don’t forget to monitor the QTc interval. Methadone can prolong the QTc interval. Although the overall rate of cardiac toxicity is low, it is reasonable to obtain an electrocardiogram in patients with heart disease, those predisposed to prolonged QTc, or those taking another QT-prolonging agent.5
Don’t let negative countertransference prevent you from giving quality care. Patients with a drug addiction can be challenging. They can elicit anger among members of their treatment team because of their character pathology or a provider’s discomfort and unfamiliarity. One might be tempted to spend less time with so-called “difficult” patients, but keep in mind that methadone-maintained patients often carry chaotic medical and social issues that require a thoughtful and thorough approach to treatment.
Disclosures
The authors report no financial relationships with any company whose products are mentioned in this article or with manufacturers of competing products.
1. Eap CB, Buclin T, Baumann P. Interindividual variability of the clinical pharmacokinetics of methadone: implications for the treatment of opioid dependence. Clin Pharmacokinet. 2002;41(14):1153-1193.
2. Davis MP, Walsh D. Methadone for relief of cancer pain: a review of pharmacokinetics, pharmacodynamics, drug interactions and protocols of administration. Support Care Cancer. 2001;9(2):73-83.
3. Athanasos P, Smith CS, White JM, et al. Methadone maintenance patients are cross-tolerant to the antinociceptive effects of very high plasma morphine concentrations. Pain. 2006;120(3):267-275.
4. Heit HA, Covington E, Good PM. Dear DEA. Pain Med. 2004;5(3):303-308.
5. Martin JA, Campbell A, Killip T, et al; Substance Abuse and Mental Health Services Administration. QT interval screening in methadone maintenance treatment: report of a SAMHSA expert panel. J Addict Dis. 2011;30(4):283-306.
Methadone maintenance therapy is widely used for helping patients recover from an opioid use disorder. When these patients develop an acute medical problem that requires hospitalization, there often is confusion among providers regarding methadone pharmacology, regulations, and general safety issues. We have observed that the lack of awareness of these practices can lead to poor medical and surgical outcomes, increased length of stay, and diminished patient satisfaction.
Consider the following common pitfalls—all of which we have encountered on our psychiatry consult service—and ways to avoid them when treating methadone-maintained patients.
Don’t give a full methadone maintenance dosage without verifying the dosage and the date when it was last administered. Methadone typically has a long, but variable, half-life, with ranges of 4 to 130 hours being reported.1 Do not rush to give the full dose without verification from the patient’s methadone maintenance treatment program (MMTP). Small doses—not to exceed 40 mg in 24 hours—can be administered until you verify the dosage. Multiple days of missed dosing result in decreased tolerance and will require a dosage reduction.
Consult with the MMTP when restarting methadone in a patient who has missed any days of outpatient dosing. Because methadone can take days to reach a serum steady state, it can cause oversedation or obtundation after it’s restarted in a person who has lost tolerance due to multiple consecutive days of missed doses.
Don’t automatically give the full, verified dose if the patient appears sedated. A variety of other substances (benzodiazepines, heroin, tricyclic antidepressants) can increase the effects of methadone. Even the verified methadone maintenance dosage may need to be reduced or held until these other substances are cleared from the patient’s system.
Don’t be afraid to adjust the methadone dosage if medically indicated. Medically hospitalized patients might be placed on medications that can alter methadone metabolism. The primary enzyme responsible for methadone metabolism is cytochrome P450 3A4, which can create significant drug-drug interactions with rifampin, carbamazepine, phenytoin, and barbiturates, among others.2
Don’t taper methadone just because the patient does not want to be on it any longer. A patient’s methadone dosage should be adjusted in the hospital only if there is an acute medical indication to do so. Otherwise, all dosage changes must be made on an outpatient basis at the MMTP.
Don’t be afraid to give opioids to treat acute pain. Methadone maintenance does not treat acute pain. In fact, compared with the general population, these patients likely will need a higher-than-expected opioid dosage to treat acute pain.3
Don’t initiate methadone maintenance in the hospital. Methadone maintenance can be initiated only at an MMTP that has been certified by appropriate federal and state agencies.4 Small doses of methadone can be given to treat or prevent opioid withdrawal in patients admitted to the hospital for conditions other than an opioid use disorder. An exception: A pregnant woman with an opioid use disorder who seeks methadone initiation in the hospital.
Don’t forget to monitor the QTc interval. Methadone can prolong the QTc interval. Although the overall rate of cardiac toxicity is low, it is reasonable to obtain an electrocardiogram in patients with heart disease, those predisposed to prolonged QTc, or those taking another QT-prolonging agent.5
Don’t let negative countertransference prevent you from giving quality care. Patients with a drug addiction can be challenging. They can elicit anger among members of their treatment team because of their character pathology or a provider’s discomfort and unfamiliarity. One might be tempted to spend less time with so-called “difficult” patients, but keep in mind that methadone-maintained patients often carry chaotic medical and social issues that require a thoughtful and thorough approach to treatment.
Disclosures
The authors report no financial relationships with any company whose products are mentioned in this article or with manufacturers of competing products.
1. Eap CB, Buclin T, Baumann P. Interindividual variability of the clinical pharmacokinetics of methadone: implications for the treatment of opioid dependence. Clin Pharmacokinet. 2002;41(14):1153-1193.
2. Davis MP, Walsh D. Methadone for relief of cancer pain: a review of pharmacokinetics, pharmacodynamics, drug interactions and protocols of administration. Support Care Cancer. 2001;9(2):73-83.
3. Athanasos P, Smith CS, White JM, et al. Methadone maintenance patients are cross-tolerant to the antinociceptive effects of very high plasma morphine concentrations. Pain. 2006;120(3):267-275.
4. Heit HA, Covington E, Good PM. Dear DEA. Pain Med. 2004;5(3):303-308.
5. Martin JA, Campbell A, Killip T, et al; Substance Abuse and Mental Health Services Administration. QT interval screening in methadone maintenance treatment: report of a SAMHSA expert panel. J Addict Dis. 2011;30(4):283-306.
Give patients a workout in the ‘ego gym’ with mindfulness exercises
Mindfulness has become an important supportive psychotherapeutic intervention for a variety of psychiatric conditions,1-3 regardless of what other modalities the psychiatrist employs (eg, pharmacotherapy, other psychotherapeutic interventions). In general, mindfulness involves engaging in meditation exercises, analogous to working out in the gym, to strengthen “mindfulness muscles.” These exercises increase the patient’s ability to remain in the moment, “as is,” and without judgment.
I think of mindfulness exercises as an “ego gym” for the patient as he (she) gets to exercise the ego functions of agency, attention, awareness, acceptance, and empathy. Advising and helping patients to be present and exist with their thoughts is a psycho-educational approach and form of advice consistent with principles of supportive therapy. In this article, I provide a practical framework for doing and teaching mindfulness using the mnemonic BREATHE.
Flow is more important than sequence
The 7 elements of mindfulness exercises contained in BREATHE do not need to be done in order. Rather, mindfulness generally involves each of the following elements flowing, or tumbling, into each other, not standing as a distinct entity.
Being in the now, “as is,” without judgment (eg, being present/being vs doing; Buddhist origins; diaphragmatic breathing/body scans; “breathing-space” meditation exercises). In general, mindfulness meditation exercises focus on some sensory experience (eg, the physical sensation of breathing or of a difficult emotion, or sounds and smells in the environment). Some mindfulness meditations are called “body scans.”
A patient can shift his (her) focus during mindfulness meditation to a sound or some other stimulus intruding on his original meditative focus, such as an intense emotion or pain, that might arise and become the new focus of mindfulness meditation. Ideally, mindfulness exercises are done without the intention of achieving anything (ie, there is no “striving” for anything when being mindful). Striving, after all, is doing; mindfulness is being.
R(AIN). Mindfulness, as operationalized by Kabat-Zinn,4 starts with a focus on breathing similar to many meditation practices in Buddhism. When the patient wanders into intense emotions, such as suffering, that become the focus of mindfulness, use the mnemonic-within-a-mnemonic RAIN as a guide; typically, this involves first anchoring with a few deep breaths, and then becoming mindful by:
• Recognizing (and labeling, naming, “tagging”) the emotion (eg, sad, hurt, angry, embarrassed); this engages frontal lobe processes that diminishes amygdaloid limbic system overactivity1
• Allowing (ie, accepting suffering)
• Investigating, with an open and curious attitude, using one’s senses to experience, feel, and explore thoughts and emotions
• Non-identifying with one’s thoughts, feelings, emotions, or suffering (expressed in the important mindfulness refrain: “You are not your thoughts or emotions. You are the entity that simply is aware of them.”).
Experiencing. The patient stops at the perceived experience or sensation and does not automatically react with thoughts, emotions, distress, or judgments. Mindfulness is a psychotherapeutic intervention that is “more experiential than cognitive.” Encourage the patient to stop at the “door of experience” and not enter the doors of thinking, emotion, and feeling.
Accepting without judgment—also called “awarenessing” or “avoid avoiding.” This involves being aware of the experience regardless of what it entails, whether suffering, thoughts, emotions, or pain, and not trying to escape or avoid the difficult experience. Psychodynamic principles help us understand how psychological defenses designed to avoid the experience of the “unbearable affect” often lead to more problems for patients. In mindfulness, only avoiding is to be avoided.
Thoughts. People tend to over-identify with their thoughts and emotions. In mindfulness, you emphasize to the patient that (1) he is not his thoughts or emotions and (2) these cognitive processes do not represent facts.
Heartfulness—or, healthy, happy, free from harm. Mindfulness from the Buddhist tradition also includes “heartfulness” and “loving-kindness” and the development of compassion and kindness for one’s self and others. Mindfulness meditation therefore also involves development of loving-kindness/compassion toward oneself and others—even one’s enemies (eg, “May I be healthy, happy, and free from harm.”). I have found this aspect of mindfulness useful for patients who feel angry or entitled, with characterological problems.
Empathy for others. As an extension of, or further emphasis on, loving-kindness, meditation focuses on understanding the suffering of others. In certain monastic practices, this mindfulness meditation involves “taking on” the suffering of another.
Disclosure
The author reports no financial relationships with any company whose products are mentioned in this article or with manufacturers of competing products.
1. Lau MA, Grabovac AD. Mindfulness-based interventions: effective for depression and anxiety. Current Psychiatry. 2009;8(12):39,40,45-47,53-55.
2. Flynn HA, Warren R. Using CBT effectively for treating depression and anxiety. Current Psychiatry. 2014;13(6):45-53.
3. Varghese SP, Koola MM, Eiger RI, et al. Opioid use remits, depression remains. Current Psychiatry. 2014;13(8):45-50.
4. Kabat-Zinn J, Hanh TN. Full catastrophe living: using the wisdom of your body and mind to face stress, pain, and illness. New York, NY: Delta; 1990.
Mindfulness has become an important supportive psychotherapeutic intervention for a variety of psychiatric conditions,1-3 regardless of what other modalities the psychiatrist employs (eg, pharmacotherapy, other psychotherapeutic interventions). In general, mindfulness involves engaging in meditation exercises, analogous to working out in the gym, to strengthen “mindfulness muscles.” These exercises increase the patient’s ability to remain in the moment, “as is,” and without judgment.
I think of mindfulness exercises as an “ego gym” for the patient as he (she) gets to exercise the ego functions of agency, attention, awareness, acceptance, and empathy. Advising and helping patients to be present and exist with their thoughts is a psycho-educational approach and form of advice consistent with principles of supportive therapy. In this article, I provide a practical framework for doing and teaching mindfulness using the mnemonic BREATHE.
Flow is more important than sequence
The 7 elements of mindfulness exercises contained in BREATHE do not need to be done in order. Rather, mindfulness generally involves each of the following elements flowing, or tumbling, into each other, not standing as a distinct entity.
Being in the now, “as is,” without judgment (eg, being present/being vs doing; Buddhist origins; diaphragmatic breathing/body scans; “breathing-space” meditation exercises). In general, mindfulness meditation exercises focus on some sensory experience (eg, the physical sensation of breathing or of a difficult emotion, or sounds and smells in the environment). Some mindfulness meditations are called “body scans.”
A patient can shift his (her) focus during mindfulness meditation to a sound or some other stimulus intruding on his original meditative focus, such as an intense emotion or pain, that might arise and become the new focus of mindfulness meditation. Ideally, mindfulness exercises are done without the intention of achieving anything (ie, there is no “striving” for anything when being mindful). Striving, after all, is doing; mindfulness is being.
R(AIN). Mindfulness, as operationalized by Kabat-Zinn,4 starts with a focus on breathing similar to many meditation practices in Buddhism. When the patient wanders into intense emotions, such as suffering, that become the focus of mindfulness, use the mnemonic-within-a-mnemonic RAIN as a guide; typically, this involves first anchoring with a few deep breaths, and then becoming mindful by:
• Recognizing (and labeling, naming, “tagging”) the emotion (eg, sad, hurt, angry, embarrassed); this engages frontal lobe processes that diminishes amygdaloid limbic system overactivity1
• Allowing (ie, accepting suffering)
• Investigating, with an open and curious attitude, using one’s senses to experience, feel, and explore thoughts and emotions
• Non-identifying with one’s thoughts, feelings, emotions, or suffering (expressed in the important mindfulness refrain: “You are not your thoughts or emotions. You are the entity that simply is aware of them.”).
Experiencing. The patient stops at the perceived experience or sensation and does not automatically react with thoughts, emotions, distress, or judgments. Mindfulness is a psychotherapeutic intervention that is “more experiential than cognitive.” Encourage the patient to stop at the “door of experience” and not enter the doors of thinking, emotion, and feeling.
Accepting without judgment—also called “awarenessing” or “avoid avoiding.” This involves being aware of the experience regardless of what it entails, whether suffering, thoughts, emotions, or pain, and not trying to escape or avoid the difficult experience. Psychodynamic principles help us understand how psychological defenses designed to avoid the experience of the “unbearable affect” often lead to more problems for patients. In mindfulness, only avoiding is to be avoided.
Thoughts. People tend to over-identify with their thoughts and emotions. In mindfulness, you emphasize to the patient that (1) he is not his thoughts or emotions and (2) these cognitive processes do not represent facts.
Heartfulness—or, healthy, happy, free from harm. Mindfulness from the Buddhist tradition also includes “heartfulness” and “loving-kindness” and the development of compassion and kindness for one’s self and others. Mindfulness meditation therefore also involves development of loving-kindness/compassion toward oneself and others—even one’s enemies (eg, “May I be healthy, happy, and free from harm.”). I have found this aspect of mindfulness useful for patients who feel angry or entitled, with characterological problems.
Empathy for others. As an extension of, or further emphasis on, loving-kindness, meditation focuses on understanding the suffering of others. In certain monastic practices, this mindfulness meditation involves “taking on” the suffering of another.
Disclosure
The author reports no financial relationships with any company whose products are mentioned in this article or with manufacturers of competing products.
1. Lau MA, Grabovac AD. Mindfulness-based interventions: effective for depression and anxiety. Current Psychiatry. 2009;8(12):39,40,45-47,53-55.
2. Flynn HA, Warren R. Using CBT effectively for treating depression and anxiety. Current Psychiatry. 2014;13(6):45-53.
3. Varghese SP, Koola MM, Eiger RI, et al. Opioid use remits, depression remains. Current Psychiatry. 2014;13(8):45-50.
4. Kabat-Zinn J, Hanh TN. Full catastrophe living: using the wisdom of your body and mind to face stress, pain, and illness. New York, NY: Delta; 1990.
Asenapine for pediatric bipolar disorder: New indication
Asenapine an atypical antipsychotic sold under the brand name Saphris, was granted a second, pediatric indication by the FDA in March 2015 as monotherapy for acute treatment of manic or mixed episodes of bipolar I disorder in children and adolescents age 10 to 17 (Table 1).1 (Asenapine was first approved in August 2009 as monotherapy or adjunctive therapy to lithium or valproate in adults for schizophrenia and bipolar I disorder.1,2)
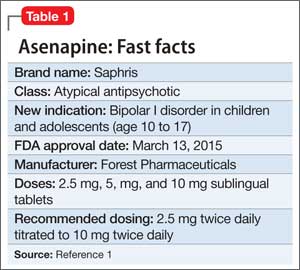
Dosage and administration
Asenapine is available as 2.5-, 5-, and 10-mg sublingual tablets, the only atypical antipsychotic with this formulation.1 The recommended dosage for the new indication is 2.5 mg twice daily for 3 days, titrated to 5 mg twice daily, titrated again to 10 mg twice daily after 3 days.3 In a phase I study, pediatric patients appeared to be more sensitive to dystonia when the recommended dosage escalation schedule was not followed.3
In clinical trials, drinking water 2 to 5 minutes after taking asenapine decreased exposure to the drug. Instruct patients not to swallow the tablet and to avoid eating and drinking for 10 minutes after administration.3
For full prescribing information for pediatric and adult patients, see Reference 3.
Safety and efficacy
In a 3-week, placebo-controlled, double-blind trial of 403 patients, 302 children and adolescents age 10 to 17 received asenapine at fixed dosages of 2.5 to 10 mg twice daily; the remainder were given placebo. The Young Mania Rating Scale (YMRS) total score and Clinical Global Impressions Severity of Illness scores of patients who received asenapine improved significantly compared with those who received placebo, as measured by change from baseline to week 3 (Table 2).1
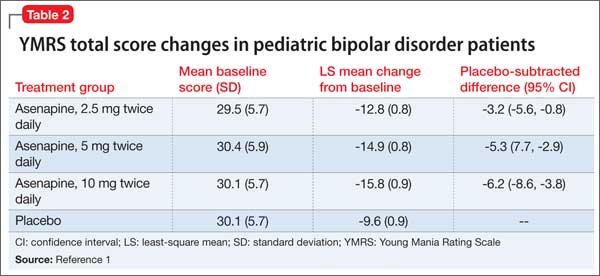
The safety and efficacy of asenapine has not been evaluated in pediatric bipolar disorder patients age ≤10 or pediatric schizophrenia patients age ≤12, or as an adjunctive therapy in pediatric bipolar disorder patients.
Asenapine was not shown to be effective in pediatric patients with schizophrenia in an 8-week, placebo-controlled, double-blind trial.
The pharmacokinetics of asenapine in pediatric patients are similar to those seen in adults.
Adverse effects
In pediatric patients, the most common reported adverse effects of asenapine are:
• dizziness
• dysgeusia
• fatigue
• increased appetite
• increased weight
• nausea
• oral paresthesia
• somnolence.
Similar adverse effects were reported in the pediatric bipolar disorder and adult bipolar disorder clinical trials (Table 3).3 A complete list of reported adverse effects is given in the package insert.3
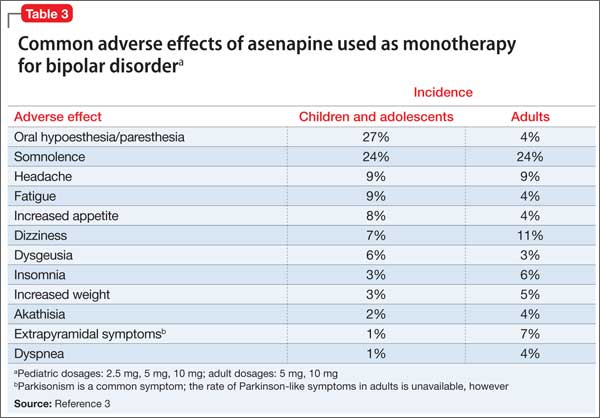
When treating pediatric patients, monitor the child’s weight gain against expected normal weight gain.
Asenapine is contraindicated in patients with hepatic impairment and those who have a hypersensitivity to asenapine or any components in its formulation.3
1. Actavis receives FDA approval of Saphris for pediatric patients with bipolar I disorder. Drugs.com. http://www.drugs.com/newdrugs/actavis-receivesfda-
approval-saphris-pediatric-patients-bipolardisorder-4188.html. Published March 2015. Accessed June 19, 2015.
2. Lincoln J, Preskon S. Asenapine for schizophrenia and bipolar I disorder. Current Psychiatry. 2009;12(8):75-76,83-85.
3. Saphris [package insert]. St. Louis, MO: Forest Pharmaceuticals; 2015.
Asenapine an atypical antipsychotic sold under the brand name Saphris, was granted a second, pediatric indication by the FDA in March 2015 as monotherapy for acute treatment of manic or mixed episodes of bipolar I disorder in children and adolescents age 10 to 17 (Table 1).1 (Asenapine was first approved in August 2009 as monotherapy or adjunctive therapy to lithium or valproate in adults for schizophrenia and bipolar I disorder.1,2)
Dosage and administration
Asenapine is available as 2.5-, 5-, and 10-mg sublingual tablets, the only atypical antipsychotic with this formulation.1 The recommended dosage for the new indication is 2.5 mg twice daily for 3 days, titrated to 5 mg twice daily, titrated again to 10 mg twice daily after 3 days.3 In a phase I study, pediatric patients appeared to be more sensitive to dystonia when the recommended dosage escalation schedule was not followed.3
In clinical trials, drinking water 2 to 5 minutes after taking asenapine decreased exposure to the drug. Instruct patients not to swallow the tablet and to avoid eating and drinking for 10 minutes after administration.3
For full prescribing information for pediatric and adult patients, see Reference 3.
Safety and efficacy
In a 3-week, placebo-controlled, double-blind trial of 403 patients, 302 children and adolescents age 10 to 17 received asenapine at fixed dosages of 2.5 to 10 mg twice daily; the remainder were given placebo. The Young Mania Rating Scale (YMRS) total score and Clinical Global Impressions Severity of Illness scores of patients who received asenapine improved significantly compared with those who received placebo, as measured by change from baseline to week 3 (Table 2).1
The safety and efficacy of asenapine has not been evaluated in pediatric bipolar disorder patients age ≤10 or pediatric schizophrenia patients age ≤12, or as an adjunctive therapy in pediatric bipolar disorder patients.
Asenapine was not shown to be effective in pediatric patients with schizophrenia in an 8-week, placebo-controlled, double-blind trial.
The pharmacokinetics of asenapine in pediatric patients are similar to those seen in adults.
Adverse effects
In pediatric patients, the most common reported adverse effects of asenapine are:
• dizziness
• dysgeusia
• fatigue
• increased appetite
• increased weight
• nausea
• oral paresthesia
• somnolence.
Similar adverse effects were reported in the pediatric bipolar disorder and adult bipolar disorder clinical trials (Table 3).3 A complete list of reported adverse effects is given in the package insert.3
When treating pediatric patients, monitor the child’s weight gain against expected normal weight gain.
Asenapine is contraindicated in patients with hepatic impairment and those who have a hypersensitivity to asenapine or any components in its formulation.3
1. Actavis receives FDA approval of Saphris for pediatric patients with bipolar I disorder. Drugs.com. http://www.drugs.com/newdrugs/actavis-receivesfda-
approval-saphris-pediatric-patients-bipolardisorder-4188.html. Published March 2015. Accessed June 19, 2015.
2. Lincoln J, Preskon S. Asenapine for schizophrenia and bipolar I disorder. Current Psychiatry. 2009;12(8):75-76,83-85.
3. Saphris [package insert]. St. Louis, MO: Forest Pharmaceuticals; 2015.
How to tame the big time wasters in your practice
Pulling up charts. Phone tag. Prior authorizations. Rinse, repeat.
Reminiscent of the movie Groundhog Day, the daily grind in running a practice rarely gives way. Some days there are more faxes to process or paperwork to push than other days but, on the whole, there’s no escaping the tedium and time sink that these gloomy chores engender. In some practices, an assistant is hired to absorb the barrage; if not, it is left to the clinician to handle at the expense of time for patient care or life outside practice.
Compounding matters, creating new systems to assuage these tasks can feel like a sisyphean endeavor, because the energy required to start likely will be more than what is already being expended. For example, switching from paper-based to electronic systems is tantalizing but incurs its own learning curve and has a financial cost. Likewise, hiring administrative help demands a significant investment in training and, if patient contact is part of the job description, even more preparation is necessary because she (he) becomes the public face of the practice. Fortunately, both of these options pay dividends in the long run.
Yet, even with some basic strategies, what seems like the inevitability of inertia can be reshaped into a more efficient, less quotidian experience. Consider the following ways to streamline processes and eliminate time wasted and not spent on providing care.
Patient-specific tasks
Prior authorizations. The typical process is to have to call the insurance company to have the paperwork faxed, burning 5 to 15 minutes by being placed on hold or being transferred between departments. Instead, ask the patient to call the insurance company (she [he] should get the phone number from the pharmacist and have your fax number handy) and request the paperwork, with her (his) demographic information pre-filled in, be faxed to your office. If she is told by the insurance company that the doctor has to call, instruct the patient to explain it is merely a request to have forms faxed and to call again and speak with a different agent if necessary. If the patient pushes back, explaining that this helps keeps your rates lower or from having to bill for this specific time usually smooths things over.
Voicemails. Listening (and re-listening) to a long voicemail takes time. Although using a professional transcription service might be costly, it may be less expensive than your time if you get lots of long voicemails. Or, consider using a service that provides computer-generated transcriptions. Although less accurate, it often allows you to skim and is more affordable.
Scheduling. Booking follow-up appointments during a session uses valuable clinical care time, but booking them outside of session can be laborious. As an alternative, offer online scheduling through your electronic medical record (EMR) or a stand-alone service that allows you to retain control over what times you are available and how soon and far out patients can book. Be sure that only your current patients and, perhaps, colleagues (for scheduling phone calls) have access to your calendar, and make your cancellation policy explicitly clear.
Refill requests. Patients routinely opt-in for automatic prescription refill requests at their pharmacy, believing it is a no-brainer for convenience’s sake. However, for psychiatrists who prescribe only enough refills to last until the patient’s next appointment, these requests can become a burden because they can’t be ignored, but shouldn’t necessarily be acted upon either. Often, time is spent clarifying with the patient if a refill is really needed, and sometimes—consciously or unconsciously— patients use automatic requests to bypass having to come in for an appointment. As an alternative, ask your patients to opt-out of auto-refill programs and to contact you directly if they are about to run out of medication.
Prescreening. An inordinate amount of time can be spent ensuring that a prospective patient is a good fit from a clinical, scheduling, and payment perspective. Save time by having a simple prescreening process that conveys that you care, yet want to make sure certain criteria are met before you accept a patient into the practice. This is where having a trained assistant or an electronic prescreening option can be useful.
Practice at large
Electronic charts. Common complaints about EMRs among users are they are clunky, convoluted, and slow, and the EMR “flow” does not match the provider’s. Although each extra click might only take a few seconds, the loss of rhythm is draining and leads to a dissatisfying, tired feeling. Be sure when selecting an EMR that the user experience is considered as important as functionality.
Billing statements. Write or print, fold, place in an envelope, put a stamp on the envelope, address the envelope, take it to the mailbox. Need more be said about how inefficient this is? Use your EMR, a biller, or billing software to send statements automatically.
Of course, make sure that any method that employs technology or outsourcing to a service has appropriate Health Insurance Portability and Accountability Act safeguards.
Nothing to lose but your chains
Although running a practice gives you some freedom in your schedule, with that comes the shackles of processing administrative tasks that accompany clinical care. Finding ways to handle them more efficiently leads to improved job satisfaction and more time for patient care. You and your patients will both benefit.
Disclosure
Dr. Braslow is the founder of Luminello.com.