User login
Middle East respiratory syndrome: SARS redux?
Middle East respiratory syndrome (MERS) is a potentially lethal illness caused by the Middle East respiratory syndrome coronavirus (MERS-CoV). The virus was first reported in 2012, when it was isolated from the sputum of a previously healthy man in Saudi Arabia who presented with acute pneumonia and subsequent renal failure with a fatal outcome.1 Retrospective studies subsequently identified an earlier outbreak that year involving 13 patients in Jordan, and since then cases have been reported in 25 countries across the Arabian Peninsula and in Asia, Europe, Africa, and the United States, with over 1,000 confirmed cases and 450 related deaths.2,3
At the time of this writing, two cases of MERS have been reported in the United States, both in May 2014. Both reported cases involved patients who had traveled from Saudi Arabia, and which did not result in secondary cases.4 Beginning in May 2015, the Republic of Korea had experienced the largest known outbreak of MERS outside the Arabian Peninsula, with over 100 cases.5
THE VIRUS
MERS-CoV is classified as a coronavirus, which is a family of single-stranded RNA viruses. In 2003, a previously unknown coronavirus (SARS-CoV) caused a global outbreak of pneumonia that resulted in approximately 800 deaths.6 The MERS-CoV virus attaches to dipeptidyl peptidase 4 to enter cells, and this receptor is believed to be critical for pathogenesis, as infection does not occur in its absence.7
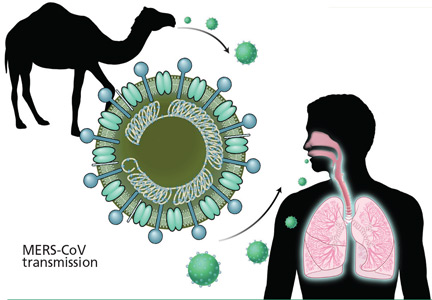
The source and mode of transmission to humans is not completely defined. Early reports suggested that MERS-CoV originated in bats, as RNA sequences related to MERS-CoV have been found in several bat species, but the virus itself has not been isolated from bats.8 Camels have been found to have a high rate of anti-MERS-CoV antibodies and to have the virus in nose swabs, and evidence for camel-to-human transmission has been presented.9–11 However, the precise role of camels and other animals as reservoirs or vectors of infection is still under investigation.
The incubation period from exposure to the development of clinical disease is estimated at 5 to 14 days.
For MERS-CoV, the basic reproduction ratio (R0), which measures the average number of secondary cases from each infected person, is estimated12 to be less than 0.7. In diseases in which the R0 is less than 1.0, infections occur in isolated clusters as limited chains of transmission, and thus the sustained transmission of MERS-CoV resulting in a large epidemic is thought to be unlikely. As a comparison, the median R0 value for seasonal influenza is estimated13 at 1.28. “Superspreading” may result in limited outbreaks of secondary cases; however, the continued epidemic spread of infection is thought to be unlikely.14 Nevertheless, viral adaptation with increased transmissibility remains a concern and a potential threat.
CLINICAL PRESENTATION
MERS most commonly presents as a respiratory illness, although asymptomatic infection occurs. The percentage of patients who experience asymptomatic infection is unknown. A recent survey of 255 patients with laboratory-confirmed MERS-CoV found that 64 (25.1%) were reported as asymptomatic at time of specimen collection. However, when 33 (52%) of those patients were interviewed, 26 (79%) reported at least one symptom that was consistent with a viral respiratory illness.15
For symptomatic patients, the initial complaints are nonspecific, beginning with fever, cough, sore throat, chills, and myalgia. Patients experiencing severe infection progress to dyspnea and pneumonia, with requirements for ventilatory support, vasopressors, and renal replacement therapy.16 Gastrointestinal symptoms such as vomiting and diarrhea have been reported in about one-third of patients.17
In a study of 47 patients with MERS-CoV, most of whom had underlying medical illnesses, 42 (89%) required intensive care and 34 (72%) required mechanical ventilation.17 The case-fatality rate in this study was 60%, but other studies have reported rates closer to 30%.15
Laboratory findings in patients with MERS-CoV infection usually include leukopenia and thrombocytopenia. Severely ill patients may have evidence of acute kidney injury.
Radiographic findings of MERS are those of viral pneumonitis and acute respiratory distress syndrome. Computed tomographic findings include ground-glass opacities, with peripheral lower-lobe preference.18
DIAGNOSIS
As MERS is a respiratory illness, sampling of respiratory secretions provides the highest yield for diagnosis. A study of 112 patients with MERS-CoV reported that polymerase chain reaction (PCR) testing of tracheal aspirates and bronchoalveolar lavage samples yielded significantly higher MERS-CoV loads than nasopharyngeal swab samples and sputum samples.19 However, upper respiratory tract testing is less invasive, and a positive nasopharyngeal swab result may obviate the need for further testing.
The US Centers for Disease Control and Prevention (CDC) recommends collecting multiple specimens from different sites at different times after the onset of symptoms in order to increase the diagnostic yield. Specifically, it recommends testing a lower respiratory specimen (eg, sputum, bronchoalveolar lavage fluid, tracheal aspirate), a nasopharyngeal and oropharyngeal swab, and serum, using the CDC MERS-CoV rRT-PCR assay. In addition, for patients whose symptoms began more than 14 days earlier, the CDC also recommends testing a serum specimen with the CDC MERS-CoV serologic assay. As these guidelines are updated frequently, clinicians are advised to check the CDC website for the most up-to-date information (www.cdc.gov/coronavirus/mers/guidelines-clinical-specimens.html).20 The identification of MERS-CoV by virus isolation in cell culture is not recommended and, if pursued, must be performed in a biosafety level 3 facility. (Level 3 is the second-highest level of biosafety. The highest, level 4, is reserved for extremely dangerous agents such as Ebola virus).20
Given the nonspecific clinical presentation of MERS-CoV, clinicians may consider testing for other respiratory pathogens. A recent review of 54 travelers to California from MERS-CoV-affected areas found that while none tested positive for MERS-CoV, 32 (62%) of 52 travelers had other respiratory viruses.21 When testing for alternative pathogens, clinicians should order molecular or antigen-based detection methods.
TREATMENT
Unfortunately, treatment for MERS is primarily supportive.
Ribavirin and interferon alfa-2b demonstrated activity in an animal model, but the regimen was ineffective when given a median of 19 (range 10–22) days after admission in 5 critically ill patients who subsequently died.22 A retrospective analysis comparing 20 patients with severe MERS-CoV who received ribavirin and interferon alfa-2a with 24 patients who did not reported that while survival was improved at 14 days, the mortality rates were similar at 28 days.23
A systematic review of treatments used for severe acute respiratory syndrome (SARS) reported that most studies investigating steroid use were inconclusive and some showed possible harm, suggesting that systemic steroids should be avoided in coronavirus infections.24
PREVENTION
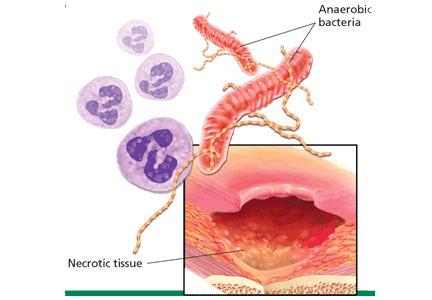
Healthcare-associated outbreaks of MERS are well described, and thus recognition of potential cases and prompt institution of appropriate infection control measures are critical.15,25
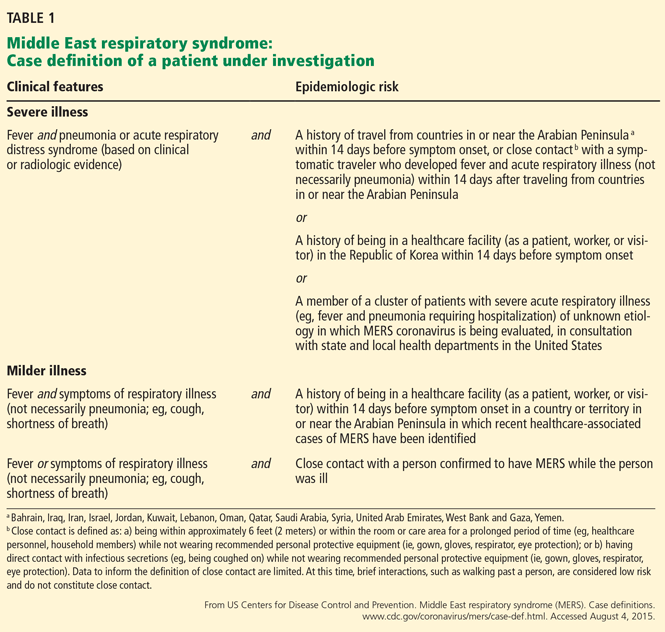
Healthcare providers should ask patients about recent travel history and ascertain if they meet the CDC criteria for a “patient under investigation” (PUI), ie, if they have both clinical features and an epidemiologic risk of MERS (Table 1). However, these recommendations for identification will assuredly change as the outbreak matures, and healthcare providers should refer to the CDC website for the most up-to-date information.
Once a PUI is identified, standard, contact, and airborne precautions are advised. These measures include performing hand hygiene and donning personal protective equipment, including gloves, gowns, eye protection, and respiratory protection (ie, a respirator) that is at least as protective as a fit-tested National Institute for Occupational Safety and Health-certified N95 filtering face-piece respirator. In addition, a patient with possible MERS should be placed in an airborne infection isolation room.
Traveler’s advice
The CDC does not currently recommend that Americans change their travel plans because of MERS. Clinicians performing pretravel evaluations should advise patients of current information on MERS. Patients at risk for MERS who develop a respiratory illness within 14 days of return should seek medical attention and inform healthcare providers of their travel history.
SUMMARY
Recent experience with SARS, Ebola virus disease, and now MERS-CoV highlights the impact of global air travel as a vector for the rapid worldwide dissemination of communicable diseases. Healthcare providers should elicit a travel history in all patients presenting with a febrile illness, as an infection acquired in one continent may not become manifest until the patient presents in another.
The scope of the current MERS-CoV outbreak is still evolving, with concerns that viral evolution could result in a SARS-like outbreak, as experienced almost a decade ago.
Healthcare providers are advised to screen patients at risk for MERS-CoV for respiratory symptoms, and to institute appropriate infection control measures. Through recognition and isolation, healthcare providers are at the front line in limiting the spread of this potentially lethal virus.
- Zaki AM, van Boheemen S, Bestebroer TM, Osterhaus ADME, Fouchier RAM. Isolation of a novel coronavirus from a man with pneumonia in Saudi Arabia. N Engl J Med 2012; 367:1814–1820.
- Al-Abdallat MM, Payne DC, Alqasrawi S, et al. Hospital-associated outbreak of Middle East respiratory syndrome coronavirus: a serologic, epidemiologic, and clinical description. Clin Infect Dis 2014; 59:1225–1233.
- World Health Organization. Frequently asked questions on Middle East respiratory syndrome coronavirus (MERS-CoV). www.who.int/csr/disease/coronavirus_infections/faq/en/. Accessed July 29, 2015.
- Bialek SR, Allen D, Alvarado-Ramy F, et al; Centers for Disease Control and Prevention (CDC). First confirmed cases of Middle East respiratory syndrome coronavirus (MERS-CoV) infection in the United States, updated information on the epidemiology of MERS-CoV infection, and guidance for the public, clinicians, and public health authorities—May 2014. MMWR Morb Mortal Wkly Rep 2014; 63:431–436.
- World Health Organization. Middle East respiratory syndrome coronavirus (MERS-CoV) – Republic of Korea. www.who.int/csr/don/12-june-2015-mers-korea/en/. Accessed July 29, 2015.
- Peiris JSM, Guan Y, Yuen KY. Severe acute respiratory syndrome. Nat Med 2004; 10:S88–S97.
- van Doremalen N, Miazqowicz KL, Milne-Price S, et al. Host species restriction of Middle East respiratory syndrome coronavirus through its receptor, dipeptidyl peptidase 4. J Virol 2014; 88:9220–9232.
- Zumla A, Hui DS, Perlman S. Middle East respiratory syndrome. Lancet 2015; S0140-6736(15)60454-604548 (Epub ahead of print).
- Meyer B, Muller MA, Corman WM, et al. Antibodies against MERS coronavirus in dromedary camels, United Arab Emirates, 2003 and 2013. Emerg Infect Dis 2014; 20:552–559.
- Haagmans BL, Al Dhahiry SH, Reusken CB, et al. Middle East respiratory syndrome coronavirus in dromedary camels: an outbreak investigation. Lancet Infect Dis 2014; 14:140–145.
- Azhar EI, El-Kafrawy SA, Farraj SA, et al. Evidence for camel-to-human transmission of MERS coronavirus. N Engl J Med 2014; 370:2499–2505.
- Chowell G, Blumberg S, Simonsen L, Miller MA, Viboud C. Synthesizing data and models for the spread of MERS-CoV, 2013: key role of index cases and hospital transmission. Epidemics 2014; 9:40–51.
- Biggerstaff M, Chauchemez S, Reed C, Gambhir M, Finelli L. Estimates of the reproduction number for seasonal, pandemic, and zoonotic influenza: a systematic review of the literature. BMC Infect Dis 2014: 14:480.
- Kucharski AJ, Althaus CL. The role of superspreading in Middle East respiratory syndrome coronavirus (MERS-CoV) transmission. Euro Surveill 2015; 20.
- Oboho I, Tomczyk S, Al-Asmari A, et al. 2014 MERS-CoV outbreak in Jeddah—a link to health care facilities. N Engl J Med 2015; 372:846–854.
- Arabi YM, Arifi AA, Balkhy HH, et al. Clinical course and outcomes of critically ill patients with Middle East respiratory syndrome coronavirus infection. Ann Intern Med 2014; 160:389–397.
- Assiri A, Al-Tawfig JA, Al-Rabeeah AA, et al. Epidemiological, demographic, and clinical characteristics of 47 cases of Middle East respiratory syndrome coronavirus disease from Saudi Arabia: a descriptive study. Lancet Infect Dis 2013; 13:752–761.
- Das KM, Lee EY, Enani MA, et al. CT correlation with outcomes in 15 patients with acute Middle East respiratory syndrome coronavirus. AJR Am J Roentgenol 2015; 204:736–742.
- Memish ZA, Al-Tawfiq JA, Makhdoom HQ, et al. Respiratory tract samples, viral load, and genome fraction yield in patients with Middle East respiratory syndrome. J Infect Dis 2014; 210:1590–1594.
- Centers for Disease Control and Prevention. Middle East respiratory syndrome (MERS). Interim guidelines for collecting, handling, and testing clinical specimens from patients under investigation (PUIs) for Middle East respiratory syndrome coronavirus (MERS-CoV)—version 2.1. www.cdc.gov/coronavirus/mers/guidelines-clinical-specimens.html. Accessed July 29, 2015.
- Shakhkarami M, Yen C, Glaser CA, Xia D, Watt J, Wadford DA. Laboratory testing for Middle East respiratory syndrome coronavirus, California, USA, 2013–2014. Emerg Infect Dis 2015; 21: E-pub ahead of print. wwwnc.cdc.gov/eid/article/21/9/15-0476_article. Accessed July 29, 2015.
- Al-Tawfiq JA, Momattin H, Dib J, Memish ZA. Ribavirin and interferon therapy in patients infected with the Middle East respiratory syndrome coronavirus: an observational study. Int J Infect Dis 2014; 20:42–46.
- Omrani AS, Saad MM, Baig K, et al. Ribavirin and interferon alfa-2a for severe Middle East respiratory syndrome coronavirus infection: a retrospective cohort study. Lancet Infect Dis 2014; 14:1090–1095.
- Stockman LJ, Bellamy R, Garner, P. SARS: systematic review of treatment effects. PLoS Med 2006; 3:e343.
- Assiri A, McGeer A, Perl TM, et al; KSA MERS-CoV Investigation Team. Hospital outbreak of Middle East respiratory syndrome coronavirus. N Engl J Med 2013; 369:407–416.
Middle East respiratory syndrome (MERS) is a potentially lethal illness caused by the Middle East respiratory syndrome coronavirus (MERS-CoV). The virus was first reported in 2012, when it was isolated from the sputum of a previously healthy man in Saudi Arabia who presented with acute pneumonia and subsequent renal failure with a fatal outcome.1 Retrospective studies subsequently identified an earlier outbreak that year involving 13 patients in Jordan, and since then cases have been reported in 25 countries across the Arabian Peninsula and in Asia, Europe, Africa, and the United States, with over 1,000 confirmed cases and 450 related deaths.2,3
At the time of this writing, two cases of MERS have been reported in the United States, both in May 2014. Both reported cases involved patients who had traveled from Saudi Arabia, and which did not result in secondary cases.4 Beginning in May 2015, the Republic of Korea had experienced the largest known outbreak of MERS outside the Arabian Peninsula, with over 100 cases.5
THE VIRUS
MERS-CoV is classified as a coronavirus, which is a family of single-stranded RNA viruses. In 2003, a previously unknown coronavirus (SARS-CoV) caused a global outbreak of pneumonia that resulted in approximately 800 deaths.6 The MERS-CoV virus attaches to dipeptidyl peptidase 4 to enter cells, and this receptor is believed to be critical for pathogenesis, as infection does not occur in its absence.7
The source and mode of transmission to humans is not completely defined. Early reports suggested that MERS-CoV originated in bats, as RNA sequences related to MERS-CoV have been found in several bat species, but the virus itself has not been isolated from bats.8 Camels have been found to have a high rate of anti-MERS-CoV antibodies and to have the virus in nose swabs, and evidence for camel-to-human transmission has been presented.9–11 However, the precise role of camels and other animals as reservoirs or vectors of infection is still under investigation.
The incubation period from exposure to the development of clinical disease is estimated at 5 to 14 days.
For MERS-CoV, the basic reproduction ratio (R0), which measures the average number of secondary cases from each infected person, is estimated12 to be less than 0.7. In diseases in which the R0 is less than 1.0, infections occur in isolated clusters as limited chains of transmission, and thus the sustained transmission of MERS-CoV resulting in a large epidemic is thought to be unlikely. As a comparison, the median R0 value for seasonal influenza is estimated13 at 1.28. “Superspreading” may result in limited outbreaks of secondary cases; however, the continued epidemic spread of infection is thought to be unlikely.14 Nevertheless, viral adaptation with increased transmissibility remains a concern and a potential threat.
CLINICAL PRESENTATION
MERS most commonly presents as a respiratory illness, although asymptomatic infection occurs. The percentage of patients who experience asymptomatic infection is unknown. A recent survey of 255 patients with laboratory-confirmed MERS-CoV found that 64 (25.1%) were reported as asymptomatic at time of specimen collection. However, when 33 (52%) of those patients were interviewed, 26 (79%) reported at least one symptom that was consistent with a viral respiratory illness.15
For symptomatic patients, the initial complaints are nonspecific, beginning with fever, cough, sore throat, chills, and myalgia. Patients experiencing severe infection progress to dyspnea and pneumonia, with requirements for ventilatory support, vasopressors, and renal replacement therapy.16 Gastrointestinal symptoms such as vomiting and diarrhea have been reported in about one-third of patients.17
In a study of 47 patients with MERS-CoV, most of whom had underlying medical illnesses, 42 (89%) required intensive care and 34 (72%) required mechanical ventilation.17 The case-fatality rate in this study was 60%, but other studies have reported rates closer to 30%.15
Laboratory findings in patients with MERS-CoV infection usually include leukopenia and thrombocytopenia. Severely ill patients may have evidence of acute kidney injury.
Radiographic findings of MERS are those of viral pneumonitis and acute respiratory distress syndrome. Computed tomographic findings include ground-glass opacities, with peripheral lower-lobe preference.18
DIAGNOSIS
As MERS is a respiratory illness, sampling of respiratory secretions provides the highest yield for diagnosis. A study of 112 patients with MERS-CoV reported that polymerase chain reaction (PCR) testing of tracheal aspirates and bronchoalveolar lavage samples yielded significantly higher MERS-CoV loads than nasopharyngeal swab samples and sputum samples.19 However, upper respiratory tract testing is less invasive, and a positive nasopharyngeal swab result may obviate the need for further testing.
The US Centers for Disease Control and Prevention (CDC) recommends collecting multiple specimens from different sites at different times after the onset of symptoms in order to increase the diagnostic yield. Specifically, it recommends testing a lower respiratory specimen (eg, sputum, bronchoalveolar lavage fluid, tracheal aspirate), a nasopharyngeal and oropharyngeal swab, and serum, using the CDC MERS-CoV rRT-PCR assay. In addition, for patients whose symptoms began more than 14 days earlier, the CDC also recommends testing a serum specimen with the CDC MERS-CoV serologic assay. As these guidelines are updated frequently, clinicians are advised to check the CDC website for the most up-to-date information (www.cdc.gov/coronavirus/mers/guidelines-clinical-specimens.html).20 The identification of MERS-CoV by virus isolation in cell culture is not recommended and, if pursued, must be performed in a biosafety level 3 facility. (Level 3 is the second-highest level of biosafety. The highest, level 4, is reserved for extremely dangerous agents such as Ebola virus).20
Given the nonspecific clinical presentation of MERS-CoV, clinicians may consider testing for other respiratory pathogens. A recent review of 54 travelers to California from MERS-CoV-affected areas found that while none tested positive for MERS-CoV, 32 (62%) of 52 travelers had other respiratory viruses.21 When testing for alternative pathogens, clinicians should order molecular or antigen-based detection methods.
TREATMENT
Unfortunately, treatment for MERS is primarily supportive.
Ribavirin and interferon alfa-2b demonstrated activity in an animal model, but the regimen was ineffective when given a median of 19 (range 10–22) days after admission in 5 critically ill patients who subsequently died.22 A retrospective analysis comparing 20 patients with severe MERS-CoV who received ribavirin and interferon alfa-2a with 24 patients who did not reported that while survival was improved at 14 days, the mortality rates were similar at 28 days.23
A systematic review of treatments used for severe acute respiratory syndrome (SARS) reported that most studies investigating steroid use were inconclusive and some showed possible harm, suggesting that systemic steroids should be avoided in coronavirus infections.24
PREVENTION
Healthcare-associated outbreaks of MERS are well described, and thus recognition of potential cases and prompt institution of appropriate infection control measures are critical.15,25
Healthcare providers should ask patients about recent travel history and ascertain if they meet the CDC criteria for a “patient under investigation” (PUI), ie, if they have both clinical features and an epidemiologic risk of MERS (Table 1). However, these recommendations for identification will assuredly change as the outbreak matures, and healthcare providers should refer to the CDC website for the most up-to-date information.
Once a PUI is identified, standard, contact, and airborne precautions are advised. These measures include performing hand hygiene and donning personal protective equipment, including gloves, gowns, eye protection, and respiratory protection (ie, a respirator) that is at least as protective as a fit-tested National Institute for Occupational Safety and Health-certified N95 filtering face-piece respirator. In addition, a patient with possible MERS should be placed in an airborne infection isolation room.
Traveler’s advice
The CDC does not currently recommend that Americans change their travel plans because of MERS. Clinicians performing pretravel evaluations should advise patients of current information on MERS. Patients at risk for MERS who develop a respiratory illness within 14 days of return should seek medical attention and inform healthcare providers of their travel history.
SUMMARY
Recent experience with SARS, Ebola virus disease, and now MERS-CoV highlights the impact of global air travel as a vector for the rapid worldwide dissemination of communicable diseases. Healthcare providers should elicit a travel history in all patients presenting with a febrile illness, as an infection acquired in one continent may not become manifest until the patient presents in another.
The scope of the current MERS-CoV outbreak is still evolving, with concerns that viral evolution could result in a SARS-like outbreak, as experienced almost a decade ago.
Healthcare providers are advised to screen patients at risk for MERS-CoV for respiratory symptoms, and to institute appropriate infection control measures. Through recognition and isolation, healthcare providers are at the front line in limiting the spread of this potentially lethal virus.
- Zaki AM, van Boheemen S, Bestebroer TM, Osterhaus ADME, Fouchier RAM. Isolation of a novel coronavirus from a man with pneumonia in Saudi Arabia. N Engl J Med 2012; 367:1814–1820.
- Al-Abdallat MM, Payne DC, Alqasrawi S, et al. Hospital-associated outbreak of Middle East respiratory syndrome coronavirus: a serologic, epidemiologic, and clinical description. Clin Infect Dis 2014; 59:1225–1233.
- World Health Organization. Frequently asked questions on Middle East respiratory syndrome coronavirus (MERS-CoV). www.who.int/csr/disease/coronavirus_infections/faq/en/. Accessed July 29, 2015.
- Bialek SR, Allen D, Alvarado-Ramy F, et al; Centers for Disease Control and Prevention (CDC). First confirmed cases of Middle East respiratory syndrome coronavirus (MERS-CoV) infection in the United States, updated information on the epidemiology of MERS-CoV infection, and guidance for the public, clinicians, and public health authorities—May 2014. MMWR Morb Mortal Wkly Rep 2014; 63:431–436.
- World Health Organization. Middle East respiratory syndrome coronavirus (MERS-CoV) – Republic of Korea. www.who.int/csr/don/12-june-2015-mers-korea/en/. Accessed July 29, 2015.
- Peiris JSM, Guan Y, Yuen KY. Severe acute respiratory syndrome. Nat Med 2004; 10:S88–S97.
- van Doremalen N, Miazqowicz KL, Milne-Price S, et al. Host species restriction of Middle East respiratory syndrome coronavirus through its receptor, dipeptidyl peptidase 4. J Virol 2014; 88:9220–9232.
- Zumla A, Hui DS, Perlman S. Middle East respiratory syndrome. Lancet 2015; S0140-6736(15)60454-604548 (Epub ahead of print).
- Meyer B, Muller MA, Corman WM, et al. Antibodies against MERS coronavirus in dromedary camels, United Arab Emirates, 2003 and 2013. Emerg Infect Dis 2014; 20:552–559.
- Haagmans BL, Al Dhahiry SH, Reusken CB, et al. Middle East respiratory syndrome coronavirus in dromedary camels: an outbreak investigation. Lancet Infect Dis 2014; 14:140–145.
- Azhar EI, El-Kafrawy SA, Farraj SA, et al. Evidence for camel-to-human transmission of MERS coronavirus. N Engl J Med 2014; 370:2499–2505.
- Chowell G, Blumberg S, Simonsen L, Miller MA, Viboud C. Synthesizing data and models for the spread of MERS-CoV, 2013: key role of index cases and hospital transmission. Epidemics 2014; 9:40–51.
- Biggerstaff M, Chauchemez S, Reed C, Gambhir M, Finelli L. Estimates of the reproduction number for seasonal, pandemic, and zoonotic influenza: a systematic review of the literature. BMC Infect Dis 2014: 14:480.
- Kucharski AJ, Althaus CL. The role of superspreading in Middle East respiratory syndrome coronavirus (MERS-CoV) transmission. Euro Surveill 2015; 20.
- Oboho I, Tomczyk S, Al-Asmari A, et al. 2014 MERS-CoV outbreak in Jeddah—a link to health care facilities. N Engl J Med 2015; 372:846–854.
- Arabi YM, Arifi AA, Balkhy HH, et al. Clinical course and outcomes of critically ill patients with Middle East respiratory syndrome coronavirus infection. Ann Intern Med 2014; 160:389–397.
- Assiri A, Al-Tawfig JA, Al-Rabeeah AA, et al. Epidemiological, demographic, and clinical characteristics of 47 cases of Middle East respiratory syndrome coronavirus disease from Saudi Arabia: a descriptive study. Lancet Infect Dis 2013; 13:752–761.
- Das KM, Lee EY, Enani MA, et al. CT correlation with outcomes in 15 patients with acute Middle East respiratory syndrome coronavirus. AJR Am J Roentgenol 2015; 204:736–742.
- Memish ZA, Al-Tawfiq JA, Makhdoom HQ, et al. Respiratory tract samples, viral load, and genome fraction yield in patients with Middle East respiratory syndrome. J Infect Dis 2014; 210:1590–1594.
- Centers for Disease Control and Prevention. Middle East respiratory syndrome (MERS). Interim guidelines for collecting, handling, and testing clinical specimens from patients under investigation (PUIs) for Middle East respiratory syndrome coronavirus (MERS-CoV)—version 2.1. www.cdc.gov/coronavirus/mers/guidelines-clinical-specimens.html. Accessed July 29, 2015.
- Shakhkarami M, Yen C, Glaser CA, Xia D, Watt J, Wadford DA. Laboratory testing for Middle East respiratory syndrome coronavirus, California, USA, 2013–2014. Emerg Infect Dis 2015; 21: E-pub ahead of print. wwwnc.cdc.gov/eid/article/21/9/15-0476_article. Accessed July 29, 2015.
- Al-Tawfiq JA, Momattin H, Dib J, Memish ZA. Ribavirin and interferon therapy in patients infected with the Middle East respiratory syndrome coronavirus: an observational study. Int J Infect Dis 2014; 20:42–46.
- Omrani AS, Saad MM, Baig K, et al. Ribavirin and interferon alfa-2a for severe Middle East respiratory syndrome coronavirus infection: a retrospective cohort study. Lancet Infect Dis 2014; 14:1090–1095.
- Stockman LJ, Bellamy R, Garner, P. SARS: systematic review of treatment effects. PLoS Med 2006; 3:e343.
- Assiri A, McGeer A, Perl TM, et al; KSA MERS-CoV Investigation Team. Hospital outbreak of Middle East respiratory syndrome coronavirus. N Engl J Med 2013; 369:407–416.
KEY POINTS
- In MERS, initial complaints are of fever, cough, chills and myalgia. In a subset of patients, usually those with underlying illnesses, the disease can progress to fulminant sepsis with respiratory and renal failure and death.
- Healthcare providers should regularly visit the US Centers for Disease Control and Prevention website for current information on countries experiencing a MERS outbreak, and for advice on how to identify a potentially infected patient.
- MERS-CoV has caused several healthcare-related outbreaks, so prompt identification and isolation of infected patients is critical to limiting the spread of infection. A “patient under identification” (ie, a person who has both clinical features and an epidemiologic risk) should be cared for under standard, contact, and airborne precautions.
Troponin elevation after noncardiac surgery: Significance and management
More than 200 million patients undergo noncardiac surgery each year, and the volume is increasing.1 Cardiovascular complications are a major cause of morbidity and mortality in the perioperative period.
Before the advent of modern cardiac biomarkers, an estimated 2% to 3% of all patients undergoing noncardiac surgery had a major adverse cardiac event.2 However, more recent studies suggest that 5% to 25% of patients have troponin elevations after noncardiac surgery, depending on the patient population,3–6 and many are asymptomatic, suggesting that many patients are sustaining undetected myocardial injury. Those who suffer a myocardial infarction or myocardial injury have elevated morbidity and mortality rates, not only perioperatively, but also at 30 days and even at up to 1 year.3–5,7–11
Yet there are almost no data on how best to manage these patients; the available guidelines, therefore, do not provide sufficient recommendations for clinical practice.
To address the lack of guidelines, we examine the incidence and proposed mechanisms of myocardial injury after noncardiac surgery, suggest an approach to identifying patients at risk, recommend treatment strategies, and consider future directions.
CARDIAC BIOMARKERS
When cardiac cellular injury from ischemia, direct trauma, or other cause disrupts the cell membrane, intracellular contents enter the extracellular space, including the blood stream. If the myocyte damage is extensive enough, biochemical assays can detect these substances.

Troponin, creatine kinase, myoglobin, and lactate dehydrogenase are common biomarkers of necrosis that, when detected in the plasma, may indicate cardiac injury. Each can be detected at varying times after cardiac injury (Figure 1).12
Cardiac troponins I and T
Of the biomarkers, cardiac troponin I and cardiac troponin T are now the most widely used and are the most specific for myocyte injury.
Troponins are proteins that regulate the calcium-induced interaction between myosin and actin that results in muscle contraction. Troponin is a complex consisting of three subunits: troponin C, troponin I, and troponin T. The cardiac troponin I and T isoforms are distinct from those found in skeletal muscle, making them specific for myocyte injury, and they are currently the recommended markers for diagnosing acute myocardial infarction.13
The troponin immunoassays currently available are not standardized among laboratories and point-of-care methods, and thus, levels cannot be compared across testing centers.14 Each assay has unique performance characteristics, but guidelines recommend using the 99th percentile value from a normal reference population for a given assay to define whether myocardial injury is present.13
Troponin elevation has prognostic value in patients presenting with acute coronary syndromes,15–18 and the degree of elevation correlates with infarct size.19–21
Controversy exists as to whether troponin and other biomarkers are released only after myocardial necrosis or after reversible injury as well. Using newer, highly sensitive assays, troponin elevations have been detected after short periods of ischemia during stress testing22,23 and in patients with stable angina,24 suggesting that reversible cardiac stress and injury can lead to troponin release. This mechanism may play an important role during the myocardial injury that can occur in patients undergoing noncardiac surgery.
MYOCARDIAL INFARCTION vs MYOCARDIAL INJURY
In 2000, the Joint Task Force of the European Society of Cardiology, American College of Cardiology Foundation, American Heart Association, and World Heart Federation revised the criteria for the diagnosis of myocardial infarction created by the World Health Organization in 1979. The definition was revised again in 2007 and once more in 2012 to create the third universal definition of myocardial infarction.
Acute myocardial infarction
Acute myocardial infarction is defined as evidence of myocardial necrosis in a setting of myocardial ischemia, not related to causes such as trauma or pulmonary embolism, with a rise or a fall (or a rise and a fall) of cardiac biomarkers (at least one value being above the 99th percentile in the reference population) and any of the following:
- Symptoms of ischemia
- New ST-segment changes or new left bundle branch block
- Pathologic Q waves
- Imaging evidence of new loss of viable myocardium or new regional wall-motion abnormality
- Intracoronary thrombus by angiography or autopsy.13
Myocardial injury after noncardiac surgery
Studies10,11 have shown that many patients undergoing noncardiac surgery have evidence of cardiac biomarker release but do not meet the universal definition of myocardial infarction.
The Perioperative Ischemic Evaluation (POISE) trial10 reported that 415 (5%) of its patients met the definition of myocardial infarction, of whom only about 35% had symptoms of ischemia. Another 697 patients (8.3%) had isolated elevations in biomarkers without meeting the definition of myocardial infarction.
The VISION study11 (Vascular Events in Noncardiac Surgery Patients Cohort Evaluation) prospectively screened more than 15,000 patients in several countries for troponin elevation during the first 3 postoperative days and for ischemic symptoms and features. Of the patients screened, approximately 1,200 (8%) had troponin elevations, with fewer than half fulfilling the criteria for myocardial infarction.
In another study, van Waes et al6 prospectively screened 2,232 patients ages 60 and older undergoing intermediate- to high-risk noncardiac surgery. Troponin levels were elevated in 19% of the patients, but only 10 of these patients met the universal definition of myocardial infarction.
In all of these studies, patients with isolated elevation in myocardial biomarkers had worse short-term and long-term outcomes than those without. These observations led to a proposed definition of “myocardial injury after noncardiac surgery” that is broader than that of myocardial infarction and requires only elevation of cardiac biomarkers judged to be due to myocardial ischemia (ie, not from another obvious cause such as pulmonary embolism or myocarditis).3
FIVE TYPES OF MYOCARDIAL INFARCTION
The Joint Task Force13 categorizes myocardial infarction into five distinct types:
- Type 1—due to plaque rupture
- Type 2—due to imbalance between oxygen supply and demand
- Type 3—sudden cardiac death
- Type 4a—associated with percutaneous coronary intervention
- Type 4b—associated with stent thrombosis
- Type 5—associated with coronary artery bypass surgery.
Types 1 and 2 have both been implicated in perioperative myocardial infarction and injury. Patient characteristics and the physiologic response to surgical and anesthetic stressors likely contribute to the development of myocardial infarction and injury after noncardiac surgery.
Plaque rupture as a cause of postoperative myocardial infarction
The mechanism of type 1 myocardial infarction—plaque rupture or erosion leading to thrombosis and infarction—plays a significant role in most cases of acute coronary syndromes. Its role in perioperative and postoperative myocardial infarction or injury, however, is less clear.
In an autopsy study of 26 patients who died of myocardial infarction after noncardiac surgery, plaque rupture was evident in 12 (46%).25 A prospective angiographic study of 120 patients with acute coronary syndromes after noncardiac surgery found that nearly 50% had evidence of plaque rupture.26
Higher levels of catecholamines, cortisol,27,28 platelet reactivity,29 procoagulant factors,30 and coronary artery shear stress31 are all present in the postoperative period and may contribute to an increased propensity for plaque rupture or erosion. Whether plaque rupture is present in patients who have isolated troponin elevation but do not meet the criteria for myocardial infarction has not been investigated.
Oxygen supply-demand imbalance during and after surgery
Oxygen supply-demand imbalance (the mechanism in type 2 myocardial infarction) leading to myocyte stress, ischemia, and subsequent infarction is likely common in the perioperative and postoperative periods. As previously discussed, this imbalance may be present with or without symptoms.
Oxygen demand may increase in this period as a result of tachycardia32 caused by bleeding, pain, and catecholamines or increased wall stress from hypertension due to vasoconstriction or pain.33 Oxygen supply can be decreased secondary to tachycardia, anemia,34 hypotension, hypoxemia, hypercarbia, intravascular fluid shifts (bleeding or volume overload), or coronary vasoconstriction.33,35
These mechanisms of myocardial injury, infarction, or both can occur with or without underlying significant obstructive coronary artery disease. However, severe coronary artery disease is more common in those who have had a perioperative myocardial infarction.36
POSTOPERATIVE TROPONIN ELEVATION CARRIES A WORSE PROGNOSIS
Patients who suffer a myocardial infarction after noncardiac surgery have worse short- and long-term outcomes than their counterparts.4,5,7, 8,10,33 In the POISE trial,10 the 30-day mortality rate was 11.6% in those who had had a perioperative myocardial infarction, compared with 2.2% in those who did not (P < .001). The patients who had had a myocardial infarction were also more likely to have nonfatal cardiac arrest, coronary revascularization, and congestive heart failure.
Myocardial injury not fulfilling the criteria for myocardial infarction after noncardiac surgery is also associated with worse short-term and long-term outcomes.3,6,10,11,37,38 POISE patients with isolated elevations in cardiac biomarkers had a higher 30-day risk of coronary revascularization and nonfatal arrest.10 In the VISION trial, an elevation in troponin was the strongest predictor of death within 30 days after noncardiac surgery. This analysis also showed that the higher the peak troponin value, the greater the risk of death and the shorter the median time until death.11
A meta-analysis of 14 studies in 3,139 patients found that elevated troponin after noncardiac surgery was an independent predictor of death within 1 year (odds ratio [OR] 6.7, 95% confidence interval [CI] 4.1–10.9) and beyond 1 year (OR 1.8, 95% CI 1.4–2.3).37
SHOULD SCREENING BE ROUTINE AFTER NONCARDIAC SURGERY?
Since patients suffering myocardial infarction or injury after noncardiac surgery have a worse prognosis, many experts advocate routinely screening all high-risk patients and those undergoing moderate- to high-risk surgery. Many tools exist to determine which patients undergoing noncardiac surgery are at high risk of cardiac complications.
The revised Goldman Cardiac Risk Index is commonly used and well validated. Variables in this index that predict major cardiac complications are:
- High-risk surgery (vascular surgery, orthopedic surgery, and intraperitoneal or intrathoracic surgery)
- History of ischemic heart disease
- History of congestive heart failure
- History of cerebrovascular disease
- Diabetes requiring insulin therapy
- Chronic kidney disease with a creatinine > 2.0 mg/dL.
The more of these variables that are present, the higher the risk of perioperative cardiac events2,4:
- No risk factors: 0.4% risk (95% CI 0.1–0.8)
- One risk factor: 1.0% risk (95% CI 0.5–1.4)
- Two risk factors: 2.4% risk (95% CI 1.3–3.5)
- Three or more risk factors: 5.4% risk (95% CI 2.7–7.9).
Current guidelines from the American College of Cardiology and the American Heart Association give a class I recommendation (the highest) for measuring troponin levels after noncardiac surgery in patients who have symptoms or signs suggesting myocardial ischemia. They give a class IIb recommendation (usefulness is less well established) for screening those at high risk but without symptoms or signs of ischemia, despite the previously cited evidence that patients with troponin elevation are at increased risk. The IIb recommendation is due to a lack of validated treatment strategies to modify and attenuate the recognized risk with troponin elevation in this setting.39
LITTLE EVIDENCE TO GUIDE TREATMENT
In current practice, internists and cardiologists are often asked to consult on patients with troponin elevations noted after noncardiac surgery. Although published and ongoing studies examine strategies to prevent cardiovascular events during noncardiac surgery, we lack data on managing the cases of myocardial infarction and injury that actually occur after noncardiac surgery.
When managing a patient who has a troponin elevation after surgery, many clinical factors must be weighed, including hemodynamic and clinical stability and risk of bleeding. Confronted with ST-segment elevation myocardial infarction or high-risk non–ST-segment elevation myocardial infarction, most clinicians would favor an early invasive reperfusion strategy in accordance with guidelines on managing acute coronary syndrome. Fibrinolytic drugs for ST-segment elevation myocardial infarction are likely to be contraindicated in the postoperative period because they pose an unacceptable risk of bleeding.
Guideline-directed medical therapies for those suffering perioperative myocardial infarction may lower the risk of future cardiovascular events, as suggested by a retrospective study of 66 patients diagnosed with perioperative myocardial infarction after vascular surgery.40 Those in whom medical therapy for coronary artery disease was not intensified—defined as adding or increasing the dose of antiplatelet agent, statin, beta-blocker, or angiotensin-converting enzyme inhibitor—had higher rates of cardiovascular events at 12 months (hazard ratio [HR] 2.80, 95% CI 1.05–24.2).40
In those with asymptomatic myocardial infarction or isolated elevation in cardiac biomarkers, no treatment strategies have been assessed prospectively or in randomized trials. However, statins and aspirin have been suggested as providing some benefit. In a substudy of the POISE trial, the use of aspirin was associated with a 46% reduction in the 30-day mortality rate in those suffering a perioperative myocardial infarction, and statins were associated with a 76% reduction.10 In a single-center retrospective analysis of 337 patients undergoing moderate- to high-risk vascular surgery, statin therapy was associated with a lower 1-year mortality rate (OR 0.63, 95% CI 0.40–0.98).38
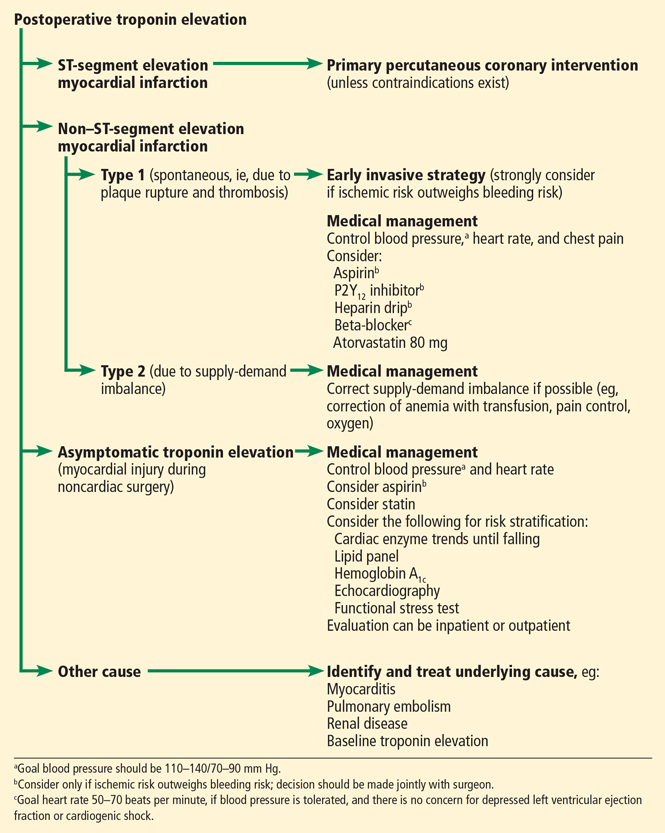
We propose a treatment algorithm for patients identified as having cardiovascular events after noncardiac surgery (Figure 2), based on current evidence and guidelines. Ultimately, treatment decisions should be tailored to the individual patient. Discussion of the risks and benefits of therapeutic options should include the patient and surgeon.
Ongoing and future trials
Ongoing and future trials are aimed at addressing definitive treatment strategies in this patient population.
The MANAGE trial (Management of Myocardial Injury After Non-cardiac Surgery Trial) is randomizing patients suffering myocardial injury after noncardiac surgery to receive either dabigatran and omeprazole or placebo to assess the efficacy of these agents in preventing major adverse cardiac events and the safety of anticoagulation (ClinicalTrials.gov Identifier: NCT01661101).
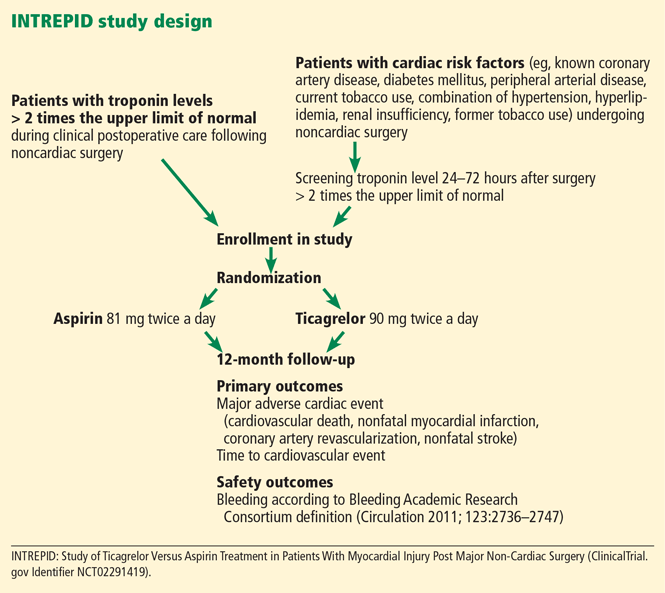
The INTREPID trial (Study of Ticagrelor Versus Aspirin Treatment in Patients With Myocardial Injury Post Major Non-Cardiac Surgery) will assess the efficacy and safety of ticagrelor treatment compared with aspirin in a similar population (ClinicalTrial.gov Identifier: NCT02291419). The trial will enroll approximately 1,000 patients identified as having a postoperative troponin elevation more than two times the upper limit of normal of the assay during the index hospitalization (Figure 3). Enrollment was to have begun in mid-2015.
- Weiser TG, Regenbogen SE, Thompson KD, et al. An estimation of the global volume of surgery: a modelling strategy based on available data. Lancet 2008; 372:139–144.
- Lee TH, Marcantonio ER, Mangione CM, et al. Derivation and prospective validation of a simple index for prediction of cardiac risk of major noncardiac surgery. Circulation 1999; 100:1043–1049.
- Botto F, Alonso-Coello P, Chan MT, et al. Myocardial injury after noncardiac surgery: a large, international, prospective cohort study establishing diagnostic criteria, characteristics, predictors, and 30-day outcomes. Anesthesiology 2014; 120:564–578.
- Devereaux PJ, Goldman L, Cook DJ, Gilbert K, Leslie K, Guyatt GH. Perioperative cardiac events in patients undergoing noncardiac surgery: a review of the magnitude of the problem, the pathophysiology of the events and methods to estimate and communicate risk. CMAJ 2005; 173:627–634.
- McFalls EO, Ward HB, Moritz TE, et al. Predictors and outcomes of a perioperative myocardial infarction following elective vascular surgery in patients with documented coronary artery disease: results of the CARP trial. Eur Heart J 2008; 29:394–401.
- van Waes JA, Nathoe HM, de Graaff JC, et al. Myocardial injury after noncardiac surgery and its association with short-term mortality. Circulation 2013; 127:2264–2271.
- Badner NH, Knill RL, Brown JE, Novick TV, Gelb AW. Myocardial infarction after noncardiac surgery. Anesthesiology 1998; 88:572–578.
- Kim LJ, Martinez EA, Faraday N, et al. Cardiac troponin I predicts short-term mortality in vascular surgery patients. Circulation 2002; 106:2366–2371.
- Landesberg G, Shatz V, Akopnik I, et al. Association of cardiac troponin, CK-MB, and postoperative myocardial ischemia with long-term survival after major vascular surgery. J Am Coll Cardiol 2003; 42:1547–1554.
- Devereaux PJ, Xavier D, Pogue J, et al. Characteristics and short-term prognosis of perioperative myocardial infarction in patients undergoing noncardiac surgery: a cohort study. Ann Intern Med 2011; 154:523–528.
- Devereaux PJ, Chan MT, Alonso-Coello P, et al. Association between postoperative troponin levels and 30-day mortality among patients undergoing noncardiac surgery. JAMA 2012; 307:2295–2304.
- Kumar A, Cannon CP. Acute coronary syndromes: diagnosis and management, part I. Mayo Clin Proc 2009; 84:917–938.
- Thygesen K, Alpert JS, Jaffe AS, et al. Third universal definition of myocardial infarction. Circulation 2012; 126:2020–2035.
- Apple FS, Quist HE, Doyle PJ, Otto AP, Murakami MM. Plasma 99th percentile reference limits for cardiac troponin and creatine kinase MB mass for use with European Society of Cardiology/American College of Cardiology consensus recommendations. Clin Chem 2003; 49:1331–1336.
- Ottani F, Galvani M, Nicolini FA, et al. Elevated cardiac troponin levels predict the risk of adverse outcome in patients with acute coronary syndromes. Am Heart J 2000; 140:917–927.
- Ohman EM, Armstrong PW, White HD, et al. Risk stratification with a point-of-care cardiac troponin T test in acute myocardial infarction. GUSTO III investigators. Global Use of Strategies to Open Occluded Coronary Arteries. Am J Cardiol 1999; 84:1281–1286.
- deFilippi CR, Tocchi M, Parmar RJ, et al. Cardiac troponin T in chest pain unit patients without ischemic electrocardiographic changes: angiographic correlates and long-term clinical outcomes. J Am Coll Cardiol 2000; 35:1827–1834.
- Heidenreich PA, Alloggiamento T, Melsop K, McDonald KM, Go AS, Hlatky MA. The prognostic value of troponin in patients with non-ST elevation acute coronary syndromes: a meta-analysis. J Am Coll Cardiol 2001; 38:478–485.
- Steen H, Giannitsis E, Futterer S, Merten C, Juenger C, Katus HA. Cardiac troponin T at 96 hours after acute myocardial infarction correlates with infarct size and cardiac function. J Am Coll Cardiol 2006; 48:2192–2194.
- Licka M, Zimmermann R, Zehelein J, Dengler TJ, Katus HA, Kubler W. Troponin T concentrations 72 hours after myocardial infarction as a serological estimate of infarct size. Heart 2002; 87:520–524.
- Vasile VC, Babuin L, Giannitsis E, Katus HA, Jaffe AS. Relationship of MRI-determined infarct size and cTnI measurements in patients with ST-elevation myocardial infarction. Clin Chem 2008; 54:617–619.
- Sabatine MS, Morrow DA, de Lemos JA, Jarolim P, Braunwald E. Detection of acute changes in circulating troponin in the setting of transient stress test-induced myocardial ischaemia using an ultrasensitive assay: results from TIMI 35. Eur Heart J 2009; 30:162–169.
- Siriwardena M, Campbell V, Richards AM, Pemberton CJ. Cardiac biomarker responses to dobutamine stress echocardiography in healthy volunteers and patients with coronary artery disease. Clin Chem 2012; 58:1492–1494.
- Turer AT, Addo TA, Martin JL, et al. Myocardial ischemia induced by rapid atrial pacing causes troponin T release detectable by a highly sensitive assay: insights from a coronary sinus sampling study. J Am Coll Cardiol 2011; 57:2398–2405.
- Cohen MC, Aretz TH. Histological analysis of coronary artery lesions in fatal postoperative myocardial infarction. Cardiovasc Pathol 1999; 8:133–139.
- Gualandro DM, Campos CA, Calderaro D, et al. Coronary plaque rupture in patients with myocardial infarction after noncardiac surgery: frequent and dangerous. Atherosclerosis 2012; 222:191–195.
- Sametz W, Metzler H, Gries M, et al. Perioperative catecholamine changes in cardiac risk patients. Eur J Clin Invest 1999; 29:582–587.
- Frank SM, Higgins MS, Breslow MJ, et al. The catecholamine, cortisol, and hemodynamic responses to mild perioperative hypothermia. A randomized clinical trial. Anesthesiology 1995; 82:83–93.
- Rosenfeld BA, Faraday N, Campbell D, et al. Perioperative platelet reactivity and the effects of clonidine. Anesthesiology 1993; 79:255–261.
- Lison S, Weiss G, Spannagl M, Heindl B. Postoperative changes in procoagulant factors after major surgery. Blood Coagul Fibrinolysis 2011; 22:190–196.
- Fukumoto Y, Hiro T, Fujii T, et al. Localized elevation of shear stress is related to coronary plaque rupture: a 3-dimensional intravascular ultrasound study with in-vivo color mapping of shear stress distribution. J Am Coll Cardiol 2008; 51:645–650.
- Feringa HH, Bax JJ, Boersma E, et al. High-dose beta-blockers and tight heart rate control reduce myocardial ischemia and troponin T release in vascular surgery patients. Circulation 2006; 114:I-344–I-349.
- Landesberg G. The pathophysiology of perioperative myocardial infarction: facts and perspectives. J Cardiothorac Vasc Anesth 2003; 17:90–100.
- Nelson AH, Fleisher LA, Rosenbaum SH. Relationship between postoperative anemia and cardiac morbidity in high-risk vascular patients in the intensive care unit. Crit Care Med 1993; 21:860–866.
- Landesberg G, Beattie WS, Mosseri M, Jaffe AS, Alpert JS. Perioperative myocardial infarction. Circulation 2009; 119:2936–2944.
- Ellis SG, Hertzer NR, Young JR, Brener S. Angiographic correlates of cardiac death and myocardial infarction complicating major nonthoracic vascular surgery. Am J Cardiol 1996; 77:1126–1128.
- Levy M, Heels-Ansdell D, Hiralal R, et al. Prognostic value of troponin and creatine kinase muscle and brain isoenzyme measurement after noncardiac surgery: a systematic review and meta-analysis. Anesthesiology 2011; 114:796–806.
- Garcia S, Marston N, Sandoval Y, et al. Prognostic value of 12-lead electrocardiogram and peak troponin I level after vascular surgery. J Vasc Surg 2013; 57:166–172.
- Fleisher LA, Fleischmann KE, Auerbach AD, et al. 2014 ACC/AHA guideline on perioperative cardiovascular evaluation and management of patients undergoing noncardiac surgery: a report of the American College of Cardiology/American Heart Association task force on practice guidelines. J Am Coll Cardiol 2014; 64:e77–e137.
- Foucrier A, Rodseth R, Aissaoui M, et al. The long-term impact of early cardiovascular therapy intensification for postoperative troponin elevation after major vascular surgery. Anesth Analg 2014; 119:1053–1063.
More than 200 million patients undergo noncardiac surgery each year, and the volume is increasing.1 Cardiovascular complications are a major cause of morbidity and mortality in the perioperative period.
Before the advent of modern cardiac biomarkers, an estimated 2% to 3% of all patients undergoing noncardiac surgery had a major adverse cardiac event.2 However, more recent studies suggest that 5% to 25% of patients have troponin elevations after noncardiac surgery, depending on the patient population,3–6 and many are asymptomatic, suggesting that many patients are sustaining undetected myocardial injury. Those who suffer a myocardial infarction or myocardial injury have elevated morbidity and mortality rates, not only perioperatively, but also at 30 days and even at up to 1 year.3–5,7–11
Yet there are almost no data on how best to manage these patients; the available guidelines, therefore, do not provide sufficient recommendations for clinical practice.
To address the lack of guidelines, we examine the incidence and proposed mechanisms of myocardial injury after noncardiac surgery, suggest an approach to identifying patients at risk, recommend treatment strategies, and consider future directions.
CARDIAC BIOMARKERS
When cardiac cellular injury from ischemia, direct trauma, or other cause disrupts the cell membrane, intracellular contents enter the extracellular space, including the blood stream. If the myocyte damage is extensive enough, biochemical assays can detect these substances.
Troponin, creatine kinase, myoglobin, and lactate dehydrogenase are common biomarkers of necrosis that, when detected in the plasma, may indicate cardiac injury. Each can be detected at varying times after cardiac injury (Figure 1).12
Cardiac troponins I and T
Of the biomarkers, cardiac troponin I and cardiac troponin T are now the most widely used and are the most specific for myocyte injury.
Troponins are proteins that regulate the calcium-induced interaction between myosin and actin that results in muscle contraction. Troponin is a complex consisting of three subunits: troponin C, troponin I, and troponin T. The cardiac troponin I and T isoforms are distinct from those found in skeletal muscle, making them specific for myocyte injury, and they are currently the recommended markers for diagnosing acute myocardial infarction.13
The troponin immunoassays currently available are not standardized among laboratories and point-of-care methods, and thus, levels cannot be compared across testing centers.14 Each assay has unique performance characteristics, but guidelines recommend using the 99th percentile value from a normal reference population for a given assay to define whether myocardial injury is present.13
Troponin elevation has prognostic value in patients presenting with acute coronary syndromes,15–18 and the degree of elevation correlates with infarct size.19–21
Controversy exists as to whether troponin and other biomarkers are released only after myocardial necrosis or after reversible injury as well. Using newer, highly sensitive assays, troponin elevations have been detected after short periods of ischemia during stress testing22,23 and in patients with stable angina,24 suggesting that reversible cardiac stress and injury can lead to troponin release. This mechanism may play an important role during the myocardial injury that can occur in patients undergoing noncardiac surgery.
MYOCARDIAL INFARCTION vs MYOCARDIAL INJURY
In 2000, the Joint Task Force of the European Society of Cardiology, American College of Cardiology Foundation, American Heart Association, and World Heart Federation revised the criteria for the diagnosis of myocardial infarction created by the World Health Organization in 1979. The definition was revised again in 2007 and once more in 2012 to create the third universal definition of myocardial infarction.
Acute myocardial infarction
Acute myocardial infarction is defined as evidence of myocardial necrosis in a setting of myocardial ischemia, not related to causes such as trauma or pulmonary embolism, with a rise or a fall (or a rise and a fall) of cardiac biomarkers (at least one value being above the 99th percentile in the reference population) and any of the following:
- Symptoms of ischemia
- New ST-segment changes or new left bundle branch block
- Pathologic Q waves
- Imaging evidence of new loss of viable myocardium or new regional wall-motion abnormality
- Intracoronary thrombus by angiography or autopsy.13
Myocardial injury after noncardiac surgery
Studies10,11 have shown that many patients undergoing noncardiac surgery have evidence of cardiac biomarker release but do not meet the universal definition of myocardial infarction.
The Perioperative Ischemic Evaluation (POISE) trial10 reported that 415 (5%) of its patients met the definition of myocardial infarction, of whom only about 35% had symptoms of ischemia. Another 697 patients (8.3%) had isolated elevations in biomarkers without meeting the definition of myocardial infarction.
The VISION study11 (Vascular Events in Noncardiac Surgery Patients Cohort Evaluation) prospectively screened more than 15,000 patients in several countries for troponin elevation during the first 3 postoperative days and for ischemic symptoms and features. Of the patients screened, approximately 1,200 (8%) had troponin elevations, with fewer than half fulfilling the criteria for myocardial infarction.
In another study, van Waes et al6 prospectively screened 2,232 patients ages 60 and older undergoing intermediate- to high-risk noncardiac surgery. Troponin levels were elevated in 19% of the patients, but only 10 of these patients met the universal definition of myocardial infarction.
In all of these studies, patients with isolated elevation in myocardial biomarkers had worse short-term and long-term outcomes than those without. These observations led to a proposed definition of “myocardial injury after noncardiac surgery” that is broader than that of myocardial infarction and requires only elevation of cardiac biomarkers judged to be due to myocardial ischemia (ie, not from another obvious cause such as pulmonary embolism or myocarditis).3
FIVE TYPES OF MYOCARDIAL INFARCTION
The Joint Task Force13 categorizes myocardial infarction into five distinct types:
- Type 1—due to plaque rupture
- Type 2—due to imbalance between oxygen supply and demand
- Type 3—sudden cardiac death
- Type 4a—associated with percutaneous coronary intervention
- Type 4b—associated with stent thrombosis
- Type 5—associated with coronary artery bypass surgery.
Types 1 and 2 have both been implicated in perioperative myocardial infarction and injury. Patient characteristics and the physiologic response to surgical and anesthetic stressors likely contribute to the development of myocardial infarction and injury after noncardiac surgery.
Plaque rupture as a cause of postoperative myocardial infarction
The mechanism of type 1 myocardial infarction—plaque rupture or erosion leading to thrombosis and infarction—plays a significant role in most cases of acute coronary syndromes. Its role in perioperative and postoperative myocardial infarction or injury, however, is less clear.
In an autopsy study of 26 patients who died of myocardial infarction after noncardiac surgery, plaque rupture was evident in 12 (46%).25 A prospective angiographic study of 120 patients with acute coronary syndromes after noncardiac surgery found that nearly 50% had evidence of plaque rupture.26
Higher levels of catecholamines, cortisol,27,28 platelet reactivity,29 procoagulant factors,30 and coronary artery shear stress31 are all present in the postoperative period and may contribute to an increased propensity for plaque rupture or erosion. Whether plaque rupture is present in patients who have isolated troponin elevation but do not meet the criteria for myocardial infarction has not been investigated.
Oxygen supply-demand imbalance during and after surgery
Oxygen supply-demand imbalance (the mechanism in type 2 myocardial infarction) leading to myocyte stress, ischemia, and subsequent infarction is likely common in the perioperative and postoperative periods. As previously discussed, this imbalance may be present with or without symptoms.
Oxygen demand may increase in this period as a result of tachycardia32 caused by bleeding, pain, and catecholamines or increased wall stress from hypertension due to vasoconstriction or pain.33 Oxygen supply can be decreased secondary to tachycardia, anemia,34 hypotension, hypoxemia, hypercarbia, intravascular fluid shifts (bleeding or volume overload), or coronary vasoconstriction.33,35
These mechanisms of myocardial injury, infarction, or both can occur with or without underlying significant obstructive coronary artery disease. However, severe coronary artery disease is more common in those who have had a perioperative myocardial infarction.36
POSTOPERATIVE TROPONIN ELEVATION CARRIES A WORSE PROGNOSIS
Patients who suffer a myocardial infarction after noncardiac surgery have worse short- and long-term outcomes than their counterparts.4,5,7, 8,10,33 In the POISE trial,10 the 30-day mortality rate was 11.6% in those who had had a perioperative myocardial infarction, compared with 2.2% in those who did not (P < .001). The patients who had had a myocardial infarction were also more likely to have nonfatal cardiac arrest, coronary revascularization, and congestive heart failure.
Myocardial injury not fulfilling the criteria for myocardial infarction after noncardiac surgery is also associated with worse short-term and long-term outcomes.3,6,10,11,37,38 POISE patients with isolated elevations in cardiac biomarkers had a higher 30-day risk of coronary revascularization and nonfatal arrest.10 In the VISION trial, an elevation in troponin was the strongest predictor of death within 30 days after noncardiac surgery. This analysis also showed that the higher the peak troponin value, the greater the risk of death and the shorter the median time until death.11
A meta-analysis of 14 studies in 3,139 patients found that elevated troponin after noncardiac surgery was an independent predictor of death within 1 year (odds ratio [OR] 6.7, 95% confidence interval [CI] 4.1–10.9) and beyond 1 year (OR 1.8, 95% CI 1.4–2.3).37
SHOULD SCREENING BE ROUTINE AFTER NONCARDIAC SURGERY?
Since patients suffering myocardial infarction or injury after noncardiac surgery have a worse prognosis, many experts advocate routinely screening all high-risk patients and those undergoing moderate- to high-risk surgery. Many tools exist to determine which patients undergoing noncardiac surgery are at high risk of cardiac complications.
The revised Goldman Cardiac Risk Index is commonly used and well validated. Variables in this index that predict major cardiac complications are:
- High-risk surgery (vascular surgery, orthopedic surgery, and intraperitoneal or intrathoracic surgery)
- History of ischemic heart disease
- History of congestive heart failure
- History of cerebrovascular disease
- Diabetes requiring insulin therapy
- Chronic kidney disease with a creatinine > 2.0 mg/dL.
The more of these variables that are present, the higher the risk of perioperative cardiac events2,4:
- No risk factors: 0.4% risk (95% CI 0.1–0.8)
- One risk factor: 1.0% risk (95% CI 0.5–1.4)
- Two risk factors: 2.4% risk (95% CI 1.3–3.5)
- Three or more risk factors: 5.4% risk (95% CI 2.7–7.9).
Current guidelines from the American College of Cardiology and the American Heart Association give a class I recommendation (the highest) for measuring troponin levels after noncardiac surgery in patients who have symptoms or signs suggesting myocardial ischemia. They give a class IIb recommendation (usefulness is less well established) for screening those at high risk but without symptoms or signs of ischemia, despite the previously cited evidence that patients with troponin elevation are at increased risk. The IIb recommendation is due to a lack of validated treatment strategies to modify and attenuate the recognized risk with troponin elevation in this setting.39
LITTLE EVIDENCE TO GUIDE TREATMENT
In current practice, internists and cardiologists are often asked to consult on patients with troponin elevations noted after noncardiac surgery. Although published and ongoing studies examine strategies to prevent cardiovascular events during noncardiac surgery, we lack data on managing the cases of myocardial infarction and injury that actually occur after noncardiac surgery.
When managing a patient who has a troponin elevation after surgery, many clinical factors must be weighed, including hemodynamic and clinical stability and risk of bleeding. Confronted with ST-segment elevation myocardial infarction or high-risk non–ST-segment elevation myocardial infarction, most clinicians would favor an early invasive reperfusion strategy in accordance with guidelines on managing acute coronary syndrome. Fibrinolytic drugs for ST-segment elevation myocardial infarction are likely to be contraindicated in the postoperative period because they pose an unacceptable risk of bleeding.
Guideline-directed medical therapies for those suffering perioperative myocardial infarction may lower the risk of future cardiovascular events, as suggested by a retrospective study of 66 patients diagnosed with perioperative myocardial infarction after vascular surgery.40 Those in whom medical therapy for coronary artery disease was not intensified—defined as adding or increasing the dose of antiplatelet agent, statin, beta-blocker, or angiotensin-converting enzyme inhibitor—had higher rates of cardiovascular events at 12 months (hazard ratio [HR] 2.80, 95% CI 1.05–24.2).40
In those with asymptomatic myocardial infarction or isolated elevation in cardiac biomarkers, no treatment strategies have been assessed prospectively or in randomized trials. However, statins and aspirin have been suggested as providing some benefit. In a substudy of the POISE trial, the use of aspirin was associated with a 46% reduction in the 30-day mortality rate in those suffering a perioperative myocardial infarction, and statins were associated with a 76% reduction.10 In a single-center retrospective analysis of 337 patients undergoing moderate- to high-risk vascular surgery, statin therapy was associated with a lower 1-year mortality rate (OR 0.63, 95% CI 0.40–0.98).38
We propose a treatment algorithm for patients identified as having cardiovascular events after noncardiac surgery (Figure 2), based on current evidence and guidelines. Ultimately, treatment decisions should be tailored to the individual patient. Discussion of the risks and benefits of therapeutic options should include the patient and surgeon.
Ongoing and future trials
Ongoing and future trials are aimed at addressing definitive treatment strategies in this patient population.
The MANAGE trial (Management of Myocardial Injury After Non-cardiac Surgery Trial) is randomizing patients suffering myocardial injury after noncardiac surgery to receive either dabigatran and omeprazole or placebo to assess the efficacy of these agents in preventing major adverse cardiac events and the safety of anticoagulation (ClinicalTrials.gov Identifier: NCT01661101).
The INTREPID trial (Study of Ticagrelor Versus Aspirin Treatment in Patients With Myocardial Injury Post Major Non-Cardiac Surgery) will assess the efficacy and safety of ticagrelor treatment compared with aspirin in a similar population (ClinicalTrial.gov Identifier: NCT02291419). The trial will enroll approximately 1,000 patients identified as having a postoperative troponin elevation more than two times the upper limit of normal of the assay during the index hospitalization (Figure 3). Enrollment was to have begun in mid-2015.
- Weiser TG, Regenbogen SE, Thompson KD, et al. An estimation of the global volume of surgery: a modelling strategy based on available data. Lancet 2008; 372:139–144.
- Lee TH, Marcantonio ER, Mangione CM, et al. Derivation and prospective validation of a simple index for prediction of cardiac risk of major noncardiac surgery. Circulation 1999; 100:1043–1049.
- Botto F, Alonso-Coello P, Chan MT, et al. Myocardial injury after noncardiac surgery: a large, international, prospective cohort study establishing diagnostic criteria, characteristics, predictors, and 30-day outcomes. Anesthesiology 2014; 120:564–578.
- Devereaux PJ, Goldman L, Cook DJ, Gilbert K, Leslie K, Guyatt GH. Perioperative cardiac events in patients undergoing noncardiac surgery: a review of the magnitude of the problem, the pathophysiology of the events and methods to estimate and communicate risk. CMAJ 2005; 173:627–634.
- McFalls EO, Ward HB, Moritz TE, et al. Predictors and outcomes of a perioperative myocardial infarction following elective vascular surgery in patients with documented coronary artery disease: results of the CARP trial. Eur Heart J 2008; 29:394–401.
- van Waes JA, Nathoe HM, de Graaff JC, et al. Myocardial injury after noncardiac surgery and its association with short-term mortality. Circulation 2013; 127:2264–2271.
- Badner NH, Knill RL, Brown JE, Novick TV, Gelb AW. Myocardial infarction after noncardiac surgery. Anesthesiology 1998; 88:572–578.
- Kim LJ, Martinez EA, Faraday N, et al. Cardiac troponin I predicts short-term mortality in vascular surgery patients. Circulation 2002; 106:2366–2371.
- Landesberg G, Shatz V, Akopnik I, et al. Association of cardiac troponin, CK-MB, and postoperative myocardial ischemia with long-term survival after major vascular surgery. J Am Coll Cardiol 2003; 42:1547–1554.
- Devereaux PJ, Xavier D, Pogue J, et al. Characteristics and short-term prognosis of perioperative myocardial infarction in patients undergoing noncardiac surgery: a cohort study. Ann Intern Med 2011; 154:523–528.
- Devereaux PJ, Chan MT, Alonso-Coello P, et al. Association between postoperative troponin levels and 30-day mortality among patients undergoing noncardiac surgery. JAMA 2012; 307:2295–2304.
- Kumar A, Cannon CP. Acute coronary syndromes: diagnosis and management, part I. Mayo Clin Proc 2009; 84:917–938.
- Thygesen K, Alpert JS, Jaffe AS, et al. Third universal definition of myocardial infarction. Circulation 2012; 126:2020–2035.
- Apple FS, Quist HE, Doyle PJ, Otto AP, Murakami MM. Plasma 99th percentile reference limits for cardiac troponin and creatine kinase MB mass for use with European Society of Cardiology/American College of Cardiology consensus recommendations. Clin Chem 2003; 49:1331–1336.
- Ottani F, Galvani M, Nicolini FA, et al. Elevated cardiac troponin levels predict the risk of adverse outcome in patients with acute coronary syndromes. Am Heart J 2000; 140:917–927.
- Ohman EM, Armstrong PW, White HD, et al. Risk stratification with a point-of-care cardiac troponin T test in acute myocardial infarction. GUSTO III investigators. Global Use of Strategies to Open Occluded Coronary Arteries. Am J Cardiol 1999; 84:1281–1286.
- deFilippi CR, Tocchi M, Parmar RJ, et al. Cardiac troponin T in chest pain unit patients without ischemic electrocardiographic changes: angiographic correlates and long-term clinical outcomes. J Am Coll Cardiol 2000; 35:1827–1834.
- Heidenreich PA, Alloggiamento T, Melsop K, McDonald KM, Go AS, Hlatky MA. The prognostic value of troponin in patients with non-ST elevation acute coronary syndromes: a meta-analysis. J Am Coll Cardiol 2001; 38:478–485.
- Steen H, Giannitsis E, Futterer S, Merten C, Juenger C, Katus HA. Cardiac troponin T at 96 hours after acute myocardial infarction correlates with infarct size and cardiac function. J Am Coll Cardiol 2006; 48:2192–2194.
- Licka M, Zimmermann R, Zehelein J, Dengler TJ, Katus HA, Kubler W. Troponin T concentrations 72 hours after myocardial infarction as a serological estimate of infarct size. Heart 2002; 87:520–524.
- Vasile VC, Babuin L, Giannitsis E, Katus HA, Jaffe AS. Relationship of MRI-determined infarct size and cTnI measurements in patients with ST-elevation myocardial infarction. Clin Chem 2008; 54:617–619.
- Sabatine MS, Morrow DA, de Lemos JA, Jarolim P, Braunwald E. Detection of acute changes in circulating troponin in the setting of transient stress test-induced myocardial ischaemia using an ultrasensitive assay: results from TIMI 35. Eur Heart J 2009; 30:162–169.
- Siriwardena M, Campbell V, Richards AM, Pemberton CJ. Cardiac biomarker responses to dobutamine stress echocardiography in healthy volunteers and patients with coronary artery disease. Clin Chem 2012; 58:1492–1494.
- Turer AT, Addo TA, Martin JL, et al. Myocardial ischemia induced by rapid atrial pacing causes troponin T release detectable by a highly sensitive assay: insights from a coronary sinus sampling study. J Am Coll Cardiol 2011; 57:2398–2405.
- Cohen MC, Aretz TH. Histological analysis of coronary artery lesions in fatal postoperative myocardial infarction. Cardiovasc Pathol 1999; 8:133–139.
- Gualandro DM, Campos CA, Calderaro D, et al. Coronary plaque rupture in patients with myocardial infarction after noncardiac surgery: frequent and dangerous. Atherosclerosis 2012; 222:191–195.
- Sametz W, Metzler H, Gries M, et al. Perioperative catecholamine changes in cardiac risk patients. Eur J Clin Invest 1999; 29:582–587.
- Frank SM, Higgins MS, Breslow MJ, et al. The catecholamine, cortisol, and hemodynamic responses to mild perioperative hypothermia. A randomized clinical trial. Anesthesiology 1995; 82:83–93.
- Rosenfeld BA, Faraday N, Campbell D, et al. Perioperative platelet reactivity and the effects of clonidine. Anesthesiology 1993; 79:255–261.
- Lison S, Weiss G, Spannagl M, Heindl B. Postoperative changes in procoagulant factors after major surgery. Blood Coagul Fibrinolysis 2011; 22:190–196.
- Fukumoto Y, Hiro T, Fujii T, et al. Localized elevation of shear stress is related to coronary plaque rupture: a 3-dimensional intravascular ultrasound study with in-vivo color mapping of shear stress distribution. J Am Coll Cardiol 2008; 51:645–650.
- Feringa HH, Bax JJ, Boersma E, et al. High-dose beta-blockers and tight heart rate control reduce myocardial ischemia and troponin T release in vascular surgery patients. Circulation 2006; 114:I-344–I-349.
- Landesberg G. The pathophysiology of perioperative myocardial infarction: facts and perspectives. J Cardiothorac Vasc Anesth 2003; 17:90–100.
- Nelson AH, Fleisher LA, Rosenbaum SH. Relationship between postoperative anemia and cardiac morbidity in high-risk vascular patients in the intensive care unit. Crit Care Med 1993; 21:860–866.
- Landesberg G, Beattie WS, Mosseri M, Jaffe AS, Alpert JS. Perioperative myocardial infarction. Circulation 2009; 119:2936–2944.
- Ellis SG, Hertzer NR, Young JR, Brener S. Angiographic correlates of cardiac death and myocardial infarction complicating major nonthoracic vascular surgery. Am J Cardiol 1996; 77:1126–1128.
- Levy M, Heels-Ansdell D, Hiralal R, et al. Prognostic value of troponin and creatine kinase muscle and brain isoenzyme measurement after noncardiac surgery: a systematic review and meta-analysis. Anesthesiology 2011; 114:796–806.
- Garcia S, Marston N, Sandoval Y, et al. Prognostic value of 12-lead electrocardiogram and peak troponin I level after vascular surgery. J Vasc Surg 2013; 57:166–172.
- Fleisher LA, Fleischmann KE, Auerbach AD, et al. 2014 ACC/AHA guideline on perioperative cardiovascular evaluation and management of patients undergoing noncardiac surgery: a report of the American College of Cardiology/American Heart Association task force on practice guidelines. J Am Coll Cardiol 2014; 64:e77–e137.
- Foucrier A, Rodseth R, Aissaoui M, et al. The long-term impact of early cardiovascular therapy intensification for postoperative troponin elevation after major vascular surgery. Anesth Analg 2014; 119:1053–1063.
KEY POINTS
- Cardiovascular events are a major cause of morbidity and mortality in patients undergoing noncardiac surgery and occur frequently, especially in high-risk patients.
- Myocardial injury or infarction after noncardiac surgery heightens the short- and long-term risk of mortality and major adverse cardiac events.
- The dominant mechanism of myocardial injury after noncardiac surgery remains uncertain.
- In the absence of therapies proven to affect the outcome, the benefit of screening to identify these patients remains uncertain.
- Clinical trials are under way to help clinicians provide optimal care to this at-risk population.
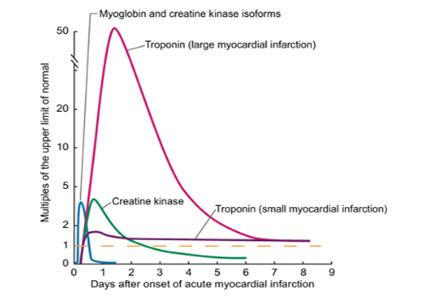
4 technology tools ObGyns can apply in practice
Over the past 15 years a technological tsunami has swept through the health care industry, and few physicians were prepared for the changes wrought by this tidal wave. It now is clear, however, that we are and will have to continue to navigate a future increasingly powered and populated by technology if we are to be successful clinicians. In addition, we must learn to take advantage of all that technology has to offer without compromising the quality of care and compassion we offer our patients. We are fortunate that technology has much to offer to enhance patient care.
One big change under way: Technology is leveling the playing field between doctors—once the high priests of medicine—and ordinary people. SMART (social, mobile, aware, and real-time) technologies such as cloud computing will broaden the setting of health care interventions from hospital rooms and doctors’ offices to patients’ everyday lives. Cloud computing involves the use of a network of remote servers hosted on the Internet to store, manage, and process data, rather than a local server or a desktop computer located in the doctor’s office. It is possible that, instead of being episodic, health care will be conducted continuously—and anywhere the patient wants it.
Without a doubt, the pace at which new technology affects our lives is increasing at lightning speeds. Today, 29% of Americans say their phone is the first and the last thing they look at each day, a telling sign of how dependent we are becoming on technology.1 In this article, we look at 4 technologies that can be effective in the clinical setting, attracting new patients and enhancing productivity, communication, and patient care.
1. A mobile-friendly Web site
According to Wikipedia, there are 327,577,529 mobile phones in the United States, give or take a few thousand. As of July 4, 2014, the US population was 318,881,992. That means there are more mobile phones in this country than there are people!2
Mobile phones are becoming more like personal assistants than phones. People are not just making calls, they’re buying movie tickets, checking the weather, sending and receiving emails, texting, making reservations, checking Web sites … and the list goes on.
According to a recent report from the Pew Research Center, almost two-thirds of Americans own a smartphone, and 62% of smartphone owners have used it to look up information on a health condition.3 Moreover, 15% of smartphone owners say they have a limited number of ways to access the Internet other than their cell phone.3
All the more reason for your Web site to be mobile-friendly. With a mobile- friendly site, the content is displayed in a more streamlined fashion on mobile phones, with larger type to make it more readable. See, for example, the FIGURE, which shows Dr. Baum’s regular Web site side by side with the mobile-friendly view.
There is another reason why you should ensure that your site is mobile-friendly: Google recently changed its algorithms so that, when someone searches for information on a mobile phone, only mobile- friendly sites make it into the top search results. Google wants mobile phone users to have a positive experience online. It is so adamant about this desire that it will lower your rankings or not show your Web site at all in search results if you fail to comply.
New patient acquisition is critical for any ObGyn practice, and we already know that just about everyone goes online to search for health information and solutions to their medical problems. If you want your practice to survive and thrive, you need to attract new patients online. If a visitor to your site cannot read the text and has to keep resizing the screen and scrolling left and right, you will lose that visitor in a hurry.
We all want to find what we are looking for quickly. In our experience, when we check Google Analytics reports for our ObGyn clients, we find that visitors to a nonresponsive site spend much less time there and do not visit as many pages as they do when a site is mobile-responsive.
To check your Web site’s mobile rating, go to http://www.google.com/webmasters/tools/mobile-friendly. Google also offers tips on making your site mobile-friendly at https://support.google.com/webmasters/answer/6001177?hl=en.
Once your site is up to snuff, you should test it from multiple devices to ensure that the pages are easily readable on all types of phones and computers.
2. Voice recognition software
Speech recognition is the ability of a machine or program to identify words and phrases in spoken language and convert them to a digital format. This tool can help you generate clinical notes and charting without having to stop and type into a computer. This can enhance your interactions with patients by freeing you from the computer during examinations and counseling and allows you to look at the patient and not at the computer.
According to data from June 2000, approximately 5% of physicians used speech recognition to generate text in their offices.4 A white paper from 2008 found that approximately 20% of physicians are using more advanced, more reliable voice recognition technology and saving both time and money.5 This report cited 2007 data showing that:
- 76% of clinicians who used “desktop speech recognition” (directly controlling an electronic health record [EHR] system via speech) reported faster turnaround time, better patient care, and quicker reimbursement
- Nearly 30% reported lower costs and increased productivity as benefits. The lower costs arise from reduced transcription and overhead expenses associated with billings and collection.5
The voice recognition software used in Dr. Neil Baum’s office is Dragon Medical Practice Edition 2 (www.dragonmedicalpractice.com). Dragon requires a good processor and a minimum of 4 gigabytes of RAM and will run with VMware, Boot Camp, Parallels, and other programs for Mac users. The software contains 80 subspecialty medical vocabularies and is easy to install. After a few minutes, the program learns how you speak and will understand you well with remarkable accuracy. However, to get the greatest benefit from the technology, you will need to invest in training, implementation, and workflow services to allow you to use the program to its full potential in record time.
Dr. Baum uses The Dragon People voice recognition software (www.thedragonpeople.com).
Although voice recognition software can reduce or eliminate transcription costs, improve documentation time, and boost the quality of medical notes, it is critical that you investigate how a particular program fits with your EHR prior to purchasing it—and a salesperson may try to gloss over this issue. In addition, the more you use voice recognition instead of checking off pull-down boxes for your clinical notes, the more difficult it will be to mine your data for quality metrics and pay-for-performance information. For that reason, voice recognition technology may be strongly discouraged by your employer or governing organization.
3. Online lab result reporting
TeleVox’s automated lab results (www .televox.com/lab-test-results-delivery) allow physicians or staff to assign lab result messages quickly and easily with the click of a mouse. Patients call an 800 number or use an Internet connection to retrieve their results, using a unique PIN to ensure privacy.
Practices that implement this technology see immediate improvements in 3 areas:
- Streamlined operations. This technology allows lab result messages to be assigned to patients with a few mouse clicks, saving time spent on phone calls and mailing coordination.
- Reduced costs. Automated lab result reporting reduces staff labor and mailing costs.
- Ease of access. Patients have round-the-clock access to their information—no more waiting for mail delivery or a phone call. Patients also can choose to be notified when their results are ready, which helps alleviate anxiety.
4. Automated wait-time notification
The most common complaint patients have about their health care experience is the excessive wait times they often experience. Now there are technologies that can provide automated information to let patients know how long they will have to wait to be seen.
A program such as MedWaitTime (www.medwaittime.com) can alert patients about the estimated wait time at a cost of approximately $50 per month per physician. Patients access the service for free.
In addition, many EHRs include practice management features to notify the staff and physician whether he or she is on time. These features may include a tie-in to alert patients as well.
The bottom line
Carefully selected technological tools have much to offer busy clinicians. By ensuring that your practice Web site is mobile- friendly, you stand to attract new patients. And the time you save with voice recognition software and computerized lab test result notification can allow you to spend more time with your patients. It can also help eliminate the lag in your patient schedule, keeping the women in your waiting room happy. Remember, a happy patient means a happy doctor!
Share your thoughts! Send your Letter to the Editor to rbarbieri@frontlinemedcom.com. Please include your name and the city and state in which you practice.
- Your Wireless Life: Results of TIME’s Mobility Poll. http://content.time.com/time/interactive/0,31813,2122187,00.html. Accessed July 29, 2015.
- Wikipedia: List of Countries by Number of Mobile Phones in Use. https://en.wikipedia.org/wiki/List_of_countries_by_number_of_mobile_phones_in_use. Accessed July 29, 2015.
- Smith A. US Smartphone Use in 2015. Pew Research Center. http://www.pewinternet.org/2015/04/01/us-smartphone-use-in-2015. Published April 1, 2015. Accessed July 29, 2015.
- Maisel JM, Wisnicki HJ. Documenting the medical encounter with speech recognition. Ophthalmol Times. 2002;27(5):38.
- Nuance Communications. Speech recognition: accelerating the adoption of electronic medical records. http://www.nuance.com/healthcare/pdf/wp_healthcareMDEMRadopt.pdf. Published 2008. Accessed July 30, 2015.
Ron Romano and Neil H. Baum, MD

Mr. Romano is President of www.YourInternetDoctor.com and CEO of Instant Marketing Systems. He co-authored The Internet Survival Guide for Doctors (2014, Instant Marketing Systems) and No B.S. Direct Marketing (2006, Entrepreneur Press) and contributed to the Walking with the Wise series (2004, Mentors Publishing). He is an Internet marketing consultant, speaker, and creator of “The Implementation Blueprint System.”

Dr. Baum practices urology in New Orleans, Louisiana. He is Associate Clinical Professor of Urology at Tulane Medical School and Louisiana State University School of Medicine, both in New Orleans. He is also on the medical staff at Touro Infirmary in New Orleans, and East Jefferson General Hospital in Metairie, Louisiana. He is the author of several books, including Social Media for the Healthcare Professional (2012, Greenbranch) and Marketing Your Clinical Practice: Ethically, Effectively, Economically (4th edition, 2009; Jones & Bartlett).Dr. Baum is a Contributing Editor for OBG Management.
Mr. Romano reports that he is CEO of Instant Marketing Systems, which provides consulting advice, marketing plans, and Internet marketing services for businesses and medical practices. Dr. Baum reports no financial relationships relevant to
this article.
Ron Romano and Neil H. Baum, MD
Mr. Romano is President of www.YourInternetDoctor.com and CEO of Instant Marketing Systems. He co-authored The Internet Survival Guide for Doctors (2014, Instant Marketing Systems) and No B.S. Direct Marketing (2006, Entrepreneur Press) and contributed to the Walking with the Wise series (2004, Mentors Publishing). He is an Internet marketing consultant, speaker, and creator of “The Implementation Blueprint System.”
Dr. Baum practices urology in New Orleans, Louisiana. He is Associate Clinical Professor of Urology at Tulane Medical School and Louisiana State University School of Medicine, both in New Orleans. He is also on the medical staff at Touro Infirmary in New Orleans, and East Jefferson General Hospital in Metairie, Louisiana. He is the author of several books, including Social Media for the Healthcare Professional (2012, Greenbranch) and Marketing Your Clinical Practice: Ethically, Effectively, Economically (4th edition, 2009; Jones & Bartlett).Dr. Baum is a Contributing Editor for OBG Management.
Mr. Romano reports that he is CEO of Instant Marketing Systems, which provides consulting advice, marketing plans, and Internet marketing services for businesses and medical practices. Dr. Baum reports no financial relationships relevant to
this article.
Over the past 15 years a technological tsunami has swept through the health care industry, and few physicians were prepared for the changes wrought by this tidal wave. It now is clear, however, that we are and will have to continue to navigate a future increasingly powered and populated by technology if we are to be successful clinicians. In addition, we must learn to take advantage of all that technology has to offer without compromising the quality of care and compassion we offer our patients. We are fortunate that technology has much to offer to enhance patient care.
One big change under way: Technology is leveling the playing field between doctors—once the high priests of medicine—and ordinary people. SMART (social, mobile, aware, and real-time) technologies such as cloud computing will broaden the setting of health care interventions from hospital rooms and doctors’ offices to patients’ everyday lives. Cloud computing involves the use of a network of remote servers hosted on the Internet to store, manage, and process data, rather than a local server or a desktop computer located in the doctor’s office. It is possible that, instead of being episodic, health care will be conducted continuously—and anywhere the patient wants it.
Without a doubt, the pace at which new technology affects our lives is increasing at lightning speeds. Today, 29% of Americans say their phone is the first and the last thing they look at each day, a telling sign of how dependent we are becoming on technology.1 In this article, we look at 4 technologies that can be effective in the clinical setting, attracting new patients and enhancing productivity, communication, and patient care.
1. A mobile-friendly Web site
According to Wikipedia, there are 327,577,529 mobile phones in the United States, give or take a few thousand. As of July 4, 2014, the US population was 318,881,992. That means there are more mobile phones in this country than there are people!2
Mobile phones are becoming more like personal assistants than phones. People are not just making calls, they’re buying movie tickets, checking the weather, sending and receiving emails, texting, making reservations, checking Web sites … and the list goes on.
According to a recent report from the Pew Research Center, almost two-thirds of Americans own a smartphone, and 62% of smartphone owners have used it to look up information on a health condition.3 Moreover, 15% of smartphone owners say they have a limited number of ways to access the Internet other than their cell phone.3
All the more reason for your Web site to be mobile-friendly. With a mobile- friendly site, the content is displayed in a more streamlined fashion on mobile phones, with larger type to make it more readable. See, for example, the FIGURE, which shows Dr. Baum’s regular Web site side by side with the mobile-friendly view.
There is another reason why you should ensure that your site is mobile-friendly: Google recently changed its algorithms so that, when someone searches for information on a mobile phone, only mobile- friendly sites make it into the top search results. Google wants mobile phone users to have a positive experience online. It is so adamant about this desire that it will lower your rankings or not show your Web site at all in search results if you fail to comply.
New patient acquisition is critical for any ObGyn practice, and we already know that just about everyone goes online to search for health information and solutions to their medical problems. If you want your practice to survive and thrive, you need to attract new patients online. If a visitor to your site cannot read the text and has to keep resizing the screen and scrolling left and right, you will lose that visitor in a hurry.
We all want to find what we are looking for quickly. In our experience, when we check Google Analytics reports for our ObGyn clients, we find that visitors to a nonresponsive site spend much less time there and do not visit as many pages as they do when a site is mobile-responsive.
To check your Web site’s mobile rating, go to http://www.google.com/webmasters/tools/mobile-friendly. Google also offers tips on making your site mobile-friendly at https://support.google.com/webmasters/answer/6001177?hl=en.
Once your site is up to snuff, you should test it from multiple devices to ensure that the pages are easily readable on all types of phones and computers.
2. Voice recognition software
Speech recognition is the ability of a machine or program to identify words and phrases in spoken language and convert them to a digital format. This tool can help you generate clinical notes and charting without having to stop and type into a computer. This can enhance your interactions with patients by freeing you from the computer during examinations and counseling and allows you to look at the patient and not at the computer.
According to data from June 2000, approximately 5% of physicians used speech recognition to generate text in their offices.4 A white paper from 2008 found that approximately 20% of physicians are using more advanced, more reliable voice recognition technology and saving both time and money.5 This report cited 2007 data showing that:
- 76% of clinicians who used “desktop speech recognition” (directly controlling an electronic health record [EHR] system via speech) reported faster turnaround time, better patient care, and quicker reimbursement
- Nearly 30% reported lower costs and increased productivity as benefits. The lower costs arise from reduced transcription and overhead expenses associated with billings and collection.5
The voice recognition software used in Dr. Neil Baum’s office is Dragon Medical Practice Edition 2 (www.dragonmedicalpractice.com). Dragon requires a good processor and a minimum of 4 gigabytes of RAM and will run with VMware, Boot Camp, Parallels, and other programs for Mac users. The software contains 80 subspecialty medical vocabularies and is easy to install. After a few minutes, the program learns how you speak and will understand you well with remarkable accuracy. However, to get the greatest benefit from the technology, you will need to invest in training, implementation, and workflow services to allow you to use the program to its full potential in record time.
Dr. Baum uses The Dragon People voice recognition software (www.thedragonpeople.com).
Although voice recognition software can reduce or eliminate transcription costs, improve documentation time, and boost the quality of medical notes, it is critical that you investigate how a particular program fits with your EHR prior to purchasing it—and a salesperson may try to gloss over this issue. In addition, the more you use voice recognition instead of checking off pull-down boxes for your clinical notes, the more difficult it will be to mine your data for quality metrics and pay-for-performance information. For that reason, voice recognition technology may be strongly discouraged by your employer or governing organization.
3. Online lab result reporting
TeleVox’s automated lab results (www .televox.com/lab-test-results-delivery) allow physicians or staff to assign lab result messages quickly and easily with the click of a mouse. Patients call an 800 number or use an Internet connection to retrieve their results, using a unique PIN to ensure privacy.
Practices that implement this technology see immediate improvements in 3 areas:
- Streamlined operations. This technology allows lab result messages to be assigned to patients with a few mouse clicks, saving time spent on phone calls and mailing coordination.
- Reduced costs. Automated lab result reporting reduces staff labor and mailing costs.
- Ease of access. Patients have round-the-clock access to their information—no more waiting for mail delivery or a phone call. Patients also can choose to be notified when their results are ready, which helps alleviate anxiety.
4. Automated wait-time notification
The most common complaint patients have about their health care experience is the excessive wait times they often experience. Now there are technologies that can provide automated information to let patients know how long they will have to wait to be seen.
A program such as MedWaitTime (www.medwaittime.com) can alert patients about the estimated wait time at a cost of approximately $50 per month per physician. Patients access the service for free.
In addition, many EHRs include practice management features to notify the staff and physician whether he or she is on time. These features may include a tie-in to alert patients as well.
The bottom line
Carefully selected technological tools have much to offer busy clinicians. By ensuring that your practice Web site is mobile- friendly, you stand to attract new patients. And the time you save with voice recognition software and computerized lab test result notification can allow you to spend more time with your patients. It can also help eliminate the lag in your patient schedule, keeping the women in your waiting room happy. Remember, a happy patient means a happy doctor!
Share your thoughts! Send your Letter to the Editor to rbarbieri@frontlinemedcom.com. Please include your name and the city and state in which you practice.
- Your Wireless Life: Results of TIME’s Mobility Poll. http://content.time.com/time/interactive/0,31813,2122187,00.html. Accessed July 29, 2015.
- Wikipedia: List of Countries by Number of Mobile Phones in Use. https://en.wikipedia.org/wiki/List_of_countries_by_number_of_mobile_phones_in_use. Accessed July 29, 2015.
- Smith A. US Smartphone Use in 2015. Pew Research Center. http://www.pewinternet.org/2015/04/01/us-smartphone-use-in-2015. Published April 1, 2015. Accessed July 29, 2015.
- Maisel JM, Wisnicki HJ. Documenting the medical encounter with speech recognition. Ophthalmol Times. 2002;27(5):38.
- Nuance Communications. Speech recognition: accelerating the adoption of electronic medical records. http://www.nuance.com/healthcare/pdf/wp_healthcareMDEMRadopt.pdf. Published 2008. Accessed July 30, 2015.
In this Article
- Voice recognition software lets you look at your patient
- Patients can retrieve online lab results

Lung cancer in HIV-infected patients and the role of targeted therapy
Lung cancer is one of the most common malignancies in HIV-infected patients. Prevalence and mortality outcomes are higher in HIV-infected populations than in noninfected patients. There are several oral agents available for patients who harbor specific mutations, but little is known about mutations and affected pathways in HIV-infected patients with lung cancer. Recent trials have facilitated the inclusion of HIV-infected patients in clinical trials, but the population is remains underrepresented in oncology trials. Here, we review the literature on lung cancer in HIV-infected patients, and discuss common mutations in lung cancer and HIV-infected patients, the role of mutational analysis, and the potential role of targeted therapy in the treatment of lung cancer in HIV-infected populations.
Click on the PDF icon at the top of this introduction to read the full article.
CUT DOWNTIME: The Lean way for a busy practitioner to improve efficiency
The mnemonic CUT DOWNTIME, which I have adapted and modified from the book Lean Healthcare Deployment and Sustainability,1 breaks down waste in health care—an activity that adds no value to a service—into 11 major categories (Table). This mnemonic provides the busy practitioner a simple framework for improving quality and efficiency of services by identifying and eliminating wastes the Lean way.
Disclosure
The author reports no financial relationships with any company whose products are mentioned in this article or with manufacturers of competing products.
Reference
1. Dean ML. Lean healthcare deployment and sustainability. New York, NY: McGraw-Hill; 2013.
The mnemonic CUT DOWNTIME, which I have adapted and modified from the book Lean Healthcare Deployment and Sustainability,1 breaks down waste in health care—an activity that adds no value to a service—into 11 major categories (Table). This mnemonic provides the busy practitioner a simple framework for improving quality and efficiency of services by identifying and eliminating wastes the Lean way.
Disclosure
The author reports no financial relationships with any company whose products are mentioned in this article or with manufacturers of competing products.
Reference
1. Dean ML. Lean healthcare deployment and sustainability. New York, NY: McGraw-Hill; 2013.
Reference
1. Dean ML. Lean healthcare deployment and sustainability. New York, NY: McGraw-Hill; 2013.
‘It’s my money, and I want it now!’ Clinical variables related to payeeship under Social Security
The Social Security Administration (SSA) does not provide much guidance on the contentious issue of determining payeeship for disability beneficiaries. The only description available is stated on the “Physician/medical officer’s statement of patient’s capability to manage benefits” (form SSA-787): “By capable we mean that the patient: Is able to understand and act on the ordinary affairs of life, such as providing for own adequate food, housing, etc., and is able, in spite of physical impairments, to manage funds or direct others how to manage them.”
Physicians will be asked to make a capability statement if they are performing a consultative examination for SSA or if their patient:
• is applying for benefits
• needs to have a payee.
Regrettably, the published literature on capability is scant.1,2 Based on decades of personal experience, here is the approach I have adopted to determine capability.
Diagnoses, circumstances, and clinical syndromes that strongly suggest the need for a payee include those listed in the Table.
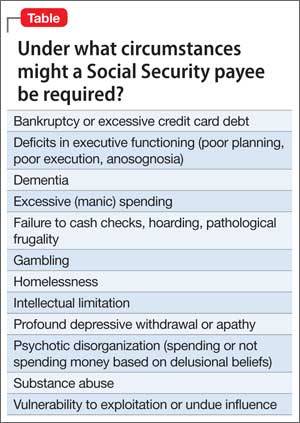
The psychiatric rehabilitation agency I work at adheres to a recovery model. I consult with caseworkers on the issue of capability, but generally endorse a “team” recommendation for initiating or terminating payeeship. A number of factors are involved:
Adherence to recovery means that we encourage autonomy; we do not attempt to prevent every bad decision.
Demands for money from the patient and demands to terminate payeeship can be strident and potentially violent.
Confrontations over payeeship can be a safety risk for family or staff who have been acting as the payee.
Guardianship (or conservatorship) is a judicially determined restriction of financial decision-making.
Payeeship is an extrajudicial restriction of financial decision-making. Treating physicians, understandably, may feel uneasy restricting the rights of a patient. Additionally, there is ethical stress when a physician does anything that might compromise the primacy of the treatment relationship.
If all parties agree that payeeship should be terminated, I recommend the payee (whether the family or an institutional payee) begin a 3-month trial, during which the payee does not pay bills or keep a budget. The patient receives his (her) money in a lump sum at the beginning of the month, which begins a naturalistic trial of the patient’s capability to pay rent and budget adequately for all other necessities. If the patient demonstrates capability, I sign the SSA-787 form.
Offering a structured plan for restoring a patient’s benefits could defuse hostile demands.
Disclosure
The author reports no financial relationships with any company whose products are mentioned in this article or with manufacturers of competing products.
1. Marson DC, Savage R, Phillips J. Financial capacity in persons with schizophrenia and serious mental illness: clinical and research ethics aspects. Schizophr Bull. 2006; 32(1):81-91.
2. Rosen MI. The ‘check effect’ reconsidered. Addiction. 2011;106(6):1071-1077.
The Social Security Administration (SSA) does not provide much guidance on the contentious issue of determining payeeship for disability beneficiaries. The only description available is stated on the “Physician/medical officer’s statement of patient’s capability to manage benefits” (form SSA-787): “By capable we mean that the patient: Is able to understand and act on the ordinary affairs of life, such as providing for own adequate food, housing, etc., and is able, in spite of physical impairments, to manage funds or direct others how to manage them.”
Physicians will be asked to make a capability statement if they are performing a consultative examination for SSA or if their patient:
• is applying for benefits
• needs to have a payee.
Regrettably, the published literature on capability is scant.1,2 Based on decades of personal experience, here is the approach I have adopted to determine capability.
Diagnoses, circumstances, and clinical syndromes that strongly suggest the need for a payee include those listed in the Table.
The psychiatric rehabilitation agency I work at adheres to a recovery model. I consult with caseworkers on the issue of capability, but generally endorse a “team” recommendation for initiating or terminating payeeship. A number of factors are involved:
Adherence to recovery means that we encourage autonomy; we do not attempt to prevent every bad decision.
Demands for money from the patient and demands to terminate payeeship can be strident and potentially violent.
Confrontations over payeeship can be a safety risk for family or staff who have been acting as the payee.
Guardianship (or conservatorship) is a judicially determined restriction of financial decision-making.
Payeeship is an extrajudicial restriction of financial decision-making. Treating physicians, understandably, may feel uneasy restricting the rights of a patient. Additionally, there is ethical stress when a physician does anything that might compromise the primacy of the treatment relationship.
If all parties agree that payeeship should be terminated, I recommend the payee (whether the family or an institutional payee) begin a 3-month trial, during which the payee does not pay bills or keep a budget. The patient receives his (her) money in a lump sum at the beginning of the month, which begins a naturalistic trial of the patient’s capability to pay rent and budget adequately for all other necessities. If the patient demonstrates capability, I sign the SSA-787 form.
Offering a structured plan for restoring a patient’s benefits could defuse hostile demands.
Disclosure
The author reports no financial relationships with any company whose products are mentioned in this article or with manufacturers of competing products.
1. Marson DC, Savage R, Phillips J. Financial capacity in persons with schizophrenia and serious mental illness: clinical and research ethics aspects. Schizophr Bull. 2006; 32(1):81-91.
2. Rosen MI. The ‘check effect’ reconsidered. Addiction. 2011;106(6):1071-1077.
1. Marson DC, Savage R, Phillips J. Financial capacity in persons with schizophrenia and serious mental illness: clinical and research ethics aspects. Schizophr Bull. 2006; 32(1):81-91.
2. Rosen MI. The ‘check effect’ reconsidered. Addiction. 2011;106(6):1071-1077.
What does molecular imaging reveal about the causes of ADHD and the potential for better management?
Attention-deficit/hyperactivity disorder (ADHD) is one of the most common pediatric psychiatric disorders, occurring in approximately 5% of children.1 The disorder persists into adulthood in about one-half of those who are affected in childhood.2 In adults and children, diagnosis continues to be based on the examiner’s subjective assessment. (Box 13-9 describes how ADHD presents a complicated, moving target for the diagnostician.)
Patients who have ADHD are rarely studied with imaging; there are no established imaging findings associated with an ADHD diagnosis. Over the past 20 years, however, significant research has shown that molecular alterations along the dopaminergic−frontostriatal pathways occur in association with the behavioral constellation of ADHD symptoms—suggesting a pathophysiologic mechanism for this disorder.
In this article, we describe molecular findings from nuclear medicine imaging in ADHD. We also summarize imaging evidence for dysfunction of the dopaminergic-frontostriatal neural circuits as central in the pathophysiology of ADHD, with special focus on the dopamine reuptake transporter (DaT). Box 210,11 reviews our key observations and looks at the future of imaging in the management of ADHD.
Dopaminergic theory of ADHD
The executive functions that are disordered in ADHD (impulse control, judgment, maintaining attention) are thought to be centered in the infraorbital, dorsolateral, and medial frontal lobes. Neurotransmitters that have been implicated in the pathophysiology of ADHD include norepinephrine12 and dopamine13; medications that selectively block reuptake of these neurotransmitters are used to treat ADHD.14,15 Only the dopamine system has been extensively evaluated with molecular imaging techniques.
Because methylphenidate, a potent selective dopamine reuptake inhibitor, has been shown to reduce disordered executive functional behaviors in ADHD, considerable imaging research has focused on the dopaminergic neural circuits in the frontostriatal regions of the brain. The dopaminergic theory of ADHD is based on the hypothesis that alterations in the density or function of these circuits are responsible for behaviors that constitute ADHD.
Despite decades of efforts to delineate the underlying pathophysiology and neurochemistry of ADHD, no single unifying theory accounts for all imaging findings in all patients. This might be in part because of imprecision inherent in psychiatric diagnoses that are based on subjective observations. The behavioral criteria for ADHD can manifest in several disorders. For example, anxiety-related symptoms seen in posttraumatic stress disorder, social anxiety disorder, and panic disorder also present as behaviors similar to those in ADHD diagnostic criteria.
Molecular imaging might provide a window into the underlying pathophysiology of ADHD and, by identifying objective findings, (1) allow for patient stratification based on underlying physiologic subtypes, (2) refine diagnostic criteria, and (3) predict treatment response.
Nuclear medicine findings
In general, nuclear medicine investigations of ADHD can be divided into studies of changes in regional cerebral blood flow (rCBF) or glucose metabolism (rCGM) and those that have assessed the concentration of synaptic structures, using highly specific radiolabeled ligands. Both kinds of studies provide limited anatomic resolution, unless co-registered with MRI or CT scans and either single photon emission computed tomography (SPECT) or positron emission tomography (PET).
Synaptic imaging using radiolabeled ligands with high biologic specificity for synaptic structures has high molecular resolution—that is, radiolabeled ligands used for selective imaging of the dopamine transporter or receptor do not identify serotonin transporters or receptors, and vice versa. (Details of SPECT and PET techniques are beyond the scope of this article but can be found in standard nuclear medicine textbooks.)
SPECT and PET of rCBF
Early investigations of rCBF in ADHD were performed using inhaled radioactive xenon-133 gas.16 Later, rCBF was assessed using fat-soluble radiolabeled ligands that rapidly distribute in the brain in proportion to blood flow by crossing the blood−brain barrier. Labeled with radioactive 99m-technetium, these ligands cross rapidly into brain cells after IV injection. Once intracellular, covalent bonds within the ligands cleave into 2 charged particles that do not easily recross the cell membrane. There is little redistribution of tracer after initial uptake.
The imaging data set that results can be reconstructed as (1) surface images, on which defects indicate areas of reduced rCBF, or (2) tomographic slices on which color scales indicate relative rCBF values (Figure 1). Because of the minimal redistribution of the tracer, SPECT images obtained 1 or 2 hours after injection provide a snapshot of rCBF at the time tracer is injected. Patients can be injected under various conditions, such as at rest with eyes and ears open in a dimly lit, quiet room, and then under cognitive stress (Figure 2), such as performing a computer-based attention and impulse control task, or during stimulant treatment.


Numerous investigators have found reduced frontal or striatal rCBF, or both, in patients with ADHD, unilaterally on the right17 or left,18,19 or bilaterally.20 Additionally, with stimulant therapy, normalization of striatal and frontal rCBF has been demonstrated14,19—changes that correlate with resolution of behavioral symptoms of ADHD with stimulant treatment.21
SPECT of 32 boys with previously untreated ADHD. Kim et al21 found that the presence of reduced right or left, or both, frontal rCBF, which normalized with 8 weeks of stimulant therapy, predicted symptom improvement in 85% of patients. Absence of improvement of reduced frontal rCBF had a 75% negative predictive value for treatment response. (Additionally, hyperperfusion of the somatosensory cortex has been demonstrated in children with ADHD,16,22 suggesting increased responsiveness to extraneous environmental input.)
SPECT of 40 untreated pediatric patients compared with 17 age-matched controls. Using SPECT, Lee et al23 reported rCBF reductions in the orbitofrontal cortex and the medial temporal gyrus of participants; reductions corresponded to areas of motor and impulsivity control. The researchers also demonstrated increased rCBF in the somatosensory area.
After methylphenidate treatment, blood flow to these areas normalized, and rCBF to higher visual and superior prefrontal areas decreased. Substantial clinical improvement occurred in 64% of patients—suggesting methylphenidate treatment of ADHD works by (1) increasing function of areas of the brain that control impulses, motor activity, and attention, and (2) reducing function to sensory areas that lead to distraction by extraneous environmental sensory input.
O-15-labeled water PET of 10 adults with ADHD. Schweitzer et al24 found that participants who demonstrated improvement in behavioral symptoms with chronic stimulant therapy had reduced rCBF in the striata at baseline—again, suggesting that baseline hypometabolism in the striata is associated with ADHD.
PET of regional cerebral glucose metabolism
Cerebral metabolism requires a constant supply of glucose; regional differences in cerebral glucose metabolism can be assessed directly with positron-emitting F-18-fluoro-2-deoxyglucose. Although metabolically inert, this agent is transported intracellularly similar to glucose; once phosphorylated within brain cells, however, it can no longer undergo further metabolism or redistribution.
Studies using PET to assess rCGM were some of the earliest molecular imaging applications in ADHD. Zametkin et al25 reported low global cerebral glucose utilization in adults, but not adolescents,26 with ADHD. However, further study, with normalization of the PET data, confirmed reduced rCGM in the left prefrontal cortex in both adolescents26 and adults,27 indicating hypometabolism of cortical areas associated with impulse control and attention in ADHD. In adolescents, symptom severity was inversely related to rCBF in the left anterior frontal cortex.
Synaptic imaging
Nuclear imaging has been used to study several components of the striatal dopaminergic synapse, including:
• dopamine substrates, using fluorine- 18-labeled dopa or carbon-11-labeled dopa
• dopamine receptors, using carbon- 11-labeled raclopride or iodine-123 iodobenzamide
• the tDaT, using iodine-123 ioflupane, 99m-technetium TRODAT, or carbon-11 cocaine (Figure 3).
All of these synaptic imaging agents were used mainly as research tools until 2011, when the FDA approved the SPECT imaging agent iodine-123 ioflupane (DaTscan) for clinical use in assessment of Parkinson’s disease.28 This commercially available agent has high specificity for the DaT, with little background activity noted on SPECT imaging (Figure 4).
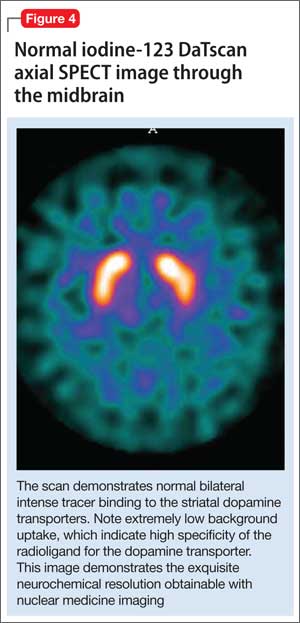
Dopamine transporter imaging
Because the site of action of methylphenidate is the DaT, imaging this component of the striatal dopaminergic synapse has been an area of intense investigation in ADHD. Located almost exclusively in the striata, DaT reduces synaptic concentrations of dopamine by means of reuptake channels in the cell membrane.29 By reversibly binding to, and occupying sites on, the DaT, methylphenidate impedes dopamine reuptake, which results in increased availability of dopamine at the synapse.30
By demonstrating an increase in striatal DaT density in patients with ADHD— first reported by Dougherty et al31 using iodine-123 altropane (a dopaminergic uptake inhibitor) in 6 adults with ADHD—investigators have hypothesized that excessive expression of the DaT protein in the striata, which may result from genetic or environmental factors, is a central causative agent of ADHD.32 Subsequent studies, however, have yielded contradictory findings: Hesse et al,33 using SPECT imaging, and Volkow et al,34 using carbon-11 cocaine PET imaging, found reduced DaT density in, respectively, 9 and 26 patients with ADHD.
To clarify the role of DaT levels in the etiology of ADHD and to explain discrepant results, Fusar-Poli et al35 performed a meta-analysis of 9 published papers that reported the results of DaT imaging in a total of 169 ADHD patients and 129 controls. They noted that these studies included 6 different imaging agents and protocols. Patients were stimulant therapy-naïve (n = 137) or drug-free (refrained from stimulant therapy for a time [n = 32]). The team found that the degree of elevation of the striatal DaT concentration correlated with a history of stimulant exposure, and that the drug-naïve group had a reduced DaT level.
Fusar-Poli’s hypothesis? Elevated DaT levels result from up-regulation in the presence of chronic methylphenidate therapy, which accounts for early reports that demonstrated increased striatal DaT density. Clinically, up-regulation might explain the lack of sustained relief of behavioral symptoms with stimulant therapy in 20% of patients with ADHD who showed clinical improvement initially.36
Only limited conclusions can be drawn about the role of DaT levels in ADHD, given the small number of patients studied in published reports. In addition, the Fusar-Poli meta-analysis has come under strong criticism because of methodological errors with improper patient inclusion and characterization of treatment status,37 calling into question the investigators’ conclusions.
Does the DaT level hold promise for practice? Despite a lack of clarity about the significance of DaT level in the etiology of ADHD, knowledge of a patient’s level might prove useful in predicting which patients will respond to methylphenidate. Namely, several researchers have found that:
• an elevated baseline level of DaT (before stimulant therapy) correlates with robust clinical response
• absence of an elevated baseline DaT level suggests that symptomatic improvement with stimulant therapy in unlikely.38-40
Dresel et al38 evaluated 17 drug-naïve adults, newly diagnosed with ADHD, using 99m-technetium TRODAT SPECT before and after methylphenidate therapy. They found a 15% increase in specific DaT binding in patients with ADHD, compared with controls, at baseline. After treatment, the researchers observed a 28% reduction in specific DaT binding—a significant change from baseline that correlated with behavioral response.
Study: SPECT in 18 adults with ADHD given methylphenidate. Krause39 used the same SPECT agent to study 18 adults before they received methylphenidate and 10 weeks after treatment. Participants were categorized as responders or nonresponders based on clinical assessment of ADHD symptoms after those 10 weeks. All 12 responders had an elevated striatal DaT concentration at baseline. Of the 6 nonresponders, 5 had a normal level of striatal DaT compared with age-matched controls.
Study: 22 Adult ADHD patients evaluated with 99m-technetium TRODAT SPECT. The same group of investigators40 presented imaging findings in 22 additional adult patients. Seventeen had an elevated striatal DaT level, 16 of whom responded to stimulant therapy. The remaining 5 patients had reduced striatal DaT at baseline; none had a good clinical response to methylphenidate.
The positive clinical response to methylphenidate in 67%37 and 77%40 of patients is in good agreement with results from larger studies, which reported that approximately 75% of patients with ADHD show prompt clinical improvement with stimulants.41 Improvement might be related to an increase in functioning of the frontostriatal dopaminergic circuit that is seen with stimulant therapy. Increased availability of dopamine at the synapse, resulting from stimulant blockade of the dopamine reuptake transporter, produces increased dopamine neurotransmission and increased activation of frontostriatal circuits.
In another study, rCBF in frontostriatal circuits was determined to be inversely proportional to DaT density; rCBF normalized with stimulant therapy.42
Will imaging pave the way for therapeutic stratification? Baseline determinations of striatal DaT concentration with SPECT imaging might make it possible to stratify patients with ADHD symptoms into those likely to show significant behavioral symptom response to methylphenidate and those who are not likely to respond. There might be an objective imaging finding—striatal DaT density—that allows clinicians to distinguish stimulant-responsive ADHD from stimulant-unresponsive ADHD.
Dopamine substrate imaging
Radiolabeled dopa (carbon-11 or fluorine-18) is transported into presynaptic dopaminergic neurons in the striatum, where it is decarboxylated, converted to radio-dopamine, and stored within vesicles until released in response to neuronal excitation. Semi-quantitative assessment is achieved with calculation of specific (striatal) to nonspecific (background) uptake ratios. Increased values are thought to indicate increased density of dopaminergic neurons.43
Ernst et al44 reported a 50% decrease in specific fluorine-18 dopa uptake in the left prefrontal cortex in 17 drug-naïve adults with ADHD, compared with 23 controls. The same team reported increased midbrain fluorine-18 dopa levels in 10 adolescents with ADHD—48% higher, overall, than what was seen in 10 controls.43 They hypothesized that these opposite results were the results of a reduction in the dopaminergic neuronal density in adults, which might be part of the natural history of ADHD, or a normal age-related reduction in neuronal density, or both. Increased dopa levels in the team’s adolescent group were hypothesized to reflect up-regulation in dopamine synthesis due to low synaptic dopamine concentrations that might result from increased dopamine reuptake.
Dopamine-receptor imaging
The 5 distinct dopamine receptors (D1, D2, D3, D4, and D5) can be grouped into 2 subtypes, based on their coupling with G proteins. D1 and D5 constitute a group; D2, D3, and D4, a second group.
The D1 receptor is the most common dopamine receptor in the brain and is widely distributed in the striatum and prefrontal cerebral cortex. D1 receptor knockout mice demonstrate hyperactivity and poorer performance on learning tasks and are used as an animal model for ADHD.45 D1 has been imaged using C-11 SCH 23390 PET46 in rats, but its role in ADHD has yet to be evaluated. D5 is the most recently cloned and most widely distributed of the known dopamine receptors; however, there are no imaging studies of the D5 receptor.13
D2 receptors are present in presynaptic and postsynaptic neurons47 in the neocortex, substantia nigra, nucleus accumbens, and olfactory tubercle, as well as in other structures.48 Presynaptic D2 receptors act as autoregulators, inhibiting dopaminergic synthesis, firing rate, and release.49
Using C-11 raclopride PET imaging, Lou et al50 reported high D2/3 receptor availability in adolescents who had a history of perinatal cerebral ischemia. They found that this availability is associated with an increase in the severity of ADHD symptoms. They proposed that the increase in “empty” receptor density might have been caused by perinatal ischemia-induced presynaptic dopaminergic neuronal loss or an increase in presynaptic dopamine reuptake (Figure 550). Either mechanism could result in up-regulation in postsynaptic D2/3 receptors.
Volkow et al51 reported that D2 receptor density correlated with methylphenidate-induced changes in rCBF in frontal and temporal lobes in humans. They postulated that the variable therapeutic effects of methylphenidate seen in ADHD patients might be related to variations in baseline D2 receptor availability.
Lou et al50 reported elevated D2 receptor density, demonstrated using carbon-11 raclopride, in children with ADHD, compared with normal adults.
Further support for a relationship between D2-receptor density and symptomatic improvement with methylphenidate in ADHD was presented by Ilgin et al52 using iodine-123 iodobenzamide SPECT. They found elevated D2 receptor levels in 9 drug-naïve children with ADHD, which is 20% to 60% above what is seen in unaffected children. They noted that these patients showed improvement in hyperactivity when treated with methylphenidate.
In a similar study of 20 drug-naïve adults, Volkow et al53 found that durable symptomatic improvement with methylphenidate therapy was associated with increased D2 receptor availability.
Summing up
Striatal DaT is the most likely synaptic target for stratifying patients with ADHD, now that a dopamine transporter imaging agent is available commercially. Stratification might allow for refinement in the diagnostic categorization of ADHD, with introduction of stimulant-responsive and stimulant-unresponsive subtypes that are based on DaT imaging findings.
Bottom Line
Given recent advances showing molecular alterations in the dopaminergic-frontostriatal pathway as central to attention-deficit/hyperactivity disorder, molecular imaging might be useful as an objective study for diagnosis.
Related Resources
• Schweitzer JB, Lee DO, Hanford RB, et al. A positron emission tomography study of methylphenidate in adults with ADHD: alterations in resting blood flow and predicting treatment response. Neuropsychopharmacology. 2003;28(5):967-973.
• Raz A. Brain imaging data of ADHD. Psychiatric Times. http://www.psychiatrictimes.com/adhd/brain-imaging-data-adhd.
Drug Brand Names
Iodine-123 ioflupane • Methylphenidate • Ritalin DaTscan
Acknowledgment
Kylee M. L. Unsdorfer, a medical student at Northeast Ohio Medical University, helped prepare the manuscript of this article.
Disclosures
Dr. Thacker reports no financial relationships with any company whose products are mentioned in this article or with manufacturers of competing products.
Dr. Binkovitz received 4 doses of ioflupane I123I (DaTscan) from General Electric for investigator-initiated research, used for animal imaging in 2012.
1. Polanczyk G, de Lima MS, Horta BL, et al. The worldwide prevalence of ADHD: a systematic review and metaregression analysis. Am J Psychiatry. 2007;164(6):942-948.
2. Simon V, Czobor P, Bálint S, et al. Prevalence and correlates of adult attention-deficit hyperactivity disorder: meta-analysis. Br J Psychiatry. 2009;194(3):204-211.
3. Diagnostic and statistical manual of mental disorders, 5th ed. Washington, DC: American Psychiatric Association; 2013.
4. Berger I. Diagnosis of attention deficit hyperactivity disorder: much ado about something. Isr Med Assoc J. 2011;13(9):571-574.
5. Schonwald A, Lechner E. Attention deficit/hyperactivity disorder: complexities and controversies. Curr Opin Pediatr. 2006;18(2):189-195.
6. Rousseau C, Measham T, Bathiche-Suidan M. DSM IV, culture and child psychiatry. J Can Acad Child Adolesc Psychiatry. 2008;17(2):69-75.
7. Taylor-Klaus E. Bringing the ADHD debate into sharper focus: part 1. The Huffington Post. http:// www.huffingtonpost.com/elaine-taylorklaus/adhd-debate_b_4571097.html. Updated March 17, 2014. Accessed August 18, 2015.
8. Sweeney CT, Sembower MA, Ertischek MD, et al. Nonmedical use of prescription ADHD stimulants and preexisting patterns of drug abuse. J Addict Dis. 2013;32(1):1-10.
9. Hitt E. Multiple reports of ADHD drug shortages. Medscape. http://www.medscape.com/viewarticle/742686. Published May 13, 2011. Accessed June 4, 2015.
10. Rubia K, Alegria AA, Cubillo AI, et al. Effects of stimulants on brain function in attention-deficit/hyperactivity disorder: a systematic review and meta-analysis. Biol Psychiatry. 2014;76(8):616-628.
11. Cortese S, Kelly C, Chabernaud C, et al. Toward systems neuroscience of ADHD: a meta-analysis of 55 fMRI studies. Am J Psychiatry. 2012;169(10):1038-1055.
12. Garnock-Jones KP, Keating GM. Atomoxetine: a review of its use in attention-deficit hyperactivity disorder in children and adolescents. Paediatr Drugs. 2009;11(3):203-226.
13. Wu J, Xiao H, Sun H, et al. Role of dopamine receptors in ADHD: a systematic meta-analysis. Mol Neurobiol. 2012; 45(3):605-620.
14. Del Campo N, Chamberlain SR, Sahakian BJ, et al. The roles of dopamine and noradrenaline in the pathophysiology and treatment of attention-deficit/hyperactivity disorder. Biol Psychiatry. 2011;69(12):e145-e157.
15. Berridge CW, Devilbiss DM. Psychostimulants as cognitive enhancers: the prefrontal cortex, catecholamines, and attention-deficit/hyperactivity disorder. Biol Psychiatry. 2011;69(12):e101-e111.
16. Lou HC, Henriksen L, Bruhn P. Focal cerebral hypoperfusion in children with dysphasia and/or attention deficit disorder. Arch Neurol. 1984;41(8):825-829.
17. Gustafsson P, Thernlund G, Ryding E, et al. Associations between cerebral blood-flow measured by single photon emission computed tomography (SPECT), electro-encephalogram (EEG), behaviour symptoms, cognition and neurological soft signs in children with attention-deficit hyperactivity disorder (ADHD). Acta Paediatr. 2000;89(7):830-835.
18. Sieg KG, Gaffney GR, Preston DF, et al. SPECT brain imaging abnormalities in attention deficit hyperactivity disorder. Clin Nucl Med. 1995;20(1):55-60.
19. Spalletta G, Pasini A, Pau F, et al. Prefrontal blood flow dysregulation in drug naive ADHD children without structural abnormalities. J Neural Transm. 2001;108(10):1203-1216.
20. Amen DG, Carmichael BD. High-resolution brain SPECT imaging in ADHD. Ann Clin Psychiatry. 1997;9(2):81-86.
21. Kim BN, Lee JS, Cho SC, et al. Methylphenidate increased regional cerebral blood flow in subjects with attention deficit/hyperactivity disorder. Yonsei Med J. 2001;42(1):19-29.
22. Lou HC, Henriksen L, Bruhn P, et al. Striatal dysfunction in attention deficit and hyperkinetic disorder. Arch Neurol. 1989;46(1):48-52.
23. Lee JS, Kim BN, Kang E, et al. Regional cerebral blood flow in children with attention deficit hyperactivity disorder: comparison before and after methylphenidate treatment. Hum Brain Mapp. 2005;24(3):157-164.
24. Schweitzer JB, Lee DO, Hanford RB, et al. A positron emission tomography study of methylphenidate in adults with ADHD: alterations in resting blood flow and predicting treatment response. Neuropsychopharmacology. 2003;28(5):967-973.
25. Zametkin AJ, Nordahl TE, Gross M, et al. Cerebral glucose metabolism in adults with hyperactivity of childhood onset. N Engl J Med. 1990;323(20):1361-1366.
26. Zametkin AJ, Liebenauer LL, Fitzgerald GA, et al. Brain metabolism in teenagers with attention-deficit hyperactivity disorder. Arch Gen Psychiatry. 1993;50(5):333-340.
27. Ernst M, Zametkin AJ, Matochik JA, et al. Effects of intravenous dextroamphetamine on brain metabolism in adults with attention-deficit hyperactivity disorder (ADHD). Preliminary findings. Psychopharmacol Bull. 1994;30(2):219-225.
28. Janssen M. Dopamine transporter (DaT) SPECT imaging. MI Gateway. 2012;6(1):1-3. http://interactive.snm.org/ docs/MI_Gateway_Newsletter_2012-1%20Dopamine%20 Transporter%20SPECT%20Imaging.pdf. Accessed August 18, 2015.
29. Volkow ND, Wang GJ, Fowler JS, et al. Dopamine transporter occupancies in the human brain induced by therapeutic doses of oral methylphenidate. Am J Psychiatry. 1998;155(10):1325-1331.
30. Volkow ND, Wang G, Fowler JS, et al. Therapeutic doses of oral methylphenidate significantly increase extracellular dopamine in the human brain. J Neurosci. 2001;21(2):RC121.
31. Dougherty DD, Bonab AA, Spencer TJ, et al. Dopamine transporter density in patients with attention deficit hyperactivity disorder. Lancet. 1999;354(9196):2132-2133.
32. Li JJ, Lee SS. Interaction of dopamine transporter gene and observed parenting behaviors on attention-deficit/ hyperactivity disorder: a structural equation modeling approach. J Clin Child Adolesc Psychol. 2013;42(2):174-186.
33. Hesse S, Ballaschke O, Barthel H, et al. Dopamine transporter imaging in adult patients with attention-deficit/ hyperactivity disorder. Psychiatry Res. 2009;171(2):120-128.
34. Volkow ND, Wang GJ, Kollins SH, et al. Evaluating dopamine reward pathway in ADHD: clinical implications. JAMA. 2009;302(10):1084-1091.
35. Fusar-Poli P, Rubia K, Rossi G, et al. Striatal dopamine transporter alterations in ADHD: pathophysiology or adaptation to psychostimulants? A meta-analysis. Am J Psychiatry. 2012;169(3):264-272.
36. Wang GJ, Volkow ND, Wigal T, et al. Long-term stimulant treatment affects brain dopamine transporter level in patients with attention deficit hyperactive disorder. PLoS One. 2013;8(5):e63023.
37. Spencer TJ, Madras BK, Fischman AJ, et al. Striatal dopamine transporter binding in adults with ADHD. Am J Psychiatry. 2012;169(6):665; author reply 666.
38. Dresel S, Krause J, Krause KH, et al. Attention deficit hyperactivity disorder: binding of [99mTc]TRODAT-1 to the dopamine transporter before and after methylphenidate treatment. Eur J Nucl Med. 2000;27(10):1518-1524.
39. Krause J, la Fougere C, Krause KH, et al. Influence of striatal dopamine transporter availability on the response to methylphenidate in adult patients with ADHD. Eur Arch Psychiatry Clin Neurosci. 2005;255(6):428-431.
40. la Fougère C, Krause J, Krause KH, et al. Value of 99mTc-TRODAT-1 SPECT to predict clinical response to methylphenidate treatment in adults with attention deficit hyperactivity disorder. Nucl Med Commun. 2006;27(9):733-737.
41. MTA Cooperative Group. National Institute of Mental Health Multimodal Treatment Study of ADHD follow-up: 24-month outcomes of treatment strategies for attention-deficit/hyperactivity disorder. Pediatrics. 2004;113(4):754-761.
42. da Silva N Jr, Szobot CM, Anselmi CE, et al. Attention deficit/hyperactivity disorder: is there a correlation between dopamine transporter density and cerebral blood flow? Clin Nucl Med. 2011;36(8):656-660.
43. Ernst M, Zametkin AJ, Matochik JA, et al. High midbrain [18F]DOPA accumulation in children with attention deficit hyperactivity disorder. Am J Psychiatry. 1999;156(8):1209-1215.
44. Ernst M, Zametkin AJ, Matochik JA, et al. DOPA decarboxylase activity in attention deficit hyperactivity disorder adults. A [fluorine-18]fluorodopa positron emission tomographic study. J Neurosci. 1998;18(15):5901-5907.
45. Xu M, Moratalla R, Gold LH, et al. Dopamine D1 receptor mutant mice are deficient in striatal expression of dynorphin and in dopamine-mediated behavioral responses. Cell. 1994;79(4):729-742.
46. Goodwin RJ, Mackay CL, Nilsson A, et al. Qualitative and quantitative MALDI imaging of the positron emission tomography ligands raclopride (a D2 dopamine antagonist) and SCH 23390 (a D1 dopamine antagonist) in rat brain tissue sections using a solvent-free dry matrix application method. Anal Chem. 2011;83(24):9694-9701.
47. Negyessy L, Goldman-Rakic PS. Subcellular localization of the dopamine D2 receptor and coexistence with the calcium-binding protein neuronal calcium sensor-1 in the primate prefrontal cortex. J Comp Neurol. 2005;488(4):464-475.
48. Boyson SJ, McGonigle P, Molinoff PB. Quantitative autoradiographic localization of the D1 and D2 subtypes of dopamine receptors in rat brain. J Neurosci. 1986;6(11):3177-3188.
49. Doi M, Yujnovsky I, Hirayama J, et al. Impaired light masking in dopamine D2 receptor-null mice. Nat Neurosci. 2006;9(6):732-734.
50. Lou HC, Rosa P, Pryds O, et al. ADHD: increased dopamine receptor availability linked to attention deficit and low neonatal cerebral blood flow. Dev Med Child Neurol. 2004;46(3):179-183.
51. Volkow ND, Wang GJ, Fowler JS, et al. Effects of methylphenidate on regional brain glucose metabolism in humans: relationship to dopamine D2 receptors. Am J Psychiatry. 1997;154(1):50-55.
52. Ilgin N, Senol S, Gucuyener K, et al. Is increased D2 receptor availability associated with response to stimulant medication in ADHD. Dev Med Child Neurol. 2001;43(11):755-760.
53. Volkow ND, Wang GJ, Tomasi D, et al. Methylphenidate-elicited dopamine increases in ventral striatum are associated with long-term symptom improvement in adults with attention deficit hyperactivity disorder. J Neurosci. 2012;32(3):841-849.
Attention-deficit/hyperactivity disorder (ADHD) is one of the most common pediatric psychiatric disorders, occurring in approximately 5% of children.1 The disorder persists into adulthood in about one-half of those who are affected in childhood.2 In adults and children, diagnosis continues to be based on the examiner’s subjective assessment. (Box 13-9 describes how ADHD presents a complicated, moving target for the diagnostician.)
Patients who have ADHD are rarely studied with imaging; there are no established imaging findings associated with an ADHD diagnosis. Over the past 20 years, however, significant research has shown that molecular alterations along the dopaminergic−frontostriatal pathways occur in association with the behavioral constellation of ADHD symptoms—suggesting a pathophysiologic mechanism for this disorder.
In this article, we describe molecular findings from nuclear medicine imaging in ADHD. We also summarize imaging evidence for dysfunction of the dopaminergic-frontostriatal neural circuits as central in the pathophysiology of ADHD, with special focus on the dopamine reuptake transporter (DaT). Box 210,11 reviews our key observations and looks at the future of imaging in the management of ADHD.
Dopaminergic theory of ADHD
The executive functions that are disordered in ADHD (impulse control, judgment, maintaining attention) are thought to be centered in the infraorbital, dorsolateral, and medial frontal lobes. Neurotransmitters that have been implicated in the pathophysiology of ADHD include norepinephrine12 and dopamine13; medications that selectively block reuptake of these neurotransmitters are used to treat ADHD.14,15 Only the dopamine system has been extensively evaluated with molecular imaging techniques.
Because methylphenidate, a potent selective dopamine reuptake inhibitor, has been shown to reduce disordered executive functional behaviors in ADHD, considerable imaging research has focused on the dopaminergic neural circuits in the frontostriatal regions of the brain. The dopaminergic theory of ADHD is based on the hypothesis that alterations in the density or function of these circuits are responsible for behaviors that constitute ADHD.
Despite decades of efforts to delineate the underlying pathophysiology and neurochemistry of ADHD, no single unifying theory accounts for all imaging findings in all patients. This might be in part because of imprecision inherent in psychiatric diagnoses that are based on subjective observations. The behavioral criteria for ADHD can manifest in several disorders. For example, anxiety-related symptoms seen in posttraumatic stress disorder, social anxiety disorder, and panic disorder also present as behaviors similar to those in ADHD diagnostic criteria.
Molecular imaging might provide a window into the underlying pathophysiology of ADHD and, by identifying objective findings, (1) allow for patient stratification based on underlying physiologic subtypes, (2) refine diagnostic criteria, and (3) predict treatment response.
Nuclear medicine findings
In general, nuclear medicine investigations of ADHD can be divided into studies of changes in regional cerebral blood flow (rCBF) or glucose metabolism (rCGM) and those that have assessed the concentration of synaptic structures, using highly specific radiolabeled ligands. Both kinds of studies provide limited anatomic resolution, unless co-registered with MRI or CT scans and either single photon emission computed tomography (SPECT) or positron emission tomography (PET).
Synaptic imaging using radiolabeled ligands with high biologic specificity for synaptic structures has high molecular resolution—that is, radiolabeled ligands used for selective imaging of the dopamine transporter or receptor do not identify serotonin transporters or receptors, and vice versa. (Details of SPECT and PET techniques are beyond the scope of this article but can be found in standard nuclear medicine textbooks.)
SPECT and PET of rCBF
Early investigations of rCBF in ADHD were performed using inhaled radioactive xenon-133 gas.16 Later, rCBF was assessed using fat-soluble radiolabeled ligands that rapidly distribute in the brain in proportion to blood flow by crossing the blood−brain barrier. Labeled with radioactive 99m-technetium, these ligands cross rapidly into brain cells after IV injection. Once intracellular, covalent bonds within the ligands cleave into 2 charged particles that do not easily recross the cell membrane. There is little redistribution of tracer after initial uptake.
The imaging data set that results can be reconstructed as (1) surface images, on which defects indicate areas of reduced rCBF, or (2) tomographic slices on which color scales indicate relative rCBF values (Figure 1). Because of the minimal redistribution of the tracer, SPECT images obtained 1 or 2 hours after injection provide a snapshot of rCBF at the time tracer is injected. Patients can be injected under various conditions, such as at rest with eyes and ears open in a dimly lit, quiet room, and then under cognitive stress (Figure 2), such as performing a computer-based attention and impulse control task, or during stimulant treatment.
Numerous investigators have found reduced frontal or striatal rCBF, or both, in patients with ADHD, unilaterally on the right17 or left,18,19 or bilaterally.20 Additionally, with stimulant therapy, normalization of striatal and frontal rCBF has been demonstrated14,19—changes that correlate with resolution of behavioral symptoms of ADHD with stimulant treatment.21
SPECT of 32 boys with previously untreated ADHD. Kim et al21 found that the presence of reduced right or left, or both, frontal rCBF, which normalized with 8 weeks of stimulant therapy, predicted symptom improvement in 85% of patients. Absence of improvement of reduced frontal rCBF had a 75% negative predictive value for treatment response. (Additionally, hyperperfusion of the somatosensory cortex has been demonstrated in children with ADHD,16,22 suggesting increased responsiveness to extraneous environmental input.)
SPECT of 40 untreated pediatric patients compared with 17 age-matched controls. Using SPECT, Lee et al23 reported rCBF reductions in the orbitofrontal cortex and the medial temporal gyrus of participants; reductions corresponded to areas of motor and impulsivity control. The researchers also demonstrated increased rCBF in the somatosensory area.
After methylphenidate treatment, blood flow to these areas normalized, and rCBF to higher visual and superior prefrontal areas decreased. Substantial clinical improvement occurred in 64% of patients—suggesting methylphenidate treatment of ADHD works by (1) increasing function of areas of the brain that control impulses, motor activity, and attention, and (2) reducing function to sensory areas that lead to distraction by extraneous environmental sensory input.
O-15-labeled water PET of 10 adults with ADHD. Schweitzer et al24 found that participants who demonstrated improvement in behavioral symptoms with chronic stimulant therapy had reduced rCBF in the striata at baseline—again, suggesting that baseline hypometabolism in the striata is associated with ADHD.
PET of regional cerebral glucose metabolism
Cerebral metabolism requires a constant supply of glucose; regional differences in cerebral glucose metabolism can be assessed directly with positron-emitting F-18-fluoro-2-deoxyglucose. Although metabolically inert, this agent is transported intracellularly similar to glucose; once phosphorylated within brain cells, however, it can no longer undergo further metabolism or redistribution.
Studies using PET to assess rCGM were some of the earliest molecular imaging applications in ADHD. Zametkin et al25 reported low global cerebral glucose utilization in adults, but not adolescents,26 with ADHD. However, further study, with normalization of the PET data, confirmed reduced rCGM in the left prefrontal cortex in both adolescents26 and adults,27 indicating hypometabolism of cortical areas associated with impulse control and attention in ADHD. In adolescents, symptom severity was inversely related to rCBF in the left anterior frontal cortex.
Synaptic imaging
Nuclear imaging has been used to study several components of the striatal dopaminergic synapse, including:
• dopamine substrates, using fluorine- 18-labeled dopa or carbon-11-labeled dopa
• dopamine receptors, using carbon- 11-labeled raclopride or iodine-123 iodobenzamide
• the tDaT, using iodine-123 ioflupane, 99m-technetium TRODAT, or carbon-11 cocaine (Figure 3).
All of these synaptic imaging agents were used mainly as research tools until 2011, when the FDA approved the SPECT imaging agent iodine-123 ioflupane (DaTscan) for clinical use in assessment of Parkinson’s disease.28 This commercially available agent has high specificity for the DaT, with little background activity noted on SPECT imaging (Figure 4).
Dopamine transporter imaging
Because the site of action of methylphenidate is the DaT, imaging this component of the striatal dopaminergic synapse has been an area of intense investigation in ADHD. Located almost exclusively in the striata, DaT reduces synaptic concentrations of dopamine by means of reuptake channels in the cell membrane.29 By reversibly binding to, and occupying sites on, the DaT, methylphenidate impedes dopamine reuptake, which results in increased availability of dopamine at the synapse.30
By demonstrating an increase in striatal DaT density in patients with ADHD— first reported by Dougherty et al31 using iodine-123 altropane (a dopaminergic uptake inhibitor) in 6 adults with ADHD—investigators have hypothesized that excessive expression of the DaT protein in the striata, which may result from genetic or environmental factors, is a central causative agent of ADHD.32 Subsequent studies, however, have yielded contradictory findings: Hesse et al,33 using SPECT imaging, and Volkow et al,34 using carbon-11 cocaine PET imaging, found reduced DaT density in, respectively, 9 and 26 patients with ADHD.
To clarify the role of DaT levels in the etiology of ADHD and to explain discrepant results, Fusar-Poli et al35 performed a meta-analysis of 9 published papers that reported the results of DaT imaging in a total of 169 ADHD patients and 129 controls. They noted that these studies included 6 different imaging agents and protocols. Patients were stimulant therapy-naïve (n = 137) or drug-free (refrained from stimulant therapy for a time [n = 32]). The team found that the degree of elevation of the striatal DaT concentration correlated with a history of stimulant exposure, and that the drug-naïve group had a reduced DaT level.
Fusar-Poli’s hypothesis? Elevated DaT levels result from up-regulation in the presence of chronic methylphenidate therapy, which accounts for early reports that demonstrated increased striatal DaT density. Clinically, up-regulation might explain the lack of sustained relief of behavioral symptoms with stimulant therapy in 20% of patients with ADHD who showed clinical improvement initially.36
Only limited conclusions can be drawn about the role of DaT levels in ADHD, given the small number of patients studied in published reports. In addition, the Fusar-Poli meta-analysis has come under strong criticism because of methodological errors with improper patient inclusion and characterization of treatment status,37 calling into question the investigators’ conclusions.
Does the DaT level hold promise for practice? Despite a lack of clarity about the significance of DaT level in the etiology of ADHD, knowledge of a patient’s level might prove useful in predicting which patients will respond to methylphenidate. Namely, several researchers have found that:
• an elevated baseline level of DaT (before stimulant therapy) correlates with robust clinical response
• absence of an elevated baseline DaT level suggests that symptomatic improvement with stimulant therapy in unlikely.38-40
Dresel et al38 evaluated 17 drug-naïve adults, newly diagnosed with ADHD, using 99m-technetium TRODAT SPECT before and after methylphenidate therapy. They found a 15% increase in specific DaT binding in patients with ADHD, compared with controls, at baseline. After treatment, the researchers observed a 28% reduction in specific DaT binding—a significant change from baseline that correlated with behavioral response.
Study: SPECT in 18 adults with ADHD given methylphenidate. Krause39 used the same SPECT agent to study 18 adults before they received methylphenidate and 10 weeks after treatment. Participants were categorized as responders or nonresponders based on clinical assessment of ADHD symptoms after those 10 weeks. All 12 responders had an elevated striatal DaT concentration at baseline. Of the 6 nonresponders, 5 had a normal level of striatal DaT compared with age-matched controls.
Study: 22 Adult ADHD patients evaluated with 99m-technetium TRODAT SPECT. The same group of investigators40 presented imaging findings in 22 additional adult patients. Seventeen had an elevated striatal DaT level, 16 of whom responded to stimulant therapy. The remaining 5 patients had reduced striatal DaT at baseline; none had a good clinical response to methylphenidate.
The positive clinical response to methylphenidate in 67%37 and 77%40 of patients is in good agreement with results from larger studies, which reported that approximately 75% of patients with ADHD show prompt clinical improvement with stimulants.41 Improvement might be related to an increase in functioning of the frontostriatal dopaminergic circuit that is seen with stimulant therapy. Increased availability of dopamine at the synapse, resulting from stimulant blockade of the dopamine reuptake transporter, produces increased dopamine neurotransmission and increased activation of frontostriatal circuits.
In another study, rCBF in frontostriatal circuits was determined to be inversely proportional to DaT density; rCBF normalized with stimulant therapy.42
Will imaging pave the way for therapeutic stratification? Baseline determinations of striatal DaT concentration with SPECT imaging might make it possible to stratify patients with ADHD symptoms into those likely to show significant behavioral symptom response to methylphenidate and those who are not likely to respond. There might be an objective imaging finding—striatal DaT density—that allows clinicians to distinguish stimulant-responsive ADHD from stimulant-unresponsive ADHD.
Dopamine substrate imaging
Radiolabeled dopa (carbon-11 or fluorine-18) is transported into presynaptic dopaminergic neurons in the striatum, where it is decarboxylated, converted to radio-dopamine, and stored within vesicles until released in response to neuronal excitation. Semi-quantitative assessment is achieved with calculation of specific (striatal) to nonspecific (background) uptake ratios. Increased values are thought to indicate increased density of dopaminergic neurons.43
Ernst et al44 reported a 50% decrease in specific fluorine-18 dopa uptake in the left prefrontal cortex in 17 drug-naïve adults with ADHD, compared with 23 controls. The same team reported increased midbrain fluorine-18 dopa levels in 10 adolescents with ADHD—48% higher, overall, than what was seen in 10 controls.43 They hypothesized that these opposite results were the results of a reduction in the dopaminergic neuronal density in adults, which might be part of the natural history of ADHD, or a normal age-related reduction in neuronal density, or both. Increased dopa levels in the team’s adolescent group were hypothesized to reflect up-regulation in dopamine synthesis due to low synaptic dopamine concentrations that might result from increased dopamine reuptake.
Dopamine-receptor imaging
The 5 distinct dopamine receptors (D1, D2, D3, D4, and D5) can be grouped into 2 subtypes, based on their coupling with G proteins. D1 and D5 constitute a group; D2, D3, and D4, a second group.
The D1 receptor is the most common dopamine receptor in the brain and is widely distributed in the striatum and prefrontal cerebral cortex. D1 receptor knockout mice demonstrate hyperactivity and poorer performance on learning tasks and are used as an animal model for ADHD.45 D1 has been imaged using C-11 SCH 23390 PET46 in rats, but its role in ADHD has yet to be evaluated. D5 is the most recently cloned and most widely distributed of the known dopamine receptors; however, there are no imaging studies of the D5 receptor.13
D2 receptors are present in presynaptic and postsynaptic neurons47 in the neocortex, substantia nigra, nucleus accumbens, and olfactory tubercle, as well as in other structures.48 Presynaptic D2 receptors act as autoregulators, inhibiting dopaminergic synthesis, firing rate, and release.49
Using C-11 raclopride PET imaging, Lou et al50 reported high D2/3 receptor availability in adolescents who had a history of perinatal cerebral ischemia. They found that this availability is associated with an increase in the severity of ADHD symptoms. They proposed that the increase in “empty” receptor density might have been caused by perinatal ischemia-induced presynaptic dopaminergic neuronal loss or an increase in presynaptic dopamine reuptake (Figure 550). Either mechanism could result in up-regulation in postsynaptic D2/3 receptors.
Volkow et al51 reported that D2 receptor density correlated with methylphenidate-induced changes in rCBF in frontal and temporal lobes in humans. They postulated that the variable therapeutic effects of methylphenidate seen in ADHD patients might be related to variations in baseline D2 receptor availability.
Lou et al50 reported elevated D2 receptor density, demonstrated using carbon-11 raclopride, in children with ADHD, compared with normal adults.
Further support for a relationship between D2-receptor density and symptomatic improvement with methylphenidate in ADHD was presented by Ilgin et al52 using iodine-123 iodobenzamide SPECT. They found elevated D2 receptor levels in 9 drug-naïve children with ADHD, which is 20% to 60% above what is seen in unaffected children. They noted that these patients showed improvement in hyperactivity when treated with methylphenidate.
In a similar study of 20 drug-naïve adults, Volkow et al53 found that durable symptomatic improvement with methylphenidate therapy was associated with increased D2 receptor availability.
Summing up
Striatal DaT is the most likely synaptic target for stratifying patients with ADHD, now that a dopamine transporter imaging agent is available commercially. Stratification might allow for refinement in the diagnostic categorization of ADHD, with introduction of stimulant-responsive and stimulant-unresponsive subtypes that are based on DaT imaging findings.
Bottom Line
Given recent advances showing molecular alterations in the dopaminergic-frontostriatal pathway as central to attention-deficit/hyperactivity disorder, molecular imaging might be useful as an objective study for diagnosis.
Related Resources
• Schweitzer JB, Lee DO, Hanford RB, et al. A positron emission tomography study of methylphenidate in adults with ADHD: alterations in resting blood flow and predicting treatment response. Neuropsychopharmacology. 2003;28(5):967-973.
• Raz A. Brain imaging data of ADHD. Psychiatric Times. http://www.psychiatrictimes.com/adhd/brain-imaging-data-adhd.
Drug Brand Names
Iodine-123 ioflupane • Methylphenidate • Ritalin DaTscan
Acknowledgment
Kylee M. L. Unsdorfer, a medical student at Northeast Ohio Medical University, helped prepare the manuscript of this article.
Disclosures
Dr. Thacker reports no financial relationships with any company whose products are mentioned in this article or with manufacturers of competing products.
Dr. Binkovitz received 4 doses of ioflupane I123I (DaTscan) from General Electric for investigator-initiated research, used for animal imaging in 2012.
1. Polanczyk G, de Lima MS, Horta BL, et al. The worldwide prevalence of ADHD: a systematic review and metaregression analysis. Am J Psychiatry. 2007;164(6):942-948.
2. Simon V, Czobor P, Bálint S, et al. Prevalence and correlates of adult attention-deficit hyperactivity disorder: meta-analysis. Br J Psychiatry. 2009;194(3):204-211.
3. Diagnostic and statistical manual of mental disorders, 5th ed. Washington, DC: American Psychiatric Association; 2013.
4. Berger I. Diagnosis of attention deficit hyperactivity disorder: much ado about something. Isr Med Assoc J. 2011;13(9):571-574.
5. Schonwald A, Lechner E. Attention deficit/hyperactivity disorder: complexities and controversies. Curr Opin Pediatr. 2006;18(2):189-195.
6. Rousseau C, Measham T, Bathiche-Suidan M. DSM IV, culture and child psychiatry. J Can Acad Child Adolesc Psychiatry. 2008;17(2):69-75.
7. Taylor-Klaus E. Bringing the ADHD debate into sharper focus: part 1. The Huffington Post. http:// www.huffingtonpost.com/elaine-taylorklaus/adhd-debate_b_4571097.html. Updated March 17, 2014. Accessed August 18, 2015.
8. Sweeney CT, Sembower MA, Ertischek MD, et al. Nonmedical use of prescription ADHD stimulants and preexisting patterns of drug abuse. J Addict Dis. 2013;32(1):1-10.
9. Hitt E. Multiple reports of ADHD drug shortages. Medscape. http://www.medscape.com/viewarticle/742686. Published May 13, 2011. Accessed June 4, 2015.
10. Rubia K, Alegria AA, Cubillo AI, et al. Effects of stimulants on brain function in attention-deficit/hyperactivity disorder: a systematic review and meta-analysis. Biol Psychiatry. 2014;76(8):616-628.
11. Cortese S, Kelly C, Chabernaud C, et al. Toward systems neuroscience of ADHD: a meta-analysis of 55 fMRI studies. Am J Psychiatry. 2012;169(10):1038-1055.
12. Garnock-Jones KP, Keating GM. Atomoxetine: a review of its use in attention-deficit hyperactivity disorder in children and adolescents. Paediatr Drugs. 2009;11(3):203-226.
13. Wu J, Xiao H, Sun H, et al. Role of dopamine receptors in ADHD: a systematic meta-analysis. Mol Neurobiol. 2012; 45(3):605-620.
14. Del Campo N, Chamberlain SR, Sahakian BJ, et al. The roles of dopamine and noradrenaline in the pathophysiology and treatment of attention-deficit/hyperactivity disorder. Biol Psychiatry. 2011;69(12):e145-e157.
15. Berridge CW, Devilbiss DM. Psychostimulants as cognitive enhancers: the prefrontal cortex, catecholamines, and attention-deficit/hyperactivity disorder. Biol Psychiatry. 2011;69(12):e101-e111.
16. Lou HC, Henriksen L, Bruhn P. Focal cerebral hypoperfusion in children with dysphasia and/or attention deficit disorder. Arch Neurol. 1984;41(8):825-829.
17. Gustafsson P, Thernlund G, Ryding E, et al. Associations between cerebral blood-flow measured by single photon emission computed tomography (SPECT), electro-encephalogram (EEG), behaviour symptoms, cognition and neurological soft signs in children with attention-deficit hyperactivity disorder (ADHD). Acta Paediatr. 2000;89(7):830-835.
18. Sieg KG, Gaffney GR, Preston DF, et al. SPECT brain imaging abnormalities in attention deficit hyperactivity disorder. Clin Nucl Med. 1995;20(1):55-60.
19. Spalletta G, Pasini A, Pau F, et al. Prefrontal blood flow dysregulation in drug naive ADHD children without structural abnormalities. J Neural Transm. 2001;108(10):1203-1216.
20. Amen DG, Carmichael BD. High-resolution brain SPECT imaging in ADHD. Ann Clin Psychiatry. 1997;9(2):81-86.
21. Kim BN, Lee JS, Cho SC, et al. Methylphenidate increased regional cerebral blood flow in subjects with attention deficit/hyperactivity disorder. Yonsei Med J. 2001;42(1):19-29.
22. Lou HC, Henriksen L, Bruhn P, et al. Striatal dysfunction in attention deficit and hyperkinetic disorder. Arch Neurol. 1989;46(1):48-52.
23. Lee JS, Kim BN, Kang E, et al. Regional cerebral blood flow in children with attention deficit hyperactivity disorder: comparison before and after methylphenidate treatment. Hum Brain Mapp. 2005;24(3):157-164.
24. Schweitzer JB, Lee DO, Hanford RB, et al. A positron emission tomography study of methylphenidate in adults with ADHD: alterations in resting blood flow and predicting treatment response. Neuropsychopharmacology. 2003;28(5):967-973.
25. Zametkin AJ, Nordahl TE, Gross M, et al. Cerebral glucose metabolism in adults with hyperactivity of childhood onset. N Engl J Med. 1990;323(20):1361-1366.
26. Zametkin AJ, Liebenauer LL, Fitzgerald GA, et al. Brain metabolism in teenagers with attention-deficit hyperactivity disorder. Arch Gen Psychiatry. 1993;50(5):333-340.
27. Ernst M, Zametkin AJ, Matochik JA, et al. Effects of intravenous dextroamphetamine on brain metabolism in adults with attention-deficit hyperactivity disorder (ADHD). Preliminary findings. Psychopharmacol Bull. 1994;30(2):219-225.
28. Janssen M. Dopamine transporter (DaT) SPECT imaging. MI Gateway. 2012;6(1):1-3. http://interactive.snm.org/ docs/MI_Gateway_Newsletter_2012-1%20Dopamine%20 Transporter%20SPECT%20Imaging.pdf. Accessed August 18, 2015.
29. Volkow ND, Wang GJ, Fowler JS, et al. Dopamine transporter occupancies in the human brain induced by therapeutic doses of oral methylphenidate. Am J Psychiatry. 1998;155(10):1325-1331.
30. Volkow ND, Wang G, Fowler JS, et al. Therapeutic doses of oral methylphenidate significantly increase extracellular dopamine in the human brain. J Neurosci. 2001;21(2):RC121.
31. Dougherty DD, Bonab AA, Spencer TJ, et al. Dopamine transporter density in patients with attention deficit hyperactivity disorder. Lancet. 1999;354(9196):2132-2133.
32. Li JJ, Lee SS. Interaction of dopamine transporter gene and observed parenting behaviors on attention-deficit/ hyperactivity disorder: a structural equation modeling approach. J Clin Child Adolesc Psychol. 2013;42(2):174-186.
33. Hesse S, Ballaschke O, Barthel H, et al. Dopamine transporter imaging in adult patients with attention-deficit/ hyperactivity disorder. Psychiatry Res. 2009;171(2):120-128.
34. Volkow ND, Wang GJ, Kollins SH, et al. Evaluating dopamine reward pathway in ADHD: clinical implications. JAMA. 2009;302(10):1084-1091.
35. Fusar-Poli P, Rubia K, Rossi G, et al. Striatal dopamine transporter alterations in ADHD: pathophysiology or adaptation to psychostimulants? A meta-analysis. Am J Psychiatry. 2012;169(3):264-272.
36. Wang GJ, Volkow ND, Wigal T, et al. Long-term stimulant treatment affects brain dopamine transporter level in patients with attention deficit hyperactive disorder. PLoS One. 2013;8(5):e63023.
37. Spencer TJ, Madras BK, Fischman AJ, et al. Striatal dopamine transporter binding in adults with ADHD. Am J Psychiatry. 2012;169(6):665; author reply 666.
38. Dresel S, Krause J, Krause KH, et al. Attention deficit hyperactivity disorder: binding of [99mTc]TRODAT-1 to the dopamine transporter before and after methylphenidate treatment. Eur J Nucl Med. 2000;27(10):1518-1524.
39. Krause J, la Fougere C, Krause KH, et al. Influence of striatal dopamine transporter availability on the response to methylphenidate in adult patients with ADHD. Eur Arch Psychiatry Clin Neurosci. 2005;255(6):428-431.
40. la Fougère C, Krause J, Krause KH, et al. Value of 99mTc-TRODAT-1 SPECT to predict clinical response to methylphenidate treatment in adults with attention deficit hyperactivity disorder. Nucl Med Commun. 2006;27(9):733-737.
41. MTA Cooperative Group. National Institute of Mental Health Multimodal Treatment Study of ADHD follow-up: 24-month outcomes of treatment strategies for attention-deficit/hyperactivity disorder. Pediatrics. 2004;113(4):754-761.
42. da Silva N Jr, Szobot CM, Anselmi CE, et al. Attention deficit/hyperactivity disorder: is there a correlation between dopamine transporter density and cerebral blood flow? Clin Nucl Med. 2011;36(8):656-660.
43. Ernst M, Zametkin AJ, Matochik JA, et al. High midbrain [18F]DOPA accumulation in children with attention deficit hyperactivity disorder. Am J Psychiatry. 1999;156(8):1209-1215.
44. Ernst M, Zametkin AJ, Matochik JA, et al. DOPA decarboxylase activity in attention deficit hyperactivity disorder adults. A [fluorine-18]fluorodopa positron emission tomographic study. J Neurosci. 1998;18(15):5901-5907.
45. Xu M, Moratalla R, Gold LH, et al. Dopamine D1 receptor mutant mice are deficient in striatal expression of dynorphin and in dopamine-mediated behavioral responses. Cell. 1994;79(4):729-742.
46. Goodwin RJ, Mackay CL, Nilsson A, et al. Qualitative and quantitative MALDI imaging of the positron emission tomography ligands raclopride (a D2 dopamine antagonist) and SCH 23390 (a D1 dopamine antagonist) in rat brain tissue sections using a solvent-free dry matrix application method. Anal Chem. 2011;83(24):9694-9701.
47. Negyessy L, Goldman-Rakic PS. Subcellular localization of the dopamine D2 receptor and coexistence with the calcium-binding protein neuronal calcium sensor-1 in the primate prefrontal cortex. J Comp Neurol. 2005;488(4):464-475.
48. Boyson SJ, McGonigle P, Molinoff PB. Quantitative autoradiographic localization of the D1 and D2 subtypes of dopamine receptors in rat brain. J Neurosci. 1986;6(11):3177-3188.
49. Doi M, Yujnovsky I, Hirayama J, et al. Impaired light masking in dopamine D2 receptor-null mice. Nat Neurosci. 2006;9(6):732-734.
50. Lou HC, Rosa P, Pryds O, et al. ADHD: increased dopamine receptor availability linked to attention deficit and low neonatal cerebral blood flow. Dev Med Child Neurol. 2004;46(3):179-183.
51. Volkow ND, Wang GJ, Fowler JS, et al. Effects of methylphenidate on regional brain glucose metabolism in humans: relationship to dopamine D2 receptors. Am J Psychiatry. 1997;154(1):50-55.
52. Ilgin N, Senol S, Gucuyener K, et al. Is increased D2 receptor availability associated with response to stimulant medication in ADHD. Dev Med Child Neurol. 2001;43(11):755-760.
53. Volkow ND, Wang GJ, Tomasi D, et al. Methylphenidate-elicited dopamine increases in ventral striatum are associated with long-term symptom improvement in adults with attention deficit hyperactivity disorder. J Neurosci. 2012;32(3):841-849.
3-Month paliperidone palmitate for preventing relapse in schizophrenia
A 3-month paliperidone palmitate (PPM-3) extended-release injectable suspension was approved by the FDA in May 2015 for preventing relapse among patients with schizophrenia, under the brand name Invega Trinza (Table 1). Administered 4 times a year, PPM-3 provides the longest interval of any approved long-acting injectable antipsychotic (LAIA). PPM-3 can be administered to patients with schizophrenia who have been taking 1-month paliperidone palmitate (PPM-1) extended-release injectable suspension (brand name, Invega Sustenna), once a month, for at least 4 months.
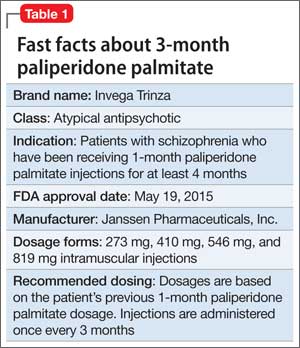
How it works
PPM-3 is a LAIA injection. Because of its low solubility in water, paliperidone palmitate dissolves slowly once injected before being hydrolyzed as paliperidone and absorbed into the bloodstream. From time of release on Day 1, PPM-3 remains active for as long 18 months.
PPM-3 reaches a maximum plasma concentration between Day 30 and Day 33. In clinical trials, PPM-3 had a median half-life of 84 to 95 days when injected into the deltoid muscle and a median half-life of 118 to 139 days when injected into the gluteal muscle.
Paliperidone is not extensively metabolized in the liver. Although results of a study suggest that cytochrome P450 (CYP) 2D6 and CYP3A4 might play a role in metabolizing paliperidone, there is no evidence that it has a significant role.
Dosing and administration
PPM-3 is administered intramuscularly by a licensed health care professional, once every 3 months. The recommended dosage is based on the patient’s previous dosage of PPM-1 (Table 2).
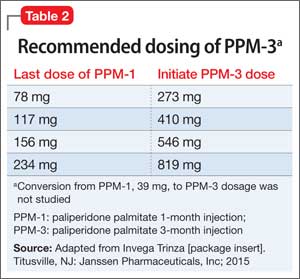
See the prescribing information for administration instructions.
Efficacy
The efficacy of PPM-3 was assessed in a long-term double-blind, placebo-controlled, randomized-withdrawal trial in adult patients with acute symptoms (previously treated with an oral antipsychotic) or adequately treated with a LAIA, either PPM-1 or another agent; patients receiving PPM-1, 39 mg, injections were ineligible. All patients entering the study received PPM-1 in place of the next scheduled injection.
The study comprised 3 treatment periods:
• 17-Week flexible-dose open-label period with PPM-1 (ie, first part of a 29-week open-label stabilization phase): Patients (N = 506) received PPM-1 with a flexible dose based on symptom response, tolerability, and medication history. Patients had to achieve a Positive and Negative Syndrome Scale (PANSS) total score of <70 at Week 17 to enter the second phase.
• 12-Week open-label with PPM-3 (ie, second part of the 29-week open-label stabilization phase): Patients (N = 379) received a single injection of PPM-3 that was 3.5 times the last dose of PPM-1. Patients had to achieve a PANSS total score of <70 and ≤4 for 7 specific PANSS items.
• A variable length double-blind treatment period: Patients (N = 305) were randomized 1:1 to continue treatment with PPM-3 (273 mg, 410 mg, 546 mg, or 819 mg) or placebo (administered once every 12 weeks) until relapse, early withdrawal, or end of the study. The primary efficacy measure was time to first relapse, defined as psychiatric hospitalization, ≥25% increase or a 10-point increase in total PANSS score on 2 consecutive assessments, deliberate self-injury, violent behavior, suicidal or homicidal ideation, or a score of ≥5 (if the maximum baseline score was ≤3) or ≥6 (if the maximum baseline score was 4) on 2 consecutive assessments of the specific PANSS items.
Among the patients in the third treatment period, 23% of those who received placebo and 7.4% of those who received PPM-3 experienced a relapse event. The time to relapse was significantly longer for patients who received PPM-3 than for those who received placebo.
See Table 3 for adverse reactions reported in patients who received PPM-3 and those taking placebo in the study.
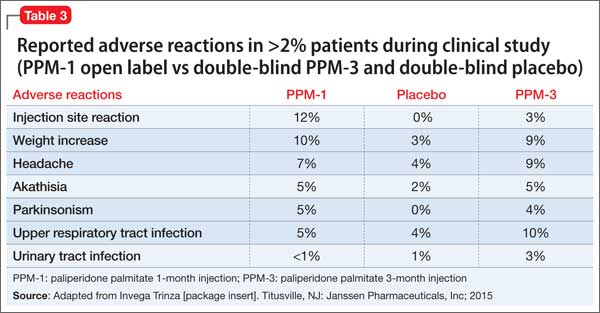
Contraindications
Allergic reactions. Patients who have a hypersensitivity to paliperidone, risperidone, or their components should not receive PPM-3. Anaphylactic reactions have been reported in patients who previously tolerated risperidone or oral paliperidone, which could be significant because the drug is slowly released over 3 months. Other adverse reactions, including angioedema, ileus, swollen tongue, thrombotic thrombocytopenic purpura, urinary incontinence, and urinary retention, were reported post-approval of paliperidone; however, these adverse effects were reported voluntarily from an unknown population size and, therefore, it is unknown whether there is a causal relationship to the drug or its frequency.
Drug-drug interactions. Although paliperidone is not expected to cause drug– drug interactions with medications that are metabolized by CYP isoenzymes, it is recommended to avoid using a strong inducer of CYP3A4 and/or P-glycoprotein.
Overdose. When assessing treatment options and recovery, consider the half-life of PPM-3 and its long-lasting effects.
Because PPM-3 is administered by a licensed health care provider, the potential for overdose is low. However, if overdose occurs, general treatment and management measures should be employed as with overdose of any drug and the possibility of multiple drug overdose should be considered. There is no specific antidote to paliperidone. Contact a certified poison control center for guidance on managing paliperidone and PPM-3 overdose. Generally, management consists of supportive care.
Black-box warning in dementia. As with all atypical antipsychotics, the black-box warning for PPM-3 states that it is not approved for, and should not be used in, patients with dementia-related psychosis. An analysis of placebo-controlled studies revealed that patients taking an antipsychotic had (1) 1.6 to 1.7 times the risk of death than those who received placebo and (2) a higher incidence of cerebrovascular adverse reactions.
Adverse reactions
The safety profile of PPM-3 is similar to that of PPM-1. The most common adverse reactions are:
• reaction at the injection site
• weight gain
• headache
• upper respiratory tract infection
• akathisia
• parkinsonism.
See the full prescribing information for a complete list of adverse effects.
Related Resources
• Sedky K, Nazir R, Lindenmayer JP, et al. Paliperidone palmitate: once monthly treatment option for schizophrenia. Current Psychiatry. 2010;9(3):48-49.
• Berwaerts J, Liu Y, Gopal S, et al. Efficacy and safety of the 3-month formulation of paliperidone palmitate vs placebo for relapse prevention of schizophrenia: a randomized clinical trial [published online March 29, 2015]. JAMA Psychiatry. doi: 10.1001/jamapsychiatry.2015.0241.
Drug Brand Names
Paliperidone palmitate • Invega Sustenna, Invega Trinza
Risperidone • Risperdal
Source: Invega Trinza [package insert]. Titusville, NJ: Janssen Pharmaceuticals, Inc; 2015.
A 3-month paliperidone palmitate (PPM-3) extended-release injectable suspension was approved by the FDA in May 2015 for preventing relapse among patients with schizophrenia, under the brand name Invega Trinza (Table 1). Administered 4 times a year, PPM-3 provides the longest interval of any approved long-acting injectable antipsychotic (LAIA). PPM-3 can be administered to patients with schizophrenia who have been taking 1-month paliperidone palmitate (PPM-1) extended-release injectable suspension (brand name, Invega Sustenna), once a month, for at least 4 months.
How it works
PPM-3 is a LAIA injection. Because of its low solubility in water, paliperidone palmitate dissolves slowly once injected before being hydrolyzed as paliperidone and absorbed into the bloodstream. From time of release on Day 1, PPM-3 remains active for as long 18 months.
PPM-3 reaches a maximum plasma concentration between Day 30 and Day 33. In clinical trials, PPM-3 had a median half-life of 84 to 95 days when injected into the deltoid muscle and a median half-life of 118 to 139 days when injected into the gluteal muscle.
Paliperidone is not extensively metabolized in the liver. Although results of a study suggest that cytochrome P450 (CYP) 2D6 and CYP3A4 might play a role in metabolizing paliperidone, there is no evidence that it has a significant role.
Dosing and administration
PPM-3 is administered intramuscularly by a licensed health care professional, once every 3 months. The recommended dosage is based on the patient’s previous dosage of PPM-1 (Table 2).
See the prescribing information for administration instructions.
Efficacy
The efficacy of PPM-3 was assessed in a long-term double-blind, placebo-controlled, randomized-withdrawal trial in adult patients with acute symptoms (previously treated with an oral antipsychotic) or adequately treated with a LAIA, either PPM-1 or another agent; patients receiving PPM-1, 39 mg, injections were ineligible. All patients entering the study received PPM-1 in place of the next scheduled injection.
The study comprised 3 treatment periods:
• 17-Week flexible-dose open-label period with PPM-1 (ie, first part of a 29-week open-label stabilization phase): Patients (N = 506) received PPM-1 with a flexible dose based on symptom response, tolerability, and medication history. Patients had to achieve a Positive and Negative Syndrome Scale (PANSS) total score of <70 at Week 17 to enter the second phase.
• 12-Week open-label with PPM-3 (ie, second part of the 29-week open-label stabilization phase): Patients (N = 379) received a single injection of PPM-3 that was 3.5 times the last dose of PPM-1. Patients had to achieve a PANSS total score of <70 and ≤4 for 7 specific PANSS items.
• A variable length double-blind treatment period: Patients (N = 305) were randomized 1:1 to continue treatment with PPM-3 (273 mg, 410 mg, 546 mg, or 819 mg) or placebo (administered once every 12 weeks) until relapse, early withdrawal, or end of the study. The primary efficacy measure was time to first relapse, defined as psychiatric hospitalization, ≥25% increase or a 10-point increase in total PANSS score on 2 consecutive assessments, deliberate self-injury, violent behavior, suicidal or homicidal ideation, or a score of ≥5 (if the maximum baseline score was ≤3) or ≥6 (if the maximum baseline score was 4) on 2 consecutive assessments of the specific PANSS items.
Among the patients in the third treatment period, 23% of those who received placebo and 7.4% of those who received PPM-3 experienced a relapse event. The time to relapse was significantly longer for patients who received PPM-3 than for those who received placebo.
See Table 3 for adverse reactions reported in patients who received PPM-3 and those taking placebo in the study.
Contraindications
Allergic reactions. Patients who have a hypersensitivity to paliperidone, risperidone, or their components should not receive PPM-3. Anaphylactic reactions have been reported in patients who previously tolerated risperidone or oral paliperidone, which could be significant because the drug is slowly released over 3 months. Other adverse reactions, including angioedema, ileus, swollen tongue, thrombotic thrombocytopenic purpura, urinary incontinence, and urinary retention, were reported post-approval of paliperidone; however, these adverse effects were reported voluntarily from an unknown population size and, therefore, it is unknown whether there is a causal relationship to the drug or its frequency.
Drug-drug interactions. Although paliperidone is not expected to cause drug– drug interactions with medications that are metabolized by CYP isoenzymes, it is recommended to avoid using a strong inducer of CYP3A4 and/or P-glycoprotein.
Overdose. When assessing treatment options and recovery, consider the half-life of PPM-3 and its long-lasting effects.
Because PPM-3 is administered by a licensed health care provider, the potential for overdose is low. However, if overdose occurs, general treatment and management measures should be employed as with overdose of any drug and the possibility of multiple drug overdose should be considered. There is no specific antidote to paliperidone. Contact a certified poison control center for guidance on managing paliperidone and PPM-3 overdose. Generally, management consists of supportive care.
Black-box warning in dementia. As with all atypical antipsychotics, the black-box warning for PPM-3 states that it is not approved for, and should not be used in, patients with dementia-related psychosis. An analysis of placebo-controlled studies revealed that patients taking an antipsychotic had (1) 1.6 to 1.7 times the risk of death than those who received placebo and (2) a higher incidence of cerebrovascular adverse reactions.
Adverse reactions
The safety profile of PPM-3 is similar to that of PPM-1. The most common adverse reactions are:
• reaction at the injection site
• weight gain
• headache
• upper respiratory tract infection
• akathisia
• parkinsonism.
See the full prescribing information for a complete list of adverse effects.
Related Resources
• Sedky K, Nazir R, Lindenmayer JP, et al. Paliperidone palmitate: once monthly treatment option for schizophrenia. Current Psychiatry. 2010;9(3):48-49.
• Berwaerts J, Liu Y, Gopal S, et al. Efficacy and safety of the 3-month formulation of paliperidone palmitate vs placebo for relapse prevention of schizophrenia: a randomized clinical trial [published online March 29, 2015]. JAMA Psychiatry. doi: 10.1001/jamapsychiatry.2015.0241.
Drug Brand Names
Paliperidone palmitate • Invega Sustenna, Invega Trinza
Risperidone • Risperdal
Source: Invega Trinza [package insert]. Titusville, NJ: Janssen Pharmaceuticals, Inc; 2015.
Source: Invega Trinza [package insert]. Titusville, NJ: Janssen Pharmaceuticals, Inc; 2015.
Universal precautions to reduce stimulant misuse in treating adult ADHD
Children are not the only people affected by attention-deficit/hyperactivity disorder (ADHD). Characterized by high levels of inattention, overactivity, and impulsivity, ADHD affects 5% of school-aged children, but also 4% of adults.1–3 Adults with untreated ADHD are likely to develop serious psychosocial problems that manifest as unemployment, arrests, divorce, underachievement, and psychiatric comorbidities.4,5
However, many clinicians are reluctant to manage adults with ADHD, partly because of concerns about misuse of the stimulant drugs they must prescribe to treat it.
Here, we outline an approach whereby clinicians can diagnose and treat adult ADHD while taking “universal precautions” to discourage misuse of the medications involved.
RECOGNIZING ADHD IN ADULTS
ADHD is characterized by developmentally inappropriate levels of inattention, impulsiveness, and hyperactivity that arise in childhood and result in impairments that often persist.
The presentation of ADHD in adults may be influenced by the longevity of their ADHD, associated sequelae (eg, low self-esteem and interpersonal, educational, and occupational difficulties), and comorbid disorders.6 There are neither reliable biomarkers nor neuropsychological tests for diagnosis, and persons with ADHD typically have a complex presentation with at least one comorbidity.6,7
In patients diagnosed in childhood, difficulties with organization as well as initiating, maintaining, and completing tasks become more prominent in adulthood and hyperactivity tends to subside. Adult impulsivity may present as edginess, shopping sprees, quitting jobs, and risky behaviors.6
Overall, the clinical manifestations of ADHD in adolescents and adults include inattention, difficulties with task completion, disorganization, and executive dysfunction—all skills critical to managing the various roles of adult life.
OBSTACLES TO EFFECTIVE TREATMENT
In the past, ADHD treatment was routinely discontinued during adolescence, as it was unclear whether adults still had significant symptoms or benefited from treatment.8,9 Now, available ADHD guidelines suggest that children and adults who respond to pharmacotherapy should continue it for as long as it remains effective. In this context, there is increasing recognition of adult ADHD as a valid and treatable disorder.10
One of the challenges clinicians face is the reliability of adult recall of childhood ADHD. A controlled, prospective 16-year follow-up study found that of all adults retrospectively given a diagnosis of childhood ADHD, only 27% actually had the disorder.11 This study suggests that retrospective diagnoses of childhood ADHD made solely on the basis of self-reports are unlikely to be valid.
Another obstacle is that traditional medical education has seldom included training in adult ADHD.8,12 In a UK study, clinicians felt that they lacked training and knowledge to assess and manage adult ADHD patients.9
Even if adult ADHD is recognized, diagnosis is just the first step of care.13 These patients require ongoing management and follow-up assessments.
Although practice patterns vary, efforts to encourage doctors to provide adult ADHD care may be hindered by the fact that the gold standard of treatment is stimulant medication.4,10 Medications approved by the US Food and Drug Administration for adult ADHD include the stimulants lisdexamfetamine, osmotic-release methylphenidate, mixed amphetamine salts extended release, dexmethylphenidate extended release, and the nonstimulant atomoxetine.6 While stimulants are generally more efficacious for ADHD symptoms than nonstimulants, they are associated with misuse and diversion.14
UNIVERSAL PRECAUTIONS: A SIMPLIFIED APPROACH
The universal-precautions approach to prescribing stimulants aims to allay physician concerns and promote appropriate medication use to allow for proper management of this disorder.15 These precautions, to be applied to all adult ADHD patients for whom stimulants are being considered, include careful diagnosis and consideration of comorbidities, baseline risk stratification, informed consent processes, treatment agreements, periodic reassessments of treatment response, and meticulous documentation.
DIAGNOSIS
A frequently used screening assessment for adult ADHD is the ADHD Rating Scale (ADHD RS), which consists of two subscales for assessing hyperactivity/impulsivity and inattentiveness.16 ADHD can be classified into one of three subtypes based on symptoms: inattentive, hyperactive, or combined type. Symptoms must persist for at least 6 months for a diagnosis to be made. Other ADHD scales include the Conners Adult ADHD Rating Scales and the Brown Attention-Deficit Disorder Scales.4
High scores on screening scales must be interpreted within the clinical context. Clinicians need to ask about ADHD symptoms, establish their presence in various settings, and determine if these symptoms interfere with functioning. A diagnosis of adult ADHD also requires evidence of symptoms beginning in childhood.17 According to the Diagnostic and Statistical Manual of Mental Disorders, Fifth Edition, inattentive or hyperactive-impulsive symptoms must be present before age 12 in two or more settings and interfere with function and development.
Although self-reporting screening tools are helpful, these tests are not reliable for diagnostic purposes, and collateral information is also required.
Neuropsychological testing may detect impairments in persons with ADHD. The most consistently employed neuropsychological tests to evaluate ADHD include the Conners Continuous Performance Test, Stroop Color and Word Test, Trail-making Test, verbal fluency tests, Controlled Oral Word Association Test, and the Weschler Adult Intelligence Scale.6
COMORBIDITY
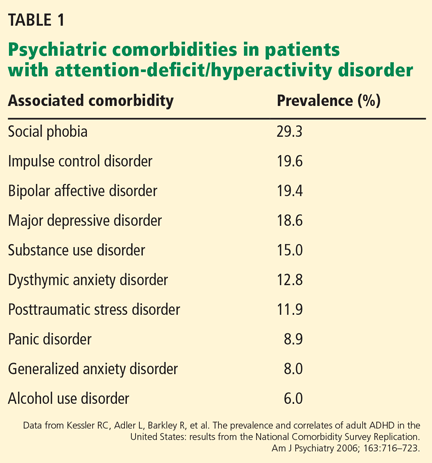
Epidemiologic studies suggest that adults with ADHD develop many psychiatric problems including anxiety, depression, and substance use disorders.7,16 Table 1 illustrates common comorbidities and their associated prevalence in the ADHD patient.7
Comorbid psychiatric disorders may affect the presentation of adult ADHD. For instance, adults with comorbid depression and ADHD are more likely to present with heightened irritability and difficulties concentrating on tasks than those with either condition alone.18 Similarly, antisocial personality disorder is more common in adults with ADHD.19 Such patients exhibit stable antisocial behavior (lying, stealing, and aggression) as well as medication misuse.5,14,19
While these comorbid disorders may obscure the ADHD diagnosis, their recognition is essential to effectively manage adult ADHD. In sum, a careful evaluation of the adult, including elucidating both ADHD and comorbid symptoms, functionality in several domains, and the degree of impairment, should precede initiating pharmacotherapy for adult ADHD.
BASELINE RISK STRATIFICATION: RISK FACTORS FOR STIMULANT MISUSE
After diagnosing ADHD, the prescriber must assess the risk for misuse of stimulant medications.20
One study revealed that nonmedical use of stimulant medications occurred in only 2% of the 4,300 people surveyed.21 Among the misusers, 66% had obtained medication from family or friends. Another 34% had stolen medication, and 20% had obtained prescriptions from a physician by falsely reporting symptoms. The study also assessed motivation for misuse. In this sample, 40% of misuse was to enhance performance, 34% was for recreation, and 23% was to stay awake.21
Other studies show that misuse of stimulant medications is common among youth in the United States, reporting that 18% of college students use some formulation of prescription stimulants.22
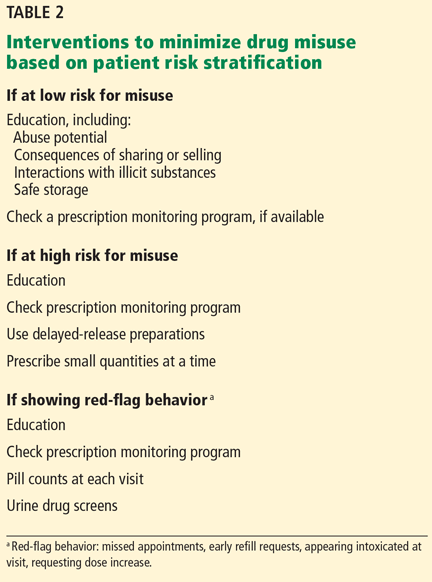
Still more research suggests that childhood conduct disorder or illicit drug use results in a higher risk of stimulant medication misuse.20 Additional risk factors for misuse include male sex, white ethnicity, upper-class background, Jewish or no religious affiliation, affiliation with a sorority or fraternity, off-campus housing, and a low grade-point average.23
Table 2 illustrates clinical interventions providers can use, once they have risk-stratified their patients, to monitor for stimulant misuse.
HOW SHOULD THESE RISK FACTORS AFFECT TREATMENT?
Although no formal scoring system exists to help clinicians risk-stratify these patients, the presence of multiple risk factors suggests the need for vigilance.14 Physicians should prescribe agents with less potential for abuse and monitor these patients more intensely.
Short-acting stimulant medications are the most likely to be abused, as phasic dopamine increase is more reinforcing than therapeutic dopamine release.24 Longer-acting stimulant medications are less likely to be abused, and they provide better symptom relief, as tonic dopamine release maintains a steady state and increases the therapeutic efficacy of these medications.25 For example, methylphenidate extended-release tablets have an osmotic oral controlled-release system and are less likely to be crushed for recreational inhalation.6,14
Lisdexamfetamine is a prodrug therapeutically inert until converted to d-amphetamine when lysine is cleaved from the molecule. This medication may be a good option for patients at high risk of misuse because it is tamper-resistant. However, it still may be subject to misuse for performance enhancement.26,27
The nonstimulant atomoxetine is also approved for ADHD, has no abuse potential, and may be particularly useful when anxiety, mood, and substance use disorders co-occur with ADHD.6 Rarely, atomoxetine can damage the liver, and liver function tests should be monitored if right upper quadrant pain develops.4,10
Other nonapproved agents such as bupropion and desipramine also have been used empirically and off-label for ADHD.4,10
Overall, treatment should be selected according to the risk of misuse of stimulant medication and the patient’s comorbidities.
INFORMED CONSENT
Informed consent may help patients appreciate the risks and benefits of the treatment options and develop realistic expectations about treatment.26 Patients are instructed to take their stimulant medications as prescribed and are informed of the risks of combining stimulants with other substances, particularly those that may interact with stimulants (eg, cocaine) and raise the risk of seizures and cardiovascular complications.
Stimulant medications lead to elevations in blood pressure and heart rate, although large-scale studies have shown no increase in the rate of serious cardiovascular events when these drugs are used appropriately.6 Less serious side effects associated with stimulant medications include insomnia, weight loss, decreased appetite, dry mouth, headache, and rarely, depression and anxiety.6
Patients need to be warned about diversion and abuse liability of stimulant medications, as well as alternative treatments.
The nonstimulant atomoxetine has no reinforcing properties but also raises the blood pressure and heart rate.6 As with stimulants, these elevations are generally minimal, time-limited, and of minor clinical significance.4,10 Frequent reasons to prescribe atomoxetine include poor tolerability of stimulants and a history of substance abuse. In addition, women with ADHD and high levels of emotional dysregulation or social anxiety appear to be particularly responsive to atomoxetine.6
Another consideration is cognitive behavioral therapy, which can augment the effects of pharmacotherapy.4 Cognitive behavioral therapy focuses on time management, prioritization, organization, problem-solving, motivation, and emotional regulation.4
Finally, patients also need to understand the possible consequences of nontreatment.5 Adults with untreated ADHD have high rates of academic and occupational difficulties, anti-social behaviors, and other forms of psychosocial adversity.4,5
Overall, this process should involve discussing risks and benefits of treatment options with the patient and promoting joint decision-making.
TREATMENT AGREEMENTS
Stimulant medications are classified by the US Drug Enforcement Administration as schedule II substances due to their abuse potential.20
It is important to inform patients of the addictive nature of the medication and to instruct them on how to store stimulants safely.27 Patients need to know that giving away or selling these medications is illegal.27
Treatment agreements establish rules for prescribing and are signed by the patient before initiating therapy.28,29 Patients are expected to attend all of their appointments, receive their prescriptions from one doctor, and obtain their medication from one pharmacy. These agreements may also require patients to submit to monitoring with random urine drug screens.29 Overall, they underscore the need for patients to follow a treatment plan in order to continue therapy with controlled substances.29
Manning27 recommends using agreements for high-risk college students prescribed stimulant medications. Red flags for misuse include signs of active substance use (eg, intoxication, a pattern of “lost” prescriptions, and doctor-shopping).27
The effectiveness in reducing risk of misuse in the adult ADHD population has not yet been investigated. Nonetheless, a method of communicating the seriousness of stimulant misuse to adult patients is essential to ADHD care.
STAYING ON TRACK
In the clinical setting, treatment response is measured not just by symptom reduction, but also by functional improvement. Thus, clinicians and patients must set functional goals whenever possible.27 Successful progress toward these goals justifies continuation of therapy, whereas lack of improvement signals the need to reconsider stimulant therapy.27
MONITORING AND DOCUMENTATION
Adults with ADHD present with varying levels of functional impairment and comorbidities, which may require different levels of monitoring.30 Not all patients with ADHD respond optimally to stimulant medications or tolerate them well.31,32 Hence, monitoring parameters for therapeutic change and adverse outcomes are important in that they guide the alteration or even discontinuation of pharmacotherapy.4,6,14
Documenting the decision-making process to continue stimulant medications under certain circumstances is also essential. Documentation should include discussion of goals and expectations, risks and benefits, and alternatives to stimulant use.
In adults, risk of stimulant medication misuse adds a new layer of complexity to monitoring.13,14 Adults may get multiple prescriptions from multiple providers, seek early refills, fill prescriptions at different pharmacies, or alter formulations. Many states track stimulant prescription use, and prescribers can use this information to determine if patients are refilling their prescriptions appropriately or obtaining stimulants from more than one provider.
Although these monitoring strategies are useful,6 it is prudent to structure the level of monitoring according to the patient’s risk of adverse events or medication misuse.14,27 Gourlay and Heit15 proposed the following “four-A” mnemonic for four domains to be explored at each visit in patients receiving pain medicine. This mnemonic can be applied to adult ADHD patients to more accurately monitor the patient throughout treatment.
THE ‘FOUR-A’ MNEMONIC
ADHD symptoms
Several ADHD scales can be used to track symptom changes over time.33 However, these self-report scales may be subject to positive illusory bias, a phenomenon observed in individuals with ADHD in which they tend to overrate their functioning,34 which may limit the accuracy of self-report scales.35
Activities of daily living
Since patients with ADHD tend to overrate their functioning in various aspects of living, collateral information should be gathered to corroborate patient self-reports whenever possible.
Adverse events
Blood pressure, heart rate, and weight should be assessed at baseline and monitored during stimulant treatment. Other symptoms to monitor include gastrointestinal distress, headache, aggression, depression, appetite, and sleeping habits.4,6 More intensive monitoring (eg, electrocardiography) may be indicated for those with hypertension and cardiovascular risk factors.
Aberrant behavior
Monitoring for misuse and diversion of stimulant medications is essential, as ADHD itself is a risk factor for addiction.20,21 Pill counts, prescription monitoring programs, urine drug screens, and collateral informants have all been proposed but not studied in monitoring for the misuse of stimulant medications.27 Before prescribing, it is prudent to check the prescription monitoring program, get a urine drug screen, and discuss any positive findings with the patient.36,37
Treatment agreements ensure that patients are aware of the consequences of misuse and allow the clinician to reference prior discussion when terminating treatment with stimulants.
LIVES CAN BE ENHANCED
ADHD is a common disorder that arises in childhood and can persist throughout life. Adults with untreated ADHD are at risk of severe impairments in various domains of functioning. Stimulant medications are an effective treatment but may be diverted into the street market. Using the universal-precautions model may reduce the risks of both nontreatment of ADHD and misuse of stimulants.
Accordingly, clinicians need to confirm the ADHD diagnosis, assess comorbidities, estimate risk of misuse, and provide informed consent prior to prescribing. Subsequent monitoring should involve the use of treatment agreements and evaluating treatment response, paying particular attention to ADHD symptom control but also to level of function, adverse effects, and aberrant behavior.
With these principles in mind, clinicians can address the risks of misuse and potentially enhance the lives of people who may have been suffering substantially due to lack of appropriate care.
- Polanczyk G, de Lima MS, Horta BL, Biederman J, Rohde LA. The worldwide prevalence of ADHD: a systematic review and metaregression analysis. Am J Psychiatry 2007; 164:942–948.
- Polanczyk GV, Wilcutt EG, Salum GA, Kieling C, Rohde LA. ADHD prevalence estimates across three decades: an updated systematic review and meta-regression analysis. Int J Epidemiol 2014; 43:434–442.
- Wilens TE. ADHD: Prevalence, diagnosis, and issues of comorbidity. CNS Spectr 2007; 12(suppl 6):1–5.
- Kooij SJ, Bejerot S, Blackwell A, et al. European consensus statement on diagnosis and treatment of adult ADHD: the European Network Adult ADHD. BMC Psychiatry 2010; 10:67.
- Shaw M, Hodgkins P, Caci H, et al. A systematic review and analysis of long-term outcomes in attention deficit hyperactivity disorder: effects of treatment and non-treatment. BMC Med 2012;10:99.
- Modesto-Lowe V, Meyer A, Soovajian V. A clinician’s guide to adult attention-deficit hyperactivity disorder. Conn Med 2012; 76:517–523.
- Kessler RC, Adler L, Barkley R, et al. The prevalence and correlates of adult ADHD in the United States: results from the National Comorbidity Survey Replication. Am J Psychiatry 2006; 163:716–723.
- Goodman DW, Surman CB, Scherer PB, Salinas GD, Brown JJ. Assessment of physician practices in adult attention-deficit/hyperactivity disorder. Prim Care Companion CNS Disord 2012; 14(4).
- Hall CL, Newell K, Taylor J, Sayal K, Swift KD, Hollis C. ‘Mind the gap’—mapping services for young people with ADHD transitioning from child to adult mental health services. BMC Psychiatry 2013; 13:186.
- National Institute for Health and Care Excellence. Attention deficit hyperactivity disorder: diagnosis and management of ADHD in children, young people and adults. The British Psychological Society and The Royal College of Psychiatrists: United Kingdom; 2009.
- Mannuzza S, Klein RG, Klein DF, Bessler A, Shrout P. Accuracy of adult recall of childhood attention deficit hyperactivity disorder. Am J Psychiatry 2002; 159:1882–1888.
- Wetzel MW. Medical student participation in an adult ADHD outpatient clinic: an ideal setting for education in outpatient psychiatry. Acad Psychiatry 2009; 33:80–81.
- Culpepper L, Mattingly G. Challenges in identifying and managing attention-deficit/hyperactivity disorder in adults in the primary care setting: a review of the literature. Prim Care Companion J Clin Psychiatry 2010; 12(6).
- Rabiner DL. Stimulant prescription cautions: addressing misuse, diversion and malingering. Curr Psychiatry Rep 2013; 15:375.
- Gourlay D, Heit H. Universal precautions: a matter of mutual trust and responsibility. Pain Med 2006; 7:210–211.
- Kessler RC, Adler L, Ames M, et al. The World Health Organization Adult ADHD Self-Report Scale (ASRS): a short screening scale for use in the general population. Psychol Med 2005; 35:245–256.
- American Psychiatric Association. Diagnostic and Statistical Manual of Mental Disorders, 5th ed. Arlington, VA: American Psychiatric Association; 2013.
- CADDRA Guidelines Steering Committee. Canadian ADHD practice guidelines: CADDRA 2008. http://www.naceonline.com/AdultADHDtoolkit/professionalresources/caddraguidelines.pdf. Accessed July 10, 2015.
- Mannuzza S, Klein RG, Bessler A, Malloy P, LaPadula M. Adult psychiatric status of hyperactive boys grown up. Am J Psychiatry 1998; 155:493–498.
- Kaye S, Darke S. The diversion and misuse of pharmaceutical stimulants: what do we know and why should we care? Addiction 2012; 107:467–477.
- Novak SP, Kroutil LA, Williams RL, Van Brunt DL. The nonmedical use of prescription ADHD medications: results from a national Internet panel. Subst Abuse Treat Prev Policy 2007; 2:32.
- Bavarian N, Flay BR, Ketcham P, et al. Using structural equation modeling to understand prescription stimulant misuse: a test of the Theory of Triadic Influence. Drug Alcohol Depend 2014; 138:193–201.
- McCabe SE, Teter CJ, Boyd CJ. Medical use, illicit use and diversion of prescription stimulant medication. J Psychoactive Drugs 2006; 38:43–56.
- Volkow ND. Stimulant medications: how to minimize their reinforcing effects? Am J Psychiatry 2006; 163:359–361.
- Kolar D, Keller A, Golfinopoulos M, Cumyn L, Syer C, Hechtman L. Treatment of adults with attention-deficit/hyperactivity disorder. Neuropsychiatr Dis Treat 2008; 4:107–121.
- Schachter D, Tharmalingam S, Kleinman I. Informed consent and stimulant medication: adolescents’ and parents’ ability to understand information about benefits and risks of stimulant medication for the treatment of attention-deficit/hyperactivity disorder. J Child Adolesc Psychopharmacol 2011; 21:139–148.
- Manning JS. Strategies for managing the risks associated with ADHD medications. J Clin Psychiatry 2013; 74:e19.
- Deep K. Use of narcotics contracts. Virtual Mentor 2013; 15:416–420.
- Cheatle MD, Savage SR. Informed consent in opioid therapy: a potential obligation and opportunity. J Pain Symptom Manage 2012; 44:105–116.
- Dias TG, Kieling C, Graeff-Martins AS, Moriyama TS, Rohde LA, Polanczyk GV. Developments and challenges in the diagnosis and treatment of ADHD. Rev Bras Psiquiatr 2013; 35(suppl 1):S40–S50.
- Mattingly GW, Weisler RH, Young J, et al. Clinical response and symptomatic remission in short- and long-term trials of lisdexamfetamine dimesylate in adults with attention-deficit/hyperactivity disorder. BMC Psychiatry 2013; 13:39.
- Contini V, Victor MM, Bertuzzi GP, et al. No significant association between genetic variants in 7 candidate genes and response to methylphenidate treatment in adult patients with ADHD. J Clin Psychopharmacol 2012; 32:820–823.
- Rösler M, Retz W, Thome J, Schneider M, Stieglitz RD, Falkai P. Psychopathological rating scales for diagnostic use in adults with attention-deficit/hyperactivity disorder (ADHD). Eur Arch Psychiatry Clin Neurosci 2006; 256(suppl 1):i3–i11.
- Prevatt F, Proctor B, Best L, Baker L, Van Walker J, Taylor NW. The positive illusory bias: does it explain self-evaluations in college students with ADHD? J Atten Disord 2012; 16:235–243.
- Jiang Y, Johnston C. The relationship between ADHD symptoms and competence as reported by both self and others. J Atten Disord 2012; 16:418–426.
- Darredeau C, Barrett SP, Jardin B, Pihl RO. Patterns and predictors of medication compliance, diversion, and misuse in adult prescribed methylphenidate users. Hum Psychopharmacol 2007; 22:529–536.
- Worley J. Prescription drug monitoring programs, a response to doctor shopping: purpose, effectiveness, and directions for future research. Issues Ment Health Nurs 2012; 33:319–328.
Children are not the only people affected by attention-deficit/hyperactivity disorder (ADHD). Characterized by high levels of inattention, overactivity, and impulsivity, ADHD affects 5% of school-aged children, but also 4% of adults.1–3 Adults with untreated ADHD are likely to develop serious psychosocial problems that manifest as unemployment, arrests, divorce, underachievement, and psychiatric comorbidities.4,5
However, many clinicians are reluctant to manage adults with ADHD, partly because of concerns about misuse of the stimulant drugs they must prescribe to treat it.
Here, we outline an approach whereby clinicians can diagnose and treat adult ADHD while taking “universal precautions” to discourage misuse of the medications involved.
RECOGNIZING ADHD IN ADULTS
ADHD is characterized by developmentally inappropriate levels of inattention, impulsiveness, and hyperactivity that arise in childhood and result in impairments that often persist.
The presentation of ADHD in adults may be influenced by the longevity of their ADHD, associated sequelae (eg, low self-esteem and interpersonal, educational, and occupational difficulties), and comorbid disorders.6 There are neither reliable biomarkers nor neuropsychological tests for diagnosis, and persons with ADHD typically have a complex presentation with at least one comorbidity.6,7
In patients diagnosed in childhood, difficulties with organization as well as initiating, maintaining, and completing tasks become more prominent in adulthood and hyperactivity tends to subside. Adult impulsivity may present as edginess, shopping sprees, quitting jobs, and risky behaviors.6
Overall, the clinical manifestations of ADHD in adolescents and adults include inattention, difficulties with task completion, disorganization, and executive dysfunction—all skills critical to managing the various roles of adult life.
OBSTACLES TO EFFECTIVE TREATMENT
In the past, ADHD treatment was routinely discontinued during adolescence, as it was unclear whether adults still had significant symptoms or benefited from treatment.8,9 Now, available ADHD guidelines suggest that children and adults who respond to pharmacotherapy should continue it for as long as it remains effective. In this context, there is increasing recognition of adult ADHD as a valid and treatable disorder.10
One of the challenges clinicians face is the reliability of adult recall of childhood ADHD. A controlled, prospective 16-year follow-up study found that of all adults retrospectively given a diagnosis of childhood ADHD, only 27% actually had the disorder.11 This study suggests that retrospective diagnoses of childhood ADHD made solely on the basis of self-reports are unlikely to be valid.
Another obstacle is that traditional medical education has seldom included training in adult ADHD.8,12 In a UK study, clinicians felt that they lacked training and knowledge to assess and manage adult ADHD patients.9
Even if adult ADHD is recognized, diagnosis is just the first step of care.13 These patients require ongoing management and follow-up assessments.
Although practice patterns vary, efforts to encourage doctors to provide adult ADHD care may be hindered by the fact that the gold standard of treatment is stimulant medication.4,10 Medications approved by the US Food and Drug Administration for adult ADHD include the stimulants lisdexamfetamine, osmotic-release methylphenidate, mixed amphetamine salts extended release, dexmethylphenidate extended release, and the nonstimulant atomoxetine.6 While stimulants are generally more efficacious for ADHD symptoms than nonstimulants, they are associated with misuse and diversion.14
UNIVERSAL PRECAUTIONS: A SIMPLIFIED APPROACH
The universal-precautions approach to prescribing stimulants aims to allay physician concerns and promote appropriate medication use to allow for proper management of this disorder.15 These precautions, to be applied to all adult ADHD patients for whom stimulants are being considered, include careful diagnosis and consideration of comorbidities, baseline risk stratification, informed consent processes, treatment agreements, periodic reassessments of treatment response, and meticulous documentation.
DIAGNOSIS
A frequently used screening assessment for adult ADHD is the ADHD Rating Scale (ADHD RS), which consists of two subscales for assessing hyperactivity/impulsivity and inattentiveness.16 ADHD can be classified into one of three subtypes based on symptoms: inattentive, hyperactive, or combined type. Symptoms must persist for at least 6 months for a diagnosis to be made. Other ADHD scales include the Conners Adult ADHD Rating Scales and the Brown Attention-Deficit Disorder Scales.4
High scores on screening scales must be interpreted within the clinical context. Clinicians need to ask about ADHD symptoms, establish their presence in various settings, and determine if these symptoms interfere with functioning. A diagnosis of adult ADHD also requires evidence of symptoms beginning in childhood.17 According to the Diagnostic and Statistical Manual of Mental Disorders, Fifth Edition, inattentive or hyperactive-impulsive symptoms must be present before age 12 in two or more settings and interfere with function and development.
Although self-reporting screening tools are helpful, these tests are not reliable for diagnostic purposes, and collateral information is also required.
Neuropsychological testing may detect impairments in persons with ADHD. The most consistently employed neuropsychological tests to evaluate ADHD include the Conners Continuous Performance Test, Stroop Color and Word Test, Trail-making Test, verbal fluency tests, Controlled Oral Word Association Test, and the Weschler Adult Intelligence Scale.6
COMORBIDITY
Epidemiologic studies suggest that adults with ADHD develop many psychiatric problems including anxiety, depression, and substance use disorders.7,16 Table 1 illustrates common comorbidities and their associated prevalence in the ADHD patient.7
Comorbid psychiatric disorders may affect the presentation of adult ADHD. For instance, adults with comorbid depression and ADHD are more likely to present with heightened irritability and difficulties concentrating on tasks than those with either condition alone.18 Similarly, antisocial personality disorder is more common in adults with ADHD.19 Such patients exhibit stable antisocial behavior (lying, stealing, and aggression) as well as medication misuse.5,14,19
While these comorbid disorders may obscure the ADHD diagnosis, their recognition is essential to effectively manage adult ADHD. In sum, a careful evaluation of the adult, including elucidating both ADHD and comorbid symptoms, functionality in several domains, and the degree of impairment, should precede initiating pharmacotherapy for adult ADHD.
BASELINE RISK STRATIFICATION: RISK FACTORS FOR STIMULANT MISUSE
After diagnosing ADHD, the prescriber must assess the risk for misuse of stimulant medications.20
One study revealed that nonmedical use of stimulant medications occurred in only 2% of the 4,300 people surveyed.21 Among the misusers, 66% had obtained medication from family or friends. Another 34% had stolen medication, and 20% had obtained prescriptions from a physician by falsely reporting symptoms. The study also assessed motivation for misuse. In this sample, 40% of misuse was to enhance performance, 34% was for recreation, and 23% was to stay awake.21
Other studies show that misuse of stimulant medications is common among youth in the United States, reporting that 18% of college students use some formulation of prescription stimulants.22
Still more research suggests that childhood conduct disorder or illicit drug use results in a higher risk of stimulant medication misuse.20 Additional risk factors for misuse include male sex, white ethnicity, upper-class background, Jewish or no religious affiliation, affiliation with a sorority or fraternity, off-campus housing, and a low grade-point average.23
Table 2 illustrates clinical interventions providers can use, once they have risk-stratified their patients, to monitor for stimulant misuse.
HOW SHOULD THESE RISK FACTORS AFFECT TREATMENT?
Although no formal scoring system exists to help clinicians risk-stratify these patients, the presence of multiple risk factors suggests the need for vigilance.14 Physicians should prescribe agents with less potential for abuse and monitor these patients more intensely.
Short-acting stimulant medications are the most likely to be abused, as phasic dopamine increase is more reinforcing than therapeutic dopamine release.24 Longer-acting stimulant medications are less likely to be abused, and they provide better symptom relief, as tonic dopamine release maintains a steady state and increases the therapeutic efficacy of these medications.25 For example, methylphenidate extended-release tablets have an osmotic oral controlled-release system and are less likely to be crushed for recreational inhalation.6,14
Lisdexamfetamine is a prodrug therapeutically inert until converted to d-amphetamine when lysine is cleaved from the molecule. This medication may be a good option for patients at high risk of misuse because it is tamper-resistant. However, it still may be subject to misuse for performance enhancement.26,27
The nonstimulant atomoxetine is also approved for ADHD, has no abuse potential, and may be particularly useful when anxiety, mood, and substance use disorders co-occur with ADHD.6 Rarely, atomoxetine can damage the liver, and liver function tests should be monitored if right upper quadrant pain develops.4,10
Other nonapproved agents such as bupropion and desipramine also have been used empirically and off-label for ADHD.4,10
Overall, treatment should be selected according to the risk of misuse of stimulant medication and the patient’s comorbidities.
INFORMED CONSENT
Informed consent may help patients appreciate the risks and benefits of the treatment options and develop realistic expectations about treatment.26 Patients are instructed to take their stimulant medications as prescribed and are informed of the risks of combining stimulants with other substances, particularly those that may interact with stimulants (eg, cocaine) and raise the risk of seizures and cardiovascular complications.
Stimulant medications lead to elevations in blood pressure and heart rate, although large-scale studies have shown no increase in the rate of serious cardiovascular events when these drugs are used appropriately.6 Less serious side effects associated with stimulant medications include insomnia, weight loss, decreased appetite, dry mouth, headache, and rarely, depression and anxiety.6
Patients need to be warned about diversion and abuse liability of stimulant medications, as well as alternative treatments.
The nonstimulant atomoxetine has no reinforcing properties but also raises the blood pressure and heart rate.6 As with stimulants, these elevations are generally minimal, time-limited, and of minor clinical significance.4,10 Frequent reasons to prescribe atomoxetine include poor tolerability of stimulants and a history of substance abuse. In addition, women with ADHD and high levels of emotional dysregulation or social anxiety appear to be particularly responsive to atomoxetine.6
Another consideration is cognitive behavioral therapy, which can augment the effects of pharmacotherapy.4 Cognitive behavioral therapy focuses on time management, prioritization, organization, problem-solving, motivation, and emotional regulation.4
Finally, patients also need to understand the possible consequences of nontreatment.5 Adults with untreated ADHD have high rates of academic and occupational difficulties, anti-social behaviors, and other forms of psychosocial adversity.4,5
Overall, this process should involve discussing risks and benefits of treatment options with the patient and promoting joint decision-making.
TREATMENT AGREEMENTS
Stimulant medications are classified by the US Drug Enforcement Administration as schedule II substances due to their abuse potential.20
It is important to inform patients of the addictive nature of the medication and to instruct them on how to store stimulants safely.27 Patients need to know that giving away or selling these medications is illegal.27
Treatment agreements establish rules for prescribing and are signed by the patient before initiating therapy.28,29 Patients are expected to attend all of their appointments, receive their prescriptions from one doctor, and obtain their medication from one pharmacy. These agreements may also require patients to submit to monitoring with random urine drug screens.29 Overall, they underscore the need for patients to follow a treatment plan in order to continue therapy with controlled substances.29
Manning27 recommends using agreements for high-risk college students prescribed stimulant medications. Red flags for misuse include signs of active substance use (eg, intoxication, a pattern of “lost” prescriptions, and doctor-shopping).27
The effectiveness in reducing risk of misuse in the adult ADHD population has not yet been investigated. Nonetheless, a method of communicating the seriousness of stimulant misuse to adult patients is essential to ADHD care.
STAYING ON TRACK
In the clinical setting, treatment response is measured not just by symptom reduction, but also by functional improvement. Thus, clinicians and patients must set functional goals whenever possible.27 Successful progress toward these goals justifies continuation of therapy, whereas lack of improvement signals the need to reconsider stimulant therapy.27
MONITORING AND DOCUMENTATION
Adults with ADHD present with varying levels of functional impairment and comorbidities, which may require different levels of monitoring.30 Not all patients with ADHD respond optimally to stimulant medications or tolerate them well.31,32 Hence, monitoring parameters for therapeutic change and adverse outcomes are important in that they guide the alteration or even discontinuation of pharmacotherapy.4,6,14
Documenting the decision-making process to continue stimulant medications under certain circumstances is also essential. Documentation should include discussion of goals and expectations, risks and benefits, and alternatives to stimulant use.
In adults, risk of stimulant medication misuse adds a new layer of complexity to monitoring.13,14 Adults may get multiple prescriptions from multiple providers, seek early refills, fill prescriptions at different pharmacies, or alter formulations. Many states track stimulant prescription use, and prescribers can use this information to determine if patients are refilling their prescriptions appropriately or obtaining stimulants from more than one provider.
Although these monitoring strategies are useful,6 it is prudent to structure the level of monitoring according to the patient’s risk of adverse events or medication misuse.14,27 Gourlay and Heit15 proposed the following “four-A” mnemonic for four domains to be explored at each visit in patients receiving pain medicine. This mnemonic can be applied to adult ADHD patients to more accurately monitor the patient throughout treatment.
THE ‘FOUR-A’ MNEMONIC
ADHD symptoms
Several ADHD scales can be used to track symptom changes over time.33 However, these self-report scales may be subject to positive illusory bias, a phenomenon observed in individuals with ADHD in which they tend to overrate their functioning,34 which may limit the accuracy of self-report scales.35
Activities of daily living
Since patients with ADHD tend to overrate their functioning in various aspects of living, collateral information should be gathered to corroborate patient self-reports whenever possible.
Adverse events
Blood pressure, heart rate, and weight should be assessed at baseline and monitored during stimulant treatment. Other symptoms to monitor include gastrointestinal distress, headache, aggression, depression, appetite, and sleeping habits.4,6 More intensive monitoring (eg, electrocardiography) may be indicated for those with hypertension and cardiovascular risk factors.
Aberrant behavior
Monitoring for misuse and diversion of stimulant medications is essential, as ADHD itself is a risk factor for addiction.20,21 Pill counts, prescription monitoring programs, urine drug screens, and collateral informants have all been proposed but not studied in monitoring for the misuse of stimulant medications.27 Before prescribing, it is prudent to check the prescription monitoring program, get a urine drug screen, and discuss any positive findings with the patient.36,37
Treatment agreements ensure that patients are aware of the consequences of misuse and allow the clinician to reference prior discussion when terminating treatment with stimulants.
LIVES CAN BE ENHANCED
ADHD is a common disorder that arises in childhood and can persist throughout life. Adults with untreated ADHD are at risk of severe impairments in various domains of functioning. Stimulant medications are an effective treatment but may be diverted into the street market. Using the universal-precautions model may reduce the risks of both nontreatment of ADHD and misuse of stimulants.
Accordingly, clinicians need to confirm the ADHD diagnosis, assess comorbidities, estimate risk of misuse, and provide informed consent prior to prescribing. Subsequent monitoring should involve the use of treatment agreements and evaluating treatment response, paying particular attention to ADHD symptom control but also to level of function, adverse effects, and aberrant behavior.
With these principles in mind, clinicians can address the risks of misuse and potentially enhance the lives of people who may have been suffering substantially due to lack of appropriate care.
- Polanczyk G, de Lima MS, Horta BL, Biederman J, Rohde LA. The worldwide prevalence of ADHD: a systematic review and metaregression analysis. Am J Psychiatry 2007; 164:942–948.
- Polanczyk GV, Wilcutt EG, Salum GA, Kieling C, Rohde LA. ADHD prevalence estimates across three decades: an updated systematic review and meta-regression analysis. Int J Epidemiol 2014; 43:434–442.
- Wilens TE. ADHD: Prevalence, diagnosis, and issues of comorbidity. CNS Spectr 2007; 12(suppl 6):1–5.
- Kooij SJ, Bejerot S, Blackwell A, et al. European consensus statement on diagnosis and treatment of adult ADHD: the European Network Adult ADHD. BMC Psychiatry 2010; 10:67.
- Shaw M, Hodgkins P, Caci H, et al. A systematic review and analysis of long-term outcomes in attention deficit hyperactivity disorder: effects of treatment and non-treatment. BMC Med 2012;10:99.
- Modesto-Lowe V, Meyer A, Soovajian V. A clinician’s guide to adult attention-deficit hyperactivity disorder. Conn Med 2012; 76:517–523.
- Kessler RC, Adler L, Barkley R, et al. The prevalence and correlates of adult ADHD in the United States: results from the National Comorbidity Survey Replication. Am J Psychiatry 2006; 163:716–723.
- Goodman DW, Surman CB, Scherer PB, Salinas GD, Brown JJ. Assessment of physician practices in adult attention-deficit/hyperactivity disorder. Prim Care Companion CNS Disord 2012; 14(4).
- Hall CL, Newell K, Taylor J, Sayal K, Swift KD, Hollis C. ‘Mind the gap’—mapping services for young people with ADHD transitioning from child to adult mental health services. BMC Psychiatry 2013; 13:186.
- National Institute for Health and Care Excellence. Attention deficit hyperactivity disorder: diagnosis and management of ADHD in children, young people and adults. The British Psychological Society and The Royal College of Psychiatrists: United Kingdom; 2009.
- Mannuzza S, Klein RG, Klein DF, Bessler A, Shrout P. Accuracy of adult recall of childhood attention deficit hyperactivity disorder. Am J Psychiatry 2002; 159:1882–1888.
- Wetzel MW. Medical student participation in an adult ADHD outpatient clinic: an ideal setting for education in outpatient psychiatry. Acad Psychiatry 2009; 33:80–81.
- Culpepper L, Mattingly G. Challenges in identifying and managing attention-deficit/hyperactivity disorder in adults in the primary care setting: a review of the literature. Prim Care Companion J Clin Psychiatry 2010; 12(6).
- Rabiner DL. Stimulant prescription cautions: addressing misuse, diversion and malingering. Curr Psychiatry Rep 2013; 15:375.
- Gourlay D, Heit H. Universal precautions: a matter of mutual trust and responsibility. Pain Med 2006; 7:210–211.
- Kessler RC, Adler L, Ames M, et al. The World Health Organization Adult ADHD Self-Report Scale (ASRS): a short screening scale for use in the general population. Psychol Med 2005; 35:245–256.
- American Psychiatric Association. Diagnostic and Statistical Manual of Mental Disorders, 5th ed. Arlington, VA: American Psychiatric Association; 2013.
- CADDRA Guidelines Steering Committee. Canadian ADHD practice guidelines: CADDRA 2008. http://www.naceonline.com/AdultADHDtoolkit/professionalresources/caddraguidelines.pdf. Accessed July 10, 2015.
- Mannuzza S, Klein RG, Bessler A, Malloy P, LaPadula M. Adult psychiatric status of hyperactive boys grown up. Am J Psychiatry 1998; 155:493–498.
- Kaye S, Darke S. The diversion and misuse of pharmaceutical stimulants: what do we know and why should we care? Addiction 2012; 107:467–477.
- Novak SP, Kroutil LA, Williams RL, Van Brunt DL. The nonmedical use of prescription ADHD medications: results from a national Internet panel. Subst Abuse Treat Prev Policy 2007; 2:32.
- Bavarian N, Flay BR, Ketcham P, et al. Using structural equation modeling to understand prescription stimulant misuse: a test of the Theory of Triadic Influence. Drug Alcohol Depend 2014; 138:193–201.
- McCabe SE, Teter CJ, Boyd CJ. Medical use, illicit use and diversion of prescription stimulant medication. J Psychoactive Drugs 2006; 38:43–56.
- Volkow ND. Stimulant medications: how to minimize their reinforcing effects? Am J Psychiatry 2006; 163:359–361.
- Kolar D, Keller A, Golfinopoulos M, Cumyn L, Syer C, Hechtman L. Treatment of adults with attention-deficit/hyperactivity disorder. Neuropsychiatr Dis Treat 2008; 4:107–121.
- Schachter D, Tharmalingam S, Kleinman I. Informed consent and stimulant medication: adolescents’ and parents’ ability to understand information about benefits and risks of stimulant medication for the treatment of attention-deficit/hyperactivity disorder. J Child Adolesc Psychopharmacol 2011; 21:139–148.
- Manning JS. Strategies for managing the risks associated with ADHD medications. J Clin Psychiatry 2013; 74:e19.
- Deep K. Use of narcotics contracts. Virtual Mentor 2013; 15:416–420.
- Cheatle MD, Savage SR. Informed consent in opioid therapy: a potential obligation and opportunity. J Pain Symptom Manage 2012; 44:105–116.
- Dias TG, Kieling C, Graeff-Martins AS, Moriyama TS, Rohde LA, Polanczyk GV. Developments and challenges in the diagnosis and treatment of ADHD. Rev Bras Psiquiatr 2013; 35(suppl 1):S40–S50.
- Mattingly GW, Weisler RH, Young J, et al. Clinical response and symptomatic remission in short- and long-term trials of lisdexamfetamine dimesylate in adults with attention-deficit/hyperactivity disorder. BMC Psychiatry 2013; 13:39.
- Contini V, Victor MM, Bertuzzi GP, et al. No significant association between genetic variants in 7 candidate genes and response to methylphenidate treatment in adult patients with ADHD. J Clin Psychopharmacol 2012; 32:820–823.
- Rösler M, Retz W, Thome J, Schneider M, Stieglitz RD, Falkai P. Psychopathological rating scales for diagnostic use in adults with attention-deficit/hyperactivity disorder (ADHD). Eur Arch Psychiatry Clin Neurosci 2006; 256(suppl 1):i3–i11.
- Prevatt F, Proctor B, Best L, Baker L, Van Walker J, Taylor NW. The positive illusory bias: does it explain self-evaluations in college students with ADHD? J Atten Disord 2012; 16:235–243.
- Jiang Y, Johnston C. The relationship between ADHD symptoms and competence as reported by both self and others. J Atten Disord 2012; 16:418–426.
- Darredeau C, Barrett SP, Jardin B, Pihl RO. Patterns and predictors of medication compliance, diversion, and misuse in adult prescribed methylphenidate users. Hum Psychopharmacol 2007; 22:529–536.
- Worley J. Prescription drug monitoring programs, a response to doctor shopping: purpose, effectiveness, and directions for future research. Issues Ment Health Nurs 2012; 33:319–328.
KEY POINTS
- Untreated adult ADHD is associated with negative outcomes that include unemployment, arrests, divorce, and psychiatric comorbidities.
- Available ADHD guidelines suggest that children and adults who respond to pharmacotherapy should continue it for as long as it remains effective. In this context, there is increasing recognition of adult ADHD as a valid and treatable disorder.
- Following the guidelines of universal precautions in the diagnosis and treatment of adult ADHD can alleviate clinicians’ concerns when diagnosing and treating this disorder.
Comprehensive wound malodor management: Win the RACE
Wounds that fail to heal become more than mere skin lesions. Pain, malodor, and the accompanying psychological distress often complicate nonhealing wounds and impair quality of life.1 Management of malodor requires perseverance, sensitivity, and familiarity with tools and procedures that range from surgical debridement to medical-grade honey.
Chronic, nonhealing wounds are defined as persisting for more than 6 months.2 These lesions are incapable of undergoing anatomic and functional repair on their own. Commonly encountered nonhealing wounds include pressure ulcers, venous stasis ulcers, arterial insufficiency ulcers, and malignant cutaneous wounds.
Typically, the patient with a nonhealing wound is frail, debilitated, medically complex, and often faced with one or more life-limiting illnesses. Complete wound healing may therefore be unrealistic, and optimal wound management becomes the goal of care.3,4
Healthcare providers encounter nonhealing wounds in varied settings—acute inpatient, outpatient, long-term, and home care. For instance, in the home care setting, a study of 383 patients enrolled in hospice found that 35% had skin ulcers and wounds.3 Half of those affected had pressure ulcers, 20% had ischemic ulcers, and 30% had other skin disorders such as stasis ulcers, burns, skin tears, and tumors. A larger study, also in hospice patients, found that 26% had pressure ulcers and 10% more developed them within 6 months.5
While pressure ulcers are the most common nonhealing wounds, malignant or fungating wounds are found in 5% to 10% of patients with metastatic disease, usually with cancers of the breast, head, and neck.6
Maximizing wound care provides comfort, relieves suffering, and promotes quality of life.3,7 To achieve these goals, clinicians must be familiar with strategies to manage complications associated with nonhealing wounds such as pain, malodor, and psychosocial adverse effects. Of these complications, malodor has been pointed out by both patients and caregivers as the most distressing.8
This article focuses on wound malodor, discusses the processes that cause wounds to emit an offensive smell, and outlines a comprehensive management approach.
MRS. A., AGE 61, WITH STAGE IV BREAST CANCER
Mrs. A., 61 years old, had a fungating mass in her left breast, which began as a small nodule and progressively enlarged to deform her breast over several months. Her oncologist subsequently staged the extent of her cancer as stage IV after workup revealed lung metastasis. Mrs. A. and her family decided to forgo cancer treatment, including radiotherapy, and to transition to hospice care after discussions with the oncologist.
Mrs. A. lived at home with her husband. Her daughter and three grandchildren all lived nearby.
When her hospice physician arrived at her home to meet her, a strong, pungent, and nauseating smell greeted him as he entered her bedroom. The patient said that for the past few months she had been increasingly distressed by the revolting odor. She rarely left home and had been ashamed to have people visit her, including her family.
On examination, the physician noticed a large fungating mass with yellowish discharge and necrotic tissue in her left breast. In addition to mild pain, she was immensely bothered by the strong odor coming from her breast.
THE IMPACT OF MALODOR
As seen in the case of Mrs. A., malodor has grave effects, both physical and psychological. Patients experience impaired or socially unacceptable body image, social rejection, personal shame, and embarrassment.9,10 Feelings of fear, anxiety, and depression are common. If left uncontrolled, malodor results in social isolation, reluctance to engage in social activities, diminished appetite, and nausea. In addition, malodor is a constant reminder of patients’ pain and cancer, and it results in further suffering.11
Reactions of family members and caregivers can worsen the situation.9,12 Expressions of revulsion limit contact and inhibit intimacy, especially near the end of life. Caregivers are often frustrated and distressed over their inability to control the malodor. The environment becomes uninhabitable, and the malodor can permeate clothing, furniture, and living quarters.
Managing malodor can be emotionally draining, physically daunting, and frustrating for healthcare professionals, as several methods are usually employed, often in a trial-and-error approach, to achieve an acceptable degree of odor control. In addition, clinicians must face the challenge of treating malodorous wounds at very close distance without reacting in a way that offends or alarms patients and family members.13
MALODOR PRODUCTION: WHERE IS THAT SMELL COMING FROM?
All wounds can produce an odor.14 Wounds that are expected to heal typically emit a faint but not unpleasant odor, akin to fresh blood. Wounds colonized by Pseudomonas aeruginosa produce a fruity or grapelike odor that is tolerable. Malodor occurs with wounds infected by other gram-negative organisms or anaerobic bacteria.15 Similarly, wounds covered by necrotic tissue smell like decaying flesh.
Three major causes
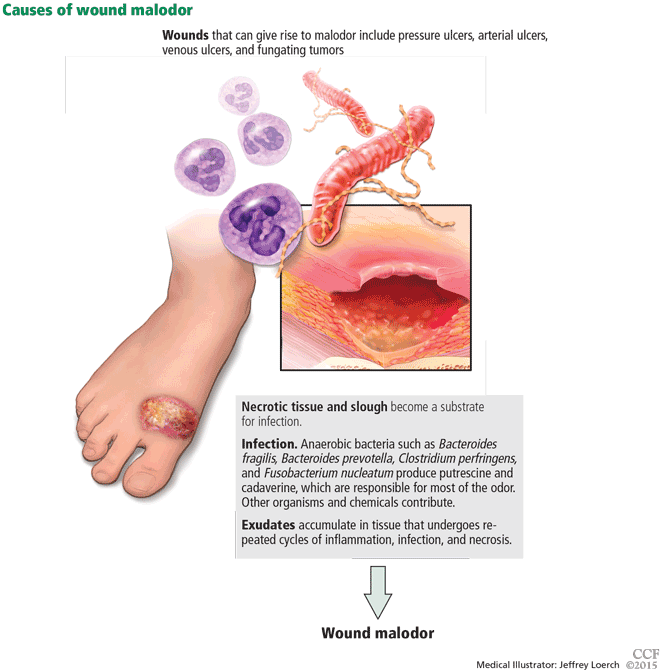
The three major causes of wound malodor are slough, infection, and exudate (Figure 1).
Slough is dead or necrotic tissue, usually resulting from vascular compromise. Arterial ulcers, pressure ulcers, and malignant wounds all form slough from capillary occlusion, subsequent ischemia, and tissue necrosis.
Infection. Devitalized tissue, an ideal medium in which bacteria thrive, becomes the source of infection. Anaerobic bacteria are usually implicated in malodor. These include Bacteroides fragilis, Bacteroides prevotella, Clostridium perfringens, and Fusobacterium nucleatum.16,17 Anaerobic organisms produce putrescine and cadaverine, which are largely responsible for the offensive odor.16,18 Volatile fatty acids such as propionic, butyric, isovaleric, and valeric acid are formed from lipid catabolism by anaerobes and add to malodor.17 Aerobic bacteria such as Proteus, Klebsiella, and Pseudomonas species supercolonize necrotic tissue as well and contribute to malodor.17,18
Exudate. Since nonhealing wounds undergo repeated cycles of inflammation, infection, and necrosis, accumulation of exudate becomes inevitable. Exudate typically is a pus-like fluid containing serum, fibrin, and white blood cells, which leak from blood vessels. In addition, bacteria that colonize chronic wounds filled with necrotic tissue activate proteases that degrade and liquefy dead tissue, thereby forming extensive amounts of exudate.19
Apart from slough, infection, and exudate, poor general hygiene and dressings left on for too long may contribute to malodor.16 Moisture-retentive dressings such as hydrocolloids leave an odor after removal. Dressings that liquefy upon contact with the wound surface leave a pus-like, potentially malodorous material.
MALODOR ASSESSMENT: DO YOU SMELL SOMETHING?
Various ways to document wound malodor can prove useful in guiding assessment and treatment. Descriptions such as “foul,” “putrid,” “fishy,” or “filled the room” vividly portray the initial presentation. A 10-point numerical scale similar to a numerical pain scale or a visual analogue scale can be used as a subjective measure.
Other grading methods, which to the authors’ knowledge are not validated, may be helpful. In a study that focused on patients suffering from malodorous gynecologic malignancies, von Gruenigen et al20 used a 0-to-3 scale:
- 0 Absent
- 1 Not offensive
- 2 Offensive but tolerable
- 3 Offensive and intolerable.
A scale often adapted by other authors was devised by Baker and Haig,21 which clearly defines four classes:
- 1 Strong—odor is evident upon entering the room (6 to 10 feet from the patient) with the dressing intact
- 2 Moderate—odor is evident upon entering the room with dressing removed
- 3 Slight—odor is evident at close proximity to the patient when the dressing is removed
- 4 No odor—no odor is evident, even at the patient’s bedside with the dressing removed.
COMPREHENSIVE MANAGEMENT: HOW DO WE WIN THE ‘RACE’?
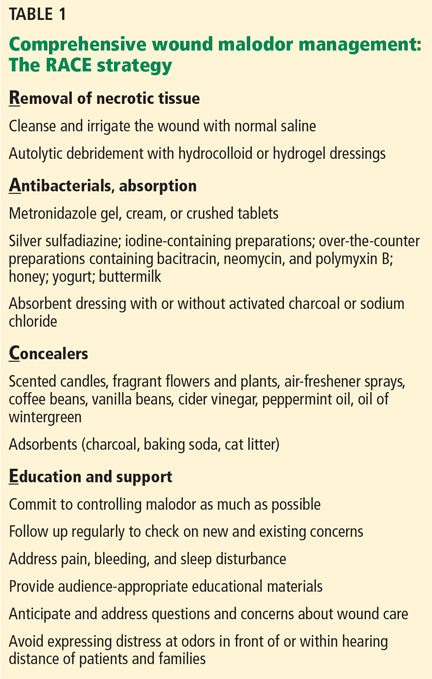
The acronym RACE outlines an approach to dealing with malodor. It stands for removal of necrotic tissue; antibacterials; odor concealers; and education and support (Table 1).
Remove necrotic tissue
An important step in eliminating malodor is to remove necrotic tissue. This starts with debridement, which decreases the incidence of infection and hastens wound closure.22,23 Table 2 compares the different types of debridement.
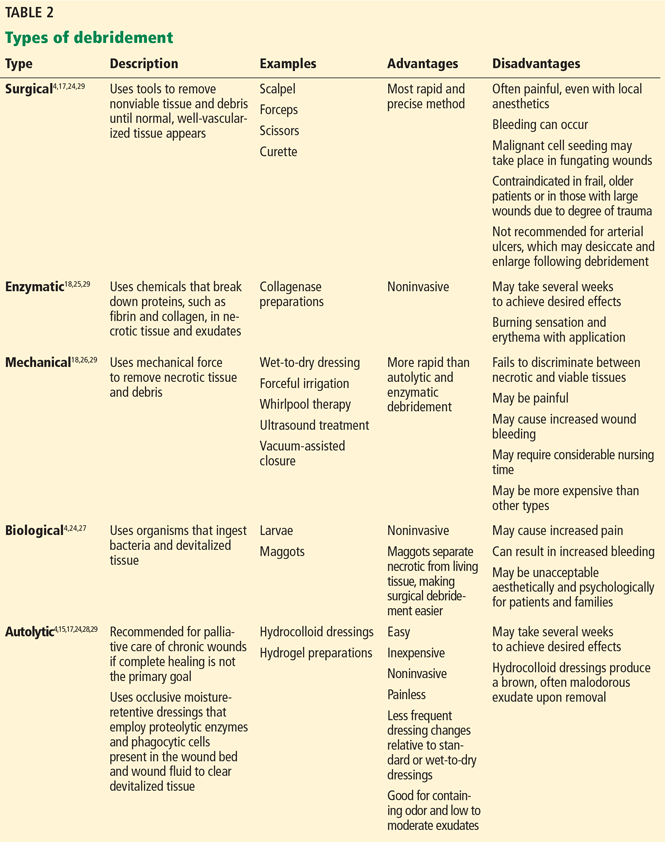
Sharp or surgical debridement involves the use of a scalpel or scissors. This type of debridement may increase the risk of bleeding, pain, and malignant cell seeding in fungating wounds.4,24
Enzymatic debridement employs chemicals with proteolytic action (eg, collagenase) to digest extracellular proteins in wounds.18,25
Mechanical debridement involves aggressive therapies such as forceful irrigation and hydrotherapy, which may fail to discriminate between necrotic and viable tissues.18,26
Biological debridement using maggots, which ingest bacteria and devitalized tissue, may cause increased wound bleeding and may be unacceptable for patients and families.24,27
Autolytic debridement is often recommended, particularly if complete healing is not the primary goal.17,24,28,29 Autolysis uses proteolytic enzymes and phagocytic cells present in the wound bed and wound fluid to clear devitalized tissue. It is easy, inexpensive, noninvasive, and painless,4 and it requires less frequent dressing changes relative to standard dressing or wet-to-dry dressing.
Autolytic debridement is commonly accomplished using hydrocolloid and hydrogel dressings.15,29 Hydrocolloids are adhesive, occlusive, and conformable dressings that are suitable for wounds with low to moderate amounts of exudate. Upon contact with the wound surface, the dressing absorbs the exudate, forms a gel layer, and maintains a moist environment. Hydrocolloids are not recommended for infected wounds or for those with copious exudate as they may lead to maceration around the wound. A disadvantage of hydrocolloid dressings is their tendency to generate brown, often malodorous exudate when removed.
On the other hand, hydrogels in amorphous gel, dressing, sheet, or impregnated gauze form are water-based products that create a moist environment similar to hydrocolloids. Aside from causing minimal trauma to the wound bed when removed, the dressing’s cooling effect may bring some pain relief. Hydrogels are appropriate for dry wounds and for those with minimal exudate.
After debridement, the wound is cleansed and irrigated. A number of cleansers and solutions are available, but normal saline is a cheap alternative. To irrigate, experts recommend an 18- or 20-gauge intravenous catheter attached to a 30- or 60-mL syringe.15 This technique provides 8 to 15 psi of pressure, enough to cleanse the wound without causing tissue trauma.
Antibacterials and absorption
Antibacterials. Topical antibiotics have several advantages over systemic antibiotics in treating chronic wounds.30,31 These include a high and sustained concentration of the antimicrobial at the site of infection, limited potential for systemic absorption and toxicity, reduced potential for antibiotic resistance, and drawing of the patient’s and caregiver’s attention to the wound.
Metronidazole is the most widely used topical antibacterial for malodor management. Its efficacy is likely due to the predominant involvement of anaerobic bacteria in foul-smelling wounds. Topical metronidazole is available as a gel and as a cream. A systematic review showed that on average, topical metronidazole was used once daily for 14 consecutive days.19 The layer of topical metronidazole is typically covered with a nonadherent primary dressing followed by an absorbent secondary dressing.
The best clinical evidence for topical metronidazole consists of case reports and series.32–35 The largest of these studies was done by Finlay et al, who treated 47 patients with malodorous benign and malignant cutaneous wounds with 0.75% metronidazole gel daily.32 Forty-five (96%) of the patients reported significantly decreased odor by 14 days, as well as decreased pain, discharge, and surrounding cellulitis.
A randomized, placebo-controlled trial conducted by Bale et al had equivocal findings.9 All 41 patients who received metronidazole gel reported a decrease in malodor within 3 days of starting it. However, 76% of patients who received placebo also reported malodor control; in the final analysis, no significant difference was noted in the success rate between the two groups.
Metronidazole tablets can be crushed and sprinkled over the wound. As with metronidazole gel or cream, the crushed tablets are applied daily and covered by a primary nonadherent dressing and an absorbent secondary dressing. This off-label use of metronidazole serves as a cheaper alternative to commercially available topical preparations. To our knowledge, there has been no head-to-head trial comparing the two topical strategies.
Systemic metronidazole, often given orally, has been recommended if evidence of deep tissue or systemic infection is noted15 and in cases of fungating wounds with fistulas invading either the gastrointestinal or genitourinary tracts.18 Side effects such as nausea, neuropathy, and alcohol intolerance (ie, disulfiram reaction) may occur, which are not seen with topical metronidazole.
Both topical and systemic metronidazole can be used together on a time-limited basis for extensive malodorous wounds, such as fungating malignant wounds or stage IV sacral pressure ulcers.
Other antimicrobial agents used to treat malodor include silver-containing products, iodine-containing topical agents, mupirocin, bacitracin, neomycin, and polymyxin B.
Honey was used for wound care by the ancient Egyptians, and it is still used.36 Its beneficial effects include antimicrobial, debriding, deodorizing, anti-inflammatory, and granulation tissue-stimulating. Honey has even been shown to significantly decrease skin colonization with various kinds of bacteria, including methicillin-resistant Staphylococcus aureus.37 Medical-grade honey is preferred over table honey, as the latter is nonsterile and can contain Clostridium spores, which contaminate the wound.38
Yogurt and buttermilk lower the pH of the wound and control bacterial proliferation to control malodor.39,40 Either is applied for 10 to 15 minutes after the wound is cleansed and is then washed off thoroughly.
Absorbent dressings are used either over a layer of topical metronidazole and a nonadherent primary dressing or as a primary dressing itself. An absorbent dressing containing activated charcoal is used for rapid improvement, although cost may be prohibitive, especially in developing countries.13,19 Another type of absorbent dressing, composed of polyester impregnated with sodium chloride, has been found to be useful in malodor control.41 An important pointer is to maintain a tight seal around the absorbent dressing to prevent leakage of exudate.
Concealers
Aromatics used to conceal malodor include scented candles, incense, fragrant flowers and plants, and air-freshener sprays. When circumstances allow, candles are good options since they conceal malodor by emitting fragrance, and the flame burns off foul-smelling chemicals. Aromatics such as coffee beans, vanilla beans, and cider vinegar can be placed in a pan and left under the patient’s bed or close to it. Drops of peppermint oil or oil of wintergreen can be placed on wound dressings.
Other odor concealers are adsorbent materials that attract and cause ions and molecules to adhere to their surface. Examples are charcoal, baking soda, and cat litter. As with other aromatics, these materials are placed in pans and left under the bed or near the patient.
Aromatics can have disadvantages, as certain scents, especially strong ones, can be nauseating for patients. Some fragrances trigger asthma or skin irritation. Patients and caregivers can be left with an unpleasant association of certain fragrances with malodor by conditioning.15,17,18
Education and support
Concerns of the patient and family members need to be heard, addressed promptly, and reassessed with each visit, since uncontrolled malodor can be a chief source of caregiver fatigue.
Foremost in formulating a patient- and family-centered malodor management strategy is to commit to controlling malodor as much as possible. Regular follow-up appointments should be made, whether in the office or at home, to check on the patient’s progress and address new and ongoing concerns. Symptoms accompanying malodor, such as pain, bleeding, and sleep disturbance, need to be addressed, as they all affect quality of life.1 Audience-appropriate educational materials should be made available.26 Online resources that patients and families can explore include the websites of the Wound Ostomy and Continence Nurses Society (www.wocn.org) and the Association for the Advancement of Wound Care (aawconline.org).
Healthcare professionals need to be prepared to deal with problems and complications involving patients and family members that may arise in the course of treatment.12 Problems include the cost and local unavailability of dressing supplies, insurance coverage for dressings and topical agents, lack of assistance at home, and fear of changing dressings. A cardinal rule for healthcare providers is to avoid expressing distress at odors in front of or within hearing of patients and families.
OTHER STRATEGIES: WHAT ELSE CAN WE DO?
Curcumin, the main biologically active compound in the herb turmeric, applied directly to wounds three times daily as an ointment, has been shown to have odor-controlling properties.42
Sugar paste has been reported to control malodor by drawing out exudative and tissue fluid osmotically, and inhibiting bacterial growth.16,17 Water is mixed with sugar (ie, granulated, caster, or powdered) to form a paste, with additives like glycerin and polyethylene glycol used to alter the consistency. Thick clay-like paste is good for wounds with large cavities, while thin paste is useful for wounds with small or superficial openings. The paste is applied twice daily and is covered by an absorbent dressing.
Pressure relief is vital in managing pressure ulcers.18,43 Repositioning every 2 hours and using special devices, such as mattress overlays, alternating pressure mattresses, and low air loss mattresses, are frequently employed techniques.
If circumstances permit and when congruent with the patient’s goals of care, intra-arterial chemotherapy and radiotherapy can be contemplated for malignant fungating wounds.44,45
Other strategies include opening the windows during dressing changes, increasing the frequency of dressing changes, promptly removing used dressings from the house, and ensuring good general hygiene.
CASE RESOLUTION
After telling her that he was committed to control the malodor or, if possible, eliminate it, Mrs. A.’s doctor prepared two lists of materials—one for himself and one for Mrs. A.’s husband. He returned the next day, brought out his supplies, asked Mrs. A. to lie in bed, and invited her husband to assist him.
He cleansed and irrigated the breast lesion with normal saline, making sure to remove as much dead tissue as he could. He applied a layer of metronidazole cream to the wound cavity, then covered it with a nonadherent dressing. He then covered the wound with gauze, sealed the edges with medical adhesive tape, and applied a few drops of oil of wintergreen to the surface. A pan of charcoal briquettes was put under the bed, and a candle with Mrs. A.’s favorite scent was lit by the bedside. The physician then instructed Mrs. A.’s husband to repeat the procedure once daily for 1 week.
After 2 weeks, Mrs. A. and her husband said the foul odor had greatly decreased. She appeared more cheerful and energetic, especially after her grandchildren visited a few days earlier. The physician then instructed the husband to stop using metronidazole cream and to apply a hydrocolloid dressing every 3 days instead. He advised them to continue the rest of the process of applying a few drops of oil of wintergreen on the dressing surface, placing a pan of charcoal briquettes under the bed, and lighting a scented candle by the bedside.
FINISH THE RACE!
Complex nonhealing wounds are encountered across various healthcare settings. Wound malodor is an important component of nonhealing wounds, which adversely affects patients, families, and healthcare providers. Infection, slough, and exudate are the major causes of wound malodor. The essential steps to reduce malodor are to remove necrotic tissue, use antibacterial and odor-absorbing agents, apply appropriate odor “concealers,” educate families, and formulate a patient- and family-centered strategy (Table 1).
Acknowledgment: The authors would like to thank Sue Reif, CNP, for her assistance in completing the manuscript.
- Lo SF, Hayter M, Hu WY, Tai CY, Hsu MY, Li YF. Symptom burden and quality of life in patients with malignant fungating wounds. J Adv Nurs 2012; 68:1312–1321.
- Lazarus GS, Cooper DM, Knighton DR, et al. Definitions and guidelines for assessment of wounds and evaluation of healing. Arch Dermatol 1994; 130:489–493.
- Tippett AW. Wounds at the end of life. Wounds 2005; 17:91–98.
- Burt T. Palliative care of pressure ulcers in long-term care. Ann Long-Term Care 2013; 21:20–28.
- Reifsnyder J, Magee HS. Development of pressure ulcers in patients receiving home hospice care. Wounds 2005; 17:74–79.
- Haisfield-Wolfe ME, Rund C. Malignant cutaneous wounds: a management protocol. Ostomy Wound Manage 1997; 43:56–66.
- O’Brien C. Malignant wounds: managing odour. Can Fam Physician 2012; 58:272–274.
- Gethin G, Grocott P, Probst S, Clarke E. Current practice in the management of wound odour: an international survey. Int J Nurs Stud 2014; 51:865–874.
- Bale S, Tebble N, Price P. A topical metronidazole gel used to treat malodorous wounds. Br J Nurs 2004; 13:S4–S11.
- Hack A. Malodorous wounds—taking the patient’s perspective into account. J Wound Care 2003; 12:319–321.
- Price E. Wound care. The stigma of smell. Nurs Times 1996; 92:71–72.
- Paul JC, Pieper BA. Topical metronidazole for the treatment of wound odor: a review of the literature. Ostomy Wound Manage 2008; 54:18–27.
- Lee G, Anand SC, Rajendran S, Walker I. Overview of current practice and future trends in the evaluation of dressings for malodorous wounds. J Wound Care 2006; 15:344–346.
- Cutting K, Harding K. Criteria for identifying wound infection. J Wound Care 1994; 3:198–201.
- McDonald A, Lesage P. Palliative management of pressure ulcers and malignant wounds in patients with advanced illness. J Palliat Med 2006; 9:285–295.
- Holloway S. Recognising and treating the causes of chronic malodorous wounds. Prof Nurse 2004; 19:380–384.
- Haughton W, Young T. Common problems in wound care: malodorous wounds. Br J Nurs 1995; 4:959–963.
- Alvarez OM, Kalinski C, Nusbaum J, et al. Incorporating wound healing strategies to improve palliation (symptom management) in patients with chronic wounds. J Palliat Med 2007; 10:1161–1189.
- da Costa Santos CM, de Mattos Pimenta CA, Nobre MR. A systematic review of topical treatments to control the odor of malignant fungating wounds. J Pain Symptom Manage 2010; 39:1065–1076.
- Von Gruenigen VE, Coleman RL, et al. Bacteriology and treatment of malodorous lower reproductive tract in gynecologic cancer patients. Obstet Gynecol 2000; 96:23–27.
- Baker PG, Haig G. Metronidazole in the treatment of chronic pressure sores and ulcers: a comparison with standard treatment in general practice. Practitioner 1981; 225:569–573.
- Whitney J, Phillips L, Aslam R, et al. Guidelines for the treatment of pressure ulcers. Wound Repair Regen 2006; 14:663–679.
- Williams D, Enoch S, Miller D, Harris K, Price P, Harding KG. Effect of sharp debridement using curette on recalcitrant nonhealing venous ulcers: a concurrently controlled, prospective cohort study. Wound Repair Regen 2005; 13:131–137.
- Bergstrom KJ. Assessment and management of fungating wounds. J Wound Ostomy Continence Nurs 2011: 38:31–37.
- Sinclair RD, Ryan TJ. Proteolytic enzymes in wound healing: the role of enzymatic debridement. Australas J Dermatol 1994; 35:35–41.
- Enoch S, Harding KG. Wound bed preparation: the science behind the removal of barriers to healing. Wounds 2003;15:213–229.
- Mumcuoglu KY. Clinical applications for maggots in wound care. Am J Clin Dermatol 2001; 2:219–227.
- Langemo DK, Black J; National Pressure Ulcer Advisory Panel. Pressure ulcers in individuals receiving palliative care: a National Pressure Ulcer Advisory Panel white paper. Adv Skin Wound Care 2010; 23:59–72.
- Fonder MA, Lazarus GS, Cowan DA, Aronson-Cook B, Kohli AR, Mamelak AJ. Treating the chronic wound: a practical approach to the care of nonhealing wounds and wound care dressings. J Am Acad Dermatol 2008; 58:185–206.
- Lio PA, Kaye ET. Topical antibacterial agents. Infect Dis Clin North Am 2004; 18:717–733.
- Gelmetti C. Local antibiotics in dermatology. Dermatol Ther 2008; 21:187–195.
- Finlay IG, Bowszyc J, Ramlau C, Gwiezdzinski Z. The effect of topical 0.75% metronidazole gel on malodorous cutaneous ulcers. J Pain Symptom Manage 1996; 11:158–162.
- Bower M, Stein R, Evans TR, Hedley A, Pert P, Coombes RC. A double-blind study of the efficacy of metronidazole gel in the treatment of malodorous fungating tumours. Eur J Cancer 1992; 28A:888–889.
- Kalinski C, Schnepf M, Laboy D, et al. Effectiveness of a topical formulation containing metronidazole for wound odor and exudate control. Wounds 2005; 17:84–90.
- Kuge S, Tokuda Y, Ohta M, et al. Use of metronidazole gel to control malodor in advanced and recurrent breast cancer. Jpn J Clin Oncol 1996; 26:207–210.
- Belcher J. A review of medical-grade honey in wound care. Br J Nurs 2012: 21:S4–S9.
- Kwakman PH, Van den Akker JP, Güçlü A, et al. Medical-grade honey kills antibiotic-resistant bacteria in vitro and eradicates skin colonization. Clin Infect Dis 2008; 46:1677–1682.
- Cooper RA, Jenkins L. A comparison between medical grade honey and table honeys in relation to antimicrobial efficacy. Wounds 2009; 21:29–36.
- Patel B, Cox-Hayley D. Managing wound odor #218. J Palliat Med 2010; 13:1286–1287.
- Schulte MJ. Yogurt helps to control wound odor. Oncol Nurs Forum 1993; 20:1262.
- Upright CA, Salton C, Roberts F, Murphy J. Evaluation of Mesalt dressings and continuous wet saline dressings in ulcerating metastatic skin lesions. Cancer Nurs 1994; 17:149–155.
- Kuttan R, Sudheeran PC, Josph CD. Turmeric and curcumin as topical agents in cancer therapy. Tumori 1987; 73:29–31.
- Bass MJ, Phillips LG. Pressure sores. Curr Probl Surg 2007; 44:101–143.
- Bufill JA, Grace WR, Neff R. Intra-arterial chemotherapy for palliation of fungating breast cancer: a case report and review of the literature. Am J Clin Oncol 1994; 17:118–124.
- Murakami M, Kuroda Y, Sano A, et al. Validity of local treatment including intraarterial infusion chemotherapy and radiotherapy for fungating adenocarcinoma of the breast: case report of more than 8-year survival. Am J Clin Oncol 2001; 24:388–391.
Wounds that fail to heal become more than mere skin lesions. Pain, malodor, and the accompanying psychological distress often complicate nonhealing wounds and impair quality of life.1 Management of malodor requires perseverance, sensitivity, and familiarity with tools and procedures that range from surgical debridement to medical-grade honey.
Chronic, nonhealing wounds are defined as persisting for more than 6 months.2 These lesions are incapable of undergoing anatomic and functional repair on their own. Commonly encountered nonhealing wounds include pressure ulcers, venous stasis ulcers, arterial insufficiency ulcers, and malignant cutaneous wounds.
Typically, the patient with a nonhealing wound is frail, debilitated, medically complex, and often faced with one or more life-limiting illnesses. Complete wound healing may therefore be unrealistic, and optimal wound management becomes the goal of care.3,4
Healthcare providers encounter nonhealing wounds in varied settings—acute inpatient, outpatient, long-term, and home care. For instance, in the home care setting, a study of 383 patients enrolled in hospice found that 35% had skin ulcers and wounds.3 Half of those affected had pressure ulcers, 20% had ischemic ulcers, and 30% had other skin disorders such as stasis ulcers, burns, skin tears, and tumors. A larger study, also in hospice patients, found that 26% had pressure ulcers and 10% more developed them within 6 months.5
While pressure ulcers are the most common nonhealing wounds, malignant or fungating wounds are found in 5% to 10% of patients with metastatic disease, usually with cancers of the breast, head, and neck.6
Maximizing wound care provides comfort, relieves suffering, and promotes quality of life.3,7 To achieve these goals, clinicians must be familiar with strategies to manage complications associated with nonhealing wounds such as pain, malodor, and psychosocial adverse effects. Of these complications, malodor has been pointed out by both patients and caregivers as the most distressing.8
This article focuses on wound malodor, discusses the processes that cause wounds to emit an offensive smell, and outlines a comprehensive management approach.
MRS. A., AGE 61, WITH STAGE IV BREAST CANCER
Mrs. A., 61 years old, had a fungating mass in her left breast, which began as a small nodule and progressively enlarged to deform her breast over several months. Her oncologist subsequently staged the extent of her cancer as stage IV after workup revealed lung metastasis. Mrs. A. and her family decided to forgo cancer treatment, including radiotherapy, and to transition to hospice care after discussions with the oncologist.
Mrs. A. lived at home with her husband. Her daughter and three grandchildren all lived nearby.
When her hospice physician arrived at her home to meet her, a strong, pungent, and nauseating smell greeted him as he entered her bedroom. The patient said that for the past few months she had been increasingly distressed by the revolting odor. She rarely left home and had been ashamed to have people visit her, including her family.
On examination, the physician noticed a large fungating mass with yellowish discharge and necrotic tissue in her left breast. In addition to mild pain, she was immensely bothered by the strong odor coming from her breast.
THE IMPACT OF MALODOR
As seen in the case of Mrs. A., malodor has grave effects, both physical and psychological. Patients experience impaired or socially unacceptable body image, social rejection, personal shame, and embarrassment.9,10 Feelings of fear, anxiety, and depression are common. If left uncontrolled, malodor results in social isolation, reluctance to engage in social activities, diminished appetite, and nausea. In addition, malodor is a constant reminder of patients’ pain and cancer, and it results in further suffering.11
Reactions of family members and caregivers can worsen the situation.9,12 Expressions of revulsion limit contact and inhibit intimacy, especially near the end of life. Caregivers are often frustrated and distressed over their inability to control the malodor. The environment becomes uninhabitable, and the malodor can permeate clothing, furniture, and living quarters.
Managing malodor can be emotionally draining, physically daunting, and frustrating for healthcare professionals, as several methods are usually employed, often in a trial-and-error approach, to achieve an acceptable degree of odor control. In addition, clinicians must face the challenge of treating malodorous wounds at very close distance without reacting in a way that offends or alarms patients and family members.13
MALODOR PRODUCTION: WHERE IS THAT SMELL COMING FROM?
All wounds can produce an odor.14 Wounds that are expected to heal typically emit a faint but not unpleasant odor, akin to fresh blood. Wounds colonized by Pseudomonas aeruginosa produce a fruity or grapelike odor that is tolerable. Malodor occurs with wounds infected by other gram-negative organisms or anaerobic bacteria.15 Similarly, wounds covered by necrotic tissue smell like decaying flesh.
Three major causes
The three major causes of wound malodor are slough, infection, and exudate (Figure 1).
Slough is dead or necrotic tissue, usually resulting from vascular compromise. Arterial ulcers, pressure ulcers, and malignant wounds all form slough from capillary occlusion, subsequent ischemia, and tissue necrosis.
Infection. Devitalized tissue, an ideal medium in which bacteria thrive, becomes the source of infection. Anaerobic bacteria are usually implicated in malodor. These include Bacteroides fragilis, Bacteroides prevotella, Clostridium perfringens, and Fusobacterium nucleatum.16,17 Anaerobic organisms produce putrescine and cadaverine, which are largely responsible for the offensive odor.16,18 Volatile fatty acids such as propionic, butyric, isovaleric, and valeric acid are formed from lipid catabolism by anaerobes and add to malodor.17 Aerobic bacteria such as Proteus, Klebsiella, and Pseudomonas species supercolonize necrotic tissue as well and contribute to malodor.17,18
Exudate. Since nonhealing wounds undergo repeated cycles of inflammation, infection, and necrosis, accumulation of exudate becomes inevitable. Exudate typically is a pus-like fluid containing serum, fibrin, and white blood cells, which leak from blood vessels. In addition, bacteria that colonize chronic wounds filled with necrotic tissue activate proteases that degrade and liquefy dead tissue, thereby forming extensive amounts of exudate.19
Apart from slough, infection, and exudate, poor general hygiene and dressings left on for too long may contribute to malodor.16 Moisture-retentive dressings such as hydrocolloids leave an odor after removal. Dressings that liquefy upon contact with the wound surface leave a pus-like, potentially malodorous material.
MALODOR ASSESSMENT: DO YOU SMELL SOMETHING?
Various ways to document wound malodor can prove useful in guiding assessment and treatment. Descriptions such as “foul,” “putrid,” “fishy,” or “filled the room” vividly portray the initial presentation. A 10-point numerical scale similar to a numerical pain scale or a visual analogue scale can be used as a subjective measure.
Other grading methods, which to the authors’ knowledge are not validated, may be helpful. In a study that focused on patients suffering from malodorous gynecologic malignancies, von Gruenigen et al20 used a 0-to-3 scale:
- 0 Absent
- 1 Not offensive
- 2 Offensive but tolerable
- 3 Offensive and intolerable.
A scale often adapted by other authors was devised by Baker and Haig,21 which clearly defines four classes:
- 1 Strong—odor is evident upon entering the room (6 to 10 feet from the patient) with the dressing intact
- 2 Moderate—odor is evident upon entering the room with dressing removed
- 3 Slight—odor is evident at close proximity to the patient when the dressing is removed
- 4 No odor—no odor is evident, even at the patient’s bedside with the dressing removed.
COMPREHENSIVE MANAGEMENT: HOW DO WE WIN THE ‘RACE’?
The acronym RACE outlines an approach to dealing with malodor. It stands for removal of necrotic tissue; antibacterials; odor concealers; and education and support (Table 1).
Remove necrotic tissue
An important step in eliminating malodor is to remove necrotic tissue. This starts with debridement, which decreases the incidence of infection and hastens wound closure.22,23 Table 2 compares the different types of debridement.
Sharp or surgical debridement involves the use of a scalpel or scissors. This type of debridement may increase the risk of bleeding, pain, and malignant cell seeding in fungating wounds.4,24
Enzymatic debridement employs chemicals with proteolytic action (eg, collagenase) to digest extracellular proteins in wounds.18,25
Mechanical debridement involves aggressive therapies such as forceful irrigation and hydrotherapy, which may fail to discriminate between necrotic and viable tissues.18,26
Biological debridement using maggots, which ingest bacteria and devitalized tissue, may cause increased wound bleeding and may be unacceptable for patients and families.24,27
Autolytic debridement is often recommended, particularly if complete healing is not the primary goal.17,24,28,29 Autolysis uses proteolytic enzymes and phagocytic cells present in the wound bed and wound fluid to clear devitalized tissue. It is easy, inexpensive, noninvasive, and painless,4 and it requires less frequent dressing changes relative to standard dressing or wet-to-dry dressing.
Autolytic debridement is commonly accomplished using hydrocolloid and hydrogel dressings.15,29 Hydrocolloids are adhesive, occlusive, and conformable dressings that are suitable for wounds with low to moderate amounts of exudate. Upon contact with the wound surface, the dressing absorbs the exudate, forms a gel layer, and maintains a moist environment. Hydrocolloids are not recommended for infected wounds or for those with copious exudate as they may lead to maceration around the wound. A disadvantage of hydrocolloid dressings is their tendency to generate brown, often malodorous exudate when removed.
On the other hand, hydrogels in amorphous gel, dressing, sheet, or impregnated gauze form are water-based products that create a moist environment similar to hydrocolloids. Aside from causing minimal trauma to the wound bed when removed, the dressing’s cooling effect may bring some pain relief. Hydrogels are appropriate for dry wounds and for those with minimal exudate.
After debridement, the wound is cleansed and irrigated. A number of cleansers and solutions are available, but normal saline is a cheap alternative. To irrigate, experts recommend an 18- or 20-gauge intravenous catheter attached to a 30- or 60-mL syringe.15 This technique provides 8 to 15 psi of pressure, enough to cleanse the wound without causing tissue trauma.
Antibacterials and absorption
Antibacterials. Topical antibiotics have several advantages over systemic antibiotics in treating chronic wounds.30,31 These include a high and sustained concentration of the antimicrobial at the site of infection, limited potential for systemic absorption and toxicity, reduced potential for antibiotic resistance, and drawing of the patient’s and caregiver’s attention to the wound.
Metronidazole is the most widely used topical antibacterial for malodor management. Its efficacy is likely due to the predominant involvement of anaerobic bacteria in foul-smelling wounds. Topical metronidazole is available as a gel and as a cream. A systematic review showed that on average, topical metronidazole was used once daily for 14 consecutive days.19 The layer of topical metronidazole is typically covered with a nonadherent primary dressing followed by an absorbent secondary dressing.
The best clinical evidence for topical metronidazole consists of case reports and series.32–35 The largest of these studies was done by Finlay et al, who treated 47 patients with malodorous benign and malignant cutaneous wounds with 0.75% metronidazole gel daily.32 Forty-five (96%) of the patients reported significantly decreased odor by 14 days, as well as decreased pain, discharge, and surrounding cellulitis.
A randomized, placebo-controlled trial conducted by Bale et al had equivocal findings.9 All 41 patients who received metronidazole gel reported a decrease in malodor within 3 days of starting it. However, 76% of patients who received placebo also reported malodor control; in the final analysis, no significant difference was noted in the success rate between the two groups.
Metronidazole tablets can be crushed and sprinkled over the wound. As with metronidazole gel or cream, the crushed tablets are applied daily and covered by a primary nonadherent dressing and an absorbent secondary dressing. This off-label use of metronidazole serves as a cheaper alternative to commercially available topical preparations. To our knowledge, there has been no head-to-head trial comparing the two topical strategies.
Systemic metronidazole, often given orally, has been recommended if evidence of deep tissue or systemic infection is noted15 and in cases of fungating wounds with fistulas invading either the gastrointestinal or genitourinary tracts.18 Side effects such as nausea, neuropathy, and alcohol intolerance (ie, disulfiram reaction) may occur, which are not seen with topical metronidazole.
Both topical and systemic metronidazole can be used together on a time-limited basis for extensive malodorous wounds, such as fungating malignant wounds or stage IV sacral pressure ulcers.
Other antimicrobial agents used to treat malodor include silver-containing products, iodine-containing topical agents, mupirocin, bacitracin, neomycin, and polymyxin B.
Honey was used for wound care by the ancient Egyptians, and it is still used.36 Its beneficial effects include antimicrobial, debriding, deodorizing, anti-inflammatory, and granulation tissue-stimulating. Honey has even been shown to significantly decrease skin colonization with various kinds of bacteria, including methicillin-resistant Staphylococcus aureus.37 Medical-grade honey is preferred over table honey, as the latter is nonsterile and can contain Clostridium spores, which contaminate the wound.38
Yogurt and buttermilk lower the pH of the wound and control bacterial proliferation to control malodor.39,40 Either is applied for 10 to 15 minutes after the wound is cleansed and is then washed off thoroughly.
Absorbent dressings are used either over a layer of topical metronidazole and a nonadherent primary dressing or as a primary dressing itself. An absorbent dressing containing activated charcoal is used for rapid improvement, although cost may be prohibitive, especially in developing countries.13,19 Another type of absorbent dressing, composed of polyester impregnated with sodium chloride, has been found to be useful in malodor control.41 An important pointer is to maintain a tight seal around the absorbent dressing to prevent leakage of exudate.
Concealers
Aromatics used to conceal malodor include scented candles, incense, fragrant flowers and plants, and air-freshener sprays. When circumstances allow, candles are good options since they conceal malodor by emitting fragrance, and the flame burns off foul-smelling chemicals. Aromatics such as coffee beans, vanilla beans, and cider vinegar can be placed in a pan and left under the patient’s bed or close to it. Drops of peppermint oil or oil of wintergreen can be placed on wound dressings.
Other odor concealers are adsorbent materials that attract and cause ions and molecules to adhere to their surface. Examples are charcoal, baking soda, and cat litter. As with other aromatics, these materials are placed in pans and left under the bed or near the patient.
Aromatics can have disadvantages, as certain scents, especially strong ones, can be nauseating for patients. Some fragrances trigger asthma or skin irritation. Patients and caregivers can be left with an unpleasant association of certain fragrances with malodor by conditioning.15,17,18
Education and support
Concerns of the patient and family members need to be heard, addressed promptly, and reassessed with each visit, since uncontrolled malodor can be a chief source of caregiver fatigue.
Foremost in formulating a patient- and family-centered malodor management strategy is to commit to controlling malodor as much as possible. Regular follow-up appointments should be made, whether in the office or at home, to check on the patient’s progress and address new and ongoing concerns. Symptoms accompanying malodor, such as pain, bleeding, and sleep disturbance, need to be addressed, as they all affect quality of life.1 Audience-appropriate educational materials should be made available.26 Online resources that patients and families can explore include the websites of the Wound Ostomy and Continence Nurses Society (www.wocn.org) and the Association for the Advancement of Wound Care (aawconline.org).
Healthcare professionals need to be prepared to deal with problems and complications involving patients and family members that may arise in the course of treatment.12 Problems include the cost and local unavailability of dressing supplies, insurance coverage for dressings and topical agents, lack of assistance at home, and fear of changing dressings. A cardinal rule for healthcare providers is to avoid expressing distress at odors in front of or within hearing of patients and families.
OTHER STRATEGIES: WHAT ELSE CAN WE DO?
Curcumin, the main biologically active compound in the herb turmeric, applied directly to wounds three times daily as an ointment, has been shown to have odor-controlling properties.42
Sugar paste has been reported to control malodor by drawing out exudative and tissue fluid osmotically, and inhibiting bacterial growth.16,17 Water is mixed with sugar (ie, granulated, caster, or powdered) to form a paste, with additives like glycerin and polyethylene glycol used to alter the consistency. Thick clay-like paste is good for wounds with large cavities, while thin paste is useful for wounds with small or superficial openings. The paste is applied twice daily and is covered by an absorbent dressing.
Pressure relief is vital in managing pressure ulcers.18,43 Repositioning every 2 hours and using special devices, such as mattress overlays, alternating pressure mattresses, and low air loss mattresses, are frequently employed techniques.
If circumstances permit and when congruent with the patient’s goals of care, intra-arterial chemotherapy and radiotherapy can be contemplated for malignant fungating wounds.44,45
Other strategies include opening the windows during dressing changes, increasing the frequency of dressing changes, promptly removing used dressings from the house, and ensuring good general hygiene.
CASE RESOLUTION
After telling her that he was committed to control the malodor or, if possible, eliminate it, Mrs. A.’s doctor prepared two lists of materials—one for himself and one for Mrs. A.’s husband. He returned the next day, brought out his supplies, asked Mrs. A. to lie in bed, and invited her husband to assist him.
He cleansed and irrigated the breast lesion with normal saline, making sure to remove as much dead tissue as he could. He applied a layer of metronidazole cream to the wound cavity, then covered it with a nonadherent dressing. He then covered the wound with gauze, sealed the edges with medical adhesive tape, and applied a few drops of oil of wintergreen to the surface. A pan of charcoal briquettes was put under the bed, and a candle with Mrs. A.’s favorite scent was lit by the bedside. The physician then instructed Mrs. A.’s husband to repeat the procedure once daily for 1 week.
After 2 weeks, Mrs. A. and her husband said the foul odor had greatly decreased. She appeared more cheerful and energetic, especially after her grandchildren visited a few days earlier. The physician then instructed the husband to stop using metronidazole cream and to apply a hydrocolloid dressing every 3 days instead. He advised them to continue the rest of the process of applying a few drops of oil of wintergreen on the dressing surface, placing a pan of charcoal briquettes under the bed, and lighting a scented candle by the bedside.
FINISH THE RACE!
Complex nonhealing wounds are encountered across various healthcare settings. Wound malodor is an important component of nonhealing wounds, which adversely affects patients, families, and healthcare providers. Infection, slough, and exudate are the major causes of wound malodor. The essential steps to reduce malodor are to remove necrotic tissue, use antibacterial and odor-absorbing agents, apply appropriate odor “concealers,” educate families, and formulate a patient- and family-centered strategy (Table 1).
Acknowledgment: The authors would like to thank Sue Reif, CNP, for her assistance in completing the manuscript.
- Lo SF, Hayter M, Hu WY, Tai CY, Hsu MY, Li YF. Symptom burden and quality of life in patients with malignant fungating wounds. J Adv Nurs 2012; 68:1312–1321.
- Lazarus GS, Cooper DM, Knighton DR, et al. Definitions and guidelines for assessment of wounds and evaluation of healing. Arch Dermatol 1994; 130:489–493.
- Tippett AW. Wounds at the end of life. Wounds 2005; 17:91–98.
- Burt T. Palliative care of pressure ulcers in long-term care. Ann Long-Term Care 2013; 21:20–28.
- Reifsnyder J, Magee HS. Development of pressure ulcers in patients receiving home hospice care. Wounds 2005; 17:74–79.
- Haisfield-Wolfe ME, Rund C. Malignant cutaneous wounds: a management protocol. Ostomy Wound Manage 1997; 43:56–66.
- O’Brien C. Malignant wounds: managing odour. Can Fam Physician 2012; 58:272–274.
- Gethin G, Grocott P, Probst S, Clarke E. Current practice in the management of wound odour: an international survey. Int J Nurs Stud 2014; 51:865–874.
- Bale S, Tebble N, Price P. A topical metronidazole gel used to treat malodorous wounds. Br J Nurs 2004; 13:S4–S11.
- Hack A. Malodorous wounds—taking the patient’s perspective into account. J Wound Care 2003; 12:319–321.
- Price E. Wound care. The stigma of smell. Nurs Times 1996; 92:71–72.
- Paul JC, Pieper BA. Topical metronidazole for the treatment of wound odor: a review of the literature. Ostomy Wound Manage 2008; 54:18–27.
- Lee G, Anand SC, Rajendran S, Walker I. Overview of current practice and future trends in the evaluation of dressings for malodorous wounds. J Wound Care 2006; 15:344–346.
- Cutting K, Harding K. Criteria for identifying wound infection. J Wound Care 1994; 3:198–201.
- McDonald A, Lesage P. Palliative management of pressure ulcers and malignant wounds in patients with advanced illness. J Palliat Med 2006; 9:285–295.
- Holloway S. Recognising and treating the causes of chronic malodorous wounds. Prof Nurse 2004; 19:380–384.
- Haughton W, Young T. Common problems in wound care: malodorous wounds. Br J Nurs 1995; 4:959–963.
- Alvarez OM, Kalinski C, Nusbaum J, et al. Incorporating wound healing strategies to improve palliation (symptom management) in patients with chronic wounds. J Palliat Med 2007; 10:1161–1189.
- da Costa Santos CM, de Mattos Pimenta CA, Nobre MR. A systematic review of topical treatments to control the odor of malignant fungating wounds. J Pain Symptom Manage 2010; 39:1065–1076.
- Von Gruenigen VE, Coleman RL, et al. Bacteriology and treatment of malodorous lower reproductive tract in gynecologic cancer patients. Obstet Gynecol 2000; 96:23–27.
- Baker PG, Haig G. Metronidazole in the treatment of chronic pressure sores and ulcers: a comparison with standard treatment in general practice. Practitioner 1981; 225:569–573.
- Whitney J, Phillips L, Aslam R, et al. Guidelines for the treatment of pressure ulcers. Wound Repair Regen 2006; 14:663–679.
- Williams D, Enoch S, Miller D, Harris K, Price P, Harding KG. Effect of sharp debridement using curette on recalcitrant nonhealing venous ulcers: a concurrently controlled, prospective cohort study. Wound Repair Regen 2005; 13:131–137.
- Bergstrom KJ. Assessment and management of fungating wounds. J Wound Ostomy Continence Nurs 2011: 38:31–37.
- Sinclair RD, Ryan TJ. Proteolytic enzymes in wound healing: the role of enzymatic debridement. Australas J Dermatol 1994; 35:35–41.
- Enoch S, Harding KG. Wound bed preparation: the science behind the removal of barriers to healing. Wounds 2003;15:213–229.
- Mumcuoglu KY. Clinical applications for maggots in wound care. Am J Clin Dermatol 2001; 2:219–227.
- Langemo DK, Black J; National Pressure Ulcer Advisory Panel. Pressure ulcers in individuals receiving palliative care: a National Pressure Ulcer Advisory Panel white paper. Adv Skin Wound Care 2010; 23:59–72.
- Fonder MA, Lazarus GS, Cowan DA, Aronson-Cook B, Kohli AR, Mamelak AJ. Treating the chronic wound: a practical approach to the care of nonhealing wounds and wound care dressings. J Am Acad Dermatol 2008; 58:185–206.
- Lio PA, Kaye ET. Topical antibacterial agents. Infect Dis Clin North Am 2004; 18:717–733.
- Gelmetti C. Local antibiotics in dermatology. Dermatol Ther 2008; 21:187–195.
- Finlay IG, Bowszyc J, Ramlau C, Gwiezdzinski Z. The effect of topical 0.75% metronidazole gel on malodorous cutaneous ulcers. J Pain Symptom Manage 1996; 11:158–162.
- Bower M, Stein R, Evans TR, Hedley A, Pert P, Coombes RC. A double-blind study of the efficacy of metronidazole gel in the treatment of malodorous fungating tumours. Eur J Cancer 1992; 28A:888–889.
- Kalinski C, Schnepf M, Laboy D, et al. Effectiveness of a topical formulation containing metronidazole for wound odor and exudate control. Wounds 2005; 17:84–90.
- Kuge S, Tokuda Y, Ohta M, et al. Use of metronidazole gel to control malodor in advanced and recurrent breast cancer. Jpn J Clin Oncol 1996; 26:207–210.
- Belcher J. A review of medical-grade honey in wound care. Br J Nurs 2012: 21:S4–S9.
- Kwakman PH, Van den Akker JP, Güçlü A, et al. Medical-grade honey kills antibiotic-resistant bacteria in vitro and eradicates skin colonization. Clin Infect Dis 2008; 46:1677–1682.
- Cooper RA, Jenkins L. A comparison between medical grade honey and table honeys in relation to antimicrobial efficacy. Wounds 2009; 21:29–36.
- Patel B, Cox-Hayley D. Managing wound odor #218. J Palliat Med 2010; 13:1286–1287.
- Schulte MJ. Yogurt helps to control wound odor. Oncol Nurs Forum 1993; 20:1262.
- Upright CA, Salton C, Roberts F, Murphy J. Evaluation of Mesalt dressings and continuous wet saline dressings in ulcerating metastatic skin lesions. Cancer Nurs 1994; 17:149–155.
- Kuttan R, Sudheeran PC, Josph CD. Turmeric and curcumin as topical agents in cancer therapy. Tumori 1987; 73:29–31.
- Bass MJ, Phillips LG. Pressure sores. Curr Probl Surg 2007; 44:101–143.
- Bufill JA, Grace WR, Neff R. Intra-arterial chemotherapy for palliation of fungating breast cancer: a case report and review of the literature. Am J Clin Oncol 1994; 17:118–124.
- Murakami M, Kuroda Y, Sano A, et al. Validity of local treatment including intraarterial infusion chemotherapy and radiotherapy for fungating adenocarcinoma of the breast: case report of more than 8-year survival. Am J Clin Oncol 2001; 24:388–391.
KEY POINTS
- Necrotic tissue is a substrate for bacterial growth and should be debrided. A variety of methods can be used.
- Malodor is most often from infection with anaerobic organisms, which topical metronidazole and other agents can help control.
- An absorbent dressing should be used either as a primary dressing, or over a layer of topical metronidazole and a nonadherent primary dressing.
- Foremost in formulating a patient- and family-centered malodor management strategy is to commit to controlling it as much as possible.