User login
Reducing morbidity and mortality from common medical conditions in schizophrenia
Life expectancy for both males and females has been increasing over the past several decades to an average of 76 years. However, the life expectancy among individuals with schizophrenia in the United States is 61 years—a 20% reduction.1 Patients with schizophrenia are known to be at increased risk of several comorbid medical conditions, such as type 2 diabetes mellitus (T2DM), coronary artery disease, and digestive and liver disorders, compared with healthy people (Figure, page 32).2-5 This risk may be heightened by several factors, including sedentary lifestyle, a high rate of cigarette use, poor self-management skills, homelessness, and poor diet.
Although substantial attention is paid to the psychiatric and behavioral management of schizophrenia, many barriers impede the detection and treatment of patients’ medical conditions, which have been implicated in excess unforeseen deaths. Patients with schizophrenia might experience delays in diagnosis, leading to more acute comorbidity at time of diagnosis and premature mortality
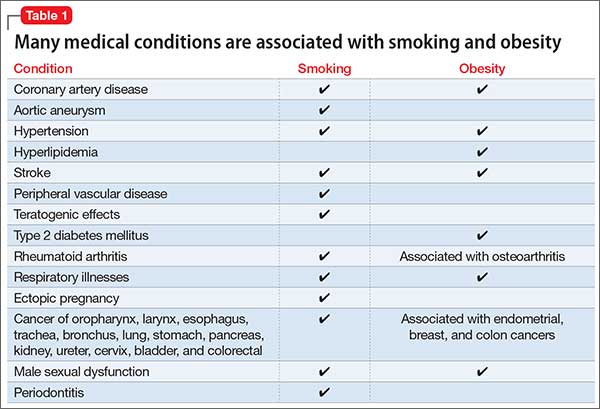
Cardiovascular disease is the leading cause of death among psychiatric patients.6 Key risk factors for cardiovascular disease include smoking, obesity, hypertension, dyslipidemia, diabetes, and lack of physical activity, all of which are more prevalent among patients with schizophrenia.7 In addition, antipsychotics are associated with adverse metabolic effects.8 In general, smoking and obesity are the most modifiable and preventable risk factors for many medical conditions, such as cardiovascular disease, hyperlipidemia, diabetes, and many forms of cancer (Table 1).
In this article, we discuss how to manage common medical comorbidities in patients with schizophrenia. Comprehensive management for all these medical conditions in this population is beyond the scope of this article; we limit ourselves to discussing (1) how common these conditions are in patients with schizophrenia compared with the general population and (2) what can be done in psychiatric practice to manage these medical comorbidities (Box).

Obesity
Obesity—defined as body mass index (BMI) of >30—is common among patients with schizophrenia. The condition leads to poor self-image, decreased treatment adherence, and an increased risk of many chronic medical conditions (Table 1). Being overweight or obese can increase stigma and social discrimination, which will undermine self-esteem and, in turn, affect adherence with medications, leading to relapse.
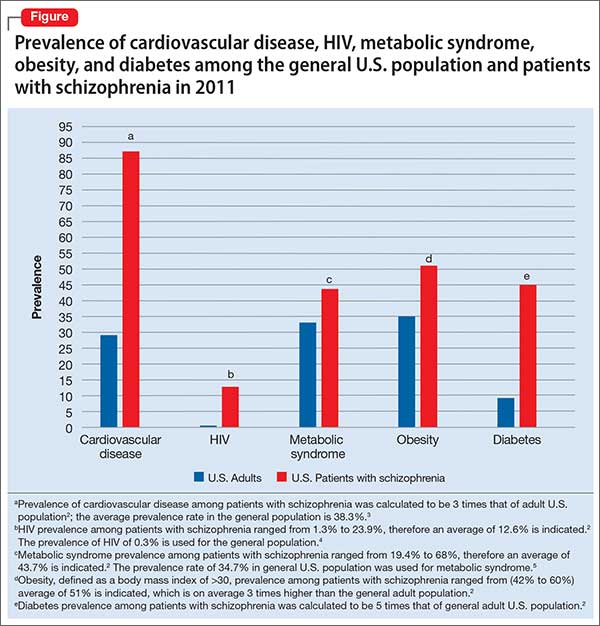
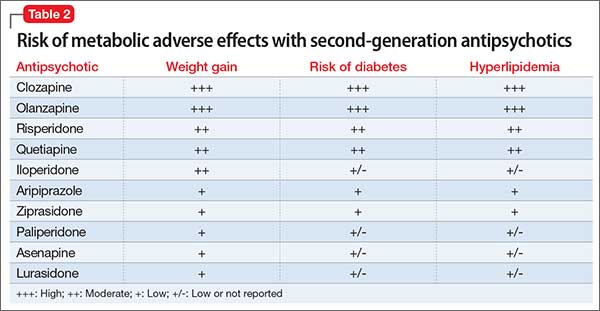
The prevalence of obesity among patients with schizophrenia is almost double that of the general population9 (Figure2-5). Several factors predispose these patients to overweight or obese, including sedentary lifestyle, lack of exercise, a high-fat diet, medications side effects, and genetic factors. Recent studies report the incidence of weight gain among patients treated with antipsychotics is as high as 80%10 (Table 2).
Mechanisms involved in antipsychotic-induced weight gain are not completely understood, but antagonism of serotonergic (5-HT2C, 5-HT1A), histamine (H1), dopamine (D2), muscarinic, and other receptors are involved in modulation of food intake. Decreased energy expenditure also has been blamed for antipsychotic-induced weight gain.10
Pharmacotherapy and bariatric surgery can be as effective among patients with schizophrenia as they are among the general population. Maintaining a BMI of <25 kg/m2 lowers the risk of cardiovascular disease by 35% to 55%.6 Metformin has modest potential for offsetting weight gain and providing some metabolic control in overweight outpatients with schizophrenia,11 and should be considered early when treating at-risk patients.
Managing obesity. Clinicians can apply several measures to manage obesity in a patient with schizophrenia:
- Educate the patient, and the family, about the risks of being overweight or obese.
- Monitor weight and BMI at each visit.
- Advise smoking cessation.
- When clinically appropriate, switch to an antipsychotic with a lower risk of weight gain—eg, from olanzapine or high-dose quetiapine to a high- or medium-potency typical antipsychotic (eg, haloperidol, perphenazine), ziprasidone, aripiprazole, iloperidone, and lurasidone (Table 2, page 36).
- Consider prophylactic use of metformin with an antipsychotic; the drug has modest potential for offsetting weight gain and providing better metabolic control in an overweight patient with schizophrenia.11
- Encourage the patient to engage in modest physical activity; for example, a 20-minute walk, every day, reduces the risk of cardiovascular disease by 35% to 55%.6
- Recommend a formal lifestyle modification program, such as behavioral group-based treatment for weight reduction.12
- Refer the patient and family to a dietitian.
Type 2 diabetes mellitus
There is strong association between T2DM and schizophrenia that is related to abnormal glucose regulation independent of any adverse medication effect.13 Ryan et al14 reported that first-episode, drug-naïve patients with schizophrenia had a higher level of intra-abdominal fat than age- and BMI-matched healthy controls, suggesting that schizophrenia could be associated with changes in adiposity that might increase the risk of insulin resistance, hyperlipidemia, and dyslipidemia. Mechanisms that increase the risk of T2DM in schizophrenia include genetic and environmental factors, such as family history, lack of physical activity, and poor diet.
Diagnosis. All patients with schizophrenia should be evaluated for undiagnosed diabetes. The diagnosis of T2DM is made by documenting:
- a fasting plasma glucose reading of ≥126 mg/dL
- symptoms of T2DM, along with a random plasma glucose reading of ≥200 mg/dL
- 2-hour reading of a plasma glucose level >200 mg/dL on an oral glucose tolerance test.
Recent guidelines also suggest using a hemoglobin A1c value cutoff of ≥6.5% to diagnose T2DM.
In the Clinical Antipsychotic Trials of Intervention Effectiveness (CATIE) study, 38% of patients with schizophrenia and diabetes were not receiving any treatment for T2DM.15
Risk factors for T2DM are:
- BMI >25
- a first-degree relative with diabetes
- lack of physical activity
- being a member of a high-risk ethnic group (African American, Hispanic American, Native American, Asian American, or Pacific Islander)
- having delivered a baby >9 lb or having had gestational diabetes
- hypertension
- high-density lipoprotein (HDL) cholesterol level of ≤35 mg/dL
- triglyceride level of ≥250 mg/dL
- history of an abnormal glucose tolerance test
- history of abnormal findings on a fasting plasma glucose test
- history of vascular disease.
Early detection and management.
- Educate the patient and family about signs and symptoms of T2DM, such as polyuria, nocturia, polydipsia, fatigue, visual disturbances, and (in women) vulvitis. Also, psychiatrists should be aware of, and inquire about, symptoms of diabetic ketoacidosis.
- At the start of therapy with any antipsychotic, particularly a second-generation antipsychotic (SGA), ask patients about a family history of diabetes and measure the hemoglobin A1c value.
- Monitor the hemoglobin A1c level 4 months after starting an antipsychotic, then annually, in a patient with significant risk factors for diabetes.
- Monitor blood glucose every 6 months in patients with no change from initial results and more frequently in those with significant risk factors for diabetes and those who gain weight.
- Order a lipid panel and measure the serum glucose level to rule out dyslipidemia and diabetes, because a patient with high lipid levels and diabetes is at higher risk of developing cardiovascular conditions.
- Advocate for smoking cessation.
- Switch to an antipsychotic with a lower risk of diabetes when clinically appropriate, such as switching a patient from olanzapine or high-dose quetiapine to a high- or medium-potency typical antipsychotic (such as haloperidol or perphenazine), ziprasidone, aripiprazole, iloperidone, and lurasidone (Table 2).
- Consider prophylactic use of metformin along with antipsychotics. Metformin has been used to improve insulin sensitivity and can lead to weight loss in diabetic and non-diabetic patients. The drug has modest potential for offsetting weight gain and providing better metabolic control in overweight outpatients with schizophrenia.11 Metformin is simple to use, does not lead to hypoglycemia, does not require serum glucose monitoring, and has a favorable safety profile.11
- Educate the patient about modest physical activity. For example, a 20-minute walk every day reduces the risk of cardiovascular disease by 35% to 55%.6
- Refer the patient to a dietitian to develop an appropriate diet plan.
- When diabetes is diagnosed, ensure appropriate follow-up and initiation or continuation of therapy with a general practitioner or an endocrinologist.
- Reinforce the need for ongoing follow-up and compliance with therapy for diabetes.
Hyperlipidemia and dyslipidemia
Elevated cholesterol and triglyceride levels are associated with cardiovascular diseases, such as ischemic heart disease and myocardial infarction. A 10% increase in cholesterol levels is associated with a 20% to 30% increase in the risk of coronary artery disease; lowering cholesterol by 10% decreases the risk by 20% to 30%.16 Triglyceride levels ≥250 mg/dL are associated with 2-fold higher risk of cardiovascular disease.16
The incidence of dyslipidemia is not as well studied as diabetes in patients with schizophrenia. There is increased prevalence of dyslipidemia in patients with schizophrenia compared with the general population because of obesity, lack of physical activity, and poor dietary habits.16
Data regarding the effects of first-generation antipsychotics (FGAs) on lipid levels are limited, but high-potency drugs, such as haloperidol, seem to carry a lower risk of hyperlipidemia than low-potency drugs, such as chlorpromazine and thioridazine.17 A comprehensive review on the effects of SGAs on plasma lipid levels suggested that clozapine, olanzapine, and quetiapine are associated with a higher risk of dyslipidemia17 (Table 2).
In the CATIE study, olanzapine and clozapine were associated with a greater increase in the serum level of cholesterol and triglycerides compared with other antipsychotics, even after adjusting for treatment duration. Furthermore, a retrospective chart review of patients who switched to aripiprazole from other SGAs showed a decrease in levels of total cholesterol and low-density lipoprotein cholesterol15 (Table 2).
Patients with schizophrenia are more likely to have dyslipidemia go undiagnosed, and therefore are less likely to be treated for the disorder. In the CATIE study, 88% of patients with dyslipidemia were not receiving any treatment.15
Management for dyslipidemia.
- Educate the patient and family about risks involved with dyslipidemia.
- Monitor weight and BMI at each visit.
- Monitor lipids to rule out dyslipidemia. Obtain a pretreatment fasting or random lipid profile for any patient receiving an antipsychotic; repeat at least every 6 months after starting the antipsychotic.
- Counsel the patient to quit smoking.
- Switch to an antipsychotic with lower risk of weight gain and dyslipidemia, such as switching from olanzapine or high-dose quetiapine to high- or medium-potency typical antipsychotics (such as, haloperidol or perphenazine), ziprasidone, aripiprazole, iloperidone, and lurasidone (Table 2).
- Educate and encourage the patient about modest physical activity. For example, a 20-minute walk everyday will reduce cardiovascular disease risk by 35% to 55%.6
- Refer to a dietitian if indicated.
- Ensure follow-up and initiation of treatment with a general practitioner.
- Educate and encourage the patient about modest physical activity. For example, a 20-minute walk everyday will reduce cardiovascular disease risk by 35% to 55%.
Metabolic syndrome
Metabolic syndrome is cluster of cardiovascular risk factors, including central adiposity, hyperglycemia, dyslipidemia, and hypertension. The National Cholesterol Education Program’s Adult Treatment Panel III report defines metabolic syndrome as the presence of 3 of 5 of the following factors:
- abdominal obesity (waist circumference of >40 inches in men, or >35 inches in women)
- triglyceride level, >150 mg/dL
- HDL cholesterol, <40 mg/dL in men and <50 mg/dL in women
- blood pressure, >130/85 mm Hg
- fasting plasma glucose level, >110 mg/dL.
The presence of metabolic syndrome in the general population is a strong predictor of cardiovascular diseases and diabetes.18 The adverse effects of metabolic syndrome are thought to relate to atherogenic dyslipidemia, higher blood pressure, insulin resistance with or without glucose intolerance, a proinflammatory state, and a prothrombotic state.
The prevalence of metabolic syndrome in patients with schizophrenia is 2- to 3-fold higher than the general population.19 In the CATIE study, approximately one-third of patients met criteria for metabolic syndrome at baseline.15 In a prospective study, De Hert et al20 reported that patients who were started on a SGA had more than twice the rate of developing metabolic syndrome compared with those treated with a FGA (Table 2). Other possible causes of metabolic syndrome are visceral adiposity and insulin resistance.16Management of the metabolic syndrome involves addressing the individual components that have been described in the preceding sections on T2DM and dyslipidemia.
Hepatitis C
Hepatitis C virus (HCV) infection is thought to be the most common blood-borne illness, with an estimated prevalence of 1% of the U.S. population. Some studies suggest that as many as 16% of people with schizophrenia have HCV infection.4 Risk factors for HCV infection include unsafe sexual practices, prostitution, homosexuality, homelessness, and IV drug use.
HCV treatments typically have involved regimens with interferon alfa, which is associated with significant neuropsychiatric side effects, including depression and suicide. There is a dearth of research on treatment of HCV in patients with schizophrenia; however, at least 1 study suggests that there was no increase in psychiatric symptoms in patients treated with interferon-containing regimens.21 There is even less evidence to guide the use of newer, non-interferon–based HCV treatment regimens that are better tolerated and have a higher response rate in the general population; there is reason, however, to be hopeful about their potential in patients with schizophrenia and HCV infection.
Managing HCV infection.
- Educate the patients and family about risk factors associated with contracting HCV.
- Screen for HCV infection in patients with schizophrenia because there is higher prevalence of HCV in these patients compared with the general population.
- When HCV infection is diagnosed, educate the patients and family about available treatments.
- Facilitate referral to an HCV specialist for appropriate treatment.
HIV/AIDS
HIV infection is highly prevalent among people suffering from severe mental illness such as schizophrenia. The incidence of HIV/AIDS in patients with schizophrenia is estimated to be 4% to 23%, compared with 0.6% in the general population.22 Risk factors associated with a higher incidence of HIV/AIDS in patients with schizophrenia are lack of knowledge about contracting HIV, unsafe sexual practices, prostitution, homosexuality, homelessness, and IV drug use.22
Managing HIV/AIDS.
- Educate the patient and family about risk factors associated with contracting HIV/AIDS.
- Educate patients about safe sex practices.
- All patients with schizophrenia should be screened for HIV because there is 10-fold higher HIV prevalence in schizophrenia compared with the general population.
- When HIV infection is diagnosed, facilitate referral to a HIV or infectious disease specialist for treatment.
- Educate the patient in whom HIV/AIDS has been diagnosed about the importance of (1) adherence to his (her) HIV medication regimen and (2) follow-up visits with an infectious disease practitioner and appropriate laboratory tests.
- Educate the patient’s family and significant other about the illness.
- Screen for and treat substance use.
- At each visit, inquire about the patient’s adherence to HIV medical therapy, viral load, and CD4 cell count.
Chronic obstructive pulmonary disease
Patients with schizophrenia are more likely to suffer from respiratory disease, such as chronic obstructive pulmonary disease (COPD) and asthma, compared with the general population.23 Smoking is a major risk factor for COPD. In a study by Dickerson et al,24 64% of people with schizophrenia were current smokers, compared with 19% of those without mental illness.
A high rate of smoking rate among people with schizophrenia suggests a “self-medication” hypothesis: That is, stimulation of CNS nicotinic cholinergic receptors treats the negative symptoms of schizophrenia and overcomes the dopamine blocking effects of antipsychotics.25 Among SGAs, only clozapine has a substantial body of evidence to support its association with decreased smoking behavior.
Managing COPD.
- Educate the patient and family about risk factors associated with COPD and smoking.
- Screen for tobacco use at each visit; try to increase motivation to quit smoking.
- Educate the patients and family about the value and availability of smoking cessation programs.
- Prescribe medication to help with smoking cessation when needed. Bupropion and varenicline have been shown to be effective in patients with schizophrenia; nicotine replacement therapies are safe and can be helpful.
- When treating a patient who is in the process of quitting, encourage and help him to maintain his commitment and enlist support from his family.
- Refer to an appropriate medical provider (primary care provider or pulmonologist) for a patient with an established or suspected diagnosis of COPD.
Cancer
Since 1909, when the Board of Control of the Commissioners in Lunacy for England and Wales noted the possibility of a decreased incidence in cancer among psychiatric patients, this connection has been a matter of controversy.26 Subsequent research has been equivocal; the prevalence of cancer has been reported to be either increased, similar, or decreased compared with the general population.26-28 Risk factors for cancer, including smoking, obesity, poor diet, sedentary lifestyle, and hyperprolactinemia, are more common among patients with schizophrenia.
Genetic factors and a possible protective effect from antipsychotics have been cited as potential causes of decreased prevalence. Clozapine is associated with an increased risk of leukemia. No conclusion can be drawn about the overall prevalence of cancer in schizophrenia.
Managing cancer in a patient with schizophrenia, however, poses a significant challenge29; he might lack capacity to make decisions about cancer treatment. The patient—or his surrogate decision-makers—need to carefully weigh current quality of life against potential benefits of treatment and risks of side effects. Adherence to complex, often toxic, therapies can be challenging for the patient with psychosis. Successful cancer treatment often requires close collaboration between the cancer treatment team and the patient’s support system, including the treating psychiatrist and case management teams.
Bottom Line
Patients with schizophrenia are at higher risk of developing comorbid medical
conditions because of the illness itself, lifestyle behaviors, genetics, and adverse
effects of medications. Because mental health clinicians focus attention on the
psychiatric and behavioral aspect of treatment, often there is delay in screening,
detecting, and treating medical comorbidities. This screening can be done in any
psychiatric practice, which can lead to timely management for those conditions
and preventing premature mortality in patients with schizophrenia.
1. Brown S, Inskip H, Barraclough B. Causes of the excess mortality of schizophrenia. Br J Psychiatry. 2000;177:212-217.
2. De Hert M, Correl CU, Bobes J, et al. Physical illness in patients with severe mental disorder. I. Prevalence, impact of medications, and disparities in health care. World Psychiatry. 2011;10(1):52-77.
3. Roger VL, Go AS, Lloyd-Jones DM, et al; American Heart Association Statistics Committee and Stroke Statistics Subcommittee. Heart disease and stroke statistics update-2011 update. Circulation. 2011;123(4):e18-e209. doi: 10.1161/CIR.0b013e3182009701.
4. Rosenberg SD, Goodman LA, Osher FC, et al. Prevalence of HIV, hepatitis B, and hepatitis C in people with severe mental illness. Am J Public Health. 2001;91(1):31-37.
5. Lovre D, Mauvais-Jarvis F. Trends in prevalence of the metabolic syndrome. JAMA. 2015;314(9):950.
6. Hennekens CH, Hennekens AR, Hollar D, et al. Schizophrenia and increased risks of cardiovascular disease. Am Heart J. 2005;150(6):1115-1121.
7. Bushe CJ, Taylor M, Haukka J. Mortality in schizophrenia: a measurable clinical point. J Psychopharmacol. 2010;24(suppl 4):17-25.
8. Nasrallah HA, Meyer JM, Goff DC, et al. Low rates of treatment for hypertension, dyslipidemia and diabetes in schizophrenia: data from the CATIE schizophrenia trial sample at baseline. Schizophr Res. 2006;86(1-3):15-22.
9. Allison DB, Fontaine KR, Heo M et al. The distribution of body mass index among individuals with and without schizophrenia. J Clin Psychiatry. 1999;60(4):215-220.
10. Allison DB, Mentore JL, Heo M, et al. Antipsychotic-induced weight gain: a comprehensive research synthesis. Am J Psychiatry. 1999;156(11):1686-1696.
11. Jarskog LF, Hamer RM, Catellier DJ, et al; METS Investigators. Metformin for weight loss and metabolic control in overweight outpatients with schizophrenia and schizoaffective disorder. Am J Psychiatry. 2013;170(9):1032-1040.
12. Ganguli R. Behavioral therapy for weight loss in patients with schizophrenia. J Clin Psychiatry. 2007;68(suppl 4):19-25.
13. Kohen D. Diabetes mellitus and schizophrenia: historical perspective. Br J Psychiatry Suppl. 2004;47:S64-S66.
14. Ryan MC, Flanagan S, Kinsella U, et al. The effects of atypical antipsychotics on visceral fat distribution in first episode, drug naïve patients with schizophrenia. Life Sci. 2004;74(16):1999-2008.
15. McEvoy JP, Meyer JM, Goff DC, et al. Prevalence of the metabolic syndrome in patients with schizophrenia: baseline results from the Clinical Antipsychotic Trials of Intervention Effectiveness (CATIE) schizophrenia trial and comparison with national estimates from NHANES III. Schizophr Res. 2005;80(1):19-32.
16. Barnett AH, Mackin P, Chaudhry I, et al. Minimising metabolic and cardiovascular risk in schizophrenia: diabetes, obesity and dyslipidaemia. J Psychopharmacol. 2007;21(4):357-373.
17. Meyer JM, Koro CE. The effects of antipsychotic therapy on serum lipids: a comprehensive review. Schizophr Res. 2004;70(1):1-17.
18. Sacks FM. Metabolic syndrome: epidemiology and consequences. J Clin Psychiatry. 2004;65(suppl 18):3-12.
19. De Hert M, Schreurs V, Vancampfort D, et al. Metabolic syndrome in people with schizophrenia: a review. World Psychiatry. 2009;8(1):15-22.
20. De Hert M, Hanssens L, Wampers M, et al. Prevalence and incidence rates of metabolic abnormalities and diabetes in a prospective study of patients treated with second-generation antipsychotics. Schizophr Bull. 2007;33:560.
21. Huckans M, Mitchell A, Pavawalla S, et al. The influence of antiviral therapy on psychiatric symptoms among patients with hepatitis C and schizophrenia. Antivir Ther. 2010;15(1):111-119.
22. Davidson S, Judd F, Jolley D, et al. Risk factors for HIV/AIDS and hepatitis C among the chronic mentally ill. Aust N Z J Psychiatry. 2001;35(2):203-209.
23. Copeland LA, Mortensen EM, Zeber JE, et al. Pulmonary disease among inpatient decendents: impact of schizophrenia. Prog Neuropsychopharmacol Biol Psychiatry. 2007;31(3):720-726.
24. Dickerson F, Stallings CR, Origoni AE, et al. Cigarette smoking among persons with schizophrenia or bipolar disorder in routine clinical settings, 1999-2011. Psychiatr Serv. 2013;64(1):44-50.
25. Dalack GW, Healy DJ, Meador-Woodruff JH. Nicotine dependence in schizophrenia: clinical phenomena and laboratory findings. Am J Psychiatry. 1998;155(11):1490-1501.
26. Hodgson R, Wildgust HJ, Bushe CJ. Cancer and schizophrenia: is there a paradox? J Psychopharmacol. 2010;24(suppl 4):51-60.
27. Hippisley-Cox J, Vinogradova Y, Coupland C, et al. Risk of malignancy in patients with schizophrenia or bipolar disorder: nested case-control study. Arch Gen Psychiatry. 2007;64(12):1368-1376.
28. Grinshpoon A, Barchana M, Ponizovsky A, et al. Cancer in schizophrenia: is the risk higher or lower? Schizophr Res. 2005;73(2-3):333-341.
29. Hwang M, Farasatpour M, Williams CD, et al. Adjuvant chemotherapy for breast cancer patients with schizophrenia. Oncol Lett. 2012;3(4):845-850.
Life expectancy for both males and females has been increasing over the past several decades to an average of 76 years. However, the life expectancy among individuals with schizophrenia in the United States is 61 years—a 20% reduction.1 Patients with schizophrenia are known to be at increased risk of several comorbid medical conditions, such as type 2 diabetes mellitus (T2DM), coronary artery disease, and digestive and liver disorders, compared with healthy people (Figure, page 32).2-5 This risk may be heightened by several factors, including sedentary lifestyle, a high rate of cigarette use, poor self-management skills, homelessness, and poor diet.
Although substantial attention is paid to the psychiatric and behavioral management of schizophrenia, many barriers impede the detection and treatment of patients’ medical conditions, which have been implicated in excess unforeseen deaths. Patients with schizophrenia might experience delays in diagnosis, leading to more acute comorbidity at time of diagnosis and premature mortality
Cardiovascular disease is the leading cause of death among psychiatric patients.6 Key risk factors for cardiovascular disease include smoking, obesity, hypertension, dyslipidemia, diabetes, and lack of physical activity, all of which are more prevalent among patients with schizophrenia.7 In addition, antipsychotics are associated with adverse metabolic effects.8 In general, smoking and obesity are the most modifiable and preventable risk factors for many medical conditions, such as cardiovascular disease, hyperlipidemia, diabetes, and many forms of cancer (Table 1).
In this article, we discuss how to manage common medical comorbidities in patients with schizophrenia. Comprehensive management for all these medical conditions in this population is beyond the scope of this article; we limit ourselves to discussing (1) how common these conditions are in patients with schizophrenia compared with the general population and (2) what can be done in psychiatric practice to manage these medical comorbidities (Box).
Obesity
Obesity—defined as body mass index (BMI) of >30—is common among patients with schizophrenia. The condition leads to poor self-image, decreased treatment adherence, and an increased risk of many chronic medical conditions (Table 1). Being overweight or obese can increase stigma and social discrimination, which will undermine self-esteem and, in turn, affect adherence with medications, leading to relapse.
The prevalence of obesity among patients with schizophrenia is almost double that of the general population9 (Figure2-5). Several factors predispose these patients to overweight or obese, including sedentary lifestyle, lack of exercise, a high-fat diet, medications side effects, and genetic factors. Recent studies report the incidence of weight gain among patients treated with antipsychotics is as high as 80%10 (Table 2).
Mechanisms involved in antipsychotic-induced weight gain are not completely understood, but antagonism of serotonergic (5-HT2C, 5-HT1A), histamine (H1), dopamine (D2), muscarinic, and other receptors are involved in modulation of food intake. Decreased energy expenditure also has been blamed for antipsychotic-induced weight gain.10
Pharmacotherapy and bariatric surgery can be as effective among patients with schizophrenia as they are among the general population. Maintaining a BMI of <25 kg/m2 lowers the risk of cardiovascular disease by 35% to 55%.6 Metformin has modest potential for offsetting weight gain and providing some metabolic control in overweight outpatients with schizophrenia,11 and should be considered early when treating at-risk patients.
Managing obesity. Clinicians can apply several measures to manage obesity in a patient with schizophrenia:
- Educate the patient, and the family, about the risks of being overweight or obese.
- Monitor weight and BMI at each visit.
- Advise smoking cessation.
- When clinically appropriate, switch to an antipsychotic with a lower risk of weight gain—eg, from olanzapine or high-dose quetiapine to a high- or medium-potency typical antipsychotic (eg, haloperidol, perphenazine), ziprasidone, aripiprazole, iloperidone, and lurasidone (Table 2, page 36).
- Consider prophylactic use of metformin with an antipsychotic; the drug has modest potential for offsetting weight gain and providing better metabolic control in an overweight patient with schizophrenia.11
- Encourage the patient to engage in modest physical activity; for example, a 20-minute walk, every day, reduces the risk of cardiovascular disease by 35% to 55%.6
- Recommend a formal lifestyle modification program, such as behavioral group-based treatment for weight reduction.12
- Refer the patient and family to a dietitian.
Type 2 diabetes mellitus
There is strong association between T2DM and schizophrenia that is related to abnormal glucose regulation independent of any adverse medication effect.13 Ryan et al14 reported that first-episode, drug-naïve patients with schizophrenia had a higher level of intra-abdominal fat than age- and BMI-matched healthy controls, suggesting that schizophrenia could be associated with changes in adiposity that might increase the risk of insulin resistance, hyperlipidemia, and dyslipidemia. Mechanisms that increase the risk of T2DM in schizophrenia include genetic and environmental factors, such as family history, lack of physical activity, and poor diet.
Diagnosis. All patients with schizophrenia should be evaluated for undiagnosed diabetes. The diagnosis of T2DM is made by documenting:
- a fasting plasma glucose reading of ≥126 mg/dL
- symptoms of T2DM, along with a random plasma glucose reading of ≥200 mg/dL
- 2-hour reading of a plasma glucose level >200 mg/dL on an oral glucose tolerance test.
Recent guidelines also suggest using a hemoglobin A1c value cutoff of ≥6.5% to diagnose T2DM.
In the Clinical Antipsychotic Trials of Intervention Effectiveness (CATIE) study, 38% of patients with schizophrenia and diabetes were not receiving any treatment for T2DM.15
Risk factors for T2DM are:
- BMI >25
- a first-degree relative with diabetes
- lack of physical activity
- being a member of a high-risk ethnic group (African American, Hispanic American, Native American, Asian American, or Pacific Islander)
- having delivered a baby >9 lb or having had gestational diabetes
- hypertension
- high-density lipoprotein (HDL) cholesterol level of ≤35 mg/dL
- triglyceride level of ≥250 mg/dL
- history of an abnormal glucose tolerance test
- history of abnormal findings on a fasting plasma glucose test
- history of vascular disease.
Early detection and management.
- Educate the patient and family about signs and symptoms of T2DM, such as polyuria, nocturia, polydipsia, fatigue, visual disturbances, and (in women) vulvitis. Also, psychiatrists should be aware of, and inquire about, symptoms of diabetic ketoacidosis.
- At the start of therapy with any antipsychotic, particularly a second-generation antipsychotic (SGA), ask patients about a family history of diabetes and measure the hemoglobin A1c value.
- Monitor the hemoglobin A1c level 4 months after starting an antipsychotic, then annually, in a patient with significant risk factors for diabetes.
- Monitor blood glucose every 6 months in patients with no change from initial results and more frequently in those with significant risk factors for diabetes and those who gain weight.
- Order a lipid panel and measure the serum glucose level to rule out dyslipidemia and diabetes, because a patient with high lipid levels and diabetes is at higher risk of developing cardiovascular conditions.
- Advocate for smoking cessation.
- Switch to an antipsychotic with a lower risk of diabetes when clinically appropriate, such as switching a patient from olanzapine or high-dose quetiapine to a high- or medium-potency typical antipsychotic (such as haloperidol or perphenazine), ziprasidone, aripiprazole, iloperidone, and lurasidone (Table 2).
- Consider prophylactic use of metformin along with antipsychotics. Metformin has been used to improve insulin sensitivity and can lead to weight loss in diabetic and non-diabetic patients. The drug has modest potential for offsetting weight gain and providing better metabolic control in overweight outpatients with schizophrenia.11 Metformin is simple to use, does not lead to hypoglycemia, does not require serum glucose monitoring, and has a favorable safety profile.11
- Educate the patient about modest physical activity. For example, a 20-minute walk every day reduces the risk of cardiovascular disease by 35% to 55%.6
- Refer the patient to a dietitian to develop an appropriate diet plan.
- When diabetes is diagnosed, ensure appropriate follow-up and initiation or continuation of therapy with a general practitioner or an endocrinologist.
- Reinforce the need for ongoing follow-up and compliance with therapy for diabetes.
Hyperlipidemia and dyslipidemia
Elevated cholesterol and triglyceride levels are associated with cardiovascular diseases, such as ischemic heart disease and myocardial infarction. A 10% increase in cholesterol levels is associated with a 20% to 30% increase in the risk of coronary artery disease; lowering cholesterol by 10% decreases the risk by 20% to 30%.16 Triglyceride levels ≥250 mg/dL are associated with 2-fold higher risk of cardiovascular disease.16
The incidence of dyslipidemia is not as well studied as diabetes in patients with schizophrenia. There is increased prevalence of dyslipidemia in patients with schizophrenia compared with the general population because of obesity, lack of physical activity, and poor dietary habits.16
Data regarding the effects of first-generation antipsychotics (FGAs) on lipid levels are limited, but high-potency drugs, such as haloperidol, seem to carry a lower risk of hyperlipidemia than low-potency drugs, such as chlorpromazine and thioridazine.17 A comprehensive review on the effects of SGAs on plasma lipid levels suggested that clozapine, olanzapine, and quetiapine are associated with a higher risk of dyslipidemia17 (Table 2).
In the CATIE study, olanzapine and clozapine were associated with a greater increase in the serum level of cholesterol and triglycerides compared with other antipsychotics, even after adjusting for treatment duration. Furthermore, a retrospective chart review of patients who switched to aripiprazole from other SGAs showed a decrease in levels of total cholesterol and low-density lipoprotein cholesterol15 (Table 2).
Patients with schizophrenia are more likely to have dyslipidemia go undiagnosed, and therefore are less likely to be treated for the disorder. In the CATIE study, 88% of patients with dyslipidemia were not receiving any treatment.15
Management for dyslipidemia.
- Educate the patient and family about risks involved with dyslipidemia.
- Monitor weight and BMI at each visit.
- Monitor lipids to rule out dyslipidemia. Obtain a pretreatment fasting or random lipid profile for any patient receiving an antipsychotic; repeat at least every 6 months after starting the antipsychotic.
- Counsel the patient to quit smoking.
- Switch to an antipsychotic with lower risk of weight gain and dyslipidemia, such as switching from olanzapine or high-dose quetiapine to high- or medium-potency typical antipsychotics (such as, haloperidol or perphenazine), ziprasidone, aripiprazole, iloperidone, and lurasidone (Table 2).
- Educate and encourage the patient about modest physical activity. For example, a 20-minute walk everyday will reduce cardiovascular disease risk by 35% to 55%.6
- Refer to a dietitian if indicated.
- Ensure follow-up and initiation of treatment with a general practitioner.
- Educate and encourage the patient about modest physical activity. For example, a 20-minute walk everyday will reduce cardiovascular disease risk by 35% to 55%.
Metabolic syndrome
Metabolic syndrome is cluster of cardiovascular risk factors, including central adiposity, hyperglycemia, dyslipidemia, and hypertension. The National Cholesterol Education Program’s Adult Treatment Panel III report defines metabolic syndrome as the presence of 3 of 5 of the following factors:
- abdominal obesity (waist circumference of >40 inches in men, or >35 inches in women)
- triglyceride level, >150 mg/dL
- HDL cholesterol, <40 mg/dL in men and <50 mg/dL in women
- blood pressure, >130/85 mm Hg
- fasting plasma glucose level, >110 mg/dL.
The presence of metabolic syndrome in the general population is a strong predictor of cardiovascular diseases and diabetes.18 The adverse effects of metabolic syndrome are thought to relate to atherogenic dyslipidemia, higher blood pressure, insulin resistance with or without glucose intolerance, a proinflammatory state, and a prothrombotic state.
The prevalence of metabolic syndrome in patients with schizophrenia is 2- to 3-fold higher than the general population.19 In the CATIE study, approximately one-third of patients met criteria for metabolic syndrome at baseline.15 In a prospective study, De Hert et al20 reported that patients who were started on a SGA had more than twice the rate of developing metabolic syndrome compared with those treated with a FGA (Table 2). Other possible causes of metabolic syndrome are visceral adiposity and insulin resistance.16Management of the metabolic syndrome involves addressing the individual components that have been described in the preceding sections on T2DM and dyslipidemia.
Hepatitis C
Hepatitis C virus (HCV) infection is thought to be the most common blood-borne illness, with an estimated prevalence of 1% of the U.S. population. Some studies suggest that as many as 16% of people with schizophrenia have HCV infection.4 Risk factors for HCV infection include unsafe sexual practices, prostitution, homosexuality, homelessness, and IV drug use.
HCV treatments typically have involved regimens with interferon alfa, which is associated with significant neuropsychiatric side effects, including depression and suicide. There is a dearth of research on treatment of HCV in patients with schizophrenia; however, at least 1 study suggests that there was no increase in psychiatric symptoms in patients treated with interferon-containing regimens.21 There is even less evidence to guide the use of newer, non-interferon–based HCV treatment regimens that are better tolerated and have a higher response rate in the general population; there is reason, however, to be hopeful about their potential in patients with schizophrenia and HCV infection.
Managing HCV infection.
- Educate the patients and family about risk factors associated with contracting HCV.
- Screen for HCV infection in patients with schizophrenia because there is higher prevalence of HCV in these patients compared with the general population.
- When HCV infection is diagnosed, educate the patients and family about available treatments.
- Facilitate referral to an HCV specialist for appropriate treatment.
HIV/AIDS
HIV infection is highly prevalent among people suffering from severe mental illness such as schizophrenia. The incidence of HIV/AIDS in patients with schizophrenia is estimated to be 4% to 23%, compared with 0.6% in the general population.22 Risk factors associated with a higher incidence of HIV/AIDS in patients with schizophrenia are lack of knowledge about contracting HIV, unsafe sexual practices, prostitution, homosexuality, homelessness, and IV drug use.22
Managing HIV/AIDS.
- Educate the patient and family about risk factors associated with contracting HIV/AIDS.
- Educate patients about safe sex practices.
- All patients with schizophrenia should be screened for HIV because there is 10-fold higher HIV prevalence in schizophrenia compared with the general population.
- When HIV infection is diagnosed, facilitate referral to a HIV or infectious disease specialist for treatment.
- Educate the patient in whom HIV/AIDS has been diagnosed about the importance of (1) adherence to his (her) HIV medication regimen and (2) follow-up visits with an infectious disease practitioner and appropriate laboratory tests.
- Educate the patient’s family and significant other about the illness.
- Screen for and treat substance use.
- At each visit, inquire about the patient’s adherence to HIV medical therapy, viral load, and CD4 cell count.
Chronic obstructive pulmonary disease
Patients with schizophrenia are more likely to suffer from respiratory disease, such as chronic obstructive pulmonary disease (COPD) and asthma, compared with the general population.23 Smoking is a major risk factor for COPD. In a study by Dickerson et al,24 64% of people with schizophrenia were current smokers, compared with 19% of those without mental illness.
A high rate of smoking rate among people with schizophrenia suggests a “self-medication” hypothesis: That is, stimulation of CNS nicotinic cholinergic receptors treats the negative symptoms of schizophrenia and overcomes the dopamine blocking effects of antipsychotics.25 Among SGAs, only clozapine has a substantial body of evidence to support its association with decreased smoking behavior.
Managing COPD.
- Educate the patient and family about risk factors associated with COPD and smoking.
- Screen for tobacco use at each visit; try to increase motivation to quit smoking.
- Educate the patients and family about the value and availability of smoking cessation programs.
- Prescribe medication to help with smoking cessation when needed. Bupropion and varenicline have been shown to be effective in patients with schizophrenia; nicotine replacement therapies are safe and can be helpful.
- When treating a patient who is in the process of quitting, encourage and help him to maintain his commitment and enlist support from his family.
- Refer to an appropriate medical provider (primary care provider or pulmonologist) for a patient with an established or suspected diagnosis of COPD.
Cancer
Since 1909, when the Board of Control of the Commissioners in Lunacy for England and Wales noted the possibility of a decreased incidence in cancer among psychiatric patients, this connection has been a matter of controversy.26 Subsequent research has been equivocal; the prevalence of cancer has been reported to be either increased, similar, or decreased compared with the general population.26-28 Risk factors for cancer, including smoking, obesity, poor diet, sedentary lifestyle, and hyperprolactinemia, are more common among patients with schizophrenia.
Genetic factors and a possible protective effect from antipsychotics have been cited as potential causes of decreased prevalence. Clozapine is associated with an increased risk of leukemia. No conclusion can be drawn about the overall prevalence of cancer in schizophrenia.
Managing cancer in a patient with schizophrenia, however, poses a significant challenge29; he might lack capacity to make decisions about cancer treatment. The patient—or his surrogate decision-makers—need to carefully weigh current quality of life against potential benefits of treatment and risks of side effects. Adherence to complex, often toxic, therapies can be challenging for the patient with psychosis. Successful cancer treatment often requires close collaboration between the cancer treatment team and the patient’s support system, including the treating psychiatrist and case management teams.
Bottom Line
Patients with schizophrenia are at higher risk of developing comorbid medical
conditions because of the illness itself, lifestyle behaviors, genetics, and adverse
effects of medications. Because mental health clinicians focus attention on the
psychiatric and behavioral aspect of treatment, often there is delay in screening,
detecting, and treating medical comorbidities. This screening can be done in any
psychiatric practice, which can lead to timely management for those conditions
and preventing premature mortality in patients with schizophrenia.
1. Brown S, Inskip H, Barraclough B. Causes of the excess mortality of schizophrenia. Br J Psychiatry. 2000;177:212-217.
2. De Hert M, Correl CU, Bobes J, et al. Physical illness in patients with severe mental disorder. I. Prevalence, impact of medications, and disparities in health care. World Psychiatry. 2011;10(1):52-77.
3. Roger VL, Go AS, Lloyd-Jones DM, et al; American Heart Association Statistics Committee and Stroke Statistics Subcommittee. Heart disease and stroke statistics update-2011 update. Circulation. 2011;123(4):e18-e209. doi: 10.1161/CIR.0b013e3182009701.
4. Rosenberg SD, Goodman LA, Osher FC, et al. Prevalence of HIV, hepatitis B, and hepatitis C in people with severe mental illness. Am J Public Health. 2001;91(1):31-37.
5. Lovre D, Mauvais-Jarvis F. Trends in prevalence of the metabolic syndrome. JAMA. 2015;314(9):950.
6. Hennekens CH, Hennekens AR, Hollar D, et al. Schizophrenia and increased risks of cardiovascular disease. Am Heart J. 2005;150(6):1115-1121.
7. Bushe CJ, Taylor M, Haukka J. Mortality in schizophrenia: a measurable clinical point. J Psychopharmacol. 2010;24(suppl 4):17-25.
8. Nasrallah HA, Meyer JM, Goff DC, et al. Low rates of treatment for hypertension, dyslipidemia and diabetes in schizophrenia: data from the CATIE schizophrenia trial sample at baseline. Schizophr Res. 2006;86(1-3):15-22.
9. Allison DB, Fontaine KR, Heo M et al. The distribution of body mass index among individuals with and without schizophrenia. J Clin Psychiatry. 1999;60(4):215-220.
10. Allison DB, Mentore JL, Heo M, et al. Antipsychotic-induced weight gain: a comprehensive research synthesis. Am J Psychiatry. 1999;156(11):1686-1696.
11. Jarskog LF, Hamer RM, Catellier DJ, et al; METS Investigators. Metformin for weight loss and metabolic control in overweight outpatients with schizophrenia and schizoaffective disorder. Am J Psychiatry. 2013;170(9):1032-1040.
12. Ganguli R. Behavioral therapy for weight loss in patients with schizophrenia. J Clin Psychiatry. 2007;68(suppl 4):19-25.
13. Kohen D. Diabetes mellitus and schizophrenia: historical perspective. Br J Psychiatry Suppl. 2004;47:S64-S66.
14. Ryan MC, Flanagan S, Kinsella U, et al. The effects of atypical antipsychotics on visceral fat distribution in first episode, drug naïve patients with schizophrenia. Life Sci. 2004;74(16):1999-2008.
15. McEvoy JP, Meyer JM, Goff DC, et al. Prevalence of the metabolic syndrome in patients with schizophrenia: baseline results from the Clinical Antipsychotic Trials of Intervention Effectiveness (CATIE) schizophrenia trial and comparison with national estimates from NHANES III. Schizophr Res. 2005;80(1):19-32.
16. Barnett AH, Mackin P, Chaudhry I, et al. Minimising metabolic and cardiovascular risk in schizophrenia: diabetes, obesity and dyslipidaemia. J Psychopharmacol. 2007;21(4):357-373.
17. Meyer JM, Koro CE. The effects of antipsychotic therapy on serum lipids: a comprehensive review. Schizophr Res. 2004;70(1):1-17.
18. Sacks FM. Metabolic syndrome: epidemiology and consequences. J Clin Psychiatry. 2004;65(suppl 18):3-12.
19. De Hert M, Schreurs V, Vancampfort D, et al. Metabolic syndrome in people with schizophrenia: a review. World Psychiatry. 2009;8(1):15-22.
20. De Hert M, Hanssens L, Wampers M, et al. Prevalence and incidence rates of metabolic abnormalities and diabetes in a prospective study of patients treated with second-generation antipsychotics. Schizophr Bull. 2007;33:560.
21. Huckans M, Mitchell A, Pavawalla S, et al. The influence of antiviral therapy on psychiatric symptoms among patients with hepatitis C and schizophrenia. Antivir Ther. 2010;15(1):111-119.
22. Davidson S, Judd F, Jolley D, et al. Risk factors for HIV/AIDS and hepatitis C among the chronic mentally ill. Aust N Z J Psychiatry. 2001;35(2):203-209.
23. Copeland LA, Mortensen EM, Zeber JE, et al. Pulmonary disease among inpatient decendents: impact of schizophrenia. Prog Neuropsychopharmacol Biol Psychiatry. 2007;31(3):720-726.
24. Dickerson F, Stallings CR, Origoni AE, et al. Cigarette smoking among persons with schizophrenia or bipolar disorder in routine clinical settings, 1999-2011. Psychiatr Serv. 2013;64(1):44-50.
25. Dalack GW, Healy DJ, Meador-Woodruff JH. Nicotine dependence in schizophrenia: clinical phenomena and laboratory findings. Am J Psychiatry. 1998;155(11):1490-1501.
26. Hodgson R, Wildgust HJ, Bushe CJ. Cancer and schizophrenia: is there a paradox? J Psychopharmacol. 2010;24(suppl 4):51-60.
27. Hippisley-Cox J, Vinogradova Y, Coupland C, et al. Risk of malignancy in patients with schizophrenia or bipolar disorder: nested case-control study. Arch Gen Psychiatry. 2007;64(12):1368-1376.
28. Grinshpoon A, Barchana M, Ponizovsky A, et al. Cancer in schizophrenia: is the risk higher or lower? Schizophr Res. 2005;73(2-3):333-341.
29. Hwang M, Farasatpour M, Williams CD, et al. Adjuvant chemotherapy for breast cancer patients with schizophrenia. Oncol Lett. 2012;3(4):845-850.

Chronic pain and depression: Treatment of 2 culprits in common
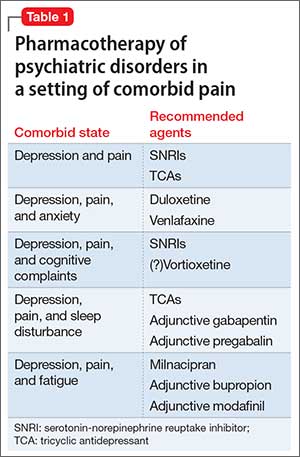
Patients who have chronic pain and those with a major depressive disorder (MDD) share clinical features, including fatigue, cognitive complaints, and functional limitation. Sleep disturbance and anxiety are common with both disorders. Because pain and depression share common neurobiological pathways (see Part 1 of this article in the February 2016 issue and at CurrentPsychiatry.com) and clinical manifestations, you can use similar strategies and, often, the same agents to treat both conditions when they occur together (Table 1).
What are the medical options?
Antidepressants. Using an antidepressant to treat chronic pain is a common practice in primary care and specialty practice. Antidepressants that modulate multiple neurotransmitters appear to be more efficacious than those with a single mechanism of action.1 Convergent evidence from preclinical and clinical studies supports the use of serotonin-norepinephrine reuptake inhibitors (SNRIs) as more effective analgesic agents, compared with the mostly noradrenergic antidepressants, which, in turn, are more effective than selective serotonin reuptake inhibitors (SSRIs).2 The mechanism of the analgesic action of antidepressants appears to rely on their inhibitory effects of norepinephrine and serotonin reuptake, thereby elevating the performance of endogenous descending pain regulatory pathways.3
Tricyclic antidepressants (TCAs), primarily amitriptyline, nortriptyline, and desipramine, have the advantage of years of clinical experience and low cost. Their side effect burden, however, is higher, especially in geriatric patients. Dose-dependent side effects include sedation, constipation, dry mouth, urinary retention, and orthostatic hypotension.
TCAs must be used with caution in patients with suicidal ideation because of the risk of a potentially lethal intentional overdose.
The key to using a TCA is to start with a low dosage, followed by slow titration. Typically, the dosages of TCAs used in clinical trials that focused on pain have been lower (25 to 100 mg/d of amitriptyline or equivalent) than the dosage typically necessary for treating depression; however, some experts have found that titrating TCAs to higher dosages with an option of monitoring serum levels may benefit some patients.4
SNRIs are considered first-line agents for both neuropathic pain and fibromyalgia. Duloxetine has been shown to be effective in both conditions5; venlafaxine also has shown efficacy in neuropathic pain.6 Milnacipran, another SNRI that blocks 5-HT, and norepinephrine equally and exerts a mild N-methyl-D-aspartate inhibition, has proven efficacy in fibromyalgia.7,8
SSRIs for alleviating central pain or neuropathic pain are supported by minimal evidence only.9 A review of the effectiveness of various antidepressants on pain in diabetic neuropathy concluded that fluoxetine was no more effective than placebo.10,11 Schreiber and Pick11 evaluated the antinociceptive properties of several SSRIs and offered the opinion that fluoxetine, fluvoxamine, and citalopram were, at best, weak antinociceptors.
Opioids. Data on the long-term benefits of opioids are limited, except for use in carefully selected patients; in any case, risk of abuse, diversion, and even death with these agents is quite high.12 Also, there is evidence that opioid-induced hyperalgesia might limit the usefulness of opioids for controlling chronic pain.13
Gabapentin and pregabalin, both anticonvulsants, act by binding to the α-2-σ subunit of voltage-gated calcium channels within the CNS.14 By reducing calcium influx at nerve terminals, the drugs diminish the release of several neurotransmitters, including glutamate, noradrenaline, and substance P. This mechanism is thought to be the basis for the analgesic, anticonvulsant, and anxiolytic effects of these drugs.15
Gabapentin and pregabalin have been shown to decrease pain intensity and improve quality of life and function in patients with neuropathic pain conditions. Pregabalin also has shown efficacy in treating central neuropathic pain and fibromyalgia.16
Added benefits of these drugs is that they have (1) a better side effect profile than TCAs and (2) fewer drug interactions when they are used as a component of combination therapy. Pregabalin has the additional advantage of less-frequent dosing, linear pharmacokinetics, and a predictable dose-response relationship.17
Addressing other comorbid psychiatric conditions
Sleep disturbance is common among patients with chronic pain. Sleep deprivation causes a hyperexcitable state that amplifies the pain response.18
When a patient presents with chronic pain, depression, and disturbed sleep, consider using a sedating antidepressant, such as a TCA. Alternatively, gabapentin or pregabalin can be added to an SNRI; anticonvulsants have been shown to improve quality of sleep.19 Cognitive-behavioral interventions targeting sleep disturbance may be a helpful adjunct in these patients.20
When anxiety is comorbid with chronic pain, antidepressants with proven efficacy in treating anxiety disorders, such as duloxetine or venlafaxine, can be used. When chronic pain coexists with a specific anxiety disorder (social anxiety disorder, obsessive-compulsive disorder, panic disorder), an SSRI might be more advantageous than an SNRI,21 especially if it is combined with a more efficacious analgesic.
Benzodiazepines should be avoided as a routine treatment for comorbid anxiety and pain, because these agents can produce sedation and cognitive interference, and carry the potential for dependence.
Fatigue. In patients who, in addition to pain and depression, complain of fatigue, an activating agent such as milnacipran or adjunct bupropion might be preferable to other agents. Modafinil has been shown to be a well-tolerated and potentially effective augmenting agent for antidepressants when fatigue and sleepiness are present as residual symptoms22; consider them as adjuncts when managing patients who have chronic pain and depression that manifests as excessive sleepiness and/or fatigue.
Cognitive complaints. We have noted that disturbances of cognition are common in patients with depression and chronic pain, and that cognitive dysfunction might improve after antidepressant treatment.
Studies suggest that SSRIs, duloxetine, and other antidepressants, such as bupropion, might exert a positive effect on learning, memory, and executive function in depressed patients.23 Beneficial effects of antidepressants may be “pseudo-specific,” however—that is, predominantly a reflection of overall improvement in mood, not on specific amelioration of the cognitive disturbance.
Vortioxetine has shown promise in improving cognitive function in adults with MDD; its cognitive benefits are largely independent of its antidepressant effect.24 The utility of vortioxetine in chronic pain patients has not been studied, but its positive impact on mood, anxiety, sleep, and cognition might make it a consideration for patients with comorbid depression—although it is uncertain at this time whether putative noradrenergic activity makes it suitable for use in chronic pain disorders.
Last, avoid TCAs in patients who have cognitive complaints. These agents have anticholinergic effects that can have an adverse impact on cognitive function.
Cautions: Drug−drug interactions, suicide risk, disrupted sleep
Avoiding drug−drug interactions is an important consideration when treating comorbid disorders. Many chronic pain patients take over-the-counter or prescribed nonsteroidal anti-inflammatory drugs for analgesia; these agents can increase the risk of gastrointestinal bleeding when they are combined with an SSRI or an SNRI.
The use of the opioid tramadol with an SNRI or a TCA is discouraged because of the risk of serotonin syndrome.
Combining a sedating antidepressant, such as a TCA, with gabapentin or pregabalin can increase the risk of CNS depression and psychomotor impairment, especially in geriatric patients. An opioid analgesic is likely to amplify these effects.
Suicidal ideation is not uncommon in patients with chronic pain and depression. To minimize the risk of suicide in patients with a chronic pain disorder, you should ensure optimal pain control by combining the most efficacious analgesic agent with psychotherapeutic interventions and optimal antidepressant treatment. Furthermore, cognitive-behavioral therapy (CBT) (see the discussion below) might not only improve pain coping skills, but also ameliorate catastrophizing, anxiety, and concomitant sleep disturbance.
Complaints of sleep disturbance and anxiety can compound the risk of suicide in a chronic pain patient. When possible, these complex patients should be treated by a multidisciplinary team that includes a pain management specialist, psychotherapist, and primary care clinician. It is important to strengthen the clinician−patient relationship to facilitate close monitoring of symptoms and to provide a trusting environment in which patients feel free to discuss thoughts of suicide or self-harm. For such patients, prescribing opiates and TCAs in small quantities is a prudent action.
When a patient struggles with suicidal thoughts, his (her) family might need to dispense these medications. Most important, if a patient is actively suicidal, consider referral to an inpatient facility or intensive outpatient program, where aggressive treatment of depressive symptoms and intensive monitoring and support can be provided.25
Usefulness of non-drug interventions
There is, of course, a diversity of non-drug treatments for MDD and for chronic pain; discussion here focuses primarily on modalities with established efficacy in both disease states (Table 2). On rare occasions, non-drug treatments can constitute a stand-alone approach; most often, they are incorporated into a multimodal treatment plan or applied as an adjunct intervention.26
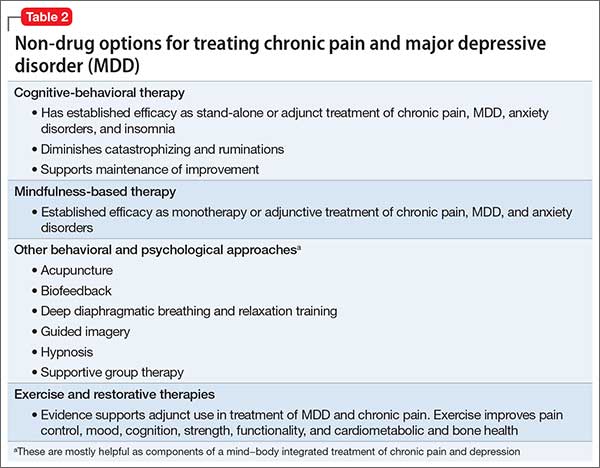
Psychotherapy. The most robust evidence supports the use of CBT in addressing MDD and chronic pain—occurring individually and comorbidly.26-28 Efficacy is well established in MDD, as monotherapy and adjunct treatment, spanning acute and maintenance phases.
Furthermore, CBT also has support from randomized trials, meta-analyses, and treatment guidelines, either as monotherapy or co-therapy for both short-term relief and long-term pain reduction. Additionally, CBT has demonstrated value for relieving pain-related disability.26,28
Combination of a special form of CBT, rumination-focused CBT with ongoing pharmacological therapy over a 26-week period in a group of medication-refractory MDD patients produced a remission rate of 62%, compared with 21% in a treatment-as-usual group.29 This is of particular interest in chronic pain patients, because rumination-related phenomena of pain catastrophizing and avoidance facilitate a transition from acute to chronic pain, while augmenting pain severity and associated disability.30
Catastrophizing also has been implicated in mediating the relationship between pain and sleep disturbance. Not surprisingly, a randomized controlled study demonstrated the benefit of 8-week, Internet-delivered CBT in patients suffering from comorbid chronic pain, depression, and anxiety. Treatment significantly diminished pain catastrophizing, depression, and anxiety; maintenance of improvement was demonstrated after 1 year of follow-up.31
Other behavioral and psychological approaches. Biofeedback, mindfulness-based stress reduction, relaxation training and diaphragmatic breathing, guided imagery, hypnosis, and supportive groups might play an important role as components of an integrated mind−body approach to chronic pain,28,32,33 while also providing mood benefits.
Exercise. The role of exercise as a primary treatment of MDD continues to be controversial, but its benefits as an add-on intervention are indisputable. Exercise not only complements pharmacotherapy to produce greater reduction in depressive scores and improvement in quality of life, it might aid in reestablishing social contacts when conducted in a group setting—an effect that can be of great value in both MDD and chronic pain.34
Exercise and restorative therapies provide several benefits for chronic pain patients, including:
- improved pain control, cognition, and mood
- greater strength and endurance
- cardiovascular and metabolic benefits
- improved bone health and functionality.26,28,32,33,35
To achieve optimal benefit, an exercise program must be customized to fit the patient’s physical condition, level of fitness, and specific type of pain.35 Preliminary evidence suggests that, beyond improvement in pain and functionality, exercise might reduce depressive symptoms in chronic pain patients.36
1. Sharp J, Keefe B. Psychiatry in chronic pain: a review and update. Curr Psychiatry Rep. 2005;7(3):213-219.
2. Fishbain DA. Polypharmacy treatment approaches to the psychiatric and somatic comorbidities found in patients with chronic pain. Am J Phys Med Rehabil. 2005;84(suppl 3):S56-S63.
3. Schug SA, Goddard C. Recent advances in the pharmacological management of acute and chronic pain. Ann Palliat Med. 2014;3(4):263-275.
4. Kroenke K, Krebs EE, Bair MJ. Pharmacotherapy of chronic pain: a synthesis of recommendations from systematic reviews. Gen Hosp Psychiatry. 2009;31(3):206-219.
5. Lunn MP, Hughes RA, Wiffen PJ. Duloxetine for treating painful neuropathy, chronic pain or fibromyalgia. Cochrane Database Syst Rev. 2014;1:CD007115. doi: 10.1002/14651858.CD007115.pub3.
6. Rowbotham MC, Goli V, Kunz NR, et al. Venlafaxine extended release in the treatment of painful diabetic neuropathy: a double-blind, placebo-controlled study. Pain. 2004;110(3):697-706.
7. Kranzler JD, Gendreau JF, Rao SG. The psychopharmacology of fibromyalgia: a drug development perspective. Psychopharmacol Bull. 2002;36(1):165-213.
8. Pae CU, Marks DM, Shah M, et al. Milnacipran: beyond a role of antidepressant. Clin Neuropharmacol. 2009;32(6):355-363.
9. Depression and pain. J Clin Psychiatry. 2008;69(12):1970-1978.
10. Max MB, Lynch SA, Muir J, et al. Effects of desipramine, amitriptyline, and fluoxetine on pain in diabetic neuropathy. N Engl J Med. 1992;326(19):1250-1256.
11. Schreiber S, Pick CG. From selective to highly selective SSRIs: a comparison of the antinociceptive properties of fluoxetine, fluvoxamine, citalopram and escitalopram. Eur Neuropsychopharmacol. 2006;16(6):464-468.
12. Freynhagen R, Geisslinger G, Schug SA. Opioids for chronic non-cancer pain. BMJ. 2013;346:f2937. doi: 10.1136/bmj.f2937.
13. Silverman SM. Opioid induced hyperalgesia: clinical implications for the pain practitioner. Pain Physician. 2009;12(3):679-684.
14. Bauer CS, Nieto-Rostro M, Rahman W, et al. The increased trafficking of the calcium channel subunit α2σ-1 to presynaptic terminals in neuropathic pain is inhibited by the α2σ ligand pregabalin. J Neurosci. 2009;29(13):4076-4088.
15. Dooley DJ, Taylor CP, Donevan S, et al. Ca2+ channel α2σ ligands: novel modulators of neurotransmission [Erratum in: Trends Pharmacol Sci. 2007;28(4):151]. Trends Pharmacol Sci. 2007;28(2):75-82.
16. Wiffen PJ, Derry S, Moore RA, et al. Antiepileptic drugs for neuropathic pain and fibromyalgia - an overview of Cochrane reviews. Cochrane Database Syst Rev. 2013;11:CD010567. doi: 10.1002/14651858.CD010567.pub2.
17. Finnerup NB, Otto M, Jensen TS, et al. An evidence-based algorithm for the treatment of neuropathic pain. MedGenMed. 2007;9(2):36.
18. Nicholson B, Verma S. Comorbidities in chronic neuropathic pain. Pain Med. 2004;5(suppl 1):S9-S27.
19. Sammaritano M, Sherwin A. Effect of anticonvulsants on sleep. Neurology. 2000;54(5 suppl 1):S16-S24.
20. Morin CM, Vallières A, Guay B, et al. Cognitive behavioral therapy, singly and combined with medication, for persistent insomnia: a randomized controlled trial. JAMA. 2009;301(19):2005-2015.
21. Fishbain DA. Polypharmacy treatment approaches to the psychiatric and somatic comorbidities found in patients with chronic pain. Am J Phys Med Rehabil. 2005;84(suppl 3):S56-S63.
22. Fava M, Thase ME, DeBattista C. A multicenter, placebo-controlled study of modafinil augmentation in partial responders to selective serotonin reuptake inhibitors with persistent fatigue and sleepiness. J Clin Psychiatry. 2005;66(1):85-93.
23. Baune BT, Renger L. Pharmacological and non-pharmacological interventions to improve cognitive dysfunction and functional ability in clinical depression—a systematic review. Psychiatry Res. 2014;219(1):25-50.
24. McIntyre RS, Lophaven S, Olsen CK. A randomized, double-blind, placebo-controlled study of vortioxetine on cognitive function in depressed adults. Int J Neuropsychopharmacol. 2014;17(10):1557-1567.
25. Cheatle MD. Depression, chronic pain, and suicide by overdose: on the edge. Pain Med. 2011;12(suppl 2):S43-S48.
26. Chang KL, Fillingim R, Hurley RW, et al. Chronic pain management: nonpharmacological therapies for chronic pain. FP Essent. 2015;432:21-26.
27. Cuijpers P, Smit F, Bohlmeijer E, et al. Efficacy of cognitive-behavioural therapy and other psychological treatments for adult depression: meta-analytic study of publication bias. Br J Psychiatry. 2010;196(3):173-178.
28. Lambert M. ICSI releases guideline on chronic pain assessment and management. Am Fam Physician. 2010;82(4):434-439.
29. Watkins ER, Mullan E, Wingrove J, et al. Rumination-focused cognitive-behavioural therapy for residual depression: phase II randomised controlled trial. Br J Psychiatry. 2011;199(4):317-322.
30. Turk DC, Wilson HD. Fear of pain as a prognostic factor in chronic pain: conceptual models, assessment, and treatment implications. Curr Pain Headache Rep. 2010;14(2):88-95.
31. Buhrman M, Syk M, Burvall O, et al. Individualized guided Internet-delivered cognitive-behavior therapy for chronic pain patients with comorbid depression and anxiety: a randomized controlled trial. Clin J Pain. 2015;31(6):504-516.
32. American Society of Anesthesiologists Task Force on Chronic Pain Management; American Society of Regional Anesthesia and Pain Medicine. Practice guidelines for chronic pain management: an updated report by the American Society of Anesthesiologists Task Force on Chronic Pain Management and the American Society of Regional Anesthesia and Pain Medicine. Anesthesiology. 2010;112(4):810-833.
33. Theadom A, Cropley M, Smith HE, et al. Mind and body therapy for fibromyalgia. Cochrane Database Syst Rev. 2015;4:CD001980. doi: 10.1002/14651858.CD001980.pub3.
34. Mura G, Moro MF, Patten SB, et al. Exercise as an add-on strategy for the treatment of major depressive disorder: a systematic review. CNS Spectr. 2014;19(6):496-508.
35. Kroll HR. Exercise therapy for chronic pain. Phys Med Rehabil Clin N Am. 2015;26(2):263-281.
36. Liang H, Zhang H, Ji H, et al. Effects of home-based exercise intervention on health-related quality of life for patients with ankylosing spondylitis: a meta-analysis. Clin Rheumatol. 2015;34(10):1737-1744.
Patients who have chronic pain and those with a major depressive disorder (MDD) share clinical features, including fatigue, cognitive complaints, and functional limitation. Sleep disturbance and anxiety are common with both disorders. Because pain and depression share common neurobiological pathways (see Part 1 of this article in the February 2016 issue and at CurrentPsychiatry.com) and clinical manifestations, you can use similar strategies and, often, the same agents to treat both conditions when they occur together (Table 1).
What are the medical options?
Antidepressants. Using an antidepressant to treat chronic pain is a common practice in primary care and specialty practice. Antidepressants that modulate multiple neurotransmitters appear to be more efficacious than those with a single mechanism of action.1 Convergent evidence from preclinical and clinical studies supports the use of serotonin-norepinephrine reuptake inhibitors (SNRIs) as more effective analgesic agents, compared with the mostly noradrenergic antidepressants, which, in turn, are more effective than selective serotonin reuptake inhibitors (SSRIs).2 The mechanism of the analgesic action of antidepressants appears to rely on their inhibitory effects of norepinephrine and serotonin reuptake, thereby elevating the performance of endogenous descending pain regulatory pathways.3
Tricyclic antidepressants (TCAs), primarily amitriptyline, nortriptyline, and desipramine, have the advantage of years of clinical experience and low cost. Their side effect burden, however, is higher, especially in geriatric patients. Dose-dependent side effects include sedation, constipation, dry mouth, urinary retention, and orthostatic hypotension.
TCAs must be used with caution in patients with suicidal ideation because of the risk of a potentially lethal intentional overdose.
The key to using a TCA is to start with a low dosage, followed by slow titration. Typically, the dosages of TCAs used in clinical trials that focused on pain have been lower (25 to 100 mg/d of amitriptyline or equivalent) than the dosage typically necessary for treating depression; however, some experts have found that titrating TCAs to higher dosages with an option of monitoring serum levels may benefit some patients.4
SNRIs are considered first-line agents for both neuropathic pain and fibromyalgia. Duloxetine has been shown to be effective in both conditions5; venlafaxine also has shown efficacy in neuropathic pain.6 Milnacipran, another SNRI that blocks 5-HT, and norepinephrine equally and exerts a mild N-methyl-D-aspartate inhibition, has proven efficacy in fibromyalgia.7,8
SSRIs for alleviating central pain or neuropathic pain are supported by minimal evidence only.9 A review of the effectiveness of various antidepressants on pain in diabetic neuropathy concluded that fluoxetine was no more effective than placebo.10,11 Schreiber and Pick11 evaluated the antinociceptive properties of several SSRIs and offered the opinion that fluoxetine, fluvoxamine, and citalopram were, at best, weak antinociceptors.
Opioids. Data on the long-term benefits of opioids are limited, except for use in carefully selected patients; in any case, risk of abuse, diversion, and even death with these agents is quite high.12 Also, there is evidence that opioid-induced hyperalgesia might limit the usefulness of opioids for controlling chronic pain.13
Gabapentin and pregabalin, both anticonvulsants, act by binding to the α-2-σ subunit of voltage-gated calcium channels within the CNS.14 By reducing calcium influx at nerve terminals, the drugs diminish the release of several neurotransmitters, including glutamate, noradrenaline, and substance P. This mechanism is thought to be the basis for the analgesic, anticonvulsant, and anxiolytic effects of these drugs.15
Gabapentin and pregabalin have been shown to decrease pain intensity and improve quality of life and function in patients with neuropathic pain conditions. Pregabalin also has shown efficacy in treating central neuropathic pain and fibromyalgia.16
Added benefits of these drugs is that they have (1) a better side effect profile than TCAs and (2) fewer drug interactions when they are used as a component of combination therapy. Pregabalin has the additional advantage of less-frequent dosing, linear pharmacokinetics, and a predictable dose-response relationship.17
Addressing other comorbid psychiatric conditions
Sleep disturbance is common among patients with chronic pain. Sleep deprivation causes a hyperexcitable state that amplifies the pain response.18
When a patient presents with chronic pain, depression, and disturbed sleep, consider using a sedating antidepressant, such as a TCA. Alternatively, gabapentin or pregabalin can be added to an SNRI; anticonvulsants have been shown to improve quality of sleep.19 Cognitive-behavioral interventions targeting sleep disturbance may be a helpful adjunct in these patients.20
When anxiety is comorbid with chronic pain, antidepressants with proven efficacy in treating anxiety disorders, such as duloxetine or venlafaxine, can be used. When chronic pain coexists with a specific anxiety disorder (social anxiety disorder, obsessive-compulsive disorder, panic disorder), an SSRI might be more advantageous than an SNRI,21 especially if it is combined with a more efficacious analgesic.
Benzodiazepines should be avoided as a routine treatment for comorbid anxiety and pain, because these agents can produce sedation and cognitive interference, and carry the potential for dependence.
Fatigue. In patients who, in addition to pain and depression, complain of fatigue, an activating agent such as milnacipran or adjunct bupropion might be preferable to other agents. Modafinil has been shown to be a well-tolerated and potentially effective augmenting agent for antidepressants when fatigue and sleepiness are present as residual symptoms22; consider them as adjuncts when managing patients who have chronic pain and depression that manifests as excessive sleepiness and/or fatigue.
Cognitive complaints. We have noted that disturbances of cognition are common in patients with depression and chronic pain, and that cognitive dysfunction might improve after antidepressant treatment.
Studies suggest that SSRIs, duloxetine, and other antidepressants, such as bupropion, might exert a positive effect on learning, memory, and executive function in depressed patients.23 Beneficial effects of antidepressants may be “pseudo-specific,” however—that is, predominantly a reflection of overall improvement in mood, not on specific amelioration of the cognitive disturbance.
Vortioxetine has shown promise in improving cognitive function in adults with MDD; its cognitive benefits are largely independent of its antidepressant effect.24 The utility of vortioxetine in chronic pain patients has not been studied, but its positive impact on mood, anxiety, sleep, and cognition might make it a consideration for patients with comorbid depression—although it is uncertain at this time whether putative noradrenergic activity makes it suitable for use in chronic pain disorders.
Last, avoid TCAs in patients who have cognitive complaints. These agents have anticholinergic effects that can have an adverse impact on cognitive function.
Cautions: Drug−drug interactions, suicide risk, disrupted sleep
Avoiding drug−drug interactions is an important consideration when treating comorbid disorders. Many chronic pain patients take over-the-counter or prescribed nonsteroidal anti-inflammatory drugs for analgesia; these agents can increase the risk of gastrointestinal bleeding when they are combined with an SSRI or an SNRI.
The use of the opioid tramadol with an SNRI or a TCA is discouraged because of the risk of serotonin syndrome.
Combining a sedating antidepressant, such as a TCA, with gabapentin or pregabalin can increase the risk of CNS depression and psychomotor impairment, especially in geriatric patients. An opioid analgesic is likely to amplify these effects.
Suicidal ideation is not uncommon in patients with chronic pain and depression. To minimize the risk of suicide in patients with a chronic pain disorder, you should ensure optimal pain control by combining the most efficacious analgesic agent with psychotherapeutic interventions and optimal antidepressant treatment. Furthermore, cognitive-behavioral therapy (CBT) (see the discussion below) might not only improve pain coping skills, but also ameliorate catastrophizing, anxiety, and concomitant sleep disturbance.
Complaints of sleep disturbance and anxiety can compound the risk of suicide in a chronic pain patient. When possible, these complex patients should be treated by a multidisciplinary team that includes a pain management specialist, psychotherapist, and primary care clinician. It is important to strengthen the clinician−patient relationship to facilitate close monitoring of symptoms and to provide a trusting environment in which patients feel free to discuss thoughts of suicide or self-harm. For such patients, prescribing opiates and TCAs in small quantities is a prudent action.
When a patient struggles with suicidal thoughts, his (her) family might need to dispense these medications. Most important, if a patient is actively suicidal, consider referral to an inpatient facility or intensive outpatient program, where aggressive treatment of depressive symptoms and intensive monitoring and support can be provided.25
Usefulness of non-drug interventions
There is, of course, a diversity of non-drug treatments for MDD and for chronic pain; discussion here focuses primarily on modalities with established efficacy in both disease states (Table 2). On rare occasions, non-drug treatments can constitute a stand-alone approach; most often, they are incorporated into a multimodal treatment plan or applied as an adjunct intervention.26
Psychotherapy. The most robust evidence supports the use of CBT in addressing MDD and chronic pain—occurring individually and comorbidly.26-28 Efficacy is well established in MDD, as monotherapy and adjunct treatment, spanning acute and maintenance phases.
Furthermore, CBT also has support from randomized trials, meta-analyses, and treatment guidelines, either as monotherapy or co-therapy for both short-term relief and long-term pain reduction. Additionally, CBT has demonstrated value for relieving pain-related disability.26,28
Combination of a special form of CBT, rumination-focused CBT with ongoing pharmacological therapy over a 26-week period in a group of medication-refractory MDD patients produced a remission rate of 62%, compared with 21% in a treatment-as-usual group.29 This is of particular interest in chronic pain patients, because rumination-related phenomena of pain catastrophizing and avoidance facilitate a transition from acute to chronic pain, while augmenting pain severity and associated disability.30
Catastrophizing also has been implicated in mediating the relationship between pain and sleep disturbance. Not surprisingly, a randomized controlled study demonstrated the benefit of 8-week, Internet-delivered CBT in patients suffering from comorbid chronic pain, depression, and anxiety. Treatment significantly diminished pain catastrophizing, depression, and anxiety; maintenance of improvement was demonstrated after 1 year of follow-up.31
Other behavioral and psychological approaches. Biofeedback, mindfulness-based stress reduction, relaxation training and diaphragmatic breathing, guided imagery, hypnosis, and supportive groups might play an important role as components of an integrated mind−body approach to chronic pain,28,32,33 while also providing mood benefits.
Exercise. The role of exercise as a primary treatment of MDD continues to be controversial, but its benefits as an add-on intervention are indisputable. Exercise not only complements pharmacotherapy to produce greater reduction in depressive scores and improvement in quality of life, it might aid in reestablishing social contacts when conducted in a group setting—an effect that can be of great value in both MDD and chronic pain.34
Exercise and restorative therapies provide several benefits for chronic pain patients, including:
- improved pain control, cognition, and mood
- greater strength and endurance
- cardiovascular and metabolic benefits
- improved bone health and functionality.26,28,32,33,35
To achieve optimal benefit, an exercise program must be customized to fit the patient’s physical condition, level of fitness, and specific type of pain.35 Preliminary evidence suggests that, beyond improvement in pain and functionality, exercise might reduce depressive symptoms in chronic pain patients.36
1. Sharp J, Keefe B. Psychiatry in chronic pain: a review and update. Curr Psychiatry Rep. 2005;7(3):213-219.
2. Fishbain DA. Polypharmacy treatment approaches to the psychiatric and somatic comorbidities found in patients with chronic pain. Am J Phys Med Rehabil. 2005;84(suppl 3):S56-S63.
3. Schug SA, Goddard C. Recent advances in the pharmacological management of acute and chronic pain. Ann Palliat Med. 2014;3(4):263-275.
4. Kroenke K, Krebs EE, Bair MJ. Pharmacotherapy of chronic pain: a synthesis of recommendations from systematic reviews. Gen Hosp Psychiatry. 2009;31(3):206-219.
5. Lunn MP, Hughes RA, Wiffen PJ. Duloxetine for treating painful neuropathy, chronic pain or fibromyalgia. Cochrane Database Syst Rev. 2014;1:CD007115. doi: 10.1002/14651858.CD007115.pub3.
6. Rowbotham MC, Goli V, Kunz NR, et al. Venlafaxine extended release in the treatment of painful diabetic neuropathy: a double-blind, placebo-controlled study. Pain. 2004;110(3):697-706.
7. Kranzler JD, Gendreau JF, Rao SG. The psychopharmacology of fibromyalgia: a drug development perspective. Psychopharmacol Bull. 2002;36(1):165-213.
8. Pae CU, Marks DM, Shah M, et al. Milnacipran: beyond a role of antidepressant. Clin Neuropharmacol. 2009;32(6):355-363.
9. Depression and pain. J Clin Psychiatry. 2008;69(12):1970-1978.
10. Max MB, Lynch SA, Muir J, et al. Effects of desipramine, amitriptyline, and fluoxetine on pain in diabetic neuropathy. N Engl J Med. 1992;326(19):1250-1256.
11. Schreiber S, Pick CG. From selective to highly selective SSRIs: a comparison of the antinociceptive properties of fluoxetine, fluvoxamine, citalopram and escitalopram. Eur Neuropsychopharmacol. 2006;16(6):464-468.
12. Freynhagen R, Geisslinger G, Schug SA. Opioids for chronic non-cancer pain. BMJ. 2013;346:f2937. doi: 10.1136/bmj.f2937.
13. Silverman SM. Opioid induced hyperalgesia: clinical implications for the pain practitioner. Pain Physician. 2009;12(3):679-684.
14. Bauer CS, Nieto-Rostro M, Rahman W, et al. The increased trafficking of the calcium channel subunit α2σ-1 to presynaptic terminals in neuropathic pain is inhibited by the α2σ ligand pregabalin. J Neurosci. 2009;29(13):4076-4088.
15. Dooley DJ, Taylor CP, Donevan S, et al. Ca2+ channel α2σ ligands: novel modulators of neurotransmission [Erratum in: Trends Pharmacol Sci. 2007;28(4):151]. Trends Pharmacol Sci. 2007;28(2):75-82.
16. Wiffen PJ, Derry S, Moore RA, et al. Antiepileptic drugs for neuropathic pain and fibromyalgia - an overview of Cochrane reviews. Cochrane Database Syst Rev. 2013;11:CD010567. doi: 10.1002/14651858.CD010567.pub2.
17. Finnerup NB, Otto M, Jensen TS, et al. An evidence-based algorithm for the treatment of neuropathic pain. MedGenMed. 2007;9(2):36.
18. Nicholson B, Verma S. Comorbidities in chronic neuropathic pain. Pain Med. 2004;5(suppl 1):S9-S27.
19. Sammaritano M, Sherwin A. Effect of anticonvulsants on sleep. Neurology. 2000;54(5 suppl 1):S16-S24.
20. Morin CM, Vallières A, Guay B, et al. Cognitive behavioral therapy, singly and combined with medication, for persistent insomnia: a randomized controlled trial. JAMA. 2009;301(19):2005-2015.
21. Fishbain DA. Polypharmacy treatment approaches to the psychiatric and somatic comorbidities found in patients with chronic pain. Am J Phys Med Rehabil. 2005;84(suppl 3):S56-S63.
22. Fava M, Thase ME, DeBattista C. A multicenter, placebo-controlled study of modafinil augmentation in partial responders to selective serotonin reuptake inhibitors with persistent fatigue and sleepiness. J Clin Psychiatry. 2005;66(1):85-93.
23. Baune BT, Renger L. Pharmacological and non-pharmacological interventions to improve cognitive dysfunction and functional ability in clinical depression—a systematic review. Psychiatry Res. 2014;219(1):25-50.
24. McIntyre RS, Lophaven S, Olsen CK. A randomized, double-blind, placebo-controlled study of vortioxetine on cognitive function in depressed adults. Int J Neuropsychopharmacol. 2014;17(10):1557-1567.
25. Cheatle MD. Depression, chronic pain, and suicide by overdose: on the edge. Pain Med. 2011;12(suppl 2):S43-S48.
26. Chang KL, Fillingim R, Hurley RW, et al. Chronic pain management: nonpharmacological therapies for chronic pain. FP Essent. 2015;432:21-26.
27. Cuijpers P, Smit F, Bohlmeijer E, et al. Efficacy of cognitive-behavioural therapy and other psychological treatments for adult depression: meta-analytic study of publication bias. Br J Psychiatry. 2010;196(3):173-178.
28. Lambert M. ICSI releases guideline on chronic pain assessment and management. Am Fam Physician. 2010;82(4):434-439.
29. Watkins ER, Mullan E, Wingrove J, et al. Rumination-focused cognitive-behavioural therapy for residual depression: phase II randomised controlled trial. Br J Psychiatry. 2011;199(4):317-322.
30. Turk DC, Wilson HD. Fear of pain as a prognostic factor in chronic pain: conceptual models, assessment, and treatment implications. Curr Pain Headache Rep. 2010;14(2):88-95.
31. Buhrman M, Syk M, Burvall O, et al. Individualized guided Internet-delivered cognitive-behavior therapy for chronic pain patients with comorbid depression and anxiety: a randomized controlled trial. Clin J Pain. 2015;31(6):504-516.
32. American Society of Anesthesiologists Task Force on Chronic Pain Management; American Society of Regional Anesthesia and Pain Medicine. Practice guidelines for chronic pain management: an updated report by the American Society of Anesthesiologists Task Force on Chronic Pain Management and the American Society of Regional Anesthesia and Pain Medicine. Anesthesiology. 2010;112(4):810-833.
33. Theadom A, Cropley M, Smith HE, et al. Mind and body therapy for fibromyalgia. Cochrane Database Syst Rev. 2015;4:CD001980. doi: 10.1002/14651858.CD001980.pub3.
34. Mura G, Moro MF, Patten SB, et al. Exercise as an add-on strategy for the treatment of major depressive disorder: a systematic review. CNS Spectr. 2014;19(6):496-508.
35. Kroll HR. Exercise therapy for chronic pain. Phys Med Rehabil Clin N Am. 2015;26(2):263-281.
36. Liang H, Zhang H, Ji H, et al. Effects of home-based exercise intervention on health-related quality of life for patients with ankylosing spondylitis: a meta-analysis. Clin Rheumatol. 2015;34(10):1737-1744.

A tool to assess behavioral problems in neurocognitive disorder and guide treatment
Non-drug treatment options, such as behavioral techniques and environment adjustment, should be considered before initiating pharmacotherapy in older patients with behavioral deregulation caused by a neurocognitive disorder. Before considering any interventions, including medical therapy, an evaluation and development of a profile of behavioral symptoms is warranted.
The purpose of such a profile is to:
- guide a patient-specific treatment plan
- measure treatment response (whether medication-related or otherwise).
Developing a profile for a patient can lead to a more tailored treatment plan. Such a plan includes identification of mitigating factors for the patient’s behavior and use of specific interventions, with a preference for non-medication interventions.
Profile assessment can guide treatment
The disruptive-behavior profile that I created (Table) can be used as an initial screening device; the score (1 through 4) in each domain indicates the intensity of intervention required. The profile also can be used to evaluate treatment response.

For example, when caring for a person with a neurocognitive disorder with agitation and disruptive behavior, this profile can be used by the caregiver as a reporting tool for the behavioral heath professional providing consultation. Based on this report, the behavioral health professional can evaluate the predisposing, precipitating, and perpetuating factors of the behavioral disturbance, and a treatment plan can be implemented. After interventions are applied, follow-up assessment with the tool can assess the response to the intervention.
The scale can aid in averting overuse of non-specific medication therapy and, if required, can guide pharmacotherapy. This assessment tool can be useful for clinicians providing care for patients with a neurocognitive disorder, not only in choosing treatment, but also to justify clinical rationale.
How does this scale compare with others?
The Neuropsychiatric Inventory (NPI), Behavioral Pathology in Alzheimer’s Disease (Behave-AD), Cohen-Mansfield Agitation Inventory, and Brief Agitation Rating Scale provide valuable information for clinical care. However:
- Use of the NPI in everyday practice is limited; time spent completing the NPI scale remains a significant impediment for the busy clinician.
- Behave-AD requires a higher level of skill for some caregivers to estimate behavioral symptoms and answer questions about severity.
- Cohen-Mansfeld and Brief Agitation Rating Scale provide a limited description of the intensity of behavioral disturbance.
Developing a treatment plan and justifying pharmacotherapy in patients with a neurocognitive disorder is a challenge for clinicians. The scale that I developed aims to (1) assist the busy clinician who must construct a targeted treatment plan and (2) avoid pharmacotherapy when it is unnecessary. If pharmacotherapy is warranted on the basis of any of the domain scores in the profile, it should be documented with a judicious rationale.
Non-drug treatment options, such as behavioral techniques and environment adjustment, should be considered before initiating pharmacotherapy in older patients with behavioral deregulation caused by a neurocognitive disorder. Before considering any interventions, including medical therapy, an evaluation and development of a profile of behavioral symptoms is warranted.
The purpose of such a profile is to:
- guide a patient-specific treatment plan
- measure treatment response (whether medication-related or otherwise).
Developing a profile for a patient can lead to a more tailored treatment plan. Such a plan includes identification of mitigating factors for the patient’s behavior and use of specific interventions, with a preference for non-medication interventions.
Profile assessment can guide treatment
The disruptive-behavior profile that I created (Table) can be used as an initial screening device; the score (1 through 4) in each domain indicates the intensity of intervention required. The profile also can be used to evaluate treatment response.
For example, when caring for a person with a neurocognitive disorder with agitation and disruptive behavior, this profile can be used by the caregiver as a reporting tool for the behavioral heath professional providing consultation. Based on this report, the behavioral health professional can evaluate the predisposing, precipitating, and perpetuating factors of the behavioral disturbance, and a treatment plan can be implemented. After interventions are applied, follow-up assessment with the tool can assess the response to the intervention.
The scale can aid in averting overuse of non-specific medication therapy and, if required, can guide pharmacotherapy. This assessment tool can be useful for clinicians providing care for patients with a neurocognitive disorder, not only in choosing treatment, but also to justify clinical rationale.
How does this scale compare with others?
The Neuropsychiatric Inventory (NPI), Behavioral Pathology in Alzheimer’s Disease (Behave-AD), Cohen-Mansfield Agitation Inventory, and Brief Agitation Rating Scale provide valuable information for clinical care. However:
- Use of the NPI in everyday practice is limited; time spent completing the NPI scale remains a significant impediment for the busy clinician.
- Behave-AD requires a higher level of skill for some caregivers to estimate behavioral symptoms and answer questions about severity.
- Cohen-Mansfeld and Brief Agitation Rating Scale provide a limited description of the intensity of behavioral disturbance.
Developing a treatment plan and justifying pharmacotherapy in patients with a neurocognitive disorder is a challenge for clinicians. The scale that I developed aims to (1) assist the busy clinician who must construct a targeted treatment plan and (2) avoid pharmacotherapy when it is unnecessary. If pharmacotherapy is warranted on the basis of any of the domain scores in the profile, it should be documented with a judicious rationale.
Extended-release, orally disintegrating mixed amphetamine salts for ADHD: New formulation
An amphetamine-based, extended-release, orally disintegrating tablet for patients age ≥6 diagnosed with attention-deficit/hyperactivity disorder (ADHD) won FDA approval on January 28, 2016 (Table).1
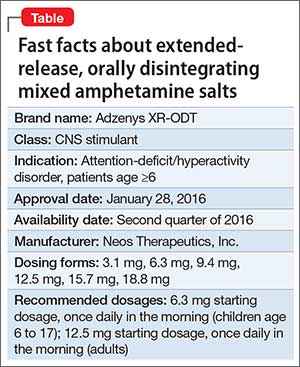
Adzenys XR-ODT is the first extended-release, orally disintegrating tablet for ADHD, Neos Therapeutics, Inc. the drug’s manufacturer, said in a statement.2 The newly approved agent is bioequivalent to Adderall XR (the capsule form of extended-release mixed amphetamine salts), and patients taking Adderall XR can be switched to the new drug. Equivalent dosages of the 2 drugs are outlined on the prescribing information.1
“The novel features of an extended-release orally disintegrating tablet ... make Adzenys XR-ODT attractive for use in both children (6 and older) and adults,” Alice R. Mao, MD, Medical Director, Memorial Park Psychiatry, Houston, Texas, said in the statement.2
As a condition of the approval, Neos must annually report the status of 3 post-marketing studies of children diagnosed with ADHD taking Adzenys XR-ODT, according to the approval letter.2 One is a single-dose, open-label study of children ages 4 and 5; the second is a randomized, double-blind, placebo-controlled titration study of children ages 4 and 5; and the third is a 1-year, open-label safety study of patients ages 4 and 5.
For patients age 6 to 17, the starting dosage is 6.3 mg once daily in the morning; for adults, it is 12.5 mg once daily in the morning, according to the label.1 The medication will be available in 4 other dose strengths: 3.1 mg, 9.4 mg, 15.7 mg, and 18.8 mg.
The most common adverse reactions to the drug among pediatric patients include loss of appetite, insomnia, and abdominal pain. Among adult patients, adverse reactions include dry mouth, loss of appetite, and insomnia.
1. Adzenys XR-ODT [prescription packet]. Grand Prairie, TX: Neos Therapeutics, LP; 2016.
2. Neos Therapeutics announces FDA approval of Adzenys XR-ODT (amphetamine extended-release orally disintegrating tablet) for the treatment of ADHD in patients 6 years and older [news release]. Dallas, TX: Neos Therapeutics, Inc; January 27, 2016. http://investors.neostx.com/phoenix.zhtml?c=254075&p=RssLanding&cat=news&id=2132931. Accessed February 3, 2016.
An amphetamine-based, extended-release, orally disintegrating tablet for patients age ≥6 diagnosed with attention-deficit/hyperactivity disorder (ADHD) won FDA approval on January 28, 2016 (Table).1
Adzenys XR-ODT is the first extended-release, orally disintegrating tablet for ADHD, Neos Therapeutics, Inc. the drug’s manufacturer, said in a statement.2 The newly approved agent is bioequivalent to Adderall XR (the capsule form of extended-release mixed amphetamine salts), and patients taking Adderall XR can be switched to the new drug. Equivalent dosages of the 2 drugs are outlined on the prescribing information.1
“The novel features of an extended-release orally disintegrating tablet ... make Adzenys XR-ODT attractive for use in both children (6 and older) and adults,” Alice R. Mao, MD, Medical Director, Memorial Park Psychiatry, Houston, Texas, said in the statement.2
As a condition of the approval, Neos must annually report the status of 3 post-marketing studies of children diagnosed with ADHD taking Adzenys XR-ODT, according to the approval letter.2 One is a single-dose, open-label study of children ages 4 and 5; the second is a randomized, double-blind, placebo-controlled titration study of children ages 4 and 5; and the third is a 1-year, open-label safety study of patients ages 4 and 5.
For patients age 6 to 17, the starting dosage is 6.3 mg once daily in the morning; for adults, it is 12.5 mg once daily in the morning, according to the label.1 The medication will be available in 4 other dose strengths: 3.1 mg, 9.4 mg, 15.7 mg, and 18.8 mg.
The most common adverse reactions to the drug among pediatric patients include loss of appetite, insomnia, and abdominal pain. Among adult patients, adverse reactions include dry mouth, loss of appetite, and insomnia.
1. Adzenys XR-ODT [prescription packet]. Grand Prairie, TX: Neos Therapeutics, LP; 2016.
2. Neos Therapeutics announces FDA approval of Adzenys XR-ODT (amphetamine extended-release orally disintegrating tablet) for the treatment of ADHD in patients 6 years and older [news release]. Dallas, TX: Neos Therapeutics, Inc; January 27, 2016. http://investors.neostx.com/phoenix.zhtml?c=254075&p=RssLanding&cat=news&id=2132931. Accessed February 3, 2016.
cTn in Patients Hospitalized with ADHF
Acute decompensated heart failure (ADHF) accounts for over a million hospitalizations per year, with a reported all‐cause mortality rate 11.7% and all‐cause readmission rate 22.5% at 30 days after initial hospitalization.[1]
Risk stratification for accurate identification of ADHF patients at high risk for readmission and mortality may enable clinicians to undertake timely interventions: triage to appropriate level of care and resource allocation for postdischarge care. Further risk stratification may allow the care team to plan and implement a personalized care plan. Several clinical and laboratory variables have been proposed for identification of patients with ADHF who are at increased risk for adverse clinical outcomes. Despite advances in the risk stratification of patients with ADHF, the accurate prediction of individuals at high risk for readmissions and mortality is challenging. Cardiac troponin T (cTnT) and I (cTnI) are highly sensitive and specific biomarkers that are widely used for the risk stratification of patients with acute myocardial infarction and stable heart failure.[2]
In this systematic review and meta‐analysis, we evaluate circulating cardiac troponin in determining risk for increased length of stay (LOS), hospital readmission, and mortality among patients admitted with ADHF.
METHODS
Data Sources and Searches
This systematic review and meta‐analysis was conducted in accordance with the established methods[3] and Preferred Reporting Items for Systematic Review and Meta‐Analysis (PRISMA) guidelines.[4] Risk of bias was evaluated using the Newcastle‐Ottawa Scale for cohort studies.[5] We performed a comprehensive search of several databases from each database's earliest inception to March 2015 without language restrictions. The databases included MEDLINE In‐Process & Other Non‐Indexed Citations, MEDLINE, Embase, Cochrane Central Register of Controlled Trials, Cochrane Database of Systematic Reviews, and Scopus. We conducted a manual search for bibliography of pertinent reviews for relevant citations that our electronic searches might have missed. The actual strategy is available from the corresponding author.
Study Selection
Eligibility criteria included: (1) randomized or nonrandomized clinical trials involving adults hospitalized with ADHF, (2) comparator groups stratified by cardiac troponin (cTn) level as defined by individual study investigators, and (3) studies reporting 1 or more of the following clinical outcomes: (1) in‐hospital mortality, (2) hospital LOS, (3) major adverse events during hospitalization (defined as persistent dyspnea,[6] worsening of heart failure,[6, 7, 8, 9] worsening of renal function [creatinine 0.3 mg/dL],[8] or recurrent myocardial ischemia[9] after hospitalization for ADHF), (4) postdischarge readmission, (5) postdischarge mortality rate, and (6) the composite of readmission and mortality. We excluded studies incorporating patients with (1) stable heart failure, (2) acute myocarditis, (3) chemotherapy‐induced cardiomyopathy, (4) postsurgical heart failure, (5) transplanted heart, (6) left ventricular assist device, and (7) hemodialysis.
We incorporated the description of ADHF from national registry for defining ADHF.[10] The lower limit of detection of cTn level in healthy subjects is assay dependent, each with a different cutoff value. To improve uniformity of expression in the present meta‐analysis, we arbitrarily stratified groups by the level of cTn: (1) undetected cTn (cTnT <0.01; cTnI <0.012 g/L), (2) detectable cTn (cTnT 0.010.03; cTnI 0.0120.03 g/L), and (3) elevated cTn (cTnT >0.03; cTnI >0.034 g/L).
Data Extraction and Risk of Bias Assessment
From the results of the initial search, 2 investigators (M.Y. and A.D.A), working independently, reviewed articles for eligibility on the basis of titles and abstracts. Studies that satisfied the inclusion and exclusion criteria were retrieved for full‐text review. Disagreements were resolved by consensus after discussion among investigators, and retained conflicts were adjudicated by a third investigator.
We extracted the following data from each study: type of study, number of participants, age, gender, type of cTn assayed and cut point, comorbidities, length of follow‐up, and outcome measure. Prevalence of detectable or elevated cTn, measure of association with clinical outcomes (hazard ratio [HR], odds ratio [OR], or relative risk) were also abstracted. When HR or OR were not reported for an outcome, based on other provided data, we estimated HR using previously validated methods.[11]
Data Synthesis and Analysis
Studies were stratified by cTn cutoff point and length of follow‐up. To reduce heterogeneity, studies reporting clinical outcomes at multiple time periods after the index hospitalization were grouped in three categories: (1) studies with short‐term follow up (06 months), (2) studies with intermediate‐term follow‐up (up to 1 year), and (3) studies with long‐term follow‐up (up to 3.5 years). We used the DerSimonian and Laird random effects model to combine OR or HR reported by individual studies. The consistency of the results of the studies was assessed by I2 statistics, with values >40% considered as indicators of heterogeneity. We evaluated statistically for publication bias if a sufficient number of studies was available, because such evaluation is unreliable when<20 studies are included in a particular analysis.[12]
Sensitivity analyses were performed to investigate the robustness of results to a few assumptions. Analyses were repeated excluding studies reporting unadjusted relative effect measures to assess whether confounding had a large effect on overall results. Similarly, analysis was repeated omitting studies reporting detectable cTn as opposed to elevated cTn level to assess whether these studies influence overall results. All statistical analyses were conducted using Stata 14.0 (StataCorp, College Station, TX).
Quality and Risk of Bias Assessment
The Newcastle‐Ottawa scale was used to assess the quality and risk of bias in cohort studies as suggested by the Cochrane Collaboration.[13] For the assessment of risk of bias, a study was awarded a maximum of 1 star for each of the 7 items from 2 domains: (1) selection of cohort (representativeness of the exposed cohort, selection of the nonexposed cohort, ascertainment of exposure, and demonstration that the outcome of interest was not present at the start of the study) and (2) outcome (assessment of outcome, was the follow‐up long enough, adequacy of the follow‐up of the cohort), and a maximum of 2 stars for comparability of the cohort (comparability on the basis of design and analysis) (Table 1).
| Source | Year | Selection | Compatibility | Outcome | Quality | ||||||
|---|---|---|---|---|---|---|---|---|---|---|---|
| S1 | S2 | S3 | S4 | C1 | C2 | O1 | O2 | O3 | |||
| |||||||||||
| Del Carlo et al.[31] | 2009 | * | * | * | * | * | 5 | ||||
| Felker et al.[6] | 2012 | * | * | * | * | * | 5 | ||||
| Gattis et al.[7] | 2004 | * | * | * | * | * | * | * | 7 | ||
| Guisado Espartero et al.[32] | 2014 | * | * | * | * | * | * | 6 | |||
| Ishii et al.[21] | 2002 | * | * | * | * | * | 5 | ||||
| Kuwabara et al.[22] | 2007 | * | * | * | * | * | 5 | ||||
| La Vecchia et al.[23] | 2000 | * | * | * | * | * | * | * | 7 | ||
| La Corvoisie et al.[17] | 2014 | * | * | * | * | * | * | * | 7 | ||
| Manzano‐Fernandez et al.[33] | 2009 | * | * | * | * | * | 5 | ||||
| Metra et al.[24] | 2007 | * | * | * | * | * | 5 | ||||
| Nakamura et al.[36] | 2014 | * | * | * | * | * | * | * | * | 8 | |
| O'Connor et al.[8] | 2011 | * | * | * | * | * | * | * | * | 8 | |
| Oliveira et al.[34] | 2010 | * | * | * | * | * | * | * | * | 8 | |
| Parissis et al.[20] | 2011 | * | * | * | * | * | * | * | 7 | ||
| Parissis et al.[25] | 2013 | * | * | * | * | * | * | * | * | 8 | |
| Pascual‐Figal et al.[37] | 2012 | * | * | * | * | * | * | 6 | |||
| Peacock et al.[15] | 2008 | * | * | * | * | * | * | * | * | * | 9 |
| Perna et al.[18] | 2005 | * | * | * | * | * | * | * | 7 | ||
| Perna et al.[19] | 2002 | * | * | * | * | * | * | 6 | |||
| Perna et al.[26] | 2012 | * | * | * | * | * | * | 6 | |||
| Rudiger et al.[27] | 2005 | * | * | * | * | * | * | 6 | |||
| Shah et al.[16] | 2007 | * | * | * | * | 4 | |||||
| Wallenborn et al.[28] | 2013 | * | * | * | * | * | * | * | 7 | ||
| Xue et al.[29] | 2011 | * | * | * | * | * | * | * | 7 | ||
| You et al.[35] | 2007 | * | * | * | * | * | * | * | * | * | 9 |
| Zairis et al.[30] | 2010 | * | * | * | * | * | * | * | 7 | ||
RESULTS
Search Results
Figure 1 represents the PRISMA flow diagram for literature search and selection process to identify eligible studies for inclusion.

Characteristics of Included Studies
We identified 26 studies, which were all observational cohorts with postdischarge median follow‐up from 30 days to 472 days. Table 2 summarizes the study characteristics. Studies were heterogeneous with regard to prevalence of elevated cTn, cTn assay, and length of follow‐up. Thirteen were single‐center and 5 were multicenter studies, 4 were substudies of large multicenter phase III clinical trials, and 4 were registries. Except for one abstracts, all studies were peer‐reviewed publications. Sample size ranged from 34 to 69,259 patients.
| Source | Year | Design | Patient Population | CAD | HF Type | LVEF, Mean % | Clinical Outcomes | |||
|---|---|---|---|---|---|---|---|---|---|---|
| No. of Patients | Age, y | Men, % | Follow‐up | Endpoints | ||||||
| ||||||||||
| Del Carlo et al.[31] | 2009 | Single | 70 | 54 16 | 69 | 26 | HFrEF | 31 8 | 262 (3393) days | Readmission, mortality |
| Felker et al.[6] | 2012 | Substudy | 808 | 67 | 70 | 61 | Both | 25 | Hosp, 30 days, 6 months | MAE, LOS, readmission, mortality |
| Gattis et al.[7] | 2004 | Substudy | 133 | NR | NR | NR | NR | NR | Hosp | MAE, mortality |
| Guisado Espartero et al.[32] | 2014 | Registry | 406 | 77 (7678) | 42 | 25 | Both | 50 (4456) | 1 year | Readmission, mortality |
| Ishii et al.[21] | 2002 | Single | 98 | 69 9 | 52 | 45 | NR | 42 17 | Hosp, 60 days, >1 year | Readmission, mortality |
| Kuwabara et al.[22] | 2007 | Single | 52 | 72 12 | 59 | 27 | NR | 47 16 | 143 (13540) days | Readmission, mortality |
| La Vecchia et al.[23] | 2000 | Single | 34 | 60 (2885) | 79 | 38 | HFrEF | NR | 90 days | Mortality |
| La Corvoisie et al.[17] | 2014 | Multicenter | 397 | NR | NR | NR | NR | Hosp | Mortality | |
| Manzano‐Fernandez et al.[33] | 2009 | Single | 138 | 74 (67801) | 54 | 35 | NR | NR | 261 (161449) days | Readmission, mortality |
| Metra et al.[24] | 2007 | Single | 116 | NR | NR | NR | NR | NR | 184 (7444) days | Readmission, mortality |
| Nakamura et al.[36] | 2014 | Single | 444 | NR | 63 | 15 | NR | NR | 472 (2001,200) days | Mortality |
| O'Connor et al.[8] | 2011 | Substudy | 288 | 73 (6577) | 59 | 74 | NR | NR | Hosp, 60 days | MAE, readmission, mortality |
| Oliveira et al.[34] | 2010 | Multicenter | 79 | NR | 61 | 18 | HFrEF | 27 | 8 months | MAE, readmission, mortality |
| Parissis et al.[20] | 2011 | Multicenter | 837 | NR | 48 | 20 | HFpEF | NR | Hosp | Mortality |
| Parissis et al.[25] | 2013 | Single | 113 | 73 11 | 68 | 46 | NR | 36 11 | 174 (94728) days | Mortality |
| Pascual‐Figal et al.[37] | 2012 | Single | 202 | 74 (6780) | 55 | 34 | Both | 49 (3260) | 406 (204728) days | Mortality |
| Peacock et al.[15] | 2008 | Registry | 69,259 | 74 14 | 45 | 56 | Both | 34 | Hosp | LOS, mortality |
| Perna et al.[18] | 2005 | Single | 184 | 64 13 | 60 | 38 | Both | NR | Hosp, 3 years | Readmission, mortality |
| Perna et al.[19] | 2002 | Single | 84 | 65 14 | 62 | 55 | NR | NR | Hosp, 1 year | Readmission, mortality |
| Perna et al.[26] | 2012 | Single | 500 | 73 12 | 53 | 38 | HFpEF | 53 11 | 6 months | Readmission, mortality |
| Rudiger et al.[27] | 2005 | Multicenter | 312 | 73 12 | 56 | 70 | Both | NR | 30 days, 1 year | Mortality |
| Shah et al.[16] | 2007 | Substudy | 141 | NR | NR | NR | HFrEF | NR | Hosp, 6 months | LOS, readmission, mortality |
| Wallenborn et al.[28] | 2013 | Registry | 879 | 69 12 | 72 | 50 | NR | 30 8 | 06 months, 618 months | Mortality |
| Xue et al.[29] | 2011 | Single | 144 | 68 13 | 98 | 62 | Both | 43 18 | 90 days | Readmission, mortality |
| You et al.[35] | 2007 | Registry | 2,025 | 76 11 | 50 | 55 | Both | NR | 1 year | Mortality |
| Zairis et al.[30] | 2010 | Multicenter | 577 | 74 8 | 68 | 77 | HFrEF | 23 5 | 31 days | Mortality |
Table 3 stratifies the characteristics of study populations by cTn status. The studies included 77,297 participants hospitalized for ADHF, of whom 7176 (9.3%) had detectable or elevated cTn level. Twenty‐five studies reported data on type of cTn measured (cTnI, cTnT, or both) and reported cutoff values for detectable or elevated cTn (Table 3). The percentages of patients who had detectable or elevated cTn varied widely across the studies (6.2%68%). Most studies utilized standard assays, and the cutoff point for cTn level was chosen arbitrary by study investigators or derived from receiver operating characteristic curve analysis. cTn level is assay dependent. For instance, the 99th centile upper reference limit (URL) is 0.014 ng/mL for cTnT with the Roche high‐sensitivity cTnT assay, and 0.04 ng/mL with the Siemens cTnI‐ultra assay. Few studies of the present meta‐analysis incorporated a cTn cutoff point that defined acute myocardial infarction.[14] Nine studies used a lower threshold cTn level (cTnT >0.01>0.03; cTnI >0.03) for stratification into comparator groups.
| Source | Year | No. of Patients | No. cTn+ (%) | cTn Cutoff | Age | Male | Atrial Fibrillation | CAD | ||
|---|---|---|---|---|---|---|---|---|---|---|
| Tn+ | Tn | Tn+ (%) | No. (%) | Tn+ (%) | Tn+ (%) | |||||
| ||||||||||
| Del Carlo et al.[31] | 2009 | 70 | 12 (17) | cTnT 0.10 | NR | NR | NR | 13 (19) | NR | NR |
| Felker et al.[6] | 2012 | 808 | 404 (50) | cTnT 0.034 | 69 | 65 | 364 (54) | 334 (41) | 170 (42) | 243 (60) |
| Gattis et al.[7] | 2004 | 133 | 91 (68) | cTnT 1.0 | 70 (6180) | 77 (6282) | 46 (50) | NR | NR | NR |
| Guisado Espartero et al.[32] | 2014 | 406 | 241 (60) | cTnT 0.02 | NR | NR | 116 (48) | 236 (58) | 136 (56) | 74 (31) |
| Ishii et al.[21] | 2002 | 98 | NR | cTnT 0.1 | NR | NR | NR | NR | NR | NR |
| Kuwabara et al.[22] | 2007 | 52 | 31 (60) | NR | NR | NR | 31 (59) | 23 (44) | NR | NR |
| La Vecchia et al.[23] | 2000 | 34 | 10 (29) | cTnI 0.4 | 56 13 | 62 12 | 100 | 19 (56) | 5 (50) | 3 (30) |
| La Corvoisie et al.[17] | 2014 | 397 | NR | cTnI0.15 | NR | NR | NR | NR | NR | NR |
| Manzano‐Fernandez et al.[33] | 2009 | 138 | NR | cTnT 0.011 | NR | NR | NR | NR | NR | NR |
| Metra et al.[24] | 2007 | 116 | 41 (38) | cTnT 0.01 | NR | NR | NR | NR | NR | 33 (61) |
| Nakamura et al.[36] | 2014 | 444 | 224 (51) | cTnT 0.028 | 67 14 | 66 14 | 133 (60) | 160 (36) | 72 (32) | 35 (16) |
| O'Connor et al.[8] | 2011 | 288 | 97 (34) | cTnT 0.03 | 71 | 72 | 67 (69) | NR | NR | NR |
| Oliveira et al.[34] | 2010 | 79 | 37 (47) | ctnT 0.02 | 57 18 | 54 17 | 26 (70) | NR | NR | 6 (16) |
| Parissis et al.[20] | 2011 | 837 | 184 (22) | cTnT >0.01 | NR | NR | NR | NR | NR | NR |
| Parissis et al.[25] | 2013 | 113 | 37 (33) | cTnT 0.077 | 74 8 | 72 12 | 22 (59) | 36 (32) | 12 (32) | 18 (49) |
| Pascual‐Figal et al.[37] | 2012 | 202 | NR | cTnT >0.02 | NR | NR | NR | 109 (54) | NR | NR |
| Peacock et al.[15] | 2008 | 69,259 | 4,240 (6.2) | cTnI 1.0; cTnT 0.1 | 73 14 | 73 14 | 2,035 (48) | 207 (30) | 975 (23) | 2,586 (58) |
| Perna et al.[18] | 2005 | 184 | 58 (31) | cTnT 0.1 | 64 13 | 65 13 | 37 (64) | NR | NR | 30 (52) |
| Perna et al.[19] | 2002 | 84 | 46 (55) | cTnT 0.1 | 68 11 | 61 16 | 27 (59) | NR | NR | 33 (72) |
| Perna et al.[26] | 2012 | 500 | 220 (44) | cTnT 0.02 | 74 10 | 72 14 | 125 (59) | 177 (35) | 70 (32) | 110 (50) |
| Rudiger et al.[27] | 2005 | 312 | 88 (28) | cTnT 0.1 | NR | NR | NR | NR | NR | NR |
| Shah et al.[16] | 2007 | 141 | NR | cTnI per 0.1 | NR | NR | NR | NR | NR | NR |
| Wallenborn et al.[28] | 2013 | 879 | 332 (37) | cTnT 0.06 | NR | NR | NR | NR | NR | NR (50) |
| Xue et al.[29] | 2011 | 144 | NR | cTnI 0.023 | NR | NR | NR | NR | NR | NR |
| You et al.[35] | 2007 | 2,025 | 669 (34) | cTnI >0.5 | 77 11 | 75 11 | 364 (53) | NR | NR | 417 (60) |
| Zairis et al.[30] | 2010 | 577 | 114 (20) | cTnI 0.42 | NR | NR | NR | 295 (51) | NR | 443 (77) |
Twenty‐five studies reported performance of cTn as a dichotomized variable. A few studies, additionally, examined clinical outcome in patients grouped by tertiles by cTn and determined the dose‐response relationship using cTn as a continuous variable. The measure of association between cTn and clinical outcome was reported as HR or OR by 16 studies. The remaining 6 studies reported the number of clinical events in the groups by cTn level and therefore provided unadjusted estimates. The results of all meta‐analyses are depicted in Figure 2.

In‐hospital Clinical Outcomes
Three studies examined the association between cTn level and LOS.[6, 15, 16] One study (n = 808) found increased LOS among patients with elevated cTn.[6] Another study (n = 141), which tested the cTn level as a continuous variable, reported no statistically significant association between cTn level and LOS.[16] A large, multicenter ADHF registry (Acute Decompensated Heart Failure National Registry), which reported elevated cTn as a predictor of LOS (mean stay 6.6 vs 5.5 days; P < 0.001) but did not provide binary data (OR, confidence interval [CI]), was therefore excluded from the meta‐analysis.[15] The pooled HRs from 2 studies revealed a significant increase in LOS in the cohort with elevated cTn (OR: 1.05, 95% CI: 1.01‐1.10, P = 0.06, I2 = 59.5.0%, n = 949). Six studies assessed in‐hospital mortality,[15, 17, 18, 19, 20, 21] and the meta‐analysis showed a significant increase in the risk of death with no significant heterogeneity (OR: 2.57, 95% CI: 2.27‐2.91, P = 0.744, I2 = 0.0%, n = 69,524). Similarly, 4 clinical studies[6, 7, 8, 9] found detectable or elevated cTn as a predictor of worsened composite clinical outcomes of death and major cardiovascular events (OR: 1.33, 95% CI: 1.03‐1.71, P = 0.473, I2 = 0.0%, n = 1,313).
Short‐term (0 to 6 Months) Clinical Outcomes
Short‐term clinical outcome was assessed in 13 studies.[6, 8, 16, 21, 22, 23, 24, 25, 26, 27, 28, 29, 30] Nine studies addressed mortality,[6, 16, 23, 24, 25, 26, 27, 28, 30] 2 studies readmission,[16, 26] and 7 studies a composite of readmission and mortality during 6 months postdischarge.[6, 8, 21, 22, 24, 26, 29] The meta‐analysis showed increased mortality without significant heterogeneity (OR: 2.11, 95% CI: 1.43‐3.12, P = 0.000, I2 8.5%, 9 studies, n = 3471) and an increase in the composite of readmission and mortality with significant heterogeneity (OR: 2.81, 95%CI: 1.60‐4.92, P = 0.000, I2 89.1%, 7 studies, n = 2028) among ADHF patients with detectable or elevated cTn. The association between cTn level and readmission rate over 6 months post‐discharge did not reach statistical significance (OR: 1.00, 95% CI: 0.37‐2.74, P = 0.034, I2 77.9%, 2 studies, n = 641).
Intermediate‐term (Up to 12 Months) Clinical Outcomes
Intermediate‐term (during the 12 months postdischarge) clinical outcome was assessed in seven studies.[18, 24, 31, 32, 33, 34, 35] Five studies reported an association between cTn level and mortality.[18, 24, 32, 34, 35] The meta‐analysis demonstrated an increase in mortality with significant heterogeneity (OR: 2.21, 95% CI: 1.46‐3.35, P = 0.048, I2 58.4%, 5 studies, n = 2801). The pooled HRs of 2 studies examining the association between cTn and readmission rate[18, 32] did not yield statistical significance (OR: 1.55, 95% CI: 0.96‐2.52, P = 0.233, I2 29.6%, 2 studies, n = 590). A meta‐analysis of 5 studies that assessed an association between cTn and outcome[18, 24, 31, 32, 33] showed a significant increase in the risk of composite of readmission and mortality without significant heterogeneity (OR: 2.30, 95% CI: 1.78‐2.99, P = 0.666, I2 0.0%, 5 studies, n = 905) among patients with a detectable or elevated cTn.
Long‐term (>1 Year) Clinical Outcomes
Long‐term clinical outcome was assessed in 7 studies.[18, 19, 21, 24, 28, 36, 37] The meta‐analysis of 6 studies[18, 19, 21, 28, 36, 37] demonstrated an increase in mortality without significant heterogeneity (OR: 3.69, 95% CI: 2.64‐5.18, P = 0.696, I2 0.0%, 6 studies, n = 1891) among ADHF patients with a detectable or elevated cTn. Likewise, a composite of readmission rate and mortality was also increased (OR: 3.49, 95% CI: 2.08‐5.84, P = 0.070, I2 57.5%, 4 studies, n = 448) in a meta‐analysis of 4 studies.[18, 21, 24, 37] The meta‐analysis of 4 studies[18, 19, 24, 37] that assessed the association between cTn level and readmission rate over long‐term follow‐up showed no significant association (OR: 2.60, 95% CI: 0.80‐8.44, P = 0.000, I2 99.9 %, 4 studies, n = 576).
Confidence in the Estimates
Following the Grading of Recommendations Assessment, Development, and Evaluation approach to evaluate the confidence in the estimates from a systematic review and meta‐analysis[38] (ie, certainty or strength of evidence), we found that the association of a detectable or elevated troponin with mortality and readmission is moderate. This is due to a large effect (ie, relative association measure >2.0) demonstrated in observational studies. The confidence in the estimate of association with hospital LOS is low (smaller magnitude of effect). Analyses of in‐hospital outcomes were not associated with statistical heterogeneity, whereas several posthospital analyses had statistically significant heterogeneity.
DISCUSSION
We conducted a systematic review and meta‐analysis of published studies to assess the association between level of cTn and clinical outcomes including LOS, in‐hospital mortality, and short‐, intermediate‐, and long‐term readmission and death following index hospitalization for ADHF. The results of our meta‐analysis showed that compared with negative or not‐elevated cTn, detectable or elevated cTn was associated with increased LOS and higher rates of in‐hospital death among patients with ADHF. In addition, mortality and composite of mortality and readmission at short‐, intermediate‐ or long‐term after index hospitalization were greater in ADHF patients with a detectable or elevated cTn, as compared with those without elevated cTn, with significant heterogeneity across the studies. Finally, relatively fewer studies examined the association between cTn and readmission rate at multiple time periods after index hospitalization for ADHF, and these associations did not reach statistical significance.
In a review of 67,924 patients with ADHF from the US National Registry, which was limited in assessing inpatient mortality, Peacock et al. reported that a positive cardiac troponin test was associated with higher in‐hospital mortality, independently of other predictive variables.[15] We confirmed this observation in the present meta‐analysis, which also incorporated the study by Peacock et al. Furthermore, our data extended the findings of Peacock et al. to postdischarge readmission and death. The association between cTn and clinical outcomes was adjusted to multiple confounders across most studies included in the present meta‐analysis. Few studies in the present meta‐analysis showed a continuous and graded relationship between cTn level and clinical outcomes in patients with ADHF.[15, 35] Findings of previous studies showed that ADHF patients with persistently elevated cTn, measured at multiple time points during or following hospitalization, had worse clinical outcomes than did patients without similar elevation in cTn.[24, 29] Conversely, a decline in cTnT levels on serial measurements was associated with lower rates of adverse clinical outcomes, potentially through alleviation in ongoing myocardial injury.[39] Additionally, elevated cTn in ambulatory heart failure patients predicted incident hospitalization for acute decompensation.[40] Acute myocardial injury reflected by elevated cTn can be hypothesized to promote ventricular remodeling and thereby heart failure progression and consequent adverse clinical outcomes. Consistent with this hypothesis, a rise in cTn was observed in conjunction with elevated biological markers that characterize extracellular matrix remodeling in patients with heart failure during the acute and postacute phase.[41, 42]cTn is released in blood in direct proportion to myocardial injury.[43] A rise or fall in cTn with 1 value at or above the 99th centile URL in conjunction with clinical evidence of myocardial injury defines acute myocardial infarction.[14] Although patients with chronic stable heart failure often have chronically elevated cTn, those with ADHF may demonstrate an acute rise in cTn, with values reaching above the 99th percentile of URL in the absence of acute myocardial infarction.[15, 44] The pathophysiology of elevated cTn in ADHF is probably multifactorial.[14, 45, 46] The prevalence of elevated cTn in ADHF varied with assay sensitivity and the cutoff point chosen. For instance, in an analysis of >105,000 patients with ADHF, the prevalence of elevated cTn was increased from 6.2% with higher (cTnI >1.0 ng/mL or cTnT >0.1 ng/mL) to 75% with a lower cutoff point for cTn levels (cTnI >0.4 ng/mL and cTnT >0.01 ng/mL).[15]
In the general population with no established coronary artery disease, the prevalence of elevated cTn is contingent on sensitivity of the assay, age, and gender.[47, 48, 49, 50] Elevated cTn, beyond conventional risk factors, identifies a subgroup of individuals from the general population who are at high risk for incident heart failure and death.[51] Furthermore, elevated cTn is an independent predictor of short‐ and long‐term cardiovascular events in patients presenting to an emergency department (ED) for ADHF.[52, 53] In 2 large Canadian registries, an elevated cTn was associated with increased risk of death and cardiovascular readmissions at 30 days after ED visit.[53]
A number of recent studies have identified numerous other biomarkers as independent prognostic indicators in patients with heart failure. cTn, when combined with other biomarkers reflecting different dimensions of heart failure pathophysiology such as brain natriuretic peptide (BNP)/N‐terminal pro‐brain natriuretic peptide, soluble ST2, or cystatin C, enhanced the model's predictive utility beyond individual markers. For instance, patients with elevated cTn who also have increased BNP (840 pg/mL) had in‐hospital mortality of 10.2%, which was significantly greater than the 4.4% in patients with elevated BNP without detectable cTn.[54] Additionally, elevated cTn along with elevated pro‐brain natriuretic peptide and cystatin C has been reported to offer incremental prognostic information in patient with ADHF.[33]
The present systematic review and meta‐analysis is the most comprehensive to date and incorporated many observational cohorts with heterogeneous and unselected patient population. The studies have used various commercially available assays for the measurement of cTnT and cTnI. Therefore, findings of this meta‐analysis are applicable to a wider heart failure patient population. This review has several limitations. The association of elevated cTn and clinical outcome is likely affected by several confounders. Although we used adjusted estimates when possible, we did not have individual participant data. Due to the small number of included studies in each analysis, we could not explore heterogeneity causes using subgroup analysis or metaregression. For the same reasons, we could not statistically evaluate publication bias, which is likely in the setting of observational studies. The meta‐analysis is mainly driven by a few large studies.
In summary, in a broad spectrum of patients with ADHF, a detectable or elevated cTn is an independent predictor of major adverse clinical events not only during acute‐phase hospitalization but also after stabilization during the postdischarge phase. cTn is a widely available and inexpensive biomarker that provides important prognostic information and is likely to have important implications for in‐patient care and postdischarge surveillance of patients hospitalized for ADHF.
Disclosures
The authors certify that they have no affiliations with or involvement in any organization or entity with any financial interest (such as honoraria; educational grants; participation in speakers' bureaus; membership, employment, consultancies, stock ownership, or other equity interest; and expert testimony or patent‐licensing arrangements), or nonfinancial interest (such as personal or professional relationships, affiliations, knowledge, or beliefs) in the subject matter or materials discussed in this article.
- Centers for Medicare 98:1778–1786.
- , , , et al. Meta‐analysis of observational studies in epidemiology: A proposal for reporting. Meta‐analysis of observational studies in epidemiology (moose) group. JAMA. 2000;283:2008–2012.
- , , , et al. The PRISMA statement for reporting systematic reviews and meta‐analyses of studies that evaluate healthcare interventions: explanation and elaboration. BMJ. 2009;339:b2700.
- . Critical evaluation of the Newcastle‐Ottawa Scale for the assessment of the quality of nonrandomized studies in meta‐analyses. Eur J Epidemiol. 2010;25:603–605.
- , , , et al. Troponin I in acute decompensated heart failure: Insights from the ascend‐hf study. Eur J Heart Fail. 2012;14:1257–1264.
- , , , , , . Usefulness of an elevated troponin‐I in predicting clinical events in patients admitted with acute heart failure and acute coronary syndrome (from the RITZ‐4 trial). Am J Cardiol. 2004;93:1436–1437.
- , , , et al. Impact of serial troponin release on outcomes in patients with acute heart failure: analysis from the protect pilot study. Circulation. 2011;4:724–732.
- , , , et al. Ongoing myocardial injury in stable severe heart failure: value of cardiac troponin t monitoring for high‐risk patient identification. Circulation. 2004;110:2376–2382.
- , , , et al. Characteristics and outcomes of patients hospitalized for heart failure in the united states: rationale, design, and preliminary observations from the first 100,000 cases in the Acute Decompensated Heart Failure National Registry (ADHERE). Am Heart J. 2005;149:209–216.
- , , . Extracting summary statistics to perform meta‐analyses of the published literature for survival endpoints. Stat Med. 1998;17:2815–2834.
- , , , , . The case of the misleading funnel plot. BMJ. 2006;333:597–600.
- , , , et al. The Newcastle‐Ottawa Scale (NOS) for assessing the quality of nonrandomised studies in meta‐analyses. Available at: http://www.ohri.ca/programs/clinical_epidemiology/oxford.asp. accessed July 3, 2015.
- , , , et al. Third universal definition of myocardial infarction. J Am Coll Cardiol. 2012;60:1581–1598.
- , , , et al.; ADHERE Investigators. Cardiac troponin and outcome in acute heart failure. N Engl J Med. 2008;358:2117–2126.
- , , , et al. Rapid assay brain natriuretic peptide and troponin I in patients hospitalized with decompensated heart failure (from the Evaluation Study of Congestive Heart Failure and Pulmonary Artery Catheterization Effectiveness trial). Am J Cardiol. 2007;100:1427–1433.
- , , , et al. Functional status and co‐morbidities are associated with in‐hospital mortality among older patients with acute decompensated heart failure: a multicentre prospective cohort study. Age Ageing. 2015;44(2):225–231.
- , , , et al. Minor myocardial damage detected by troponin T is a powerful predictor of long‐term prognosis in patients with acute decompensated heart failure. Int J Cardiol. 2005;99:253–261.
- , , , et al. Cardiac troponin T levels are associated with poor short‐ and long‐term prognosis in patients with acute cardiogenic pulmonary edema. Am Heart J. 2002;143:814–820.
- , , , et al. Clinical characteristics and predictors of in‐hospital mortality in acute heart failure with preserved left ventricular ejection fraction. Am J Cardiol. 2011;107:79–84.
- , , , et al. Risk stratification using a combination of cardiac troponin t and brain natriuretic peptide in patients hospitalized for worsening chronic heart failure. Am J Cardiol. 2002;89:691–695.
- , , , , et al. Persistently increased serum concentrations of cardiac troponin in patients with acutely decompensated heart failure are predictive of adverse outcomes. Circ J. 2007;71:1047–1051.
- , , , et al. Cardiac troponin I as diagnostic and prognostic marker in severe heart failure. J Heart Lung Transplant. 2000;19:644–652.
- , , , et al. The role of plasma biomarkers in acute heart failure. Serial changes and independent prognostic value of NT‐proBNP and cardiac troponin‐T. Eur J Heart Fail. 2007;9:776–786.
- , , , et al. Prognostic value of high sensitivity troponin T in patients with acutely decompensated heart failure and non‐detectable conventional troponin T levels. Int J Cardiol. 2013;168:3609–3612.
- , , , et al. Minor myocardial damage is a prevalent condition in patients with acute heart failure syndromes and preserved systolic function with long‐term prognostic implications: CIAST‐HF (Collaborative Italo‐Argentinean Study on cardiac Troponin T in Heart Failure) study. J Card Fail. 2012;18:822–830.
- , , , et al. Acute heart failure: clinical presentation, one‐year mortality and prognostic factors. Eur J Heart Fail. 2005;7:662–670.
- , , , et al. High‐sensitive troponin I after acute cardiac decompensation‐distribution of baseline values and prognostic significance. Paper presented at: Heart Failure Congress 2013; May 25–28, 2013; Lisbon, Portugal.
- , , , . Serial changes in high‐sensitive troponin I predict outcome in patients with decompensated heart failure. Eur J Heart Fail. 2011;13:37–42.
- , , , et al. Multimarker strategy for the prediction of 31 days cardiac death in patients with acutely decompensated chronic heart failure. Int J Cardiol. 2010;141:284–290.
- , , , , , . Cardiac troponin t for risk stratification in decompensated chronic heart failure. [in Portuguese]. Arq Bras Cardiol. 2009;92(5):404–412.
- , , , et al. Troponin T in acute heart failure: clinical implications and prognosis in the Spanish National Registry on Heart Failure. Eur J Intern Med. 2014;25:739–744.
- , , , et al. Complementary prognostic value of cystatin C, N‐terminal pro‐B‐type natriuretic Peptide and cardiac troponin T in patients with acute heart failure. Am J Cardiol. 2009;103:1753–1759.
- , , . Single cardiac troponin t measurement predicts risk for adverse outcome in decompensated heart failure. Arq Bras Cardiol. 2010;94(4):495–501.
- , , , , . Relation between cardiac troponin i and mortality in acute decompensated heart failure. Am Heart J. 2007;153:462–470.
- , , , et al. High‐sensitivity cardiac troponin t predicts non‐cardiac mortality in heart failure. Circ J. 2014;78:890–895.
- , , , et al. Highly sensitive troponin t for risk stratification of acutely destabilized heart failure. Am Heart J. 2012;163(6):1002–1010.
- , , , et al. How to read a systematic review and meta‐analysis and apply the results to patient care: Users' guides to the medical literature. JAMA. 2014;312:171–179.
- , , , et al. Serial biomarker measurements in ambulatory patients with chronic heart failure: the importance of change over time. Circulation. 2007;116:249–257.
- , , , et al. Prognostic value of very low plasma concentrations of troponin T in patients with stable chronic heart failure. Circulation. 2007;116:1242–1249.
- , , , et al. Episodes of acute heart failure syndrome are associated with increased levels of troponin and extracellular matrix markers. Circ Heart Fail. 2010;3:44–50.
- , , , et al. Cardiac microinjury measured by troponin T predicts collagen metabolism in adults aged >=65 years with heart failure. Circ Heart Fail. 2012;5:406–413.
- . Pathobiology of troponin elevations: so elevations occur with myocardial ischemia as well as necrosis? J Am Coll Cardiol. 2011;57:2406–2408.
- , , . Prognostic value of cardiac troponin in chronic stable heart failure: a systematic review. Heart. 2012;98:1778–1786.
- , , , et al. Vascular endothelial dysfunction and mortality risk in patients with chronic heart failure. Circulation. 2005;111:310–314.
- , , , , . Preload induces troponin I degradation independently of myocardial ischemia. Circulation. 2001;103:2035–2037.
- , , ,et al. Prevalence and determinants of troponin T elevation in the general population. Circulation. 2006;113:1958–1965.
- , , , et al. Cardiac troponin‐I and risk of heart failure: a community‐based cohort study. Eur Heart J. 2009;30:773–781.
- , , , et al. Age‐ and sex‐dependent upper reference limits for the high‐sensitivity cardiac troponin t assay. J Am Coll Cardiol. 2014;63:1441–1448.
- , , , et al. Defining high‐sensitivity cardiac troponin concentrations in the community. Clin Chem. 2013;59:1099–1107.
- , , , et al. Association of serial measures of cardiac troponin T using a sensitive assay with incident heart failure and cardiovascular mortality in older adults. JAMA. 2010;304:2494–2502.
- , , , et al. Sensitive cardiac troponin in the diagnosis and risk stratification of acute heart failure. J Intern Med. 2012;271:598–607.
- , , , et al. Outcomes and care of patients with acute heart failure syndromes and cardiac troponin elevation. Circulation. 2013;6:193–202.
- , , , et al.; ADHERE Scientific Advisory Committee and Investigators. Usefulness of B‐type natriuretic peptide and cardiac troponin levels to predict in‐hospital mortality from ADHERE. Am J Cardiol. 2008;101:231–237.
Acute decompensated heart failure (ADHF) accounts for over a million hospitalizations per year, with a reported all‐cause mortality rate 11.7% and all‐cause readmission rate 22.5% at 30 days after initial hospitalization.[1]
Risk stratification for accurate identification of ADHF patients at high risk for readmission and mortality may enable clinicians to undertake timely interventions: triage to appropriate level of care and resource allocation for postdischarge care. Further risk stratification may allow the care team to plan and implement a personalized care plan. Several clinical and laboratory variables have been proposed for identification of patients with ADHF who are at increased risk for adverse clinical outcomes. Despite advances in the risk stratification of patients with ADHF, the accurate prediction of individuals at high risk for readmissions and mortality is challenging. Cardiac troponin T (cTnT) and I (cTnI) are highly sensitive and specific biomarkers that are widely used for the risk stratification of patients with acute myocardial infarction and stable heart failure.[2]
In this systematic review and meta‐analysis, we evaluate circulating cardiac troponin in determining risk for increased length of stay (LOS), hospital readmission, and mortality among patients admitted with ADHF.
METHODS
Data Sources and Searches
This systematic review and meta‐analysis was conducted in accordance with the established methods[3] and Preferred Reporting Items for Systematic Review and Meta‐Analysis (PRISMA) guidelines.[4] Risk of bias was evaluated using the Newcastle‐Ottawa Scale for cohort studies.[5] We performed a comprehensive search of several databases from each database's earliest inception to March 2015 without language restrictions. The databases included MEDLINE In‐Process & Other Non‐Indexed Citations, MEDLINE, Embase, Cochrane Central Register of Controlled Trials, Cochrane Database of Systematic Reviews, and Scopus. We conducted a manual search for bibliography of pertinent reviews for relevant citations that our electronic searches might have missed. The actual strategy is available from the corresponding author.
Study Selection
Eligibility criteria included: (1) randomized or nonrandomized clinical trials involving adults hospitalized with ADHF, (2) comparator groups stratified by cardiac troponin (cTn) level as defined by individual study investigators, and (3) studies reporting 1 or more of the following clinical outcomes: (1) in‐hospital mortality, (2) hospital LOS, (3) major adverse events during hospitalization (defined as persistent dyspnea,[6] worsening of heart failure,[6, 7, 8, 9] worsening of renal function [creatinine 0.3 mg/dL],[8] or recurrent myocardial ischemia[9] after hospitalization for ADHF), (4) postdischarge readmission, (5) postdischarge mortality rate, and (6) the composite of readmission and mortality. We excluded studies incorporating patients with (1) stable heart failure, (2) acute myocarditis, (3) chemotherapy‐induced cardiomyopathy, (4) postsurgical heart failure, (5) transplanted heart, (6) left ventricular assist device, and (7) hemodialysis.
We incorporated the description of ADHF from national registry for defining ADHF.[10] The lower limit of detection of cTn level in healthy subjects is assay dependent, each with a different cutoff value. To improve uniformity of expression in the present meta‐analysis, we arbitrarily stratified groups by the level of cTn: (1) undetected cTn (cTnT <0.01; cTnI <0.012 g/L), (2) detectable cTn (cTnT 0.010.03; cTnI 0.0120.03 g/L), and (3) elevated cTn (cTnT >0.03; cTnI >0.034 g/L).
Data Extraction and Risk of Bias Assessment
From the results of the initial search, 2 investigators (M.Y. and A.D.A), working independently, reviewed articles for eligibility on the basis of titles and abstracts. Studies that satisfied the inclusion and exclusion criteria were retrieved for full‐text review. Disagreements were resolved by consensus after discussion among investigators, and retained conflicts were adjudicated by a third investigator.
We extracted the following data from each study: type of study, number of participants, age, gender, type of cTn assayed and cut point, comorbidities, length of follow‐up, and outcome measure. Prevalence of detectable or elevated cTn, measure of association with clinical outcomes (hazard ratio [HR], odds ratio [OR], or relative risk) were also abstracted. When HR or OR were not reported for an outcome, based on other provided data, we estimated HR using previously validated methods.[11]
Data Synthesis and Analysis
Studies were stratified by cTn cutoff point and length of follow‐up. To reduce heterogeneity, studies reporting clinical outcomes at multiple time periods after the index hospitalization were grouped in three categories: (1) studies with short‐term follow up (06 months), (2) studies with intermediate‐term follow‐up (up to 1 year), and (3) studies with long‐term follow‐up (up to 3.5 years). We used the DerSimonian and Laird random effects model to combine OR or HR reported by individual studies. The consistency of the results of the studies was assessed by I2 statistics, with values >40% considered as indicators of heterogeneity. We evaluated statistically for publication bias if a sufficient number of studies was available, because such evaluation is unreliable when<20 studies are included in a particular analysis.[12]
Sensitivity analyses were performed to investigate the robustness of results to a few assumptions. Analyses were repeated excluding studies reporting unadjusted relative effect measures to assess whether confounding had a large effect on overall results. Similarly, analysis was repeated omitting studies reporting detectable cTn as opposed to elevated cTn level to assess whether these studies influence overall results. All statistical analyses were conducted using Stata 14.0 (StataCorp, College Station, TX).
Quality and Risk of Bias Assessment
The Newcastle‐Ottawa scale was used to assess the quality and risk of bias in cohort studies as suggested by the Cochrane Collaboration.[13] For the assessment of risk of bias, a study was awarded a maximum of 1 star for each of the 7 items from 2 domains: (1) selection of cohort (representativeness of the exposed cohort, selection of the nonexposed cohort, ascertainment of exposure, and demonstration that the outcome of interest was not present at the start of the study) and (2) outcome (assessment of outcome, was the follow‐up long enough, adequacy of the follow‐up of the cohort), and a maximum of 2 stars for comparability of the cohort (comparability on the basis of design and analysis) (Table 1).
| Source | Year | Selection | Compatibility | Outcome | Quality | ||||||
|---|---|---|---|---|---|---|---|---|---|---|---|
| S1 | S2 | S3 | S4 | C1 | C2 | O1 | O2 | O3 | |||
| |||||||||||
| Del Carlo et al.[31] | 2009 | * | * | * | * | * | 5 | ||||
| Felker et al.[6] | 2012 | * | * | * | * | * | 5 | ||||
| Gattis et al.[7] | 2004 | * | * | * | * | * | * | * | 7 | ||
| Guisado Espartero et al.[32] | 2014 | * | * | * | * | * | * | 6 | |||
| Ishii et al.[21] | 2002 | * | * | * | * | * | 5 | ||||
| Kuwabara et al.[22] | 2007 | * | * | * | * | * | 5 | ||||
| La Vecchia et al.[23] | 2000 | * | * | * | * | * | * | * | 7 | ||
| La Corvoisie et al.[17] | 2014 | * | * | * | * | * | * | * | 7 | ||
| Manzano‐Fernandez et al.[33] | 2009 | * | * | * | * | * | 5 | ||||
| Metra et al.[24] | 2007 | * | * | * | * | * | 5 | ||||
| Nakamura et al.[36] | 2014 | * | * | * | * | * | * | * | * | 8 | |
| O'Connor et al.[8] | 2011 | * | * | * | * | * | * | * | * | 8 | |
| Oliveira et al.[34] | 2010 | * | * | * | * | * | * | * | * | 8 | |
| Parissis et al.[20] | 2011 | * | * | * | * | * | * | * | 7 | ||
| Parissis et al.[25] | 2013 | * | * | * | * | * | * | * | * | 8 | |
| Pascual‐Figal et al.[37] | 2012 | * | * | * | * | * | * | 6 | |||
| Peacock et al.[15] | 2008 | * | * | * | * | * | * | * | * | * | 9 |
| Perna et al.[18] | 2005 | * | * | * | * | * | * | * | 7 | ||
| Perna et al.[19] | 2002 | * | * | * | * | * | * | 6 | |||
| Perna et al.[26] | 2012 | * | * | * | * | * | * | 6 | |||
| Rudiger et al.[27] | 2005 | * | * | * | * | * | * | 6 | |||
| Shah et al.[16] | 2007 | * | * | * | * | 4 | |||||
| Wallenborn et al.[28] | 2013 | * | * | * | * | * | * | * | 7 | ||
| Xue et al.[29] | 2011 | * | * | * | * | * | * | * | 7 | ||
| You et al.[35] | 2007 | * | * | * | * | * | * | * | * | * | 9 |
| Zairis et al.[30] | 2010 | * | * | * | * | * | * | * | 7 | ||
RESULTS
Search Results
Figure 1 represents the PRISMA flow diagram for literature search and selection process to identify eligible studies for inclusion.
Characteristics of Included Studies
We identified 26 studies, which were all observational cohorts with postdischarge median follow‐up from 30 days to 472 days. Table 2 summarizes the study characteristics. Studies were heterogeneous with regard to prevalence of elevated cTn, cTn assay, and length of follow‐up. Thirteen were single‐center and 5 were multicenter studies, 4 were substudies of large multicenter phase III clinical trials, and 4 were registries. Except for one abstracts, all studies were peer‐reviewed publications. Sample size ranged from 34 to 69,259 patients.
| Source | Year | Design | Patient Population | CAD | HF Type | LVEF, Mean % | Clinical Outcomes | |||
|---|---|---|---|---|---|---|---|---|---|---|
| No. of Patients | Age, y | Men, % | Follow‐up | Endpoints | ||||||
| ||||||||||
| Del Carlo et al.[31] | 2009 | Single | 70 | 54 16 | 69 | 26 | HFrEF | 31 8 | 262 (3393) days | Readmission, mortality |
| Felker et al.[6] | 2012 | Substudy | 808 | 67 | 70 | 61 | Both | 25 | Hosp, 30 days, 6 months | MAE, LOS, readmission, mortality |
| Gattis et al.[7] | 2004 | Substudy | 133 | NR | NR | NR | NR | NR | Hosp | MAE, mortality |
| Guisado Espartero et al.[32] | 2014 | Registry | 406 | 77 (7678) | 42 | 25 | Both | 50 (4456) | 1 year | Readmission, mortality |
| Ishii et al.[21] | 2002 | Single | 98 | 69 9 | 52 | 45 | NR | 42 17 | Hosp, 60 days, >1 year | Readmission, mortality |
| Kuwabara et al.[22] | 2007 | Single | 52 | 72 12 | 59 | 27 | NR | 47 16 | 143 (13540) days | Readmission, mortality |
| La Vecchia et al.[23] | 2000 | Single | 34 | 60 (2885) | 79 | 38 | HFrEF | NR | 90 days | Mortality |
| La Corvoisie et al.[17] | 2014 | Multicenter | 397 | NR | NR | NR | NR | Hosp | Mortality | |
| Manzano‐Fernandez et al.[33] | 2009 | Single | 138 | 74 (67801) | 54 | 35 | NR | NR | 261 (161449) days | Readmission, mortality |
| Metra et al.[24] | 2007 | Single | 116 | NR | NR | NR | NR | NR | 184 (7444) days | Readmission, mortality |
| Nakamura et al.[36] | 2014 | Single | 444 | NR | 63 | 15 | NR | NR | 472 (2001,200) days | Mortality |
| O'Connor et al.[8] | 2011 | Substudy | 288 | 73 (6577) | 59 | 74 | NR | NR | Hosp, 60 days | MAE, readmission, mortality |
| Oliveira et al.[34] | 2010 | Multicenter | 79 | NR | 61 | 18 | HFrEF | 27 | 8 months | MAE, readmission, mortality |
| Parissis et al.[20] | 2011 | Multicenter | 837 | NR | 48 | 20 | HFpEF | NR | Hosp | Mortality |
| Parissis et al.[25] | 2013 | Single | 113 | 73 11 | 68 | 46 | NR | 36 11 | 174 (94728) days | Mortality |
| Pascual‐Figal et al.[37] | 2012 | Single | 202 | 74 (6780) | 55 | 34 | Both | 49 (3260) | 406 (204728) days | Mortality |
| Peacock et al.[15] | 2008 | Registry | 69,259 | 74 14 | 45 | 56 | Both | 34 | Hosp | LOS, mortality |
| Perna et al.[18] | 2005 | Single | 184 | 64 13 | 60 | 38 | Both | NR | Hosp, 3 years | Readmission, mortality |
| Perna et al.[19] | 2002 | Single | 84 | 65 14 | 62 | 55 | NR | NR | Hosp, 1 year | Readmission, mortality |
| Perna et al.[26] | 2012 | Single | 500 | 73 12 | 53 | 38 | HFpEF | 53 11 | 6 months | Readmission, mortality |
| Rudiger et al.[27] | 2005 | Multicenter | 312 | 73 12 | 56 | 70 | Both | NR | 30 days, 1 year | Mortality |
| Shah et al.[16] | 2007 | Substudy | 141 | NR | NR | NR | HFrEF | NR | Hosp, 6 months | LOS, readmission, mortality |
| Wallenborn et al.[28] | 2013 | Registry | 879 | 69 12 | 72 | 50 | NR | 30 8 | 06 months, 618 months | Mortality |
| Xue et al.[29] | 2011 | Single | 144 | 68 13 | 98 | 62 | Both | 43 18 | 90 days | Readmission, mortality |
| You et al.[35] | 2007 | Registry | 2,025 | 76 11 | 50 | 55 | Both | NR | 1 year | Mortality |
| Zairis et al.[30] | 2010 | Multicenter | 577 | 74 8 | 68 | 77 | HFrEF | 23 5 | 31 days | Mortality |
Table 3 stratifies the characteristics of study populations by cTn status. The studies included 77,297 participants hospitalized for ADHF, of whom 7176 (9.3%) had detectable or elevated cTn level. Twenty‐five studies reported data on type of cTn measured (cTnI, cTnT, or both) and reported cutoff values for detectable or elevated cTn (Table 3). The percentages of patients who had detectable or elevated cTn varied widely across the studies (6.2%68%). Most studies utilized standard assays, and the cutoff point for cTn level was chosen arbitrary by study investigators or derived from receiver operating characteristic curve analysis. cTn level is assay dependent. For instance, the 99th centile upper reference limit (URL) is 0.014 ng/mL for cTnT with the Roche high‐sensitivity cTnT assay, and 0.04 ng/mL with the Siemens cTnI‐ultra assay. Few studies of the present meta‐analysis incorporated a cTn cutoff point that defined acute myocardial infarction.[14] Nine studies used a lower threshold cTn level (cTnT >0.01>0.03; cTnI >0.03) for stratification into comparator groups.
| Source | Year | No. of Patients | No. cTn+ (%) | cTn Cutoff | Age | Male | Atrial Fibrillation | CAD | ||
|---|---|---|---|---|---|---|---|---|---|---|
| Tn+ | Tn | Tn+ (%) | No. (%) | Tn+ (%) | Tn+ (%) | |||||
| ||||||||||
| Del Carlo et al.[31] | 2009 | 70 | 12 (17) | cTnT 0.10 | NR | NR | NR | 13 (19) | NR | NR |
| Felker et al.[6] | 2012 | 808 | 404 (50) | cTnT 0.034 | 69 | 65 | 364 (54) | 334 (41) | 170 (42) | 243 (60) |
| Gattis et al.[7] | 2004 | 133 | 91 (68) | cTnT 1.0 | 70 (6180) | 77 (6282) | 46 (50) | NR | NR | NR |
| Guisado Espartero et al.[32] | 2014 | 406 | 241 (60) | cTnT 0.02 | NR | NR | 116 (48) | 236 (58) | 136 (56) | 74 (31) |
| Ishii et al.[21] | 2002 | 98 | NR | cTnT 0.1 | NR | NR | NR | NR | NR | NR |
| Kuwabara et al.[22] | 2007 | 52 | 31 (60) | NR | NR | NR | 31 (59) | 23 (44) | NR | NR |
| La Vecchia et al.[23] | 2000 | 34 | 10 (29) | cTnI 0.4 | 56 13 | 62 12 | 100 | 19 (56) | 5 (50) | 3 (30) |
| La Corvoisie et al.[17] | 2014 | 397 | NR | cTnI0.15 | NR | NR | NR | NR | NR | NR |
| Manzano‐Fernandez et al.[33] | 2009 | 138 | NR | cTnT 0.011 | NR | NR | NR | NR | NR | NR |
| Metra et al.[24] | 2007 | 116 | 41 (38) | cTnT 0.01 | NR | NR | NR | NR | NR | 33 (61) |
| Nakamura et al.[36] | 2014 | 444 | 224 (51) | cTnT 0.028 | 67 14 | 66 14 | 133 (60) | 160 (36) | 72 (32) | 35 (16) |
| O'Connor et al.[8] | 2011 | 288 | 97 (34) | cTnT 0.03 | 71 | 72 | 67 (69) | NR | NR | NR |
| Oliveira et al.[34] | 2010 | 79 | 37 (47) | ctnT 0.02 | 57 18 | 54 17 | 26 (70) | NR | NR | 6 (16) |
| Parissis et al.[20] | 2011 | 837 | 184 (22) | cTnT >0.01 | NR | NR | NR | NR | NR | NR |
| Parissis et al.[25] | 2013 | 113 | 37 (33) | cTnT 0.077 | 74 8 | 72 12 | 22 (59) | 36 (32) | 12 (32) | 18 (49) |
| Pascual‐Figal et al.[37] | 2012 | 202 | NR | cTnT >0.02 | NR | NR | NR | 109 (54) | NR | NR |
| Peacock et al.[15] | 2008 | 69,259 | 4,240 (6.2) | cTnI 1.0; cTnT 0.1 | 73 14 | 73 14 | 2,035 (48) | 207 (30) | 975 (23) | 2,586 (58) |
| Perna et al.[18] | 2005 | 184 | 58 (31) | cTnT 0.1 | 64 13 | 65 13 | 37 (64) | NR | NR | 30 (52) |
| Perna et al.[19] | 2002 | 84 | 46 (55) | cTnT 0.1 | 68 11 | 61 16 | 27 (59) | NR | NR | 33 (72) |
| Perna et al.[26] | 2012 | 500 | 220 (44) | cTnT 0.02 | 74 10 | 72 14 | 125 (59) | 177 (35) | 70 (32) | 110 (50) |
| Rudiger et al.[27] | 2005 | 312 | 88 (28) | cTnT 0.1 | NR | NR | NR | NR | NR | NR |
| Shah et al.[16] | 2007 | 141 | NR | cTnI per 0.1 | NR | NR | NR | NR | NR | NR |
| Wallenborn et al.[28] | 2013 | 879 | 332 (37) | cTnT 0.06 | NR | NR | NR | NR | NR | NR (50) |
| Xue et al.[29] | 2011 | 144 | NR | cTnI 0.023 | NR | NR | NR | NR | NR | NR |
| You et al.[35] | 2007 | 2,025 | 669 (34) | cTnI >0.5 | 77 11 | 75 11 | 364 (53) | NR | NR | 417 (60) |
| Zairis et al.[30] | 2010 | 577 | 114 (20) | cTnI 0.42 | NR | NR | NR | 295 (51) | NR | 443 (77) |
Twenty‐five studies reported performance of cTn as a dichotomized variable. A few studies, additionally, examined clinical outcome in patients grouped by tertiles by cTn and determined the dose‐response relationship using cTn as a continuous variable. The measure of association between cTn and clinical outcome was reported as HR or OR by 16 studies. The remaining 6 studies reported the number of clinical events in the groups by cTn level and therefore provided unadjusted estimates. The results of all meta‐analyses are depicted in Figure 2.
In‐hospital Clinical Outcomes
Three studies examined the association between cTn level and LOS.[6, 15, 16] One study (n = 808) found increased LOS among patients with elevated cTn.[6] Another study (n = 141), which tested the cTn level as a continuous variable, reported no statistically significant association between cTn level and LOS.[16] A large, multicenter ADHF registry (Acute Decompensated Heart Failure National Registry), which reported elevated cTn as a predictor of LOS (mean stay 6.6 vs 5.5 days; P < 0.001) but did not provide binary data (OR, confidence interval [CI]), was therefore excluded from the meta‐analysis.[15] The pooled HRs from 2 studies revealed a significant increase in LOS in the cohort with elevated cTn (OR: 1.05, 95% CI: 1.01‐1.10, P = 0.06, I2 = 59.5.0%, n = 949). Six studies assessed in‐hospital mortality,[15, 17, 18, 19, 20, 21] and the meta‐analysis showed a significant increase in the risk of death with no significant heterogeneity (OR: 2.57, 95% CI: 2.27‐2.91, P = 0.744, I2 = 0.0%, n = 69,524). Similarly, 4 clinical studies[6, 7, 8, 9] found detectable or elevated cTn as a predictor of worsened composite clinical outcomes of death and major cardiovascular events (OR: 1.33, 95% CI: 1.03‐1.71, P = 0.473, I2 = 0.0%, n = 1,313).
Short‐term (0 to 6 Months) Clinical Outcomes
Short‐term clinical outcome was assessed in 13 studies.[6, 8, 16, 21, 22, 23, 24, 25, 26, 27, 28, 29, 30] Nine studies addressed mortality,[6, 16, 23, 24, 25, 26, 27, 28, 30] 2 studies readmission,[16, 26] and 7 studies a composite of readmission and mortality during 6 months postdischarge.[6, 8, 21, 22, 24, 26, 29] The meta‐analysis showed increased mortality without significant heterogeneity (OR: 2.11, 95% CI: 1.43‐3.12, P = 0.000, I2 8.5%, 9 studies, n = 3471) and an increase in the composite of readmission and mortality with significant heterogeneity (OR: 2.81, 95%CI: 1.60‐4.92, P = 0.000, I2 89.1%, 7 studies, n = 2028) among ADHF patients with detectable or elevated cTn. The association between cTn level and readmission rate over 6 months post‐discharge did not reach statistical significance (OR: 1.00, 95% CI: 0.37‐2.74, P = 0.034, I2 77.9%, 2 studies, n = 641).
Intermediate‐term (Up to 12 Months) Clinical Outcomes
Intermediate‐term (during the 12 months postdischarge) clinical outcome was assessed in seven studies.[18, 24, 31, 32, 33, 34, 35] Five studies reported an association between cTn level and mortality.[18, 24, 32, 34, 35] The meta‐analysis demonstrated an increase in mortality with significant heterogeneity (OR: 2.21, 95% CI: 1.46‐3.35, P = 0.048, I2 58.4%, 5 studies, n = 2801). The pooled HRs of 2 studies examining the association between cTn and readmission rate[18, 32] did not yield statistical significance (OR: 1.55, 95% CI: 0.96‐2.52, P = 0.233, I2 29.6%, 2 studies, n = 590). A meta‐analysis of 5 studies that assessed an association between cTn and outcome[18, 24, 31, 32, 33] showed a significant increase in the risk of composite of readmission and mortality without significant heterogeneity (OR: 2.30, 95% CI: 1.78‐2.99, P = 0.666, I2 0.0%, 5 studies, n = 905) among patients with a detectable or elevated cTn.
Long‐term (>1 Year) Clinical Outcomes
Long‐term clinical outcome was assessed in 7 studies.[18, 19, 21, 24, 28, 36, 37] The meta‐analysis of 6 studies[18, 19, 21, 28, 36, 37] demonstrated an increase in mortality without significant heterogeneity (OR: 3.69, 95% CI: 2.64‐5.18, P = 0.696, I2 0.0%, 6 studies, n = 1891) among ADHF patients with a detectable or elevated cTn. Likewise, a composite of readmission rate and mortality was also increased (OR: 3.49, 95% CI: 2.08‐5.84, P = 0.070, I2 57.5%, 4 studies, n = 448) in a meta‐analysis of 4 studies.[18, 21, 24, 37] The meta‐analysis of 4 studies[18, 19, 24, 37] that assessed the association between cTn level and readmission rate over long‐term follow‐up showed no significant association (OR: 2.60, 95% CI: 0.80‐8.44, P = 0.000, I2 99.9 %, 4 studies, n = 576).
Confidence in the Estimates
Following the Grading of Recommendations Assessment, Development, and Evaluation approach to evaluate the confidence in the estimates from a systematic review and meta‐analysis[38] (ie, certainty or strength of evidence), we found that the association of a detectable or elevated troponin with mortality and readmission is moderate. This is due to a large effect (ie, relative association measure >2.0) demonstrated in observational studies. The confidence in the estimate of association with hospital LOS is low (smaller magnitude of effect). Analyses of in‐hospital outcomes were not associated with statistical heterogeneity, whereas several posthospital analyses had statistically significant heterogeneity.
DISCUSSION
We conducted a systematic review and meta‐analysis of published studies to assess the association between level of cTn and clinical outcomes including LOS, in‐hospital mortality, and short‐, intermediate‐, and long‐term readmission and death following index hospitalization for ADHF. The results of our meta‐analysis showed that compared with negative or not‐elevated cTn, detectable or elevated cTn was associated with increased LOS and higher rates of in‐hospital death among patients with ADHF. In addition, mortality and composite of mortality and readmission at short‐, intermediate‐ or long‐term after index hospitalization were greater in ADHF patients with a detectable or elevated cTn, as compared with those without elevated cTn, with significant heterogeneity across the studies. Finally, relatively fewer studies examined the association between cTn and readmission rate at multiple time periods after index hospitalization for ADHF, and these associations did not reach statistical significance.
In a review of 67,924 patients with ADHF from the US National Registry, which was limited in assessing inpatient mortality, Peacock et al. reported that a positive cardiac troponin test was associated with higher in‐hospital mortality, independently of other predictive variables.[15] We confirmed this observation in the present meta‐analysis, which also incorporated the study by Peacock et al. Furthermore, our data extended the findings of Peacock et al. to postdischarge readmission and death. The association between cTn and clinical outcomes was adjusted to multiple confounders across most studies included in the present meta‐analysis. Few studies in the present meta‐analysis showed a continuous and graded relationship between cTn level and clinical outcomes in patients with ADHF.[15, 35] Findings of previous studies showed that ADHF patients with persistently elevated cTn, measured at multiple time points during or following hospitalization, had worse clinical outcomes than did patients without similar elevation in cTn.[24, 29] Conversely, a decline in cTnT levels on serial measurements was associated with lower rates of adverse clinical outcomes, potentially through alleviation in ongoing myocardial injury.[39] Additionally, elevated cTn in ambulatory heart failure patients predicted incident hospitalization for acute decompensation.[40] Acute myocardial injury reflected by elevated cTn can be hypothesized to promote ventricular remodeling and thereby heart failure progression and consequent adverse clinical outcomes. Consistent with this hypothesis, a rise in cTn was observed in conjunction with elevated biological markers that characterize extracellular matrix remodeling in patients with heart failure during the acute and postacute phase.[41, 42]cTn is released in blood in direct proportion to myocardial injury.[43] A rise or fall in cTn with 1 value at or above the 99th centile URL in conjunction with clinical evidence of myocardial injury defines acute myocardial infarction.[14] Although patients with chronic stable heart failure often have chronically elevated cTn, those with ADHF may demonstrate an acute rise in cTn, with values reaching above the 99th percentile of URL in the absence of acute myocardial infarction.[15, 44] The pathophysiology of elevated cTn in ADHF is probably multifactorial.[14, 45, 46] The prevalence of elevated cTn in ADHF varied with assay sensitivity and the cutoff point chosen. For instance, in an analysis of >105,000 patients with ADHF, the prevalence of elevated cTn was increased from 6.2% with higher (cTnI >1.0 ng/mL or cTnT >0.1 ng/mL) to 75% with a lower cutoff point for cTn levels (cTnI >0.4 ng/mL and cTnT >0.01 ng/mL).[15]
In the general population with no established coronary artery disease, the prevalence of elevated cTn is contingent on sensitivity of the assay, age, and gender.[47, 48, 49, 50] Elevated cTn, beyond conventional risk factors, identifies a subgroup of individuals from the general population who are at high risk for incident heart failure and death.[51] Furthermore, elevated cTn is an independent predictor of short‐ and long‐term cardiovascular events in patients presenting to an emergency department (ED) for ADHF.[52, 53] In 2 large Canadian registries, an elevated cTn was associated with increased risk of death and cardiovascular readmissions at 30 days after ED visit.[53]
A number of recent studies have identified numerous other biomarkers as independent prognostic indicators in patients with heart failure. cTn, when combined with other biomarkers reflecting different dimensions of heart failure pathophysiology such as brain natriuretic peptide (BNP)/N‐terminal pro‐brain natriuretic peptide, soluble ST2, or cystatin C, enhanced the model's predictive utility beyond individual markers. For instance, patients with elevated cTn who also have increased BNP (840 pg/mL) had in‐hospital mortality of 10.2%, which was significantly greater than the 4.4% in patients with elevated BNP without detectable cTn.[54] Additionally, elevated cTn along with elevated pro‐brain natriuretic peptide and cystatin C has been reported to offer incremental prognostic information in patient with ADHF.[33]
The present systematic review and meta‐analysis is the most comprehensive to date and incorporated many observational cohorts with heterogeneous and unselected patient population. The studies have used various commercially available assays for the measurement of cTnT and cTnI. Therefore, findings of this meta‐analysis are applicable to a wider heart failure patient population. This review has several limitations. The association of elevated cTn and clinical outcome is likely affected by several confounders. Although we used adjusted estimates when possible, we did not have individual participant data. Due to the small number of included studies in each analysis, we could not explore heterogeneity causes using subgroup analysis or metaregression. For the same reasons, we could not statistically evaluate publication bias, which is likely in the setting of observational studies. The meta‐analysis is mainly driven by a few large studies.
In summary, in a broad spectrum of patients with ADHF, a detectable or elevated cTn is an independent predictor of major adverse clinical events not only during acute‐phase hospitalization but also after stabilization during the postdischarge phase. cTn is a widely available and inexpensive biomarker that provides important prognostic information and is likely to have important implications for in‐patient care and postdischarge surveillance of patients hospitalized for ADHF.
Disclosures
The authors certify that they have no affiliations with or involvement in any organization or entity with any financial interest (such as honoraria; educational grants; participation in speakers' bureaus; membership, employment, consultancies, stock ownership, or other equity interest; and expert testimony or patent‐licensing arrangements), or nonfinancial interest (such as personal or professional relationships, affiliations, knowledge, or beliefs) in the subject matter or materials discussed in this article.
- Centers for Medicare 98:1778–1786.
- , , , et al. Meta‐analysis of observational studies in epidemiology: A proposal for reporting. Meta‐analysis of observational studies in epidemiology (moose) group. JAMA. 2000;283:2008–2012.
- , , , et al. The PRISMA statement for reporting systematic reviews and meta‐analyses of studies that evaluate healthcare interventions: explanation and elaboration. BMJ. 2009;339:b2700.
- . Critical evaluation of the Newcastle‐Ottawa Scale for the assessment of the quality of nonrandomized studies in meta‐analyses. Eur J Epidemiol. 2010;25:603–605.
- , , , et al. Troponin I in acute decompensated heart failure: Insights from the ascend‐hf study. Eur J Heart Fail. 2012;14:1257–1264.
- , , , , , . Usefulness of an elevated troponin‐I in predicting clinical events in patients admitted with acute heart failure and acute coronary syndrome (from the RITZ‐4 trial). Am J Cardiol. 2004;93:1436–1437.
- , , , et al. Impact of serial troponin release on outcomes in patients with acute heart failure: analysis from the protect pilot study. Circulation. 2011;4:724–732.
- , , , et al. Ongoing myocardial injury in stable severe heart failure: value of cardiac troponin t monitoring for high‐risk patient identification. Circulation. 2004;110:2376–2382.
- , , , et al. Characteristics and outcomes of patients hospitalized for heart failure in the united states: rationale, design, and preliminary observations from the first 100,000 cases in the Acute Decompensated Heart Failure National Registry (ADHERE). Am Heart J. 2005;149:209–216.
- , , . Extracting summary statistics to perform meta‐analyses of the published literature for survival endpoints. Stat Med. 1998;17:2815–2834.
- , , , , . The case of the misleading funnel plot. BMJ. 2006;333:597–600.
- , , , et al. The Newcastle‐Ottawa Scale (NOS) for assessing the quality of nonrandomised studies in meta‐analyses. Available at: http://www.ohri.ca/programs/clinical_epidemiology/oxford.asp. accessed July 3, 2015.
- , , , et al. Third universal definition of myocardial infarction. J Am Coll Cardiol. 2012;60:1581–1598.
- , , , et al.; ADHERE Investigators. Cardiac troponin and outcome in acute heart failure. N Engl J Med. 2008;358:2117–2126.
- , , , et al. Rapid assay brain natriuretic peptide and troponin I in patients hospitalized with decompensated heart failure (from the Evaluation Study of Congestive Heart Failure and Pulmonary Artery Catheterization Effectiveness trial). Am J Cardiol. 2007;100:1427–1433.
- , , , et al. Functional status and co‐morbidities are associated with in‐hospital mortality among older patients with acute decompensated heart failure: a multicentre prospective cohort study. Age Ageing. 2015;44(2):225–231.
- , , , et al. Minor myocardial damage detected by troponin T is a powerful predictor of long‐term prognosis in patients with acute decompensated heart failure. Int J Cardiol. 2005;99:253–261.
- , , , et al. Cardiac troponin T levels are associated with poor short‐ and long‐term prognosis in patients with acute cardiogenic pulmonary edema. Am Heart J. 2002;143:814–820.
- , , , et al. Clinical characteristics and predictors of in‐hospital mortality in acute heart failure with preserved left ventricular ejection fraction. Am J Cardiol. 2011;107:79–84.
- , , , et al. Risk stratification using a combination of cardiac troponin t and brain natriuretic peptide in patients hospitalized for worsening chronic heart failure. Am J Cardiol. 2002;89:691–695.
- , , , , et al. Persistently increased serum concentrations of cardiac troponin in patients with acutely decompensated heart failure are predictive of adverse outcomes. Circ J. 2007;71:1047–1051.
- , , , et al. Cardiac troponin I as diagnostic and prognostic marker in severe heart failure. J Heart Lung Transplant. 2000;19:644–652.
- , , , et al. The role of plasma biomarkers in acute heart failure. Serial changes and independent prognostic value of NT‐proBNP and cardiac troponin‐T. Eur J Heart Fail. 2007;9:776–786.
- , , , et al. Prognostic value of high sensitivity troponin T in patients with acutely decompensated heart failure and non‐detectable conventional troponin T levels. Int J Cardiol. 2013;168:3609–3612.
- , , , et al. Minor myocardial damage is a prevalent condition in patients with acute heart failure syndromes and preserved systolic function with long‐term prognostic implications: CIAST‐HF (Collaborative Italo‐Argentinean Study on cardiac Troponin T in Heart Failure) study. J Card Fail. 2012;18:822–830.
- , , , et al. Acute heart failure: clinical presentation, one‐year mortality and prognostic factors. Eur J Heart Fail. 2005;7:662–670.
- , , , et al. High‐sensitive troponin I after acute cardiac decompensation‐distribution of baseline values and prognostic significance. Paper presented at: Heart Failure Congress 2013; May 25–28, 2013; Lisbon, Portugal.
- , , , . Serial changes in high‐sensitive troponin I predict outcome in patients with decompensated heart failure. Eur J Heart Fail. 2011;13:37–42.
- , , , et al. Multimarker strategy for the prediction of 31 days cardiac death in patients with acutely decompensated chronic heart failure. Int J Cardiol. 2010;141:284–290.
- , , , , , . Cardiac troponin t for risk stratification in decompensated chronic heart failure. [in Portuguese]. Arq Bras Cardiol. 2009;92(5):404–412.
- , , , et al. Troponin T in acute heart failure: clinical implications and prognosis in the Spanish National Registry on Heart Failure. Eur J Intern Med. 2014;25:739–744.
- , , , et al. Complementary prognostic value of cystatin C, N‐terminal pro‐B‐type natriuretic Peptide and cardiac troponin T in patients with acute heart failure. Am J Cardiol. 2009;103:1753–1759.
- , , . Single cardiac troponin t measurement predicts risk for adverse outcome in decompensated heart failure. Arq Bras Cardiol. 2010;94(4):495–501.
- , , , , . Relation between cardiac troponin i and mortality in acute decompensated heart failure. Am Heart J. 2007;153:462–470.
- , , , et al. High‐sensitivity cardiac troponin t predicts non‐cardiac mortality in heart failure. Circ J. 2014;78:890–895.
- , , , et al. Highly sensitive troponin t for risk stratification of acutely destabilized heart failure. Am Heart J. 2012;163(6):1002–1010.
- , , , et al. How to read a systematic review and meta‐analysis and apply the results to patient care: Users' guides to the medical literature. JAMA. 2014;312:171–179.
- , , , et al. Serial biomarker measurements in ambulatory patients with chronic heart failure: the importance of change over time. Circulation. 2007;116:249–257.
- , , , et al. Prognostic value of very low plasma concentrations of troponin T in patients with stable chronic heart failure. Circulation. 2007;116:1242–1249.
- , , , et al. Episodes of acute heart failure syndrome are associated with increased levels of troponin and extracellular matrix markers. Circ Heart Fail. 2010;3:44–50.
- , , , et al. Cardiac microinjury measured by troponin T predicts collagen metabolism in adults aged >=65 years with heart failure. Circ Heart Fail. 2012;5:406–413.
- . Pathobiology of troponin elevations: so elevations occur with myocardial ischemia as well as necrosis? J Am Coll Cardiol. 2011;57:2406–2408.
- , , . Prognostic value of cardiac troponin in chronic stable heart failure: a systematic review. Heart. 2012;98:1778–1786.
- , , , et al. Vascular endothelial dysfunction and mortality risk in patients with chronic heart failure. Circulation. 2005;111:310–314.
- , , , , . Preload induces troponin I degradation independently of myocardial ischemia. Circulation. 2001;103:2035–2037.
- , , ,et al. Prevalence and determinants of troponin T elevation in the general population. Circulation. 2006;113:1958–1965.
- , , , et al. Cardiac troponin‐I and risk of heart failure: a community‐based cohort study. Eur Heart J. 2009;30:773–781.
- , , , et al. Age‐ and sex‐dependent upper reference limits for the high‐sensitivity cardiac troponin t assay. J Am Coll Cardiol. 2014;63:1441–1448.
- , , , et al. Defining high‐sensitivity cardiac troponin concentrations in the community. Clin Chem. 2013;59:1099–1107.
- , , , et al. Association of serial measures of cardiac troponin T using a sensitive assay with incident heart failure and cardiovascular mortality in older adults. JAMA. 2010;304:2494–2502.
- , , , et al. Sensitive cardiac troponin in the diagnosis and risk stratification of acute heart failure. J Intern Med. 2012;271:598–607.
- , , , et al. Outcomes and care of patients with acute heart failure syndromes and cardiac troponin elevation. Circulation. 2013;6:193–202.
- , , , et al.; ADHERE Scientific Advisory Committee and Investigators. Usefulness of B‐type natriuretic peptide and cardiac troponin levels to predict in‐hospital mortality from ADHERE. Am J Cardiol. 2008;101:231–237.
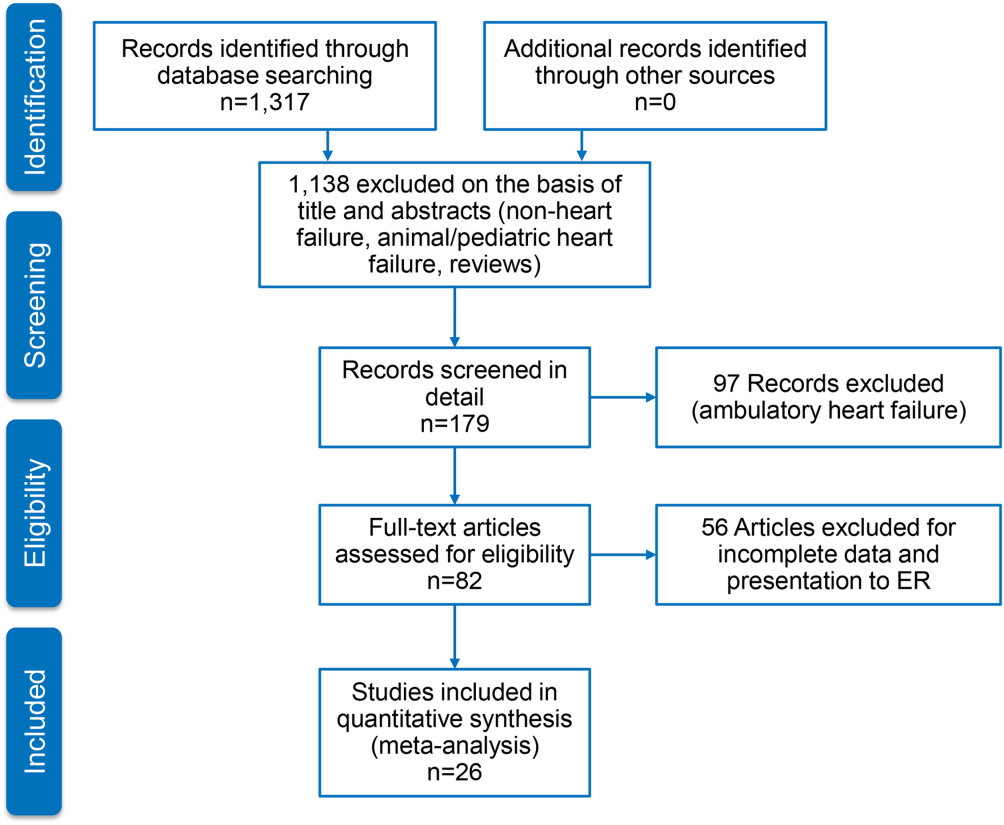
Flibanserin for hypoactive sexual desire disorder in premenopausal women
Flibanserin, FDA-approved in August 2015, is the first medication approved to treat acquired, generalized hypoactive sexual desire disorder (HSDD) in premenopausal women (Table 1). In clinical trials,1-4 the drug has shown modest efficacy in improving symptoms of low sexual desire (number of satisfying sexual events [SSEs], sexual desire, and overall sexual function). Flibanserin is not indicated to enhance sexual performance, for HSDD in postmenopausal women, or in men.
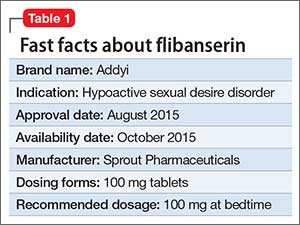
Clinical implications
Flibanserin could help premenopausal women who have distressing low sexual desire, which must be acquired and generalized:
- “Acquired low sexual desire” means that a patient had an adequate sexual desire that decreased or ceased for an unknown reason.
- “Generalized low sexual desire” means that lack of sexual desire occurs all the time and in all situations, not only with a certain partner or in some situations.
Women taking flibanserin could experience gradually increased sexual desire, increase in SSEs, and decrease of sexual distress. Flibanserin is indicated for long-term use; however, it should be discontinued after 8 weeks if the patient does not report any improvement in symptoms.
The number needed to treat with flibanserin likely would be rather large, but it is not available because of complex outcome measures in clinical trials. Flibanserin was not approved at 2 previous FDA committee hearings—mainly because of safety issues but also because of concerns about efficacy. For example, during the 2013 FDA hearing, the results presented showed statistically significant, but numerically small, treatment differences at 24 weeks compared with placebo. In an FDA responder analysis of the Phase-III trials, after accounting for the placebo effect, approximately 8% to 13% women were at least “much improved” on at least 1 of the primary outcomes.5
Flibanserin is not indicated for women whose sexual desire is due to (1) coexisting medical or psychiatric condition, (2) effects of medication or substance abuse, or (3) a relationship problem. It is unknown whether supplemental treatment would help these patients; however, it seems reasonable that combining flibanserin with psychosocial treatment, such as sex therapy or individual therapy, could be beneficial because it may be difficult to disentangle sexual dysfunction and relationship issues—2 problems that often are interwoven.
How it works
Flibanserin is a serotonin 1A receptor agonist and serotonin 2A receptor antagonist. In vitro, flibanserin demonstrated high affinity for the following 5-HT receptors:
- agonist activity at 5-HT1A
- antagonist activity at 5-HT2A, mostly in the prefrontal cortex.
Flibanserin also has moderate antagonist activities at the 5-HT2B, 5-HT2C, and dopamine D4 receptors. Flibanserin presumably acts centrally in the CNS; it has been suggested that flibanserin could rebalance neural circuitry involved in processing sexual desire by reducing serotonin activity and enhancing dopamine and epinephrine activity. The exact mechanism of how flibanserin improves sexual desire in women is unknown.
Pharmacokinetics
Flibanserin has a mean termination half-life of approximately 11 hours. It is administered once a day (50 to 100 mg) at bedtime. Steady state in healthy women was achieved after 3 days. Based on clinical observations, onset of action seems to be gradual and reaches maximum efficacy in approximately 8 weeks. Patients should discontinue the drug if no improvement is reported after 8 weeks. Flibanserin is readily absorbed from the gastrointestinal tract; however, food slows its absorption. The drug is 98% protein (mostly albumin)-bound.
Flibanserin is primarily metabolized in the liver by cytochrome P450 (CYP) 3A4 and to a lesser extent by CYP2C19. Co-administration of moderate (diltiazem, erythromycin, fluconazole, fosamprenavir, verapamil) or strong (eg, ketoconazole, clarithromycin, nefazodone, ritonavir) CYP3A4 inhibitors increases the concentration of flibanserin. This could lead to severe hypotension and syncope; therefore, co-administering flibanserin with a strong CYP3A4 inhibitor is contraindicated. Grapefruit juice is a moderate inhibitor of CYP3A4, and in a study of 26 healthy females, 240 mL of grapefruit juice increased flibanserin concentration 1.4-fold. Flibanserin is excreted though urine and feces. Flibanserin should be taken once a day at bedtime because of sedation, somnolence, and possible syncope.
Efficacy
The efficacy of flibanserin for treating HSDD was established in three 24-week, randomized, double-blind, placebo-controlled studies (Table 2). The target population in these studies was premenopausal women (mean age 36, range 19 to 55) with acquired HSDD lasting at least 6 months (mean duration, approximately 5 years). The 3 studies included 1,187 women who received flibanserin, 100 mg at bedtime, and 1,188 women who received placebo. Participants were mostly white (88.6%), and included black (9.6%) and Asian (1.5%) women. The completion rates were 69% for flibanserin and 78% for placebo. Some of the trials included arms with a lower dosage of flibanserin (25 mg and 50 mg), which are not included in this analysis.
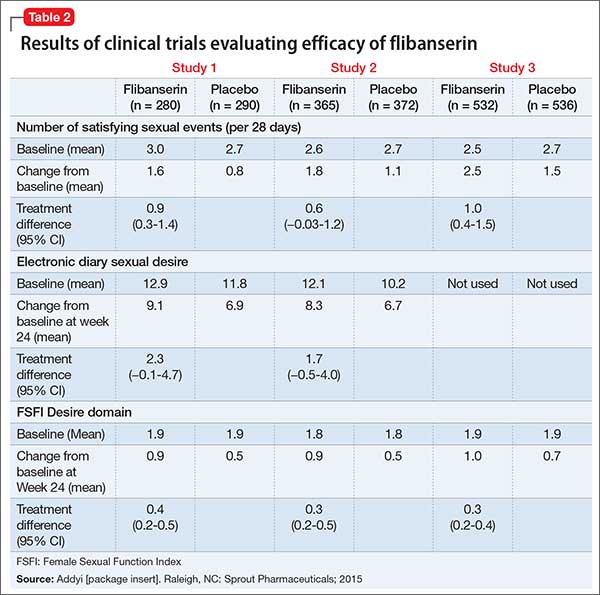
As noted in the package insert, these trials each had 2 co-primary efficacy endpoints, SSEs and sexual desire:
- change from baseline to Week 24 in the number of monthly SSEs (ie, sexual intercourse, oral sex, masturbation, or genital stimulation by the partner)
- change in sexual desire from baseline to 24-week endpoint.
In Study 1 and 2, change in sexual desire from baseline to Week 24 was measured daily by using an electronic diary. Every day, patients rated their sexual desire level by answering the question, “Indicate your most intense level of sexual desire” from 0 (no desire) to 3 (strong desire). These responses were totaled over a 28-day period to yield the monthly sexual desire score, which ranged from 0 to 84. These 2 studies also used the Female Sexual Function Index (FSFI) Desire domain as a secondary endpoint.
Study 3 used the FSFI Desire domain, comprising 2 questions, as the sexual desire co-primary endpoint:
- “Over the past 4 weeks, how often did you feel sexual desire or interest?” Responses ranged from 1 (almost never or never) to 5 (almost always or always).
- “Over the past 4 weeks, how would you rate your level (degree) of sexual desire or interest?” Responses ranged from 1 (very low or none at all) to 5 (very high).
In all 3 trials, flibanserin was associated with a small, yet statistically significant, improvement in change in monthly SSEs from baseline to Week 24 compared with placebo. In Study 1 and 2, there were no statistically significant differences between flibanserin and placebo for the electronic diary sexual desire endpoint. In the third study, there was statistically significant improvement in the change in sexual desire using the FSFI Desire domain with flibanserin compared with placebo. The FSFI Desire domain findings were consistent across all 3 trials. Flibanserin was associated with a decrease in sexual distress compared with placebo in all 3 studies.
Tolerability
Flibanserin was well tolerated in the 3 clinical trials. As the FDA noted, clinical trials are conducted under widely varying conditions and therefore adverse reaction rates observed in trials of flibanserin cannot be directly compared with those reported in clinical trials of another drug and might not reflect rates observed in clinical practice.
The discontinuation rate due to adverse reactions was 13% among patients treated with flibanserin, 100 mg at bedtime, and 6% among those taking placebo. The most common side effects were somnolence, dizziness, fatigue, nausea, insomnia, and dry mouth, which appear dose-dependent. Onset of most of these adverse events was within 14 days after the start of treatment.
Although hypotension and syncope rarely were seen with flibanserin alone in clinical trials, these adverse events occurred more frequently in the morning and when taken with alcohol and with some drugs (moderate or strong CYP3A4 inhibitors), and in patients with hepatic impairment. Therefore, women who drink alcohol or take a moderate or strong inhibitor of CYP3A4—both of which are contraindicated—and those with hepatic impairment should not take flibanserin.
Flibanserin should be taken at bedtime, because the risk of hypotension and syncope is higher when flibanserin is taken in the morning and because of associated sedation and somnolence.
Unique clinical issues
Flibanserin is the first FDA-approved medication for treating HSDD. It is important to note that the drug originally was developed as an antidepressant, but failed to show efficacy. Researchers noted that the drug was more effective than placebo when patients were asked, “How strong is your sexual desire?” The focus of development then shifted to a potential treatment of HSDD.
Flibanserin was not approved at 2 previous FDA hearings, mainly because of safety concerns. For the second hearing, the manufacturer, Boehringer Ingelheim, which sold the rights to the drug to Sprout Pharmaceuticals in 2011,6 did not present any new efficacy data, but provided additional safety data, such as research suggesting the absence of next-day driving impairment and data related to alcohol use (the study confirming hypotension associated with alcohol abuse used a small sample, and only 2 of 25 participants were women).
Contraindications
Flibanserin is contraindicated in patients using alcohol because of an increased risk of hypotension and syncope. A patient’s alcohol use should be evaluated before administering flibanserin, and patients should be counseled about the importance of abstaining from alcohol.
Similarly, concomitant use of flibanserin with a moderate or strong inhibitor of CYP3A4 increases the concentration of flibanserin and raises the risk of hypotension and syncope. Therefore, the use of a moderate or strong inhibitor of CYP3A4 in patients taking flibanserin is contraindicated. Similarly, patients with liver impairment should not take this drug.
Strong CYP2C19 inhibitors (proton-pump inhibitors, selective serotonin reuptake inhibitors, benzodiazepines, antifungals) could increase flibanserin exposure, which may increase risk of hypotension, syncope, and CNS depression. Discuss these risks with your patients; doing so is particularly important when treating women of Chinese heritage, and some other Asian women, because 20% of these populations are genotypic CYP2C19 poor metabolizers.
Because of the increased risk of hypotension and syncope with alcohol use, flibanserin is available only through a restricted program under a Risk Evaluation and Mitigation Strategy (REMS) called the Addyi REMS Program. Flibanserin can be prescribed or dispensed only by physicians and pharmacists who watch this program’s online slide presentation and passed a comprehension test.a
Pregnant women should not take flibanserin because the effect on the fetus is unknown. Also, because the interaction with some oral contraceptives is unknown, patients should be cautioned about unwanted pregnancy. Women who are breastfeeding also should avoid using flibanserin because it is not known whether the drug is excreted in breast milk.
Women taking flibanserin also should avoid grapefruit juice, which increases flibanserin levels, and avoid using herbal products, resveratrol, and some over-the-counter drugs such as cimetidine. Women who have a depressive disorder also should avoid using flibanserin because their low sexual desire is more likely due to depression, which is not a therapeutic target for the drug.
Dosing
Flibanserin is provided in 100-mg film-coated tablets. It should be taken once a day at bedtime; titration is unnecessary. Length of treatment has not been determined, but it is recommended that patients stop flibanserin if they do not experience any benefit after 8 weeks. Although there is no guidance in the prescribing information, the medication probably could be stopped without tapering because withdrawal effects have not been observed.
Bottom Line
Flibanserin is FDA-approved for treating generalized, acquired hypoactive sexual desire disorder in premenopausal women. In clinical trials, the drug increased the number of satisfying sexual events and sexual desire, as measured by a diary and rating scales. Alcohol use and use of any moderate or strong inhibitor of cytochrome P450 3A4 are contraindicated in patients taking flibanserin because of an increased risk of hypotension and syncope.
1. Goldfisher ER, Breaux J, Katz M, et al. Continued efficacy and safety of flibanserin in premenopausal women with Hypoactive Sexual desire Disorder (HSDD): results from a randomized withdrawal trial. J Sex Med. 2011;8(11):3160- 3172.
2. Thorp J, Simon J, Dattani D, et al; DAISY trial investigators. Treatment of hypoactive sexual desire disorder in premenopausal women: efficacy of flibanserin in the DAISY study. J Sex Med. 2012;9(3):793-804.
3. Derogatis LR, Komer L, Katz M, et al; VIOLET Trial Investigators. Treatment of hypoactive sexual desire disorder in premenopausal women: efficacy of flibanserin in the VIOLET study. J Sex Med. 2012;9(4):1074-1085.
4. Katz M, DeRogatis LR, Ackerman R, et al; BEGONIA trial investigators. Efficacy of flibanserin in women with hypoactive sexual desire disorder: results from the BEGONIA trial. J Sex Med. 2013;10(7):1807-1815.
5. Gellad WF, Flynn KE, Alexander GC. Evaluation of flibanserin: science and advocacy at the FDA. JAMA. 2015;314(9):869-870
6. Joffe HV, Chang C, Sewell C, et al. FDA approval of flibanserin—treating hypoactive sexual desire disorder. N Engl J Med. 2016;374(2):101-104.
Flibanserin, FDA-approved in August 2015, is the first medication approved to treat acquired, generalized hypoactive sexual desire disorder (HSDD) in premenopausal women (Table 1). In clinical trials,1-4 the drug has shown modest efficacy in improving symptoms of low sexual desire (number of satisfying sexual events [SSEs], sexual desire, and overall sexual function). Flibanserin is not indicated to enhance sexual performance, for HSDD in postmenopausal women, or in men.
Clinical implications
Flibanserin could help premenopausal women who have distressing low sexual desire, which must be acquired and generalized:
- “Acquired low sexual desire” means that a patient had an adequate sexual desire that decreased or ceased for an unknown reason.
- “Generalized low sexual desire” means that lack of sexual desire occurs all the time and in all situations, not only with a certain partner or in some situations.
Women taking flibanserin could experience gradually increased sexual desire, increase in SSEs, and decrease of sexual distress. Flibanserin is indicated for long-term use; however, it should be discontinued after 8 weeks if the patient does not report any improvement in symptoms.
The number needed to treat with flibanserin likely would be rather large, but it is not available because of complex outcome measures in clinical trials. Flibanserin was not approved at 2 previous FDA committee hearings—mainly because of safety issues but also because of concerns about efficacy. For example, during the 2013 FDA hearing, the results presented showed statistically significant, but numerically small, treatment differences at 24 weeks compared with placebo. In an FDA responder analysis of the Phase-III trials, after accounting for the placebo effect, approximately 8% to 13% women were at least “much improved” on at least 1 of the primary outcomes.5
Flibanserin is not indicated for women whose sexual desire is due to (1) coexisting medical or psychiatric condition, (2) effects of medication or substance abuse, or (3) a relationship problem. It is unknown whether supplemental treatment would help these patients; however, it seems reasonable that combining flibanserin with psychosocial treatment, such as sex therapy or individual therapy, could be beneficial because it may be difficult to disentangle sexual dysfunction and relationship issues—2 problems that often are interwoven.
How it works
Flibanserin is a serotonin 1A receptor agonist and serotonin 2A receptor antagonist. In vitro, flibanserin demonstrated high affinity for the following 5-HT receptors:
- agonist activity at 5-HT1A
- antagonist activity at 5-HT2A, mostly in the prefrontal cortex.
Flibanserin also has moderate antagonist activities at the 5-HT2B, 5-HT2C, and dopamine D4 receptors. Flibanserin presumably acts centrally in the CNS; it has been suggested that flibanserin could rebalance neural circuitry involved in processing sexual desire by reducing serotonin activity and enhancing dopamine and epinephrine activity. The exact mechanism of how flibanserin improves sexual desire in women is unknown.
Pharmacokinetics
Flibanserin has a mean termination half-life of approximately 11 hours. It is administered once a day (50 to 100 mg) at bedtime. Steady state in healthy women was achieved after 3 days. Based on clinical observations, onset of action seems to be gradual and reaches maximum efficacy in approximately 8 weeks. Patients should discontinue the drug if no improvement is reported after 8 weeks. Flibanserin is readily absorbed from the gastrointestinal tract; however, food slows its absorption. The drug is 98% protein (mostly albumin)-bound.
Flibanserin is primarily metabolized in the liver by cytochrome P450 (CYP) 3A4 and to a lesser extent by CYP2C19. Co-administration of moderate (diltiazem, erythromycin, fluconazole, fosamprenavir, verapamil) or strong (eg, ketoconazole, clarithromycin, nefazodone, ritonavir) CYP3A4 inhibitors increases the concentration of flibanserin. This could lead to severe hypotension and syncope; therefore, co-administering flibanserin with a strong CYP3A4 inhibitor is contraindicated. Grapefruit juice is a moderate inhibitor of CYP3A4, and in a study of 26 healthy females, 240 mL of grapefruit juice increased flibanserin concentration 1.4-fold. Flibanserin is excreted though urine and feces. Flibanserin should be taken once a day at bedtime because of sedation, somnolence, and possible syncope.
Efficacy
The efficacy of flibanserin for treating HSDD was established in three 24-week, randomized, double-blind, placebo-controlled studies (Table 2). The target population in these studies was premenopausal women (mean age 36, range 19 to 55) with acquired HSDD lasting at least 6 months (mean duration, approximately 5 years). The 3 studies included 1,187 women who received flibanserin, 100 mg at bedtime, and 1,188 women who received placebo. Participants were mostly white (88.6%), and included black (9.6%) and Asian (1.5%) women. The completion rates were 69% for flibanserin and 78% for placebo. Some of the trials included arms with a lower dosage of flibanserin (25 mg and 50 mg), which are not included in this analysis.
As noted in the package insert, these trials each had 2 co-primary efficacy endpoints, SSEs and sexual desire:
- change from baseline to Week 24 in the number of monthly SSEs (ie, sexual intercourse, oral sex, masturbation, or genital stimulation by the partner)
- change in sexual desire from baseline to 24-week endpoint.
In Study 1 and 2, change in sexual desire from baseline to Week 24 was measured daily by using an electronic diary. Every day, patients rated their sexual desire level by answering the question, “Indicate your most intense level of sexual desire” from 0 (no desire) to 3 (strong desire). These responses were totaled over a 28-day period to yield the monthly sexual desire score, which ranged from 0 to 84. These 2 studies also used the Female Sexual Function Index (FSFI) Desire domain as a secondary endpoint.
Study 3 used the FSFI Desire domain, comprising 2 questions, as the sexual desire co-primary endpoint:
- “Over the past 4 weeks, how often did you feel sexual desire or interest?” Responses ranged from 1 (almost never or never) to 5 (almost always or always).
- “Over the past 4 weeks, how would you rate your level (degree) of sexual desire or interest?” Responses ranged from 1 (very low or none at all) to 5 (very high).
In all 3 trials, flibanserin was associated with a small, yet statistically significant, improvement in change in monthly SSEs from baseline to Week 24 compared with placebo. In Study 1 and 2, there were no statistically significant differences between flibanserin and placebo for the electronic diary sexual desire endpoint. In the third study, there was statistically significant improvement in the change in sexual desire using the FSFI Desire domain with flibanserin compared with placebo. The FSFI Desire domain findings were consistent across all 3 trials. Flibanserin was associated with a decrease in sexual distress compared with placebo in all 3 studies.
Tolerability
Flibanserin was well tolerated in the 3 clinical trials. As the FDA noted, clinical trials are conducted under widely varying conditions and therefore adverse reaction rates observed in trials of flibanserin cannot be directly compared with those reported in clinical trials of another drug and might not reflect rates observed in clinical practice.
The discontinuation rate due to adverse reactions was 13% among patients treated with flibanserin, 100 mg at bedtime, and 6% among those taking placebo. The most common side effects were somnolence, dizziness, fatigue, nausea, insomnia, and dry mouth, which appear dose-dependent. Onset of most of these adverse events was within 14 days after the start of treatment.
Although hypotension and syncope rarely were seen with flibanserin alone in clinical trials, these adverse events occurred more frequently in the morning and when taken with alcohol and with some drugs (moderate or strong CYP3A4 inhibitors), and in patients with hepatic impairment. Therefore, women who drink alcohol or take a moderate or strong inhibitor of CYP3A4—both of which are contraindicated—and those with hepatic impairment should not take flibanserin.
Flibanserin should be taken at bedtime, because the risk of hypotension and syncope is higher when flibanserin is taken in the morning and because of associated sedation and somnolence.
Unique clinical issues
Flibanserin is the first FDA-approved medication for treating HSDD. It is important to note that the drug originally was developed as an antidepressant, but failed to show efficacy. Researchers noted that the drug was more effective than placebo when patients were asked, “How strong is your sexual desire?” The focus of development then shifted to a potential treatment of HSDD.
Flibanserin was not approved at 2 previous FDA hearings, mainly because of safety concerns. For the second hearing, the manufacturer, Boehringer Ingelheim, which sold the rights to the drug to Sprout Pharmaceuticals in 2011,6 did not present any new efficacy data, but provided additional safety data, such as research suggesting the absence of next-day driving impairment and data related to alcohol use (the study confirming hypotension associated with alcohol abuse used a small sample, and only 2 of 25 participants were women).
Contraindications
Flibanserin is contraindicated in patients using alcohol because of an increased risk of hypotension and syncope. A patient’s alcohol use should be evaluated before administering flibanserin, and patients should be counseled about the importance of abstaining from alcohol.
Similarly, concomitant use of flibanserin with a moderate or strong inhibitor of CYP3A4 increases the concentration of flibanserin and raises the risk of hypotension and syncope. Therefore, the use of a moderate or strong inhibitor of CYP3A4 in patients taking flibanserin is contraindicated. Similarly, patients with liver impairment should not take this drug.
Strong CYP2C19 inhibitors (proton-pump inhibitors, selective serotonin reuptake inhibitors, benzodiazepines, antifungals) could increase flibanserin exposure, which may increase risk of hypotension, syncope, and CNS depression. Discuss these risks with your patients; doing so is particularly important when treating women of Chinese heritage, and some other Asian women, because 20% of these populations are genotypic CYP2C19 poor metabolizers.
Because of the increased risk of hypotension and syncope with alcohol use, flibanserin is available only through a restricted program under a Risk Evaluation and Mitigation Strategy (REMS) called the Addyi REMS Program. Flibanserin can be prescribed or dispensed only by physicians and pharmacists who watch this program’s online slide presentation and passed a comprehension test.a
Pregnant women should not take flibanserin because the effect on the fetus is unknown. Also, because the interaction with some oral contraceptives is unknown, patients should be cautioned about unwanted pregnancy. Women who are breastfeeding also should avoid using flibanserin because it is not known whether the drug is excreted in breast milk.
Women taking flibanserin also should avoid grapefruit juice, which increases flibanserin levels, and avoid using herbal products, resveratrol, and some over-the-counter drugs such as cimetidine. Women who have a depressive disorder also should avoid using flibanserin because their low sexual desire is more likely due to depression, which is not a therapeutic target for the drug.
Dosing
Flibanserin is provided in 100-mg film-coated tablets. It should be taken once a day at bedtime; titration is unnecessary. Length of treatment has not been determined, but it is recommended that patients stop flibanserin if they do not experience any benefit after 8 weeks. Although there is no guidance in the prescribing information, the medication probably could be stopped without tapering because withdrawal effects have not been observed.
Bottom Line
Flibanserin is FDA-approved for treating generalized, acquired hypoactive sexual desire disorder in premenopausal women. In clinical trials, the drug increased the number of satisfying sexual events and sexual desire, as measured by a diary and rating scales. Alcohol use and use of any moderate or strong inhibitor of cytochrome P450 3A4 are contraindicated in patients taking flibanserin because of an increased risk of hypotension and syncope.
1. Goldfisher ER, Breaux J, Katz M, et al. Continued efficacy and safety of flibanserin in premenopausal women with Hypoactive Sexual desire Disorder (HSDD): results from a randomized withdrawal trial. J Sex Med. 2011;8(11):3160- 3172.
2. Thorp J, Simon J, Dattani D, et al; DAISY trial investigators. Treatment of hypoactive sexual desire disorder in premenopausal women: efficacy of flibanserin in the DAISY study. J Sex Med. 2012;9(3):793-804.
3. Derogatis LR, Komer L, Katz M, et al; VIOLET Trial Investigators. Treatment of hypoactive sexual desire disorder in premenopausal women: efficacy of flibanserin in the VIOLET study. J Sex Med. 2012;9(4):1074-1085.
4. Katz M, DeRogatis LR, Ackerman R, et al; BEGONIA trial investigators. Efficacy of flibanserin in women with hypoactive sexual desire disorder: results from the BEGONIA trial. J Sex Med. 2013;10(7):1807-1815.
5. Gellad WF, Flynn KE, Alexander GC. Evaluation of flibanserin: science and advocacy at the FDA. JAMA. 2015;314(9):869-870
6. Joffe HV, Chang C, Sewell C, et al. FDA approval of flibanserin—treating hypoactive sexual desire disorder. N Engl J Med. 2016;374(2):101-104.
Common neurologic emergencies for nonneurologists: When minutes count
Neurologic emergencies such as acute stroke, status epilepticus, subarachnoid hemorrhage, neuromuscular weakness, and spinal cord injury affect millions of Americans yearly.1,2 These conditions can be difficult to diagnose, and delays in recognition and treatment can have devastating results. Consequently, it is important for nonneurologists to be able to quickly recognize these conditions and initiate timely management, often while awaiting neurologic consultation.
Here, we review how to recognize and treat these common, serious conditions.
ACUTE ISCHEMIC STROKE: TIME IS OF THE ESSENCE
Stroke is the fourth leading cause of death in the United States and is one of the most common causes of disability worldwide.3–5 About 85% of strokes are ischemic, resulting from diminished vascular supply to the brain. Symptoms such as facial droop, unilateral weakness or numbness, aphasia, gaze deviation, and unsteadiness of gait may be seen. Time is of the essence, as all currently available interventions are safe and effective only within defined time windows.
Diagnosis and assessment
When acute ischemic stroke is suspected, the clinical history, time of onset, and basic neurologic examination should be obtained quickly.
The National Institutes of Health (NIH) stroke scale is an objective marker for assessing stroke severity as well as evolution of disease and should be obtained in all stroke patients. Scores range from 0 (best) to 42 (worst) (www.ninds.nih.gov/doctors/NIH_Stroke_Scale.pdf).
Time of onset of symptoms is essential to determine, since it guides eligibility for acute therapies. Clinicians should ascertain the last time the patient was seen to be neurologically well in order to estimate this time window as closely as possible.
Laboratory tests should include a fingerstick blood glucose measurement, coagulation studies, complete blood cell count, and basic metabolic profile.
Computed tomography (CT) of the head without contrast should be obtained immediately to exclude acute hemorrhage and any alternative diagnoses that could explain the patient’s symptoms. Acute brain ischemia is often not apparent on CT during the first few hours of injury. Therefore, a patient presenting with new focal neurologic deficits and an unremarkable result on CT of the head should be treated as having had an acute ischemic stroke, and interventional therapies should be considered.
Stroke mimics should be considered and treated, as appropriate (Table 1).
Acute management of ischemic stroke
Acute treatment should not be delayed by obtaining chest radiography, inserting a Foley catheter, or obtaining an electrocardiogram. The longer the time that elapses before treatment, the worse the functional outcome, underscoring the need for rapid decision-making.6–8
Lowering the head of the bed may provide benefit by promoting blood flow to ischemic brain tissue.9 However, this should not be done in patients with significantly elevated intracerebral pressure and concern for herniation.
Permissive hypertension (antihypertensive treatment only for blood pressure greater than 220/110 mm Hg) should be allowed per national guidelines to provide adequate perfusion to brain areas at risk of injury.10
Tissue plasminogen activator. Patients with ischemic stroke who present within 3 hours of symptom onset should be considered for intravenous administration of tissue plasminogen activator (tPA), a safe and effective therapy with nearly 2 decades of evidence to support its use.10 The treating physician should carefully review the risks and benefits of this therapy.
To receive tPA, the patient must have all of the following:
- Clinical diagnosis of ischemic stroke with measurable neurologic deficit
- Onset of symptoms within the past 3 hours
- Age 18 or older.
The patient must not have any of the following:
- Significant stroke within the past 3 months
- Severe traumatic head injury within the past 3 months
- History of significant intracerebral hemorrhage
- Previously ruptured arteriovenous malformation or intracranial aneurysm
- Central nervous system neoplasm
- Arterial puncture at a noncompressible site within the past 7 days
- Evidence of hemorrhage on CT of the head
- Evidence of ischemia in greater than 33% of the cerebral hemisphere on head CT
- History and symptoms strongly suggesting subarachnoid hemorrhage
- Persistent hypertension (systolic pressure ≥ 185 mm Hg or diastolic pressure ≥ 110 mm Hg)
- Evidence of acute significant bleeding (external or internal)
- Hypoglycemia—ie, serum glucose less than 50 mg/dL (< 2.8 mmol/L)
- Thrombocytopenia (platelet count < 100 × 109/L)
- Significant coagulopathy (international normalized ratio > 1.7, prothrombin time > 15 seconds, or abnormally elevated activated partial thromboplastin time)
- Current use of a factor Xa inhibitor or direct thrombin inhibitor.
Relative contraindications:
- Minor or rapidly resolving symptoms
- Major surgery or trauma within the past 14 days
- Gastrointestinal or urinary tract bleeding within the past 21 days
- Myocardial infarction in the past 3 months
- Unruptured intracranial aneurysm
- Seizure occurring at stroke onset
- Pregnancy.
If these criteria are satisfied, tPA should be given at a dose of 0.9 mg/kg intravenously over 60 minutes. Ten percent of the dose should be given as an initial bolus, followed by a constant infusion of the remaining 90% over 1 hour.
If tPA is given, the blood pressure must be kept lower than 185/110 mm Hg to minimize the risk of symptomatic intracerebral hemorrhage.
A subset of patients may benefit from receiving intravenous tPA between 3 and 4.5 hours after the onset of stroke symptoms. These include patients who are no more than 80 years old, who have not recently used oral anticoagulants, who do not have severe neurologic injury (ie, do not have NIH Stroke Scale scores > 25), and who do not have diabetes mellitus or a history of ischemic stroke.11 Although many hospitals have such a protocol for tPA up to 4.5 hours after the onset of stroke symptoms, this time window is not currently approved by the US Food and Drug Administration.
Intra-arterial therapy. Based on recent trials, some patients may benefit further from intra-arterial thrombolysis or mechanical thrombectomy, both delivered during catheter-based cerebral angiography, independent of intravenous tPA administration.12,13 These patients should be evaluated on a case-by-case basis by a neurologist and neurointerventional team. Time windows for these treatments generally extend to 6 hours from stroke onset and perhaps even longer in some situations (eg, basilar artery occlusion).
An antiplatelet agent should be started quickly in all stroke patients who do not receive tPA. Patients who receive tPA can begin receiving an antiplatelet agent 24 hours afterward.
Unfractionated heparin. There is no evidence to support the use of unfractionated heparin in most cases of acute ischemic stroke.10
Glucose control (in the range of 140–180 mg/dL) and fever control remain essential elements of post-acute stroke care to provide additional protection to the damaged brain.
For ischemic stroke due to atrial fibrillation
In ischemic stroke due to atrial fibrillation, early anticoagulation should be considered, based on the CHA2DS2-VASC risk of ischemic stroke vs the HAS-BLED risk of hemorrhage (calculators available at www.mdcalc.com).
In general, anticoagulation may be withheld during the first 72 hours while further stroke workup and evaluation of extent of injury are carried out, as there is an increased risk of hemorrhagic transformation of the ischemic stroke. Often, anticoagulation is resumed at a full dose between 72 hours and 2 weeks of the ischemic stroke.
ACUTE HEMORRHAGIC STROKE: BLOOD PRESSURE, COAGULATION
Approximately 15% of strokes are caused by intracerebral hemorrhage, which can be detected with noncontrast head CT with a sensitivity of 98.6% within 6 hours of the onset of bleeding.14 A common underlying cause of intracerebral hemorrhage is chronic poorly controlled hypertension, causing rupture of damaged (or “lipohyalinized”) vessels with resultant blood extravasation into the brain parenchyma. Other causes are less common (Table 2).
Treatment of acute hemorrhagic stroke
Acute treatment of intracerebral hemorrhage includes blood pressure control, reversal of underlying coagulopathy or anticoagulation, and sometimes intracranial pressure control. There is little role for surgery in most cases, based on findings of randomized trials.15
Blood pressure control. Many studies have investigated optimal blood pressure goals in acute intracerebral hemorrhage. Recent data suggest that early aggressive therapy, targeting a systolic blood pressure goal less than 140 mm Hg within the first hour, is safe and can lead to better functional outcomes than a more conservative blood-pressure-lowering target.16 Rapid-onset, short-acting antihypertensive agents in intravenous form, such as nicardipine and labetalol, are frequently used. Of note, this treatment strategy for hemorrhagic stroke is in direct contrast to the treatment of ischemic stroke, in which permissive hypertension (blood pressure goal < 220/110 mm Hg) is often pursued.
Reversal of any coagulation abnormalities should be done quickly in intracranial hemorrhage. Warfarin use has been shown to be a strong independent predictor of intracranial hemorrhage expansion, which increases the risk of death.17,18
Increasingly, agents other than vitamin K or fresh-frozen plasma are being used to rapidly reverse anticoagulation, including prothrombin complex concentrate (available in three- and four-factor preparations) and recombinant factor VIIa. While four-factor prothrombin complex concentrate and recombinant factor VIIa have been shown to be more efficacious than fresh-frozen plasma, there are limited data directly comparing these newer reversal agents against each other.19 The use of these medications is limited by availability and practitioner familiarity.20–22
Reversing anticoagulation due to target-specific oral anticoagulants. The acute management of intracranial hemorrhage in patients taking the new target-specific oral anticoagulants (eg, dabigatran, apixaban, rivaroxaban, edoxaban) remains challenging. Laboratory tests such as factor Xa levels are not readily available in many institutions and do not provide results in a timely fashion, and in the interim, acute hemorrhage and clinical deterioration may occur. Management strategies involve giving fresh-frozen plasma, prothrombin complex concentrate, and consideration of hemodialysis.23 Dabigatran reversal with idarucizumab has recently been shown to have efficacy.24
Vigilance for elevated intracranial pressure. Intracranial hemorrhage can occasionally cause elevated intracranial pressure, which should be treated rapidly. Any acute decline in mental status in a patient with intracranial hemorrhage requires emergency imaging to evaluate for expansion of hemorrhage.
SUBARACHNOID HEMORRHAGE
The sudden onset of a “thunderclap” headache (often described by patients as “the worst headache of my life”) suggests subarachnoid hemorrhage.
In contrast to intracranial hemorrhage, in subarachnoid hemorrhage blood collects mainly in the cerebral spinal fluid-containing spaces surrounding the brain, leading to a higher incidence of hydrocephalus from impaired drainage of cerebrospinal fluid. Nontraumatic subarachnoid hemorrhage is most often caused by rupture of an intracranial aneurysm, which can be a devastating event, with death rates approaching 50%.25
Diagnosis of subarachnoid hemorrhage
Noncontrast CT of the head is the main modality for diagnosing subarachnoid hemorrhage. Blood within the subarachnoid space is demonstrable in 92% of cases if CT is performed within the first 24 hours of hemorrhage, with an initial sensitivity of about 95% within the first 6 hours of onset.14,26,27 The longer CT is delayed, the lower the sensitivity.
Some studies suggest that a protocol of CT followed by CT angiography can safely exclude aneurysmal subarachnoid hemorrhage and obviate the need for lumbar puncture. However, further research is required to validate this approach.28
Lumbar puncture. If clinical suspicion of subarachnoid hemorrhage remains strong even though initial CT is negative, lumbar puncture must be performed for cerebrospinal fluid analysis.29 Xanthochromia (a yellowish pigmentation of the cerebrospinal fluid due to the degeneration of blood products that occurs within 8 to 12 hours of bleeding) should raise the alarm for subarachnoid hemorrhage; this sign may be present up to 4 weeks after the bleeding event.30
If lumbar puncture is contraindicated, then aneurysmal subarachnoid hemorrhage has not been ruled out, and further neurologic consultation should be pursued.
Management of subarachnoid hemorrhage
Early management of blood pressure for a ruptured intracranial aneurysm follows strategies similar to those for intracranial hemorrhage. Further investigation is rapidly directed toward an underlying vascular malformation, with intracranial vessel imaging such as CT angiography, magnetic resonance angiography, or the gold standard test—catheter-based cerebral angiography.
Aneurysms are treated (or “secured”) either by surgical clipping or by endovascular coiling. Endovascular coiling is preferable in cases in which both can be safely attempted.31 If the facility lacks the resources to do these procedures, the patient should be referred to a nearby tertiary care center.
INTRACRANIAL HYPERTENSION: DANGER OF BRAIN HERNIATION
A number of conditions can cause an acute intracranial pressure elevation. The danger of brain herniation requires that therapies be implemented rapidly to prevent catastrophic neurologic injury. In many situations, nonneurologists are the first responders and therefore should be familiar with basic intracranial pressure management.
Initial symptoms of acute rise in intracranial pressure
As intracranial pressure rises, pressure is typically equally distributed throughout the cranial vault, leading to dysfunction of the ascending reticular activating system, which clinically manifests as the inability to stay alert despite varying degrees of noxious stimulation. Progressive cranial neuropathies (often starting with pupillary abnormalities) and coma are often seen in this setting as the upper brainstem begins to be compressed.
Initial assessment and treatment of elevated intracranial pressure
Noncontrast CT of the head is often obtained immediately when acutely elevated intracranial pressure is suspected. If clinical examination and radiographic findings are consistent with intracranial hypertension, prompt measures can be started at the bedside.
Elevate the head of the bed to 30 degrees to promote venous drainage and reduce intracranial pressure. (In contrast, most other hemodynamically unstable patients are placed flat or in the Trendelenburg position.)
Intubation should be done quickly in cases of airway compromise, and hyperventilation should be started with a goal Paco2 of 30 to 35 mm Hg. This hypocarbic strategy promotes cerebral vasoconstriction and a transient decrease in intracranial pressure.
Hyperosmolar therapy allows for transient intracranial volume decompression and is the mainstay of emergency medical treatment of intracranial hypertension. Mannitol is a hyperosmolar polysaccharide that promotes osmotic diuresis and removes excessive cerebral water. In the acute setting, it can be given as an intravenous bolus of 1 to 2 g/kg through a peripheral intravenous line, followed by a bolus every 4 to 6 hours. Hypotension can occur after diuresis, and renal function should be closely monitored since frequent mannitol use can promote acute tubular necrosis. In patients who are anuric, the medication is typically not used.
Hypertonic saline (typically 3% sodium chloride, though different concentrations are available) is an alternative that helps draw interstitial fluid into the intravascular space, decreasing cerebral edema and maintaining hemodynamic stability. Relative contraindications include congestive heart failure or renal failure leading to pulmonary edema from volume overload. Hypertonic saline can be given as a bolus or a constant infusion. Some institutions have rapid access to 23.4% saline, which can be given as a 30-mL bolus but typically requires a central venous catheter for rapid infusion.
Comatose patients with radiographic findings of hydrocephalus, epidural or subdural hematoma, or mass effect with midline shift warrant prompt neurosurgical consultation for further surgical measures of intracranial pressure control and monitoring.
The ‘blown’ pupil
The physician should be concerned about elevated intracranial pressure if a patient has mydriasis, ie, an abnormally dilated (“blown”) pupil, which is a worrisome sign in the setting of true intracranial hypertension. However, many different processes can cause mydriasis and should be kept in mind when evaluating this finding (Table 3).32 If radiographic findings do not suggest elevated intracranial pressure, further workup into these other processes should be pursued.
STATUS EPILEPTICUS: SEIZURE CONTROL IS IMPORTANT
A continuous unremitting seizure lasting longer than 5 minutes or recurrent seizure activity in a patient who does not regain consciousness between seizures should be treated as status epilepticus. All seizure types carry the risk of progressing to status epilepticus, and responsiveness to antiepileptic drug therapy is inversely related to the duration of seizures. It is imperative that seizure activity be treated early and aggressively to prevent recalcitrant seizure activity, neuronal damage, and progression to status epilepticus.33
Once the ABCs of emergency stabilization have been performed (ie, airway, breathing, circulation), antiepileptic drug therapy should start immediately using established algorithms (Figure 1).34–36 During the course of treatment, the reliability of the neurologic examination may be limited due to medication effects or continued status epilepticus, making continuous video electroencephalographic monitoring often necessary to guide further therapy in patients who are not rapidly recovering.34–38
Once status epilepticus has resolved, further investigation into the underlying cause should be pursued quickly, especially in patients without a previous diagnosis of epilepsy. Head CT with contrast or magnetic resonance imaging can be used to look for any structural abnormality that may explain seizures. Basic laboratory tests including toxicology screening can identify a common trigger such as hypoglycemia or stimulant use. Fever or other possible signs of meningitis should be investigated further with cerebrospinal fluid analysis.
SPINAL CORD INJURY
Acute spinal cord injury can lead to substantial long-term neurologic impairment and should be suspected in any patient presenting with focal motor loss, sensory loss, or both with sparing of the cranial nerves and mental status. Causes of injury include compression (traumatic or nontraumatic) and inflammatory and noninflammatory myelopathies.
The location of the injury can be inferred by analyzing the symptoms, which can point to the cord level and indicate whether the anterior or posterior of the cord is involved. Anterior cord injury tends to affect the descending corticospinal and pyramidal tracts, resulting in motor deficits and weakness. Posterior cord injury involves the dorsal columns, leading to deficits of vibration sensation and proprioception. High cervical cord injuries tend to involve varying degrees of quadriparesis, sensory loss, and sometimes respiratory compromise. A clinical history of bilateral lower-extremity weakness, a “band-like” sensory complaint around the lower chest or abdomen, or both, can suggest thoracic cord involvement. Symptoms isolated to one or both lower extremities along with lower back pain and bowel or bladder involvement may point to injury of the lumbosacral cord.
Basic management of spinal cord injury includes decompression of the bladder and initial protection against further injury with a stabilizing collar or brace.
Magnetic resonance imaging with and without contrast is the ideal study to evaluate injuries to the spinal cord itself. While CT is helpful in identifying bony disease of the spinal column (eg, evaluating traumatic fractures), it is not helpful in viewing intrinsic cord pathology.
Traumatic myelopathy
Traumatic spinal cord injury is usually suggested by the clinical history and confirmed with CT. In this setting, early consultation with a neurosurgeon is required to prevent permanent cord injury.
Guidelines suggest maintaining a mean arterial pressure greater than 85 to 90 mm Hg for the first 7 days after traumatic spinal cord injury, a particular problem in the setting of hemodynamic instability, which can accompany lesions above the midthoracic level.39,40
Patients with vertebral body misalignment should be placed in an appropriate stabilizing collar or brace until a medically trained professional deems it appropriate to discontinue the device, or until surgical stabilization is performed.
Methylprednisone is a controversial intervention for acute spinal cord trauma, lacking clear benefit in meta-analyses.41
Nontraumatic compressive myelopathy
Patients with nontraumatic compressive myelopathy tend to present with varying degrees of back pain and worsening sensorimotor function. The differential diagnosis includes epidural abscesses, hematoma, metastatic neoplasm, and osteophyte compression (Table 4). The clinical history helps to guide therapy and should involve assessment for previous spinal column injury, immunocompromised state, travel history (which provides information on risks of exposure to a variety of diseases, including infections), and constitutional symptoms such as fever and weight loss.
Epidural abscess can have devastating results if missed. Red flags such as recent illness, intravenous drug use, focal back pain, fever, worsening numbness or weakness, and bowel or bladder incontinence should raise suspicion of this disorder. Emergency magnetic resonance imaging is required to diagnose this condition, and treatment involves urgent administration of antibiotics and consideration of surgical drainage.
Noncompressive myelopathies
There are numerous causes of noncompressive spinal cord injury (Table 4), and the etiology may be inflammatory (eg, “myelitis”) or noninflammatory. The diagnostic workup may require both magnetic resonance imaging and cerebrospinal fluid analysis. Acute disease-targeted therapy is rarely indicated and can be deferred until a full diagnostic workup has been completed.
NEUROMUSCULAR DISEASE: IS VENTILATION NEEDED?
Diseases involving the motor components of the peripheral nervous system (Table 5) share the common risk of causing ventilatory failure due to weakness of the diaphragm, intercostal muscles, and upper-airway muscles. Clinicians need to be aware of this risk and view these disorders as neurologic emergencies.
Determining when these patients require mechanical intubation is a challenge. Serial measurements of maximum inspiratory force and vital capacity are important and can be accomplished quickly at the bedside by a respiratory therapist. A maximum inspiratory force less than –30 cm H2O or a vital capacity less than 20 mL/kg, or both, are worrisome markers that raise concern for impending ventilatory failure. Serial measurements can detect changes in these values that might indicate the need for elective intubation. In any patient presenting with weakness of the limbs, these measurements are an important step in the initial evaluation.
Myasthenic crisis
Myasthenia gravis is caused by autoantibodies directed against postsynaptic acetylcholine receptors. Patients demonstrate muscle weakness, usually in a proximal pattern, with fatigue, respiratory distress, nasal speech, ophthalmoparesis, and dysphagia. Exacerbations can occur as a response to recent infection, surgery, or medications such as neuromuscular blocking agents or aminoglycosides.
Myasthenic crisis, while uncommon, is a life-threatening emergency characterized by bulbar or respiratory failure secondary to muscle weakness. It can occur in patients already diagnosed with myasthenia gravis or may be the initial manifestation of the disease.42–49 Intubation and mechanical ventilation are frequently required. Postoperative myasthenic patients in whom extubation has been delayed more than 24 hours should be considered in crisis.45
The diagnosis of myasthenia gravis can be made by serum autoantibody testing, electromyography, and nerve conduction studies (with repetitive stimulation) or administration of edrophonium in patients with obvious ptosis.
The mainstay of therapy for myasthenic crisis is either intravenous immunoglobulin at a dose of 2 g/kg over 2 to 5 days or plasmapheresis (5–7 exchanges over 7–14 days). Corticosteroids are not recommended in myasthenic crisis in patients who are not intubated, as they can potentiate an initial worsening of crisis. Once the patient begins to show clinical improvement, outpatient pyridostigmine and immunosuppressive medications can be resumed at a low dose and titrated as tolerated.
Acute inflammatory demyelinating polyneuropathy (Guillain-Barré syndrome)
Acute inflammatory demyelinating polyneuropathy is an autoimmune disorder involving autoantibodies against axons or myelin in the peripheral nervous system.
This disease should be suspected in a patient who is developing worsening muscle weakness (usually with areflexia) over the course of days to weeks. Occasionally, a recent diarrheal or other systemic infectious trigger can be identified. Blood pressure instability and cardiac arrhythmia can also be seen due to autonomic nerve involvement. Although classically described as an “ascending paralysis,” other variants of this disease have distinct clinical presentations (eg, the descending paralysis, ataxia, areflexia, ophthalmoparesis of the Miller Fisher syndrome).
Acute inflammatory demyelinating polyneuropathy is diagnosed by electromyography and nerve conduction studies. A cerebrospinal fluid profile demonstrating elevated protein and few white blood cells is typical.
Treatment, as in myasthenic crisis, involves intravenous immunoglobulin or plasmapheresis. Corticosteroids are ineffective. Anticipation of ventilatory failure and expectant intubation is essential, given the progressive nature of the disorder.50
- Pitts SR, Niska RW, Xu J, Burt CW. National hospital ambulatory medical care survey: 2006 emergency department summary. Natl Health Stat Report 2008; 7:1–38.
- McMullan JT, Knight WA, Clark JF, Beyette FR, Pancioli A. Time-critical neurological emergencies: the unfulfilled role for point-of-care testing. Int J Emerg Med 2010; 3:127–131.
- Centers for Disease Control and Prevention (CDC). Prevalence of stroke: United States, 2006–2010. MMWR Morb Mortal Wkly Rep 2012; 61:379–382.
- Lozano R, Naghavi M, Foreman K, et al. Global and regional mortality from 235 causes of death for 20 age groups in 1990 and 2010: a systematic analysis for the global burden of disease study 2010. Lancet 2012; 380:2095–2128.
- Vos T, Flaxman AD, Naghavi M, et al. Years lived with disability (YLDs) for 1,160 sequelae of 289 diseases and injuries 1990–2010: a systematic analysis for the global burden of disease study 2010. Lancet 2012; 380:2163–2196.
- Tissue plasminogen activator for acute ischemic stroke. The National Institute of Neurological Disorders and Stroke rt-PA stroke study group. N Engl J Med 1995; 333:1581–1587.
- Hacke W, Donnan G, Fieschi C, et al; ATLANTIS Trials Investigators; ECASS Trials Investigators; NINDS rt-PA Study Group Investigators. Association of outcome with early stroke treatment: pooled analysis of ATLANTIS, ECASS, and NINDS rt-PA stroke trials. Lancet 2004; 363:768–774.
- Saver JL, Fonarrow GC, Smith EE, et al. Time to treatment with intravenous tissue plasminogen activator and outcome from acute ischemic stroke. JAMA 2013; 309:2480–2488.
- Wojner-Alexander AW, Garami Z, Chernyshev OY, Alexandrov AV. Heads down: flat positioning improves blood flow velocity in acute ischemic stroke. Neurology 2005; 64:1354–1357.
- Jauch EC, Saver JL, Adams HP Jr, et al; American Heart Association Stroke Council; Council on Cardiovascular Nursing; Council on Peripheral Vascular Disease; Council on Clinical Cardiology. Guidelines for the early management of patients with acute ischemic stroke: a guideline for healthcare professionals from the American Heart Association/American Stroke Association. Stroke 2013; 44:870–947.
- Hacke W, Kaste M, Bluhmki E, et al; ECASS Investigators. Thrombolysis with alteplase 3 to 4.5 hours after acute ischemic stroke. N Engl J Med 2008; 359:1317–1329.
- Berkhemer OA, Fransen PSS, Beumer D, et al; MR CLEAN Investigators. A randomized trial of intraarterial treatment for acute ischemic stroke. N Eng J Med 2015; 372:11–20.
- Campbell BC, Mitchell PJ, Kleinig TJ, et al; EXTEND-IA Investigators. Endovascular therapy for ischemic stroke with perfusion-imaging selection. N Engl J Med 2015; 372:1009–1018.
- Backes D, Rinkel GJ, Kemperman H, Linn FH, Vergouwen MD. Time-dependent test characteristics of head computed tomography in patients suspected of nontraumatic subarachnoid hemorrhage. Stroke 2012; 43:2115–2119.
- Mendelow AD, Gregson BA, Fernandes HM, et al; STICH investigators. Early surgery versus initial conservative treatment in patients with spontaneous supratentorial intracerebral haematomas in the International Surgical Trial in Intracerebral Haemorrhage (STICH): a randomised trial. Lancet 2005; 365: 387–397.
- Anderson CS, Helley E, Huang Y, et al; INTERACT2 Investigators. Rapid blood-pressure lowering in patients with acute intracerebral hemorrhage. N Engl J Med 2013; 368:2355–2365.
- Flibotte JJ, Hagan N, O'Donnell J, Greenberg SM, Rosand J. Warfarin, hematoma expansion, and outcome of intracerebral hemorrhage. Neurology 2004; 63:1059–1064.
- Davis SM, Broderick J, Hennerici M, et al; Recombinant Activated Factor VII Intracerebral Hemorrhage Trial Investigators. Hematoma growth is a determinant of mortality and poor outcome after intracerebral hemorrhage. Neurology 2006; 66:1175–1181.
- Woo CH, Patel N, Conell C, et al. Rapid warfarin reversal in the setting of intracranial hemorrhage: a comparison of plasma, recombinant activated factor VII, and prothrombin complex concentrate. World Neurosurg 2014; 81:110–115.
- Broderick J, Connolly S, Feldmann E, et al; American Heart Association; American Stroke Association Stroke Council; High Blood Pressure Research Council; Quality of Care and Outcomes in Research Interdisciplinary Working Group. Guidelines for the management of spontaneous intracerebral hemorrhage in adults: 2007 update: a guideline from the American Heart Association/American Stroke Association Stroke Council, High Blood Pressure Research Council, and the Quality of Care and Outcomes in Research Interdisciplinary Working Group. Stroke 2007; 38:2001–2023.
- Goldstein JN, Thomas SH, Frontiero V, et al. Timing of fresh frozen plasma administration and rapid correction of coagulopathy in warfarin-related intracerebral hemorrhage. Stroke 2006, 37:151–155.
- Chapman SA, Irwin ED, Beal AL, Kulinski NM, Hutson KE, Thorson MA. Prothrombin complex concentrate versus standard therapies for INR reversal in trauma patients receiving warfarin. Ann Pharmacother 2011; 45:869–875.
- Fawole A, Daw HA, Crowther MA. Practical management of bleeding due to the anticoagulants dabigatran, rivaroxaban, and apixaban. Cleve Clin J Med 2013; 80:443–451.
- Pollack CV Jr, Reilly PA, Eikelboom J, et al. Idarucizumab for dabigatran reversal. N Engl J Med 2015; 373:511-520.
- Broderick JP, Brott TG, Duldner JE, Tomsick T, Leach A. Initial and recurrent bleeding are the major causes of death following subarachnoid hemorrhage. Stroke 1994; 25:1342–1347.
- Kassell NF, Torner JC, Haley EC Jr, Jane JA, Adams HP, Kongable GL. The international cooperative study on the timing of aneurysm surgery. Part 1: overall management results. J Neurosurg 1990; 73:18–36.
- Perry JJ, Stiell IG, Sivilotti ML, et al. Sensitivity of computed tomography performed within six hours of onset of headache for diagnosis of subarachnoid haemorrhage: prospective cohort study. BMJ 2011; 343:d4277.
- McCormack RF, Hutson A. Can computed tomography angiography of the brain replace lumbar puncture in the evaluation of acute-onset headache after a negative noncontrast cranial computed tomography scan? Acad Emerg Med 2010; 17:444–451.
- Connolly ES Jr, Rabinstein AA, Carhuapoma JR, et al; American Heart Association Stroke Council; Council on Cardiovascular Radiology and Intervention; Council on Cardiovascular Nursing; Council on Cardiovascular Surgery and Anesthesia; Council on Clinical Cardiology. Guidelines for the management of aneurysmal subarachnoid hemorrhage: a guideline for healthcare professionals from the American Heart Association/American Stroke Association. Stroke 2012; 43:1711–1737.
- Vermuelen M, Hasan D, Blijenberg BG, Hijdra A, van Gijn J. Xanthochromia after subarachnoid haemorrhage needs no revisitation. J Neurol Neurosurg Psychiatry 1989; 52:826–828.
- Molyneaux AJ, Kerr RS, Yu LM, et al; International Subarachnoid Aneurysm Trial (ISAT) Collaborative Group. International subarachnoid hemorrhage trial (ISAT) of neurosurgical clipping versus endovascular coiling in 2,143 patients with ruptured intracranial aneurysms: a randomised comparison of effects on survival, dependency, seizures, rebleeding, subgroups, and aneurysm occlusion. Lancet 2005; 366:809–817.
- Caglayan HZ, Colpak IA, Kansu T. A diagnostic challenge: dilated pupil. Curr Opin Ophthalmol 2013; 24:550–557.
- Brophy GM, Bell R, Claassen J, et al; Neurocritical Care Society Status Epilepticus Guideline Writing Committee. Guidelines for the evaluation and management of status epilepticus. Neurocrit Care 2012; 17:3–23.
- Chang CW, Bleck TP. Status epilepticus. Neurol Clin 1995; 13:529–548.
- Treiman DM. Generalized convulsive status epilepticus in the adult. Epilepsia 1993; 34(suppl 1):S2–S11.
- Leppick IE. Status epilepticus: the next decade. Neurology 1990; 40(suppl 2):4–9.
- Aranda A, Foucart G, Ducassé JL, Grolleau S, McGonigal A, Valton L. Generalized convulsive status epilepticus management in adults: a cohort study with evaluation of professional practice. Epilepsia 2010; 51:2159–2167.
- DeLorenzo RJ, Waterhouse EJ, Towne AR, et al. Persistent nonconvulsive status epilepticus after the control of convulsive status epilepticus. Epilepsia 1998; 39:833–840.
- Casha S, Christie S. A systematic review of intensive cardiopulmonary management after spinal cord injury. J Neurotrauma 2011; 28:1479–1495.
- Walters BC, Hadley MN, Hurlbert RJ, et al; American Association of Neurological Surgeons; Congress of Neurological Surgeons. Guidelines for the management of acute cervical spine and spinal cord injuries: 2013 update. Neurosurgery 2013; 60(suppl 1):82–91.
- Hurlbert RJ, Hadley MN, Walters BC, et al. Pharmacological therapy for acute spinal cord injury. Neurosurgery 2013; 72(suppl 2):93–105.
- Cohen MS, Younger D. Aspects of the natural history of myasthenia gravis: crisis and death. Ann NY Acad Sci 1981; 377:670–677.
- Belack RS, Sanders DB. On the concept of myasthenic crisis. J Clin Neuromuscul Dis 2002; 4:40–42.
- Chaudhuri A, Behan PO. Myasthenic crisis. QJM 2009; 102:97–107.
- Mayer SA. Intensive care of the myasthenic patient. Neurology 1997; 48(suppl 5):70S–75S.
- Jani-Acsadi A, Lisak RP. Myasthenic crisis: guidelines for prevention and treatment. J Neurol Sci 2007; 261:127–133.
- Bershad EM, Feen ES, Suarez JI. Myasthenia gravis crisis. South Med J 2008; 101:63–69.
- Ahmed S, Kirmani JF, Janjua N, et al. An update on myasthenic crisis. Curr Treat Options Neurol 2005; 7:129–141.
- Godoy DA, Vaz de Mello LJ, Masotti L, Napoli MD. The myasthenic patient in crisis: an update of the management in neurointensive care unit. Arq Neuropsiquiatr 2013; 71:627–639.
- Hughes RA, Wijdicks EF, Benson E, et al; Multidisciplinary Consensus Group. Supportive care for patients with Guillain-Barré syndrome: Arch Neurol 2005; 62:1194–1198.
Neurologic emergencies such as acute stroke, status epilepticus, subarachnoid hemorrhage, neuromuscular weakness, and spinal cord injury affect millions of Americans yearly.1,2 These conditions can be difficult to diagnose, and delays in recognition and treatment can have devastating results. Consequently, it is important for nonneurologists to be able to quickly recognize these conditions and initiate timely management, often while awaiting neurologic consultation.
Here, we review how to recognize and treat these common, serious conditions.
ACUTE ISCHEMIC STROKE: TIME IS OF THE ESSENCE
Stroke is the fourth leading cause of death in the United States and is one of the most common causes of disability worldwide.3–5 About 85% of strokes are ischemic, resulting from diminished vascular supply to the brain. Symptoms such as facial droop, unilateral weakness or numbness, aphasia, gaze deviation, and unsteadiness of gait may be seen. Time is of the essence, as all currently available interventions are safe and effective only within defined time windows.
Diagnosis and assessment
When acute ischemic stroke is suspected, the clinical history, time of onset, and basic neurologic examination should be obtained quickly.
The National Institutes of Health (NIH) stroke scale is an objective marker for assessing stroke severity as well as evolution of disease and should be obtained in all stroke patients. Scores range from 0 (best) to 42 (worst) (www.ninds.nih.gov/doctors/NIH_Stroke_Scale.pdf).
Time of onset of symptoms is essential to determine, since it guides eligibility for acute therapies. Clinicians should ascertain the last time the patient was seen to be neurologically well in order to estimate this time window as closely as possible.
Laboratory tests should include a fingerstick blood glucose measurement, coagulation studies, complete blood cell count, and basic metabolic profile.
Computed tomography (CT) of the head without contrast should be obtained immediately to exclude acute hemorrhage and any alternative diagnoses that could explain the patient’s symptoms. Acute brain ischemia is often not apparent on CT during the first few hours of injury. Therefore, a patient presenting with new focal neurologic deficits and an unremarkable result on CT of the head should be treated as having had an acute ischemic stroke, and interventional therapies should be considered.
Stroke mimics should be considered and treated, as appropriate (Table 1).
Acute management of ischemic stroke
Acute treatment should not be delayed by obtaining chest radiography, inserting a Foley catheter, or obtaining an electrocardiogram. The longer the time that elapses before treatment, the worse the functional outcome, underscoring the need for rapid decision-making.6–8
Lowering the head of the bed may provide benefit by promoting blood flow to ischemic brain tissue.9 However, this should not be done in patients with significantly elevated intracerebral pressure and concern for herniation.
Permissive hypertension (antihypertensive treatment only for blood pressure greater than 220/110 mm Hg) should be allowed per national guidelines to provide adequate perfusion to brain areas at risk of injury.10
Tissue plasminogen activator. Patients with ischemic stroke who present within 3 hours of symptom onset should be considered for intravenous administration of tissue plasminogen activator (tPA), a safe and effective therapy with nearly 2 decades of evidence to support its use.10 The treating physician should carefully review the risks and benefits of this therapy.
To receive tPA, the patient must have all of the following:
- Clinical diagnosis of ischemic stroke with measurable neurologic deficit
- Onset of symptoms within the past 3 hours
- Age 18 or older.
The patient must not have any of the following:
- Significant stroke within the past 3 months
- Severe traumatic head injury within the past 3 months
- History of significant intracerebral hemorrhage
- Previously ruptured arteriovenous malformation or intracranial aneurysm
- Central nervous system neoplasm
- Arterial puncture at a noncompressible site within the past 7 days
- Evidence of hemorrhage on CT of the head
- Evidence of ischemia in greater than 33% of the cerebral hemisphere on head CT
- History and symptoms strongly suggesting subarachnoid hemorrhage
- Persistent hypertension (systolic pressure ≥ 185 mm Hg or diastolic pressure ≥ 110 mm Hg)
- Evidence of acute significant bleeding (external or internal)
- Hypoglycemia—ie, serum glucose less than 50 mg/dL (< 2.8 mmol/L)
- Thrombocytopenia (platelet count < 100 × 109/L)
- Significant coagulopathy (international normalized ratio > 1.7, prothrombin time > 15 seconds, or abnormally elevated activated partial thromboplastin time)
- Current use of a factor Xa inhibitor or direct thrombin inhibitor.
Relative contraindications:
- Minor or rapidly resolving symptoms
- Major surgery or trauma within the past 14 days
- Gastrointestinal or urinary tract bleeding within the past 21 days
- Myocardial infarction in the past 3 months
- Unruptured intracranial aneurysm
- Seizure occurring at stroke onset
- Pregnancy.
If these criteria are satisfied, tPA should be given at a dose of 0.9 mg/kg intravenously over 60 minutes. Ten percent of the dose should be given as an initial bolus, followed by a constant infusion of the remaining 90% over 1 hour.
If tPA is given, the blood pressure must be kept lower than 185/110 mm Hg to minimize the risk of symptomatic intracerebral hemorrhage.
A subset of patients may benefit from receiving intravenous tPA between 3 and 4.5 hours after the onset of stroke symptoms. These include patients who are no more than 80 years old, who have not recently used oral anticoagulants, who do not have severe neurologic injury (ie, do not have NIH Stroke Scale scores > 25), and who do not have diabetes mellitus or a history of ischemic stroke.11 Although many hospitals have such a protocol for tPA up to 4.5 hours after the onset of stroke symptoms, this time window is not currently approved by the US Food and Drug Administration.
Intra-arterial therapy. Based on recent trials, some patients may benefit further from intra-arterial thrombolysis or mechanical thrombectomy, both delivered during catheter-based cerebral angiography, independent of intravenous tPA administration.12,13 These patients should be evaluated on a case-by-case basis by a neurologist and neurointerventional team. Time windows for these treatments generally extend to 6 hours from stroke onset and perhaps even longer in some situations (eg, basilar artery occlusion).
An antiplatelet agent should be started quickly in all stroke patients who do not receive tPA. Patients who receive tPA can begin receiving an antiplatelet agent 24 hours afterward.
Unfractionated heparin. There is no evidence to support the use of unfractionated heparin in most cases of acute ischemic stroke.10
Glucose control (in the range of 140–180 mg/dL) and fever control remain essential elements of post-acute stroke care to provide additional protection to the damaged brain.
For ischemic stroke due to atrial fibrillation
In ischemic stroke due to atrial fibrillation, early anticoagulation should be considered, based on the CHA2DS2-VASC risk of ischemic stroke vs the HAS-BLED risk of hemorrhage (calculators available at www.mdcalc.com).
In general, anticoagulation may be withheld during the first 72 hours while further stroke workup and evaluation of extent of injury are carried out, as there is an increased risk of hemorrhagic transformation of the ischemic stroke. Often, anticoagulation is resumed at a full dose between 72 hours and 2 weeks of the ischemic stroke.
ACUTE HEMORRHAGIC STROKE: BLOOD PRESSURE, COAGULATION
Approximately 15% of strokes are caused by intracerebral hemorrhage, which can be detected with noncontrast head CT with a sensitivity of 98.6% within 6 hours of the onset of bleeding.14 A common underlying cause of intracerebral hemorrhage is chronic poorly controlled hypertension, causing rupture of damaged (or “lipohyalinized”) vessels with resultant blood extravasation into the brain parenchyma. Other causes are less common (Table 2).
Treatment of acute hemorrhagic stroke
Acute treatment of intracerebral hemorrhage includes blood pressure control, reversal of underlying coagulopathy or anticoagulation, and sometimes intracranial pressure control. There is little role for surgery in most cases, based on findings of randomized trials.15
Blood pressure control. Many studies have investigated optimal blood pressure goals in acute intracerebral hemorrhage. Recent data suggest that early aggressive therapy, targeting a systolic blood pressure goal less than 140 mm Hg within the first hour, is safe and can lead to better functional outcomes than a more conservative blood-pressure-lowering target.16 Rapid-onset, short-acting antihypertensive agents in intravenous form, such as nicardipine and labetalol, are frequently used. Of note, this treatment strategy for hemorrhagic stroke is in direct contrast to the treatment of ischemic stroke, in which permissive hypertension (blood pressure goal < 220/110 mm Hg) is often pursued.
Reversal of any coagulation abnormalities should be done quickly in intracranial hemorrhage. Warfarin use has been shown to be a strong independent predictor of intracranial hemorrhage expansion, which increases the risk of death.17,18
Increasingly, agents other than vitamin K or fresh-frozen plasma are being used to rapidly reverse anticoagulation, including prothrombin complex concentrate (available in three- and four-factor preparations) and recombinant factor VIIa. While four-factor prothrombin complex concentrate and recombinant factor VIIa have been shown to be more efficacious than fresh-frozen plasma, there are limited data directly comparing these newer reversal agents against each other.19 The use of these medications is limited by availability and practitioner familiarity.20–22
Reversing anticoagulation due to target-specific oral anticoagulants. The acute management of intracranial hemorrhage in patients taking the new target-specific oral anticoagulants (eg, dabigatran, apixaban, rivaroxaban, edoxaban) remains challenging. Laboratory tests such as factor Xa levels are not readily available in many institutions and do not provide results in a timely fashion, and in the interim, acute hemorrhage and clinical deterioration may occur. Management strategies involve giving fresh-frozen plasma, prothrombin complex concentrate, and consideration of hemodialysis.23 Dabigatran reversal with idarucizumab has recently been shown to have efficacy.24
Vigilance for elevated intracranial pressure. Intracranial hemorrhage can occasionally cause elevated intracranial pressure, which should be treated rapidly. Any acute decline in mental status in a patient with intracranial hemorrhage requires emergency imaging to evaluate for expansion of hemorrhage.
SUBARACHNOID HEMORRHAGE
The sudden onset of a “thunderclap” headache (often described by patients as “the worst headache of my life”) suggests subarachnoid hemorrhage.
In contrast to intracranial hemorrhage, in subarachnoid hemorrhage blood collects mainly in the cerebral spinal fluid-containing spaces surrounding the brain, leading to a higher incidence of hydrocephalus from impaired drainage of cerebrospinal fluid. Nontraumatic subarachnoid hemorrhage is most often caused by rupture of an intracranial aneurysm, which can be a devastating event, with death rates approaching 50%.25
Diagnosis of subarachnoid hemorrhage
Noncontrast CT of the head is the main modality for diagnosing subarachnoid hemorrhage. Blood within the subarachnoid space is demonstrable in 92% of cases if CT is performed within the first 24 hours of hemorrhage, with an initial sensitivity of about 95% within the first 6 hours of onset.14,26,27 The longer CT is delayed, the lower the sensitivity.
Some studies suggest that a protocol of CT followed by CT angiography can safely exclude aneurysmal subarachnoid hemorrhage and obviate the need for lumbar puncture. However, further research is required to validate this approach.28
Lumbar puncture. If clinical suspicion of subarachnoid hemorrhage remains strong even though initial CT is negative, lumbar puncture must be performed for cerebrospinal fluid analysis.29 Xanthochromia (a yellowish pigmentation of the cerebrospinal fluid due to the degeneration of blood products that occurs within 8 to 12 hours of bleeding) should raise the alarm for subarachnoid hemorrhage; this sign may be present up to 4 weeks after the bleeding event.30
If lumbar puncture is contraindicated, then aneurysmal subarachnoid hemorrhage has not been ruled out, and further neurologic consultation should be pursued.
Management of subarachnoid hemorrhage
Early management of blood pressure for a ruptured intracranial aneurysm follows strategies similar to those for intracranial hemorrhage. Further investigation is rapidly directed toward an underlying vascular malformation, with intracranial vessel imaging such as CT angiography, magnetic resonance angiography, or the gold standard test—catheter-based cerebral angiography.
Aneurysms are treated (or “secured”) either by surgical clipping or by endovascular coiling. Endovascular coiling is preferable in cases in which both can be safely attempted.31 If the facility lacks the resources to do these procedures, the patient should be referred to a nearby tertiary care center.
INTRACRANIAL HYPERTENSION: DANGER OF BRAIN HERNIATION
A number of conditions can cause an acute intracranial pressure elevation. The danger of brain herniation requires that therapies be implemented rapidly to prevent catastrophic neurologic injury. In many situations, nonneurologists are the first responders and therefore should be familiar with basic intracranial pressure management.
Initial symptoms of acute rise in intracranial pressure
As intracranial pressure rises, pressure is typically equally distributed throughout the cranial vault, leading to dysfunction of the ascending reticular activating system, which clinically manifests as the inability to stay alert despite varying degrees of noxious stimulation. Progressive cranial neuropathies (often starting with pupillary abnormalities) and coma are often seen in this setting as the upper brainstem begins to be compressed.
Initial assessment and treatment of elevated intracranial pressure
Noncontrast CT of the head is often obtained immediately when acutely elevated intracranial pressure is suspected. If clinical examination and radiographic findings are consistent with intracranial hypertension, prompt measures can be started at the bedside.
Elevate the head of the bed to 30 degrees to promote venous drainage and reduce intracranial pressure. (In contrast, most other hemodynamically unstable patients are placed flat or in the Trendelenburg position.)
Intubation should be done quickly in cases of airway compromise, and hyperventilation should be started with a goal Paco2 of 30 to 35 mm Hg. This hypocarbic strategy promotes cerebral vasoconstriction and a transient decrease in intracranial pressure.
Hyperosmolar therapy allows for transient intracranial volume decompression and is the mainstay of emergency medical treatment of intracranial hypertension. Mannitol is a hyperosmolar polysaccharide that promotes osmotic diuresis and removes excessive cerebral water. In the acute setting, it can be given as an intravenous bolus of 1 to 2 g/kg through a peripheral intravenous line, followed by a bolus every 4 to 6 hours. Hypotension can occur after diuresis, and renal function should be closely monitored since frequent mannitol use can promote acute tubular necrosis. In patients who are anuric, the medication is typically not used.
Hypertonic saline (typically 3% sodium chloride, though different concentrations are available) is an alternative that helps draw interstitial fluid into the intravascular space, decreasing cerebral edema and maintaining hemodynamic stability. Relative contraindications include congestive heart failure or renal failure leading to pulmonary edema from volume overload. Hypertonic saline can be given as a bolus or a constant infusion. Some institutions have rapid access to 23.4% saline, which can be given as a 30-mL bolus but typically requires a central venous catheter for rapid infusion.
Comatose patients with radiographic findings of hydrocephalus, epidural or subdural hematoma, or mass effect with midline shift warrant prompt neurosurgical consultation for further surgical measures of intracranial pressure control and monitoring.
The ‘blown’ pupil
The physician should be concerned about elevated intracranial pressure if a patient has mydriasis, ie, an abnormally dilated (“blown”) pupil, which is a worrisome sign in the setting of true intracranial hypertension. However, many different processes can cause mydriasis and should be kept in mind when evaluating this finding (Table 3).32 If radiographic findings do not suggest elevated intracranial pressure, further workup into these other processes should be pursued.
STATUS EPILEPTICUS: SEIZURE CONTROL IS IMPORTANT
A continuous unremitting seizure lasting longer than 5 minutes or recurrent seizure activity in a patient who does not regain consciousness between seizures should be treated as status epilepticus. All seizure types carry the risk of progressing to status epilepticus, and responsiveness to antiepileptic drug therapy is inversely related to the duration of seizures. It is imperative that seizure activity be treated early and aggressively to prevent recalcitrant seizure activity, neuronal damage, and progression to status epilepticus.33
Once the ABCs of emergency stabilization have been performed (ie, airway, breathing, circulation), antiepileptic drug therapy should start immediately using established algorithms (Figure 1).34–36 During the course of treatment, the reliability of the neurologic examination may be limited due to medication effects or continued status epilepticus, making continuous video electroencephalographic monitoring often necessary to guide further therapy in patients who are not rapidly recovering.34–38
Once status epilepticus has resolved, further investigation into the underlying cause should be pursued quickly, especially in patients without a previous diagnosis of epilepsy. Head CT with contrast or magnetic resonance imaging can be used to look for any structural abnormality that may explain seizures. Basic laboratory tests including toxicology screening can identify a common trigger such as hypoglycemia or stimulant use. Fever or other possible signs of meningitis should be investigated further with cerebrospinal fluid analysis.
SPINAL CORD INJURY
Acute spinal cord injury can lead to substantial long-term neurologic impairment and should be suspected in any patient presenting with focal motor loss, sensory loss, or both with sparing of the cranial nerves and mental status. Causes of injury include compression (traumatic or nontraumatic) and inflammatory and noninflammatory myelopathies.
The location of the injury can be inferred by analyzing the symptoms, which can point to the cord level and indicate whether the anterior or posterior of the cord is involved. Anterior cord injury tends to affect the descending corticospinal and pyramidal tracts, resulting in motor deficits and weakness. Posterior cord injury involves the dorsal columns, leading to deficits of vibration sensation and proprioception. High cervical cord injuries tend to involve varying degrees of quadriparesis, sensory loss, and sometimes respiratory compromise. A clinical history of bilateral lower-extremity weakness, a “band-like” sensory complaint around the lower chest or abdomen, or both, can suggest thoracic cord involvement. Symptoms isolated to one or both lower extremities along with lower back pain and bowel or bladder involvement may point to injury of the lumbosacral cord.
Basic management of spinal cord injury includes decompression of the bladder and initial protection against further injury with a stabilizing collar or brace.
Magnetic resonance imaging with and without contrast is the ideal study to evaluate injuries to the spinal cord itself. While CT is helpful in identifying bony disease of the spinal column (eg, evaluating traumatic fractures), it is not helpful in viewing intrinsic cord pathology.
Traumatic myelopathy
Traumatic spinal cord injury is usually suggested by the clinical history and confirmed with CT. In this setting, early consultation with a neurosurgeon is required to prevent permanent cord injury.
Guidelines suggest maintaining a mean arterial pressure greater than 85 to 90 mm Hg for the first 7 days after traumatic spinal cord injury, a particular problem in the setting of hemodynamic instability, which can accompany lesions above the midthoracic level.39,40
Patients with vertebral body misalignment should be placed in an appropriate stabilizing collar or brace until a medically trained professional deems it appropriate to discontinue the device, or until surgical stabilization is performed.
Methylprednisone is a controversial intervention for acute spinal cord trauma, lacking clear benefit in meta-analyses.41
Nontraumatic compressive myelopathy
Patients with nontraumatic compressive myelopathy tend to present with varying degrees of back pain and worsening sensorimotor function. The differential diagnosis includes epidural abscesses, hematoma, metastatic neoplasm, and osteophyte compression (Table 4). The clinical history helps to guide therapy and should involve assessment for previous spinal column injury, immunocompromised state, travel history (which provides information on risks of exposure to a variety of diseases, including infections), and constitutional symptoms such as fever and weight loss.
Epidural abscess can have devastating results if missed. Red flags such as recent illness, intravenous drug use, focal back pain, fever, worsening numbness or weakness, and bowel or bladder incontinence should raise suspicion of this disorder. Emergency magnetic resonance imaging is required to diagnose this condition, and treatment involves urgent administration of antibiotics and consideration of surgical drainage.
Noncompressive myelopathies
There are numerous causes of noncompressive spinal cord injury (Table 4), and the etiology may be inflammatory (eg, “myelitis”) or noninflammatory. The diagnostic workup may require both magnetic resonance imaging and cerebrospinal fluid analysis. Acute disease-targeted therapy is rarely indicated and can be deferred until a full diagnostic workup has been completed.
NEUROMUSCULAR DISEASE: IS VENTILATION NEEDED?
Diseases involving the motor components of the peripheral nervous system (Table 5) share the common risk of causing ventilatory failure due to weakness of the diaphragm, intercostal muscles, and upper-airway muscles. Clinicians need to be aware of this risk and view these disorders as neurologic emergencies.
Determining when these patients require mechanical intubation is a challenge. Serial measurements of maximum inspiratory force and vital capacity are important and can be accomplished quickly at the bedside by a respiratory therapist. A maximum inspiratory force less than –30 cm H2O or a vital capacity less than 20 mL/kg, or both, are worrisome markers that raise concern for impending ventilatory failure. Serial measurements can detect changes in these values that might indicate the need for elective intubation. In any patient presenting with weakness of the limbs, these measurements are an important step in the initial evaluation.
Myasthenic crisis
Myasthenia gravis is caused by autoantibodies directed against postsynaptic acetylcholine receptors. Patients demonstrate muscle weakness, usually in a proximal pattern, with fatigue, respiratory distress, nasal speech, ophthalmoparesis, and dysphagia. Exacerbations can occur as a response to recent infection, surgery, or medications such as neuromuscular blocking agents or aminoglycosides.
Myasthenic crisis, while uncommon, is a life-threatening emergency characterized by bulbar or respiratory failure secondary to muscle weakness. It can occur in patients already diagnosed with myasthenia gravis or may be the initial manifestation of the disease.42–49 Intubation and mechanical ventilation are frequently required. Postoperative myasthenic patients in whom extubation has been delayed more than 24 hours should be considered in crisis.45
The diagnosis of myasthenia gravis can be made by serum autoantibody testing, electromyography, and nerve conduction studies (with repetitive stimulation) or administration of edrophonium in patients with obvious ptosis.
The mainstay of therapy for myasthenic crisis is either intravenous immunoglobulin at a dose of 2 g/kg over 2 to 5 days or plasmapheresis (5–7 exchanges over 7–14 days). Corticosteroids are not recommended in myasthenic crisis in patients who are not intubated, as they can potentiate an initial worsening of crisis. Once the patient begins to show clinical improvement, outpatient pyridostigmine and immunosuppressive medications can be resumed at a low dose and titrated as tolerated.
Acute inflammatory demyelinating polyneuropathy (Guillain-Barré syndrome)
Acute inflammatory demyelinating polyneuropathy is an autoimmune disorder involving autoantibodies against axons or myelin in the peripheral nervous system.
This disease should be suspected in a patient who is developing worsening muscle weakness (usually with areflexia) over the course of days to weeks. Occasionally, a recent diarrheal or other systemic infectious trigger can be identified. Blood pressure instability and cardiac arrhythmia can also be seen due to autonomic nerve involvement. Although classically described as an “ascending paralysis,” other variants of this disease have distinct clinical presentations (eg, the descending paralysis, ataxia, areflexia, ophthalmoparesis of the Miller Fisher syndrome).
Acute inflammatory demyelinating polyneuropathy is diagnosed by electromyography and nerve conduction studies. A cerebrospinal fluid profile demonstrating elevated protein and few white blood cells is typical.
Treatment, as in myasthenic crisis, involves intravenous immunoglobulin or plasmapheresis. Corticosteroids are ineffective. Anticipation of ventilatory failure and expectant intubation is essential, given the progressive nature of the disorder.50
- Pitts SR, Niska RW, Xu J, Burt CW. National hospital ambulatory medical care survey: 2006 emergency department summary. Natl Health Stat Report 2008; 7:1–38.
- McMullan JT, Knight WA, Clark JF, Beyette FR, Pancioli A. Time-critical neurological emergencies: the unfulfilled role for point-of-care testing. Int J Emerg Med 2010; 3:127–131.
- Centers for Disease Control and Prevention (CDC). Prevalence of stroke: United States, 2006–2010. MMWR Morb Mortal Wkly Rep 2012; 61:379–382.
- Lozano R, Naghavi M, Foreman K, et al. Global and regional mortality from 235 causes of death for 20 age groups in 1990 and 2010: a systematic analysis for the global burden of disease study 2010. Lancet 2012; 380:2095–2128.
- Vos T, Flaxman AD, Naghavi M, et al. Years lived with disability (YLDs) for 1,160 sequelae of 289 diseases and injuries 1990–2010: a systematic analysis for the global burden of disease study 2010. Lancet 2012; 380:2163–2196.
- Tissue plasminogen activator for acute ischemic stroke. The National Institute of Neurological Disorders and Stroke rt-PA stroke study group. N Engl J Med 1995; 333:1581–1587.
- Hacke W, Donnan G, Fieschi C, et al; ATLANTIS Trials Investigators; ECASS Trials Investigators; NINDS rt-PA Study Group Investigators. Association of outcome with early stroke treatment: pooled analysis of ATLANTIS, ECASS, and NINDS rt-PA stroke trials. Lancet 2004; 363:768–774.
- Saver JL, Fonarrow GC, Smith EE, et al. Time to treatment with intravenous tissue plasminogen activator and outcome from acute ischemic stroke. JAMA 2013; 309:2480–2488.
- Wojner-Alexander AW, Garami Z, Chernyshev OY, Alexandrov AV. Heads down: flat positioning improves blood flow velocity in acute ischemic stroke. Neurology 2005; 64:1354–1357.
- Jauch EC, Saver JL, Adams HP Jr, et al; American Heart Association Stroke Council; Council on Cardiovascular Nursing; Council on Peripheral Vascular Disease; Council on Clinical Cardiology. Guidelines for the early management of patients with acute ischemic stroke: a guideline for healthcare professionals from the American Heart Association/American Stroke Association. Stroke 2013; 44:870–947.
- Hacke W, Kaste M, Bluhmki E, et al; ECASS Investigators. Thrombolysis with alteplase 3 to 4.5 hours after acute ischemic stroke. N Engl J Med 2008; 359:1317–1329.
- Berkhemer OA, Fransen PSS, Beumer D, et al; MR CLEAN Investigators. A randomized trial of intraarterial treatment for acute ischemic stroke. N Eng J Med 2015; 372:11–20.
- Campbell BC, Mitchell PJ, Kleinig TJ, et al; EXTEND-IA Investigators. Endovascular therapy for ischemic stroke with perfusion-imaging selection. N Engl J Med 2015; 372:1009–1018.
- Backes D, Rinkel GJ, Kemperman H, Linn FH, Vergouwen MD. Time-dependent test characteristics of head computed tomography in patients suspected of nontraumatic subarachnoid hemorrhage. Stroke 2012; 43:2115–2119.
- Mendelow AD, Gregson BA, Fernandes HM, et al; STICH investigators. Early surgery versus initial conservative treatment in patients with spontaneous supratentorial intracerebral haematomas in the International Surgical Trial in Intracerebral Haemorrhage (STICH): a randomised trial. Lancet 2005; 365: 387–397.
- Anderson CS, Helley E, Huang Y, et al; INTERACT2 Investigators. Rapid blood-pressure lowering in patients with acute intracerebral hemorrhage. N Engl J Med 2013; 368:2355–2365.
- Flibotte JJ, Hagan N, O'Donnell J, Greenberg SM, Rosand J. Warfarin, hematoma expansion, and outcome of intracerebral hemorrhage. Neurology 2004; 63:1059–1064.
- Davis SM, Broderick J, Hennerici M, et al; Recombinant Activated Factor VII Intracerebral Hemorrhage Trial Investigators. Hematoma growth is a determinant of mortality and poor outcome after intracerebral hemorrhage. Neurology 2006; 66:1175–1181.
- Woo CH, Patel N, Conell C, et al. Rapid warfarin reversal in the setting of intracranial hemorrhage: a comparison of plasma, recombinant activated factor VII, and prothrombin complex concentrate. World Neurosurg 2014; 81:110–115.
- Broderick J, Connolly S, Feldmann E, et al; American Heart Association; American Stroke Association Stroke Council; High Blood Pressure Research Council; Quality of Care and Outcomes in Research Interdisciplinary Working Group. Guidelines for the management of spontaneous intracerebral hemorrhage in adults: 2007 update: a guideline from the American Heart Association/American Stroke Association Stroke Council, High Blood Pressure Research Council, and the Quality of Care and Outcomes in Research Interdisciplinary Working Group. Stroke 2007; 38:2001–2023.
- Goldstein JN, Thomas SH, Frontiero V, et al. Timing of fresh frozen plasma administration and rapid correction of coagulopathy in warfarin-related intracerebral hemorrhage. Stroke 2006, 37:151–155.
- Chapman SA, Irwin ED, Beal AL, Kulinski NM, Hutson KE, Thorson MA. Prothrombin complex concentrate versus standard therapies for INR reversal in trauma patients receiving warfarin. Ann Pharmacother 2011; 45:869–875.
- Fawole A, Daw HA, Crowther MA. Practical management of bleeding due to the anticoagulants dabigatran, rivaroxaban, and apixaban. Cleve Clin J Med 2013; 80:443–451.
- Pollack CV Jr, Reilly PA, Eikelboom J, et al. Idarucizumab for dabigatran reversal. N Engl J Med 2015; 373:511-520.
- Broderick JP, Brott TG, Duldner JE, Tomsick T, Leach A. Initial and recurrent bleeding are the major causes of death following subarachnoid hemorrhage. Stroke 1994; 25:1342–1347.
- Kassell NF, Torner JC, Haley EC Jr, Jane JA, Adams HP, Kongable GL. The international cooperative study on the timing of aneurysm surgery. Part 1: overall management results. J Neurosurg 1990; 73:18–36.
- Perry JJ, Stiell IG, Sivilotti ML, et al. Sensitivity of computed tomography performed within six hours of onset of headache for diagnosis of subarachnoid haemorrhage: prospective cohort study. BMJ 2011; 343:d4277.
- McCormack RF, Hutson A. Can computed tomography angiography of the brain replace lumbar puncture in the evaluation of acute-onset headache after a negative noncontrast cranial computed tomography scan? Acad Emerg Med 2010; 17:444–451.
- Connolly ES Jr, Rabinstein AA, Carhuapoma JR, et al; American Heart Association Stroke Council; Council on Cardiovascular Radiology and Intervention; Council on Cardiovascular Nursing; Council on Cardiovascular Surgery and Anesthesia; Council on Clinical Cardiology. Guidelines for the management of aneurysmal subarachnoid hemorrhage: a guideline for healthcare professionals from the American Heart Association/American Stroke Association. Stroke 2012; 43:1711–1737.
- Vermuelen M, Hasan D, Blijenberg BG, Hijdra A, van Gijn J. Xanthochromia after subarachnoid haemorrhage needs no revisitation. J Neurol Neurosurg Psychiatry 1989; 52:826–828.
- Molyneaux AJ, Kerr RS, Yu LM, et al; International Subarachnoid Aneurysm Trial (ISAT) Collaborative Group. International subarachnoid hemorrhage trial (ISAT) of neurosurgical clipping versus endovascular coiling in 2,143 patients with ruptured intracranial aneurysms: a randomised comparison of effects on survival, dependency, seizures, rebleeding, subgroups, and aneurysm occlusion. Lancet 2005; 366:809–817.
- Caglayan HZ, Colpak IA, Kansu T. A diagnostic challenge: dilated pupil. Curr Opin Ophthalmol 2013; 24:550–557.
- Brophy GM, Bell R, Claassen J, et al; Neurocritical Care Society Status Epilepticus Guideline Writing Committee. Guidelines for the evaluation and management of status epilepticus. Neurocrit Care 2012; 17:3–23.
- Chang CW, Bleck TP. Status epilepticus. Neurol Clin 1995; 13:529–548.
- Treiman DM. Generalized convulsive status epilepticus in the adult. Epilepsia 1993; 34(suppl 1):S2–S11.
- Leppick IE. Status epilepticus: the next decade. Neurology 1990; 40(suppl 2):4–9.
- Aranda A, Foucart G, Ducassé JL, Grolleau S, McGonigal A, Valton L. Generalized convulsive status epilepticus management in adults: a cohort study with evaluation of professional practice. Epilepsia 2010; 51:2159–2167.
- DeLorenzo RJ, Waterhouse EJ, Towne AR, et al. Persistent nonconvulsive status epilepticus after the control of convulsive status epilepticus. Epilepsia 1998; 39:833–840.
- Casha S, Christie S. A systematic review of intensive cardiopulmonary management after spinal cord injury. J Neurotrauma 2011; 28:1479–1495.
- Walters BC, Hadley MN, Hurlbert RJ, et al; American Association of Neurological Surgeons; Congress of Neurological Surgeons. Guidelines for the management of acute cervical spine and spinal cord injuries: 2013 update. Neurosurgery 2013; 60(suppl 1):82–91.
- Hurlbert RJ, Hadley MN, Walters BC, et al. Pharmacological therapy for acute spinal cord injury. Neurosurgery 2013; 72(suppl 2):93–105.
- Cohen MS, Younger D. Aspects of the natural history of myasthenia gravis: crisis and death. Ann NY Acad Sci 1981; 377:670–677.
- Belack RS, Sanders DB. On the concept of myasthenic crisis. J Clin Neuromuscul Dis 2002; 4:40–42.
- Chaudhuri A, Behan PO. Myasthenic crisis. QJM 2009; 102:97–107.
- Mayer SA. Intensive care of the myasthenic patient. Neurology 1997; 48(suppl 5):70S–75S.
- Jani-Acsadi A, Lisak RP. Myasthenic crisis: guidelines for prevention and treatment. J Neurol Sci 2007; 261:127–133.
- Bershad EM, Feen ES, Suarez JI. Myasthenia gravis crisis. South Med J 2008; 101:63–69.
- Ahmed S, Kirmani JF, Janjua N, et al. An update on myasthenic crisis. Curr Treat Options Neurol 2005; 7:129–141.
- Godoy DA, Vaz de Mello LJ, Masotti L, Napoli MD. The myasthenic patient in crisis: an update of the management in neurointensive care unit. Arq Neuropsiquiatr 2013; 71:627–639.
- Hughes RA, Wijdicks EF, Benson E, et al; Multidisciplinary Consensus Group. Supportive care for patients with Guillain-Barré syndrome: Arch Neurol 2005; 62:1194–1198.
KEY POINTS
- Patients with possible acute ischemic stroke should be assessed quickly to see if they should receive tissue plasminogen activator, which should be started within 3 hours of stroke onset. Computed tomography (CT) of the head without contrast should be done immediately to rule out acute hemorrhagic stroke.
- Acute treatment of intracerebral hemorrhage includes blood pressure control, reversal of underlying coagulopathy, and sometimes intracranial pressure control.
- If the clinical suspicion of subarachnoid hemorrhage remains strong even though initial CT was negative, lumbar puncture is mandatory.
- Hyperosmolar therapy is the mainstay of emergency medical treatment of intracranial hypertension.
- Seizure activity must be treated aggressively to prevent recalcitrant seizure activity, neuronal damage, and progression to status epilepticus.
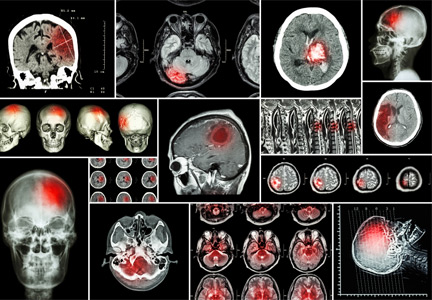
Prescribing exercise to help your patients lose weight
Although exercise is probably less effective than diet in reducing weight, most studies show that adding it to a diet regimen will increase the weight loss.1,2 Guidelines from the American Heart Association, American College of Cardiology, and Obesity Society recommend a comprehensive lifestyle program that includes a low-calorie diet as well as an increase in physical activity.3
Here, we review the many benefits of exercise for obese patients, not only in terms of weight loss, but also its positive cardiovascular and metabolic effects. Then we discuss how to motivate and prescribe exercise for this challenging group.
EXERCISE IMPROVES WEIGHT LOSS
Increasing energy expenditure by exercising can mobilize and burn stored fat and thus lead to weight loss.4
Typically, with no changes in caloric intake, exercising 60 minutes at low intensity most days of the week will remove up to 0.5 lb per week.5 Exercising harder for longer will take off more weight, up to 3 lb per week.1,6 Some practitioners believe that the total volume of exercise (frequency multiplied by time) is more important than the intensity in determining the amount of weight loss.2,7,8
Ross et al9 randomized 101 obese men to try to lose weight by exercising at a low to moderate intensity, to try to lose weight by dieting, to exercise without the goal of losing weight, or to do nothing (the control group). About half the participants declined or dropped out, but 52 completed the trial. The weight-loss-through-exercise group had lost approximately 15 lb by 12 weeks; the diet group lost a similar amount. Total body fat, visceral fat, and abdominal obesity were all reduced with both diet- and exercise-induced weight loss.
In a study in 130 severely obese adults, after 6 months of high-intensity physical activity for a mean duration of 71 minutes per week, those on an exercise-and-diet regimen lost an average of 24 lb, compared with 18 lb with diet alone.10
Another trial involved obese patients who were instructed to jog the equivalent of 20 miles (32.2 km) a week, with no restriction on caloric intake.11 They lost only 2.9 kg (6.5 lb) over 8 months. Increased food intake explained this minimal weight loss.
In an analysis of 20 studies, exercise-only interventions of 4 months or less resulted in a mean weekly weight loss of 0.4 lb (0.2 kg), with a total loss of about 5 lb (2.3 kg).12
A systematic review of 15 studies noted that aerobic exercise for 3 months or more resulted in a significant reduction in visceral adipose tissue in overweight men and women as measured by computed tomography.13
Effects that different types of exercise have on weight loss
In a study of 119 sedentary adults who were overweight or obese and who were randomized to aerobic, resistance, or combined aerobic-resistance training over 8 months, those involved in aerobic or combined aerobic and resistance training had the greatest reduction in total body and fat mass.14 Given that the combined aerobic-resistance training program required twice the time commitment of the aerobic-alone program, the authors suggested that the most efficient manner of reducing body and fat mass is aerobic training alone.14 In contrast, if the goal is to increase lean muscle mass rather than lose weight and fat, then resistance training would be preferred.14
A meta-analysis confirmed the benefit of aerobic exercise, which resulted in significantly more loss in weight (1.2 kg, 2.6 lb), waist circumference (1.57 cm), and fat mass (1.2 kg, 2.6 lb) than resistance training.15 However, combined aerobic and resistance training was even better, with significantly more weight loss (2.0 kg, 4.4 lb) and fat mass reduction (1.9 kg, 4.2 lb).15
In summary, aerobic and combined aerobic-resistance training appear to be more effective for weight management in obese people than resistance training alone.
ADDITIONAL BENEFITS OF EXERCISE
Increasing regular physical activity through structured exercise has the additional benefits of improving physical fitness, flexibility, mobility, and cardiovascular health.16,17
Even before patients lose a significant amount of weight (eg, 10%), low-intensity exercise such as walking 30 to 60 minutes most days of the week will rapidly improve cardiorespiratory fitness and have positive effects on cardiovascular risk factors such as hypertension, elevated blood glucose, and dyslipidemia.18,19 Aerobic exercise and resistance training also reduce chronic inflammation, which is a strong indicator of future disease, especially in obese patients who have high levels of inflammatory biomarkers.20,21
Even if he or she does not lose much weight, an obese exercising person with good cardiorespiratory fitness has lower cardiovascular risk than a person who is not obese but is poorly conditioned.22
Exercise lowers blood pressure
Overactivity of the sympathetic nervous system is thought to account for over 50% of all cases of hypertension.23 Obesity in concert with diabetes is characterized by sympathetic overactivity and progressive loss of cardiac parasympathetic activity.24 Cardiac autonomic neuropathy is an underestimated risk factor for the increased cardiovascular morbidity and mortality associated with obesity and diabetes, and physical exercise may promote restoration of cardioprotective autonomic modulation in the heart.24
Several studies have shown that aerobic endurance exercise lowers blood pressure in patients with hypertension, and reduction in sympathetic neural activity has been reported as one of the main mechanisms explaining this effect.23 Another mechanism is endothelium-mediated vasodilation: even a single exercise session may increase the bioavailability of nitric oxide and decrease postexercise blood pressure.25
Different types of exercise have been shown to have different effects on blood pressure.
Aerobic training has been shown to reduce systolic blood pressure by 5.2 to 11.0 mm Hg and diastolic blood pressure by 3.0 to 7.7 mm Hg.26
The hypotensive effect of endurance aerobic training is probably mediated at least in part by a reduction in systemic vascular resistance through decreased activity of the sympathetic and renin-angiotensin systems and through improved insulin sensitivity.26 Other factors that may be involved include improved endothelium-dependent vasodilation, enhanced baroreceptor sensitivity, and arterial compliance.26
Dynamic resistance exercise has less of an effect than aerobic exercise, but it has been shown to reduce systolic blood pressure by 0.5 to 4.8 mm Hg and diastolic blood pressure by 0.5 to 4.1 mm Hg.26
In a meta-analysis of studies of resistance training lasting more than 1 month in healthy adults age 18 and older, the authors noted that resistance training induced a significant blood pressure reduction in 28 normotensive or prehypertensive study groups (–3.9/–3.9 mm Hg), whereas the reduction was not significant for the five hypertensive study groups.27
Isometric resistance exercise has been associated with small cardiovascular benefits, but has been shown to reduce systolic blood pressure by 10.5 to 16.5 mm Hg and diastolic blood pressure by 0.62 to 16.4 mm Hg.26
Exercise improves type 2 diabetes
Regular physical activity improves glycemic control and can prevent or delay the onset of type 2 diabetes mellitus.28 Furthermore, physical activity positively affects lipid levels, lowers blood pressure, reduces the rate of cardiovascular events, and restores quality of life in patients with type 2 diabetes.24,29
A meta-analysis of the effect of supervised exercise in adults with type 2 diabetes found that structured exercise achieved the following:
- Lowered systolic blood pressure by 2.42 mm Hg (95% confidence interval 0.45–4.39)
- Lowered diastolic blood pressure by 2.23 mm Hg (1.25–3.21)
- Raised the level of high-density lipoprotein cholesterol by 0.04 mmol/L (0.02–0.07)
- Lowered the level of low-density lipoprotein cholesterol by 0.16 mmol/L (0.01–0.30).30
The metabolic stress from physical exercise can increase oxidation of carbohydrates during exercise, increase postexercise consumption of oxygen (which can increase the rate of fat oxidation during recovery periods after exercise), improve glucose tolerance and insulin sensitivity, and reduce glycemia for 2 to 72 hours depending on the intensity and duration of the exercise.25
Exercise lowers the Framingham risk score
Exercise improves several of the risk factors for coronary artery disease used in calculating the Framingham risk score—ie, systolic blood pressure, total cholesterol, and high-density lipoprotein cholesterol—and thus can significantly lower this number. (It is important to remember that the Framingham score is a surrogate end point of cardiovascular risk that may correlate with a real clinical end point but does not necessarily have a guaranteed relationship.)
In a study of a 12-week exercise program in middle-aged women (ages 40–55), treadmill running for 30 minutes a day 3 days a week significantly reduced 10-year cardiovascular risk scores: 10-year risk 2.2% vs 4.3% in the nonexercising group.31 Others have also shown that enhanced levels of fitness are associated with lower 10-year Framingham risk estimates.32
A study of 31 healthy sedentary adults ages 50 to 65 who were randomized to an unsupervised but pedometer-monitored home-based walking program of 30 minutes of brisk walking 5 days a week noted significant reductions in systolic and diastolic blood pressure and stroke risk, and increased functional capacity in the walking group at 12 weeks.33 Thus, the Framingham risk scores were significantly lower in the exercising group than in with the control group.33
Given that overweight and obese patients who are starting to exercise may find jogging or running daunting, it should also be noted that three brisk 10-minute walks a day are at least as effective as one continuous 30-minute walk in reducing cardiovascular risk in previously sedentary people.34
SETTING ‘SMART’ GOALS
Because obese adults typically do not comply well with prescriptions for exercise, it is important to educate them about its benefits and to provide tools such as perceived exertion scales so they can monitor their exercise, document their performance, and chart their progress; smartphone apps can also be helpful.35 Supervised exercise may improve compliance and results.36 Initially, personal trainers are excellent for starting a habit change, but they are expensive. Virtual trainers are now available and cost far less.37
People do not become obese overnight.They gain weight over a long time. Likewise, weight reduction takes time if done in a sustainable and healthy manner. Thus, SMART goals—specific, measurable, attainable, realistic, timely—should be set to sustain the self-discipline required.
EXERCISE RECOMMENDATIONS
Any exercise program should target 30 to 60 minutes of effort per day, most days of the week, ie, 150 to 300 minutes per week or more.38 But beginners should start low and go slow to avoid dropout, musculoskeletal strain, and joint injury.
The American College of Sports Medicine (ACSM)38,39 recommends combining aerobic and progressive resistance exercise as the core components of an exercise program. The aerobic component can include anaerobic high-intensity interval training (see discussion below). In addition, we recommend flexibility and balance exercises for obese patients.40
Combining aerobic and resistance exercises likely results in greater decreases in abdominal adiposity in the obese.41 In addition, the aerobic portion of a combined exercise regimen can improve functional capacity, and the resistance portion may prevent injury by strengthening the muscles, bones, and joint support systems.42 Adding exercises that promote flexibility and balance helps with range of motion and prevents injuries while exercising.43 These exercises not only expend calories during the exercise itself, but also increase resting energy expenditure for the remainder of the day, as the effects of the raised metabolism persist for hours.44
Aerobic exercise is the foundation
Aerobic exercises that involve large muscle groups, especially walking, should be the foundation of cardiopulmonary exercise for obese persons.45 Many patients can tolerate weight-bearing exercises such as walking or bike riding, but for some, exercises with limited or no weight-bearing such as swimming or aqua-aerobics are better.46
Tips for prescribing. Patients should exercise:
- On 5 or 6 days each week
- At low to moderate intensity (30%–60% of maximum oxygen consumption [Vo2 max])
- For at least 150 minutes per week, with a long-term goal of 300 minutes per week
- By walking, riding a stationary bicycle, or swimming.38,47
To mobilize and use free fatty acids as an energy source, lower-intensity longer-duration aerobic exercise is preferred.5 Thus, frequent, low-intensity or moderate-intensity training (30%–60% of Vo2 max) of longer duration (at least 60 minutes) may be the best approach to losing body fat in obese persons.5,48 Early on in the exercise program, keep the intensity low, as high-intensity training will preferentially use stored glycogen or carbohydrate as an energy substrate rather than free fatty acids or fat.5
With light-moderate exercise, the heart rate will increase and patients will perspire, but they still should be able to carry on a conversation.
Measure (or have patients measure) the heart rate using the radial artery in their wrist after 6 minutes of walking. A pulse of 100 beats per minute or more is associated with an exercise intensity of approximately 50% (or more) of Vo2 max.5
A study of 136 obese men and women who exercised for 6 months found that those doing aerobic exercise only and those doing a combination of aerobic and resistance exercise had greater cardiopulmonary fitness, greater reductions in abdominal and visceral fat, and more improved insulin sensitivity than those doing resistance exercise only.41 Although the aerobiconly group lost more weight (6 lb) than the aerobic-plus-resistance group (5.1 lb) and the resistance-only group (1.4 lb), combining aerobic and resistance exercise is considered optimal.
All physical activity is beneficial, but activities that have less impact on the joints are less likely to cause injuries and joint pain. Aerobic activities that are especially useful in obese adults include walking at a speed of at least 2.5 miles per hour, bicycling, jogging, treadmill walking, swimming, aqua-aerobics, rowing, and low-impact aerobics classes.
Walking is the easiest way for most people to start their program, as it is safe, accessible, and relatively cheap with respect to equipment.35 Adding a simple pedometer or smartphone app to measure the amount of exercise, together with physician counseling, may improve compliance and thus weight loss.49,50
Obese patients may have been inactive for quite a while. Therefore, the sessions should be short and low-intensity at first, then steadily progress.51 To minimize dropout, avoid hard exercise too soon for people with a low exercise capacity or high body mass index at baseline, and give positive feedback and encouragement at each visit.52
It is reasonable to introduce other aerobic exercises to vary the routine, use other muscle groups, and reduce the chance of injury from overuse of one muscle or joint group. Then, as cardiorespiratory fitness improves, the patient will be more confident about trying activities that are more challenging, such as jogging and aerobics classes. An aerobic exercise program consisting only of swimming is less efficacious for weight loss in this population.53
High-intensity interval training
High-intensity interval training involves relatively brief bursts of vigorous exercise separated by periods of recovery and is a time-efficient, novel alternative to continuous exercise.54 The exercise component is anaerobic, meaning muscle movement that does not require oxygen. Anaerobic exercise uses fast-twitch muscle fibers, and thus helps that musculature to become stronger, larger, and more toned. Evidence suggests that high-intensity interval training induces health-enhancing adaptations similar to those of continuous exercise, despite a substantially lower time commitment.41
The ACSM recommends that most adults engage in moderate-intensity cardiorespiratory exercise training for at least 30 minutes a day on at least 5 days a week for a total of at least 150 minutes per week, or high-intensity cardiorespiratory exercise training for at least 20 minutes a day on at least 3 days a week for a goal of 75 minutes a week.38 Thus, high-intensity interval training may be attractive for obese patients because it entails a shorter time commitment to achieve similar weight loss and improved insulin sensitivity than low-intensity or moderate-intensity continuous exercise.
High-intensity exercise has been shown to be effective for obese patients if they can do it.54–56 In one study,57 134 obese patients, mean age 53, underwent supervised high-intensity interval training with resistance training two or three times a week, were encouraged to perform one or two additional exercise sessions a week (unsupervised), and were counseled to follow a Mediterranean diet. At 9 months, investigators noted a significant reduction in body mass, waist circumference, and fat mass.
A study of 12 weeks of high-intensity interval training, moderate-intensity interval training, or no exercise in 34 obese adolescent girls noted that body mass and percentage body fat were significantly decreased with both interval training regimens. However, the high-intensity group had greater reductions in waist circumference and more significant improvements in blood lipid levels, adiponectin levels, and insulin sensitivity.58
Of 62 overweight and obese patients (mean age 53.3, mean body mass index 35.8 kg/m2), 97% adhered to a program of high-intensity interval training over 9 months, which resulted in an average weekly energy expenditure of 1,582 kcal.55 Clinically and statistically significant improvements occurred in body mass (–5.3 kg), body mass index (–1.9 kg/m2), and waist circumference (–5.8 cm) (P < .0001 for all variables). Total fat mass, trunk fat mass, and lipid levels also significantly improved (P < .0001), and the prevalence of metabolic syndrome was reduced by 32.5% (P < .05).
In a meta-analysis of the effect of exercise on overweight adults, training of moderate or high intensity was noted to have the highest potential to reduce visceral adipose tissue in overweight men and women.13 Another meta-analysis noted that high-intensity interval training appeared to promote more improvement in fitness and similar improvements in some cardiometabolic risk factors than moderate exercise performed for at least 8 to 12 weeks in overweight patients.56
A typical progressive exercise program for obese adults is shown in Table 1.
Progressive resistance exercise
Progressive resistance exercises are generally easier for obese patients, as they are not aerobically challenging, allow patients to exercise around physically active people who thus motivate them, and encourage positive feelings about completing their exercise sets.59 The result is improved muscular fitness, socialization, and increased confidence in their abilities (self-efficacy).59
Progressive resistance exercises also promote favorable energy balance and reduced visceral fat deposition through enhanced basal metabolism and activity levels while counteracting age- and disease-related muscle wasting.59 They have been shown to improve cognitive ability, self-esteem, movement control, muscle mass, strength, glucose control, insulin sensitivity, resting blood pressure, lipid profile, and bone mineral density and to reduce fat weight, low back pain, arthritic discomfort, insomnia, anxiety, and depression.60
Gym neophytes should spend a few sessions with a personal trainer to learn how to use the equipment.
While the primary goal of resistance training is more muscle strength, it can reduce fat and weight, burning up to 170 kcal in a 20-minute intense exercise session.61 It reduces both total body fat and visceral adipose tissue, thus benefiting obese persons by reducing insulin resistance.62 All exercise, and especially resistance exercise, can help to strengthen the musculoskeletal system, reduce muscle atrophy, and improve bone mineral density.63
The ACSM guidelines38 recommend progressive resistance exercise on 2 or 3 nonconsecutive days a week. It should involve:
- Exercises that work 8 to 10 muscle groups per session
- Two to four sets of 8 to 12 repetitions for each muscle group.
Exercising on nonconsecutive days allows time for the complete cycle of muscle tissue remodeling.64 Such self-regulated intensity reduces the likelihood of excessive delayed-onset muscle soreness, which can discourage new participants.65
To prevent muscle injury, obese people should begin with low-intensity workouts using lower resistance, one set of 8 to 12 repetitions 2 days a week. Then, they should gradually but progressively increase the intensity, volume, and frequency of the training.47 This will obviate a plateau in training and will maximize musculoskeletal adaptation. The prescription should include exercises for the upper body (eg, biceps curls), lower body (eg, leg presses), and the midsection (eg, abdominal curl-ups, which give better abdominal muscle engagement and less risk to the back than crunches) and focus on the correct exercise form and function rather than the amount of resistance or weight lifted.
A typical progressive resistance exercise program for obese adults is shown in Table 2.
Flexibility exercise
Flexibility exercise involves stretching to improve the movement of muscles, joints, and ligaments.45 While not specifically used in an energy-expenditure strategy, flexibility (or mobility) exercises help to increase or maintain joint range of motion and can reduce muscle and joint pain associated with obesity and exercise.66
The ACSM recommends that stretching exercises be done when the muscles are warm after a brief warm-up or exercise session.38 Typically, muscles should be stretched for at least 15 seconds, and stretching is recommended at a frequency of 2 to 4 days per week.38
A good way to incorporate flexibility exercise is to join a yoga class, as yoga has been shown to improve strength and flexibility and may help control physiologic variables such as blood pressure, lipids, respiration, heart rate, and metabolic rate to improve overall exercise capacity in obese patients.67
Balance exercise
Balance exercises help obese patients improve their stability. Poor balance is associated with injuries, accidents, and falls during activities of daily living.68
Balance, the ability to maintain the body’s center of gravity within its base of support, can be categorized as static (sustaining the body in static equilibrium or within its base of support) or dynamic (maintaining equilibrium during a transition from a dynamic to a static state), which is more challenging.69 Doing both static and dynamic balance training maximizes balance and stability.69 While most activities that involve moving the body or body parts (such as walking) will improve balance, some additional balance exercises can be beneficial.
Balance exercises can be done without any equipment. Examples are balancing on one foot for 15 seconds and standing up and sitting down without using the hands. However, specific equipment can help, including physioballs, stability balls, cut-in-half stability balls, balance discs, balance wedges, wobble boards, rocker boards, and Indo boards.70 In fact, balance boards and stability balls engage more muscle fibers in other areas of the body (lower back, lower abs, quads, hamstrings, and calves) than exercises done without those balancing devices.71
Balance training for at least 10 minutes a day, 3 days a week, for 4 weeks that incorporates various methods of balance training appears to improve balance.56 Obese patients commencing a program should start with static balance exercises and then progress to dynamic ones. In addition, as balance training progresses, obese patients can integrate balance and stability training exercises with other pieces of equipment, such as performing squats on a balance board, and then gradually add weights (eg, dumbbells) to the exercise.
An example of a weekly comprehensive exercise program for an obese patient that incorporates all major exercise types is provided in Table 3. In addition, some smartphone apps that are especially helpful in overweight newcomers to exercise include Couch-to-5K, GymGoal 2, Moves, Fitbit, Workout Trainer, Endomondo, MapMyFitness, Fitocracy, and Fitness Buddy.
BARIATRIC SURGERY AND LIFESTYLE MANAGEMENT FOR OBESITY
Bariatric surgery is a safe and effective treatment for severe obesity and comorbidities including type 2 diabetes mellitus, but weight loss and health outcomes vary considerably among individuals.72,73 Of importance, postoperative weight loss after bariatric surgery and long-term weight loss largely depend on the extent to which patients can make and sustain changes to their lifestyle, including diet, exercise, and behavior modification.72,74
Exercise, especially supervised, is associated with more weight loss after bariatric surgery.61 In a meta-analysis of bariatric patients, exercise participants involved in moderate or greater levels of exercise lost a mean of 3.6 kg more than the minimal exercise groups.75 Another meta-analysis noted the beneficial effects of exercise incorporating more than 30 minutes a day of moderate physical activity following bariatric surgery and was associated with a greater weight loss of over 4% of body mass index.76 These findings were consistent with those of yet another meta-analysis.77
In summary, exercise appears to significantly increase weight loss after bariatric surgery.
TREATMENT CONSIDERATIONS IN MORBID OBESITY
Challenges faced by severely obese or morbidly obese patients affect their exercise options. The types of exercise they are able to perform are limited in most cases to very-low-impact, low-intensity exercises, which may not be as efficient in weight loss or weight maintenance.48 Therefore, it may be prudent to set more conservative weight-loss goals for them, especially early in the program. Compliance and success rates may be better with low-impact activities such as walking, water aerobics, stationary cycling, and resistance training in the severely obese population.
The more severe the obesity, the more comorbidities such as diabetes, hypertension, hyperlipidemia, arthritis, sleep apnea, gastroesophageal reflux disease, and the greater the risk of metabolic syndrome—and conversely, the greater the potential benefit from bariatric surgery followed by exercise.74
A LONG-TERM ENDEAVOR
For obese patients, a comprehensive exercise program will improve functional status, favorably influence cardiovascular risk factors, and help with weight loss or weight maintenance.
Managing obesity is a long-term endeavor.78 For it to succeed, both the patient and the physician need to keep up their efforts. To keep the patient from becoming discouraged, the clinician should focus not just on weight, but also on improvements in metabolic profile and cardiorespiratory fitness. In addition, a careful evaluation, a clear exercise prescription, defined goals, ongoing monitoring (by the patient and the provider), frequent feedback, and charting of progress will improve daily performance and the chance of long-term success.
- Thorogood A, Mottillo S, Shimony A, et al. Isolated aerobic exercise and weight loss: a systematic review and meta-analysis of randomized controlled trials. Am J Med 2011; 124:747–755.
- Church T. Exercise in obesity, metabolic syndrome, and diabetes. Prog Cardiovasc Dis 2011; 53:412–418.
- Jensen MD, Ryan DH, Apovian CM, et al; American College of Cardiology/American Heart Association Task Force on Practice Guidelines; Obesity Society. 2013 AHA/ACC/TOS guideline for the management of overweight and obesity in adults: a report of the American College of Cardiology/American Heart Association Task Force on Practice Guidelines and The Obesity Society. Circulation 2014; 129(suppl 2):S102–S138.
- Strasser B. Physical activity in obesity and metabolic syndrome. Ann N Y Acad Sci 2013; 1281:141–159.
- Poirier P, Despres JP. Exercise in weight management of obesity. Cardiol Clin 2001; 19:459–470.
- Shaw K, Gennat H, O’Rourke P, Del Mar C. Exercise for overweight or obesity. Cochrane Database Syst Rev 2006; 4:CD003817.
- Slentz CA, Houmard JA, Kraus WE. Exercise, abdominal obesity, skeletal muscle, and metabolic risk: evidence for a dose response. Obesity (Silver Spring) 2009; 17(suppl 3):S27–S33.
- Ross R, Hudson R, Stotz PJ, Lam M. Effects of exercise amount and intensity on abdominal obesity and glucose tolerance in obese adults: a randomized trial. Ann Intern Med 2015; 162:325–334.
- Ross R, Dagnone D, Jones PJ, et al. Reduction in obesity and related comorbid conditions after diet-induced weight loss or exercise-induced weight loss in men. A randomized, controlled trial. Ann Intern Med 2000; 133:92–103.
- Goodpaster BH, Delany JP, Otto AD, et al. Effects of diet and physical activity interventions on weight loss and cardiometabolic risk factors in severely obese adults: a randomized trial. JAMA 2010; 304:1795–1802.
- Slentz CA, Duscha BD, Johnson JL, et al. Effects of the amount of exercise on body weight, body composition, and measures of central obesity: STRRIDE—a randomized controlled study. Arch Intern Med 2004; 164:31–39.
- Ross R, Janssen I. Physical activity, total and regional obesity: dose-response considerations. Med Sci Sports Exerc 2001; 33(suppl 6):S521–S529.
- Vissers D, Hens W, Taeymans J, Baeyens JP, Poortmans J, Van Gaal L. The effect of exercise on visceral adipose tissue in overweight adults: a systematic review and meta-analysis. PLoS One 2013; 8:e56415.
- Willis LH, Slentz CA, Bateman LA, et al. Effects of aerobic and/or resistance training on body mass and fat mass in overweight or obese adults. J Appl Physiol (1985) 2012; 113:1831–1837.
- Schwingshackl L, Dias S, Strasser B, Hoffmann G. Impact of different training modalities on anthropometric and metabolic characteristics in overweight/obese subjects: a systematic review and network meta-analysis. PLoS One 2013; 8:e82853.
- Cook CM, Schoeller DA. Physical activity and weight control: conflicting findings. Curr Opin Clin Nutr Metab Care 2011; 14:419–424.
- Choo J, Lee J, Cho JH, Burke LE, Sekikawa A, Jae SY. Effects of weight management by exercise modes on markers of subclinical atherosclerosis and cardiometabolic profile among women with abdominal obesity: a randomized controlled trial. BMC Cardiovasc Disord 2014; 14:82.
- Carroll S, Dudfield M. What is the relationship between exercise and metabolic abnormalities? A review of the metabolic syndrome. Sports Med 2004; 34:371–418.
- Shaibi GQ, Ryder JR, Kim JY, Barraza E. Exercise for obese youth: refocusing attention from weight loss to health gains. Exerc Sport Sci Rev 2015; 43:41–47.
- You T, Arsenis NC, Disanzo BL, Lamonte MJ. Effects of exercise training on chronic inflammation in obesity: current evidence and potential mechanisms. Sports Med 2013; 43:243–256.
- Bluher S, Petroff D, Wagner A, et al. The one year exercise and lifestyle intervention program KLAKS: effects on anthropometric parameters, cardiometabolic risk factors and glycemic control in childhood obesity. Metabolism 2014; 63:422–430.
- Lee CD, Blair SN, Jackson AS. Cardiorespiratory fitness, body composition, and all-cause and cardiovascular disease mortality in men. Am J Clin Nutr 1999; 69:373–380.
- Leosco D, Parisi V, Femminella GD, et al. Effects of exercise training on cardiovascular adrenergic system. Front Physiol 2013; 4:348.
- Voulgari C, Pagoni S, Vinik A, Poirier P. Exercise improves cardiac autonomic function in obesity and diabetes. Metabolism 2013; 62:609–621.
- Asano RY, Sales MM, Browne RA, et al. Acute effects of physical exercise in type 2 diabetes: a review. World J Diabetes 2014; 5:659–665.
- Brook RD, Appel LJ, Rubenfire M, et al; American Heart Association Professional Education Committee of the Council for High Blood Pressure Research, Council on Cardiovascular and Stroke Nursing, Council on Epidemiology and Prevention, and Council on Nutrition, Physical Activity. Beyond medications and diet: alternative approaches to lowering blood pressure: a scientific statement from the American Heart Association. Hypertension 2013; 61:1360–1383.
- Cornelissen VA, Fagard RH, Coeckelberghs E, Vanhees L. Impact of resistance training on blood pressure and other cardiovascular risk factors: a meta-analysis of randomized, controlled trials. Hypertension 2011; 58:950–958.
- Ades PA. A lifestyle program of exercise and weight loss is effective in preventing and treating type 2 diabetes mellitus: why are programs not more available? Prev Med 2015: S0091–7435(15)00085–7.
- Ades PA, Savage PD, Marney AM, Harvey J, Evans KA. Remission of recently diagnosed type 2 diabetes mellitus with weight loss and exercise. J Cardiopulm Rehabil Prev 2015; 35:193–197.
- Hayashino Y, Jackson JL, Fukumori N, Nakamura F, Fukuhara S. Effects of supervised exercise on lipid profiles and blood pressure control in people with type 2 diabetes mellitus: a meta-analysis of randomized controlled trials. Diabetes Res Clin Pract 2012; 98:349–360.
- Saffi MA, Polanczyk CA, Rabelo-Silva ER. Lifestyle interventions reduce cardiovascular risk in patients with coronary artery disease: a randomized clinical trial. Eur J Cardiovasc Nurs 2014; 13:436–443.
- LaMonte MJ, Durstine JL, Addy CL, Irwin ML, Ainsworth BE. Physical activity, physical fitness, and Framingham 10-year risk score: the cross-cultural activity participation study. J Cardiopulm Rehabil 2001; 21:63–70.
- Tully MA, Cupples ME, Chan WS, McGlade K, Young IS. Brisk walking, fitness, and cardiovascular risk: a randomized controlled trial in primary care. Prev Med 2005; 41:622–628.
- Murphy M, Nevill A, Neville C, Biddle S, Hardman A. Accumulating brisk walking for fitness, cardiovascular risk, and psychological health. Med Sci Sports Exerc 2002; 34:1468–1474.
- Colley RC, Hills AP, King NA, Byrne NM. Exercise-induced energy expenditure: implications for exercise prescription and obesity. Patient Educ Couns 2010; 79:327–332.
- Baillot A, Mampuya WM, Comeau E, Méziat-Burdin A, Langlois MF. Feasibility and impacts of supervised exercise training in subjects with obesity awaiting bariatric surgery: a pilot study. Obes Surg 2013; 23:882–891.
- Lowe S, ÓLaighin G. The age of the virtual trainer. Procedia Engineering 2012; 34:242–247.
- Garber CE, Blissmer B, Deschenes MR, et al; American College of Sports Medicine. American College of Sports Medicine position stand. Quantity and quality of exercise for developing and maintaining cardiorespiratory, musculoskeletal, and neuromotor fitness in apparently healthy adults: guidance for prescribing exercise. Med Sci Sports Exerc 2011; 43:1334–1359.
- Donnelly JE, Blair SN, Jakicic JM, Manore MM, Rankin JW, Smith BK; American College of Sports Medicine. American College of Sports Medicine position stand. Appropriate physical activity intervention strategies for weight loss and prevention of weight regain for adults. Med Sci Sports Exerc 2009; 41:459–471.
- Montero-Fernandez N, Serra-Rexach JA. Role of exercise on sarcopenia in the elderly. Eur J Phys Rehabil Med 2013; 49:131–143.
- Davidson LE, Hudson R, Kilpatrick K, et al. Effects of exercise modality on insulin resistance and functional limitation in older adults: a randomized controlled trial. Arch Intern Med 2009; 169:122–131.
- Liu CJ, Latham NK. Progressive resistance strength training for improving physical function in older adults. Cochrane Database Syst Rev 2009; 3:CD002759.
- Manini TM, Newman AB, Fielding R, et al; LIFE Research Group. Effects of exercise on mobility in obese and nonobese older adults. Obesity (Silver Spring) 2010; 18:1168–1175.
- Hackney KJ, Engels HJ, Gretebeck RJ. Resting energy expenditure and delayed-onset muscle soreness after full-body resistance training with an eccentric concentration. J Strength Cond Res 2008; 22:1602–1609.
- Siddiqui NI, Nessa A, Hossain MA. Regular physical exercise: way to healthy life. Mymensingh Med J 2010; 19:154–158.
- Chicco AJ. Exercise training in prevention and rehabilitation: which training mode is best? Minerva Cardioangiol 2008; 56:557–570.
- Westcott WL, Winett RA, Annesi JJ, Wojcik JR, Anderson ES, Madden PJ. Prescribing physical activity: applying the ACSM protocols for exercise type, intensity, and duration across 3 training frequencies. Phys Sportsmed 2009; 37:51–58.
- Mougios V1, Kazaki M, Christoulas K, Ziogas G, Petridou A. Does the intensity of an exercise programme modulate body composition changes? Int J Sports Med 2006; 27:178–181.
- Richardson CR, Newton TL, Abraham JJ, Sen A, Jimbo M, Swartz AM. A meta-analysis of pedometer-based walking interventions and weight loss. Ann Fam Med 2008; 6:69–77.
- Stovitz SD, VanWormer JJ, Center BA, Bremer KL. Pedometers as a means to increase ambulatory activity for patients seen at a family medicine clinic. J Am Board Fam Pract 2005; 18:335–343.
- Lepor NE, Fouchia DD, McCullough PA. New vistas for the treatment of obesity: turning the tide against the leading cause of morbidity and cardiovascular mortality in the developed world. Rev Cardiovasc Med 2013; 14:20–40.
- Wittmer M, Volpatti M, Piazzalonga S, Hoffmann A. Expectation, satisfaction, and predictors of dropout in cardiac rehabilitation. Eur J Prev Cardiol 2012; 19:1082–1088.
- Gwinup G. Weight loss without dietary restriction: efficacy of different forms of aerobic exercise. Am J Sports Med 1987; 15:275–279.
- Jung ME, Bourne JE, Little JP. Where does HIT fit? An examination of the affective response to high-intensity intervals in comparison to continuous moderate- and continuous vigorous-intensity exercise in the exercise intensity-affect continuum. PLoS One 2014; 9:e114541.
- Gremeaux V, Drigny J, Nigam A, et al. Long-term lifestyle intervention with optimized high-intensity interval training improves body composition, cardiometabolic risk, and exercise parameters in patients with abdominal obesity. Am J Phys Med Rehabil 2012; 91:941–950.
- Kessler HS, Sisson SB, Short KR. The potential for high-intensity interval training to reduce cardiometabolic disease risk. Sports Med 2012; 42:489–509.
- Dalzill C, Nigam A, Juneau M, et al. Intensive lifestyle intervention improves cardiometabolic and exercise parameters in metabolically healthy obese and metabolically unhealthy obese individuals. Can J Cardiol 2014; 30:434–440.
- Racil G, Ben Ounis O, Hammouda O, et al. Effects of high vs moderate exercise intensity during interval training on lipids and adiponectin levels in obese young females. Eur J Appl Physiol 2013; 113:2531–2540.
- Willey KA, Singh MA. Battling insulin resistance in elderly obese people with type 2 diabetes: bring on the heavy weights. Diabetes Care 2003; 26:1580–1588.
- Westcott WL. Resistance training is medicine: effects of strength training on health. Curr Sports Med Rep 2012; 11:209–216.
- Haltom RW, Kraemer RR, Sloan RA, Hebert EP, Frank K, Tryniecki JL. Circuit weight training and its effects on excess postexercise oxygen consumption. Med Sci Sports Exerc 1999; 31:1613–1618.
- Strasser B, Schobersberger W. Evidence for resistance training as a treatment therapy in obesity. J Obes 2011; pii:482564.
- Fonseca H, Moreira-Gonçalves D, Coriolano HJ, Duarte JA. Bone quality: the determinants of bone strength and fragility. Sports Med 2014; 44:37–53.
- Candow DG, Burke DG. Effect of short-term equal-volume resistance training with different workout frequency on muscle mass and strength in untrained men and women. J Strength Cond Res 2007; 21:204–207.
- Trost Z, France CR, Thomas JS. Pain-related fear and avoidance of physical exertion following delayed-onset muscle soreness. Pain 2011; 152:1540–1547.
- Mathus-Vliegen EM. Obesity and the elderly. J Clin Gastroenterol 2012; 46:533–544.
- Dhananjai S, Sadashiv, Tiwari S, Dutt K, Kumar R. Reducing psychological distress and obesity through yoga practice. Int J Yoga 2013; 6:66–70.
- Mathus-Vliegen EM; Obesity Management Task Force of the European Association for the Study of Obesity. Prevalence, pathophysiology, health consequences and treatment options of obesity in the elderly: a guideline. Obes Facts 2012; 5:460–483.
- DiStefano LJ, Clark MA, Padua DA. Evidence supporting balance training in healthy individuals: a systemic review. J Strength Cond Res 2009; 23:2718–2731.
- Ogaya S, Ikezoe T, Soda N, Ichihashi N. Effects of balance training using wobble boards in the elderly. J Strength Cond Res 2011; 25:2616–2622.
- Sukalinggam CL, Sukalinggam GL, Kasim F, Yusof A. Stability ball training on lower back strength has greater effect in untrained female compared to male. J Hum Kinet 2012; 33:133–141.
- Kalarchian M, Turk M, Elliott J, Gourash W. Lifestyle management for enhancing outcomes after bariatric surgery. Curr Diab Rep 2014; 14:540.
- Rothwell L, Kow L, Toouli J. Effect of a post-operative structured exercise programme on short-term weight loss after obesity surgery using adjustable gastric bands. Obes Surg 2015; 25:126–128.
- Mechanick JI, Youdim A, Jones DB, et al. Clinical practice guidelines for the perioperative nutritional, metabolic, and nonsurgical support of the bariatric surgery patient—2013 update: cosponsored by American Association of Clinical Endocrinologists, the Obesity Society, and American Society for Metabolic & Bariatric Surgery. Surg Obes Relat Dis 2013; 9:159–191.
- Egberts K, Brown WA, Brennan L, O’Brien PE. Does exercise improve weight loss after bariatric surgery? A systematic review. Obes Surg 2012; 22:335–341.
- Livhits M, Mercado C, Yermilov I, et al. Exercise following bariatric surgery: systematic review. Obes Surg 2010; 20:657–665.
- Jacobi D, Ciangura C, Couet C, Oppert JM. Physical activity and weight loss following bariatric surgery. Obes Rev 2011; 12:366–377.
- Wadden TA, Foster GD, Letizia KA. One-year behavioral treatment of obesity: comparison of moderate and severe caloric restriction and the effects of weight maintenance therapy. J Consult Clin Psychol 1994; 62:165–171.
Although exercise is probably less effective than diet in reducing weight, most studies show that adding it to a diet regimen will increase the weight loss.1,2 Guidelines from the American Heart Association, American College of Cardiology, and Obesity Society recommend a comprehensive lifestyle program that includes a low-calorie diet as well as an increase in physical activity.3
Here, we review the many benefits of exercise for obese patients, not only in terms of weight loss, but also its positive cardiovascular and metabolic effects. Then we discuss how to motivate and prescribe exercise for this challenging group.
EXERCISE IMPROVES WEIGHT LOSS
Increasing energy expenditure by exercising can mobilize and burn stored fat and thus lead to weight loss.4
Typically, with no changes in caloric intake, exercising 60 minutes at low intensity most days of the week will remove up to 0.5 lb per week.5 Exercising harder for longer will take off more weight, up to 3 lb per week.1,6 Some practitioners believe that the total volume of exercise (frequency multiplied by time) is more important than the intensity in determining the amount of weight loss.2,7,8
Ross et al9 randomized 101 obese men to try to lose weight by exercising at a low to moderate intensity, to try to lose weight by dieting, to exercise without the goal of losing weight, or to do nothing (the control group). About half the participants declined or dropped out, but 52 completed the trial. The weight-loss-through-exercise group had lost approximately 15 lb by 12 weeks; the diet group lost a similar amount. Total body fat, visceral fat, and abdominal obesity were all reduced with both diet- and exercise-induced weight loss.
In a study in 130 severely obese adults, after 6 months of high-intensity physical activity for a mean duration of 71 minutes per week, those on an exercise-and-diet regimen lost an average of 24 lb, compared with 18 lb with diet alone.10
Another trial involved obese patients who were instructed to jog the equivalent of 20 miles (32.2 km) a week, with no restriction on caloric intake.11 They lost only 2.9 kg (6.5 lb) over 8 months. Increased food intake explained this minimal weight loss.
In an analysis of 20 studies, exercise-only interventions of 4 months or less resulted in a mean weekly weight loss of 0.4 lb (0.2 kg), with a total loss of about 5 lb (2.3 kg).12
A systematic review of 15 studies noted that aerobic exercise for 3 months or more resulted in a significant reduction in visceral adipose tissue in overweight men and women as measured by computed tomography.13
Effects that different types of exercise have on weight loss
In a study of 119 sedentary adults who were overweight or obese and who were randomized to aerobic, resistance, or combined aerobic-resistance training over 8 months, those involved in aerobic or combined aerobic and resistance training had the greatest reduction in total body and fat mass.14 Given that the combined aerobic-resistance training program required twice the time commitment of the aerobic-alone program, the authors suggested that the most efficient manner of reducing body and fat mass is aerobic training alone.14 In contrast, if the goal is to increase lean muscle mass rather than lose weight and fat, then resistance training would be preferred.14
A meta-analysis confirmed the benefit of aerobic exercise, which resulted in significantly more loss in weight (1.2 kg, 2.6 lb), waist circumference (1.57 cm), and fat mass (1.2 kg, 2.6 lb) than resistance training.15 However, combined aerobic and resistance training was even better, with significantly more weight loss (2.0 kg, 4.4 lb) and fat mass reduction (1.9 kg, 4.2 lb).15
In summary, aerobic and combined aerobic-resistance training appear to be more effective for weight management in obese people than resistance training alone.
ADDITIONAL BENEFITS OF EXERCISE
Increasing regular physical activity through structured exercise has the additional benefits of improving physical fitness, flexibility, mobility, and cardiovascular health.16,17
Even before patients lose a significant amount of weight (eg, 10%), low-intensity exercise such as walking 30 to 60 minutes most days of the week will rapidly improve cardiorespiratory fitness and have positive effects on cardiovascular risk factors such as hypertension, elevated blood glucose, and dyslipidemia.18,19 Aerobic exercise and resistance training also reduce chronic inflammation, which is a strong indicator of future disease, especially in obese patients who have high levels of inflammatory biomarkers.20,21
Even if he or she does not lose much weight, an obese exercising person with good cardiorespiratory fitness has lower cardiovascular risk than a person who is not obese but is poorly conditioned.22
Exercise lowers blood pressure
Overactivity of the sympathetic nervous system is thought to account for over 50% of all cases of hypertension.23 Obesity in concert with diabetes is characterized by sympathetic overactivity and progressive loss of cardiac parasympathetic activity.24 Cardiac autonomic neuropathy is an underestimated risk factor for the increased cardiovascular morbidity and mortality associated with obesity and diabetes, and physical exercise may promote restoration of cardioprotective autonomic modulation in the heart.24
Several studies have shown that aerobic endurance exercise lowers blood pressure in patients with hypertension, and reduction in sympathetic neural activity has been reported as one of the main mechanisms explaining this effect.23 Another mechanism is endothelium-mediated vasodilation: even a single exercise session may increase the bioavailability of nitric oxide and decrease postexercise blood pressure.25
Different types of exercise have been shown to have different effects on blood pressure.
Aerobic training has been shown to reduce systolic blood pressure by 5.2 to 11.0 mm Hg and diastolic blood pressure by 3.0 to 7.7 mm Hg.26
The hypotensive effect of endurance aerobic training is probably mediated at least in part by a reduction in systemic vascular resistance through decreased activity of the sympathetic and renin-angiotensin systems and through improved insulin sensitivity.26 Other factors that may be involved include improved endothelium-dependent vasodilation, enhanced baroreceptor sensitivity, and arterial compliance.26
Dynamic resistance exercise has less of an effect than aerobic exercise, but it has been shown to reduce systolic blood pressure by 0.5 to 4.8 mm Hg and diastolic blood pressure by 0.5 to 4.1 mm Hg.26
In a meta-analysis of studies of resistance training lasting more than 1 month in healthy adults age 18 and older, the authors noted that resistance training induced a significant blood pressure reduction in 28 normotensive or prehypertensive study groups (–3.9/–3.9 mm Hg), whereas the reduction was not significant for the five hypertensive study groups.27
Isometric resistance exercise has been associated with small cardiovascular benefits, but has been shown to reduce systolic blood pressure by 10.5 to 16.5 mm Hg and diastolic blood pressure by 0.62 to 16.4 mm Hg.26
Exercise improves type 2 diabetes
Regular physical activity improves glycemic control and can prevent or delay the onset of type 2 diabetes mellitus.28 Furthermore, physical activity positively affects lipid levels, lowers blood pressure, reduces the rate of cardiovascular events, and restores quality of life in patients with type 2 diabetes.24,29
A meta-analysis of the effect of supervised exercise in adults with type 2 diabetes found that structured exercise achieved the following:
- Lowered systolic blood pressure by 2.42 mm Hg (95% confidence interval 0.45–4.39)
- Lowered diastolic blood pressure by 2.23 mm Hg (1.25–3.21)
- Raised the level of high-density lipoprotein cholesterol by 0.04 mmol/L (0.02–0.07)
- Lowered the level of low-density lipoprotein cholesterol by 0.16 mmol/L (0.01–0.30).30
The metabolic stress from physical exercise can increase oxidation of carbohydrates during exercise, increase postexercise consumption of oxygen (which can increase the rate of fat oxidation during recovery periods after exercise), improve glucose tolerance and insulin sensitivity, and reduce glycemia for 2 to 72 hours depending on the intensity and duration of the exercise.25
Exercise lowers the Framingham risk score
Exercise improves several of the risk factors for coronary artery disease used in calculating the Framingham risk score—ie, systolic blood pressure, total cholesterol, and high-density lipoprotein cholesterol—and thus can significantly lower this number. (It is important to remember that the Framingham score is a surrogate end point of cardiovascular risk that may correlate with a real clinical end point but does not necessarily have a guaranteed relationship.)
In a study of a 12-week exercise program in middle-aged women (ages 40–55), treadmill running for 30 minutes a day 3 days a week significantly reduced 10-year cardiovascular risk scores: 10-year risk 2.2% vs 4.3% in the nonexercising group.31 Others have also shown that enhanced levels of fitness are associated with lower 10-year Framingham risk estimates.32
A study of 31 healthy sedentary adults ages 50 to 65 who were randomized to an unsupervised but pedometer-monitored home-based walking program of 30 minutes of brisk walking 5 days a week noted significant reductions in systolic and diastolic blood pressure and stroke risk, and increased functional capacity in the walking group at 12 weeks.33 Thus, the Framingham risk scores were significantly lower in the exercising group than in with the control group.33
Given that overweight and obese patients who are starting to exercise may find jogging or running daunting, it should also be noted that three brisk 10-minute walks a day are at least as effective as one continuous 30-minute walk in reducing cardiovascular risk in previously sedentary people.34
SETTING ‘SMART’ GOALS
Because obese adults typically do not comply well with prescriptions for exercise, it is important to educate them about its benefits and to provide tools such as perceived exertion scales so they can monitor their exercise, document their performance, and chart their progress; smartphone apps can also be helpful.35 Supervised exercise may improve compliance and results.36 Initially, personal trainers are excellent for starting a habit change, but they are expensive. Virtual trainers are now available and cost far less.37
People do not become obese overnight.They gain weight over a long time. Likewise, weight reduction takes time if done in a sustainable and healthy manner. Thus, SMART goals—specific, measurable, attainable, realistic, timely—should be set to sustain the self-discipline required.
EXERCISE RECOMMENDATIONS
Any exercise program should target 30 to 60 minutes of effort per day, most days of the week, ie, 150 to 300 minutes per week or more.38 But beginners should start low and go slow to avoid dropout, musculoskeletal strain, and joint injury.
The American College of Sports Medicine (ACSM)38,39 recommends combining aerobic and progressive resistance exercise as the core components of an exercise program. The aerobic component can include anaerobic high-intensity interval training (see discussion below). In addition, we recommend flexibility and balance exercises for obese patients.40
Combining aerobic and resistance exercises likely results in greater decreases in abdominal adiposity in the obese.41 In addition, the aerobic portion of a combined exercise regimen can improve functional capacity, and the resistance portion may prevent injury by strengthening the muscles, bones, and joint support systems.42 Adding exercises that promote flexibility and balance helps with range of motion and prevents injuries while exercising.43 These exercises not only expend calories during the exercise itself, but also increase resting energy expenditure for the remainder of the day, as the effects of the raised metabolism persist for hours.44
Aerobic exercise is the foundation
Aerobic exercises that involve large muscle groups, especially walking, should be the foundation of cardiopulmonary exercise for obese persons.45 Many patients can tolerate weight-bearing exercises such as walking or bike riding, but for some, exercises with limited or no weight-bearing such as swimming or aqua-aerobics are better.46
Tips for prescribing. Patients should exercise:
- On 5 or 6 days each week
- At low to moderate intensity (30%–60% of maximum oxygen consumption [Vo2 max])
- For at least 150 minutes per week, with a long-term goal of 300 minutes per week
- By walking, riding a stationary bicycle, or swimming.38,47
To mobilize and use free fatty acids as an energy source, lower-intensity longer-duration aerobic exercise is preferred.5 Thus, frequent, low-intensity or moderate-intensity training (30%–60% of Vo2 max) of longer duration (at least 60 minutes) may be the best approach to losing body fat in obese persons.5,48 Early on in the exercise program, keep the intensity low, as high-intensity training will preferentially use stored glycogen or carbohydrate as an energy substrate rather than free fatty acids or fat.5
With light-moderate exercise, the heart rate will increase and patients will perspire, but they still should be able to carry on a conversation.
Measure (or have patients measure) the heart rate using the radial artery in their wrist after 6 minutes of walking. A pulse of 100 beats per minute or more is associated with an exercise intensity of approximately 50% (or more) of Vo2 max.5
A study of 136 obese men and women who exercised for 6 months found that those doing aerobic exercise only and those doing a combination of aerobic and resistance exercise had greater cardiopulmonary fitness, greater reductions in abdominal and visceral fat, and more improved insulin sensitivity than those doing resistance exercise only.41 Although the aerobiconly group lost more weight (6 lb) than the aerobic-plus-resistance group (5.1 lb) and the resistance-only group (1.4 lb), combining aerobic and resistance exercise is considered optimal.
All physical activity is beneficial, but activities that have less impact on the joints are less likely to cause injuries and joint pain. Aerobic activities that are especially useful in obese adults include walking at a speed of at least 2.5 miles per hour, bicycling, jogging, treadmill walking, swimming, aqua-aerobics, rowing, and low-impact aerobics classes.
Walking is the easiest way for most people to start their program, as it is safe, accessible, and relatively cheap with respect to equipment.35 Adding a simple pedometer or smartphone app to measure the amount of exercise, together with physician counseling, may improve compliance and thus weight loss.49,50
Obese patients may have been inactive for quite a while. Therefore, the sessions should be short and low-intensity at first, then steadily progress.51 To minimize dropout, avoid hard exercise too soon for people with a low exercise capacity or high body mass index at baseline, and give positive feedback and encouragement at each visit.52
It is reasonable to introduce other aerobic exercises to vary the routine, use other muscle groups, and reduce the chance of injury from overuse of one muscle or joint group. Then, as cardiorespiratory fitness improves, the patient will be more confident about trying activities that are more challenging, such as jogging and aerobics classes. An aerobic exercise program consisting only of swimming is less efficacious for weight loss in this population.53
High-intensity interval training
High-intensity interval training involves relatively brief bursts of vigorous exercise separated by periods of recovery and is a time-efficient, novel alternative to continuous exercise.54 The exercise component is anaerobic, meaning muscle movement that does not require oxygen. Anaerobic exercise uses fast-twitch muscle fibers, and thus helps that musculature to become stronger, larger, and more toned. Evidence suggests that high-intensity interval training induces health-enhancing adaptations similar to those of continuous exercise, despite a substantially lower time commitment.41
The ACSM recommends that most adults engage in moderate-intensity cardiorespiratory exercise training for at least 30 minutes a day on at least 5 days a week for a total of at least 150 minutes per week, or high-intensity cardiorespiratory exercise training for at least 20 minutes a day on at least 3 days a week for a goal of 75 minutes a week.38 Thus, high-intensity interval training may be attractive for obese patients because it entails a shorter time commitment to achieve similar weight loss and improved insulin sensitivity than low-intensity or moderate-intensity continuous exercise.
High-intensity exercise has been shown to be effective for obese patients if they can do it.54–56 In one study,57 134 obese patients, mean age 53, underwent supervised high-intensity interval training with resistance training two or three times a week, were encouraged to perform one or two additional exercise sessions a week (unsupervised), and were counseled to follow a Mediterranean diet. At 9 months, investigators noted a significant reduction in body mass, waist circumference, and fat mass.
A study of 12 weeks of high-intensity interval training, moderate-intensity interval training, or no exercise in 34 obese adolescent girls noted that body mass and percentage body fat were significantly decreased with both interval training regimens. However, the high-intensity group had greater reductions in waist circumference and more significant improvements in blood lipid levels, adiponectin levels, and insulin sensitivity.58
Of 62 overweight and obese patients (mean age 53.3, mean body mass index 35.8 kg/m2), 97% adhered to a program of high-intensity interval training over 9 months, which resulted in an average weekly energy expenditure of 1,582 kcal.55 Clinically and statistically significant improvements occurred in body mass (–5.3 kg), body mass index (–1.9 kg/m2), and waist circumference (–5.8 cm) (P < .0001 for all variables). Total fat mass, trunk fat mass, and lipid levels also significantly improved (P < .0001), and the prevalence of metabolic syndrome was reduced by 32.5% (P < .05).
In a meta-analysis of the effect of exercise on overweight adults, training of moderate or high intensity was noted to have the highest potential to reduce visceral adipose tissue in overweight men and women.13 Another meta-analysis noted that high-intensity interval training appeared to promote more improvement in fitness and similar improvements in some cardiometabolic risk factors than moderate exercise performed for at least 8 to 12 weeks in overweight patients.56
A typical progressive exercise program for obese adults is shown in Table 1.
Progressive resistance exercise
Progressive resistance exercises are generally easier for obese patients, as they are not aerobically challenging, allow patients to exercise around physically active people who thus motivate them, and encourage positive feelings about completing their exercise sets.59 The result is improved muscular fitness, socialization, and increased confidence in their abilities (self-efficacy).59
Progressive resistance exercises also promote favorable energy balance and reduced visceral fat deposition through enhanced basal metabolism and activity levels while counteracting age- and disease-related muscle wasting.59 They have been shown to improve cognitive ability, self-esteem, movement control, muscle mass, strength, glucose control, insulin sensitivity, resting blood pressure, lipid profile, and bone mineral density and to reduce fat weight, low back pain, arthritic discomfort, insomnia, anxiety, and depression.60
Gym neophytes should spend a few sessions with a personal trainer to learn how to use the equipment.
While the primary goal of resistance training is more muscle strength, it can reduce fat and weight, burning up to 170 kcal in a 20-minute intense exercise session.61 It reduces both total body fat and visceral adipose tissue, thus benefiting obese persons by reducing insulin resistance.62 All exercise, and especially resistance exercise, can help to strengthen the musculoskeletal system, reduce muscle atrophy, and improve bone mineral density.63
The ACSM guidelines38 recommend progressive resistance exercise on 2 or 3 nonconsecutive days a week. It should involve:
- Exercises that work 8 to 10 muscle groups per session
- Two to four sets of 8 to 12 repetitions for each muscle group.
Exercising on nonconsecutive days allows time for the complete cycle of muscle tissue remodeling.64 Such self-regulated intensity reduces the likelihood of excessive delayed-onset muscle soreness, which can discourage new participants.65
To prevent muscle injury, obese people should begin with low-intensity workouts using lower resistance, one set of 8 to 12 repetitions 2 days a week. Then, they should gradually but progressively increase the intensity, volume, and frequency of the training.47 This will obviate a plateau in training and will maximize musculoskeletal adaptation. The prescription should include exercises for the upper body (eg, biceps curls), lower body (eg, leg presses), and the midsection (eg, abdominal curl-ups, which give better abdominal muscle engagement and less risk to the back than crunches) and focus on the correct exercise form and function rather than the amount of resistance or weight lifted.
A typical progressive resistance exercise program for obese adults is shown in Table 2.
Flexibility exercise
Flexibility exercise involves stretching to improve the movement of muscles, joints, and ligaments.45 While not specifically used in an energy-expenditure strategy, flexibility (or mobility) exercises help to increase or maintain joint range of motion and can reduce muscle and joint pain associated with obesity and exercise.66
The ACSM recommends that stretching exercises be done when the muscles are warm after a brief warm-up or exercise session.38 Typically, muscles should be stretched for at least 15 seconds, and stretching is recommended at a frequency of 2 to 4 days per week.38
A good way to incorporate flexibility exercise is to join a yoga class, as yoga has been shown to improve strength and flexibility and may help control physiologic variables such as blood pressure, lipids, respiration, heart rate, and metabolic rate to improve overall exercise capacity in obese patients.67
Balance exercise
Balance exercises help obese patients improve their stability. Poor balance is associated with injuries, accidents, and falls during activities of daily living.68
Balance, the ability to maintain the body’s center of gravity within its base of support, can be categorized as static (sustaining the body in static equilibrium or within its base of support) or dynamic (maintaining equilibrium during a transition from a dynamic to a static state), which is more challenging.69 Doing both static and dynamic balance training maximizes balance and stability.69 While most activities that involve moving the body or body parts (such as walking) will improve balance, some additional balance exercises can be beneficial.
Balance exercises can be done without any equipment. Examples are balancing on one foot for 15 seconds and standing up and sitting down without using the hands. However, specific equipment can help, including physioballs, stability balls, cut-in-half stability balls, balance discs, balance wedges, wobble boards, rocker boards, and Indo boards.70 In fact, balance boards and stability balls engage more muscle fibers in other areas of the body (lower back, lower abs, quads, hamstrings, and calves) than exercises done without those balancing devices.71
Balance training for at least 10 minutes a day, 3 days a week, for 4 weeks that incorporates various methods of balance training appears to improve balance.56 Obese patients commencing a program should start with static balance exercises and then progress to dynamic ones. In addition, as balance training progresses, obese patients can integrate balance and stability training exercises with other pieces of equipment, such as performing squats on a balance board, and then gradually add weights (eg, dumbbells) to the exercise.
An example of a weekly comprehensive exercise program for an obese patient that incorporates all major exercise types is provided in Table 3. In addition, some smartphone apps that are especially helpful in overweight newcomers to exercise include Couch-to-5K, GymGoal 2, Moves, Fitbit, Workout Trainer, Endomondo, MapMyFitness, Fitocracy, and Fitness Buddy.
BARIATRIC SURGERY AND LIFESTYLE MANAGEMENT FOR OBESITY
Bariatric surgery is a safe and effective treatment for severe obesity and comorbidities including type 2 diabetes mellitus, but weight loss and health outcomes vary considerably among individuals.72,73 Of importance, postoperative weight loss after bariatric surgery and long-term weight loss largely depend on the extent to which patients can make and sustain changes to their lifestyle, including diet, exercise, and behavior modification.72,74
Exercise, especially supervised, is associated with more weight loss after bariatric surgery.61 In a meta-analysis of bariatric patients, exercise participants involved in moderate or greater levels of exercise lost a mean of 3.6 kg more than the minimal exercise groups.75 Another meta-analysis noted the beneficial effects of exercise incorporating more than 30 minutes a day of moderate physical activity following bariatric surgery and was associated with a greater weight loss of over 4% of body mass index.76 These findings were consistent with those of yet another meta-analysis.77
In summary, exercise appears to significantly increase weight loss after bariatric surgery.
TREATMENT CONSIDERATIONS IN MORBID OBESITY
Challenges faced by severely obese or morbidly obese patients affect their exercise options. The types of exercise they are able to perform are limited in most cases to very-low-impact, low-intensity exercises, which may not be as efficient in weight loss or weight maintenance.48 Therefore, it may be prudent to set more conservative weight-loss goals for them, especially early in the program. Compliance and success rates may be better with low-impact activities such as walking, water aerobics, stationary cycling, and resistance training in the severely obese population.
The more severe the obesity, the more comorbidities such as diabetes, hypertension, hyperlipidemia, arthritis, sleep apnea, gastroesophageal reflux disease, and the greater the risk of metabolic syndrome—and conversely, the greater the potential benefit from bariatric surgery followed by exercise.74
A LONG-TERM ENDEAVOR
For obese patients, a comprehensive exercise program will improve functional status, favorably influence cardiovascular risk factors, and help with weight loss or weight maintenance.
Managing obesity is a long-term endeavor.78 For it to succeed, both the patient and the physician need to keep up their efforts. To keep the patient from becoming discouraged, the clinician should focus not just on weight, but also on improvements in metabolic profile and cardiorespiratory fitness. In addition, a careful evaluation, a clear exercise prescription, defined goals, ongoing monitoring (by the patient and the provider), frequent feedback, and charting of progress will improve daily performance and the chance of long-term success.
- Thorogood A, Mottillo S, Shimony A, et al. Isolated aerobic exercise and weight loss: a systematic review and meta-analysis of randomized controlled trials. Am J Med 2011; 124:747–755.
- Church T. Exercise in obesity, metabolic syndrome, and diabetes. Prog Cardiovasc Dis 2011; 53:412–418.
- Jensen MD, Ryan DH, Apovian CM, et al; American College of Cardiology/American Heart Association Task Force on Practice Guidelines; Obesity Society. 2013 AHA/ACC/TOS guideline for the management of overweight and obesity in adults: a report of the American College of Cardiology/American Heart Association Task Force on Practice Guidelines and The Obesity Society. Circulation 2014; 129(suppl 2):S102–S138.
- Strasser B. Physical activity in obesity and metabolic syndrome. Ann N Y Acad Sci 2013; 1281:141–159.
- Poirier P, Despres JP. Exercise in weight management of obesity. Cardiol Clin 2001; 19:459–470.
- Shaw K, Gennat H, O’Rourke P, Del Mar C. Exercise for overweight or obesity. Cochrane Database Syst Rev 2006; 4:CD003817.
- Slentz CA, Houmard JA, Kraus WE. Exercise, abdominal obesity, skeletal muscle, and metabolic risk: evidence for a dose response. Obesity (Silver Spring) 2009; 17(suppl 3):S27–S33.
- Ross R, Hudson R, Stotz PJ, Lam M. Effects of exercise amount and intensity on abdominal obesity and glucose tolerance in obese adults: a randomized trial. Ann Intern Med 2015; 162:325–334.
- Ross R, Dagnone D, Jones PJ, et al. Reduction in obesity and related comorbid conditions after diet-induced weight loss or exercise-induced weight loss in men. A randomized, controlled trial. Ann Intern Med 2000; 133:92–103.
- Goodpaster BH, Delany JP, Otto AD, et al. Effects of diet and physical activity interventions on weight loss and cardiometabolic risk factors in severely obese adults: a randomized trial. JAMA 2010; 304:1795–1802.
- Slentz CA, Duscha BD, Johnson JL, et al. Effects of the amount of exercise on body weight, body composition, and measures of central obesity: STRRIDE—a randomized controlled study. Arch Intern Med 2004; 164:31–39.
- Ross R, Janssen I. Physical activity, total and regional obesity: dose-response considerations. Med Sci Sports Exerc 2001; 33(suppl 6):S521–S529.
- Vissers D, Hens W, Taeymans J, Baeyens JP, Poortmans J, Van Gaal L. The effect of exercise on visceral adipose tissue in overweight adults: a systematic review and meta-analysis. PLoS One 2013; 8:e56415.
- Willis LH, Slentz CA, Bateman LA, et al. Effects of aerobic and/or resistance training on body mass and fat mass in overweight or obese adults. J Appl Physiol (1985) 2012; 113:1831–1837.
- Schwingshackl L, Dias S, Strasser B, Hoffmann G. Impact of different training modalities on anthropometric and metabolic characteristics in overweight/obese subjects: a systematic review and network meta-analysis. PLoS One 2013; 8:e82853.
- Cook CM, Schoeller DA. Physical activity and weight control: conflicting findings. Curr Opin Clin Nutr Metab Care 2011; 14:419–424.
- Choo J, Lee J, Cho JH, Burke LE, Sekikawa A, Jae SY. Effects of weight management by exercise modes on markers of subclinical atherosclerosis and cardiometabolic profile among women with abdominal obesity: a randomized controlled trial. BMC Cardiovasc Disord 2014; 14:82.
- Carroll S, Dudfield M. What is the relationship between exercise and metabolic abnormalities? A review of the metabolic syndrome. Sports Med 2004; 34:371–418.
- Shaibi GQ, Ryder JR, Kim JY, Barraza E. Exercise for obese youth: refocusing attention from weight loss to health gains. Exerc Sport Sci Rev 2015; 43:41–47.
- You T, Arsenis NC, Disanzo BL, Lamonte MJ. Effects of exercise training on chronic inflammation in obesity: current evidence and potential mechanisms. Sports Med 2013; 43:243–256.
- Bluher S, Petroff D, Wagner A, et al. The one year exercise and lifestyle intervention program KLAKS: effects on anthropometric parameters, cardiometabolic risk factors and glycemic control in childhood obesity. Metabolism 2014; 63:422–430.
- Lee CD, Blair SN, Jackson AS. Cardiorespiratory fitness, body composition, and all-cause and cardiovascular disease mortality in men. Am J Clin Nutr 1999; 69:373–380.
- Leosco D, Parisi V, Femminella GD, et al. Effects of exercise training on cardiovascular adrenergic system. Front Physiol 2013; 4:348.
- Voulgari C, Pagoni S, Vinik A, Poirier P. Exercise improves cardiac autonomic function in obesity and diabetes. Metabolism 2013; 62:609–621.
- Asano RY, Sales MM, Browne RA, et al. Acute effects of physical exercise in type 2 diabetes: a review. World J Diabetes 2014; 5:659–665.
- Brook RD, Appel LJ, Rubenfire M, et al; American Heart Association Professional Education Committee of the Council for High Blood Pressure Research, Council on Cardiovascular and Stroke Nursing, Council on Epidemiology and Prevention, and Council on Nutrition, Physical Activity. Beyond medications and diet: alternative approaches to lowering blood pressure: a scientific statement from the American Heart Association. Hypertension 2013; 61:1360–1383.
- Cornelissen VA, Fagard RH, Coeckelberghs E, Vanhees L. Impact of resistance training on blood pressure and other cardiovascular risk factors: a meta-analysis of randomized, controlled trials. Hypertension 2011; 58:950–958.
- Ades PA. A lifestyle program of exercise and weight loss is effective in preventing and treating type 2 diabetes mellitus: why are programs not more available? Prev Med 2015: S0091–7435(15)00085–7.
- Ades PA, Savage PD, Marney AM, Harvey J, Evans KA. Remission of recently diagnosed type 2 diabetes mellitus with weight loss and exercise. J Cardiopulm Rehabil Prev 2015; 35:193–197.
- Hayashino Y, Jackson JL, Fukumori N, Nakamura F, Fukuhara S. Effects of supervised exercise on lipid profiles and blood pressure control in people with type 2 diabetes mellitus: a meta-analysis of randomized controlled trials. Diabetes Res Clin Pract 2012; 98:349–360.
- Saffi MA, Polanczyk CA, Rabelo-Silva ER. Lifestyle interventions reduce cardiovascular risk in patients with coronary artery disease: a randomized clinical trial. Eur J Cardiovasc Nurs 2014; 13:436–443.
- LaMonte MJ, Durstine JL, Addy CL, Irwin ML, Ainsworth BE. Physical activity, physical fitness, and Framingham 10-year risk score: the cross-cultural activity participation study. J Cardiopulm Rehabil 2001; 21:63–70.
- Tully MA, Cupples ME, Chan WS, McGlade K, Young IS. Brisk walking, fitness, and cardiovascular risk: a randomized controlled trial in primary care. Prev Med 2005; 41:622–628.
- Murphy M, Nevill A, Neville C, Biddle S, Hardman A. Accumulating brisk walking for fitness, cardiovascular risk, and psychological health. Med Sci Sports Exerc 2002; 34:1468–1474.
- Colley RC, Hills AP, King NA, Byrne NM. Exercise-induced energy expenditure: implications for exercise prescription and obesity. Patient Educ Couns 2010; 79:327–332.
- Baillot A, Mampuya WM, Comeau E, Méziat-Burdin A, Langlois MF. Feasibility and impacts of supervised exercise training in subjects with obesity awaiting bariatric surgery: a pilot study. Obes Surg 2013; 23:882–891.
- Lowe S, ÓLaighin G. The age of the virtual trainer. Procedia Engineering 2012; 34:242–247.
- Garber CE, Blissmer B, Deschenes MR, et al; American College of Sports Medicine. American College of Sports Medicine position stand. Quantity and quality of exercise for developing and maintaining cardiorespiratory, musculoskeletal, and neuromotor fitness in apparently healthy adults: guidance for prescribing exercise. Med Sci Sports Exerc 2011; 43:1334–1359.
- Donnelly JE, Blair SN, Jakicic JM, Manore MM, Rankin JW, Smith BK; American College of Sports Medicine. American College of Sports Medicine position stand. Appropriate physical activity intervention strategies for weight loss and prevention of weight regain for adults. Med Sci Sports Exerc 2009; 41:459–471.
- Montero-Fernandez N, Serra-Rexach JA. Role of exercise on sarcopenia in the elderly. Eur J Phys Rehabil Med 2013; 49:131–143.
- Davidson LE, Hudson R, Kilpatrick K, et al. Effects of exercise modality on insulin resistance and functional limitation in older adults: a randomized controlled trial. Arch Intern Med 2009; 169:122–131.
- Liu CJ, Latham NK. Progressive resistance strength training for improving physical function in older adults. Cochrane Database Syst Rev 2009; 3:CD002759.
- Manini TM, Newman AB, Fielding R, et al; LIFE Research Group. Effects of exercise on mobility in obese and nonobese older adults. Obesity (Silver Spring) 2010; 18:1168–1175.
- Hackney KJ, Engels HJ, Gretebeck RJ. Resting energy expenditure and delayed-onset muscle soreness after full-body resistance training with an eccentric concentration. J Strength Cond Res 2008; 22:1602–1609.
- Siddiqui NI, Nessa A, Hossain MA. Regular physical exercise: way to healthy life. Mymensingh Med J 2010; 19:154–158.
- Chicco AJ. Exercise training in prevention and rehabilitation: which training mode is best? Minerva Cardioangiol 2008; 56:557–570.
- Westcott WL, Winett RA, Annesi JJ, Wojcik JR, Anderson ES, Madden PJ. Prescribing physical activity: applying the ACSM protocols for exercise type, intensity, and duration across 3 training frequencies. Phys Sportsmed 2009; 37:51–58.
- Mougios V1, Kazaki M, Christoulas K, Ziogas G, Petridou A. Does the intensity of an exercise programme modulate body composition changes? Int J Sports Med 2006; 27:178–181.
- Richardson CR, Newton TL, Abraham JJ, Sen A, Jimbo M, Swartz AM. A meta-analysis of pedometer-based walking interventions and weight loss. Ann Fam Med 2008; 6:69–77.
- Stovitz SD, VanWormer JJ, Center BA, Bremer KL. Pedometers as a means to increase ambulatory activity for patients seen at a family medicine clinic. J Am Board Fam Pract 2005; 18:335–343.
- Lepor NE, Fouchia DD, McCullough PA. New vistas for the treatment of obesity: turning the tide against the leading cause of morbidity and cardiovascular mortality in the developed world. Rev Cardiovasc Med 2013; 14:20–40.
- Wittmer M, Volpatti M, Piazzalonga S, Hoffmann A. Expectation, satisfaction, and predictors of dropout in cardiac rehabilitation. Eur J Prev Cardiol 2012; 19:1082–1088.
- Gwinup G. Weight loss without dietary restriction: efficacy of different forms of aerobic exercise. Am J Sports Med 1987; 15:275–279.
- Jung ME, Bourne JE, Little JP. Where does HIT fit? An examination of the affective response to high-intensity intervals in comparison to continuous moderate- and continuous vigorous-intensity exercise in the exercise intensity-affect continuum. PLoS One 2014; 9:e114541.
- Gremeaux V, Drigny J, Nigam A, et al. Long-term lifestyle intervention with optimized high-intensity interval training improves body composition, cardiometabolic risk, and exercise parameters in patients with abdominal obesity. Am J Phys Med Rehabil 2012; 91:941–950.
- Kessler HS, Sisson SB, Short KR. The potential for high-intensity interval training to reduce cardiometabolic disease risk. Sports Med 2012; 42:489–509.
- Dalzill C, Nigam A, Juneau M, et al. Intensive lifestyle intervention improves cardiometabolic and exercise parameters in metabolically healthy obese and metabolically unhealthy obese individuals. Can J Cardiol 2014; 30:434–440.
- Racil G, Ben Ounis O, Hammouda O, et al. Effects of high vs moderate exercise intensity during interval training on lipids and adiponectin levels in obese young females. Eur J Appl Physiol 2013; 113:2531–2540.
- Willey KA, Singh MA. Battling insulin resistance in elderly obese people with type 2 diabetes: bring on the heavy weights. Diabetes Care 2003; 26:1580–1588.
- Westcott WL. Resistance training is medicine: effects of strength training on health. Curr Sports Med Rep 2012; 11:209–216.
- Haltom RW, Kraemer RR, Sloan RA, Hebert EP, Frank K, Tryniecki JL. Circuit weight training and its effects on excess postexercise oxygen consumption. Med Sci Sports Exerc 1999; 31:1613–1618.
- Strasser B, Schobersberger W. Evidence for resistance training as a treatment therapy in obesity. J Obes 2011; pii:482564.
- Fonseca H, Moreira-Gonçalves D, Coriolano HJ, Duarte JA. Bone quality: the determinants of bone strength and fragility. Sports Med 2014; 44:37–53.
- Candow DG, Burke DG. Effect of short-term equal-volume resistance training with different workout frequency on muscle mass and strength in untrained men and women. J Strength Cond Res 2007; 21:204–207.
- Trost Z, France CR, Thomas JS. Pain-related fear and avoidance of physical exertion following delayed-onset muscle soreness. Pain 2011; 152:1540–1547.
- Mathus-Vliegen EM. Obesity and the elderly. J Clin Gastroenterol 2012; 46:533–544.
- Dhananjai S, Sadashiv, Tiwari S, Dutt K, Kumar R. Reducing psychological distress and obesity through yoga practice. Int J Yoga 2013; 6:66–70.
- Mathus-Vliegen EM; Obesity Management Task Force of the European Association for the Study of Obesity. Prevalence, pathophysiology, health consequences and treatment options of obesity in the elderly: a guideline. Obes Facts 2012; 5:460–483.
- DiStefano LJ, Clark MA, Padua DA. Evidence supporting balance training in healthy individuals: a systemic review. J Strength Cond Res 2009; 23:2718–2731.
- Ogaya S, Ikezoe T, Soda N, Ichihashi N. Effects of balance training using wobble boards in the elderly. J Strength Cond Res 2011; 25:2616–2622.
- Sukalinggam CL, Sukalinggam GL, Kasim F, Yusof A. Stability ball training on lower back strength has greater effect in untrained female compared to male. J Hum Kinet 2012; 33:133–141.
- Kalarchian M, Turk M, Elliott J, Gourash W. Lifestyle management for enhancing outcomes after bariatric surgery. Curr Diab Rep 2014; 14:540.
- Rothwell L, Kow L, Toouli J. Effect of a post-operative structured exercise programme on short-term weight loss after obesity surgery using adjustable gastric bands. Obes Surg 2015; 25:126–128.
- Mechanick JI, Youdim A, Jones DB, et al. Clinical practice guidelines for the perioperative nutritional, metabolic, and nonsurgical support of the bariatric surgery patient—2013 update: cosponsored by American Association of Clinical Endocrinologists, the Obesity Society, and American Society for Metabolic & Bariatric Surgery. Surg Obes Relat Dis 2013; 9:159–191.
- Egberts K, Brown WA, Brennan L, O’Brien PE. Does exercise improve weight loss after bariatric surgery? A systematic review. Obes Surg 2012; 22:335–341.
- Livhits M, Mercado C, Yermilov I, et al. Exercise following bariatric surgery: systematic review. Obes Surg 2010; 20:657–665.
- Jacobi D, Ciangura C, Couet C, Oppert JM. Physical activity and weight loss following bariatric surgery. Obes Rev 2011; 12:366–377.
- Wadden TA, Foster GD, Letizia KA. One-year behavioral treatment of obesity: comparison of moderate and severe caloric restriction and the effects of weight maintenance therapy. J Consult Clin Psychol 1994; 62:165–171.
KEY POINTS
- Exercise not only helps people lose weight and keep it off, it lowers blood pressure, improves lipid levels, improves insulin sensitivity, and lowers blood glucose levels.
- Of the various types of exercise, aerobic exercise provides the most benefits, but resistance, flexibility, and balance exercises have additional value. Specifically, continuous moderate-intensity aerobic or high-intensity interval training in combination with some resistance exercises appears to be most effective for weight management.
- For people who are extremely obese, low-impact exercises performed for a longer duration may be more manageable and are still effective.
- The clinician should monitor the patient’s compliance and progress and give appropriate encouragement and feedback for sustained success.

The intersection of obstructive lung disease and sleep apnea
Many patients who have obstructive lung disease, ie, chronic obstructive pulmonary disease (COPD) or asthma, also have obstructive sleep apnea (OSA), and vice versa.
The combination of COPD and OSA was first described almost 30 years ago by Flenley, who called it “overlap syndrome.”1 At that time, he recommended that a sleep study be considered in all obese patients with COPD who snore and in those who have frequent headaches after starting oxygen therapy. In the latter group, he doubted that nocturnal oxygen was the correct treatment. He also believed that the outcomes in patients with overlap syndrome were worse than those in patients with COPD or OSA alone. These opinions remain largely valid today.
We now also recognize the combination of asthma and OSA (alternative overlap syndrome) and collectively call both combinations obstructive lung disease-obstructive sleep apnea (OLDOSA) syndrome.2 Interestingly, these relationships are likely bidirectional, with one condition aggravating or predisposing to the other.
Knowing that a patient has one of these overlap syndromes, one can initiate continuous positive airway pressure (CPAP) therapy, which can improve clinical outcomes.3–6 Therefore, when evaluating a patient with asthma or COPD, one should consider OSA using a validated questionnaire and, if the findings suggest the diagnosis, polysomnography. Conversely, it is prudent to look for comorbid obstructive lung disease in patients with OSA, as interactions between upper and lower airway dysfunction may lead to distinctly different treatment and outcomes.
Here, we briefly review asthma and COPD, explore shared risk factors for sleep-disordered breathing and obstructive lung diseases, describe potential pathophysiologic mechanisms explaining these associations, and highlight the importance of recognizing and individually treating the overlaps of OSA and COPD or asthma.
COPD AND ASTHMA ARE VERY COMMON
About 10% of the US population have COPD,7 a preventable and treatable disease mainly caused by smoking, and a leading cause of sickness and death worldwide.8,9
About 8% of Americans have asthma,7 which has become one of the most common chronic conditions in the Western world, affecting about 1 in 7 children and about 1 in 12 adults. The World Health Organization estimates that 235 million people suffer from asthma worldwide, and by 2025 this number is projected to rise to 400 million.10,11
The prevalence of these conditions in a particular population depends on the frequency of risk factors and associated morbidities, including OSA. These factors may allow asthma or COPD to arise earlier or have more severe manifestations.8,12
Asthma and COPD: Similarities and differences
Asthma and COPD share several features. Both are inflammatory airway conditions triggered or perpetuated by allergens, viral infection, tobacco smoke, products of biomass or fossil fuel combustion, and other substances. In both diseases, airflow is “obstructed” or limited, with a low ratio of forced expiratory volume in 1 second to forced vital capacity (FEV1/FVC). Symptoms can also be similar, with dyspnea, cough, wheezing, and chest tightness being the most frequent complaints. The similarities support the theory proposed by Orie et al13 (the “Dutch hypothesis”) that asthma and COPD may actually be manifestations of the same disease.
But there are also differences. COPD is strongly linked to cigarette smoking and has at least three phenotypes:
- Chronic bronchitis, defined clinically by cough and sputum production for more than 3 months per year for 2 consecutive years
- Emphysema, characterized anatomically by loss of lung parenchyma, as seen on tomographic imaging or examination of pathologic specimens
- A mixed form with bronchitic and emphysematous features, which is likely the most common.
Particularly in emphysematous COPD, smoking predisposes patients to gas-exchange abnormalities and low diffusing capacity for carbon monoxide.
In asthma, symptoms may be more episodic, the age of onset is often younger, and atopy is common, especially in allergic asthma. These episodic symptoms may correlate temporally with measurable airflow reversibility (≥ 12% and ≥ 200 mL improvement in FVC or in FEV1 after bronchodilator challenge).
However, the current taxonomy does not unequivocally divide obstructive lung diseases into asthma and COPD, and major features such as airway hyperresponsiveness, airflow reversibility, neutrophilic or CD8 lymphocytic airway inflammation, and lower concentration of nitric oxide in the exhaled air may be present in different phenotypes of both conditions (Table 1).
AIRFLOW IN OBSTRUCTIVE LUNG DISEASES AND DURING SLEEP
Normal airflow involves a complex interplay between airway resistance and elastic recoil of the entire respiratory system, including the airways, the lung parenchyma, and the chest wall (Figure 1).
In asthma and COPD, resistance to airflow is increased, predominantly in the upper airways (nasal passages, pharynx, and larynx) and in the first three or four subdivisions of the tracheobronchial tree. The problem is worse during exhalation, when elastic recoil of the lung parenchyma and chest wall also increases airway resistance, reduces airway caliber, and possibly even constricts the bronchi. This last effect may occur either due to mass loading of the bronchial smooth muscles or to large intrathoracic transmural pressure shifts that may increase extravasation of fluid in the bronchial walls, especially with higher vascular permeability in inflammatory conditions.
Furthermore, interactions between the airway and parenchyma and between the upper and lower airways, as well as radial and axial coupling of these anatomic and functional components, contribute to complex interplay between airway resistance and parenchymal-chest wall elastic energy—stretch or recoil.
The muscles of the upper and lower airway may not work together due to the loss of normal lung parenchyma (as in emphysema) or to the acute inflammation in the small airways and adjacent parenchyma (as in severe asthma exacerbations). This loss of coordination makes the upper airway more collapsible, a feature of OSA.
Additionally, obesity, gastroesophageal reflux, disease chronic rhinitis, nasal polyposis, and acute exacerbations of chronic systemic inflammation all contribute to more complex interactions between obstructive lung diseases and OSA.6
Sleep affects breathing, particularly in patients with respiratory comorbidities, and sleep-disordered breathing causes daytime symptoms and worsens quality of life.1,13–15 During sleep, respiratory centers become less sensitive to oxygen and carbon dioxide; breathing becomes more irregular, especially during rapid eye movement (REM) sleep; the chest wall moves less, so that the tidal volume and functional residual capacity are lower; sighs, yawns, and deep breaths become limited; and serum carbon dioxide concentration may rise.
OBSTRUCTIVE SLEEP APNEA
The prevalence of OSA, a form of sleep-disordered breathing characterized by limitation of inspiratory and (to a lesser degree) expiratory flow, has increased significantly in recent years, in parallel with the prevalence of its major risk factor, obesity.
OSA is generally defined as an apnea-hypopnea index of 5 or higher, ie, five or more episodes of apnea or hypopnea per hour.
OSA syndrome, ie, an apnea-hypopnea index of 5 or higher and excessive daytime sleepiness (defined by an Epworth Sleepiness Scale score > 10) was found in the initial analysis of the Wisconsin Sleep cohort in 1993 to be present in about 2% of women and 4% of men.16 A more recent longitudinal analysis showed a significant increase—for example, in people 50 to 70 years old the prevalence was up to 17.6% in men and 7.5% in women.17
Upper airway resistance syndrome, a milder form of sleep-disordered breathing, is now included under the diagnosis of OSA, as its pathophysiology is not significantly different.18
In the next section, we discuss what happens when OSA overlaps with COPD (overlap syndrome) and with asthma (“alternative overlap syndrome”)2,8 (Figure 2).
OSA AND COPD (OVERLAP SYNDROME)
Flenley1 hypothesized that patients with COPD in whom supplemental oxygen worsened hypercapnia may also have OSA and called this association overlap syndrome.
How common is overlap syndrome?
Since both COPD and OSA are prevalent conditions, overlap syndrome may also be common.
The reported prevalence of overlap syndrome varies widely, depending on the population studied and the methods used. In various studies, COPD was present in 9% to 56% of patients with OSA,19–23 and OSA was found in 5% to 85% of patients with COPD.24–27
Based on the prevalence of COPD in the general population (about 10%12) and that of sleep-disordered breathing (about 5% to 10%17), the expected prevalence of overlap syndrome in people over age 40 may be 0.5% to 1%.28 In a more inclusive estimate with “subclinical” forms of overlap syndrome—ie, OSA defined as an apnea-hypopnea index of 5 or more (about 25% of the population17) and COPD Global initiative for Chronic Obstructive Lung Disease (GOLD) stage 1 (16.8% in the National Health and Nutrition Education Survey12)—the expected prevalence of overlap is around 4%. Some studies found a higher prevalence of COPD in OSA patients than in the general population,21,29 while others did not.22,28,30 The studies differed in how they defined sleep-disordered breathing.
Larger studies are needed to better assess the true prevalence of sleep-disordered breathing in COPD. They should use more sensitive measures of airflow and standardized definitions of sleep-disordered breathing and should include patients with more severe COPD.
Fatigue and insomnia are common in COPD
Fatigue is strongly correlated with declining lung function, low exercise tolerance, and impaired quality of life in COPD.31 Factors that contribute to fatigue include dyspnea, depression, and impaired sleep.32 Some suggest that at least half of COPD patients have sleep complaints such as insomnia, sleep disruption, or sleep fragmentation.33 Insomnia, difficulty falling asleep, and early morning awakenings are the most common complaints (30%–70% of patients) and are associated with daytime fatigue.34 Conversely, comorbid OSA can contribute to fatigue and maintenance-type insomnia (ie, difficulty staying asleep and returning to sleep).
Multiple mechanisms of hypoxemia in overlap syndrome
Oxygenation abnormalities and increased work of breathing contribute to the pathophysiology of overlap syndrome. In patients with COPD, oxygenation during wakefulness is a strong predictor of gas exchange during sleep.35 Further, patients with overlap syndrome tend to have more severe hypoxia during sleep than patients with isolated COPD or OSA at rest or during exercise.36
In overlap syndrome, hypoxemia is the result of several mechanisms:
- Loss of upper airway muscle tone from intermittent episodes of obstructive apnea and hypopnea leads to upper airway collapse during sleep, particularly during REM sleep, increasing the severity of OSA.37
- Reductions in functional residual capacity from lying in the recumbent position and during REM sleep render patients with COPD more vulnerable, as compensatory use of accessory muscles to maintain near-normal ventilation in a hyperinflated state becomes impaired.37
- Alterations in pulmonary ventilation-perfusion matching may lead to altered carbon dioxide homeostasis and impaired oxygenation in patients with emphysema.
- Circadian variation in lower airway caliber may also be observed, in parallel with the bronchoconstriction caused by increased nocturnal vagotonia.
- Hypercapnia (Paco2 ≥ 45 mm Hg) may lead to overall reduced responsiveness of respiratory muscles and to a blunted response of respiratory centers to low oxygen and high carbon dioxide levels.38 Thus, hypercapnia is a better predictor of the severity of nocturnal hypoxemia than hypoxemia developing during exercise.39
In a person who is at near-maximal ventilatory capacity, even a mild increase in upper airway resistance (as seen with snoring, upper airway resistance syndrome, or OSA) increases the work of breathing. This phenomenon can lead to early arousals even before significant oxyhemoglobin desaturation occurs.
Normally, inspiratory flow limitation is counteracted by increasing inspiratory time to maintain ventilation. Patients with COPD may not be able to do this, however, as they need more time to breathe out due to narrowing of their lower airways.40 The inability to compensate for upper airway resistance, similar to the increased work of breathing seen with exercise, may lead to early arousals and increased sleep fragmentation.
Consequences of overlap syndrome
Patients with overlap syndrome appear to have higher morbidity and mortality rates than those with COPD or sleep-disordered breathing alone.
Cor pulmonale. Nighttime hypoxia is more severe and persistent in overlap syndrome than with COPD or OSA alone. This may contribute to more significant pulmonary hypertension and to the development of cor pulmonale, in which the right ventricle is altered in structure (eg, hypertrophied, dilated) or reduced in function, or both, from severe pulmonary hypertension.
In contrast to right ventricular failure due to disorders of the left heart, cor pulmonale is a result of diseases of the vasculature (eg, idiopathic pulmonary arterial hypertension), lung parenchyma (eg, COPD), upper airway (eg, OSA), or chest wall (eg, severe kyphoscoliosis). COPD is the most common cause of cor pulmonale in the United States, accounting for up to 30% of cases of cor pulmonale.41–45 In OSA, cor pulmonale is seen in up to 20% of cases,43 while in overlap syndrome cor pulmonale is encountered even more often (ie, in up to 80%); these patients have a dismal 5-year survival rate of about 30%.46
Obesity hypoventilation syndrome is characterized by obesity (body mass index ≥ 30 kg/m2) and daytime hypercapnia (Paco2 ≥ 45 mm Hg) that cannot be fully attributed to an underlying cardiopulmonary or neurologic condition.18 Hypercapnia worsens during sleep (especially during REM sleep) and is often associated with severe arterial oxygen desaturation. Up to 90% of patients with obesity hypoventilation syndrome have comorbid OSA, and the rest generally have sleep-related hypoventilation, particularly during REM sleep.
In patients with obesity hypoventilation syndrome, daytime hypercapnia may improve or even normalize with adequate positive airway pressure treatment and sustained adherence to treatment.18 Many patients with obesity hypoventilation syndrome respond to CPAP or bilevel positive airway pressure (BPAP), with improvement in daytime Paco2. However, normalization of daytime Paco2 occurs only in a subgroup of patients. In contrast, treatment with oxygen therapy alone may worsen hypercapnia.
Oxygen therapy for pure COPD, but maybe not for overlap syndrome
Continuous oxygen therapy reduces mortality in COPD,47,48 but the duration and severity of hypoxemia that warrant oxygen therapy are less clear. Oxygen therapy in hypoxemic patients has been shown to improve sleep quality and reduce arousals.49
Indications for oxygen treatment of nocturnal hypoxemia are generally based on Medicare guidelines:
- At least 5 minutes of sleep with peripheral oxygen saturation ≤ 88% or Pao2 ≤ 55 mm Hg, or
- A decrease in Pao2 of more than 10 mm Hg or in peripheral oxygen saturation of more than 5% for at least 5 minutes of sleep and associated with signs or symptoms reasonably attributable to hypoxemia (group I criteria), or
- At least 5 minutes of sleep with peripheral oxygen saturation ≥ 89% or Pao2 56 to 59 mm Hg and pedal edema, pulmonary hypertension, cor pulmonale, or erythrocytosis (group II criteria).50
Approximately 47% of COPD patients who are hypoxemic during the day spend about 30% of sleep time with an oxygen saturation less than 90%, even while on continuous oxygen therapy.51 Current recommendations for nocturnal oxygen therapy are to increase the oxygen concentration by 1 L/minute above the baseline oxygen flow rate needed to maintain an oxygen saturation higher than 90% during resting wakefulness, using a nasal cannula or face mask.52
Caveat. In overlap syndrome, supplemental oxygen may prolong the duration of apnea episodes and worsen hypercapnia.
Positive airway pressure for OSA
Positive airway pressure therapy improves cardiovascular outcomes in OSA.53 Several studies54–58 compared the effectiveness of CPAP vs BPAP as initial therapy for OSA but did not provide enough evidence to favor one over the other in this setting. Similarly, the results are mixed for the use of fixed or auto-adjusting BPAP as salvage therapy in patients who cannot tolerate CPAP.59–61
In overlap syndrome, CPAP or BPAP with or without supplemental oxygen has been investigated in several studies.26,62–65 In general, the mortality rate of COPD patients who require oxygen therapy is quite high.47,66 In hypoxemic COPD patients with moderate to severe sleep-disordered breathing, the 5-year survival rate was 71% in those treated with CPAP plus oxygen, vs 26% in those on oxygen alone, independent of baseline postbronchodilator FEV1.67
There is no specific FEV1 cutoff for prescribing CPAP. In general, daytime hypercapnia and nocturnal hypoxemia despite supplemental oxygen therapy are indications for BPAP therapy, regardless of the presence of OSA. Whether noninvasive nocturnal ventilation for COPD patients who do not have OSA improves long-term COPD outcomes is not entirely clear.65,68,69
Adding nocturnal BPAP in spontaneous timed mode to pulmonary rehabilitation for severe hypercapnic COPD was found to improve quality of life, mood, dyspnea, gas exchange, and decline in lung function.70 Other studies noted that COPD patients hospitalized with respiratory failure who were randomized to noninvasive nocturnal ventilation plus oxygen therapy as opposed to oxygen alone experienced improvement in health-related quality of life and reduction in intensive-care-unit length of stay but no difference in mortality or subsequent hospitalizations.69 In stable hypercapnic COPD patients without OSA, there is no clear evidence that nocturnal noninvasive ventilation lessens the risk of death despite improved daytime gas exchange,71,72 but additional long-term studies are needed.
Lung volume reduction surgery, a procedure indicated for highly selected patients with severe COPD, has been shown to reduce hyperinflation, improve nocturnal hypoxemia, and improve total sleep time and sleep efficiency in patients without sleep-disordered breathing.73 More studies are needed to determine if reduction in lung hyperinflation has an impact on the occurrence of OSA and on morbidity related to sleep-disordered breathing.
Benefit of CPAP in overlap syndrome
In a nonrandomized study, Marin et al62 found that overlap syndrome is associated with an increased risk of death and hospitalization due to COPD exacerbations. CPAP therapy was associated with improved survival rates and decreased hospitalization rates in these patients.
Stanchina et al,74 in a post hoc analysis of an observational cohort, assessed the outcomes of 227 patients with overlap syndrome. Greater use of CPAP was found to be associated with lower mortality rates.
Jaoude et al75 found that hypercapnic patients with overlap syndrome who were adherent to CPAP therapy had a lower mortality rate than nonadherent hypercapnic patients (P = .04). In a multivariate analysis, the comorbidity index was the only independent predictor of mortality in normocapnic patients with overlap syndrome, while CPAP adherence was associated with improved survival.
Lastly, patients with overlap syndrome tend to need more healthcare and accrue higher medical costs than patients with COPD alone. An analysis of a state Medicaid database that included COPD patients showed that beneficiaries with overlap syndrome spent at least $4,000 more in medical expenditures than beneficiaries with “lone” COPD.24
In conclusion, CPAP is the first line of therapy for overlap syndrome, while daytime hypercapnia or nocturnal hypoxemia despite supplemental oxygen therapy are indications for nocturnal BPAP therapy, regardless of whether patients have OSA.
OSA AND ASTHMA (ALTERNATIVE OVERLAP SYNDROME)
Epidemiology and clinical features
The coexistence of asthma and OSA can begin in childhood and continue throughout adult life. A higher prevalence of lifetime asthma and OSA has been noted in children of racial and ethnic minorities, children of lower socioeconomic status, and those with atopy.76
In a pediatric asthma clinic, it was noted that 12 months into structured asthma management and optimization, children with sleep-disordered breathing were nearly four times more likely to have severe asthma at follow-up, even after adjusting for obesity, race, and gender.77
In adult patients with OSA, the prevalence of asthma is about 35%.78 Conversely, people with asthma are at higher risk of OSA. High risk of OSA was more prevalent in a group of patients with asthma than in a general medical clinic population (39.5% vs 27.2%, P < .05).79
Analysis of a large prospective cohort found that asthma was a risk factor for new-onset OSA. The incidence of OSA over 4 years in patients with self-reported asthma was 27%, compared with 16% without asthma. The relative risk adjusted for risk factors such as body mass index, age, and gender was 1.39 (95% confidence interval [CI] 15%–19%).80
Patients with asthma who are at high risk of OSA are more likely to have worse daytime and nighttime asthma symptoms. Interestingly, patients who are diagnosed with OSA and treated with CPAP seem to have better asthma control.
Patients with asthma who are more likely to have OSA are women (odds ratio [OR] 2.1), have greater asthma severity (OR 1.6), have gastroesophageal reflux disease (OR 2.7), and use inhaled corticosteroids (OR 4.0).81 These associations are different than the traditional, population-wide risk factors for OSA, such as male sex, excess body weight, and nocturnal nasal congestion.82
OSA also worsens asthma control. Teodorescu et al15 found that severe asthma was more frequent in older asthma patients (ages 60–75, prevalence 49%) than in younger patients (ages 18–59, 39%). Older adults with OSA were seven times as likely to have severe asthma (OR 6.6), whereas young adults with sleep apnea were only three times as likely (OR 2.6).
In a group of patients with difficult-to-treat asthma, OSA was significantly associated with frequent exacerbations (OR 3.4), an association similar in magnitude to that of psychological conditions (OR 10.8), severe sinus disease (OR 3.7), recurrent respiratory tract infections (OR 6.9), and gastroesophageal reflux disease (OR 4.9).83 More than half of the patients had at least three of these comorbid conditions.
Sleep quality can greatly affect asthma control, and its importance is often underestimated. Patients with severe asthma have worse sleep quality than patients with milder asthma or nonasthmatic patients, even after excluding patients with a high risk of OSA, patients on CPAP therapy, and patients with a history of gastroesophageal reflux disease. Furthermore, regardless of asthma severity, sleep quality is a significant predictor of asthma-related quality of life, even after accounting for body mass index, daytime sleepiness, and gastroesophageal reflux disease.84
Pathophysiology of alternative overlap syndrome
Sleep significantly affects respiratory pathophysiology in asthma. The underlying mechanisms include physical and mechanical stressors, neurohormonal changes, hypoxia, confounding medical conditions, and local and systemic inflammatory changes.
Patients with nocturnal asthma experience more pronounced obstruction when sleep-deprived, suggesting that sleep loss may contribute to worsening airflow limitation.14 Although changes in pulmonary mechanics and lung volumes may also have a role, volume-dependent airway narrowing does not appear to account for all observed nocturnal increases in airway resistance. Intrathoracic blood pooling may also contribute to nocturnal bronchoconstriction through stimulation of pulmonary C fibers and increased bronchial wall edema, a mechanism that may be similar to the “cardiac asthma” seen in left ventricular dysfunction.
Early studies of sleep-disordered breathing demonstrated that patients with asthma were breathing more irregularly (with hypopnea, apnea, and hyperpnea) in REM sleep than those without asthma.85 Interestingly, REM-related hypoxia has also been noted in children with asthma.86 This may be related to the increased cholinergic outflow that occurs during REM sleep, which in turn modulates the caliber and reactivity of the lower airways.
Physical changes such as upper airway collapse and reduced pharyngeal cross-sectional area may cause further mechanical strain.87 This can further propagate airway inflammation, alter airway mucosal muscle fibers, and stimulate neural reflexes, thereby increasing cholinergic tone and bronchoconstriction. Furthermore, heightened negative intrathoracic pressure during obstructive episodes can increase nocturnal pulmonary blood pooling.14 Hypoxia itself can augment airway hyperresponsiveness via vagal pathways or carotid body receptors, increasing reactive oxygen species and inflammatory mediators. Local inflammation can “spill over” into systemic inflammatory changes, while alterations in airway inflammatory markers in asthma seem to follow a circadian rhythm, in parallel with the nocturnal worsening of the asthma symptoms.88 Finally, altered sleep may be related to other comorbid conditions, such as gastroesophageal reflux disease, insomnia, and restless leg syndrome.
Management and outcomes of alternative overlap syndrome
Despite optimization of asthma management, OSA can still significantly affect asthma control and symptoms.84
Interestingly, medications that reduce airway inflammation (eg, corticosteroids) may promote OSA. This occurrence cannot be fully explained by an increase in body mass, as more respiratory disturbances occur during sleep with continuous corticosteroid treatment even without increases in body mass index.87 Therefore, these associations may be related to upper airway myopathy caused by the treatment, a small pharynx, facial dysmorphisms, or fat deposition.89
Does CPAP improve asthma?
OSA is often unrecognized in patients with asthma, and treating it can have an impact on asthma symptoms.
CPAP therapy has not been shown to significantly change airway responsiveness or lung function, but it has been noted to significantly improve both OSA-related and asthma-related quality of life and reduce the use of rescue bronchodilators.3,90 CPAP has demonstrated improvement of quality of life that positively correlated with body weight and apnea-hypopnea index at baseline, suggesting that asthmatic patients with greater obesity or worse OSA may benefit most from aggressive management.90
However, CPAP should be used only if the patient has confirmed OSA. Empiric use of CPAP without a diagnosis of OSA was poorly tolerated and failed to improve asthma symptoms or lung function.91 More importantly, using CPAP in a patient who does not have OSA may contribute to further sleep disruption.91
Second-line treatments such as mandibular advancing devices and airway or bariatric surgery have not yet been studied in alternative overlap syndrome.
A multidimensional assessment of asthma
The Western world is experiencing an epidemic of obesity and of asthma. Obesity contributes to the pathogenesis of OSA by altering the anatomy and collapsibility of the upper airway, affecting ventilatory control and increasing respiratory workload. Another paradigm, supported by some evidence, is that OSA itself may contribute to the development of obesity. Both OSA and obesity lead to activation of inflammatory biologic cascades, which are likely the pathogenic mechanisms for their cardiovascular and metabolic consequences. As such, early recognition of OSA is important, as effective treatments are available.
In some patients, obesity may cause asthma, as obesity precedes the onset of asthma in a significant proportion of patients, and bariatric surgery for morbid obesity may resolve asthma. The obese asthma phenotype seems to include chronic rhinosinusitis, gastroesophageal reflux disease, poorer asthma control, limited responsiveness to corticosteroids, and even different sets of biomarkers (eg, neutrophilic airway inflammation). A cohort of obese patients with poor asthma control demonstrated significant improvement in asthma symptoms, quality of life, and airway reactivity after weight loss from bariatric surgery.92
To improve our knowledge about airway disease phenotypes and endotypes and their response to therapy, we propose taking a multidimensional, structured assessment of all patients with asthma, using a schema we call “ABCD-3P-PQRST” (Table 2).
The purpose of using this type of system in clinics and research is to capture the multidimensionality of the disease and better develop future individualized therapeutic strategies by employing the latest advances in systems biology and computational methods such as cluster and principal component analysis.
Multidimensional assessments addressing airway problems such as asthma, COPD, OSA, other comorbidities and risk factors, and personalized management plans will need to be the basis of future therapeutic interventions. Increased attention to the complications of asthma and obstructive airway and lung diseases in our patients is imperative, specifically to develop effective systems of care, appropriate clinical guidelines, and research studies that lead to improved health outcomes.
- Flenley DC. Sleep in chronic obstructive lung disease. Clin Chest Med 1985; 6:651–661.
- Ioachimescu OC, Teodorescu M. Integrating the overlap of obstructive lung disease and obstructive sleep apnoea: OLDOSA syndrome. Respirology 2013; 18:421–431.
- Ciftci TU, Ciftci B, Guven SF, Kokturk O, Turktas H. Effect of nasal continuous positive airway pressure in uncontrolled nocturnal asthmatic patients with obstructive sleep apnea syndrome. Respiratory Med 2005; 99:529–534.
- Kim MY, Jo EJ, Kang SY, et al. Obstructive sleep apnea is associated with reduced quality of life in adult patients with asthma. Ann Allergy Asthma Immunol 2013; 110:253–257.
- Teodorescu M, Polomis DA, Teodorescu MC, et al. Association of obstructive sleep apnea risk or diagnosis with daytime asthma in adults. J Asthma 2012; 49:620–628.
- Puthalapattu S, Ioachimescu OC. Asthma and obstructive sleep apnea: clinical and pathogenic interactions. J Investig Med 2014; 62:665–675.
- National Institutes of Health. National Heart, Lung, and Blood Institute. NHLBI Factbook, Fiscal Year 2007. Chapter 4. Disease Statistics. www.nhlbi.nih.gov/about/factbook-07/chapter4.htm. Accessed November 11, 2015.
- Vestbo J, Hurd SS, Agusti AG, et al. Global strategy for the diagnosis, management, and prevention of chronic obstructive pulmonary disease: GOLD executive summary. Am J Respir Crit Care Med 2013; 187:347–365.
- WHO. World Health Organization: Asthma. Fact sheet No 307. www.who.int/mediacentre/factsheets/fs307/en/. Accessed November 11, 2015.
- Masoli M, Fabian D, Holt S, Beasley R. The global burden of asthma: executive summary of the GINA Dissemination Committee report. Allergy 2004; 59:469–478.
- WHO. Chronic obstructive pulmonary disease (COPD). Fact sheet No 315. www.who.int/mediacentre/factsheets/fs315/en/index.html. 2011. Accessed November 11, 2015.
- Ford ES, Mannino DM, Wheaton AG, Giles WH, Presley-Cantrell L, Croft JB. Trends in the prevalence of obstructive and restrictive lung function among adults in the United States: findings from the National Health and Nutrition Examination surveys from 1988–1994 to 2007–2010. Chest 2013; 143:1395–1406.
- Orie N, Sluiter H, de Vries K, Tammeling G, Witkop J. The host factor in bronchitis. Paper presented at: Bronchitis—an international symposium 1961; Assen, Netherlands.
- Ballard RD. Sleep, respiratory physiology, and nocturnal asthma. Chronobiol Int 1999; 16:565–580.
- Teodorescu M, Polomis DA, Gangnon RE, et al. Asthma control and its relationship with obstructive sleep apnea (OSA) in older adults. Sleep Disord 2013; 2013:251567.
- Young T, Palta M, Dempsey J, Skatrud J, Weber S, Badr S. The occurrence of sleep-disordered breathing among middle-aged adults. N Engl J Med 1993; 328:1230–1235.
- Peppard PE, Young T, Barnet JH, Palta M, Hagen EW, Hla KM. Increased prevalence of sleep-disordered breathing in adults. Am J Epidemiol 2013; 177:1006–1014.
- International Classification of Sleep Disorders, 3rd ed.: Diagnostic and coding manual. Darien, Illinois: American Academy of Sleep Medicine. 2014.
- Lopez-Acevedo MN, Torres-Palacios A, Elena Ocasio-Tascon M, Campos-Santiago Z, Rodriguez-Cintron W. Overlap syndrome: an indication for sleep studies? A pilot study. Sleep Breath 2009; 13:409–413.
- Scharf C, Li P, Muntwyler J, et al. Rate-dependent AV delay optimization in cardiac resynchronization therapy. PACE 2005; 28:279–284.
- Chaouat A, Weitzenblum E, Krieger J, Ifoundza T, Oswald M, Kessler R. Association of chronic obstructive pulmonary disease and sleep apnea syndrome. Am J Respir Crit Care Med 1995;151:82–86.
- Bednarek M, Plywaczewski R, Jonczak L, Zielinski J. There is no relationship between chronic obstructive pulmonary disease and obstructive sleep apnea syndrome: a population study. Respiration 2005; 72:142–149.
- Fletcher EC. Chronic lung disease in the sleep apnea syndrome. Lung 1990; 168(suppl):751–761.
- Shaya FT, Lin PJ, Aljawadi MH, Scharf SM. Elevated economic burden in obstructive lung disease patients with concomitant sleep apnea syndrome. Sleep Breath 2009; 13:317–323.
- Larsson LG, Lindberg A, Franklin KA, Lundbäck B; Obstructive Lung Disease in Northern Sweden Studies. Obstructive sleep apnoea syndrome is common in subjects with chronic bronchitis. Report from the Obstructive Lung Disease in Northern Sweden studies. Respiration 2001; 68:250–255.
- Machado MC, Vollmer WM, Togeiro SM, et al. CPAP and survival in moderate-to-severe obstructive sleep apnoea syndrome and hypoxaemic COPD. Eur Resp J 2010; 35:132–137.
- Guilleminault C, Cummiskey J, Motta J. Chronic obstructive airflow disease and sleep studies. Am Rev Respir Dis 1980; 122:397–406.
- Weitzenblum E, Chaouat A, Kessler R, Canuet M. Overlap syndrome: obstructive sleep apnea in patients with chronic obstructive pulmonary disease. Proc Am Thorac Soc 2008; 5:237–241.
- Bradley TD, Rutherford R, Lue F, et al. Role of diffuse airway obstruction in the hypercapnia of obstructive sleep apnea. Am Rev Respir Dis 1986; 134:920–924.
- Sanders MH, Newman AB, Haggerty CL, et al. Sleep and sleep-disordered breathing in adults with predominantly mild obstructive airway disease. Am J Respir Crit Care Med 2003; 167:7–14.
- Breslin E, van der Schans C, Breukink S, et al. Perception of fatigue and quality of life in patients with COPD. Chest 1998; 114:958–964.
- Kapella MC, Larson JL, Patel MK, Covey MK, Berry JK. Subjective fatigue, influencing variables, and consequences in chronic obstructive pulmonary disease. Nurs Res 2006; 55:10–17.
- Klink M, Quan SF. Prevalence of reported sleep disturbances in a general adult population and their relationship to obstructive airways diseases. Chest 1987; 91:540–546.
- Bellia V, Catalano F, Scichilone N, et al. Sleep disorders in the elderly with and without chronic airflow obstruction: the SARA study. Sleep 2003; 26:318–323.
- Connaughton JJ, Catterall JR, Elton RA, Stradling JR, Douglas NJ. Do sleep studies contribute to the management of patients with severe chronic obstructive pulmonary disease? Am Rev Respir Dis 1988; 138:341–344.
- Mulloy E, McNicholas WT. Ventilation and gas exchange during sleep and exercise in severe COPD. Chest 1996; 109:387–394.
- Johnson MW, Remmers JE. Accessory muscle activity during sleep in chronic obstructive pulmonary disease. J Appl Physiol 1984; 57:1011–1017.
- Douglas NJ, White DP, Pickett CK, Weil JV, Zwillich CW. Respiration during sleep in normal man. Thorax 1982; 37:840–844.
- Mulloy E, Fitzpatrick M, Bourke S, O’Regan A, McNicholas WT. Oxygen desaturation during sleep and exercise in patients with severe chronic obstructive pulmonary disease. Respir Med 1995; 89:193–198.
- Herpel LB, Brown CD, Goring KL, et al. COPD cannot compensate for upper airway obstruction during sleep (abstract). Am J Respir Crit Care Med 2007; 175:A71.
- MacNee W. Pathophysiology of cor pulmonale in chronic obstructive pulmonary disease. Part 2. Am J Respir Crit Care Med 1994; 150:1158–1168.
- MacNee W. Pathophysiology of cor pulmonale in chronic obstructive pulmonary disease. Part 1. Am J Respir Crit Care Med 1994; 150:833–852.
- Budev MM, Arroliga AC, Wiedemann HP, Matthay RA. Cor pulmonale: an overview. Semin Respir Crit Care Med 2003; 24:233–244.
- Simonneau G, Gatzoulis MA, Adatia I, et al. Updated clinical classification of pulmonary hypertension. J Am Coll Cardiol 2013; 62(25 suppl):D34–D41.
- Naeije R. Pulmonary hypertension and right heart failure in chronic obstructive pulmonary disease. Proc Am Thorac Soc 2005; 2:20–22.
- Rasche K, Orth M, Kutscha A, Duchna HW. [Pulmonary diseases and heart function]. In German. Internist (Berl) 2007; 48:276–282.
- Continuous or nocturnal oxygen therapy in hypoxemic chronic obstructive lung disease: a clinical trial. Nocturnal Oxygen Therapy Trial Group. Ann Intern Med 1980; 93:391–398.
- Newman AB, Foster G, Givelber R, Nieto FJ, Redline S, Young T. Progression and regression of sleep-disordered breathing with changes in weight: the Sleep Heart Health Study. Arch Intern Med 2005; 165:2408–2413.
- Calverley PM, Brezinova V, Douglas NJ, Catterall JR, Flenley DC. The effect of oxygenation on sleep quality in chronic bronchitis and emphysema. Am Rev Respir Dis 1982; 126:206–210.
- Centers for Medicare and Medicaid Services. National coverage determination (NCD) for home use of oxygen (240.2). www.cms.gov/medicare-coverage-database/details/ncd-details.aspx?NCDId=169&ncdver=1&NCAId=169&NcaName=Home+Use+of+Oxygen&IsPopup=y&bc=AAAAAAAAIAAA&. Accessed November 11, 2015.
- Plywaczewski R, Sliwinski P, Nowinski A, Kaminski D, Zielinski J. Incidence of nocturnal desaturation while breathing oxygen in COPD patients undergoing long-term oxygen therapy. Chest 2000; 117:679–683.
- Mokhlesi B, Tulaimat A, Faibussowitsch I, Wang Y, Evans AT. Obesity hypoventilation syndrome: prevalence and predictors in patients with obstructive sleep apnea. Sleep Breathing 2007; 11:117–124.
- Marin JM, Carrizo SJ, Vicente E, Agusti AG. Long-term cardiovascular outcomes in men with obstructive sleep apnoea-hypopnoea with or without treatment with continuous positive airway pressure: an observational study. Lancet 2005; 365:1046–1053.
- Marin JM, DeAndres R, Alonso J, Sanchez A, Carrizo S. Long term mortality in the overlap syndrome. Eur Resp J 2008; 32(suppl 52):P865.
- Reeves-Hoche MK, Hudgel DW, Meck R, Witteman R, Ross A, Zwillich CW. Continuous versus bilevel positive airway pressure for obstructive sleep apnea. Am J Respir Crit Care Med 1995; 151:443–449.
- Gay PC, Herold DL, Olson EJ. A randomized, double-blind clinical trial comparing continuous positive airway pressure with a novel bilevel pressure system for treatment of obstructive sleep apnea syndrome. Sleep 2003; 26:864–869.
- Blau A, Minx M, Peter JG, et al. Auto bi-level pressure relief-PAP is as effective as CPAP in OSA patients—a pilot study. Sleep Breath 2012; 16:773–779.
- Randerath WJ, Galetke W, Ruhle KH. Auto-adjusting CPAP based on impedance versus bilevel pressure in difficult-to-treat sleep apnea syndrome: a prospective randomized crossover study. Med Sci Monit 2003; 9:CR353–CR358.
- Schwartz SW, Rosas J, Iannacone MR, Foulis PR, Anderson WM. Correlates of a prescription for bilevel positive airway pressure for treatment of obstructive sleep apnea among veterans. J Clin Sleep Med 2013; 9:327–335.
- Gentina T, Fortin F, Douay B, et al. Auto bi-level with pressure relief during exhalation as a rescue therapy for optimally treated obstructive sleep apnoea patients with poor compliance to continuous positive airways pressure therapy--a pilot study. Sleep Breathing 2011; 15:21–27.
- Ballard RD, Gay PC, Strollo PJ. Interventions to improve compliance in sleep apnea patients previously non-compliant with continuous positive airway pressure. J Clinical Sleep Med 2007; 3:706–712.
- Marin JM, Soriano JB, Carrizo SJ, Boldova A, Celli BR. Outcomes in patients with chronic obstructive pulmonary disease and obstructive sleep apnea: the overlap syndrome. Am J Respir Crit Care Med 2010; 182:325–331.
- de Miguel J, Cabello J, Sanchez-Alarcos JM, Alvarez-Sala R, Espinos D, Alvarez-Sala JL. Long-term effects of treatment with nasal continuous positive airway pressure on lung function in patients with overlap syndrome. Sleep Breath 2002; 6:3–10.
- Mansfield D, Naughton MT. Effects of continuous positive airway pressure on lung function in patients with chronic obstructive pulmonary disease and sleep disordered breathing. Respirology 1999; 4:365–370.
- McEvoy RD, Pierce RJ, Hillman D, et al. Nocturnal non-invasive nasal ventilation in stable hypercapnic COPD: a randomised controlled trial. Thorax 2009; 64:561–566.
- Long term domiciliary oxygen therapy in chronic hypoxic cor pulmonale complicating chronic bronchitis and emphysema. Report of the Medical Research Council Working Party. Lancet 1981; 1:681–686.
- Machado MC, Vollmer WM, Togeiro SM, et al. CPAP and survival in moderate-to-severe obstructive sleep apnoea syndrome and hypoxaemic COPD. Eur Respir J 2010; 35:132–137.
- Casanova C, Celli BR, Tost L, et al. Long-term controlled trial of nocturnal nasal positive pressure ventilation in patients with severe COPD. Chest 2000; 118:1582–1590.
- Clini E, Sturani C, Rossi A, et al. The Italian multicentre study on noninvasive ventilation in chronic obstructive pulmonary disease patients. Eur Respir J 2002; 20:529–538.
- Duiverman ML, Wempe JB, Bladder G, et al. Two-year home-based nocturnal noninvasive ventilation added to rehabilitation in chronic obstructive pulmonary disease patients: a randomized controlled trial. Respir Res 2011; 12:112.
- Gay PC, Hubmayr RD, Stroetz RW. Efficacy of nocturnal nasal ventilation in stable, severe chronic obstructive pulmonary disease during a 3-month controlled trial. Mayo Clin Proc 1996; 71:533–542.
- Meecham Jones DJ, Paul EA, Jones PW, Wedzicha JA. Nasal pressure support ventilation plus oxygen compared with oxygen therapy alone in hypercapnic COPD. Am J Respir Crit Care Med 1995; 152:538–544.
- Krachman SL, Chatila W, Martin UJ, et al. Effects of lung volume reduction surgery on sleep quality and nocturnal gas exchange in patients with severe emphysema. Chest 2005; 128:3221–3228.
- Stanchina ML, Welicky LM, Donat W, Lee D, Corrao W, Malhotra A. Impact of CPAP use and age on mortality in patients with combined COPD and obstructive sleep apnea: the overlap syndrome. J Clin Sleep Med 2013; 9:767–772.
- Jaoude P, Kufel T, El-Solh AA. Survival benefit of CPAP favors hypercapnic patients with the overlap syndrome. Lung 2014; 192:251–258.
- Ramagopal M, Mehta A, Roberts DW, et al. Asthma as a predictor of obstructive sleep apnea in urban African-American children. J Asthma 2009; 46:895–899.
- Ross KR, Storfer-Isser A, Hart MA, et al. Sleep-disordered breathing is associated with asthma severity in children. J Ped 2012; 160:736–742.
- Alharbi M, Almutairi A, Alotaibi D, Alotaibi A, Shaikh S, Bahammam AS. The prevalence of asthma in patients with obstructive sleep apnoea. Prim Care Respir J 2009; 18:328–330.
- Auckley D, Moallem M, Shaman Z, Mustafa M. Findings of a Berlin Questionnaire survey: comparison between patients seen in an asthma clinic versus internal medicine clinic. Sleep Med 2008; 9:494–499.
- Teodorescu M, Barnet JH, Hagen EW, Palta M, Young TB, Peppard PE. Association between asthma and risk of developing obstructive sleep apnea. JAMA 2015; 313:156–164.
- Teodorescu M, Polomis DA, Hall SV, et al. Association of obstructive sleep apnea risk with asthma control in adults. Chest 2010; 138:543–550.
- Larsson LG, Lindberg A, Franklin KA, Lundback B. Gender differences in symptoms related to sleep apnea in a general population and in relation to referral to sleep clinic. Chest 2003; 124:204–211.
- ten Brinke A, Sterk PJ, Masclee AA, et al. Risk factors of frequent exacerbations in difficult-to-treat asthma. Eur Respir J 2005; 26:812–818.
- Luyster FS, Teodorescu M, Bleecker E, et al. Sleep quality and asthma control and quality of life in non-severe and severe asthma. Sleep Breath 2012; 16:1129–1137.
- Catterall JR, Douglas NJ, Calverley PM, et al. Irregular breathing and hypoxaemia during sleep in chronic stable asthma. Lancet 1982; 1:301–304.
- Perez GF, Gutierrez MJ, Huseni S, et al. Oximetry signal processing identifies REM sleep-related vulnerability trait in asthmatic children. Sleep Disord 2013; 2013:406157.
- Yigla M, Tov N, Solomonov A, Rubin AH, Harlev D. Difficult-to-control asthma and obstructive sleep apnea. J Asthma 2003; 40:865–871.
- Kelly EA, Houtman JJ, Jarjour NN. Inflammatory changes associated with circadian variation in pulmonary function in subjects with mild asthma. Clin Exper Allergy 2004; 34:227–233.
- Bohadana AB, Hannhart B, Teculescu DB. Nocturnal worsening of asthma and sleep-disordered breathing. J Asthma 2002; 39:85–100.
- Lafond C, Series F, Lemiere C. Impact of CPAP on asthmatic patients with obstructive sleep apnoea. Eur Respir J 2007; 29:307–311.
- Martin RJ, Pak J. Nasal CPAP in nonapneic nocturnal asthma. Chest 1991; 100:1024–1027.
- Dixon AE, Pratley RE, Forgione PM, et al. Effects of obesity and bariatric surgery on airway hyperresponsiveness, asthma control, and inflammation. J Allergy Clin Immunol 2011; 128:508–515 e501–502.
Many patients who have obstructive lung disease, ie, chronic obstructive pulmonary disease (COPD) or asthma, also have obstructive sleep apnea (OSA), and vice versa.
The combination of COPD and OSA was first described almost 30 years ago by Flenley, who called it “overlap syndrome.”1 At that time, he recommended that a sleep study be considered in all obese patients with COPD who snore and in those who have frequent headaches after starting oxygen therapy. In the latter group, he doubted that nocturnal oxygen was the correct treatment. He also believed that the outcomes in patients with overlap syndrome were worse than those in patients with COPD or OSA alone. These opinions remain largely valid today.
We now also recognize the combination of asthma and OSA (alternative overlap syndrome) and collectively call both combinations obstructive lung disease-obstructive sleep apnea (OLDOSA) syndrome.2 Interestingly, these relationships are likely bidirectional, with one condition aggravating or predisposing to the other.
Knowing that a patient has one of these overlap syndromes, one can initiate continuous positive airway pressure (CPAP) therapy, which can improve clinical outcomes.3–6 Therefore, when evaluating a patient with asthma or COPD, one should consider OSA using a validated questionnaire and, if the findings suggest the diagnosis, polysomnography. Conversely, it is prudent to look for comorbid obstructive lung disease in patients with OSA, as interactions between upper and lower airway dysfunction may lead to distinctly different treatment and outcomes.
Here, we briefly review asthma and COPD, explore shared risk factors for sleep-disordered breathing and obstructive lung diseases, describe potential pathophysiologic mechanisms explaining these associations, and highlight the importance of recognizing and individually treating the overlaps of OSA and COPD or asthma.
COPD AND ASTHMA ARE VERY COMMON
About 10% of the US population have COPD,7 a preventable and treatable disease mainly caused by smoking, and a leading cause of sickness and death worldwide.8,9
About 8% of Americans have asthma,7 which has become one of the most common chronic conditions in the Western world, affecting about 1 in 7 children and about 1 in 12 adults. The World Health Organization estimates that 235 million people suffer from asthma worldwide, and by 2025 this number is projected to rise to 400 million.10,11
The prevalence of these conditions in a particular population depends on the frequency of risk factors and associated morbidities, including OSA. These factors may allow asthma or COPD to arise earlier or have more severe manifestations.8,12
Asthma and COPD: Similarities and differences
Asthma and COPD share several features. Both are inflammatory airway conditions triggered or perpetuated by allergens, viral infection, tobacco smoke, products of biomass or fossil fuel combustion, and other substances. In both diseases, airflow is “obstructed” or limited, with a low ratio of forced expiratory volume in 1 second to forced vital capacity (FEV1/FVC). Symptoms can also be similar, with dyspnea, cough, wheezing, and chest tightness being the most frequent complaints. The similarities support the theory proposed by Orie et al13 (the “Dutch hypothesis”) that asthma and COPD may actually be manifestations of the same disease.
But there are also differences. COPD is strongly linked to cigarette smoking and has at least three phenotypes:
- Chronic bronchitis, defined clinically by cough and sputum production for more than 3 months per year for 2 consecutive years
- Emphysema, characterized anatomically by loss of lung parenchyma, as seen on tomographic imaging or examination of pathologic specimens
- A mixed form with bronchitic and emphysematous features, which is likely the most common.
Particularly in emphysematous COPD, smoking predisposes patients to gas-exchange abnormalities and low diffusing capacity for carbon monoxide.
In asthma, symptoms may be more episodic, the age of onset is often younger, and atopy is common, especially in allergic asthma. These episodic symptoms may correlate temporally with measurable airflow reversibility (≥ 12% and ≥ 200 mL improvement in FVC or in FEV1 after bronchodilator challenge).
However, the current taxonomy does not unequivocally divide obstructive lung diseases into asthma and COPD, and major features such as airway hyperresponsiveness, airflow reversibility, neutrophilic or CD8 lymphocytic airway inflammation, and lower concentration of nitric oxide in the exhaled air may be present in different phenotypes of both conditions (Table 1).
AIRFLOW IN OBSTRUCTIVE LUNG DISEASES AND DURING SLEEP
Normal airflow involves a complex interplay between airway resistance and elastic recoil of the entire respiratory system, including the airways, the lung parenchyma, and the chest wall (Figure 1).
In asthma and COPD, resistance to airflow is increased, predominantly in the upper airways (nasal passages, pharynx, and larynx) and in the first three or four subdivisions of the tracheobronchial tree. The problem is worse during exhalation, when elastic recoil of the lung parenchyma and chest wall also increases airway resistance, reduces airway caliber, and possibly even constricts the bronchi. This last effect may occur either due to mass loading of the bronchial smooth muscles or to large intrathoracic transmural pressure shifts that may increase extravasation of fluid in the bronchial walls, especially with higher vascular permeability in inflammatory conditions.
Furthermore, interactions between the airway and parenchyma and between the upper and lower airways, as well as radial and axial coupling of these anatomic and functional components, contribute to complex interplay between airway resistance and parenchymal-chest wall elastic energy—stretch or recoil.
The muscles of the upper and lower airway may not work together due to the loss of normal lung parenchyma (as in emphysema) or to the acute inflammation in the small airways and adjacent parenchyma (as in severe asthma exacerbations). This loss of coordination makes the upper airway more collapsible, a feature of OSA.
Additionally, obesity, gastroesophageal reflux, disease chronic rhinitis, nasal polyposis, and acute exacerbations of chronic systemic inflammation all contribute to more complex interactions between obstructive lung diseases and OSA.6
Sleep affects breathing, particularly in patients with respiratory comorbidities, and sleep-disordered breathing causes daytime symptoms and worsens quality of life.1,13–15 During sleep, respiratory centers become less sensitive to oxygen and carbon dioxide; breathing becomes more irregular, especially during rapid eye movement (REM) sleep; the chest wall moves less, so that the tidal volume and functional residual capacity are lower; sighs, yawns, and deep breaths become limited; and serum carbon dioxide concentration may rise.
OBSTRUCTIVE SLEEP APNEA
The prevalence of OSA, a form of sleep-disordered breathing characterized by limitation of inspiratory and (to a lesser degree) expiratory flow, has increased significantly in recent years, in parallel with the prevalence of its major risk factor, obesity.
OSA is generally defined as an apnea-hypopnea index of 5 or higher, ie, five or more episodes of apnea or hypopnea per hour.
OSA syndrome, ie, an apnea-hypopnea index of 5 or higher and excessive daytime sleepiness (defined by an Epworth Sleepiness Scale score > 10) was found in the initial analysis of the Wisconsin Sleep cohort in 1993 to be present in about 2% of women and 4% of men.16 A more recent longitudinal analysis showed a significant increase—for example, in people 50 to 70 years old the prevalence was up to 17.6% in men and 7.5% in women.17
Upper airway resistance syndrome, a milder form of sleep-disordered breathing, is now included under the diagnosis of OSA, as its pathophysiology is not significantly different.18
In the next section, we discuss what happens when OSA overlaps with COPD (overlap syndrome) and with asthma (“alternative overlap syndrome”)2,8 (Figure 2).
OSA AND COPD (OVERLAP SYNDROME)
Flenley1 hypothesized that patients with COPD in whom supplemental oxygen worsened hypercapnia may also have OSA and called this association overlap syndrome.
How common is overlap syndrome?
Since both COPD and OSA are prevalent conditions, overlap syndrome may also be common.
The reported prevalence of overlap syndrome varies widely, depending on the population studied and the methods used. In various studies, COPD was present in 9% to 56% of patients with OSA,19–23 and OSA was found in 5% to 85% of patients with COPD.24–27
Based on the prevalence of COPD in the general population (about 10%12) and that of sleep-disordered breathing (about 5% to 10%17), the expected prevalence of overlap syndrome in people over age 40 may be 0.5% to 1%.28 In a more inclusive estimate with “subclinical” forms of overlap syndrome—ie, OSA defined as an apnea-hypopnea index of 5 or more (about 25% of the population17) and COPD Global initiative for Chronic Obstructive Lung Disease (GOLD) stage 1 (16.8% in the National Health and Nutrition Education Survey12)—the expected prevalence of overlap is around 4%. Some studies found a higher prevalence of COPD in OSA patients than in the general population,21,29 while others did not.22,28,30 The studies differed in how they defined sleep-disordered breathing.
Larger studies are needed to better assess the true prevalence of sleep-disordered breathing in COPD. They should use more sensitive measures of airflow and standardized definitions of sleep-disordered breathing and should include patients with more severe COPD.
Fatigue and insomnia are common in COPD
Fatigue is strongly correlated with declining lung function, low exercise tolerance, and impaired quality of life in COPD.31 Factors that contribute to fatigue include dyspnea, depression, and impaired sleep.32 Some suggest that at least half of COPD patients have sleep complaints such as insomnia, sleep disruption, or sleep fragmentation.33 Insomnia, difficulty falling asleep, and early morning awakenings are the most common complaints (30%–70% of patients) and are associated with daytime fatigue.34 Conversely, comorbid OSA can contribute to fatigue and maintenance-type insomnia (ie, difficulty staying asleep and returning to sleep).
Multiple mechanisms of hypoxemia in overlap syndrome
Oxygenation abnormalities and increased work of breathing contribute to the pathophysiology of overlap syndrome. In patients with COPD, oxygenation during wakefulness is a strong predictor of gas exchange during sleep.35 Further, patients with overlap syndrome tend to have more severe hypoxia during sleep than patients with isolated COPD or OSA at rest or during exercise.36
In overlap syndrome, hypoxemia is the result of several mechanisms:
- Loss of upper airway muscle tone from intermittent episodes of obstructive apnea and hypopnea leads to upper airway collapse during sleep, particularly during REM sleep, increasing the severity of OSA.37
- Reductions in functional residual capacity from lying in the recumbent position and during REM sleep render patients with COPD more vulnerable, as compensatory use of accessory muscles to maintain near-normal ventilation in a hyperinflated state becomes impaired.37
- Alterations in pulmonary ventilation-perfusion matching may lead to altered carbon dioxide homeostasis and impaired oxygenation in patients with emphysema.
- Circadian variation in lower airway caliber may also be observed, in parallel with the bronchoconstriction caused by increased nocturnal vagotonia.
- Hypercapnia (Paco2 ≥ 45 mm Hg) may lead to overall reduced responsiveness of respiratory muscles and to a blunted response of respiratory centers to low oxygen and high carbon dioxide levels.38 Thus, hypercapnia is a better predictor of the severity of nocturnal hypoxemia than hypoxemia developing during exercise.39
In a person who is at near-maximal ventilatory capacity, even a mild increase in upper airway resistance (as seen with snoring, upper airway resistance syndrome, or OSA) increases the work of breathing. This phenomenon can lead to early arousals even before significant oxyhemoglobin desaturation occurs.
Normally, inspiratory flow limitation is counteracted by increasing inspiratory time to maintain ventilation. Patients with COPD may not be able to do this, however, as they need more time to breathe out due to narrowing of their lower airways.40 The inability to compensate for upper airway resistance, similar to the increased work of breathing seen with exercise, may lead to early arousals and increased sleep fragmentation.
Consequences of overlap syndrome
Patients with overlap syndrome appear to have higher morbidity and mortality rates than those with COPD or sleep-disordered breathing alone.
Cor pulmonale. Nighttime hypoxia is more severe and persistent in overlap syndrome than with COPD or OSA alone. This may contribute to more significant pulmonary hypertension and to the development of cor pulmonale, in which the right ventricle is altered in structure (eg, hypertrophied, dilated) or reduced in function, or both, from severe pulmonary hypertension.
In contrast to right ventricular failure due to disorders of the left heart, cor pulmonale is a result of diseases of the vasculature (eg, idiopathic pulmonary arterial hypertension), lung parenchyma (eg, COPD), upper airway (eg, OSA), or chest wall (eg, severe kyphoscoliosis). COPD is the most common cause of cor pulmonale in the United States, accounting for up to 30% of cases of cor pulmonale.41–45 In OSA, cor pulmonale is seen in up to 20% of cases,43 while in overlap syndrome cor pulmonale is encountered even more often (ie, in up to 80%); these patients have a dismal 5-year survival rate of about 30%.46
Obesity hypoventilation syndrome is characterized by obesity (body mass index ≥ 30 kg/m2) and daytime hypercapnia (Paco2 ≥ 45 mm Hg) that cannot be fully attributed to an underlying cardiopulmonary or neurologic condition.18 Hypercapnia worsens during sleep (especially during REM sleep) and is often associated with severe arterial oxygen desaturation. Up to 90% of patients with obesity hypoventilation syndrome have comorbid OSA, and the rest generally have sleep-related hypoventilation, particularly during REM sleep.
In patients with obesity hypoventilation syndrome, daytime hypercapnia may improve or even normalize with adequate positive airway pressure treatment and sustained adherence to treatment.18 Many patients with obesity hypoventilation syndrome respond to CPAP or bilevel positive airway pressure (BPAP), with improvement in daytime Paco2. However, normalization of daytime Paco2 occurs only in a subgroup of patients. In contrast, treatment with oxygen therapy alone may worsen hypercapnia.
Oxygen therapy for pure COPD, but maybe not for overlap syndrome
Continuous oxygen therapy reduces mortality in COPD,47,48 but the duration and severity of hypoxemia that warrant oxygen therapy are less clear. Oxygen therapy in hypoxemic patients has been shown to improve sleep quality and reduce arousals.49
Indications for oxygen treatment of nocturnal hypoxemia are generally based on Medicare guidelines:
- At least 5 minutes of sleep with peripheral oxygen saturation ≤ 88% or Pao2 ≤ 55 mm Hg, or
- A decrease in Pao2 of more than 10 mm Hg or in peripheral oxygen saturation of more than 5% for at least 5 minutes of sleep and associated with signs or symptoms reasonably attributable to hypoxemia (group I criteria), or
- At least 5 minutes of sleep with peripheral oxygen saturation ≥ 89% or Pao2 56 to 59 mm Hg and pedal edema, pulmonary hypertension, cor pulmonale, or erythrocytosis (group II criteria).50
Approximately 47% of COPD patients who are hypoxemic during the day spend about 30% of sleep time with an oxygen saturation less than 90%, even while on continuous oxygen therapy.51 Current recommendations for nocturnal oxygen therapy are to increase the oxygen concentration by 1 L/minute above the baseline oxygen flow rate needed to maintain an oxygen saturation higher than 90% during resting wakefulness, using a nasal cannula or face mask.52
Caveat. In overlap syndrome, supplemental oxygen may prolong the duration of apnea episodes and worsen hypercapnia.
Positive airway pressure for OSA
Positive airway pressure therapy improves cardiovascular outcomes in OSA.53 Several studies54–58 compared the effectiveness of CPAP vs BPAP as initial therapy for OSA but did not provide enough evidence to favor one over the other in this setting. Similarly, the results are mixed for the use of fixed or auto-adjusting BPAP as salvage therapy in patients who cannot tolerate CPAP.59–61
In overlap syndrome, CPAP or BPAP with or without supplemental oxygen has been investigated in several studies.26,62–65 In general, the mortality rate of COPD patients who require oxygen therapy is quite high.47,66 In hypoxemic COPD patients with moderate to severe sleep-disordered breathing, the 5-year survival rate was 71% in those treated with CPAP plus oxygen, vs 26% in those on oxygen alone, independent of baseline postbronchodilator FEV1.67
There is no specific FEV1 cutoff for prescribing CPAP. In general, daytime hypercapnia and nocturnal hypoxemia despite supplemental oxygen therapy are indications for BPAP therapy, regardless of the presence of OSA. Whether noninvasive nocturnal ventilation for COPD patients who do not have OSA improves long-term COPD outcomes is not entirely clear.65,68,69
Adding nocturnal BPAP in spontaneous timed mode to pulmonary rehabilitation for severe hypercapnic COPD was found to improve quality of life, mood, dyspnea, gas exchange, and decline in lung function.70 Other studies noted that COPD patients hospitalized with respiratory failure who were randomized to noninvasive nocturnal ventilation plus oxygen therapy as opposed to oxygen alone experienced improvement in health-related quality of life and reduction in intensive-care-unit length of stay but no difference in mortality or subsequent hospitalizations.69 In stable hypercapnic COPD patients without OSA, there is no clear evidence that nocturnal noninvasive ventilation lessens the risk of death despite improved daytime gas exchange,71,72 but additional long-term studies are needed.
Lung volume reduction surgery, a procedure indicated for highly selected patients with severe COPD, has been shown to reduce hyperinflation, improve nocturnal hypoxemia, and improve total sleep time and sleep efficiency in patients without sleep-disordered breathing.73 More studies are needed to determine if reduction in lung hyperinflation has an impact on the occurrence of OSA and on morbidity related to sleep-disordered breathing.
Benefit of CPAP in overlap syndrome
In a nonrandomized study, Marin et al62 found that overlap syndrome is associated with an increased risk of death and hospitalization due to COPD exacerbations. CPAP therapy was associated with improved survival rates and decreased hospitalization rates in these patients.
Stanchina et al,74 in a post hoc analysis of an observational cohort, assessed the outcomes of 227 patients with overlap syndrome. Greater use of CPAP was found to be associated with lower mortality rates.
Jaoude et al75 found that hypercapnic patients with overlap syndrome who were adherent to CPAP therapy had a lower mortality rate than nonadherent hypercapnic patients (P = .04). In a multivariate analysis, the comorbidity index was the only independent predictor of mortality in normocapnic patients with overlap syndrome, while CPAP adherence was associated with improved survival.
Lastly, patients with overlap syndrome tend to need more healthcare and accrue higher medical costs than patients with COPD alone. An analysis of a state Medicaid database that included COPD patients showed that beneficiaries with overlap syndrome spent at least $4,000 more in medical expenditures than beneficiaries with “lone” COPD.24
In conclusion, CPAP is the first line of therapy for overlap syndrome, while daytime hypercapnia or nocturnal hypoxemia despite supplemental oxygen therapy are indications for nocturnal BPAP therapy, regardless of whether patients have OSA.
OSA AND ASTHMA (ALTERNATIVE OVERLAP SYNDROME)
Epidemiology and clinical features
The coexistence of asthma and OSA can begin in childhood and continue throughout adult life. A higher prevalence of lifetime asthma and OSA has been noted in children of racial and ethnic minorities, children of lower socioeconomic status, and those with atopy.76
In a pediatric asthma clinic, it was noted that 12 months into structured asthma management and optimization, children with sleep-disordered breathing were nearly four times more likely to have severe asthma at follow-up, even after adjusting for obesity, race, and gender.77
In adult patients with OSA, the prevalence of asthma is about 35%.78 Conversely, people with asthma are at higher risk of OSA. High risk of OSA was more prevalent in a group of patients with asthma than in a general medical clinic population (39.5% vs 27.2%, P < .05).79
Analysis of a large prospective cohort found that asthma was a risk factor for new-onset OSA. The incidence of OSA over 4 years in patients with self-reported asthma was 27%, compared with 16% without asthma. The relative risk adjusted for risk factors such as body mass index, age, and gender was 1.39 (95% confidence interval [CI] 15%–19%).80
Patients with asthma who are at high risk of OSA are more likely to have worse daytime and nighttime asthma symptoms. Interestingly, patients who are diagnosed with OSA and treated with CPAP seem to have better asthma control.
Patients with asthma who are more likely to have OSA are women (odds ratio [OR] 2.1), have greater asthma severity (OR 1.6), have gastroesophageal reflux disease (OR 2.7), and use inhaled corticosteroids (OR 4.0).81 These associations are different than the traditional, population-wide risk factors for OSA, such as male sex, excess body weight, and nocturnal nasal congestion.82
OSA also worsens asthma control. Teodorescu et al15 found that severe asthma was more frequent in older asthma patients (ages 60–75, prevalence 49%) than in younger patients (ages 18–59, 39%). Older adults with OSA were seven times as likely to have severe asthma (OR 6.6), whereas young adults with sleep apnea were only three times as likely (OR 2.6).
In a group of patients with difficult-to-treat asthma, OSA was significantly associated with frequent exacerbations (OR 3.4), an association similar in magnitude to that of psychological conditions (OR 10.8), severe sinus disease (OR 3.7), recurrent respiratory tract infections (OR 6.9), and gastroesophageal reflux disease (OR 4.9).83 More than half of the patients had at least three of these comorbid conditions.
Sleep quality can greatly affect asthma control, and its importance is often underestimated. Patients with severe asthma have worse sleep quality than patients with milder asthma or nonasthmatic patients, even after excluding patients with a high risk of OSA, patients on CPAP therapy, and patients with a history of gastroesophageal reflux disease. Furthermore, regardless of asthma severity, sleep quality is a significant predictor of asthma-related quality of life, even after accounting for body mass index, daytime sleepiness, and gastroesophageal reflux disease.84
Pathophysiology of alternative overlap syndrome
Sleep significantly affects respiratory pathophysiology in asthma. The underlying mechanisms include physical and mechanical stressors, neurohormonal changes, hypoxia, confounding medical conditions, and local and systemic inflammatory changes.
Patients with nocturnal asthma experience more pronounced obstruction when sleep-deprived, suggesting that sleep loss may contribute to worsening airflow limitation.14 Although changes in pulmonary mechanics and lung volumes may also have a role, volume-dependent airway narrowing does not appear to account for all observed nocturnal increases in airway resistance. Intrathoracic blood pooling may also contribute to nocturnal bronchoconstriction through stimulation of pulmonary C fibers and increased bronchial wall edema, a mechanism that may be similar to the “cardiac asthma” seen in left ventricular dysfunction.
Early studies of sleep-disordered breathing demonstrated that patients with asthma were breathing more irregularly (with hypopnea, apnea, and hyperpnea) in REM sleep than those without asthma.85 Interestingly, REM-related hypoxia has also been noted in children with asthma.86 This may be related to the increased cholinergic outflow that occurs during REM sleep, which in turn modulates the caliber and reactivity of the lower airways.
Physical changes such as upper airway collapse and reduced pharyngeal cross-sectional area may cause further mechanical strain.87 This can further propagate airway inflammation, alter airway mucosal muscle fibers, and stimulate neural reflexes, thereby increasing cholinergic tone and bronchoconstriction. Furthermore, heightened negative intrathoracic pressure during obstructive episodes can increase nocturnal pulmonary blood pooling.14 Hypoxia itself can augment airway hyperresponsiveness via vagal pathways or carotid body receptors, increasing reactive oxygen species and inflammatory mediators. Local inflammation can “spill over” into systemic inflammatory changes, while alterations in airway inflammatory markers in asthma seem to follow a circadian rhythm, in parallel with the nocturnal worsening of the asthma symptoms.88 Finally, altered sleep may be related to other comorbid conditions, such as gastroesophageal reflux disease, insomnia, and restless leg syndrome.
Management and outcomes of alternative overlap syndrome
Despite optimization of asthma management, OSA can still significantly affect asthma control and symptoms.84
Interestingly, medications that reduce airway inflammation (eg, corticosteroids) may promote OSA. This occurrence cannot be fully explained by an increase in body mass, as more respiratory disturbances occur during sleep with continuous corticosteroid treatment even without increases in body mass index.87 Therefore, these associations may be related to upper airway myopathy caused by the treatment, a small pharynx, facial dysmorphisms, or fat deposition.89
Does CPAP improve asthma?
OSA is often unrecognized in patients with asthma, and treating it can have an impact on asthma symptoms.
CPAP therapy has not been shown to significantly change airway responsiveness or lung function, but it has been noted to significantly improve both OSA-related and asthma-related quality of life and reduce the use of rescue bronchodilators.3,90 CPAP has demonstrated improvement of quality of life that positively correlated with body weight and apnea-hypopnea index at baseline, suggesting that asthmatic patients with greater obesity or worse OSA may benefit most from aggressive management.90
However, CPAP should be used only if the patient has confirmed OSA. Empiric use of CPAP without a diagnosis of OSA was poorly tolerated and failed to improve asthma symptoms or lung function.91 More importantly, using CPAP in a patient who does not have OSA may contribute to further sleep disruption.91
Second-line treatments such as mandibular advancing devices and airway or bariatric surgery have not yet been studied in alternative overlap syndrome.
A multidimensional assessment of asthma
The Western world is experiencing an epidemic of obesity and of asthma. Obesity contributes to the pathogenesis of OSA by altering the anatomy and collapsibility of the upper airway, affecting ventilatory control and increasing respiratory workload. Another paradigm, supported by some evidence, is that OSA itself may contribute to the development of obesity. Both OSA and obesity lead to activation of inflammatory biologic cascades, which are likely the pathogenic mechanisms for their cardiovascular and metabolic consequences. As such, early recognition of OSA is important, as effective treatments are available.
In some patients, obesity may cause asthma, as obesity precedes the onset of asthma in a significant proportion of patients, and bariatric surgery for morbid obesity may resolve asthma. The obese asthma phenotype seems to include chronic rhinosinusitis, gastroesophageal reflux disease, poorer asthma control, limited responsiveness to corticosteroids, and even different sets of biomarkers (eg, neutrophilic airway inflammation). A cohort of obese patients with poor asthma control demonstrated significant improvement in asthma symptoms, quality of life, and airway reactivity after weight loss from bariatric surgery.92
To improve our knowledge about airway disease phenotypes and endotypes and their response to therapy, we propose taking a multidimensional, structured assessment of all patients with asthma, using a schema we call “ABCD-3P-PQRST” (Table 2).
The purpose of using this type of system in clinics and research is to capture the multidimensionality of the disease and better develop future individualized therapeutic strategies by employing the latest advances in systems biology and computational methods such as cluster and principal component analysis.
Multidimensional assessments addressing airway problems such as asthma, COPD, OSA, other comorbidities and risk factors, and personalized management plans will need to be the basis of future therapeutic interventions. Increased attention to the complications of asthma and obstructive airway and lung diseases in our patients is imperative, specifically to develop effective systems of care, appropriate clinical guidelines, and research studies that lead to improved health outcomes.
- Flenley DC. Sleep in chronic obstructive lung disease. Clin Chest Med 1985; 6:651–661.
- Ioachimescu OC, Teodorescu M. Integrating the overlap of obstructive lung disease and obstructive sleep apnoea: OLDOSA syndrome. Respirology 2013; 18:421–431.
- Ciftci TU, Ciftci B, Guven SF, Kokturk O, Turktas H. Effect of nasal continuous positive airway pressure in uncontrolled nocturnal asthmatic patients with obstructive sleep apnea syndrome. Respiratory Med 2005; 99:529–534.
- Kim MY, Jo EJ, Kang SY, et al. Obstructive sleep apnea is associated with reduced quality of life in adult patients with asthma. Ann Allergy Asthma Immunol 2013; 110:253–257.
- Teodorescu M, Polomis DA, Teodorescu MC, et al. Association of obstructive sleep apnea risk or diagnosis with daytime asthma in adults. J Asthma 2012; 49:620–628.
- Puthalapattu S, Ioachimescu OC. Asthma and obstructive sleep apnea: clinical and pathogenic interactions. J Investig Med 2014; 62:665–675.
- National Institutes of Health. National Heart, Lung, and Blood Institute. NHLBI Factbook, Fiscal Year 2007. Chapter 4. Disease Statistics. www.nhlbi.nih.gov/about/factbook-07/chapter4.htm. Accessed November 11, 2015.
- Vestbo J, Hurd SS, Agusti AG, et al. Global strategy for the diagnosis, management, and prevention of chronic obstructive pulmonary disease: GOLD executive summary. Am J Respir Crit Care Med 2013; 187:347–365.
- WHO. World Health Organization: Asthma. Fact sheet No 307. www.who.int/mediacentre/factsheets/fs307/en/. Accessed November 11, 2015.
- Masoli M, Fabian D, Holt S, Beasley R. The global burden of asthma: executive summary of the GINA Dissemination Committee report. Allergy 2004; 59:469–478.
- WHO. Chronic obstructive pulmonary disease (COPD). Fact sheet No 315. www.who.int/mediacentre/factsheets/fs315/en/index.html. 2011. Accessed November 11, 2015.
- Ford ES, Mannino DM, Wheaton AG, Giles WH, Presley-Cantrell L, Croft JB. Trends in the prevalence of obstructive and restrictive lung function among adults in the United States: findings from the National Health and Nutrition Examination surveys from 1988–1994 to 2007–2010. Chest 2013; 143:1395–1406.
- Orie N, Sluiter H, de Vries K, Tammeling G, Witkop J. The host factor in bronchitis. Paper presented at: Bronchitis—an international symposium 1961; Assen, Netherlands.
- Ballard RD. Sleep, respiratory physiology, and nocturnal asthma. Chronobiol Int 1999; 16:565–580.
- Teodorescu M, Polomis DA, Gangnon RE, et al. Asthma control and its relationship with obstructive sleep apnea (OSA) in older adults. Sleep Disord 2013; 2013:251567.
- Young T, Palta M, Dempsey J, Skatrud J, Weber S, Badr S. The occurrence of sleep-disordered breathing among middle-aged adults. N Engl J Med 1993; 328:1230–1235.
- Peppard PE, Young T, Barnet JH, Palta M, Hagen EW, Hla KM. Increased prevalence of sleep-disordered breathing in adults. Am J Epidemiol 2013; 177:1006–1014.
- International Classification of Sleep Disorders, 3rd ed.: Diagnostic and coding manual. Darien, Illinois: American Academy of Sleep Medicine. 2014.
- Lopez-Acevedo MN, Torres-Palacios A, Elena Ocasio-Tascon M, Campos-Santiago Z, Rodriguez-Cintron W. Overlap syndrome: an indication for sleep studies? A pilot study. Sleep Breath 2009; 13:409–413.
- Scharf C, Li P, Muntwyler J, et al. Rate-dependent AV delay optimization in cardiac resynchronization therapy. PACE 2005; 28:279–284.
- Chaouat A, Weitzenblum E, Krieger J, Ifoundza T, Oswald M, Kessler R. Association of chronic obstructive pulmonary disease and sleep apnea syndrome. Am J Respir Crit Care Med 1995;151:82–86.
- Bednarek M, Plywaczewski R, Jonczak L, Zielinski J. There is no relationship between chronic obstructive pulmonary disease and obstructive sleep apnea syndrome: a population study. Respiration 2005; 72:142–149.
- Fletcher EC. Chronic lung disease in the sleep apnea syndrome. Lung 1990; 168(suppl):751–761.
- Shaya FT, Lin PJ, Aljawadi MH, Scharf SM. Elevated economic burden in obstructive lung disease patients with concomitant sleep apnea syndrome. Sleep Breath 2009; 13:317–323.
- Larsson LG, Lindberg A, Franklin KA, Lundbäck B; Obstructive Lung Disease in Northern Sweden Studies. Obstructive sleep apnoea syndrome is common in subjects with chronic bronchitis. Report from the Obstructive Lung Disease in Northern Sweden studies. Respiration 2001; 68:250–255.
- Machado MC, Vollmer WM, Togeiro SM, et al. CPAP and survival in moderate-to-severe obstructive sleep apnoea syndrome and hypoxaemic COPD. Eur Resp J 2010; 35:132–137.
- Guilleminault C, Cummiskey J, Motta J. Chronic obstructive airflow disease and sleep studies. Am Rev Respir Dis 1980; 122:397–406.
- Weitzenblum E, Chaouat A, Kessler R, Canuet M. Overlap syndrome: obstructive sleep apnea in patients with chronic obstructive pulmonary disease. Proc Am Thorac Soc 2008; 5:237–241.
- Bradley TD, Rutherford R, Lue F, et al. Role of diffuse airway obstruction in the hypercapnia of obstructive sleep apnea. Am Rev Respir Dis 1986; 134:920–924.
- Sanders MH, Newman AB, Haggerty CL, et al. Sleep and sleep-disordered breathing in adults with predominantly mild obstructive airway disease. Am J Respir Crit Care Med 2003; 167:7–14.
- Breslin E, van der Schans C, Breukink S, et al. Perception of fatigue and quality of life in patients with COPD. Chest 1998; 114:958–964.
- Kapella MC, Larson JL, Patel MK, Covey MK, Berry JK. Subjective fatigue, influencing variables, and consequences in chronic obstructive pulmonary disease. Nurs Res 2006; 55:10–17.
- Klink M, Quan SF. Prevalence of reported sleep disturbances in a general adult population and their relationship to obstructive airways diseases. Chest 1987; 91:540–546.
- Bellia V, Catalano F, Scichilone N, et al. Sleep disorders in the elderly with and without chronic airflow obstruction: the SARA study. Sleep 2003; 26:318–323.
- Connaughton JJ, Catterall JR, Elton RA, Stradling JR, Douglas NJ. Do sleep studies contribute to the management of patients with severe chronic obstructive pulmonary disease? Am Rev Respir Dis 1988; 138:341–344.
- Mulloy E, McNicholas WT. Ventilation and gas exchange during sleep and exercise in severe COPD. Chest 1996; 109:387–394.
- Johnson MW, Remmers JE. Accessory muscle activity during sleep in chronic obstructive pulmonary disease. J Appl Physiol 1984; 57:1011–1017.
- Douglas NJ, White DP, Pickett CK, Weil JV, Zwillich CW. Respiration during sleep in normal man. Thorax 1982; 37:840–844.
- Mulloy E, Fitzpatrick M, Bourke S, O’Regan A, McNicholas WT. Oxygen desaturation during sleep and exercise in patients with severe chronic obstructive pulmonary disease. Respir Med 1995; 89:193–198.
- Herpel LB, Brown CD, Goring KL, et al. COPD cannot compensate for upper airway obstruction during sleep (abstract). Am J Respir Crit Care Med 2007; 175:A71.
- MacNee W. Pathophysiology of cor pulmonale in chronic obstructive pulmonary disease. Part 2. Am J Respir Crit Care Med 1994; 150:1158–1168.
- MacNee W. Pathophysiology of cor pulmonale in chronic obstructive pulmonary disease. Part 1. Am J Respir Crit Care Med 1994; 150:833–852.
- Budev MM, Arroliga AC, Wiedemann HP, Matthay RA. Cor pulmonale: an overview. Semin Respir Crit Care Med 2003; 24:233–244.
- Simonneau G, Gatzoulis MA, Adatia I, et al. Updated clinical classification of pulmonary hypertension. J Am Coll Cardiol 2013; 62(25 suppl):D34–D41.
- Naeije R. Pulmonary hypertension and right heart failure in chronic obstructive pulmonary disease. Proc Am Thorac Soc 2005; 2:20–22.
- Rasche K, Orth M, Kutscha A, Duchna HW. [Pulmonary diseases and heart function]. In German. Internist (Berl) 2007; 48:276–282.
- Continuous or nocturnal oxygen therapy in hypoxemic chronic obstructive lung disease: a clinical trial. Nocturnal Oxygen Therapy Trial Group. Ann Intern Med 1980; 93:391–398.
- Newman AB, Foster G, Givelber R, Nieto FJ, Redline S, Young T. Progression and regression of sleep-disordered breathing with changes in weight: the Sleep Heart Health Study. Arch Intern Med 2005; 165:2408–2413.
- Calverley PM, Brezinova V, Douglas NJ, Catterall JR, Flenley DC. The effect of oxygenation on sleep quality in chronic bronchitis and emphysema. Am Rev Respir Dis 1982; 126:206–210.
- Centers for Medicare and Medicaid Services. National coverage determination (NCD) for home use of oxygen (240.2). www.cms.gov/medicare-coverage-database/details/ncd-details.aspx?NCDId=169&ncdver=1&NCAId=169&NcaName=Home+Use+of+Oxygen&IsPopup=y&bc=AAAAAAAAIAAA&. Accessed November 11, 2015.
- Plywaczewski R, Sliwinski P, Nowinski A, Kaminski D, Zielinski J. Incidence of nocturnal desaturation while breathing oxygen in COPD patients undergoing long-term oxygen therapy. Chest 2000; 117:679–683.
- Mokhlesi B, Tulaimat A, Faibussowitsch I, Wang Y, Evans AT. Obesity hypoventilation syndrome: prevalence and predictors in patients with obstructive sleep apnea. Sleep Breathing 2007; 11:117–124.
- Marin JM, Carrizo SJ, Vicente E, Agusti AG. Long-term cardiovascular outcomes in men with obstructive sleep apnoea-hypopnoea with or without treatment with continuous positive airway pressure: an observational study. Lancet 2005; 365:1046–1053.
- Marin JM, DeAndres R, Alonso J, Sanchez A, Carrizo S. Long term mortality in the overlap syndrome. Eur Resp J 2008; 32(suppl 52):P865.
- Reeves-Hoche MK, Hudgel DW, Meck R, Witteman R, Ross A, Zwillich CW. Continuous versus bilevel positive airway pressure for obstructive sleep apnea. Am J Respir Crit Care Med 1995; 151:443–449.
- Gay PC, Herold DL, Olson EJ. A randomized, double-blind clinical trial comparing continuous positive airway pressure with a novel bilevel pressure system for treatment of obstructive sleep apnea syndrome. Sleep 2003; 26:864–869.
- Blau A, Minx M, Peter JG, et al. Auto bi-level pressure relief-PAP is as effective as CPAP in OSA patients—a pilot study. Sleep Breath 2012; 16:773–779.
- Randerath WJ, Galetke W, Ruhle KH. Auto-adjusting CPAP based on impedance versus bilevel pressure in difficult-to-treat sleep apnea syndrome: a prospective randomized crossover study. Med Sci Monit 2003; 9:CR353–CR358.
- Schwartz SW, Rosas J, Iannacone MR, Foulis PR, Anderson WM. Correlates of a prescription for bilevel positive airway pressure for treatment of obstructive sleep apnea among veterans. J Clin Sleep Med 2013; 9:327–335.
- Gentina T, Fortin F, Douay B, et al. Auto bi-level with pressure relief during exhalation as a rescue therapy for optimally treated obstructive sleep apnoea patients with poor compliance to continuous positive airways pressure therapy--a pilot study. Sleep Breathing 2011; 15:21–27.
- Ballard RD, Gay PC, Strollo PJ. Interventions to improve compliance in sleep apnea patients previously non-compliant with continuous positive airway pressure. J Clinical Sleep Med 2007; 3:706–712.
- Marin JM, Soriano JB, Carrizo SJ, Boldova A, Celli BR. Outcomes in patients with chronic obstructive pulmonary disease and obstructive sleep apnea: the overlap syndrome. Am J Respir Crit Care Med 2010; 182:325–331.
- de Miguel J, Cabello J, Sanchez-Alarcos JM, Alvarez-Sala R, Espinos D, Alvarez-Sala JL. Long-term effects of treatment with nasal continuous positive airway pressure on lung function in patients with overlap syndrome. Sleep Breath 2002; 6:3–10.
- Mansfield D, Naughton MT. Effects of continuous positive airway pressure on lung function in patients with chronic obstructive pulmonary disease and sleep disordered breathing. Respirology 1999; 4:365–370.
- McEvoy RD, Pierce RJ, Hillman D, et al. Nocturnal non-invasive nasal ventilation in stable hypercapnic COPD: a randomised controlled trial. Thorax 2009; 64:561–566.
- Long term domiciliary oxygen therapy in chronic hypoxic cor pulmonale complicating chronic bronchitis and emphysema. Report of the Medical Research Council Working Party. Lancet 1981; 1:681–686.
- Machado MC, Vollmer WM, Togeiro SM, et al. CPAP and survival in moderate-to-severe obstructive sleep apnoea syndrome and hypoxaemic COPD. Eur Respir J 2010; 35:132–137.
- Casanova C, Celli BR, Tost L, et al. Long-term controlled trial of nocturnal nasal positive pressure ventilation in patients with severe COPD. Chest 2000; 118:1582–1590.
- Clini E, Sturani C, Rossi A, et al. The Italian multicentre study on noninvasive ventilation in chronic obstructive pulmonary disease patients. Eur Respir J 2002; 20:529–538.
- Duiverman ML, Wempe JB, Bladder G, et al. Two-year home-based nocturnal noninvasive ventilation added to rehabilitation in chronic obstructive pulmonary disease patients: a randomized controlled trial. Respir Res 2011; 12:112.
- Gay PC, Hubmayr RD, Stroetz RW. Efficacy of nocturnal nasal ventilation in stable, severe chronic obstructive pulmonary disease during a 3-month controlled trial. Mayo Clin Proc 1996; 71:533–542.
- Meecham Jones DJ, Paul EA, Jones PW, Wedzicha JA. Nasal pressure support ventilation plus oxygen compared with oxygen therapy alone in hypercapnic COPD. Am J Respir Crit Care Med 1995; 152:538–544.
- Krachman SL, Chatila W, Martin UJ, et al. Effects of lung volume reduction surgery on sleep quality and nocturnal gas exchange in patients with severe emphysema. Chest 2005; 128:3221–3228.
- Stanchina ML, Welicky LM, Donat W, Lee D, Corrao W, Malhotra A. Impact of CPAP use and age on mortality in patients with combined COPD and obstructive sleep apnea: the overlap syndrome. J Clin Sleep Med 2013; 9:767–772.
- Jaoude P, Kufel T, El-Solh AA. Survival benefit of CPAP favors hypercapnic patients with the overlap syndrome. Lung 2014; 192:251–258.
- Ramagopal M, Mehta A, Roberts DW, et al. Asthma as a predictor of obstructive sleep apnea in urban African-American children. J Asthma 2009; 46:895–899.
- Ross KR, Storfer-Isser A, Hart MA, et al. Sleep-disordered breathing is associated with asthma severity in children. J Ped 2012; 160:736–742.
- Alharbi M, Almutairi A, Alotaibi D, Alotaibi A, Shaikh S, Bahammam AS. The prevalence of asthma in patients with obstructive sleep apnoea. Prim Care Respir J 2009; 18:328–330.
- Auckley D, Moallem M, Shaman Z, Mustafa M. Findings of a Berlin Questionnaire survey: comparison between patients seen in an asthma clinic versus internal medicine clinic. Sleep Med 2008; 9:494–499.
- Teodorescu M, Barnet JH, Hagen EW, Palta M, Young TB, Peppard PE. Association between asthma and risk of developing obstructive sleep apnea. JAMA 2015; 313:156–164.
- Teodorescu M, Polomis DA, Hall SV, et al. Association of obstructive sleep apnea risk with asthma control in adults. Chest 2010; 138:543–550.
- Larsson LG, Lindberg A, Franklin KA, Lundback B. Gender differences in symptoms related to sleep apnea in a general population and in relation to referral to sleep clinic. Chest 2003; 124:204–211.
- ten Brinke A, Sterk PJ, Masclee AA, et al. Risk factors of frequent exacerbations in difficult-to-treat asthma. Eur Respir J 2005; 26:812–818.
- Luyster FS, Teodorescu M, Bleecker E, et al. Sleep quality and asthma control and quality of life in non-severe and severe asthma. Sleep Breath 2012; 16:1129–1137.
- Catterall JR, Douglas NJ, Calverley PM, et al. Irregular breathing and hypoxaemia during sleep in chronic stable asthma. Lancet 1982; 1:301–304.
- Perez GF, Gutierrez MJ, Huseni S, et al. Oximetry signal processing identifies REM sleep-related vulnerability trait in asthmatic children. Sleep Disord 2013; 2013:406157.
- Yigla M, Tov N, Solomonov A, Rubin AH, Harlev D. Difficult-to-control asthma and obstructive sleep apnea. J Asthma 2003; 40:865–871.
- Kelly EA, Houtman JJ, Jarjour NN. Inflammatory changes associated with circadian variation in pulmonary function in subjects with mild asthma. Clin Exper Allergy 2004; 34:227–233.
- Bohadana AB, Hannhart B, Teculescu DB. Nocturnal worsening of asthma and sleep-disordered breathing. J Asthma 2002; 39:85–100.
- Lafond C, Series F, Lemiere C. Impact of CPAP on asthmatic patients with obstructive sleep apnoea. Eur Respir J 2007; 29:307–311.
- Martin RJ, Pak J. Nasal CPAP in nonapneic nocturnal asthma. Chest 1991; 100:1024–1027.
- Dixon AE, Pratley RE, Forgione PM, et al. Effects of obesity and bariatric surgery on airway hyperresponsiveness, asthma control, and inflammation. J Allergy Clin Immunol 2011; 128:508–515 e501–502.
KEY POINTS
- Obstructive lung diseases and OSA are both common and may exacerbate each other.
- When assessing a patient with COPD, it may be prudent to think about whether the patient also has OSA, and vice versa.
- Oxygen therapy lowers the risk of death in patients with COPD but may worsen hypercapnia and apneic episodes in those with OSA.
- Continuous positive airway pressure is the first line of therapy for overlap syndrome. Daytime hypercapnia and nocturnal hypoxemia despite supplemental oxygen therapy are indications for nocturnal bilevel positive airway pressure therapy, regardless of the presence of OSA.
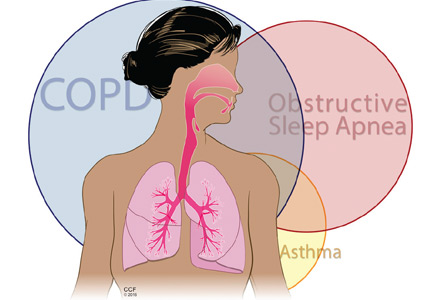
Rapid Response Team Meta‐analysis
In 2004, the Institute for Healthcare Improvement (IHI) launched its 100,000 Lives Campaign, a national initiative with a goal of saving 100,000 lives among hospitalized patients through improvements in the safety and effectiveness of healthcare.[1] One of their recommended strategies to reduce preventable inpatient deaths was for hospitals to establish rapid response teams (RRTs).[2, 3] The goal of RRTs, also termed medical emergency teams (METs), is to identify patients at risk for rapid decline in condition and intervene prior to a catastrophic event such as cardiopulmonary arrest.[4] The basis for recommending RRT/METs was evidence of predictable warning signs occurring in patients prior to cardiopulmonary arrest that could alert physicians.[5] A pilot study by the IHI, including 8 hospitals in the United States and the United Kingdom, found reductions in code calls after implementing RRTs, with 2 hospitals also showing a reduction in mortality.[3]
In response to the IHI report, many hospitals established RRT/METs.[6] Proponents for RRT/METs argued that the potential benefit justified immediate implementation, whereas others advocated for further research.[6] Despite the rapid, widespread adoption of RRT/METs, questions remain regarding their effectiveness in reducing hospital mortality and nonintensive care unit (ICU) cardiopulmonary arrests.[6, 7] In 2010, Chan et al. reported the results of a meta‐analysis of studies published through 2008 that demonstrated a reduction in cardiac arrests, but not mortality, following the implementation of RRTs.[8] An updated systematic review, including studies published through 2012, suggested that RRTs are associated with reduced non‐ICU cardiac arrest and reduced mortality.[9]
Since the publication of the Winters et al. systematic review, several new studies have been published.[9, 10, 11, 12] We performed a systematic review and meta‐analysis including studies published through 2014 to examine the impact of RRT/METs on hospital mortality and in‐hospital cardiopulmonary arrest (IHCA).
METHODS
Search Methods
We conducted a systematic search of publications on RRTs using PubMed (19462014), Cumulative Index to Nursing and Allied Health Literature (19372014), and the Cochrane Library (issue 10 of 12, 2014). The search used no language restrictions and no limits. Medical Subject Headings with keywords in a Boolean search strategy were employed. The major themes used were cardiopulmonary arrest and rapid response teams.
Study Eligibility Criteria
Prespecified criteria for determining study eligibility included: before‐after studies, cohort studies, nonrandomized control studies, or cluster randomized controlled trials (RCTs); implementation of an RRT and/or a MET as the intervention; adults (based on individual study definition) hospitalized in a non‐ICU setting; reported 1 or both prespecified outcomes, hospital mortality, or IHCA. There were no exclusion criteria or language restrictions.
Data Extraction
We prospectively outlined a standard protocol that included the research question, inclusion/exclusion criteria, as well as our outcomes and search approaches. We used standard methodology for analysis in accordance with the guidelines in Cochrane Handbook for Systematic Reviews of Interventions.[13] The protocol can be obtained by request to the authors. All changes to our original protocol were recorded in a protocol amendments table.
The studies identified underwent title and abstract screening by 1 of 2 reviewers (G.S.C., R.S.S.). After irrelevant studies were removed, reviewers independently assessed the remaining studies for eligibility based on full‐text review. All disagreements were resolved with consensus and the help of a third reviewer (D.C.B.).
Prior to extracting data, a piloted standardized data‐collection form was created. Eligible studies were independently reviewed by each of the 2 reviewers, and the relevant data extracted. Conflicts between the reviewers regarding the data collected for a given study were resolved by a third reviewer. The essential data were total events (hospital deaths and IHCA) and total hospital admissions.
Assessment of Methodological Quality
We utilized design‐specific tools to assess the methodological quality of included studies. For nonrandomized control and cohort studies, we used the Newcastle Ottawa Scale. This allowed us to evaluate the representativeness of the intervention cohort, selection of the nonintervention cohort, ascertainment of the intervention, whether or not the outcome was present at the start of the study, comparability of cohorts, assessment of the outcome, and whether there was adequate follow‐up.[14] We assigned stars as a measure of rating for each category and tallied the number of stars to assess the methodological quality. The maximum score was 9.[14]
For before‐after studies, an assessment scale developed by the ECRI (Emergency Care Research Institute) to test the internal validity of each study was utilized.[15] The ECRI Before‐After Scale allowed us to evaluate if the study was prospective, inclusion and exclusion criteria were established a priori, consecutive patients were enrolled, the same initial/subsequent treatment was administered, outcomes were objectively measured, follow‐up was complete, cohorts were comparable, there were no conflicts of interest, and conclusions were supported by data.[15] We ascertained whether each criterion was met and converted answers to numerical scores. A yes was scored 1, a no was scored 1, and no response was scored 0.5. The sum of these scores was then added to 11, divided by 22, and multiplied by 10 to yield the total quality score. The summary score can range from 0 to 10. A total score <5 was considered unacceptable quality. A score 5 but <7.5 was considered low quality, and a total 7.5 was considered moderate quality.[15]
To assess the methodological quality of RCTs, we used the Cochrane Risk of Bias Tool.[13] The tool involves determining whether a study has a high, low, or unclear risk of bias for specific criteria.[13]
Two independent reviewers evaluated the studies using these scales, and discrepancies were resolved by discussion.
Data Analysis
Measure of Treatment Effect
We used relative risk (RR) to summarize outcome data for our prespecified outcomes: hospital mortality and IHCA.
Dealing With Missing Data
If essential data were missing, study authors were contacted. If we did not receive a response, we calculated total events (deaths and IHCAs) using total admissions and event rates per admissions. If total admissions and/or event rates were missing, studies were not included in the analysis.
Data Synthesis
We used Review Manager 5.3 to calculate pooled summary estimates.[16] Meta‐analyses for each outcome were conducted by means of a random effects model.
Assessment of Heterogeneity
To assess for heterogeneity, we calculated I2 and P values. If the I2< 0.50 or the P > 0.10, then the test for heterogeneity was passed. If heterogeneity was present, we evaluated each study in an effort to identify outliers. If an outlier was identified, the study was removed from the analysis.
Assessment of Reporting Bias
To assess publication bias, we used a funnel plot of the primary outcome. The findings were arranged by study size and effect size, and the plot was assessed for symmetry.
Subgroup Analyses
Subgroup analyses were performed for study type, RRT/MET composition, and publication year. Study type was grouped by cluster RCT and nonrandomized studies versus cohort/before‐after studies. Team composition was grouped by whether or not there was a physician on the RRT/MET. Publication year was grouped by studies published before or after 2010.
Sensitivity Analysis
We conducted sensitivity analyses to evaluate the impact of methodological quality on summary estimates. We compared overall summary estimates to summary estimates based only on before‐after studies judged to be low risk for bias. We also conducted an analysis to evaluate the inclusion of studies in which total events were calculated from rates and total admissions. We compared the overall summary estimates to summary estimates based on studies in which we were able to obtain essential data.
RESULTS
Description of Studies
Our search identified 691 studies, of which 90 were duplicates. The remaining studies were screened by title and abstract, identifying 82 potentially eligible studies, of which 30 studies were identified as eligible for inclusion in the meta‐analysis (Figure 1).
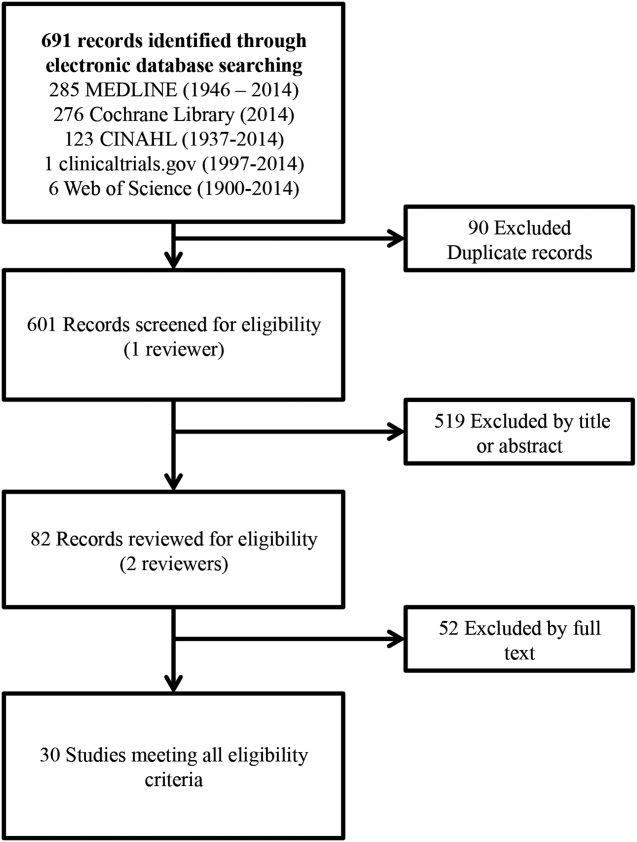
Of the 30 eligible studies, 10 were excluded from pooled estimates for hospital mortality,[7, 17, 18, 19, 20, 21, 22, 23, 24, 25, 26, 27, 28] and 10 were excluded from pooled estimates for IHCA due to missing data.[17, 18, 20, 21, 22, 23, 24, 25, 26, 27, 29, 30] For the analysis, 20 studies were included for the hospital mortality analysis and 20 studies were included for the IHCA analysis. The 22 studies included in either or both analyses spanned the years 2000 to 2014. The characteristics of the included studies are summarized in Table 1.
| Author/Year | Study Design | Setting/Location | Subjects (No.) | Age, y | Description of Intervention | Description of Control | Duration of Study | Outcome(s) of Interest |
|---|---|---|---|---|---|---|---|---|
| ||||||||
| Al‐Qahtani, 2013[10] | Before‐after | Saudi Arabia (tertiary care academic center) | Before: 157,804; after: 98,391 | Before: 59.2 19.2; after: 59 19.0 | RRT Implementation | Before RRT implementation | 5 years (January 2006December 2010) | IH mortality, IHCA, ward mortality |
| Bader, 2009[37] | Before‐after | USA (community acute care hospital) | Before: 15,949; after: 16,907 | N/R | RRT Implementation | Before RRT implementation | 3 years (October 2005June 2008) | IHCA, code mortality, ICU transfer |
| Beitler, 2011[31] | Before‐after | USA (tertiary referral public teaching hospital) | Before: 77,021; after: 79,013 | Pre‐RRT: 40.9 (22.3); post‐RRT: 42.0 (22.2) | RRT implementation | Before RRT implementation | 5 years (20032008) | IHCA mortality, IHCA, out‐of‐ICU mortality, IH mortality |
| Bellomo, 2003[32] | Before‐after | Australia (tertiary referral hospital) | Before: 21,090; after: 20,921 | Before: 60.7; after: 60.2 | MET implementation | Before MET implementation | 8 months (before: May 1999August 1999; after: November 2000February 2001) | IHCA, CA‐related mortality, IH mortality |
| Bristow, 2000[33] | Nonrandomized controlled | Australia (3 public hospitals) | 50,942 | NR | Hospitals with MET | Hospitals without MET (with conventional CA teams) | 5 months (2006) | IHCA, IH mortality |
| Buist, 2002[38] | Before‐after | Australia (tertiary referral teaching hospital) | Before: 25,254; after: 28,801 | Before: 36.6 (26.0); after: 36.4 (26.0) | MET implementation | Before MET implementation | 3 years (19961999) | Incidence and outcome of unexpected IHCA |
| Chan, 2008[39] | Prospective cohort | USA (tertiary care academic hospital) | Before: 24,193; after: 24,978 | Before: 56.8 (13.6) in 2004; 56.5 (13.8) in 2005; after: 57.0 (13.9) in 2006; 57.1 (13.8) in 2007 | RRT implementation | Standard care | 3.5 years (20042007) | IHCA, IH mortality |
| Chen, 2014[11] | Nonrandomized controlled | Australia (teaching hospital) | Before: 1,088,491; after: 479,194 | NR | Teaching hospital with a mature RRS | Three teaching hospitals without RRS | 8 years (20022009) | IHCA, IHCA mortality, IH mortality |
| Goncales, 2012[34] | Before‐after | Brazil (high complexity general hospital) | Before: 40,033; after: 42,796 | Before: 73; after: 68 | Implementation of RRT called Code Yellow | Before Implementation of RRTCode Blue | 3 years (20052008) | IHCA, IHCA mortality, IH mortality |
| Hatler, 2009[19] | Before‐after | USA (tertiary care hospital) | Before: 24,739; after: 25,470 | N/R | RRT implementation | Before RRT implementation | 2 years (20052007) | IHCA |
| Hillman, 2005[20] | Cluster RCT | Australia (23 hospitals) | Control hospitals: 56.756; MET hospitals: 68,376 | Control hospitals: 56.9; MET hospitals: 55.4 | MET implementation | Care as usual | 6 months | IH Mortality, IHCA |
| Jones, 2005[7] | Before‐after | Australia (tertiary care teaching hospital) | Before: 16,246; after: 104,001 | Before: 73.4; after: 70.8 | MET implementation | Before MET implementation | 5 years (19992004) | IHCA, death following cardiac arrest |
| Jones, 2007[29] | Before‐after | Australia (teaching hospital) | Before: 25,334; after: 100,243 | N/R | MET implementation | Before MET implementation | 6 years (19982004) | Surgical and medical mortality |
| Kenward, 2004[22] | Before‐after | UK (general hospital) | Before: 53,500; after: 53,500 | Before: N/R; after: 73 | MET implementation | Before MET implementation | 1 year (20002001) | IH mortality, IHCA |
| Konrad, 2010[36] | Before‐after | Sweden (tertiary care center) | Before: 203,892; after 73,825 | Before: 53.1; after: 52.4 | MET implementation | Before MET implementation | 6 years (20002006) | IH mortality, IHCA |
| Lighthall, 2010[40] | Before‐after | USA (university affiliated VA hospital) | Before: 2,975; after: 9,077 | Before: 65.26; after: 65.56 | RRT implementation | Before RRT implementation | 3 years (20042007) | IH mortality, IHCA |
| Lim, 2011[41] | Before‐after | South Korea (Samsung Medical Center) | Before: 33,360; after: 34,699 | Before: 64; after: 59 | MET implementation | Before MET implementation | 1 year (20082009) | IH mortality, IHCA, unexpected ICU transfers |
| Moroseos, 2014[12] | Before‐after | USA (teaching hospital) | Before: 7,092; after: 9,357 | Before: 30.1; after: 30.9 | Teaching hospital after RRT implementation | Teaching hospital before RRT implementation | 10 years (before: January 2000December 2004; after: January 2007December 2011) | IH mortality, IHCA, unexpected ICU transfers |
| Salvatierra, 2014[30] | Observational cohort | USA (10 tertiary care hospitals) | Before: 235,718; after: 235,344 | N/R | RRT implementation | Before RRT implementation | 62 months (September 2001December 2009) | IH mortality |
| Santamaria, 2010[35] | Before‐after | Australia (teaching hospital) | Before (IH mortality): 22,698; before (IHCA): 8,190 after (IH mortality): 74,616; after (IHCA): 81,628 | Median: 5860 (19932007) | RRT implementation | Before RRT implementation | 14 years (19932007) | IH mortality, IHCA |
| Segon, 2014[42] | Before‐after | USA (teaching hospital) | Before: 14,013; after: 14,333 | N/R | RRT implementation | Before RRT implementation | 2 years (January 2004April 2006) | IH mortality, unexpected ICU transfer, IHCA, ICU length of stay |
| Shah, 2011[28] | Retrospective cohort | USA (teaching hospital) | Before: 16,244; after: 45,145 | N/R | RRT implementation | Before RRT implementation | 3 years (20052008) | IHCA, IH mortality, unplanned ICU transfers |
Methodological Quality
The methodological quality of the 4 cohort studies, based on the New Castle Ottawa Scale, was either 8 or 9 stars. Using the ECRI Before‐After Scale, the average quality score of the 17 included before‐after studies was 8.41 (range, 7.279.32). Included before‐after studies were of moderate quality, with the exception of 1 of lower quality. The cluster RCT had low risk of bias for random sequence generation, allocation concealment, blinding of participants/personnel, and incomplete outcome data; however, it had unclear risk of bias for blinding of outcome assessment, selective reporting, and sources of bias due to lack of reporting.[20] Overall, the 22 studies included ranged from moderate to good quality.
Effect of RRT on Hospital Mortality
Of the 20 studies that reported hospital mortality, 9 favored RRT/METs,[10, 11, 30, 31, 32, 33, 34, 35, 36] 10 found no difference with RRT/METs,[12, 20, 22, 28, 37, 38, 39, 40, 41, 42] and 1 favored RRT/METs for surgical patients while favoring usual care (no RRT/MET) for medical patients[29] (Figure 2a). The pooled analysis demonstrated that implementation of RRT/METs was associated with a significant reduction in hospital mortality (RR = 0.88, 95% confidence interval [CI]: 0.83‐0.93). There was heterogeneity among the contributing studies (I2 = 86%).
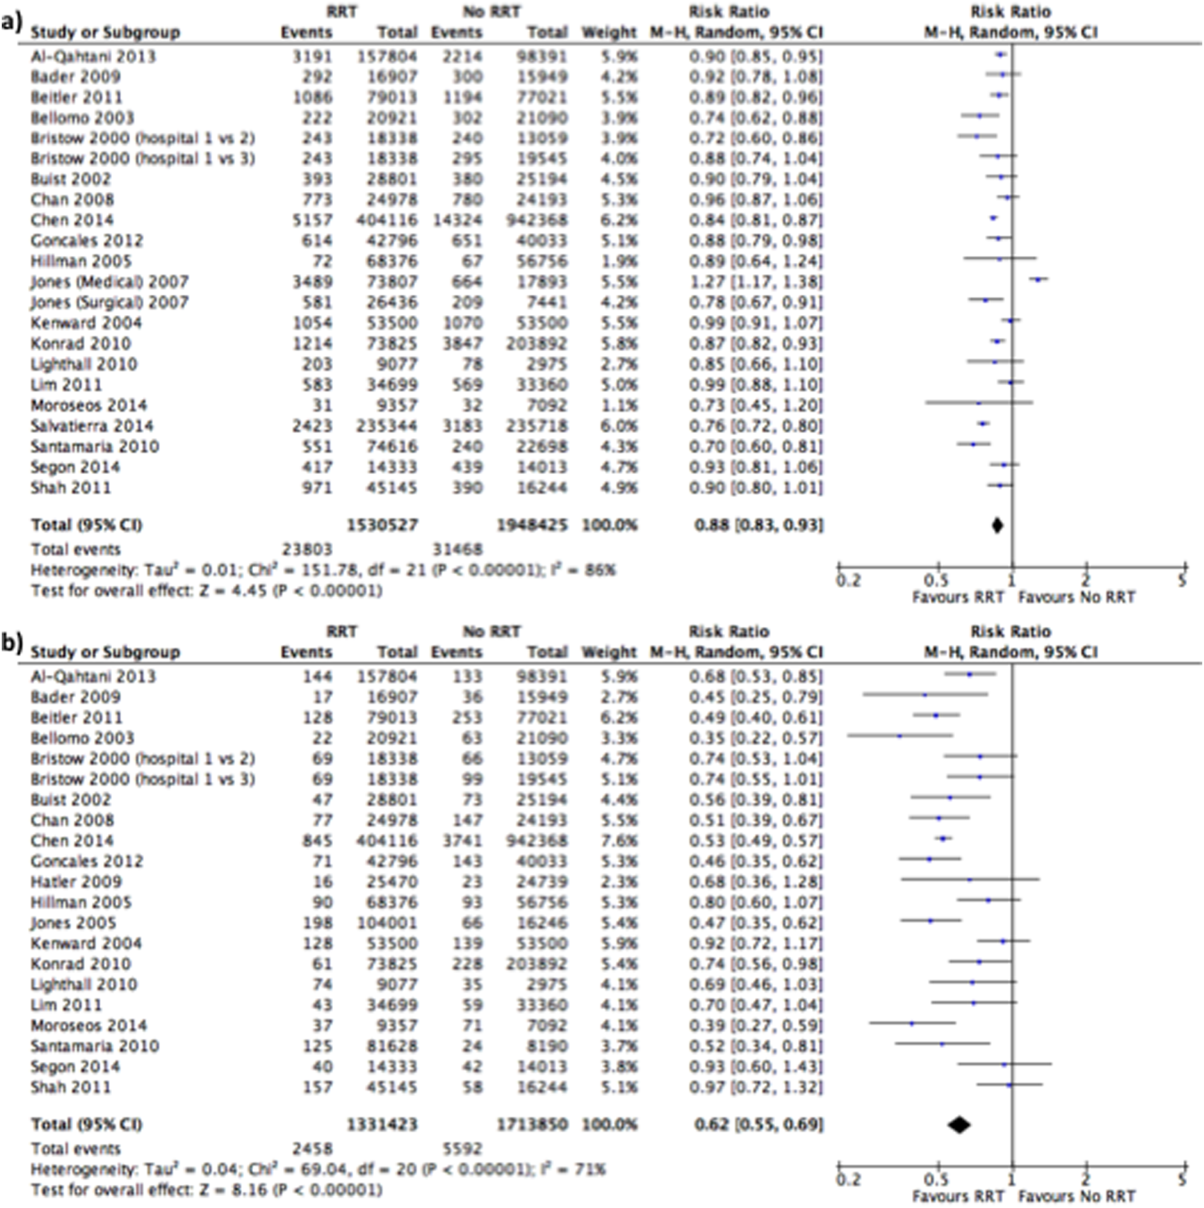
Effect of RRT on IHCA
Of the 20 studies that reported rates of IHCA, 12 favored RRT/METs [7, 10, 11, 12, 31, 32, 34, 35, 36, 37, 38, 39] and 8 found no difference with RRT/METs[16, 19, 20, 22, 28, 33, 40, 41, 42] (Figure 2b). In the pooled analysis, RRT/METs were associated with a significant reduction in IHCA (RR = 0.62, 95% CI: 0.55‐0.69). There was moderate heterogeneity among the studies (I2 = 71%).
Subgroup Analysis
Study Type
For hospital mortality, there was 1 cluster RCT and 2 nonrandomized studies[11, 20, 33] (RR = 0.83, 95% CI: 0.80‐0.87) and 17 cohort/before‐after studies[10, 12, 22, 28, 29, 30, 31, 32, 34, 35, 36, 37, 38, 39, 40, 41, 42] (RR = 0.89, 95% CI: 0.83‐0.96). The cluster RCT and non‐randomized studies had minimal heterogeneity (I2 = 7%), and the cohort/before‐after studies exhibited substantial heterogeneity (I2 = 88%). The test for subgroup differences (I2 = 54.7%) indicates that study type may have an impact on hospital mortality.
For IHCA, there was 1 cluster RCT and 2 nonrandomized studies[11, 20, 33] (RR = 0.68, 95% CI: 0.52‐0.88) and 17 before‐after studies[7, 10, 12, 19, 22, 28, 31, 32, 34, 35, 36, 37, 38, 39, 40, 41, 42] (RR = 0.60, 95% CI: 0.52‐0.69). The cluster RCT and nonrandomized studies had substantial heterogeneity (I2 = 79%), whereas the cohort/before‐after studies had moderate heterogeneity (I2 = 69%). The test for subgroup differences (I2 = 0%) indicates that study type had no impact on IHCA.
RRT/MET Team Composition
For hospital mortality, there were 14 studies[10, 20, 29, 31, 32, 33, 34, 35, 36, 37, 38, 40, 41, 42] of RRTs with physicians (RR = 0.88, 95% CI: 0.82‐0.95) and 4 studies[12, 28, 30, 39] without physicians (RR = 0.85, 95% CI: 0.74‐0.99). Both groups exhibited substantial heterogeneity (I2 = 85% for both). The test for subgroup differences (I2 = 0%) indicates that team composition had no impact on hospital mortality.
Similarly, for IHCA there were 14 studies[7, 10, 20, 31, 32, 33, 34, 35, 36, 37, 38, 40, 41, 42] of RRTs with physicians (RR = 0.61, 95% CI: 0.54‐0.69) and 4 studies[12, 19, 28, 39] without (RR = 0.60, 95% CI: 0.39‐0.92). The studies with physicians on the RRT had moderate heterogeneity (I2 = 55%), whereas studies without a physician on the RRT had substantial heterogeneity (I2 = 81%). The test for subgroup differences (I2 = 0%) indicates that team composition had no impact on IHCA.
Publication Year
Publication year had no impact on hospital mortality. Studies published 2010 or earlier had an RR of 0.88 (95% CI: 0.80‐0.97), whereas studies published after 2010 had an RR of 0.87 (95% CI: 0.83‐0.92). Both groups had substantial heterogeneity (I2 of 88% and 75%, respectively). The test for subgroup differences (I2 = 0%) indicates publication year had no impact on hospital mortality.
Publication year had no impact on IHCA. Studies published in 2010 or earlier had an RR of 0.63 (95% CI: 0.54‐0.73), whereas studies published after 2010 had an RR of 0.60 (95% CI: 0.50‐0.72). The 2010 or earlier group had moderate heterogeneity (I2 = 60%), whereas the post‐2010 group had substantial heterogeneity (I2 = 77%). The test for subgroup differences (I2 = 0%) indicates that publication year had no impact on IHCA.
Sensitivity Analysis
A sensitivity analysis was performed excluding studies with low methodological quality from the analysis. For hospital mortality there were no studies of low methodological quality. For IHCA there was no major change in the summary estimate or the heterogeneity (RR = 0.59, 95% CI: 0.53‐0.67, I2 = 66%).
A sensitivity analysis was performed excluding studies only reporting rates and/or average annual admissions from the analysis. For hospital mortality, there was no major change in the summary estimate or the heterogeneity (RR = 0.87, 95% CI: 0.82‐0.93, I2 = 87%). For IHCA there was no major change in the summary estimate, but there was a decrease in heterogeneity (RR = 0.59, 95% CI: 0.53‐0.66, I2 = 63%).
Publication Bias
Funnel plots generated for the effect of RRTs on hospital mortality and on IHCA did not indicate publication bias. Our search of
DISCUSSION
We found implementation of RRT/METs was associated with reductions in hospital mortality and IHCA. Our analysis extends the meta‐analysis of Chan et al. and is consistent with the recent systematic review by Winters et al.[8, 9] These findings provide support for the IHI recommendation that hospitals implement RRT/METs.[1]
Following the 2004 IHI recommendations, RRT/METs were widely implemented, with over 50% of hospitals having some form of RRT by 2010.[6] The adoption of RRT/METs occurred despite limited evidence on the effectiveness of RRT/METs. A meta‐analysis of studies published through 2008 demonstrated a reduction in cardiac arrests, but no reduction in mortality after implementation of RRT/METs.[8] More recently a systematic review that included studies through 2012 suggested that RRT/METs are associated with reduced IHCA and reduced mortality.[9] Our analysis addressed the conflicting results of the prior reviews and included 13 studies published after the Chan et al. meta‐analysis and several studies published after the Winters et al. systemic review.[8, 9] The studies included in our analysis were completed in hospitals across multiple countries and settings, increasing the generalizability of the results. Most studies were performed in teaching hospitals; thus, the results may not be as applicable to community hospitals.
We found publication year did not impact either outcome. However, this may reflect our use of 2 broad publication periods rather than smaller periods, as 5 of the 6 newly included studies favor RRT interventions. Additionally, if the studies missing data had been included in our analysis, they may have shown that publication year impacts the outcomes. We noted that a physician on a RRT/MET did not affect outcomes, contrary to suggestions by Winters et al.[9] This may reflect the skill of nonphysician providers and/or the collaboration of the RRT/MET with critical care teams. However, very few RRTs did not include a physician, limiting the conclusion that can be drawn regarding team composition.
Many patients exhibit observable clinical deterioration or measurable changes that could identify them prior to an event such as cardiac arrest.[5, 43] Measurable physiologic parameters, in fact, are the basis of medical early warning systems and recent automated systems.[44, 45] Similarly, delayed transfer to the ICU has been shown to be associated with increased mortality.[46] Therefore, RRTs, either by identifying patients at risk for clinical deterioration and/or facilitating transfer of patients to the ICU earlier, could result in improved clinical outcomes. We did not specifically look at ICU transfer or ICU codes in our analysis. However, in a recent single‐center before‐after study, RRT implementation increased ICU admission rates and the transfer of less severely ill patients to the ICU without improvement in severity of illness‐adjusted outcomes.[47] This finding may reflect the ICU organization of the particular institution; however, given limited ICU resources, admitting an increased number of less severely ill patients without clear clinical benefit is a potential concern. More studies are needed to better understand the mechanism of benefit as well as potential trade‐offs associated with RRT implementation. It is possible that institutional factors determine the benefit that can be achieved through RRTs.
Our study has several limitations. Although the methodological quality of the included studies was moderate to good, confounding and biases can be an issue with before‐after trials and cohort studies. Most studies were before‐after observational trials, lacking a concurrent control group making it difficult to draw causal relationships. This is particularly the case for hospital mortality, which has been independently falling since 2000.[48] Thus, changes in observed hospital mortality may simply reflect the general trend independent of the RRT intervention. However, this does not appear the case for cardiopulmonary arrest, which has been increasing in incidence since 2000.[49] There were several studies eligible for inclusion in our analysis, but could not be included because of insufficient data. It is possible that the inclusion of these studies could influence the results of our analysis. Finally, there was heterogeneity among the studies for both outcomes, particularly in‐hospital mortality. This likely reflects variations in hospital characteristics and case‐mix indices. There may also be other factors impacting teams such as how hospitals handled deteriorating patients before RRT implementation, education periods, and differing mechanisms and criteria for RRT activation.
In conclusion, RRT/METs are effective in decreasing both IHCA and hospital mortality. Our findings support the 2004 IHI recommendations for the implementation of RRTs in hospitals. Additional studies are still required to explore team composition, activation criteria, activation mechanism, and implementation strategies.
- , , , . The 100,000 lives campaign: setting a goal and a deadline for improving health care quality. JAMA. 2006;295(3):324–327.
- Institute for Healthcare Improvement. Overview of the 100,000 Lives Campaign. Available at: https://www.ihi.org/Engage/Initiatives/Completed/5MillionLivesCampaign/Documents/Overview%20of%20 the%20100K%20Campaign.pdf. Accessed September 18, 2014.
- , , . Reducing Hospital Mortality Rates (Part 2). IHI Innovation Series white paper. Cambridge, MA: Institute for Healthcare Improvement; 2005.
- , . Developing strategies to prevent inhospital cardiac arrest: analyzing responses of physicians and nurses in the hours before the event. Crit Care Med. 1994;22(2):244–247.
- , , , et al. Duration of life‐threatening antecedents prior to intensive care admission. Intensive Care Med. 2002;28(11):1629–1634.
- , , . The tension between needing to improve care and knowing how to do it. N Engl J Med. 2007;357(6):608–613.
- , , , et al. Long term effect of a medical emergency team on cardiac arrests in a teaching hospital. Crit Care. 2005;9(6):R808–R815.
- , , , , . Rapid response teams: a systematic review and meta‐analysis. Arch Intern Med. 2010;170(1):18–26.
- , , , , , . Rapid‐response systems as a patient safety strategy: a systematic review. Ann Intern Med. 2013;158(5 pt 2):417–425.
- , , , et al. Impact of an intensivist‐led multidisciplinary extended rapid response team on hospital‐wide cardiopulmonary arrests and mortality. Crit Care Med. 2013;41(2):506–517.
- , , , et al. The impact of implementing a rapid response system: a comparison of cardiopulmonary arrests and mortality among four teaching hospitals in Australia. Resuscitation. 2014;85(9):1275–1281.
- , , , et al. Rapid response team implementation on a burn surgery/acute care ward. J Burn Care Res. 2014;35(1):21–27.
- Higgins J, Green S, eds. Cochrane Handbook for Systematic Reviews of Interventions. Version 5.1.0. Oxford, United Kingdom: The Cochrane Collaboration; 2011: Available at: http://www.cochrane‐handbook.org. Accessed October 9, 2014.
- , , , et al. The Newcastle‐Ottawa Scale (NOS) for Assessing The Quality of Nonrandomised Studies in Meta‐analyses. Ottawa, Canada: Ottawa Hospital Research Institute; 2014.
- Agency for Healthcare Research and Quality. Remote cardiac monitoring: a systematic review. Available at: http://www.cms.gov/determinationprocess/downloads/id51ta.pdf. Published December 12, 2007.
- Review Manager (RevMan) [computer program]. Version 5.3. Copenhagen, the Netherlands: The Nordic Cochrane Centre, The Cochrane Collaboration; 2014.
- , , . Implementing a rapid‐response team using a nurse‐to‐nurse consult approach. J Vasc Nurs. 2008;26(2):37–42.
- , , , et al. The effect of a rapid response team on major clinical outcome measures in a community hospital. Crit Care Med. 2007;35(9):2076–2082.
- , , , et al. Implementing a rapid response team to decrease emergencies outside the ICU: one hospital's experience. Medsurg Nurs. 2009;18(2):84–90, 126.
- , , , et al. Introduction of the medical emergency team (MET) system: a cluster‐randomised controlled trial. Lancet. 2005;365(9477):2091–2097.
- , , , , . Rapid response teams: do they make a difference? Dimens Crit Care Nurs. 2007;26(6):253–260; quiz 261–262.
- , , , . Evaluation of a medical emergency team one year after implementation. Resuscitation. 2004;61(3):257–263.
- , , , . Improving patient safety to reduce preventable deaths: the case of a California safety net hospital. J Healthc Qual. 2012;34(2):64–76.
- , . Implementation and outcomes of a rapid response team. J Nurs Care Qual. 2007;22(4):307–313, quiz 314–315.
- , , . Implementation of a rapid response team decreases cardiac arrest outside of the intensive care unit. J Trauma. 2007;62(5):1223–1227; discussion 1227–1228.
- , , , et al. Introducing Critical Care Outreach: a ward‐randomised trial of phased introduction in a general hospital. Intensive Care Med. 2004;30(7):1398–1404.
- , , , , . Four years' experience with a hospitalist‐led medical emergency team: an interrupted time series. J Hosp Med. 2012;7(2):98–103.
- , , , . Rapid response team in an academic institution: does it make a difference? Chest. 2011;139(6):1361–1367.
- , , , et al. Long‐term effect of a medical emergency team on mortality in a teaching hospital. Resuscitation. 2007;74(2):235–241.
- , , , , . Rapid response team implementation and in‐hospital mortality*. Crit Care Med. 2014;42(9):2001–2006.
- , , , , . Reduction in hospital‐wide mortality after implementation of a rapid response team: a long‐term cohort study. Crit Care. 2011;15(6):R269.
- , , , et al. A prospective before‐and‐after trial of a medical emergency team. Med J Aust. 2003;179(6):283–287.
- , , , et al. Rates of in‐hospital arrests, deaths and intensive care admissions: the effect of a medical emergency team. Med J Aust. 2000;173(5):236–240.
- , , , et al. Reduced frequency of cardiopulmonary arrests by rapid response teams. Einstein (Sao Paulo). 2012;10(4):442–448.
- , , . Changing cardiac arrest and hospital mortality rates through a medical emergency team takes time and constant review. Crit Care Med. 2010;38(2):445–450.
- , , , , , . Reducing in‐hospital cardiac arrests and hospital mortality by introducing a medical emergency team. Intensive Care Med. 2010;36(1):100–106.
- , , , et al. Rescue me: saving the vulnerable non‐ICU patient population. Jt Comm J Qual Patient Saf. 2009;35(4):199–205.
- , , , , , . Effects of a medical emergency team on reduction of incidence of and mortality from unexpected cardiac arrests in hospital: preliminary study. BMJ. 2002;324(7334):387–390.
- , , , , , . Hospital‐wide code rates and mortality before and after implementation of a rapid response team. JAMA. 2008;300(21):2506–2513.
- , , , . Introduction of a rapid response system at a United States veterans affairs hospital reduced cardiac arrests. Anesth Analg. 2010;111(3):679–686.
- , , , et al. Early impact of medical emergency team implementation in a country with limited medical resources: a before‐and‐after study. J Crit Care. 2011;26(4):373–378.
- , , , , , . Effect of a rapid response team on patient outcomes in a community‐based teaching hospital. J Grad Med Educ. 2014;6(1):61–64.
- , , . Abnormal vital signs are associated with an increased risk for critical events in US veteran inpatients. Resuscitation. 2009;80(11):1264–1269.
- , , , et al. A randomized trial of real‐time automated clinical deterioration alerts sent to a rapid response team. J Hosp Med. 2014;9(7):424–429.
- , , , , , . Early detection of impending physiologic deterioration among patients who are not in intensive care: development of predictive models using data from an automated electronic medical record. J Hosp Med. 2012;7(5):388–395.
- , , , . Adverse outcomes associated with delayed intensive care unit transfers in an integrated healthcare system. J Hosp Med. 2012;7(3):224–230.
- , , , , , . The impact of rapid response team on outcome of patients transferred from the ward to the ICU: a single‐center study. Crit Care Med. 2013;41(10):2284–2291.
- , , . Trends in inpatient hospital deaths: National Hospital Discharge Survey, 2000–2010. NCHS Data Brief. 2013(118):1–8.
- , , . Epidemiology and outcomes of in‐hospital cardiopulmonary resuscitation in the United States, 2000–2009. Resuscitation. 2013;84(9):1255–1260.
In 2004, the Institute for Healthcare Improvement (IHI) launched its 100,000 Lives Campaign, a national initiative with a goal of saving 100,000 lives among hospitalized patients through improvements in the safety and effectiveness of healthcare.[1] One of their recommended strategies to reduce preventable inpatient deaths was for hospitals to establish rapid response teams (RRTs).[2, 3] The goal of RRTs, also termed medical emergency teams (METs), is to identify patients at risk for rapid decline in condition and intervene prior to a catastrophic event such as cardiopulmonary arrest.[4] The basis for recommending RRT/METs was evidence of predictable warning signs occurring in patients prior to cardiopulmonary arrest that could alert physicians.[5] A pilot study by the IHI, including 8 hospitals in the United States and the United Kingdom, found reductions in code calls after implementing RRTs, with 2 hospitals also showing a reduction in mortality.[3]
In response to the IHI report, many hospitals established RRT/METs.[6] Proponents for RRT/METs argued that the potential benefit justified immediate implementation, whereas others advocated for further research.[6] Despite the rapid, widespread adoption of RRT/METs, questions remain regarding their effectiveness in reducing hospital mortality and nonintensive care unit (ICU) cardiopulmonary arrests.[6, 7] In 2010, Chan et al. reported the results of a meta‐analysis of studies published through 2008 that demonstrated a reduction in cardiac arrests, but not mortality, following the implementation of RRTs.[8] An updated systematic review, including studies published through 2012, suggested that RRTs are associated with reduced non‐ICU cardiac arrest and reduced mortality.[9]
Since the publication of the Winters et al. systematic review, several new studies have been published.[9, 10, 11, 12] We performed a systematic review and meta‐analysis including studies published through 2014 to examine the impact of RRT/METs on hospital mortality and in‐hospital cardiopulmonary arrest (IHCA).
METHODS
Search Methods
We conducted a systematic search of publications on RRTs using PubMed (19462014), Cumulative Index to Nursing and Allied Health Literature (19372014), and the Cochrane Library (issue 10 of 12, 2014). The search used no language restrictions and no limits. Medical Subject Headings with keywords in a Boolean search strategy were employed. The major themes used were cardiopulmonary arrest and rapid response teams.
Study Eligibility Criteria
Prespecified criteria for determining study eligibility included: before‐after studies, cohort studies, nonrandomized control studies, or cluster randomized controlled trials (RCTs); implementation of an RRT and/or a MET as the intervention; adults (based on individual study definition) hospitalized in a non‐ICU setting; reported 1 or both prespecified outcomes, hospital mortality, or IHCA. There were no exclusion criteria or language restrictions.
Data Extraction
We prospectively outlined a standard protocol that included the research question, inclusion/exclusion criteria, as well as our outcomes and search approaches. We used standard methodology for analysis in accordance with the guidelines in Cochrane Handbook for Systematic Reviews of Interventions.[13] The protocol can be obtained by request to the authors. All changes to our original protocol were recorded in a protocol amendments table.
The studies identified underwent title and abstract screening by 1 of 2 reviewers (G.S.C., R.S.S.). After irrelevant studies were removed, reviewers independently assessed the remaining studies for eligibility based on full‐text review. All disagreements were resolved with consensus and the help of a third reviewer (D.C.B.).
Prior to extracting data, a piloted standardized data‐collection form was created. Eligible studies were independently reviewed by each of the 2 reviewers, and the relevant data extracted. Conflicts between the reviewers regarding the data collected for a given study were resolved by a third reviewer. The essential data were total events (hospital deaths and IHCA) and total hospital admissions.
Assessment of Methodological Quality
We utilized design‐specific tools to assess the methodological quality of included studies. For nonrandomized control and cohort studies, we used the Newcastle Ottawa Scale. This allowed us to evaluate the representativeness of the intervention cohort, selection of the nonintervention cohort, ascertainment of the intervention, whether or not the outcome was present at the start of the study, comparability of cohorts, assessment of the outcome, and whether there was adequate follow‐up.[14] We assigned stars as a measure of rating for each category and tallied the number of stars to assess the methodological quality. The maximum score was 9.[14]
For before‐after studies, an assessment scale developed by the ECRI (Emergency Care Research Institute) to test the internal validity of each study was utilized.[15] The ECRI Before‐After Scale allowed us to evaluate if the study was prospective, inclusion and exclusion criteria were established a priori, consecutive patients were enrolled, the same initial/subsequent treatment was administered, outcomes were objectively measured, follow‐up was complete, cohorts were comparable, there were no conflicts of interest, and conclusions were supported by data.[15] We ascertained whether each criterion was met and converted answers to numerical scores. A yes was scored 1, a no was scored 1, and no response was scored 0.5. The sum of these scores was then added to 11, divided by 22, and multiplied by 10 to yield the total quality score. The summary score can range from 0 to 10. A total score <5 was considered unacceptable quality. A score 5 but <7.5 was considered low quality, and a total 7.5 was considered moderate quality.[15]
To assess the methodological quality of RCTs, we used the Cochrane Risk of Bias Tool.[13] The tool involves determining whether a study has a high, low, or unclear risk of bias for specific criteria.[13]
Two independent reviewers evaluated the studies using these scales, and discrepancies were resolved by discussion.
Data Analysis
Measure of Treatment Effect
We used relative risk (RR) to summarize outcome data for our prespecified outcomes: hospital mortality and IHCA.
Dealing With Missing Data
If essential data were missing, study authors were contacted. If we did not receive a response, we calculated total events (deaths and IHCAs) using total admissions and event rates per admissions. If total admissions and/or event rates were missing, studies were not included in the analysis.
Data Synthesis
We used Review Manager 5.3 to calculate pooled summary estimates.[16] Meta‐analyses for each outcome were conducted by means of a random effects model.
Assessment of Heterogeneity
To assess for heterogeneity, we calculated I2 and P values. If the I2< 0.50 or the P > 0.10, then the test for heterogeneity was passed. If heterogeneity was present, we evaluated each study in an effort to identify outliers. If an outlier was identified, the study was removed from the analysis.
Assessment of Reporting Bias
To assess publication bias, we used a funnel plot of the primary outcome. The findings were arranged by study size and effect size, and the plot was assessed for symmetry.
Subgroup Analyses
Subgroup analyses were performed for study type, RRT/MET composition, and publication year. Study type was grouped by cluster RCT and nonrandomized studies versus cohort/before‐after studies. Team composition was grouped by whether or not there was a physician on the RRT/MET. Publication year was grouped by studies published before or after 2010.
Sensitivity Analysis
We conducted sensitivity analyses to evaluate the impact of methodological quality on summary estimates. We compared overall summary estimates to summary estimates based only on before‐after studies judged to be low risk for bias. We also conducted an analysis to evaluate the inclusion of studies in which total events were calculated from rates and total admissions. We compared the overall summary estimates to summary estimates based on studies in which we were able to obtain essential data.
RESULTS
Description of Studies
Our search identified 691 studies, of which 90 were duplicates. The remaining studies were screened by title and abstract, identifying 82 potentially eligible studies, of which 30 studies were identified as eligible for inclusion in the meta‐analysis (Figure 1).
Of the 30 eligible studies, 10 were excluded from pooled estimates for hospital mortality,[7, 17, 18, 19, 20, 21, 22, 23, 24, 25, 26, 27, 28] and 10 were excluded from pooled estimates for IHCA due to missing data.[17, 18, 20, 21, 22, 23, 24, 25, 26, 27, 29, 30] For the analysis, 20 studies were included for the hospital mortality analysis and 20 studies were included for the IHCA analysis. The 22 studies included in either or both analyses spanned the years 2000 to 2014. The characteristics of the included studies are summarized in Table 1.
| Author/Year | Study Design | Setting/Location | Subjects (No.) | Age, y | Description of Intervention | Description of Control | Duration of Study | Outcome(s) of Interest |
|---|---|---|---|---|---|---|---|---|
| ||||||||
| Al‐Qahtani, 2013[10] | Before‐after | Saudi Arabia (tertiary care academic center) | Before: 157,804; after: 98,391 | Before: 59.2 19.2; after: 59 19.0 | RRT Implementation | Before RRT implementation | 5 years (January 2006December 2010) | IH mortality, IHCA, ward mortality |
| Bader, 2009[37] | Before‐after | USA (community acute care hospital) | Before: 15,949; after: 16,907 | N/R | RRT Implementation | Before RRT implementation | 3 years (October 2005June 2008) | IHCA, code mortality, ICU transfer |
| Beitler, 2011[31] | Before‐after | USA (tertiary referral public teaching hospital) | Before: 77,021; after: 79,013 | Pre‐RRT: 40.9 (22.3); post‐RRT: 42.0 (22.2) | RRT implementation | Before RRT implementation | 5 years (20032008) | IHCA mortality, IHCA, out‐of‐ICU mortality, IH mortality |
| Bellomo, 2003[32] | Before‐after | Australia (tertiary referral hospital) | Before: 21,090; after: 20,921 | Before: 60.7; after: 60.2 | MET implementation | Before MET implementation | 8 months (before: May 1999August 1999; after: November 2000February 2001) | IHCA, CA‐related mortality, IH mortality |
| Bristow, 2000[33] | Nonrandomized controlled | Australia (3 public hospitals) | 50,942 | NR | Hospitals with MET | Hospitals without MET (with conventional CA teams) | 5 months (2006) | IHCA, IH mortality |
| Buist, 2002[38] | Before‐after | Australia (tertiary referral teaching hospital) | Before: 25,254; after: 28,801 | Before: 36.6 (26.0); after: 36.4 (26.0) | MET implementation | Before MET implementation | 3 years (19961999) | Incidence and outcome of unexpected IHCA |
| Chan, 2008[39] | Prospective cohort | USA (tertiary care academic hospital) | Before: 24,193; after: 24,978 | Before: 56.8 (13.6) in 2004; 56.5 (13.8) in 2005; after: 57.0 (13.9) in 2006; 57.1 (13.8) in 2007 | RRT implementation | Standard care | 3.5 years (20042007) | IHCA, IH mortality |
| Chen, 2014[11] | Nonrandomized controlled | Australia (teaching hospital) | Before: 1,088,491; after: 479,194 | NR | Teaching hospital with a mature RRS | Three teaching hospitals without RRS | 8 years (20022009) | IHCA, IHCA mortality, IH mortality |
| Goncales, 2012[34] | Before‐after | Brazil (high complexity general hospital) | Before: 40,033; after: 42,796 | Before: 73; after: 68 | Implementation of RRT called Code Yellow | Before Implementation of RRTCode Blue | 3 years (20052008) | IHCA, IHCA mortality, IH mortality |
| Hatler, 2009[19] | Before‐after | USA (tertiary care hospital) | Before: 24,739; after: 25,470 | N/R | RRT implementation | Before RRT implementation | 2 years (20052007) | IHCA |
| Hillman, 2005[20] | Cluster RCT | Australia (23 hospitals) | Control hospitals: 56.756; MET hospitals: 68,376 | Control hospitals: 56.9; MET hospitals: 55.4 | MET implementation | Care as usual | 6 months | IH Mortality, IHCA |
| Jones, 2005[7] | Before‐after | Australia (tertiary care teaching hospital) | Before: 16,246; after: 104,001 | Before: 73.4; after: 70.8 | MET implementation | Before MET implementation | 5 years (19992004) | IHCA, death following cardiac arrest |
| Jones, 2007[29] | Before‐after | Australia (teaching hospital) | Before: 25,334; after: 100,243 | N/R | MET implementation | Before MET implementation | 6 years (19982004) | Surgical and medical mortality |
| Kenward, 2004[22] | Before‐after | UK (general hospital) | Before: 53,500; after: 53,500 | Before: N/R; after: 73 | MET implementation | Before MET implementation | 1 year (20002001) | IH mortality, IHCA |
| Konrad, 2010[36] | Before‐after | Sweden (tertiary care center) | Before: 203,892; after 73,825 | Before: 53.1; after: 52.4 | MET implementation | Before MET implementation | 6 years (20002006) | IH mortality, IHCA |
| Lighthall, 2010[40] | Before‐after | USA (university affiliated VA hospital) | Before: 2,975; after: 9,077 | Before: 65.26; after: 65.56 | RRT implementation | Before RRT implementation | 3 years (20042007) | IH mortality, IHCA |
| Lim, 2011[41] | Before‐after | South Korea (Samsung Medical Center) | Before: 33,360; after: 34,699 | Before: 64; after: 59 | MET implementation | Before MET implementation | 1 year (20082009) | IH mortality, IHCA, unexpected ICU transfers |
| Moroseos, 2014[12] | Before‐after | USA (teaching hospital) | Before: 7,092; after: 9,357 | Before: 30.1; after: 30.9 | Teaching hospital after RRT implementation | Teaching hospital before RRT implementation | 10 years (before: January 2000December 2004; after: January 2007December 2011) | IH mortality, IHCA, unexpected ICU transfers |
| Salvatierra, 2014[30] | Observational cohort | USA (10 tertiary care hospitals) | Before: 235,718; after: 235,344 | N/R | RRT implementation | Before RRT implementation | 62 months (September 2001December 2009) | IH mortality |
| Santamaria, 2010[35] | Before‐after | Australia (teaching hospital) | Before (IH mortality): 22,698; before (IHCA): 8,190 after (IH mortality): 74,616; after (IHCA): 81,628 | Median: 5860 (19932007) | RRT implementation | Before RRT implementation | 14 years (19932007) | IH mortality, IHCA |
| Segon, 2014[42] | Before‐after | USA (teaching hospital) | Before: 14,013; after: 14,333 | N/R | RRT implementation | Before RRT implementation | 2 years (January 2004April 2006) | IH mortality, unexpected ICU transfer, IHCA, ICU length of stay |
| Shah, 2011[28] | Retrospective cohort | USA (teaching hospital) | Before: 16,244; after: 45,145 | N/R | RRT implementation | Before RRT implementation | 3 years (20052008) | IHCA, IH mortality, unplanned ICU transfers |
Methodological Quality
The methodological quality of the 4 cohort studies, based on the New Castle Ottawa Scale, was either 8 or 9 stars. Using the ECRI Before‐After Scale, the average quality score of the 17 included before‐after studies was 8.41 (range, 7.279.32). Included before‐after studies were of moderate quality, with the exception of 1 of lower quality. The cluster RCT had low risk of bias for random sequence generation, allocation concealment, blinding of participants/personnel, and incomplete outcome data; however, it had unclear risk of bias for blinding of outcome assessment, selective reporting, and sources of bias due to lack of reporting.[20] Overall, the 22 studies included ranged from moderate to good quality.
Effect of RRT on Hospital Mortality
Of the 20 studies that reported hospital mortality, 9 favored RRT/METs,[10, 11, 30, 31, 32, 33, 34, 35, 36] 10 found no difference with RRT/METs,[12, 20, 22, 28, 37, 38, 39, 40, 41, 42] and 1 favored RRT/METs for surgical patients while favoring usual care (no RRT/MET) for medical patients[29] (Figure 2a). The pooled analysis demonstrated that implementation of RRT/METs was associated with a significant reduction in hospital mortality (RR = 0.88, 95% confidence interval [CI]: 0.83‐0.93). There was heterogeneity among the contributing studies (I2 = 86%).
Effect of RRT on IHCA
Of the 20 studies that reported rates of IHCA, 12 favored RRT/METs [7, 10, 11, 12, 31, 32, 34, 35, 36, 37, 38, 39] and 8 found no difference with RRT/METs[16, 19, 20, 22, 28, 33, 40, 41, 42] (Figure 2b). In the pooled analysis, RRT/METs were associated with a significant reduction in IHCA (RR = 0.62, 95% CI: 0.55‐0.69). There was moderate heterogeneity among the studies (I2 = 71%).
Subgroup Analysis
Study Type
For hospital mortality, there was 1 cluster RCT and 2 nonrandomized studies[11, 20, 33] (RR = 0.83, 95% CI: 0.80‐0.87) and 17 cohort/before‐after studies[10, 12, 22, 28, 29, 30, 31, 32, 34, 35, 36, 37, 38, 39, 40, 41, 42] (RR = 0.89, 95% CI: 0.83‐0.96). The cluster RCT and non‐randomized studies had minimal heterogeneity (I2 = 7%), and the cohort/before‐after studies exhibited substantial heterogeneity (I2 = 88%). The test for subgroup differences (I2 = 54.7%) indicates that study type may have an impact on hospital mortality.
For IHCA, there was 1 cluster RCT and 2 nonrandomized studies[11, 20, 33] (RR = 0.68, 95% CI: 0.52‐0.88) and 17 before‐after studies[7, 10, 12, 19, 22, 28, 31, 32, 34, 35, 36, 37, 38, 39, 40, 41, 42] (RR = 0.60, 95% CI: 0.52‐0.69). The cluster RCT and nonrandomized studies had substantial heterogeneity (I2 = 79%), whereas the cohort/before‐after studies had moderate heterogeneity (I2 = 69%). The test for subgroup differences (I2 = 0%) indicates that study type had no impact on IHCA.
RRT/MET Team Composition
For hospital mortality, there were 14 studies[10, 20, 29, 31, 32, 33, 34, 35, 36, 37, 38, 40, 41, 42] of RRTs with physicians (RR = 0.88, 95% CI: 0.82‐0.95) and 4 studies[12, 28, 30, 39] without physicians (RR = 0.85, 95% CI: 0.74‐0.99). Both groups exhibited substantial heterogeneity (I2 = 85% for both). The test for subgroup differences (I2 = 0%) indicates that team composition had no impact on hospital mortality.
Similarly, for IHCA there were 14 studies[7, 10, 20, 31, 32, 33, 34, 35, 36, 37, 38, 40, 41, 42] of RRTs with physicians (RR = 0.61, 95% CI: 0.54‐0.69) and 4 studies[12, 19, 28, 39] without (RR = 0.60, 95% CI: 0.39‐0.92). The studies with physicians on the RRT had moderate heterogeneity (I2 = 55%), whereas studies without a physician on the RRT had substantial heterogeneity (I2 = 81%). The test for subgroup differences (I2 = 0%) indicates that team composition had no impact on IHCA.
Publication Year
Publication year had no impact on hospital mortality. Studies published 2010 or earlier had an RR of 0.88 (95% CI: 0.80‐0.97), whereas studies published after 2010 had an RR of 0.87 (95% CI: 0.83‐0.92). Both groups had substantial heterogeneity (I2 of 88% and 75%, respectively). The test for subgroup differences (I2 = 0%) indicates publication year had no impact on hospital mortality.
Publication year had no impact on IHCA. Studies published in 2010 or earlier had an RR of 0.63 (95% CI: 0.54‐0.73), whereas studies published after 2010 had an RR of 0.60 (95% CI: 0.50‐0.72). The 2010 or earlier group had moderate heterogeneity (I2 = 60%), whereas the post‐2010 group had substantial heterogeneity (I2 = 77%). The test for subgroup differences (I2 = 0%) indicates that publication year had no impact on IHCA.
Sensitivity Analysis
A sensitivity analysis was performed excluding studies with low methodological quality from the analysis. For hospital mortality there were no studies of low methodological quality. For IHCA there was no major change in the summary estimate or the heterogeneity (RR = 0.59, 95% CI: 0.53‐0.67, I2 = 66%).
A sensitivity analysis was performed excluding studies only reporting rates and/or average annual admissions from the analysis. For hospital mortality, there was no major change in the summary estimate or the heterogeneity (RR = 0.87, 95% CI: 0.82‐0.93, I2 = 87%). For IHCA there was no major change in the summary estimate, but there was a decrease in heterogeneity (RR = 0.59, 95% CI: 0.53‐0.66, I2 = 63%).
Publication Bias
Funnel plots generated for the effect of RRTs on hospital mortality and on IHCA did not indicate publication bias. Our search of
DISCUSSION
We found implementation of RRT/METs was associated with reductions in hospital mortality and IHCA. Our analysis extends the meta‐analysis of Chan et al. and is consistent with the recent systematic review by Winters et al.[8, 9] These findings provide support for the IHI recommendation that hospitals implement RRT/METs.[1]
Following the 2004 IHI recommendations, RRT/METs were widely implemented, with over 50% of hospitals having some form of RRT by 2010.[6] The adoption of RRT/METs occurred despite limited evidence on the effectiveness of RRT/METs. A meta‐analysis of studies published through 2008 demonstrated a reduction in cardiac arrests, but no reduction in mortality after implementation of RRT/METs.[8] More recently a systematic review that included studies through 2012 suggested that RRT/METs are associated with reduced IHCA and reduced mortality.[9] Our analysis addressed the conflicting results of the prior reviews and included 13 studies published after the Chan et al. meta‐analysis and several studies published after the Winters et al. systemic review.[8, 9] The studies included in our analysis were completed in hospitals across multiple countries and settings, increasing the generalizability of the results. Most studies were performed in teaching hospitals; thus, the results may not be as applicable to community hospitals.
We found publication year did not impact either outcome. However, this may reflect our use of 2 broad publication periods rather than smaller periods, as 5 of the 6 newly included studies favor RRT interventions. Additionally, if the studies missing data had been included in our analysis, they may have shown that publication year impacts the outcomes. We noted that a physician on a RRT/MET did not affect outcomes, contrary to suggestions by Winters et al.[9] This may reflect the skill of nonphysician providers and/or the collaboration of the RRT/MET with critical care teams. However, very few RRTs did not include a physician, limiting the conclusion that can be drawn regarding team composition.
Many patients exhibit observable clinical deterioration or measurable changes that could identify them prior to an event such as cardiac arrest.[5, 43] Measurable physiologic parameters, in fact, are the basis of medical early warning systems and recent automated systems.[44, 45] Similarly, delayed transfer to the ICU has been shown to be associated with increased mortality.[46] Therefore, RRTs, either by identifying patients at risk for clinical deterioration and/or facilitating transfer of patients to the ICU earlier, could result in improved clinical outcomes. We did not specifically look at ICU transfer or ICU codes in our analysis. However, in a recent single‐center before‐after study, RRT implementation increased ICU admission rates and the transfer of less severely ill patients to the ICU without improvement in severity of illness‐adjusted outcomes.[47] This finding may reflect the ICU organization of the particular institution; however, given limited ICU resources, admitting an increased number of less severely ill patients without clear clinical benefit is a potential concern. More studies are needed to better understand the mechanism of benefit as well as potential trade‐offs associated with RRT implementation. It is possible that institutional factors determine the benefit that can be achieved through RRTs.
Our study has several limitations. Although the methodological quality of the included studies was moderate to good, confounding and biases can be an issue with before‐after trials and cohort studies. Most studies were before‐after observational trials, lacking a concurrent control group making it difficult to draw causal relationships. This is particularly the case for hospital mortality, which has been independently falling since 2000.[48] Thus, changes in observed hospital mortality may simply reflect the general trend independent of the RRT intervention. However, this does not appear the case for cardiopulmonary arrest, which has been increasing in incidence since 2000.[49] There were several studies eligible for inclusion in our analysis, but could not be included because of insufficient data. It is possible that the inclusion of these studies could influence the results of our analysis. Finally, there was heterogeneity among the studies for both outcomes, particularly in‐hospital mortality. This likely reflects variations in hospital characteristics and case‐mix indices. There may also be other factors impacting teams such as how hospitals handled deteriorating patients before RRT implementation, education periods, and differing mechanisms and criteria for RRT activation.
In conclusion, RRT/METs are effective in decreasing both IHCA and hospital mortality. Our findings support the 2004 IHI recommendations for the implementation of RRTs in hospitals. Additional studies are still required to explore team composition, activation criteria, activation mechanism, and implementation strategies.
- , , , . The 100,000 lives campaign: setting a goal and a deadline for improving health care quality. JAMA. 2006;295(3):324–327.
- Institute for Healthcare Improvement. Overview of the 100,000 Lives Campaign. Available at: https://www.ihi.org/Engage/Initiatives/Completed/5MillionLivesCampaign/Documents/Overview%20of%20 the%20100K%20Campaign.pdf. Accessed September 18, 2014.
- , , . Reducing Hospital Mortality Rates (Part 2). IHI Innovation Series white paper. Cambridge, MA: Institute for Healthcare Improvement; 2005.
- , . Developing strategies to prevent inhospital cardiac arrest: analyzing responses of physicians and nurses in the hours before the event. Crit Care Med. 1994;22(2):244–247.
- , , , et al. Duration of life‐threatening antecedents prior to intensive care admission. Intensive Care Med. 2002;28(11):1629–1634.
- , , . The tension between needing to improve care and knowing how to do it. N Engl J Med. 2007;357(6):608–613.
- , , , et al. Long term effect of a medical emergency team on cardiac arrests in a teaching hospital. Crit Care. 2005;9(6):R808–R815.
- , , , , . Rapid response teams: a systematic review and meta‐analysis. Arch Intern Med. 2010;170(1):18–26.
- , , , , , . Rapid‐response systems as a patient safety strategy: a systematic review. Ann Intern Med. 2013;158(5 pt 2):417–425.
- , , , et al. Impact of an intensivist‐led multidisciplinary extended rapid response team on hospital‐wide cardiopulmonary arrests and mortality. Crit Care Med. 2013;41(2):506–517.
- , , , et al. The impact of implementing a rapid response system: a comparison of cardiopulmonary arrests and mortality among four teaching hospitals in Australia. Resuscitation. 2014;85(9):1275–1281.
- , , , et al. Rapid response team implementation on a burn surgery/acute care ward. J Burn Care Res. 2014;35(1):21–27.
- Higgins J, Green S, eds. Cochrane Handbook for Systematic Reviews of Interventions. Version 5.1.0. Oxford, United Kingdom: The Cochrane Collaboration; 2011: Available at: http://www.cochrane‐handbook.org. Accessed October 9, 2014.
- , , , et al. The Newcastle‐Ottawa Scale (NOS) for Assessing The Quality of Nonrandomised Studies in Meta‐analyses. Ottawa, Canada: Ottawa Hospital Research Institute; 2014.
- Agency for Healthcare Research and Quality. Remote cardiac monitoring: a systematic review. Available at: http://www.cms.gov/determinationprocess/downloads/id51ta.pdf. Published December 12, 2007.
- Review Manager (RevMan) [computer program]. Version 5.3. Copenhagen, the Netherlands: The Nordic Cochrane Centre, The Cochrane Collaboration; 2014.
- , , . Implementing a rapid‐response team using a nurse‐to‐nurse consult approach. J Vasc Nurs. 2008;26(2):37–42.
- , , , et al. The effect of a rapid response team on major clinical outcome measures in a community hospital. Crit Care Med. 2007;35(9):2076–2082.
- , , , et al. Implementing a rapid response team to decrease emergencies outside the ICU: one hospital's experience. Medsurg Nurs. 2009;18(2):84–90, 126.
- , , , et al. Introduction of the medical emergency team (MET) system: a cluster‐randomised controlled trial. Lancet. 2005;365(9477):2091–2097.
- , , , , . Rapid response teams: do they make a difference? Dimens Crit Care Nurs. 2007;26(6):253–260; quiz 261–262.
- , , , . Evaluation of a medical emergency team one year after implementation. Resuscitation. 2004;61(3):257–263.
- , , , . Improving patient safety to reduce preventable deaths: the case of a California safety net hospital. J Healthc Qual. 2012;34(2):64–76.
- , . Implementation and outcomes of a rapid response team. J Nurs Care Qual. 2007;22(4):307–313, quiz 314–315.
- , , . Implementation of a rapid response team decreases cardiac arrest outside of the intensive care unit. J Trauma. 2007;62(5):1223–1227; discussion 1227–1228.
- , , , et al. Introducing Critical Care Outreach: a ward‐randomised trial of phased introduction in a general hospital. Intensive Care Med. 2004;30(7):1398–1404.
- , , , , . Four years' experience with a hospitalist‐led medical emergency team: an interrupted time series. J Hosp Med. 2012;7(2):98–103.
- , , , . Rapid response team in an academic institution: does it make a difference? Chest. 2011;139(6):1361–1367.
- , , , et al. Long‐term effect of a medical emergency team on mortality in a teaching hospital. Resuscitation. 2007;74(2):235–241.
- , , , , . Rapid response team implementation and in‐hospital mortality*. Crit Care Med. 2014;42(9):2001–2006.
- , , , , . Reduction in hospital‐wide mortality after implementation of a rapid response team: a long‐term cohort study. Crit Care. 2011;15(6):R269.
- , , , et al. A prospective before‐and‐after trial of a medical emergency team. Med J Aust. 2003;179(6):283–287.
- , , , et al. Rates of in‐hospital arrests, deaths and intensive care admissions: the effect of a medical emergency team. Med J Aust. 2000;173(5):236–240.
- , , , et al. Reduced frequency of cardiopulmonary arrests by rapid response teams. Einstein (Sao Paulo). 2012;10(4):442–448.
- , , . Changing cardiac arrest and hospital mortality rates through a medical emergency team takes time and constant review. Crit Care Med. 2010;38(2):445–450.
- , , , , , . Reducing in‐hospital cardiac arrests and hospital mortality by introducing a medical emergency team. Intensive Care Med. 2010;36(1):100–106.
- , , , et al. Rescue me: saving the vulnerable non‐ICU patient population. Jt Comm J Qual Patient Saf. 2009;35(4):199–205.
- , , , , , . Effects of a medical emergency team on reduction of incidence of and mortality from unexpected cardiac arrests in hospital: preliminary study. BMJ. 2002;324(7334):387–390.
- , , , , , . Hospital‐wide code rates and mortality before and after implementation of a rapid response team. JAMA. 2008;300(21):2506–2513.
- , , , . Introduction of a rapid response system at a United States veterans affairs hospital reduced cardiac arrests. Anesth Analg. 2010;111(3):679–686.
- , , , et al. Early impact of medical emergency team implementation in a country with limited medical resources: a before‐and‐after study. J Crit Care. 2011;26(4):373–378.
- , , , , , . Effect of a rapid response team on patient outcomes in a community‐based teaching hospital. J Grad Med Educ. 2014;6(1):61–64.
- , , . Abnormal vital signs are associated with an increased risk for critical events in US veteran inpatients. Resuscitation. 2009;80(11):1264–1269.
- , , , et al. A randomized trial of real‐time automated clinical deterioration alerts sent to a rapid response team. J Hosp Med. 2014;9(7):424–429.
- , , , , , . Early detection of impending physiologic deterioration among patients who are not in intensive care: development of predictive models using data from an automated electronic medical record. J Hosp Med. 2012;7(5):388–395.
- , , , . Adverse outcomes associated with delayed intensive care unit transfers in an integrated healthcare system. J Hosp Med. 2012;7(3):224–230.
- , , , , , . The impact of rapid response team on outcome of patients transferred from the ward to the ICU: a single‐center study. Crit Care Med. 2013;41(10):2284–2291.
- , , . Trends in inpatient hospital deaths: National Hospital Discharge Survey, 2000–2010. NCHS Data Brief. 2013(118):1–8.
- , , . Epidemiology and outcomes of in‐hospital cardiopulmonary resuscitation in the United States, 2000–2009. Resuscitation. 2013;84(9):1255–1260.