User login
Limited benefits of early gestational diabetes screening
Screening pregnant women with obesity for gestational diabetes before 20 weeks of pregnancy did not lead to any improved maternal or neonatal outcomes compared with doing routine screening between 24 and 28 weeks, according to research presented Feb. 4 at the Pregnancy Meeting sponsored by the Society for Maternal-Fetal Medicine.
“There is increasing evidence that early screening does not reduce the risk of adverse perinatal outcomes,” Jennifer Thompson, MD, associate professor of ob.gyn. at Vanderbilt University, Nashville, Tenn., said in an interview. “The increasing number of studies that have demonstrated no benefit in reducing adverse perinatal outcomes leads to consideration to revise recommendations for early screening.”
However, she did note that early screening may be helpful in identifying patients with undiagnosed preexisting diabetes.
Michael Richley, MD, a maternal-fetal medicine fellow at the University of California, Los Angeles, said catching those previously undiagnosed cases is one of the goals of earlier screening with the expectation that earlier management will lead to better outcomes.
“If a patient then obtains the diagnosis of type 2 diabetes, introducing nutritional counseling and possible medical management early can lead to better outcomes,” said Dr. Richley, who attended the presentation but was not involved in the research. ”While catching undiagnosed type 2 diabetes is not common, it is becoming increasingly common lately.”
Obesity is a known risk factor for impaired glucose metabolism and for gestational diabetes, explained presenter Christopher A. Enakpene, MD, an ob.gyn. from Midland, Tex., who completed the study while completing his maternal-fetal medicine fellowship at the University of Illinois in Chicago. Dr. Enakpene reminded attendees that the American College of Obstetricians and Gynecologists (ACOG) currently recommends early screening for gestational diabetes in patients with certain risk factors, including obesity, a history of first-degree relatives with diabetes, or a history of gestational diabetes, impaired glucose tolerance, poor pregnancy outcomes, fetal demise, congenital abnormalities, or birth of an infant large for gestational age.
The researchers screened 7,126 patients for enrollment in the study from March 2017 through February 2019 and identified 600 who met the criteria: An adult with a singleton pregnancy and body mass index (BMI) of at least 30 kg/m2. Patients were excluded if they had preexisting diabetes, elevated blood glucose or impaired glucose tolerance, a history of gestational diabetes, any chromosomal anomalies or abnormalities in the pregnancy, or were past 20 weeks of pregnancy.
The prospective randomized controlled trial was open label and included 296 patients who were randomly assigned to early screening with a 1-hour glucose challenge test (GCT) and hemoglobin A1c before 20 weeks, followed by a 3-hour oral glucose tolerance test if the GCT result was between 140 and 200 mg/dL with an HbA1c of less than 6.5%. The other 304 patients were screened with a 1-hour GCT between 24 and 28 weeks but also had an HbA1c test before 20 weeks.
The primary outcome was macrosomia, defined as a birth weight at least 4,000 g, with various maternal and neonatal secondary outcomes. The only significant difference between the groups at baseline was a higher proportion of Hispanic participants in the early screening group (22.4%) compared to the routine screening group (13.7%).
The groups had no significant differences in birth weight or macrosomia, which occurred in 2.8% of the early screening group and 3.4% of the routine screening group (P = .7). There were no significant differences in gestational age at delivery, preeclampsia, polyhydramnios, shoulder dystocia, cesarean delivery, or NICU admission. However, the rate of gestational diabetes was significantly higher in the early screening group (22.5%) than in the routine screening group (15.7%; P < .05). In addition, more participants with gestational diabetes in the early screening group used insulin (34.4%) compared with those in the routine screening group (15.6%; P < .05).
Dr. Enakpene noted several reasons that the perinatal outcomes may have been similar between the groups, such as the increased rate of gestational diabetes requiring treatment in the early screening group or a higher proportion of participants using insulin in the early screening group.
“Hence, the similarity in adverse perinatal outcomes between the groups despite a higher proportion of gestational diabetes in the early group might be due to more utilization of insulin,” Dr. Enakpene said.
Dr. Richley was not surprised by the findings and hypothesized that the reason for not seeing a difference in outcomes might relate to using a 20-week cutoff for testing when type 2 diabetes would be evident at any stage of pregnancy.
“It would be interesting to have a study look at diabetes testing exclusively in the first trimester for high-risk patients that looks at neonatal outcomes and see if that would show a difference between the two groups,” Dr. Richley said.
Dr. Thompson was similarly interested in whether 20 weeks was an early enough time for early screening.
”I would also like to know the differences in management between the two groups and if the knowledge of early diagnosis impacted their management, such as timing of medication start, amount of medication required, and how that differed from the standard group,” Dr. Thompson said. ”Since patients with a hemoglobin A1c > 6.5% or glucose tolerance test > 200 [mg/dL] were excluded, I’m interested in the number of patients that were excluded since they likely have undiagnosed preexisting diabetes, which are the patients that may benefit most from early screening.”
Dr. Richley pointed out that the potential clinical implications of the study are limited right now.
“While their secondary outcomes of neonatal hypoglycemia, method of delivery, and other common obstetrical measures were not different, we cannot draw conclusions from this as the study was not powered to evaluate these findings,” Dr. Richley said. “I do still see a role in early screening for patients with risk factors but favor doing so at the first prenatal visit, whenever that is, as opposed to as late as mid-second trimester, though this is often when a patient’s first interaction with a health care system will be within their pregnancy.”
Dr. Enakpene, Dr. Thompson, and Dr. Richley reported no disclosures. External funding for the study was not noted.
FROM THE PREGNANCY MEETING
Eating dinner late ups diabetes risk; melatonin involved
which increase the risk of type 2 diabetes.
And people who are carriers of the G allele of the MTNR1B gene have greater impairment in glucose tolerance after eating a late dinner.
“In natural late eaters [in Spain], we simulated early and late dinner timing by administering a glucose drink and compared effects on blood sugar control over 2 hours,” said senior author Richa Saxena, PhD, a principal investigator at the Center for Genomic Medicine at Massachusetts General Hospital, Boston.
The study also compared outcomes in carriers and noncarriers of the G allele variant of the melatonin receptor gene, Dr. Saxena pointed out in a press release from the hospital.
“We found that late eating disturbed blood sugar control in the whole group,” added lead author Marta Garaulet, PhD.
“This impaired glucose control was predominantly seen in genetic risk variant carriers, representing about half of the cohort,” said Dr. Garaulet, professor of physiology and nutrition, University of Murcia (Spain).
The study results “may be important in the effort toward prevention of type 2 diabetes,” according to co–senior author Frank A.J.L. Scheer, PhD.
“Our findings are applicable to about a third of the population in the industrialized world who consume food close to bedtime, as well as other populations who eat at night, including shift workers, or those experiencing jet lag or night-eating disorders, as well as those who routinely use melatonin supplements close to food intake,” said Dr. Scheer, director of the medical chronobiology program at Brigham and Women’s Hospital, Boston.
The results suggest people should not eat within 2 hours of bedtime, said the researchers.
“Notably, our study does not include patients with diabetes, so additional studies are needed to examine the impact of food timing and its link with melatonin and receptor variation in patients with diabetes,” Dr. Scheer said.
The findings, from the MTNR1B SNP*Food Timing Interaction on Glucose Control (ONTIME-MT) randomized crossover study, were recently published in Diabetes Care.
Melatonin plays a key role in glucose metabolism
Melatonin, a hormone primarily released at night that helps control the sleep-wake cycle, typically rises around 2 hours before bedtime, the researchers explained.
The discovery of MTNR1B as a type 2 diabetes–associated gene “suggests that, beyond sleep and circadian regulation, melatonin plays a key role in glucose metabolism,” they noted. However, whether melatonin improves or impairs glucose control is controversial, and the effect of MTNR1B genotypes on glucose control is not clear.
“We decided to test if late eating that usually occurs with elevated melatonin levels results in disturbed blood sugar control,” Dr. Saxena explained.
To investigate this, researchers enrolled 845 adults in Spain who were 18-70 years old and did not have diabetes. Participants were a mean age of 38 years and 71% were women. They had a mean body mass index of 25.7 kg/m2 and 18% had obesity.
On average, they typically ate dinner at 21:38 (9:38 p.m.) and went to bed at 24:32 (12:32 a.m.).
DNA analysis from participants’ blood samples determined that 50% had the CC genotype of the MTNR1B gene, 40% had the CG genotype, and 10% had the GG genotype.
Each participant underwent two oral glucose tolerance tests. They fasted for 8 hours and then had a 2-hour 75-g oral glucose tolerance test either 1 hour before bedtime (simulating a late dinner) or 4 hours before bedtime (simulating an early dinner). Then they repeated the test at the opposite dinner time on another night.
The average serum melatonin values were 3.5-fold higher after the late dinner than after the early dinner, resulting in 6.7% lower insulin area under the curve and 8.3% higher glucose AUC.
Genotype differences in glucose tolerance were attributed to reductions in beta-cell function.
“Our results confirm that late eating acutely impairs glucose tolerance through a defect in insulin secretion,” the researchers reiterated.
ONTIME-MT was funded by the National Institutes of Health; the Spanish Government of Investigation, Development, and Innovation; and the Seneca Foundation. The researchers reported no relevant financial disclosures.
A version of this article first appeared on Medscape.com.
FROM DIABETES CARE
Does using A1c to diagnose diabetes miss some patients?
The introduction of hemoglobin A1c as an option for diagnosing type 2 diabetes over a decade ago may have resulted in underdiagnosis, new research indicates.
In 2011, the World Health Organization advised that A1c measurement, with a cutoff value of 6.5%, could be used to diagnose diabetes. The American Diabetes Association had issued similar guidance in 2010.
Prior to that time, the less-convenient 2-hour oral glucose tolerance test (OGTT) and fasting blood glucose (FBG) were the only recommended tests. While WHO made no recommendations for interpreting values below 6.5%, the ADA designated 5.7%-6.4% as prediabetes.
The new study, published online in The Lancet Regional Health–Europe, showed that the incidence of type 2 diabetes in Denmark had been increasing prior to the 2012 adoption of A1c as a diagnostic option but declined thereafter. And all-cause mortality among people with type 2 diabetes, which had been dropping, began to increase after that time.
“Our findings suggest that fewer patients have been diagnosed with [type 2 diabetes] since A1c testing was introduced as a convenient diagnostic option. We may thus be missing a group with borderline increased A1c values that is still at high metabolic and cardiovascular risk,” Jakob S. Knudsen, MD, of the department of clinical epidemiology, Aarhus (Denmark) University Hospital, and colleagues wrote.
Therefore, Dr. Knudsen said in an interview, clinicians should “consider testing with FBG or OGTT when presented with borderline A1c values.”
The reason for the increase in mortality after incident type 2 diabetes diagnosis, he said, “is that the patients who would have reduced the average mortality are no longer diagnosed...This does not reflect that we are treating already diagnosed patients any worse, rather some patients are not diagnosed.”
But M. Sue Kirkman, MD, emeritus professor of medicine at the University of North Carolina at Chapel Hill, who was part of the writing group for the 2010 ADA guidelines, isn’t convinced.
“This is an interesting paper, but it is a bit hard to believe that a change in WHO recommendations would have such a large and almost immediate impact on incidence and mortality. It seems likely that ... factors [other] than just the changes in recommendations for the diagnostic test account for these findings,” she said.
Dr. Kirkman pointed to new data just out from the Centers for Disease Control and Prevention on Jan. 26 that don›t show evidence of a higher proportion of people in the United States who have undiagnosed diabetes, “which would be expected if more cases were being ‘missed’ by A1c.”
She added that the CDC incidence data “show a continuing steady rate of decline in incidence that began in 2008, before any organizations recommended using A1c to screen for or diagnose diabetes.” Moreover, “there is evidence that type 2 diabetes incidence has fallen or plateaued in many countries since 2006, well before the WHO recommendation, with most of the studies from developed countries.”
But Dr. Knudsen also cited other data, including a study that showed a drop or stabilization in diagnosed diabetes incidence in high-income countries since 2010.
“That study concluded that the reasons for the declines in the incidence of diagnosed diabetes warrant further investigation with appropriate data sources, which was a main objective of our study,” wrote Dr. Knudsen and coauthors.
Dr. Knudsen said in an interview: “We are not the first to make the point that this sudden change is related to A1c introduction...but we are the first to have the data to clearly show that is the case.”
Diabetes incidence dropped but mortality rose after 2010
The population-based longitudinal study used four Danish medical databases and included 415,553 patients treated for type 2 diabetes for the first time from 1995-2018 and 2,060,279 matched comparators not treated for diabetes.
From 1995 until the 2012 introduction of A1c as a diagnostic option, the annual standardized incidence rates of type 2 diabetes more than doubled, from 193 per 100,000 population to 396 per 100,000 population, at a rate of 4.1% per year.
But from 2011 to 2018, the annual standardized incidence rate declined by 36%, to 253 per 100,000 population, a 5.7% annualized decrease.
The increase prior to 2011 occurred in both men and women and in all age groups, while the subsequent decline was seen primarily in the older age groups. The all-cause mortality risk within the first year after diabetes diagnosis was higher than subsequent 1-year mortality risks and not different between men and women.
From the periods 1995-1997 to 2010-2012, the adjusted mortality rate among those with type 2 diabetes decreased by 44%, from 72 deaths per 1000 person-years to 40 deaths per 1000 person-years (adjusted mortality rate ratio, 0.55). After that low level in 2010-2012, mortality increased by 27% to 48 per 1000 person-years (adjusted mortality rate ratio 0.69, compared with 1995-1997).
The reversed mortality trend after 2010-2012 was caused almost entirely by the increase in the first year after diabetes diagnosis, Dr. Knudsen and colleagues noted.
According to Dr. Kirkman, “A1c is strongly predictive of complications and mortality. That plus its ease of use and the fact that more people may be screened mean it’s still a good option. But for any of these tests, people who are slightly below the cut-point should not be considered normal or low risk.”
Indeed, Dr. Knudsen and colleagues said, “these findings may have implications for clinical practice and suggest that a more multifactorial view of metabolic risk is needed.”
Dr. Knudsen and Dr. Kirkman have reported no relevant financial relationships.
A version of this article first appeared on Medscape.com.
FROM THE LANCET REGIONAL HEALTH–EUROPE
Anxiety in men tied to risk factors for CVD, diabetes
Among healthy middle-aged men, those who were more anxious were more likely to develop high levels of multiple biomarkers of cardiometabolic risk over a 40-year follow-up in a new study.
“By middle adulthood, higher anxiety levels are associated with stable differences” in biomarkers of risk for coronary artery disease (CAD), stroke, and type 2 diabetes, which “are maintained into older ages,” the researchers wrote.
Anxious individuals “may experience deteriorations in cardiometabolic health earlier in life and remain on a stable trajectory of heightened risk into older ages,” they concluded.
The study, led by Lewina Lee, PhD, was published online Jan. 24, 2022, in the Journal of the American Heart Association.
“Men who had higher levels of anxiety at the beginning of the study had consistently higher biological risk for cardiometabolic disease than less anxious men from midlife into old age,” Dr. Lee, assistant professor of psychiatry, Boston University, summarized in an email.
Clinicians may not screen for heart disease and diabetes, and/or only discuss lifestyle modifications when patients are older or have the first signs of disease, she added.
However, the study findings “suggest that worries and anxiety are associated with preclinical pathophysiological processes that tend to culminate in cardiometabolic disease” and show “the importance of screening for mental health difficulties, such as worries and anxiety, in men as early as in their 30s and 40s,” she stressed.
Since most of the men were White (97%) and veterans (94%), “it would be important for future studies to evaluate if these associations exist among women, people from diverse racial and ethnic groups, and in more socioeconomically varying samples, and to consider how anxiety may relate to the development of cardiometabolic risk in much younger individuals than those in our study,” Dr. Lee said in a press release from the American Heart Association.
“This study adds to the growing body of research that link psychological health to cardiovascular risk,” Glenn N. Levine, MD, who was not involved with this research, told this news organization in an email.
“We know that factors such as depression and stress can increase cardiac risk; this study further supports that anxiety can as well,” added Dr. Levine, chief of cardiology, Michael E. DeBakey Veterans Affairs Medical Center, Houston.
“Everyone experiences some anxiety in their life,” he added. However, “if a provider senses that a patient’s anxiety is far beyond the ‘normal’ that we all have from time to time, and it is seemingly adversely impacting both their psychological and physical health, it would be reasonable to suggest to the patient that it might be useful to speak with a mental health professional, and if the patient is receptive, to then make a formal consultation or referral,” said Dr. Levine, who was writing group chair of a recent AHA Scientific Statement on mind-heart-body connection.
Neuroticism and worry
Several studies have linked anxiety to a greater risk of cardiometabolic disease onset, Dr. Lee and colleagues wrote, but it is unclear if anxious individuals have a steadily worsening risk as they age, or if they have a higher risk in middle age, which stays the same in older age.
To investigate this, they analyzed data from 1561 men who were seen at the VA Boston outpatient clinic and did not have CAD, type 2 diabetes, stroke, or cancer when they enrolled in the Normative Aging Study.
The men had a mean age of 53 years (range, 33-84) in 1975 and were followed until 2015 or until dropout from the study or death.
At baseline, the study participants filled in the Eysenck Personality Inventory, which assesses neuroticism, and also responded to a scale indicating how much they worry about 20 issues (excluding health).
“Neuroticism,” the researchers explained, “is a tendency to perceive experiences as threatening, feel that challenges are uncontrollable, and experience frequent and disproportionately intense negative emotions,” such as fear, anxiety, sadness, and anger, “across many situations.”
“Worry refers to attempts to solve a problem where future outcome is uncertain and potentially positive or negative,” Dr. Lee noted. Although worry can be healthy and lead to constructive solutions, “it may be unhealthy, especially when it becomes uncontrollable and interferes with day-to-day functioning.”
Of note, in 1980, the American Psychiatric Association removed the term neurosis from its diagnostic manual. What was previously called neurosis is included as part of generalized anxiety disorder; GAD also encompasses excessive worry.
Cardiometabolic risk from midlife to old age
The men in the current study had on-site physical examinations every 3-5 years.
The researchers calculated the men’s cardiometabolic risk score (from 0 to 7) by assigning 1 point each for the following: systolic blood pressure greater than 130 mm Hg, diastolic blood pressure greater than 85 mm Hg, total cholesterol of at least 240 mg/dL, triglycerides of at least 150 mg/dL, body mass index of at least 30 kg/m2, glucose of at least 100 mg/dL, and erythrocyte sedimentation rate of at least 14 mm/hour.
Alternatively, patients were assigned a point each for taking medication that could affect these markers (except for body mass index).
Overall, on average, at baseline, the men had a cardiometabolic risk score of 2.9. From age 33-65, this score increased to 3.8, and then it did not increase as much later on.
That is, the cardiometabolic risk score increased by 0.8 per decade until age 65, followed by a slower increase of 0.5 per decade.
At all ages, men with higher levels of neuroticism or worry had a higher cardiometabolic risk score
Each additional standard deviation of neuroticism was associated with a 13% increased risk of having six or more of the seven cardiometabolic risk markers during follow-up, after adjusting for age, demographics, and family history of CAD, but the relationship was attenuated after also adjusting for health behaviors (for example, smoking, alcohol consumption, physical activity, and past-year physician visit at baseline).
Similarly, each additional standard deviation of worry was associated with a 10% increased risk of having six or more of the seven cardiometabolic risk markers during follow-up after the same adjustments, and was also no longer significantly different after the same further adjustments.
The research was supported by grants from the National Institutes of Health and a Senior Research Career Scientist Award from the Office of Research and Development, Department of Veterans Affairs. The Normative Aging Study is a research component of the Massachusetts Veterans Epidemiology Research and Information Center and is supported by the VA Cooperative Studies Program/Epidemiological Research Centers. The study authors and Dr. Levine disclosed no relevant financial relationships.
A version of this article first appeared on Medscape.com.
FROM THE JOURNAL OF THE AMERICAN HEART ASSOCIATION
AHA annual stats update highlights heart-brain connection
in its annual statistical update on heart disease and stroke.
“For several years now, the AHA and the scientific community have increasingly recognized the connections between cardiovascular health and brain health, so it was time for us to cement this into its own chapter, which we highlight as the brain health chapter,” Connie W. Tsao, MD, MPH, chair of the statistical update writing group, with Harvard Medical School, Boston, said in an AHA podcast.
“The global rate of brain disease is quickly outpacing heart disease,” Mitchell S. V. Elkind, MD, immediate past president of the AHA, added in a news release.
“The rate of deaths from Alzheimer’s disease and other dementias rose more than twice as much in the past decade compared to the rate of deaths from heart disease, and that is something we must address,” said Dr. Elkind, with Columbia University Vagelos College of Physicians and Surgeons in New York.
“It’s becoming more evident that reducing vascular disease risk factors can make a real difference in helping people live longer, healthier lives, free of heart disease and brain disease,” Dr. Elkind added.
The AHA’s Heart Disease and Stroke Statistics – 2022 Update was published online January 26 in Circulation).
The report highlights some of the research connecting heart and brain health, including the following:
- A meta-analysis of 139 studies showed that people with midlife hypertension were five times more likely to experience impairment on global cognition and about twice as likely to experience reduced executive function, dementia, and Alzheimer’s disease.
- A meta-analysis of four longitudinal studies found that the risk for dementia associated with heart failure was increased nearly twofold.
- In the large prospective Atherosclerosis Risk in Communities (ARIC) Neurocognitive Study, atrial fibrillation was associated with greater cognitive decline and dementia over 20 years.
- A meta-analysis of 10 prospective studies (including 24,801 participants) showed that coronary heart disease (CHD) was associated with a 40% increased risk of poor cognitive outcomes, including dementia, cognitive impairment, or cognitive decline.
“This new chapter on brain health was a critical one to add,” Dr. Tsao said in the news release.
“The data we’ve collected brings to light the strong correlations between heart health and brain health and makes it an easy story to tell -- what’s good for the heart is good for the brain,” Dr. Tsao added.
Along with the new chapter on brain health, the 2022 statistical update provides the latest statistics and heart disease and stroke. Among the highlights:
- Cardiovascular disease (CVD) remains the leading cause of death worldwide. In the United States in 2019, CVD, listed as the underlying cause of death, accounted for 874,613 deaths, about 2,396 deaths each day. On average, someone dies of CVD every 36 seconds.
- CVD claims more lives each year in the United States than all forms of cancer and chronic lower respiratory disease combined.
- In 2019, CHD was the leading cause (41.3%) of deaths attributable to CVD, followed by other CVD (17.3%), stroke (17.2%), hypertension (11.7%), heart failure (9.9%), and diseases of the arteries (2.8%).
- In 2019, stroke accounted for roughly 1 in every 19 deaths in the United States. On average, someone in the United States has a stroke every 40 seconds and someone dies of stroke every 3 minutes 30 seconds. When considered separately from other CVD, stroke ranks number five among all causes of death in the United States.
While the annual statistics update aims to be a contemporary update of annual heart disease and stroke statistics over the past year, it also examines trends over time, Dr. Tsao explains in the podcast.
“One noteworthy point is that we saw a decline in the rate of cardiovascular mortality over the past three decades or so until about 2010. But over the past decade now, we’re also seeing a rise in these numbers,” she said.
This could be due to rising rates of obesity, diabetes, and poor hypertension control, as well as other lifestyle behaviors, Tsao said.
Key risk factor data
Each year, the statistical update gauges the cardiovascular health of Americans by tracking seven key health factors and behaviors that increase risk for heart disease and stroke. Below is a snapshot of the latest risk factor data.
Smoking
In 2019, smoking was the leading risk factor for years of life lost to premature death and the third leading risk factor for years of life lived with disability or injury.
According to the 2020 surgeon general’s report on smoking cessation, more than 480,000 Americans die as a result of cigarette smoking, and more than 41,000 die of secondhand smoke exposure each year (roughly 1 in 5 deaths annually).
One in 7 adults are current smokers, 1 in 6 female adults are current smokers, and 1 in 5 high school students use e-cigarettes.
Physical inactivity
In 2018, 25.4% of U.S. adults did not engage in leisure-time physical activity, and only 24.0% met the 2018 Physical Activity Guidelines for Americans for both aerobic and muscle strengthening.
Among U.S. high school students in 2019, only 44.1% were physically active for 60 minutes or more on at least 5 days of the week.
Nutrition
While there is some evidence that Americans are improving their diet, fewer than 10% of U.S. adults met guidelines for whole grain, whole fruit, and nonstarchy vegetable consumption each day in 2017–2018.
Overweight/obesity
The prevalence of obesity among adults increased from 1999–2000 through 2017–2018 from 30.5% to 42.4%. Overall prevalence of obesity and severe obesity in U.S. youth 2 to 19 years of age increased from 13.9% to 19.3% and 2.6% to 6.1% between 1999–2000 and 2017–2018.
Cholesterol
Close to 94 million (38.1%) U.S. adults have total cholesterol of 200 mg/dL or higher, according to 2015–2018 data; about 28.0 million (11.5%) have total cholesterol of 240 mg/dL or higher; and 27.8% have high levels of low-density lipoprotein cholesterol (130 mg/dL or higher).
Diabetes
In 2019, 87,647 U.S. deaths were attributed to diabetes; data show that 9.8 million U.S. adults have undiagnosed diabetes, 28.2 million have diagnosed diabetes, and 113.6 million have prediabetes.
Hypertension
A total of 121.5 million (47.3%) U.S. adults have hypertension, based on 2015–2018 data. In 2019, 102,072 U.S. deaths were primarily attributable to hypertension.
This statistical update was prepared by a volunteer writing group on behalf of the American Heart Association Council on Epidemiology and Prevention Statistics Committee and Stroke Statistics Subcommittee. Disclosures for the writing committee are listed with the original article.
A version of this article first appeared on Medscape.com.
Differences in COVID-19 Outcomes Among Patients With Type 1 Diabetes: First vs Later Surges
From Hassenfeld Children’s Hospital at NYU Langone Health, New York, NY (Dr Gallagher), T1D Exchange, Boston, MA (Saketh Rompicherla; Drs Ebekozien, Noor, Odugbesan, and Mungmode; Nicole Rioles, Emma Ospelt), University of Mississippi School of Population Health, Jackson, MS (Dr. Ebekozien), Icahn School of Medicine at Mount Sinai, New York, NY (Drs. Wilkes, O’Malley, and Rapaport), Weill Cornell Medicine, New York, NY (Drs. Antal and Feuer), NYU Long Island School of Medicine, Mineola, NY (Dr. Gabriel), NYU Langone Health, New York, NY (Dr. Golden), Barbara Davis Center, Aurora, CO (Dr. Alonso), Texas Children’s Hospital/Baylor College of Medicine, Houston, TX (Dr. Lyons), Stanford University, Stanford, CA (Dr. Prahalad), Children Mercy Kansas City, MO (Dr. Clements), Indiana University School of Medicine, IN (Dr. Neyman), Rady Children’s Hospital, University of California, San Diego, CA (Dr. Demeterco-Berggren).
Background: Patient outcomes of COVID-19 have improved throughout the pandemic. However, because it is not known whether outcomes of COVID-19 in the type 1 diabetes (T1D) population improved over time, we investigated differences in COVID-19 outcomes for patients with T1D in the United States.
Methods: We analyzed data collected via a registry of patients with T1D and COVID-19 from 56 sites between April 2020 and January 2021. We grouped cases into first surge (April 9, 2020, to July 31, 2020, n = 188) and late surge (August 1, 2020, to January 31, 2021, n = 410), and then compared outcomes between both groups using descriptive statistics and logistic regression models.
Results: Adverse outcomes were more frequent during the first surge, including diabetic ketoacidosis (32% vs 15%, P < .001), severe hypoglycemia (4% vs 1%, P = .04), and hospitalization (52% vs 22%, P < .001). Patients in the first surge were older (28 [SD,18.8] years vs 18.0 [SD, 11.1] years, P < .001), had higher median hemoglobin A1c levels (9.3 [interquartile range {IQR}, 4.0] vs 8.4 (IQR, 2.8), P < .001), and were more likely to use public insurance (107 [57%] vs 154 [38%], P < .001). The odds of hospitalization for adults in the first surge were 5 times higher compared to the late surge (odds ratio, 5.01; 95% CI, 2.11-12.63).
Conclusion: Patients with T1D who presented with COVID-19 during the first surge had a higher proportion of adverse outcomes than those who presented in a later surge.
Keywords: TD1, diabetic ketoacidosis, hypoglycemia.
After the World Health Organization declared the disease caused by the novel coronavirus SARS-CoV-2, COVID-19, a pandemic on March 11, 2020, the Centers for Disease Control and Prevention identified patients with diabetes as high risk for severe illness.1-7 The case-fatality rate for COVID-19 has significantly improved over the past 2 years. Public health measures, less severe COVID-19 variants, increased access to testing, and new treatments for COVID-19 have contributed to improved outcomes.
The T1D Exchange has previously published findings on COVID-19 outcomes for patients with type 1 diabetes (T1D) using data from the T1D COVID-19 Surveillance Registry.8-12 Given improved outcomes in COVID-19 in the general population, we sought to determine if outcomes for cases of COVID-19 reported to this registry changed over time.
Methods
This study was coordinated by the T1D Exchange and approved as nonhuman subject research by the Western Institutional Review Board. All participating centers also obtained local institutional review board approval. No identifiable patient information was collected as part of this noninterventional, cross-sectional study.
The T1D Exchange Multi-center COVID-19 Surveillance Study collected data from endocrinology clinics that completed a retrospective chart review and submitted information to T1D Exchange via an online questionnaire for all patients with T1D at their sites who tested positive for COVID-19.13,14 The questionnaire was administered using the Qualtrics survey platform (www.qualtrics.com version XM) and contained 33 pre-coded and free-text response fields to collect patient and clinical attributes.
Each participating center identified 1 team member for reporting to avoid duplicate case submission. Each submitted case was reviewed for potential errors and incomplete information. The coordinating center verified the number of cases per site for data quality assurance.
Quantitative data were represented as mean (standard deviation) or median (interquartile range). Categorical data were described as the number (percentage) of patients. Summary statistics, including frequency and percentage for categorical variables, were calculated for all patient-related and clinical characteristics. The date August 1, 2021, was selected as the end of the first surge based on a review of national COVID-19 surges.
We used the Fisher’s exact test to assess associations between hospitalization and demographics, HbA1c, diabetes duration, symptoms, and adverse outcomes. In addition, multivariate logistic regression was used to calculate odds ratios (OR). Logistic regression models were used to determine the association between time of surge and hospitalization separately for both the pediatric and adult populations. Each model was adjusted for potential sociodemographic confounders, specifically age, sex, race, insurance, and HbA1c.
All tests were 2-sided, with type 1 error set at 5%. Fisher’s exact test and logistic regression were performed using statistical software R, version 3.6.2 (R Foundation for Statistical Computing).
Results
The characteristics of COVID-19 cases in patients with T1D that were reported early in the pandemic, before August 1, 2020 (first surge), compared with those of cases reported on and after August 1, 2020 (later surges) are shown in Table 1.
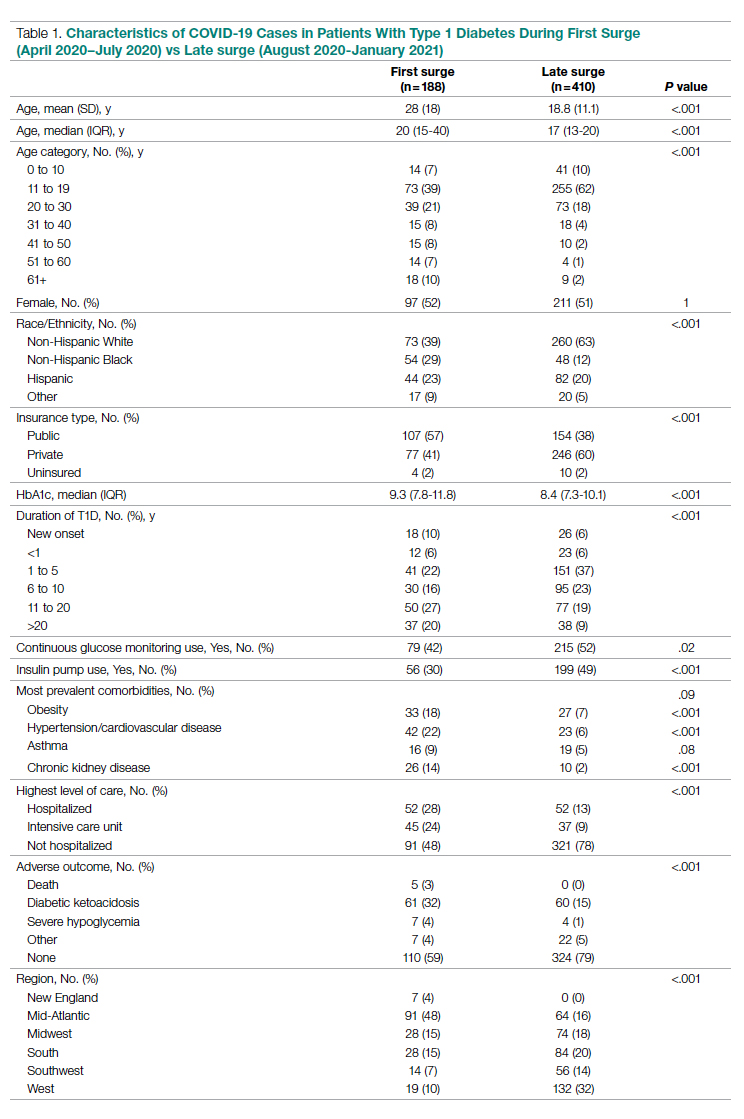
Patients with T1D who presented with COVID-19 during the first surge as compared to the later surges were older (mean age 28 [SD, 18.0] years vs 18.8 [SD, 11.1] years; P < .001) and had a longer duration of diabetes (P < .001). The first-surge group also had more patients with >20 years’ diabetes duration (20% vs 9%, P < .001). Obesity, hypertension, and chronic kidney disease were also more commonly reported in first-surge cases (all P < .001).
There was a significant difference in race and ethnicity reported in the first surge vs the later surge cases, with fewer patients identifying as non-Hispanic White (39% vs, 63%, P < .001) and more patients identifying as non-Hispanic Black (29% vs 12%, P < .001). The groups also differed significantly in terms of insurance type, with more people on public insurance in the first-surge group (57% vs 38%, P < .001). In addition, median HbA1c was higher (9.3% vs 8.4%, P < .001) and continuous glucose monitor and insulin pump use were less common (P = .02 and <.001, respectively) in the early surge.
All symptoms and adverse outcomes were reported more often in the first surge, including diabetic ketoacidosis (DKA; 32% vs 15%; P < .001) and severe hypoglycemia (4% vs 1%, P = .04). Hospitalization (52% vs 13%, P < .001) and ICU admission (24% vs 9%, P < .001) were reported more often in the first-surge group.
Regression Analyses
Table 2 shows the results of logistic regression analyses for hospitalization in the pediatric (≤19 years of age) and adult (>19 years of age) groups, along with the odds of hospitalization during the first vs late surge among COVID-positive people with T1D. Adult patients who tested positive in the first surge were about 5 times more likely to be hospitalized than adults who tested positive for infection in the late surge after adjusting for age, insurance type, sex, race, and HbA1c levels. Pediatric patients also had an increased odds for hospitalization during the first surge, but this increase was not statistically significant.
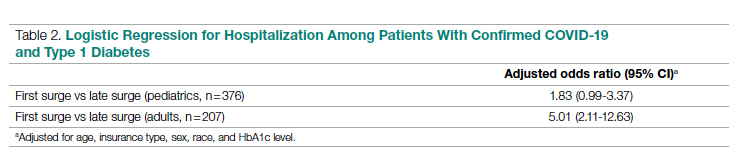
Discussion
Our analysis of COVID-19 cases in patients with T1D reported by diabetes providers across the United States found that adverse outcomes were more prevalent early in the pandemic. There may be a number of reasons for this difference in outcomes between patients who presented in the first surge vs a later surge. First, because testing for COVID-19 was extremely limited and reserved for hospitalized patients early in the pandemic, the first-surge patients with confirmed COVID-19 likely represent a skewed population of higher-acuity patients. This may also explain the relative paucity of cases in younger patients reported early in the pandemic. Second, worse outcomes in the early surge may also have been associated with overwhelmed hospitals in New York City at the start of the outbreak. According to Cummings et al, the abrupt surge of critically ill patients hospitalized with severe acute respiratory distress syndrome initially outpaced their capacity to provide prone-positioning ventilation, which has been expanded since then.15 While there was very little hypertension, cardiovascular disease, or kidney disease reported in the pediatric groups, there was a higher prevalence of obesity in the pediatric group from the mid-Atlantic region. Obesity has been associated with a worse prognosis for COVID-19 illness in children.16 Finally, there were 5 deaths reported in this study, all of which were reported during the first surge. Older age and increased rates of cardiovascular disease and chronic kidney disease in the first surge cases likely contributed to worse outcomes for adults in mid-Atlantic region relative to the other regions. Minority race and the use of public insurance, risk factors for more severe outcomes in all regions, were also more common in cases reported from the mid-Atlantic region.
This study has several limitations. First, it is a cross-sectional study that relies upon voluntary provider reports. Second, availability of COVID-19 testing was limited in all regions in spring 2020. Third, different regions of the country experienced subsequent surges at different times within the reported timeframes in this analysis. Fourth, this report time period does not include the impact of the newer COVID-19 variants. Finally, trends in COVID-19 outcomes were affected by the evolution of care that developed throughout 2020.
Conclusion
Adult patients with T1D and COVID-19 who reported during the first surge had about 5 times higher hospitalization odds than those who presented in a later surge.
Corresponding author: Osagie Ebekozien, MD, MPH, 11 Avenue de Lafayette, Boston, MA 02111; oebekozien@t1dexchange.org
Disclosures: Dr Ebekozien reports receiving research grants from Medtronic Diabetes, Eli Lilly, and Dexcom, and receiving honoraria from Medtronic Diabetes.
1. Barron E, Bakhai C, Kar P, et al. Associations of type 1 and type 2 diabetes with COVID-19-related mortality in England: a whole-population study. Lancet Diabetes Endocrinol. 2020;8(10):813-822. doi:10.1016/S2213-8587(20)30272-2
2. Fisher L, Polonsky W, Asuni A, Jolly Y, Hessler D. The early impact of the COVID-19 pandemic on adults with type 1 or type 2 diabetes: A national cohort study. J Diabetes Complications. 2020;34(12):107748. doi:10.1016/j.jdiacomp.2020.107748
3. Holman N, Knighton P, Kar P, et al. Risk factors for COVID-19-related mortality in people with type 1 and type 2 diabetes in England: a population-based cohort study. Lancet Diabetes Endocrinol. 2020;8(10):823-833. doi:10.1016/S2213-8587(20)30271-0
4. Wargny M, Gourdy P, Ludwig L, et al. Type 1 diabetes in people hospitalized for COVID-19: new insights from the CORONADO study. Diabetes Care. 2020;43(11):e174-e177. doi:10.2337/dc20-1217
5. Gregory JM, Slaughter JC, Duffus SH, et al. COVID-19 severity is tripled in the diabetes community: a prospective analysis of the pandemic’s impact in type 1 and type 2 diabetes. Diabetes Care. 2021;44(2):526-532. doi:10.2337/dc20-2260
6. Cardona-Hernandez R, Cherubini V, Iafusco D, Schiaffini R, Luo X, Maahs DM. Children and youth with diabetes are not at increased risk for hospitalization due to COVID-19. Pediatr Diabetes. 2021;22(2):202-206. doi:10.1111/pedi.13158
7. Maahs DM, Alonso GT, Gallagher MP, Ebekozien O. Comment on Gregory et al. COVID-19 severity is tripled in the diabetes community: a prospective analysis of the pandemic’s impact in type 1 and type 2 diabetes. Diabetes Care. 2021;44:526-532. Diabetes Care. 2021;44(5):e102. doi:10.2337/dc20-3119
8. Ebekozien OA, Noor N, Gallagher MP, Alonso GT. Type 1 diabetes and COVID-19: preliminary findings from a multicenter surveillance study in the US. Diabetes Care. 2020;43(8):e83-e85. doi:10.2337/dc20-1088
9. Beliard K, Ebekozien O, Demeterco-Berggren C, et al. Increased DKA at presentation among newly diagnosed type 1 diabetes patients with or without COVID-19: Data from a multi-site surveillance registry. J Diabetes. 2021;13(3):270-272. doi:10.1111/1753-0407
10. O’Malley G, Ebekozien O, Desimone M, et al. COVID-19 hospitalization in adults with type 1 diabetes: results from the T1D Exchange Multicenter Surveillance study. J Clin Endocrinol Metab. 2021;106(2):e936-e942. doi:10.1210/clinem/dgaa825
11. Ebekozien O, Agarwal S, Noor N, et al. Inequities in diabetic ketoacidosis among patients with type 1 diabetes and COVID-19: data from 52 US clinical centers. J Clin Endocrinol Metab. 2021;106(4):e1755-e1762. doi:10.1210/clinem/dgaa920
12. Alonso GT, Ebekozien O, Gallagher MP, et al. Diabetic ketoacidosis drives COVID-19 related hospitalizations in children with type 1 diabetes. J Diabetes. 2021;13(8):681-687. doi:10.1111/1753-0407.13184
13. Noor N, Ebekozien O, Levin L, et al. Diabetes technology use for management of type 1 diabetes is associated with fewer adverse COVID-19 outcomes: findings from the T1D Exchange COVID-19 Surveillance Registry. Diabetes Care. 2021;44(8):e160-e162. doi:10.2337/dc21-0074
14. Demeterco-Berggren C, Ebekozien O, Rompicherla S, et al. Age and hospitalization risk in people with type 1 diabetes and COVID-19: Data from the T1D Exchange Surveillance Study. J Clin Endocrinol Metab. 2021;dgab668. doi:10.1210/clinem/dgab668
15. Cummings MJ, Baldwin MR, Abrams D, et al. Epidemiology, clinical course, and outcomes of critically ill adults with COVID-19 in New York City: a prospective cohort study. Lancet. 2020;395(10239):1763-1770. doi:10.1016/S0140-6736(20)31189-2
16. Tsankov BK, Allaire JM, Irvine MA, et al. Severe COVID-19 infection and pediatric comorbidities: a systematic review and meta-analysis. Int J Infect Dis. 2021;103:246-256. doi:10.1016/j.ijid.2020.11.163
From Hassenfeld Children’s Hospital at NYU Langone Health, New York, NY (Dr Gallagher), T1D Exchange, Boston, MA (Saketh Rompicherla; Drs Ebekozien, Noor, Odugbesan, and Mungmode; Nicole Rioles, Emma Ospelt), University of Mississippi School of Population Health, Jackson, MS (Dr. Ebekozien), Icahn School of Medicine at Mount Sinai, New York, NY (Drs. Wilkes, O’Malley, and Rapaport), Weill Cornell Medicine, New York, NY (Drs. Antal and Feuer), NYU Long Island School of Medicine, Mineola, NY (Dr. Gabriel), NYU Langone Health, New York, NY (Dr. Golden), Barbara Davis Center, Aurora, CO (Dr. Alonso), Texas Children’s Hospital/Baylor College of Medicine, Houston, TX (Dr. Lyons), Stanford University, Stanford, CA (Dr. Prahalad), Children Mercy Kansas City, MO (Dr. Clements), Indiana University School of Medicine, IN (Dr. Neyman), Rady Children’s Hospital, University of California, San Diego, CA (Dr. Demeterco-Berggren).
Background: Patient outcomes of COVID-19 have improved throughout the pandemic. However, because it is not known whether outcomes of COVID-19 in the type 1 diabetes (T1D) population improved over time, we investigated differences in COVID-19 outcomes for patients with T1D in the United States.
Methods: We analyzed data collected via a registry of patients with T1D and COVID-19 from 56 sites between April 2020 and January 2021. We grouped cases into first surge (April 9, 2020, to July 31, 2020, n = 188) and late surge (August 1, 2020, to January 31, 2021, n = 410), and then compared outcomes between both groups using descriptive statistics and logistic regression models.
Results: Adverse outcomes were more frequent during the first surge, including diabetic ketoacidosis (32% vs 15%, P < .001), severe hypoglycemia (4% vs 1%, P = .04), and hospitalization (52% vs 22%, P < .001). Patients in the first surge were older (28 [SD,18.8] years vs 18.0 [SD, 11.1] years, P < .001), had higher median hemoglobin A1c levels (9.3 [interquartile range {IQR}, 4.0] vs 8.4 (IQR, 2.8), P < .001), and were more likely to use public insurance (107 [57%] vs 154 [38%], P < .001). The odds of hospitalization for adults in the first surge were 5 times higher compared to the late surge (odds ratio, 5.01; 95% CI, 2.11-12.63).
Conclusion: Patients with T1D who presented with COVID-19 during the first surge had a higher proportion of adverse outcomes than those who presented in a later surge.
Keywords: TD1, diabetic ketoacidosis, hypoglycemia.
After the World Health Organization declared the disease caused by the novel coronavirus SARS-CoV-2, COVID-19, a pandemic on March 11, 2020, the Centers for Disease Control and Prevention identified patients with diabetes as high risk for severe illness.1-7 The case-fatality rate for COVID-19 has significantly improved over the past 2 years. Public health measures, less severe COVID-19 variants, increased access to testing, and new treatments for COVID-19 have contributed to improved outcomes.
The T1D Exchange has previously published findings on COVID-19 outcomes for patients with type 1 diabetes (T1D) using data from the T1D COVID-19 Surveillance Registry.8-12 Given improved outcomes in COVID-19 in the general population, we sought to determine if outcomes for cases of COVID-19 reported to this registry changed over time.
Methods
This study was coordinated by the T1D Exchange and approved as nonhuman subject research by the Western Institutional Review Board. All participating centers also obtained local institutional review board approval. No identifiable patient information was collected as part of this noninterventional, cross-sectional study.
The T1D Exchange Multi-center COVID-19 Surveillance Study collected data from endocrinology clinics that completed a retrospective chart review and submitted information to T1D Exchange via an online questionnaire for all patients with T1D at their sites who tested positive for COVID-19.13,14 The questionnaire was administered using the Qualtrics survey platform (www.qualtrics.com version XM) and contained 33 pre-coded and free-text response fields to collect patient and clinical attributes.
Each participating center identified 1 team member for reporting to avoid duplicate case submission. Each submitted case was reviewed for potential errors and incomplete information. The coordinating center verified the number of cases per site for data quality assurance.
Quantitative data were represented as mean (standard deviation) or median (interquartile range). Categorical data were described as the number (percentage) of patients. Summary statistics, including frequency and percentage for categorical variables, were calculated for all patient-related and clinical characteristics. The date August 1, 2021, was selected as the end of the first surge based on a review of national COVID-19 surges.
We used the Fisher’s exact test to assess associations between hospitalization and demographics, HbA1c, diabetes duration, symptoms, and adverse outcomes. In addition, multivariate logistic regression was used to calculate odds ratios (OR). Logistic regression models were used to determine the association between time of surge and hospitalization separately for both the pediatric and adult populations. Each model was adjusted for potential sociodemographic confounders, specifically age, sex, race, insurance, and HbA1c.
All tests were 2-sided, with type 1 error set at 5%. Fisher’s exact test and logistic regression were performed using statistical software R, version 3.6.2 (R Foundation for Statistical Computing).
Results
The characteristics of COVID-19 cases in patients with T1D that were reported early in the pandemic, before August 1, 2020 (first surge), compared with those of cases reported on and after August 1, 2020 (later surges) are shown in Table 1.
Patients with T1D who presented with COVID-19 during the first surge as compared to the later surges were older (mean age 28 [SD, 18.0] years vs 18.8 [SD, 11.1] years; P < .001) and had a longer duration of diabetes (P < .001). The first-surge group also had more patients with >20 years’ diabetes duration (20% vs 9%, P < .001). Obesity, hypertension, and chronic kidney disease were also more commonly reported in first-surge cases (all P < .001).
There was a significant difference in race and ethnicity reported in the first surge vs the later surge cases, with fewer patients identifying as non-Hispanic White (39% vs, 63%, P < .001) and more patients identifying as non-Hispanic Black (29% vs 12%, P < .001). The groups also differed significantly in terms of insurance type, with more people on public insurance in the first-surge group (57% vs 38%, P < .001). In addition, median HbA1c was higher (9.3% vs 8.4%, P < .001) and continuous glucose monitor and insulin pump use were less common (P = .02 and <.001, respectively) in the early surge.
All symptoms and adverse outcomes were reported more often in the first surge, including diabetic ketoacidosis (DKA; 32% vs 15%; P < .001) and severe hypoglycemia (4% vs 1%, P = .04). Hospitalization (52% vs 13%, P < .001) and ICU admission (24% vs 9%, P < .001) were reported more often in the first-surge group.
Regression Analyses
Table 2 shows the results of logistic regression analyses for hospitalization in the pediatric (≤19 years of age) and adult (>19 years of age) groups, along with the odds of hospitalization during the first vs late surge among COVID-positive people with T1D. Adult patients who tested positive in the first surge were about 5 times more likely to be hospitalized than adults who tested positive for infection in the late surge after adjusting for age, insurance type, sex, race, and HbA1c levels. Pediatric patients also had an increased odds for hospitalization during the first surge, but this increase was not statistically significant.
Discussion
Our analysis of COVID-19 cases in patients with T1D reported by diabetes providers across the United States found that adverse outcomes were more prevalent early in the pandemic. There may be a number of reasons for this difference in outcomes between patients who presented in the first surge vs a later surge. First, because testing for COVID-19 was extremely limited and reserved for hospitalized patients early in the pandemic, the first-surge patients with confirmed COVID-19 likely represent a skewed population of higher-acuity patients. This may also explain the relative paucity of cases in younger patients reported early in the pandemic. Second, worse outcomes in the early surge may also have been associated with overwhelmed hospitals in New York City at the start of the outbreak. According to Cummings et al, the abrupt surge of critically ill patients hospitalized with severe acute respiratory distress syndrome initially outpaced their capacity to provide prone-positioning ventilation, which has been expanded since then.15 While there was very little hypertension, cardiovascular disease, or kidney disease reported in the pediatric groups, there was a higher prevalence of obesity in the pediatric group from the mid-Atlantic region. Obesity has been associated with a worse prognosis for COVID-19 illness in children.16 Finally, there were 5 deaths reported in this study, all of which were reported during the first surge. Older age and increased rates of cardiovascular disease and chronic kidney disease in the first surge cases likely contributed to worse outcomes for adults in mid-Atlantic region relative to the other regions. Minority race and the use of public insurance, risk factors for more severe outcomes in all regions, were also more common in cases reported from the mid-Atlantic region.
This study has several limitations. First, it is a cross-sectional study that relies upon voluntary provider reports. Second, availability of COVID-19 testing was limited in all regions in spring 2020. Third, different regions of the country experienced subsequent surges at different times within the reported timeframes in this analysis. Fourth, this report time period does not include the impact of the newer COVID-19 variants. Finally, trends in COVID-19 outcomes were affected by the evolution of care that developed throughout 2020.
Conclusion
Adult patients with T1D and COVID-19 who reported during the first surge had about 5 times higher hospitalization odds than those who presented in a later surge.
Corresponding author: Osagie Ebekozien, MD, MPH, 11 Avenue de Lafayette, Boston, MA 02111; oebekozien@t1dexchange.org
Disclosures: Dr Ebekozien reports receiving research grants from Medtronic Diabetes, Eli Lilly, and Dexcom, and receiving honoraria from Medtronic Diabetes.
1. Barron E, Bakhai C, Kar P, et al. Associations of type 1 and type 2 diabetes with COVID-19-related mortality in England: a whole-population study. Lancet Diabetes Endocrinol. 2020;8(10):813-822. doi:10.1016/S2213-8587(20)30272-2
2. Fisher L, Polonsky W, Asuni A, Jolly Y, Hessler D. The early impact of the COVID-19 pandemic on adults with type 1 or type 2 diabetes: A national cohort study. J Diabetes Complications. 2020;34(12):107748. doi:10.1016/j.jdiacomp.2020.107748
3. Holman N, Knighton P, Kar P, et al. Risk factors for COVID-19-related mortality in people with type 1 and type 2 diabetes in England: a population-based cohort study. Lancet Diabetes Endocrinol. 2020;8(10):823-833. doi:10.1016/S2213-8587(20)30271-0
4. Wargny M, Gourdy P, Ludwig L, et al. Type 1 diabetes in people hospitalized for COVID-19: new insights from the CORONADO study. Diabetes Care. 2020;43(11):e174-e177. doi:10.2337/dc20-1217
5. Gregory JM, Slaughter JC, Duffus SH, et al. COVID-19 severity is tripled in the diabetes community: a prospective analysis of the pandemic’s impact in type 1 and type 2 diabetes. Diabetes Care. 2021;44(2):526-532. doi:10.2337/dc20-2260
6. Cardona-Hernandez R, Cherubini V, Iafusco D, Schiaffini R, Luo X, Maahs DM. Children and youth with diabetes are not at increased risk for hospitalization due to COVID-19. Pediatr Diabetes. 2021;22(2):202-206. doi:10.1111/pedi.13158
7. Maahs DM, Alonso GT, Gallagher MP, Ebekozien O. Comment on Gregory et al. COVID-19 severity is tripled in the diabetes community: a prospective analysis of the pandemic’s impact in type 1 and type 2 diabetes. Diabetes Care. 2021;44:526-532. Diabetes Care. 2021;44(5):e102. doi:10.2337/dc20-3119
8. Ebekozien OA, Noor N, Gallagher MP, Alonso GT. Type 1 diabetes and COVID-19: preliminary findings from a multicenter surveillance study in the US. Diabetes Care. 2020;43(8):e83-e85. doi:10.2337/dc20-1088
9. Beliard K, Ebekozien O, Demeterco-Berggren C, et al. Increased DKA at presentation among newly diagnosed type 1 diabetes patients with or without COVID-19: Data from a multi-site surveillance registry. J Diabetes. 2021;13(3):270-272. doi:10.1111/1753-0407
10. O’Malley G, Ebekozien O, Desimone M, et al. COVID-19 hospitalization in adults with type 1 diabetes: results from the T1D Exchange Multicenter Surveillance study. J Clin Endocrinol Metab. 2021;106(2):e936-e942. doi:10.1210/clinem/dgaa825
11. Ebekozien O, Agarwal S, Noor N, et al. Inequities in diabetic ketoacidosis among patients with type 1 diabetes and COVID-19: data from 52 US clinical centers. J Clin Endocrinol Metab. 2021;106(4):e1755-e1762. doi:10.1210/clinem/dgaa920
12. Alonso GT, Ebekozien O, Gallagher MP, et al. Diabetic ketoacidosis drives COVID-19 related hospitalizations in children with type 1 diabetes. J Diabetes. 2021;13(8):681-687. doi:10.1111/1753-0407.13184
13. Noor N, Ebekozien O, Levin L, et al. Diabetes technology use for management of type 1 diabetes is associated with fewer adverse COVID-19 outcomes: findings from the T1D Exchange COVID-19 Surveillance Registry. Diabetes Care. 2021;44(8):e160-e162. doi:10.2337/dc21-0074
14. Demeterco-Berggren C, Ebekozien O, Rompicherla S, et al. Age and hospitalization risk in people with type 1 diabetes and COVID-19: Data from the T1D Exchange Surveillance Study. J Clin Endocrinol Metab. 2021;dgab668. doi:10.1210/clinem/dgab668
15. Cummings MJ, Baldwin MR, Abrams D, et al. Epidemiology, clinical course, and outcomes of critically ill adults with COVID-19 in New York City: a prospective cohort study. Lancet. 2020;395(10239):1763-1770. doi:10.1016/S0140-6736(20)31189-2
16. Tsankov BK, Allaire JM, Irvine MA, et al. Severe COVID-19 infection and pediatric comorbidities: a systematic review and meta-analysis. Int J Infect Dis. 2021;103:246-256. doi:10.1016/j.ijid.2020.11.163
FDA okays first tubing-free ‘artificial pancreas’ Omnipod 5
The Food and Drug Administration has cleared the Omnipod 5 Automated Insulin Delivery System (Insulet), the third semiautomated closed-loop insulin delivery system in the United States and the first that is tubing free.
Omnipod 5 is cleared for people aged 6 years and older with type 1 diabetes. The system integrates the tubeless insulin delivery Pods with Dexcom G6 continuous glucose monitors (CGM) and a smartphone app or a separate controller device to automatically adjust insulin to minimize high and low blood glucose levels via SmartAdjust technology.
Within the app is a SmartBolus calculator that receives Dexcom CGM values every 5 minutes and automatically adjusts insulin up or down or pauses it based on predicted values for 60 minutes into the future and the individual’s customized glucose targets.
The Omnipod 5 becomes the third FDA-cleared semiautomated insulin delivery system in the United States, along with systems by Tandem and Medtronic. Others are available outside the United States. All of the currently marketed systems incorporate insulin pumps with tubing, whereas the tubeless Pods are worn directly on the body and changed every 3 days.
In a statement, JDRF, the type 1 diabetes advocacy organization, said: “Authorization of the Insulet Omnipod 5 is a huge win for the type 1 diabetes community. As the first tubeless hybrid closed-loop system to receive FDA clearance, this is a critical step forward in making day-to-day life better for people living with the disease.”
JDRF, which worked with the FDA to establish regulatory pathways for artificial pancreas technology, supported the development of the Omnipod 5 control algorithm through investigators in the JDRF Artificial Pancreas Consortium.
The Omnipod 5 will be available as a pharmacy product. It will be launched soon in limited market release and broadly thereafter.
A version of this article first appeared on Medscape.com.
More than 1 in 10 people in U.S. have diabetes, CDC says
More than 1 in 10 Americans have diabetes and over a third have prediabetes, according to updated statistics from the Centers for Disease Control and Prevention.
The National Diabetes Statistics Report includes data for 2017-2020 from several nationally representative sources on prevalence and incidence of diabetes and prediabetes, risk factors for complications, acute and long-term complications, and costs.
According to the new report, published on Jan. 25, a total of 37.3 million people in the United States have diabetes, or about 11.3% of the population. Of those, 28.7 million are diagnosed (including 28.5 million adults), while 8.5 million, or 23% of those with diabetes, are undiagnosed.
Another 96 million adults have prediabetes, comprising 38.0% of the adult U.S. population, of whom only 19% are aware of their prediabetes status.
In a statement, the American Diabetes Association said the new CDC data “show an alarming increase of diabetes in our nation among adults,” while the high number with prediabetes who don’t know that they have it “is fueling the diabetes epidemic.”
Regarding the total estimated 1.84 million with type 1 diabetes, the advocacy organization JDRF said in a statement: “These data and additional statistical research reinforces the urgency to accelerate life-changing breakthroughs to cure, prevent, and treat [type 1 diabetes] and its complications.”
Overall, the ADA said, “the National Diabetes Statistics Report reaffirms why the ADA is dedicated to innovative research to find a cure for diabetes once and for all.”
Notable increases since 2019
These new data represent notable increases since the CDC’s 2019 Report Card, which gave the U.S. population with diabetes in 2018 as 34.2 million, or 10.5% of the population, including 7.3 million undiagnosed. The prediabetes prevalence that year was 88 million.
Among children and adolescents younger than 20 years, 283,000, or 35 per 10,000 U.S. youths, had diagnosed diabetes in 2019. Of those, 244,000 had type 1 diabetes. Another 1.6 million adults aged 20 and older also reported having type 1 diabetes, comprising 5.7% of U.S. adults with diagnosed diabetes.
A version of this article first appeared on Medscape.com.
Moderate-vigorous stepping seen to lower diabetes risk in older women
More steps per day, particularly at a higher intensity, may reduce the risk of type 2 diabetes in older women, based on a prospective cohort study.
The link between daily stepping and diabetes was not significantly modified by body mass index (BMI) or other common diabetes risk factors, suggesting that the relationship is highly generalizable, lead author Alexis C. Garduno, MPH, a PhD student at the University of California, San Diego, and colleagues reported.
“Physical activity is a key modifiable behavior for diabetes prevention and management,” the investigators wrote in Diabetes Care. “Many prevention studies have demonstrated that regular physical activity, along with improved diet, reduces the risk of diabetes in adults. ... To the best of our knowledge, there are few studies examining the association between objectively measured steps per day and incident diabetes in a community-based setting.”
To this end, the investigators analyzed data from 4,838 older, community-living women in the Objective Physical Activity and Cardiovascular Health Study. Upon enrollment, women were without physician-diagnosed diabetes and had a mean age of 78.9 years. For 1 week, participants wore ActiGraph GT3X+ accelerometers to measure steps per day, as well as step intensity, graded as light or moderate to vigorous.
The relationship between daily activity and diabetes was analyzed using three multivariate models: The first included race/ethnicity and age; the second also included family history of diabetes, education, physical functioning, self-rated health, smoking status, and alcohol consumption; and the third added BMI, “a potential mediator in the causal pathway between steps per day and diabetes,” the investigators wrote.
Participants took an average of 3,729 steps per day, divided roughly evenly between light and moderate to vigorous intensity.
After a median follow-up of 5.7 years, 8.1% of women developed diabetes. The least-adjusted model showed a 14% reduction in diabetes risk per 2,000 steps (hazard ratio, 0.86; 95% confidence interval, 0.80-0.92; P = .007), whereas the second model, adjusting for more confounding variables, showed a 12% reduction in diabetes risk per 2,000 steps (HR, 0.88; 95% CI, 0.78-1.00; P = .045).
The final model, which added BMI, showed a 10% reduction in risk, although it didn’t reach statistical significance (HR, 0.90; 95% CI, 0.80-1.02; P = .11). Furthermore, accelerated failure time models suggested that BMI did not significantly impact the link between steps and diabetes (proportion mediated, 17.7%;95% CI, –55.0 to 142.0; P = .09). Further analyses also found no significant interactions between BMI or other possible confounders.
“The steps per day–diabetes association was not modified by age, race/ethnicity, BMI, physical functioning, or family history of diabetes, which supports the generalizability of these findings to community-living older women,” the investigators wrote.
Increased stepping intensity also appeared to lower risk of diabetes. After adjusting for confounding variables, light stepping was not linked to reduced risk (HR, 0.97; 95% CI, 0.73-1.29; P = .83), whereas moderate to vigorous stepping reduced risk by 14% per 2,000 steps (HR, 0.86; 95% CI, 0.74-1.00; P = .04).
“This study provides evidence supporting an association between steps per day and lower incident diabetes,” the investigators concluded. “While further work is needed to identify whether there is a minimum number of steps per day that results in a clinically significant reduction of diabetes and to evaluate the role that step intensity plays in diabetes etiology for older adults, findings from this study suggest that moderate-vigorous–intensity steps may be more important than lower-intensity steps with respect to incident diabetes. Steps per day–based interventions are needed to advance diabetes prevention science in older adults.”
The study was supported by the National Institute on Aging, the National Institute of Diabetes and Digestive and Kidney Diseases, the Tobacco-Related Disease Research Program, and others. The investigators had no potential conflicts of interest.
FROM DIABETES CARE
Does COVID-19 induce type 1 diabetes in kids? Jury still out
Two new studies from different parts of the world have identified an increase in the incidence of type 1 diabetes in children since the COVID-19 pandemic began, but the reasons still aren’t clear.
The findings from the two studies, in Germany and the United States, align closely, endocrinologist Jane J. Kim, MD, professor of pediatrics and principal investigator of the U.S. study, told this news organization. “I think that the general conclusion based on their data and our data is that there appears to be an increased rate of new type 1 diabetes diagnoses in children since the onset of the pandemic.”
Dr. Kim noted that because her group’s data pertain to just a single center, she is “heartened to see that the [German team’s] general conclusions are the same as ours.” Moreover, she pointed out that other studies examining this question came from Europe early in the pandemic, whereas “now both they [the German group] and we have had the opportunity to look at what’s happening over a longer period of time.”
But the reason for the association remains unclear. Some answers may be forthcoming from a database designed in mid-2020 specifically to examine the relationship between COVID-19 and new-onset diabetes. Called CoviDiab, the registry aims “to establish the extent and characteristics of new-onset, COVID-19–related diabetes and to investigate its pathogenesis, management, and outcomes,” according to the website.
The first new study, a multicenter German diabetes registry study, was published online Jan. 17 in Diabetes Care by Clemens Kamrath, MD, of Justus Liebig University, Giessen, Germany, and colleagues.
The other, from Rady Children’s Hospital of San Diego, was published online Jan. 24 in JAMA Pediatrics by Bethany L. Gottesman, MD, and colleagues, all with the University of California, San Diego.
Mechanisms likely to differ for type 1 versus type 2 diabetes
Neither the German nor the U.S. investigators were able to directly correlate current or prior SARS-CoV-2 infection in children with the subsequent development of type 1 diabetes.
Earlier this month, a study from the U.S. Centers for Disease Control and Prevention did examine that issue, but it also included youth with type 2 diabetes and did not separate out the two groups.
Dr. Kim said her institution has also seen an increase in type 2 diabetes among youth since the COVID-19 pandemic began but did not include that in their current article.
“When we started looking at our data, diabetes and COVID-19 in adults had been relatively well established. To see an increase in type 2 [diabetes] was not so surprising to our group. But we had the sense we were seeing more patients with type 1, and when we looked at our hospital that was very much the case. I think that was a surprise to people,” said Dr. Kim.
Although a direct effect of SARS-CoV-2 on pancreatic beta cells has been proposed, in both the German and San Diego datasets the diagnosis of type 1 diabetes was confirmed with autoantibodies that are typically present years prior to the onset of clinical symptoms.
The German group suggests possible other explanations for the link, including the lack of immune system exposure to other common pediatric infections during pandemic-necessitated social distancing – the so-called hygiene hypothesis – as well as the possible role of psychological stress, which several studies have linked to type 1 diabetes.
But as of now, Dr. Kim said, “Nobody really knows.”
Is the effect direct or indirect?
Using data from the multicenter German Diabetes Prospective Follow-up Registry, Dr. Kamrath and colleagues compared the incidence of type 1 diabetes in children and adolescents from Jan. 1, 2020 through June 30, 2021 with the incidence in 2011-2019.
During the pandemic period, a total of 5,162 youth were newly diagnosed with type 1 diabetes at 236 German centers. That incidence, 24.4 per 100,000 patient-years, was significantly higher than the 21.2 per 100,000 patient-years expected based on the prior decade, with an incidence rate ratio of 1.15 (P < .001). The increase was similar in both males and females.
There was a difference by age, however, as the phenomenon appeared to be limited to the preadolescent age groups. The incidence rate ratios (IRRs) for ages below 6 years and 6-11 years were 1.23 and 1.18 (both P < .001), respectively, compared to a nonsignificant IRR of 1.06 (P = .13) in those aged 12-17 years.
Compared with the expected monthly incidence, the observed incidence was significantly higher in June 2020 (IRR, 1.43; P = .003), July 2020 (IRR, 1.48; P < 0.001), March 2021 (IRR, 1.29; P = .028), and June 2021 (IRR, 1.39; P = .01).
Among the 3,851 patients for whom data on type 1 diabetes-associated autoantibodies were available, the adjusted rates of autoantibody negativity did not differ from 2018-2019 during the entire pandemic period or during the year 2020 or the first half of 2021.
“Therefore, the increase in the incidence of type 1 diabetes in children appears to be due to immune-mediated type 1 diabetes. However, because autoimmunity and progressive beta-cell destruction typically begin long before the clinical diagnosis of type 1 diabetes, we were surprised to see the incidence of type 1 diabetes followed the peak incidence of COVID-19 and also the pandemic containment measures by only approximately 3 months,” Dr. Kamrath and colleagues write.
Taken together, they say, the data suggest that “the impact on type 1 diabetes incidence is not due to infection with SARS-CoV-2 but rather a consequence of environmental changes resulting from the pandemic itself or pandemic containment measures.”
Similar findings at a U.S. children’s hospital
In the cross-sectional study in San Diego, Dr. Gottesman and colleagues looked at the electronic medical records (EMRs) at Rady Children’s Hospital for patients aged younger than 19 years with at least one positive type 1 diabetes antibody titer.
During March 19, 2020 to March 18, 2021, a total of 187 children were admitted for new-onset type 1 diabetes, compared with just 119 the previous year, a 57% increase.
From July 2020 through February 2021, the number of new type 1 diabetes diagnoses significantly exceeded the number expected based on a quarterly moving average of each of the preceding 5 years.
Only four of the 187 patients (2.1%) diagnosed during the pandemic period had a COVID-19 infection at the time of presentation. Antibody testing to assess prior infection wasn’t feasible, and now that children are receiving the vaccine – and therefore most will have antibodies – “we’ve lost our window of opportunity to look at that question,” Dr. Kim noted.
As has been previously shown, there was an increase in the percentage of patients presenting with diabetic ketoacidosis during the pandemic compared with the prior 5 years (49.7% vs. 40.7% requiring insulin infusion). However, there was no difference in mean age at presentation, body mass index, A1c, or percentage requiring admission to intensive care.
Because these data only go through March 2021, Dr. Kim noted, “We need to see what’s happening with these different variants. We’ll have a chance to look in a month or two to see the effects of Omicron on the rates of diabetes in the hospital.”
Will CoviDiab answer the question?
Data from CoviDiab will include diabetes type in adults and children, registry coprincipal investigator Francesco Rubino, MD, of King’s College London, told this news organization.
“We aimed at having as many as possible cases of new-onset diabetes for which we can have also a minimum set of clinical data including type of diabetes and A1c. By looking at this information we can infer whether a role of COVID-19 in triggering diabetes is clinically plausible – or not – and what type of diabetes is most frequently associated with COVID-19 as this also speaks about mechanisms of action.”
Dr. Rubino said that the CoviDiab team is approaching the data with the assumption that, at least in adults diagnosed with type 2 diabetes, the explanation might be that the person already had undiagnosed diabetes or that the hyperglycemia may be stress-induced and temporary.
“We’re looking at this question with a skeptical eye ... Is it just an association, or does the virus have a role in inducing diabetes from scratch, or can the virus advance pathophysiology in a way that it ends up in full-blown diabetes in predisposed individuals?”
While no single study will prove that SARS-CoV-2 causes diabetes, “combining observations from various studies and approaches we may get a higher degree of certainty,” Dr. Rubino said, noting that the CoviDiab team plans to publish data from the first 800 cases “soon.”
Dr. Kim has reported no relevant financial relationships. Dr. Rubino has reported receiving grants from Ethicon and Medtronic, personal fees from GI Dynamic, Keyron, Novo Nordisk, Ethicon, and Medtronic.
A version of this article first appeared on Medscape.com.