User login
To err is human, but…

In Being Wrong,1 her treatise on the psychology of human error, Kathryn Schulz quotes William James: “Our errors are surely not such awfully solemn things.”2 Being wrong, she argues, is part of the human genome. Despite aphorisms such as “we learn from our mistakes,” we are far from accepting of mistakes in medical practice. Perhaps naively, I do not believe that our need to understand how clinical errors occur and how to avoid them is based on the fear of legal repercussion. And of course we do not want to harm our patients. But our relationship with medical errors is far more complex than that. We really don’t want to be wrong.
Dr. Atul Gawande3 has promoted using checklists and a structured system to limit errors of misapplication of knowledge. Diagnostic and therapeutic algorithms, once the province of trauma surgeons, are increasingly becoming part of internal medicine.
When I was a house officer we all had our “pocket brains” in our white coats—lists of disease complications, drug doses and interactions, causes of IgA deposition in the kidney, and treatment algorithms. But we believed (probably correctly) that our teachers expected us to commit all these facts to memory in our fleshy brains. The elitist and hubristic belief that this was uniformly possible has lingered in academic medicine, still permeating even the fabric of certification examinations. We learn that it is OK to be honest and say that we don’t know the answer, but we don’t like to have to say it. Physicians finish the academic game of Chutes and Ladders with a strong aversion to being wrong.
Younger doctors today seem more comfortable with not knowing so many facts and bits of medical trivia, being able to find answers instantly using their smart phones. But a challenge is knowing at a glance the context and veracity of the answers you find. And whether the knowledge comes from our anatomic, pocket, or cyber brain, the overarching challenge is to avoid Gawande’s error of misapplication.
In this issue of the Journal, Dr. Nikhil Mull and colleagues dissect a clinical case that did not proceed as expected. They discuss, in reference to the described patient, some of the published analyses of the clinical decision-making process, highlighting various ways that our reasoning can be led astray. Having just finished a stint on the inpatient consultation service, I wish I could have read the article a few weeks ago. A bit of reflection on how we reach decisions can be as powerful as knowing the source of the facts in our pocket brain.
Being wrong, as Schulz has written, is part of the human experience, but I don’t like it. Ways to limit the chances of it’s happening in the clinic are worth keeping on a personal checklist, or perhaps as an app on my smart phone.
- Schulz K. Being Wrong: Adventures in the Margin of Error. New York: Harper Collins, 2010.
- James W. The will to believe. An address to the philosophical clubs of Yale and Brown Universities, 1896. http://educ.jmu.edu//~omearawm/ph101willtobelieve.html. Accessed October 12, 2015.
- Gawande A. The Checklist Manifesto. How to Get Things Right. New York: Metropolitan Books, 2009.
In Being Wrong,1 her treatise on the psychology of human error, Kathryn Schulz quotes William James: “Our errors are surely not such awfully solemn things.”2 Being wrong, she argues, is part of the human genome. Despite aphorisms such as “we learn from our mistakes,” we are far from accepting of mistakes in medical practice. Perhaps naively, I do not believe that our need to understand how clinical errors occur and how to avoid them is based on the fear of legal repercussion. And of course we do not want to harm our patients. But our relationship with medical errors is far more complex than that. We really don’t want to be wrong.
Dr. Atul Gawande3 has promoted using checklists and a structured system to limit errors of misapplication of knowledge. Diagnostic and therapeutic algorithms, once the province of trauma surgeons, are increasingly becoming part of internal medicine.
When I was a house officer we all had our “pocket brains” in our white coats—lists of disease complications, drug doses and interactions, causes of IgA deposition in the kidney, and treatment algorithms. But we believed (probably correctly) that our teachers expected us to commit all these facts to memory in our fleshy brains. The elitist and hubristic belief that this was uniformly possible has lingered in academic medicine, still permeating even the fabric of certification examinations. We learn that it is OK to be honest and say that we don’t know the answer, but we don’t like to have to say it. Physicians finish the academic game of Chutes and Ladders with a strong aversion to being wrong.
Younger doctors today seem more comfortable with not knowing so many facts and bits of medical trivia, being able to find answers instantly using their smart phones. But a challenge is knowing at a glance the context and veracity of the answers you find. And whether the knowledge comes from our anatomic, pocket, or cyber brain, the overarching challenge is to avoid Gawande’s error of misapplication.
In this issue of the Journal, Dr. Nikhil Mull and colleagues dissect a clinical case that did not proceed as expected. They discuss, in reference to the described patient, some of the published analyses of the clinical decision-making process, highlighting various ways that our reasoning can be led astray. Having just finished a stint on the inpatient consultation service, I wish I could have read the article a few weeks ago. A bit of reflection on how we reach decisions can be as powerful as knowing the source of the facts in our pocket brain.
Being wrong, as Schulz has written, is part of the human experience, but I don’t like it. Ways to limit the chances of it’s happening in the clinic are worth keeping on a personal checklist, or perhaps as an app on my smart phone.
- Schulz K. Being Wrong: Adventures in the Margin of Error. New York: Harper Collins, 2010.
- James W. The will to believe. An address to the philosophical clubs of Yale and Brown Universities, 1896. http://educ.jmu.edu//~omearawm/ph101willtobelieve.html. Accessed October 12, 2015.
- Gawande A. The Checklist Manifesto. How to Get Things Right. New York: Metropolitan Books, 2009.
An elderly woman with ‘heart failure’: Cognitive biases and diagnostic error
An elderly Spanish-speaking woman with morbid obesity, diabetes, hypertension, and rheumatoid arthritis presents to the emergency department with worsening shortness of breath and cough. She speaks only Spanish, so her son provides the history without the aid of an interpreter.
Her shortness of breath is most noticeable with exertion and has increased gradually over the past 2 months. She has a nonproductive cough. Her son has noticed decreased oral intake and weight loss over the past few weeks. She has neither traveled recently nor been in contact with anyone known to have an infectious disease.
A review of systems is otherwise negative: specifically, she denies chest pain, fevers, or chills. She saw her primary care physician 3 weeks ago for these complaints and was prescribed a 3-day course of azithromycin with no improvement.
Her medications include lisinopril, atenolol, glipizide, and metformin; her son believes she may be taking others as well but is not sure. He is also unsure of what treatment his mother has received for her rheumatoid arthritis, and most of her medical records are within another health system.
On physical examination, the patient is coughing and appears ill. Her temperature is 99.9°F (37.7°C), heart rate 105 beats per minute, blood pressure 140/70 mm Hg, respiratory rate 24 per minute, and oxygen saturation by pulse oximetry 89% on room air. Heart sounds are normal, jugular venous pressure cannot be assessed because of her obese body habitus, pulmonary examination demonstrates crackles in all lung fields, and lower-extremity edema is not present. Her extremities are warm and well perfused. Musculoskeletal examination reveals deformities of the joints in both hands consistent with rheumatoid arthritis.
Laboratory data:
- White blood cell count 13.0 × 10⁹/L (reference range 3.7–11.0)
- Hemoglobin level 10 g/dL (11.5–15)
- Serum creatinine 1.0 mg/dL (0.7–1.4)
- Pro-brain-type natriuretic peptide (pro-BNP) level greater than the upper limit of normal.
A chest radiograph is obtained, and the resident radiologist’s preliminary impression is that it is consistent with pulmonary vascular congestion.
The patient is admitted for further diagnostic evaluation. The emergency department resident orders intravenous furosemide and signs out to the night float medicine resident that this is an “elderly woman with hypertension, diabetes, and heart failure being admitted for a heart failure exacerbation.”
What is the accuracy of a physician’s initial working diagnosis?
Diagnostic accuracy requires both clinical knowledge and problem-solving skills.1
A decade ago, a National Patient Safety Foundation survey2 found that one in six patients had suffered a medical error related to misdiagnosis. In a large systematic review of autopsy-based diagnostic errors, the theorized rate of major errors ranged from 8.4% to as high as 24.4%.3 A study by Neale et al4 found that admitting diagnoses were incorrect in 6% of cases. In emergency departments, inaccuracy rates of up to 12% have been described.5
What factors influence the prevalence of diagnostic errors?
Initial empiric treatments, such as intravenous furosemide in the above scenario, add to the challenge of diagnosis in acute care settings and can influence clinical decisions made by subsequent providers.6
Nonspecific or vague symptoms make diagnosis especially challenging. Shortness of breath, for example, is a common chief complaint in medical patients, as in this case. Green et al7 found emergency department physicians reported clinical uncertainty for a diagnosis of heart failure in 31% of patients evaluated for “dyspnea.” Pulmonary embolism and pulmonary tuberculosis are also in the differential diagnosis for our patient, with studies reporting a misdiagnosis rate of 55% for pulmonary embolism8 and 50% for pulmonary tuberculosis.9
Hertwig et al,10 describing the diagnostic process in patients presenting to emergency departments with a nonspecific constellation of symptoms, found particularly low rates of agreement between the initial diagnostic impression and the final, correct one. In fact, the actual diagnosis was only in the physician’s initial “top three” differential diagnoses 29% to 83% of the time.
Atypical presentations of common diseases, initial nonspecific presentations of common diseases, and confounding comorbid conditions have also been associated with misdiagnosis.11 Our case scenario illustrates the frequent challenges physicians face when diagnosing patients who present with nonspecific symptoms and signs on a background of multiple, chronic comorbidities.
Contextual factors in the system and environment contribute to the potential for error.12 Examples include frequent interruptions, time pressure, poor handoffs, insufficient data, and multitasking.
In our scenario, incomplete data, time constraints, and multitasking in a busy work environment compelled the emergency department resident to rapidly synthesize information to establish a working diagnosis. Interpretations of radiographs by on-call radiology residents are similarly at risk of diagnostic error for the same reasons.13
Physician factors also influence diagnosis. Interestingly, physician certainty or uncertainty at the time of initial diagnosis does not uniformly appear to correlate with diagnostic accuracy. A recent study showed that physician confidence remained high regardless of the degree of difficulty in a given case, and degree of confidence also correlated poorly with whether the physician’s diagnosis was accurate.14
For patients admitted with a chief complaint of dyspnea, as in our scenario, Zwaan et al15 showed that “inappropriate selectivity” in reasoning contributed to an inaccurate diagnosis 23% of the time. Inappropriate selectivity, as defined by these authors, occurs when a probable diagnosis is not sufficiently considered and therefore is neither confirmed nor ruled out.
In our patient scenario, the failure to consider diagnoses other than heart failure and the inability to confirm a prior diagnosis of heart failure in the emergency department may contribute to a diagnostic error.
CASE CONTINUED: NO IMPROVEMENT OVER 3 DAYS
The night float resident, who has six other admissions this night, cannot ask the resident who evaluated this patient in the emergency department for further information because the shift has ended. The patient’s son left at the time of admission and is not available when the patient arrives on the medical ward.
The night float resident quickly examines the patient, enters admission orders, and signs the patient out to the intern and resident who will be caring for her during her hospitalization. The verbal handoff notes that the history was limited due to a language barrier. The initial problem list includes heart failure without a differential diagnosis, but notes that an elevated pro-BNP and chest radiograph confirm heart failure as the likely diagnosis.
Several hours after the night float resident has left, the resident presents this history to the attending physician, and together they decide to order her regular at-home medications, as well as deep vein thrombosis prophylaxis and echocardiography. In writing the orders, subcutaneous heparin once daily is erroneously entered instead of low-molecular-weight heparin daily, as this is the default in the medical record system. The tired resident fails to recognize this, and the pharmacist does not question it.
Over the next 2 days, the patient’s cough and shortness of breath persist.
On hospital day 3, two junior residents on the team (who finished their internship 2 weeks ago) review the attending radiologist’s interpretation of the chest radiograph. Unflagged, it confirms the resident’s interpretation but notes ill-defined, scattered, faint opacities. The residents believe that an interstitial pattern may be present and suggest that the patient may not have heart failure but rather a primary pulmonary disease. They bring this to the attention of their attending physician, who dismisses their concerns and comments that heart failure is a clinical diagnosis. The residents do not bring this idea up again to the attending physician.
That night, the float team is called by the nursing staff because of worsening oxygenation and cough. They add an intravenous corticosteroid, a broad-spectrum antibiotic, and an inhaled bronchodilator to the patient’s drug regimen.
How do cognitive errors predispose physicians to diagnostic errors?
When errors in diagnosis are reviewed retrospectively, cognitive or “thinking” errors are generally found, especially in nonprocedural or primary care specialties such as internal medicine, pediatrics, and emergency medicine.16,17
A widely accepted theory on how humans make decisions was described by the psychologists Tversky and Kahneman in 197418 and has been applied more recently to physicians’ diagnostic processes.19 Their dual process model theory states that persons with a requisite level of expertise use either the intuitive “system 1” process of thinking, based on pattern-recognition and heuristics, or the slower, more analytical “system 2” process.20 Experts disagree as to whether in medicine these processes represent a binary either-or model or a continuum21 with relative contributions of each process determined by the physician and the task.
What are some common types of cognitive error?
Experts agree that many diagnostic errors in medicine stem from decisions arrived at by inappropriate system 1 thinking due to biases. These biases have been identified and described as they relate to medicine, most notably by Croskerry.22
Several cognitive biases are illustrated in our clinical scenario:
The framing effect occurred when the emergency department resident listed the patient’s admitting diagnosis as heart failure during the clinical handoff of care.
Anchoring bias, as defined by Croskerry,22 is the tendency to lock onto salient features of the case too early in the diagnostic process and then to fail to adjust this initial diagnostic impression. This bias affected the admitting night float resident, primary intern, resident, and attending physician.
Diagnostic momentum, in turn, is a well-described phenomenon that clinical providers are especially vulnerable to in today’s environment of “copy-and-paste” medical records and numerous handovers of care as a consequence of residency duty-hour restrictions.23
Availability bias refers to commonly seen diagnoses like heart failure or recently seen diagnoses, which are more “available” to the human memory. These diagnoses, which spring to mind quickly, often trick providers into thinking that because they are more easily recalled, they are also more common or more likely.
Confirmation bias. The initial working diagnosis of heart failure may have led the medical team to place greater emphasis on the elevated pro-BNP and the chest radiograph to support the initial impression while ignoring findings such as weight loss that do not support this impression.
Blind obedience. Although the residents recognized the possibility of a primary pulmonary disease, they did not investigate this further. And when the attending physician dismissed their suggestion, they thus deferred to the person in authority or with a reputation of expertise.
Overconfidence bias. Despite minimal improvement in the patient’s clinical status after effective diuresis and the suggestion of alternative diagnoses by the residents, the attending physician remained confident—perhaps overconfident—in the diagnosis of heart failure and would not consider alternatives. Overconfidence bias has been well described and occurs when a medical provider believes too strongly in his or her ability to be correct and therefore fails to consider alternative diagnoses.24
Despite succumbing to overconfidence bias, the attending physician was able to overcome base-rate neglect, ie, failure to consider the prevalence of potential diagnoses in diagnostic reasoning.

Each of these biases, and others not mentioned, can lead to premature closure, which is the unfortunate root cause of many diagnostic errors and delays. We have illustrated several biases in our case scenario that led several physicians on the medical team to prematurely “close” on the diagnosis of heart failure (Table 1).
CASE CONTINUED: SURPRISES AND REASSESSMENT
On hospital day 4, the patient’s medication lists from her previous hospitalizations arrive, and the team is surprised to discover that she has been receiving infliximab for the past 3 to 4 months for her rheumatoid arthritis.
Additionally, an echocardiogram that was ordered on hospital day 1 but was lost in the cardiologist’s reading queue comes in and shows a normal ejection fraction with no evidence of elevated filling pressures.
Computed tomography of the chest reveals a reticular pattern with innumerable, tiny, 1- to 2-mm pulmonary nodules. The differential diagnosis is expanded to include hypersensitivity pneumonitis, lymphoma, fungal infection, and miliary tuberculosis.
How do faulty systems contribute to diagnostic error?
It is increasingly recognized that diagnostic errors can occur as a result of cognitive error, systems-based error, or quite commonly, both. Graber et al17 analyzed 100 cases of diagnostic error and determined that while cognitive errors did occur in most of them, nearly half the time both cognitive and systems-based errors contributed simultaneously.17 Observers have further delineated the importance of the systems context and how it affects our thinking.25
In this case, the language barrier, lack of availability of family, and inability to promptly utilize interpreter services contributed to early problems in acquiring a detailed history and a complete medication list that included the immunosuppressant infliximab. Later, a systems error led to a delay in the interpretation of an echocardiogram. Each of these factors, if prevented, would have presumably resulted in expansion of the differential diagnosis and earlier arrival at the correct diagnosis.
CASE CONTINUED: THE PATIENT DIES OF TUBERCULOSIS
The patient is moved to a negative pressure room, and the pulmonary consultants recommend bronchoscopy. During the procedure, the patient suffers acute respiratory failure, is intubated, and is transferred to the medical intensive care unit, where a saddle pulmonary embolism is diagnosed by computed tomographic angiography.
One day later, the sputum culture from the bronchoscopy returns as positive for acid-fast bacilli. A four-drug regimen for tuberculosis is started. The patient continues to have a downward course and expires 2 weeks later. Autopsy reveals miliary tuberculosis.
What is the frequency of diagnostic error in medicine?
Diagnostic error is estimated to have a frequency of 10% to 20%.24 Rates of diagnostic error are similar irrespective of method of determination, eg, from autopsy,3 standardized patients (ie, actors presenting with scripted scenarios),26 or case reviews.27 Patient surveys report patient-perceived harm from diagnostic error at a rate of 35% to 42%.28,29 The landmark Harvard Medical Practice Study found that 17% of all adverse events were attributable to diagnostic error.30
Diagnostic error is the most common type of medical error in nonprocedural medical fields.31 It causes a disproportionately large amount of morbidity and death.
Diagnostic error is the most common cause of malpractice claims in the United States. In inpatient and outpatient settings, for both medical and surgical patients, it accounted for 45.9% of all outpatient malpractice claims in 2009, making it the most common reason for medical malpractice litigation.32 A 2013 study indicated that diagnostic error is more common, more expensive, and two times more likely to result in death than any other category of error.33
CASE CONTINUED: MORBIDITY AND MORTALITY CONFERENCE
The patient’s case is brought to a morbidity and mortality conference for discussion. The systems issues in the case—including medication reconciliation, availability of interpreters, and timing and process of echocardiogram readings—are all discussed, but clinical reasoning and cognitive errors made in the case are avoided.
Why are cognitive errors often neglected in discussions of medical error?
Historically, openly discussing error in medicine has been difficult. Over the past decade, however, and fueled by the landmark Institute of Medicine report To Err is Human,34 the healthcare community has made substantial strides in identifying and talking about systems factors as a cause of preventable medical error.34,35
While systems contributions to medical error are inherently “external” to physicians and other healthcare providers, the cognitive contributions to error are inherently “internal” and are often considered personal. This has led to diagnostic error being kept out of many patient safety conversations. Further, while the solutions to systems errors are often tangible, such as implementing a fall prevention program or changing the physical packaging of a medication to reduce a medication dispensing or administration error, solutions to cognitive errors are generally considered more challenging to address by organizations trying to improve patient safety.
How can hospitals and department leaders do better?
Healthcare organizations and leaders of clinical teams or departments can implement several strategies.36
First, they can seek out and analyze the causes of diagnostic errors that are occurring locally in their institution and learn from their diagnostic errors, such as the one in our clinical scenario.
Second, they can promote a culture of open communication and questioning around diagnosis. Trainees, physicians, and nurses should be comfortable questioning each other, including those higher up in the hierarchy, by saying, “I’m not sure” or “What else could this be?” to help reduce cognitive bias and expand the diagnostic possibilities.
Similarly, developing strategies to promote feedback on diagnosis among physicians will allow us all to learn from our diagnostic mistakes.
Use of the electronic medical record to assist in follow-up of pending diagnostic studies and patient return visits is yet another strategy.
Finally, healthcare organizations can adopt strategies to promote patient involvement in diagnosis, such as providing patients with copies of their test results and discharge summaries, encouraging the use of electronic patient communication portals, and empowering patients to ask questions related to their diagnosis. Prioritizing potential solutions to reduce diagnostic errors may be helpful in situations, depending on the context and environment, in which all proposed interventions may not be possible.
CASE CONTINUED: LEARNING FROM MISTAKES
The attending physician and resident in the case meet after the conference to review their clinical decision-making. Both are interested in learning from this case and improving their diagnostic skills in the future.
What specific steps can clinicians take to mitigate cognitive bias in daily practice?
In addition to continuing to expand one’s medical knowledge and gain more clinical experience, we can suggest several small steps to busy clinicians, taken individually or in combination with others that may improve diagnostic skills by reducing the potential for biased thinking in clinical practice.

Think about your thinking. Our first recommendation would be to become more familiar with the dual process theory of clinical cognition (Figure 1).37,38 This theoretical framework may be very helpful as a foundation from which to build better thinking skills. Physicians, especially residents, and students can be taught these concepts and their potential to contribute to diagnostic errors, and can use these skills to recognize those contributions in others’ diagnostic practices and even in their own.39
Facilitating metacognition, or “thinking about one’s thinking,” may help clinicians catch themselves in thinking traps and provide the opportunity to reflect on biases retrospectively, as a double check or an opportunity to learn from a mistake.
Recognize your emotions. Gaining an understanding of the effect of one’s emotions on decision-making also can help clinicians free themselves of bias. As human beings, healthcare professionals are susceptible to emotion, and the best approach to mitigate the emotional influences may be to consciously name them and adjust for them.40
Because it is impractical to apply slow, analytical system 2 approaches to every case, skills that hone and develop more accurate, reliable system 1 thinking are crucial. Gaining broad exposure to increased numbers of cases may be the most reliable way to build an experiential repertoire of “illness scripts,” but there are ways to increase the experiential value of any case with a few techniques that have potential to promote better intuition.41
Embracing uncertainty in the early diagnostic process and envisioning the worst-case scenario in a case allows the consideration of additional diagnostic paths outside of the current working diagnosis, potentially priming the clinician to look for and recognize early warning signs that could argue against the initial diagnosis at a time when an adjustment could be made to prevent a bad outcome.
Practice progressive problem-solving,42 a technique in which the physician creates additional challenges to increase the cognitive burden of a “routine” case in an effort to train his or her mind and sharpen intuition. An example of this practice is contemplating a backup treatment plan in advance in the event of a poor response to or an adverse effect of treatment. Highly rated physicians and teachers perform this regularly.43,44 Other ways to maximize the learning value of an individual case include seeking feedback on patient outcomes, especially when a patient has been discharged or transferred to another provider’s care, or when the physician goes off service.
Simulation, traditionally used for procedural training, has potential as well. Cognitive simulation, such as case reports or virtual patient modules, have potential to enhance clinical reasoning skills as well, though possibly at greater cost of time and expense.
Decreased reliance on memory is likely to improve diagnostic reasoning. Systems tools such as checklists45 and health information technology46 have potential to reduce diagnostic errors, not by taking thinking away from the clinician but by relieving the cognitive load enough to facilitate greater effort toward reasoning.
Slow down. Finally, and perhaps most important, recent models of clinical expertise have suggested that mastery comes from having a robust intuitive method, with a sense of the limitations of the intuitive approach, an ability to recognize the need to perform more analytical reasoning in select cases, and the willingness to do so. In short, it may well be that the hallmark of a master clinician is the propensity to slow down when necessary.47
If one considers diagnosis a cognitive procedure, perhaps a brief “diagnostic time-out” for safety might afford an opportunity to recognize and mitigate biases and errors. There are likely many potential scripts for a good diagnostic time-out, but to be functional it should be brief and simple to facilitate consistent use. We have recommended the following four questions to our residents as a starting point, any of which could signal the need to switch to a slower, analytic approach.
Four-step diagnostic time-out
- What else can it be?
- Is there anything about the case that does not fit?
- Is it possible that multiple processes are going on?
- Do I need to slow down?
These questions can serve as a double check for an intuitively formed initial working diagnosis, incorporating many of the principles discussed above, in a way that would hopefully avoid undue burden on a busy clinician. These techniques, it must be acknowledged, have not yet been directly tied to reductions in diagnostic errors. However, diagnostic errors, as discussed, are very difficult to identify and study, and these techniques will serve mainly to improve habits that are likely to show benefits over much longer time periods than most studies can measure.
- Kassirer JP. Diagnostic reasoning. Ann Intern Med 1989; 110:893–900.
- Golodner L. How the public perceives patient safety. Newsletter of the National Patient Safety Foundation 2004; 1997:1–6.
- Shojania KG, Burton EC, McDonald KM, Goldman L. Changes in rates of autopsy-detected diagnostic errors over time: a systematic review. JAMA 2003; 289:2849–2856.
- Neale G, Woloshynowych M, Vincent C. Exploring the causes of adverse events in NHS hospital practice. J R Soc Med 2001; 94:322–330.
- Chellis M, Olson J, Augustine J, Hamilton G. Evaluation of missed diagnoses for patients admitted from the emergency department. Acad Emerg Med 2001; 8:125–130.
- Tallentire VR, Smith SE, Skinner J, Cameron HS. Exploring error in team-based acute care scenarios: an observational study from the United Kingdom. Acad Med 2012; 87:792–798.
- Green SM, Martinez-Rumayor A, Gregory SA, et al. Clinical uncertainty, diagnostic accuracy, and outcomes in emergency department patients presenting with dyspnea. Arch Intern Med 2008; 168:741–748.
- Pineda LA, Hathwar VS, Grant BJ. Clinical suspicion of fatal pulmonary embolism. Chest 2001; 120:791–795.
- Shojania KG, Burton EC, McDonald KM, Goldman L. The autopsy as an outcome and performance measure. Evid Rep Technol Assess (Summ) 2002; 58:1–5.
- Hertwig R, Meier N, Nickel C, et al. Correlates of diagnostic accuracy in patients with nonspecific complaints. Med Decis Making 2013; 33:533–543.
- Kostopoulou O, Delaney BC, Munro CW. Diagnostic difficulty and error in primary care—a systematic review. Fam Pract 2008; 25:400–413.
- Ogdie AR, Reilly JB, Pang WG, et al. Seen through their eyes: residents’ reflections on the cognitive and contextual components of diagnostic errors in medicine. Acad Med 2012; 87:1361–1367.
- Feldmann EJ, Jain VR, Rakoff S, Haramati LB. Radiology residents’ on-call interpretation of chest radiographs for congestive heart failure. Acad Radiol 2007; 14:1264–1270.
- Meyer AN, Payne VL, Meeks DW, Rao R, Singh H. Physicians’ diagnostic accuracy, confidence, and resource requests: a vignette study. JAMA Intern Med 2013; 173:1952–1958.
- Zwaan L, Thijs A, Wagner C, Timmermans DR. Does inappropriate selectivity in information use relate to diagnostic errors and patient harm? The diagnosis of patients with dyspnea. Soc Sci Med 2013; 91:32–38.
- Schiff GD, Hasan O, Kim S, et al. Diagnostic error in medicine: analysis of 583 physician-reported errors. Arch Intern Med 2009; 169:1881–1887.
- Graber ML, Franklin N, Gordon R. Diagnostic error in internal medicine. Arch Intern Med 2005; 165:1493–1499.
- Tversky A, Kahneman D. Judgment under uncertainty: heuristics and biases. Science 1974; 185:1124–1131.
- Kahneman D. Thinking, fast and slow. New York, NY: Farrar, Straus, and Giroux; 2011.
- Croskerry P. A universal model of diagnostic reasoning. Acad Med 2009; 84:1022–1028.
- Custers EJ. Medical education and cognitive continuum theory: an alternative perspective on medical problem solving and clinical reasoning. Acad Med 2013; 88:1074–1080.
- Croskerry P. The importance of cognitive errors in diagnosis and strategies to minimize them. Acad Med 2003; 78:775–780.
- Hirschtick RE. A piece of my mind. Copy-and-paste. JAMA 2006; 295:2335–2336.
- Berner ES, Graber ML. Overconfidence as a cause of diagnostic error in medicine. Am J Med 2008;121(suppl 5):S2–S23.
- Henriksen K, Brady J. The pursuit of better diagnostic performance: a human factors perspective. BMJ Qual Saf 2013; 22(suppl 2):ii1–ii5.
- Peabody JW, Luck J, Jain S, Bertenthal D, Glassman P. Assessing the accuracy of administrative data in health information systems. Med Care 2004; 42:1066–1072.
- Hogan H, Healey F, Neale G, Thomson R, Vincent C, Black N. Preventable deaths due to problems in care in English acute hospitals: a retrospective case record review study. BMJ Qual Saf 2012; 21:737–745.
- Blendon RJ, DesRoches CM, Brodie M, et al. Views of practicing physicians and the public on medical errors. N Engl J Med 2002; 347:1933–1940.
- Burroughs TE, Waterman AD, Gallagher TH, et al. Patient concerns about medical errors in emergency departments. Acad Emerg Med 2005; 12:57–64.
- Leape LL, Brennan TA, Laird N, et al. The nature of adverse events in hospitalized patients. Results of the Harvard Medical Practice Study II. N Engl J Med 1991; 324:377–384.
- Thomas EJ, Studdert DM, Burstin HR, et al. Incidence and types of adverse events and negligent care in Utah and Colorado. Med Care 2000; 38:261–271.
- Bishop TF, Ryan AM, Casalino LP. Paid malpractice claims for adverse events in inpatient and outpatient settings. JAMA 2011; 305:2427–2431.
- Saber Tehrani AS, Lee H, Mathews SC, et al. 25-year summary of US malpractice claims for diagnostic errors 1986–2010: an analysis from the national practitioner data bank. BMJ Qual Saf 2013; 22:672–680.
- Kohn LT, Corrigan JM, Donaldson MS. To err is human: building a safer health system. Washington, DC: The National Academies Press; 2000.
- Singh H. Diagnostic errors: moving beyond ‘no respect’ and getting ready for prime time. BMJ Qual Saf 2013; 22:789–792.
- Graber ML, Trowbridge R, Myers JS, Umscheid CA, Strull W, Kanter MH. The next organizational challenge: finding and addressing diagnostic error. Jt Comm J Qual Patient Saf 2014; 40:102–110.
- Croskerry P. Clinical cognition and diagnostic error: applications of a dual process model of reasoning. Adv Health Sci Educ Theory Pract 2009; 14(suppl 1):27–35.
- Norman G. Dual processing and diagnostic errors. Adv Health Sci Educ Theory Pract 2009; 14(suppl 1):37–49.
- Reilly JB, Ogdie AR, Von Feldt JM, Myers JS. Teaching about how doctors think: a longitudinal curriculum in cognitive bias and diagnostic error for residents. BMJ Qual Saf 2013; 22:1044–1050.
- Croskerry P, Abbass A, Wu AW. Emotional influences in patient safety. J Patient Saf 2010; 6:199–205.
- Rajkomar A, Dhaliwal G. Improving diagnostic reasoning to improve patient safety. Perm J 2011; 15:68–73.
- Trowbridge RL, Dhaliwal G, Cosby KS. Educational agenda for diagnostic error reduction. BMJ Qual Saf 2013; 22(suppl 2):ii28–ii32.
- Sargeant J, Mann K, Sinclair D, et al. Learning in practice: experiences and perceptions of high-scoring physicians. Acad Med 2006; 81:655–660.
- Mylopoulos M, Lohfeld L, Norman GR, Dhaliwal G, Eva KW. Renowned physicians' perceptions of expert diagnostic practice. Acad Med 2012; 87:1413–1417.
- Sibbald M, de Bruin AB, van Merrienboer JJ. Checklists improve experts' diagnostic decisions. Med Educ 2013; 47:301–308.
- El-Kareh R, Hasan O, Schiff GD. Use of health information technology to reduce diagnostic errors. BMJ Qual Saf 2013; 22(suppl 2):ii40–ii51.
- Moulton CA, Regehr G, Mylopoulos M, MacRae HM. Slowing down when you should: a new model of expert judgment. Acad Med 2007; 82(suppl 10):S109–S116.
An elderly Spanish-speaking woman with morbid obesity, diabetes, hypertension, and rheumatoid arthritis presents to the emergency department with worsening shortness of breath and cough. She speaks only Spanish, so her son provides the history without the aid of an interpreter.
Her shortness of breath is most noticeable with exertion and has increased gradually over the past 2 months. She has a nonproductive cough. Her son has noticed decreased oral intake and weight loss over the past few weeks. She has neither traveled recently nor been in contact with anyone known to have an infectious disease.
A review of systems is otherwise negative: specifically, she denies chest pain, fevers, or chills. She saw her primary care physician 3 weeks ago for these complaints and was prescribed a 3-day course of azithromycin with no improvement.
Her medications include lisinopril, atenolol, glipizide, and metformin; her son believes she may be taking others as well but is not sure. He is also unsure of what treatment his mother has received for her rheumatoid arthritis, and most of her medical records are within another health system.
On physical examination, the patient is coughing and appears ill. Her temperature is 99.9°F (37.7°C), heart rate 105 beats per minute, blood pressure 140/70 mm Hg, respiratory rate 24 per minute, and oxygen saturation by pulse oximetry 89% on room air. Heart sounds are normal, jugular venous pressure cannot be assessed because of her obese body habitus, pulmonary examination demonstrates crackles in all lung fields, and lower-extremity edema is not present. Her extremities are warm and well perfused. Musculoskeletal examination reveals deformities of the joints in both hands consistent with rheumatoid arthritis.
Laboratory data:
- White blood cell count 13.0 × 10⁹/L (reference range 3.7–11.0)
- Hemoglobin level 10 g/dL (11.5–15)
- Serum creatinine 1.0 mg/dL (0.7–1.4)
- Pro-brain-type natriuretic peptide (pro-BNP) level greater than the upper limit of normal.
A chest radiograph is obtained, and the resident radiologist’s preliminary impression is that it is consistent with pulmonary vascular congestion.
The patient is admitted for further diagnostic evaluation. The emergency department resident orders intravenous furosemide and signs out to the night float medicine resident that this is an “elderly woman with hypertension, diabetes, and heart failure being admitted for a heart failure exacerbation.”
What is the accuracy of a physician’s initial working diagnosis?
Diagnostic accuracy requires both clinical knowledge and problem-solving skills.1
A decade ago, a National Patient Safety Foundation survey2 found that one in six patients had suffered a medical error related to misdiagnosis. In a large systematic review of autopsy-based diagnostic errors, the theorized rate of major errors ranged from 8.4% to as high as 24.4%.3 A study by Neale et al4 found that admitting diagnoses were incorrect in 6% of cases. In emergency departments, inaccuracy rates of up to 12% have been described.5
What factors influence the prevalence of diagnostic errors?
Initial empiric treatments, such as intravenous furosemide in the above scenario, add to the challenge of diagnosis in acute care settings and can influence clinical decisions made by subsequent providers.6
Nonspecific or vague symptoms make diagnosis especially challenging. Shortness of breath, for example, is a common chief complaint in medical patients, as in this case. Green et al7 found emergency department physicians reported clinical uncertainty for a diagnosis of heart failure in 31% of patients evaluated for “dyspnea.” Pulmonary embolism and pulmonary tuberculosis are also in the differential diagnosis for our patient, with studies reporting a misdiagnosis rate of 55% for pulmonary embolism8 and 50% for pulmonary tuberculosis.9
Hertwig et al,10 describing the diagnostic process in patients presenting to emergency departments with a nonspecific constellation of symptoms, found particularly low rates of agreement between the initial diagnostic impression and the final, correct one. In fact, the actual diagnosis was only in the physician’s initial “top three” differential diagnoses 29% to 83% of the time.
Atypical presentations of common diseases, initial nonspecific presentations of common diseases, and confounding comorbid conditions have also been associated with misdiagnosis.11 Our case scenario illustrates the frequent challenges physicians face when diagnosing patients who present with nonspecific symptoms and signs on a background of multiple, chronic comorbidities.
Contextual factors in the system and environment contribute to the potential for error.12 Examples include frequent interruptions, time pressure, poor handoffs, insufficient data, and multitasking.
In our scenario, incomplete data, time constraints, and multitasking in a busy work environment compelled the emergency department resident to rapidly synthesize information to establish a working diagnosis. Interpretations of radiographs by on-call radiology residents are similarly at risk of diagnostic error for the same reasons.13
Physician factors also influence diagnosis. Interestingly, physician certainty or uncertainty at the time of initial diagnosis does not uniformly appear to correlate with diagnostic accuracy. A recent study showed that physician confidence remained high regardless of the degree of difficulty in a given case, and degree of confidence also correlated poorly with whether the physician’s diagnosis was accurate.14
For patients admitted with a chief complaint of dyspnea, as in our scenario, Zwaan et al15 showed that “inappropriate selectivity” in reasoning contributed to an inaccurate diagnosis 23% of the time. Inappropriate selectivity, as defined by these authors, occurs when a probable diagnosis is not sufficiently considered and therefore is neither confirmed nor ruled out.
In our patient scenario, the failure to consider diagnoses other than heart failure and the inability to confirm a prior diagnosis of heart failure in the emergency department may contribute to a diagnostic error.
CASE CONTINUED: NO IMPROVEMENT OVER 3 DAYS
The night float resident, who has six other admissions this night, cannot ask the resident who evaluated this patient in the emergency department for further information because the shift has ended. The patient’s son left at the time of admission and is not available when the patient arrives on the medical ward.
The night float resident quickly examines the patient, enters admission orders, and signs the patient out to the intern and resident who will be caring for her during her hospitalization. The verbal handoff notes that the history was limited due to a language barrier. The initial problem list includes heart failure without a differential diagnosis, but notes that an elevated pro-BNP and chest radiograph confirm heart failure as the likely diagnosis.
Several hours after the night float resident has left, the resident presents this history to the attending physician, and together they decide to order her regular at-home medications, as well as deep vein thrombosis prophylaxis and echocardiography. In writing the orders, subcutaneous heparin once daily is erroneously entered instead of low-molecular-weight heparin daily, as this is the default in the medical record system. The tired resident fails to recognize this, and the pharmacist does not question it.
Over the next 2 days, the patient’s cough and shortness of breath persist.
On hospital day 3, two junior residents on the team (who finished their internship 2 weeks ago) review the attending radiologist’s interpretation of the chest radiograph. Unflagged, it confirms the resident’s interpretation but notes ill-defined, scattered, faint opacities. The residents believe that an interstitial pattern may be present and suggest that the patient may not have heart failure but rather a primary pulmonary disease. They bring this to the attention of their attending physician, who dismisses their concerns and comments that heart failure is a clinical diagnosis. The residents do not bring this idea up again to the attending physician.
That night, the float team is called by the nursing staff because of worsening oxygenation and cough. They add an intravenous corticosteroid, a broad-spectrum antibiotic, and an inhaled bronchodilator to the patient’s drug regimen.
How do cognitive errors predispose physicians to diagnostic errors?
When errors in diagnosis are reviewed retrospectively, cognitive or “thinking” errors are generally found, especially in nonprocedural or primary care specialties such as internal medicine, pediatrics, and emergency medicine.16,17
A widely accepted theory on how humans make decisions was described by the psychologists Tversky and Kahneman in 197418 and has been applied more recently to physicians’ diagnostic processes.19 Their dual process model theory states that persons with a requisite level of expertise use either the intuitive “system 1” process of thinking, based on pattern-recognition and heuristics, or the slower, more analytical “system 2” process.20 Experts disagree as to whether in medicine these processes represent a binary either-or model or a continuum21 with relative contributions of each process determined by the physician and the task.
What are some common types of cognitive error?
Experts agree that many diagnostic errors in medicine stem from decisions arrived at by inappropriate system 1 thinking due to biases. These biases have been identified and described as they relate to medicine, most notably by Croskerry.22
Several cognitive biases are illustrated in our clinical scenario:
The framing effect occurred when the emergency department resident listed the patient’s admitting diagnosis as heart failure during the clinical handoff of care.
Anchoring bias, as defined by Croskerry,22 is the tendency to lock onto salient features of the case too early in the diagnostic process and then to fail to adjust this initial diagnostic impression. This bias affected the admitting night float resident, primary intern, resident, and attending physician.
Diagnostic momentum, in turn, is a well-described phenomenon that clinical providers are especially vulnerable to in today’s environment of “copy-and-paste” medical records and numerous handovers of care as a consequence of residency duty-hour restrictions.23
Availability bias refers to commonly seen diagnoses like heart failure or recently seen diagnoses, which are more “available” to the human memory. These diagnoses, which spring to mind quickly, often trick providers into thinking that because they are more easily recalled, they are also more common or more likely.
Confirmation bias. The initial working diagnosis of heart failure may have led the medical team to place greater emphasis on the elevated pro-BNP and the chest radiograph to support the initial impression while ignoring findings such as weight loss that do not support this impression.
Blind obedience. Although the residents recognized the possibility of a primary pulmonary disease, they did not investigate this further. And when the attending physician dismissed their suggestion, they thus deferred to the person in authority or with a reputation of expertise.
Overconfidence bias. Despite minimal improvement in the patient’s clinical status after effective diuresis and the suggestion of alternative diagnoses by the residents, the attending physician remained confident—perhaps overconfident—in the diagnosis of heart failure and would not consider alternatives. Overconfidence bias has been well described and occurs when a medical provider believes too strongly in his or her ability to be correct and therefore fails to consider alternative diagnoses.24
Despite succumbing to overconfidence bias, the attending physician was able to overcome base-rate neglect, ie, failure to consider the prevalence of potential diagnoses in diagnostic reasoning.
Each of these biases, and others not mentioned, can lead to premature closure, which is the unfortunate root cause of many diagnostic errors and delays. We have illustrated several biases in our case scenario that led several physicians on the medical team to prematurely “close” on the diagnosis of heart failure (Table 1).
CASE CONTINUED: SURPRISES AND REASSESSMENT
On hospital day 4, the patient’s medication lists from her previous hospitalizations arrive, and the team is surprised to discover that she has been receiving infliximab for the past 3 to 4 months for her rheumatoid arthritis.
Additionally, an echocardiogram that was ordered on hospital day 1 but was lost in the cardiologist’s reading queue comes in and shows a normal ejection fraction with no evidence of elevated filling pressures.
Computed tomography of the chest reveals a reticular pattern with innumerable, tiny, 1- to 2-mm pulmonary nodules. The differential diagnosis is expanded to include hypersensitivity pneumonitis, lymphoma, fungal infection, and miliary tuberculosis.
How do faulty systems contribute to diagnostic error?
It is increasingly recognized that diagnostic errors can occur as a result of cognitive error, systems-based error, or quite commonly, both. Graber et al17 analyzed 100 cases of diagnostic error and determined that while cognitive errors did occur in most of them, nearly half the time both cognitive and systems-based errors contributed simultaneously.17 Observers have further delineated the importance of the systems context and how it affects our thinking.25
In this case, the language barrier, lack of availability of family, and inability to promptly utilize interpreter services contributed to early problems in acquiring a detailed history and a complete medication list that included the immunosuppressant infliximab. Later, a systems error led to a delay in the interpretation of an echocardiogram. Each of these factors, if prevented, would have presumably resulted in expansion of the differential diagnosis and earlier arrival at the correct diagnosis.
CASE CONTINUED: THE PATIENT DIES OF TUBERCULOSIS
The patient is moved to a negative pressure room, and the pulmonary consultants recommend bronchoscopy. During the procedure, the patient suffers acute respiratory failure, is intubated, and is transferred to the medical intensive care unit, where a saddle pulmonary embolism is diagnosed by computed tomographic angiography.
One day later, the sputum culture from the bronchoscopy returns as positive for acid-fast bacilli. A four-drug regimen for tuberculosis is started. The patient continues to have a downward course and expires 2 weeks later. Autopsy reveals miliary tuberculosis.
What is the frequency of diagnostic error in medicine?
Diagnostic error is estimated to have a frequency of 10% to 20%.24 Rates of diagnostic error are similar irrespective of method of determination, eg, from autopsy,3 standardized patients (ie, actors presenting with scripted scenarios),26 or case reviews.27 Patient surveys report patient-perceived harm from diagnostic error at a rate of 35% to 42%.28,29 The landmark Harvard Medical Practice Study found that 17% of all adverse events were attributable to diagnostic error.30
Diagnostic error is the most common type of medical error in nonprocedural medical fields.31 It causes a disproportionately large amount of morbidity and death.
Diagnostic error is the most common cause of malpractice claims in the United States. In inpatient and outpatient settings, for both medical and surgical patients, it accounted for 45.9% of all outpatient malpractice claims in 2009, making it the most common reason for medical malpractice litigation.32 A 2013 study indicated that diagnostic error is more common, more expensive, and two times more likely to result in death than any other category of error.33
CASE CONTINUED: MORBIDITY AND MORTALITY CONFERENCE
The patient’s case is brought to a morbidity and mortality conference for discussion. The systems issues in the case—including medication reconciliation, availability of interpreters, and timing and process of echocardiogram readings—are all discussed, but clinical reasoning and cognitive errors made in the case are avoided.
Why are cognitive errors often neglected in discussions of medical error?
Historically, openly discussing error in medicine has been difficult. Over the past decade, however, and fueled by the landmark Institute of Medicine report To Err is Human,34 the healthcare community has made substantial strides in identifying and talking about systems factors as a cause of preventable medical error.34,35
While systems contributions to medical error are inherently “external” to physicians and other healthcare providers, the cognitive contributions to error are inherently “internal” and are often considered personal. This has led to diagnostic error being kept out of many patient safety conversations. Further, while the solutions to systems errors are often tangible, such as implementing a fall prevention program or changing the physical packaging of a medication to reduce a medication dispensing or administration error, solutions to cognitive errors are generally considered more challenging to address by organizations trying to improve patient safety.
How can hospitals and department leaders do better?
Healthcare organizations and leaders of clinical teams or departments can implement several strategies.36
First, they can seek out and analyze the causes of diagnostic errors that are occurring locally in their institution and learn from their diagnostic errors, such as the one in our clinical scenario.
Second, they can promote a culture of open communication and questioning around diagnosis. Trainees, physicians, and nurses should be comfortable questioning each other, including those higher up in the hierarchy, by saying, “I’m not sure” or “What else could this be?” to help reduce cognitive bias and expand the diagnostic possibilities.
Similarly, developing strategies to promote feedback on diagnosis among physicians will allow us all to learn from our diagnostic mistakes.
Use of the electronic medical record to assist in follow-up of pending diagnostic studies and patient return visits is yet another strategy.
Finally, healthcare organizations can adopt strategies to promote patient involvement in diagnosis, such as providing patients with copies of their test results and discharge summaries, encouraging the use of electronic patient communication portals, and empowering patients to ask questions related to their diagnosis. Prioritizing potential solutions to reduce diagnostic errors may be helpful in situations, depending on the context and environment, in which all proposed interventions may not be possible.
CASE CONTINUED: LEARNING FROM MISTAKES
The attending physician and resident in the case meet after the conference to review their clinical decision-making. Both are interested in learning from this case and improving their diagnostic skills in the future.
What specific steps can clinicians take to mitigate cognitive bias in daily practice?
In addition to continuing to expand one’s medical knowledge and gain more clinical experience, we can suggest several small steps to busy clinicians, taken individually or in combination with others that may improve diagnostic skills by reducing the potential for biased thinking in clinical practice.
Think about your thinking. Our first recommendation would be to become more familiar with the dual process theory of clinical cognition (Figure 1).37,38 This theoretical framework may be very helpful as a foundation from which to build better thinking skills. Physicians, especially residents, and students can be taught these concepts and their potential to contribute to diagnostic errors, and can use these skills to recognize those contributions in others’ diagnostic practices and even in their own.39
Facilitating metacognition, or “thinking about one’s thinking,” may help clinicians catch themselves in thinking traps and provide the opportunity to reflect on biases retrospectively, as a double check or an opportunity to learn from a mistake.
Recognize your emotions. Gaining an understanding of the effect of one’s emotions on decision-making also can help clinicians free themselves of bias. As human beings, healthcare professionals are susceptible to emotion, and the best approach to mitigate the emotional influences may be to consciously name them and adjust for them.40
Because it is impractical to apply slow, analytical system 2 approaches to every case, skills that hone and develop more accurate, reliable system 1 thinking are crucial. Gaining broad exposure to increased numbers of cases may be the most reliable way to build an experiential repertoire of “illness scripts,” but there are ways to increase the experiential value of any case with a few techniques that have potential to promote better intuition.41
Embracing uncertainty in the early diagnostic process and envisioning the worst-case scenario in a case allows the consideration of additional diagnostic paths outside of the current working diagnosis, potentially priming the clinician to look for and recognize early warning signs that could argue against the initial diagnosis at a time when an adjustment could be made to prevent a bad outcome.
Practice progressive problem-solving,42 a technique in which the physician creates additional challenges to increase the cognitive burden of a “routine” case in an effort to train his or her mind and sharpen intuition. An example of this practice is contemplating a backup treatment plan in advance in the event of a poor response to or an adverse effect of treatment. Highly rated physicians and teachers perform this regularly.43,44 Other ways to maximize the learning value of an individual case include seeking feedback on patient outcomes, especially when a patient has been discharged or transferred to another provider’s care, or when the physician goes off service.
Simulation, traditionally used for procedural training, has potential as well. Cognitive simulation, such as case reports or virtual patient modules, have potential to enhance clinical reasoning skills as well, though possibly at greater cost of time and expense.
Decreased reliance on memory is likely to improve diagnostic reasoning. Systems tools such as checklists45 and health information technology46 have potential to reduce diagnostic errors, not by taking thinking away from the clinician but by relieving the cognitive load enough to facilitate greater effort toward reasoning.
Slow down. Finally, and perhaps most important, recent models of clinical expertise have suggested that mastery comes from having a robust intuitive method, with a sense of the limitations of the intuitive approach, an ability to recognize the need to perform more analytical reasoning in select cases, and the willingness to do so. In short, it may well be that the hallmark of a master clinician is the propensity to slow down when necessary.47
If one considers diagnosis a cognitive procedure, perhaps a brief “diagnostic time-out” for safety might afford an opportunity to recognize and mitigate biases and errors. There are likely many potential scripts for a good diagnostic time-out, but to be functional it should be brief and simple to facilitate consistent use. We have recommended the following four questions to our residents as a starting point, any of which could signal the need to switch to a slower, analytic approach.
Four-step diagnostic time-out
- What else can it be?
- Is there anything about the case that does not fit?
- Is it possible that multiple processes are going on?
- Do I need to slow down?
These questions can serve as a double check for an intuitively formed initial working diagnosis, incorporating many of the principles discussed above, in a way that would hopefully avoid undue burden on a busy clinician. These techniques, it must be acknowledged, have not yet been directly tied to reductions in diagnostic errors. However, diagnostic errors, as discussed, are very difficult to identify and study, and these techniques will serve mainly to improve habits that are likely to show benefits over much longer time periods than most studies can measure.
- Kassirer JP. Diagnostic reasoning. Ann Intern Med 1989; 110:893–900.
- Golodner L. How the public perceives patient safety. Newsletter of the National Patient Safety Foundation 2004; 1997:1–6.
- Shojania KG, Burton EC, McDonald KM, Goldman L. Changes in rates of autopsy-detected diagnostic errors over time: a systematic review. JAMA 2003; 289:2849–2856.
- Neale G, Woloshynowych M, Vincent C. Exploring the causes of adverse events in NHS hospital practice. J R Soc Med 2001; 94:322–330.
- Chellis M, Olson J, Augustine J, Hamilton G. Evaluation of missed diagnoses for patients admitted from the emergency department. Acad Emerg Med 2001; 8:125–130.
- Tallentire VR, Smith SE, Skinner J, Cameron HS. Exploring error in team-based acute care scenarios: an observational study from the United Kingdom. Acad Med 2012; 87:792–798.
- Green SM, Martinez-Rumayor A, Gregory SA, et al. Clinical uncertainty, diagnostic accuracy, and outcomes in emergency department patients presenting with dyspnea. Arch Intern Med 2008; 168:741–748.
- Pineda LA, Hathwar VS, Grant BJ. Clinical suspicion of fatal pulmonary embolism. Chest 2001; 120:791–795.
- Shojania KG, Burton EC, McDonald KM, Goldman L. The autopsy as an outcome and performance measure. Evid Rep Technol Assess (Summ) 2002; 58:1–5.
- Hertwig R, Meier N, Nickel C, et al. Correlates of diagnostic accuracy in patients with nonspecific complaints. Med Decis Making 2013; 33:533–543.
- Kostopoulou O, Delaney BC, Munro CW. Diagnostic difficulty and error in primary care—a systematic review. Fam Pract 2008; 25:400–413.
- Ogdie AR, Reilly JB, Pang WG, et al. Seen through their eyes: residents’ reflections on the cognitive and contextual components of diagnostic errors in medicine. Acad Med 2012; 87:1361–1367.
- Feldmann EJ, Jain VR, Rakoff S, Haramati LB. Radiology residents’ on-call interpretation of chest radiographs for congestive heart failure. Acad Radiol 2007; 14:1264–1270.
- Meyer AN, Payne VL, Meeks DW, Rao R, Singh H. Physicians’ diagnostic accuracy, confidence, and resource requests: a vignette study. JAMA Intern Med 2013; 173:1952–1958.
- Zwaan L, Thijs A, Wagner C, Timmermans DR. Does inappropriate selectivity in information use relate to diagnostic errors and patient harm? The diagnosis of patients with dyspnea. Soc Sci Med 2013; 91:32–38.
- Schiff GD, Hasan O, Kim S, et al. Diagnostic error in medicine: analysis of 583 physician-reported errors. Arch Intern Med 2009; 169:1881–1887.
- Graber ML, Franklin N, Gordon R. Diagnostic error in internal medicine. Arch Intern Med 2005; 165:1493–1499.
- Tversky A, Kahneman D. Judgment under uncertainty: heuristics and biases. Science 1974; 185:1124–1131.
- Kahneman D. Thinking, fast and slow. New York, NY: Farrar, Straus, and Giroux; 2011.
- Croskerry P. A universal model of diagnostic reasoning. Acad Med 2009; 84:1022–1028.
- Custers EJ. Medical education and cognitive continuum theory: an alternative perspective on medical problem solving and clinical reasoning. Acad Med 2013; 88:1074–1080.
- Croskerry P. The importance of cognitive errors in diagnosis and strategies to minimize them. Acad Med 2003; 78:775–780.
- Hirschtick RE. A piece of my mind. Copy-and-paste. JAMA 2006; 295:2335–2336.
- Berner ES, Graber ML. Overconfidence as a cause of diagnostic error in medicine. Am J Med 2008;121(suppl 5):S2–S23.
- Henriksen K, Brady J. The pursuit of better diagnostic performance: a human factors perspective. BMJ Qual Saf 2013; 22(suppl 2):ii1–ii5.
- Peabody JW, Luck J, Jain S, Bertenthal D, Glassman P. Assessing the accuracy of administrative data in health information systems. Med Care 2004; 42:1066–1072.
- Hogan H, Healey F, Neale G, Thomson R, Vincent C, Black N. Preventable deaths due to problems in care in English acute hospitals: a retrospective case record review study. BMJ Qual Saf 2012; 21:737–745.
- Blendon RJ, DesRoches CM, Brodie M, et al. Views of practicing physicians and the public on medical errors. N Engl J Med 2002; 347:1933–1940.
- Burroughs TE, Waterman AD, Gallagher TH, et al. Patient concerns about medical errors in emergency departments. Acad Emerg Med 2005; 12:57–64.
- Leape LL, Brennan TA, Laird N, et al. The nature of adverse events in hospitalized patients. Results of the Harvard Medical Practice Study II. N Engl J Med 1991; 324:377–384.
- Thomas EJ, Studdert DM, Burstin HR, et al. Incidence and types of adverse events and negligent care in Utah and Colorado. Med Care 2000; 38:261–271.
- Bishop TF, Ryan AM, Casalino LP. Paid malpractice claims for adverse events in inpatient and outpatient settings. JAMA 2011; 305:2427–2431.
- Saber Tehrani AS, Lee H, Mathews SC, et al. 25-year summary of US malpractice claims for diagnostic errors 1986–2010: an analysis from the national practitioner data bank. BMJ Qual Saf 2013; 22:672–680.
- Kohn LT, Corrigan JM, Donaldson MS. To err is human: building a safer health system. Washington, DC: The National Academies Press; 2000.
- Singh H. Diagnostic errors: moving beyond ‘no respect’ and getting ready for prime time. BMJ Qual Saf 2013; 22:789–792.
- Graber ML, Trowbridge R, Myers JS, Umscheid CA, Strull W, Kanter MH. The next organizational challenge: finding and addressing diagnostic error. Jt Comm J Qual Patient Saf 2014; 40:102–110.
- Croskerry P. Clinical cognition and diagnostic error: applications of a dual process model of reasoning. Adv Health Sci Educ Theory Pract 2009; 14(suppl 1):27–35.
- Norman G. Dual processing and diagnostic errors. Adv Health Sci Educ Theory Pract 2009; 14(suppl 1):37–49.
- Reilly JB, Ogdie AR, Von Feldt JM, Myers JS. Teaching about how doctors think: a longitudinal curriculum in cognitive bias and diagnostic error for residents. BMJ Qual Saf 2013; 22:1044–1050.
- Croskerry P, Abbass A, Wu AW. Emotional influences in patient safety. J Patient Saf 2010; 6:199–205.
- Rajkomar A, Dhaliwal G. Improving diagnostic reasoning to improve patient safety. Perm J 2011; 15:68–73.
- Trowbridge RL, Dhaliwal G, Cosby KS. Educational agenda for diagnostic error reduction. BMJ Qual Saf 2013; 22(suppl 2):ii28–ii32.
- Sargeant J, Mann K, Sinclair D, et al. Learning in practice: experiences and perceptions of high-scoring physicians. Acad Med 2006; 81:655–660.
- Mylopoulos M, Lohfeld L, Norman GR, Dhaliwal G, Eva KW. Renowned physicians' perceptions of expert diagnostic practice. Acad Med 2012; 87:1413–1417.
- Sibbald M, de Bruin AB, van Merrienboer JJ. Checklists improve experts' diagnostic decisions. Med Educ 2013; 47:301–308.
- El-Kareh R, Hasan O, Schiff GD. Use of health information technology to reduce diagnostic errors. BMJ Qual Saf 2013; 22(suppl 2):ii40–ii51.
- Moulton CA, Regehr G, Mylopoulos M, MacRae HM. Slowing down when you should: a new model of expert judgment. Acad Med 2007; 82(suppl 10):S109–S116.
KEY POINTS
- Diagnostic errors are common and lead to bad outcomes.
- Factors that increase the risk of diagnostic error include initial empiric treatment, nonspecific or vague symptoms, atypical presentation, confounding comorbid conditions, contextual factors, and physician factors.
- Common types of cognitive error include the framing effect, anchoring bias, diagnostic momentum, availability bias, confirmation bias, blind obedience, overconfidence bias, base-rate neglect, and premature closure.
- Organizations and leaders can implement strategies to reduce diagnostic errors.

A Novel Emergency Department Surge Protocol: Implementation of a Targeted Response Plan
From the Ottawa Hospital, Ottawa, ON Canada.
Abstract
- Objective: Fluctuations in emergency department (ED) visits occur frequently, and traditional global measures of ED crowding do not allow for targeted responses to address root causes. We sought to develop, implement, and evaluate a novel ED surge protocol based on the input-throughput-output (ITO) model of ED flow.
- Methods: This initiative took place at a tertiary care academic teaching hospital. An inter-professional group developed and validated metrics for various levels of surge in relation to the ITO model, measured every 2 hours, which directly linked to specific actions targeting root causes within those components. Main outcome measure was defined as the frequency of sustained (≥ 6 hours) high surges, a marker of inability to respond effectively.
- Results: During the 6-month study period, average daily hospital occupancy levels rose above 100% (pre 99.5%, post 101.2%; P = 0.01) and frequency of high surges in the output component increased (pre 7.7%, post 10.8%; P = 0.002). Despite this, frequency of sustained high surges remained stable for input (pre 4.5%, post 0.0%; P = 0.13) and throughput (pre 3.5%, post 2.7%; P = 0.54), while improvement in output reached statistical significance (pre 7.7%, post 2.0%, P = 0.01).
- Conclusions: The ED surge protocol led to effective containment of daily high surges despite significant increase in hospital occupancy levels. This is the first study to describe an ED surge plan capable of identifying within which ITO component surge is happening and linking actions to address specific causes. We believe this protocol can be adapted for any ED.
Emergency department (ED) crowding has been defined as “a situation where the demand for emergency services exceeds the ability to provide care in a reasonable amount of time” [1]. Crowding is an increasingly common occurrence in hospital-based EDs, and overcrowding of EDs has been shown to adversely affect the delivery of emergency care and results in increased patient morbidity and mortality [2,3]. Furthermore, the nature of medical emergencies dictates that rapid daily changes (or surges) in patient volume and acuity occur frequently and unpredictably, contributing to the difficulty of matching resources to demands. Accurate understanding and continuous measurement of where bottlenecks may be occurring within an ED are critical to an effective response to ED surges.
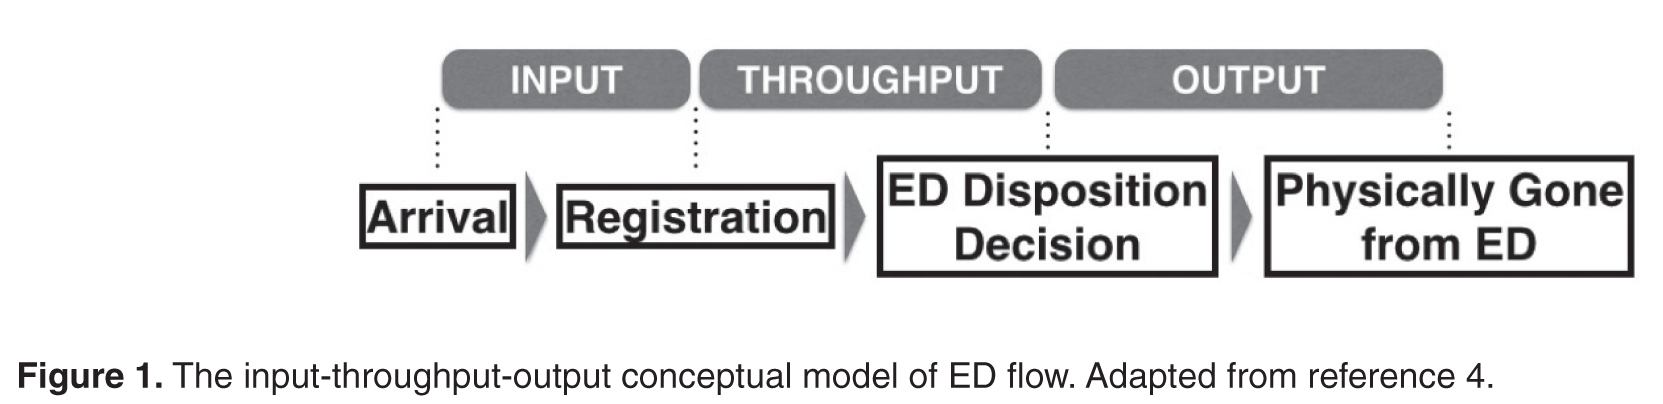
Many of the widely used measurement tools for overcrowding produce one final overall net value on a one-dimensional scale, failing to capture the complexity of the root causes of surges. For example, the National ED Overcrowding Study (NEDOCS) scoring system, validated at various centers and widely used and studied [5–7] utilizes a number of institutional and situational variables to calculate a final NEDOCS score, which translates to “Not Busy,” “Busy,” “Overcrowded,” “Severely Overcrowded,” or “Dangerously Overcrowded” as a global state. Other published scoring systems such as the Emergency Department Work Index (EDWIN), while performing well in comparison to subjective impressions of physicians and nurses, also suffers from computation of a single final score, which makes it difficult to tie to specific actions or solutions [8]. Other surrogate markers quantifying ED crowding have also been used, such as left-without-being-seen rates, ambulance diversions, and total number of boarded patients in the ED; yet they too only measure consequences of crowding and provide little diagnostic information on when and where specific ED surges are actually happening throughout the day [9].
Responding to ED Surges
An effective surge plan should ensure the delivery of safe, effective care in response to various input/throughput/output surges in a coordinated and standardized manner. The ideal ED surge plan should include (1) a prospective continuous tool/method that accurately gauges the surge level (based on objective measures) in various components of the Input-Throughput-Output model of the department, (2) standardized targeted actions that are tied to specific triggers identified within that model to ensure effective solutions, and (3) built-in contingency plans for escalation in the face of sustained/worsening surges. Few studies have been published describing successful implementation of ED surge protocols, with the majority being linked to global ED crowding measures such as the NEDOCS score [10]. As a result, it is difficult to tease out the specific targeted actions that are most effective in dealing with the root causes of a surge.
Local Problem
Prior to the quality improvement initiative we describe below, the Ottawa Hospital ED had no formal process or method of measuring daily surges nor any standardized action plan to respond effectively to those surges. The state of “busy-ness” was often defined by gut feelings of frontline workers, which was quite variable depending on the individuals in charge of departmental patient flow. Often, actions to try and mitigate rising ED surges were triggered too late, resulting in consistent gridlock in the ED that lasted many hours. Several near-misses as well as actual critical incidences had occurred as a result of ineffective management of ED surges, and the authors of this initiative were tasked by senior hospital leadership with designing and implementing a novel solution.
Objectives
We describe our approach to the development, implementation, and evaluation of a novel ED surge protocol at a tertiary care academic hospital based on the principles cited above. Specifically, we sought to:
- define various levels of ED surge and to provide a common language for better communication between all stakeholders
- incorporate the validated Input-Throughput-Output model of ED flow to provide a conceptual framework for measuring surges in real-time and developing targeted action plans
- standardize ED and organizational responses to various ED surges based on identified bottlenecks
- measure and evaluate the effectiveness of the ED surge plan implementation
- continuously modify and improve the ED surge protocol using quality improvement strategies
Methods
Setting
The Ottawa Hospital is an academic tertiary care center with 3 campuses (Civic, General, and Riverside), with the ED providing coverage at 2 physical emergency rooms. The hospital is the regional trauma center as well as referral destination for many subspecialties such as cardiac, vascular and neurosurgical emergencies. This 1163-bed facility handles over 160,000 emergency visits a year, over 1 million ambulatory care visits a year, and roughly 35,000 surgical cases annually. The ED is staffed by 78 staff physicians, approximately 250 registered nurses (RNs), and ~50 emergency medicine residents/trainees.
The EDs are supported by a computerized tracking system that provides real-time metrics. This information is displayed by ED-specific geographical area on electronic whiteboards, which can be accessed on overhead monitors, desktop computers, and personal iPads. Information available to ED physicians and staff at any time includes individual-level data such as location, demographics, Canadian Triage Acuity Score (CTAS), and presenting complaint as well as departmental-level data such as patient volumes, wait times, length of stay (LOS), pending/completed diagnostics, consultation status and final dispositions.
According to the policy and standard operating procedures that govern research at the Ottawa Hospital Research Institute, this work met criteria for quality improvement activities exempt from ethics review.
Intervention
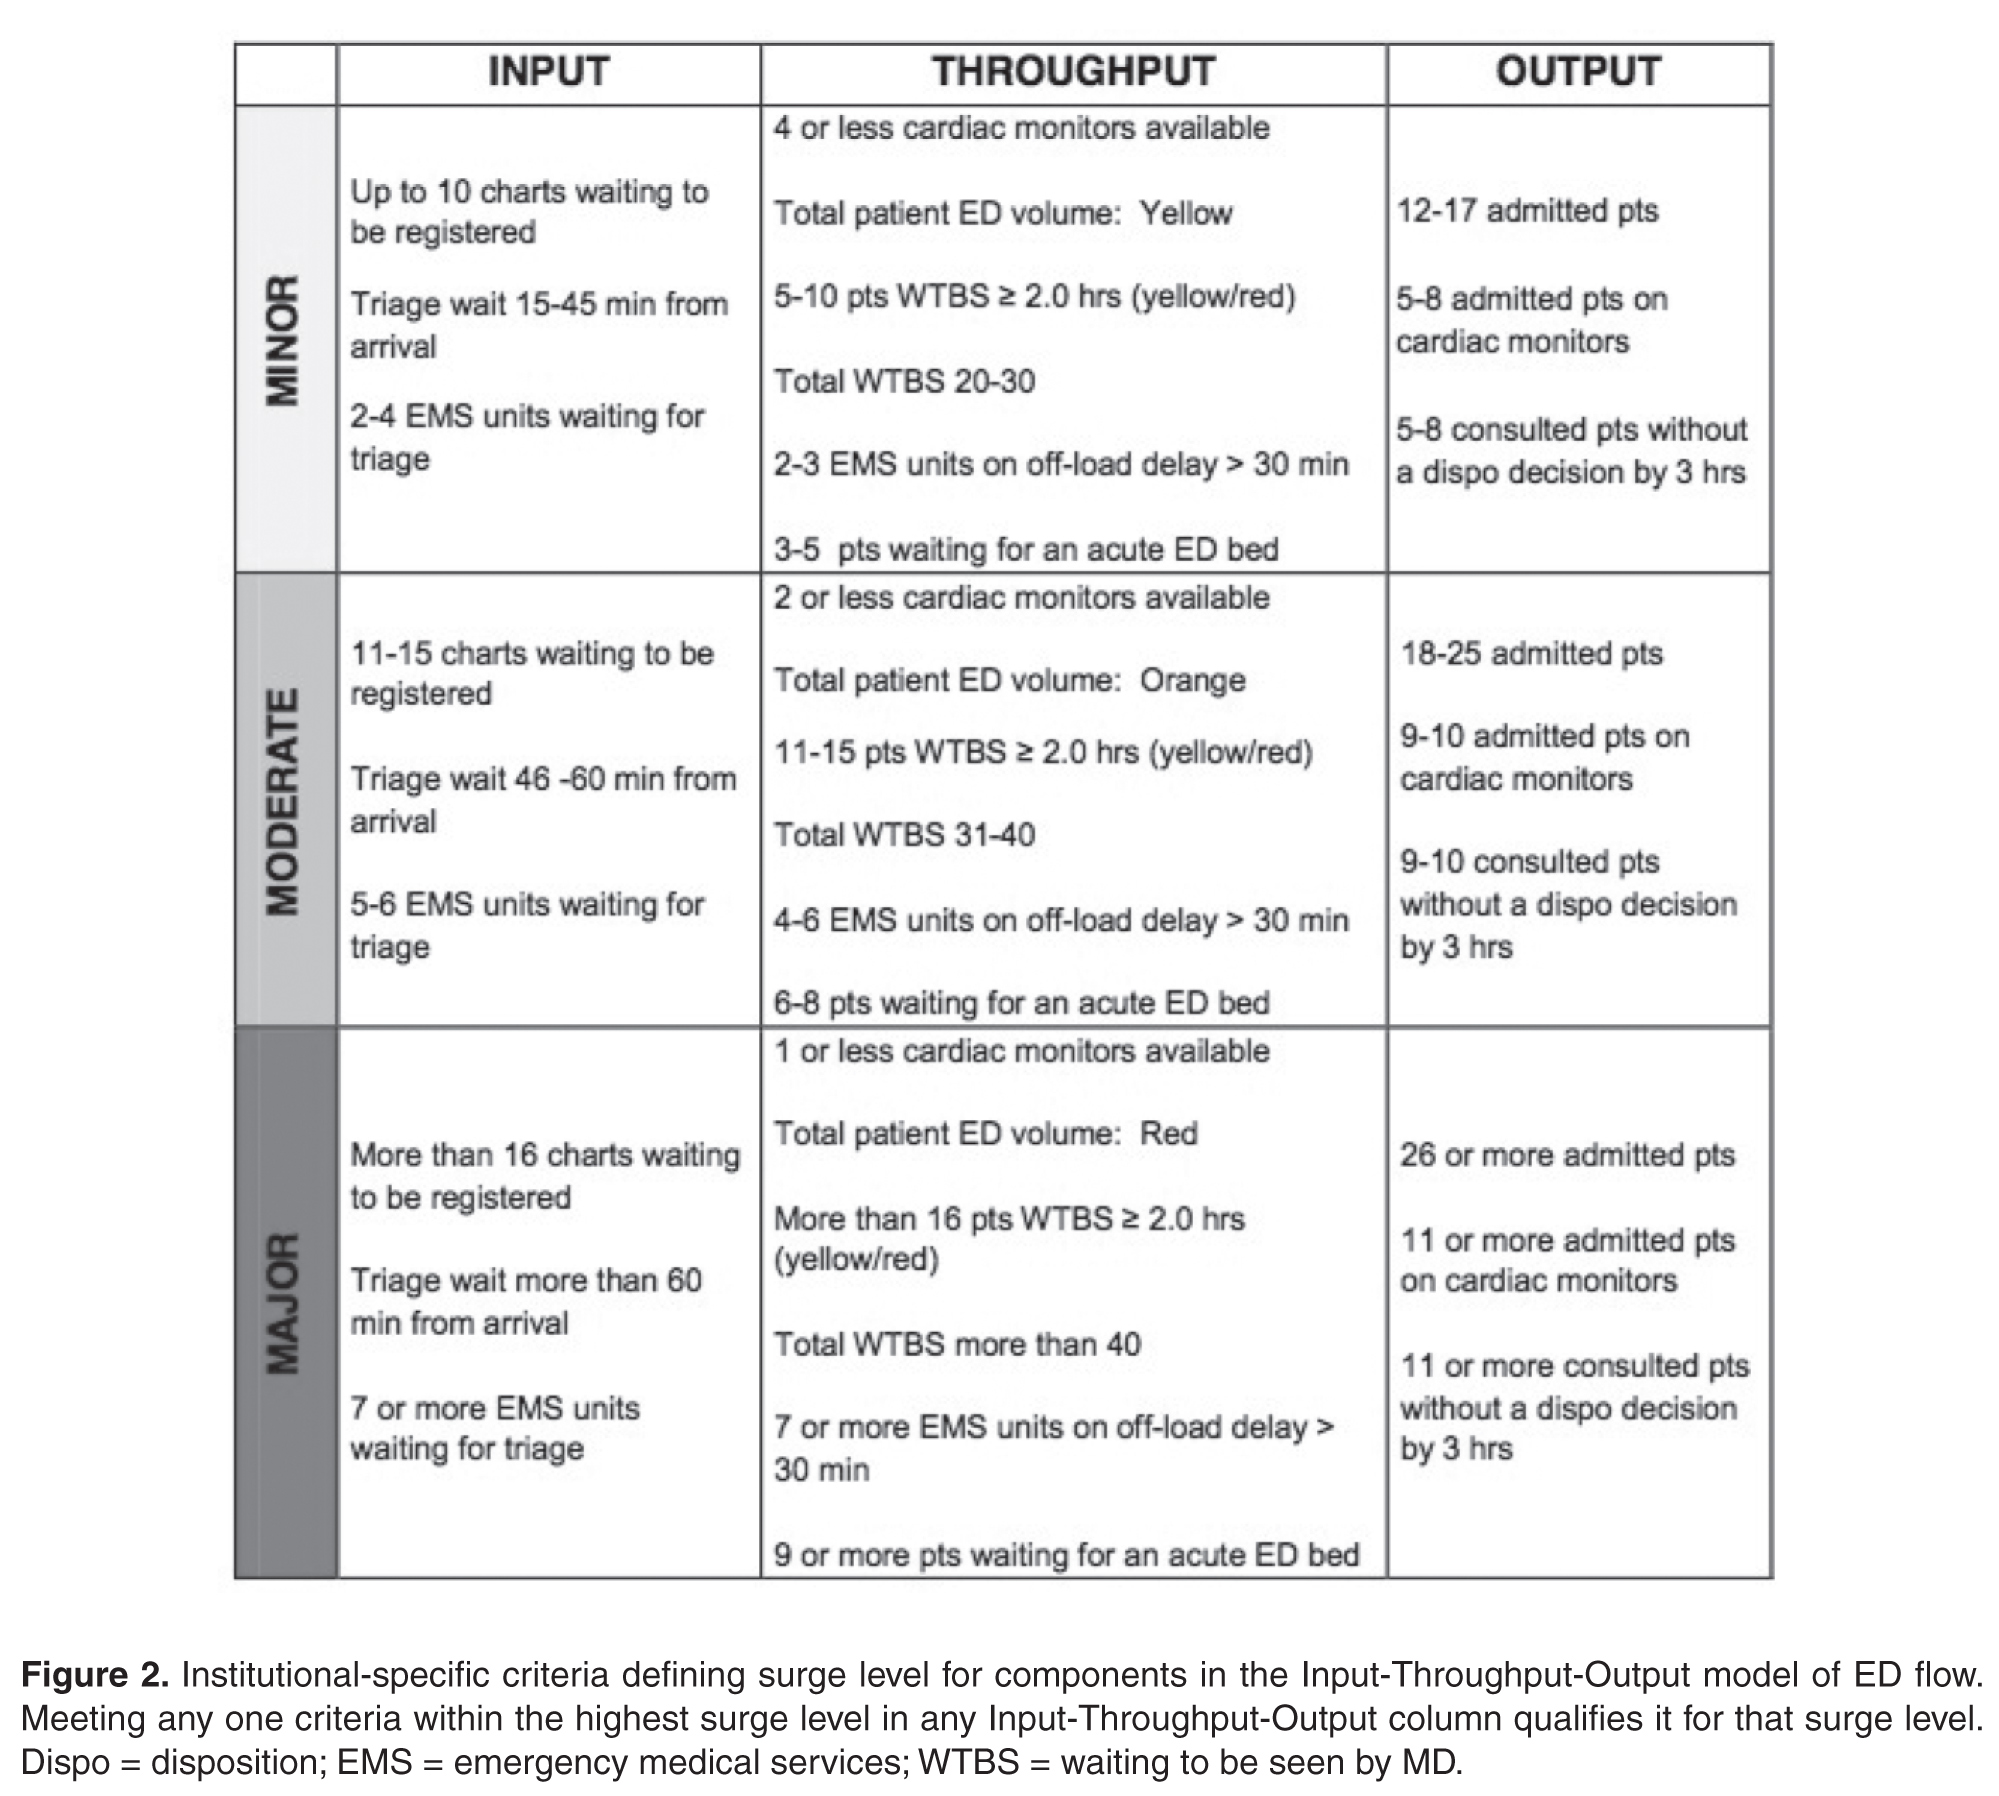
Over a 4-day period care facilitators were polled on an hourly basis to determine what factors were important to the in determining how “busy” they perceived the ED to be. These factors included but were not limited to: total number of patients waiting to be seen; time to physician initial assessment; number of monitored beds available; and number of admitted patients boarded in the ED. Analysis was done to prospectively compare their perception of surge levels to the proposed Surge Plan metrics, and to ensure that the individual criteria for each level was practically meaningful and accurate.
Next, a set of standardized action and response plans were developed and agreed upon that tied specifically to a corresponding component of the different measured ED surge levels (these action plans are detailed in an online Appendix and are also available from the author). The fundamental guiding principles behind the development of each action item was that it should (1) target underlying causes - in a standardized way - specific to the relevant Input-Throughput-Output surge, (2) provide escalating level of effectiveness for each corresponding escalation in the surge level (eg, contacting a staff physician directly for a disposition decision for patents consulted in the ED, if the resident trainees have failed to do so in a timely manner), and (3) coordinate actions by various stakeholders in a planned and organized manner. Practically, the standardized targeted actions span across 5 different roles, which were explicitly listed on action sheets for care facilitators, clinical managers, patient flow managers, evening and night coordinators, and clinical directors.
Stakeholder Engagement

Implementation and Continuous Improvement
Given the complexity of the ED- and hospital-wide nature of the surge protocol, implementation was done over multiple phases and Plan-Do-Study-Act (PDSA) improvement cycles:
Phase I (Apr 2013 - Jun 2013)
The initial proposed ED surge level metrics were measured at a single ED campus. Care facilitators were trained and asked to measure surge levels in the ED every 2 hours. This served as a testing period to gauge the sensitivity and reliability of our proposed surge level metrics, and no actual action items were triggered during this period. Stakeholder meetings were held to determine feasibility of the plan, validate the proposed metrics, and develop “standard work” action plans for each stakeholder group in response to the metrics. This first phase also allowed care facilitators to objectively reflect on ED surge patterns throughout the day, and provided everyone in the ED team a frequent global snapshot of how “busy” the department was at any time. Finally, surge level data during this phase confirmed previous suspicions that the Output component was the biggest driver behind overall ED surge level.
Throughout this phase, the ED clinical manager recorded all the usual actions taken in response to the different level of surges as felt appropriate by the individual care facilitator on duty. The variety of actions and types of escalations were collected and fed back to weekly workgroup meetings to help further refine crafting of standardized action plans for implementation of the surge protocol.
Phase II (June - Aug 2013)
An initial trial of a limited ED surge protocol was rolled out at both ED campuses, with actual action items being triggered in response to specific surge level metrics. The main focus of this PDSA cycle was to collect data on how the care facilitator groups at the 2 campuses utilized the surge protocol, as well as feedback on usability, barriers, and effectiveness. Regular audits were performed to ensure surge measurement and compliance rates. Educational sessions were provided regarding rationale and purpose of the plan so that all team members had a better understanding of ED surges. Frequent meetings with stakeholders to share updates continued throughout Phase II, allowing further engagement as well as fine-tuning of stakeholder action plans based on real-time experiences.
Phase III (Aug 2013 - Dec 2013)
The next phase of implementation expanded beyond the ED and included the hospital’s off-hours and off-service management group. This in effect was the official corporate roll-out of the ED surge protocol including full action plans for all stakeholders, including off-service clinical administrators, inpatient flow managers, and the director of emergency and critical care. Regular audits were performed to ensure compliance of measurement every 2 hours as well as performance of specified action items related to each surge level, with the actual surge level measurement completion rates of 98%.
Data Collection and Analysis
Over the study period April 2013 to December 2013 at the Civic campus and June 2013 to December 2013 at the General campus, ED surge levels were measured every 2 hours by the care facilitators and manually recorded in standardized ED surge protocol booklets. These were subsequently entered into Excel database for tracking and data analysis. Patient volumes and hospital occupancy levels were recorded daily. Perceptions of the primary users of the surge protocol (ie, care facilitators) were obtained via standardized interviews and polls. We present descriptive statistics and statistical process control (SPC) charts. Chi-squared test was performed for comparison of pre- and post-intervention frequencies of outcome measures.
Outcome Measures
The main outcome measure was the frequency of sustained (≥ 6 hours) high surges, a marker of inability to respond effectively. High surges were defined as Moderate and Major surges combined. Our expert group consensus was that combinging the Moderate and Major surge categories to represent “high” surge was reasonable since they both require mobilizing resources on a hospital-wide level, and failure to improve despite 6 continuous hours of actively trying to address such high surges would lead to significantly higher risk for quality of care and patient safety issues.
Secondary outcomes include overall frequency of reaching high surge levels at various components of the Input-Throughput-Output ED flow model, hospital occupancy levels, and care facilitators’ perceptions on workload and overall effectiveness of the surge protocol.
Results
ED Flow
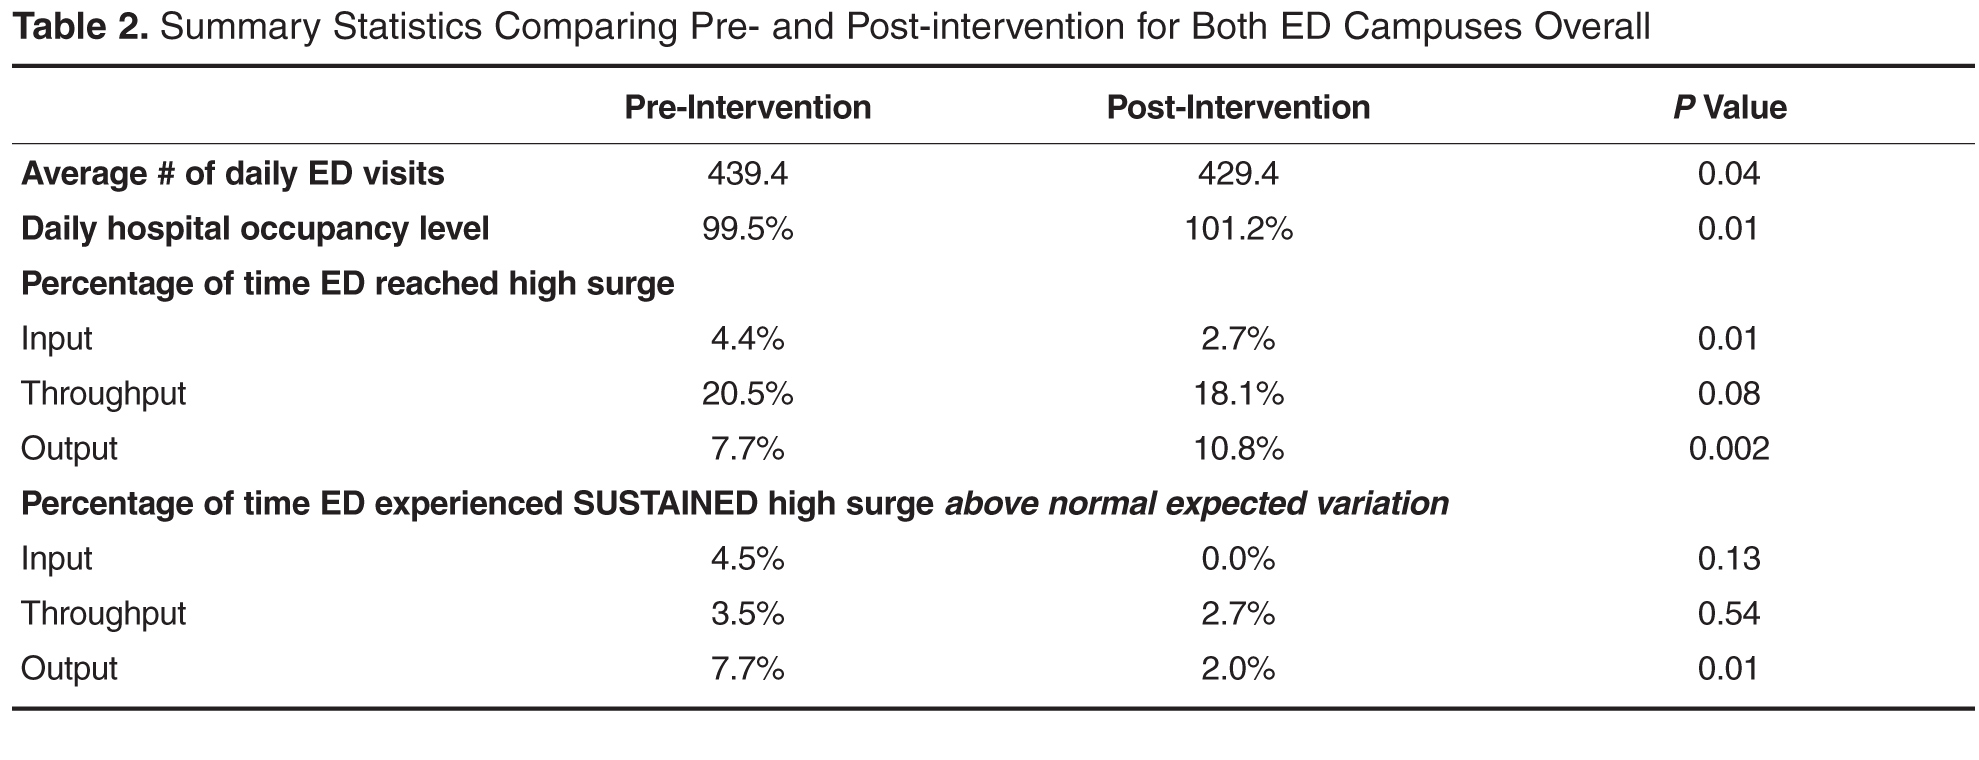
Statistical Process Control Charts
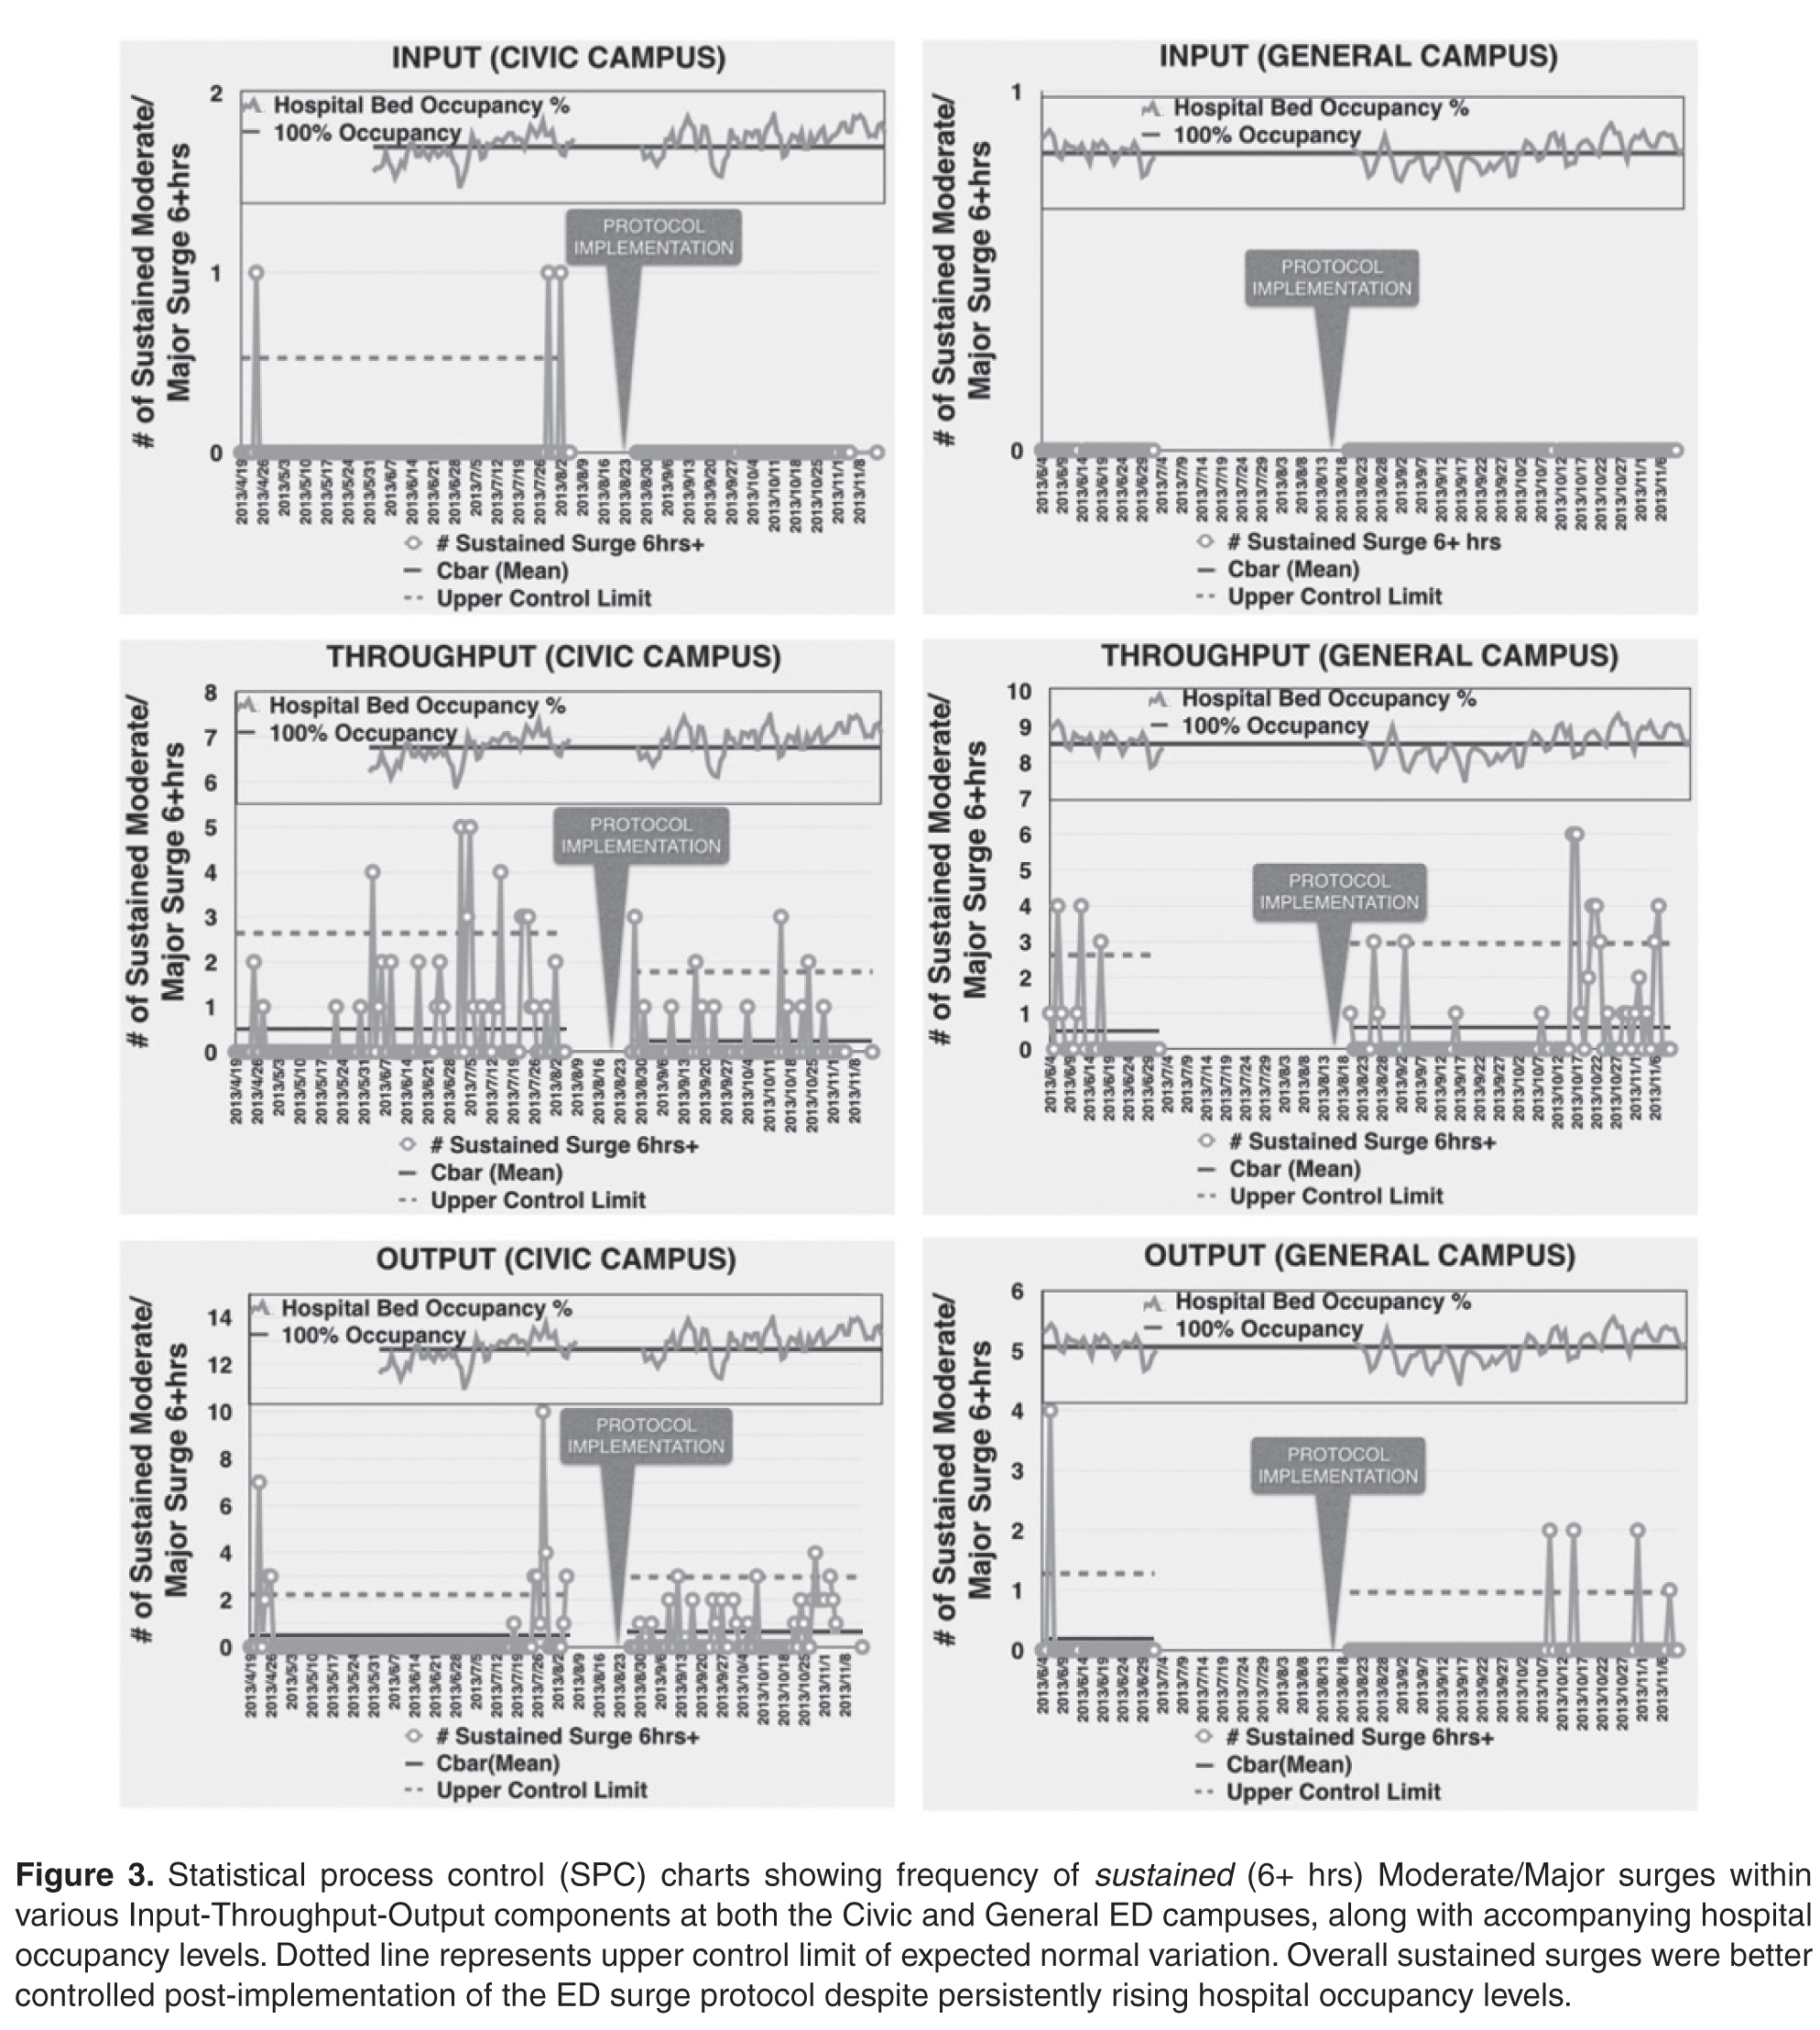
Survey of Care Facilitators
The primary users and drivers of the surge protocol—the care facilitator group—felt strongly that the tool was easy to use and that it made a positive difference. 72% felt that the ED surge protocol has increased their workload but 92% felt that it was good for overall flow of the ED. Specific feedback included having a much more standardized language around communicating (and acting on) surges, and a better overall bird’s-eye view of the department.
Discussion
Despite a call for urgent research on implementing solutions targeting daily ED surges (vs. global ED crowding) over a decade ago at the Academic Emergency Medicine 2006 Consensus Conference [12], little work has been published on distinguishing, measuring, and dealing with ED surges. McCarthy et al proposed the rate of patient arrivals to the ED by time of day as a rudimentary definition of surge, although they provided very little specific guidance on what to do with that information in the setting of responding to spikes in surges [13]. Asplin et al described a number of theoretical models to bridge ED census, daily surges, length of stay and quality of care, however they were never validated in real-life scenarios [14]. A systematic review published in 2009 summarizing articles that described theoretical and practical ED surge responses found a large heterogeneity of different proposed models with little standardization and multiple shortcomings [15].
To our knowledge, this study is the first to report on the actual development, implementation, and evaluation of a daily ED surge protocol that utilizes a widely accepted conceptual model of ED flow. Unlike single global measure of ED crowding, our protocol measures frequent surge levels for various Input-Throughput-Output components of the ED, which are tied directly to standardized specific actions to address underlying root causes. Despite continued rise in hospital occupant levels and budgetary restraints, we found a improvement in the number of times the ED actually hit severe surges with the exception of Output, which is expected since this component of the flow model is intimately tied to hospital occupant levels. When severe surges did happen, we were able to deal with them much more effectively and efficiently, resulting in an overall decrease in sustained surges in the ED including the Output component.
Limitations
Similar to other pragmatic quality improvement projects that rely on manual processes, it was difficult to ensure absolute compliance of surge level measurements throughout the study period. As a result, there were occasional missing surge level data at various times of different days. However, we believe these are relatively nonsignificant occurrences that balanced out over the pre- and post-implementation periods. In addition, we did not have the resources to robustly record and confirm completion of specific action items that were activated in response to various surge levels, although we did confirm verbally with frontline workers regularly that those actions were done. Future Plan-Do-Study-Act cycles will focus on explicit measurement of actual completed action items and further refinement of targeted responses to surge. Finally, while we were able to only collect and present data over a relatively short period of evaluation (and thus potentially susceptible to seasonal variations in ED flow), we believe that our data does support the surge protocol’s effectiveness when compared to the robust trend of hospital occupant levels.
Future Directions
This ED surge protocol can be adapted and modified to fit any ED. The specific criteria defining Minor/Moderate/Major surges can be set up as ratios or percentages relative to total number of monitors, beds, etc., available. The principles of linking actions directly to specific triggers within each Input/Throughput/Output category could be translated to fit any-sized organization. Currently in progress is a longer evaluation period and based upon the results as well as individual feedback, necessary adjustments to our definitions, criteria and action items will be considered as part of ongoing quality improvement. The principles of our surge protocol are not limited to the ED, and we will explore its implementation in other hospital departments as well as methods to link them together in alignment with the hospital’s overall corporate strategy in tackling overcrowding.
Conclusion
In summary, implementation of this novel ED surge protocol led to a more effective response and management of high surges, despite significant increase in overall hospital occupancy rates and associated frequency of surges in the Output component of the ED flow model. Our surge measurement tool is capable of identifying within which area of the ED surges are occurring, and our ED surge protocol links specific actions to address those specific root causes. We believe this will lead not only to more accurate assessments of overall ED crowding but also to more timely and effective departmental and institutional responses.
Corresponding author: Dr. Edmund S.H. Kwok, Dept. of Emergency Medicine, Ottawa Hospital, Civic Campus, 1053 Carling Ave., Ottawa, ON, Canada K1Y 4E9, ekwok@toh.on.ca.
Financial disclosures: None.
1. Bond K. Interventions to reduce overcrowding in emergency departments. [Technology report no 67.4]. Ottawa: Canadian Agency for Drugs and Technologies in Health; 2006.
2. Richardson DB, et al. Increase in patient mortality at 10 days associated with emergency department overcrowding. Med J Aust 2006;184:213–6.
3. Sprivulis PC, et al. The association between hospital overcrowding and mortality among patients admitted via Western Australian emergency departments. Med J Aust 2006; 184:208–12.
4. Asplin BR, Magid DJ, Rhodes KV, et al. A conceptual model of emergency department crowding. Ann Emerg Med 2003; 42:173–80.
5. Affleck A, Parks P, Drummond A, et al. Emergency department overcrowding and access block. CAEP Position Statement. CJEM 2013;15:359–70.
6. Weiss SJ, Derlet R, Arndahl J, et al. Estimating the degree of emergency department overcrowding in academic medical centers: results of the National ED Overcrowding Study (NEDOCS). Acad Emerg Med 2004;11:38–50.
7. Weiss SJ, Ernst AA, Nick TG. Comparison of the National Emergency Department Overcrowding Scale and the Emergency Department Work Index for quantifying emergency department crowding. Acad Emerg Med 2006;13:513–8.
8. Jones SS, Allen TL, Welch SJ. An independent evaluation of four quantitative emergency department crowding scales. Acad Emerg Med 2006;13:1204–11
9. Bernstein SL, Verghese V, Leung W, et al. Development and validation of a new index to measure emergency department crowding. Acad Emerg Med 2003;10:938–42
10. General Accounting Office. Hospital emergency departments–crowded conditions vary among hospitals and communities. GAO-03-460. Washington, DC: US General Accounting Office; 2003.
11. Moseley MG, Dickerson CL, Kasey J, et al. Surge: a organizational response to emergency department overcrowding. J Clin Outcomes Manage 2010;17:453–7.
12. Jenkins JL, O’Connor RE, Cone DC. Differentiating large-scale surge versus daily surge. Acad Emerg Med 2006; 13:1169–72.
13. McCarthy ML, Aronsky D, Kelen GD. The measurement of daily surge and its relevance to disaster preparedness. Acad Emerg Med 2006; 13:1138–41.
14. Asplin BR, Flottemesch TJ, Gordon B. Developing models for patient flow and daily surge capacity research. Acad Emerg Med 2006;13:1109–13.
15. Nager AL, Khanna K. Emergency department surge: models and practical implications. J Trauma 2009; 67(2 Suppl):S96–9.
From the Ottawa Hospital, Ottawa, ON Canada.
Abstract
- Objective: Fluctuations in emergency department (ED) visits occur frequently, and traditional global measures of ED crowding do not allow for targeted responses to address root causes. We sought to develop, implement, and evaluate a novel ED surge protocol based on the input-throughput-output (ITO) model of ED flow.
- Methods: This initiative took place at a tertiary care academic teaching hospital. An inter-professional group developed and validated metrics for various levels of surge in relation to the ITO model, measured every 2 hours, which directly linked to specific actions targeting root causes within those components. Main outcome measure was defined as the frequency of sustained (≥ 6 hours) high surges, a marker of inability to respond effectively.
- Results: During the 6-month study period, average daily hospital occupancy levels rose above 100% (pre 99.5%, post 101.2%; P = 0.01) and frequency of high surges in the output component increased (pre 7.7%, post 10.8%; P = 0.002). Despite this, frequency of sustained high surges remained stable for input (pre 4.5%, post 0.0%; P = 0.13) and throughput (pre 3.5%, post 2.7%; P = 0.54), while improvement in output reached statistical significance (pre 7.7%, post 2.0%, P = 0.01).
- Conclusions: The ED surge protocol led to effective containment of daily high surges despite significant increase in hospital occupancy levels. This is the first study to describe an ED surge plan capable of identifying within which ITO component surge is happening and linking actions to address specific causes. We believe this protocol can be adapted for any ED.
Emergency department (ED) crowding has been defined as “a situation where the demand for emergency services exceeds the ability to provide care in a reasonable amount of time” [1]. Crowding is an increasingly common occurrence in hospital-based EDs, and overcrowding of EDs has been shown to adversely affect the delivery of emergency care and results in increased patient morbidity and mortality [2,3]. Furthermore, the nature of medical emergencies dictates that rapid daily changes (or surges) in patient volume and acuity occur frequently and unpredictably, contributing to the difficulty of matching resources to demands. Accurate understanding and continuous measurement of where bottlenecks may be occurring within an ED are critical to an effective response to ED surges.
Many of the widely used measurement tools for overcrowding produce one final overall net value on a one-dimensional scale, failing to capture the complexity of the root causes of surges. For example, the National ED Overcrowding Study (NEDOCS) scoring system, validated at various centers and widely used and studied [5–7] utilizes a number of institutional and situational variables to calculate a final NEDOCS score, which translates to “Not Busy,” “Busy,” “Overcrowded,” “Severely Overcrowded,” or “Dangerously Overcrowded” as a global state. Other published scoring systems such as the Emergency Department Work Index (EDWIN), while performing well in comparison to subjective impressions of physicians and nurses, also suffers from computation of a single final score, which makes it difficult to tie to specific actions or solutions [8]. Other surrogate markers quantifying ED crowding have also been used, such as left-without-being-seen rates, ambulance diversions, and total number of boarded patients in the ED; yet they too only measure consequences of crowding and provide little diagnostic information on when and where specific ED surges are actually happening throughout the day [9].
Responding to ED Surges
An effective surge plan should ensure the delivery of safe, effective care in response to various input/throughput/output surges in a coordinated and standardized manner. The ideal ED surge plan should include (1) a prospective continuous tool/method that accurately gauges the surge level (based on objective measures) in various components of the Input-Throughput-Output model of the department, (2) standardized targeted actions that are tied to specific triggers identified within that model to ensure effective solutions, and (3) built-in contingency plans for escalation in the face of sustained/worsening surges. Few studies have been published describing successful implementation of ED surge protocols, with the majority being linked to global ED crowding measures such as the NEDOCS score [10]. As a result, it is difficult to tease out the specific targeted actions that are most effective in dealing with the root causes of a surge.
Local Problem
Prior to the quality improvement initiative we describe below, the Ottawa Hospital ED had no formal process or method of measuring daily surges nor any standardized action plan to respond effectively to those surges. The state of “busy-ness” was often defined by gut feelings of frontline workers, which was quite variable depending on the individuals in charge of departmental patient flow. Often, actions to try and mitigate rising ED surges were triggered too late, resulting in consistent gridlock in the ED that lasted many hours. Several near-misses as well as actual critical incidences had occurred as a result of ineffective management of ED surges, and the authors of this initiative were tasked by senior hospital leadership with designing and implementing a novel solution.
Objectives
We describe our approach to the development, implementation, and evaluation of a novel ED surge protocol at a tertiary care academic hospital based on the principles cited above. Specifically, we sought to:
- define various levels of ED surge and to provide a common language for better communication between all stakeholders
- incorporate the validated Input-Throughput-Output model of ED flow to provide a conceptual framework for measuring surges in real-time and developing targeted action plans
- standardize ED and organizational responses to various ED surges based on identified bottlenecks
- measure and evaluate the effectiveness of the ED surge plan implementation
- continuously modify and improve the ED surge protocol using quality improvement strategies
Methods
Setting
The Ottawa Hospital is an academic tertiary care center with 3 campuses (Civic, General, and Riverside), with the ED providing coverage at 2 physical emergency rooms. The hospital is the regional trauma center as well as referral destination for many subspecialties such as cardiac, vascular and neurosurgical emergencies. This 1163-bed facility handles over 160,000 emergency visits a year, over 1 million ambulatory care visits a year, and roughly 35,000 surgical cases annually. The ED is staffed by 78 staff physicians, approximately 250 registered nurses (RNs), and ~50 emergency medicine residents/trainees.
The EDs are supported by a computerized tracking system that provides real-time metrics. This information is displayed by ED-specific geographical area on electronic whiteboards, which can be accessed on overhead monitors, desktop computers, and personal iPads. Information available to ED physicians and staff at any time includes individual-level data such as location, demographics, Canadian Triage Acuity Score (CTAS), and presenting complaint as well as departmental-level data such as patient volumes, wait times, length of stay (LOS), pending/completed diagnostics, consultation status and final dispositions.
According to the policy and standard operating procedures that govern research at the Ottawa Hospital Research Institute, this work met criteria for quality improvement activities exempt from ethics review.
Intervention
Over a 4-day period care facilitators were polled on an hourly basis to determine what factors were important to the in determining how “busy” they perceived the ED to be. These factors included but were not limited to: total number of patients waiting to be seen; time to physician initial assessment; number of monitored beds available; and number of admitted patients boarded in the ED. Analysis was done to prospectively compare their perception of surge levels to the proposed Surge Plan metrics, and to ensure that the individual criteria for each level was practically meaningful and accurate.
Next, a set of standardized action and response plans were developed and agreed upon that tied specifically to a corresponding component of the different measured ED surge levels (these action plans are detailed in an online Appendix and are also available from the author). The fundamental guiding principles behind the development of each action item was that it should (1) target underlying causes - in a standardized way - specific to the relevant Input-Throughput-Output surge, (2) provide escalating level of effectiveness for each corresponding escalation in the surge level (eg, contacting a staff physician directly for a disposition decision for patents consulted in the ED, if the resident trainees have failed to do so in a timely manner), and (3) coordinate actions by various stakeholders in a planned and organized manner. Practically, the standardized targeted actions span across 5 different roles, which were explicitly listed on action sheets for care facilitators, clinical managers, patient flow managers, evening and night coordinators, and clinical directors.
Stakeholder Engagement
Implementation and Continuous Improvement
Given the complexity of the ED- and hospital-wide nature of the surge protocol, implementation was done over multiple phases and Plan-Do-Study-Act (PDSA) improvement cycles:
Phase I (Apr 2013 - Jun 2013)
The initial proposed ED surge level metrics were measured at a single ED campus. Care facilitators were trained and asked to measure surge levels in the ED every 2 hours. This served as a testing period to gauge the sensitivity and reliability of our proposed surge level metrics, and no actual action items were triggered during this period. Stakeholder meetings were held to determine feasibility of the plan, validate the proposed metrics, and develop “standard work” action plans for each stakeholder group in response to the metrics. This first phase also allowed care facilitators to objectively reflect on ED surge patterns throughout the day, and provided everyone in the ED team a frequent global snapshot of how “busy” the department was at any time. Finally, surge level data during this phase confirmed previous suspicions that the Output component was the biggest driver behind overall ED surge level.
Throughout this phase, the ED clinical manager recorded all the usual actions taken in response to the different level of surges as felt appropriate by the individual care facilitator on duty. The variety of actions and types of escalations were collected and fed back to weekly workgroup meetings to help further refine crafting of standardized action plans for implementation of the surge protocol.
Phase II (June - Aug 2013)
An initial trial of a limited ED surge protocol was rolled out at both ED campuses, with actual action items being triggered in response to specific surge level metrics. The main focus of this PDSA cycle was to collect data on how the care facilitator groups at the 2 campuses utilized the surge protocol, as well as feedback on usability, barriers, and effectiveness. Regular audits were performed to ensure surge measurement and compliance rates. Educational sessions were provided regarding rationale and purpose of the plan so that all team members had a better understanding of ED surges. Frequent meetings with stakeholders to share updates continued throughout Phase II, allowing further engagement as well as fine-tuning of stakeholder action plans based on real-time experiences.
Phase III (Aug 2013 - Dec 2013)
The next phase of implementation expanded beyond the ED and included the hospital’s off-hours and off-service management group. This in effect was the official corporate roll-out of the ED surge protocol including full action plans for all stakeholders, including off-service clinical administrators, inpatient flow managers, and the director of emergency and critical care. Regular audits were performed to ensure compliance of measurement every 2 hours as well as performance of specified action items related to each surge level, with the actual surge level measurement completion rates of 98%.
Data Collection and Analysis
Over the study period April 2013 to December 2013 at the Civic campus and June 2013 to December 2013 at the General campus, ED surge levels were measured every 2 hours by the care facilitators and manually recorded in standardized ED surge protocol booklets. These were subsequently entered into Excel database for tracking and data analysis. Patient volumes and hospital occupancy levels were recorded daily. Perceptions of the primary users of the surge protocol (ie, care facilitators) were obtained via standardized interviews and polls. We present descriptive statistics and statistical process control (SPC) charts. Chi-squared test was performed for comparison of pre- and post-intervention frequencies of outcome measures.
Outcome Measures
The main outcome measure was the frequency of sustained (≥ 6 hours) high surges, a marker of inability to respond effectively. High surges were defined as Moderate and Major surges combined. Our expert group consensus was that combinging the Moderate and Major surge categories to represent “high” surge was reasonable since they both require mobilizing resources on a hospital-wide level, and failure to improve despite 6 continuous hours of actively trying to address such high surges would lead to significantly higher risk for quality of care and patient safety issues.
Secondary outcomes include overall frequency of reaching high surge levels at various components of the Input-Throughput-Output ED flow model, hospital occupancy levels, and care facilitators’ perceptions on workload and overall effectiveness of the surge protocol.
Results
ED Flow
Statistical Process Control Charts
Survey of Care Facilitators
The primary users and drivers of the surge protocol—the care facilitator group—felt strongly that the tool was easy to use and that it made a positive difference. 72% felt that the ED surge protocol has increased their workload but 92% felt that it was good for overall flow of the ED. Specific feedback included having a much more standardized language around communicating (and acting on) surges, and a better overall bird’s-eye view of the department.
Discussion
Despite a call for urgent research on implementing solutions targeting daily ED surges (vs. global ED crowding) over a decade ago at the Academic Emergency Medicine 2006 Consensus Conference [12], little work has been published on distinguishing, measuring, and dealing with ED surges. McCarthy et al proposed the rate of patient arrivals to the ED by time of day as a rudimentary definition of surge, although they provided very little specific guidance on what to do with that information in the setting of responding to spikes in surges [13]. Asplin et al described a number of theoretical models to bridge ED census, daily surges, length of stay and quality of care, however they were never validated in real-life scenarios [14]. A systematic review published in 2009 summarizing articles that described theoretical and practical ED surge responses found a large heterogeneity of different proposed models with little standardization and multiple shortcomings [15].
To our knowledge, this study is the first to report on the actual development, implementation, and evaluation of a daily ED surge protocol that utilizes a widely accepted conceptual model of ED flow. Unlike single global measure of ED crowding, our protocol measures frequent surge levels for various Input-Throughput-Output components of the ED, which are tied directly to standardized specific actions to address underlying root causes. Despite continued rise in hospital occupant levels and budgetary restraints, we found a improvement in the number of times the ED actually hit severe surges with the exception of Output, which is expected since this component of the flow model is intimately tied to hospital occupant levels. When severe surges did happen, we were able to deal with them much more effectively and efficiently, resulting in an overall decrease in sustained surges in the ED including the Output component.
Limitations
Similar to other pragmatic quality improvement projects that rely on manual processes, it was difficult to ensure absolute compliance of surge level measurements throughout the study period. As a result, there were occasional missing surge level data at various times of different days. However, we believe these are relatively nonsignificant occurrences that balanced out over the pre- and post-implementation periods. In addition, we did not have the resources to robustly record and confirm completion of specific action items that were activated in response to various surge levels, although we did confirm verbally with frontline workers regularly that those actions were done. Future Plan-Do-Study-Act cycles will focus on explicit measurement of actual completed action items and further refinement of targeted responses to surge. Finally, while we were able to only collect and present data over a relatively short period of evaluation (and thus potentially susceptible to seasonal variations in ED flow), we believe that our data does support the surge protocol’s effectiveness when compared to the robust trend of hospital occupant levels.
Future Directions
This ED surge protocol can be adapted and modified to fit any ED. The specific criteria defining Minor/Moderate/Major surges can be set up as ratios or percentages relative to total number of monitors, beds, etc., available. The principles of linking actions directly to specific triggers within each Input/Throughput/Output category could be translated to fit any-sized organization. Currently in progress is a longer evaluation period and based upon the results as well as individual feedback, necessary adjustments to our definitions, criteria and action items will be considered as part of ongoing quality improvement. The principles of our surge protocol are not limited to the ED, and we will explore its implementation in other hospital departments as well as methods to link them together in alignment with the hospital’s overall corporate strategy in tackling overcrowding.
Conclusion
In summary, implementation of this novel ED surge protocol led to a more effective response and management of high surges, despite significant increase in overall hospital occupancy rates and associated frequency of surges in the Output component of the ED flow model. Our surge measurement tool is capable of identifying within which area of the ED surges are occurring, and our ED surge protocol links specific actions to address those specific root causes. We believe this will lead not only to more accurate assessments of overall ED crowding but also to more timely and effective departmental and institutional responses.
Corresponding author: Dr. Edmund S.H. Kwok, Dept. of Emergency Medicine, Ottawa Hospital, Civic Campus, 1053 Carling Ave., Ottawa, ON, Canada K1Y 4E9, ekwok@toh.on.ca.
Financial disclosures: None.
1. Bond K. Interventions to reduce overcrowding in emergency departments. [Technology report no 67.4]. Ottawa: Canadian Agency for Drugs and Technologies in Health; 2006.
2. Richardson DB, et al. Increase in patient mortality at 10 days associated with emergency department overcrowding. Med J Aust 2006;184:213–6.
3. Sprivulis PC, et al. The association between hospital overcrowding and mortality among patients admitted via Western Australian emergency departments. Med J Aust 2006; 184:208–12.
4. Asplin BR, Magid DJ, Rhodes KV, et al. A conceptual model of emergency department crowding. Ann Emerg Med 2003; 42:173–80.
5. Affleck A, Parks P, Drummond A, et al. Emergency department overcrowding and access block. CAEP Position Statement. CJEM 2013;15:359–70.
6. Weiss SJ, Derlet R, Arndahl J, et al. Estimating the degree of emergency department overcrowding in academic medical centers: results of the National ED Overcrowding Study (NEDOCS). Acad Emerg Med 2004;11:38–50.
7. Weiss SJ, Ernst AA, Nick TG. Comparison of the National Emergency Department Overcrowding Scale and the Emergency Department Work Index for quantifying emergency department crowding. Acad Emerg Med 2006;13:513–8.
8. Jones SS, Allen TL, Welch SJ. An independent evaluation of four quantitative emergency department crowding scales. Acad Emerg Med 2006;13:1204–11
9. Bernstein SL, Verghese V, Leung W, et al. Development and validation of a new index to measure emergency department crowding. Acad Emerg Med 2003;10:938–42
10. General Accounting Office. Hospital emergency departments–crowded conditions vary among hospitals and communities. GAO-03-460. Washington, DC: US General Accounting Office; 2003.
11. Moseley MG, Dickerson CL, Kasey J, et al. Surge: a organizational response to emergency department overcrowding. J Clin Outcomes Manage 2010;17:453–7.
12. Jenkins JL, O’Connor RE, Cone DC. Differentiating large-scale surge versus daily surge. Acad Emerg Med 2006; 13:1169–72.
13. McCarthy ML, Aronsky D, Kelen GD. The measurement of daily surge and its relevance to disaster preparedness. Acad Emerg Med 2006; 13:1138–41.
14. Asplin BR, Flottemesch TJ, Gordon B. Developing models for patient flow and daily surge capacity research. Acad Emerg Med 2006;13:1109–13.
15. Nager AL, Khanna K. Emergency department surge: models and practical implications. J Trauma 2009; 67(2 Suppl):S96–9.
What’s Wrong With This Picture?
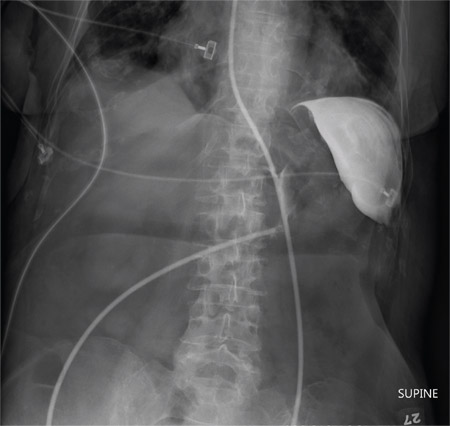
ANSWER
The radiograph shows an enteric tube passing through the gastrointestinal tract. However, it extends low into the left lower quadrant, loops around the right lower quadrant, and then heads up toward the left upper quadrant. Such a course is atypical and concerning for displaced position.
The radiologists concurred, and it was decided to instill some water-soluble contrast and repeat the KUB for further evaluation. That image is shown here. Note that the contrast does not appear to be in the stomach, as no gastric folds are visible. It accumulates in the left upper quadrant, under the diaphragm. Such a finding is concerning for possible gastric perforation.
The tube was promptly withdrawn, and urgent surgical consultation was obtained.
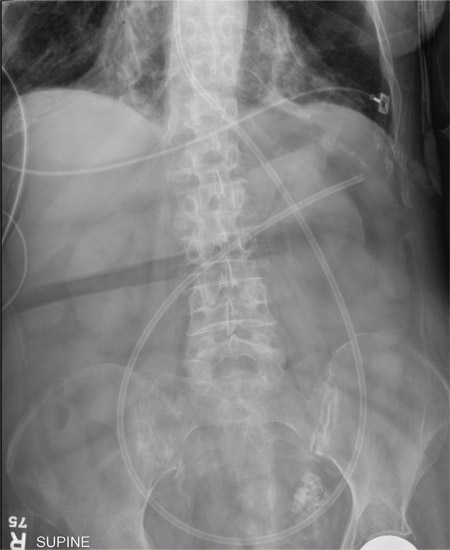
A 90-year-old woman, admitted for altered mental status, just had a nasogastric tube placed to facilitate nutrition and medication delivery. The ICU nurse asks you to review an abdominal radiograph to confirm correct placement, since several attempts by various hospital personnel were required before they felt they had the tube in place. The patient is otherwise currently stable, per the nurse’s report. Her vital signs are stable, and she will arouse to minimal stimulation, although she continues to demonstrate confusion. Portable KUB radiograph is shown. What is your impression?

Case Studies in Toxicology: One Last Kick—Transverse Myelitis After an Overdose of Heroin via Insufflation

Case
A 17-year-old adolescent girl with a history of depression and opioid dependence, for which she was taking buprenorphine until 2 weeks earlier, presented to the ED via emergency medical services (EMS) after her father found her lying on the couch unresponsive and with shallow respirations. Naloxone was administered by EMS and her mental status improved.
At presentation, the patient admitted to insufflation of an unknown amount of heroin and ingestion of 2 mg of alprazolam earlier in the day. She denied any past or current use of intravenous (IV) drugs. During monitoring, she began to complain of numbness in her legs and an inability to urinate. Examination revealed paralysis and decreased sensation of her bilateral lower extremities to the midthigh, with decreased rectal tone. Because of the patient’s history of drug use and temporal association with the heroin overdose, both neurosurgery and toxicology services were consulted.
What can cause lower extremity paralysis in a drug user?
The differential diagnosis for the patient at this point included toxin-induced myelopathy, Guillain-Barré syndrome, hypokalemic periodic paralysis, spinal compression, epidural abscess, cerebrovascular accident, spinal lesion, and spinal artery dissection or infarction.
Although Guillain-Barré syndrome presents with ascending paralysis, there is usually an antecedent respiratory or gastrointestinal infection. While epidural abscess with spinal compression is associated with IV drug use and can present similarly, the patient in this case denied IV use. In the absence of any risk factors, cerebrovascular accident and spinal artery dissection were also unlikely.
Case Continuation
A bladder catheter was placed due to the patient’s inability to urinate, and approximately 1 L of urine output was retrieved. Immediate magnetic resonance imaging (MRI) demonstrated increased T2 signal intensity and expansion of the distal thoracic cord and conus without mass lesion, consistent with transverse myelitis (TM).
What is transverse myelitis and why does it occur?
Transverse myelitis is an inflammatory demyelinating disorder that focally affects the spinal cord, resulting in a specific pattern of motor, sensory, and autonomic dysfunction.1 Signs and symptoms include paresthesia, paralysis of the extremities, and loss of bladder and bowel control. The level of the spinal cord affected determines the clinical effects. Demyelination typically occurs at the thoracic segment, producing findings in the legs, as well as bladder and bowel dysfunction.
The exact cause of TM is unknown, but the inflammation may result from a viral complication or an abnormal immune response. Infectious viral agents suspected of causing TM include varicella zoster, herpes simplex, cytomegalovirus, Epstein-Barr, influenza, human immunodeficiency virus, hepatitis A, and rubella. It has also been postulated that an autoimmune reaction is responsible for the condition.
In some individuals, TM represents the first manifestation of an underlying demyelinating disorder such as multiple sclerosis or neuromyelitis optica. A diagnosis of TM is made through patient history, physical examination, and characteristic findings on neuroimaging, specifically MRI.
Heroin use has long been associated with the development of TM, and is usually associated with IV administration of the drug after a period of abstinence.2 This association strengthens the basis for an immunologic etiology—an initial sensitization and subsequent reexposure causing the effects of TM. There have also been cases of TM coexisting with rhabdomyolysis due to the patient being found in a contorted position.3 Another theory of the etiology of heroin-associated TM is a reaction to a possible adulterant or contaminant in the heroin.4
What is the treatment and prognosis of transverse myelitis?
Since there is no cure for TM, treatment is directed at reducing inflammation in the spinal cord. Initial therapy generally includes corticosteroids. In patients with a minimal response to corticosteroids, plasma exchange can be attempted. There are also limited data to suggest a beneficial role for the use of IV immunoglobulin.5 In addition to treatment, general supportive care must also be optimized, such as the use of prophylaxis for thrombophlebitis due to immobility and physical therapy, if possible.
The prognosis of patients with TM is variable, and up to two thirds of patients will have moderate-to-severe residual neurological disability.6 Recovery is slow, with most patients beginning to show improvement within the first 2 to 12 weeks from treatment and supportive care. The recovery process can continue for 2 years. However, if no improvement is made within the first 3 to 6 months, recovery is unlikely.7 Cases of heroin-associated TM may have a more favorable prognosis.8
A majority of individuals will only experience this clinical entity once, but there are rare causes of recurrent or relapsing TM.7 In these situations, a search for underlying demyelinating diseases should be performed.
Case Conclusion
The patient was immediately started on IV corticosteroids, but as there was no improvement after 5 days, plasmapheresis was performed. She received 5 cycles of plasmapheresis and a 5-day course of IV immunoglobulin but still without any improvement. A repeat MRI of the thoracic spine was performed and raised the possibility of cord infarct, but infectious or inflammatory myelitis remained within differential consideration. The patient continued to make minimal improvement with physical therapy and, after a 3-week hospital course, she was transferred to inpatient rehabilitation for further care. Over the next 2 months, the loss of sensation and motor ability of her legs did not improve, but she did regain control of her bowels and bladder.
Dr Regina is a medical toxicology fellow in the department of emergency medicine at North Shore Long Island Jewish Health System, New York. Dr Nelson, editor of “Case Studies in Toxicology,” is a professor in the department of emergency medicine and director of the medical toxicology fellowship program at the New York University School of Medicine and the New York City Poison Control Center. He is also associate editor, toxicology, of the EMERGENCY MEDICINE editorial board.
- Pandit L. Transverse myelitis spectrum disorders. Neurol India. 2009;57(2):126-133.
- Richter RW, Rosenberg RN. Transverse myelitis associated with heroin addiction. JAMA. 1968;206(6):1255-1257.
- Sahni V, Garg D, Garg S, Agarwal SK, Singh NP. Unusual complications of heroin abuse: transverse myelitis, rhabdomyolysis, compartment syndrome, and ARF. Clin Toxicol (Phila). 2008;46(2):153-155.
- Schein PS, Yessayan L, Mayman CI. Acute transverse myelitis associated with intravenous opium. Neurology. 1971;21(1):101-102.
- Absoud M, Gadian J, Hellier J, et al. Protocol for a multicentre randomiSed controlled TRial of IntraVEnous immunoglobulin versus standard therapy for the treatment of transverse myelitis in adults and children (STRIVE). BMJ Open. 2015;5(5):e008312.
- West TW. Transverse myelitis--a review of the presentation, diagnosis, and initial management. Discov Med. 2013;16(88):167-177.
- Transverse myelitis fact sheet. National Institute of Neurological Disorders and Stroke. http://www.ninds.nih.gov/disorders/transversemyelitis/detail_transversemyelitis.htm. Updated June 24, 2015. Accessed September 2, 2015.
- McGuire JL, Beslow LA, Finkel RS, Zimmerman RA, Henretig FM. A teenager with focal weakness. Pediatr Emerg Care. 2008;24(12):875-879.
Case
A 17-year-old adolescent girl with a history of depression and opioid dependence, for which she was taking buprenorphine until 2 weeks earlier, presented to the ED via emergency medical services (EMS) after her father found her lying on the couch unresponsive and with shallow respirations. Naloxone was administered by EMS and her mental status improved.
At presentation, the patient admitted to insufflation of an unknown amount of heroin and ingestion of 2 mg of alprazolam earlier in the day. She denied any past or current use of intravenous (IV) drugs. During monitoring, she began to complain of numbness in her legs and an inability to urinate. Examination revealed paralysis and decreased sensation of her bilateral lower extremities to the midthigh, with decreased rectal tone. Because of the patient’s history of drug use and temporal association with the heroin overdose, both neurosurgery and toxicology services were consulted.
What can cause lower extremity paralysis in a drug user?
The differential diagnosis for the patient at this point included toxin-induced myelopathy, Guillain-Barré syndrome, hypokalemic periodic paralysis, spinal compression, epidural abscess, cerebrovascular accident, spinal lesion, and spinal artery dissection or infarction.
Although Guillain-Barré syndrome presents with ascending paralysis, there is usually an antecedent respiratory or gastrointestinal infection. While epidural abscess with spinal compression is associated with IV drug use and can present similarly, the patient in this case denied IV use. In the absence of any risk factors, cerebrovascular accident and spinal artery dissection were also unlikely.
Case Continuation
A bladder catheter was placed due to the patient’s inability to urinate, and approximately 1 L of urine output was retrieved. Immediate magnetic resonance imaging (MRI) demonstrated increased T2 signal intensity and expansion of the distal thoracic cord and conus without mass lesion, consistent with transverse myelitis (TM).
What is transverse myelitis and why does it occur?
Transverse myelitis is an inflammatory demyelinating disorder that focally affects the spinal cord, resulting in a specific pattern of motor, sensory, and autonomic dysfunction.1 Signs and symptoms include paresthesia, paralysis of the extremities, and loss of bladder and bowel control. The level of the spinal cord affected determines the clinical effects. Demyelination typically occurs at the thoracic segment, producing findings in the legs, as well as bladder and bowel dysfunction.
The exact cause of TM is unknown, but the inflammation may result from a viral complication or an abnormal immune response. Infectious viral agents suspected of causing TM include varicella zoster, herpes simplex, cytomegalovirus, Epstein-Barr, influenza, human immunodeficiency virus, hepatitis A, and rubella. It has also been postulated that an autoimmune reaction is responsible for the condition.
In some individuals, TM represents the first manifestation of an underlying demyelinating disorder such as multiple sclerosis or neuromyelitis optica. A diagnosis of TM is made through patient history, physical examination, and characteristic findings on neuroimaging, specifically MRI.
Heroin use has long been associated with the development of TM, and is usually associated with IV administration of the drug after a period of abstinence.2 This association strengthens the basis for an immunologic etiology—an initial sensitization and subsequent reexposure causing the effects of TM. There have also been cases of TM coexisting with rhabdomyolysis due to the patient being found in a contorted position.3 Another theory of the etiology of heroin-associated TM is a reaction to a possible adulterant or contaminant in the heroin.4
What is the treatment and prognosis of transverse myelitis?
Since there is no cure for TM, treatment is directed at reducing inflammation in the spinal cord. Initial therapy generally includes corticosteroids. In patients with a minimal response to corticosteroids, plasma exchange can be attempted. There are also limited data to suggest a beneficial role for the use of IV immunoglobulin.5 In addition to treatment, general supportive care must also be optimized, such as the use of prophylaxis for thrombophlebitis due to immobility and physical therapy, if possible.
The prognosis of patients with TM is variable, and up to two thirds of patients will have moderate-to-severe residual neurological disability.6 Recovery is slow, with most patients beginning to show improvement within the first 2 to 12 weeks from treatment and supportive care. The recovery process can continue for 2 years. However, if no improvement is made within the first 3 to 6 months, recovery is unlikely.7 Cases of heroin-associated TM may have a more favorable prognosis.8
A majority of individuals will only experience this clinical entity once, but there are rare causes of recurrent or relapsing TM.7 In these situations, a search for underlying demyelinating diseases should be performed.
Case Conclusion
The patient was immediately started on IV corticosteroids, but as there was no improvement after 5 days, plasmapheresis was performed. She received 5 cycles of plasmapheresis and a 5-day course of IV immunoglobulin but still without any improvement. A repeat MRI of the thoracic spine was performed and raised the possibility of cord infarct, but infectious or inflammatory myelitis remained within differential consideration. The patient continued to make minimal improvement with physical therapy and, after a 3-week hospital course, she was transferred to inpatient rehabilitation for further care. Over the next 2 months, the loss of sensation and motor ability of her legs did not improve, but she did regain control of her bowels and bladder.
Dr Regina is a medical toxicology fellow in the department of emergency medicine at North Shore Long Island Jewish Health System, New York. Dr Nelson, editor of “Case Studies in Toxicology,” is a professor in the department of emergency medicine and director of the medical toxicology fellowship program at the New York University School of Medicine and the New York City Poison Control Center. He is also associate editor, toxicology, of the EMERGENCY MEDICINE editorial board.
- Pandit L. Transverse myelitis spectrum disorders. Neurol India. 2009;57(2):126-133.
- Richter RW, Rosenberg RN. Transverse myelitis associated with heroin addiction. JAMA. 1968;206(6):1255-1257.
- Sahni V, Garg D, Garg S, Agarwal SK, Singh NP. Unusual complications of heroin abuse: transverse myelitis, rhabdomyolysis, compartment syndrome, and ARF. Clin Toxicol (Phila). 2008;46(2):153-155.
- Schein PS, Yessayan L, Mayman CI. Acute transverse myelitis associated with intravenous opium. Neurology. 1971;21(1):101-102.
- Absoud M, Gadian J, Hellier J, et al. Protocol for a multicentre randomiSed controlled TRial of IntraVEnous immunoglobulin versus standard therapy for the treatment of transverse myelitis in adults and children (STRIVE). BMJ Open. 2015;5(5):e008312.
- West TW. Transverse myelitis--a review of the presentation, diagnosis, and initial management. Discov Med. 2013;16(88):167-177.
- Transverse myelitis fact sheet. National Institute of Neurological Disorders and Stroke. http://www.ninds.nih.gov/disorders/transversemyelitis/detail_transversemyelitis.htm. Updated June 24, 2015. Accessed September 2, 2015.
- McGuire JL, Beslow LA, Finkel RS, Zimmerman RA, Henretig FM. A teenager with focal weakness. Pediatr Emerg Care. 2008;24(12):875-879.

A 56-year-old with diarrhea and weakness
A 56-year-old man presents to the emergency department with nausea, weakness, and exertional dyspnea, which have been going on for 1 week. He is sent by his primary care physician after being noted to be hypotensive with a weak, thready pulse.
He has had diarrhea with intermittent abdominal pain over the past year, with 10 stools daily, including 3 or 4 at night. The stools are described as large, nonbloody, sticky, greasy, and occasionally watery. Stools are fewer when he curtails his food intake. The diarrhea is associated with occasional diffuse abdominal pain he describes as a burning sensation. He has no incontinence or tenesmus. He reports that he has unintentionally lost 137 lb (62 kg) over the past year. He has not taken over-the-counter antidiarrheal agents.
CHRONIC DIARRHEA
1. Chronic diarrhea is defined as lasting for at least how long?
- 1 week
- 2 weeks
- 3 weeks
- 4 weeks
Chronic diarrhea is defined as looser stools for more than 4 weeks,1 a period that allows most cases of acute, self-limited, infectious diarrhea to resolve.
Because individuals perceive diarrhea differently, reported prevalence rates of chronic diarrhea vary.2 Based on the definition of having excessive stool frequency, the prevalence in the United States is about 5%.1
In developing countries, the most common cause of chronic diarrhea is infection. In developed nations, irritable bowel syndrome, inflammatory bowel disease, malabsorption syndrome, and chronic infection predominate.1
Once chronicity is established, diarrhea should be characterized as inflammatory, fatty, or watery (Table 1).3
CASE CONTINUED: HISTORY OF HYPERTENSION, DIABETES
Our patient reports that he has never traveled outside the United States. He has a history of hypertension and type 2 diabetes mellitus that is controlled on oral agents. He has had surgery for a radial fracture and for reconstruction of his knees. He uses no tobacco, alcohol, or illicit drugs and works as a train engineer. He has no pets. He knows of no family history of inflammatory bowel disease or chronic diarrhea.
Comment. Patients with diabetes are at increased risk of gastrointestinal problems, with severity increasing with poorer control.4 Although our patient’s diabetes puts him at risk of diabetic autonomic neuropathy, his blood glucose control has been consistently good since his diagnosis, and his last measured hemoglobin A1c was 7.3% (reference range 4%–7%). His description of greasy stools in conjunction with his marked weight loss puts fatty diarrhea higher on the differential diagnosis.
DRUG-INDUCED DIARRHEA
His medications include glimepiride 1 mg twice daily, lisinopril 10 mg daily, metformin 500 mg twice daily, omeprazole 40 mg daily, and naproxen 220 mg daily. He has been taking metformin for at least 2 years. He is allergic to pentobarbital.
2. Which of his medications is least likely to be associated with his diarrhea?
- Lisinopril
- Metformin
- Glimepiride
- Naproxen
More than 700 drugs are known to cause diarrhea, often through the interplay of simultaneous mechanisms.5 The diagnosis of drug-induced diarrhea requires taking a careful medication history and establishing a temporal relationship between the drug and the diarrheal symptoms. Treatment consists of withdrawing the offending agent.
Nonsteroidal anti-inflammatory drugs (eg, naproxen) are associated with collagenous colitis that occurs mostly after long-term use (> 6 months). Metformin-induced diarrhea is related to fat malabsorption. Olmesartan, an angiotensin II receptor antagonist, has been associated with severe sprue-like enteropathy. On the other hand, the incidence of diarrhea with lisinopril is similar to that with placebo.7
CASE CONTINUED: EXAMINATION AND LABORATORY VALUES
The patient’s primary care physician had recently referred him to a gastroenterologist, and 4 days before presenting to the emergency department he had undergone abdominal and pelvic computed tomography (CT) with iodinated contrast, which had showed hepatic steatosis and pancreatic atrophy.
On examination now, the patient’s temperature is 97.5°F (36.4°C), heart rate 90 beats per minute, respirations 18 breaths per minute, oxygen saturation 99% on room air, and blood pressure 85/55 mm Hg. His body mass index is 32.5 kg/m2. His oral mucosa is dry. The rest of the examination is normal. No rash or ulcers are noted.
His laboratory values (Table 2) are notable for sodium 130 mmol/L, potassium 2.2 mmol/L, bicarbonate 9 mmol/L, blood urea nitrogen 32 mg/dL, creatinine 4.18 mg/dL, and international normalized ratio 5.4. Arterial blood gases drawn on admission reveal pH 7.32 and pCO2 19 mm Hg.
ACID-BASE DISTURBANCES
3. The patient’s acidosis is most likely related to which of the following?
- Sepsis
- Diarrhea
- Metformin
- Acute kidney injury
It is most likely related to diarrhea. The patient has a non-anion-gap metabolic acidosis. (The anion gap can be calculated by subtracting the sum of the serum bicarbonate and chloride values from the sodium—here, 130 – [112 + 9] = 9—and most textbooks list the reference range as 10–12 mmol/L.) Non-anion-gap metabolic acidosis results from excessive loss of bicarbonate or impaired ability of the kidney to excrete acid. Bicarbonate losses can occur in diarrhea or in ureteral diversion to the colon. Impairment in urinary acidification can occur in renal tubular acidosis.
To determine the cause of non-anion-gap acidosis, calculating the urine anion gap can be useful (Table 3), as it reflects the ability of the kidneys to excrete acid and is an indirect measure of ammonium excretion. Our patient’s urine anion gap is –45 mmol/L ([62 + 8] – 115), which supports diarrhea as the cause of his non-anion-gap acidosis. Sepsis, metformin use, or acute kidney injury would result in an anion-gap acidosis.
To manage acid-base disturbances, it is important to first determine whether there is a single primary disturbance with compensation or a mixed disorder. In the case of metabolic acidosis, for every 1-mmol/L decrease in bicarbonate, there should be a corresponding 1.3-mm Hg decrease in pCO2. Our patient’s laboratory data show that he had a pure non-anion-gap metabolic acidosis.8 His sensation of dyspnea was likely related to respiratory compensation as evidenced by an appropriately low pCO2.
CASE CONTINUED: HIS LABORATORY VALUES IMPROVE
The patient is admitted to the hospital for fluid resuscitation with normal saline and potassium and magnesium replacement.
Renal ultrasonography reveals normal-appearing kidneys without obstruction. The calculated fractional excretion of sodium is 3.4%. Urine microscopy reveals two to five hyaline casts per low-power field. His urine output remains adequate, and 3 days after hospitalization, his renal function starts to improve, as reflected in falling serum creatinine and blood urea nitrogen levels: his creatinine level has declined to 1.91 mg/dL and his blood urea nitrogen level has declined to 24 mg/dL. His acute kidney injury is attributed to intravenous contrast given for computed tomography, as well as to volume depletion and hypotension.
Stool studies for ova, parasites, and Clostridium difficile are negative. Fecal calprotectin and lactoferrin are useful noninvasive markers of intestinal inflammation but were not checked in this case.
Loperamide, taken as needed, is started for his diarrhea, along with empiric pancreatic enzyme replacement. After 3 days of treatment with oral vitamin K 10 mg, his international normalized ratio comes down to 1.4, from his admission value of 5.4. Given the clinical concern for fat malabsorption, vitamin D levels are also checked: his 25-hydroxyvitamin D level is less than 10 ng/mL (lower limit of normal 20). His fecal neutral fats are reported as normal, but split fats are increased.
STOOL FAT STUDIES
4. What does increased fecal split fats but normal fecal neutral fats imply?
- Pancreatic insufficiency
- Intestinal malabsorption
- Does not differentiate between the two
The finding does not differentiate between pancreatic insufficiency and intestinal malabsorption. The two-step Sudan stain has been used to differentiate maldigestion (eg, caused by pancreatic insufficiency) from malabsorption. Although patients with impaired digestion were once thought to excrete excessive amounts of intact triglyceride whereas those with malabsorption excrete more of the lipolytic or “split” product, the Sudan stain does not differentiate between the two.10 Stool fecal-elastase 1 testing correlates well with pancreatic exocrine function but was not performed in our patient.11
CASE CONTINUED: CELIAC DISEASE IS DIAGNOSED
Given the description of his stools, unintentional weight loss, and improvement of stool frequency with fasting, serologic testing for celiac disease is performed (Table 4). The patient undergoes esophagogastroduodenoscopy, which shows mild duodenitis. Small-bowel biopsy reveals blunted villous architecture and increased mixed inflammatory cells of the epithelium and lamina propria, suggestive of celiac disease.
The patient is diagnosed with celiac disease and is counseled to follow a gluten-free diet. He is discharged home and scheduled to follow up with a gastroenterologist and nephrologist. His liver function test abnormalities are attributed to a combination of nonalcoholic steatohepatitis and celiac disease.
CELIAC DISEASE AND MALABSORPTION
Celiac disease is an immune-mediated disorder that causes mucosal injury to the small intestine, leading to malabsorption. It is triggered by gluten intake in genetically susceptible individuals. The HLA-DQ2 haplotype is expressed in nearly 90% of patients with the disease.
The worldwide prevalence of celiac disease is about 0.6% to 1%. Those with an affected first-degree relative, type 1 diabetes, Hashimoto thyroiditis, an autoimmune disease, Down syndrome, Turner syndrome, or IgA deficiency have an increased risk.
Celiac disease presents with chronic diarrhea, weight loss, and abdominal distention and pain. Sequelae of nutrient malabsorption such as iron-deficiency anemia, short stature, and osteopenia may be evident. Liver function may also be impaired. Dermatitis herpetiformis and gluten ataxia are rarer presentations of celiac disease.12
In the absence of immunoglobulin (Ig) A deficiency, measurement of serum IgA anti-tissue transglutaminase antibodies is recommended for initial testing. IgG antitissue transglutaminase antibodies can be measured in those with IgA deficiency.12
Duodenal biopsies to confirm the diagnosis are recommended in adults unless they have previously had biopsy-proven dermatitis herpetiformis.
Gluten-free diet
The treatment for celiac disease is avoidance of gluten. Patients who consult with a nutritionist and participate in an advocacy group are more likely to adhere to a gluten-free diet, and the physician should strongly encourage and facilitate these activities.13
Untreated disease can lead to osteoporosis, impaired splenic function with increased risk of infection with encapsulated organisms, infertility or recurrent abortion, ulcerative jejunoileitis, and lymphoma.12 Patients should be monitored annually for adherence to the gluten-free diet and for the development of any associated condition. Despite adherence to a gluten-free diet, calcium absorption and bone mineral density are lower in patients with celiac disease than in controls.14 Careful monitoring of fracture risk and adequate calcium and vitamin D replacement are also important.
Our patient undergoes dual-emission x-ray absorptiometry after discharge, with results consistent with osteopenia. His T scores range from –0.2 at the right hip to –1.1 in the left femoral neck.
Recurrence or persistently abnormal levels of IgA anti-tissue transglutaminase antibodies usually indicates poor dietary compliance.12
5. In patients whose symptoms do not improve on gluten restriction, there should be concern for which of the following?
- Lymphoma
- Nonadherence to gluten restriction
- Microscopic colitis
- All of the above
The answer is all of the above. Up to 30% of patients have persistent symptoms on a gluten-free diet. Persistent exposure to gluten is the most common reason for lack of clinical improvement. In addition, bacterial overgrowth of the small bowel, lactose intolerance, pancreatic insufficiency, and microscopic colitis may coexist with celiac disease and may contribute to ongoing symptoms. In a small subset of patients with persistent villous atrophy and symptoms despite strict adherence to a gluten-free diet for 12 months, the disease is deemed “refractory.” Refractory celiac disease can be a precursor to enteropathy-associated T-cell lymphoma.13
CASE CONCLUDED
On telephone follow-up 3 weeks after discharge, the patient reports complete resolution of diarrhea and stabilization of his weight. He reports strict adherence to a gluten-free diet and feels he is coping well.
Diagnoses
- Presenting weakness secondary to dehydration and hypokalemia
- Dyspnea secondary to respiratory compensation for metabolic acidosis
- Non-anion-gap metabolic acidosis secondary to diarrhea
- Acute kidney injury secondary to iodinated contrast, volume depletion, hypotension
- Chronic diarrhea secondary to celiac disease
- Coagulopathy secondary to fat malabsorption secondary to celiac disease.
- Fine KD, Schiller LR. AGA technical review on the evaluation and management of chronic diarrhea. Gastroenterology 1999; 116:1464–1486.
- Talley NJ, Weaver AL, Zinsmeister AR, Melton LJ 3rd. Self-reported diarrhea: what does it mean? Am J Gastroenterol 1994; 89:1160–1164.
- Sweetser S. Evaluating the patient with diarrhea: a case-based approach. Mayo Clin Proc 2012; 87:596–602.
- Bytzer P, Talley NJ, Leemon M, Young LJ, Jones MP, Horowitz M. Prevalence of gastrointestinal symptoms associated with diabetes mellitus: a population-based survey of 15,000 adults. Arch Intern Med 2001; 161:1989–1996.
- Chassany O, Michaux A, Bergmann JF. Drug-induced diarrhoea. Drug Saf 2000; 22:53–72.
- Rubio-Tapia A, Herman ML, Ludvigsson JF, et al. Severe spruelike enteropathy associated with olmesartan. Mayo Clin Proc 2012; 87:732–738.
- Zestril (lisinopril) tablets. www.accessdata.fda.gov/drugsatfda_docs/label/2012/019777s062lbl.pdf. Accessed September 8, 2015.
- Whittier WL, Rutecki GW. Primer on clinical acid-base problem solving. Dis Mon 2004; 50:122–162.
- Langhorst J, Elsenbruch S, Koelzer J, Rueffer A, Michalsen A, Dobos GJ. Noninvasive markers in the assessment of intestinal inflammation in inflammatory bowel diseases: performance of fecal lactoferrin, calprotectin, and PMN-elastase, CRP, and clinical indices. Am J Gastroenterol 2008; 103:162–169.
- Khouri MR, Ng SN, Huang G, Shiau YF. Fecal triglyceride excretion is not excessive in pancreatic insufficiency. Gastroenterology 1989; 96:848–852.
- Dominici R, Franzini C. Fecal elastase-1 as a test for pancreatic function: a review. Clin Chem Lab Med 2002; 40:325–332.
- Fasano A, Catassi C. Celiac disease. New Engl J Med 2012; 367:2419–2426.
- Mooney PD, Hadjivassiliou M, Sanders DS. Coeliac disease. BMJ 2014; 348:g1561–g1561.
- Pazianas M, Butcher GP, Subhani JM, et al. Calcium absorption and bone mineral density in celiacs after long term treatment with gluten-free diet and adequate calcium intake. Osteoporos Int 2005; 16:56–63.
A 56-year-old man presents to the emergency department with nausea, weakness, and exertional dyspnea, which have been going on for 1 week. He is sent by his primary care physician after being noted to be hypotensive with a weak, thready pulse.
He has had diarrhea with intermittent abdominal pain over the past year, with 10 stools daily, including 3 or 4 at night. The stools are described as large, nonbloody, sticky, greasy, and occasionally watery. Stools are fewer when he curtails his food intake. The diarrhea is associated with occasional diffuse abdominal pain he describes as a burning sensation. He has no incontinence or tenesmus. He reports that he has unintentionally lost 137 lb (62 kg) over the past year. He has not taken over-the-counter antidiarrheal agents.
CHRONIC DIARRHEA
1. Chronic diarrhea is defined as lasting for at least how long?
- 1 week
- 2 weeks
- 3 weeks
- 4 weeks
Chronic diarrhea is defined as looser stools for more than 4 weeks,1 a period that allows most cases of acute, self-limited, infectious diarrhea to resolve.
Because individuals perceive diarrhea differently, reported prevalence rates of chronic diarrhea vary.2 Based on the definition of having excessive stool frequency, the prevalence in the United States is about 5%.1
In developing countries, the most common cause of chronic diarrhea is infection. In developed nations, irritable bowel syndrome, inflammatory bowel disease, malabsorption syndrome, and chronic infection predominate.1
Once chronicity is established, diarrhea should be characterized as inflammatory, fatty, or watery (Table 1).3
CASE CONTINUED: HISTORY OF HYPERTENSION, DIABETES
Our patient reports that he has never traveled outside the United States. He has a history of hypertension and type 2 diabetes mellitus that is controlled on oral agents. He has had surgery for a radial fracture and for reconstruction of his knees. He uses no tobacco, alcohol, or illicit drugs and works as a train engineer. He has no pets. He knows of no family history of inflammatory bowel disease or chronic diarrhea.
Comment. Patients with diabetes are at increased risk of gastrointestinal problems, with severity increasing with poorer control.4 Although our patient’s diabetes puts him at risk of diabetic autonomic neuropathy, his blood glucose control has been consistently good since his diagnosis, and his last measured hemoglobin A1c was 7.3% (reference range 4%–7%). His description of greasy stools in conjunction with his marked weight loss puts fatty diarrhea higher on the differential diagnosis.
DRUG-INDUCED DIARRHEA
His medications include glimepiride 1 mg twice daily, lisinopril 10 mg daily, metformin 500 mg twice daily, omeprazole 40 mg daily, and naproxen 220 mg daily. He has been taking metformin for at least 2 years. He is allergic to pentobarbital.
2. Which of his medications is least likely to be associated with his diarrhea?
- Lisinopril
- Metformin
- Glimepiride
- Naproxen
More than 700 drugs are known to cause diarrhea, often through the interplay of simultaneous mechanisms.5 The diagnosis of drug-induced diarrhea requires taking a careful medication history and establishing a temporal relationship between the drug and the diarrheal symptoms. Treatment consists of withdrawing the offending agent.
Nonsteroidal anti-inflammatory drugs (eg, naproxen) are associated with collagenous colitis that occurs mostly after long-term use (> 6 months). Metformin-induced diarrhea is related to fat malabsorption. Olmesartan, an angiotensin II receptor antagonist, has been associated with severe sprue-like enteropathy. On the other hand, the incidence of diarrhea with lisinopril is similar to that with placebo.7
CASE CONTINUED: EXAMINATION AND LABORATORY VALUES
The patient’s primary care physician had recently referred him to a gastroenterologist, and 4 days before presenting to the emergency department he had undergone abdominal and pelvic computed tomography (CT) with iodinated contrast, which had showed hepatic steatosis and pancreatic atrophy.
On examination now, the patient’s temperature is 97.5°F (36.4°C), heart rate 90 beats per minute, respirations 18 breaths per minute, oxygen saturation 99% on room air, and blood pressure 85/55 mm Hg. His body mass index is 32.5 kg/m2. His oral mucosa is dry. The rest of the examination is normal. No rash or ulcers are noted.
His laboratory values (Table 2) are notable for sodium 130 mmol/L, potassium 2.2 mmol/L, bicarbonate 9 mmol/L, blood urea nitrogen 32 mg/dL, creatinine 4.18 mg/dL, and international normalized ratio 5.4. Arterial blood gases drawn on admission reveal pH 7.32 and pCO2 19 mm Hg.
ACID-BASE DISTURBANCES
3. The patient’s acidosis is most likely related to which of the following?
- Sepsis
- Diarrhea
- Metformin
- Acute kidney injury
It is most likely related to diarrhea. The patient has a non-anion-gap metabolic acidosis. (The anion gap can be calculated by subtracting the sum of the serum bicarbonate and chloride values from the sodium—here, 130 – [112 + 9] = 9—and most textbooks list the reference range as 10–12 mmol/L.) Non-anion-gap metabolic acidosis results from excessive loss of bicarbonate or impaired ability of the kidney to excrete acid. Bicarbonate losses can occur in diarrhea or in ureteral diversion to the colon. Impairment in urinary acidification can occur in renal tubular acidosis.
To determine the cause of non-anion-gap acidosis, calculating the urine anion gap can be useful (Table 3), as it reflects the ability of the kidneys to excrete acid and is an indirect measure of ammonium excretion. Our patient’s urine anion gap is –45 mmol/L ([62 + 8] – 115), which supports diarrhea as the cause of his non-anion-gap acidosis. Sepsis, metformin use, or acute kidney injury would result in an anion-gap acidosis.
To manage acid-base disturbances, it is important to first determine whether there is a single primary disturbance with compensation or a mixed disorder. In the case of metabolic acidosis, for every 1-mmol/L decrease in bicarbonate, there should be a corresponding 1.3-mm Hg decrease in pCO2. Our patient’s laboratory data show that he had a pure non-anion-gap metabolic acidosis.8 His sensation of dyspnea was likely related to respiratory compensation as evidenced by an appropriately low pCO2.
CASE CONTINUED: HIS LABORATORY VALUES IMPROVE
The patient is admitted to the hospital for fluid resuscitation with normal saline and potassium and magnesium replacement.
Renal ultrasonography reveals normal-appearing kidneys without obstruction. The calculated fractional excretion of sodium is 3.4%. Urine microscopy reveals two to five hyaline casts per low-power field. His urine output remains adequate, and 3 days after hospitalization, his renal function starts to improve, as reflected in falling serum creatinine and blood urea nitrogen levels: his creatinine level has declined to 1.91 mg/dL and his blood urea nitrogen level has declined to 24 mg/dL. His acute kidney injury is attributed to intravenous contrast given for computed tomography, as well as to volume depletion and hypotension.
Stool studies for ova, parasites, and Clostridium difficile are negative. Fecal calprotectin and lactoferrin are useful noninvasive markers of intestinal inflammation but were not checked in this case.
Loperamide, taken as needed, is started for his diarrhea, along with empiric pancreatic enzyme replacement. After 3 days of treatment with oral vitamin K 10 mg, his international normalized ratio comes down to 1.4, from his admission value of 5.4. Given the clinical concern for fat malabsorption, vitamin D levels are also checked: his 25-hydroxyvitamin D level is less than 10 ng/mL (lower limit of normal 20). His fecal neutral fats are reported as normal, but split fats are increased.
STOOL FAT STUDIES
4. What does increased fecal split fats but normal fecal neutral fats imply?
- Pancreatic insufficiency
- Intestinal malabsorption
- Does not differentiate between the two
The finding does not differentiate between pancreatic insufficiency and intestinal malabsorption. The two-step Sudan stain has been used to differentiate maldigestion (eg, caused by pancreatic insufficiency) from malabsorption. Although patients with impaired digestion were once thought to excrete excessive amounts of intact triglyceride whereas those with malabsorption excrete more of the lipolytic or “split” product, the Sudan stain does not differentiate between the two.10 Stool fecal-elastase 1 testing correlates well with pancreatic exocrine function but was not performed in our patient.11
CASE CONTINUED: CELIAC DISEASE IS DIAGNOSED
Given the description of his stools, unintentional weight loss, and improvement of stool frequency with fasting, serologic testing for celiac disease is performed (Table 4). The patient undergoes esophagogastroduodenoscopy, which shows mild duodenitis. Small-bowel biopsy reveals blunted villous architecture and increased mixed inflammatory cells of the epithelium and lamina propria, suggestive of celiac disease.
The patient is diagnosed with celiac disease and is counseled to follow a gluten-free diet. He is discharged home and scheduled to follow up with a gastroenterologist and nephrologist. His liver function test abnormalities are attributed to a combination of nonalcoholic steatohepatitis and celiac disease.
CELIAC DISEASE AND MALABSORPTION
Celiac disease is an immune-mediated disorder that causes mucosal injury to the small intestine, leading to malabsorption. It is triggered by gluten intake in genetically susceptible individuals. The HLA-DQ2 haplotype is expressed in nearly 90% of patients with the disease.
The worldwide prevalence of celiac disease is about 0.6% to 1%. Those with an affected first-degree relative, type 1 diabetes, Hashimoto thyroiditis, an autoimmune disease, Down syndrome, Turner syndrome, or IgA deficiency have an increased risk.
Celiac disease presents with chronic diarrhea, weight loss, and abdominal distention and pain. Sequelae of nutrient malabsorption such as iron-deficiency anemia, short stature, and osteopenia may be evident. Liver function may also be impaired. Dermatitis herpetiformis and gluten ataxia are rarer presentations of celiac disease.12
In the absence of immunoglobulin (Ig) A deficiency, measurement of serum IgA anti-tissue transglutaminase antibodies is recommended for initial testing. IgG antitissue transglutaminase antibodies can be measured in those with IgA deficiency.12
Duodenal biopsies to confirm the diagnosis are recommended in adults unless they have previously had biopsy-proven dermatitis herpetiformis.
Gluten-free diet
The treatment for celiac disease is avoidance of gluten. Patients who consult with a nutritionist and participate in an advocacy group are more likely to adhere to a gluten-free diet, and the physician should strongly encourage and facilitate these activities.13
Untreated disease can lead to osteoporosis, impaired splenic function with increased risk of infection with encapsulated organisms, infertility or recurrent abortion, ulcerative jejunoileitis, and lymphoma.12 Patients should be monitored annually for adherence to the gluten-free diet and for the development of any associated condition. Despite adherence to a gluten-free diet, calcium absorption and bone mineral density are lower in patients with celiac disease than in controls.14 Careful monitoring of fracture risk and adequate calcium and vitamin D replacement are also important.
Our patient undergoes dual-emission x-ray absorptiometry after discharge, with results consistent with osteopenia. His T scores range from –0.2 at the right hip to –1.1 in the left femoral neck.
Recurrence or persistently abnormal levels of IgA anti-tissue transglutaminase antibodies usually indicates poor dietary compliance.12
5. In patients whose symptoms do not improve on gluten restriction, there should be concern for which of the following?
- Lymphoma
- Nonadherence to gluten restriction
- Microscopic colitis
- All of the above
The answer is all of the above. Up to 30% of patients have persistent symptoms on a gluten-free diet. Persistent exposure to gluten is the most common reason for lack of clinical improvement. In addition, bacterial overgrowth of the small bowel, lactose intolerance, pancreatic insufficiency, and microscopic colitis may coexist with celiac disease and may contribute to ongoing symptoms. In a small subset of patients with persistent villous atrophy and symptoms despite strict adherence to a gluten-free diet for 12 months, the disease is deemed “refractory.” Refractory celiac disease can be a precursor to enteropathy-associated T-cell lymphoma.13
CASE CONCLUDED
On telephone follow-up 3 weeks after discharge, the patient reports complete resolution of diarrhea and stabilization of his weight. He reports strict adherence to a gluten-free diet and feels he is coping well.
Diagnoses
- Presenting weakness secondary to dehydration and hypokalemia
- Dyspnea secondary to respiratory compensation for metabolic acidosis
- Non-anion-gap metabolic acidosis secondary to diarrhea
- Acute kidney injury secondary to iodinated contrast, volume depletion, hypotension
- Chronic diarrhea secondary to celiac disease
- Coagulopathy secondary to fat malabsorption secondary to celiac disease.
- Fine KD, Schiller LR. AGA technical review on the evaluation and management of chronic diarrhea. Gastroenterology 1999; 116:1464–1486.
- Talley NJ, Weaver AL, Zinsmeister AR, Melton LJ 3rd. Self-reported diarrhea: what does it mean? Am J Gastroenterol 1994; 89:1160–1164.
- Sweetser S. Evaluating the patient with diarrhea: a case-based approach. Mayo Clin Proc 2012; 87:596–602.
- Bytzer P, Talley NJ, Leemon M, Young LJ, Jones MP, Horowitz M. Prevalence of gastrointestinal symptoms associated with diabetes mellitus: a population-based survey of 15,000 adults. Arch Intern Med 2001; 161:1989–1996.
- Chassany O, Michaux A, Bergmann JF. Drug-induced diarrhoea. Drug Saf 2000; 22:53–72.
- Rubio-Tapia A, Herman ML, Ludvigsson JF, et al. Severe spruelike enteropathy associated with olmesartan. Mayo Clin Proc 2012; 87:732–738.
- Zestril (lisinopril) tablets. www.accessdata.fda.gov/drugsatfda_docs/label/2012/019777s062lbl.pdf. Accessed September 8, 2015.
- Whittier WL, Rutecki GW. Primer on clinical acid-base problem solving. Dis Mon 2004; 50:122–162.
- Langhorst J, Elsenbruch S, Koelzer J, Rueffer A, Michalsen A, Dobos GJ. Noninvasive markers in the assessment of intestinal inflammation in inflammatory bowel diseases: performance of fecal lactoferrin, calprotectin, and PMN-elastase, CRP, and clinical indices. Am J Gastroenterol 2008; 103:162–169.
- Khouri MR, Ng SN, Huang G, Shiau YF. Fecal triglyceride excretion is not excessive in pancreatic insufficiency. Gastroenterology 1989; 96:848–852.
- Dominici R, Franzini C. Fecal elastase-1 as a test for pancreatic function: a review. Clin Chem Lab Med 2002; 40:325–332.
- Fasano A, Catassi C. Celiac disease. New Engl J Med 2012; 367:2419–2426.
- Mooney PD, Hadjivassiliou M, Sanders DS. Coeliac disease. BMJ 2014; 348:g1561–g1561.
- Pazianas M, Butcher GP, Subhani JM, et al. Calcium absorption and bone mineral density in celiacs after long term treatment with gluten-free diet and adequate calcium intake. Osteoporos Int 2005; 16:56–63.

Upper-limb deep vein thrombosis in Paget-Schroetter syndrome
A 43-year-old man with no medical history presented with pain and swelling in his left arm for 2 weeks. He was a regular weight lifter, and his exercise routine included repetitive hyperextension and hyperabduction of his arms while lifting heavy weights.
He had no history of recent trauma or venous cannulation of the left arm. His family history was negative for thrombophilic disorders. Physical examination revealed a swollen and erythematous left arm and visible venous collaterals at the neck, shoulder, and chest. There was no evidence of arterial insufficiency.
Duplex ultrasonography confirmed thrombosis of the left brachial, axillary, and subclavian veins. Further evaluation with computed tomography showed no intrathoracic mass but revealed several subsegmental pulmonary thrombi in the right lung. A screen for thrombophilia was negative. Venography confirmed complete thrombotic occlusion of the subclavian, axillary, and brachial veins (Figure 1).
Catheter-directed thrombolysis with tissue plasminogen activator resulted in complete resolution of the thrombosis, but venography after 3 days of thrombolysis showed 50% residual stenosis of the left subclavian vein where it passes under the first rib (Figure 2). The redness and swelling had markedly improved 2 days after thrombolytic therapy. He was discharged home on rivaroxaban 20 mg daily.
Follow-up venography 2 months later (Figure 3), with the patient performing hyperabduction of the arms, showed a patent subclavian vein with no thrombosis, but dynamic compression and occlusion of the subclavian vein where it passes the first rib. Magnetic resonance imaging (MRI) of the neck showed no cervical (ie, extra) rib and no soft-tissue abnormalities of the scalene triangle.
Following this, the patient underwent resection of the left first rib for decompression of the venous thoracic outlet, which resulted in resolution of his symptoms. He remained asymptomatic at 6-month follow-up.
PAGET-SCHROETTER SYNDROME
Paget-Schroetter syndrome, also referred to as effort-induced or effort thrombosis, is thrombosis of the axillary or subclavian vein associated with strenuous and repetitive activity of the arms. Anatomic abnormalities at the thoracic outlet—cervical rib, congenital bands, hypertrophy of scalene tendons, abnormal insertion of the costoclavicular ligament—and repetitive trauma to the endothelium of the subclavian vein are key factors in its initiation and progression.
The condition is seen primarily in young people who participate in strenuous activities such as rowing, weight lifting, and baseball pitching. It is estimated to be the cause of 40% of cases of primary upper-extremity deep vein thrombosis in the absence of an obvious risk factor or trigger such as a central venous catheter, pacemaker, port, or occult malignancy.1
A provocative test such as the Adson test or hyperabduction test during MRI or venography helps confirm thoracic outlet obstruction by demonstrating dynamic obstruction.2
TREATMENT CONSIDERATIONS
There are no universal guidelines for the treatment of Paget-Schroetter syndrome. However, the available data3–5 suggest a multimodal approach that involves early catheter-directed thrombolysis and subsequent surgical decompression of the thoracic outlet. This can restore venous patency and reduce the risk of long-term complications such as rethrombosis and postthrombotic syndrome.3–5
Surgical treatment includes resection of the first rib and division of the scalene muscles and the costoclavicular ligament. MRI with provocative testing helps guide the surgical approach. Anticoagulation therapy alone—ie, without thrombolysis and surgical decompression—is inadequate as it leads to recurrence of thrombosis and residual symptoms.6
Paget-Schroetter syndrome should not be managed the same as lower-extremity deep vein thrombosis because the cause and the exacerbating factors are different.
Unanswered questions
Because we have no data from randomized controlled trials, questions about management remain. What should be the duration of anticoagulation, especially in the absence of coexisting thrombophilia? Is thrombophilia screening useful? What is the optimal timing for starting thrombolytic therapy?
A careful history and heightened suspicion are required to make this diagnosis. If undiagnosed, it carries a risk of significant long-term morbidity and death. Dynamic obstruction during venography, in addition to MRI, can help identify an anatomic obstruction.
- Bernardi E, Pesavento R, Prandoni P. Upper extremity deep venous thrombosis. Semin Thromb Hemost 2006; 32:729–736.
- Demirbag D, Unlu E, Ozdemir F, et al. The relationship between magnetic resonance imaging findings and postural maneuver and physical examination tests in patients with thoracic outlet syndrome: results of a double-blind, controlled study. Arch Phys Med Rehabil 2007; 88:844–851.
- Alla VM, Natarajan N, Kaushik M, Warrier R, Nair CK. Paget-Schroetter syndrome: review of pathogenesis and treatment of effort thrombosis. West J Emerg Med 2010; 11:358–362.
- Molina JE, Hunter DW, Dietz CA. Paget-Schroetter syndrome treated with thrombolytics and immediate surgery. J Vasc Surg 2007; 45:328–334.
- Thompson RW. Comprehensive management of subclavian vein effort thrombosis. Semin Intervent Radiol 2012; 29:44–51.
- AbuRahma AF, Robinson PA. Effort subclavian vein thrombosis: evolution of management. J Endovasc Ther 2000; 7:302–308.
A 43-year-old man with no medical history presented with pain and swelling in his left arm for 2 weeks. He was a regular weight lifter, and his exercise routine included repetitive hyperextension and hyperabduction of his arms while lifting heavy weights.
He had no history of recent trauma or venous cannulation of the left arm. His family history was negative for thrombophilic disorders. Physical examination revealed a swollen and erythematous left arm and visible venous collaterals at the neck, shoulder, and chest. There was no evidence of arterial insufficiency.
Duplex ultrasonography confirmed thrombosis of the left brachial, axillary, and subclavian veins. Further evaluation with computed tomography showed no intrathoracic mass but revealed several subsegmental pulmonary thrombi in the right lung. A screen for thrombophilia was negative. Venography confirmed complete thrombotic occlusion of the subclavian, axillary, and brachial veins (Figure 1).
Catheter-directed thrombolysis with tissue plasminogen activator resulted in complete resolution of the thrombosis, but venography after 3 days of thrombolysis showed 50% residual stenosis of the left subclavian vein where it passes under the first rib (Figure 2). The redness and swelling had markedly improved 2 days after thrombolytic therapy. He was discharged home on rivaroxaban 20 mg daily.
Follow-up venography 2 months later (Figure 3), with the patient performing hyperabduction of the arms, showed a patent subclavian vein with no thrombosis, but dynamic compression and occlusion of the subclavian vein where it passes the first rib. Magnetic resonance imaging (MRI) of the neck showed no cervical (ie, extra) rib and no soft-tissue abnormalities of the scalene triangle.
Following this, the patient underwent resection of the left first rib for decompression of the venous thoracic outlet, which resulted in resolution of his symptoms. He remained asymptomatic at 6-month follow-up.
PAGET-SCHROETTER SYNDROME
Paget-Schroetter syndrome, also referred to as effort-induced or effort thrombosis, is thrombosis of the axillary or subclavian vein associated with strenuous and repetitive activity of the arms. Anatomic abnormalities at the thoracic outlet—cervical rib, congenital bands, hypertrophy of scalene tendons, abnormal insertion of the costoclavicular ligament—and repetitive trauma to the endothelium of the subclavian vein are key factors in its initiation and progression.
The condition is seen primarily in young people who participate in strenuous activities such as rowing, weight lifting, and baseball pitching. It is estimated to be the cause of 40% of cases of primary upper-extremity deep vein thrombosis in the absence of an obvious risk factor or trigger such as a central venous catheter, pacemaker, port, or occult malignancy.1
A provocative test such as the Adson test or hyperabduction test during MRI or venography helps confirm thoracic outlet obstruction by demonstrating dynamic obstruction.2
TREATMENT CONSIDERATIONS
There are no universal guidelines for the treatment of Paget-Schroetter syndrome. However, the available data3–5 suggest a multimodal approach that involves early catheter-directed thrombolysis and subsequent surgical decompression of the thoracic outlet. This can restore venous patency and reduce the risk of long-term complications such as rethrombosis and postthrombotic syndrome.3–5
Surgical treatment includes resection of the first rib and division of the scalene muscles and the costoclavicular ligament. MRI with provocative testing helps guide the surgical approach. Anticoagulation therapy alone—ie, without thrombolysis and surgical decompression—is inadequate as it leads to recurrence of thrombosis and residual symptoms.6
Paget-Schroetter syndrome should not be managed the same as lower-extremity deep vein thrombosis because the cause and the exacerbating factors are different.
Unanswered questions
Because we have no data from randomized controlled trials, questions about management remain. What should be the duration of anticoagulation, especially in the absence of coexisting thrombophilia? Is thrombophilia screening useful? What is the optimal timing for starting thrombolytic therapy?
A careful history and heightened suspicion are required to make this diagnosis. If undiagnosed, it carries a risk of significant long-term morbidity and death. Dynamic obstruction during venography, in addition to MRI, can help identify an anatomic obstruction.
- Bernardi E, Pesavento R, Prandoni P. Upper extremity deep venous thrombosis. Semin Thromb Hemost 2006; 32:729–736.
- Demirbag D, Unlu E, Ozdemir F, et al. The relationship between magnetic resonance imaging findings and postural maneuver and physical examination tests in patients with thoracic outlet syndrome: results of a double-blind, controlled study. Arch Phys Med Rehabil 2007; 88:844–851.
- Alla VM, Natarajan N, Kaushik M, Warrier R, Nair CK. Paget-Schroetter syndrome: review of pathogenesis and treatment of effort thrombosis. West J Emerg Med 2010; 11:358–362.
- Molina JE, Hunter DW, Dietz CA. Paget-Schroetter syndrome treated with thrombolytics and immediate surgery. J Vasc Surg 2007; 45:328–334.
- Thompson RW. Comprehensive management of subclavian vein effort thrombosis. Semin Intervent Radiol 2012; 29:44–51.
- AbuRahma AF, Robinson PA. Effort subclavian vein thrombosis: evolution of management. J Endovasc Ther 2000; 7:302–308.
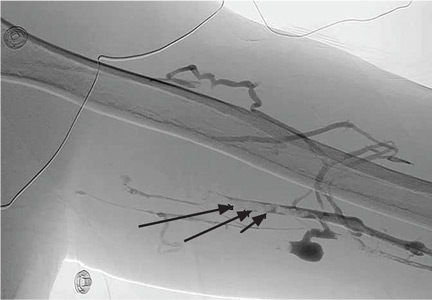
Oh, Deer! Accident Leaves Man in Pain
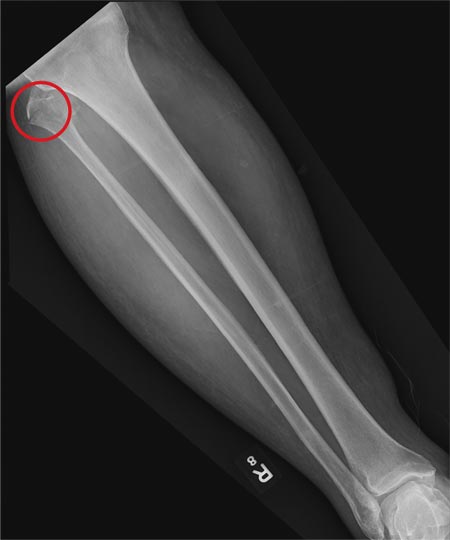
ANSWER
The radiograph shows a nondisplaced fracture of the proximal fibular head. No other fractures are evident. There is some evidence of soft-tissue injury and edema over the tibia.
An orthopedics consultation was obtained, with the presumption that the fracture would be nonsurgically managed.
ANSWER
The radiograph shows a nondisplaced fracture of the proximal fibular head. No other fractures are evident. There is some evidence of soft-tissue injury and edema over the tibia.
An orthopedics consultation was obtained, with the presumption that the fracture would be nonsurgically managed.
ANSWER
The radiograph shows a nondisplaced fracture of the proximal fibular head. No other fractures are evident. There is some evidence of soft-tissue injury and edema over the tibia.
An orthopedics consultation was obtained, with the presumption that the fracture would be nonsurgically managed.

A 50-year-old man is brought to your facility by EMS personnel for evaluation after a motor vehicle crash. He was an unrestrained driver who swerved suddenly to avoid hitting a deer that jumped in front of him. He lost control of his vehicle, which rolled over several times and eventually landed in a ditch. His airbag deployed. The patient’s primary complaint is neck and right leg pain. His medical history is essentially unremarkable. He is awake, alert, and oriented, with stable vital signs. Primary survey shows a large laceration of his right leg over the tibia, with extensive soft-tissue injury and loss through the muscle. He has good range of motion in his knee, with no evident pain or swelling. His ankle and foot also show no injury and appear to be neurovascularly intact. You obtain a radiograph of the right tibia. What is your impression?
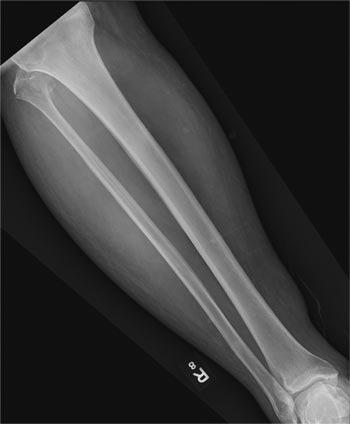
Middle East respiratory syndrome: SARS redux?
Middle East respiratory syndrome (MERS) is a potentially lethal illness caused by the Middle East respiratory syndrome coronavirus (MERS-CoV). The virus was first reported in 2012, when it was isolated from the sputum of a previously healthy man in Saudi Arabia who presented with acute pneumonia and subsequent renal failure with a fatal outcome.1 Retrospective studies subsequently identified an earlier outbreak that year involving 13 patients in Jordan, and since then cases have been reported in 25 countries across the Arabian Peninsula and in Asia, Europe, Africa, and the United States, with over 1,000 confirmed cases and 450 related deaths.2,3
At the time of this writing, two cases of MERS have been reported in the United States, both in May 2014. Both reported cases involved patients who had traveled from Saudi Arabia, and which did not result in secondary cases.4 Beginning in May 2015, the Republic of Korea had experienced the largest known outbreak of MERS outside the Arabian Peninsula, with over 100 cases.5
THE VIRUS
MERS-CoV is classified as a coronavirus, which is a family of single-stranded RNA viruses. In 2003, a previously unknown coronavirus (SARS-CoV) caused a global outbreak of pneumonia that resulted in approximately 800 deaths.6 The MERS-CoV virus attaches to dipeptidyl peptidase 4 to enter cells, and this receptor is believed to be critical for pathogenesis, as infection does not occur in its absence.7
The source and mode of transmission to humans is not completely defined. Early reports suggested that MERS-CoV originated in bats, as RNA sequences related to MERS-CoV have been found in several bat species, but the virus itself has not been isolated from bats.8 Camels have been found to have a high rate of anti-MERS-CoV antibodies and to have the virus in nose swabs, and evidence for camel-to-human transmission has been presented.9–11 However, the precise role of camels and other animals as reservoirs or vectors of infection is still under investigation.
The incubation period from exposure to the development of clinical disease is estimated at 5 to 14 days.
For MERS-CoV, the basic reproduction ratio (R0), which measures the average number of secondary cases from each infected person, is estimated12 to be less than 0.7. In diseases in which the R0 is less than 1.0, infections occur in isolated clusters as limited chains of transmission, and thus the sustained transmission of MERS-CoV resulting in a large epidemic is thought to be unlikely. As a comparison, the median R0 value for seasonal influenza is estimated13 at 1.28. “Superspreading” may result in limited outbreaks of secondary cases; however, the continued epidemic spread of infection is thought to be unlikely.14 Nevertheless, viral adaptation with increased transmissibility remains a concern and a potential threat.
CLINICAL PRESENTATION
MERS most commonly presents as a respiratory illness, although asymptomatic infection occurs. The percentage of patients who experience asymptomatic infection is unknown. A recent survey of 255 patients with laboratory-confirmed MERS-CoV found that 64 (25.1%) were reported as asymptomatic at time of specimen collection. However, when 33 (52%) of those patients were interviewed, 26 (79%) reported at least one symptom that was consistent with a viral respiratory illness.15
For symptomatic patients, the initial complaints are nonspecific, beginning with fever, cough, sore throat, chills, and myalgia. Patients experiencing severe infection progress to dyspnea and pneumonia, with requirements for ventilatory support, vasopressors, and renal replacement therapy.16 Gastrointestinal symptoms such as vomiting and diarrhea have been reported in about one-third of patients.17
In a study of 47 patients with MERS-CoV, most of whom had underlying medical illnesses, 42 (89%) required intensive care and 34 (72%) required mechanical ventilation.17 The case-fatality rate in this study was 60%, but other studies have reported rates closer to 30%.15
Laboratory findings in patients with MERS-CoV infection usually include leukopenia and thrombocytopenia. Severely ill patients may have evidence of acute kidney injury.
Radiographic findings of MERS are those of viral pneumonitis and acute respiratory distress syndrome. Computed tomographic findings include ground-glass opacities, with peripheral lower-lobe preference.18
DIAGNOSIS
As MERS is a respiratory illness, sampling of respiratory secretions provides the highest yield for diagnosis. A study of 112 patients with MERS-CoV reported that polymerase chain reaction (PCR) testing of tracheal aspirates and bronchoalveolar lavage samples yielded significantly higher MERS-CoV loads than nasopharyngeal swab samples and sputum samples.19 However, upper respiratory tract testing is less invasive, and a positive nasopharyngeal swab result may obviate the need for further testing.
The US Centers for Disease Control and Prevention (CDC) recommends collecting multiple specimens from different sites at different times after the onset of symptoms in order to increase the diagnostic yield. Specifically, it recommends testing a lower respiratory specimen (eg, sputum, bronchoalveolar lavage fluid, tracheal aspirate), a nasopharyngeal and oropharyngeal swab, and serum, using the CDC MERS-CoV rRT-PCR assay. In addition, for patients whose symptoms began more than 14 days earlier, the CDC also recommends testing a serum specimen with the CDC MERS-CoV serologic assay. As these guidelines are updated frequently, clinicians are advised to check the CDC website for the most up-to-date information (www.cdc.gov/coronavirus/mers/guidelines-clinical-specimens.html).20 The identification of MERS-CoV by virus isolation in cell culture is not recommended and, if pursued, must be performed in a biosafety level 3 facility. (Level 3 is the second-highest level of biosafety. The highest, level 4, is reserved for extremely dangerous agents such as Ebola virus).20
Given the nonspecific clinical presentation of MERS-CoV, clinicians may consider testing for other respiratory pathogens. A recent review of 54 travelers to California from MERS-CoV-affected areas found that while none tested positive for MERS-CoV, 32 (62%) of 52 travelers had other respiratory viruses.21 When testing for alternative pathogens, clinicians should order molecular or antigen-based detection methods.
TREATMENT
Unfortunately, treatment for MERS is primarily supportive.
Ribavirin and interferon alfa-2b demonstrated activity in an animal model, but the regimen was ineffective when given a median of 19 (range 10–22) days after admission in 5 critically ill patients who subsequently died.22 A retrospective analysis comparing 20 patients with severe MERS-CoV who received ribavirin and interferon alfa-2a with 24 patients who did not reported that while survival was improved at 14 days, the mortality rates were similar at 28 days.23
A systematic review of treatments used for severe acute respiratory syndrome (SARS) reported that most studies investigating steroid use were inconclusive and some showed possible harm, suggesting that systemic steroids should be avoided in coronavirus infections.24
PREVENTION
Healthcare-associated outbreaks of MERS are well described, and thus recognition of potential cases and prompt institution of appropriate infection control measures are critical.15,25
Healthcare providers should ask patients about recent travel history and ascertain if they meet the CDC criteria for a “patient under investigation” (PUI), ie, if they have both clinical features and an epidemiologic risk of MERS (Table 1). However, these recommendations for identification will assuredly change as the outbreak matures, and healthcare providers should refer to the CDC website for the most up-to-date information.
Once a PUI is identified, standard, contact, and airborne precautions are advised. These measures include performing hand hygiene and donning personal protective equipment, including gloves, gowns, eye protection, and respiratory protection (ie, a respirator) that is at least as protective as a fit-tested National Institute for Occupational Safety and Health-certified N95 filtering face-piece respirator. In addition, a patient with possible MERS should be placed in an airborne infection isolation room.
Traveler’s advice
The CDC does not currently recommend that Americans change their travel plans because of MERS. Clinicians performing pretravel evaluations should advise patients of current information on MERS. Patients at risk for MERS who develop a respiratory illness within 14 days of return should seek medical attention and inform healthcare providers of their travel history.
SUMMARY
Recent experience with SARS, Ebola virus disease, and now MERS-CoV highlights the impact of global air travel as a vector for the rapid worldwide dissemination of communicable diseases. Healthcare providers should elicit a travel history in all patients presenting with a febrile illness, as an infection acquired in one continent may not become manifest until the patient presents in another.
The scope of the current MERS-CoV outbreak is still evolving, with concerns that viral evolution could result in a SARS-like outbreak, as experienced almost a decade ago.
Healthcare providers are advised to screen patients at risk for MERS-CoV for respiratory symptoms, and to institute appropriate infection control measures. Through recognition and isolation, healthcare providers are at the front line in limiting the spread of this potentially lethal virus.
- Zaki AM, van Boheemen S, Bestebroer TM, Osterhaus ADME, Fouchier RAM. Isolation of a novel coronavirus from a man with pneumonia in Saudi Arabia. N Engl J Med 2012; 367:1814–1820.
- Al-Abdallat MM, Payne DC, Alqasrawi S, et al. Hospital-associated outbreak of Middle East respiratory syndrome coronavirus: a serologic, epidemiologic, and clinical description. Clin Infect Dis 2014; 59:1225–1233.
- World Health Organization. Frequently asked questions on Middle East respiratory syndrome coronavirus (MERS-CoV). www.who.int/csr/disease/coronavirus_infections/faq/en/. Accessed July 29, 2015.
- Bialek SR, Allen D, Alvarado-Ramy F, et al; Centers for Disease Control and Prevention (CDC). First confirmed cases of Middle East respiratory syndrome coronavirus (MERS-CoV) infection in the United States, updated information on the epidemiology of MERS-CoV infection, and guidance for the public, clinicians, and public health authorities—May 2014. MMWR Morb Mortal Wkly Rep 2014; 63:431–436.
- World Health Organization. Middle East respiratory syndrome coronavirus (MERS-CoV) – Republic of Korea. www.who.int/csr/don/12-june-2015-mers-korea/en/. Accessed July 29, 2015.
- Peiris JSM, Guan Y, Yuen KY. Severe acute respiratory syndrome. Nat Med 2004; 10:S88–S97.
- van Doremalen N, Miazqowicz KL, Milne-Price S, et al. Host species restriction of Middle East respiratory syndrome coronavirus through its receptor, dipeptidyl peptidase 4. J Virol 2014; 88:9220–9232.
- Zumla A, Hui DS, Perlman S. Middle East respiratory syndrome. Lancet 2015; S0140-6736(15)60454-604548 (Epub ahead of print).
- Meyer B, Muller MA, Corman WM, et al. Antibodies against MERS coronavirus in dromedary camels, United Arab Emirates, 2003 and 2013. Emerg Infect Dis 2014; 20:552–559.
- Haagmans BL, Al Dhahiry SH, Reusken CB, et al. Middle East respiratory syndrome coronavirus in dromedary camels: an outbreak investigation. Lancet Infect Dis 2014; 14:140–145.
- Azhar EI, El-Kafrawy SA, Farraj SA, et al. Evidence for camel-to-human transmission of MERS coronavirus. N Engl J Med 2014; 370:2499–2505.
- Chowell G, Blumberg S, Simonsen L, Miller MA, Viboud C. Synthesizing data and models for the spread of MERS-CoV, 2013: key role of index cases and hospital transmission. Epidemics 2014; 9:40–51.
- Biggerstaff M, Chauchemez S, Reed C, Gambhir M, Finelli L. Estimates of the reproduction number for seasonal, pandemic, and zoonotic influenza: a systematic review of the literature. BMC Infect Dis 2014: 14:480.
- Kucharski AJ, Althaus CL. The role of superspreading in Middle East respiratory syndrome coronavirus (MERS-CoV) transmission. Euro Surveill 2015; 20.
- Oboho I, Tomczyk S, Al-Asmari A, et al. 2014 MERS-CoV outbreak in Jeddah—a link to health care facilities. N Engl J Med 2015; 372:846–854.
- Arabi YM, Arifi AA, Balkhy HH, et al. Clinical course and outcomes of critically ill patients with Middle East respiratory syndrome coronavirus infection. Ann Intern Med 2014; 160:389–397.
- Assiri A, Al-Tawfig JA, Al-Rabeeah AA, et al. Epidemiological, demographic, and clinical characteristics of 47 cases of Middle East respiratory syndrome coronavirus disease from Saudi Arabia: a descriptive study. Lancet Infect Dis 2013; 13:752–761.
- Das KM, Lee EY, Enani MA, et al. CT correlation with outcomes in 15 patients with acute Middle East respiratory syndrome coronavirus. AJR Am J Roentgenol 2015; 204:736–742.
- Memish ZA, Al-Tawfiq JA, Makhdoom HQ, et al. Respiratory tract samples, viral load, and genome fraction yield in patients with Middle East respiratory syndrome. J Infect Dis 2014; 210:1590–1594.
- Centers for Disease Control and Prevention. Middle East respiratory syndrome (MERS). Interim guidelines for collecting, handling, and testing clinical specimens from patients under investigation (PUIs) for Middle East respiratory syndrome coronavirus (MERS-CoV)—version 2.1. www.cdc.gov/coronavirus/mers/guidelines-clinical-specimens.html. Accessed July 29, 2015.
- Shakhkarami M, Yen C, Glaser CA, Xia D, Watt J, Wadford DA. Laboratory testing for Middle East respiratory syndrome coronavirus, California, USA, 2013–2014. Emerg Infect Dis 2015; 21: E-pub ahead of print. wwwnc.cdc.gov/eid/article/21/9/15-0476_article. Accessed July 29, 2015.
- Al-Tawfiq JA, Momattin H, Dib J, Memish ZA. Ribavirin and interferon therapy in patients infected with the Middle East respiratory syndrome coronavirus: an observational study. Int J Infect Dis 2014; 20:42–46.
- Omrani AS, Saad MM, Baig K, et al. Ribavirin and interferon alfa-2a for severe Middle East respiratory syndrome coronavirus infection: a retrospective cohort study. Lancet Infect Dis 2014; 14:1090–1095.
- Stockman LJ, Bellamy R, Garner, P. SARS: systematic review of treatment effects. PLoS Med 2006; 3:e343.
- Assiri A, McGeer A, Perl TM, et al; KSA MERS-CoV Investigation Team. Hospital outbreak of Middle East respiratory syndrome coronavirus. N Engl J Med 2013; 369:407–416.
Middle East respiratory syndrome (MERS) is a potentially lethal illness caused by the Middle East respiratory syndrome coronavirus (MERS-CoV). The virus was first reported in 2012, when it was isolated from the sputum of a previously healthy man in Saudi Arabia who presented with acute pneumonia and subsequent renal failure with a fatal outcome.1 Retrospective studies subsequently identified an earlier outbreak that year involving 13 patients in Jordan, and since then cases have been reported in 25 countries across the Arabian Peninsula and in Asia, Europe, Africa, and the United States, with over 1,000 confirmed cases and 450 related deaths.2,3
At the time of this writing, two cases of MERS have been reported in the United States, both in May 2014. Both reported cases involved patients who had traveled from Saudi Arabia, and which did not result in secondary cases.4 Beginning in May 2015, the Republic of Korea had experienced the largest known outbreak of MERS outside the Arabian Peninsula, with over 100 cases.5
THE VIRUS
MERS-CoV is classified as a coronavirus, which is a family of single-stranded RNA viruses. In 2003, a previously unknown coronavirus (SARS-CoV) caused a global outbreak of pneumonia that resulted in approximately 800 deaths.6 The MERS-CoV virus attaches to dipeptidyl peptidase 4 to enter cells, and this receptor is believed to be critical for pathogenesis, as infection does not occur in its absence.7
The source and mode of transmission to humans is not completely defined. Early reports suggested that MERS-CoV originated in bats, as RNA sequences related to MERS-CoV have been found in several bat species, but the virus itself has not been isolated from bats.8 Camels have been found to have a high rate of anti-MERS-CoV antibodies and to have the virus in nose swabs, and evidence for camel-to-human transmission has been presented.9–11 However, the precise role of camels and other animals as reservoirs or vectors of infection is still under investigation.
The incubation period from exposure to the development of clinical disease is estimated at 5 to 14 days.
For MERS-CoV, the basic reproduction ratio (R0), which measures the average number of secondary cases from each infected person, is estimated12 to be less than 0.7. In diseases in which the R0 is less than 1.0, infections occur in isolated clusters as limited chains of transmission, and thus the sustained transmission of MERS-CoV resulting in a large epidemic is thought to be unlikely. As a comparison, the median R0 value for seasonal influenza is estimated13 at 1.28. “Superspreading” may result in limited outbreaks of secondary cases; however, the continued epidemic spread of infection is thought to be unlikely.14 Nevertheless, viral adaptation with increased transmissibility remains a concern and a potential threat.
CLINICAL PRESENTATION
MERS most commonly presents as a respiratory illness, although asymptomatic infection occurs. The percentage of patients who experience asymptomatic infection is unknown. A recent survey of 255 patients with laboratory-confirmed MERS-CoV found that 64 (25.1%) were reported as asymptomatic at time of specimen collection. However, when 33 (52%) of those patients were interviewed, 26 (79%) reported at least one symptom that was consistent with a viral respiratory illness.15
For symptomatic patients, the initial complaints are nonspecific, beginning with fever, cough, sore throat, chills, and myalgia. Patients experiencing severe infection progress to dyspnea and pneumonia, with requirements for ventilatory support, vasopressors, and renal replacement therapy.16 Gastrointestinal symptoms such as vomiting and diarrhea have been reported in about one-third of patients.17
In a study of 47 patients with MERS-CoV, most of whom had underlying medical illnesses, 42 (89%) required intensive care and 34 (72%) required mechanical ventilation.17 The case-fatality rate in this study was 60%, but other studies have reported rates closer to 30%.15
Laboratory findings in patients with MERS-CoV infection usually include leukopenia and thrombocytopenia. Severely ill patients may have evidence of acute kidney injury.
Radiographic findings of MERS are those of viral pneumonitis and acute respiratory distress syndrome. Computed tomographic findings include ground-glass opacities, with peripheral lower-lobe preference.18
DIAGNOSIS
As MERS is a respiratory illness, sampling of respiratory secretions provides the highest yield for diagnosis. A study of 112 patients with MERS-CoV reported that polymerase chain reaction (PCR) testing of tracheal aspirates and bronchoalveolar lavage samples yielded significantly higher MERS-CoV loads than nasopharyngeal swab samples and sputum samples.19 However, upper respiratory tract testing is less invasive, and a positive nasopharyngeal swab result may obviate the need for further testing.
The US Centers for Disease Control and Prevention (CDC) recommends collecting multiple specimens from different sites at different times after the onset of symptoms in order to increase the diagnostic yield. Specifically, it recommends testing a lower respiratory specimen (eg, sputum, bronchoalveolar lavage fluid, tracheal aspirate), a nasopharyngeal and oropharyngeal swab, and serum, using the CDC MERS-CoV rRT-PCR assay. In addition, for patients whose symptoms began more than 14 days earlier, the CDC also recommends testing a serum specimen with the CDC MERS-CoV serologic assay. As these guidelines are updated frequently, clinicians are advised to check the CDC website for the most up-to-date information (www.cdc.gov/coronavirus/mers/guidelines-clinical-specimens.html).20 The identification of MERS-CoV by virus isolation in cell culture is not recommended and, if pursued, must be performed in a biosafety level 3 facility. (Level 3 is the second-highest level of biosafety. The highest, level 4, is reserved for extremely dangerous agents such as Ebola virus).20
Given the nonspecific clinical presentation of MERS-CoV, clinicians may consider testing for other respiratory pathogens. A recent review of 54 travelers to California from MERS-CoV-affected areas found that while none tested positive for MERS-CoV, 32 (62%) of 52 travelers had other respiratory viruses.21 When testing for alternative pathogens, clinicians should order molecular or antigen-based detection methods.
TREATMENT
Unfortunately, treatment for MERS is primarily supportive.
Ribavirin and interferon alfa-2b demonstrated activity in an animal model, but the regimen was ineffective when given a median of 19 (range 10–22) days after admission in 5 critically ill patients who subsequently died.22 A retrospective analysis comparing 20 patients with severe MERS-CoV who received ribavirin and interferon alfa-2a with 24 patients who did not reported that while survival was improved at 14 days, the mortality rates were similar at 28 days.23
A systematic review of treatments used for severe acute respiratory syndrome (SARS) reported that most studies investigating steroid use were inconclusive and some showed possible harm, suggesting that systemic steroids should be avoided in coronavirus infections.24
PREVENTION
Healthcare-associated outbreaks of MERS are well described, and thus recognition of potential cases and prompt institution of appropriate infection control measures are critical.15,25
Healthcare providers should ask patients about recent travel history and ascertain if they meet the CDC criteria for a “patient under investigation” (PUI), ie, if they have both clinical features and an epidemiologic risk of MERS (Table 1). However, these recommendations for identification will assuredly change as the outbreak matures, and healthcare providers should refer to the CDC website for the most up-to-date information.
Once a PUI is identified, standard, contact, and airborne precautions are advised. These measures include performing hand hygiene and donning personal protective equipment, including gloves, gowns, eye protection, and respiratory protection (ie, a respirator) that is at least as protective as a fit-tested National Institute for Occupational Safety and Health-certified N95 filtering face-piece respirator. In addition, a patient with possible MERS should be placed in an airborne infection isolation room.
Traveler’s advice
The CDC does not currently recommend that Americans change their travel plans because of MERS. Clinicians performing pretravel evaluations should advise patients of current information on MERS. Patients at risk for MERS who develop a respiratory illness within 14 days of return should seek medical attention and inform healthcare providers of their travel history.
SUMMARY
Recent experience with SARS, Ebola virus disease, and now MERS-CoV highlights the impact of global air travel as a vector for the rapid worldwide dissemination of communicable diseases. Healthcare providers should elicit a travel history in all patients presenting with a febrile illness, as an infection acquired in one continent may not become manifest until the patient presents in another.
The scope of the current MERS-CoV outbreak is still evolving, with concerns that viral evolution could result in a SARS-like outbreak, as experienced almost a decade ago.
Healthcare providers are advised to screen patients at risk for MERS-CoV for respiratory symptoms, and to institute appropriate infection control measures. Through recognition and isolation, healthcare providers are at the front line in limiting the spread of this potentially lethal virus.
- Zaki AM, van Boheemen S, Bestebroer TM, Osterhaus ADME, Fouchier RAM. Isolation of a novel coronavirus from a man with pneumonia in Saudi Arabia. N Engl J Med 2012; 367:1814–1820.
- Al-Abdallat MM, Payne DC, Alqasrawi S, et al. Hospital-associated outbreak of Middle East respiratory syndrome coronavirus: a serologic, epidemiologic, and clinical description. Clin Infect Dis 2014; 59:1225–1233.
- World Health Organization. Frequently asked questions on Middle East respiratory syndrome coronavirus (MERS-CoV). www.who.int/csr/disease/coronavirus_infections/faq/en/. Accessed July 29, 2015.
- Bialek SR, Allen D, Alvarado-Ramy F, et al; Centers for Disease Control and Prevention (CDC). First confirmed cases of Middle East respiratory syndrome coronavirus (MERS-CoV) infection in the United States, updated information on the epidemiology of MERS-CoV infection, and guidance for the public, clinicians, and public health authorities—May 2014. MMWR Morb Mortal Wkly Rep 2014; 63:431–436.
- World Health Organization. Middle East respiratory syndrome coronavirus (MERS-CoV) – Republic of Korea. www.who.int/csr/don/12-june-2015-mers-korea/en/. Accessed July 29, 2015.
- Peiris JSM, Guan Y, Yuen KY. Severe acute respiratory syndrome. Nat Med 2004; 10:S88–S97.
- van Doremalen N, Miazqowicz KL, Milne-Price S, et al. Host species restriction of Middle East respiratory syndrome coronavirus through its receptor, dipeptidyl peptidase 4. J Virol 2014; 88:9220–9232.
- Zumla A, Hui DS, Perlman S. Middle East respiratory syndrome. Lancet 2015; S0140-6736(15)60454-604548 (Epub ahead of print).
- Meyer B, Muller MA, Corman WM, et al. Antibodies against MERS coronavirus in dromedary camels, United Arab Emirates, 2003 and 2013. Emerg Infect Dis 2014; 20:552–559.
- Haagmans BL, Al Dhahiry SH, Reusken CB, et al. Middle East respiratory syndrome coronavirus in dromedary camels: an outbreak investigation. Lancet Infect Dis 2014; 14:140–145.
- Azhar EI, El-Kafrawy SA, Farraj SA, et al. Evidence for camel-to-human transmission of MERS coronavirus. N Engl J Med 2014; 370:2499–2505.
- Chowell G, Blumberg S, Simonsen L, Miller MA, Viboud C. Synthesizing data and models for the spread of MERS-CoV, 2013: key role of index cases and hospital transmission. Epidemics 2014; 9:40–51.
- Biggerstaff M, Chauchemez S, Reed C, Gambhir M, Finelli L. Estimates of the reproduction number for seasonal, pandemic, and zoonotic influenza: a systematic review of the literature. BMC Infect Dis 2014: 14:480.
- Kucharski AJ, Althaus CL. The role of superspreading in Middle East respiratory syndrome coronavirus (MERS-CoV) transmission. Euro Surveill 2015; 20.
- Oboho I, Tomczyk S, Al-Asmari A, et al. 2014 MERS-CoV outbreak in Jeddah—a link to health care facilities. N Engl J Med 2015; 372:846–854.
- Arabi YM, Arifi AA, Balkhy HH, et al. Clinical course and outcomes of critically ill patients with Middle East respiratory syndrome coronavirus infection. Ann Intern Med 2014; 160:389–397.
- Assiri A, Al-Tawfig JA, Al-Rabeeah AA, et al. Epidemiological, demographic, and clinical characteristics of 47 cases of Middle East respiratory syndrome coronavirus disease from Saudi Arabia: a descriptive study. Lancet Infect Dis 2013; 13:752–761.
- Das KM, Lee EY, Enani MA, et al. CT correlation with outcomes in 15 patients with acute Middle East respiratory syndrome coronavirus. AJR Am J Roentgenol 2015; 204:736–742.
- Memish ZA, Al-Tawfiq JA, Makhdoom HQ, et al. Respiratory tract samples, viral load, and genome fraction yield in patients with Middle East respiratory syndrome. J Infect Dis 2014; 210:1590–1594.
- Centers for Disease Control and Prevention. Middle East respiratory syndrome (MERS). Interim guidelines for collecting, handling, and testing clinical specimens from patients under investigation (PUIs) for Middle East respiratory syndrome coronavirus (MERS-CoV)—version 2.1. www.cdc.gov/coronavirus/mers/guidelines-clinical-specimens.html. Accessed July 29, 2015.
- Shakhkarami M, Yen C, Glaser CA, Xia D, Watt J, Wadford DA. Laboratory testing for Middle East respiratory syndrome coronavirus, California, USA, 2013–2014. Emerg Infect Dis 2015; 21: E-pub ahead of print. wwwnc.cdc.gov/eid/article/21/9/15-0476_article. Accessed July 29, 2015.
- Al-Tawfiq JA, Momattin H, Dib J, Memish ZA. Ribavirin and interferon therapy in patients infected with the Middle East respiratory syndrome coronavirus: an observational study. Int J Infect Dis 2014; 20:42–46.
- Omrani AS, Saad MM, Baig K, et al. Ribavirin and interferon alfa-2a for severe Middle East respiratory syndrome coronavirus infection: a retrospective cohort study. Lancet Infect Dis 2014; 14:1090–1095.
- Stockman LJ, Bellamy R, Garner, P. SARS: systematic review of treatment effects. PLoS Med 2006; 3:e343.
- Assiri A, McGeer A, Perl TM, et al; KSA MERS-CoV Investigation Team. Hospital outbreak of Middle East respiratory syndrome coronavirus. N Engl J Med 2013; 369:407–416.
KEY POINTS
- In MERS, initial complaints are of fever, cough, chills and myalgia. In a subset of patients, usually those with underlying illnesses, the disease can progress to fulminant sepsis with respiratory and renal failure and death.
- Healthcare providers should regularly visit the US Centers for Disease Control and Prevention website for current information on countries experiencing a MERS outbreak, and for advice on how to identify a potentially infected patient.
- MERS-CoV has caused several healthcare-related outbreaks, so prompt identification and isolation of infected patients is critical to limiting the spread of infection. A “patient under identification” (ie, a person who has both clinical features and an epidemiologic risk) should be cared for under standard, contact, and airborne precautions.

Elective Craniotomy Results in Respiratory Distress
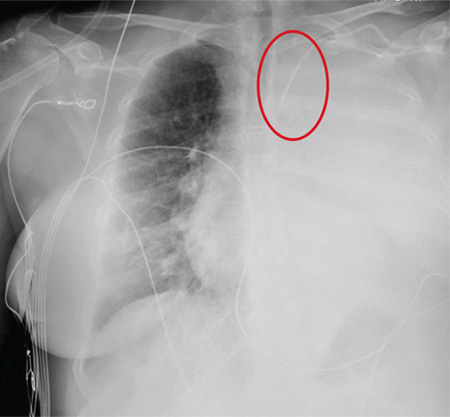
ANSWER
The radiograph shows complete opacification of the left hemithorax. The differential includes total atelectasis of the lung, mucus plug within the left bronchus, or possible blood or fluid collection. Of note, the patient has a catheter within the left subclavian vein, the distal tip of which appears to be in an unusual location. In this case, it was determined that the displaced catheter tip, resulting in hemothorax, was the etiology. The line was removed, and urgent cardiothoracic consultation was obtained. A left chest tube was promptly placed, with a resultant 2 L of immediate output. The patient improved clinically as well.
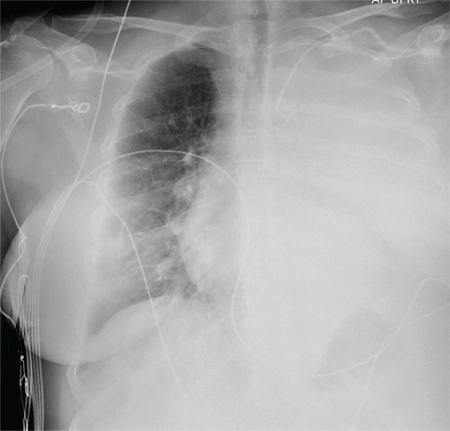
A 60-year-old woman undergoes an elective craniotomy for clipping of a nonruptured aneurysm. The perioperative course is uneventful, and the aneurysm is clipped without complication. The patient is extubated and sent to the recovery room. Within 30 minutes, you are notified by the nurse that the patient is experiencing moderate respiratory distress. There are no neurologic deficits. Her medical history includes hypertension, hypercholesterolemia, and coronary artery disease, with previous stenting. Preoperative medical and cardiac clearance for the craniotomy had been obtained. Examination reveals the patient to be in a postanesthetic state, with mild-to-moderate dyspnea and tachypnea. She appears to be moving all of her extremities well. Her O2 saturation is 92% on 100% oxygen via a nonrebreather mask. Her breath sounds are significantly diminished on the left side. A stat portable chest radiograph is obtained. What is your impression?
