User login
Is Headache a Sign of a Larger Problem?
Answer
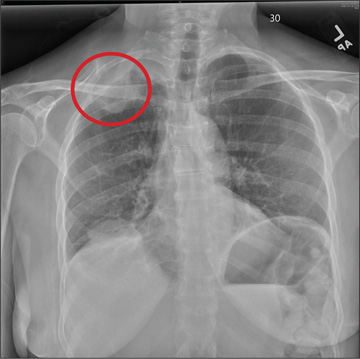
The radiograph shows a masslike density within the left suprahilar and mediastinal region, most likely consistent with a carcinoma. Given the entire clinical picture, this patient likely has a primary lung carcinoma that metastasized to the brain.
Answer
The radiograph shows a masslike density within the left suprahilar and mediastinal region, most likely consistent with a carcinoma. Given the entire clinical picture, this patient likely has a primary lung carcinoma that metastasized to the brain.
Answer
The radiograph shows a masslike density within the left suprahilar and mediastinal region, most likely consistent with a carcinoma. Given the entire clinical picture, this patient likely has a primary lung carcinoma that metastasized to the brain.

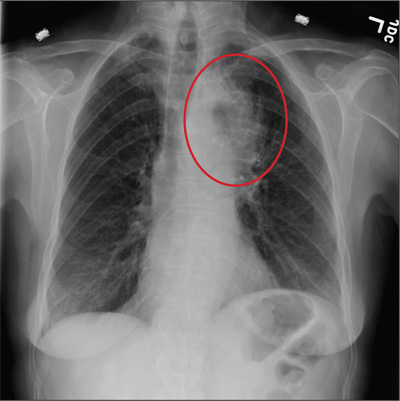
A 60-year-old woman presents with a complaint of severe headache, hoarseness, and weight loss, which have worsened in the past few days. Her headache is bifrontal, and at times she rates its severity as 10/10. She is not aware of any medical problems, but she admits she doesn’t have a primary care provider due to lack of insurance. She has a 30-year history of smoking one to one-and-a-half packs of cigarettes per day. Family history is positive for cancer. On examination, you note that she is uncomfortable but in no obvious distress. Her vital signs are normal. She is able to move all four extremities well and is neurovascularly intact. She has no other focal deficits. Noncontrast CT of the head is obtained. It shows a large right frontal lesion with surrounding vasogenic edema. You also order a chest radiograph (shown). What is your impression?
Woman, 78, With Dyspnea, Dry Cough, and Fatigue
A 78-year-old woman presented to the emergency department (ED) complaining of shortness of breath, a dry nonproductive cough, fatigue, hypoxia, and general malaise lasting for several months and worsening over a two-week period. She denied having fever, chills, hemoptysis, weight loss, headache, rashes, or joint pain. She reported sweats, decrease in appetite, wheezing, cough without sputum production, and slight swelling of the legs. The patient complained of chest pain upon admission, but it resolved quickly.
The patient, a retired widow with five grown children, denied recent surgery or exposure to sick people, had not travelled, and reported no changes in her home environment. She claimed to have no pets but admitted to currently smoking about four cigarettes a day; she had previously smoked, on average, three packs of cigarettes per day for 60 years. She denied using alcohol or drugs, including intravenous agents.
The patient’s medical history was significant for paroxysmal atrial fibrillation. She had also been diagnosed with chronic obstructive pulmonary disease (COPD), transient ischemic attack, patent foramen ovale, hyperlipidemia, seizure disorder, and hypothyroidism. She had no known HIV risk factors and had had no exposure to asbestos or tuberculosis.
The patient’s current medications included amiodarone (200 mg/d) for four years; valproic acid (500 mg/d); aspirin (325 mg/d); levothyroxine (50 g/d); rosuvastatin (10 mg/d); daily warfarin, dosed according to the international normalized ratio (INR); and budesonide/formoterol (160/4.5 mg, one puff bid). She denied having any drug allergies.
Physical examination in the ED revealed a pulse of 63 beats/min; blood pressure, 108/50 mm Hg; and respiratory rate, 16 to 20 breaths/min. The patient’s O2 saturation was 84% on room air; 82% to 84% on 4 L to 6 L of supplemental oxygen; 87% to 92% with a venturi mask; and 95% on biphasic positive airway pressure (BiPAP) device. She was afebrile with hypoxia and able to speak in full sentences. Crackles were detected in the upper lung fields, best heard anteriorly, as well as a few scattered wheezes and rhonchi. Her heart sounds were normal with a regular rhythm; her extremities exhibited trace edema bilaterally. The remainder of the physical exam was normal.
The patient’s laboratory values included a normal white blood cell (WBC) count, elevated lactic acid dehydrogenase (LDH) at 448 IU/L (reference range, 84 to 246 IU/L), and no eosinophils. The erythrocyte sedimentation rate (ESR) was not measured on admission. Blood analysis of her N-terminal pro-brain natriuretic peptide (NT-proBNP) was 4,877 pg/mL; for women older than 75, a level higher than 1,800 pg/mL is abnormal.
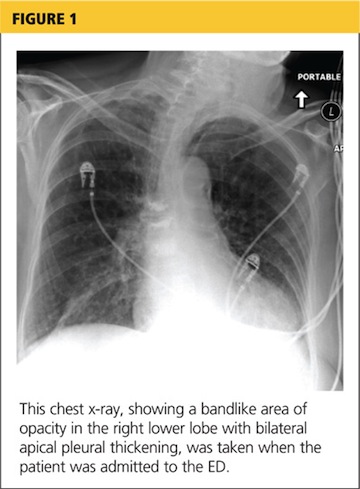
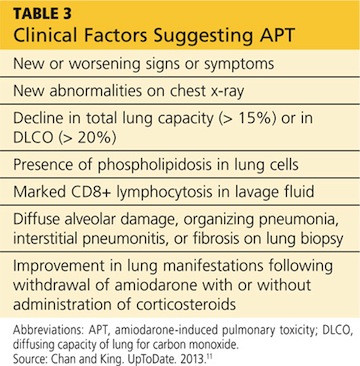
A chest x-ray was performed on admission, showing hyperinflation of the lungs with mild coarsening of the lung markings. A bandlike area of opacity in the right lower lobe with bilateral apical pleural thickening was noted (see Figure 1). Noncontrast CT of the chest revealed diffuse upper lobe ground glass opacities in both lungs, extending into the right middle lobe and lingula as well the superior segments of the lower lobes, with areas of emphysema and septal thickening. Numerous nodules, some of which appeared cavitary, were apparent in the lower lobes.
A two-dimensional echocardiogram demonstrated normal left ventricular size and systolic function, mild tricuspid regurgitation without evidence of pulmonary hypertension, and mild left atrial enlargement.
The patient was admitted to the cardiac unit for evaluation. While there, she received one dose of methylprednisolone (125 mg IV), three doses of ipratropium bromide/albuterol, one dose of ceftriaxone (1 g IV), and one dose of azithromycin (500 mg po). In the absence of significant leg edema and an elevation of jugular venous distention with a normal two-dimensional echocardiogram, heart failure was ruled out. The chest pains reported on initial presentation were ultimately felt to be noncardiac in nature.
After the patient was transferred to the medical floor with an initial diagnosis of exacerbation of her COPD, she was treated with antibiotics, nebulizers, and corticosteroids. She continued to experience episodes of O2 desaturation while on 4 L to 6 L of oxygen via nasal cannula and on a venturi mask. She was then placed on a BiPAP device, set to 12/5, and 50% Fio2 (fraction of inspired oxygen), which improved her oxygenation.
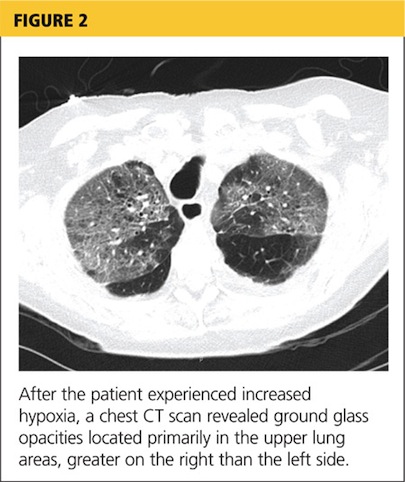
Her hypoxia prompted further radiographic studies. The resulting chest CT scan showed ground glass opacities located primarily in the upper lung areas, greater on the right than on the left side (see Figure 2). The radiologist suggested that the hypoxia was caused by an infection, but because the patient’s presenting symptoms were chronic in nature, drug-induced causes were considered as well. Amiodarone was discontinued.
Cardiology was consulted and agreed that stopping amiodarone was acceptable since the patient was in sinus rhythm at the time. The patient continued to take antibiotics and prednisone. Her symptoms slowly improved during hospitalization, and she required less oxygen. Based on the patient’s presentation, physical exam findings, imaging studies, and laboratory findings, amiodarone-induced pulmonary toxicity (APT) was diagnosed.
She was discharged home on supplemental oxygen at 4 L via cannula, a tapering dosage of prednisone, and metered-dose inhalers for fluticasone/salmeterol and tiotropium bromide. She also had outpatient appointments scheduled, one with the pulmonologist to follow up on her imaging studies and to manage the prednisone taper and the other with the cardiologist to manage her atrial fibrillation.
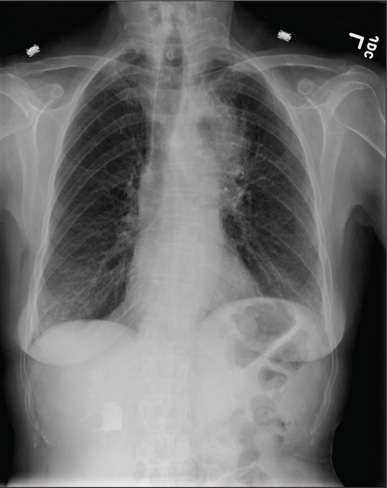
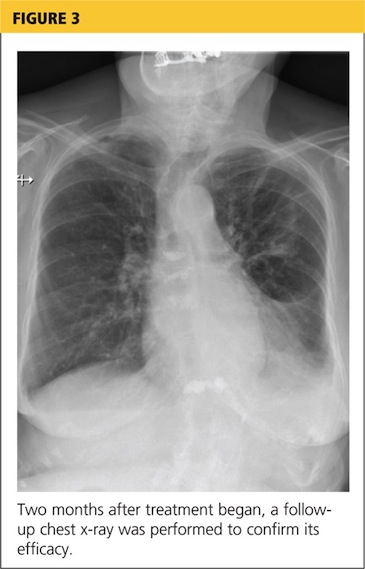
At pulmonology two months later, she had a chest x-ray (see Figure 3) and pulmonary function tests (PFTs). The patient reported feeling progressively better in the past month. Her dyspnea on exertion had improved, and she did not require supplemental oxygen anymore. She stopped smoking cigarettes.
The patient continued to use fluticasone/salmeterol but stopped tiotropium bromide. On physical exam, her O2 saturation was 95% on room air, heart rhythm and rate were regular, and her lungs revealed very minimal crackles at the right base but were otherwise clear.
The plan specified continuing the prednisone taper. The patient was asked to call the office if she had any worsening shortness of breath, cough, and sputum production. She was also encouraged to continue refraining from smoking cigarettes. This patient had done very well, with near complete resolution of symptoms and a clear chest x-ray.
Continue reading for discussion...
DISCUSSION
Amiodarone, a highly effective antiarrhythmic drug, is FDA approved for suppressing ventricular fibrillation and ventricular tachycardia. It is also used off-label as a second- or third-line choice for atrial fibrillation.1
Standard of care requires that, prior to starting amiodarone therapy, patients have a baseline chest x-ray and PFTs with diffusing capacity performed. Thereafter, the patient should be monitored with annual chest x-rays, with one performed promptly if new symptoms develop. Serial PFTs have not offered any benefit for monitoring, but a decrease of more than 15% in total lung capacity or more than 20% in diffusing capacity from baseline is consistent with APT.2
Adverse effects, both cardiac and noncardiac, are common with amiodarone therapy. They include proarrhythmias, bradycardia, and heart block, as well as thyroid and liver dysfunctions; dermatologic conditions such as blue-gray discoloration of the skin and photosensitivity; neurologic effects such as ataxia, paresthesias, and tremor; ocular problems, including corneal microdeposits; gastrointestinal problems such as nausea, anorexia, and constipation; and lung problems such as pulmonary toxicity, pleural effusion, and pleural thickening.3-6 Of these, pulmonary toxicity is the most severe and life threatening.7
APT, also known as amiodarone pneumonitis and amiodarone lung, typically manifests from a few months to a year and a half after treatment is commenced.6 APT can occur even after the drug is discontinued, because amiodarone has a very long elimination half-life of approximately 15 to 45 days and a tendency to concentrate in organs with high blood perfusion and in adipose tissues.8 Patients taking 400 mg/d for two months or longer or 200 mg/d for more than two years are considered at higher risk for APT.9 The severity of disease appears to correlate with the cumulative dose and length of treatment.10
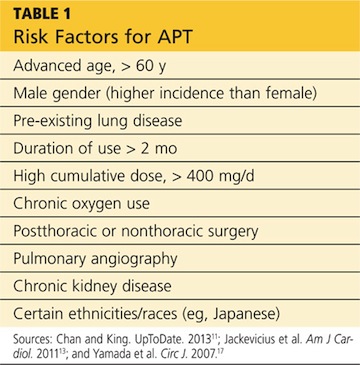
Numerous risk factors for pulmonary toxicity have been reported, including high drug dosage, pre-existing lung disease, patient age, and prior surgery (see Table 1).11 According to an analysis of a database of 237 patients, only age and duration of amiodarone therapy were significant risk factors for APT.9 Its incidence is not precisely known; reported rates range from 1% to 17%.6,12,13
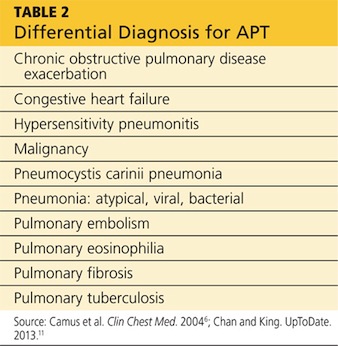
Presentation with such nonspecific symptoms as shortness of breath, nonproductive cough, fatigue, hypoxia, and general malaise is typical for many pulmonary and cardiac illnesses (see Table 2), making APT difficult to diagnose.14 Occasionally, rapid onset with progression to pneumonitis and respiratory failure masquerades as acute respiratory distress syndrome (ARDS).15
Notable, however, is that APT can manifest with nonproductive cough and dyspnea in 50% to 75% of cases. In addition, presenting symptoms will include fever (33% to 50% of cases) with associated malaise, fatigue, chest pain, and weight loss. In patients with APT, the physical exam usually reveals bilateral crackles on inspiration, but diffuse rales may be heard as well.11
Laboratory studies are not very helpful in diagnosing APT. Patients may present with nonspecific elevated WBCs without eosinophilia and an elevated LDH level.11 An elevated ESR may be detected before symptoms of APT manifest and can be present at the time of diagnosis.6
Imaging studies are far more helpful and specific in diagnosing APT. The typical chest x-ray shows bilateral patchy diffuse infiltrates.12 CT of the chest is usually more revealing, demonstrating ground glass opacities in the periphery and subpleural thickening, especially where infiltrates are denser. This thickening may result in pleuritic chest pain.6
The right upper lobe is more often affected in these cases than the left lung.6 Numerous pulmonary nodules in the upper lobes are found rarely and can be confused with lung cancer. These nodules are likely the result of an accumulation of the drug in areas of previous inflammation; a lung mass should prompt the addition of APT in the differential.2,16
APT is a diagnosis of exclusion, requiring clinical suspicion, drug history, imaging, and consideration of the differential. The presence of three or more clinical factors supports a diagnosis of APT (see Table 3).11
Once APT is recognized, the first action is to have the patient stop taking amiodarone, followed by the administration of corticosteroids (eg, prednisone 40 to 60 mg/d11) for four to 12 months.17 Patients, especially those with underlying lung disease, will typically require temporary oxygen supplementation until hypoxia resolves. Even after the drug has been discontinued, some patients experience worsening symptoms before they see improvement simply because the drug can persist in lung tissue for up to a year following cessation of therapy.6
If APT is diagnosed early, the prognosis is favorable. In one study, a significant number of APT patients stabilized or improved after withdrawal of the drug, regardless of concurrent treatment with corticosteroids.18 Follow-up studies, both imaging and PFT, indicate complete clearing of lung opacities in the majority of patients treated for APT.19 Radiologic improvement may be seen six months after cessation of amiodarone.20 Patients who develop ARDS tend to do poorly and have a mortality rate of approximately 50%.11
Continue reading for the conclusion...
CONCLUSION
Among patients who are taking long-term or high-dose amiodarone, particularly those older than 60, new-onset nonproductive cough and dyspnea signal the need for pulmonary and cardiac work-up. Once the diagnosis of APT is made, treatment is straightforward: Withdraw the amiodarone, and initiate corticosteroid therapy.
REFERENCES
1. Fuster V, Rydén LE, Asinger RW, et al; American College of Cardiology/American Heart Association Task Force on Practice Guidelines; European Society of Cardiology Committee for Practice Guidelines and Policy Conferences (Committee to Develop Guidelines for the Management of Patients With Atrial Fibrillation); North American Society of Pacing and Electrophysiology. ACC/AHA/ESC guidelines for the management of patients with atrial fibrillation: executive summary. Circulation. 2001; 104(17):2118-2150.
2. Jarand J, Lee A, Leigh R. Amiodaronoma: an unusual form of amiodarone-induced pulmonary toxicity. CMAJ. 2007;176(10):1411-1413.
3. Connolly S. Evidence-based analysis of amiodarone efficacy and safety. Circulation. 1999;100:2025-2034.
4. Amiodarone Trials Meta-Analysis Investigators. Effect of prophylactic amiodarone on mortality after acute myocardial infarction and in congestive heart failure: meta-analysis of individual data from 6500 patients in randomised trials. Lancet. 1997;350(9089):1417-1424.
5. Pollak PT. Clinical organ toxicity of antiarrhythmic compounds: ocular and pulmonary manifestations. Am J Cardiol. 1999;84(9A):37R-45R.
6. Camus P, Martin W, Rosenow E. Amiodarone pulmonary toxicity. Clin Chest Med. 2004;25(1):65-75.
7. Rady MY, Ryan T, Starr NJ. Preoperative therapy with amiodarone and the incidence of acute organ dysfunction after cardiac surgery. Anesth Analg. 1997;85(3):489-497.
8. Canada A, Lesko L, Haffajee C, et al. Amiodarone for tachyarrhythmias: kinetics, and efficacy. Drug Intell Clin Pharm. 1983;17(2):100-104.
9. Ernawati DK, Stafford L, Hughes JD. Amiodarone-induced pulmonary toxicity. Br J Clin Pharmacol. 2008;66(1):82-87.
10. Liu FL, Cohen RD, Downar E, et al. Amiodarone pulmonary toxicity: functional and ultrastructural evaluation. Thorax. 1986;41(2):100-105.
11. Chan E, King TE. Amiodarone pulmonary toxicity. UpToDate. 2013. www.uptodate.com/contents/amiodarone-pulmonary-toxicity. Accessed January 17, 2014.
12. Wolkove N, Baltzan M. Amiodarone pulmonary toxicity. Can Respir J. 2009;16(2):43-48.
13. Jackevicius CA, Tom A, Essebag V, et al. Population-level incidence and risk factors for pulmonary toxicity associated with amiodarone. Am J Cardiol. 2011;108:705-710.
14. Jessurun G, Crijns H. Amiodarone pulmonary toxicity [editorial]. BMJ. 1997;314(7081):619-620.
15. Nacca N, Castigliano B, Yuhico L, et al. Severe amiodarone induced pulmonary toxicity. J Thorac Dis. 2012;4(6):667-670.
16. Arnon R, Raz I, Chajek-Shaul T, et al. Amiodarone pulmonary toxicity presenting as a solitary lung mass. Chest. 1988;93(2):425-427.
17. Yamada Y, Shiga T, Matsuda N, et al. Incidence and predictors of pulmonary toxicity in Japanese patients receiving low-dose amiodarone. Circ J. 2007;71(10):1610-1616.
18. Coudert B, Bailly F, Lombard JN, et al. Amiodarone pneumonitis: bronchoalveolar lavage findings in 15 patients and review of the literature. Chest. 1992;102(4):1005-1012.
19. Vernhet H, Bousquet C, Durand G, et al. Reversible amiodarone-induced lung disease: HRCT findings. Eur Radiol. 2001;11(9):1697-1703.
20. Olson LK, Forrest JV, Friedman PJ, et al. Pneumonitis after amiodarone therapy. Radiology. 1984;150(2):327-330.
A 78-year-old woman presented to the emergency department (ED) complaining of shortness of breath, a dry nonproductive cough, fatigue, hypoxia, and general malaise lasting for several months and worsening over a two-week period. She denied having fever, chills, hemoptysis, weight loss, headache, rashes, or joint pain. She reported sweats, decrease in appetite, wheezing, cough without sputum production, and slight swelling of the legs. The patient complained of chest pain upon admission, but it resolved quickly.
The patient, a retired widow with five grown children, denied recent surgery or exposure to sick people, had not travelled, and reported no changes in her home environment. She claimed to have no pets but admitted to currently smoking about four cigarettes a day; she had previously smoked, on average, three packs of cigarettes per day for 60 years. She denied using alcohol or drugs, including intravenous agents.
The patient’s medical history was significant for paroxysmal atrial fibrillation. She had also been diagnosed with chronic obstructive pulmonary disease (COPD), transient ischemic attack, patent foramen ovale, hyperlipidemia, seizure disorder, and hypothyroidism. She had no known HIV risk factors and had had no exposure to asbestos or tuberculosis.
The patient’s current medications included amiodarone (200 mg/d) for four years; valproic acid (500 mg/d); aspirin (325 mg/d); levothyroxine (50 g/d); rosuvastatin (10 mg/d); daily warfarin, dosed according to the international normalized ratio (INR); and budesonide/formoterol (160/4.5 mg, one puff bid). She denied having any drug allergies.
Physical examination in the ED revealed a pulse of 63 beats/min; blood pressure, 108/50 mm Hg; and respiratory rate, 16 to 20 breaths/min. The patient’s O2 saturation was 84% on room air; 82% to 84% on 4 L to 6 L of supplemental oxygen; 87% to 92% with a venturi mask; and 95% on biphasic positive airway pressure (BiPAP) device. She was afebrile with hypoxia and able to speak in full sentences. Crackles were detected in the upper lung fields, best heard anteriorly, as well as a few scattered wheezes and rhonchi. Her heart sounds were normal with a regular rhythm; her extremities exhibited trace edema bilaterally. The remainder of the physical exam was normal.
The patient’s laboratory values included a normal white blood cell (WBC) count, elevated lactic acid dehydrogenase (LDH) at 448 IU/L (reference range, 84 to 246 IU/L), and no eosinophils. The erythrocyte sedimentation rate (ESR) was not measured on admission. Blood analysis of her N-terminal pro-brain natriuretic peptide (NT-proBNP) was 4,877 pg/mL; for women older than 75, a level higher than 1,800 pg/mL is abnormal.
A chest x-ray was performed on admission, showing hyperinflation of the lungs with mild coarsening of the lung markings. A bandlike area of opacity in the right lower lobe with bilateral apical pleural thickening was noted (see Figure 1). Noncontrast CT of the chest revealed diffuse upper lobe ground glass opacities in both lungs, extending into the right middle lobe and lingula as well the superior segments of the lower lobes, with areas of emphysema and septal thickening. Numerous nodules, some of which appeared cavitary, were apparent in the lower lobes.
A two-dimensional echocardiogram demonstrated normal left ventricular size and systolic function, mild tricuspid regurgitation without evidence of pulmonary hypertension, and mild left atrial enlargement.
The patient was admitted to the cardiac unit for evaluation. While there, she received one dose of methylprednisolone (125 mg IV), three doses of ipratropium bromide/albuterol, one dose of ceftriaxone (1 g IV), and one dose of azithromycin (500 mg po). In the absence of significant leg edema and an elevation of jugular venous distention with a normal two-dimensional echocardiogram, heart failure was ruled out. The chest pains reported on initial presentation were ultimately felt to be noncardiac in nature.
After the patient was transferred to the medical floor with an initial diagnosis of exacerbation of her COPD, she was treated with antibiotics, nebulizers, and corticosteroids. She continued to experience episodes of O2 desaturation while on 4 L to 6 L of oxygen via nasal cannula and on a venturi mask. She was then placed on a BiPAP device, set to 12/5, and 50% Fio2 (fraction of inspired oxygen), which improved her oxygenation.
Her hypoxia prompted further radiographic studies. The resulting chest CT scan showed ground glass opacities located primarily in the upper lung areas, greater on the right than on the left side (see Figure 2). The radiologist suggested that the hypoxia was caused by an infection, but because the patient’s presenting symptoms were chronic in nature, drug-induced causes were considered as well. Amiodarone was discontinued.
Cardiology was consulted and agreed that stopping amiodarone was acceptable since the patient was in sinus rhythm at the time. The patient continued to take antibiotics and prednisone. Her symptoms slowly improved during hospitalization, and she required less oxygen. Based on the patient’s presentation, physical exam findings, imaging studies, and laboratory findings, amiodarone-induced pulmonary toxicity (APT) was diagnosed.
She was discharged home on supplemental oxygen at 4 L via cannula, a tapering dosage of prednisone, and metered-dose inhalers for fluticasone/salmeterol and tiotropium bromide. She also had outpatient appointments scheduled, one with the pulmonologist to follow up on her imaging studies and to manage the prednisone taper and the other with the cardiologist to manage her atrial fibrillation.
At pulmonology two months later, she had a chest x-ray (see Figure 3) and pulmonary function tests (PFTs). The patient reported feeling progressively better in the past month. Her dyspnea on exertion had improved, and she did not require supplemental oxygen anymore. She stopped smoking cigarettes.
The patient continued to use fluticasone/salmeterol but stopped tiotropium bromide. On physical exam, her O2 saturation was 95% on room air, heart rhythm and rate were regular, and her lungs revealed very minimal crackles at the right base but were otherwise clear.
The plan specified continuing the prednisone taper. The patient was asked to call the office if she had any worsening shortness of breath, cough, and sputum production. She was also encouraged to continue refraining from smoking cigarettes. This patient had done very well, with near complete resolution of symptoms and a clear chest x-ray.
Continue reading for discussion...
DISCUSSION
Amiodarone, a highly effective antiarrhythmic drug, is FDA approved for suppressing ventricular fibrillation and ventricular tachycardia. It is also used off-label as a second- or third-line choice for atrial fibrillation.1
Standard of care requires that, prior to starting amiodarone therapy, patients have a baseline chest x-ray and PFTs with diffusing capacity performed. Thereafter, the patient should be monitored with annual chest x-rays, with one performed promptly if new symptoms develop. Serial PFTs have not offered any benefit for monitoring, but a decrease of more than 15% in total lung capacity or more than 20% in diffusing capacity from baseline is consistent with APT.2
Adverse effects, both cardiac and noncardiac, are common with amiodarone therapy. They include proarrhythmias, bradycardia, and heart block, as well as thyroid and liver dysfunctions; dermatologic conditions such as blue-gray discoloration of the skin and photosensitivity; neurologic effects such as ataxia, paresthesias, and tremor; ocular problems, including corneal microdeposits; gastrointestinal problems such as nausea, anorexia, and constipation; and lung problems such as pulmonary toxicity, pleural effusion, and pleural thickening.3-6 Of these, pulmonary toxicity is the most severe and life threatening.7
APT, also known as amiodarone pneumonitis and amiodarone lung, typically manifests from a few months to a year and a half after treatment is commenced.6 APT can occur even after the drug is discontinued, because amiodarone has a very long elimination half-life of approximately 15 to 45 days and a tendency to concentrate in organs with high blood perfusion and in adipose tissues.8 Patients taking 400 mg/d for two months or longer or 200 mg/d for more than two years are considered at higher risk for APT.9 The severity of disease appears to correlate with the cumulative dose and length of treatment.10
Numerous risk factors for pulmonary toxicity have been reported, including high drug dosage, pre-existing lung disease, patient age, and prior surgery (see Table 1).11 According to an analysis of a database of 237 patients, only age and duration of amiodarone therapy were significant risk factors for APT.9 Its incidence is not precisely known; reported rates range from 1% to 17%.6,12,13
Presentation with such nonspecific symptoms as shortness of breath, nonproductive cough, fatigue, hypoxia, and general malaise is typical for many pulmonary and cardiac illnesses (see Table 2), making APT difficult to diagnose.14 Occasionally, rapid onset with progression to pneumonitis and respiratory failure masquerades as acute respiratory distress syndrome (ARDS).15
Notable, however, is that APT can manifest with nonproductive cough and dyspnea in 50% to 75% of cases. In addition, presenting symptoms will include fever (33% to 50% of cases) with associated malaise, fatigue, chest pain, and weight loss. In patients with APT, the physical exam usually reveals bilateral crackles on inspiration, but diffuse rales may be heard as well.11
Laboratory studies are not very helpful in diagnosing APT. Patients may present with nonspecific elevated WBCs without eosinophilia and an elevated LDH level.11 An elevated ESR may be detected before symptoms of APT manifest and can be present at the time of diagnosis.6
Imaging studies are far more helpful and specific in diagnosing APT. The typical chest x-ray shows bilateral patchy diffuse infiltrates.12 CT of the chest is usually more revealing, demonstrating ground glass opacities in the periphery and subpleural thickening, especially where infiltrates are denser. This thickening may result in pleuritic chest pain.6
The right upper lobe is more often affected in these cases than the left lung.6 Numerous pulmonary nodules in the upper lobes are found rarely and can be confused with lung cancer. These nodules are likely the result of an accumulation of the drug in areas of previous inflammation; a lung mass should prompt the addition of APT in the differential.2,16
APT is a diagnosis of exclusion, requiring clinical suspicion, drug history, imaging, and consideration of the differential. The presence of three or more clinical factors supports a diagnosis of APT (see Table 3).11
Once APT is recognized, the first action is to have the patient stop taking amiodarone, followed by the administration of corticosteroids (eg, prednisone 40 to 60 mg/d11) for four to 12 months.17 Patients, especially those with underlying lung disease, will typically require temporary oxygen supplementation until hypoxia resolves. Even after the drug has been discontinued, some patients experience worsening symptoms before they see improvement simply because the drug can persist in lung tissue for up to a year following cessation of therapy.6
If APT is diagnosed early, the prognosis is favorable. In one study, a significant number of APT patients stabilized or improved after withdrawal of the drug, regardless of concurrent treatment with corticosteroids.18 Follow-up studies, both imaging and PFT, indicate complete clearing of lung opacities in the majority of patients treated for APT.19 Radiologic improvement may be seen six months after cessation of amiodarone.20 Patients who develop ARDS tend to do poorly and have a mortality rate of approximately 50%.11
Continue reading for the conclusion...
CONCLUSION
Among patients who are taking long-term or high-dose amiodarone, particularly those older than 60, new-onset nonproductive cough and dyspnea signal the need for pulmonary and cardiac work-up. Once the diagnosis of APT is made, treatment is straightforward: Withdraw the amiodarone, and initiate corticosteroid therapy.
REFERENCES
1. Fuster V, Rydén LE, Asinger RW, et al; American College of Cardiology/American Heart Association Task Force on Practice Guidelines; European Society of Cardiology Committee for Practice Guidelines and Policy Conferences (Committee to Develop Guidelines for the Management of Patients With Atrial Fibrillation); North American Society of Pacing and Electrophysiology. ACC/AHA/ESC guidelines for the management of patients with atrial fibrillation: executive summary. Circulation. 2001; 104(17):2118-2150.
2. Jarand J, Lee A, Leigh R. Amiodaronoma: an unusual form of amiodarone-induced pulmonary toxicity. CMAJ. 2007;176(10):1411-1413.
3. Connolly S. Evidence-based analysis of amiodarone efficacy and safety. Circulation. 1999;100:2025-2034.
4. Amiodarone Trials Meta-Analysis Investigators. Effect of prophylactic amiodarone on mortality after acute myocardial infarction and in congestive heart failure: meta-analysis of individual data from 6500 patients in randomised trials. Lancet. 1997;350(9089):1417-1424.
5. Pollak PT. Clinical organ toxicity of antiarrhythmic compounds: ocular and pulmonary manifestations. Am J Cardiol. 1999;84(9A):37R-45R.
6. Camus P, Martin W, Rosenow E. Amiodarone pulmonary toxicity. Clin Chest Med. 2004;25(1):65-75.
7. Rady MY, Ryan T, Starr NJ. Preoperative therapy with amiodarone and the incidence of acute organ dysfunction after cardiac surgery. Anesth Analg. 1997;85(3):489-497.
8. Canada A, Lesko L, Haffajee C, et al. Amiodarone for tachyarrhythmias: kinetics, and efficacy. Drug Intell Clin Pharm. 1983;17(2):100-104.
9. Ernawati DK, Stafford L, Hughes JD. Amiodarone-induced pulmonary toxicity. Br J Clin Pharmacol. 2008;66(1):82-87.
10. Liu FL, Cohen RD, Downar E, et al. Amiodarone pulmonary toxicity: functional and ultrastructural evaluation. Thorax. 1986;41(2):100-105.
11. Chan E, King TE. Amiodarone pulmonary toxicity. UpToDate. 2013. www.uptodate.com/contents/amiodarone-pulmonary-toxicity. Accessed January 17, 2014.
12. Wolkove N, Baltzan M. Amiodarone pulmonary toxicity. Can Respir J. 2009;16(2):43-48.
13. Jackevicius CA, Tom A, Essebag V, et al. Population-level incidence and risk factors for pulmonary toxicity associated with amiodarone. Am J Cardiol. 2011;108:705-710.
14. Jessurun G, Crijns H. Amiodarone pulmonary toxicity [editorial]. BMJ. 1997;314(7081):619-620.
15. Nacca N, Castigliano B, Yuhico L, et al. Severe amiodarone induced pulmonary toxicity. J Thorac Dis. 2012;4(6):667-670.
16. Arnon R, Raz I, Chajek-Shaul T, et al. Amiodarone pulmonary toxicity presenting as a solitary lung mass. Chest. 1988;93(2):425-427.
17. Yamada Y, Shiga T, Matsuda N, et al. Incidence and predictors of pulmonary toxicity in Japanese patients receiving low-dose amiodarone. Circ J. 2007;71(10):1610-1616.
18. Coudert B, Bailly F, Lombard JN, et al. Amiodarone pneumonitis: bronchoalveolar lavage findings in 15 patients and review of the literature. Chest. 1992;102(4):1005-1012.
19. Vernhet H, Bousquet C, Durand G, et al. Reversible amiodarone-induced lung disease: HRCT findings. Eur Radiol. 2001;11(9):1697-1703.
20. Olson LK, Forrest JV, Friedman PJ, et al. Pneumonitis after amiodarone therapy. Radiology. 1984;150(2):327-330.
Deep T waves and chest pain
A 67-year-old man with a history of hypertension and hyperlipidemia presented to the emergency department after 3 hours of what he described as a burning sensation in his chest that woke him from sleep. He attributed it at first to a late-night meal and treated himself with some milk and yogurt, which seemed to relieve the symptoms. However, the pain recurred and was associated with difficulty breathing. At that point, he drove himself to the emergency department.
On arrival, his temperature was 36.5°C (97.7°F), blood pressure 134/67 mm Hg, heart rate 89 bpm, respirations 18/min, and oxygen saturation 98% on room air. His cardiovascular, lung, and neurologic examinations were normal. His cardiac enzyme levels (creatine kinase, creatine kinase MB fraction, and troponin T) were within normal limits.
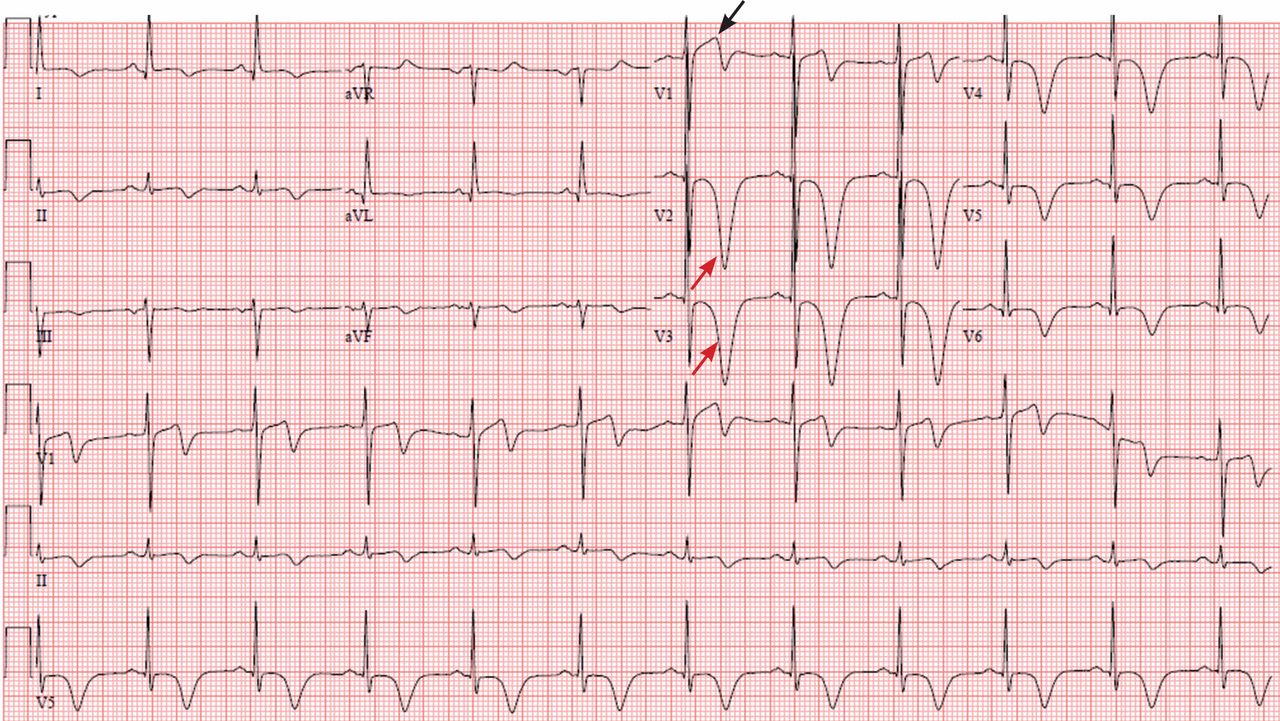
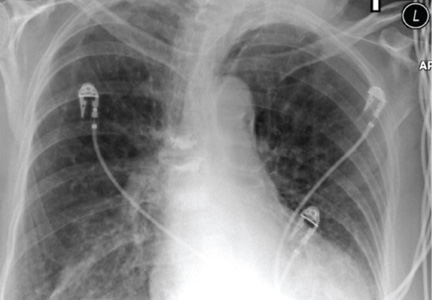
Figure 1 depicts his initial electrocardiogram. It showed deep, symmetric T-wave inversions in the precordial leads especially in V2 and V3, changes known as Wellens syndrome. The ST-T changes in lead V1 suggested a very proximal lesion in the left anterior descending artery (LAD), before the first septal perforator. Also, lateral and high lateral (V5 and V6) findings indicated stenoses of the branching diagonals and left circumflex myocardial territory. Furthermore, the inferior ST-T changes indicated that his LAD may have wrapped around the cardiac apex. All of these findings were prognostically significant.
The patient was given aspirin and was started on intravenous unfractionated heparin and nitroglycerin. He was sent for urgent left-heart catheterization, which showed a 50% to 60% stenosis in the left main coronary artery, with involvement of the left circumflex artery proximally, in addition to a “tight” first-diagonal stenosis, a 90% stenosis in a large (> 3.0-mm) proximal segment of the LAD, an 80% stenosis in a large (> 3.0-mm) mid-LAD segment, and a 40% stenosis in a large (> 3.0-mm) second diagonal artery (Figure 2).
He was referred for cardiac surgery and underwent triple coronary artery bypass grafting: the left internal thoracic artery was grafted to the LAD, a reverse saphenous vein graft was performed to the diagonal artery, and a reverse saphenous vein graft was performed to the obtuse marginal artery.
A PRECURSOR TO INFARCTION
Wellens et al described specific precordial T-wave changes in patients with unstable angina who subsequently developed anterior wall myocardial infarction.1
The importance of Wellens syndrome is that it occurs in the pain-free interval when no other evidence of ischemia or angina may be present.1 Cardiac enzyme levels are typically normal or only minimally elevated; only 12% of patients with this syndrome have elevated cardiac biomarker levels.2
Given the extent of myocardial injury, urgent echocardiography can show a wall-motion abnormality even if cardiac enzyme levels are normal. This gives important insight into electrocardiographic changes and should prompt consideration of revascularization.
Even with extensive medical management, Wellens syndrome progresses to acute anterior wall ischemia. About 75% of patients with Wellens syndrome who receive medical management but do not undergo revascularization (eg, coronary artery bypass grafting, percutaneous coronary intervention) develop extensive anterior wall infarction within days.1,3 Despite negative cardiac biomarkers, Wellens syndrome is considered an acute coronary syndrome requiring urgent cardiac intervention.
- Movahed MR. Wellens’ syndrome or inverted U-waves? Clin Cardiol 2008; 31:133–134.
- de Zwaan C, Bär FW, Janssen JH, et al. Angiographic and clinical characteristics of patients with unstable angina showing an ECG pattern indicating critical narrowing of the proximal LAD coronary artery. Am Heart J 1989; 117:657–665.
- de Zwaan C, Bär FW, Wellens HJ. Characteristic electrocardiographic pattern indicating a critical stenosis high in left anterior descending coronary artery in patients admitted because of impending myocardial infarction. Am Heart J 1982; 103:730–736.
A 67-year-old man with a history of hypertension and hyperlipidemia presented to the emergency department after 3 hours of what he described as a burning sensation in his chest that woke him from sleep. He attributed it at first to a late-night meal and treated himself with some milk and yogurt, which seemed to relieve the symptoms. However, the pain recurred and was associated with difficulty breathing. At that point, he drove himself to the emergency department.
On arrival, his temperature was 36.5°C (97.7°F), blood pressure 134/67 mm Hg, heart rate 89 bpm, respirations 18/min, and oxygen saturation 98% on room air. His cardiovascular, lung, and neurologic examinations were normal. His cardiac enzyme levels (creatine kinase, creatine kinase MB fraction, and troponin T) were within normal limits.
Figure 1 depicts his initial electrocardiogram. It showed deep, symmetric T-wave inversions in the precordial leads especially in V2 and V3, changes known as Wellens syndrome. The ST-T changes in lead V1 suggested a very proximal lesion in the left anterior descending artery (LAD), before the first septal perforator. Also, lateral and high lateral (V5 and V6) findings indicated stenoses of the branching diagonals and left circumflex myocardial territory. Furthermore, the inferior ST-T changes indicated that his LAD may have wrapped around the cardiac apex. All of these findings were prognostically significant.
The patient was given aspirin and was started on intravenous unfractionated heparin and nitroglycerin. He was sent for urgent left-heart catheterization, which showed a 50% to 60% stenosis in the left main coronary artery, with involvement of the left circumflex artery proximally, in addition to a “tight” first-diagonal stenosis, a 90% stenosis in a large (> 3.0-mm) proximal segment of the LAD, an 80% stenosis in a large (> 3.0-mm) mid-LAD segment, and a 40% stenosis in a large (> 3.0-mm) second diagonal artery (Figure 2).
He was referred for cardiac surgery and underwent triple coronary artery bypass grafting: the left internal thoracic artery was grafted to the LAD, a reverse saphenous vein graft was performed to the diagonal artery, and a reverse saphenous vein graft was performed to the obtuse marginal artery.
A PRECURSOR TO INFARCTION
Wellens et al described specific precordial T-wave changes in patients with unstable angina who subsequently developed anterior wall myocardial infarction.1
The importance of Wellens syndrome is that it occurs in the pain-free interval when no other evidence of ischemia or angina may be present.1 Cardiac enzyme levels are typically normal or only minimally elevated; only 12% of patients with this syndrome have elevated cardiac biomarker levels.2
Given the extent of myocardial injury, urgent echocardiography can show a wall-motion abnormality even if cardiac enzyme levels are normal. This gives important insight into electrocardiographic changes and should prompt consideration of revascularization.
Even with extensive medical management, Wellens syndrome progresses to acute anterior wall ischemia. About 75% of patients with Wellens syndrome who receive medical management but do not undergo revascularization (eg, coronary artery bypass grafting, percutaneous coronary intervention) develop extensive anterior wall infarction within days.1,3 Despite negative cardiac biomarkers, Wellens syndrome is considered an acute coronary syndrome requiring urgent cardiac intervention.
- Movahed MR. Wellens’ syndrome or inverted U-waves? Clin Cardiol 2008; 31:133–134.
- de Zwaan C, Bär FW, Janssen JH, et al. Angiographic and clinical characteristics of patients with unstable angina showing an ECG pattern indicating critical narrowing of the proximal LAD coronary artery. Am Heart J 1989; 117:657–665.
- de Zwaan C, Bär FW, Wellens HJ. Characteristic electrocardiographic pattern indicating a critical stenosis high in left anterior descending coronary artery in patients admitted because of impending myocardial infarction. Am Heart J 1982; 103:730–736.
Is Spreading Pain Due to Injury?
Answer
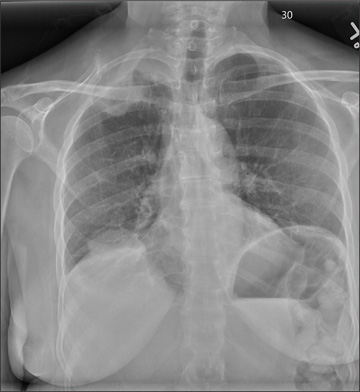
The radiograph shows a right apical mass. This clinical and radiographic presentation is strongly suggestive of a Pancoast tumor. Such lung masses (typically non–small cell carcinomas) can cause brachial plexus compression when they progress, which results in thoracic outlet obstruction and symptoms similar to those seen in this patient.
The patient was admitted by a hospitalist service, and further imaging did confirm the presence of a lung mass, as well as extension to the chest wall and cervicothoracic portion of the spinal canal. CT-guided biopsy of the mass is pending.
Answer
The radiograph shows a right apical mass. This clinical and radiographic presentation is strongly suggestive of a Pancoast tumor. Such lung masses (typically non–small cell carcinomas) can cause brachial plexus compression when they progress, which results in thoracic outlet obstruction and symptoms similar to those seen in this patient.
The patient was admitted by a hospitalist service, and further imaging did confirm the presence of a lung mass, as well as extension to the chest wall and cervicothoracic portion of the spinal canal. CT-guided biopsy of the mass is pending.

A 53-year-old woman presents with complaints of right-side chest wall, neck, and shoulder pain. Her symptoms started two months ago, when she says she injured herself while doing yard work. She initially self-treated but subsequently went to various emergency departments and walk-in clinics on several occasions; no definitive diagnosis was established. Recently, she has noticed increasing weakness in her right arm and hand as well. Medical history is significant for hypertension. Family history is remarkable for non-Hodgkin’s lymphoma (mother). Social history reveals that the patient is a smoker, with a pack-a-day habit for at least 40 years. On physical exam, you note normal vital signs. The patient has good range of motion in her extremities; however, the strength in her right upper extremity is significantly diminished. Her deltoid, biceps, triceps, and hand grip are all about 2/5. She also notes a paresthesia along her right anterior chest wall, although sensation is intact. Chest radiograph is ordered (shown). What is your impression?
Man, 45, With Greasy Rash and Deformed Nails
A 45-year-old man presented to the dermatology office complaining of a pruritic rash on his neck, chest, abdomen, and upper back. The rash had been present since the patient was 20, intermittently flaring and causing severe pruritus. For the past two weeks, it had become increasingly bothersome.
The patient described the rash as “greasy” brown plaques diffusely scattered on his body. The rash on his neck was the most bothersome, and the patient felt an uncontrollable need to scratch that area.
Since it first developed 25 years ago, he had used OTC hydrocortisone cream as needed to treat the rash. Although effective for past flares, the cream provided only minimal relief during the current episode.
The patient’s medical history included brittle nails with a worsening of nail quality in recent years. The family history revealed that the patient’s father and sister were affected by the same type of rash, which developed in adolescence for each of them, as well as brittle nails.
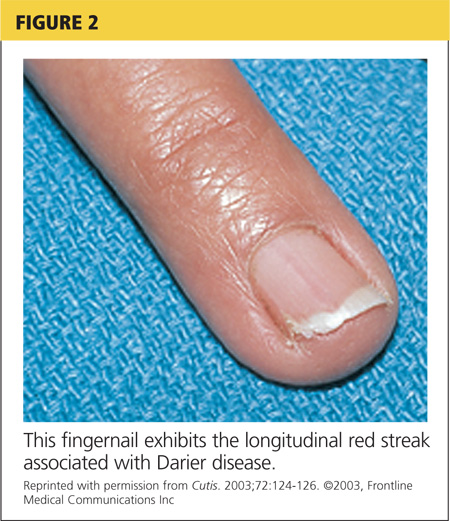
On physical examination, the skin was warm and moist to the touch. Flat, slightly elevated, greasy brown papules were scattered on the chest, abdomen, and upper back, with mild surrounding erythema (see Figure 1). Excoriated lesions were noted on the anterior surface of the neck, with pinpoint bleeding resulting from constant irritation. The patient’s fingernails were deformed, with longitudinal ridges and v-shaped notching of the free margin. The remainder of the physical exam was unremarkable, and review of systems was negative.
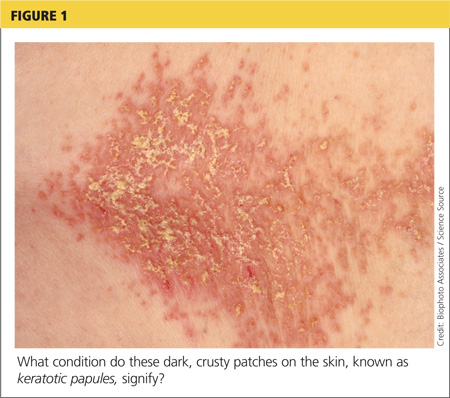
This patient’s symptoms could result from a variety of causes. Seborrheic dermatitis is a common skin condition that presents with brown plaques similar to those on the patient’s trunk. Another possible diagnosis is Grover’s disease, a rare disorder also known as transient acantholytic dermatosis, in which keratotic plaques appear on the torso and are thought to occur from trauma to sun-damaged skin. An additional consideration is Hailey-Hailey disease, a rare genetic disorder also known as benign familial pemphigus, which is characterized by red-brown plaques located predominantly on flexure surfaces.1 Skin biopsy should be performed for a definitive diagnosis.
Given the family history of a similar rash occurring in first-degree relatives and the distinct physical exam findings, the most likely diagnosis for this patient is keratosis follicularis, also known as Darier disease (DD) or Darier-White disease.
DISCUSSION
Named after Ferdinand-Jean Darier, who discovered this rare genodermatosis, DD is a rare genetic skin disorder caused by mutations of the ATP2A2 gene, located on the long arm of chromosome 12 at position 24,11.1,2 The mutation disrupts the encoding of the enzyme sarco/endoplasmic reticulum calcium-ATPase 2 (SERCA2). This enzyme is important in the transport of calcium ions across the cell membrane, and insufficient amounts lead to a defect in intracellular calcium signaling.2,3
This genetic mutation is inherited as an autosomal dominant trait with complete penetrance. DD affects men and women equally, with progressive skin signs of interfamilial and intrafamilial variability.4 Skin manifestations occur from late childhood to early adulthood and are typical during adolescence.4 Acute flare-ups can be triggered by heat, perspiration, sunlight, ultraviolet B exposure, stress, or certain medications (in particular, lithium).2 DD is not contagious.2
CLINICAL PRESENTATION
The characteristics of DD include yellow or brown, rough, firm papules that are frequently crusted. The papules often appear in seborrheic areas of the body, such as the chest, back, ears, nasolabial fold, forehead, scalp, and groin.4 The severity of expression varies from mild, with few lesions, to severe, in which the entire body is covered with disfiguring, macerated plaques emitting a strong odor. On biopsy, the histopathologic findings are typical of dyskeratosis and acantholysis.4
Fingernails (and occasionally toenails) display broad, white or red, somewhat translucent, longitudinal bands accompanied by v-shaped notching1,4,5 (see Figure 2). Such nail changes are diagnostic and occur in 92% to 95% of patients with DD.6 They may, in fact, occur in the absence of cutaneous disease. All nails may be affected, but usually only two to three are involved.6
Although uncommon in DD, white, umbilicated, or cobblestone plaques may be found on intraoral mucous membranes (ie, tongue, buccal mucosa, palate, epiglottis, pharyngeal wall, and esophagus); due to confluence, papules may mimic leukoplakia.7 Lesions may also appear on the vulva or rectum.1,5 In severe cases, the salivary glands can become blocked, and the gums can hypertrophy.5
Since epidermal and brain tissue both derive from ectoderm, pathologic processes that affect one organ system may also affect the other.8 Indeed, among patients with DD, neuropsychiatric problems—including epilepsy, learning difficulties, and schizoaffective disorder—are commonly reported.1 To confirm an association between DD and ATP2A2 mutations, Jacobsen and colleagues performed an analysis of 19 unrelated DD patients with neuropsychiatric phenotypes. They discovered evidence to support the gene’s pleiotropic effects in the brain and hypothesized that mutations in the enzyme SERCA2 correlate with these phenotypes, most specifically for mood disorders.9
TREATMENT AND MANAGEMENT
Although no cure is currently available for DD, both short- and long-term treatment options are available; the choice should be based on the severity of an individual patient’s signs and symptoms. For mild cases, topical therapy, such as general emollients, corticosteroid ointments, and high sun protection factor sunscreen, is sufficient.1
For moderate cases, topical retinoids, including tretinoin cream, adapalene gel or cream, and tazarotene gel, may be necessary.4 Keratolytics, including salicylic acid in propylene glycol gel, may be used to regulate hyperkeratosis.4 Celecoxib, a COX-2 inhibitor, is another option that may restore the down regulation of SERCA2. This can prevent progression of the disease.10
Long-term management includes use of oral retinoid therapy (eg, acitretin), which might reduce the frequency of inflammatory flares.1 Systemic adverse effects from long-term use of oral retinoids are cause for concern, however. Close monitoring along with patient education can limit the occurrence of complications.11
If DD is uncontrolled with medication, dermabrasion and erbium:YAG laser ablation have been used to successfully treat chronic cases.12 Although these treatment options may remove existing lesions, it is important to inform patients that the disease has not been cured, that remission is difficult to attain, and that lesions may recur.
Because viral, bacterial, and fungal superinfections are common and may exacerbate the disease, be sure to check for signs of infection while examining the patient.4 Patients should be advised to avoid hot environments, and if that is not possible, to dress in cool cotton clothing to allow for proper ventilation and avoid the build-up of perspiration. Excessive perspiration along with poor hygiene can contribute to the formation of infections as well as trigger a flare-up. If an infection develops, patients should consult a health care provider.
Keeping the skin well moisturized can alleviate the constant pruritus that many patients experience. Daily sunscreen use is essential to avoid skin irritation caused by the sun, which can trigger an acute flare-up. Patients should be advised to avoid the long-term use of corticosteroid ointment. They should also contact their health care provider before using OTC treatments such as Burow’s solution.
CONCLUSION
A thorough history and physical exam are crucial in the diagnosis of DD. In this particular case, inquiry into family history was the key to proper diagnosis. That information, paired with a thorough physical exam, led to the correct diagnosis of this rare genetic skin disorder. A skin biopsy provided definitive confirmation.
This patient had a mild-to-moderate manifestation of DD. He was prescribed retinoid therapy, and routine follow-up visits were recommended to monitor the efficacy of medical therapy and to screen for secondary infections or neuropsychiatric disorders.
This case illustrates the importance of taking a full history and performing an in-depth physical exam when a patient presents with an unfamiliar complaint. Being thorough reduces the risk of missing a crucial element that can guide the diagnostic process.
REFERENCES
1. Creamer D, Barker J, Kerdel FA. Papular and papulosquamous dermatoses. In: Acute Adult Dermatology: Diagnosis and Management (A Colour Handbook). London, UK: Manson Publishing Ltd; 2011:48.
2. Kelly EB. Darier disease (DAR). In: Encyclopedia of Human Genetics and Disease. Santa Barbara, CA: ABC-CLIO; 2013:186-187.
3. Klausegger A, Laimer M, Bauer JW. Darier disease. [In German.] Hautarzt. 2013;64:22-25.
4. Ringpfeil F. Dermatologic disorders. In: NORD Guide to Rare Disorders. Philadelphia, PA: Lippincott Williams & Wilkins; 2003:101.
5. Disorders of keratinization. In: Ostler HB, Maibach HI, Hoke AW, Schwab IR, eds. Diseases of the Eye and Skin: A Color Atlas. Philadelphia, PA: Lippincott Williams & Wilkins; 2004:23-34.
6. Baran R, de Berker D, Holzberg M, Thomas L, eds. Baran & Dawber’s Diseases of the Nails and their Management. 4th ed. West Sussex, UK: John Wiley & Sons, Ltd; 2012:295-296.
7. Thiagarajan MK, Narasimhan M, Sankarasubramanian A. Darier disease with oral and esophageal involvement: a case report. Indian J Dent Res. 2011;22:843-846.
8. Medansky RS, Woloshin AA. Darier’s disease: an evaluation of its neuropsychiatric component. Arch Dermatol. 1961;84:482-484.
9. Jacobsen NJ, Lyons I, Hoogendoorn B, et al. ATP2A2 mutations in Darier’s disease and their relationship to neuropsychiatric phenotypes. Hum Mol Genet. 1999;8:1631-1636.
10. Kamijo M, Nishiyama C, Takagi A, et al. Cyclooxygenase-2 inhibition restores ultraviolet B-induced downregulation of ATP2A2/SERCA2 in keratinocytes: possible therapeutic approach of cyclooxygenase-2 inhibition for treatment of Darier disease. Br J Dermatol. 2012;166: 1017-1022.
11. Brecher AR, Orlow SJ. Oral retinoid therapy for dermatologic conditions in children and adolescents. J Am Acad Dermatol. 2003;49:171-182.
12. Beier C, Kaufmann R. Efficacy of erbium:YAG laser ablation in Darier disease and Hailey-Hailey disease. Arch Dermatol. 1999;35:423-427.
A 45-year-old man presented to the dermatology office complaining of a pruritic rash on his neck, chest, abdomen, and upper back. The rash had been present since the patient was 20, intermittently flaring and causing severe pruritus. For the past two weeks, it had become increasingly bothersome.
The patient described the rash as “greasy” brown plaques diffusely scattered on his body. The rash on his neck was the most bothersome, and the patient felt an uncontrollable need to scratch that area.
Since it first developed 25 years ago, he had used OTC hydrocortisone cream as needed to treat the rash. Although effective for past flares, the cream provided only minimal relief during the current episode.
The patient’s medical history included brittle nails with a worsening of nail quality in recent years. The family history revealed that the patient’s father and sister were affected by the same type of rash, which developed in adolescence for each of them, as well as brittle nails.
On physical examination, the skin was warm and moist to the touch. Flat, slightly elevated, greasy brown papules were scattered on the chest, abdomen, and upper back, with mild surrounding erythema (see Figure 1). Excoriated lesions were noted on the anterior surface of the neck, with pinpoint bleeding resulting from constant irritation. The patient’s fingernails were deformed, with longitudinal ridges and v-shaped notching of the free margin. The remainder of the physical exam was unremarkable, and review of systems was negative.
This patient’s symptoms could result from a variety of causes. Seborrheic dermatitis is a common skin condition that presents with brown plaques similar to those on the patient’s trunk. Another possible diagnosis is Grover’s disease, a rare disorder also known as transient acantholytic dermatosis, in which keratotic plaques appear on the torso and are thought to occur from trauma to sun-damaged skin. An additional consideration is Hailey-Hailey disease, a rare genetic disorder also known as benign familial pemphigus, which is characterized by red-brown plaques located predominantly on flexure surfaces.1 Skin biopsy should be performed for a definitive diagnosis.
Given the family history of a similar rash occurring in first-degree relatives and the distinct physical exam findings, the most likely diagnosis for this patient is keratosis follicularis, also known as Darier disease (DD) or Darier-White disease.
DISCUSSION
Named after Ferdinand-Jean Darier, who discovered this rare genodermatosis, DD is a rare genetic skin disorder caused by mutations of the ATP2A2 gene, located on the long arm of chromosome 12 at position 24,11.1,2 The mutation disrupts the encoding of the enzyme sarco/endoplasmic reticulum calcium-ATPase 2 (SERCA2). This enzyme is important in the transport of calcium ions across the cell membrane, and insufficient amounts lead to a defect in intracellular calcium signaling.2,3
This genetic mutation is inherited as an autosomal dominant trait with complete penetrance. DD affects men and women equally, with progressive skin signs of interfamilial and intrafamilial variability.4 Skin manifestations occur from late childhood to early adulthood and are typical during adolescence.4 Acute flare-ups can be triggered by heat, perspiration, sunlight, ultraviolet B exposure, stress, or certain medications (in particular, lithium).2 DD is not contagious.2
CLINICAL PRESENTATION
The characteristics of DD include yellow or brown, rough, firm papules that are frequently crusted. The papules often appear in seborrheic areas of the body, such as the chest, back, ears, nasolabial fold, forehead, scalp, and groin.4 The severity of expression varies from mild, with few lesions, to severe, in which the entire body is covered with disfiguring, macerated plaques emitting a strong odor. On biopsy, the histopathologic findings are typical of dyskeratosis and acantholysis.4
Fingernails (and occasionally toenails) display broad, white or red, somewhat translucent, longitudinal bands accompanied by v-shaped notching1,4,5 (see Figure 2). Such nail changes are diagnostic and occur in 92% to 95% of patients with DD.6 They may, in fact, occur in the absence of cutaneous disease. All nails may be affected, but usually only two to three are involved.6
Although uncommon in DD, white, umbilicated, or cobblestone plaques may be found on intraoral mucous membranes (ie, tongue, buccal mucosa, palate, epiglottis, pharyngeal wall, and esophagus); due to confluence, papules may mimic leukoplakia.7 Lesions may also appear on the vulva or rectum.1,5 In severe cases, the salivary glands can become blocked, and the gums can hypertrophy.5
Since epidermal and brain tissue both derive from ectoderm, pathologic processes that affect one organ system may also affect the other.8 Indeed, among patients with DD, neuropsychiatric problems—including epilepsy, learning difficulties, and schizoaffective disorder—are commonly reported.1 To confirm an association between DD and ATP2A2 mutations, Jacobsen and colleagues performed an analysis of 19 unrelated DD patients with neuropsychiatric phenotypes. They discovered evidence to support the gene’s pleiotropic effects in the brain and hypothesized that mutations in the enzyme SERCA2 correlate with these phenotypes, most specifically for mood disorders.9
TREATMENT AND MANAGEMENT
Although no cure is currently available for DD, both short- and long-term treatment options are available; the choice should be based on the severity of an individual patient’s signs and symptoms. For mild cases, topical therapy, such as general emollients, corticosteroid ointments, and high sun protection factor sunscreen, is sufficient.1
For moderate cases, topical retinoids, including tretinoin cream, adapalene gel or cream, and tazarotene gel, may be necessary.4 Keratolytics, including salicylic acid in propylene glycol gel, may be used to regulate hyperkeratosis.4 Celecoxib, a COX-2 inhibitor, is another option that may restore the down regulation of SERCA2. This can prevent progression of the disease.10
Long-term management includes use of oral retinoid therapy (eg, acitretin), which might reduce the frequency of inflammatory flares.1 Systemic adverse effects from long-term use of oral retinoids are cause for concern, however. Close monitoring along with patient education can limit the occurrence of complications.11
If DD is uncontrolled with medication, dermabrasion and erbium:YAG laser ablation have been used to successfully treat chronic cases.12 Although these treatment options may remove existing lesions, it is important to inform patients that the disease has not been cured, that remission is difficult to attain, and that lesions may recur.
Because viral, bacterial, and fungal superinfections are common and may exacerbate the disease, be sure to check for signs of infection while examining the patient.4 Patients should be advised to avoid hot environments, and if that is not possible, to dress in cool cotton clothing to allow for proper ventilation and avoid the build-up of perspiration. Excessive perspiration along with poor hygiene can contribute to the formation of infections as well as trigger a flare-up. If an infection develops, patients should consult a health care provider.
Keeping the skin well moisturized can alleviate the constant pruritus that many patients experience. Daily sunscreen use is essential to avoid skin irritation caused by the sun, which can trigger an acute flare-up. Patients should be advised to avoid the long-term use of corticosteroid ointment. They should also contact their health care provider before using OTC treatments such as Burow’s solution.
CONCLUSION
A thorough history and physical exam are crucial in the diagnosis of DD. In this particular case, inquiry into family history was the key to proper diagnosis. That information, paired with a thorough physical exam, led to the correct diagnosis of this rare genetic skin disorder. A skin biopsy provided definitive confirmation.
This patient had a mild-to-moderate manifestation of DD. He was prescribed retinoid therapy, and routine follow-up visits were recommended to monitor the efficacy of medical therapy and to screen for secondary infections or neuropsychiatric disorders.
This case illustrates the importance of taking a full history and performing an in-depth physical exam when a patient presents with an unfamiliar complaint. Being thorough reduces the risk of missing a crucial element that can guide the diagnostic process.
REFERENCES
1. Creamer D, Barker J, Kerdel FA. Papular and papulosquamous dermatoses. In: Acute Adult Dermatology: Diagnosis and Management (A Colour Handbook). London, UK: Manson Publishing Ltd; 2011:48.
2. Kelly EB. Darier disease (DAR). In: Encyclopedia of Human Genetics and Disease. Santa Barbara, CA: ABC-CLIO; 2013:186-187.
3. Klausegger A, Laimer M, Bauer JW. Darier disease. [In German.] Hautarzt. 2013;64:22-25.
4. Ringpfeil F. Dermatologic disorders. In: NORD Guide to Rare Disorders. Philadelphia, PA: Lippincott Williams & Wilkins; 2003:101.
5. Disorders of keratinization. In: Ostler HB, Maibach HI, Hoke AW, Schwab IR, eds. Diseases of the Eye and Skin: A Color Atlas. Philadelphia, PA: Lippincott Williams & Wilkins; 2004:23-34.
6. Baran R, de Berker D, Holzberg M, Thomas L, eds. Baran & Dawber’s Diseases of the Nails and their Management. 4th ed. West Sussex, UK: John Wiley & Sons, Ltd; 2012:295-296.
7. Thiagarajan MK, Narasimhan M, Sankarasubramanian A. Darier disease with oral and esophageal involvement: a case report. Indian J Dent Res. 2011;22:843-846.
8. Medansky RS, Woloshin AA. Darier’s disease: an evaluation of its neuropsychiatric component. Arch Dermatol. 1961;84:482-484.
9. Jacobsen NJ, Lyons I, Hoogendoorn B, et al. ATP2A2 mutations in Darier’s disease and their relationship to neuropsychiatric phenotypes. Hum Mol Genet. 1999;8:1631-1636.
10. Kamijo M, Nishiyama C, Takagi A, et al. Cyclooxygenase-2 inhibition restores ultraviolet B-induced downregulation of ATP2A2/SERCA2 in keratinocytes: possible therapeutic approach of cyclooxygenase-2 inhibition for treatment of Darier disease. Br J Dermatol. 2012;166: 1017-1022.
11. Brecher AR, Orlow SJ. Oral retinoid therapy for dermatologic conditions in children and adolescents. J Am Acad Dermatol. 2003;49:171-182.
12. Beier C, Kaufmann R. Efficacy of erbium:YAG laser ablation in Darier disease and Hailey-Hailey disease. Arch Dermatol. 1999;35:423-427.
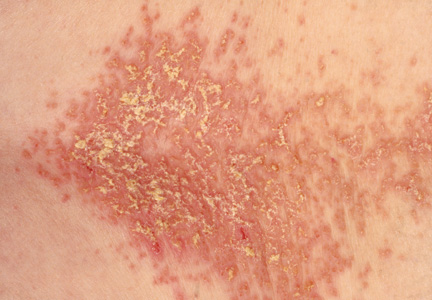
Case Studies in Toxicology: Tiny Bubbles (Or, the Dangers of Cleaning Your Fruit)
Case
A previously healthy 32-year-old man presented to the ED after unintentionally ingesting a mouthful of concentrated (35%) hydrogen peroxide (H2O2) from an unmarked bottle he kept in his refrigerator. Upon realizing his error, he immediately drank a liter of water, which promptly induced vomiting. In the ED, the patient complained of mild throat and chest discomfort as well as “abdominal fullness.”
His initial vital signs were: blood pressure, 140/92 mm Hg; heart rate, 93 beats/minute; respiratory rate, 18 breaths/minute; temperature, 96.4° F. Oxygen saturation was 98% on room air. Physical examination revealed tenderness in the epigastric region with no peritoneal findings. Oropharynx and chest examination were normal, and standard laboratory investigations were all within normal limits.
What are the potential exposures to hydrogen peroxide?
Hydrogen peroxide is a colorless and odorless liquid. Solutions with concentrations ranging from 3% to 5% have many household applications, including use as a wound disinfectant and dentifrice; dilute solutions are also utilized for similar purposes in the hospital setting. Industrial-strength H2O2 (concentrations of 10% to 35%) is employed to bleach textiles and paper, and higher concentrations (70% to 90%) are used as an oxygen source for rocket engines.
Consumer application of concentrated H2O2 solutions has become increasingly common. Some, like this patient, clean the surfaces of fruits and vegetables with H2O2 to decrease transmission of bacteria during cutting.1 More concerning, however, is the purported medicinal benefits of ingesting “food-grade” (35%) H2O2 mixed with water—touted on many Internet sites as a treatment for illnesses such as emphysema, cancer, anemia, and HIV.2 Sometimes referred to as “hyperoxygenation therapy,” this so-called treatment has not been approved by the US Food and Drug Administration for any such purpose.3 When diluted sufficiently, this concoction is not harmful but unlikely to provide any health benefits.
Dr Lucyk is a fellow of medical toxicology in the department of emergency medicine at the New York University School of Medicine and the New York City Poison Control Center. Dr Nelson, editor of “Case Studies in Toxicology,” is a professor in the department of emergency medicine and director of the medical toxicology fellowship program at the New York University School of Medicine and the New York City Poison Control Center. He is also associate editor, toxicology, of the EMERGENCY MEDICINE editorial board.
What are the toxic effects of concentrated hydrogen peroxide?
Injury from concentrated H2O2 consumption is primarily from either direct caustic injury or the embolic obstruction of blood flow. Following ingestion, the enzyme catalase metabolizes the breakdown of H2O2 in accordance with the following equation: 2H2O2(aq) → 2H2O(l) + O2(g) + heat. A single milliliter of 35% H2O2 results in the liberation of 100 mL of O2. (The more common 3% household solution generates 10 mL of oxygen per 1 ml of H2O2.) The creation of a large intragastric pressure gradient from the liberation of gas, coupled with the caustic and exothermic injury of the bowel mucosa, may contribute to the movement of oxygen through epithelial interstices into the circulation.In addition, and perhaps more importantly, absorption of intact H2O2 with subsequent metabolism by catalase in the blood liberates oxygen directly within the vasculature. Oxygen bubbles may coalesce in blood circulation and occlude vascular flow. In canine studies, elevated oxygen tension in the portal venous system led to cessation of mesenteric flow in arteries and veins, though the mechanism of action is unclear.4 Furthermore, coalescence of bubbles can lead to disruption of bowel-cell architecture, fibrin plugging of capillaries, venous thrombosis, and infarction of tissues.4
Cases of cardiac and cerebral gas embolism have been reported, and present similarly to patients with diving-related decompression injuries (eg, stroke-like syndromes).5,6 The proposed mechanism for these latter effects involves the metabolism of H2O2 in the systemic circulation with production of oxygen bubbles. In the presence of an atrial septal defect, bubbles may move from the right atrium to the arterial circulation.7
Toxicity and death from H2O2 exposure associated with the historical treatment of inspissated meconium,4 as well as the irrigation of wounds,8 has been reported in the medical literature. Ingestion of a 3% solution is generally benign, resulting at worst in gastrointestinal symptoms or throat irritation.9 Rarely does significant toxicity occur at this low concentration,5 with the vast majority of such cases involving concentrated solutions of 35%.
Case continuation
Case 2

Based on this patient’s continued symptoms, an abdominal radiograph was obtained to assess the presence of portal venous air. Although radiographic findings were normal, continued abdominal examination findings warranted a subsequent abdominal computed tomography (CT) scan, which revealed the presence of extensive air throughout the portal venous system (Figure.).
Do all patients presenting with H2O2 ingestion require imaging to assess for the presence of portal venous air?
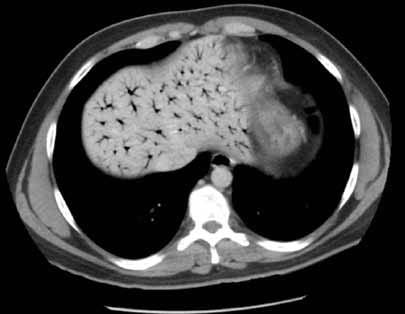
Reportedly, ingestion of as little as a “sip” or “mouthful” of 35% H2O2 has resulted in venous and arterial gas embolism,6 occasionally with severe consequences, but no current consensus guidelines exist regarding imaging requirements. Some toxicologists and hyperbaric physicians believe that the presence of portal venous air does not adversely impact a patient’s prognosis or necessitate treatment, and therefore a workup is unnecessary. Others, however, suggest that the presence of portal venous air indicates oversaturation of oxygen in the blood, placing the patient at increased risk for cardiac and cerebral air embolism. Neither one of these theories is well supported in the literature. Although practice patterns vary by institution, it is reasonable that all patients presenting with abdominal complaints after ingestion of H2O2 undergo CT imaging to assess for portal venous air.
If portal venous air is detected, do patients require hyperbaric oxygen therapy?
The management of patients with portal venous gas following H2O2
Hyperbaric therapy increases the amount of oxygen that can be dissolved in the blood, thereby decreasing bubble formation and allowing transport of dissolved oxygen to the lungs where it can be exhaled. Some patients with portal venous air experience significant pain and portal venous hypertension, which may respond rapidly to this therapy.10 Based on available literature, hyperbaric therapy is reasonable for patients with significant abdominal pain and portal venous air following H2O2 ingestion; less controversial is the role of hyperbaric therapy in those with cerebral air embolism. Multiple case reports of patients with significant neurologic findings demonstrate resolution of symptoms following hyperbaric therapy.6
Case conclusion
Hyperbaric oxygen therapy was recommended for the patient in this case, but transfer to a hyperbaric facility was not possible. He was instead admitted to the hospital for continuous monitoring. Over the next 12 hours, his symptoms gradually resolved, and a repeat CT scan the following day showed complete resolution of the portal venous gas. The patient was subsequently discharged without any sequelae.
- Ukuku DO, Bari ML, Kawamoto S, Isshiki K. Use of hydrogen peroxide in combination with nisin, sodium lactate and citric acid for reducing transfer of bacterial pathogens from whole melon surfaces to fresh-cut pieces. Int J Food Microbiol. 2005;104(2):225-233.
- 35% H2O2 hydrogen peroxide food grade certified benefits. The One Minute Miracle Web site. http:// www.theoneminutemiracleinc.com/pages/h2o2- benefits/. Accessed November 20, 2013.
- FDA warns consumers against drinking high-strength hydrogen peroxide for medicinal use: ingestion can lead to serious health risk and death [news release]. Silver Spring, MD: US Food and Drug Administration; July 27, 2006. http://www.fda.gov/NewsEvents/Newsroom/PressAnnouncements/ 2006/ucm108701.htm. Accessed November 20, 2013.
- Shaw A, Cooperman A, Fusco J. Gas embolism produced by hydrogen peroxide. N Engl J Med. 1967;277(5):238-241.
- Cina SJ, Downs JC, Conradi SE. Hydrogen peroxide: a source of lethal oxygen embolism. Case report and review of the literature. Am J Forensic Med Pathol. 1994;15(1):44-50.
- Rider SP, Jackson SB, Rusyniak DE. Cerebral air gas embolism from concentrated hydrogen peroxide ingestion. Clin Toxicol (Phila). 2008;46(9):815-818.
- French LK, Horowitz BZ, McKeown NJ. Hydrogen peroxide ingestion associated with portal venous gas and treatment with hyperbaric oxygen: a case series and review of the literature. Clin Toxicol (Phila). 2010;48(6):533-538.
- Bassan MM, Dudai M, Shalev O. Near-fatal systemic oxygen embolism due to wound irrigation with hydrogen peroxide. Postgrad Med J. 1982;58(681):448-450.
- Henry MC, Wheeler J, Mofenson HC, et al. Hydrogen peroxide 3% exposures. J Toxicol Clin Toxicol. 1996;34(3):323-327.
- Papafragkou S, Gasparyan A, Batista R, Scott P. Treatment of portal venous gas embolism with hyperbaric oxygen after accidental ingestion of hydrogen peroxide: a case report and review of the literature. J Emerg Med. 2012;43(1):e21-e23.
Case
A previously healthy 32-year-old man presented to the ED after unintentionally ingesting a mouthful of concentrated (35%) hydrogen peroxide (H2O2) from an unmarked bottle he kept in his refrigerator. Upon realizing his error, he immediately drank a liter of water, which promptly induced vomiting. In the ED, the patient complained of mild throat and chest discomfort as well as “abdominal fullness.”
His initial vital signs were: blood pressure, 140/92 mm Hg; heart rate, 93 beats/minute; respiratory rate, 18 breaths/minute; temperature, 96.4° F. Oxygen saturation was 98% on room air. Physical examination revealed tenderness in the epigastric region with no peritoneal findings. Oropharynx and chest examination were normal, and standard laboratory investigations were all within normal limits.
What are the potential exposures to hydrogen peroxide?
Hydrogen peroxide is a colorless and odorless liquid. Solutions with concentrations ranging from 3% to 5% have many household applications, including use as a wound disinfectant and dentifrice; dilute solutions are also utilized for similar purposes in the hospital setting. Industrial-strength H2O2 (concentrations of 10% to 35%) is employed to bleach textiles and paper, and higher concentrations (70% to 90%) are used as an oxygen source for rocket engines.
Consumer application of concentrated H2O2 solutions has become increasingly common. Some, like this patient, clean the surfaces of fruits and vegetables with H2O2 to decrease transmission of bacteria during cutting.1 More concerning, however, is the purported medicinal benefits of ingesting “food-grade” (35%) H2O2 mixed with water—touted on many Internet sites as a treatment for illnesses such as emphysema, cancer, anemia, and HIV.2 Sometimes referred to as “hyperoxygenation therapy,” this so-called treatment has not been approved by the US Food and Drug Administration for any such purpose.3 When diluted sufficiently, this concoction is not harmful but unlikely to provide any health benefits.
Dr Lucyk is a fellow of medical toxicology in the department of emergency medicine at the New York University School of Medicine and the New York City Poison Control Center. Dr Nelson, editor of “Case Studies in Toxicology,” is a professor in the department of emergency medicine and director of the medical toxicology fellowship program at the New York University School of Medicine and the New York City Poison Control Center. He is also associate editor, toxicology, of the EMERGENCY MEDICINE editorial board.
What are the toxic effects of concentrated hydrogen peroxide?
Injury from concentrated H2O2 consumption is primarily from either direct caustic injury or the embolic obstruction of blood flow. Following ingestion, the enzyme catalase metabolizes the breakdown of H2O2 in accordance with the following equation: 2H2O2(aq) → 2H2O(l) + O2(g) + heat. A single milliliter of 35% H2O2 results in the liberation of 100 mL of O2. (The more common 3% household solution generates 10 mL of oxygen per 1 ml of H2O2.) The creation of a large intragastric pressure gradient from the liberation of gas, coupled with the caustic and exothermic injury of the bowel mucosa, may contribute to the movement of oxygen through epithelial interstices into the circulation.In addition, and perhaps more importantly, absorption of intact H2O2 with subsequent metabolism by catalase in the blood liberates oxygen directly within the vasculature. Oxygen bubbles may coalesce in blood circulation and occlude vascular flow. In canine studies, elevated oxygen tension in the portal venous system led to cessation of mesenteric flow in arteries and veins, though the mechanism of action is unclear.4 Furthermore, coalescence of bubbles can lead to disruption of bowel-cell architecture, fibrin plugging of capillaries, venous thrombosis, and infarction of tissues.4
Cases of cardiac and cerebral gas embolism have been reported, and present similarly to patients with diving-related decompression injuries (eg, stroke-like syndromes).5,6 The proposed mechanism for these latter effects involves the metabolism of H2O2 in the systemic circulation with production of oxygen bubbles. In the presence of an atrial septal defect, bubbles may move from the right atrium to the arterial circulation.7
Toxicity and death from H2O2 exposure associated with the historical treatment of inspissated meconium,4 as well as the irrigation of wounds,8 has been reported in the medical literature. Ingestion of a 3% solution is generally benign, resulting at worst in gastrointestinal symptoms or throat irritation.9 Rarely does significant toxicity occur at this low concentration,5 with the vast majority of such cases involving concentrated solutions of 35%.
Case continuation
Case 2
Based on this patient’s continued symptoms, an abdominal radiograph was obtained to assess the presence of portal venous air. Although radiographic findings were normal, continued abdominal examination findings warranted a subsequent abdominal computed tomography (CT) scan, which revealed the presence of extensive air throughout the portal venous system (Figure.).
Do all patients presenting with H2O2 ingestion require imaging to assess for the presence of portal venous air?
Reportedly, ingestion of as little as a “sip” or “mouthful” of 35% H2O2 has resulted in venous and arterial gas embolism,6 occasionally with severe consequences, but no current consensus guidelines exist regarding imaging requirements. Some toxicologists and hyperbaric physicians believe that the presence of portal venous air does not adversely impact a patient’s prognosis or necessitate treatment, and therefore a workup is unnecessary. Others, however, suggest that the presence of portal venous air indicates oversaturation of oxygen in the blood, placing the patient at increased risk for cardiac and cerebral air embolism. Neither one of these theories is well supported in the literature. Although practice patterns vary by institution, it is reasonable that all patients presenting with abdominal complaints after ingestion of H2O2 undergo CT imaging to assess for portal venous air.
If portal venous air is detected, do patients require hyperbaric oxygen therapy?
The management of patients with portal venous gas following H2O2
Hyperbaric therapy increases the amount of oxygen that can be dissolved in the blood, thereby decreasing bubble formation and allowing transport of dissolved oxygen to the lungs where it can be exhaled. Some patients with portal venous air experience significant pain and portal venous hypertension, which may respond rapidly to this therapy.10 Based on available literature, hyperbaric therapy is reasonable for patients with significant abdominal pain and portal venous air following H2O2 ingestion; less controversial is the role of hyperbaric therapy in those with cerebral air embolism. Multiple case reports of patients with significant neurologic findings demonstrate resolution of symptoms following hyperbaric therapy.6
Case conclusion
Hyperbaric oxygen therapy was recommended for the patient in this case, but transfer to a hyperbaric facility was not possible. He was instead admitted to the hospital for continuous monitoring. Over the next 12 hours, his symptoms gradually resolved, and a repeat CT scan the following day showed complete resolution of the portal venous gas. The patient was subsequently discharged without any sequelae.
- Ukuku DO, Bari ML, Kawamoto S, Isshiki K. Use of hydrogen peroxide in combination with nisin, sodium lactate and citric acid for reducing transfer of bacterial pathogens from whole melon surfaces to fresh-cut pieces. Int J Food Microbiol. 2005;104(2):225-233.
- 35% H2O2 hydrogen peroxide food grade certified benefits. The One Minute Miracle Web site. http:// www.theoneminutemiracleinc.com/pages/h2o2- benefits/. Accessed November 20, 2013.
- FDA warns consumers against drinking high-strength hydrogen peroxide for medicinal use: ingestion can lead to serious health risk and death [news release]. Silver Spring, MD: US Food and Drug Administration; July 27, 2006. http://www.fda.gov/NewsEvents/Newsroom/PressAnnouncements/ 2006/ucm108701.htm. Accessed November 20, 2013.
- Shaw A, Cooperman A, Fusco J. Gas embolism produced by hydrogen peroxide. N Engl J Med. 1967;277(5):238-241.
- Cina SJ, Downs JC, Conradi SE. Hydrogen peroxide: a source of lethal oxygen embolism. Case report and review of the literature. Am J Forensic Med Pathol. 1994;15(1):44-50.
- Rider SP, Jackson SB, Rusyniak DE. Cerebral air gas embolism from concentrated hydrogen peroxide ingestion. Clin Toxicol (Phila). 2008;46(9):815-818.
- French LK, Horowitz BZ, McKeown NJ. Hydrogen peroxide ingestion associated with portal venous gas and treatment with hyperbaric oxygen: a case series and review of the literature. Clin Toxicol (Phila). 2010;48(6):533-538.
- Bassan MM, Dudai M, Shalev O. Near-fatal systemic oxygen embolism due to wound irrigation with hydrogen peroxide. Postgrad Med J. 1982;58(681):448-450.
- Henry MC, Wheeler J, Mofenson HC, et al. Hydrogen peroxide 3% exposures. J Toxicol Clin Toxicol. 1996;34(3):323-327.
- Papafragkou S, Gasparyan A, Batista R, Scott P. Treatment of portal venous gas embolism with hyperbaric oxygen after accidental ingestion of hydrogen peroxide: a case report and review of the literature. J Emerg Med. 2012;43(1):e21-e23.

Third universal definition of myocardial infarction: Update, caveats, differential diagnoses
In 2012, a task force of the European Society of Cardiology, the American College of Cardiology Foundation, the American Heart Association, and the World Heart Federation released its “third universal definition” of myocardial infarction (MI),1 replacing the previous (2007) definition. The new consensus definition reflects the increasing sensitivity of available troponin assays, which are commonly elevated in other conditions and after uncomplicated percutaneous coronary intervention or cardiac surgery. With a more appropriate definition of the troponin threshold after these procedures, benign myocardial injury can be differentiated from pathologic MI.
TROPONINS: THE PREFERRED MARKERS
Symptoms of MI such as nausea, chest pain, epigastric discomfort, syncope, and diaphoresis may be nonspecific, and findings on electrocardiography or imaging studies may be nondiagnostic. We thus rely on biomarker elevations to identify patients who need treatment.
Cardiac troponin I and cardiac troponin T have become the preferred markers for detecting MI, as they are more sensitive and tissue-specific than their main competitor, the MB fraction of creatine kinase (CK-MB).2 But the newer troponin assays, which are even more sensitive than earlier ones, have raised concerns about their ability to differentiate patients who truly have acute coronary syndromes from those with other causes of troponin elevation. This can have major effects on treatment, patient psyche, and hospital costs.
Troponin elevations can occur in patients with heart failure, end-stage renal disease, sepsis, acute pulmonary embolism, myopericarditis, arrhythmias, and many other conditions. As noted by the task force, these cases of elevated troponin in the absence of clinical supportive evidence should not be labeled as an MI but rather as myocardial injury.
Troponins bind actin and myosin filaments in a trimeric complex composed of troponins I, C, and T. Troponins are present in all muscle cells, but the cardiac isoforms are specific to myocardial tissue.
As a result, both cardiac troponin I and cardiac troponin T, as measured by fourth-generation assays, are highly sensitive (75.2%, 95% confidence interval [CI] 66.8%–83.4%) and specific (94.6%, 95% CI 93.4%–96.3%) for detecting pathologic processes involving the heart.3,4 Nonetheless, increases in cardiac troponin T (but not I) have been documented in patients with disease of skeletal muscles, likely secondary to re-expressed isoforms of the troponin C gene present in both cardiac and skeletal myocytes.3 There has been no evidence to suggest that either cardiac troponin I nor cardiac troponin T is superior to the other as a marker of MI.
Serum troponin levels detectably rise by 2 to 3 hours after myocardial injury. This temporal pattern is similar to that of CK-MB, which rises at about 2 hours and reaches a peak in 4 to 6 hours. However, troponins are more sensitive than CK-MB during this early time period, since a greater proportion is released from the heart during times of cardiac injury.
The definition of an abnormal troponin value is set by the precision of each individual assay. The task force has designated the optimal precision for troponin assays to be at a coefficient of variation of less than 10% when describing a value exceeding the 99th percentile in a reference population. The 99th percentile, which is the upper reference limit, corresponds to a value near 0.035 μg/L for fourth-generation troponin I and troponin T assays.5 Most assays have been adapted to ensure that they meet such criteria.
High-sensitivity assays
Over the past few years, “high-sensitivity” assays have been developed that can detect nanogram levels of troponin.
In one study, an algorithm that incorporated high-sensitivity cardiac troponin T levels was able to rule in or rule out acute MI in 77% of patients with chest pain within 1 hour.6 The algorithm had a sensitivity and negative predictive value of 100%.
Other studies have shown a sensitivity of 100.0%, a specificity of 34.0%, and a negative predictive value of 100.0% when using a cardiac troponin T cutoff of 3 ng/L, while a cutoff of 14 ng/L yielded a sensitivity of 85.4%, a specificity of 82.4%, and a negative predictive value of 96.1%.4 With cutoffs as low as 3 ng/L, some assays detect elevated troponin in up to 90% of people in normal reference populations without MI.7
Physicians thus need to be aware that high-sensitivity troponin assays should mainly be used to rule out acute coronary syndrome, as their high sensitivity substantially compromises their specificity. The appropriate thresholds for various patient populations, the appropriate testing procedures with high-sensitivity assays as compared with the fourth-generation troponin assays (ie, frequency of testing, change in level, and rise), and the cost and clinical outcomes of care based on algorithms that use these values remain unclear and will require further study.8,9
TYPES OF MYOCARDIAL INFARCTION
The task force defines the following categories of MI (Table 1):
Type 1: Spontaneous myocardial infarction
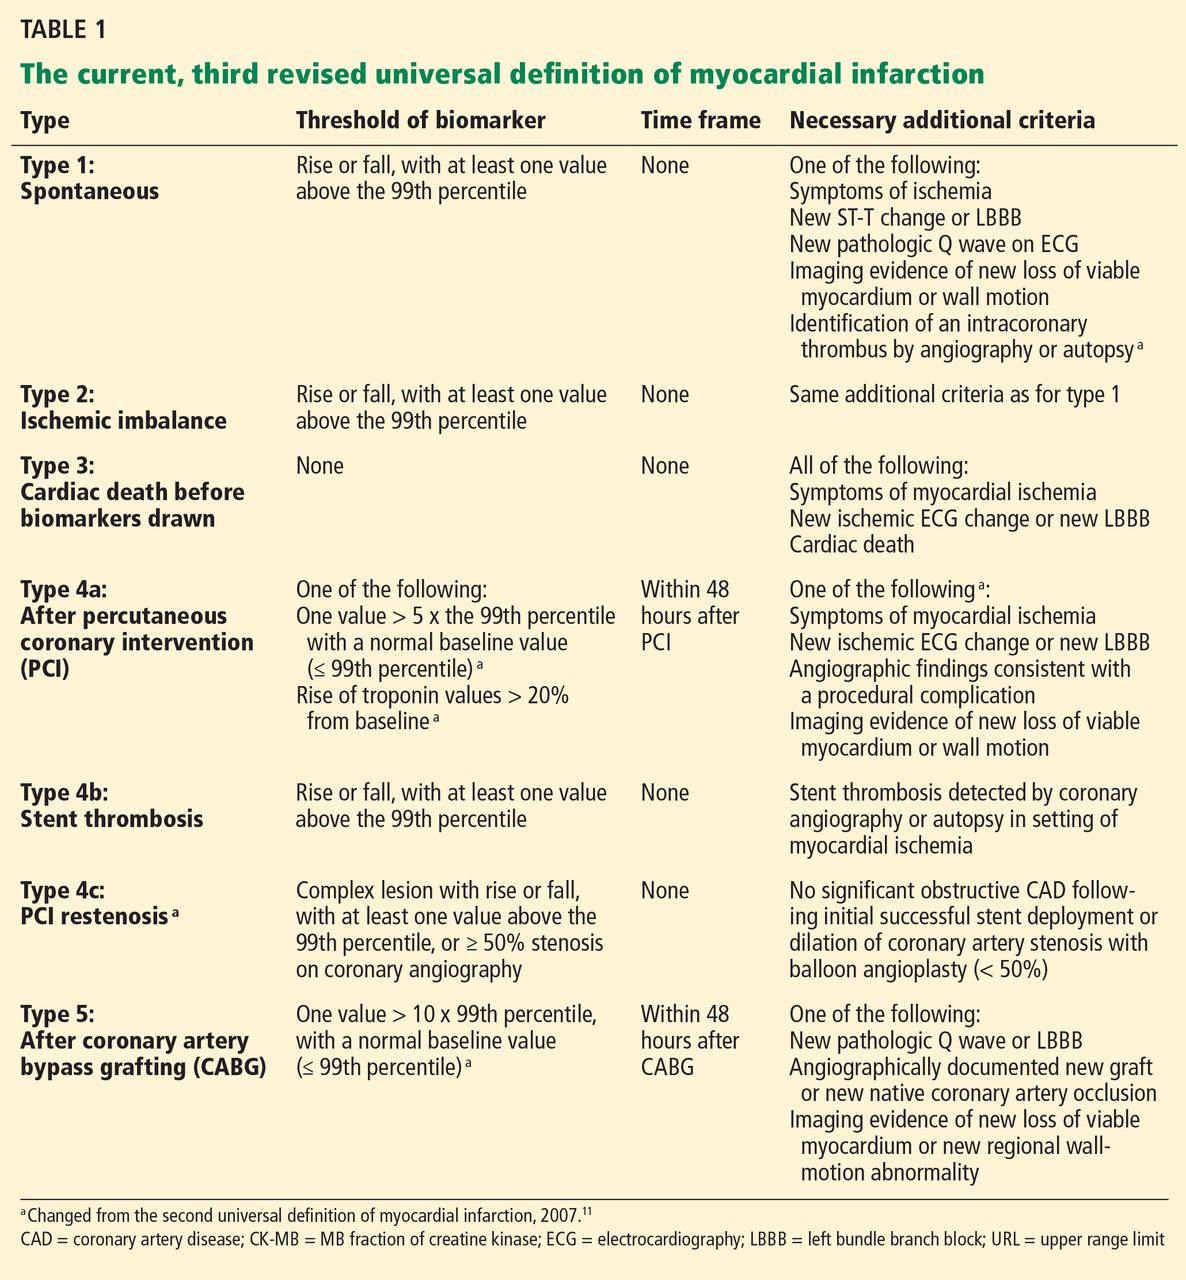
Type 1, or “spontaneous” MI, is an acute coronary syndrome, colloquially called a “heart attack.” It is primarily the result of rupture, fissuring, erosion, or dissection of atherosclerotic plaque. Most are the result of underlying atherosclerotic coronary artery disease, although some (ie, those caused by coronary dissection) are not.
To diagnose type 1 MI, a blood sample must detect a rise or fall (or both) of cardiac biomarker values (preferably cardiac troponin), with at least one value above the 99th percentile. However, an elevated troponin level is not sufficient. At least one of the following criteria must also be met:
- Symptoms of ischemia
- New ST-segment or T-wave changes or new left bundle branch block
- Development of pathologic Q waves
- Imaging evidence of new loss of viable myocardium or new wall-motion abnormality
- Finding of an intracoronary thrombus by angiography or autopsy.
Type 1 MI therapy requires antithrombotic drugs and, with the additional findings, revascularization.
Type 2: Due to ischemic imbalance
Type 2 MI is caused by a supply-demand imbalance in myocardial perfusion, resulting in ischemic damage. This specifically excludes acute coronary thrombosis, but can result from marked changes in demand or supply (eg, sepsis) or from a combination of acute changes and chronic conditions (eg, tachycardia with baseline coronary artery disease). Baseline stable coronary artery disease, left ventricular hypertrophy, endothelial dysfunction, coronary artery spasm, coronary embolism, arrhythmias, anemia, respiratory failure, hypotension, and hypertension can all contribute to a supply-demand mismatch sufficient to cause permanent myocardial damage.
The criteria for diagnosing type 2 MI are the same as for type 1: both elevated troponin levels and one of the clinical criteria (symptoms of ischemia, electrocardiographic changes, new wall-motion abnormality, or intracoronary thrombus) must be present.
Of importance, unlike those with type 1 MI, most patients with type 2 MI are unlikely to immediately benefit from antithrombotic therapy, as they typically have no acute thrombosis (except in cases of coronary embolism). Therapy should instead be directed at the underlying supply-demand imbalance and may include volume resuscitation, blood pressure support or control, or control of tachyarrhythmias.
In the long term, treatment to resolve or prevent supply-demand imbalances may also include revascularization or antithrombotic drugs, but these may be contraindicated in the acute setting.
Type 3: Sudden cardiac death from MI
The third type of MI occurs when myocardial ischemia results in sudden cardiac death before blood samples can be obtained. Before dying, the patient should have had symptoms suggesting myocardial ischemia and should have had presumed new ischemic electrocardiographic changes or new left bundle branch block.
This definition of MI is not very useful clinically but is important for population-based research studies.
Type 4a: Due to percutaneous coronary intervention
A rise in CK-MB levels after percutaneous coronary intervention has been associated with a higher rate of death or recurrent MI.10 Previously, type 4 MI was defined as an elevation of cardiac biomarker values (> 3 times the 99th percentile) after percutaneous coronary intervention in a patient who had a normal baseline value (< 99th percentile).11
Unfortunately, using troponin at this threshold, the number of cases is five times higher than when CK-MB is used, without a consistent correlation with the outcomes of death or complications.12 Currently, the increase in cardiac troponin after percutaneous coronary intervention is best interpreted as a marker of the patient’s atherothrombotic burden more than as a predictor of adverse outcomes.13
The updated definition of MI associated with percutaneous coronary intervention now requires an elevation of cardiac troponin values greater than 5 times the 99th percentile in a patient who had normal baseline values or an increase of more than 20% from baseline within 48 hours of the procedure. As this value has been arbitrarily assigned rather than based on an established threshold with clinical outcomes, a true MI must further meet one of the following criteria:
- Symptoms suggesting myocardial ischemia
- New ischemic electrocardiographic changes or new left bundle branch block
- Angiographic loss of patency of a major coronary artery or a side branch or persistent slow-flow or no-flow or embolization
- Imaging evidence of a new loss of viable myocardium or a new wall-motion abnormality.
Given that troponin levels may be elevated in up to 65% of patients after uncomplicated percutaneous coronary intervention and this elevation may be unavoidable,14 a higher troponin threshold to diagnose MI and the clear requirement of clinical correlates may resonate with physicians as a more appropriate definition. In turn, such guidelines may better identify those with an adverse event, while partly reducing unnecessary hospitalization and observation time in those for whom it is not necessary.
Type 4b: Due to stent thrombosis
Type 4b MI is MI caused by stent thrombosis. The thrombosis must be detected by coronary angiography or autopsy in the setting of myocardial ischemia and a rise or fall of cardiac biomarker values, with at least one value above the 99th percentile.
Type 4c: Due to restenosis
Proposed is the addition of type 4c MI, ie, MI resulting from restenosis of more than 50%, because restenosis after percutaneous coronary intervention can lead to MI without thrombosis.15
Type 5: After coronary artery bypass grafting
Similar to the situation after percutaneous coronary intervention, increased CK-MB levels after coronary artery bypass graft surgery are associated with poor outcomes.16 Although some studies have indicated that increased troponin levels within 24 hours of this surgery are associated with higher death rates, no study has established a troponin threshold that correlates with outcomes.17
The task force acknowledged this lack of prognostic value but arbitrarily defined type 5 MI as requiring biomarker elevations greater than 10 times the 99th percentile during the first 48 hours after surgery, with a normal baseline value. One of the following additional criteria must also be met:
- New pathologic Q waves or new left bundle branch block
- Angiographically documented new occlusion in the graft or native coronary artery
- Imaging evidence of new loss of viable myocardium or new wall-motion abnormality.
CHANGES FROM THE 2007 DEFINITIONS
Updates to the definitions of the MI types since the 2007 task force definition can be found in Table 1.
In type 1 and 2 MI, the finding of an intracoronary thrombus by angiography or autopsy was added as one of the possible criteria for evidence of myocardial ischemia.
In type 3 MI, the definition was simplified by deleting the former criterion of finding a fresh thrombus by angiography or autopsy.
In type 4a MI, by requiring clinical correlates, the updated definition in particular moves away from relying solely on troponin levels to diagnose an infarction after percutaneous coronary intervention, as was the case in 2007. Other changes from the 2007 definition: the troponin MI threshold was previously 3 times the 99th percentile, now it is 5 times. Also, if the patient had an elevated baseline value, he or she can now still qualify as having an MI if the level increases by more than 20%.
In type 5 MI, changes to the definition similarly reflect the need to address overly sensitive troponin values when diagnosing an MI after coronary artery bypass grafting. To address such concerns, the required cardiac biomarker values were increased from more than 5 to more than 10 times the 99th percentile.
The task force raised the troponin thresholds for type 4 and type 5 MI in response to evidence showing that troponins are excessively sensitive to minimal myocardial damage during revascularization, and the lack of a troponin threshold that correlates with clinical outcomes.12 Although higher, these values remain arbitrary, so physicians will need to exercise clinical judgment when deciding whether patients are experiencing benign myocardial injury or rather a true MI after revascularization procedures.
OTHER CONDITIONS THAT RAISE TROPONIN LEVELS
As troponin is a marker not only for MI but also for any form of cardiac injury, its levels are elevated in numerous conditions, such as heart failure, renal failure, and left ventricular hypertrophy. The task force identifies distinct troponin elevations above basal levels as the best indication of new pathology, yet several conditions other than acute coronary syndromes can also cause dynamic changes in troponin levels.
Troponin is a sensitive marker for ruling out MI and has tissue specificity for cardiac injury, but it is not specific for acute coronary syndrome as the cause of such injury. Troponin assays were tested and validated in patients in whom there was a high clinical suspicion of acute coronary syndrome, but when ordered indiscriminately, they have a poor positive predictive value (53%) for this disorder.18
Physicians must distinguish between acute coronary syndrome and other causes when deciding to give antithrombotics. Table 2 lists common causes of increased troponin other than acute coronary syndrome.
Heart failure
Some patients with acute congestive heart failure have elevated troponin levels. In one study, 6.2% of such patients had troponin I levels of 1 μg/L or higher or troponin T levels of 0.1 μg/L or higher, and these patients had poorer outcomes and more severe symptoms.19 Levels can also be elevated in patients with chronic heart failure, in whom they correlate with impaired hemodynamics, progressive ventricular dysfunction, and death.20 In an overview of two large trials of patients with chronic congestive heart failure, 86% and 98% tested positive for cardiac troponin using high-sensitivity assays.21
Troponin levels can rise from baseline and subsequently fall in congestive heart failure due to small amounts of myocardial injury, which may be very difficult to distinguish from MI based on the similar presenting symptoms of dyspnea and chest pressure.1,22 The increased troponin levels in chronic congestive heart failure may reflect apoptosis secondary to wall stretch or direct cell toxicity by neurohormones, alcohol, chemotherapy agents, or infiltrative disorders.23–26
End-stage renal disease
Troponin levels are increased in end-stage renal disease, with 25% to 75% of patients having elevated levels using currently available assays.27–29 With the advent of high-sensitivity assays, however, cardiac troponin T levels higher than the 99th percentile are found in 100% of patients who have end-stage renal disease without cardiac symptoms.30
Troponin values above the 99th percentile are therefore not diagnostic of MI in this population. Rather, a diagnosis of MI in patients with end-stage renal disease requires clinical signs and symptoms and serial changes in troponin levels from baseline levels. The task force and the National Academy of Clinical Biochemistry recommend requiring an elevation of more than 20% from baseline, representing a change in troponin of more than 3 standard deviations.31
Increases in troponin in renal failure are thought to be the result of chronic cardiac structural changes such as coronary artery disease, left ventricular hypertrophy, and elevated left ventricular end-diastolic pressure, rather than decreased clearance.32,33
In stable patients with end-stage renal disease, those who have high levels of cardiac troponin T have a higher mortality rate.34 Although the mechanism is not completely clear, decreased clearance of uremic toxins may contribute to myocardial damage beyond that of the cardiac structural changes.34
Sepsis
Approximately 50% of patients admitted to an intensive care unit with sepsis without acute coronary syndrome have elevated troponin levels.35
Elevated troponin in sepsis patients has been associated with left ventricular dysfunction, most likely from hemodynamic stress, direct cytotoxicity of bacterial endotoxins, and reperfusion injury.35,36 Critical illness places high demands on the myocardium, while oxygen supply may be diminished by hypotension, pulmonary edema, and intravascular volume depletion. This supply-demand mismatch is similar to the physiology of type 2 MI, with clinical signs and symptoms of MI potentially being the only differentiating factor.
Elevated troponin levels may represent either reversible or irreversible myocardial injury in patients with sepsis and are a predictor of severe illness and death.37 However, what to do about elevated troponin in patients with sepsis is not clear. When patients are in the intensive care unit with single-organ or multi-organ failure, the diagnosis and treatment of troponin elevations may not take priority.1 Diagnosing MI is further complicated by the inability of critically ill patients to communicate signs and symptoms. Physicians should also remember that diagnostic testing (electrocardiography, echocardiography) is often necessary to meet the clinical criteria for a type 1 or 2 MI in critically ill patients, and that treatment options may be limited.
Pulmonary embolism
Pulmonary embolism is a leading noncardiac cause of troponin elevation in patients in whom the clinical suspicion of acute coronary syndrome is initially high.38 It is thought that increased troponin levels in patients with pulmonary embolism are caused by increased right ventricular strain secondary to increased pulmonary artery resistance.
The signs and symptoms of MI and of pulmonary embolism overlap, and troponin can be elevated in both conditions, making the initial diagnosis difficult. Electrocardiography and early bedside echocardiography can identify the predominant right-sided dilatation and strain in the heart secondary to pulmonary embolism. Computed tomography should be performed if there is even a moderate clinical suspicion of pulmonary embolism.
The appropriate use of thrombolytics in a normotensive patient with pulmonary embolism remains controversial. The significant risks of hemorrhage need to be balanced with the risk of hemodynamic deterioration. For these patients, the combination of cardiac troponin I measurement and echocardiography provides more prognostic information than each does individually.39 Troponin elevation may therefore be a marker for poor outcomes without aggressive treatment with thrombolytics.
However, single troponin measurements in patients hospitalized early with pulmonary embolism can lead to substantial risk of misdiagnosing them with MI. Although the intensity of the peak is not particularly useful in the setting of pulmonary embolism, two consecutive troponin values 8 hours apart will allow for more appropriate risk stratification for pulmonary embolism patients, who may have a delay between right heart injury and troponin release.40
‘Myopericarditis’
It is reasonable to expect that myocarditis—inflammation of the myocardium—would cause release of troponin from myocytes.41 Interestingly, however, troponin levels can also be elevated in pericarditis.42 The reasons are not clear but have been hypothesized as being caused by nonspecific inflammation during pericarditis that also includes the superficial myocardium—hence, “myopericarditis.”
We have only limited data on the outcomes of patients who have pericarditis with troponin elevation, but troponin levels did correlate with an adverse prognosis in one study.43
Arrhythmias
A number of arrhythmias have been associated with elevated troponin levels. Some studies have shown arrhythmias to be the most common cause of high troponin levels in patients who are not experiencing an acute coronary syndrome.44,45
The reasons proposed for increased troponins in tachyarrhythmia are similar to those in other conditions of oxygen supply-demand mismatch.46 Tachycardia alone may lead to troponin release in the absence of myodepressive factors, inflammatory mediators, or coronary artery disease.46
Studies have provided only mixed data as to whether troponin levels predict newonset arrhythmias or recurrence of arrhythmias.47,48 Nonetheless, elevated troponin (≥ 0.040 μg/L) in patients with atrial fibrillation has independently correlated with increased risk of stroke or systemic embolism, death, and other cardiovascular events. This is clinically important, as troponin elevations higher than these levels adds prognostic information to that given by the CHADS2 stroke score (congestive heart failure, hypertension, age ≥ 75 years diabetes mellitus, and prior stroke or transient ischemic attack) and thus can inform appropriate anticoagulation therapy.49
USE OF TROPONIN VALUES
Troponins are highly sensitive assays with high tissue specificity for myocardial injury, but levels can be elevated in non-MI conditions and in MIs other than type 1. As with any diagnostic test applied to a population with a low prevalence of the disease, troponin elevation has a low positive predictive value—53% for acute coronary syndrome.18
Unfortunately, in clinical practice, troponins are measured in up to 50% of admitted patients, a small proportion of whom have clinical signs or symptoms of MI.50 Often, clinicians are left with a positive troponin of unknown significance, potentially leading to unnecessary diagnostic testing that detracts from the primary diagnosis.
Dynamic changes in troponin values (eg, a change of more than 20% in a patient with end-stage renal disease) are helpful in distinguishing acute from chronic causes of troponin elevation. However, such changes can also occur with acute or chronic congestive heart failure, tachycardia, hypotension, or other conditions other than acute coronary syndrome.
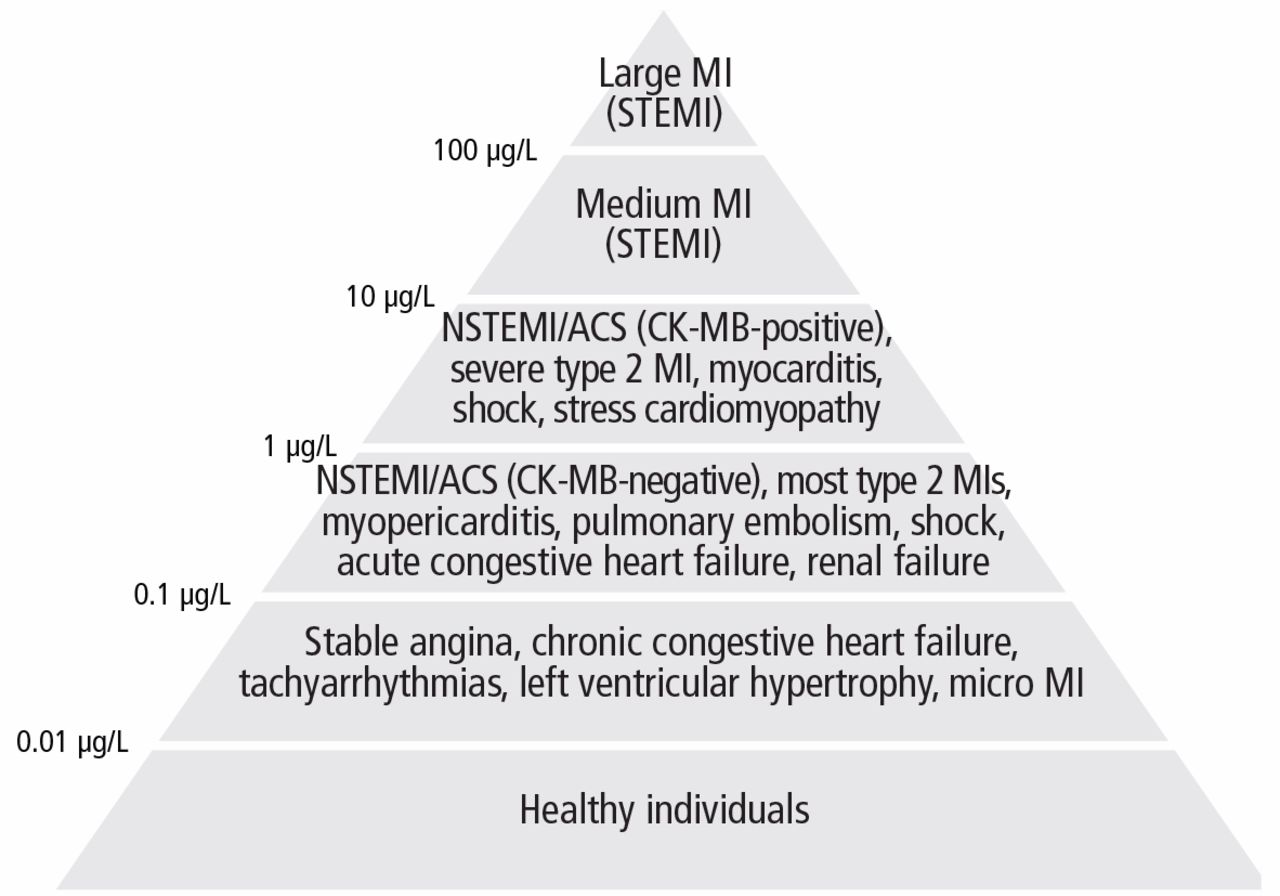
The absolute numerical value of troponin can help assess the significance of troponin elevation. In most non-MI and non-acute coronary syndrome causes of troponin elevation, the troponin level tends to be lower than 1 μg/mL (Figure 1). Occasional exceptions occur, especially when multiple conditions coexist (end-stage renal disease and congestive heart failure, for example). In contrast, most patients with acute coronary syndromes have either clear symptoms or electrocardiographic changes consistent with MI and a troponin that rises above 0.5 μg/mL.
The task force discourages the use of secondary thresholds for MI, as there is no level of troponin that is considered benign. While any troponin elevation carries a negative prognosis, such prognostic knowledge may not be particularly helpful in deciding whether to anticoagulate patients or attempt revascularization procedures.
We thus recommend using a threshold higher than the 99th percentile to distinguish acute coronary syndromes from other causes of troponin elevations. The particular threshold for decision-making should vary, depending on how strongly one clinically suspects an acute coronary syndrome. For instance, a cardiac troponin I level of 0.2 μg/mL in an otherwise healthy patient with chest pain and ST-segment depression is more than sufficient to diagnose acute coronary syndrome. In contrast, an end-stage renal disease patient with hypertensive cardiomyopathy who presents only with nausea should have a level markedly higher than his or her baseline value (and likely > 0.8 μg/mL) before acute coronary syndrome should be diagnosed.
CK-MB’S ROLE IN THE TROPONIN ERA
Some proponents of troponin assays, including those on the task force, have suggested that CK-MB may no longer be necessary in the evaluation of acute MI.51 In the past, CK-MB had more research supporting its use in quantifying myocardial damage and in diagnosing reinfarction, but some data suggest that troponin may be equally useful for these applications.52,53
These comments aside, CK-MB measurements are still widely ordered with troponin, a probable response to the clinical difficulty of determining the cause and significance of troponin elevations. Although likely less common with recent assays, a small subgroup of patients with acute coronary syndrome will be CK-MB–positive and troponin-negative and at higher risk of morbidity and death than those who are troponin- and CK-MB–negative.54,55
Troponin levels are elevated in many chronic conditions, whereas CK-MB levels may be unaffected or less affected. In some cases, such as congestive heart failure or renal failure, troponins may be both chronically elevated and more than 20% higher than at baseline. In a clinical context in which a false-positive troponin assay is likely, the addition of a CK-MB assay may help determine if a rise (and possibly a subsequent fall) in the troponin level represents true MI. More importantly, deciding on antithrombotic therapy or revascularization is often based on whether a patient has acute coronary syndrome, rather than a small MI from demand ischemia. CK-MB may thus serve as a less sensitive but more specific marker for the larger amount of myocardial damage that one might expect from an acute coronary syndrome.
CK-MB testing also may help determine the acuity of an acute coronary syndrome for patients with known causes of increased troponin. A negative CK-MB value in the presence of a troponin value elevated above baseline could indicate an event a few days prior.
Finally, the approach of ordering both troponin and CK-MB may be particularly helpful in diagnosing type 4 and 5 MIs, as current guidelines suggest that more research is needed to determine whether current troponin thresholds lead to clinical outcomes.
CLINICAL JUDGMENT IS NECESSARY
The updated definition raises the biomarker threshold required to diagnose MI after revascularization procedures and reemphasizes the need to look for other signs of infarction. This change reflects the sometimes excessive sensitivity of troponin assays for minimal and often unavoidable myocardial damage that occurs in numerous conditions.
With sensitive troponin assays, clinical judgment is essential for separating true MI from myocardial injury, and acute coronary syndrome from demand ischemia. Clinicians will now be forced to be cognizant of their suspicion for acute coronary syndrome in the presence of multiple noncoronary causes of increased troponin with little practical guideline guidance. In settings in which troponin elevation is expected (eg, congestive heart failure, end-stage renal failure, shock), a higher cardiac troponin threshold or CK-MB may be useful as a less sensitive but more specific marker of significant myocardial damage requiring aggressive treatment.
- Thygesen K, Alpert JS, Jaffe AS, et al. Third universal definition of myocardial infarction. J Am Coll Cardiol 2012; 60:1581–1598.
- Perry SV. Troponin T: genetics, properties and function. J Muscle Res Cell Motil 1998; 19:575–602.
- Jaffe AS, Vasile VC, Milone M, Saenger AK, Olson KN, Apple FS. Diseased skeletal muscle: a noncardiac source of increased circulating concentrations of cardiac troponin T. J Am Coll Cardiol 2011; 58:1819–1824.
- Body R, Carley S, McDowell G, et al. Rapid exclusion of acute myocardial infarction in patients with undetectable troponin using a high-sensitivity assay. J Am Coll Cardiol 2011; 58:1332–1339.
- Jaffe AS, Apple FS, Morrow DA, Lindahl B, Katus HA. Being rational about (im)precision: a statement from the Biochemistry Subcommittee of the Joint European Society of Cardiology/American College of Cardiology Foundation/American Heart Association/World Heart Federation Task Force for the definition of myocardial infarction. Clin Chem 2010; 56:941–943.
- Reichlin T, Schindler C, Drexler B, et al. One-hour rule-out and rule-in of acute myocardial infarction using high-sensitivity cardiac troponin T. Arch Intern Med 2012; 172:1211–1218.
- Reichlin T, Hochholzer W, Bassetti S, et al. Early diagnosis of myocardial infarction with sensitive cardiac troponin assays. N Engl J Med 2009; 361:858–867.
- Kavsak PA, Worster A. Dichotomizing high-sensitivity cardiac troponin T results and important analytical considerations [letter]. J Am Coll Cardiol 2012; 59:1570; author reply 1571–1572.
- Newby LK. Myocardial infarction rule-out in the emergency department: are high-sensitivity troponins the answer? Comment on “one-hour rule-out and rule-in of acute myocardial infarction using high-sensitivity cardiac troponin T.” Arch Intern Med 2012; 172:1218–1219.
- Califf RM, Abdelmeguid AE, Kuntz RE, et al. Myonecrosis after revascularization procedures. J Am Coll Cardiol 1998; 31:241–251.
- Thygesen K, Alpert JS, White HD; Joint ESC/ACCF/AHA/WHF Task Force for the Redefinition of Myocardial Infarction. Universal definition of myocardial infarction. J Am Coll Cardiol 2007; 50:2173–2195.
- Cockburn J, Behan M, de Belder A, et al. Use of troponin to diagnose periprocedural myocardial infarction: effect on composite endpoints in the British Bifurcation Coronary Study (BBC ONE). Heart 2012; 98:1431–1435.
- Zimarino M, Cicchitti V, Genovesi E, Rotondo D, De Caterina R. Isolated troponin increase after percutaneous coronary interventions: does it have prognostic relevance? Atherosclerosis 2012; 221:297–302.
- Loeb HS, Liu JC. Frequency, risk factors, and effect on long-term survival of increased troponin I following uncomplicated elective percutaneous coronary intervention. Clin Cardiol 2010; 33:E40–E44.
- Lee MS, Pessegueiro A, Zimmer R, Jurewitz D, Tobis J. Clinical presentation of patients with in-stent restenosis in the drug-eluting stent era. J Invasive Cardiol 2008; 20:401–403.
- Klatte K, Chaitman BR, Theroux P, et al; GUARDIAN Investigators (The GUARD during Ischemia Against Necrosis). Increased mortality after coronary artery bypass graft surgery is associated with increased levels of postoperative creatine kinase-myocardial band isoenzyme release: results from the GUARDIAN trial. J Am Coll Cardiol 2001; 38:1070–1077.
- Domanski MJ, Mahaffey K, Hasselblad V, et al. Association of myocardial enzyme elevation and survival following coronary artery bypass graft surgery. JAMA 2011; 305:585–591.
- Alcalai R, Planer D, Culhaoglu A, Osman A, Pollak A, Lotan C. Acute coronary syndrome vs nonspecific troponin elevation: clinical predictors and survival analysis. Arch Intern Med 2007; 167:276–281.
- Peacock WF, De Marco T, Fonarow GC, et al; ADHERE Investigators. Cardiac troponin and outcome in acute heart failure. N Engl J Med 2008; 358:2117–2126.
- Horwich TB, Patel J, MacLellan WR, Fonarow GC. Cardiac troponin I is associated with impaired hemodynamics, progressive left ventricular dysfunction, and increased mortality rates in advanced heart failure. Circulation 2003; 108:833–838.
- Masson S, Anand I, Favero C, et al; Valsartan Heart Failure Trial (Val-HeFT) and Gruppo Italiano per lo Studio della Sopravvivenza nell’Insufficienza Cardiaca—Heart Failure (GISSI-HF) Investigators. Serial measurement of cardiac troponin T using a highly sensitive assay in patients with chronic heart failure: data from 2 large randomized clinical trials. Circulation 2012; 125:280–288.
- Januzzi JL, Filippatos G, Nieminen M, Gheorghiade M. Troponin elevation in patients with heart failure: on behalf of the third Universal Definition of Myocardial Infarction Global Task Force: Heart Failure Section. Eur Heart J 2012; 33:2265–2271.
- Shih H, Lee B, Lee RJ, Boyle AJ. The aging heart and post-infarction left ventricular remodeling. J Am Coll Cardiol 2011; 57:9–17.
- Latini R, Masson S, Anand IS, et al; Val-HeFT Investigators. Prognostic value of very low plasma concentrations of troponin T in patients with stable chronic heart failure. Circulation 2007; 116:1242–1249.
- Dispenzieri A, Kyle RA, Gertz MA, et al. Survival in patients with primary systemic amyloidosis and raised serum cardiac troponins. Lancet 2003; 361:1787–1789.
- Sawaya H, Sebag IA, Plana JC, et al. Early detection and prediction of cardiotoxicity in chemotherapy-treated patients. Am J Cardiol 2011; 107:1375–1380.
- Apple FS, Murakami MM, Pearce LA, Herzog CA. Predictive value of cardiac troponin I and T for subsequent death in end-stage renal disease. Circulation 2002; 106:2941–2945.
- Mallamaci F, Zoccali C, Parlongo S, et al. Troponin is related to left ventricular mass and predicts all-cause and cardiovascular mortality in hemodialysis patients. Am J Kidney Dis 2002; 40:68–75.
- Roppolo LP, Fitzgerald R, Dillow J, Ziegler T, Rice M, Maisel A. A comparison of troponin T and troponin I as predictors of cardiac events in patients undergoing chronic dialysis at a Veteran’s Hospital: a pilot study. J Am Coll Cardiol 1999; 34:448–454.
- Jacobs LH, van de Kerkhof J, Mingels AM, et al. Haemodialysis patients longitudinally assessed by highly sensitive cardiac troponin T and commercial cardiac troponin T and cardiac troponin I assays. Ann Clin Biochem 2009; 46:283–290.
- NACB Writing Group; Wu AH, Jaffe AS, Apple FS, et al. National Academy of Clinical Biochemistry laboratory medicine practice guidelines: use of cardiac troponin and B-type natriuretic peptide or N-terminal proB-type natriuretic peptide for etiologies other than acute coronary syndromes and heart failure. Clin Chem 2007; 53:2086–2096.
- Schulz O, Kirpal K, Stein J, et al. Importance of low concentrations of cardiac troponins. Clin Chem 2006; 52:1614–1615.
- Jaffe AS, Babuin L, Apple FS. Biomarkers in acute cardiac disease: the present and the future. J Am Coll Cardiol 2006; 48:1–11.
- deFilippi C, Wasserman S, Rosanio S, et al. Cardiac troponin T and C-reactive protein for predicting prognosis, coronary atherosclerosis, and cardiomyopathy in patients undergoing long-term hemodialysis. JAMA 2003; 290:353–359.
- ver Elst KM, Spapen HD, Nguyen DN, Garbar C, Huyghens LP, Gorus FK. Cardiac troponins I and T are biological markers of left ventricular dysfunction in septic shock. Clin Chem 2000; 46:650–657.
- Fromm RE. Cardiac troponins in the intensive care unit: common causes of increased levels and interpretation. Crit Care Med 2007; 35:584–588.
- Mehta NJ, Khan IA, Gupta V, Jani K, Gowda RM, Smith PR. Cardiac troponin I predicts myocardial dysfunction and adverse outcome in septic shock. Int J Cardiol 2004; 95:13–17.
- Ilva TJ, Eskola MJ, Nikus KC, et al. The etiology and prognostic significance of cardiac troponin I elevation in unselected emergency department patients. J Emerg Med 2010; 38:1–5.
- Kucher N, Wallmann D, Carone A, Windecker S, Meier B, Hess OM. Incremental prognostic value of troponin I and echocardiography in patients with acute pulmonary embolism. Eur Heart J 2003; 24:1651–1656.
- Ferrari E, Moceri P, Crouzet C, Doyen D, Cerboni P. Timing of troponin I measurement in pulmonary embolism. Heart 2012; 98:732–735.
- Smith SC, Ladenson JH, Mason JW, Jaffe AS. Elevations of cardiac troponin I associated with myocarditis. Experimental and clinical correlates. Circulation 1997; 95:163–168.
- Brandt RR, Filzmaier K, Hanrath P. Circulating cardiac troponin I in acute pericarditis. Am J Cardiol 2001; 87:1326–1328.
- Imazio M, Cecchi E, Demichelis B, et al. Myopericarditis versus viral or idiopathic acute pericarditis. Heart 2008; 94:498–501.
- Bakshi TK, Choo MK, Edwards CC, Scott AG, Hart HH, Armstrong GP. Causes of elevated troponin I with a normal coronary angiogram. Intern Med J 2002; 32:520–525.
- Bukkapatnam RN, Robinson M, Turnipseed S, Tancredi D, Amsterdam E, Srivatsa UN. Relationship of myocardial ischemia and injury to coronary artery disease in patients with supraventricular tachycardia. Am J Cardiol 2010; 106:374–377.
- Jeremias A, Gibson CM. Narrative review: alternative causes for elevated cardiac troponin levels when acute coronary syndromes are excluded. Ann Intern Med 2005; 142:786–791.
- Beaulieu-Boire I, Leblanc N, Berger L, Boulanger JM. Troponin elevation predicts atrial fibrillation in patients with stroke or transient ischemic attack. J Stroke Cerebrovasc Dis 2012; Epub ahead of print.
- Latini R, Masson S, Pirelli S, et al; GISSI-AF Investigators. Circulating cardiovascular biomarkers in recurrent atrial fibrillation: data from the GISSI-atrial fibrillation trial. J Intern Med 2011; 269:160–171.
- Hijazi Z, Oldgren J, Andersson U, et al. Cardiac biomarkers are associated with an increased risk of stroke and death in patients with atrial fibrillation: a Randomized Evaluation of Long-term Anticoagulation Therapy (RE-LY) substudy. Circulation 2012; 125:1605–1616.
- Waxman DA, Hecht S, Schappert J, Husk G. A model for troponin I as a quantitative predictor of in-hospital mortality. J Am Coll Cardiol 2006; 48:1755–1762.
- Saenger AK, Jaffe AS. Requiem for a heavyweight: the demise of creatine kinase-MB. Circulation 2008; 118:2200–2206.
- Younger JF, Plein S, Barth J, Ridgway JP, Ball SG, Greenwood JP. Troponin-I concentration 72 h after myocardial infarction correlates with infarct size and presence of microvascular obstruction. Heart 2007; 93:1547–1551.
- Morrow DA, Cannon CP, Jesse RL, et al; National Academy of Clinical Biochemistry. National Academy of Clinical Biochemistry Laboratory Medicine Practice Guidelines: clinical characteristics and utilization of biochemical markers in acute coronary syndromes. Circulation 2007; 115:e356–e375.
- Yee KC, Mukherjee D, Smith DE, et al. Prognostic significance of an elevated creatine kinase in the absence of an elevated troponin I during an acute coronary syndrome. Am J Cardiol 2003; 92:1442–1444.
- Newby LK, Roe MT, Chen AY, et al; CRUSADE Investigators. Frequency and clinical implications of discordant creatine kinase-MB and troponin measurements in acute coronary syndromes. J Am Coll Cardiol 2006; 47:312–318.
In 2012, a task force of the European Society of Cardiology, the American College of Cardiology Foundation, the American Heart Association, and the World Heart Federation released its “third universal definition” of myocardial infarction (MI),1 replacing the previous (2007) definition. The new consensus definition reflects the increasing sensitivity of available troponin assays, which are commonly elevated in other conditions and after uncomplicated percutaneous coronary intervention or cardiac surgery. With a more appropriate definition of the troponin threshold after these procedures, benign myocardial injury can be differentiated from pathologic MI.
TROPONINS: THE PREFERRED MARKERS
Symptoms of MI such as nausea, chest pain, epigastric discomfort, syncope, and diaphoresis may be nonspecific, and findings on electrocardiography or imaging studies may be nondiagnostic. We thus rely on biomarker elevations to identify patients who need treatment.
Cardiac troponin I and cardiac troponin T have become the preferred markers for detecting MI, as they are more sensitive and tissue-specific than their main competitor, the MB fraction of creatine kinase (CK-MB).2 But the newer troponin assays, which are even more sensitive than earlier ones, have raised concerns about their ability to differentiate patients who truly have acute coronary syndromes from those with other causes of troponin elevation. This can have major effects on treatment, patient psyche, and hospital costs.
Troponin elevations can occur in patients with heart failure, end-stage renal disease, sepsis, acute pulmonary embolism, myopericarditis, arrhythmias, and many other conditions. As noted by the task force, these cases of elevated troponin in the absence of clinical supportive evidence should not be labeled as an MI but rather as myocardial injury.
Troponins bind actin and myosin filaments in a trimeric complex composed of troponins I, C, and T. Troponins are present in all muscle cells, but the cardiac isoforms are specific to myocardial tissue.
As a result, both cardiac troponin I and cardiac troponin T, as measured by fourth-generation assays, are highly sensitive (75.2%, 95% confidence interval [CI] 66.8%–83.4%) and specific (94.6%, 95% CI 93.4%–96.3%) for detecting pathologic processes involving the heart.3,4 Nonetheless, increases in cardiac troponin T (but not I) have been documented in patients with disease of skeletal muscles, likely secondary to re-expressed isoforms of the troponin C gene present in both cardiac and skeletal myocytes.3 There has been no evidence to suggest that either cardiac troponin I nor cardiac troponin T is superior to the other as a marker of MI.
Serum troponin levels detectably rise by 2 to 3 hours after myocardial injury. This temporal pattern is similar to that of CK-MB, which rises at about 2 hours and reaches a peak in 4 to 6 hours. However, troponins are more sensitive than CK-MB during this early time period, since a greater proportion is released from the heart during times of cardiac injury.
The definition of an abnormal troponin value is set by the precision of each individual assay. The task force has designated the optimal precision for troponin assays to be at a coefficient of variation of less than 10% when describing a value exceeding the 99th percentile in a reference population. The 99th percentile, which is the upper reference limit, corresponds to a value near 0.035 μg/L for fourth-generation troponin I and troponin T assays.5 Most assays have been adapted to ensure that they meet such criteria.
High-sensitivity assays
Over the past few years, “high-sensitivity” assays have been developed that can detect nanogram levels of troponin.
In one study, an algorithm that incorporated high-sensitivity cardiac troponin T levels was able to rule in or rule out acute MI in 77% of patients with chest pain within 1 hour.6 The algorithm had a sensitivity and negative predictive value of 100%.
Other studies have shown a sensitivity of 100.0%, a specificity of 34.0%, and a negative predictive value of 100.0% when using a cardiac troponin T cutoff of 3 ng/L, while a cutoff of 14 ng/L yielded a sensitivity of 85.4%, a specificity of 82.4%, and a negative predictive value of 96.1%.4 With cutoffs as low as 3 ng/L, some assays detect elevated troponin in up to 90% of people in normal reference populations without MI.7
Physicians thus need to be aware that high-sensitivity troponin assays should mainly be used to rule out acute coronary syndrome, as their high sensitivity substantially compromises their specificity. The appropriate thresholds for various patient populations, the appropriate testing procedures with high-sensitivity assays as compared with the fourth-generation troponin assays (ie, frequency of testing, change in level, and rise), and the cost and clinical outcomes of care based on algorithms that use these values remain unclear and will require further study.8,9
TYPES OF MYOCARDIAL INFARCTION
The task force defines the following categories of MI (Table 1):
Type 1: Spontaneous myocardial infarction
Type 1, or “spontaneous” MI, is an acute coronary syndrome, colloquially called a “heart attack.” It is primarily the result of rupture, fissuring, erosion, or dissection of atherosclerotic plaque. Most are the result of underlying atherosclerotic coronary artery disease, although some (ie, those caused by coronary dissection) are not.
To diagnose type 1 MI, a blood sample must detect a rise or fall (or both) of cardiac biomarker values (preferably cardiac troponin), with at least one value above the 99th percentile. However, an elevated troponin level is not sufficient. At least one of the following criteria must also be met:
- Symptoms of ischemia
- New ST-segment or T-wave changes or new left bundle branch block
- Development of pathologic Q waves
- Imaging evidence of new loss of viable myocardium or new wall-motion abnormality
- Finding of an intracoronary thrombus by angiography or autopsy.
Type 1 MI therapy requires antithrombotic drugs and, with the additional findings, revascularization.
Type 2: Due to ischemic imbalance
Type 2 MI is caused by a supply-demand imbalance in myocardial perfusion, resulting in ischemic damage. This specifically excludes acute coronary thrombosis, but can result from marked changes in demand or supply (eg, sepsis) or from a combination of acute changes and chronic conditions (eg, tachycardia with baseline coronary artery disease). Baseline stable coronary artery disease, left ventricular hypertrophy, endothelial dysfunction, coronary artery spasm, coronary embolism, arrhythmias, anemia, respiratory failure, hypotension, and hypertension can all contribute to a supply-demand mismatch sufficient to cause permanent myocardial damage.
The criteria for diagnosing type 2 MI are the same as for type 1: both elevated troponin levels and one of the clinical criteria (symptoms of ischemia, electrocardiographic changes, new wall-motion abnormality, or intracoronary thrombus) must be present.
Of importance, unlike those with type 1 MI, most patients with type 2 MI are unlikely to immediately benefit from antithrombotic therapy, as they typically have no acute thrombosis (except in cases of coronary embolism). Therapy should instead be directed at the underlying supply-demand imbalance and may include volume resuscitation, blood pressure support or control, or control of tachyarrhythmias.
In the long term, treatment to resolve or prevent supply-demand imbalances may also include revascularization or antithrombotic drugs, but these may be contraindicated in the acute setting.
Type 3: Sudden cardiac death from MI
The third type of MI occurs when myocardial ischemia results in sudden cardiac death before blood samples can be obtained. Before dying, the patient should have had symptoms suggesting myocardial ischemia and should have had presumed new ischemic electrocardiographic changes or new left bundle branch block.
This definition of MI is not very useful clinically but is important for population-based research studies.
Type 4a: Due to percutaneous coronary intervention
A rise in CK-MB levels after percutaneous coronary intervention has been associated with a higher rate of death or recurrent MI.10 Previously, type 4 MI was defined as an elevation of cardiac biomarker values (> 3 times the 99th percentile) after percutaneous coronary intervention in a patient who had a normal baseline value (< 99th percentile).11
Unfortunately, using troponin at this threshold, the number of cases is five times higher than when CK-MB is used, without a consistent correlation with the outcomes of death or complications.12 Currently, the increase in cardiac troponin after percutaneous coronary intervention is best interpreted as a marker of the patient’s atherothrombotic burden more than as a predictor of adverse outcomes.13
The updated definition of MI associated with percutaneous coronary intervention now requires an elevation of cardiac troponin values greater than 5 times the 99th percentile in a patient who had normal baseline values or an increase of more than 20% from baseline within 48 hours of the procedure. As this value has been arbitrarily assigned rather than based on an established threshold with clinical outcomes, a true MI must further meet one of the following criteria:
- Symptoms suggesting myocardial ischemia
- New ischemic electrocardiographic changes or new left bundle branch block
- Angiographic loss of patency of a major coronary artery or a side branch or persistent slow-flow or no-flow or embolization
- Imaging evidence of a new loss of viable myocardium or a new wall-motion abnormality.
Given that troponin levels may be elevated in up to 65% of patients after uncomplicated percutaneous coronary intervention and this elevation may be unavoidable,14 a higher troponin threshold to diagnose MI and the clear requirement of clinical correlates may resonate with physicians as a more appropriate definition. In turn, such guidelines may better identify those with an adverse event, while partly reducing unnecessary hospitalization and observation time in those for whom it is not necessary.
Type 4b: Due to stent thrombosis
Type 4b MI is MI caused by stent thrombosis. The thrombosis must be detected by coronary angiography or autopsy in the setting of myocardial ischemia and a rise or fall of cardiac biomarker values, with at least one value above the 99th percentile.
Type 4c: Due to restenosis
Proposed is the addition of type 4c MI, ie, MI resulting from restenosis of more than 50%, because restenosis after percutaneous coronary intervention can lead to MI without thrombosis.15
Type 5: After coronary artery bypass grafting
Similar to the situation after percutaneous coronary intervention, increased CK-MB levels after coronary artery bypass graft surgery are associated with poor outcomes.16 Although some studies have indicated that increased troponin levels within 24 hours of this surgery are associated with higher death rates, no study has established a troponin threshold that correlates with outcomes.17
The task force acknowledged this lack of prognostic value but arbitrarily defined type 5 MI as requiring biomarker elevations greater than 10 times the 99th percentile during the first 48 hours after surgery, with a normal baseline value. One of the following additional criteria must also be met:
- New pathologic Q waves or new left bundle branch block
- Angiographically documented new occlusion in the graft or native coronary artery
- Imaging evidence of new loss of viable myocardium or new wall-motion abnormality.
CHANGES FROM THE 2007 DEFINITIONS
Updates to the definitions of the MI types since the 2007 task force definition can be found in Table 1.
In type 1 and 2 MI, the finding of an intracoronary thrombus by angiography or autopsy was added as one of the possible criteria for evidence of myocardial ischemia.
In type 3 MI, the definition was simplified by deleting the former criterion of finding a fresh thrombus by angiography or autopsy.
In type 4a MI, by requiring clinical correlates, the updated definition in particular moves away from relying solely on troponin levels to diagnose an infarction after percutaneous coronary intervention, as was the case in 2007. Other changes from the 2007 definition: the troponin MI threshold was previously 3 times the 99th percentile, now it is 5 times. Also, if the patient had an elevated baseline value, he or she can now still qualify as having an MI if the level increases by more than 20%.
In type 5 MI, changes to the definition similarly reflect the need to address overly sensitive troponin values when diagnosing an MI after coronary artery bypass grafting. To address such concerns, the required cardiac biomarker values were increased from more than 5 to more than 10 times the 99th percentile.
The task force raised the troponin thresholds for type 4 and type 5 MI in response to evidence showing that troponins are excessively sensitive to minimal myocardial damage during revascularization, and the lack of a troponin threshold that correlates with clinical outcomes.12 Although higher, these values remain arbitrary, so physicians will need to exercise clinical judgment when deciding whether patients are experiencing benign myocardial injury or rather a true MI after revascularization procedures.
OTHER CONDITIONS THAT RAISE TROPONIN LEVELS
As troponin is a marker not only for MI but also for any form of cardiac injury, its levels are elevated in numerous conditions, such as heart failure, renal failure, and left ventricular hypertrophy. The task force identifies distinct troponin elevations above basal levels as the best indication of new pathology, yet several conditions other than acute coronary syndromes can also cause dynamic changes in troponin levels.
Troponin is a sensitive marker for ruling out MI and has tissue specificity for cardiac injury, but it is not specific for acute coronary syndrome as the cause of such injury. Troponin assays were tested and validated in patients in whom there was a high clinical suspicion of acute coronary syndrome, but when ordered indiscriminately, they have a poor positive predictive value (53%) for this disorder.18
Physicians must distinguish between acute coronary syndrome and other causes when deciding to give antithrombotics. Table 2 lists common causes of increased troponin other than acute coronary syndrome.
Heart failure
Some patients with acute congestive heart failure have elevated troponin levels. In one study, 6.2% of such patients had troponin I levels of 1 μg/L or higher or troponin T levels of 0.1 μg/L or higher, and these patients had poorer outcomes and more severe symptoms.19 Levels can also be elevated in patients with chronic heart failure, in whom they correlate with impaired hemodynamics, progressive ventricular dysfunction, and death.20 In an overview of two large trials of patients with chronic congestive heart failure, 86% and 98% tested positive for cardiac troponin using high-sensitivity assays.21
Troponin levels can rise from baseline and subsequently fall in congestive heart failure due to small amounts of myocardial injury, which may be very difficult to distinguish from MI based on the similar presenting symptoms of dyspnea and chest pressure.1,22 The increased troponin levels in chronic congestive heart failure may reflect apoptosis secondary to wall stretch or direct cell toxicity by neurohormones, alcohol, chemotherapy agents, or infiltrative disorders.23–26
End-stage renal disease
Troponin levels are increased in end-stage renal disease, with 25% to 75% of patients having elevated levels using currently available assays.27–29 With the advent of high-sensitivity assays, however, cardiac troponin T levels higher than the 99th percentile are found in 100% of patients who have end-stage renal disease without cardiac symptoms.30
Troponin values above the 99th percentile are therefore not diagnostic of MI in this population. Rather, a diagnosis of MI in patients with end-stage renal disease requires clinical signs and symptoms and serial changes in troponin levels from baseline levels. The task force and the National Academy of Clinical Biochemistry recommend requiring an elevation of more than 20% from baseline, representing a change in troponin of more than 3 standard deviations.31
Increases in troponin in renal failure are thought to be the result of chronic cardiac structural changes such as coronary artery disease, left ventricular hypertrophy, and elevated left ventricular end-diastolic pressure, rather than decreased clearance.32,33
In stable patients with end-stage renal disease, those who have high levels of cardiac troponin T have a higher mortality rate.34 Although the mechanism is not completely clear, decreased clearance of uremic toxins may contribute to myocardial damage beyond that of the cardiac structural changes.34
Sepsis
Approximately 50% of patients admitted to an intensive care unit with sepsis without acute coronary syndrome have elevated troponin levels.35
Elevated troponin in sepsis patients has been associated with left ventricular dysfunction, most likely from hemodynamic stress, direct cytotoxicity of bacterial endotoxins, and reperfusion injury.35,36 Critical illness places high demands on the myocardium, while oxygen supply may be diminished by hypotension, pulmonary edema, and intravascular volume depletion. This supply-demand mismatch is similar to the physiology of type 2 MI, with clinical signs and symptoms of MI potentially being the only differentiating factor.
Elevated troponin levels may represent either reversible or irreversible myocardial injury in patients with sepsis and are a predictor of severe illness and death.37 However, what to do about elevated troponin in patients with sepsis is not clear. When patients are in the intensive care unit with single-organ or multi-organ failure, the diagnosis and treatment of troponin elevations may not take priority.1 Diagnosing MI is further complicated by the inability of critically ill patients to communicate signs and symptoms. Physicians should also remember that diagnostic testing (electrocardiography, echocardiography) is often necessary to meet the clinical criteria for a type 1 or 2 MI in critically ill patients, and that treatment options may be limited.
Pulmonary embolism
Pulmonary embolism is a leading noncardiac cause of troponin elevation in patients in whom the clinical suspicion of acute coronary syndrome is initially high.38 It is thought that increased troponin levels in patients with pulmonary embolism are caused by increased right ventricular strain secondary to increased pulmonary artery resistance.
The signs and symptoms of MI and of pulmonary embolism overlap, and troponin can be elevated in both conditions, making the initial diagnosis difficult. Electrocardiography and early bedside echocardiography can identify the predominant right-sided dilatation and strain in the heart secondary to pulmonary embolism. Computed tomography should be performed if there is even a moderate clinical suspicion of pulmonary embolism.
The appropriate use of thrombolytics in a normotensive patient with pulmonary embolism remains controversial. The significant risks of hemorrhage need to be balanced with the risk of hemodynamic deterioration. For these patients, the combination of cardiac troponin I measurement and echocardiography provides more prognostic information than each does individually.39 Troponin elevation may therefore be a marker for poor outcomes without aggressive treatment with thrombolytics.
However, single troponin measurements in patients hospitalized early with pulmonary embolism can lead to substantial risk of misdiagnosing them with MI. Although the intensity of the peak is not particularly useful in the setting of pulmonary embolism, two consecutive troponin values 8 hours apart will allow for more appropriate risk stratification for pulmonary embolism patients, who may have a delay between right heart injury and troponin release.40
‘Myopericarditis’
It is reasonable to expect that myocarditis—inflammation of the myocardium—would cause release of troponin from myocytes.41 Interestingly, however, troponin levels can also be elevated in pericarditis.42 The reasons are not clear but have been hypothesized as being caused by nonspecific inflammation during pericarditis that also includes the superficial myocardium—hence, “myopericarditis.”
We have only limited data on the outcomes of patients who have pericarditis with troponin elevation, but troponin levels did correlate with an adverse prognosis in one study.43
Arrhythmias
A number of arrhythmias have been associated with elevated troponin levels. Some studies have shown arrhythmias to be the most common cause of high troponin levels in patients who are not experiencing an acute coronary syndrome.44,45
The reasons proposed for increased troponins in tachyarrhythmia are similar to those in other conditions of oxygen supply-demand mismatch.46 Tachycardia alone may lead to troponin release in the absence of myodepressive factors, inflammatory mediators, or coronary artery disease.46
Studies have provided only mixed data as to whether troponin levels predict newonset arrhythmias or recurrence of arrhythmias.47,48 Nonetheless, elevated troponin (≥ 0.040 μg/L) in patients with atrial fibrillation has independently correlated with increased risk of stroke or systemic embolism, death, and other cardiovascular events. This is clinically important, as troponin elevations higher than these levels adds prognostic information to that given by the CHADS2 stroke score (congestive heart failure, hypertension, age ≥ 75 years diabetes mellitus, and prior stroke or transient ischemic attack) and thus can inform appropriate anticoagulation therapy.49
USE OF TROPONIN VALUES
Troponins are highly sensitive assays with high tissue specificity for myocardial injury, but levels can be elevated in non-MI conditions and in MIs other than type 1. As with any diagnostic test applied to a population with a low prevalence of the disease, troponin elevation has a low positive predictive value—53% for acute coronary syndrome.18
Unfortunately, in clinical practice, troponins are measured in up to 50% of admitted patients, a small proportion of whom have clinical signs or symptoms of MI.50 Often, clinicians are left with a positive troponin of unknown significance, potentially leading to unnecessary diagnostic testing that detracts from the primary diagnosis.
Dynamic changes in troponin values (eg, a change of more than 20% in a patient with end-stage renal disease) are helpful in distinguishing acute from chronic causes of troponin elevation. However, such changes can also occur with acute or chronic congestive heart failure, tachycardia, hypotension, or other conditions other than acute coronary syndrome.
The absolute numerical value of troponin can help assess the significance of troponin elevation. In most non-MI and non-acute coronary syndrome causes of troponin elevation, the troponin level tends to be lower than 1 μg/mL (Figure 1). Occasional exceptions occur, especially when multiple conditions coexist (end-stage renal disease and congestive heart failure, for example). In contrast, most patients with acute coronary syndromes have either clear symptoms or electrocardiographic changes consistent with MI and a troponin that rises above 0.5 μg/mL.
The task force discourages the use of secondary thresholds for MI, as there is no level of troponin that is considered benign. While any troponin elevation carries a negative prognosis, such prognostic knowledge may not be particularly helpful in deciding whether to anticoagulate patients or attempt revascularization procedures.
We thus recommend using a threshold higher than the 99th percentile to distinguish acute coronary syndromes from other causes of troponin elevations. The particular threshold for decision-making should vary, depending on how strongly one clinically suspects an acute coronary syndrome. For instance, a cardiac troponin I level of 0.2 μg/mL in an otherwise healthy patient with chest pain and ST-segment depression is more than sufficient to diagnose acute coronary syndrome. In contrast, an end-stage renal disease patient with hypertensive cardiomyopathy who presents only with nausea should have a level markedly higher than his or her baseline value (and likely > 0.8 μg/mL) before acute coronary syndrome should be diagnosed.
CK-MB’S ROLE IN THE TROPONIN ERA
Some proponents of troponin assays, including those on the task force, have suggested that CK-MB may no longer be necessary in the evaluation of acute MI.51 In the past, CK-MB had more research supporting its use in quantifying myocardial damage and in diagnosing reinfarction, but some data suggest that troponin may be equally useful for these applications.52,53
These comments aside, CK-MB measurements are still widely ordered with troponin, a probable response to the clinical difficulty of determining the cause and significance of troponin elevations. Although likely less common with recent assays, a small subgroup of patients with acute coronary syndrome will be CK-MB–positive and troponin-negative and at higher risk of morbidity and death than those who are troponin- and CK-MB–negative.54,55
Troponin levels are elevated in many chronic conditions, whereas CK-MB levels may be unaffected or less affected. In some cases, such as congestive heart failure or renal failure, troponins may be both chronically elevated and more than 20% higher than at baseline. In a clinical context in which a false-positive troponin assay is likely, the addition of a CK-MB assay may help determine if a rise (and possibly a subsequent fall) in the troponin level represents true MI. More importantly, deciding on antithrombotic therapy or revascularization is often based on whether a patient has acute coronary syndrome, rather than a small MI from demand ischemia. CK-MB may thus serve as a less sensitive but more specific marker for the larger amount of myocardial damage that one might expect from an acute coronary syndrome.
CK-MB testing also may help determine the acuity of an acute coronary syndrome for patients with known causes of increased troponin. A negative CK-MB value in the presence of a troponin value elevated above baseline could indicate an event a few days prior.
Finally, the approach of ordering both troponin and CK-MB may be particularly helpful in diagnosing type 4 and 5 MIs, as current guidelines suggest that more research is needed to determine whether current troponin thresholds lead to clinical outcomes.
CLINICAL JUDGMENT IS NECESSARY
The updated definition raises the biomarker threshold required to diagnose MI after revascularization procedures and reemphasizes the need to look for other signs of infarction. This change reflects the sometimes excessive sensitivity of troponin assays for minimal and often unavoidable myocardial damage that occurs in numerous conditions.
With sensitive troponin assays, clinical judgment is essential for separating true MI from myocardial injury, and acute coronary syndrome from demand ischemia. Clinicians will now be forced to be cognizant of their suspicion for acute coronary syndrome in the presence of multiple noncoronary causes of increased troponin with little practical guideline guidance. In settings in which troponin elevation is expected (eg, congestive heart failure, end-stage renal failure, shock), a higher cardiac troponin threshold or CK-MB may be useful as a less sensitive but more specific marker of significant myocardial damage requiring aggressive treatment.
- Thygesen K, Alpert JS, Jaffe AS, et al. Third universal definition of myocardial infarction. J Am Coll Cardiol 2012; 60:1581–1598.
- Perry SV. Troponin T: genetics, properties and function. J Muscle Res Cell Motil 1998; 19:575–602.
- Jaffe AS, Vasile VC, Milone M, Saenger AK, Olson KN, Apple FS. Diseased skeletal muscle: a noncardiac source of increased circulating concentrations of cardiac troponin T. J Am Coll Cardiol 2011; 58:1819–1824.
- Body R, Carley S, McDowell G, et al. Rapid exclusion of acute myocardial infarction in patients with undetectable troponin using a high-sensitivity assay. J Am Coll Cardiol 2011; 58:1332–1339.
- Jaffe AS, Apple FS, Morrow DA, Lindahl B, Katus HA. Being rational about (im)precision: a statement from the Biochemistry Subcommittee of the Joint European Society of Cardiology/American College of Cardiology Foundation/American Heart Association/World Heart Federation Task Force for the definition of myocardial infarction. Clin Chem 2010; 56:941–943.
- Reichlin T, Schindler C, Drexler B, et al. One-hour rule-out and rule-in of acute myocardial infarction using high-sensitivity cardiac troponin T. Arch Intern Med 2012; 172:1211–1218.
- Reichlin T, Hochholzer W, Bassetti S, et al. Early diagnosis of myocardial infarction with sensitive cardiac troponin assays. N Engl J Med 2009; 361:858–867.
- Kavsak PA, Worster A. Dichotomizing high-sensitivity cardiac troponin T results and important analytical considerations [letter]. J Am Coll Cardiol 2012; 59:1570; author reply 1571–1572.
- Newby LK. Myocardial infarction rule-out in the emergency department: are high-sensitivity troponins the answer? Comment on “one-hour rule-out and rule-in of acute myocardial infarction using high-sensitivity cardiac troponin T.” Arch Intern Med 2012; 172:1218–1219.
- Califf RM, Abdelmeguid AE, Kuntz RE, et al. Myonecrosis after revascularization procedures. J Am Coll Cardiol 1998; 31:241–251.
- Thygesen K, Alpert JS, White HD; Joint ESC/ACCF/AHA/WHF Task Force for the Redefinition of Myocardial Infarction. Universal definition of myocardial infarction. J Am Coll Cardiol 2007; 50:2173–2195.
- Cockburn J, Behan M, de Belder A, et al. Use of troponin to diagnose periprocedural myocardial infarction: effect on composite endpoints in the British Bifurcation Coronary Study (BBC ONE). Heart 2012; 98:1431–1435.
- Zimarino M, Cicchitti V, Genovesi E, Rotondo D, De Caterina R. Isolated troponin increase after percutaneous coronary interventions: does it have prognostic relevance? Atherosclerosis 2012; 221:297–302.
- Loeb HS, Liu JC. Frequency, risk factors, and effect on long-term survival of increased troponin I following uncomplicated elective percutaneous coronary intervention. Clin Cardiol 2010; 33:E40–E44.
- Lee MS, Pessegueiro A, Zimmer R, Jurewitz D, Tobis J. Clinical presentation of patients with in-stent restenosis in the drug-eluting stent era. J Invasive Cardiol 2008; 20:401–403.
- Klatte K, Chaitman BR, Theroux P, et al; GUARDIAN Investigators (The GUARD during Ischemia Against Necrosis). Increased mortality after coronary artery bypass graft surgery is associated with increased levels of postoperative creatine kinase-myocardial band isoenzyme release: results from the GUARDIAN trial. J Am Coll Cardiol 2001; 38:1070–1077.
- Domanski MJ, Mahaffey K, Hasselblad V, et al. Association of myocardial enzyme elevation and survival following coronary artery bypass graft surgery. JAMA 2011; 305:585–591.
- Alcalai R, Planer D, Culhaoglu A, Osman A, Pollak A, Lotan C. Acute coronary syndrome vs nonspecific troponin elevation: clinical predictors and survival analysis. Arch Intern Med 2007; 167:276–281.
- Peacock WF, De Marco T, Fonarow GC, et al; ADHERE Investigators. Cardiac troponin and outcome in acute heart failure. N Engl J Med 2008; 358:2117–2126.
- Horwich TB, Patel J, MacLellan WR, Fonarow GC. Cardiac troponin I is associated with impaired hemodynamics, progressive left ventricular dysfunction, and increased mortality rates in advanced heart failure. Circulation 2003; 108:833–838.
- Masson S, Anand I, Favero C, et al; Valsartan Heart Failure Trial (Val-HeFT) and Gruppo Italiano per lo Studio della Sopravvivenza nell’Insufficienza Cardiaca—Heart Failure (GISSI-HF) Investigators. Serial measurement of cardiac troponin T using a highly sensitive assay in patients with chronic heart failure: data from 2 large randomized clinical trials. Circulation 2012; 125:280–288.
- Januzzi JL, Filippatos G, Nieminen M, Gheorghiade M. Troponin elevation in patients with heart failure: on behalf of the third Universal Definition of Myocardial Infarction Global Task Force: Heart Failure Section. Eur Heart J 2012; 33:2265–2271.
- Shih H, Lee B, Lee RJ, Boyle AJ. The aging heart and post-infarction left ventricular remodeling. J Am Coll Cardiol 2011; 57:9–17.
- Latini R, Masson S, Anand IS, et al; Val-HeFT Investigators. Prognostic value of very low plasma concentrations of troponin T in patients with stable chronic heart failure. Circulation 2007; 116:1242–1249.
- Dispenzieri A, Kyle RA, Gertz MA, et al. Survival in patients with primary systemic amyloidosis and raised serum cardiac troponins. Lancet 2003; 361:1787–1789.
- Sawaya H, Sebag IA, Plana JC, et al. Early detection and prediction of cardiotoxicity in chemotherapy-treated patients. Am J Cardiol 2011; 107:1375–1380.
- Apple FS, Murakami MM, Pearce LA, Herzog CA. Predictive value of cardiac troponin I and T for subsequent death in end-stage renal disease. Circulation 2002; 106:2941–2945.
- Mallamaci F, Zoccali C, Parlongo S, et al. Troponin is related to left ventricular mass and predicts all-cause and cardiovascular mortality in hemodialysis patients. Am J Kidney Dis 2002; 40:68–75.
- Roppolo LP, Fitzgerald R, Dillow J, Ziegler T, Rice M, Maisel A. A comparison of troponin T and troponin I as predictors of cardiac events in patients undergoing chronic dialysis at a Veteran’s Hospital: a pilot study. J Am Coll Cardiol 1999; 34:448–454.
- Jacobs LH, van de Kerkhof J, Mingels AM, et al. Haemodialysis patients longitudinally assessed by highly sensitive cardiac troponin T and commercial cardiac troponin T and cardiac troponin I assays. Ann Clin Biochem 2009; 46:283–290.
- NACB Writing Group; Wu AH, Jaffe AS, Apple FS, et al. National Academy of Clinical Biochemistry laboratory medicine practice guidelines: use of cardiac troponin and B-type natriuretic peptide or N-terminal proB-type natriuretic peptide for etiologies other than acute coronary syndromes and heart failure. Clin Chem 2007; 53:2086–2096.
- Schulz O, Kirpal K, Stein J, et al. Importance of low concentrations of cardiac troponins. Clin Chem 2006; 52:1614–1615.
- Jaffe AS, Babuin L, Apple FS. Biomarkers in acute cardiac disease: the present and the future. J Am Coll Cardiol 2006; 48:1–11.
- deFilippi C, Wasserman S, Rosanio S, et al. Cardiac troponin T and C-reactive protein for predicting prognosis, coronary atherosclerosis, and cardiomyopathy in patients undergoing long-term hemodialysis. JAMA 2003; 290:353–359.
- ver Elst KM, Spapen HD, Nguyen DN, Garbar C, Huyghens LP, Gorus FK. Cardiac troponins I and T are biological markers of left ventricular dysfunction in septic shock. Clin Chem 2000; 46:650–657.
- Fromm RE. Cardiac troponins in the intensive care unit: common causes of increased levels and interpretation. Crit Care Med 2007; 35:584–588.
- Mehta NJ, Khan IA, Gupta V, Jani K, Gowda RM, Smith PR. Cardiac troponin I predicts myocardial dysfunction and adverse outcome in septic shock. Int J Cardiol 2004; 95:13–17.
- Ilva TJ, Eskola MJ, Nikus KC, et al. The etiology and prognostic significance of cardiac troponin I elevation in unselected emergency department patients. J Emerg Med 2010; 38:1–5.
- Kucher N, Wallmann D, Carone A, Windecker S, Meier B, Hess OM. Incremental prognostic value of troponin I and echocardiography in patients with acute pulmonary embolism. Eur Heart J 2003; 24:1651–1656.
- Ferrari E, Moceri P, Crouzet C, Doyen D, Cerboni P. Timing of troponin I measurement in pulmonary embolism. Heart 2012; 98:732–735.
- Smith SC, Ladenson JH, Mason JW, Jaffe AS. Elevations of cardiac troponin I associated with myocarditis. Experimental and clinical correlates. Circulation 1997; 95:163–168.
- Brandt RR, Filzmaier K, Hanrath P. Circulating cardiac troponin I in acute pericarditis. Am J Cardiol 2001; 87:1326–1328.
- Imazio M, Cecchi E, Demichelis B, et al. Myopericarditis versus viral or idiopathic acute pericarditis. Heart 2008; 94:498–501.
- Bakshi TK, Choo MK, Edwards CC, Scott AG, Hart HH, Armstrong GP. Causes of elevated troponin I with a normal coronary angiogram. Intern Med J 2002; 32:520–525.
- Bukkapatnam RN, Robinson M, Turnipseed S, Tancredi D, Amsterdam E, Srivatsa UN. Relationship of myocardial ischemia and injury to coronary artery disease in patients with supraventricular tachycardia. Am J Cardiol 2010; 106:374–377.
- Jeremias A, Gibson CM. Narrative review: alternative causes for elevated cardiac troponin levels when acute coronary syndromes are excluded. Ann Intern Med 2005; 142:786–791.
- Beaulieu-Boire I, Leblanc N, Berger L, Boulanger JM. Troponin elevation predicts atrial fibrillation in patients with stroke or transient ischemic attack. J Stroke Cerebrovasc Dis 2012; Epub ahead of print.
- Latini R, Masson S, Pirelli S, et al; GISSI-AF Investigators. Circulating cardiovascular biomarkers in recurrent atrial fibrillation: data from the GISSI-atrial fibrillation trial. J Intern Med 2011; 269:160–171.
- Hijazi Z, Oldgren J, Andersson U, et al. Cardiac biomarkers are associated with an increased risk of stroke and death in patients with atrial fibrillation: a Randomized Evaluation of Long-term Anticoagulation Therapy (RE-LY) substudy. Circulation 2012; 125:1605–1616.
- Waxman DA, Hecht S, Schappert J, Husk G. A model for troponin I as a quantitative predictor of in-hospital mortality. J Am Coll Cardiol 2006; 48:1755–1762.
- Saenger AK, Jaffe AS. Requiem for a heavyweight: the demise of creatine kinase-MB. Circulation 2008; 118:2200–2206.
- Younger JF, Plein S, Barth J, Ridgway JP, Ball SG, Greenwood JP. Troponin-I concentration 72 h after myocardial infarction correlates with infarct size and presence of microvascular obstruction. Heart 2007; 93:1547–1551.
- Morrow DA, Cannon CP, Jesse RL, et al; National Academy of Clinical Biochemistry. National Academy of Clinical Biochemistry Laboratory Medicine Practice Guidelines: clinical characteristics and utilization of biochemical markers in acute coronary syndromes. Circulation 2007; 115:e356–e375.
- Yee KC, Mukherjee D, Smith DE, et al. Prognostic significance of an elevated creatine kinase in the absence of an elevated troponin I during an acute coronary syndrome. Am J Cardiol 2003; 92:1442–1444.
- Newby LK, Roe MT, Chen AY, et al; CRUSADE Investigators. Frequency and clinical implications of discordant creatine kinase-MB and troponin measurements in acute coronary syndromes. J Am Coll Cardiol 2006; 47:312–318.
KEY POINTS
- Because newer assays for troponin can detect this biomarker at lower concentrations than earlier ones could, they are more sensitive but less specific.
- The high sensitivity of troponin assays makes them valuable for ruling out MI, but less so for ruling it in. Therefore, additional signs are required for the diagnosis.
- MI is categorized into several types, depending on whether it is spontaneous (acute coronary syndromes), caused by supply-demand mismatch, associated with sudden cardiac death, or a complication of percutaneous coronary intervention or of coronary artery bypass grafting.
- In settings in which nonspecific troponin elevations are frequently seen, a less sensitive but more specific test such as creatine kinase MB or troponin using a higher threshold value may be useful.
Man, 55, With Mild Chest Discomfort
A 55-year-old white man with controlled hypertension and hypercholesterolemia awoke with mild chest discomfort that he believed was mild gastroesophageal reflux. He denied radiation of pain to the shoulders, arms, back, or neck; dyspnea; palpitations; diaphoresis; nausea/vomiting; cough; or fever, during the first 30 hours of discomfort. There was no change in discomfort with deep breath, palpation of the chest, or administration of antacids. Minimal, short-lived improvement was noted with belching.
The patient had no trouble sleeping in the prone position and did not notice an increase in discomfort or unusual difficulty during his daily vigorous 30-minute aerobic workout. In fact, his symptoms seemed to improve or disappear during exercise. The patient denied any recent illness or exposure to sick people, had not traveled outside the United States, and had not been exposed to radiation of the chest wall. At the end of the second day of discomfort, the patient noted irregular palpitations with mild shortness of breath and was transported to the hospital for evaluation. He denied being a cigarette smoker or illicit drug user.
The patient had no history of MI or diabetes. The patient’s father had an MI in his 80s, and two uncles died suddenly in their 50s of “massive heart attacks.” His mother, who had died of sepsis of uncertain etiology approximately 10 days earlier, also had hypertension and hypercholesterolemia but no history of coronary artery disease (CAD). Both of the patient’s adult daughters had been diagnosed with celiac disease in the preceding three years. His elder daughter had also been diagnosed with type 1 diabetes within the past two years.
On examination, the patient was afebrile, with a blood pressure of 143/87 mm Hg; pulse, 53 beats/min; and respiratory rate, 17 breaths/min. The patient’s weight was 204 lb and his height, 75 in (BMI, 25.5). The patient was in no apparent distress. Head, eyes, ears, nose, and throat were unremarkable. There was no significant jugular venous distention. The carotid pulses were full, and no bruits were appreciated. S1 and S2 sounds were within normal limits. No murmurs or S3 or S4 gallops were appreciated. The chest was clear on auscultation. Results of the abdominal exam were negative, no edema was noted in the extremities, and pulses were symmetrical.
ECG demonstrated subtle ST-segment elevation in leads I and aVL with a prominent R wave in lead V1. This pattern was interpreted as consistent with an acute inferolateral MI. A baseline ECG, previously obtained by the patient’s internist, had been interpreted as normal.
Peak troponin level was 55 ng/mL (normal, < 0.03 ng/mL); total creatine kinase (CK), 807 U/L (reference range, 20 to 259 U/L); and mass CK-MB fraction, 44 ng/mL (0.1 to 6.6 ng/mL). Total cholesterol was 105 mg/dL, with both LDL- and HDL-cholesterol fractions at 46 mg/dL. A complete blood count without differential revealed a total white blood cell count of 53,000/µL. Hemoglobin and hematocrit were both low (12.3 g/dL and 34.5%, respectively). All indices were within normal limits, as was the platelet count. Glucose, blood urea nitrogen, creatinine, potassium chloride bicarbonate, and calcium were all within normal limits. The sodium level was slightly low (132 mEq/L). Emergency catheterization revealed an ejection fraction of 45% (reference range, 55% to 70%), with mild-to-moderate diffuse hypokinesis but normal coronary arteries.
The patient was diagnosed with myocarditis, likely of viral origin.
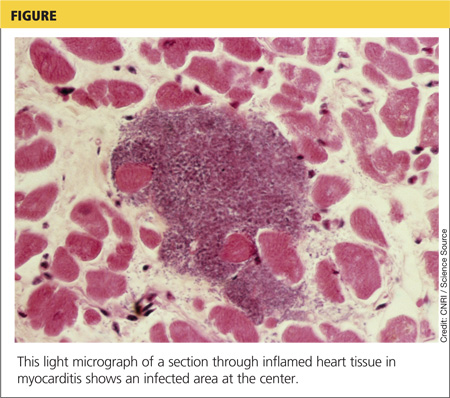
DISCUSSION
Although the incidence of myocarditis in the US is difficult to assess, autopsy reports implicate it in 8.6% to 12% of cases of sudden cardiac death in young adults,1,2 and a large prospective series implicated myocarditis in 9% of cases of dilated cardiomyopathy.3 Myocarditis is considered to be at one extreme of a spectrum of perimyocardial processes that result in inflammation of the myocardium (see figure), pericardium, or both.4
The underlying pathology involves an acute injury to the myocyte. This activates the innate and humoral immune systems, resulting in severe inflammation. The immune reaction eventually subsides, and the myocardium recovers. In certain patients, however, myocardial inflammation persists, resulting in ongoing myocyte damage, relentless symptomatic heart failure, or even death.5
Although a variety of diagnostic criteria have been developed and employed, the diagnosis of myocarditis is often one of exclusion. First proposed in 1986, the Dallas criteria—a histopathologic classification for myocarditis diagnosis—are based on endomyocardial biopsy, with inflammatory cellular infiltrate (with or without associated myocyte necrosis) visible on conventionally stained myocardial tissue sections.5 However, this method poses significant practical limitations, including low sensitivity (43% to 64%) and complication and death rates of 6% and 0.4%, respectively.5,6
An empiric diagnosis of myocarditis is often based on a combination of clinical findings including altered ECG, increase in myocardial enzymes, and lack of significant CAD.6 The recommended diagnostic cardiac magnetic resonance (CMR) imaging criteria for clinically suspected myocardial inflammation (ie, the Lake Louise Criteria) include at least two of the following:7
• Regional or global myocardial signal intensity increase in T2-weighted images.
• Increased global myocardial early gadolinium enhancement ratio between myocardium and skeletal muscle in gadolinium-enhanced T1-weighted images.
• At least one focal lesion with nonischemic regional distribution in inversion recovery–prepared gadolinium-enhanced T1-weighted images (“late gadolinium enhancement”).
Because of its reported high sensitivity and specificity (100% and 90%, respectively), CMR was used in the case patient to confirm the diagnosis of myocarditis.8 Specifically, CMR with contrast demonstrated normal left ventricular cavity size and mild reduction in overall left ventricular systolic function, with a visually estimated left ventricular ejection fraction of 45% to 50%. Regional hypokinesis of the mid-inferior wall and apical inferior septum was noted. Delayed contrast imaging demonstrated extensive non-CAD scarring and fibrosis, involving the basal anterior wall, basal inferior wall, and basal and midlateral wall in a pattern consistent with acute myocarditis.
Just as there is variability in the specific criteria by which the diagnosis of myocarditis can be made, the array of clinical findings with which it can manifest range from fatigue and other nonspecific symptoms to fulminant congestive heart failure and sudden death.6 Often, but not always, a viral prodrome precedes the onset of “cardiac symptoms” (eg, chest pain, dyspnea, palpitations, or syncope).5 This patient’s multiple risk factors for CAD and a suggestive, albeit atypical, history of chest discomfort, palpitations, and shortness of breath helped to focus the clinicians’ evaluation on the heart.
Potential Causes
Once a diagnosis of myocarditis is rendered, the next challenge is distinguishing its specific source from a plethora of potential etiologies, including infection, toxic exposure, or hypersensitivity/autoimmune reaction. Viral infections (mostly herpes, parvovirus, and cytomegalovirus) are thought to cause most cases of myocarditis in developed countries.5,9
Viral myocarditis results when viruses enter cardiac myocytes and incite a cytotoxic effect with activation of the immune response, including expression of interferon , natural killer cells, and release of nitric oxide. The majority of patients recover, but some develop an adaptive immune response, which further causes cardiac damage. In this response, antibodies to viral and to some cardiac proteins are produced, and effector T lymphocytes proliferate. Viral genome or inflammatory mechanisms may persist, contributing to ventricular dysfunction leading to heart failure and arrhythmias.10
Celiac disease is a chronic gastroenterologic disease caused by an immune response to a gluten protein. Damage to the brush border of the small intestine results in an inability to absorb fat, protein, vitamins, and minerals. Intermittent diarrhea, abdominal pain, and bloating are most commonly reported, but celiac disease may also manifest less obviously with iron deficiency anemia, joint pain, muscle cramps, osteoporosis, and neuropathy.11 Iron deficiency anemia that is refractory to iron replacement may offer insight into diagnosing myocarditis due to celiac disease.12 Although studies have found that more than 4% of patients with myocarditis also had celiac disease, none had the classic GI symptoms of celiac disease.12
Takotsubo cardiomyopathy is a transient left ventricular apical ballooning syndrome of unknown etiology. (For more information, see Fasolino T. Takotsubo cardiomyopathy: a clinical overview). Patients who have experienced emotional or physiologic stress and postmenopausal women appear to be at greatest risk. The clinical symptoms mimic MI, including chest pain with ST-segment elevation in the precordial leads on ECG13 and minor elevation of the cardiac enzyme and biomarker levels.14 However, patients experiencing this stress cardiomyopathy lack evidence of atherosclerotic CAD.15 An echocardiogram or CMR imaging reveals characteristic wall motion hypokinesis, akinesis, or dyskinesis of the left ventricular apex and mid-ventricle that help to differentiate it from other forms of myocarditis.15,16 Patient prognosis is favorable, with 95% of patients experiencing a full recovery; left ventricular dysfunction usually begins to improve in a few weeks.13,14
Sarcoidosis is a systemic disease resulting in noncaseating granulomas in multiple organs.17 Initial presentation typically includes bilateral hilar adenopathy, pulmonary reticular opacities, and/or skin, joint, or eye lesions.18 Patients with cardiac sarcoidosis most commonly present with conduction disturbances and ventricular arrhythmias.17 Although frequently absent, clinical symptoms may include palpitations, syncope, dizziness, or chest pain and clinical heart failure.17,18 It is difficult to distinguish cardiac sarcoidosis from other forms of myocarditis unless signs of systemic sarcoidosis are evident. A patient with suspected cardiac sarcoidosis should have an ECG to detect subclinical conduction abnormalities.17 The patient should wear a Holter monitor for 24 hours to screen for cardiac involvement, and echocardiography should be performed to define cardiac abnormalities.19
Giant-cell myocarditis (GCM) is a rare, rapidly progressive, and frequently fatal myocardial disease. Based on endomyocardial or surgical biopsy, GCM is histologically defined by multinucleated giant cells, a lymphocytic inflammatory infiltrate, and myocyte necrosis. It is often found in association with various immune-related systemic disorders.20 Patients present with heart failure, ventricular arrhythmias, and atrioventricular block that fails to improve with standard therapy.21
Treatment and Management
The typical management of acute myocarditis includes supportive care for left ventricular dysfunction and arrhythmia control.22 Many of the standard heart failure therapies—β-blockers, ACE inhibitors, angiotensin receptor blockers, and aldosterone antagonists—are efficacious; several, at least in animal models, appear to exert anti-inflammatory as well as the standard cardiovascular effects.23
Caution is advised regarding the selection of specific therapies. For example, in one study, metoprolol produced deleterious effects in acute murine Coxsackie virus myocarditis; inflammation, necrosis, and mortality significantly increased in the treatment group, compared with the placebo group.23
Information on the effects of particular therapies for specific etiologies of myocarditis are limited, but some evidence supports immunosuppressive and immune-modulating therapies for chronic, virus-negative inflammatory cardiomyopathy. Immunosuppressive therapy is also beneficial for acute GCM and sarcoidosis.23 For patients with myocarditis associated with celiac disease, a gluten-free diet alone or in combination with immunosuppressive agents can significantly improve clinical outcomes.12
OUTCOME FOR THE CASE PATIENT
Because the patient was already taking a statin and an ACE inhibitor for hypercholesterolemia and hypertension, respectively, as well as one baby aspirin per day, only a β-blocker was added to his discharge medication regimen.
Three months after hospital discharge, the patient underwent repeat CMR imaging. The ejection fraction had markedly improved to the 55%-to-60% range, although extensive midmyocardial-to-epicardial scarring in a multifocal pattern, primarily involving the basilar anterior and anterolateral wall, was still present, as was a small focus of an active (albeit healing) process in the inferior wall. Clinically, the patient was doing reasonably well and was vigorously exercising daily without dizziness, syncope, chest discomfort, or shortness of breath.
However, within several weeks of discharge, the patient reported having one two-hour episode of frequent palpitations at rest. Since that episode, palpitations have occurred infrequently. A 48-hour Holter monitor was ordered to better evaluate the palpitations and showed only rare premature ventricular contractions and isolated premature atrial contractions; no complex ectopy was noted. A follow-up stress echocardiogram was scheduled for 12 months, assuming the patient was free of clinical signs and symptoms of heart failure and arrhythmias at that time.
CONCLUSION
Myocarditis can manifest with a broad spectrum of signs and symptoms that may make its identification difficult, especially if a cardiac source is not initially considered in the differential diagnosis. However, for patients who present with elevated biomarkers and normal coronary artery anatomy, the identification of myocarditis is relatively easy; the difficulty in this circumstance relates to the identification of the specific etiology of the myocarditis.
The long-term prognosis for myocarditis is frequently good and the treatment straightforward, using medications that are modeled after standard heart failure therapy. However, depending on the etiology, specific treatment may be advisable—or required—in order to improve outcomes.
References
1. Fabre A, Sheppard MN. Sudden adult death syndrome and other nonischaemic causes of sudden cardiac death: a UK experience. Heart. 2006;92:316-320.
2. Doolan A, Semsarian C, Langlois N. Causes of sudden cardiac death in young Australians. Med J Aust. 2004;180:110-112.
3. Felker GM, Hu W, Hare JM, Hruban RH, et al. The spectrum of dilated cardiomyopathy: the Johns Hopkins experience with 1,278 patients. Medicine (Baltimore). 1999;78:270-283.
4. Leitman M, Tyomkin V, Peleg E, et al. Left ventricular function in acute inflammatory peri-myocardial diseases—new insights and long-term follow-up. Cardiovasc Ultrasound. 2012;10:42.
5. Blauwet LA, Cooper LT. Myocarditis. Prog Cardiovasc Dis. 2010;52:274-288.
6. Testani JM, Kolansky DM, Litt H, Gerstenfeld EP. Focal myocarditis mimicking acute ST-elevation myocardial infarction: diagnosis using cardiac magnetic resonance imaging. Tex Heart Inst J. 2006;33:256-259.
7. Friedrich MG, Sechtem U, Schulz-Menger J, et al. Cardiovascular magnetic resonance in myocarditis: a JACC white paper. J Am Coll Cardiol. 2009;53: 1475-1487.
8. Olimulder MA, van Es J, Galjee MA. The importance of cardiac MRI as a diagnostic tool in viral myocarditis-induced cardiomyopathy. Neth Heart J. 2009;17:481-486.
9. Mavrogeni S, Bratis K, Markussis V, et al. The diagnostic role of cardiac magnetic resonance imaging in detecting myocardial inflammation in systemic lupus erythematosus. Differentiation from viral myocarditis. Lupus. 2013;22:34-43.
10. Schultz JC, Hilliard AA, Cooper LT, Rihal CS. Diagnosis and treatment of viral myocarditis. Mayo Clin Proc. 2009;84:1001-1009.
11. Schuppan D, Dieterich W. Pathogenesis, epidemiology, and clinical manifestations of celiac disease in adults (2013). www.uptodate.com/contents/pathogenesis-epidemiology-and-clinical-manifestations-of-celiac-disease-in-adults. Accessed November 14, 2013.
12. Frustaci A, Cuoco L, Chimenti C, et al. Celiac disease associated with autoimmune myocarditis. Circulation. 2002;105:2611-2618.
13. Thakar S, Chandra P, Hollander G, Lichstein E. Electrocardiographic changes in Takotsubo cardiomyopathy. Pacing Clin Electrophysiol. 2011;34:
1278-1282.
14. Fefer P, Chelvanathan A, Dick A, et al. Takotsubo cardiomyopathy and left ventricular outflow tract obstruction. J Interv Cardiol. 2009;22:444-452.
15. Stensaeth KH, Fossum E, Hoffmann P, et al. Takotsubo cardiomyopathy in acute coronary syndrome; clinical features and contribution of cardiac magnetic resonance during the acute and convalescent phase. Scand Cardiovasc J. 2011;45:77-85.
16. Omerovic E. How to think about stress-induced cardiomyopathy?—Think “out of the box”! Scand Cardiovasc J. 2011;45:67-71.
17. McKenna WJ. Cardiac sarcoidosis (2013). www.uptodate.com/contents/cardiac-sarcoidosis. Accessed November 14, 2013.
18. King TE Jr. Clinical manifestations and diagnosis of sarcoidosis (2013). www.uptodate.com/contents/clinical-manifestations-and-diagnosis-of-sarcoidosis. Accessed November 14, 2013.
19. Bussinguer M, Danielian A, Sharma O. Cardiac sarcoidosis: diagnosis and management. Curr Treat Options Cardiovasc Med. 2012;14:652-664.
20. Cooper LT Jr, Berry GJ, Shabetai R; Multicenter Giant Cell Myocarditis Study Group Investigators. Idiopathic giant-cell myocarditis—natural history and treatment. N Engl J Med. 1997;336(26):1860-1866.
21. Kandolin R, Lehtonen J, Salmenkivi K, et al. Diagnosis, treatment, and outcome of giant-cell myocarditis in the era of combined immunosuppression. Circ Heart Fail. 2013;6:15-22.
22. Htwe TH, Khardori NM. Cardiac emergencies: infective endocarditis, pericarditis, and myocarditis. Med Clin North Am. 2012;96:1149-1169.
23. Kindermann I, Barth C, Mahfoud F, et al. Update on myocarditis. J Am Coll Cardiol. 2012;59:779-792.
A 55-year-old white man with controlled hypertension and hypercholesterolemia awoke with mild chest discomfort that he believed was mild gastroesophageal reflux. He denied radiation of pain to the shoulders, arms, back, or neck; dyspnea; palpitations; diaphoresis; nausea/vomiting; cough; or fever, during the first 30 hours of discomfort. There was no change in discomfort with deep breath, palpation of the chest, or administration of antacids. Minimal, short-lived improvement was noted with belching.
The patient had no trouble sleeping in the prone position and did not notice an increase in discomfort or unusual difficulty during his daily vigorous 30-minute aerobic workout. In fact, his symptoms seemed to improve or disappear during exercise. The patient denied any recent illness or exposure to sick people, had not traveled outside the United States, and had not been exposed to radiation of the chest wall. At the end of the second day of discomfort, the patient noted irregular palpitations with mild shortness of breath and was transported to the hospital for evaluation. He denied being a cigarette smoker or illicit drug user.
The patient had no history of MI or diabetes. The patient’s father had an MI in his 80s, and two uncles died suddenly in their 50s of “massive heart attacks.” His mother, who had died of sepsis of uncertain etiology approximately 10 days earlier, also had hypertension and hypercholesterolemia but no history of coronary artery disease (CAD). Both of the patient’s adult daughters had been diagnosed with celiac disease in the preceding three years. His elder daughter had also been diagnosed with type 1 diabetes within the past two years.
On examination, the patient was afebrile, with a blood pressure of 143/87 mm Hg; pulse, 53 beats/min; and respiratory rate, 17 breaths/min. The patient’s weight was 204 lb and his height, 75 in (BMI, 25.5). The patient was in no apparent distress. Head, eyes, ears, nose, and throat were unremarkable. There was no significant jugular venous distention. The carotid pulses were full, and no bruits were appreciated. S1 and S2 sounds were within normal limits. No murmurs or S3 or S4 gallops were appreciated. The chest was clear on auscultation. Results of the abdominal exam were negative, no edema was noted in the extremities, and pulses were symmetrical.
ECG demonstrated subtle ST-segment elevation in leads I and aVL with a prominent R wave in lead V1. This pattern was interpreted as consistent with an acute inferolateral MI. A baseline ECG, previously obtained by the patient’s internist, had been interpreted as normal.
Peak troponin level was 55 ng/mL (normal, < 0.03 ng/mL); total creatine kinase (CK), 807 U/L (reference range, 20 to 259 U/L); and mass CK-MB fraction, 44 ng/mL (0.1 to 6.6 ng/mL). Total cholesterol was 105 mg/dL, with both LDL- and HDL-cholesterol fractions at 46 mg/dL. A complete blood count without differential revealed a total white blood cell count of 53,000/µL. Hemoglobin and hematocrit were both low (12.3 g/dL and 34.5%, respectively). All indices were within normal limits, as was the platelet count. Glucose, blood urea nitrogen, creatinine, potassium chloride bicarbonate, and calcium were all within normal limits. The sodium level was slightly low (132 mEq/L). Emergency catheterization revealed an ejection fraction of 45% (reference range, 55% to 70%), with mild-to-moderate diffuse hypokinesis but normal coronary arteries.
The patient was diagnosed with myocarditis, likely of viral origin.
DISCUSSION
Although the incidence of myocarditis in the US is difficult to assess, autopsy reports implicate it in 8.6% to 12% of cases of sudden cardiac death in young adults,1,2 and a large prospective series implicated myocarditis in 9% of cases of dilated cardiomyopathy.3 Myocarditis is considered to be at one extreme of a spectrum of perimyocardial processes that result in inflammation of the myocardium (see figure), pericardium, or both.4
The underlying pathology involves an acute injury to the myocyte. This activates the innate and humoral immune systems, resulting in severe inflammation. The immune reaction eventually subsides, and the myocardium recovers. In certain patients, however, myocardial inflammation persists, resulting in ongoing myocyte damage, relentless symptomatic heart failure, or even death.5
Although a variety of diagnostic criteria have been developed and employed, the diagnosis of myocarditis is often one of exclusion. First proposed in 1986, the Dallas criteria—a histopathologic classification for myocarditis diagnosis—are based on endomyocardial biopsy, with inflammatory cellular infiltrate (with or without associated myocyte necrosis) visible on conventionally stained myocardial tissue sections.5 However, this method poses significant practical limitations, including low sensitivity (43% to 64%) and complication and death rates of 6% and 0.4%, respectively.5,6
An empiric diagnosis of myocarditis is often based on a combination of clinical findings including altered ECG, increase in myocardial enzymes, and lack of significant CAD.6 The recommended diagnostic cardiac magnetic resonance (CMR) imaging criteria for clinically suspected myocardial inflammation (ie, the Lake Louise Criteria) include at least two of the following:7
• Regional or global myocardial signal intensity increase in T2-weighted images.
• Increased global myocardial early gadolinium enhancement ratio between myocardium and skeletal muscle in gadolinium-enhanced T1-weighted images.
• At least one focal lesion with nonischemic regional distribution in inversion recovery–prepared gadolinium-enhanced T1-weighted images (“late gadolinium enhancement”).
Because of its reported high sensitivity and specificity (100% and 90%, respectively), CMR was used in the case patient to confirm the diagnosis of myocarditis.8 Specifically, CMR with contrast demonstrated normal left ventricular cavity size and mild reduction in overall left ventricular systolic function, with a visually estimated left ventricular ejection fraction of 45% to 50%. Regional hypokinesis of the mid-inferior wall and apical inferior septum was noted. Delayed contrast imaging demonstrated extensive non-CAD scarring and fibrosis, involving the basal anterior wall, basal inferior wall, and basal and midlateral wall in a pattern consistent with acute myocarditis.
Just as there is variability in the specific criteria by which the diagnosis of myocarditis can be made, the array of clinical findings with which it can manifest range from fatigue and other nonspecific symptoms to fulminant congestive heart failure and sudden death.6 Often, but not always, a viral prodrome precedes the onset of “cardiac symptoms” (eg, chest pain, dyspnea, palpitations, or syncope).5 This patient’s multiple risk factors for CAD and a suggestive, albeit atypical, history of chest discomfort, palpitations, and shortness of breath helped to focus the clinicians’ evaluation on the heart.
Potential Causes
Once a diagnosis of myocarditis is rendered, the next challenge is distinguishing its specific source from a plethora of potential etiologies, including infection, toxic exposure, or hypersensitivity/autoimmune reaction. Viral infections (mostly herpes, parvovirus, and cytomegalovirus) are thought to cause most cases of myocarditis in developed countries.5,9
Viral myocarditis results when viruses enter cardiac myocytes and incite a cytotoxic effect with activation of the immune response, including expression of interferon , natural killer cells, and release of nitric oxide. The majority of patients recover, but some develop an adaptive immune response, which further causes cardiac damage. In this response, antibodies to viral and to some cardiac proteins are produced, and effector T lymphocytes proliferate. Viral genome or inflammatory mechanisms may persist, contributing to ventricular dysfunction leading to heart failure and arrhythmias.10
Celiac disease is a chronic gastroenterologic disease caused by an immune response to a gluten protein. Damage to the brush border of the small intestine results in an inability to absorb fat, protein, vitamins, and minerals. Intermittent diarrhea, abdominal pain, and bloating are most commonly reported, but celiac disease may also manifest less obviously with iron deficiency anemia, joint pain, muscle cramps, osteoporosis, and neuropathy.11 Iron deficiency anemia that is refractory to iron replacement may offer insight into diagnosing myocarditis due to celiac disease.12 Although studies have found that more than 4% of patients with myocarditis also had celiac disease, none had the classic GI symptoms of celiac disease.12
Takotsubo cardiomyopathy is a transient left ventricular apical ballooning syndrome of unknown etiology. (For more information, see Fasolino T. Takotsubo cardiomyopathy: a clinical overview). Patients who have experienced emotional or physiologic stress and postmenopausal women appear to be at greatest risk. The clinical symptoms mimic MI, including chest pain with ST-segment elevation in the precordial leads on ECG13 and minor elevation of the cardiac enzyme and biomarker levels.14 However, patients experiencing this stress cardiomyopathy lack evidence of atherosclerotic CAD.15 An echocardiogram or CMR imaging reveals characteristic wall motion hypokinesis, akinesis, or dyskinesis of the left ventricular apex and mid-ventricle that help to differentiate it from other forms of myocarditis.15,16 Patient prognosis is favorable, with 95% of patients experiencing a full recovery; left ventricular dysfunction usually begins to improve in a few weeks.13,14
Sarcoidosis is a systemic disease resulting in noncaseating granulomas in multiple organs.17 Initial presentation typically includes bilateral hilar adenopathy, pulmonary reticular opacities, and/or skin, joint, or eye lesions.18 Patients with cardiac sarcoidosis most commonly present with conduction disturbances and ventricular arrhythmias.17 Although frequently absent, clinical symptoms may include palpitations, syncope, dizziness, or chest pain and clinical heart failure.17,18 It is difficult to distinguish cardiac sarcoidosis from other forms of myocarditis unless signs of systemic sarcoidosis are evident. A patient with suspected cardiac sarcoidosis should have an ECG to detect subclinical conduction abnormalities.17 The patient should wear a Holter monitor for 24 hours to screen for cardiac involvement, and echocardiography should be performed to define cardiac abnormalities.19
Giant-cell myocarditis (GCM) is a rare, rapidly progressive, and frequently fatal myocardial disease. Based on endomyocardial or surgical biopsy, GCM is histologically defined by multinucleated giant cells, a lymphocytic inflammatory infiltrate, and myocyte necrosis. It is often found in association with various immune-related systemic disorders.20 Patients present with heart failure, ventricular arrhythmias, and atrioventricular block that fails to improve with standard therapy.21
Treatment and Management
The typical management of acute myocarditis includes supportive care for left ventricular dysfunction and arrhythmia control.22 Many of the standard heart failure therapies—β-blockers, ACE inhibitors, angiotensin receptor blockers, and aldosterone antagonists—are efficacious; several, at least in animal models, appear to exert anti-inflammatory as well as the standard cardiovascular effects.23
Caution is advised regarding the selection of specific therapies. For example, in one study, metoprolol produced deleterious effects in acute murine Coxsackie virus myocarditis; inflammation, necrosis, and mortality significantly increased in the treatment group, compared with the placebo group.23
Information on the effects of particular therapies for specific etiologies of myocarditis are limited, but some evidence supports immunosuppressive and immune-modulating therapies for chronic, virus-negative inflammatory cardiomyopathy. Immunosuppressive therapy is also beneficial for acute GCM and sarcoidosis.23 For patients with myocarditis associated with celiac disease, a gluten-free diet alone or in combination with immunosuppressive agents can significantly improve clinical outcomes.12
OUTCOME FOR THE CASE PATIENT
Because the patient was already taking a statin and an ACE inhibitor for hypercholesterolemia and hypertension, respectively, as well as one baby aspirin per day, only a β-blocker was added to his discharge medication regimen.
Three months after hospital discharge, the patient underwent repeat CMR imaging. The ejection fraction had markedly improved to the 55%-to-60% range, although extensive midmyocardial-to-epicardial scarring in a multifocal pattern, primarily involving the basilar anterior and anterolateral wall, was still present, as was a small focus of an active (albeit healing) process in the inferior wall. Clinically, the patient was doing reasonably well and was vigorously exercising daily without dizziness, syncope, chest discomfort, or shortness of breath.
However, within several weeks of discharge, the patient reported having one two-hour episode of frequent palpitations at rest. Since that episode, palpitations have occurred infrequently. A 48-hour Holter monitor was ordered to better evaluate the palpitations and showed only rare premature ventricular contractions and isolated premature atrial contractions; no complex ectopy was noted. A follow-up stress echocardiogram was scheduled for 12 months, assuming the patient was free of clinical signs and symptoms of heart failure and arrhythmias at that time.
CONCLUSION
Myocarditis can manifest with a broad spectrum of signs and symptoms that may make its identification difficult, especially if a cardiac source is not initially considered in the differential diagnosis. However, for patients who present with elevated biomarkers and normal coronary artery anatomy, the identification of myocarditis is relatively easy; the difficulty in this circumstance relates to the identification of the specific etiology of the myocarditis.
The long-term prognosis for myocarditis is frequently good and the treatment straightforward, using medications that are modeled after standard heart failure therapy. However, depending on the etiology, specific treatment may be advisable—or required—in order to improve outcomes.
References
1. Fabre A, Sheppard MN. Sudden adult death syndrome and other nonischaemic causes of sudden cardiac death: a UK experience. Heart. 2006;92:316-320.
2. Doolan A, Semsarian C, Langlois N. Causes of sudden cardiac death in young Australians. Med J Aust. 2004;180:110-112.
3. Felker GM, Hu W, Hare JM, Hruban RH, et al. The spectrum of dilated cardiomyopathy: the Johns Hopkins experience with 1,278 patients. Medicine (Baltimore). 1999;78:270-283.
4. Leitman M, Tyomkin V, Peleg E, et al. Left ventricular function in acute inflammatory peri-myocardial diseases—new insights and long-term follow-up. Cardiovasc Ultrasound. 2012;10:42.
5. Blauwet LA, Cooper LT. Myocarditis. Prog Cardiovasc Dis. 2010;52:274-288.
6. Testani JM, Kolansky DM, Litt H, Gerstenfeld EP. Focal myocarditis mimicking acute ST-elevation myocardial infarction: diagnosis using cardiac magnetic resonance imaging. Tex Heart Inst J. 2006;33:256-259.
7. Friedrich MG, Sechtem U, Schulz-Menger J, et al. Cardiovascular magnetic resonance in myocarditis: a JACC white paper. J Am Coll Cardiol. 2009;53: 1475-1487.
8. Olimulder MA, van Es J, Galjee MA. The importance of cardiac MRI as a diagnostic tool in viral myocarditis-induced cardiomyopathy. Neth Heart J. 2009;17:481-486.
9. Mavrogeni S, Bratis K, Markussis V, et al. The diagnostic role of cardiac magnetic resonance imaging in detecting myocardial inflammation in systemic lupus erythematosus. Differentiation from viral myocarditis. Lupus. 2013;22:34-43.
10. Schultz JC, Hilliard AA, Cooper LT, Rihal CS. Diagnosis and treatment of viral myocarditis. Mayo Clin Proc. 2009;84:1001-1009.
11. Schuppan D, Dieterich W. Pathogenesis, epidemiology, and clinical manifestations of celiac disease in adults (2013). www.uptodate.com/contents/pathogenesis-epidemiology-and-clinical-manifestations-of-celiac-disease-in-adults. Accessed November 14, 2013.
12. Frustaci A, Cuoco L, Chimenti C, et al. Celiac disease associated with autoimmune myocarditis. Circulation. 2002;105:2611-2618.
13. Thakar S, Chandra P, Hollander G, Lichstein E. Electrocardiographic changes in Takotsubo cardiomyopathy. Pacing Clin Electrophysiol. 2011;34:
1278-1282.
14. Fefer P, Chelvanathan A, Dick A, et al. Takotsubo cardiomyopathy and left ventricular outflow tract obstruction. J Interv Cardiol. 2009;22:444-452.
15. Stensaeth KH, Fossum E, Hoffmann P, et al. Takotsubo cardiomyopathy in acute coronary syndrome; clinical features and contribution of cardiac magnetic resonance during the acute and convalescent phase. Scand Cardiovasc J. 2011;45:77-85.
16. Omerovic E. How to think about stress-induced cardiomyopathy?—Think “out of the box”! Scand Cardiovasc J. 2011;45:67-71.
17. McKenna WJ. Cardiac sarcoidosis (2013). www.uptodate.com/contents/cardiac-sarcoidosis. Accessed November 14, 2013.
18. King TE Jr. Clinical manifestations and diagnosis of sarcoidosis (2013). www.uptodate.com/contents/clinical-manifestations-and-diagnosis-of-sarcoidosis. Accessed November 14, 2013.
19. Bussinguer M, Danielian A, Sharma O. Cardiac sarcoidosis: diagnosis and management. Curr Treat Options Cardiovasc Med. 2012;14:652-664.
20. Cooper LT Jr, Berry GJ, Shabetai R; Multicenter Giant Cell Myocarditis Study Group Investigators. Idiopathic giant-cell myocarditis—natural history and treatment. N Engl J Med. 1997;336(26):1860-1866.
21. Kandolin R, Lehtonen J, Salmenkivi K, et al. Diagnosis, treatment, and outcome of giant-cell myocarditis in the era of combined immunosuppression. Circ Heart Fail. 2013;6:15-22.
22. Htwe TH, Khardori NM. Cardiac emergencies: infective endocarditis, pericarditis, and myocarditis. Med Clin North Am. 2012;96:1149-1169.
23. Kindermann I, Barth C, Mahfoud F, et al. Update on myocarditis. J Am Coll Cardiol. 2012;59:779-792.
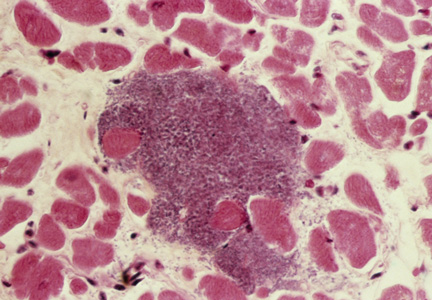
Neck Pain With No Palpable Tenderness
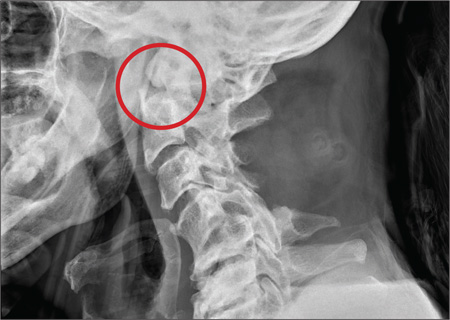
ANSWER
The image shows an acute fracture at the base of the odontoid with evidence of posterior displacement of the fracture fragment. Such fractures are typically unstable.
In addition, there is evidence of a fracture and subluxation at the C4/C5 level. However, given the degree of sclerosis and chronic changes present, this finding is likely an old one.
The patient was maintained in a collar on bedrest. Subsequently, he underwent odontoid pinning to stabilize the fractures.
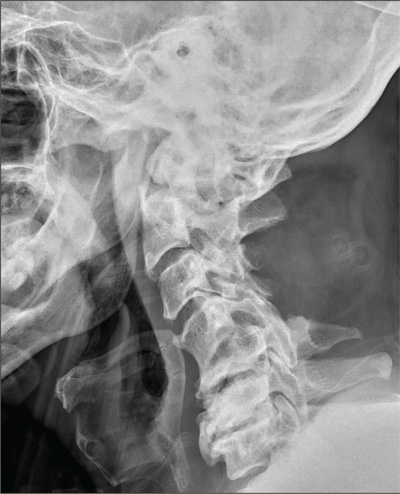
A 65-year-old man presents with neck pain following a fall. Earlier this evening, he says, he fell off his porch (approximately four feet in height) and hit the top/front of his head on the ground. He denies any loss of consciousness, adding that he only came in for evaluation at the urging of his family. The patient denies any extremity weakness or paresthesias. He also denies any significant medical history, although his sister, who has accompanied him, states that he drinks alcohol “regularly and heavily.” Physical examination reveals a man who appears much older than his stated age and is uncomfortable, but not in obvious distress. His vital signs are normal. He is currently wearing a hard cervical collar. There is no palpable tenderness posteriorly along his cervical spine. He is able to move all of his extremities well. His strength is good, and his sensation is intact. A lateral radiograph of the patient’s cervical spine is shown. What is your impression?

Case Studies in ToxicologyNeonatal Seizure: Sepsis or Toxic Syndrome?
Neonatal Seizure: Sepsis or Toxic Syndrome?
A mother presents to the ED with her 4-day-old daughter after noting abnormal jerking movements of the neonate's upper extremities. She states the baby has had watery stools for the past day, but has been tolerating bottle formula feeds without vomiting and having appropriate urinary output. The patient was born full-term via normal spontaneous vaginal delivery, with Apgar scores of 8 at 1 minute and 9 at 5 minutes. The postdelivery course was uncomplicated, and both mother and baby were discharged home 2 days after delivery.
Initial vital signs are: heart rate, 135 beats/min; respiratory rate (RR), 48 breaths/min; and temperature, 98.7°F; blood glucose was normal. On physical examination, the baby is awake and well-appearing, with a nonbulging anterior fontanelle, soft, supple neck, and flexed and symmetrically mobile extremities. Moro, suck, rooting, and grasp reflexes are all intact. No abnormal movements are noted. The remainder of the examination is unremarkable.
Do the jerking movements indicate a focal seizure? What could cause these movements in a neonate?
As the length of the postpartum hospital stay has decreased over the past 20 years, EDs have experienced an increase in neonatal visits for conditions that traditionally manifested in newborn nurseries. While most presentations are for benign reasons (eg, issues related to feeding, irritability), patients with concerning conditions, including central nervous system (CNS) abnormalities, may also initially present to the ED. Causes of such clinical findings may be structural (eg, cerebral malformations, subdural hematomas, herpes encephalitis) and/or metabolic (eg, hypoglycemia, hypocalcemia, inborn errors). Many early-onset neonatal seizures are benign and resolve by several months of age, but it is essential to identify those that are consequential and treatable.
Case Continuation
In the evaluation of the neonatal patient with suspected seizure, it is important to take a detailed maternal and labor history, and to consider a broad differential in the face of nonspecific findings. In this case, the patient's mother disclosed a personal history of chronic pain, for which she took buprenorphine 2 mg orally in the morning and 4 mg orally at bedtime (total daily dose of 6mg/day) throughout her pregnancy.
How does drug withdrawal present in the neonate?
Neonatal abstinence syndrome (NAS) is the clinical syndrome of withdrawal in a newborn exposed in utero to drugs capable of inducing dependence. Agents associated with NAS include opioids, benzodiazepines, ethanol, selective serotonin reuptake inhibitors (SSRIs), mood stabilizers, and nicotine.1,2
Over the past decade, there has been a 330% rise in the diagnosis of opioid-related NAS alone.3 In response to this increase, the US Food and Drug Administration recently added a black-box warning to all extended-release/long-acting opioid preparations detailing this risk.4
Presenting symptoms of NAS are protean, differ from patient to patient, and are a function of drug type, duration, and amount of drug exposure. NAS may mimic other severe life-threatening conditions such as those previously noted, and the inability to obtain an adequate symptom-based medical history from a neonate further complicates the diagnosis. Before making a diagnosis of NAS, other conditions should be carefully considered in the differential.
Take Home Points |
|
Neonatal opioid withdrawal manifests primarily with CNS and gastrointestinal (GI) effects since there are high concentrations of opioid receptors in these areas. Although clinical findings are generally similar among opioid agents, the onset and duration following abstinence varies—largely based on individual drug half-life; this helps to differentiate between opioid agents. For example, while babies exposed to heroin in utero present with signs of NAS within 24 hours of birth, those exposed to buprenorphine or methadone tend to present 2 to 6 days after delivery.1 Between 55% to 94% of neonates with in-utero opioid exposure develop NAS.5
Select Serotonin Reuptake Inhibitors
SSRIs have also been associated with a neonatal syndrome, and largely involve similar signs and symptoms as NAS. Although the specific etiology is not clear, it has been suggested that this syndrome is the result of serotonin toxicity rather than withdrawal; as such, it is often referred to as "serotonin discontinuation syndrome." Clinical findings occur from several hours to several days after birth and usually resolve within 1 to 2 weeks.6
Cocaine Exposure
In-utero cocaine exposure is also associated with neurobehavioral abnormalities in neonates although a withdrawal syndrome is less clearly defined. Findings, however, are consistent with NAS and include increased irritability, tremors, and high-pitched cry—most frequently occurring between 24 and 48 hours postdelivery.6
Neonatal Alcohol Withdrawal Syndrome
Neonatal alcohol withdrawal syndrome, particularly in fetuses exposed to alcohol during the last trimester, is distinct from fetal alcohol syndrome (FAS). The latter is associated with typical dysmorphic features, growth deficiencies, and CNS findings reflective of permanent neurologic sequelae. Neonatal alcohol withdrawal presents with CNS findings similar to those listed for other in-utero exposures—eg, increased irritability, tremors, nystagmus hyperactive reflexes.7
Screening for NAS: The Finnegan Scale
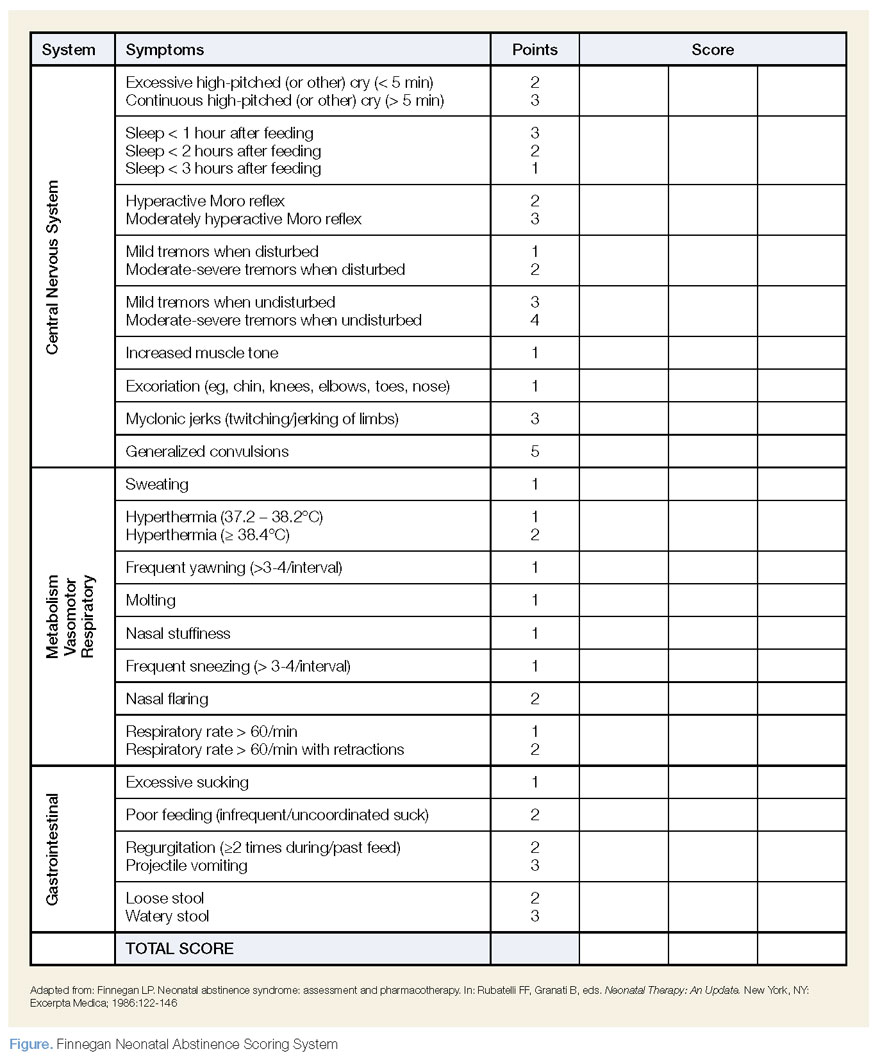
The Finnegan Neonatal Abstinence Scoring System is one of the most commonly employed and validated tools used to screen for NAS. It comprises a 31-item scale, listing the clinical signs and symptoms of NAS, which are scored by severity and organized by system to include neurologic, metabolic, vasomotor, respiratory, and GI disturbances (Figure). Point allocation is based on mild, moderate, or severe symptoms as follows:
- Mild findings (eg, sweating, fever <101°F mottling, nasal stuffiness) each score 1 point.
- Moderate findings (eg, high-pitched cry, hyperactive moro reflex, increased muscle tone, fever >101°F, increased RR >60 with retractions, poor feeding, loose stools) each score 2 points.
- Severe findings (eg, myoclonic jerks, generalized convulsions, projectile vomiting, watery stools) each score 3 points.
While each of the above are independently nonspecific, the constellation of findings, together with the appropriate history, provide for a clinical diagnosis. The Finnegan Scale is therefore designed not only to aid in diagnosis, but also to quantify the severity of NAS and guide management.
Screening for NAS begins at birth in neonates with known in-utero exposure (ie, when risk of NAS is high) or at the time of initial presentation in other circumstances. Scoring is performed every 4 hours; the first two or three scores will determine the need for pharmacotherapy (see Table).
| Table |
Pharmacotherapy is indicated in the following Finnegan scoring scenarios: |
|
|
|
How is NAS treated?
The two main goals of management in the treatment of opioid-related NAS are to relieve the signs and symptoms of withdrawal and to prevent complications (eg, fever, weight loss, seizures). Therapy should begin with nonpharmacologic measures that minimize excess external stimuli, such as swaddling, gentle handling, and minimizing noise and light. To prevent weight loss, small hypercaloric feeds may be helpful. If pharmacologic treatment is indicated, oral opioid replacement with morphine is considered by many to be the drug of choice. Oral morphine dosing may be guided by NAS severity based on the Finnegan score; alternatively, initial dosing at 0.1 mg/kg orally every 4 hours has also been recommended.1
Other agents, such methadone 0.1 mg/kg orally every 12 hours and buprenorphine 15.9 mcg/kg divided in three doses orally, may also be used. In patients whose symptoms persist despite opioid treatment, use of adjuncts such as phenobarbital and clonidine may be indicated.
Case Conclusion
The patient was admitted to the neonatal intensive care unit where she appropriately underwent a sepsis workup. Laboratory evaluation, including blood and urine cultures, was obtained. A brain ultrasound was unremarkable, and since lumbar puncture was unsuccessful, the patient was started empirically on meningitis doses of the cefotaxime, vancomycin, and acyclovir.
An initial Finnegan score was calculated. With the exception of soft stools, there were no other persistent symptoms, and patient did not achieve a score indicating a need for pharmacologic management. After 48 hours, she remained afebrile and soft stools resolved. All laboratory values, including cultures, were unremarkable. The patient was discharged on hospital day 3, with a scheduled well-baby follow-up appointment.
Dr Laskowski is a medical toxicology fellow in the department of emergency medicine at New York University Langone Medical Center. Dr Nelson, editor of "Case Studies in Toxicology," is a professor in the department of emergency medicine and director of the medical toxicology fellowship program at the New York University School of Medicine and the New York City Poison Control Center. He is also associate editor, toxicology, of the EMERGENCY MEDICINE editorial board.
- Cramton RE, Gruchala NE. Babies breaking bad: neonatal and iatrogenic withdrawal syndromes. Curr Opin Pediatr. 2013;25(4): 532-542.
- Kraft WK, Dysart K, Greenspan JS, Gibson E, Kaltenbach K, Ehrlich ME. Revised dose schema of sublingual buprenorphine in the treatment of the neonatal opioid abstinence syndrome. Addiction. 2011;106(3):574-580. http://dx.doi.org/10.1111/j.1360-0443.2010.03170.x Accessed October 24, 2013.
- Patrick SW, Schumacher RE, Benneyworth BD, Krans EE, McAllister JM, Davis MM. Neonatal abstinence syndrome and associated health care expenditures: United States, 2000-2009. JAMA. 2012;307(18):1934-40.
- New safety measures announced for extended-release and long-acting opioids. US Food and Drug Administration Web site. www.fda.gov/Drugs/DrugSafety/InformationbyDrugClass/ucm363722.htm. Accessed October 24, 2013.
- Burgos AE, Burke BL Jr. Neonatal abstinence syndrome. NeoReviews. 2009;10(5):e222-e228. http://dx.doi.org/10.1542/neo.10-5-e222. Accessed October 24, 2013.
- Hudak ML, Tan RC. Committee on Drugs. Committee on Fetus and Newborn. Neonatal drug withdrawal. Pediatrics. 2012;129(2):e540-e560.
- Coles CD, Smith IE, Fernhoff PM, Falek A. Neonatal ethanol withdrawal: Characteristics in clinically normal nondysmorphic neonates. J Pediatr. 1984;105(3):445-451.
A mother presents to the ED with her 4-day-old daughter after noting abnormal jerking movements of the neonate's upper extremities. She states the baby has had watery stools for the past day, but has been tolerating bottle formula feeds without vomiting and having appropriate urinary output. The patient was born full-term via normal spontaneous vaginal delivery, with Apgar scores of 8 at 1 minute and 9 at 5 minutes. The postdelivery course was uncomplicated, and both mother and baby were discharged home 2 days after delivery.
Initial vital signs are: heart rate, 135 beats/min; respiratory rate (RR), 48 breaths/min; and temperature, 98.7°F; blood glucose was normal. On physical examination, the baby is awake and well-appearing, with a nonbulging anterior fontanelle, soft, supple neck, and flexed and symmetrically mobile extremities. Moro, suck, rooting, and grasp reflexes are all intact. No abnormal movements are noted. The remainder of the examination is unremarkable.
Do the jerking movements indicate a focal seizure? What could cause these movements in a neonate?
As the length of the postpartum hospital stay has decreased over the past 20 years, EDs have experienced an increase in neonatal visits for conditions that traditionally manifested in newborn nurseries. While most presentations are for benign reasons (eg, issues related to feeding, irritability), patients with concerning conditions, including central nervous system (CNS) abnormalities, may also initially present to the ED. Causes of such clinical findings may be structural (eg, cerebral malformations, subdural hematomas, herpes encephalitis) and/or metabolic (eg, hypoglycemia, hypocalcemia, inborn errors). Many early-onset neonatal seizures are benign and resolve by several months of age, but it is essential to identify those that are consequential and treatable.
Case Continuation
In the evaluation of the neonatal patient with suspected seizure, it is important to take a detailed maternal and labor history, and to consider a broad differential in the face of nonspecific findings. In this case, the patient's mother disclosed a personal history of chronic pain, for which she took buprenorphine 2 mg orally in the morning and 4 mg orally at bedtime (total daily dose of 6mg/day) throughout her pregnancy.
How does drug withdrawal present in the neonate?
Neonatal abstinence syndrome (NAS) is the clinical syndrome of withdrawal in a newborn exposed in utero to drugs capable of inducing dependence. Agents associated with NAS include opioids, benzodiazepines, ethanol, selective serotonin reuptake inhibitors (SSRIs), mood stabilizers, and nicotine.1,2
Over the past decade, there has been a 330% rise in the diagnosis of opioid-related NAS alone.3 In response to this increase, the US Food and Drug Administration recently added a black-box warning to all extended-release/long-acting opioid preparations detailing this risk.4
Presenting symptoms of NAS are protean, differ from patient to patient, and are a function of drug type, duration, and amount of drug exposure. NAS may mimic other severe life-threatening conditions such as those previously noted, and the inability to obtain an adequate symptom-based medical history from a neonate further complicates the diagnosis. Before making a diagnosis of NAS, other conditions should be carefully considered in the differential.
Take Home Points |
|
Neonatal opioid withdrawal manifests primarily with CNS and gastrointestinal (GI) effects since there are high concentrations of opioid receptors in these areas. Although clinical findings are generally similar among opioid agents, the onset and duration following abstinence varies—largely based on individual drug half-life; this helps to differentiate between opioid agents. For example, while babies exposed to heroin in utero present with signs of NAS within 24 hours of birth, those exposed to buprenorphine or methadone tend to present 2 to 6 days after delivery.1 Between 55% to 94% of neonates with in-utero opioid exposure develop NAS.5
Select Serotonin Reuptake Inhibitors
SSRIs have also been associated with a neonatal syndrome, and largely involve similar signs and symptoms as NAS. Although the specific etiology is not clear, it has been suggested that this syndrome is the result of serotonin toxicity rather than withdrawal; as such, it is often referred to as "serotonin discontinuation syndrome." Clinical findings occur from several hours to several days after birth and usually resolve within 1 to 2 weeks.6
Cocaine Exposure
In-utero cocaine exposure is also associated with neurobehavioral abnormalities in neonates although a withdrawal syndrome is less clearly defined. Findings, however, are consistent with NAS and include increased irritability, tremors, and high-pitched cry—most frequently occurring between 24 and 48 hours postdelivery.6
Neonatal Alcohol Withdrawal Syndrome
Neonatal alcohol withdrawal syndrome, particularly in fetuses exposed to alcohol during the last trimester, is distinct from fetal alcohol syndrome (FAS). The latter is associated with typical dysmorphic features, growth deficiencies, and CNS findings reflective of permanent neurologic sequelae. Neonatal alcohol withdrawal presents with CNS findings similar to those listed for other in-utero exposures—eg, increased irritability, tremors, nystagmus hyperactive reflexes.7
Screening for NAS: The Finnegan Scale
The Finnegan Neonatal Abstinence Scoring System is one of the most commonly employed and validated tools used to screen for NAS. It comprises a 31-item scale, listing the clinical signs and symptoms of NAS, which are scored by severity and organized by system to include neurologic, metabolic, vasomotor, respiratory, and GI disturbances (Figure). Point allocation is based on mild, moderate, or severe symptoms as follows:
- Mild findings (eg, sweating, fever <101°F mottling, nasal stuffiness) each score 1 point.
- Moderate findings (eg, high-pitched cry, hyperactive moro reflex, increased muscle tone, fever >101°F, increased RR >60 with retractions, poor feeding, loose stools) each score 2 points.
- Severe findings (eg, myoclonic jerks, generalized convulsions, projectile vomiting, watery stools) each score 3 points.
While each of the above are independently nonspecific, the constellation of findings, together with the appropriate history, provide for a clinical diagnosis. The Finnegan Scale is therefore designed not only to aid in diagnosis, but also to quantify the severity of NAS and guide management.
Screening for NAS begins at birth in neonates with known in-utero exposure (ie, when risk of NAS is high) or at the time of initial presentation in other circumstances. Scoring is performed every 4 hours; the first two or three scores will determine the need for pharmacotherapy (see Table).
| Table |
Pharmacotherapy is indicated in the following Finnegan scoring scenarios: |
|
|
|
How is NAS treated?
The two main goals of management in the treatment of opioid-related NAS are to relieve the signs and symptoms of withdrawal and to prevent complications (eg, fever, weight loss, seizures). Therapy should begin with nonpharmacologic measures that minimize excess external stimuli, such as swaddling, gentle handling, and minimizing noise and light. To prevent weight loss, small hypercaloric feeds may be helpful. If pharmacologic treatment is indicated, oral opioid replacement with morphine is considered by many to be the drug of choice. Oral morphine dosing may be guided by NAS severity based on the Finnegan score; alternatively, initial dosing at 0.1 mg/kg orally every 4 hours has also been recommended.1
Other agents, such methadone 0.1 mg/kg orally every 12 hours and buprenorphine 15.9 mcg/kg divided in three doses orally, may also be used. In patients whose symptoms persist despite opioid treatment, use of adjuncts such as phenobarbital and clonidine may be indicated.
Case Conclusion
The patient was admitted to the neonatal intensive care unit where she appropriately underwent a sepsis workup. Laboratory evaluation, including blood and urine cultures, was obtained. A brain ultrasound was unremarkable, and since lumbar puncture was unsuccessful, the patient was started empirically on meningitis doses of the cefotaxime, vancomycin, and acyclovir.
An initial Finnegan score was calculated. With the exception of soft stools, there were no other persistent symptoms, and patient did not achieve a score indicating a need for pharmacologic management. After 48 hours, she remained afebrile and soft stools resolved. All laboratory values, including cultures, were unremarkable. The patient was discharged on hospital day 3, with a scheduled well-baby follow-up appointment.
Dr Laskowski is a medical toxicology fellow in the department of emergency medicine at New York University Langone Medical Center. Dr Nelson, editor of "Case Studies in Toxicology," is a professor in the department of emergency medicine and director of the medical toxicology fellowship program at the New York University School of Medicine and the New York City Poison Control Center. He is also associate editor, toxicology, of the EMERGENCY MEDICINE editorial board.
- Cramton RE, Gruchala NE. Babies breaking bad: neonatal and iatrogenic withdrawal syndromes. Curr Opin Pediatr. 2013;25(4): 532-542.
- Kraft WK, Dysart K, Greenspan JS, Gibson E, Kaltenbach K, Ehrlich ME. Revised dose schema of sublingual buprenorphine in the treatment of the neonatal opioid abstinence syndrome. Addiction. 2011;106(3):574-580. http://dx.doi.org/10.1111/j.1360-0443.2010.03170.x Accessed October 24, 2013.
- Patrick SW, Schumacher RE, Benneyworth BD, Krans EE, McAllister JM, Davis MM. Neonatal abstinence syndrome and associated health care expenditures: United States, 2000-2009. JAMA. 2012;307(18):1934-40.
- New safety measures announced for extended-release and long-acting opioids. US Food and Drug Administration Web site. www.fda.gov/Drugs/DrugSafety/InformationbyDrugClass/ucm363722.htm. Accessed October 24, 2013.
- Burgos AE, Burke BL Jr. Neonatal abstinence syndrome. NeoReviews. 2009;10(5):e222-e228. http://dx.doi.org/10.1542/neo.10-5-e222. Accessed October 24, 2013.
- Hudak ML, Tan RC. Committee on Drugs. Committee on Fetus and Newborn. Neonatal drug withdrawal. Pediatrics. 2012;129(2):e540-e560.
- Coles CD, Smith IE, Fernhoff PM, Falek A. Neonatal ethanol withdrawal: Characteristics in clinically normal nondysmorphic neonates. J Pediatr. 1984;105(3):445-451.
Neonatal Seizure: Sepsis or Toxic Syndrome?
Neonatal Seizure: Sepsis or Toxic Syndrome?