User login
Sudden hypoxia during knee surgery
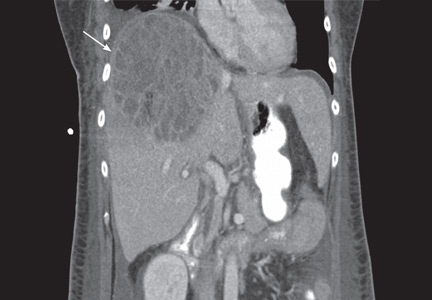
A 75-year-old man with type 2 diabetes and hypothyroidism underwent bilateral total knee replacement at our hospital.
His functional capacity had been moderately limited by knee pain, but he could easily climb one flight of stairs without symptoms. His medications at that time included levothyroxine (Synthroid) and metformin (Glucophage). He had no known cardiac or pulmonary disease. The preoperative evaluation, including laboratory tests and electrocardiography, was within normal limits.
Spinal anesthesia was used for surgery, and he was given 2 mg of midazolam (Versed) intravenously for sedation. No additional sedation was given. He was given oxygen via nasal cannula at 2 L/min.
All vital signs were stable at the start of the procedure. However, about halfway through, when the thigh tourniquet was released, his oxygen saturation dropped abruptly from 100% to 92%. All other vital signs remained stable, and he was asymptomatic, was oriented to person, time, and place, was conversing freely, and was in no distress. The oxygen flow was increased to 6 L/min, his oxygen saturation improved, and the procedure was then completed as planned.
At the conclusion of the surgery, before the patient was transported to the postanesthesia care unit (PACU) and while his oxygen flow rate was still 6 L/min, his oxygen saturation again dropped to 92%. A simple face mask was placed, and the oxygen flow rate was increased to 10 L/min. His oxygen saturation stayed low, near 90%.
Bleeding during surgery had been nominal. He had received 2 L of lactated Ringer’s solution and 500 mL of hetastarch (Hextend) during surgery. He continued to be asymptomatic in the PACU.
1. What is the most likely cause of oxygen desaturation during bilateral total knee arthroplasty?
- Fat embolism
- Intraoperative pneumonia
- Venous thromboembolism with pulmonary embolism
- Acute myocardial infarction
- Acute pulmonary edema
- Excessive sedation
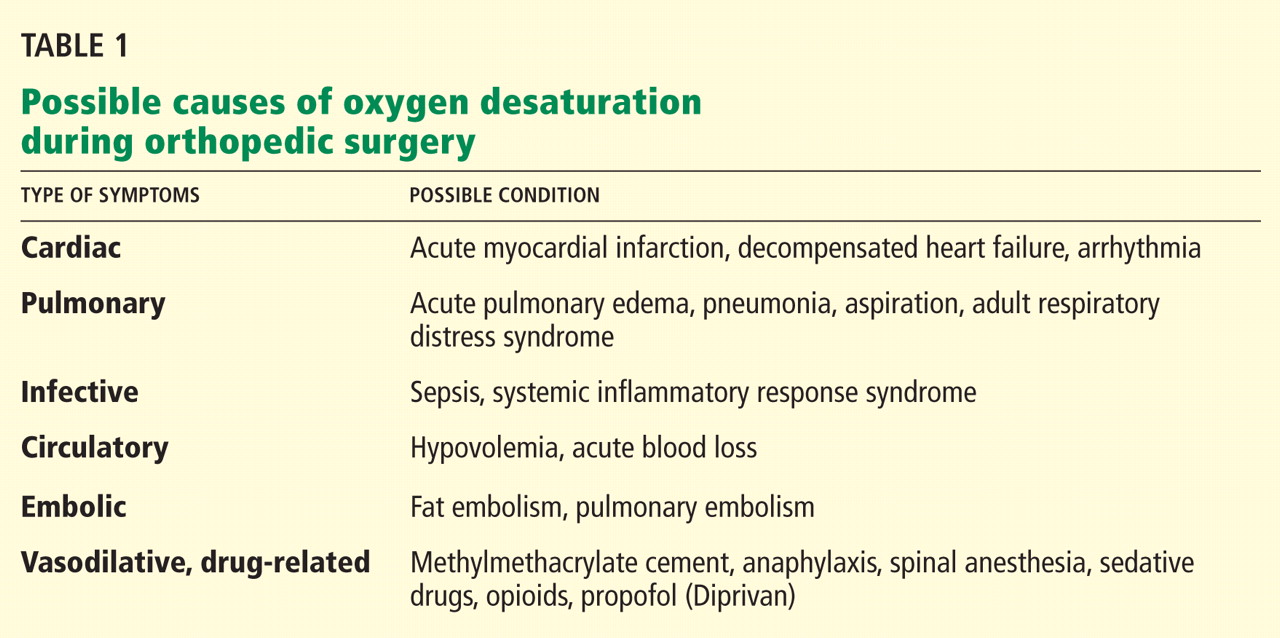
The differential diagnosis of oxygen desaturation during orthopedic procedures is listed in Table 1.
Fat embolism is the most likely cause, particularly given the greater fatty embolic load that occurs with bilateral total knee arthroplasty than with unilateral total knee arthroplasty.
At what point the maximal showering of fat emboli occurs is not known. Fat may be released into the circulation with pressurization of the medullary canal during surgery or with manipulation of a fracture. The emboli may collect in the leg veins and then be released in a shower when the thigh tourniquet is released. Vasoactive mediators and methylmethacrylate cement released into the circulatory system after tourniquet deflation may also cause vasodilation, hypotension, and increased dead-space ventilation, resulting in hypoxia and a drop in end-tidal CO2.
Pneumonia during surgery is rare without an apparent aspiration event.
Venous thromboembolism is possible but is more likely later in the postoperative period after major orthopedic surgery.
Acute myocardial infarction could present with hypoxia, particularly in a diabetic patient, who may not experience chest pain. However, intraoperative electrocardiographic changes would likely be seen. If myocardial infarction is suspected, postoperative serial electrocardiograms and measuring troponin and cardiac enzyme levels aid in the diagnosis.
Acute pulmonary edema is possible but not as highly suspected, as the patient had no history of congestive heart failure and received an appropriate amount of fluid for this type of surgery.
Excessive sedation could cause hypoventilation and, thus, oxygen desaturatation. However, this patient’s oxygen desaturatation began more than an hour after the midazolam was given. Midazolam is a short-acting benzodiazepine. It is unlikely that the patient would show signs of hypoventilation and oversedation an hour after the drug was given. Our patient also did not show any signs of excessive sedation, as he was awake and conversing during the surgery.
Fat emboli vs fat embolism syndrome
Fat embolism is the presence of fat drops within the systemic and pulmonary microcirculation, with or without clinical sequelae.1 Fat embolism syndrome, on the other hand, is defined as injury to and dysfunction of one or more organs as a result of the embolization of fat, usually within 24 hours of injury or orthopedic surgery.2
Fat embolism syndrome is an unpredictable condition with a varied presentation. Fat droplets are thought to embolize via the venous circulation into the pulmonary arteries, occluding small blood vessels in the lung. However, they also get into the arterial circulation and occlude arteries in the brain, kidney, heart, and liver (more on this phenomenon below).
Fat embolism is reported to originate primarily from fractures of the femur, tibia, and pelvis.2,3 As many as 90% of trauma patients have been shown to have evidence of fat embolism on autopsy.4 However, only a small number of patients develop the classic fat embolism syndrome,2,3,5 Why some develop the syndrome and others do not is still unknown.
Orthopedic procedures associated with fat embolization include knee arthroplasty and hip arthroplasty, particularly if it involves intramedullary manipulation or medullary fixation.6 It has also been reported during spinal procedures in which pedicular screws are used.7 The syndrome occurs in 0.25% to 30% of patients following multiple fractures and in 0.1% to 12% of patients during or following knee or hip arthroplasty.
One study8 showed evidence of fat on transesophageal echocardiography in 88% of patients undergoing medullary reaming of lower-extremity fractures and hip hemiarthroplasty. Blood sampling from the right atrium confirmed that fat was responsible for the echocardiographic abnormalities. The study also showed that the severity of the embolic showering correlated with the severity of hypoxia and the decrease in end-tidal CO2.8
CASE CONTINUED
On arrival at the PACU, our patient’s oxygen saturation was 94% while he was breathing oxygen via a simple face mask at a flow rate of 10 L/min. His heart rate was 60 bpm, blood pressure 110/60 mm Hg, and temperature 37.5°C (96.3°F). Chest sounds were normal on auscultation.
However, 3 hours later, his mental status rapidly deteriorated. He was oriented only to person, and he was drowsy. He had escalating respiratory distress with a rapid respiratory rate and decreasing oxygen saturation. At this point, auscultation of his chest wall revealed bilateral crackles and rales.
He was promptly intubated. Profuse fluid and secretions were noted to be coming from his lungs, filling the endotracheal tube. Arterial blood gas measurement showed a pH of 7.22, Pao2 64 mm Hg, and Paco2 56 mm Hg on 100% fraction of inspired oxygen, with no increased anion gap.
2. Which consequence of fat embolism is most likely at this time in this patient?
- Coexisting sepsis
- Fat embolism syndrome
- Acute cardioembolic stroke
- Anaphylaxis
Fat embolism syndrome should be highly suspected in this patient. As mentioned, it can affect many different organs. It is the most serious condition resulting from fat embolization after surgery or trauma.
Sepsis was unlikely in our patient, since he presented for his surgery in good health and with no preexisting signs or symptoms of infection. Acute cardioembolic stroke could have caused the neurologic signs, but this would not necessarily explain the coexisting hypoxia. An anaphylactic reaction to drugs or surgical cement would most likely present intraoperatively, shortly after exposure occurred, rather than several hours after surgery.
How common is fat embolism syndrome?
The occurrence rate of fat embolism syndrome has been reported to be 0.25% to 30% after multiple fractures and 0.1% to 12% after knee and hip joint surgery, with a mortality rate of 13% to 36%.2,9–14 The rate of occurrence after unilateral total knee joint replacement has been reported to be 1.8% to 5%, and 4% to 12% after bilateral total knee replacement.15–19
The syndrome is relatively more common with traumatic fractures of the lower extremities. However, it has also been reported with liposuction, total parenteral nutrition, bone marrow harvest and transplantation, burns, and acute pancreatitis, to mention a few.10
The broad range of reported incidence rates can be attributed to the fact that many studies were in patients with multiple trauma, whose concomitant injuries may have made it difficult to clearly define the contribution of fat embolism syndrome to the overall rates of morbidity and mortality. Also, different studies used different criteria to define the syndrome.
How does fat embolism syndrome occur?
Two hypotheses for how this syndrome occurs were proposed nearly a century ago.20,21
The “mechanical” theory is that fat emboli are formed as a result of trauma and disruption of adipose tissue and other cells in the bone marrow. Increases in intramedullary pressure force the fat emboli through damaged medullary venous channels in the bone and into the circulation of the lower extremities. This embolization of fat causes an initial mechanical pulmonary obstruction. Mechanical obstruction by fat emboli in the pulmonary system leads to increased pulmonary pressures and an increase in right heart outflow pressure. The right heart becomes strained, leading to a decreased right-sided cardiac output. As a result, the left heart filling pressures diminish and hypotension ensues.20
The “biochemical” theory, on the other hand, is that chylomicrons within the vascular system are modified and their stability is compromised as a result of stress. These traumatized chylomicrons then coalesce to form droplets of fat that accumulate in the pulmonary circulation and produce a mechanical obstruction. This would explain why nontraumatic, nonorthopedic insults can produce this syndrome.
Autopsy studies show that there is little correlation between the presence and quantity of intravascular fat and the severity of clinical symptoms, thus implying that the syndrome is caused by more than just mechanical obstruction. The biochemical theory postulates that fat globules within the circulatory system then cause the release of lipase from the pulmonary alveolar cells, which then hydrolyses the fat into free fatty acids. These free fatty acids cause an inflammatory reaction, complementmediated leukocyte aggregation, chemotoxin release, and subsequently endothelial damage. These vasoactive substances damage type 2 pneumocytes and lead to an increased permeability of the pulmonary capillary beds. Acute respiratory distress syndrome (ARDS) may ensue. Disseminated intravascular coagulation may occur as a result of the formation of microthrombi involving lipids, platelets, and fibrin.21,22
Embolization of fat to the central nervous system can occur as fat globules cross into the systemic circulation via a patent foramen ovale, an atrioventricular shunt, or the pulmonary capillaries. This can then result in cerebral ischemia.23
Although patent foramen ovale may seem the most direct route for cerebral embolization, the neurologic impairment and signs of cerebral emboli in fat embolism syndrome may occur in the absence of patent foramen ovale.24,25 The fat globules may actually go through the lung capillaries, being flexible and forced through by increased pulmonary pressure.
But whether the cause of fat embolism syndrome is occlusion by globules, the release of biochemical mediators, or a combination of both is unknown. Both mechanisms are likely responsible. We can only suspect that the degree of fat load and intrinsic metabolic differences between individuals account for the variation in susceptibility.
FAT EMBOLI AFFECT THE LUNGS, SKIN, AND BRAIN
3. Where on the body is the rash associated with fat embolism syndrome usually seen?
- Face
- Near a site of fracture or surgery
- Chest, axilla, conjunctiva
- Distal extremities
Petechiae are part of the classic presenting triad of fat embolism syndrome, which also includes pulmonary and cerebral dysfunction.
Petechiae usually appear on the 2nd to 4th day after injury.26 They are usually found across the chest, the anterior axillary folds, and the neck, as well as on the oral mucosa and the conjunctiva. The rash is caused by occlusion of dermal capillaries by fat, which increases their fragility.10
Pulmonary changes usually begin with tachypnea, dyspnea, and a drop in oxygen saturation, leading to generalized hypoxia. Respiratory symptoms are present in 100% of cases.2 Respiratory symptoms can acutely develop with the sudden manipulation of a fracture, reaming of bone, or release of a limb tourniquet.27
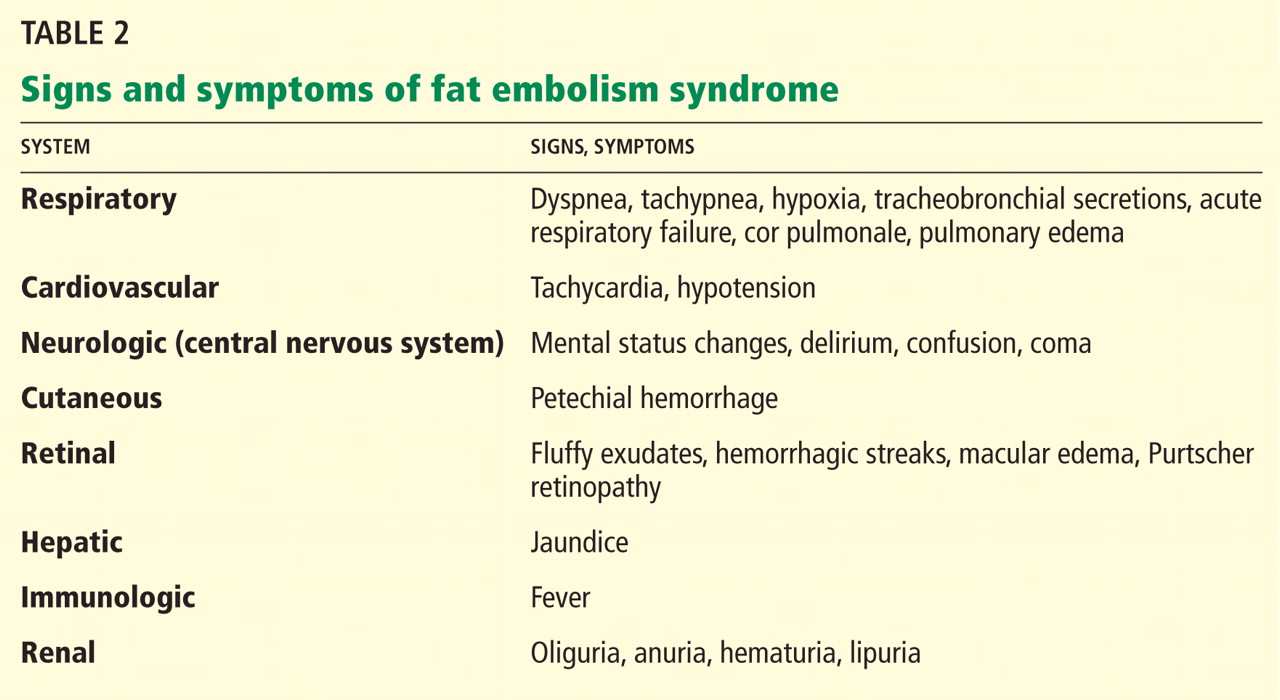
Body systems affected by fat embolism syndrome are summarized in Table 2.
4. How many hours after injury does fat embolism syndrome typically manifest?
- 1 to 2 hours
- 6 to 12 hours
- 12 to 20 hours
- 24 to 48 hours
- 72 to 84 hours
Most patients develop signs and symptoms 24 to 48 hours after injury. Patients presenting earlier than 12 hours usually have a more fulminant course.29
The time between fat embolization and the development of fat embolism syndrome is thought to be related to the time required for the metabolic conversion of fat to free fatty acids.30 We suspect that the early desaturation seen in our patient was the result of a heavy showering of fat intraoperatively. However, this could only be concluded after we had ruled out other causes of acute hypoxia and hypotension.
Fat embolism syndrome is a diagnosis of exclusion and is based on clinical criteria. No specific sign, symptom, or test is pathognomonic. It may often be confused with other conditions such as systemic inflammatory response syndrome or sepsis. However, the triad of respiratory and neurologic symptoms and petechiae coupled with the clinical picture of recent trauma or orthopedic surgery almost assures the diagnosis.
Fat embolism syndrome can range from subclinical to fulminating, with the more fulminating course attributable to a huge load of fat emboli, which leads to acute cor pulmonale.
Regardless of the criteria used, one must have a high index of suspicion for fat embolization syndrome in patients undergoing orthopedic procedures, particularly hip and knee surgery, and in patients with fractures, especially fractures of the femur, tibia, or pelvis and multiple, concomitant fractures.
CASE CONTINUED
Our patient was given furosemide (Lasix) empirically for diuresis and to improve oxygenation. However, his oxygen saturation remained low.
Chest radiography 4 hours after surgery showed bilateral pulmonary infiltrates. Serial electrocardiography showed no acute changes. Levels of cardiac enzymes and troponins were normal. Transthoracic echocardiography showed no left ventricular dysfunction, a normal right ventricle, and no evidence of valvular lesions. Urine and blood fat stains were negative, but the sputum stain was positive for copious extracellular fat. The patient became comatose 5 hours postoperatively. Computed tomography of the brain was normal. He was transferred to the surgical intensive care unit.
The clinical course was marked by hemodynamic instability requiring norepinephrine (Levophed) and vasopressin (Pitressin) for hypotension. Right ventricular filling pressures via central venous pressure monitoring showed no evidence of hypovolemia. The hemoglobin concentration and the hematocrit were stable, with no evidence of acute or ongoing bleeding. Blood, urine, and sputum cultures remained negative. Acute myocardial infarction was ruled out by serial electrocardiography, cardiac enzyme testing, and troponin testing.
Magnetic resonance imaging (MRI) of the brain on postoperative day 2 showed foci of acute ischemia suggestive of embolic phenomena consistent with fat embolism syndrome (Figure 1). Transthoracic echocardiography was repeated but again showed no evidence of a patent foramen ovale. Electroencephalography on postoperative day 4 showed severe, diffuse encephalopathy. There was no petechial skin rash. Other laboratory studies showed progressive thrombocytopenia with a platelet count of 53 × 199/L on postoperative day 3.
TESTS THAT AID THE CLINICAL DIAGNOSIS
Although no single laboratory test is pathognomonic for fat embolism syndrome, several tests may help raise suspicion of it, especially in the setting of fracture or an orthopedic surgical procedure.
Arterial blood gases must be measured. A Pao2 of less than 60 mm Hg with no other obvious lung pathology in an orthopedic surgery patient is highly suspicious.12 An alveolar-arterial gradient of greater than 100 mm Hg may further increase suspicion.
Tests for fat. The blood and urine may be examined for fat, although positive findings are not specific for fat embolism syndrome.33 Fat in the urine indicates the occurrence of massive fat embolism, but this is not always accompanied by the syndrome.34 Gurd and Wilson13 found fat globules larger than 8 μm circulating in the serum in all documented cases. They stated that, even though the relationship of large fat globules to the pathogenesis of the clinical picture remains obscure, the demonstration of their presence can be helpful in the diagnosis.13
Also, samples obtained with bronchoalveolar lavage may be examined for fat. The macrophages may be stained for fat using the oil red O stain. Again, this is a nonspecific marker, as fat-stained macrophages are seen in trauma patients,35 but the finding has a very high negative predictive value.36 Anemia, thrombocytopenia, hypofibrinogenemia, an elevated lipase level, and a high erythrocyte sedimentation rate may be found in fat embolism syndrome.13
Chest radiography may show bilateral infiltrates, as in ARDS, but this is not diagnostic for fat embolism syndrome.
Electrocardiography may show changes in ST and T waves and signs of right heart strain.
Transesophageal echocardiography may show increased right heart and pulmonary artery pressures.
Computed tomography is often negative,37,38 but T2-weighted MRI is useful in the diagnosis of cerebral fat embolism syndrome, as it can show intracerebral microinfarcts as early as 4 hours after the onset of neurologic symptoms, and these findings correlate well with the clinical severity of brain injury.
Diffusion-weighted MRI may enhance the sensitivity and specificity of the neuroradiologic diagnosis. Diffusion-weighted MRI typically shows multiple nonconfluent areas of high-intensity signals or bright spots on a dark background, known as a “starfield pattern.” This pattern has been suggested to be pathognomonic of acute cerebral microinfarction. The abnormalities presumably reflect foci of cytotoxic edema that develops immediately, unlike vasogenic edema, seen in T2-weighted images, which may take up to several days to develop. Although these images are not necessarily specific for fat emboli, they are useful in helping make the diagnosis. Thus, diffusionweighted MRI should be done if fat embolism syndrome is suspected.38,39
CASE CONCLUDED
The patient’s course in the intensive care unit was further complicated by gastrointestinal bleeding and renal failure. His neurologic status did not improve. Repeated MRI of the brain showed evolving bilateral watershed infarction throughout the cortices. The neurologic consult service diagnosed the patient as having severe encephalopathy with a very poor prognosis. The decision was made to withdraw care. He was placed under palliative care and died on postoperative day 22.
DRUG TREATMENT OF FAT EMBOLISM SYNDROME
5. Which of the following drugs has been proven to be effective in treating fat embolism syndrome?
- Intravenous ethanol
- Steroids
- Heparin
- Dextran
- Aspirin
- None of the above
None of the above has been proven to be effective in treating this disorder. The management is largely supportive. Thus, prevention, early diagnosis, and symptom management are vital.
Pulmonary and hemodynamic support are the cornerstones of successful treatment. Aggressive respiratory support is often needed. Management of acute lung injury and ARDS focuses on achieving acceptable gas exchange while preventing ventilator-associated lung injury. Intravascular volume must be supported. Inotropes and pulmonary vasodilators may be required to maintain hemodynamics. Exacerbation of central nervous system ischemia from hypotension or hypoxia should be avoided.
If the thrombocytopenia leads to clinical bleeding, platelet transfusions may be warranted.
Supportive care should include prophylaxis of deep venous thrombosis and of gastrointestinal bleeding, and maintenance of nutrition.40 Patients who receive supportive care generally have a favorable outcome, with a mortality rate of less than 10%.28
Drug studies have been inconclusive
Drugs suggested in the treatment of fat embolism syndrome include heparin, aspirin, dextran, hypertonic glucose, and alcohol, but the results have been inconclusive.3,11,23,40–43
Heparin stimulates lipase activity, consequently decreasing the concentration of circulating fat globules. However, the increase in levels of free fatty acids may actually worsen the clinical picture. For this reason, and because of anticoagulation concerns and evidence of increased mortality rates, heparin is now contraindicated in the treatment of fat embolism syndrome.2,41,43
Alcohol. Patients with a higher blood alcohol level at the time of injury have been reported to have a lower incidence of fat embolism syndrome. Alcohol inhibits lipase, suppressing the rise of free fatty acids. In experimental studies, the incidence of fat embolism syndrome was lower when the blood alcohol level was maintained at 20 mg/dL. However, no prospective randomized trial has been done to determine the clinical efficacy of ethanol as a treatment for this condition.5,42
Dextran has been advocated, owing to its ability to improve small-vessel perfusion, but bleeding risk and acute renal failure associated with this drug have limited its use.5
N-acetylcysteine has been shown to attenuate fat-induced lung injury in a study of rats with induced fat embolism syndrome.44
Corticosteroid treatment for this condition is controversial. Studies in patients with femoral and tibial fractures show that steroids reduce the incidence of fat embolism syndrome when given prophylactically, and those treated with steroids had a higher Pao2 than controls. Doses of methylprednisolone in these studies ranged between 9 mg/kg to 90 mg/kg. A drawback of these studies is their small number of patients.12,32,45,46
A meta-analysis47 of randomized trials of corticosteroids to prevent fat embolism syndrome in patients with long-bone fractures identified 104 such studies. Only 7 of the 104 were considered adequate. In 389 patients with long-bone fractures, prophylactic corticosteroids reduced the risk of fat embolism syndrome by 78% (95% confidence interval 43%–92%) and corticosteroids also significantly reduced the risk of hypoxia with no difference in rates of infection or death. However, the overall quality of the trials was poor, and the authors of the meta-analysis concluded that more study is needed before corticosteroids could be formally recommended.47
There is no evidence that steroids improve the overall clinical course of already established fat embolism syndrome.12,32,45 The dosing and optimal timing of administration have also not been established. High doses pose a risk of septic complications, which may be devastating for the posttrauma or postoperative patient.
- Akhtar S. Fat embolism. Anesthesiol Clin 2009; 27:533–550.
- Filomeno LT, Carelli CR, Silva NC, Filho TE, Amatuzzi MM. Fat embolism: a review for current orthopaedics practice. Acta Ortop Bras 2005; 13:196–208.
- ten Duis HJ. The fat embolism syndrome. Injury 1997; 28:77–85.
- Peltier LF. Fat embolism. A current concept. Clin Orthop Relat Res 1969; 66:241–253.
- Gossling HR, Pellegrini VD. Fat embolism syndrome: a review of the pathophysiology and physiological basis of treatment. Clin Orthop Relat Res 1982; 165:68–82.
- Papagelopoulos PJ, Apostolou CD, Karachalios TS, Themistocleous GS, Giannakopoulos CK, Ioannidis TT. Pulmonary fat embolism after total hip and total knee arthroplasty. Orthopedics 2003; 26:523–527.
- Takahashi S, Kitagawa H, Ishii T. Intraoperative pulmonary embolism during spinal instrumentation surgery. A prospective study using transoesophageal echocardiography. J Bone Joint Surg Br 2003; 85:90–94.
- Christie J, Robinson CM, Pell AC, McBirnie J, Burnett R. Transcardiac echocardiography during invasive intramedullary procedures. J Bone Joint Surg Br 1995; 77:450–455.
- Robert JH, Hoffmeyer P, Broquet PE, Cerutti P, Vasey H. Fat embolism syndrome. Orthop Rev 1993; 22:567–571.
- Mellor A, Soni N. Fat embolism. Anaesthesia 2001; 56:145–154.
- Taviloglu K, Yanar H. Fat embolism syndrome. Surg Today 2007; 37:5–8.
- Lindeque BG, Schoeman HS, Dommisse GF, Boeyens MC, Vlok AL. Fat embolism and the fat embolism syndrome. A double-blind therapeutic study. J Bone Joint Surg Br 1987; 69:128–131.
- Gurd AR, Wilson RI. The fat embolism syndrome. J Bone Joint Surg Br 1974; 56B:408–416.
- Ganong RB. Fat emboli syndrome in isolated fractures of the tibia and femur. Clin Orthop Relat Res 1993; 291:208–214.
- Djelouah I, Lefèvre G, Ozier Y, Rosencher N, Tallet F. Fat embolism in orthopedic surgery: role of bone marrow fatty acid. Anesth Analg 1997; 85:441–443.
- Barre J, Lepouse C, Segal P. Embolism and intramedullary femoral surgery. Rev Chir Orthop Reparatrice Appar Mot 1997; 83:9–21.
- Kim YH. Incidence of fat embolism syndrome after cemented or cementless bilateral simultaneous and unilateral total knee arthroplasty. J Arthroplasty 2001; 16:730–739.
- Dorr LD, Merkel C, Mellman MF, Klein I. Fat emboli in bilateral total knee arthroplasty. Predictive factors for neurologic manifestations. Clin Orthop Relat Res 1989; 248:112–118.
- Jankiewicz JJ, Sculco TP, Ranawat CS, Behr C, Tarrentino S. Onestage versus 2-stage bilateral total knee arthroplasty. Clin Orthop Relat Res 1994; 309:94–101.
- Gauss H. The pathology of fat embolism. Arch Surg 1924; 9:593–605.
- Lehman EP, Moore RM. Fat embolism, including experimental production without trauma. Arch Surg 1927; 14:621–662.
- Johnson MJ, Lucas GL. Fat embolism syndrome. Orthopedics 1996; 19:41–48.
- Benson KT. Diagnosis and treatment of fat embolism syndrome. Anesthesiology Rev 1993; 20:165–170.
- Colonna DM, Kilgus D, Brown W, Challa V, Stump DA, Moody DM. Acute brain fat embolization occurring after total hip arthroplasty in the absence of a patent foramen ovale. Anesthesiology 2002; 96:1027–1029.
- Byrick RJ, Mullen JB, Mazer CD, Guest CB. Transpulmonary systemic fat embolism. Studies in mongrel dogs after cemented arthroplasty. Am J Respir Crit Care Med 1994; 150:1416–1422.
- Benestad G. Drei Fälle von Fettembolie mit punktförmigen Blutungen in der Haut. Deutsche Ztschr f Chir 1911; 112:192.
- Hagley SR. The fulminant fat embolism syndrome. Anaesth Intensive Care 1983; 11:167–170.
- Fulde GW, Harrison P. Fat embolism—a review. Arch Emerg Med 1991; 8:233–239.
- Bulger EM, Smith DG, Maier RV, Jurkovich GJ. Fat embolism syndrome. A 10-year review. Arch Surg 1997; 132:435–439.
- King EG, Wagner WW, Ashbaugh DG, Latham LP, Halsey DR. Alterations in pulmonary microanatomy after fat embolism. In vivo observations via thoracic window of the oleic acid-embolized canine lung. Chest 1971; 59:524–530.
- Talbot M, Schemitsch EH. Fat embolism syndrome: history, definition, epidemiology. Injury 2006; 37(suppl 4):S3–S7.
- Schonfeld SA, Ploysongsang Y, DiLisio R, et al. Fat embolism prophylaxis with corticosteroids. A prospective study in high-risk patients. Ann Intern Med 1983; 99:438–443.
- Tetzlaff J, Massoli K. Fat embolism. In:Tetzlaff J, editor. Clinical Orthopedic Anesthesia. Boston, MA: Butterworth-Heinemann; 1995:341–349.
- Capan LM, Miller SM, Patel KP. Fat embolism. Anesthesiol Clin North Am 1993; 11:25–54.
- Reider E, Sherman Y, Weiss Y, Liebergall M, Pizov R. Alveolar macrophages fat stain in early diagnosis of fat embolism syndrome. Isr J Med Sci 1997; 33:654–658.
- Aoki N, Soma K, Shindo M, Kurosawa T, Ohwada T. Evaluation of potential fat emboli during placement of intramedullary nails after orthopedic fractures. Chest 1998; 113:178–181.
- Stoeger A, Daniaux M, Felber S, Stockhammer G, Aichner F, zur Nedden D. MRI findings in cerebral fat embolism. Eur Radiol 1998; 8:1590–1593.
- Takahashi M, Suzuki R, Osakabe Y, et al. Magnetic resonance imaging findings in cerebral fat embolism: correlation with clinical manifestations. J Trauma 1999; 46:324–327.
- Parizel PM, Demey HE, Veeckmans G, et al. Early diagnosis of cerebral fat embolism syndrome by diffusion-weighted MRI (starfield pattern). Stroke 2001; 32:2942–2944.
- Habashi NM, Andrews PL, Scalea TM. Therapeutic aspects of fat embolism syndrome. Injury 2006; 37(suppl 4):S68–S73.
- Sage RH, Tudor RW. Treatment of fat embolism with heparin. Br Med J 1958; 1:1160–1161.
- Myers R, Taljaard JJ. Blood alcohol and fat embolism syndrome. J Bone Joint Surg Am 1977; 59:878–880.
- Denman EE, Cairnes CS, Holmes CM. Case of severe fat embolism treated by intermittent positive-pressure respiration. Br Med J 1964; 2:101–102.
- Liu DD, Kao SJ, Chen HI. N-Acetylcysteine attenuates acute lung injury induced by fat embolism. Crit Care Med 2008; 36:565–571.
- Kallenbach J, Lewis M, Zaltzman M, Feldman C, Orford A, Zwi S. ‘Low-dose’ corticosteroid prophylaxis against fat embolism. J Trauma 1987; 27:1173–1176.
- Stoltenberg JJ, Gustilo RB. The use of methylprednisolone and hypertonic glucose in the prophylaxis of fat embolism syndrome. Clin Orthop Relat Res 1979; 143:211–221.
- Bederman SS, Bhandari M, McKee MD, Schemitsch EH. Do corticosteroids reduce the risk of fat embolism syndrome in patients with long-bone fractures? A meta-analysis. Can J Surg 2009; 52:386–393.
A 75-year-old man with type 2 diabetes and hypothyroidism underwent bilateral total knee replacement at our hospital.
His functional capacity had been moderately limited by knee pain, but he could easily climb one flight of stairs without symptoms. His medications at that time included levothyroxine (Synthroid) and metformin (Glucophage). He had no known cardiac or pulmonary disease. The preoperative evaluation, including laboratory tests and electrocardiography, was within normal limits.
Spinal anesthesia was used for surgery, and he was given 2 mg of midazolam (Versed) intravenously for sedation. No additional sedation was given. He was given oxygen via nasal cannula at 2 L/min.
All vital signs were stable at the start of the procedure. However, about halfway through, when the thigh tourniquet was released, his oxygen saturation dropped abruptly from 100% to 92%. All other vital signs remained stable, and he was asymptomatic, was oriented to person, time, and place, was conversing freely, and was in no distress. The oxygen flow was increased to 6 L/min, his oxygen saturation improved, and the procedure was then completed as planned.
At the conclusion of the surgery, before the patient was transported to the postanesthesia care unit (PACU) and while his oxygen flow rate was still 6 L/min, his oxygen saturation again dropped to 92%. A simple face mask was placed, and the oxygen flow rate was increased to 10 L/min. His oxygen saturation stayed low, near 90%.
Bleeding during surgery had been nominal. He had received 2 L of lactated Ringer’s solution and 500 mL of hetastarch (Hextend) during surgery. He continued to be asymptomatic in the PACU.
1. What is the most likely cause of oxygen desaturation during bilateral total knee arthroplasty?
- Fat embolism
- Intraoperative pneumonia
- Venous thromboembolism with pulmonary embolism
- Acute myocardial infarction
- Acute pulmonary edema
- Excessive sedation
The differential diagnosis of oxygen desaturation during orthopedic procedures is listed in Table 1.
Fat embolism is the most likely cause, particularly given the greater fatty embolic load that occurs with bilateral total knee arthroplasty than with unilateral total knee arthroplasty.
At what point the maximal showering of fat emboli occurs is not known. Fat may be released into the circulation with pressurization of the medullary canal during surgery or with manipulation of a fracture. The emboli may collect in the leg veins and then be released in a shower when the thigh tourniquet is released. Vasoactive mediators and methylmethacrylate cement released into the circulatory system after tourniquet deflation may also cause vasodilation, hypotension, and increased dead-space ventilation, resulting in hypoxia and a drop in end-tidal CO2.
Pneumonia during surgery is rare without an apparent aspiration event.
Venous thromboembolism is possible but is more likely later in the postoperative period after major orthopedic surgery.
Acute myocardial infarction could present with hypoxia, particularly in a diabetic patient, who may not experience chest pain. However, intraoperative electrocardiographic changes would likely be seen. If myocardial infarction is suspected, postoperative serial electrocardiograms and measuring troponin and cardiac enzyme levels aid in the diagnosis.
Acute pulmonary edema is possible but not as highly suspected, as the patient had no history of congestive heart failure and received an appropriate amount of fluid for this type of surgery.
Excessive sedation could cause hypoventilation and, thus, oxygen desaturatation. However, this patient’s oxygen desaturatation began more than an hour after the midazolam was given. Midazolam is a short-acting benzodiazepine. It is unlikely that the patient would show signs of hypoventilation and oversedation an hour after the drug was given. Our patient also did not show any signs of excessive sedation, as he was awake and conversing during the surgery.
Fat emboli vs fat embolism syndrome
Fat embolism is the presence of fat drops within the systemic and pulmonary microcirculation, with or without clinical sequelae.1 Fat embolism syndrome, on the other hand, is defined as injury to and dysfunction of one or more organs as a result of the embolization of fat, usually within 24 hours of injury or orthopedic surgery.2
Fat embolism syndrome is an unpredictable condition with a varied presentation. Fat droplets are thought to embolize via the venous circulation into the pulmonary arteries, occluding small blood vessels in the lung. However, they also get into the arterial circulation and occlude arteries in the brain, kidney, heart, and liver (more on this phenomenon below).
Fat embolism is reported to originate primarily from fractures of the femur, tibia, and pelvis.2,3 As many as 90% of trauma patients have been shown to have evidence of fat embolism on autopsy.4 However, only a small number of patients develop the classic fat embolism syndrome,2,3,5 Why some develop the syndrome and others do not is still unknown.
Orthopedic procedures associated with fat embolization include knee arthroplasty and hip arthroplasty, particularly if it involves intramedullary manipulation or medullary fixation.6 It has also been reported during spinal procedures in which pedicular screws are used.7 The syndrome occurs in 0.25% to 30% of patients following multiple fractures and in 0.1% to 12% of patients during or following knee or hip arthroplasty.
One study8 showed evidence of fat on transesophageal echocardiography in 88% of patients undergoing medullary reaming of lower-extremity fractures and hip hemiarthroplasty. Blood sampling from the right atrium confirmed that fat was responsible for the echocardiographic abnormalities. The study also showed that the severity of the embolic showering correlated with the severity of hypoxia and the decrease in end-tidal CO2.8
CASE CONTINUED
On arrival at the PACU, our patient’s oxygen saturation was 94% while he was breathing oxygen via a simple face mask at a flow rate of 10 L/min. His heart rate was 60 bpm, blood pressure 110/60 mm Hg, and temperature 37.5°C (96.3°F). Chest sounds were normal on auscultation.
However, 3 hours later, his mental status rapidly deteriorated. He was oriented only to person, and he was drowsy. He had escalating respiratory distress with a rapid respiratory rate and decreasing oxygen saturation. At this point, auscultation of his chest wall revealed bilateral crackles and rales.
He was promptly intubated. Profuse fluid and secretions were noted to be coming from his lungs, filling the endotracheal tube. Arterial blood gas measurement showed a pH of 7.22, Pao2 64 mm Hg, and Paco2 56 mm Hg on 100% fraction of inspired oxygen, with no increased anion gap.
2. Which consequence of fat embolism is most likely at this time in this patient?
- Coexisting sepsis
- Fat embolism syndrome
- Acute cardioembolic stroke
- Anaphylaxis
Fat embolism syndrome should be highly suspected in this patient. As mentioned, it can affect many different organs. It is the most serious condition resulting from fat embolization after surgery or trauma.
Sepsis was unlikely in our patient, since he presented for his surgery in good health and with no preexisting signs or symptoms of infection. Acute cardioembolic stroke could have caused the neurologic signs, but this would not necessarily explain the coexisting hypoxia. An anaphylactic reaction to drugs or surgical cement would most likely present intraoperatively, shortly after exposure occurred, rather than several hours after surgery.
How common is fat embolism syndrome?
The occurrence rate of fat embolism syndrome has been reported to be 0.25% to 30% after multiple fractures and 0.1% to 12% after knee and hip joint surgery, with a mortality rate of 13% to 36%.2,9–14 The rate of occurrence after unilateral total knee joint replacement has been reported to be 1.8% to 5%, and 4% to 12% after bilateral total knee replacement.15–19
The syndrome is relatively more common with traumatic fractures of the lower extremities. However, it has also been reported with liposuction, total parenteral nutrition, bone marrow harvest and transplantation, burns, and acute pancreatitis, to mention a few.10
The broad range of reported incidence rates can be attributed to the fact that many studies were in patients with multiple trauma, whose concomitant injuries may have made it difficult to clearly define the contribution of fat embolism syndrome to the overall rates of morbidity and mortality. Also, different studies used different criteria to define the syndrome.
How does fat embolism syndrome occur?
Two hypotheses for how this syndrome occurs were proposed nearly a century ago.20,21
The “mechanical” theory is that fat emboli are formed as a result of trauma and disruption of adipose tissue and other cells in the bone marrow. Increases in intramedullary pressure force the fat emboli through damaged medullary venous channels in the bone and into the circulation of the lower extremities. This embolization of fat causes an initial mechanical pulmonary obstruction. Mechanical obstruction by fat emboli in the pulmonary system leads to increased pulmonary pressures and an increase in right heart outflow pressure. The right heart becomes strained, leading to a decreased right-sided cardiac output. As a result, the left heart filling pressures diminish and hypotension ensues.20
The “biochemical” theory, on the other hand, is that chylomicrons within the vascular system are modified and their stability is compromised as a result of stress. These traumatized chylomicrons then coalesce to form droplets of fat that accumulate in the pulmonary circulation and produce a mechanical obstruction. This would explain why nontraumatic, nonorthopedic insults can produce this syndrome.
Autopsy studies show that there is little correlation between the presence and quantity of intravascular fat and the severity of clinical symptoms, thus implying that the syndrome is caused by more than just mechanical obstruction. The biochemical theory postulates that fat globules within the circulatory system then cause the release of lipase from the pulmonary alveolar cells, which then hydrolyses the fat into free fatty acids. These free fatty acids cause an inflammatory reaction, complementmediated leukocyte aggregation, chemotoxin release, and subsequently endothelial damage. These vasoactive substances damage type 2 pneumocytes and lead to an increased permeability of the pulmonary capillary beds. Acute respiratory distress syndrome (ARDS) may ensue. Disseminated intravascular coagulation may occur as a result of the formation of microthrombi involving lipids, platelets, and fibrin.21,22
Embolization of fat to the central nervous system can occur as fat globules cross into the systemic circulation via a patent foramen ovale, an atrioventricular shunt, or the pulmonary capillaries. This can then result in cerebral ischemia.23
Although patent foramen ovale may seem the most direct route for cerebral embolization, the neurologic impairment and signs of cerebral emboli in fat embolism syndrome may occur in the absence of patent foramen ovale.24,25 The fat globules may actually go through the lung capillaries, being flexible and forced through by increased pulmonary pressure.
But whether the cause of fat embolism syndrome is occlusion by globules, the release of biochemical mediators, or a combination of both is unknown. Both mechanisms are likely responsible. We can only suspect that the degree of fat load and intrinsic metabolic differences between individuals account for the variation in susceptibility.
FAT EMBOLI AFFECT THE LUNGS, SKIN, AND BRAIN
3. Where on the body is the rash associated with fat embolism syndrome usually seen?
- Face
- Near a site of fracture or surgery
- Chest, axilla, conjunctiva
- Distal extremities
Petechiae are part of the classic presenting triad of fat embolism syndrome, which also includes pulmonary and cerebral dysfunction.
Petechiae usually appear on the 2nd to 4th day after injury.26 They are usually found across the chest, the anterior axillary folds, and the neck, as well as on the oral mucosa and the conjunctiva. The rash is caused by occlusion of dermal capillaries by fat, which increases their fragility.10
Pulmonary changes usually begin with tachypnea, dyspnea, and a drop in oxygen saturation, leading to generalized hypoxia. Respiratory symptoms are present in 100% of cases.2 Respiratory symptoms can acutely develop with the sudden manipulation of a fracture, reaming of bone, or release of a limb tourniquet.27
Body systems affected by fat embolism syndrome are summarized in Table 2.
4. How many hours after injury does fat embolism syndrome typically manifest?
- 1 to 2 hours
- 6 to 12 hours
- 12 to 20 hours
- 24 to 48 hours
- 72 to 84 hours
Most patients develop signs and symptoms 24 to 48 hours after injury. Patients presenting earlier than 12 hours usually have a more fulminant course.29
The time between fat embolization and the development of fat embolism syndrome is thought to be related to the time required for the metabolic conversion of fat to free fatty acids.30 We suspect that the early desaturation seen in our patient was the result of a heavy showering of fat intraoperatively. However, this could only be concluded after we had ruled out other causes of acute hypoxia and hypotension.
Fat embolism syndrome is a diagnosis of exclusion and is based on clinical criteria. No specific sign, symptom, or test is pathognomonic. It may often be confused with other conditions such as systemic inflammatory response syndrome or sepsis. However, the triad of respiratory and neurologic symptoms and petechiae coupled with the clinical picture of recent trauma or orthopedic surgery almost assures the diagnosis.
Fat embolism syndrome can range from subclinical to fulminating, with the more fulminating course attributable to a huge load of fat emboli, which leads to acute cor pulmonale.
Regardless of the criteria used, one must have a high index of suspicion for fat embolization syndrome in patients undergoing orthopedic procedures, particularly hip and knee surgery, and in patients with fractures, especially fractures of the femur, tibia, or pelvis and multiple, concomitant fractures.
CASE CONTINUED
Our patient was given furosemide (Lasix) empirically for diuresis and to improve oxygenation. However, his oxygen saturation remained low.
Chest radiography 4 hours after surgery showed bilateral pulmonary infiltrates. Serial electrocardiography showed no acute changes. Levels of cardiac enzymes and troponins were normal. Transthoracic echocardiography showed no left ventricular dysfunction, a normal right ventricle, and no evidence of valvular lesions. Urine and blood fat stains were negative, but the sputum stain was positive for copious extracellular fat. The patient became comatose 5 hours postoperatively. Computed tomography of the brain was normal. He was transferred to the surgical intensive care unit.
The clinical course was marked by hemodynamic instability requiring norepinephrine (Levophed) and vasopressin (Pitressin) for hypotension. Right ventricular filling pressures via central venous pressure monitoring showed no evidence of hypovolemia. The hemoglobin concentration and the hematocrit were stable, with no evidence of acute or ongoing bleeding. Blood, urine, and sputum cultures remained negative. Acute myocardial infarction was ruled out by serial electrocardiography, cardiac enzyme testing, and troponin testing.
Magnetic resonance imaging (MRI) of the brain on postoperative day 2 showed foci of acute ischemia suggestive of embolic phenomena consistent with fat embolism syndrome (Figure 1). Transthoracic echocardiography was repeated but again showed no evidence of a patent foramen ovale. Electroencephalography on postoperative day 4 showed severe, diffuse encephalopathy. There was no petechial skin rash. Other laboratory studies showed progressive thrombocytopenia with a platelet count of 53 × 199/L on postoperative day 3.
TESTS THAT AID THE CLINICAL DIAGNOSIS
Although no single laboratory test is pathognomonic for fat embolism syndrome, several tests may help raise suspicion of it, especially in the setting of fracture or an orthopedic surgical procedure.
Arterial blood gases must be measured. A Pao2 of less than 60 mm Hg with no other obvious lung pathology in an orthopedic surgery patient is highly suspicious.12 An alveolar-arterial gradient of greater than 100 mm Hg may further increase suspicion.
Tests for fat. The blood and urine may be examined for fat, although positive findings are not specific for fat embolism syndrome.33 Fat in the urine indicates the occurrence of massive fat embolism, but this is not always accompanied by the syndrome.34 Gurd and Wilson13 found fat globules larger than 8 μm circulating in the serum in all documented cases. They stated that, even though the relationship of large fat globules to the pathogenesis of the clinical picture remains obscure, the demonstration of their presence can be helpful in the diagnosis.13
Also, samples obtained with bronchoalveolar lavage may be examined for fat. The macrophages may be stained for fat using the oil red O stain. Again, this is a nonspecific marker, as fat-stained macrophages are seen in trauma patients,35 but the finding has a very high negative predictive value.36 Anemia, thrombocytopenia, hypofibrinogenemia, an elevated lipase level, and a high erythrocyte sedimentation rate may be found in fat embolism syndrome.13
Chest radiography may show bilateral infiltrates, as in ARDS, but this is not diagnostic for fat embolism syndrome.
Electrocardiography may show changes in ST and T waves and signs of right heart strain.
Transesophageal echocardiography may show increased right heart and pulmonary artery pressures.
Computed tomography is often negative,37,38 but T2-weighted MRI is useful in the diagnosis of cerebral fat embolism syndrome, as it can show intracerebral microinfarcts as early as 4 hours after the onset of neurologic symptoms, and these findings correlate well with the clinical severity of brain injury.
Diffusion-weighted MRI may enhance the sensitivity and specificity of the neuroradiologic diagnosis. Diffusion-weighted MRI typically shows multiple nonconfluent areas of high-intensity signals or bright spots on a dark background, known as a “starfield pattern.” This pattern has been suggested to be pathognomonic of acute cerebral microinfarction. The abnormalities presumably reflect foci of cytotoxic edema that develops immediately, unlike vasogenic edema, seen in T2-weighted images, which may take up to several days to develop. Although these images are not necessarily specific for fat emboli, they are useful in helping make the diagnosis. Thus, diffusionweighted MRI should be done if fat embolism syndrome is suspected.38,39
CASE CONCLUDED
The patient’s course in the intensive care unit was further complicated by gastrointestinal bleeding and renal failure. His neurologic status did not improve. Repeated MRI of the brain showed evolving bilateral watershed infarction throughout the cortices. The neurologic consult service diagnosed the patient as having severe encephalopathy with a very poor prognosis. The decision was made to withdraw care. He was placed under palliative care and died on postoperative day 22.
DRUG TREATMENT OF FAT EMBOLISM SYNDROME
5. Which of the following drugs has been proven to be effective in treating fat embolism syndrome?
- Intravenous ethanol
- Steroids
- Heparin
- Dextran
- Aspirin
- None of the above
None of the above has been proven to be effective in treating this disorder. The management is largely supportive. Thus, prevention, early diagnosis, and symptom management are vital.
Pulmonary and hemodynamic support are the cornerstones of successful treatment. Aggressive respiratory support is often needed. Management of acute lung injury and ARDS focuses on achieving acceptable gas exchange while preventing ventilator-associated lung injury. Intravascular volume must be supported. Inotropes and pulmonary vasodilators may be required to maintain hemodynamics. Exacerbation of central nervous system ischemia from hypotension or hypoxia should be avoided.
If the thrombocytopenia leads to clinical bleeding, platelet transfusions may be warranted.
Supportive care should include prophylaxis of deep venous thrombosis and of gastrointestinal bleeding, and maintenance of nutrition.40 Patients who receive supportive care generally have a favorable outcome, with a mortality rate of less than 10%.28
Drug studies have been inconclusive
Drugs suggested in the treatment of fat embolism syndrome include heparin, aspirin, dextran, hypertonic glucose, and alcohol, but the results have been inconclusive.3,11,23,40–43
Heparin stimulates lipase activity, consequently decreasing the concentration of circulating fat globules. However, the increase in levels of free fatty acids may actually worsen the clinical picture. For this reason, and because of anticoagulation concerns and evidence of increased mortality rates, heparin is now contraindicated in the treatment of fat embolism syndrome.2,41,43
Alcohol. Patients with a higher blood alcohol level at the time of injury have been reported to have a lower incidence of fat embolism syndrome. Alcohol inhibits lipase, suppressing the rise of free fatty acids. In experimental studies, the incidence of fat embolism syndrome was lower when the blood alcohol level was maintained at 20 mg/dL. However, no prospective randomized trial has been done to determine the clinical efficacy of ethanol as a treatment for this condition.5,42
Dextran has been advocated, owing to its ability to improve small-vessel perfusion, but bleeding risk and acute renal failure associated with this drug have limited its use.5
N-acetylcysteine has been shown to attenuate fat-induced lung injury in a study of rats with induced fat embolism syndrome.44
Corticosteroid treatment for this condition is controversial. Studies in patients with femoral and tibial fractures show that steroids reduce the incidence of fat embolism syndrome when given prophylactically, and those treated with steroids had a higher Pao2 than controls. Doses of methylprednisolone in these studies ranged between 9 mg/kg to 90 mg/kg. A drawback of these studies is their small number of patients.12,32,45,46
A meta-analysis47 of randomized trials of corticosteroids to prevent fat embolism syndrome in patients with long-bone fractures identified 104 such studies. Only 7 of the 104 were considered adequate. In 389 patients with long-bone fractures, prophylactic corticosteroids reduced the risk of fat embolism syndrome by 78% (95% confidence interval 43%–92%) and corticosteroids also significantly reduced the risk of hypoxia with no difference in rates of infection or death. However, the overall quality of the trials was poor, and the authors of the meta-analysis concluded that more study is needed before corticosteroids could be formally recommended.47
There is no evidence that steroids improve the overall clinical course of already established fat embolism syndrome.12,32,45 The dosing and optimal timing of administration have also not been established. High doses pose a risk of septic complications, which may be devastating for the posttrauma or postoperative patient.
- Akhtar S. Fat embolism. Anesthesiol Clin 2009; 27:533–550.
- Filomeno LT, Carelli CR, Silva NC, Filho TE, Amatuzzi MM. Fat embolism: a review for current orthopaedics practice. Acta Ortop Bras 2005; 13:196–208.
- ten Duis HJ. The fat embolism syndrome. Injury 1997; 28:77–85.
- Peltier LF. Fat embolism. A current concept. Clin Orthop Relat Res 1969; 66:241–253.
- Gossling HR, Pellegrini VD. Fat embolism syndrome: a review of the pathophysiology and physiological basis of treatment. Clin Orthop Relat Res 1982; 165:68–82.
- Papagelopoulos PJ, Apostolou CD, Karachalios TS, Themistocleous GS, Giannakopoulos CK, Ioannidis TT. Pulmonary fat embolism after total hip and total knee arthroplasty. Orthopedics 2003; 26:523–527.
- Takahashi S, Kitagawa H, Ishii T. Intraoperative pulmonary embolism during spinal instrumentation surgery. A prospective study using transoesophageal echocardiography. J Bone Joint Surg Br 2003; 85:90–94.
- Christie J, Robinson CM, Pell AC, McBirnie J, Burnett R. Transcardiac echocardiography during invasive intramedullary procedures. J Bone Joint Surg Br 1995; 77:450–455.
- Robert JH, Hoffmeyer P, Broquet PE, Cerutti P, Vasey H. Fat embolism syndrome. Orthop Rev 1993; 22:567–571.
- Mellor A, Soni N. Fat embolism. Anaesthesia 2001; 56:145–154.
- Taviloglu K, Yanar H. Fat embolism syndrome. Surg Today 2007; 37:5–8.
- Lindeque BG, Schoeman HS, Dommisse GF, Boeyens MC, Vlok AL. Fat embolism and the fat embolism syndrome. A double-blind therapeutic study. J Bone Joint Surg Br 1987; 69:128–131.
- Gurd AR, Wilson RI. The fat embolism syndrome. J Bone Joint Surg Br 1974; 56B:408–416.
- Ganong RB. Fat emboli syndrome in isolated fractures of the tibia and femur. Clin Orthop Relat Res 1993; 291:208–214.
- Djelouah I, Lefèvre G, Ozier Y, Rosencher N, Tallet F. Fat embolism in orthopedic surgery: role of bone marrow fatty acid. Anesth Analg 1997; 85:441–443.
- Barre J, Lepouse C, Segal P. Embolism and intramedullary femoral surgery. Rev Chir Orthop Reparatrice Appar Mot 1997; 83:9–21.
- Kim YH. Incidence of fat embolism syndrome after cemented or cementless bilateral simultaneous and unilateral total knee arthroplasty. J Arthroplasty 2001; 16:730–739.
- Dorr LD, Merkel C, Mellman MF, Klein I. Fat emboli in bilateral total knee arthroplasty. Predictive factors for neurologic manifestations. Clin Orthop Relat Res 1989; 248:112–118.
- Jankiewicz JJ, Sculco TP, Ranawat CS, Behr C, Tarrentino S. Onestage versus 2-stage bilateral total knee arthroplasty. Clin Orthop Relat Res 1994; 309:94–101.
- Gauss H. The pathology of fat embolism. Arch Surg 1924; 9:593–605.
- Lehman EP, Moore RM. Fat embolism, including experimental production without trauma. Arch Surg 1927; 14:621–662.
- Johnson MJ, Lucas GL. Fat embolism syndrome. Orthopedics 1996; 19:41–48.
- Benson KT. Diagnosis and treatment of fat embolism syndrome. Anesthesiology Rev 1993; 20:165–170.
- Colonna DM, Kilgus D, Brown W, Challa V, Stump DA, Moody DM. Acute brain fat embolization occurring after total hip arthroplasty in the absence of a patent foramen ovale. Anesthesiology 2002; 96:1027–1029.
- Byrick RJ, Mullen JB, Mazer CD, Guest CB. Transpulmonary systemic fat embolism. Studies in mongrel dogs after cemented arthroplasty. Am J Respir Crit Care Med 1994; 150:1416–1422.
- Benestad G. Drei Fälle von Fettembolie mit punktförmigen Blutungen in der Haut. Deutsche Ztschr f Chir 1911; 112:192.
- Hagley SR. The fulminant fat embolism syndrome. Anaesth Intensive Care 1983; 11:167–170.
- Fulde GW, Harrison P. Fat embolism—a review. Arch Emerg Med 1991; 8:233–239.
- Bulger EM, Smith DG, Maier RV, Jurkovich GJ. Fat embolism syndrome. A 10-year review. Arch Surg 1997; 132:435–439.
- King EG, Wagner WW, Ashbaugh DG, Latham LP, Halsey DR. Alterations in pulmonary microanatomy after fat embolism. In vivo observations via thoracic window of the oleic acid-embolized canine lung. Chest 1971; 59:524–530.
- Talbot M, Schemitsch EH. Fat embolism syndrome: history, definition, epidemiology. Injury 2006; 37(suppl 4):S3–S7.
- Schonfeld SA, Ploysongsang Y, DiLisio R, et al. Fat embolism prophylaxis with corticosteroids. A prospective study in high-risk patients. Ann Intern Med 1983; 99:438–443.
- Tetzlaff J, Massoli K. Fat embolism. In:Tetzlaff J, editor. Clinical Orthopedic Anesthesia. Boston, MA: Butterworth-Heinemann; 1995:341–349.
- Capan LM, Miller SM, Patel KP. Fat embolism. Anesthesiol Clin North Am 1993; 11:25–54.
- Reider E, Sherman Y, Weiss Y, Liebergall M, Pizov R. Alveolar macrophages fat stain in early diagnosis of fat embolism syndrome. Isr J Med Sci 1997; 33:654–658.
- Aoki N, Soma K, Shindo M, Kurosawa T, Ohwada T. Evaluation of potential fat emboli during placement of intramedullary nails after orthopedic fractures. Chest 1998; 113:178–181.
- Stoeger A, Daniaux M, Felber S, Stockhammer G, Aichner F, zur Nedden D. MRI findings in cerebral fat embolism. Eur Radiol 1998; 8:1590–1593.
- Takahashi M, Suzuki R, Osakabe Y, et al. Magnetic resonance imaging findings in cerebral fat embolism: correlation with clinical manifestations. J Trauma 1999; 46:324–327.
- Parizel PM, Demey HE, Veeckmans G, et al. Early diagnosis of cerebral fat embolism syndrome by diffusion-weighted MRI (starfield pattern). Stroke 2001; 32:2942–2944.
- Habashi NM, Andrews PL, Scalea TM. Therapeutic aspects of fat embolism syndrome. Injury 2006; 37(suppl 4):S68–S73.
- Sage RH, Tudor RW. Treatment of fat embolism with heparin. Br Med J 1958; 1:1160–1161.
- Myers R, Taljaard JJ. Blood alcohol and fat embolism syndrome. J Bone Joint Surg Am 1977; 59:878–880.
- Denman EE, Cairnes CS, Holmes CM. Case of severe fat embolism treated by intermittent positive-pressure respiration. Br Med J 1964; 2:101–102.
- Liu DD, Kao SJ, Chen HI. N-Acetylcysteine attenuates acute lung injury induced by fat embolism. Crit Care Med 2008; 36:565–571.
- Kallenbach J, Lewis M, Zaltzman M, Feldman C, Orford A, Zwi S. ‘Low-dose’ corticosteroid prophylaxis against fat embolism. J Trauma 1987; 27:1173–1176.
- Stoltenberg JJ, Gustilo RB. The use of methylprednisolone and hypertonic glucose in the prophylaxis of fat embolism syndrome. Clin Orthop Relat Res 1979; 143:211–221.
- Bederman SS, Bhandari M, McKee MD, Schemitsch EH. Do corticosteroids reduce the risk of fat embolism syndrome in patients with long-bone fractures? A meta-analysis. Can J Surg 2009; 52:386–393.
A new ICU paradigm: Intensivists as primary critical care physicians
After nearly a half-century, the subspecialty of critical care medicine—uniquely trained physicians caring for critically ill or injured patients in specialized, discrete nursing units—continues to suffer from an identity crisis.
Too often, the role of the intensivist in caring for the patient is unclear, to the patient, to the family, and to other physicians. Is the intensivist merely a consultant, or does he or she have a larger role?
The time has come to end the identity crisis with a fundamental paradigm shift, to identify intensivists as the principal caregivers of critically ill patients, ie, the “primary critical care physicians,” or PCCPs. We think this is necessary based not only on evidence from clinical studies, but also on our decades of experience as intensivist caregivers in a high-intensity, closed-staffing model.
REASONS FOR THE IDENTITY CRISIS
The reasons for the continued identity crisis of intensivists are many and complex.
To begin with, other physicians tend to be ambiguous about the duties of intensivists, and the general population is mostly unaware of the subspecialty. In contrast to mature subspecialties such as cardiology or gastroenterology, where responsibilities are generally known to physicians and the lay public alike, or in contrast even to recently evolved specialties such as emergency medicine, the enigmatic roles of an intensivist may differ depending on primary specialty (anesthesiology, internal medicine, surgery) and the patient population, or even among intensive care units (ICUs) within the same hospital.
Moreover, that an identity crisis exists is even more surprising given the disproportionately large consumption by critical care medicine of finite economic resources. One would expect that a sector of health care that expends 1% of the GNP1 would have clearly explicit roles and responsibilities for its physicians.
Nearly three-quarters of the care by intensivists in the United States is delivered in what is considered an “open” or “low-intensity” ICU staffing model2: an intensivist makes treatment recommendations but otherwise has no overarching authority over patient care. In this model, the admitting physician is not trained in critical care and is not available throughout the day to make decisions concerning the management of the patient. In addition, various consulting physicians and single-organ specialists may not be aware of the overall management plan, resulting in potentially unnecessary or conflicting orders and increased expense.2 What is more, in an open ICU model, critical care nurses are often left to detect and correct a significant change in a patient’s status without the necessary immediate physician availability, resulting not only in a stressful working environment for nursing staff, but also in potential harm associated with individuals providing care outside their scope of practice.3
In only a small percentage of ICUs—mostly medical ICUs and ICUs in teaching hospitals—is critical care provided in a “high-intensity” or “closed” staffing pattern, in which treatment decisions are cohesively managed under the guidance of an intensivist.2
EVIDENCE IN THE MEDICAL LITERATURE
Staffing patterns in the ICU
Several studies have attempted to identify the consequences of these different ICU staffing patterns on patient care.
Hanson et al4 examined two concurrent patient cohorts admitted to a surgical ICU. The study cohort was cared for by an on-site critical care team supervised by an intensivist, while the control cohort received care from a team with patient care responsibilities in multiple sites, supervised by a general surgeon. The results showed that patients cared for by the critical care team spent less time in the ICU, used fewer resources, had fewer complications, and had lower total hospital charges. The difference between the two cohorts was most evident in patients with the worst Acute Physiology and Chronic Health Evaluation (APACHE) II scores.
According to Hanson et al, the lack of an accepted prototype for the delivery of critical care is due to factors such as the relative youth of the discipline, contention over control of individual patient management, and the absence of a single academic advocate.4
Moreover, Pronovost et al5 concluded that high-intensity staffing (mandatory intensivist consultation or closed ICU) was associated with lower ICU mortality rates in 93% of studies and with a reduced ICU length of stay in the high-intensity staffing units when compared with ICUs with low-intensity staffing (no intensivist or elective intensivist consultation).
Critics of our PCCP paradigm may point to a study by Levy et al6 that, using a database of more than 100,000 patients, could not demonstrate any survival benefit with management by critical care physicians. Indeed the study found that patients managed by intensivists had a higher mortality rate than patients managed by physicians not trained in critical care. However, they also showed that more patients managed for the entire stay by intensivists received interventions such as intravenous drugs, mechanical ventilation, and continuous sedation and that they had a higher mean severity of illness as measured by the expanded Simplified Acute Physiology Score (SAPS II) and higher hospital mortality rates than patients who were not managed by a critical care team.
According to Levy et al, most ICUs in the United States are structured as completely open units in which the admitting physicians retain full clinical and decisional responsibility and thus have the option to care for their patients with or without input from intensivists.6
However, a recent study by Kim et al7 likely rebuts the findings of Levy et al. Kim et al analyzed more than 100,000 ICU admissions and found that the lowest odds of death within 30 days were in ICUs that had high-intensity physician staffing and multidisciplinary care teams, suggesting that the presence of an intensivist confers a survival benefit.
Other studies have also shown that high-intensity staffing improves patient outcomes in the ICU.5,8,9
Issues of cost and use of resources
Issues concerning cost and human resources for staffing ICUs have acquired increasing importance. According to Angus et al,10 intensivists provided care to only 36.8% of all ICU patients. The demand for critical care services will continue to grow rapidly as the population ages. It is this shift in the care of the critically ill that requires intensivists to take on the role of the PCCP, so as to provide high-quality, evidence-based critical care and to promote a long-term sustainable model of physician and nursing care.
OUR EXPERIENCE
Our intensivist group has been providing a near-primary-care style of critical care practice for almost 40 years, from its inception in 1977 by one of the authors (A.B.), to our current group of 15 board-certified intensivists. We can easily cite the clinical value of our practice approach, with outcome data showing consistent and better-than-expected Standardized Mortality Ratio accounts from our APACHE IV data (personal communication, Cleveland Clinic Cerner/APACHE IV report), or with reports showing that the presence of a full-time, attending-level, in-house staff physician ensures that patients, surgeons, and consultants have confidence and respect for the care provided. However, we feel that the intangible components are what make our practice a prototype for the PCCP model.
A dedicated team with a low turnover rate
First, we have a team of anesthesiology- and surgery-based intensivists dedicated to ICU practice, with a very low turnover or burnout rate, in contrast to most ICUs in the United States, where intensivists tend to practice part-time (at other times either providing operating-room-based anesthesia or surgical care or working in a pulmonary- or sleep-lab-based practice). We believe this point should not go unstressed: we have a team of physicians who have dedicated their career to working in the ICU full-time, and some have done so in excess of 20 years, even as long as 30 years! It is our opinion that we are able to provide such a highly desirable working environment by a unique daily staffing model that does not utilize the conventional practice style of one intensivist on-call per week.
We also feel that our model dramatically reduces the risk of burnout by permitting our attending intensivists to break up on-call sequences so that there are days on which work in the ICU is not also associated with on-call responsibilities.
A successful fellowship program
Second, we have an extremely successful fellowship program, which began in 1974 when one of the authors (A.B.) advocated the training of anesthesiology residents as intensivists.11 The American Board of Anesthesiology certifies on average 55 candidates per year in critical care medicine, and our program trains about 10% of the physicians applying for certification. In most years, there are actually more candidates for our program than there are available positions, which is atypical for anesthesiology-based critical care training programs. This wealth of young, talented candidates interested in critical care as a career is, again, in contrast to most anesthesiology-based programs, which find it difficult to enroll even one fellow per year.
Critical care programs grounded in anesthesiology typically struggle because of the realities of economics.12 The payoff of operating-room-based anesthesiology practices generally outshines those in critical care, yet we already have three times as many candidates as there are positions to start our training program in the next 2 years. We feel that candidates are attracted to our program simply because our environment (dedicated staffing, equal clinical footing with surgeons, low burnout rates) is seen as an exciting, positively charged role-modeling atmosphere for young physicians who may have a career interest that involves more than just their original base specialty.
A collegial working relationship
Third, we have a thriving, collegial working relationship—including daily bedside and weekly bioethics rounds with our nursing staff—which has fueled a high degree of professional satisfaction among nurses. This is evidenced by the extremely low turnover rate of nurses (less than 5% per year in the last 5 years) and by national recognition for nursing excellence (Beacon Award for Critical Care Excellence, American Association of Critical Care Nurses) (personal communication, S. Wilson, Nurse Manager). In 2009, the four nurses out of 174 who left did so to further their careers.
While low turnover rates among nurses and award-winning practices are surely a testament to a highly motivated and skilled nursing team, there is no question that a constructive collegiality among the physicians and nurses has provided an environment to allow these positive aspects to flourish.
OVERCOMING ROADBLOCKS
Obviously, although in theory it is easy to proclaim a PCCP paradigm, in reality the roadblocks are many.
For example, standardization of education and credentialing would be an essential hurdle to overcome. The current educational arrangement of the various adult specialties (anesthesiology, internal medicine, surgery), each offering disparate subspecialty critical care training and certification, is deeply rooted in interdisciplinary politics, but without any demonstration of improved patient care.13 As described recently by Kaplan and Shaw,14 an all-encompassing training and credentialing standard for critical care is essential for 21st century medicine and would go a long way toward development of the PCCP paradigm.
Another major roadblock is the shortage of intensivists in the United States.13 There are many reasons why physicians opt not to select critical care as a career, such as a non-straight-forward training pathway (as described above), recognition that the 24-hours per day, 7-days-per-week nature of critical care affects lifestyle issues, and inconsistent physician compensation.13
However, technological and personnel advances, including the use of electronic (e-ICU)15 and mid-level practitioner models, have led to creative approaches to extend critical care coverage.13
Additionally, the multitude of physician specialty stakeholders and the overall flux of the future of medical care in the United States all would contribute to the difficulties of prioritizing the implementation of the PCCP concept. Also, our practice style—a large intensivist group working in an ostensibly closed surgical ICU in a tertiary-care hospital—is one possible model, as is the even more highly evolved Cleveland Clinic medical ICU, where medical intensivists are already essentially PCCPs. But these models of care may not be generalizable among the local care patterns and medical politics across hospitals or ICUs.
Based on the described successes of our practice model, coupled with evidence in the literature, we have proposed a paradigm shift toward the concept of a PCCP. To be sure, paradigm shifts nearly always require time, effort, and wherewithal. In the end, however, we feel that embracement of the PCCP paradigm would result in a concise, discrete understanding of the role of intensivist, eliminate the specialty’s identity crisis, and ultimately improve patient care.
- Bloomfield EL. The impact of economics on changing medical technology with reference to critical care medicine in the United States. Anesth Analg 2003; 96:418–425.
- Gajic O, Afessa B. Physician staffing models and patient safety in the ICU. Chest 2009; 135:1038–1044.
- Baggs JG, Schmitt MH, Mushlin AI, et al. Association between nurse-physician collaboration and patient outcomes in three intensive care units. Crit Care Med 1999; 27:1991–1998.
- Hanson CW, Deutschman CS, Anderson HL, et al. Effects of an organized critical care service on outcomes and resource utilization: a cohort study. Crit Care Med 1999; 27:270–274.
- Pronovost PJ, Angus DC, Dorman T, Robinson KA, Dremsizov TT, Young TL. Physician staffing patterns and clinical outcomes in critically ill patients: a systematic review. JAMA 2002; 288:2151–2162.
- Levy MM, Rapoport J, Lemeshow S, Chalfin DB, Phillips G, Danis M. Association between critical care physician management and patient mortality in the intensive care unit. Ann Intern Med 2008; 148:801–809.
- Kim MM, Barnato AE, Angus DC, Fleisher LA, Kahn JM. The effect of multidisciplinary care teams on intensive care unit mortality. Arch Intern Med 2010; 170:369–376.
- Carson SS, Stocking C, Podsadecki T, et al. Effects of organizational change in the medical intensive care unit of a teaching hospital: a comparison of ‘open’ and ‘closed’ formats. JAMA 1996; 276:322–328.
- Treggiari MM, Martin DP, Yanez ND, Caldwell E, Hudson LD, Rubenfeld GD. Effect of intensive care unit organizational model and structure on outcomes in patients with acute lung injury. Am J Respir Crit Care Med 2007; 176:685–690.
- Angus DC, Kelley MA, Schmitz RJ, White A, Popovich J; Committee on Manpower for Pulmonary and Critical Care Societies (COMPACCS). Caring for the critically ill patient. Current and projected workforce requirements for care of the critically ill and patients with pulmonary disease: can we meet the requirements of an aging population? JAMA 2000; 284:2762–2770.
- Boutros AR. Anesthesiology and intensive care (editorial). Anesthesiology 1974; 41:319–320.
- Boyle WA. A critical time for anesthesiology? American Society of Anesthesiologists (ASA) Newsletter, September 2009;10–11. http://viewer.zmags.com/publication/9960917c#/9960917c/12. Accessed July 13, 2011.
- Ewart GW, Marcus L, Gaba MM, Bradner RH, Medina JL, Chandler EB. The critical care medicine crisis: a call for federal action: a white paper from the critical care professional societies. Chest 2004; 125:1518–1521.
- Kaplan LJ, Shaw AD. Standards for education and credentialing in critical care medicine. JAMA 2011; 305:296–297.
- Leong JR, Sirio CA, Rotondi AJ. eICU program favorably affects clinical and economic outcomes. Crit Care 2005, http://ccforum.com/content/9/5/E22. Accessed July 13, 2011.
After nearly a half-century, the subspecialty of critical care medicine—uniquely trained physicians caring for critically ill or injured patients in specialized, discrete nursing units—continues to suffer from an identity crisis.
Too often, the role of the intensivist in caring for the patient is unclear, to the patient, to the family, and to other physicians. Is the intensivist merely a consultant, or does he or she have a larger role?
The time has come to end the identity crisis with a fundamental paradigm shift, to identify intensivists as the principal caregivers of critically ill patients, ie, the “primary critical care physicians,” or PCCPs. We think this is necessary based not only on evidence from clinical studies, but also on our decades of experience as intensivist caregivers in a high-intensity, closed-staffing model.
REASONS FOR THE IDENTITY CRISIS
The reasons for the continued identity crisis of intensivists are many and complex.
To begin with, other physicians tend to be ambiguous about the duties of intensivists, and the general population is mostly unaware of the subspecialty. In contrast to mature subspecialties such as cardiology or gastroenterology, where responsibilities are generally known to physicians and the lay public alike, or in contrast even to recently evolved specialties such as emergency medicine, the enigmatic roles of an intensivist may differ depending on primary specialty (anesthesiology, internal medicine, surgery) and the patient population, or even among intensive care units (ICUs) within the same hospital.
Moreover, that an identity crisis exists is even more surprising given the disproportionately large consumption by critical care medicine of finite economic resources. One would expect that a sector of health care that expends 1% of the GNP1 would have clearly explicit roles and responsibilities for its physicians.
Nearly three-quarters of the care by intensivists in the United States is delivered in what is considered an “open” or “low-intensity” ICU staffing model2: an intensivist makes treatment recommendations but otherwise has no overarching authority over patient care. In this model, the admitting physician is not trained in critical care and is not available throughout the day to make decisions concerning the management of the patient. In addition, various consulting physicians and single-organ specialists may not be aware of the overall management plan, resulting in potentially unnecessary or conflicting orders and increased expense.2 What is more, in an open ICU model, critical care nurses are often left to detect and correct a significant change in a patient’s status without the necessary immediate physician availability, resulting not only in a stressful working environment for nursing staff, but also in potential harm associated with individuals providing care outside their scope of practice.3
In only a small percentage of ICUs—mostly medical ICUs and ICUs in teaching hospitals—is critical care provided in a “high-intensity” or “closed” staffing pattern, in which treatment decisions are cohesively managed under the guidance of an intensivist.2
EVIDENCE IN THE MEDICAL LITERATURE
Staffing patterns in the ICU
Several studies have attempted to identify the consequences of these different ICU staffing patterns on patient care.
Hanson et al4 examined two concurrent patient cohorts admitted to a surgical ICU. The study cohort was cared for by an on-site critical care team supervised by an intensivist, while the control cohort received care from a team with patient care responsibilities in multiple sites, supervised by a general surgeon. The results showed that patients cared for by the critical care team spent less time in the ICU, used fewer resources, had fewer complications, and had lower total hospital charges. The difference between the two cohorts was most evident in patients with the worst Acute Physiology and Chronic Health Evaluation (APACHE) II scores.
According to Hanson et al, the lack of an accepted prototype for the delivery of critical care is due to factors such as the relative youth of the discipline, contention over control of individual patient management, and the absence of a single academic advocate.4
Moreover, Pronovost et al5 concluded that high-intensity staffing (mandatory intensivist consultation or closed ICU) was associated with lower ICU mortality rates in 93% of studies and with a reduced ICU length of stay in the high-intensity staffing units when compared with ICUs with low-intensity staffing (no intensivist or elective intensivist consultation).
Critics of our PCCP paradigm may point to a study by Levy et al6 that, using a database of more than 100,000 patients, could not demonstrate any survival benefit with management by critical care physicians. Indeed the study found that patients managed by intensivists had a higher mortality rate than patients managed by physicians not trained in critical care. However, they also showed that more patients managed for the entire stay by intensivists received interventions such as intravenous drugs, mechanical ventilation, and continuous sedation and that they had a higher mean severity of illness as measured by the expanded Simplified Acute Physiology Score (SAPS II) and higher hospital mortality rates than patients who were not managed by a critical care team.
According to Levy et al, most ICUs in the United States are structured as completely open units in which the admitting physicians retain full clinical and decisional responsibility and thus have the option to care for their patients with or without input from intensivists.6
However, a recent study by Kim et al7 likely rebuts the findings of Levy et al. Kim et al analyzed more than 100,000 ICU admissions and found that the lowest odds of death within 30 days were in ICUs that had high-intensity physician staffing and multidisciplinary care teams, suggesting that the presence of an intensivist confers a survival benefit.
Other studies have also shown that high-intensity staffing improves patient outcomes in the ICU.5,8,9
Issues of cost and use of resources
Issues concerning cost and human resources for staffing ICUs have acquired increasing importance. According to Angus et al,10 intensivists provided care to only 36.8% of all ICU patients. The demand for critical care services will continue to grow rapidly as the population ages. It is this shift in the care of the critically ill that requires intensivists to take on the role of the PCCP, so as to provide high-quality, evidence-based critical care and to promote a long-term sustainable model of physician and nursing care.
OUR EXPERIENCE
Our intensivist group has been providing a near-primary-care style of critical care practice for almost 40 years, from its inception in 1977 by one of the authors (A.B.), to our current group of 15 board-certified intensivists. We can easily cite the clinical value of our practice approach, with outcome data showing consistent and better-than-expected Standardized Mortality Ratio accounts from our APACHE IV data (personal communication, Cleveland Clinic Cerner/APACHE IV report), or with reports showing that the presence of a full-time, attending-level, in-house staff physician ensures that patients, surgeons, and consultants have confidence and respect for the care provided. However, we feel that the intangible components are what make our practice a prototype for the PCCP model.
A dedicated team with a low turnover rate
First, we have a team of anesthesiology- and surgery-based intensivists dedicated to ICU practice, with a very low turnover or burnout rate, in contrast to most ICUs in the United States, where intensivists tend to practice part-time (at other times either providing operating-room-based anesthesia or surgical care or working in a pulmonary- or sleep-lab-based practice). We believe this point should not go unstressed: we have a team of physicians who have dedicated their career to working in the ICU full-time, and some have done so in excess of 20 years, even as long as 30 years! It is our opinion that we are able to provide such a highly desirable working environment by a unique daily staffing model that does not utilize the conventional practice style of one intensivist on-call per week.
We also feel that our model dramatically reduces the risk of burnout by permitting our attending intensivists to break up on-call sequences so that there are days on which work in the ICU is not also associated with on-call responsibilities.
A successful fellowship program
Second, we have an extremely successful fellowship program, which began in 1974 when one of the authors (A.B.) advocated the training of anesthesiology residents as intensivists.11 The American Board of Anesthesiology certifies on average 55 candidates per year in critical care medicine, and our program trains about 10% of the physicians applying for certification. In most years, there are actually more candidates for our program than there are available positions, which is atypical for anesthesiology-based critical care training programs. This wealth of young, talented candidates interested in critical care as a career is, again, in contrast to most anesthesiology-based programs, which find it difficult to enroll even one fellow per year.
Critical care programs grounded in anesthesiology typically struggle because of the realities of economics.12 The payoff of operating-room-based anesthesiology practices generally outshines those in critical care, yet we already have three times as many candidates as there are positions to start our training program in the next 2 years. We feel that candidates are attracted to our program simply because our environment (dedicated staffing, equal clinical footing with surgeons, low burnout rates) is seen as an exciting, positively charged role-modeling atmosphere for young physicians who may have a career interest that involves more than just their original base specialty.
A collegial working relationship
Third, we have a thriving, collegial working relationship—including daily bedside and weekly bioethics rounds with our nursing staff—which has fueled a high degree of professional satisfaction among nurses. This is evidenced by the extremely low turnover rate of nurses (less than 5% per year in the last 5 years) and by national recognition for nursing excellence (Beacon Award for Critical Care Excellence, American Association of Critical Care Nurses) (personal communication, S. Wilson, Nurse Manager). In 2009, the four nurses out of 174 who left did so to further their careers.
While low turnover rates among nurses and award-winning practices are surely a testament to a highly motivated and skilled nursing team, there is no question that a constructive collegiality among the physicians and nurses has provided an environment to allow these positive aspects to flourish.
OVERCOMING ROADBLOCKS
Obviously, although in theory it is easy to proclaim a PCCP paradigm, in reality the roadblocks are many.
For example, standardization of education and credentialing would be an essential hurdle to overcome. The current educational arrangement of the various adult specialties (anesthesiology, internal medicine, surgery), each offering disparate subspecialty critical care training and certification, is deeply rooted in interdisciplinary politics, but without any demonstration of improved patient care.13 As described recently by Kaplan and Shaw,14 an all-encompassing training and credentialing standard for critical care is essential for 21st century medicine and would go a long way toward development of the PCCP paradigm.
Another major roadblock is the shortage of intensivists in the United States.13 There are many reasons why physicians opt not to select critical care as a career, such as a non-straight-forward training pathway (as described above), recognition that the 24-hours per day, 7-days-per-week nature of critical care affects lifestyle issues, and inconsistent physician compensation.13
However, technological and personnel advances, including the use of electronic (e-ICU)15 and mid-level practitioner models, have led to creative approaches to extend critical care coverage.13
Additionally, the multitude of physician specialty stakeholders and the overall flux of the future of medical care in the United States all would contribute to the difficulties of prioritizing the implementation of the PCCP concept. Also, our practice style—a large intensivist group working in an ostensibly closed surgical ICU in a tertiary-care hospital—is one possible model, as is the even more highly evolved Cleveland Clinic medical ICU, where medical intensivists are already essentially PCCPs. But these models of care may not be generalizable among the local care patterns and medical politics across hospitals or ICUs.
Based on the described successes of our practice model, coupled with evidence in the literature, we have proposed a paradigm shift toward the concept of a PCCP. To be sure, paradigm shifts nearly always require time, effort, and wherewithal. In the end, however, we feel that embracement of the PCCP paradigm would result in a concise, discrete understanding of the role of intensivist, eliminate the specialty’s identity crisis, and ultimately improve patient care.
- Bloomfield EL. The impact of economics on changing medical technology with reference to critical care medicine in the United States. Anesth Analg 2003; 96:418–425.
- Gajic O, Afessa B. Physician staffing models and patient safety in the ICU. Chest 2009; 135:1038–1044.
- Baggs JG, Schmitt MH, Mushlin AI, et al. Association between nurse-physician collaboration and patient outcomes in three intensive care units. Crit Care Med 1999; 27:1991–1998.
- Hanson CW, Deutschman CS, Anderson HL, et al. Effects of an organized critical care service on outcomes and resource utilization: a cohort study. Crit Care Med 1999; 27:270–274.
- Pronovost PJ, Angus DC, Dorman T, Robinson KA, Dremsizov TT, Young TL. Physician staffing patterns and clinical outcomes in critically ill patients: a systematic review. JAMA 2002; 288:2151–2162.
- Levy MM, Rapoport J, Lemeshow S, Chalfin DB, Phillips G, Danis M. Association between critical care physician management and patient mortality in the intensive care unit. Ann Intern Med 2008; 148:801–809.
- Kim MM, Barnato AE, Angus DC, Fleisher LA, Kahn JM. The effect of multidisciplinary care teams on intensive care unit mortality. Arch Intern Med 2010; 170:369–376.
- Carson SS, Stocking C, Podsadecki T, et al. Effects of organizational change in the medical intensive care unit of a teaching hospital: a comparison of ‘open’ and ‘closed’ formats. JAMA 1996; 276:322–328.
- Treggiari MM, Martin DP, Yanez ND, Caldwell E, Hudson LD, Rubenfeld GD. Effect of intensive care unit organizational model and structure on outcomes in patients with acute lung injury. Am J Respir Crit Care Med 2007; 176:685–690.
- Angus DC, Kelley MA, Schmitz RJ, White A, Popovich J; Committee on Manpower for Pulmonary and Critical Care Societies (COMPACCS). Caring for the critically ill patient. Current and projected workforce requirements for care of the critically ill and patients with pulmonary disease: can we meet the requirements of an aging population? JAMA 2000; 284:2762–2770.
- Boutros AR. Anesthesiology and intensive care (editorial). Anesthesiology 1974; 41:319–320.
- Boyle WA. A critical time for anesthesiology? American Society of Anesthesiologists (ASA) Newsletter, September 2009;10–11. http://viewer.zmags.com/publication/9960917c#/9960917c/12. Accessed July 13, 2011.
- Ewart GW, Marcus L, Gaba MM, Bradner RH, Medina JL, Chandler EB. The critical care medicine crisis: a call for federal action: a white paper from the critical care professional societies. Chest 2004; 125:1518–1521.
- Kaplan LJ, Shaw AD. Standards for education and credentialing in critical care medicine. JAMA 2011; 305:296–297.
- Leong JR, Sirio CA, Rotondi AJ. eICU program favorably affects clinical and economic outcomes. Crit Care 2005, http://ccforum.com/content/9/5/E22. Accessed July 13, 2011.
Update in intensive care medicine: Studies that challenged our practice in the last 5 years
We have seen significant growth in clinical research in critical care medicine in the last decade. Advances have been made in many important areas in this field; of these, advances in treating septic shock and acute respiratory distress syndrome (ARDS), and also in supportive therapies for critically ill patients (eg, sedatives, insulin), have perhaps received the most attention.
Of note, several once-established therapies in these areas have failed the test of time, as the result of evidence from more-recent clinical trials. For example, recent studies have shown that a pulmonary arterial catheter does not improve outcomes in patients with ARDS. Similarly, what used to be “optimal” fluid management in patients with ARDS is no longer considered appropriate.
In this review, we summarize eight major studies in critical care medicine published in the last 5 years, studies that have contributed to changes in our practice in the intensive care unit (ICU).
FLUID MANAGEMENT IN ARDS
Key points
- In patients with acute lung injury (ALI) and ARDS, fluid restriction is associated with better outcomes than a liberal fluid policy.
- A pulmonary arterial catheter is not necessary and, compared with a central venous catheter, may result in more complications in patients with ALI and ARDS.
Background
Fluid management practices in patients with ARDS have been extremely variable. Two different approaches are commonly used: the liberal or “wet” approach to optimize tissue perfusion and the “dry” approach, which focuses on reducing lung edema. Given that most deaths attributed to ARDS result from extrapulmonary organ failure, aggressive fluid restriction has been the less popular approach.
Additionally, although earlier studies and meta-analyses suggested that the use of a pulmonary arterial catheter was not associated with better outcomes in critically ill patients,1 controversy remained regarding the value of a pulmonary arterial catheter compared with a central venous catheter in guiding fluid management in patients with ARDS, and data were insufficient to prove one strategy better than the other.
The Fluids and Catheter Treatment Trial (FACTT)
NATIONAL HEART, LUNG, AND BLOOD INSTITUTE ACUTE RESPIRATORY DISTRESS SYNDROME (ARDS) CLINICAL TRIALS NETWORK; WIEDEMANN HP, WHEELER AP, BERNARD GR, ET AL. COMPARISON OF TWO FLUID-MANAGEMENT STRATEGIES IN ACUTE LUNG INJURY. N ENGL J MED 2006; 354:2564–2575.
NATIONAL HEART, LUNG, AND BLOOD INSTITUTE ACUTE RESPIRATORY DISTRESS SYNDROME (ARDS) CLINICAL TRIALS NETWORK; WHEELER AP, BERNARD GR, THOMPSON BT, ET AL. PULMONARY-ARTERY VERSUS CENTRAL VENOUS CATHETER TO GUIDE TREATMENT OF ACUTE LUNG INJURY. N ENGL J MED 2006; 354:2213–2224.
The Fluids and Catheter Treatment Trial (FACTT) compared two fluid strategies2 and also the utility of a pulmonary arterial catheter vs a central venous catheter3 in patients with ALI or ARDS.
This two-by-two factorial trial randomized 1,000 patients to be treated according to either a conservative (fluid-restrictive or “dry”) or a liberal (“wet”) fluid management strategy for 7 days. Additionally, they were randomly assigned to receive either a central venous catheter or a pulmonary arterial catheter. The trial thus had four treatment groups:
- Fluid-restricted and a central venous catheter, with a goal of keeping the central venous pressure below 4 mm Hg
- Fluid-restricted and a pulmonary arterial catheter: fluids were restricted and diuretics were given to keep the pulmonary artery occlusion pressure below 8 mm Hg
- Fluid-liberal and a central venous catheter: fluids were given to keep the central venous pressure between 10 and 14 mm Hg
- Fluid-liberal and a pulmonary arterial catheter: fluids were given to keep the pulmonary artery occlusion pressure between 14 and 18 mm Hg.
The primary end point was the mortality rate at 60 days. Secondary end points included the number of ventilator-free days and organ-failure-free days and parameters of lung physiology. All patients were managed with a low-tidal-volume strategy.
The ‘dry’ strategy was better
The cumulative fluid balance was −136 mL ± 491 mL in the “dry” group and 6,992 mL ± 502 mL in the “wet” group, a difference of more than 7 L (P < .0001). Of note, before randomization, the patients were already fluid-positive, with a mean total fluid balance of +2,700 mL).2
At 60 days, no statistically significant difference in mortality rate was seen between the fluid-management groups (25.5% in the dry group vs 28.4% in the wet group (P = .30). Nevertheless, patients in the dry group had better oxygenation indices and lung injury scores (including lower plateau airway pressure), resulting in more ventilator-free days (14.6 ± 0.5 vs 12.1 ± 0.5; P = .0002) and ICU-free days (13.4 ± 0.4 vs 11.2 ± 0.4; P = .0003).2
Although those in the dry-strategy group had a slightly lower cardiac index and mean arterial pressure, they did not have a higher incidence of shock.
More importantly, the dry group did not have a higher rate of nonpulmonary organ failure. Serum creatinine and blood urea nitrogen concentrations were slightly higher in this group, but this was not associated with a higher incidence of renal failure or the use of dialysis: 10% in the dry-strategy group vs 14% in the wet-strategy group; P = .0642).2
No advantage with a pulmonary arterial catheter
The mortality rate did not differ between the catheter groups. However, the patients who received a pulmonary arterial catheter stayed in the ICU 0.2 days longer and had twice as many nonfatal cardiac arrhythmias as those who received a central venous catheter.3
Comments
The liberal fluid-strategy group had fluid balances similar to those seen in previous National Institutes of Health ARDS Network trials in which fluid management was not controlled. This suggests that the liberal fluid strategy reflects usual clinical practice.
Although the goals used in this study (central venous pressure < 4 mm Hg or pulmonary artery occlusion pressure < 8 mm Hg) could be difficult to achieve in clinical practice, a conservative strategy of fluid management is preferred in patients with ALI or ARDS, given the benefits observed in this trial.
A pulmonary arterial catheter is not indicated to guide hemodynamic management of patients with ARDS.
CORTICOSTEROID USE IN ARDS
Key points
- In selected patients with ARDS, the prolonged use of corticosteroids may result in better oxygenation and a shorter duration of mechanical ventilation.
- Late use of corticosteroids in patients with ARDS (> 14 days after diagnosis) is not indicated and may increase the risk of death.
- The role of corticosteroids in early ARDS (< 7 days after diagnosis) remains controversial.
Background
Systemic corticosteroid therapy was commonly used in ARDS patients in the 1970s and 1980s. However, a single-center study published in the late 1980s showed that a corticosteroid in high doses (methylprednisolone 30 mg/kg) resulted in more complications and was not associated with a lower mortality rate.4 On the other hand, a small study that included only patients with persistent ARDS (defined as ARDS lasting for more than 7 days) subsequently showed that oxygenation was significantly better and that fewer patients died while in the hospital with the use of methylprednisolone 2 mg/kg for 32 days.5
In view of these divergent findings, the ARDS Network decided to perform a study to help understand the role of corticosteroids in ARDS.
The Late Steroid Rescue Study (LaSRS)
STEINBERG KP, HUDSON LD, GOODMAN RB, ET AL; NATIONAL HEART, LUNG, AND BLOOD INSTITUTE ACUTE RESPIRATORY DISTRESS SYNDROME (ARDS) CLINICAL TRIALS NETWORK. EFFICACY AND SAFETY OF CORTICOSTEROIDS FOR PERSISTENT ACUTE RESPIRATORY DISTRESS SYNDROME. N ENGL J MED 2006; 354:1671–1684.
The Late Steroid Rescue Study (LaSRS),6 a double-blind, multicenter trial, randomly assigned 180 patients with persistent ARDS (defined as ongoing disease 7–28 days after its onset) to receive methylprednisolone or placebo for 21 days.
Methylprednisolone was given in an initial dose of 2 mg/kg of predicted body weight followed by a dose of 0.5 mg/kg every 6 hours for 14 days and then a dose of 0.5 mg/kg every 12 hours for 7 days, and then it was tapered over 2 to 4 days and discontinued. It could be discontinued if 21 days of treatment were completed or if the patient was able to breathe without assistance.
The primary end point was the mortality rate at 60 days. Secondary end points included the number of ventilator-free days, organ-failure-free days, and complications and the levels of biomarkers of inflammation.
No reduction in mortality rates with steroids
The mortality rates did not differ significantly in the corticosteroid group vs the placebo group at 60 days:
- 29.2% with methylprednisolone (95% confidence interval [CI] 20.8–39.4)
- 28.6% with placebo (95% CI 20.3–38.6, P = 1.0).
Mortality rates at 180 days were also similar between the groups:
- 31.5% with methylprednisolone (95% CI 22.8–41.7)
- 31.9% with placebo (95% CI 23.2–42.0, P = 1.0).
In patients randomized between 7 and 13 days after the onset of ARDS, the mortality rates were lower in the methylprednisolone group than in the placebo group but the differences were not statistically significant. The mortality rate in this subgroup was 27% vs 36% (P = .26) at 60 days and was 27% vs 39% (P = .14) at 180 days.
However, in patients randomized more than 14 days after the onset of ARDS, the mortality rate was significantly higher in the methylprednisolone group than in the placebo group at 60 days (35% vs 8%, P = .02) and at 180 days (44% vs 12%, P = .01).
Some benefit in secondary outcomes
At day 28, methylprednisolone was associated with:
- More ventilator-free days (11.2 ± 9.4 vs 6.8 ± 8.5, P < .001)
- More shock-free days (20.7 ± 8.9 vs 17.9 ± 10.2, P = .04)
- More ICU-free days (8.9 ± 8.2 vs 6.7 ± 7.8, P = .02).
Similarly, pulmonary physiologic indices were better with methylprednisolone, specifically:
- The ratio of Pao2 to the fraction of inspired oxygen at days 3, 4, and 14 (P < .05)
- Plateau pressure at days 4, 5, and 7 (P < .05)
- Static compliance at days 7 and 14 (P < .05).
In terms of side effects, methylprednisolone was associated with more events associated with myopathy or neuropathy (9 vs 0, P = .001), but there were no differences in the number of serious infections or in glycemic control.
Comments
Although other recent studies suggested that corticosteroid use may be associated with a reduction in mortality rates,7–9 LaSRS did not confirm this effect. Although the doses and length of therapy were similar in these studies, LaSRS was much larger and included patients from the ARDS Network.
Nevertheless, LaSRS was criticized because of strict exclusion criteria and poor enrollment (only 5% of eligible patients were included). Additionally, it was conducted over a period of time when some ICU practices varied significantly (eg, low vs high tidal volume ventilation, tight vs loose glucose control).
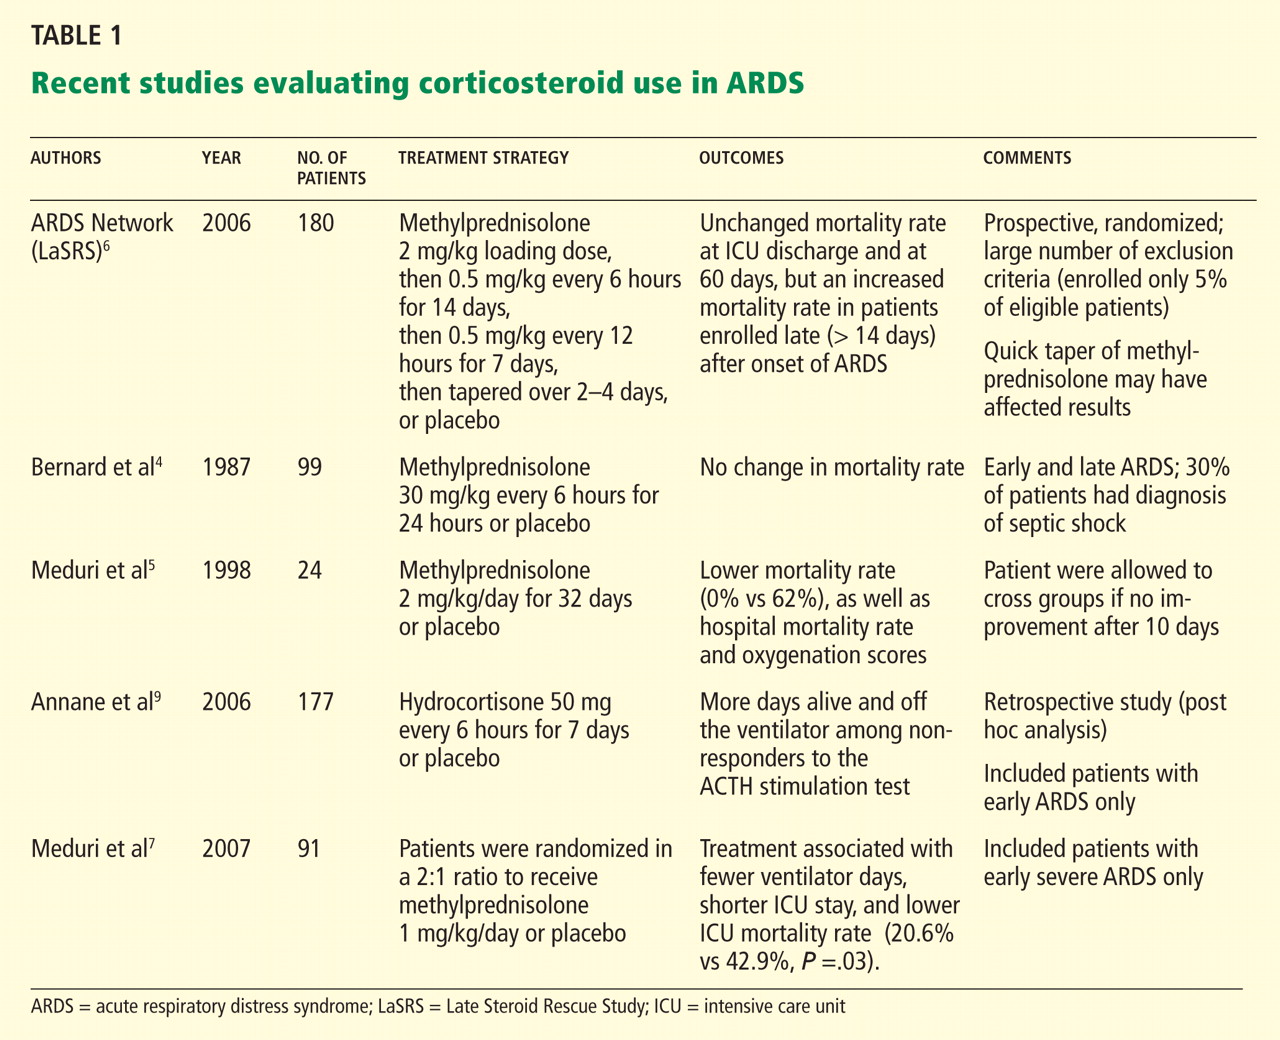
INTERRUPTING SEDATION DURING MECHANICAL VENTILATION
Key points
- Daily awakening of mechanically ventilated patients is safe.
- Daily interruption of sedation in mechanically ventilated patients is associated with a shorter length of mechanical ventilation.
Background
Sedatives are a central component of critical care. Continuous infusions of narcotics, benzodiazepines, and anesthetic agents are frequently used to promote comfort in patients receiving mechanical ventilation.
Despite its widespread use in the ICU, there is little evidence that such sedation improves outcomes. Observational and randomized trials10–12 have shown that patients who receive continuous infusions of sedatives need to be on mechanical ventilation longer than those who receive intermittent dosing. Additionally, an earlier randomized controlled trial13 showed that daily interruption of sedative drug infusions decreased the duration of mechanical ventilation by almost 50% and resulted in a reduction in the length of stay in the ICU.
Despite these findings, many ICU physicians remain skeptical of the value of daily interruption of sedative medications and question the safety of this practice.
The Awakening and Breathing Controlled (ABC) trial
GIRARD TD, KRESS JP, FUCHS BD, ET AL. EFFICACY AND SAFETY OF A PAIRED SEDATION AND VENTILATOR WEANING PROTOCOL FOR MECHANICALLY VENTILATED PATIENTS IN INTENSIVE CARE (AWAKENING AND BREATHING CONTROLLED TRIAL): A RANDOMISED CONTROLLED TRIAL. LANCET 2008; 371:126–134.
The Awakening and Breathing Controlled (ABC) trial14 was a multicenter, randomized controlled trial that included 336 patients who required at least 12 consecutive hours of mechanical ventilation. All patients had to be receiving patient-targeted sedation.
Those in the intervention group (n = 168) had their sedation interrupted every day, followed by a clinical assessment to determine whether they could be allowed to try breathing spontaneously. The control group (n = 168) also received a clinical assessment for a trial of spontaneous breathing, while their sedation was continued as usual.
In patients in the intervention group who failed the screening for a spontaneous breathing trial, the sedatives were resumed at half the previous dose. Criteria for failure on the spontaneous breathing trial included any of the following: anxiety, agitation, respiratory rate more than 35 breaths per minute for 5 minutes or longer, cardiac arrhythmia, oxygen saturation less than 88% for 5 minutes or longer, or two or more signs of respiratory distress, tachycardia, bradycardia, paradoxical breathing, accessory muscle use, diaphoresis, or marked dyspnea.
Interrupting sedation was superior
The combination of sedation interruption and a spontaneous breathing trial was superior to a spontaneous breathing trial alone. The mean number of ventilator-free days:
- 14.7 ± 0.9 with sedation interruption
- 11.6 ± 0.9 days with usual care (P = .02).
The median time to ICU discharge:
- 9.1 days with sedation interruption (interquartile range 5.1 to 17.8)
- 12.9 days with usual care (interquartile range 6.0 to 24.2, P = .01).
The mortality rate at 28 days:
- 28% with sedation interruption
- 35% with usual care (P = .21).
The mortality rate at 1 year:
- 44% with sedation interruption
- 58% with usual care (hazard ratio [HR] in the intervention group 0.68, 95% CI 0.50–0.92, P = .01).
Of note, patients in the intervention group had a higher rate of self-extubation (9.6% vs 3.6%, P = .03), but the rate of reintubation was similar between the groups (14% vs 13%, P = .47).
Comments
The addition of daily awakenings to spontaneous breathing trials results in a further reduction in the number of ICU days and increases the number of ventilator-free days.
Of note, the protocol allowed patients in the control group to undergo a spontaneous breathing trial while on sedatives (69% of the patients were receiving sedation at the time). Therefore, a bias effect in favor of the intervention group cannot be excluded. However, both groups had to meet criteria for readiness for spontaneous breathing.
The study demonstrates the safety of daily awakenings and confirms previous findings suggesting that a daily trial of spontaneous breathing results in better ICU outcomes.
GLUCOSE CONTROL IN THE ICU
Key points
- Although earlier studies suggested that intensive insulin therapy might be beneficial in critically ill patients, new findings show that strict glucose control can lead to complications without improving outcomes.
Background
A previous study15 found that intensive insulin therapy to maintain a blood glucose level between 80 and 110 mg/dL (compared with 180–200 mg/dL) reduced the mortality rate in surgical critical care patients. The mortality rate in the ICU was 4.6% with intensive insulin therapy vs 8.0% with conventional therapy (P < .04), and the effect was more robust for patients who remained longer than 5 days in the ICU (10.6% vs 20.2%).
Importantly, however, hypoglycemia (defined as blood glucose ≤ 40 mg/dL) occurred in 39 patients in the intensive-treatment group vs 6 patients in the conventional-treatment group.
The NICE-SUGAR trial
NICE-SUGAR STUDY INVESTIGATORS; FINFER S, CHITTOCK DR, SU SY, ET AL. INTENSIVE VERSUS CONVENTIONAL GLUCOSE CONTROL IN CRITICALLY ILL PATIENTS. N ENGL J MED 2009; 360:1283–1297.
The Normoglycemia in Intensive Care Evaluation-Survival Using Glucose Algorithm Regulation (NICE-SUGAR) trial16 randomized 6,104 patients in medical and surgical ICUs to receive either intensive glucose control (blood glucose 81–108 mg/dL) with insulin therapy or conventional glucose control (blood glucose < 180 mg/dL). In the conventional-control group, insulin was discontinued if the blood glucose level dropped below 144 mg/dL.
A higher mortality rate with intensive glucose control
As expected, the intensive-control group achieved lower blood glucose levels: 115 vs 144 mg/dL.
Nevertheless, intensive glucose control was associated with a higher incidence of severe hypoglycemia, defined as a blood glucose level lower than 40 mg/dL: 6.8% vs 0.5%.
More importantly, compared with conventional insulin therapy, intensive glucose control was associated with a higher 90-day mortality rate: 27.5% vs 24.9% (odds ratio 1.14, 95% CI 1.02–1.28). These findings were similar in the subgroup of surgical patients (24.4% vs 19.8%, odds ratio 1.31, 95% CI 1.07–1.61).
Comments
Of note, the conventional-control group had more patients who discontinued the treatment protocol prematurely. Additionally, more patients in this group received corticosteroids.
These results widely differ from those of a previous study by van den Berghe et al,15 which showed that tight glycemic control is associated with a survival benefit. The differences in outcomes are probably largely related to different patient populations, as van den Berghe et al included patients who had undergone cardiac surgery, who were more likely to benefit from strict blood glucose control.
The VISEP trial
BRUNKHORST FM, ENGEL C, BLOOS F, ET AL; GERMAN COMPETENCE NETWORK SEPSIS (SEPNET). INTENSIVE INSULIN THERAPY AND PENTASTARCH RESUSCITATION IN SEVERE SEPSIS. N ENGL J MED 2008; 358:125–139.
The Volume Substitution and Insulin Therapy in Severe Sepsis (VISEP) trial was a multicenter study designed to compare intensive insulin therapy (target blood glucose level 80–110 mg/dL) and conventional glucose control (target blood glucose level 180–200 mg/dL) in patients with severe sepsis.17 It also compared two fluids for volume resuscitation: 10% pentastarch vs modified Ringer's lactate. It included both medical and surgical patients.
Trial halted early for safety reasons
The mean morning blood glucose level was significantly lower in the intensive insulin group (112 vs 151 mg/dL).
Severe hypoglycemia (blood glucose ≤ 40 mg/dL) was more common in the group that received intensive insulin therapy (17% vs 4.1%, P < .001).
Mortality rates at 28 days did not differ significantly: 24.7% with intensive control vs 26.0% with conventional glucose control. The mortality rate at 90 days was 39.7% in the intensive therapy group and 35.4% in the conventional therapy group, but the difference was not statistically significant.
The intensive insulin arm of the trial was stopped after 488 patients were enrolled because of a higher rate of hypoglycemia (12.1% vs 2.1%) and of serious adverse events (10.9% vs 5.2%).
Additionally, the fluid resuscitation arm of the study was suspended at the first planned interim analysis because of a higher risk of organ failure in the 10% pentastarch group.
CORTICOSTEROID THERAPY IN SEPTIC SHOCK
Key points
- Corticosteroid therapy improves hemodynamic outcomes in patients with severe septic shock.
- Although meta-analyses suggest the mortality rate is lower with corticosteroid therapy, there is not enough evidence from randomized controlled trials to prove that the use of low-dose corticosteroids lowers the mortality rate in patients with septic shock.
- The corticotropin (ACTH) stimulation test should not be used to determine the need for corticosteroids in patients with septic shock.
Background
A previous multicenter study,18 performed in France, found that the use of corticosteroids in patients with septic shock resulted in lower rates of death at 28 days, in the ICU, and in the hospital and a shorter time to vasopressor withdrawal. Nevertheless, the beneficial effects were not observed in patients with adequate adrenal reserve (based on an ACTH stimulation test).
This study was criticized because of a high mortality rate in the placebo group.
The CORTICUS study
SPRUNG CL, ANNANE D, KEH D, ET AL; CORTICUS STUDY GROUP. HYDROCORTISONE THERAPY FOR PATIENTS WITH SEPTIC SHOCK. N ENGL J MED 2008; 358:111–124.
The Corticosteroid Therapy of Septic Shock (CORTICUS) study was a multicenter trial that randomly assigned 499 patients with septic shock to receive hydrocortisone (50 mg intravenously every 6 hours for 5 days, followed by a 6-day taper period) or placebo.19
Patients were eligible to be enrolled within 72 hours of onset of shock. Similar to previous studies, the CORTICUS trial classified patients on the basis of an ACTH stimulation test as having inadequate adrenal reserve (a cortisol increase of ≤ 9 μg/dL) or adequate adrenal reserve (a cortisol increase of > 9 μg/dL).
Faster reversal of shock with steroids
At baseline, the mean Simplified Acute Physiologic Score II (SAPS II) was 49 (the range of possible scores is 0 to 163; the higher the score the worse the organ dysfunction).
Hydrocortisone use resulted in a shorter duration of vasopressor use and a faster reversal of shock (3.3 days vs 5.8 days, P < .001).
This association was the same when patients were divided according to response to ACTH stimulation test. Time to reversal of shock in responders:
- 2.8 days with hydrocortisone
- 5.8 days with placebo (P < .001).
Time to reversal of shock in nonresponders:
- 3.9 days with hydrocortisone
- 6.0 days with placebo (P = .06).
Nevertheless, the treatment did not reduce the mortality rate at 28 days overall (34.3% vs 31.5% P = .51), or in the subgroups based on response to ACTH, or at any other time point. A post hoc analysis suggested that patients who had a systolic blood pressure of less than 90 mm Hg within 30 minutes of enrollment had a greater benefit in terms of mortality rate, but the effect was not statistically significant: the absolute difference was −11.2% (P = 0.28). Similarly, post hoc analyses also revealed a higher rate of death at 28 days in patients who received etomidate (Amidate) before randomization in both groups (P = .03).
Importantly, patients who received corticosteroids had a higher incidence of superinfections, including new episodes of sepsis or septic shock, with a combined odds ratio of 1.37 (95% CI 1.05–1.79).
Length of stay in the hospital or in the ICU was similar in patients who received corticosteroids and in those who received placebo. The ICU length of stay was 19 ± 31 days with hydrocortisone vs 18 ± 17 days with placebo (P = .51).
Comments
The CORTICUS trial showed that low-dose corticosteroid therapy results in faster reversal of shock in patients with severe septic shock. The hemodynamic benefits are present in all patients regardless of response to the ACTH stimulation test.
Nevertheless, contrary to previous findings,18 corticosteroid use was not associated with an improvement in mortality rates. Important differences exist between these two studies:
- The mortality rates in the placebo groups were significantly different (> 50% in the French study vs 30% in CORTICUS).
- The SAPS II scores were different in these two trials (55 vs 49), suggesting a greater severity of illness in the French study.
- The criteria for enrollment were different: the French study included patients who had a systolic blood pressure lower than 90 mm Hg for more than 1 hour despite fluid administration and vasopressor use, whereas the CORTICUS trial included patients who had a systolic blood pressure lower than 90 mm Hg for more than 1 hour despite fluid administration or vasopressor use.
- The time of enrollment was different: patients were enrolled much faster in the French study (within 8 hours) than in the CORTICUS trial (within 72 hours).
A recent meta-analysis of 17 randomized trials (including the CORTICUS study), found that, compared with those who received placebo, patients who received corticosteroids had a small reduction in the 28-day mortality rate (HR 0.84, 95% CI 0.71–1.00, P < .05).20 Of note, this meta-analysis has been criticized for possible publication bias and also for a large degree of heterogeneity in its results.21
VASOPRESSOR THERAPY IN SHOCK
Key points
- Vasopressin use in patients with severe septic shock is not associated with an improvement in mortality rates.
- Vasopressin should not be used as a first-line agent in patients with septic shock.
- Norepinephrine should be considered a first-line agent in patients with shock.
- Compared with norepinephrine, the use of dopamine in patients with shock is associated with similar mortality rates, although its use may result in a greater number of cardiac adverse events.
Background
Vasopressin gained popularity in critical care in the last 10 years because several small studies showed that adding it improves hemodynamics and results in a reduction in the doses of catecholamines in patients with refractory septic shock.22 Furthermore, the Surviving Sepsis Campaign guidelines recommended the use of vasopressin in patients who have refractory shock despite fluid resuscitation and the use of other “conventional” vasopressors.23
Despite these positive findings, it remained unknown if the use of vasopressin increases the survival rate in patients with septic shock.
The Vasopressin and Septic Shock Trial (VASST)
RUSSELL JA, WALLEY KR, SINGER J, ET AL; VASST INVESTIGATORS. VASOPRESSIN VERSUS NOREPINEPHRINE INFUSION IN PATIENTS WITH SEPTIC SHOCK. N ENGL J MED 2008; 358:877–887.
The Vasopressin and Septic Shock Trial (VASST)24 was a multicenter randomized, double-blind, controlled trial that included 778 patients with refractory septic shock. Refractory shock was defined as the lack of a response to a normal saline fluid bolus of 500 mL or the need for vasopressors (norepinephrine in doses of at least 5 μg/minute or its equivalent for 6 hours or more in the 24 hours before randomization).
Two subgroups were identified: those with severe septic shock (requiring norepinephrine in doses of 15 μg/minute or higher) and those with less-severe septic shock (needing norepinephrine in doses of 5 to 14 μg/minute). Patients with unstable coronary artery disease (acute myocardial infarction, angina) and severe congestive heart failure were excluded.
Patients were randomized to receive an intravenous infusion of vasopressin (0.01–0.03 U/minute) or norepinephrine (5–15 mg/minute) in addition to open-labeled vasopressors (excluding vasopressin). The primary outcome was the all-cause mortality rate at 28 days.
Results
At 28 days, fewer patients had died in the vasopressin group than in the norepinephrine group (35.4% vs 39.3%), but the difference was not statistically significant (P = .26). The trend was the same at 90 days (mortality rate 43.9% vs 49.6%, P = .11).
Subgroup analysis showed that in patients with less-severe septic shock, those who received vasopressin had a lower mortality rate at 28 days (26.5% vs 35.7%, P = .05; relative risk 0.74; 95% CI 0.55–1.01) and at 90 days (35.8% vs 46.1%, P = .04; relative risk 0.78, 95% CI 0.61–0.99).
There were no statistically significant differences in any of the other secondary outcomes or in serious adverse events.
Comments
The study has been criticized for several reasons:
- The mean arterial blood pressure at baseline before initiation of vasopressin was 72 mm Hg (and some argue that vasopressin was therefore not needed by the time it was started).
- The time from screening to infusion of the study drug was very long (12 hours).
- The observed mortality rate was lower than expected (37%).
Despite these considerations, the VASST trial showed that vasopressin is not associated with an increased number of adverse events in patients without active cardiovascular disease. The possible benefit in terms of the mortality rate in the subgroup of patients with less-severe septic shock requires further investigation.
Is dopamine equivalent to norepinephrine?
Previously, the Sepsis Occurrence in Acutely Ill Patients (SOAP) study, a multicenter, observational cohort study, found that dopamine use was associated with a higher all-cause mortality rate in the ICU compared with no dopamine.25 This finding had not been reproduced, as few well-designed studies had compared the effects of dopamine and norepinephrine.
The SOAP II study
DE BACKER D, BISTON P, DEVRIENDT J, ET AL; SOAP II INVESTIGATORS.. COMPARISON OF DOPAMINE AND NOREPINEPHRINE IN THE TREATMENT OF SHOCK. N ENGL J MED 2010; 362:779–789.
The SOAP II study,26 a multicenter, randomized trial, compared dopamine vs norepinephrine as first-line vasopressor therapy. In patients with refractory shock despite use of dopamine 20 μg/kg/minute or norepinephrine 0.19 μg/kg/minute, open-label norepinephrine, epinephrine, or vasopressin was added.
The primary outcome was the mortality rate at 28 days after randomization; secondary end points included the number of days without need for organ support and the occurrence of adverse events.
Results
A total of 1,679 patients were included; 858 were assigned to dopamine and 821 to norepinephrine. Most (1,044, 62%) of the patients had a diagnosis of septic shock.
No significant difference in mortality rates was noted at 28 days: 52.5% with dopamine vs 48.5% with norepinephrine (P = .10).
However, there were more arrhythmias in the patients treated with dopamine: 207 events (24.1%) vs 102 events (12.4%) (P < .001). The number of other adverse events such as renal failure, myocardial infarction, arterial occlusion, or skin necrosis was not different between the groups.
A subgroup analysis showed that dopamine was associated with more deaths at 28 days in patients with cardiogenic shock (P = .03) but not in patients with septic shock (P = .19) or with hypovolemic shock (P = .84).
Comments
The study was criticized because the patients may not have received adequate fluid resuscitation (the study considered adequate resuscitation to be equivalent to 1 L of crystalloids or 500 mL of colloids), as different degrees of volume depletion among patients make direct comparisons of vasopressor effects difficult.
Additionally, the study defined dopamine 20 μg/kg/minute as being equipotent with norepinephrine 0.19 μg/kg/minute. Comparisons of potency between drugs are difficult to establish, as there are no available data.
Nevertheless, this study further confirms previous findings suggesting that norepinephrine is not associated with more end-organ damage (such as renal failure or skin ischemia), and shows that dopamine may increase the number of adverse events, particularly in patients with cardiac disease.
- Shah MR, Hasselblad V, Stevenson LW, et al. Impact of the pulmonary artery catheter in critically ill patients: meta-analysis of randomized clinical trials. JAMA 2005; 294:1664–1670.
- National Heart, Lung, and Blood Institute Acute Respiratory Distress Syndrome (ARDS) Clinical Trials Network; Wiedemann HP, Wheeler AP, Bernard GR, et al. Comparison of two fluid-management strategies in acute lung injury. N Engl J Med 2006; 354:2564–2575.
- National Heart, Lung, and Blood Institute Acute Respiratory Distress Syndrome (ARDS) Clinical Trials Network; Wheeler AP, Bernard GR, Thompson BT, et al. Pulmonary-artery versus central venous catheter to guide treatment of acute lung injury. N Engl J Med 2006; 354:2213–2224.
- Bernard GR, Luce JM, Sprung CL, et al. High-dose corticosteroids in patients with the adult respiratory distress syndrome. N Engl J Med 1987; 317:1565–1570.
- Meduri GU, Headley AS, Golden E, et al. Effect of prolonged methylprednisolone therapy in unresolving acute respiratory distress syndrome: a randomized controlled trial. JAMA 1998; 280:159–165.
- Steinberg KP, Hudson LD, Goodman RB, et al; National Heart, Lung, and Blood Institute Acute Respiratory Distress Syndrome (ARDS) Clinical Trials Network. Efficacy and safety of corticosteroids for persistent acute respiratory distress syndrome. N Engl J Med 2006; 354:1671–1684.
- Meduri GU, Golden E, Freire AX, et al. Methylprednisolone infusion in early severe ARDS: results of a randomized controlled trial. Chest 2007; 131:954–963.
- Meduri GU, Golden E, Freire AX, et al. Methylprednisolone infusion in early severe ARDS results of a randomized controlled trial. 2007. Chest 2009; 136(suppl 5):e30.
- Annane D, Sébille V, Bellissant E; Ger-Inf-05 Study Group. Effect of low doses of corticosteroids in septic shock patients with or without early acute respiratory distress syndrome. Crit Care Med 2006; 34:22–30.
- Kollef MH, Levy NT, Ahrens TS, Schaiff R, Prentice D, Sherman G. The use of continuous i.v. sedation is associated with prolongation of mechanical ventilation. Chest 1998; 114:541–548.
- Carson SS, Kress JP, Rodgers JE, et al. A randomized trial of intermittent lorazepam versus propofol with daily interruption in mechanically ventilated patients. Crit Care Med 2006; 34:1326–1332.
- Brook AD, Ahrens TS, Schaiff R, et al. Effect of a nursing-implemented sedation protocol on the duration of mechanical ventilation. Crit Care Med 1999; 27:2609–2615.
- Kress JP, Pohlman AS, O’Connor MF, Hall JB. Daily interruption of sedative infusions in critically ill patients undergoing mechanical ventilation. N Engl J Med 2000; 342:1471–1477.
- Girard TD, Kress JP, Fuchs BD, et al. Efficacy and safety of a paired sedation and ventilator weaning protocol for mechanically ventilated patients in intensive care (Awakening and Breathing Controlled trial): a randomised controlled trial. Lancet 2008; 371:126–134.
- van den Berghe G, Wouters P, Weekers F, et al. Intensive insulin therapy in the critically ill patients. N Engl J Med 2001; 345:1359–1367.
- NICE-SUGAR Study Investigators; Finfer S, Chittock DR, Su SY, et al. Intensive versus conventional glucose control in critically ill patients. N Engl J Med 2009; 360:1283–1297.
- Brunkhorst FM, Engel C, Bloos F, et al; German Competence Network Sepsis (SepNet). Intensive insulin therapy and pentastarch resuscitation in severe sepsis. N Engl J Med 2008; 358:125–139.
- Annane D, Sébille V, Charpentier C, et al. Effect of treatment with low doses of hydrocortisone and fludrocortisone on mortality in patients with septic shock. JAMA 2002; 288:862–871.
- Sprung CL, Annane D, Keh D, et al; CORTICUS Study Group. Hydrocortisone therapy for patients with septic shock. N Engl J Med 2008; 358:111–124.
- Annane D, Bellissant E, Bollaert PE, et al. Corticosteroids in the treatment of severe sepsis and septic shock in adults: a systematic review. JAMA 2009; 301:2362–2375.
- Minneci PC, Deans KJ, Natanson C. Corticosteroid therapy for severe sepsis and septic shock [letter]. JAMA 2009; 302:16443–1644.
- Kampmeier TG, Rehberg S, Westphal M, Lange M. Vasopressin in sepsis and septic shock. Minerva Anestesiol 2010; 76:844–850.
- Dellinger RP, Levy MM, Carlet JM, et al; International Surviving Sepsis Campaign Guidelines Committee. Surviving Sepsis Campaign: international guidelines for management of severe sepsis and septic shock: 2008. Crit Care Med 2008; 36:296–327.
- Russell JA, Walley KR, Singer J, et al; VASST Investigators. Vasopressin versus norepinephrine infusion in patients with septic shock. N Engl J Med 2008; 358:877–887.
- Sakr Y, Reinhart K, Vincent JL, et al. Does dopamine administration in shock influence outcome? Results of the Sepsis Occurrence in Acutely Ill Patients (SOAP) Study. Crit Care Med 2006; 34:589–597.
- De Backer D, Biston P, Devriendt J, et al; SOAP II Investigators. Comparison of dopamine and norepinephrine in the treatment of shock. N Engl J Med 2010; 362:779–789.
We have seen significant growth in clinical research in critical care medicine in the last decade. Advances have been made in many important areas in this field; of these, advances in treating septic shock and acute respiratory distress syndrome (ARDS), and also in supportive therapies for critically ill patients (eg, sedatives, insulin), have perhaps received the most attention.
Of note, several once-established therapies in these areas have failed the test of time, as the result of evidence from more-recent clinical trials. For example, recent studies have shown that a pulmonary arterial catheter does not improve outcomes in patients with ARDS. Similarly, what used to be “optimal” fluid management in patients with ARDS is no longer considered appropriate.
In this review, we summarize eight major studies in critical care medicine published in the last 5 years, studies that have contributed to changes in our practice in the intensive care unit (ICU).
FLUID MANAGEMENT IN ARDS
Key points
- In patients with acute lung injury (ALI) and ARDS, fluid restriction is associated with better outcomes than a liberal fluid policy.
- A pulmonary arterial catheter is not necessary and, compared with a central venous catheter, may result in more complications in patients with ALI and ARDS.
Background
Fluid management practices in patients with ARDS have been extremely variable. Two different approaches are commonly used: the liberal or “wet” approach to optimize tissue perfusion and the “dry” approach, which focuses on reducing lung edema. Given that most deaths attributed to ARDS result from extrapulmonary organ failure, aggressive fluid restriction has been the less popular approach.
Additionally, although earlier studies and meta-analyses suggested that the use of a pulmonary arterial catheter was not associated with better outcomes in critically ill patients,1 controversy remained regarding the value of a pulmonary arterial catheter compared with a central venous catheter in guiding fluid management in patients with ARDS, and data were insufficient to prove one strategy better than the other.
The Fluids and Catheter Treatment Trial (FACTT)
NATIONAL HEART, LUNG, AND BLOOD INSTITUTE ACUTE RESPIRATORY DISTRESS SYNDROME (ARDS) CLINICAL TRIALS NETWORK; WIEDEMANN HP, WHEELER AP, BERNARD GR, ET AL. COMPARISON OF TWO FLUID-MANAGEMENT STRATEGIES IN ACUTE LUNG INJURY. N ENGL J MED 2006; 354:2564–2575.
NATIONAL HEART, LUNG, AND BLOOD INSTITUTE ACUTE RESPIRATORY DISTRESS SYNDROME (ARDS) CLINICAL TRIALS NETWORK; WHEELER AP, BERNARD GR, THOMPSON BT, ET AL. PULMONARY-ARTERY VERSUS CENTRAL VENOUS CATHETER TO GUIDE TREATMENT OF ACUTE LUNG INJURY. N ENGL J MED 2006; 354:2213–2224.
The Fluids and Catheter Treatment Trial (FACTT) compared two fluid strategies2 and also the utility of a pulmonary arterial catheter vs a central venous catheter3 in patients with ALI or ARDS.
This two-by-two factorial trial randomized 1,000 patients to be treated according to either a conservative (fluid-restrictive or “dry”) or a liberal (“wet”) fluid management strategy for 7 days. Additionally, they were randomly assigned to receive either a central venous catheter or a pulmonary arterial catheter. The trial thus had four treatment groups:
- Fluid-restricted and a central venous catheter, with a goal of keeping the central venous pressure below 4 mm Hg
- Fluid-restricted and a pulmonary arterial catheter: fluids were restricted and diuretics were given to keep the pulmonary artery occlusion pressure below 8 mm Hg
- Fluid-liberal and a central venous catheter: fluids were given to keep the central venous pressure between 10 and 14 mm Hg
- Fluid-liberal and a pulmonary arterial catheter: fluids were given to keep the pulmonary artery occlusion pressure between 14 and 18 mm Hg.
The primary end point was the mortality rate at 60 days. Secondary end points included the number of ventilator-free days and organ-failure-free days and parameters of lung physiology. All patients were managed with a low-tidal-volume strategy.
The ‘dry’ strategy was better
The cumulative fluid balance was −136 mL ± 491 mL in the “dry” group and 6,992 mL ± 502 mL in the “wet” group, a difference of more than 7 L (P < .0001). Of note, before randomization, the patients were already fluid-positive, with a mean total fluid balance of +2,700 mL).2
At 60 days, no statistically significant difference in mortality rate was seen between the fluid-management groups (25.5% in the dry group vs 28.4% in the wet group (P = .30). Nevertheless, patients in the dry group had better oxygenation indices and lung injury scores (including lower plateau airway pressure), resulting in more ventilator-free days (14.6 ± 0.5 vs 12.1 ± 0.5; P = .0002) and ICU-free days (13.4 ± 0.4 vs 11.2 ± 0.4; P = .0003).2
Although those in the dry-strategy group had a slightly lower cardiac index and mean arterial pressure, they did not have a higher incidence of shock.
More importantly, the dry group did not have a higher rate of nonpulmonary organ failure. Serum creatinine and blood urea nitrogen concentrations were slightly higher in this group, but this was not associated with a higher incidence of renal failure or the use of dialysis: 10% in the dry-strategy group vs 14% in the wet-strategy group; P = .0642).2
No advantage with a pulmonary arterial catheter
The mortality rate did not differ between the catheter groups. However, the patients who received a pulmonary arterial catheter stayed in the ICU 0.2 days longer and had twice as many nonfatal cardiac arrhythmias as those who received a central venous catheter.3
Comments
The liberal fluid-strategy group had fluid balances similar to those seen in previous National Institutes of Health ARDS Network trials in which fluid management was not controlled. This suggests that the liberal fluid strategy reflects usual clinical practice.
Although the goals used in this study (central venous pressure < 4 mm Hg or pulmonary artery occlusion pressure < 8 mm Hg) could be difficult to achieve in clinical practice, a conservative strategy of fluid management is preferred in patients with ALI or ARDS, given the benefits observed in this trial.
A pulmonary arterial catheter is not indicated to guide hemodynamic management of patients with ARDS.
CORTICOSTEROID USE IN ARDS
Key points
- In selected patients with ARDS, the prolonged use of corticosteroids may result in better oxygenation and a shorter duration of mechanical ventilation.
- Late use of corticosteroids in patients with ARDS (> 14 days after diagnosis) is not indicated and may increase the risk of death.
- The role of corticosteroids in early ARDS (< 7 days after diagnosis) remains controversial.
Background
Systemic corticosteroid therapy was commonly used in ARDS patients in the 1970s and 1980s. However, a single-center study published in the late 1980s showed that a corticosteroid in high doses (methylprednisolone 30 mg/kg) resulted in more complications and was not associated with a lower mortality rate.4 On the other hand, a small study that included only patients with persistent ARDS (defined as ARDS lasting for more than 7 days) subsequently showed that oxygenation was significantly better and that fewer patients died while in the hospital with the use of methylprednisolone 2 mg/kg for 32 days.5
In view of these divergent findings, the ARDS Network decided to perform a study to help understand the role of corticosteroids in ARDS.
The Late Steroid Rescue Study (LaSRS)
STEINBERG KP, HUDSON LD, GOODMAN RB, ET AL; NATIONAL HEART, LUNG, AND BLOOD INSTITUTE ACUTE RESPIRATORY DISTRESS SYNDROME (ARDS) CLINICAL TRIALS NETWORK. EFFICACY AND SAFETY OF CORTICOSTEROIDS FOR PERSISTENT ACUTE RESPIRATORY DISTRESS SYNDROME. N ENGL J MED 2006; 354:1671–1684.
The Late Steroid Rescue Study (LaSRS),6 a double-blind, multicenter trial, randomly assigned 180 patients with persistent ARDS (defined as ongoing disease 7–28 days after its onset) to receive methylprednisolone or placebo for 21 days.
Methylprednisolone was given in an initial dose of 2 mg/kg of predicted body weight followed by a dose of 0.5 mg/kg every 6 hours for 14 days and then a dose of 0.5 mg/kg every 12 hours for 7 days, and then it was tapered over 2 to 4 days and discontinued. It could be discontinued if 21 days of treatment were completed or if the patient was able to breathe without assistance.
The primary end point was the mortality rate at 60 days. Secondary end points included the number of ventilator-free days, organ-failure-free days, and complications and the levels of biomarkers of inflammation.
No reduction in mortality rates with steroids
The mortality rates did not differ significantly in the corticosteroid group vs the placebo group at 60 days:
- 29.2% with methylprednisolone (95% confidence interval [CI] 20.8–39.4)
- 28.6% with placebo (95% CI 20.3–38.6, P = 1.0).
Mortality rates at 180 days were also similar between the groups:
- 31.5% with methylprednisolone (95% CI 22.8–41.7)
- 31.9% with placebo (95% CI 23.2–42.0, P = 1.0).
In patients randomized between 7 and 13 days after the onset of ARDS, the mortality rates were lower in the methylprednisolone group than in the placebo group but the differences were not statistically significant. The mortality rate in this subgroup was 27% vs 36% (P = .26) at 60 days and was 27% vs 39% (P = .14) at 180 days.
However, in patients randomized more than 14 days after the onset of ARDS, the mortality rate was significantly higher in the methylprednisolone group than in the placebo group at 60 days (35% vs 8%, P = .02) and at 180 days (44% vs 12%, P = .01).
Some benefit in secondary outcomes
At day 28, methylprednisolone was associated with:
- More ventilator-free days (11.2 ± 9.4 vs 6.8 ± 8.5, P < .001)
- More shock-free days (20.7 ± 8.9 vs 17.9 ± 10.2, P = .04)
- More ICU-free days (8.9 ± 8.2 vs 6.7 ± 7.8, P = .02).
Similarly, pulmonary physiologic indices were better with methylprednisolone, specifically:
- The ratio of Pao2 to the fraction of inspired oxygen at days 3, 4, and 14 (P < .05)
- Plateau pressure at days 4, 5, and 7 (P < .05)
- Static compliance at days 7 and 14 (P < .05).
In terms of side effects, methylprednisolone was associated with more events associated with myopathy or neuropathy (9 vs 0, P = .001), but there were no differences in the number of serious infections or in glycemic control.
Comments
Although other recent studies suggested that corticosteroid use may be associated with a reduction in mortality rates,7–9 LaSRS did not confirm this effect. Although the doses and length of therapy were similar in these studies, LaSRS was much larger and included patients from the ARDS Network.
Nevertheless, LaSRS was criticized because of strict exclusion criteria and poor enrollment (only 5% of eligible patients were included). Additionally, it was conducted over a period of time when some ICU practices varied significantly (eg, low vs high tidal volume ventilation, tight vs loose glucose control).
INTERRUPTING SEDATION DURING MECHANICAL VENTILATION
Key points
- Daily awakening of mechanically ventilated patients is safe.
- Daily interruption of sedation in mechanically ventilated patients is associated with a shorter length of mechanical ventilation.
Background
Sedatives are a central component of critical care. Continuous infusions of narcotics, benzodiazepines, and anesthetic agents are frequently used to promote comfort in patients receiving mechanical ventilation.
Despite its widespread use in the ICU, there is little evidence that such sedation improves outcomes. Observational and randomized trials10–12 have shown that patients who receive continuous infusions of sedatives need to be on mechanical ventilation longer than those who receive intermittent dosing. Additionally, an earlier randomized controlled trial13 showed that daily interruption of sedative drug infusions decreased the duration of mechanical ventilation by almost 50% and resulted in a reduction in the length of stay in the ICU.
Despite these findings, many ICU physicians remain skeptical of the value of daily interruption of sedative medications and question the safety of this practice.
The Awakening and Breathing Controlled (ABC) trial
GIRARD TD, KRESS JP, FUCHS BD, ET AL. EFFICACY AND SAFETY OF A PAIRED SEDATION AND VENTILATOR WEANING PROTOCOL FOR MECHANICALLY VENTILATED PATIENTS IN INTENSIVE CARE (AWAKENING AND BREATHING CONTROLLED TRIAL): A RANDOMISED CONTROLLED TRIAL. LANCET 2008; 371:126–134.
The Awakening and Breathing Controlled (ABC) trial14 was a multicenter, randomized controlled trial that included 336 patients who required at least 12 consecutive hours of mechanical ventilation. All patients had to be receiving patient-targeted sedation.
Those in the intervention group (n = 168) had their sedation interrupted every day, followed by a clinical assessment to determine whether they could be allowed to try breathing spontaneously. The control group (n = 168) also received a clinical assessment for a trial of spontaneous breathing, while their sedation was continued as usual.
In patients in the intervention group who failed the screening for a spontaneous breathing trial, the sedatives were resumed at half the previous dose. Criteria for failure on the spontaneous breathing trial included any of the following: anxiety, agitation, respiratory rate more than 35 breaths per minute for 5 minutes or longer, cardiac arrhythmia, oxygen saturation less than 88% for 5 minutes or longer, or two or more signs of respiratory distress, tachycardia, bradycardia, paradoxical breathing, accessory muscle use, diaphoresis, or marked dyspnea.
Interrupting sedation was superior
The combination of sedation interruption and a spontaneous breathing trial was superior to a spontaneous breathing trial alone. The mean number of ventilator-free days:
- 14.7 ± 0.9 with sedation interruption
- 11.6 ± 0.9 days with usual care (P = .02).
The median time to ICU discharge:
- 9.1 days with sedation interruption (interquartile range 5.1 to 17.8)
- 12.9 days with usual care (interquartile range 6.0 to 24.2, P = .01).
The mortality rate at 28 days:
- 28% with sedation interruption
- 35% with usual care (P = .21).
The mortality rate at 1 year:
- 44% with sedation interruption
- 58% with usual care (hazard ratio [HR] in the intervention group 0.68, 95% CI 0.50–0.92, P = .01).
Of note, patients in the intervention group had a higher rate of self-extubation (9.6% vs 3.6%, P = .03), but the rate of reintubation was similar between the groups (14% vs 13%, P = .47).
Comments
The addition of daily awakenings to spontaneous breathing trials results in a further reduction in the number of ICU days and increases the number of ventilator-free days.
Of note, the protocol allowed patients in the control group to undergo a spontaneous breathing trial while on sedatives (69% of the patients were receiving sedation at the time). Therefore, a bias effect in favor of the intervention group cannot be excluded. However, both groups had to meet criteria for readiness for spontaneous breathing.
The study demonstrates the safety of daily awakenings and confirms previous findings suggesting that a daily trial of spontaneous breathing results in better ICU outcomes.
GLUCOSE CONTROL IN THE ICU
Key points
- Although earlier studies suggested that intensive insulin therapy might be beneficial in critically ill patients, new findings show that strict glucose control can lead to complications without improving outcomes.
Background
A previous study15 found that intensive insulin therapy to maintain a blood glucose level between 80 and 110 mg/dL (compared with 180–200 mg/dL) reduced the mortality rate in surgical critical care patients. The mortality rate in the ICU was 4.6% with intensive insulin therapy vs 8.0% with conventional therapy (P < .04), and the effect was more robust for patients who remained longer than 5 days in the ICU (10.6% vs 20.2%).
Importantly, however, hypoglycemia (defined as blood glucose ≤ 40 mg/dL) occurred in 39 patients in the intensive-treatment group vs 6 patients in the conventional-treatment group.
The NICE-SUGAR trial
NICE-SUGAR STUDY INVESTIGATORS; FINFER S, CHITTOCK DR, SU SY, ET AL. INTENSIVE VERSUS CONVENTIONAL GLUCOSE CONTROL IN CRITICALLY ILL PATIENTS. N ENGL J MED 2009; 360:1283–1297.
The Normoglycemia in Intensive Care Evaluation-Survival Using Glucose Algorithm Regulation (NICE-SUGAR) trial16 randomized 6,104 patients in medical and surgical ICUs to receive either intensive glucose control (blood glucose 81–108 mg/dL) with insulin therapy or conventional glucose control (blood glucose < 180 mg/dL). In the conventional-control group, insulin was discontinued if the blood glucose level dropped below 144 mg/dL.
A higher mortality rate with intensive glucose control
As expected, the intensive-control group achieved lower blood glucose levels: 115 vs 144 mg/dL.
Nevertheless, intensive glucose control was associated with a higher incidence of severe hypoglycemia, defined as a blood glucose level lower than 40 mg/dL: 6.8% vs 0.5%.
More importantly, compared with conventional insulin therapy, intensive glucose control was associated with a higher 90-day mortality rate: 27.5% vs 24.9% (odds ratio 1.14, 95% CI 1.02–1.28). These findings were similar in the subgroup of surgical patients (24.4% vs 19.8%, odds ratio 1.31, 95% CI 1.07–1.61).
Comments
Of note, the conventional-control group had more patients who discontinued the treatment protocol prematurely. Additionally, more patients in this group received corticosteroids.
These results widely differ from those of a previous study by van den Berghe et al,15 which showed that tight glycemic control is associated with a survival benefit. The differences in outcomes are probably largely related to different patient populations, as van den Berghe et al included patients who had undergone cardiac surgery, who were more likely to benefit from strict blood glucose control.
The VISEP trial
BRUNKHORST FM, ENGEL C, BLOOS F, ET AL; GERMAN COMPETENCE NETWORK SEPSIS (SEPNET). INTENSIVE INSULIN THERAPY AND PENTASTARCH RESUSCITATION IN SEVERE SEPSIS. N ENGL J MED 2008; 358:125–139.
The Volume Substitution and Insulin Therapy in Severe Sepsis (VISEP) trial was a multicenter study designed to compare intensive insulin therapy (target blood glucose level 80–110 mg/dL) and conventional glucose control (target blood glucose level 180–200 mg/dL) in patients with severe sepsis.17 It also compared two fluids for volume resuscitation: 10% pentastarch vs modified Ringer's lactate. It included both medical and surgical patients.
Trial halted early for safety reasons
The mean morning blood glucose level was significantly lower in the intensive insulin group (112 vs 151 mg/dL).
Severe hypoglycemia (blood glucose ≤ 40 mg/dL) was more common in the group that received intensive insulin therapy (17% vs 4.1%, P < .001).
Mortality rates at 28 days did not differ significantly: 24.7% with intensive control vs 26.0% with conventional glucose control. The mortality rate at 90 days was 39.7% in the intensive therapy group and 35.4% in the conventional therapy group, but the difference was not statistically significant.
The intensive insulin arm of the trial was stopped after 488 patients were enrolled because of a higher rate of hypoglycemia (12.1% vs 2.1%) and of serious adverse events (10.9% vs 5.2%).
Additionally, the fluid resuscitation arm of the study was suspended at the first planned interim analysis because of a higher risk of organ failure in the 10% pentastarch group.
CORTICOSTEROID THERAPY IN SEPTIC SHOCK
Key points
- Corticosteroid therapy improves hemodynamic outcomes in patients with severe septic shock.
- Although meta-analyses suggest the mortality rate is lower with corticosteroid therapy, there is not enough evidence from randomized controlled trials to prove that the use of low-dose corticosteroids lowers the mortality rate in patients with septic shock.
- The corticotropin (ACTH) stimulation test should not be used to determine the need for corticosteroids in patients with septic shock.
Background
A previous multicenter study,18 performed in France, found that the use of corticosteroids in patients with septic shock resulted in lower rates of death at 28 days, in the ICU, and in the hospital and a shorter time to vasopressor withdrawal. Nevertheless, the beneficial effects were not observed in patients with adequate adrenal reserve (based on an ACTH stimulation test).
This study was criticized because of a high mortality rate in the placebo group.
The CORTICUS study
SPRUNG CL, ANNANE D, KEH D, ET AL; CORTICUS STUDY GROUP. HYDROCORTISONE THERAPY FOR PATIENTS WITH SEPTIC SHOCK. N ENGL J MED 2008; 358:111–124.
The Corticosteroid Therapy of Septic Shock (CORTICUS) study was a multicenter trial that randomly assigned 499 patients with septic shock to receive hydrocortisone (50 mg intravenously every 6 hours for 5 days, followed by a 6-day taper period) or placebo.19
Patients were eligible to be enrolled within 72 hours of onset of shock. Similar to previous studies, the CORTICUS trial classified patients on the basis of an ACTH stimulation test as having inadequate adrenal reserve (a cortisol increase of ≤ 9 μg/dL) or adequate adrenal reserve (a cortisol increase of > 9 μg/dL).
Faster reversal of shock with steroids
At baseline, the mean Simplified Acute Physiologic Score II (SAPS II) was 49 (the range of possible scores is 0 to 163; the higher the score the worse the organ dysfunction).
Hydrocortisone use resulted in a shorter duration of vasopressor use and a faster reversal of shock (3.3 days vs 5.8 days, P < .001).
This association was the same when patients were divided according to response to ACTH stimulation test. Time to reversal of shock in responders:
- 2.8 days with hydrocortisone
- 5.8 days with placebo (P < .001).
Time to reversal of shock in nonresponders:
- 3.9 days with hydrocortisone
- 6.0 days with placebo (P = .06).
Nevertheless, the treatment did not reduce the mortality rate at 28 days overall (34.3% vs 31.5% P = .51), or in the subgroups based on response to ACTH, or at any other time point. A post hoc analysis suggested that patients who had a systolic blood pressure of less than 90 mm Hg within 30 minutes of enrollment had a greater benefit in terms of mortality rate, but the effect was not statistically significant: the absolute difference was −11.2% (P = 0.28). Similarly, post hoc analyses also revealed a higher rate of death at 28 days in patients who received etomidate (Amidate) before randomization in both groups (P = .03).
Importantly, patients who received corticosteroids had a higher incidence of superinfections, including new episodes of sepsis or septic shock, with a combined odds ratio of 1.37 (95% CI 1.05–1.79).
Length of stay in the hospital or in the ICU was similar in patients who received corticosteroids and in those who received placebo. The ICU length of stay was 19 ± 31 days with hydrocortisone vs 18 ± 17 days with placebo (P = .51).
Comments
The CORTICUS trial showed that low-dose corticosteroid therapy results in faster reversal of shock in patients with severe septic shock. The hemodynamic benefits are present in all patients regardless of response to the ACTH stimulation test.
Nevertheless, contrary to previous findings,18 corticosteroid use was not associated with an improvement in mortality rates. Important differences exist between these two studies:
- The mortality rates in the placebo groups were significantly different (> 50% in the French study vs 30% in CORTICUS).
- The SAPS II scores were different in these two trials (55 vs 49), suggesting a greater severity of illness in the French study.
- The criteria for enrollment were different: the French study included patients who had a systolic blood pressure lower than 90 mm Hg for more than 1 hour despite fluid administration and vasopressor use, whereas the CORTICUS trial included patients who had a systolic blood pressure lower than 90 mm Hg for more than 1 hour despite fluid administration or vasopressor use.
- The time of enrollment was different: patients were enrolled much faster in the French study (within 8 hours) than in the CORTICUS trial (within 72 hours).
A recent meta-analysis of 17 randomized trials (including the CORTICUS study), found that, compared with those who received placebo, patients who received corticosteroids had a small reduction in the 28-day mortality rate (HR 0.84, 95% CI 0.71–1.00, P < .05).20 Of note, this meta-analysis has been criticized for possible publication bias and also for a large degree of heterogeneity in its results.21
VASOPRESSOR THERAPY IN SHOCK
Key points
- Vasopressin use in patients with severe septic shock is not associated with an improvement in mortality rates.
- Vasopressin should not be used as a first-line agent in patients with septic shock.
- Norepinephrine should be considered a first-line agent in patients with shock.
- Compared with norepinephrine, the use of dopamine in patients with shock is associated with similar mortality rates, although its use may result in a greater number of cardiac adverse events.
Background
Vasopressin gained popularity in critical care in the last 10 years because several small studies showed that adding it improves hemodynamics and results in a reduction in the doses of catecholamines in patients with refractory septic shock.22 Furthermore, the Surviving Sepsis Campaign guidelines recommended the use of vasopressin in patients who have refractory shock despite fluid resuscitation and the use of other “conventional” vasopressors.23
Despite these positive findings, it remained unknown if the use of vasopressin increases the survival rate in patients with septic shock.
The Vasopressin and Septic Shock Trial (VASST)
RUSSELL JA, WALLEY KR, SINGER J, ET AL; VASST INVESTIGATORS. VASOPRESSIN VERSUS NOREPINEPHRINE INFUSION IN PATIENTS WITH SEPTIC SHOCK. N ENGL J MED 2008; 358:877–887.
The Vasopressin and Septic Shock Trial (VASST)24 was a multicenter randomized, double-blind, controlled trial that included 778 patients with refractory septic shock. Refractory shock was defined as the lack of a response to a normal saline fluid bolus of 500 mL or the need for vasopressors (norepinephrine in doses of at least 5 μg/minute or its equivalent for 6 hours or more in the 24 hours before randomization).
Two subgroups were identified: those with severe septic shock (requiring norepinephrine in doses of 15 μg/minute or higher) and those with less-severe septic shock (needing norepinephrine in doses of 5 to 14 μg/minute). Patients with unstable coronary artery disease (acute myocardial infarction, angina) and severe congestive heart failure were excluded.
Patients were randomized to receive an intravenous infusion of vasopressin (0.01–0.03 U/minute) or norepinephrine (5–15 mg/minute) in addition to open-labeled vasopressors (excluding vasopressin). The primary outcome was the all-cause mortality rate at 28 days.
Results
At 28 days, fewer patients had died in the vasopressin group than in the norepinephrine group (35.4% vs 39.3%), but the difference was not statistically significant (P = .26). The trend was the same at 90 days (mortality rate 43.9% vs 49.6%, P = .11).
Subgroup analysis showed that in patients with less-severe septic shock, those who received vasopressin had a lower mortality rate at 28 days (26.5% vs 35.7%, P = .05; relative risk 0.74; 95% CI 0.55–1.01) and at 90 days (35.8% vs 46.1%, P = .04; relative risk 0.78, 95% CI 0.61–0.99).
There were no statistically significant differences in any of the other secondary outcomes or in serious adverse events.
Comments
The study has been criticized for several reasons:
- The mean arterial blood pressure at baseline before initiation of vasopressin was 72 mm Hg (and some argue that vasopressin was therefore not needed by the time it was started).
- The time from screening to infusion of the study drug was very long (12 hours).
- The observed mortality rate was lower than expected (37%).
Despite these considerations, the VASST trial showed that vasopressin is not associated with an increased number of adverse events in patients without active cardiovascular disease. The possible benefit in terms of the mortality rate in the subgroup of patients with less-severe septic shock requires further investigation.
Is dopamine equivalent to norepinephrine?
Previously, the Sepsis Occurrence in Acutely Ill Patients (SOAP) study, a multicenter, observational cohort study, found that dopamine use was associated with a higher all-cause mortality rate in the ICU compared with no dopamine.25 This finding had not been reproduced, as few well-designed studies had compared the effects of dopamine and norepinephrine.
The SOAP II study
DE BACKER D, BISTON P, DEVRIENDT J, ET AL; SOAP II INVESTIGATORS.. COMPARISON OF DOPAMINE AND NOREPINEPHRINE IN THE TREATMENT OF SHOCK. N ENGL J MED 2010; 362:779–789.
The SOAP II study,26 a multicenter, randomized trial, compared dopamine vs norepinephrine as first-line vasopressor therapy. In patients with refractory shock despite use of dopamine 20 μg/kg/minute or norepinephrine 0.19 μg/kg/minute, open-label norepinephrine, epinephrine, or vasopressin was added.
The primary outcome was the mortality rate at 28 days after randomization; secondary end points included the number of days without need for organ support and the occurrence of adverse events.
Results
A total of 1,679 patients were included; 858 were assigned to dopamine and 821 to norepinephrine. Most (1,044, 62%) of the patients had a diagnosis of septic shock.
No significant difference in mortality rates was noted at 28 days: 52.5% with dopamine vs 48.5% with norepinephrine (P = .10).
However, there were more arrhythmias in the patients treated with dopamine: 207 events (24.1%) vs 102 events (12.4%) (P < .001). The number of other adverse events such as renal failure, myocardial infarction, arterial occlusion, or skin necrosis was not different between the groups.
A subgroup analysis showed that dopamine was associated with more deaths at 28 days in patients with cardiogenic shock (P = .03) but not in patients with septic shock (P = .19) or with hypovolemic shock (P = .84).
Comments
The study was criticized because the patients may not have received adequate fluid resuscitation (the study considered adequate resuscitation to be equivalent to 1 L of crystalloids or 500 mL of colloids), as different degrees of volume depletion among patients make direct comparisons of vasopressor effects difficult.
Additionally, the study defined dopamine 20 μg/kg/minute as being equipotent with norepinephrine 0.19 μg/kg/minute. Comparisons of potency between drugs are difficult to establish, as there are no available data.
Nevertheless, this study further confirms previous findings suggesting that norepinephrine is not associated with more end-organ damage (such as renal failure or skin ischemia), and shows that dopamine may increase the number of adverse events, particularly in patients with cardiac disease.
- Shah MR, Hasselblad V, Stevenson LW, et al. Impact of the pulmonary artery catheter in critically ill patients: meta-analysis of randomized clinical trials. JAMA 2005; 294:1664–1670.
- National Heart, Lung, and Blood Institute Acute Respiratory Distress Syndrome (ARDS) Clinical Trials Network; Wiedemann HP, Wheeler AP, Bernard GR, et al. Comparison of two fluid-management strategies in acute lung injury. N Engl J Med 2006; 354:2564–2575.
- National Heart, Lung, and Blood Institute Acute Respiratory Distress Syndrome (ARDS) Clinical Trials Network; Wheeler AP, Bernard GR, Thompson BT, et al. Pulmonary-artery versus central venous catheter to guide treatment of acute lung injury. N Engl J Med 2006; 354:2213–2224.
- Bernard GR, Luce JM, Sprung CL, et al. High-dose corticosteroids in patients with the adult respiratory distress syndrome. N Engl J Med 1987; 317:1565–1570.
- Meduri GU, Headley AS, Golden E, et al. Effect of prolonged methylprednisolone therapy in unresolving acute respiratory distress syndrome: a randomized controlled trial. JAMA 1998; 280:159–165.
- Steinberg KP, Hudson LD, Goodman RB, et al; National Heart, Lung, and Blood Institute Acute Respiratory Distress Syndrome (ARDS) Clinical Trials Network. Efficacy and safety of corticosteroids for persistent acute respiratory distress syndrome. N Engl J Med 2006; 354:1671–1684.
- Meduri GU, Golden E, Freire AX, et al. Methylprednisolone infusion in early severe ARDS: results of a randomized controlled trial. Chest 2007; 131:954–963.
- Meduri GU, Golden E, Freire AX, et al. Methylprednisolone infusion in early severe ARDS results of a randomized controlled trial. 2007. Chest 2009; 136(suppl 5):e30.
- Annane D, Sébille V, Bellissant E; Ger-Inf-05 Study Group. Effect of low doses of corticosteroids in septic shock patients with or without early acute respiratory distress syndrome. Crit Care Med 2006; 34:22–30.
- Kollef MH, Levy NT, Ahrens TS, Schaiff R, Prentice D, Sherman G. The use of continuous i.v. sedation is associated with prolongation of mechanical ventilation. Chest 1998; 114:541–548.
- Carson SS, Kress JP, Rodgers JE, et al. A randomized trial of intermittent lorazepam versus propofol with daily interruption in mechanically ventilated patients. Crit Care Med 2006; 34:1326–1332.
- Brook AD, Ahrens TS, Schaiff R, et al. Effect of a nursing-implemented sedation protocol on the duration of mechanical ventilation. Crit Care Med 1999; 27:2609–2615.
- Kress JP, Pohlman AS, O’Connor MF, Hall JB. Daily interruption of sedative infusions in critically ill patients undergoing mechanical ventilation. N Engl J Med 2000; 342:1471–1477.
- Girard TD, Kress JP, Fuchs BD, et al. Efficacy and safety of a paired sedation and ventilator weaning protocol for mechanically ventilated patients in intensive care (Awakening and Breathing Controlled trial): a randomised controlled trial. Lancet 2008; 371:126–134.
- van den Berghe G, Wouters P, Weekers F, et al. Intensive insulin therapy in the critically ill patients. N Engl J Med 2001; 345:1359–1367.
- NICE-SUGAR Study Investigators; Finfer S, Chittock DR, Su SY, et al. Intensive versus conventional glucose control in critically ill patients. N Engl J Med 2009; 360:1283–1297.
- Brunkhorst FM, Engel C, Bloos F, et al; German Competence Network Sepsis (SepNet). Intensive insulin therapy and pentastarch resuscitation in severe sepsis. N Engl J Med 2008; 358:125–139.
- Annane D, Sébille V, Charpentier C, et al. Effect of treatment with low doses of hydrocortisone and fludrocortisone on mortality in patients with septic shock. JAMA 2002; 288:862–871.
- Sprung CL, Annane D, Keh D, et al; CORTICUS Study Group. Hydrocortisone therapy for patients with septic shock. N Engl J Med 2008; 358:111–124.
- Annane D, Bellissant E, Bollaert PE, et al. Corticosteroids in the treatment of severe sepsis and septic shock in adults: a systematic review. JAMA 2009; 301:2362–2375.
- Minneci PC, Deans KJ, Natanson C. Corticosteroid therapy for severe sepsis and septic shock [letter]. JAMA 2009; 302:16443–1644.
- Kampmeier TG, Rehberg S, Westphal M, Lange M. Vasopressin in sepsis and septic shock. Minerva Anestesiol 2010; 76:844–850.
- Dellinger RP, Levy MM, Carlet JM, et al; International Surviving Sepsis Campaign Guidelines Committee. Surviving Sepsis Campaign: international guidelines for management of severe sepsis and septic shock: 2008. Crit Care Med 2008; 36:296–327.
- Russell JA, Walley KR, Singer J, et al; VASST Investigators. Vasopressin versus norepinephrine infusion in patients with septic shock. N Engl J Med 2008; 358:877–887.
- Sakr Y, Reinhart K, Vincent JL, et al. Does dopamine administration in shock influence outcome? Results of the Sepsis Occurrence in Acutely Ill Patients (SOAP) Study. Crit Care Med 2006; 34:589–597.
- De Backer D, Biston P, Devriendt J, et al; SOAP II Investigators. Comparison of dopamine and norepinephrine in the treatment of shock. N Engl J Med 2010; 362:779–789.
KEY POINTS
- In patients with acute respiratory distress syndrome (ARDS), fluid restriction is associated with better outcomes. A pulmonary arterial catheter is not indicated in the routine management of ARDS. Corticosteroid use can result in improved oxygenation but may be associated with worse outcomes if treatment is started late, ie, more than 14 days after the onset of the disease.
- Intensive insulin therapy is associated with hypoglycemia and may be associated with complications in medical patients.
- In patients with septic shock, corticosteroid therapy is associated with faster shock reversal, but its effects on mortality rates remain controversial. Vasopressin improves hemodynamic variables but is not associated with a lower mortality rate.
- Daily interruption of sedation and early awakening of mechanically ventilated patients result in better outcomes.
- Compared with norepinephrine, dopamine is associated with more cardiac adverse events in patients with shock.
Update in hospital medicine: Studies likely to affect inpatient practice in 2011
A number of studies published in the last few years will likely affect the way we practice medicine in the hospital. Here, we will use a hypothetical case scenario to focus on the issues of anticoagulants, patient safety, quality improvement, critical care, transitions of care, and perioperative medicine.
AN ELDERLY MAN WITH NEW-ONSET ATRIAL FIBRILLATION
P.G. is an 80-year-old man with a history of hypertension and type 2 diabetes mellitus who is admitted with new-onset atrial fibrillation. In the hospital, his heart rate is brought under control with intravenous metoprolol (Lopressor). On discharge, he will be followed by his primary care physician (PCP). He does not have access to an anticoagulation clinic.
1. What are this patient’s options for stroke prevention?
- Aspirin 81 mg daily and clopidogrel (Plavix) 75 mg daily
- Warfarin (Coumadin) with a target international normalized ratio (INR) of 2.0 to 3.0
- Aspirin mg daily by itself
- Dabigatran (Pradaxa) 150 mg daily
A new oral anticoagulant agent
In deciding what type of anticoagulation to give to a patient with atrial fibrillation, it is useful to look at the CHADS2 score (1 point each for congestive heart failure, hypertension, age 75 or older, and diabetes mellitus; 2 points for prior stroke or transient ischemic attack. This patient has a CHADS2 score of 3, indicating that he should receive warfarin. An alternative is dabigatran, the first new anticoagulant agent in more than 50 years.
In a multicenter, international trial, Connolly et al1 randomized 18,113 patients (mean age 71, 64% men) to receive dabigatran 110 mg twice daily, dabigatran 150 mg twice daily, or warfarin with a target INR of 2.0 to 3.0. In this noninferiority trial, dabigatran was given in a blinded manner, but the use of warfarin was open-label. Patients were eligible if they had atrial fibrillation at screening or within the previous 6 months and were at risk of stroke—ie, if they had at least one of the following: a history of stroke or transient ischemic attack, a left ventricular ejection fraction of less than 40%, symptoms of congestive heart failure (New York Heart Association class II or higher), and an age of 75 or older or an age of 65 to 74 with diabetes mellitus, hypertension, or coronary artery disease.
At a mean follow-up of 2 years, the rate of stroke or systolic embolism was 1.69% per year in the warfarin group compared with 1.1% in the higher-dose dabigatran group (relative risk 0.66, 95% confidence interval [CI] 0.53–0.82, P < .001). The rates of major hemorrhage were similar between these two groups. Comparing lower-dose dabigatran and warfarin, the rates of stroke or systolic embolism were not significantly different, but the rate of major bleeding was significantly lower with lower-dose dabigatran.
In a trial in patients with acute venous thromboembolism, Schulman et al2 found that dabigatran was not inferior to warfarin in preventing venous thromboembolism.
Guidelines from the American College of Cardiology Foundation and the American Heart Association now endorse dabigatran as an alternative to warfarin for patients with atrial fibrillation.3 However, the guidelines state that it should be reserved for those patients who:
- Do not have a prosthetic heart valve or hemodynamically significant valve disease
- Have good kidney function (dabigatran is cleared by the kidney; the creatinine clearance rate should be greater than 30 mL/min for patients to receive dabigatran 150 mg twice a day, and at least 15 mL/min to receive 75 mg twice a day)
- Do not have severe hepatic dysfunction (which would impair baseline clotting function).
They note that other factors to consider are whether the patient:
- Can comply with the twice-daily dosing required
- Can afford the drug
- Has access to an anticoagulation management program (which would argue in favor of using warfarin).
Dabigatran is not yet approved to prevent venous thromboembolism.
CASE CONTINUED: HE GETS AN INFECTION
P.G. is started on dabigatran 150 mg by mouth twice a day.
While in the hospital he develops shortness of breath and needs intravenous furosemide (Lasix). Because he has bad veins, a percutaneous intravenous central catheter (PICC) line is placed. However, 2 days later, his temperature is 101.5°F, and his systolic blood pressure is 70 mm Hg. He is transferred to the medical intensive care unit (ICU) for treatment of sepsis. The anticoagulant is held, the PICC line is removed, and a new central catheter is inserted.
2. Which of the following directions is incorrect?
- Wash your hands before inserting the catheter. The accompanying nurse is required to directly observe this procedure or, if this step is not observed, to confirm that the physician did it.
- Before inserting the catheter, clean the patient’s skin with chlorhexidine antiseptic.
- Place sterile drapes over the entire patient.
- Wear any mask, hat, gown, and gloves available.
- Put a sterile dressing over the catheter.
A checklist can prevent infections when inserting central catheters
A checklist developed at Johns Hopkins Hospital consists of the five statements above, except for the second to last one—you should wear a sterile mask, hat, gown and gloves. This is important to ensure that sterility is not broken at any point during the procedure.
Pronovost et al4 launched a multicenter initiative at 90 ICUs, predominantly in the state of Michigan, to implement interventions to improve staff culture and teamwork and to translate research into practice by increasing the extent to which these five evidence-based recommendations were applied. The mean rate of catheter-related blood stream infections at baseline was 7.7%; this dropped to 2.8% during the implementation period, 2.3% in the first 3 months after implementation, 1.3% in months 16 through 18, and 1.1% in months 34 through 36, demonstrating that the gains from this quality-improvement project were sustainable.
If this intervention and collaborative model were implemented in all ICUs across the United States and if similar success rates were achieved, substantial and sustained reductions could be made in the 82,000 infections, 28,000 deaths, and $2.3 billion in costs attributed to these infections annually.
CASE CONTINUED: HE IS RESUSCITATED
P.G. is started on a 1-L fluid bolus but he remains hypotensive, necessitating a norepinephrine drip. He does well for about 6 hours, but in the middle of the night he develops ventricular tachycardia and ventricular fibrillation, and a code is called. He is successfully resuscitated, but the family is looking for prognostic information.
3. What are P.G.’s chances of surviving and leaving the hospital?
- 5%
- 8%
- 15%
- 23%
A registry of cardiopulmonary resuscitation
Tian et al5 evaluated outcomes in the largest registry of cardiopulmonary resuscitation to date. In this analysis, 49,656 adult patients with a first cardiopulmonary arrest occurring in an ICU between January 1, 2000, and August 26, 2008, were evaluated for their outcomes on pressors vs those not on pressors.
Other independent predictors of a lower survival rate were nonwhite race, mechanical ventilation, having three or more immediate causes of cardiopulmonary arrest, age 65 years or older, and cardiopulmonary arrest occurring at night or over the weekend.
Fortunately, for our patient, survival rates were higher for patients with ventricular tachycardia or fibrillation than with other causes of cardiopulmonary arrest: 22.6% for those on pressors (like our patient) and 40.7% for those on no pressors.
CASE CONTINUED: HE RECOVERS AND GOES HOME
P.G. makes a remarkable recovery and is now ready to go home. It is the weekend, and you are unable to schedule a follow-up appointment before his discharge, so you ask him to make an appointment with his PCP.
4. What is the likelihood that P.G. will be readmitted within 1 month?
- 5%
- 12%
- 20%
- 25%
- 30%
The importance of follow-up with a primary care physician
Misky et al,6 in a small study, attempted to identify the characteristics and outcomes of discharged patients who lack timely follow-up with a PCP. They prospectively enrolled 65 patients admitted to University of Colorado Hospital, an urban 425-bed tertiary care center, collecting information about patient demographics, diagnosis, payer source, and PCPs. After discharge, they called the patients to determine their PCP follow-up and readmission status. Thirty-day readmission rates and hospital length of stay were compared in patients with and without timely PCP follow-up (ie, within 4 weeks).
Patients lacking timely PCP follow-up were 10 times more likely to be readmitted (odds ratio [OR] = 9.9, P = .04): the rate was 21% in patients lacking timely PCP follow-up vs 3% in patients with timely PCP follow-up, P = .03. Lack of insurance was associated with lower rates of timely PCP follow-up: 29% vs 56% (P = .06), but did not independently increase the readmission rate or length of stay (OR = 1.0, P = .96). Index hospital length of stay was longer in patients lacking timely PCP follow-up: 4.4 days vs 6.3 days, P = 0.11.
Comment. Nearly half of the patients in this study, who were discharged from a large urban academic center, lacked timely follow-up with a PCP, resulting in higher rates of readmission and a nonsignificant trend toward longer length of stay. Timely follow-up is necessary for vulnerable patients.
Since the lack of timely PCP follow-up results in higher readmission rates and possibly a longer length of stay, a PCP appointment at discharge should perhaps be considered a core quality measure. This would be problematic in our American health care system, in which many patients lack health insurance and do not have a PCP.
A MAN UNDERGOING GASTRIC BYPASS SURGERY
A 55-year-old morbidly obese man (body mass index 45 kg/m2) with a history of type 2 diabetes mellitus, chronic renal insufficiency (serum creatinine level 2.1 mg/dL), hypercholesterolemia, and previous stroke is scheduled for gastric bypass surgery. His functional capacity is low, but he is able to do his activities of daily living. He reports having dyspnea on exertion and intermittently at rest, but no chest pain. His medications include insulin, atorvastatin (Lipitor), aspirin, and atenolol (Tenormin). He is afebrile; his blood pressure is 130/80 mm Hg, pulse 75, and oxygen saturation 97% on room air. His baseline electrocardiogram shows no Q waves.
5. Which of the following is an appropriate next step before proceeding to surgery?
- Echocardiography
- Cardiac catheterization
- Dobutamine stress echocardiography or adenosine thallium scanning
- No cardiac testing is necessary before surgery
Is cardiac testing necessary before noncardiac surgery?
Wijeysundera et al7 performed a retrospective cohort study of patients who underwent elective surgery at acute care hospitals in Ontario, Canada, in the years 1994 through 2004. The aim was to determine the association of noninvasive cardiac stress testing before surgery with survival rates and length of hospital stay. Included were 271,082 patients, of whom 23,991 (8.9%) underwent stress testing less than 6 months before surgery. These patients were matched with 46,120 who did not undergo testing.
One year after surgery, fewer patients who underwent stress testing had died: 1,622 (7.0%) vs 1,738 (7.5%); hazard ratio 0.92, 95% CI 0.86–0.99, P = .03. The number needed to treat (ie, to be tested) to prevent one death was 221. The tested patients also had a shorter mean hospital stay: 8.72 vs 8.96 days, a difference of 0.24 days (95% CI −0.07 to −0.43; P < .001).
However, the elderly patients (ie, older than 66 years) who underwent testing were more likely to be on beta-blockers and statins than those who did not undergo testing, which may be a confounding factor.
Furthermore, the benefit was all in the patients at intermediate or high risk. The authors performed a subgroup analysis, dividing the patients on the basis of their Revised Cardiac Risk Index (RCRI; 1 point each for ischemic heart disease, congestive heart failure, cerebrovascular disease, diabetes, renal insufficiency, and high-risk surgery).8 Patients with an RCRI of 0 points (indicating low risk) actually had a higher risk of death with testing than without testing: hazard ratio 1.35 (95% CI 1.03–1.74), number needed to harm 179—ie, for every 179 low-risk patients tested, one excess death occurred. Those with an RCRI of 1 or 2 points (indicating intermediate risk) had a hazard ratio of 0.92 with testing (95% CI 085–0.99), and those with an RCRI of 3 to 6 points (indicating high risk) had a hazard ratio of 0.80 with testing (95% CI 0.67- 0.97; number needed to treat = 38).
Comment. These findings indicate that cardiac stress testing should be done selectively before noncardiac surgery, and primarily for patients at high risk (with an RCRI of 3 or higher) and in some patients at intermediate risk, but not in patients at low risk, in whom it may be harmful. Stress testing may change patient management because a positive stress test allows one to start a beta-blocker or a statin, use more aggressive intraoperative and postoperative care, and identify patients who have indications for revascularization.
- Connolly SJ, Ezekowitz MD, Yusuf S, et al; RE-LY Steering Committee and Investigators. Dabigatran versus warfarin in patients with atrial fibrillation. N Engl J Med 2009; 361:1139–1151.
- Schulman S, Kearon C, Kakkar AK, et al; RE-COVER Study Group. Dabigatran versus warfarin in the treatment of acute venous thromboembolism. N Engl J Med 2009; 361:2342–2352.
- Wann LS, Curtis AB, Ellenbogen KA, et al. 2011 ACCF/AHA/HRS focused update on the management of patients with atrial fibrillation (update on dabigatran): A report of the American College of Cardiology Foundation/American Heart Association Task Force on Practice Guidelines. Circulation 2011; 123:1144–1150.
- Pronovost PJ, Goeschel CA, Colantuoni E, et al. Sustaining reductions in catheter-related bloodstream infections in Michigan intensive care units: observational study. BMJ 2010; 340:c309.
- Tian J, Kaufman DA, Zarich S, et al; American Heart Association National Registry for Cardiopulmonary Resuscitation Investigators. Outcomes of critically ill patients who received cardiopulmonary resuscitation. Am J Respir Crit Care Med 2010; 182:501–506.
- Misky GJ, Wald HL, Coleman EA. Post-hospitalization transitions: examining the effects of timing of primary care provider follow-up. J Hosp Med 2010; 5:392–397.
- Wijeysundera DN, Beattie WS, Austin PC, Hux JE, Laupacis A. Non-invasive cardiac stress testing before elective major non-cardiac surgery: population based cohort study. BMJ 2010; 340:b5526.
- Lee TH, Marcantonio ER, Mangione CM, et al. Derivation and prospective validation of a simple index for prediction of cardiac risk of major noncardiac surgery. Circulation 1999; 100:1043–1049.
A number of studies published in the last few years will likely affect the way we practice medicine in the hospital. Here, we will use a hypothetical case scenario to focus on the issues of anticoagulants, patient safety, quality improvement, critical care, transitions of care, and perioperative medicine.
AN ELDERLY MAN WITH NEW-ONSET ATRIAL FIBRILLATION
P.G. is an 80-year-old man with a history of hypertension and type 2 diabetes mellitus who is admitted with new-onset atrial fibrillation. In the hospital, his heart rate is brought under control with intravenous metoprolol (Lopressor). On discharge, he will be followed by his primary care physician (PCP). He does not have access to an anticoagulation clinic.
1. What are this patient’s options for stroke prevention?
- Aspirin 81 mg daily and clopidogrel (Plavix) 75 mg daily
- Warfarin (Coumadin) with a target international normalized ratio (INR) of 2.0 to 3.0
- Aspirin mg daily by itself
- Dabigatran (Pradaxa) 150 mg daily
A new oral anticoagulant agent
In deciding what type of anticoagulation to give to a patient with atrial fibrillation, it is useful to look at the CHADS2 score (1 point each for congestive heart failure, hypertension, age 75 or older, and diabetes mellitus; 2 points for prior stroke or transient ischemic attack. This patient has a CHADS2 score of 3, indicating that he should receive warfarin. An alternative is dabigatran, the first new anticoagulant agent in more than 50 years.
In a multicenter, international trial, Connolly et al1 randomized 18,113 patients (mean age 71, 64% men) to receive dabigatran 110 mg twice daily, dabigatran 150 mg twice daily, or warfarin with a target INR of 2.0 to 3.0. In this noninferiority trial, dabigatran was given in a blinded manner, but the use of warfarin was open-label. Patients were eligible if they had atrial fibrillation at screening or within the previous 6 months and were at risk of stroke—ie, if they had at least one of the following: a history of stroke or transient ischemic attack, a left ventricular ejection fraction of less than 40%, symptoms of congestive heart failure (New York Heart Association class II or higher), and an age of 75 or older or an age of 65 to 74 with diabetes mellitus, hypertension, or coronary artery disease.
At a mean follow-up of 2 years, the rate of stroke or systolic embolism was 1.69% per year in the warfarin group compared with 1.1% in the higher-dose dabigatran group (relative risk 0.66, 95% confidence interval [CI] 0.53–0.82, P < .001). The rates of major hemorrhage were similar between these two groups. Comparing lower-dose dabigatran and warfarin, the rates of stroke or systolic embolism were not significantly different, but the rate of major bleeding was significantly lower with lower-dose dabigatran.
In a trial in patients with acute venous thromboembolism, Schulman et al2 found that dabigatran was not inferior to warfarin in preventing venous thromboembolism.
Guidelines from the American College of Cardiology Foundation and the American Heart Association now endorse dabigatran as an alternative to warfarin for patients with atrial fibrillation.3 However, the guidelines state that it should be reserved for those patients who:
- Do not have a prosthetic heart valve or hemodynamically significant valve disease
- Have good kidney function (dabigatran is cleared by the kidney; the creatinine clearance rate should be greater than 30 mL/min for patients to receive dabigatran 150 mg twice a day, and at least 15 mL/min to receive 75 mg twice a day)
- Do not have severe hepatic dysfunction (which would impair baseline clotting function).
They note that other factors to consider are whether the patient:
- Can comply with the twice-daily dosing required
- Can afford the drug
- Has access to an anticoagulation management program (which would argue in favor of using warfarin).
Dabigatran is not yet approved to prevent venous thromboembolism.
CASE CONTINUED: HE GETS AN INFECTION
P.G. is started on dabigatran 150 mg by mouth twice a day.
While in the hospital he develops shortness of breath and needs intravenous furosemide (Lasix). Because he has bad veins, a percutaneous intravenous central catheter (PICC) line is placed. However, 2 days later, his temperature is 101.5°F, and his systolic blood pressure is 70 mm Hg. He is transferred to the medical intensive care unit (ICU) for treatment of sepsis. The anticoagulant is held, the PICC line is removed, and a new central catheter is inserted.
2. Which of the following directions is incorrect?
- Wash your hands before inserting the catheter. The accompanying nurse is required to directly observe this procedure or, if this step is not observed, to confirm that the physician did it.
- Before inserting the catheter, clean the patient’s skin with chlorhexidine antiseptic.
- Place sterile drapes over the entire patient.
- Wear any mask, hat, gown, and gloves available.
- Put a sterile dressing over the catheter.
A checklist can prevent infections when inserting central catheters
A checklist developed at Johns Hopkins Hospital consists of the five statements above, except for the second to last one—you should wear a sterile mask, hat, gown and gloves. This is important to ensure that sterility is not broken at any point during the procedure.
Pronovost et al4 launched a multicenter initiative at 90 ICUs, predominantly in the state of Michigan, to implement interventions to improve staff culture and teamwork and to translate research into practice by increasing the extent to which these five evidence-based recommendations were applied. The mean rate of catheter-related blood stream infections at baseline was 7.7%; this dropped to 2.8% during the implementation period, 2.3% in the first 3 months after implementation, 1.3% in months 16 through 18, and 1.1% in months 34 through 36, demonstrating that the gains from this quality-improvement project were sustainable.
If this intervention and collaborative model were implemented in all ICUs across the United States and if similar success rates were achieved, substantial and sustained reductions could be made in the 82,000 infections, 28,000 deaths, and $2.3 billion in costs attributed to these infections annually.
CASE CONTINUED: HE IS RESUSCITATED
P.G. is started on a 1-L fluid bolus but he remains hypotensive, necessitating a norepinephrine drip. He does well for about 6 hours, but in the middle of the night he develops ventricular tachycardia and ventricular fibrillation, and a code is called. He is successfully resuscitated, but the family is looking for prognostic information.
3. What are P.G.’s chances of surviving and leaving the hospital?
- 5%
- 8%
- 15%
- 23%
A registry of cardiopulmonary resuscitation
Tian et al5 evaluated outcomes in the largest registry of cardiopulmonary resuscitation to date. In this analysis, 49,656 adult patients with a first cardiopulmonary arrest occurring in an ICU between January 1, 2000, and August 26, 2008, were evaluated for their outcomes on pressors vs those not on pressors.
Other independent predictors of a lower survival rate were nonwhite race, mechanical ventilation, having three or more immediate causes of cardiopulmonary arrest, age 65 years or older, and cardiopulmonary arrest occurring at night or over the weekend.
Fortunately, for our patient, survival rates were higher for patients with ventricular tachycardia or fibrillation than with other causes of cardiopulmonary arrest: 22.6% for those on pressors (like our patient) and 40.7% for those on no pressors.
CASE CONTINUED: HE RECOVERS AND GOES HOME
P.G. makes a remarkable recovery and is now ready to go home. It is the weekend, and you are unable to schedule a follow-up appointment before his discharge, so you ask him to make an appointment with his PCP.
4. What is the likelihood that P.G. will be readmitted within 1 month?
- 5%
- 12%
- 20%
- 25%
- 30%
The importance of follow-up with a primary care physician
Misky et al,6 in a small study, attempted to identify the characteristics and outcomes of discharged patients who lack timely follow-up with a PCP. They prospectively enrolled 65 patients admitted to University of Colorado Hospital, an urban 425-bed tertiary care center, collecting information about patient demographics, diagnosis, payer source, and PCPs. After discharge, they called the patients to determine their PCP follow-up and readmission status. Thirty-day readmission rates and hospital length of stay were compared in patients with and without timely PCP follow-up (ie, within 4 weeks).
Patients lacking timely PCP follow-up were 10 times more likely to be readmitted (odds ratio [OR] = 9.9, P = .04): the rate was 21% in patients lacking timely PCP follow-up vs 3% in patients with timely PCP follow-up, P = .03. Lack of insurance was associated with lower rates of timely PCP follow-up: 29% vs 56% (P = .06), but did not independently increase the readmission rate or length of stay (OR = 1.0, P = .96). Index hospital length of stay was longer in patients lacking timely PCP follow-up: 4.4 days vs 6.3 days, P = 0.11.
Comment. Nearly half of the patients in this study, who were discharged from a large urban academic center, lacked timely follow-up with a PCP, resulting in higher rates of readmission and a nonsignificant trend toward longer length of stay. Timely follow-up is necessary for vulnerable patients.
Since the lack of timely PCP follow-up results in higher readmission rates and possibly a longer length of stay, a PCP appointment at discharge should perhaps be considered a core quality measure. This would be problematic in our American health care system, in which many patients lack health insurance and do not have a PCP.
A MAN UNDERGOING GASTRIC BYPASS SURGERY
A 55-year-old morbidly obese man (body mass index 45 kg/m2) with a history of type 2 diabetes mellitus, chronic renal insufficiency (serum creatinine level 2.1 mg/dL), hypercholesterolemia, and previous stroke is scheduled for gastric bypass surgery. His functional capacity is low, but he is able to do his activities of daily living. He reports having dyspnea on exertion and intermittently at rest, but no chest pain. His medications include insulin, atorvastatin (Lipitor), aspirin, and atenolol (Tenormin). He is afebrile; his blood pressure is 130/80 mm Hg, pulse 75, and oxygen saturation 97% on room air. His baseline electrocardiogram shows no Q waves.
5. Which of the following is an appropriate next step before proceeding to surgery?
- Echocardiography
- Cardiac catheterization
- Dobutamine stress echocardiography or adenosine thallium scanning
- No cardiac testing is necessary before surgery
Is cardiac testing necessary before noncardiac surgery?
Wijeysundera et al7 performed a retrospective cohort study of patients who underwent elective surgery at acute care hospitals in Ontario, Canada, in the years 1994 through 2004. The aim was to determine the association of noninvasive cardiac stress testing before surgery with survival rates and length of hospital stay. Included were 271,082 patients, of whom 23,991 (8.9%) underwent stress testing less than 6 months before surgery. These patients were matched with 46,120 who did not undergo testing.
One year after surgery, fewer patients who underwent stress testing had died: 1,622 (7.0%) vs 1,738 (7.5%); hazard ratio 0.92, 95% CI 0.86–0.99, P = .03. The number needed to treat (ie, to be tested) to prevent one death was 221. The tested patients also had a shorter mean hospital stay: 8.72 vs 8.96 days, a difference of 0.24 days (95% CI −0.07 to −0.43; P < .001).
However, the elderly patients (ie, older than 66 years) who underwent testing were more likely to be on beta-blockers and statins than those who did not undergo testing, which may be a confounding factor.
Furthermore, the benefit was all in the patients at intermediate or high risk. The authors performed a subgroup analysis, dividing the patients on the basis of their Revised Cardiac Risk Index (RCRI; 1 point each for ischemic heart disease, congestive heart failure, cerebrovascular disease, diabetes, renal insufficiency, and high-risk surgery).8 Patients with an RCRI of 0 points (indicating low risk) actually had a higher risk of death with testing than without testing: hazard ratio 1.35 (95% CI 1.03–1.74), number needed to harm 179—ie, for every 179 low-risk patients tested, one excess death occurred. Those with an RCRI of 1 or 2 points (indicating intermediate risk) had a hazard ratio of 0.92 with testing (95% CI 085–0.99), and those with an RCRI of 3 to 6 points (indicating high risk) had a hazard ratio of 0.80 with testing (95% CI 0.67- 0.97; number needed to treat = 38).
Comment. These findings indicate that cardiac stress testing should be done selectively before noncardiac surgery, and primarily for patients at high risk (with an RCRI of 3 or higher) and in some patients at intermediate risk, but not in patients at low risk, in whom it may be harmful. Stress testing may change patient management because a positive stress test allows one to start a beta-blocker or a statin, use more aggressive intraoperative and postoperative care, and identify patients who have indications for revascularization.
- Connolly SJ, Ezekowitz MD, Yusuf S, et al; RE-LY Steering Committee and Investigators. Dabigatran versus warfarin in patients with atrial fibrillation. N Engl J Med 2009; 361:1139–1151.
- Schulman S, Kearon C, Kakkar AK, et al; RE-COVER Study Group. Dabigatran versus warfarin in the treatment of acute venous thromboembolism. N Engl J Med 2009; 361:2342–2352.
- Wann LS, Curtis AB, Ellenbogen KA, et al. 2011 ACCF/AHA/HRS focused update on the management of patients with atrial fibrillation (update on dabigatran): A report of the American College of Cardiology Foundation/American Heart Association Task Force on Practice Guidelines. Circulation 2011; 123:1144–1150.
- Pronovost PJ, Goeschel CA, Colantuoni E, et al. Sustaining reductions in catheter-related bloodstream infections in Michigan intensive care units: observational study. BMJ 2010; 340:c309.
- Tian J, Kaufman DA, Zarich S, et al; American Heart Association National Registry for Cardiopulmonary Resuscitation Investigators. Outcomes of critically ill patients who received cardiopulmonary resuscitation. Am J Respir Crit Care Med 2010; 182:501–506.
- Misky GJ, Wald HL, Coleman EA. Post-hospitalization transitions: examining the effects of timing of primary care provider follow-up. J Hosp Med 2010; 5:392–397.
- Wijeysundera DN, Beattie WS, Austin PC, Hux JE, Laupacis A. Non-invasive cardiac stress testing before elective major non-cardiac surgery: population based cohort study. BMJ 2010; 340:b5526.
- Lee TH, Marcantonio ER, Mangione CM, et al. Derivation and prospective validation of a simple index for prediction of cardiac risk of major noncardiac surgery. Circulation 1999; 100:1043–1049.
KEY POINTS
- Dabigatran (Pradaxa) will likely start to replace warfarin (Coumadin) both to prevent stroke in patients with atrial fibrillation and to prevent recurrent venous thromboembolism.
- Using a checklist during insertion of central venous catheters can decrease the rate of catheter-related bloodstream infections in the intensive care unit.
- The overall survival rate of patients who undergo cardiopulmonary resuscitation in the intensive care unit is approximately 16%; the rate is lower in patients who are receiving pressor drugs and higher in those with ventricular tachycardia or ventricular fibrillation.
- Patients lacking follow-up with a primary care physician within 30 days of discharge are at high risk of readmission and have a trend for longer length of hospital stay.
- Preoperative stress testing for patients undergoing noncardiac surgery should be done selectively, ie, in patients at high risk.
How to manage type 2 diabetes in medical and surgical patients in the hospital
Hyperglycemia and diabetes mellitus are very common in hospitalized patients. Although more data are available on the prevalence of this problem and on how to manage it in the intensive care unit (ICU) than on regular hospital floors, the situation is changing. Information is emerging on the prevalence and impact of hyperglycemia and diabetes in the non-ICU setting, which is the focus of this paper.
HYPERGLYCEMIA IS COMMON AND PREDICTS POOR OUTCOMES
Cook et al,1 in a survey of 126 US hospitals, found that the prevalence of hyperglycemia (blood glucose > 180 mg/dL) was 46% in the ICU and 32% in regular wards.
Kosiborod et al2 reported that hyperglycemia (blood glucose > 140 mg/dL) was present in 78% of diabetic patients hospitalized with acute coronary syndrome and 26% of similar hospitalized nondiabetic patients.
Hyperglycemia is a common comorbidity in medical-surgical patients in community hospitals. Our group3 found that, in our hospital, 62% of patients were normoglycemic (ie, had a fasting blood glucose < 126 mg/dL or a random blood glucose < 200 mg/dL on two occasions), 26% had known diabetes, and 12% had new hyperglycemia. Further, new hyperglycemia was associated with a higher in-hospital death rate than the other two conditions.
Failure to identify diabetes is a predictor of rehospitalization. Robbins and Webb4 reported that 30.6% of those who had diabetes that was missed during hospitalization were readmitted within 30 days, compared with 9.4% of patients with diabetes first diagnosed during hospitalization.
WHAT DIAGNOSTIC CRITERIA SHOULD WE USE?
Blood glucose greater than 140 mg/dL
A consensus statement from the American Association of Clinical Endocrinologists (ACE) and the American Diabetes Association (ADA)5 defines in-hospital hyperglycemia as a blood glucose level greater than 140 mg/dL on admission or in the hospital. If the blood glucose is higher than this, the question arises as to whether the patient has preexisting diabetes or has stress hyperglycemia.
Hemoglobin A1c of 6.5% or higher
In view of the uncertainty as to whether a patient with an elevated blood glucose level has preexisting diabetes or stress hyperglycemia, upcoming guidelines will recommend measuring the hemoglobin A1c level if the blood glucose level is higher than 140 mg/dL.
A patient with an elevated blood glucose level (>140 mg/dL) whose hemoglobin A1c level is 6.5% or higher can be identified as having diabetes that preceded the hospitalization. Hemoglobin A1c testing can also be useful to assess glycemic control before admission and in designing an optional regimen at the time of discharge. In patients with newly recognized hyperglycemia, a hemoglobin A1c measurement can help differentiate patients with previously undiagnosed diabetes from those with stress-induced hyperglycemia.
Clinicians should keep in mind that a hemoglobin A1c cutoff of 6.5% identifies fewer cases of undiagnosed diabetes than does a high fasting glucose concentration, and that a level less than 6.5% does not rule out the diagnosis of diabetes. Several epidemiologic studies6 have reported a low sensitivity (44% to 66%) but a high specificity (76% to 99%) for hemoglobin A1c values higher than 6.5% in an outpatient population. The high specificity therefore supports the use of hemoglobin A1c to confirm the diagnosis of diabetes in patients with hyperglycemia, but the low sensitivity indicates that this test should not be used for universal screening in the hospital.
Many factors can influence the hemoglobin A1c level, such as anemia, iron deficiency, blood transfusions, hemolytic anemia, and renal failure.
Until now, if patients had hyperglycemia but no prior diagnosis of diabetes, the recommendation was for an oral 2-hour glucose tolerance test shortly after discharge to confirm the diagnosis of diabetes. Norhammar et al7 performed oral glucose tolerance tests in patients admitted with acute myocardial infarction, and Matz et al8 performed glucose tolerance tests in patients with acute stroke. They found that impaired glucose tolerance and undiagnosed type 2 diabetes were very common in these two groups. However, physicians rarely order oral glucose tolerance tests. We believe that hemoglobin A1c will be a better tool than an oral glucose tolerance test to confirm diabetes in hyperglycemic patients in the hospital setting.
WHAT IS THE ASSOCIATION BETWEEN HYPERGLYCEMIA AND OUTCOMES?
In 2,471 patients admitted to the hospital with community-acquired pneumonia, McAlister et al10 found that the rates of hospital complications and of death rose with blood glucose levels.
Falguera et al11 found that, in 660 episodes of community-acquired pneumonia, the rates of hospitalization, death, pleural effusion, and concomitant illnesses were all significantly higher in diabetic patients than in nondiabetic patients.
Noordzij et al12 performed a case-control study of 108,593 patients who underwent noncardiac surgery. The odds ratio for perioperative death was 1.19 (95% confidence interval [CI] 1.1–1.3) for every 1-mmol/L increase in the glucose level.
Frisch et al,13 in patients undergoing noncardiac surgery, found that the 30-day rates of death and of in-hospital complications were all higher in patients with diabetes than without diabetes.
Our group3 identified hyperglycemia as an independent marker of in-hospital death in patients with undiagnosed diabetes. The rates of death were 1.7% in those with normoglycemia, 3.0% in those with known diabetes, and 16.0% (P < .01) in those with new hyperglycemia.
The ACE/ADA consensus panel14 set the following glucose targets for patients in the non-ICU setting:
- Pre-meal blood glucose < 140 mg/dL
- Random blood glucose < 180 mg/dL.
On the other hand, hypoglycemia is also associated with adverse outcomes. Therefore, to avoid hypoglycemia, the insulin regimen should be reassessed if blood glucose levels fall below 100 mg/dL. New guidelines will suggest keeping the blood glucose between 100 and 140 mg/dL.
HOW SHOULD WE MANAGE HYPERGLYCEMIA IN THE NON-ICU SETTING?
The ACE/ADA guidelines recommend subcutaneous insulin therapy for most medical-surgical patients with diabetes, reserving intravenous insulin therapy for hyperglycemic crises and uncontrolled hyperglycemia.14
Oral antidiabetic agents are not generally recommended, as we have no data to support their use in the hospital. Another argument against using noninsulin therapies in the hospital is that sulfonylureas, especially glyburide (Diabeta, Micronase) are a major cause of hypoglycemia. Metformin (Glucophage) is contraindicated in decreased renal function, in hemodynamic instability, in surgical patients, and with the use of iodinated contrast dye. Thiazolidinediones are associated with edema and congestive heart failure, and they take up to 12 weeks to lower blood glucose levels. Alpha-glucosidase inhibitors are weak glucose-lowering agents. Also, therapies directed at glucagon-like-protein 1 can cause nausea and have a greater effect on postprandial glucose.14
The two main options for managing hyperglycemia and diabetes in the non-ICU setting are short-acting insulin on a sliding scale and basal-bolus therapy, the latter with either NPH plus regular insulin or long-acting plus rapid-acting insulin analogues.
Basal-bolus vs sliding scale insulin: The RABBIT-2 trial
In the RABBIT 2 trial (Randomized Basal Bolus Versus Sliding Scale Regular Insulin in Patients With Type 2 Diabetes Mellitus),15 our group compared the efficacy and safety of a basal-bolus regimen and a sliding-scale regimen in 130 hospitalized patients with type 2 diabetes treated with diet, with oral hypoglycemic agents, or with both. Oral antidiabetic drugs were discontinued on admission, and patients were randomized to one of the treatment groups.
In the basal-bolus group, the starting total daily dose was 0.4 U/kg/day if the blood glucose level on admission was between 140 and 200 mg/dL, or 0.5 U/kg/day if the glucose level was between 201 and 400 mg/dL. Half of the total daily dose was given as insulin glargine (Lantus) once daily, and the other half was given as insulin glulisine (Apidra) before meals. These doses were adjusted if the patient’s fasting or pre-meal blood glucose levels rose above 140 mg/dL or fell below 70 mg/dL.
The sliding-scale group received regular insulin four times daily (before meals and at bedtime) for glucose levels higher than 140 mg/dL; the higher the level, the more they got.
The basal-bolus regimen was better than sliding-scale regular insulin. At admission, the mean glucose values and hemoglobin A1c values were similar in both groups, but the mean glucose level on therapy was significantly lower in the basal-bolus group than in the sliding-scale group, 166 ± 32 mg/dL vs 193 ± 54 mg/dL, P < .001). About two-thirds of the basal-bolus group achieved a blood glucose target of less than 140 mg/dL, compared with only about one-third of the sliding-scale group. The basal-bolus group received more insulin, a mean of 42 units per day vs 12.5 units per day in the sliding-scale group. Yet the incidence of hypoglycemia was 3% in both groups.
NPH plus regular vs detemir plus aspart: The DEAN trial
Several long-acting insulin analogues are available and have a longer duration of action than NPH. Similarly, several newer rapid-acting analogues act more rapidly than regular insulin. Do these pharmacokinetic advantages matter? And do they justify the higher costs of the newer agents?
In the randomized Insulin Detemir Versus NPH Insulin in Hospitalized Patients With Diabetes (DEAN) trial,16 we compared two regimens: detemir plus aspart in a basal-bolus regimen, and NPH plus regular insulin in two divided doses, two-thirds of the total daily dose in the morning before breakfast and one-third before dinner, both doses in a ratio of two-thirds NPH and one-third regular, mixed in the same syringe. We recruited 130 patients with type 2 diabetes mellitus who were on oral hypoglycemic agents or insulin therapy.
NPH plus regular was just as good as detemir plus aspart in improving glycemic control. Blood glucose levels fell during the first day of therapy and were similar in both groups throughout the trial, as measured before breakfast, lunch, and dinner and at bedtime. The mean total daily insulin dose was not significantly different between treatment groups: 56 ± 45 units in the basal-bolus detemir-aspart group and 45 ± 32 units in the NPH-regular group. However, the basal-bolus group received significantly more short-acting insulin: 27 ± 20 units a day of aspart vs 18 ± 14 units of regular.
Somewhat fewer patients in the NPH-regular group had episodes of hypoglycemia, although the difference between groups was not statistically significant.
In a univariate analysis of the RABBIT-2 and DEAN trials,17 factors that predicted a blood glucose level less than 60 mg/dL were older age, lower body weight, higher serum creatinine level, and previous insulin therapy. Factors that were not predictive were the hemoglobin A1c level and the enrollment blood glucose level. Based on these data, we believe that to reduce the rate of hypoglycemia, lower insulin doses are needed in elderly patients and patients with renal impairment, and that if patients have been taking insulin before they come to the hospital, the dose should be cut back by about 25% while they are hospitalized.
Basal-bolus vs sliding-scale insulin for surgical patients: The RABBIT 2 Surgery trial
Does better glucose control in surgical patients affect outcomes in patients undergoing general surgery? To find out, we performed a prospective, multicenter, randomized, open-label trial in general surgery patients not in the ICU.18 We recruited and randomized 211 patients with type 2 diabetes who were on diet therapy or oral hypoglycemic agents or insulin in low doses (< 0.4 U/kg/day).
Oral drugs were discontinued on admission, and patients were randomized to receive either a basal-bolus regimen of glargine plus glulisine or regular insulin on a sliding scale. The basal-bolus group got 0.5 U/kg/day, half of it as glargine once daily and half as glulisine before meals. The total daily dose was reduced to 0.3 U/kg/day in patients age 70 and older or who had a serum creatinine level of 2.0 mg/dL or higher.
The goal was to maintain fasting and pre-meal glucose concentrations between 100 and 140 mg/dL. The total daily dose was raised by 10% (mostly in the glargine dose) if the blood glucose level was in the range of 141 to 180 mg/dL, and by 20% if the glucose level was higher than 181 mg/dL. The dose was decreased by 10% for glucose levels between 70 and 99 mg/dL, was decreased by 20% if the glucose level was between 40 and 69, and was held if the glucose level was lower than 40 mg/dL. If a patient was not able to eat, insulin glulisine was held until meals were resumed.
The sliding-scale group received regular insulin four times a day for blood glucose levels higher than 140 mg/dL.
The primary outcomes measured were the difference between groups in mean daily blood glucose concentration and a composite of hospital complications including postoperative wound infection, pneumonia, respiratory failure, acute renal failure, and bacteremia. Secondary outcomes were differences between groups in mean fasting and pre-meal blood glucose, number of hypoglycemic episodes (blood glucose < 70 mg/dL), hyperglycemic episodes (blood glucose > 200 mg/dL), length of hospital stay, need for intensive care, and rate of complications including wound infection, pneumonia, acute renal failure, and death.
Blood glucose levels were significantly lower in the basal-bolus group through the first 7 days after randomization, as measured before breakfast, lunch, and dinner, and at bedtime, and then they converged.
More patients in the sliding-scale group had hospital complications, 26 vs 9, P = .003. On the other hand, more patients in the basal-bolus group had episodes of hypoglycemia: 24 (23%) vs 5 (4.7%) had episodes of less than 70 mg/dL (P < .001), 12 (12%) vs 2 (1.9%) had episodes of less than 60 mg/dL (P = .005), and 4 (3.8%) vs 0 had episodes of less than 40 mg/dL (P = .057). The mean total daily dose of insulin was 33.4 units in the basal-bolus group and 12.3 units in the sliding-scale group.
WHAT HAVE WE LEARNED?
Don’t use a sliding-scale regimen as a single agent in patients with diabetes. Glycemic control is better with a basal-bolus regimen than with a sliding-scale regimen, and a basal-bolus insulin regimen is preferred for most patients with hyperglycemia.
The old human insulins (ie, regular and NPH) are still good and improve glycemic control as well as the new basal insulin analogues (detemir and aspart) do.
Improved control may reduce the rate of hospital complications, according to preliminary evidence. More studies are under way.
One size does not fit all. Those who are elderly or who have impaired renal function should receive lower doses of insulin, eg, 0.3 U/kg/day instead of 0.5 U/kg/day. Those who are on insulin should have their dose decreased when they are admitted to the hospital. Perhaps lean patients with type 2 diabetes should also have a lower dose.
Most hospitalized patients with diabetes and elevated blood glucose values (or hyperglycemia) should receive subcutaneous insulin treatment with a basal-bolus regimen or a multidose combination of NPH plus regular insulin. Selected patients with severe insulin resistance and persistent hyperglycemia despite subcutaneous insulin may benefit from continuous intravenous insulin infusion.
Patients treated with insulin at home should continue to receive insulin therapy in the hospital. However, the insulin dosage should be reduced by about 25% to allow for lower food intake.
QUESTIONS FOR FURTHER STUDY
Should we modify the standard basal-bolus regimen?
In a typical basal-bolus regimen, patients get 50% of their total daily insulin dose in the form of a basal injection and 50% in the form of rapid-acting boluses before meals. However, for a variety of reasons, hospitalized patients do not eat very much. Thus, a 50-50 basal-bolus regimen may not be ideal for patients with poor oral intake.
In the Basal-PLUS trial, currently under way, we are comparing the safety and efficacy of a daily dose of basal insulin (glargine) plus correction doses of a rapid-acting insulin analogue (glulisine) on a sliding scale and a standard basal-bolus regimen in medical and surgical patients.
Does one glycemic target fit all patients?
Falciglia et al19 found an association between hyperglycemia and death in patients with unstable angina, arrhythmias, stroke, pneumonia, gastrointestinal bleeding, respiratory failure, sepsis, acute renal failure, and congestive heart failure. However, they found no such association in patients with chronic obstructive pulmonary disease, liver failure, diabetic ketoacidosis, gastrointestinal neoplasm, musculoskeletal disease, peripheral vascular disease with bypass, hip fracture, amputation due to peripheral vascular disease, or prostate surgery. Should patients in this second group be treated with a less-intensive insulin regimen?
What is the best regimen after hospital discharge?
We are conducting a prospective clinical trial to assess the impact of insulin after hospital discharge. Our current practice when a patient is discharged from the hospital is as follows:
- If the admission hemoglobin A1c level is less than 7%, we restart the previous outpatient treatment regimen of oral antidiabetic agents, or insulin, or both.
- If the admission hemoglobin A1c is between 7% and 9%, we restart the outpatient oral agents and continue glargine once daily at 50% to 80% of the hospital dose.
- If the hemoglobin A1c level is higher than 9%, we discharge the patient on a basal-bolus regimen at the same dosage as in the hospital. As an alternative, we could restart the oral agents and add glargine once daily at 80% of the hospital dose.
- Cook CB, Kongable GL, Potter DJ, Abad VJ, Leija DE, Anderson M. Inpatient glucose control: a glycemic survey of 126 U.S. hospitals. J Hosp Med 2009; 4:E7–E14.
- Kosiborod M, Inzucchi S, Clark B, et al. National patterns of glucose control among patients hospitalized with acute myocardial infarction [abstract]. J Am Coll Cardiol 2007; 49:283A–284A.
- Umpierrez GE, Isaacs SD, Bazargan N, You X, Thaler LM, Kitabchi AE. Hyperglycemia: an independent marker of in-hospital mortality in patients with undiagnosed diabetes. J Clin Endocrinol Metab 2002; 87:978–982.
- Robbins JM, Webb DA. Diagnosing diabetes and preventing rehospitalizations: the urban diabetes study. Med Care 2006; 44:292–296.
- Moghissi ES, Korytkowski MT, DiNardo M, et al. American Association of Clinical Endocrinologists and American Diabetes Association consensus statement on inpatient glycemic control. Diabetes Care 2009; 32:1119–1131.
- Saudek D, Herman WH, Sacks DB, Bergenstal RM, Edelman D, Davidson MB. A new look at screening and diagnosing diabetes mellitus. J Clin Endocrinol Metab 2008; 93:2447–2453.
- Norhammar A, Tenerz A, Nilsson G, et al. Glucose metabolism in patients with acute myocardial infarction and no previous diagnosis of diabetes mellitus: a prospective study. Lancet 2002; 359:2140–2144.
- Matz K, Keresztes K, Tatschl C, et al. Disorders of glucose metabolism in acute stroke patients: an underrecognized problem. Diabetes Care 2006; 29:792–797.
- American Diabetes Association. Diagnosis and classification of diabetes mellitus. Diabetes Care 2010; 33(suppl 1):S62–S69.
- McAlister FA, Majumdar SR, Blitz S, Rowe BH, Romney J, Marrie TJ. The relation between hyperglycemia and outcomes in 2,471 patients admitted to the hospital with community-acquired pneumonia. Diabetes Care 2005; 28:810–815.
- Falguera M, Pifarre R, Martin A, Sheikh A, Moreno A. Etiology and outcome of community-acquired pneumonia in patients with diabetes mellitus. Chest 2005; 128:3233–3239.
- Noordzij PG, Boersma E, Schreiner F, et al. Increased preoperative glucose levels are associated with perioperative mortality in patients undergoing noncardiac, nonvascular surgery. Eur J Endocrinol 2007; 156:137–142.
- Frisch A, Chandra P, Smiley D, et al. Prevalence and clinical outcome of hyperglycemia in the perioperative period in noncardiac surgery. Diabetes Care 2010; 33:1783–1788.
- Moghissi ES, Korythowski MT, DiNardo M, et al. American Association of Clinical Endocrinologists and American Diabetes Association consensus statement on inpatient glycemic control. Endocrine Pract 2009; 15:1–17.
- Umpierrrez GE, Smiley D, Zisman A, et al. Randomized study of basal-bolus insulin therapy in the inpatient management of patients with type 2 diabetes (RABBIT 2 trial). Diabetes Care 2007; 30:2181–2186.
- Umpierrez GE, Hor T, Smiley D, et al. Comparison of inpatient insulin regimens with detemir plus aspart versus neutral protamine Hagedorn plus regular in medical patients with type 2 diabetes. J Clin Endocrinol Metab 2009; 94:564–569.
- Umpierrez GE, Smiley D, Umpierrez D, Ceron M, Temponi A. Hypoglycemic events during subcutaneous insulin therapy in type 2 diabetes (abstract). Presented at American Diabetes Association 69th Scientific Sessions, New Orleans, LA, June 5–9, 2009.
- Umpierrez GE, Smiley D, Jacobs S, et al. Randomized study of basal-bolus insulin therapy in the inpatient management of patients with type 2 diabetes undergoing general surgery (RABBIT 2 surgery). Diabetes Care 2011; 34:256–261.
- Falciglia M, Freyberg RW, Almenoff PL, D’Alessio DA, Render ML. Hyperglycemia-related mortality in critically ill patients varies with admission diagnosis. Crit Care Med 2009; 37:3001–3009.
Hyperglycemia and diabetes mellitus are very common in hospitalized patients. Although more data are available on the prevalence of this problem and on how to manage it in the intensive care unit (ICU) than on regular hospital floors, the situation is changing. Information is emerging on the prevalence and impact of hyperglycemia and diabetes in the non-ICU setting, which is the focus of this paper.
HYPERGLYCEMIA IS COMMON AND PREDICTS POOR OUTCOMES
Cook et al,1 in a survey of 126 US hospitals, found that the prevalence of hyperglycemia (blood glucose > 180 mg/dL) was 46% in the ICU and 32% in regular wards.
Kosiborod et al2 reported that hyperglycemia (blood glucose > 140 mg/dL) was present in 78% of diabetic patients hospitalized with acute coronary syndrome and 26% of similar hospitalized nondiabetic patients.
Hyperglycemia is a common comorbidity in medical-surgical patients in community hospitals. Our group3 found that, in our hospital, 62% of patients were normoglycemic (ie, had a fasting blood glucose < 126 mg/dL or a random blood glucose < 200 mg/dL on two occasions), 26% had known diabetes, and 12% had new hyperglycemia. Further, new hyperglycemia was associated with a higher in-hospital death rate than the other two conditions.
Failure to identify diabetes is a predictor of rehospitalization. Robbins and Webb4 reported that 30.6% of those who had diabetes that was missed during hospitalization were readmitted within 30 days, compared with 9.4% of patients with diabetes first diagnosed during hospitalization.
WHAT DIAGNOSTIC CRITERIA SHOULD WE USE?
Blood glucose greater than 140 mg/dL
A consensus statement from the American Association of Clinical Endocrinologists (ACE) and the American Diabetes Association (ADA)5 defines in-hospital hyperglycemia as a blood glucose level greater than 140 mg/dL on admission or in the hospital. If the blood glucose is higher than this, the question arises as to whether the patient has preexisting diabetes or has stress hyperglycemia.
Hemoglobin A1c of 6.5% or higher
In view of the uncertainty as to whether a patient with an elevated blood glucose level has preexisting diabetes or stress hyperglycemia, upcoming guidelines will recommend measuring the hemoglobin A1c level if the blood glucose level is higher than 140 mg/dL.
A patient with an elevated blood glucose level (>140 mg/dL) whose hemoglobin A1c level is 6.5% or higher can be identified as having diabetes that preceded the hospitalization. Hemoglobin A1c testing can also be useful to assess glycemic control before admission and in designing an optional regimen at the time of discharge. In patients with newly recognized hyperglycemia, a hemoglobin A1c measurement can help differentiate patients with previously undiagnosed diabetes from those with stress-induced hyperglycemia.
Clinicians should keep in mind that a hemoglobin A1c cutoff of 6.5% identifies fewer cases of undiagnosed diabetes than does a high fasting glucose concentration, and that a level less than 6.5% does not rule out the diagnosis of diabetes. Several epidemiologic studies6 have reported a low sensitivity (44% to 66%) but a high specificity (76% to 99%) for hemoglobin A1c values higher than 6.5% in an outpatient population. The high specificity therefore supports the use of hemoglobin A1c to confirm the diagnosis of diabetes in patients with hyperglycemia, but the low sensitivity indicates that this test should not be used for universal screening in the hospital.
Many factors can influence the hemoglobin A1c level, such as anemia, iron deficiency, blood transfusions, hemolytic anemia, and renal failure.
Until now, if patients had hyperglycemia but no prior diagnosis of diabetes, the recommendation was for an oral 2-hour glucose tolerance test shortly after discharge to confirm the diagnosis of diabetes. Norhammar et al7 performed oral glucose tolerance tests in patients admitted with acute myocardial infarction, and Matz et al8 performed glucose tolerance tests in patients with acute stroke. They found that impaired glucose tolerance and undiagnosed type 2 diabetes were very common in these two groups. However, physicians rarely order oral glucose tolerance tests. We believe that hemoglobin A1c will be a better tool than an oral glucose tolerance test to confirm diabetes in hyperglycemic patients in the hospital setting.
WHAT IS THE ASSOCIATION BETWEEN HYPERGLYCEMIA AND OUTCOMES?
In 2,471 patients admitted to the hospital with community-acquired pneumonia, McAlister et al10 found that the rates of hospital complications and of death rose with blood glucose levels.
Falguera et al11 found that, in 660 episodes of community-acquired pneumonia, the rates of hospitalization, death, pleural effusion, and concomitant illnesses were all significantly higher in diabetic patients than in nondiabetic patients.
Noordzij et al12 performed a case-control study of 108,593 patients who underwent noncardiac surgery. The odds ratio for perioperative death was 1.19 (95% confidence interval [CI] 1.1–1.3) for every 1-mmol/L increase in the glucose level.
Frisch et al,13 in patients undergoing noncardiac surgery, found that the 30-day rates of death and of in-hospital complications were all higher in patients with diabetes than without diabetes.
Our group3 identified hyperglycemia as an independent marker of in-hospital death in patients with undiagnosed diabetes. The rates of death were 1.7% in those with normoglycemia, 3.0% in those with known diabetes, and 16.0% (P < .01) in those with new hyperglycemia.
The ACE/ADA consensus panel14 set the following glucose targets for patients in the non-ICU setting:
- Pre-meal blood glucose < 140 mg/dL
- Random blood glucose < 180 mg/dL.
On the other hand, hypoglycemia is also associated with adverse outcomes. Therefore, to avoid hypoglycemia, the insulin regimen should be reassessed if blood glucose levels fall below 100 mg/dL. New guidelines will suggest keeping the blood glucose between 100 and 140 mg/dL.
HOW SHOULD WE MANAGE HYPERGLYCEMIA IN THE NON-ICU SETTING?
The ACE/ADA guidelines recommend subcutaneous insulin therapy for most medical-surgical patients with diabetes, reserving intravenous insulin therapy for hyperglycemic crises and uncontrolled hyperglycemia.14
Oral antidiabetic agents are not generally recommended, as we have no data to support their use in the hospital. Another argument against using noninsulin therapies in the hospital is that sulfonylureas, especially glyburide (Diabeta, Micronase) are a major cause of hypoglycemia. Metformin (Glucophage) is contraindicated in decreased renal function, in hemodynamic instability, in surgical patients, and with the use of iodinated contrast dye. Thiazolidinediones are associated with edema and congestive heart failure, and they take up to 12 weeks to lower blood glucose levels. Alpha-glucosidase inhibitors are weak glucose-lowering agents. Also, therapies directed at glucagon-like-protein 1 can cause nausea and have a greater effect on postprandial glucose.14
The two main options for managing hyperglycemia and diabetes in the non-ICU setting are short-acting insulin on a sliding scale and basal-bolus therapy, the latter with either NPH plus regular insulin or long-acting plus rapid-acting insulin analogues.
Basal-bolus vs sliding scale insulin: The RABBIT-2 trial
In the RABBIT 2 trial (Randomized Basal Bolus Versus Sliding Scale Regular Insulin in Patients With Type 2 Diabetes Mellitus),15 our group compared the efficacy and safety of a basal-bolus regimen and a sliding-scale regimen in 130 hospitalized patients with type 2 diabetes treated with diet, with oral hypoglycemic agents, or with both. Oral antidiabetic drugs were discontinued on admission, and patients were randomized to one of the treatment groups.
In the basal-bolus group, the starting total daily dose was 0.4 U/kg/day if the blood glucose level on admission was between 140 and 200 mg/dL, or 0.5 U/kg/day if the glucose level was between 201 and 400 mg/dL. Half of the total daily dose was given as insulin glargine (Lantus) once daily, and the other half was given as insulin glulisine (Apidra) before meals. These doses were adjusted if the patient’s fasting or pre-meal blood glucose levels rose above 140 mg/dL or fell below 70 mg/dL.
The sliding-scale group received regular insulin four times daily (before meals and at bedtime) for glucose levels higher than 140 mg/dL; the higher the level, the more they got.
The basal-bolus regimen was better than sliding-scale regular insulin. At admission, the mean glucose values and hemoglobin A1c values were similar in both groups, but the mean glucose level on therapy was significantly lower in the basal-bolus group than in the sliding-scale group, 166 ± 32 mg/dL vs 193 ± 54 mg/dL, P < .001). About two-thirds of the basal-bolus group achieved a blood glucose target of less than 140 mg/dL, compared with only about one-third of the sliding-scale group. The basal-bolus group received more insulin, a mean of 42 units per day vs 12.5 units per day in the sliding-scale group. Yet the incidence of hypoglycemia was 3% in both groups.
NPH plus regular vs detemir plus aspart: The DEAN trial
Several long-acting insulin analogues are available and have a longer duration of action than NPH. Similarly, several newer rapid-acting analogues act more rapidly than regular insulin. Do these pharmacokinetic advantages matter? And do they justify the higher costs of the newer agents?
In the randomized Insulin Detemir Versus NPH Insulin in Hospitalized Patients With Diabetes (DEAN) trial,16 we compared two regimens: detemir plus aspart in a basal-bolus regimen, and NPH plus regular insulin in two divided doses, two-thirds of the total daily dose in the morning before breakfast and one-third before dinner, both doses in a ratio of two-thirds NPH and one-third regular, mixed in the same syringe. We recruited 130 patients with type 2 diabetes mellitus who were on oral hypoglycemic agents or insulin therapy.
NPH plus regular was just as good as detemir plus aspart in improving glycemic control. Blood glucose levels fell during the first day of therapy and were similar in both groups throughout the trial, as measured before breakfast, lunch, and dinner and at bedtime. The mean total daily insulin dose was not significantly different between treatment groups: 56 ± 45 units in the basal-bolus detemir-aspart group and 45 ± 32 units in the NPH-regular group. However, the basal-bolus group received significantly more short-acting insulin: 27 ± 20 units a day of aspart vs 18 ± 14 units of regular.
Somewhat fewer patients in the NPH-regular group had episodes of hypoglycemia, although the difference between groups was not statistically significant.
In a univariate analysis of the RABBIT-2 and DEAN trials,17 factors that predicted a blood glucose level less than 60 mg/dL were older age, lower body weight, higher serum creatinine level, and previous insulin therapy. Factors that were not predictive were the hemoglobin A1c level and the enrollment blood glucose level. Based on these data, we believe that to reduce the rate of hypoglycemia, lower insulin doses are needed in elderly patients and patients with renal impairment, and that if patients have been taking insulin before they come to the hospital, the dose should be cut back by about 25% while they are hospitalized.
Basal-bolus vs sliding-scale insulin for surgical patients: The RABBIT 2 Surgery trial
Does better glucose control in surgical patients affect outcomes in patients undergoing general surgery? To find out, we performed a prospective, multicenter, randomized, open-label trial in general surgery patients not in the ICU.18 We recruited and randomized 211 patients with type 2 diabetes who were on diet therapy or oral hypoglycemic agents or insulin in low doses (< 0.4 U/kg/day).
Oral drugs were discontinued on admission, and patients were randomized to receive either a basal-bolus regimen of glargine plus glulisine or regular insulin on a sliding scale. The basal-bolus group got 0.5 U/kg/day, half of it as glargine once daily and half as glulisine before meals. The total daily dose was reduced to 0.3 U/kg/day in patients age 70 and older or who had a serum creatinine level of 2.0 mg/dL or higher.
The goal was to maintain fasting and pre-meal glucose concentrations between 100 and 140 mg/dL. The total daily dose was raised by 10% (mostly in the glargine dose) if the blood glucose level was in the range of 141 to 180 mg/dL, and by 20% if the glucose level was higher than 181 mg/dL. The dose was decreased by 10% for glucose levels between 70 and 99 mg/dL, was decreased by 20% if the glucose level was between 40 and 69, and was held if the glucose level was lower than 40 mg/dL. If a patient was not able to eat, insulin glulisine was held until meals were resumed.
The sliding-scale group received regular insulin four times a day for blood glucose levels higher than 140 mg/dL.
The primary outcomes measured were the difference between groups in mean daily blood glucose concentration and a composite of hospital complications including postoperative wound infection, pneumonia, respiratory failure, acute renal failure, and bacteremia. Secondary outcomes were differences between groups in mean fasting and pre-meal blood glucose, number of hypoglycemic episodes (blood glucose < 70 mg/dL), hyperglycemic episodes (blood glucose > 200 mg/dL), length of hospital stay, need for intensive care, and rate of complications including wound infection, pneumonia, acute renal failure, and death.
Blood glucose levels were significantly lower in the basal-bolus group through the first 7 days after randomization, as measured before breakfast, lunch, and dinner, and at bedtime, and then they converged.
More patients in the sliding-scale group had hospital complications, 26 vs 9, P = .003. On the other hand, more patients in the basal-bolus group had episodes of hypoglycemia: 24 (23%) vs 5 (4.7%) had episodes of less than 70 mg/dL (P < .001), 12 (12%) vs 2 (1.9%) had episodes of less than 60 mg/dL (P = .005), and 4 (3.8%) vs 0 had episodes of less than 40 mg/dL (P = .057). The mean total daily dose of insulin was 33.4 units in the basal-bolus group and 12.3 units in the sliding-scale group.
WHAT HAVE WE LEARNED?
Don’t use a sliding-scale regimen as a single agent in patients with diabetes. Glycemic control is better with a basal-bolus regimen than with a sliding-scale regimen, and a basal-bolus insulin regimen is preferred for most patients with hyperglycemia.
The old human insulins (ie, regular and NPH) are still good and improve glycemic control as well as the new basal insulin analogues (detemir and aspart) do.
Improved control may reduce the rate of hospital complications, according to preliminary evidence. More studies are under way.
One size does not fit all. Those who are elderly or who have impaired renal function should receive lower doses of insulin, eg, 0.3 U/kg/day instead of 0.5 U/kg/day. Those who are on insulin should have their dose decreased when they are admitted to the hospital. Perhaps lean patients with type 2 diabetes should also have a lower dose.
Most hospitalized patients with diabetes and elevated blood glucose values (or hyperglycemia) should receive subcutaneous insulin treatment with a basal-bolus regimen or a multidose combination of NPH plus regular insulin. Selected patients with severe insulin resistance and persistent hyperglycemia despite subcutaneous insulin may benefit from continuous intravenous insulin infusion.
Patients treated with insulin at home should continue to receive insulin therapy in the hospital. However, the insulin dosage should be reduced by about 25% to allow for lower food intake.
QUESTIONS FOR FURTHER STUDY
Should we modify the standard basal-bolus regimen?
In a typical basal-bolus regimen, patients get 50% of their total daily insulin dose in the form of a basal injection and 50% in the form of rapid-acting boluses before meals. However, for a variety of reasons, hospitalized patients do not eat very much. Thus, a 50-50 basal-bolus regimen may not be ideal for patients with poor oral intake.
In the Basal-PLUS trial, currently under way, we are comparing the safety and efficacy of a daily dose of basal insulin (glargine) plus correction doses of a rapid-acting insulin analogue (glulisine) on a sliding scale and a standard basal-bolus regimen in medical and surgical patients.
Does one glycemic target fit all patients?
Falciglia et al19 found an association between hyperglycemia and death in patients with unstable angina, arrhythmias, stroke, pneumonia, gastrointestinal bleeding, respiratory failure, sepsis, acute renal failure, and congestive heart failure. However, they found no such association in patients with chronic obstructive pulmonary disease, liver failure, diabetic ketoacidosis, gastrointestinal neoplasm, musculoskeletal disease, peripheral vascular disease with bypass, hip fracture, amputation due to peripheral vascular disease, or prostate surgery. Should patients in this second group be treated with a less-intensive insulin regimen?
What is the best regimen after hospital discharge?
We are conducting a prospective clinical trial to assess the impact of insulin after hospital discharge. Our current practice when a patient is discharged from the hospital is as follows:
- If the admission hemoglobin A1c level is less than 7%, we restart the previous outpatient treatment regimen of oral antidiabetic agents, or insulin, or both.
- If the admission hemoglobin A1c is between 7% and 9%, we restart the outpatient oral agents and continue glargine once daily at 50% to 80% of the hospital dose.
- If the hemoglobin A1c level is higher than 9%, we discharge the patient on a basal-bolus regimen at the same dosage as in the hospital. As an alternative, we could restart the oral agents and add glargine once daily at 80% of the hospital dose.
- Cook CB, Kongable GL, Potter DJ, Abad VJ, Leija DE, Anderson M. Inpatient glucose control: a glycemic survey of 126 U.S. hospitals. J Hosp Med 2009; 4:E7–E14.
- Kosiborod M, Inzucchi S, Clark B, et al. National patterns of glucose control among patients hospitalized with acute myocardial infarction [abstract]. J Am Coll Cardiol 2007; 49:283A–284A.
- Umpierrez GE, Isaacs SD, Bazargan N, You X, Thaler LM, Kitabchi AE. Hyperglycemia: an independent marker of in-hospital mortality in patients with undiagnosed diabetes. J Clin Endocrinol Metab 2002; 87:978–982.
- Robbins JM, Webb DA. Diagnosing diabetes and preventing rehospitalizations: the urban diabetes study. Med Care 2006; 44:292–296.
- Moghissi ES, Korytkowski MT, DiNardo M, et al. American Association of Clinical Endocrinologists and American Diabetes Association consensus statement on inpatient glycemic control. Diabetes Care 2009; 32:1119–1131.
- Saudek D, Herman WH, Sacks DB, Bergenstal RM, Edelman D, Davidson MB. A new look at screening and diagnosing diabetes mellitus. J Clin Endocrinol Metab 2008; 93:2447–2453.
- Norhammar A, Tenerz A, Nilsson G, et al. Glucose metabolism in patients with acute myocardial infarction and no previous diagnosis of diabetes mellitus: a prospective study. Lancet 2002; 359:2140–2144.
- Matz K, Keresztes K, Tatschl C, et al. Disorders of glucose metabolism in acute stroke patients: an underrecognized problem. Diabetes Care 2006; 29:792–797.
- American Diabetes Association. Diagnosis and classification of diabetes mellitus. Diabetes Care 2010; 33(suppl 1):S62–S69.
- McAlister FA, Majumdar SR, Blitz S, Rowe BH, Romney J, Marrie TJ. The relation between hyperglycemia and outcomes in 2,471 patients admitted to the hospital with community-acquired pneumonia. Diabetes Care 2005; 28:810–815.
- Falguera M, Pifarre R, Martin A, Sheikh A, Moreno A. Etiology and outcome of community-acquired pneumonia in patients with diabetes mellitus. Chest 2005; 128:3233–3239.
- Noordzij PG, Boersma E, Schreiner F, et al. Increased preoperative glucose levels are associated with perioperative mortality in patients undergoing noncardiac, nonvascular surgery. Eur J Endocrinol 2007; 156:137–142.
- Frisch A, Chandra P, Smiley D, et al. Prevalence and clinical outcome of hyperglycemia in the perioperative period in noncardiac surgery. Diabetes Care 2010; 33:1783–1788.
- Moghissi ES, Korythowski MT, DiNardo M, et al. American Association of Clinical Endocrinologists and American Diabetes Association consensus statement on inpatient glycemic control. Endocrine Pract 2009; 15:1–17.
- Umpierrrez GE, Smiley D, Zisman A, et al. Randomized study of basal-bolus insulin therapy in the inpatient management of patients with type 2 diabetes (RABBIT 2 trial). Diabetes Care 2007; 30:2181–2186.
- Umpierrez GE, Hor T, Smiley D, et al. Comparison of inpatient insulin regimens with detemir plus aspart versus neutral protamine Hagedorn plus regular in medical patients with type 2 diabetes. J Clin Endocrinol Metab 2009; 94:564–569.
- Umpierrez GE, Smiley D, Umpierrez D, Ceron M, Temponi A. Hypoglycemic events during subcutaneous insulin therapy in type 2 diabetes (abstract). Presented at American Diabetes Association 69th Scientific Sessions, New Orleans, LA, June 5–9, 2009.
- Umpierrez GE, Smiley D, Jacobs S, et al. Randomized study of basal-bolus insulin therapy in the inpatient management of patients with type 2 diabetes undergoing general surgery (RABBIT 2 surgery). Diabetes Care 2011; 34:256–261.
- Falciglia M, Freyberg RW, Almenoff PL, D’Alessio DA, Render ML. Hyperglycemia-related mortality in critically ill patients varies with admission diagnosis. Crit Care Med 2009; 37:3001–3009.
KEY POINTS
- Hyperglycemia and undiagnosed diabetes are very common in hospitalized patients and are associated with poorer outcomes.
- Hospitalized patients should be screened for diabetes with a blood glucose measurement. Those who have a value of 140 mg/dL or higher should be tested for hemoglobin A1c. A value higher than 6.5% is very specific for diabetes, although not very sensitive for it.
- Most hospitalized patients with diabetes and elevated blood glucose values (or hyperglycemia) should receive subcutaneous insulin treatment with a basal-bolus regimen or a multidose combination of neutral protamine Hagedorn (NPH) plus regular insulin. Selected patients with severe insulin resistance and persistent hyperglycemia despite subcutaneous insulin may benefit from continuous intravenous insulin infusion.
- Sliding-scale insulin as a single form of therapy in patients with diabetes is undesirable.
Perioperative Medicine Summit 2011
Summit Director:
Amir K. Jaffer, MD
Contents
Abstract 1: Application of 2007 ACC/AHA guidelines on perioperative cardiovascular evaluation and care for noncardiac surgery using decision support tools
BobbieJean Sweitzer, Michael Vigoda, Vicente Behrens, Nikola Miljkovic, and Kris Arheart
Abstract 2: Prevalence of obstructive dleep spnea in patients presenting for hip or knee replacement surgery
Micah Beachy, DO; Jason Shiffermiller, MD; and Chad Vokoun, MD
Abstract 3: A protocol to triage preoperative assessments to either nurses or nurse practitioners/physician assistants
Anthony Basil, RN; Pamela Pennigar, FNP; David R. Wright, MD; and Ronald P. Olson, MD
Abstract 4: Application of 2007 ACC/AHA guidelines on perioperative cardiovascular evaluation and care for noncardiac surgery using decision support tools
BobbieJean Sweitzer, Michael Vigoda, Vicente Behrens, Nikola Miljkovic, and Kris Arheart
Abstract 5: Most anesthesiologists don’t correctly apply 2007 ACC/AHA guidelines on perioperative cardiac evaluation
BobbieJean Sweitzer, Michael Vigoda, Vicente Behrens, Nikola Miljkovic, Kris Arheart, and Richard Dutton
Abstract 6: Anesthesiology residents do not agree with their training programs on the degree to which the 2007 ACC/AHA guidelines are emphasized
BobbieJean Sweitzer, Michael Vigoda, Vicente Behrens, Nikola Miljkovic, and Kris Arheart
Abstract 7: Prevalence of obstructive sleep apnea in patients presenting for hip or knee replacement surgery
Micah Beachy, DO; Jason Shiffermiller, MD; and Chad Vokoun, MD
Abstract 8: A protocol to triage preoperative assessments to either nurses or nurse practitioners/physician assistants
Anthony Basil, RN; Pamela Pennigar, FNP; David R. Wright, MD; and Ronald P. Olson, MD
Abstract 9: Do ACEIs on the morning of surgery increase risk of intraoperative hypotension?
Steven L. Cohn, MD, and Kalia Skeete, MD
Abstract 10: One-year incidence of postoperative troponin revations in patients undergoing major orthopedic surgery
Michael Urban, MD, PhD; Stephen Wolfe, BS; Niel Sanghevi, BS; and Steven Magid, MD
Abstract 11: A review of preoperative clinic cardiology referrals for adults undergoing intermediate- and low-risk surgery
Susan Calderwood, MD; Jennifer Lee Morse, MS; and Damon R. Michaels, CCRP
Abstract 12: Patterns of preoperative consultation by risk and surgical specialty in a large health care system
Stephan Thilen, MD, MS; Christopher Bryson, MD, MS; Robert Reid, MD, PhD; and Miriam Treggiari, MD, MPH, PhD
Abstract 13: One-year incidence for admission to a critical care unit after major orthopedic surgery
Michael Urban, MD, PhD; Steven Magid, MD; and Michele Mangini, DNP
Abstract 14: Determination of the causes of long patient wait times in a preoperative evaluation clinic
Jean Kwo, MD; Devon Price, BS; Mary Elizabeth Ellbeg, RN; and Retsef Levi, PhD
Abstract 15: Does perioperative statin treatment affect hospital and ICU length of stay rollowing cardiac surgery: A systematic review
Vineet Chopra, MD, FACP, FHM; David Wesorick, MD; and Kim A. Eagle, MD
Abstract 16: Assessment of patient satisfaction of nurse screening vs complete preoperative assessment
Ronald Olson, MD, and Kathy Bock, RN
Abstract 17: Traumatic subdural hematoma: An update on morbidity
Rachel Thompson, MD; Christina Ryan, MD; Nancy Temkin, PhD; Richard Ellenbogen, MD; and Joann G. Elmore, MD, MPH
Abstract 18: Lipid emulsion as a lifesaving treatment for local anesthetic systemic toxicity (LAST)
Deepti Sachdev and Guy Weinberg, MD
Abstract 19: Perioperative ACLS recommendations should be modified for the treatment of local anesthetic toxicity
Adam Haas, MD, and Alexia Beccue, MD
Abstract 20: Preoperative EMR containing smart-set reminders improve accuracy of documentation by nonanesthesia clinicians during preoperative assessments
Angela Edwards, MD; Jill Grant, PA; and Ruth Hyde, MD
Abstract 21: POET: Procedure outcomes evaluation tool
Ahmad AbuSalah, MSc, and Terrence Adam, MD, PhD
Abstract 22: Results of a multidisciplinary preoperative assessment process for high-risk orthopedic patients
Terrence Adam, MD, PhD; Connie Parenti, MD; Terence Gioe, MD; and Karen Ringsred, MD
Abstract 23: Practical algorithm for preoperative evaluation of patients with liver disease
Madalina A. Vlase, PA-C, and Deborah C. Richman, MBChB, FFA(SA)
Abstract 24: Evaluation and management of isolated elevated aPTT
Sheila Hassan, MSN, NP; Patricia Kidik, MSN, NP; Catherine McGowan, MSN, NP; and Angela M. Bader, MD
Abstract 25: A perioperative triage plan for obstructive sleep apnea patients
Christian Altman, MD; R. Michael Boyer, DO; and Peter G. Kallas, MD
Abstract 26: Quantitative evaluation of handoff checklists
Jay Joshi, MD, and David Mayer, MD
Abstract 27: To deflate or not to deflate: Lap-Band® management in subsequent surgeries
Arjun Reddy, MD, and Deborah C. Richman, MBChB, FFA(SA)
Abstract 28: Takotsubo cardiomyopathy and resultant cardiogenic shock after mitral valve repair
Adam Evans, MD, MBA; Daniel B. Sims, MD; Nir Uriel, MD; Ulrich P. Jorde, MD; and Craig R. Smith, MD
Abstract 29: Intravenous vitamin K: Rapid reversal of warfarin and lack of subsequent warfarin resistance
Feras Abdul Khalek, MD; Interdeep Dhaliwal, MD; and Twylla Tassava, MD
Abstract 30: Cervical spine surgery: When not to extubate postoperatively
Carlos Mateo Mijares, MD; Doris Debs, ARNP, MSN-BC; Nicole Martin, MD; and Ronald Lee Samson, MD
Abstract 31: Total occlusion of oral cavity by mandibular sarcoma for resection: To intubate nasally or proceed to an awake tracheostomy?
Carlos Mateo Mijares, MD, and Maria DeLapena, MD
Abstract 32: Perioperative fatal embolic stroke associated with iron deficiency anemia and thrombocytosis
Carlos Mateo Mijares, MD; Nicole Martin, MD; and Ricardo Martinez-Ruiz, MD
Abstract 33: Conservative approach saves the day anesthesia-wise and surgical-wise
Carlos Mateo Mijares, MD; Bradley Shore, MD; Edward Zalkind, CRNA; and Nicole Martin, MD
Abstract 34: Predictors of acute kidney injury in patients undergoing total knee replacement surgery
Vishal Sehgal, MD; Pardeep Bansal, MD; Praveen Reddy, MD; Vishal Sharma, MD; Samuel Lesko, MD; John H. Doherty, MD; Theodore Tomaszewski, MD; Jack Prior, MD; Roger Getts, MD; and Jeremiah Eagan, MD
Abstract 35: Perioperative medical management of the Marfan patient undergoing repeat cardiothoracic surgery
Aashish Shah, MD, and Adam Skrzynski, MD
Intracerebral hemorrhage: Pick your poison
Anticoagulants have been helping patients at risk of thrombosis since the late 1930s.1,2 Although the indications for these agents are many, the development of anticoagulants beyond oral vitamin K antagonists and parenteral heparin has been slow. In the United States, the vitamin K antagonist warfarin (Coumadin) is still the only oral anticoagulant available.
The major complication of anticoagulant therapy is bleeding, and vitamin K antagonists have proven challenging to use in clinical practice.1,3 They have a narrow therapeutic window, they vary considerably in dose-response from patient to patient, and they are subject to significant interactions with other drugs and with foods. For these reasons, therapy must be monitored with laboratory testing, and good patient compliance and patient education are essential. Yet even with these measures, life-threatening hemorrhage still can occur.
In this issue of the Cleveland Clinic Journal of Medicine, Goldstein and Greenberg4 review warfarin-related intracerebral hemorrhage (ICH) and provide a framework for considering whether to resume anticoagulant therapy.
WHAT TO DO IN THE ACUTE PHASE
Goldstein and Greenberg divide the difficult clinical question of what to do after ICH into the acute phase and the chronic phase.
What to do in the acute phase appears straightforward, as the risk of hematoma expansion in the hours immediately after warfarin-related ICH outweighs the risk of arterial or venous thromboembolism. Anticoagulant reversal should be the primary consideration in the first 24 hours, and, assuming the patient does not have acute (< 4-week-old) deep vein thrombosis, intermittent pneumatic compression should be applied to the lower extremities to reduce the risk of venous thromboembolism associated with ICH.5
Prophylactic anticoagulation with subcutaneous fixed-dose heparin or low-molecular-weight heparin is recommended starting 72 hours after ICH is diagnosed, provided the patient is not underweight (< 50 kg), has relatively normal renal function (creatinine clearance > 30 mL/minute/1.73 m2) and normal platelet function, and does not have coagulopathy. 6 If any one of these criteria is not met, the risk of bleeding can be higher, even with only prophylactic doses of anticoagulant drugs. Prophylactic anticoagulation should be continued until hospital and rehabilitation discharge, typically 1 to 2 weeks after ICH, depending on the severity of the patient’s neurologic impairment.
If a patient with warfarin-related ICH has concomitant acute proximal deep vein thrombosis or pulmonary embolism (ie, < 4 weeks old), then caval interruption therapy would be indicated.7 Although retrievable inferior vena cava filters are increasingly preferred over permanent filters, it is important to recognize the relative lack of both longitudinal and prospective data on retrievable devices. Given that provoked venous thromboembolism requires a minimum of 3 months of anticoagulation, and retrievable filters generally need to be removed before 3 months, a retrievable filter should be chosen only if the clinician has already decided that oral anticoagulation will be restarted in the next 3 to 4 weeks after filter removal.
WHAT TO DO IN THE CHRONIC PHASE
A more difficult question in patients with warfarin-related ICH arises in the chronic phase: should oral anticoagulation be resumed at all?
Since the risk of ICH is related to the intensity of anticoagulation, a lower target international normalized ratio may be the best compromise, depending on the patient. Alternatively, antiplatelet therapy alone may offer some benefit with less risk of ICH.
THE NEWER ORAL ANTICOAGULANTS
As Goldstein and Greenberg mention, the ongoing development of new and potentially safer oral anticoagulants may affect how we approach these risk-benefit equations.
Three new oral anticoagulants—dabigatran (Pradaxa), apixaban, and rivaroxaban (Xarelto)—are being tested for various anticoagulant indications, and several phase III studies have recently closed or are nearing completion.
Dabigatran is an oral direct thrombin inhibitor currently available in Europe and Canada.
In the Randomized Evaluation of Long-term Anticoagulant Therapy (RE-LY) trial, the efficacy and safety of two different doses of dabigatran (110 mg twice daily or 150 mg twice daily) relative to warfarin were studied in more than 18,000 patients with atrial fibrillation. 9 The primary outcome measure was stroke or systemic embolism. Dabigatran 110 mg was not inferior to warfarin in terms of the primary outcome, while dabigatran 150 mg was superior. The rate of major bleeding was 3.36% per year in the warfarin group vs 2.71% in the 110-mg group (P = .003) and 3.11% in the 150-mg group (P not significant).
Additional safety data on this drug are available from the 2,500-patient RE-COVER trial.10 Dabigatran was not inferior to warfarin in the treatment of acute venous thromboembolism, with a similar rate of major bleeding and a lower rate of combined major plus nonmajor bleeding.
Apixaban, an oral direct factor Xa inhibitor, is in a phase III trial in patients with atrial fibrillation—Apixaban for Reduction in Stroke and Other Thromboembolic Events in Atrial Fibrillation (ARISTOTLE)11—comparing apixaban vs warfarin. Another phase III trial, AVERROES,12 was stopped early after a predefined interim analysis by the independent data-monitoring committee found clear evidence of benefit in the apixaban group.13 The AVERROES results were presented at the 2010 European Society of Cardiology Congress, August 28–September 1, Stockholm, Sweden.14
Rivaroxaban, another promising oral direct factor Xa inhibitor, is currently available in Europe and Canada for the prevention of thrombosis in orthopedic surgery patients. Rivaroxaban is also in large phase III trials for the treatment of acute venous thromboembolism15–17 and for the prevention of stroke in atrial fibrillation.18
Newer agents have drawbacks, too
These new agents need no laboratory monitoring, and they do not appear to be subject to the dose variability and the interactions with drugs and foods seen with vitamin K antagonists. As a result, they may pose less risk of anticoagulant-related ICH.
The decision to resume anticoagulation after anticoagulant-associated intracranial hemorrhage should be based on the risk of rebleeding vs the risk of thrombosis. Patients determined to be at high risk of thrombosis and low risk of rebleeding are the best candidates for resuming anticoagulation.
Still, for patients who suffer an anticoagulant- or warfarin-related ICH, these new anticoagulants are not likely to simplify the issue of restarting anticoagulant therapy. Unlike vitamin K antagonists, dabigatran and the direct factor Xa inhibitors have no known antidote for their anticoagulant effects. Animal data suggest that factor Xa concentrates may help,19 but for patients at risk of a second anticoagulant-related ICH, this does not provide much reassurance.
As with all clinical decisions in medicine, the potential benefits of any therapy should outweigh the risks. In the case of warfarin-related ICH, resuming anticoagulant therapy requires careful consideration of many factors, including patient preferences and tolerance of different levels of risk. As new and perhaps safer anticoagulants become available, clinicians may face such difficult questions less and less. But in the meantime, doctors and their patients are left to pick their poison.
- Ansell J, Hirsh J, Hylek E, Jacobson A, Crowther M, Palareti G; American College of Chest Physicians. Pharmacology and management of the vitamin K antagonists: American College of Chest Physicians Evidence-Based Clinical Practice Guidelines (8th Edition). Chest 2008; 133(suppl 6):160S–198S.
- Hirsh J, Bauer KA, Donati MB, Gould M, Samama MM, Weitz JI; American College of Chest Physicians. Parenteral anticoagulants: American College of Chest Physicians Evidence-Based Clinical Practice Guidelines (8th Edition). Chest 2008; 133(suppl 6):141S–159S.
- Schulman S, Beyth RJ, Kearon C, Levine MN; American College of Chest Physicians. Hemorrhagic complications of anticoagulant and thrombolytic treatment: American College of Chest Physicians Evidence-Based Clinical Practice Guidelines (8th edition). Chest 2008; 133(suppl 6):257S–298S.
- Goldstein JN, Greenberg SM. Should anticoagulation be resumed after intracerebral hemorrhage? Cleve Clin J Med 2010; 77:791–799.
- Geerts WH, Bergqvist D, Pineo GF, et al; American College of Chest Physicians. Prevention of venous thromboembolism: American College of Chest Physicians Evidence-Based Clinical Practice Guidelines (8th Edition). Chest 2008; 133(suppl 6):381S–453S.
- Michota F, Merli G. Anticoagulation in special patient populations: are special dosing considerations required? Cleve Clin J Med 2005; 72(suppl 1):S37–S42.
- Kearon C, Kahn SR, Agnelli G, Goldhaber S, Raskob GE, Comerota AJ; American College of Chest Physicians. Antithrombotic therapy for venous thromboembolic disease: American College of Chest Physicians Evidence-Based Clinical Practice Guidelines (8th Edition). Chest 2008; 133(suppl 6):454S–545S.
- Douketis JD, Berger PB, Dunn AS, et al; American College of Chest Physicians. The perioperative management of antithrombotic therapy: American College of Chest Physicians Evidence-Based Clinical Practice Guidelines (8th Edition). Chest 2008; 133(suppl 6):299S–339S.
- Connolly SJ, Ezekowitz MD, Yusuf S, et al; RE-LY Steering Committee and Investigators. Dabigatran versus warfarin in patients with atrial fibrillation. N Engl J Med 2009; 361:1139–1151.
- Schulman S, Kearon C, Kakkar AK, et al; RE-COVER Study Group. Dabigatran versus warfarin in the treatment of acute venous thromboembolism. N Engl J Med 2009; 361:2342–2352.
- Lopes RD, Alexander JH, Al-Khatib SM; ARISTOTLE Investigators. Apixaban for Reduction in Stroke and Other Thromboembolic Events in Atrial Fibrillation (ARISTOTLE) trial: design and rationale. Am Heart J 2010; 159:331–339.
- Eikelboom JW, O’Donnell M, Yusuf S, et al. Rationale and design of AVERROES: apixaban versus acetylsalicylic acid to prevent stroke in atrial fibrillation patients who have failed or are unsuitable for vitamin K antagonist treatment. Am Heart J 2010; 159:348–353.
- Pfizer/Bristol-Myers Squibb. AVERROES study of investigational agent apixaban closes early due to clear evidence of efficacy, June 9, 2010. www.theheart.org/article/1087291.do. Accessed September 26, 2010.
- Connolly SJ, Arnesen H. AVERROES: Apixaban versus acetylsalicylic acid. http://www.escardio.org/congresses/esc-2010/congress-reports/Pages/708-3-AVERROES.aspx. Accessed September 7, 2010.
- Once-daily oral direct factor Xa inhibitor rivaroxaban in the long-term prevention of recurrent symptomatic venous thromboembolism in patients with symptomatic deep-vein thrombosis or pulmonary embolism. The Einstein-Extension Study. http://clinicaltrials.gov/ct2/show/NCT00439725. Accessed September 26, 2010.
- Oral direct factor Xa inhibitor rivaroxaban in patients with acute symptomatic deep-vein thrombosis without symptomatic pulmonary embolism: Einstein-DVT Evaluation. http://clinicaltrials.gov/ct2/show/NCT00440193. Accessed September 26, 2010.
- Oral direct factor Xa inhibitor rivaroxaban in patients with acute symptomatic pulmonary embolism with or without symptomatic deep-vein thrombosis: Einstein-PE Evaluation. http://clinicaltrials.gov/ct2/show/NCT00439777. Accessed September 26, 2010.
- ROCKET AF Study Investigators. Rivaroxaban once-daily, oral, direct factor Xa inhibition compared with vitamin K antagonism for prevention of stroke and embolism trial in atrial fibrillation: rationale and design of the ROCKET AF study. Am Heart J 2010; 159:340–347.
- Weitz JI, Hirsh J, Samama MM; American College of Chest Physicians. New antithrombotic drugs: American College of Chest Physicians Evidence-Based Clinical Practice Guidelines (8th Edition). Chest 2008; 133(suppl 6):234S–256S.
Anticoagulants have been helping patients at risk of thrombosis since the late 1930s.1,2 Although the indications for these agents are many, the development of anticoagulants beyond oral vitamin K antagonists and parenteral heparin has been slow. In the United States, the vitamin K antagonist warfarin (Coumadin) is still the only oral anticoagulant available.
The major complication of anticoagulant therapy is bleeding, and vitamin K antagonists have proven challenging to use in clinical practice.1,3 They have a narrow therapeutic window, they vary considerably in dose-response from patient to patient, and they are subject to significant interactions with other drugs and with foods. For these reasons, therapy must be monitored with laboratory testing, and good patient compliance and patient education are essential. Yet even with these measures, life-threatening hemorrhage still can occur.
In this issue of the Cleveland Clinic Journal of Medicine, Goldstein and Greenberg4 review warfarin-related intracerebral hemorrhage (ICH) and provide a framework for considering whether to resume anticoagulant therapy.
WHAT TO DO IN THE ACUTE PHASE
Goldstein and Greenberg divide the difficult clinical question of what to do after ICH into the acute phase and the chronic phase.
What to do in the acute phase appears straightforward, as the risk of hematoma expansion in the hours immediately after warfarin-related ICH outweighs the risk of arterial or venous thromboembolism. Anticoagulant reversal should be the primary consideration in the first 24 hours, and, assuming the patient does not have acute (< 4-week-old) deep vein thrombosis, intermittent pneumatic compression should be applied to the lower extremities to reduce the risk of venous thromboembolism associated with ICH.5
Prophylactic anticoagulation with subcutaneous fixed-dose heparin or low-molecular-weight heparin is recommended starting 72 hours after ICH is diagnosed, provided the patient is not underweight (< 50 kg), has relatively normal renal function (creatinine clearance > 30 mL/minute/1.73 m2) and normal platelet function, and does not have coagulopathy. 6 If any one of these criteria is not met, the risk of bleeding can be higher, even with only prophylactic doses of anticoagulant drugs. Prophylactic anticoagulation should be continued until hospital and rehabilitation discharge, typically 1 to 2 weeks after ICH, depending on the severity of the patient’s neurologic impairment.
If a patient with warfarin-related ICH has concomitant acute proximal deep vein thrombosis or pulmonary embolism (ie, < 4 weeks old), then caval interruption therapy would be indicated.7 Although retrievable inferior vena cava filters are increasingly preferred over permanent filters, it is important to recognize the relative lack of both longitudinal and prospective data on retrievable devices. Given that provoked venous thromboembolism requires a minimum of 3 months of anticoagulation, and retrievable filters generally need to be removed before 3 months, a retrievable filter should be chosen only if the clinician has already decided that oral anticoagulation will be restarted in the next 3 to 4 weeks after filter removal.
WHAT TO DO IN THE CHRONIC PHASE
A more difficult question in patients with warfarin-related ICH arises in the chronic phase: should oral anticoagulation be resumed at all?
Since the risk of ICH is related to the intensity of anticoagulation, a lower target international normalized ratio may be the best compromise, depending on the patient. Alternatively, antiplatelet therapy alone may offer some benefit with less risk of ICH.
THE NEWER ORAL ANTICOAGULANTS
As Goldstein and Greenberg mention, the ongoing development of new and potentially safer oral anticoagulants may affect how we approach these risk-benefit equations.
Three new oral anticoagulants—dabigatran (Pradaxa), apixaban, and rivaroxaban (Xarelto)—are being tested for various anticoagulant indications, and several phase III studies have recently closed or are nearing completion.
Dabigatran is an oral direct thrombin inhibitor currently available in Europe and Canada.
In the Randomized Evaluation of Long-term Anticoagulant Therapy (RE-LY) trial, the efficacy and safety of two different doses of dabigatran (110 mg twice daily or 150 mg twice daily) relative to warfarin were studied in more than 18,000 patients with atrial fibrillation. 9 The primary outcome measure was stroke or systemic embolism. Dabigatran 110 mg was not inferior to warfarin in terms of the primary outcome, while dabigatran 150 mg was superior. The rate of major bleeding was 3.36% per year in the warfarin group vs 2.71% in the 110-mg group (P = .003) and 3.11% in the 150-mg group (P not significant).
Additional safety data on this drug are available from the 2,500-patient RE-COVER trial.10 Dabigatran was not inferior to warfarin in the treatment of acute venous thromboembolism, with a similar rate of major bleeding and a lower rate of combined major plus nonmajor bleeding.
Apixaban, an oral direct factor Xa inhibitor, is in a phase III trial in patients with atrial fibrillation—Apixaban for Reduction in Stroke and Other Thromboembolic Events in Atrial Fibrillation (ARISTOTLE)11—comparing apixaban vs warfarin. Another phase III trial, AVERROES,12 was stopped early after a predefined interim analysis by the independent data-monitoring committee found clear evidence of benefit in the apixaban group.13 The AVERROES results were presented at the 2010 European Society of Cardiology Congress, August 28–September 1, Stockholm, Sweden.14
Rivaroxaban, another promising oral direct factor Xa inhibitor, is currently available in Europe and Canada for the prevention of thrombosis in orthopedic surgery patients. Rivaroxaban is also in large phase III trials for the treatment of acute venous thromboembolism15–17 and for the prevention of stroke in atrial fibrillation.18
Newer agents have drawbacks, too
These new agents need no laboratory monitoring, and they do not appear to be subject to the dose variability and the interactions with drugs and foods seen with vitamin K antagonists. As a result, they may pose less risk of anticoagulant-related ICH.
The decision to resume anticoagulation after anticoagulant-associated intracranial hemorrhage should be based on the risk of rebleeding vs the risk of thrombosis. Patients determined to be at high risk of thrombosis and low risk of rebleeding are the best candidates for resuming anticoagulation.
Still, for patients who suffer an anticoagulant- or warfarin-related ICH, these new anticoagulants are not likely to simplify the issue of restarting anticoagulant therapy. Unlike vitamin K antagonists, dabigatran and the direct factor Xa inhibitors have no known antidote for their anticoagulant effects. Animal data suggest that factor Xa concentrates may help,19 but for patients at risk of a second anticoagulant-related ICH, this does not provide much reassurance.
As with all clinical decisions in medicine, the potential benefits of any therapy should outweigh the risks. In the case of warfarin-related ICH, resuming anticoagulant therapy requires careful consideration of many factors, including patient preferences and tolerance of different levels of risk. As new and perhaps safer anticoagulants become available, clinicians may face such difficult questions less and less. But in the meantime, doctors and their patients are left to pick their poison.
- Ansell J, Hirsh J, Hylek E, Jacobson A, Crowther M, Palareti G; American College of Chest Physicians. Pharmacology and management of the vitamin K antagonists: American College of Chest Physicians Evidence-Based Clinical Practice Guidelines (8th Edition). Chest 2008; 133(suppl 6):160S–198S.
- Hirsh J, Bauer KA, Donati MB, Gould M, Samama MM, Weitz JI; American College of Chest Physicians. Parenteral anticoagulants: American College of Chest Physicians Evidence-Based Clinical Practice Guidelines (8th Edition). Chest 2008; 133(suppl 6):141S–159S.
- Schulman S, Beyth RJ, Kearon C, Levine MN; American College of Chest Physicians. Hemorrhagic complications of anticoagulant and thrombolytic treatment: American College of Chest Physicians Evidence-Based Clinical Practice Guidelines (8th edition). Chest 2008; 133(suppl 6):257S–298S.
- Goldstein JN, Greenberg SM. Should anticoagulation be resumed after intracerebral hemorrhage? Cleve Clin J Med 2010; 77:791–799.
- Geerts WH, Bergqvist D, Pineo GF, et al; American College of Chest Physicians. Prevention of venous thromboembolism: American College of Chest Physicians Evidence-Based Clinical Practice Guidelines (8th Edition). Chest 2008; 133(suppl 6):381S–453S.
- Michota F, Merli G. Anticoagulation in special patient populations: are special dosing considerations required? Cleve Clin J Med 2005; 72(suppl 1):S37–S42.
- Kearon C, Kahn SR, Agnelli G, Goldhaber S, Raskob GE, Comerota AJ; American College of Chest Physicians. Antithrombotic therapy for venous thromboembolic disease: American College of Chest Physicians Evidence-Based Clinical Practice Guidelines (8th Edition). Chest 2008; 133(suppl 6):454S–545S.
- Douketis JD, Berger PB, Dunn AS, et al; American College of Chest Physicians. The perioperative management of antithrombotic therapy: American College of Chest Physicians Evidence-Based Clinical Practice Guidelines (8th Edition). Chest 2008; 133(suppl 6):299S–339S.
- Connolly SJ, Ezekowitz MD, Yusuf S, et al; RE-LY Steering Committee and Investigators. Dabigatran versus warfarin in patients with atrial fibrillation. N Engl J Med 2009; 361:1139–1151.
- Schulman S, Kearon C, Kakkar AK, et al; RE-COVER Study Group. Dabigatran versus warfarin in the treatment of acute venous thromboembolism. N Engl J Med 2009; 361:2342–2352.
- Lopes RD, Alexander JH, Al-Khatib SM; ARISTOTLE Investigators. Apixaban for Reduction in Stroke and Other Thromboembolic Events in Atrial Fibrillation (ARISTOTLE) trial: design and rationale. Am Heart J 2010; 159:331–339.
- Eikelboom JW, O’Donnell M, Yusuf S, et al. Rationale and design of AVERROES: apixaban versus acetylsalicylic acid to prevent stroke in atrial fibrillation patients who have failed or are unsuitable for vitamin K antagonist treatment. Am Heart J 2010; 159:348–353.
- Pfizer/Bristol-Myers Squibb. AVERROES study of investigational agent apixaban closes early due to clear evidence of efficacy, June 9, 2010. www.theheart.org/article/1087291.do. Accessed September 26, 2010.
- Connolly SJ, Arnesen H. AVERROES: Apixaban versus acetylsalicylic acid. http://www.escardio.org/congresses/esc-2010/congress-reports/Pages/708-3-AVERROES.aspx. Accessed September 7, 2010.
- Once-daily oral direct factor Xa inhibitor rivaroxaban in the long-term prevention of recurrent symptomatic venous thromboembolism in patients with symptomatic deep-vein thrombosis or pulmonary embolism. The Einstein-Extension Study. http://clinicaltrials.gov/ct2/show/NCT00439725. Accessed September 26, 2010.
- Oral direct factor Xa inhibitor rivaroxaban in patients with acute symptomatic deep-vein thrombosis without symptomatic pulmonary embolism: Einstein-DVT Evaluation. http://clinicaltrials.gov/ct2/show/NCT00440193. Accessed September 26, 2010.
- Oral direct factor Xa inhibitor rivaroxaban in patients with acute symptomatic pulmonary embolism with or without symptomatic deep-vein thrombosis: Einstein-PE Evaluation. http://clinicaltrials.gov/ct2/show/NCT00439777. Accessed September 26, 2010.
- ROCKET AF Study Investigators. Rivaroxaban once-daily, oral, direct factor Xa inhibition compared with vitamin K antagonism for prevention of stroke and embolism trial in atrial fibrillation: rationale and design of the ROCKET AF study. Am Heart J 2010; 159:340–347.
- Weitz JI, Hirsh J, Samama MM; American College of Chest Physicians. New antithrombotic drugs: American College of Chest Physicians Evidence-Based Clinical Practice Guidelines (8th Edition). Chest 2008; 133(suppl 6):234S–256S.
Management of hyponatremia: Providing treatment and avoiding harm
Hyponatremia, defined as a serum sodium concentration below 135 mmol/L, is one of the most frequently encountered electrolyte disorders. In 1981, Flear et al1 reported that 15% of their hospitalized patients had plasma sodium concentrations lower than 134 mmol/L, the cutoff they were using at that time.
Hyponatremia is sometimes merely a laboratory artifact or a result of improper blood collection. If real, it can be due to excessive water intake or, most often, the inability of the kidney to excrete water coupled with continued water intake. Patients with significant underlying cardiac, hepatic, or renal dysfunction are at greatest risk of developing hyponatremia, secondary to the nonosmotic release of antidiuretic hormone (ADH). Others at risk include postoperative patients (especially menstruating women), older patients on thiazide diuretics, patients with malignant or psychiatric illness, and endurance athletes.
In this article, we review the treatment of acute and chronic hyponatremia, emphasizing the importance of basing the therapy on the severity of symptoms and taking care not to raise the serum sodium level too rapidly, which can cause neurologic dysfunction.
Guidelines for managing hyponatremia2 are based mostly on retrospective studies and expert opinion, since few prospective studies have been done. Despite the paucity of evidence-based recommendations, we will attempt to incorporate findings from important human and animal studies and consensus guidelines from expert panels. We will focus initially on the critical diagnostic considerations necessary to initiate treatment.
SYMPTOMATIC VS ASYMPTOMATIC
Subsequent sections will address therapeutic approaches in two clinical settings:
Symptomatic hyponatremia, ie, with severe signs or symptoms of cerebral edema—a medical emergency; and
Asymptomatic hyponatremia, ie, without serious signs or symptoms of cerebral edema.
KEY DIAGNOSTIC STEPS WHEN STARTING TREATMENT
The clinical and laboratory evaluations form the foundation of a proper approach to any patient with hyponatremia. The rationale behind making several important diagnostic distinctions will be discussed here briefly and then expanded on in the remaining text. The reader is referred to another review on the diagnostic evaluation of hyponatremia.3
Confirm that the patient truly has hypo-osmolar hyponatremia
The serum osmolality should be measured to confirm that it is low (ie, < 275 mOsm/kg). In addition, the arterial serum sodium concentration can be measured using a blood gas device if pseudohyponatremia (see below) is suspected. This method uses direct potentiometry and bypasses the dilutional step in the processing of venous samples.4
Rationale. The clinical consequences of hyponatremia are due to water moving from hypo-osmolar extracellular fluid into the relatively hyperosmolar interior of the cell. This water movement can cause progressive cerebral edema, resulting in a spectrum of signs and symptoms from headache and ataxia to seizures and coma. But significant fluid shifts and cerebral edema occur only if the extracellular fluid is hypo-osmolar relative to the intracellular fluid.
In fact, hyponatremia can occur in several situations in which the extracellular fluid is not hypo-osmolar. An increase in effective plasma osmoles (substances in the extracellular fluid that do not readily move across the plasma membrane) can cause water to move out of cells, resulting in translocational hyponatremia. This may be seen in hyperglycemia or when mannitol or contrast dye has been given. In these situations, the plasma is either isotonic or even hypertonic to the intracellular fluid, resulting in no movement of water into the cells and therefore no clinical consequences relating to the hyponatremia. Importantly, no therapy is required for the hyponatremia.
Other situations in which hyponatremia is present but not associated with true hypotonicity include states of excess protein or lipid in the blood (pseudohyponatremia). Also, if an infusion of hypotonic fluid is running, clinicians must be sure that blood samples are not drawn proximally in the same vein.
Are there significant signs or symptoms of cerebral edema?
Patients need to be assessed quickly because those with serious neurologic signs or symptoms thought to be related to hyponatremia require urgent treatment with hypertonic saline to increase the serum sodium concentration, regardless of the underlying volume status, the cause of hyponatremia, or the time of onset.
Determine the duration of hyponatremia
One should try to ascertain when the hyponatremia started, as its duration is important in determining the proper pace of correction.
At the onset of hyponatremia, water moves from the extracellular fluid into cells, pulled in by osmosis. The brain can decrease the net amount of water entering into the neurons (and thus regulate its volume) by increasing the flow of water from the interstitium into the cerebrospinal fluid via increased interstitial hydraulic pressure.7
Over the next several days, inorganic solutes (eg, potassium and sodium salts) and various organic solutes are transported out of the cells. In patients in whom this process has had time to occur, treatment of hyponatremia with hypertonic fluids raises the plasma osmolality faster than the cells can recapture the previously transported osmoles. In this situation, overly rapid correction can cause excessive loss of intracellular water, resulting in cell shrinkage and osmotic demyelination syndrome. Osmotic demyelination usually presents during treatment of hyponatremia after an initial improvement in mental status, with worsening neurologic function and various neurologic signs, including paresis and ultimately even death.6
In patients with acute-onset hyponatremia (ie, with onset within the past 48 hours), in whom the above cerebral adaptations have not had time to occur completely, rapid correction is unlikely to result in osmotic demyelination.
In view of the serious risk of osmotic demyelination, if the timing of development of hyponatremia cannot be determined, one should assume it is chronic (> 48 hours) and avoid rapid overcorrection (see discussion below on the rate of correction).
On the other hand, patients who have severe neurologic signs or symptoms initially need their serum sodium increased urgently to safer levels, regardless of the timing of onset (see below for suggested approach). Subsequent treatment of hyponatremia—after the serum sodium level has been raised enough to reverse neurologic symptoms—will be influenced by the duration of the hyponatremia, with careful avoidance of overly rapid correction, especially in patients with chronic hyponatremia.
Assess the patient’s volume status to determine the proper initial treatment
Check urine osmolality to assess for hyponatremic states in which urinary dilution is intact
Measuring urine osmolality is useful in ascertaining whether hyponatremic patients are making appropriately dilute urine (< 100 mOsm/kg). If they are, the cause of the hyponatremia may be excessive water intake, a reset osmostat, or low solute intake. In addition, patients with hypovolemic hyponatremia may have appropriately dilute urine soon after treatment with isotonic intravenous fluids.
The serum sodium concentration often returns to normal if the underlying cause is eliminated (eg, if excessive fluid intake is stopped). If there are no serious signs or symptoms, this can usually be accomplished without additional therapy with intravenous fluids or medications, thereby avoiding the risk of overcorrection.
Search for causes of rapidly correctable hyponatremia
TREATING HYPONATREMIC PATIENTS WITH SERIOUS SIGNS OR SYMPTOMS
Patients with hypo-osmolar hyponatremia and serious signs or symptoms of cerebral edema (lethargy, respiratory depression, seizures) need rapid initial correction of the serum sodium level, as this is a true medical emergency.
Certain patients are at greater risk of developing cerebral edema from hyponatremia (Table 2).
On the other hand, patients with chronic hyponatremia are very unlikely to present with signs or symptoms of cerebral edema. In fact, in a patient with chronic hyponatremia, care must be taken to avoid overcorrection beyond that needed to reverse severe signs and symptoms. In the rare case in which a patient with chronic hyponatremia presents with signs or symptoms of cerebral edema, the hypertonic saline infusion must be stopped as soon as the signs or symptoms have resolved. Further rapid changes in serum sodium must be avoided.
During correction of hyponatremia, some patients are at particularly high risk of osmotic demyelination syndrome secondary to underlying abnormalities in cerebral osmotic regulation. These include patients with alcoholism, malnutrition, hypokalemia, and burns, and elderly women on thiazide diuretics.8 These patients should be monitored vigilantly for overly rapid correction during treatment.
INITIAL TREATMENT: REVERSE CEREBRAL EDEMA WITH 3% SALINE
The goal of the initial, rapid phase of correction is to reverse cerebral edema.
Patients with serious signs or symptoms should receive hypertonic (3%) saline at a rate of about 1 mL/kg/hour for the first several hours.8 Those with concomitant hypervolemia (as in congestive heart failure) or underlying cardiovascular disease should also receive a loop diuretic to aid in free-water excretion and to prevent volume overload from the saline infusion. This regimen usually raises the serum sodium concentration enough (usually by about 1 mmol/L/hour) to decrease cerebral edema and improve symptoms.
In patients having active seizures or showing signs of brain herniation, 3% saline can be given initially at a higher rate of about 2 to 3 mL/kg/hour over the first few hours. An alternative approach is an initial 50-mL bolus of 3% saline and an additional 200 mL given over the subsequent 4 to 6 hours.9
No study has compared the efficacy and safety of these approaches, and clinicians should always monitor extracellular fluid volume status, neurologic status, and serum sodium levels closely in any patient treated with hypertonic saline.
After severe signs and symptoms have resolved, 3% saline is promptly discontinued and appropriate therapy is initiated based on the patient’s volume status and underlying cause of hyponatremia (see discussion below).
NEXT, FIND THE APPROPRIATE RATE OF CORRECTION
After the initial serious signs or symptoms have been addressed with hypertonic saline, management should focus on limiting the rate of correction in patients with chronic hyponatremia or hyponatremia of unknown duration.
Animal studies and retrospective human studies have suggested certain guidelines on the appropriate pace and magnitude of correction during treatment of hyponatremia to avoid osmotic demyelination syndrome.2
Clinicians must not attempt to correct the serum sodium to “normal” values. Although patients with acute hyponatremia may tolerate complete correction, there is little evidence that raising the serum sodium concentration acutely by more than 5 to 8 mmol/L is advantageous. Therefore, correction should be judicious in all patients.
Appropriate rates of correction
A recent expert consensus panel suggested that the serum sodium level be raised by no more than 10 to 12 mmol/L during the first 24 hours of treatment, and by less than 18 mmol/L over 48 hours.2
Patients with chronic hyponatremia and signs or symptoms of cerebral edema should have their sodium level raised at an even slower rate—some recommend less than 10 mmol/L in the first 24 hours.10 Aggressive initial correction at the rate of 1.5 to 2 mmol/hour for the first 3 to 4 hours with 3% saline is indicated until serious symptoms (seizure, obtundation) resolve, but correction beyond 10 to 12 mmol/L in the first 24 hours should be avoided. Hypertonic saline therapy should usually be discontinued well before the serum sodium level has risen this much, to avoid a continuing rise in the sodium level after the infusion has stopped.
While hypertonic saline is being infused, serum sodium levels should be checked every 1 to 2 hours. In a study in 56 patients with severe hyponatremia (serum sodium ≤ 105 mmol/L),11 no neurologic complications were observed in patients with chronic hyponatremia whose serum sodium was corrected by less than 12 mmol/L in 24 hours or by less than 18 mmol/L in 48 hours or in whom the average rate of correction to a serum sodium of 120 mmol/L was less than or equal to 0.55 mmol/L per hour.
If the serum sodium concentration has been overcorrected
Desmopressin is effective in preventing and reversing inadvertent overcorrection of hyponatremia. 12 In one study, desmopressin lowered the sodium concentration by 2 to 9 mmol/L in 14 of 20 patients. None of the patients developed any serious adverse consequences.
In addition, intravenous water (dextrose 5%) can be given alone or in combination with desmopressin to prevent or reverse an excessive increase in serum sodium.13 Such therapy may be considered in patients who continue to excrete hypotonic urine and have already reached a serum sodium concentration that meets or exceeds the recommended rate or magnitude of change.
Formulas for estimating the rate of correction
Various formulas have been devised for estimating the change in serum sodium concentration during treatment of hyponatremia.14
An alternative is the Barsoum-Levine equation, which takes into account ongoing urinary losses. Although it is more cumbersome to calculate, it may be more precise.17
Alternatively, in patients without hypovolemia, the clinician can calculate the amount of urinary excretion of free water required to achieve a specific target serum sodium and then measure hourly urinary water excretion during aquaresis induced by furosemide (Lasix).8 Although more physiologic, this method can be clinically cumbersome, requiring timely handling of urine specimens, accurate recording of urine output, and rapid reporting of laboratory results.
Ultimately, these methods serve only as estimates of the change in serum sodium and do not replace careful monitoring of electrolytes (every 1 to 2 hours during acute therapy) and fastidious assessment for clinical signs or symptoms of osmotic demyelination syndrome.
PATIENTS WITH HYPONATREMIA AND NO SERIOUS SIGNS OR SYMPTOMS
General approach
Hyponatremic patients without serious signs or symptoms of cerebral edema do not require urgent therapy to raise the serum sodium.
Patients with chronic asymptomatic hyponatremia are commonly encountered in clinical practice. As a result of cerebral adaptation, they can appear to have no symptoms despite serum sodium levels as low as 115 to 120 mmol/L. However, even if they have no serious signs or symptoms of cerebral edema, some patients may complain of fatigue, lethargy, nausea, gait abnormalities, and muscle cramps and have evidence of milder forms of neurocognitive impairment.18
In a recent case-control study,18 elderly patients with chronic hyponatremia (mean serum sodium concentration 126 ± 5 mmol/L) were more likely to present to the hospital with falls compared with age-matched controls. Further analysis suggested these patients had marked impairments in gait and attention, which improved in some as the serum sodium increased.
Another recent study19 reported that mild hyponatremia (mean serum sodium concentration 132 mmol/L) was independently associated with the risk of fracture, even after adjustment for known osteoporotic risk factors.
Even when there is no need for acute therapy to raise the serum sodium level, the clinician should scrutinize the medical regimen and available clinical data to rule out reversible causes of water excess. These may include ongoing administration of hypotonic fluids (eg, parenteral nutrition or dextrose 5% to “keep the vein open”) or of medications that cause inappropriate release of ADH (eg, selective serotonin reuptake inhibitors) or that impair water excretion (eg, nonsteroidal anti-inflammatory drugs). The clinician should also search for an underlying diagnosis that predisposes to water retention, such as hypothyroidism, adrenal insufficiency, congestive heart failure, or hepatic or renal failure. If hyponatremia is due to endocrine disease, correction of hypothyroidism or adrenal insufficiency should result in water excretion and improvement in the serum sodium.
If the cause of the hyponatremia is not immediately apparent, treatment can be started on the basis of assessment of the patient’s extracellular fluid volume status using clinical examination and supplementary laboratory data such as the serum uric acid concentration and urinary sodium concentration.3 Table 3 outlines general treatment options for hypoosmolar hyponatremia according to extracellular fluid volume status.
Of note, physical examination alone has poor sensitivity and specificity in assessing extracellular fluid volume status in patients with hyponatremia.20,21 This highlights the importance of spot measurements of urine sodium and serum uric acid and, when appropriate, isotonic intravenous saline challenge to detect occult hypovolemia.
In general, patients with euvolemia are treated with fluid restriction, and patients with hypovolemia are given isotonic saline. Patients with hypervolemia can be difficult to treat, but in general they are prescribed both sodium and fluid restriction. Loop diuretics can be given to promote excretion of water and sodium. Thiazide diuretics are avoided, as they impair urinary dilution and worsen hyponatremia. Attempts should be made to optimize the treatment of the underlying hypervolemic disorder (congestive heart failure, cirrhosis, advanced renal failure). Vasopressin receptor antagonists can also be used in selected cases of hypervolemic or euvolemic hyponatremia (see discussion below).
How to prescribe fluid restriction rationally
Ideally, patients should not ingest any more fluid than they can excrete in urine and insensible losses—otherwise, the serum sodium can continue to decrease.
Water excretion can be estimated from solute intake and urine osmolarity. In theory, a 70-kg person with a typical daily solute intake of about 10 mOsm/kg and intact urinary dilution to a urine osmolarity of 50 mOsm/L can excrete up to 14 L of urine (700 mOsm/50 mOsm/L) per day. However, a patient with the syndrome of inappropriate ADH secretion (SIADH) and a fixed urine osmolality of 700 mOsm/kg would excrete a similar solute load in only 1 L of urine. Thus, any fluid intake in excess of this volume could worsen hyponatremia.
To excrete free water, urinary sodium plus urinary potassium must be less than the serum sodium concentration. In this regard, the necessary degree of fluid restriction can also be estimated made on the basis of the patient’s urinary electrolytes.22
Increased solute intake to augment water excretion
In patients without hypervolemia, solute intake can be increased to augment water excretion. 22 This can be achieved with salt tablets or oral urea. Although urea can be effective, it is not commonly used because it is not available the United States and it has poor gastrointestinal tolerability. In patients whose nutritional intake is limited and who continue to ingest fluids (such as, for example, an elderly patient subsisting on tea and toast) every effort should be made to increase solute intake with high-protein foods or supplements.
DRUGS TO INHIBIT VASOPRESSIN
Unfortunately, patients often do not adhere to these strategies, as fluid restriction and unpalatable salt tablets or urea can become too burdensome. In such instances, pharmacologic inhibition of vasopressin-mediated water reabsorption can be considered using the following agents.
Demeclocycline (Declomycin) and lithium inhibit the kidney’s response to vasopressin. Because lithium may be nephrotoxic and has unwanted effects on the central nervous system, demeclocycline has become the preferred agent. Given in doses of 300 to 600 mg twice daily, demeclocycline promotes free water excretion, but often takes 1 to 2 weeks of therapy to begin working.
Renal failure due to demeclocycline has been reported in patients with concomitant liver disease.23 Demeclocycline can also cause photosensitivity and is contraindicated in children and pregnant women due to abnormalities in bone and enamel formation. In addition, it can be expensive and may not be covered fully by some prescription plans.
Vasopressin receptor antagonists (‘vaptans’)
ADH, also called vasopressin, interacts with various receptor subtypes, including V1a (causing vasoconstriction, platelet aggregation, inotropic stimulation, myocardial protein synthesis), V1b (causing secretion of adrenocorticotropic hormone), and V2 (causing water reabsorption and release of von Willebrand factor and factor VIII).
Conivaptan (Vaprisol) is a combined V1a-V2 antagonist that has been approved for the treatment of euvolemic and hypervolemic hyponatremia. Conivaptan inhibits the cytochrome P450 3A4 system and thus may interact with other drugs; therefore, its use has been limited to no more than 4 days of intravenous administration in the hospital setting. The recommended dosage is an initial 20-mg infusion over 30 minutes, followed by continuous infusions of 20 to 40 mg/day. Dosing adjustments in renal and hepatic impairment have not been well defined.
Tolvaptan (Samsca) is an oral selective V2 antagonist that has been studied in patients with euvolemic and hypervolemic hyponatremia. 26 Studies have included patients with congestive heart failure, cirrhosis, and SIADH. Although tolvaptan has not been shown to reduce rates of rehospitalization or death in congestive heart failure, it improves serum sodium, overall fluid balance, and congestive symptoms.27 Tolvaptan has recently been approved for the treatment of euvolemic and hypervolemic hyponatremia.
A recent study has confirmed the longterm efficacy of tolvaptan in 111 patients over a mean duration of treatment greater than 700 days.28 While the clinical benefits of chronic tolvaptan therapy have yet to be clearly demonstrated, this study shows that tolvaptan therapy can result in a sustained improvement in serum sodium concentration without an unacceptable increase in adverse events.29
Lixivaptan (VPA-985), another oral selective V2 receptor antagonist, is being studied in patients with euvolemic and hypervolemic hyponatremia.
Current role of vasopressin antagonists
Current studies of vasopressin antagonists in the treatment of hyponatremia are promising, though definite recommendations are needed to ensure slow, careful correction of hyponatremia. Most studies suggest that these agents provide slow, reliable increases in serum sodium. In one large study of patients with congestive heart failure, serum sodium rose by more than 12 mmol/L in 24 hours in fewer than 2% of patients.26
Notably, no cases of osmotic demyelination syndrome have been reported in these studies. However, it should be noted that therapy was started in the hospital with close monitoring of serum sodium levels and discontinuation of fluid restriction; the incidence of overly rapid correction of sodium may be higher outside of carefully done clinical studies. Clinicians should adopt monitoring strategies similar to those used in these rigorous studies.
At present, there is little experience with vasopressin antagonists in hyponatremic patients with serious signs or symptoms of cerebral edema, and most clinicians still view 3% saline as the gold standard for these patients.
Vasopressin antagonists should not be used in patients with hypovolemic hyponatremia, due to concerns about V1a blockade causing hypotension and about V2 blockade producing water excretion and a worsening of the volume-depleted state.
Recent clinical trials have reported that patients often experience increased thirst while taking these agents. This highlights the need to monitor serum sodium during treatment.
These agents are expensive. Tolvaptan costs about $250 per tablet; conivaptan, which is administered intravenously, may cost a little more per treatment course.
THERAPY IN SPECIFIC DISEASE STATES
Patients with hyponatremia and cirrhosis
The focus of treatment remains water and salt restriction and judicious use of loop diuretics and aldosterone antagonists such as spironolactone (Aldactone).
Tolvaptan has been effective at raising the serum sodium level in patients with cirrhosis, 26 while conivaptan should be avoided at present because of vasodilation from V1a receptor antagonism and its potential effects on systemic hemodynamics and risk of variceal bleeding.30
As the severity of cirrhosis increases, the only effective treatment of hyponatremia is liver transplantation.
Patients with SIADH
In most cases, water restriction is the mainstay of therapy. Adequate nutritional intake should also be stressed so that enough solute is available for ongoing water excretion. Although fluid restriction is usually effective, many patients cannot adhere to the level of restriction required.
In cases in which fluid restriction is not effective on its own, demeclocyline can be used to antagonize ADH action and increase water excretion. Sodium tablets and loop diuretics can also be used, taking care to avoid hypovolemia from diuretic-induced sodium losses. The use of tolvaptan in patients with SIADH has resulted in short-term increases in serum sodium.26 A recent study has suggested that this effect can be sustained with longer-term treatment,28 but further studies are needed to show a complementary clinical benefit (eg, improved neurocognition) to guide the use of these costly agents in clinical practice.
Patients with diuretic-induced hyponatremia
Thiazide diuretics should be discontinued and hypovolemia and hypokalemia should be corrected with isotonic saline and potassium supplementation. As the hypokalemia is corrected and the diuretic effect and hypovolemic stimulus to ADH dissipates, water excretion can increase rapidly, resulting in a brisk change in serum sodium.
Serum sodium levels should be closely monitored during therapy to avoid overcorrection. For this reason, use of hypertonic saline should generally be avoided. Hypotonic fluid— eg, half-normal (0.45%) or quarter-normal (0.22%) saline or even desmopressin—may become necessary in the later stages of therapy to avoid overly rapid correction.
Patients with exercise-associated hyponatremia
Patients at highest risk of exercise-associated hyponatremia include those who drink too much fluid during a long-distance race, who have low body weight, who are female, who exercise longer than 4 hours, and who use nonsteroidal anti-inflammatory drugs.31 The cause of hyponatremia is likely multifactorial, with excessive water intake coupled with sodium losses and impaired renal excretion of water due to ADH action and impaired renal dilution. To prevent exercise-associated hyponatremia, fluid intake should be limited to 400 to 800 mL/hour, with the higher end recommended for larger athletes and hotter climates.
Consensus recommendations suggest that most patients with mild hyponatremia (serum sodium 130 to 135 mmol/L) should be treated with fluid restriction and clinical observation, as spontaneous water diuresis leads to improvement in the serum sodium level. Importantly, the reflex to provide isotonic saline infusions should be avoided unless clear signs of volume depletion are present. Intravenous saline has the potential to worsen hyponatremia in the presence of ADH. In addition, some athletes will have retained water in the gastrointestinal tract that may be mobilized after the race, resulting in worsening of hyponatremia.32
In athletes with severe hyponatremia (serum sodium < 120 mmol/L) or symptomatic exercise-associated hyponatremia (lethargy, respiratory depression, seizures), hypertonic saline is the treatment of choice. One protocol suggests giving 100 mL of 3% saline over 10 minutes in the field, followed by prompt transportation to hospital.33
SUMMARY POINTS
- Hyponatremia is a common electrolyte disorder that in its most severe form requires urgent therapy with hypertonic saline to correct cerebral edema.
- In patients without serious signs or symptoms of cerebral edema, recent observations suggest there may be clinically important symptomatology relating to mild neurocognitive dysfunction and an association with risk of bone fracture.
- Multiple treatment strategies are available according to the underlying extracellular fluid volume status and cause of hyponatremia. These include fluid and sodium restriction and augmentation of urinary water excretion with various nutritional and pharmacologic strategies. The most novel therapy includes antagonism of the vasopressin V2 receptor with a class of aquaretic agents known as vaptans.
- There can be serious neurologic injury associated with overly rapid correction of chronic hyponatremia or undercorrection of acute symptomatic hyponatremia.
- Clinicians must be familiar with the details of each of the treatments and have an appreciation of the importance of careful monitoring during treatment.
- Flear CTG, Gill GV, Burn J. Hyponatremia: mechanisms and management. Lancet 1981; 2:26–31.
- Verbalis JG, Goldsmith SR, Greenberg A, Schrier RW, Sterns RH. Hyponatremia treatment guidelines 2007: expert panel recommendations. Am J Med 2007; 120(suppl 1):S1–S21.
- Freda BJ, Davidson MB, Hall PM. Evaluation of hyponatremia: a little physiology goes a long way. Cleve Clin J Med 2004; 71:639–650.
- Weisberg LS. Pseudohyponatremia: a reappraisal. Am J Med 1989; 86:315–318.
- Moritz L, Ayus JC. The pathophysiology and treatment of hyponatraemic encephalopathy: an update. Nephrol Dial Transplant 2003; 18:2486–2491.
- Widdess-Walsh P, Sabharwal V, Demirjian S, DeGeorgia M. Neurologic effects of hyponatremia and its treatment. Cleve Clin J Med 2007; 74:377–383.
- Melton JE, Patlak CS, Pettigrew KD, Cserr HF. Volume regulatory loss of Na, Cl, and K from rat brain during acute hyponatremia. Am J Physiol 1987; 252:F661–F669.
- Lauriat SM, Berl T. The hyponatremic patient: practical focus on therapy. J Am Soc Nephrol 1997; 8:1599–1607.
- Kokko JP. Symptomatic hyponatremia with hypoxia is a medical emergency. Kidney Int 2006; 69:1291–1293.
- Ellis SJ. Severe hyponatraemia: complications and treatment. QJM 1995; 88:905–909.
- Sterns RH, Cappuccio JD, Silver SM, Cohen EP. Neurologic sequelae after treatment of severe hyponatremia: a multicenter perspective. J Am Soc Nephrol 1994; 4:1522–1530.
- Perianayagam A, Sterns RH, Silver SM, et al. DDAVP is effective in preventing and reversing inadvertent overcorrection of hyponatremia. Clin J Am Soc Nephrol 2008; 3:331–336.
- Sterns RH, Hix JK. Overcorrection of hyponatremia is a medical emergency. Kidney Int 2009; 76:587–589.
- Nguyen MK, Kurtz I. Analysis of current formulas used for treatment of the dysnatremias. Clin Exp Nephrol 2004; 8:12–16.
- Adrogué HJ, Madias NE. Hyponatremia. N Engl J Med 2000; 342:1581–1589.
- Mohmand HK, Issa D, Ahmad Z, Cappuccio JD, Kouides RW, Sterns RH. Hypertonic saline for hyponatremia: risk of inadvertent overcorrection. Clin J Am Soc Nephrol 2007; 2:1110–1117.
- Ellison DH, Berl T. Clinical practice. The syndrome of inappropriate antidiuresis. N Engl J Med 2007; 356:2064–2072.
- Renneboog B, Musch W, Vandemergel X, Manto MU, Decaux G. Mild chronic hyponatremia is associated with falls, unsteadiness, and attention deficits. Am J Med 2006; 119:71.e1–e8.
- Kinsella S, Moran S, Sullivan MO, Molloy MG, Eustace JA. Hyponatremia independent of osteoporosis is associated with fracture occurrence. Clin J Am Soc Nephrol 2010; 5:275–280.
- Chung HM, Kluge R, Schrier RW, Anderson RJ. Clinical assessment of extracellular fluid volume in hyponatremia. Am J Med 1987; 83:905–988.
- Hoorn EJ, Halperin ML, Zietse R. Diagnostic approach to a patient with hyponatraemia: traditional versus physiology-based options. QJM 2005; 98:529–540.
- Berl T. Impact of solute intake on urine flow and water excretion. J Am Soc Nephrol 2008; 19:1076–1078.
- Carrilho F, Bosch J, Arroyo V, Mas A, Viver J, Rodes J. Renal failure associated with demeclocycline in cirrhosis. Ann Intern Med 1977; 87:195–197.
- Lehrich RW, Greenberg A. When is it appropriate to use vasopressin receptor antagonists? J Am Soc Nephrol 2008; 19:1054–1058.
- Decaux G, Soupart A, Vassart G. Non-peptide arginine-vasopressin antagonists: the vaptans. Lancet 2008; 371:1624–1632.
- Schrier RW, Gross P, Gheorghiade M, et al; SALT Investigators. Tolvaptan, a selective oral vasopressin V2-receptor antagonist, for hyponatremia. N Engl J Med 2006; 355:2099–2112.
- Konstam MA, Gheorghiade M, Burnett JC, et al; Efficacy of Vasopressin Antagonism in Heart Failure Outcome Study With Tolvaptan (EVEREST) Investigators. Effects of oral tolvaptan in patients hospitalized for worsening heart failure: the EVEREST Outcome Trial. JAMA 2007; 297:1319–1331.
- Berl T, Quittnat-Pelletier F, Verbalis JG, et al; SALTWATER Investigators. Oral tolvaptan is safe and effective in chronic hyponatremia. J Am Soc Nephrol 2010; 21:705–712.
- Greenberg A, Lehrich RW. Treatment of chronic hyponatremia: now we know how, but do we know when or if? J Am Soc Nephrol 2010; 21:552–555.
- Greenberg A, Verbalis JG. Vasopressin receptor antagonists. Kidney Int 2006; 69:2124–2130.
- Rosner MH, Kirven J. Exercise-associated hyponatremia. Clin J Am Soc Nephrol 2007; 2:151–161.
- Halperin ML, Kamel KS, Sterns R. Hyponatremia in marathon runners. N Engl J Med 2005; 353:427–428.
- Hew-Butler T, Almond C, Ayus JC, et al; Exercise-Associated Hyponatremia (EAH) Consensus Panel. Consensus statement of the 1st International Exercise-Associated Hyponatremia Consensus Development Conference, Cape Town, South Africa 2005. Clin J Sport Med 2005; 15:208–213.
Hyponatremia, defined as a serum sodium concentration below 135 mmol/L, is one of the most frequently encountered electrolyte disorders. In 1981, Flear et al1 reported that 15% of their hospitalized patients had plasma sodium concentrations lower than 134 mmol/L, the cutoff they were using at that time.
Hyponatremia is sometimes merely a laboratory artifact or a result of improper blood collection. If real, it can be due to excessive water intake or, most often, the inability of the kidney to excrete water coupled with continued water intake. Patients with significant underlying cardiac, hepatic, or renal dysfunction are at greatest risk of developing hyponatremia, secondary to the nonosmotic release of antidiuretic hormone (ADH). Others at risk include postoperative patients (especially menstruating women), older patients on thiazide diuretics, patients with malignant or psychiatric illness, and endurance athletes.
In this article, we review the treatment of acute and chronic hyponatremia, emphasizing the importance of basing the therapy on the severity of symptoms and taking care not to raise the serum sodium level too rapidly, which can cause neurologic dysfunction.
Guidelines for managing hyponatremia2 are based mostly on retrospective studies and expert opinion, since few prospective studies have been done. Despite the paucity of evidence-based recommendations, we will attempt to incorporate findings from important human and animal studies and consensus guidelines from expert panels. We will focus initially on the critical diagnostic considerations necessary to initiate treatment.
SYMPTOMATIC VS ASYMPTOMATIC
Subsequent sections will address therapeutic approaches in two clinical settings:
Symptomatic hyponatremia, ie, with severe signs or symptoms of cerebral edema—a medical emergency; and
Asymptomatic hyponatremia, ie, without serious signs or symptoms of cerebral edema.
KEY DIAGNOSTIC STEPS WHEN STARTING TREATMENT
The clinical and laboratory evaluations form the foundation of a proper approach to any patient with hyponatremia. The rationale behind making several important diagnostic distinctions will be discussed here briefly and then expanded on in the remaining text. The reader is referred to another review on the diagnostic evaluation of hyponatremia.3
Confirm that the patient truly has hypo-osmolar hyponatremia
The serum osmolality should be measured to confirm that it is low (ie, < 275 mOsm/kg). In addition, the arterial serum sodium concentration can be measured using a blood gas device if pseudohyponatremia (see below) is suspected. This method uses direct potentiometry and bypasses the dilutional step in the processing of venous samples.4
Rationale. The clinical consequences of hyponatremia are due to water moving from hypo-osmolar extracellular fluid into the relatively hyperosmolar interior of the cell. This water movement can cause progressive cerebral edema, resulting in a spectrum of signs and symptoms from headache and ataxia to seizures and coma. But significant fluid shifts and cerebral edema occur only if the extracellular fluid is hypo-osmolar relative to the intracellular fluid.
In fact, hyponatremia can occur in several situations in which the extracellular fluid is not hypo-osmolar. An increase in effective plasma osmoles (substances in the extracellular fluid that do not readily move across the plasma membrane) can cause water to move out of cells, resulting in translocational hyponatremia. This may be seen in hyperglycemia or when mannitol or contrast dye has been given. In these situations, the plasma is either isotonic or even hypertonic to the intracellular fluid, resulting in no movement of water into the cells and therefore no clinical consequences relating to the hyponatremia. Importantly, no therapy is required for the hyponatremia.
Other situations in which hyponatremia is present but not associated with true hypotonicity include states of excess protein or lipid in the blood (pseudohyponatremia). Also, if an infusion of hypotonic fluid is running, clinicians must be sure that blood samples are not drawn proximally in the same vein.
Are there significant signs or symptoms of cerebral edema?
Patients need to be assessed quickly because those with serious neurologic signs or symptoms thought to be related to hyponatremia require urgent treatment with hypertonic saline to increase the serum sodium concentration, regardless of the underlying volume status, the cause of hyponatremia, or the time of onset.
Determine the duration of hyponatremia
One should try to ascertain when the hyponatremia started, as its duration is important in determining the proper pace of correction.
At the onset of hyponatremia, water moves from the extracellular fluid into cells, pulled in by osmosis. The brain can decrease the net amount of water entering into the neurons (and thus regulate its volume) by increasing the flow of water from the interstitium into the cerebrospinal fluid via increased interstitial hydraulic pressure.7
Over the next several days, inorganic solutes (eg, potassium and sodium salts) and various organic solutes are transported out of the cells. In patients in whom this process has had time to occur, treatment of hyponatremia with hypertonic fluids raises the plasma osmolality faster than the cells can recapture the previously transported osmoles. In this situation, overly rapid correction can cause excessive loss of intracellular water, resulting in cell shrinkage and osmotic demyelination syndrome. Osmotic demyelination usually presents during treatment of hyponatremia after an initial improvement in mental status, with worsening neurologic function and various neurologic signs, including paresis and ultimately even death.6
In patients with acute-onset hyponatremia (ie, with onset within the past 48 hours), in whom the above cerebral adaptations have not had time to occur completely, rapid correction is unlikely to result in osmotic demyelination.
In view of the serious risk of osmotic demyelination, if the timing of development of hyponatremia cannot be determined, one should assume it is chronic (> 48 hours) and avoid rapid overcorrection (see discussion below on the rate of correction).
On the other hand, patients who have severe neurologic signs or symptoms initially need their serum sodium increased urgently to safer levels, regardless of the timing of onset (see below for suggested approach). Subsequent treatment of hyponatremia—after the serum sodium level has been raised enough to reverse neurologic symptoms—will be influenced by the duration of the hyponatremia, with careful avoidance of overly rapid correction, especially in patients with chronic hyponatremia.
Assess the patient’s volume status to determine the proper initial treatment
Check urine osmolality to assess for hyponatremic states in which urinary dilution is intact
Measuring urine osmolality is useful in ascertaining whether hyponatremic patients are making appropriately dilute urine (< 100 mOsm/kg). If they are, the cause of the hyponatremia may be excessive water intake, a reset osmostat, or low solute intake. In addition, patients with hypovolemic hyponatremia may have appropriately dilute urine soon after treatment with isotonic intravenous fluids.
The serum sodium concentration often returns to normal if the underlying cause is eliminated (eg, if excessive fluid intake is stopped). If there are no serious signs or symptoms, this can usually be accomplished without additional therapy with intravenous fluids or medications, thereby avoiding the risk of overcorrection.
Search for causes of rapidly correctable hyponatremia
TREATING HYPONATREMIC PATIENTS WITH SERIOUS SIGNS OR SYMPTOMS
Patients with hypo-osmolar hyponatremia and serious signs or symptoms of cerebral edema (lethargy, respiratory depression, seizures) need rapid initial correction of the serum sodium level, as this is a true medical emergency.
Certain patients are at greater risk of developing cerebral edema from hyponatremia (Table 2).
On the other hand, patients with chronic hyponatremia are very unlikely to present with signs or symptoms of cerebral edema. In fact, in a patient with chronic hyponatremia, care must be taken to avoid overcorrection beyond that needed to reverse severe signs and symptoms. In the rare case in which a patient with chronic hyponatremia presents with signs or symptoms of cerebral edema, the hypertonic saline infusion must be stopped as soon as the signs or symptoms have resolved. Further rapid changes in serum sodium must be avoided.
During correction of hyponatremia, some patients are at particularly high risk of osmotic demyelination syndrome secondary to underlying abnormalities in cerebral osmotic regulation. These include patients with alcoholism, malnutrition, hypokalemia, and burns, and elderly women on thiazide diuretics.8 These patients should be monitored vigilantly for overly rapid correction during treatment.
INITIAL TREATMENT: REVERSE CEREBRAL EDEMA WITH 3% SALINE
The goal of the initial, rapid phase of correction is to reverse cerebral edema.
Patients with serious signs or symptoms should receive hypertonic (3%) saline at a rate of about 1 mL/kg/hour for the first several hours.8 Those with concomitant hypervolemia (as in congestive heart failure) or underlying cardiovascular disease should also receive a loop diuretic to aid in free-water excretion and to prevent volume overload from the saline infusion. This regimen usually raises the serum sodium concentration enough (usually by about 1 mmol/L/hour) to decrease cerebral edema and improve symptoms.
In patients having active seizures or showing signs of brain herniation, 3% saline can be given initially at a higher rate of about 2 to 3 mL/kg/hour over the first few hours. An alternative approach is an initial 50-mL bolus of 3% saline and an additional 200 mL given over the subsequent 4 to 6 hours.9
No study has compared the efficacy and safety of these approaches, and clinicians should always monitor extracellular fluid volume status, neurologic status, and serum sodium levels closely in any patient treated with hypertonic saline.
After severe signs and symptoms have resolved, 3% saline is promptly discontinued and appropriate therapy is initiated based on the patient’s volume status and underlying cause of hyponatremia (see discussion below).
NEXT, FIND THE APPROPRIATE RATE OF CORRECTION
After the initial serious signs or symptoms have been addressed with hypertonic saline, management should focus on limiting the rate of correction in patients with chronic hyponatremia or hyponatremia of unknown duration.
Animal studies and retrospective human studies have suggested certain guidelines on the appropriate pace and magnitude of correction during treatment of hyponatremia to avoid osmotic demyelination syndrome.2
Clinicians must not attempt to correct the serum sodium to “normal” values. Although patients with acute hyponatremia may tolerate complete correction, there is little evidence that raising the serum sodium concentration acutely by more than 5 to 8 mmol/L is advantageous. Therefore, correction should be judicious in all patients.
Appropriate rates of correction
A recent expert consensus panel suggested that the serum sodium level be raised by no more than 10 to 12 mmol/L during the first 24 hours of treatment, and by less than 18 mmol/L over 48 hours.2
Patients with chronic hyponatremia and signs or symptoms of cerebral edema should have their sodium level raised at an even slower rate—some recommend less than 10 mmol/L in the first 24 hours.10 Aggressive initial correction at the rate of 1.5 to 2 mmol/hour for the first 3 to 4 hours with 3% saline is indicated until serious symptoms (seizure, obtundation) resolve, but correction beyond 10 to 12 mmol/L in the first 24 hours should be avoided. Hypertonic saline therapy should usually be discontinued well before the serum sodium level has risen this much, to avoid a continuing rise in the sodium level after the infusion has stopped.
While hypertonic saline is being infused, serum sodium levels should be checked every 1 to 2 hours. In a study in 56 patients with severe hyponatremia (serum sodium ≤ 105 mmol/L),11 no neurologic complications were observed in patients with chronic hyponatremia whose serum sodium was corrected by less than 12 mmol/L in 24 hours or by less than 18 mmol/L in 48 hours or in whom the average rate of correction to a serum sodium of 120 mmol/L was less than or equal to 0.55 mmol/L per hour.
If the serum sodium concentration has been overcorrected
Desmopressin is effective in preventing and reversing inadvertent overcorrection of hyponatremia. 12 In one study, desmopressin lowered the sodium concentration by 2 to 9 mmol/L in 14 of 20 patients. None of the patients developed any serious adverse consequences.
In addition, intravenous water (dextrose 5%) can be given alone or in combination with desmopressin to prevent or reverse an excessive increase in serum sodium.13 Such therapy may be considered in patients who continue to excrete hypotonic urine and have already reached a serum sodium concentration that meets or exceeds the recommended rate or magnitude of change.
Formulas for estimating the rate of correction
Various formulas have been devised for estimating the change in serum sodium concentration during treatment of hyponatremia.14
An alternative is the Barsoum-Levine equation, which takes into account ongoing urinary losses. Although it is more cumbersome to calculate, it may be more precise.17
Alternatively, in patients without hypovolemia, the clinician can calculate the amount of urinary excretion of free water required to achieve a specific target serum sodium and then measure hourly urinary water excretion during aquaresis induced by furosemide (Lasix).8 Although more physiologic, this method can be clinically cumbersome, requiring timely handling of urine specimens, accurate recording of urine output, and rapid reporting of laboratory results.
Ultimately, these methods serve only as estimates of the change in serum sodium and do not replace careful monitoring of electrolytes (every 1 to 2 hours during acute therapy) and fastidious assessment for clinical signs or symptoms of osmotic demyelination syndrome.
PATIENTS WITH HYPONATREMIA AND NO SERIOUS SIGNS OR SYMPTOMS
General approach
Hyponatremic patients without serious signs or symptoms of cerebral edema do not require urgent therapy to raise the serum sodium.
Patients with chronic asymptomatic hyponatremia are commonly encountered in clinical practice. As a result of cerebral adaptation, they can appear to have no symptoms despite serum sodium levels as low as 115 to 120 mmol/L. However, even if they have no serious signs or symptoms of cerebral edema, some patients may complain of fatigue, lethargy, nausea, gait abnormalities, and muscle cramps and have evidence of milder forms of neurocognitive impairment.18
In a recent case-control study,18 elderly patients with chronic hyponatremia (mean serum sodium concentration 126 ± 5 mmol/L) were more likely to present to the hospital with falls compared with age-matched controls. Further analysis suggested these patients had marked impairments in gait and attention, which improved in some as the serum sodium increased.
Another recent study19 reported that mild hyponatremia (mean serum sodium concentration 132 mmol/L) was independently associated with the risk of fracture, even after adjustment for known osteoporotic risk factors.
Even when there is no need for acute therapy to raise the serum sodium level, the clinician should scrutinize the medical regimen and available clinical data to rule out reversible causes of water excess. These may include ongoing administration of hypotonic fluids (eg, parenteral nutrition or dextrose 5% to “keep the vein open”) or of medications that cause inappropriate release of ADH (eg, selective serotonin reuptake inhibitors) or that impair water excretion (eg, nonsteroidal anti-inflammatory drugs). The clinician should also search for an underlying diagnosis that predisposes to water retention, such as hypothyroidism, adrenal insufficiency, congestive heart failure, or hepatic or renal failure. If hyponatremia is due to endocrine disease, correction of hypothyroidism or adrenal insufficiency should result in water excretion and improvement in the serum sodium.
If the cause of the hyponatremia is not immediately apparent, treatment can be started on the basis of assessment of the patient’s extracellular fluid volume status using clinical examination and supplementary laboratory data such as the serum uric acid concentration and urinary sodium concentration.3 Table 3 outlines general treatment options for hypoosmolar hyponatremia according to extracellular fluid volume status.
Of note, physical examination alone has poor sensitivity and specificity in assessing extracellular fluid volume status in patients with hyponatremia.20,21 This highlights the importance of spot measurements of urine sodium and serum uric acid and, when appropriate, isotonic intravenous saline challenge to detect occult hypovolemia.
In general, patients with euvolemia are treated with fluid restriction, and patients with hypovolemia are given isotonic saline. Patients with hypervolemia can be difficult to treat, but in general they are prescribed both sodium and fluid restriction. Loop diuretics can be given to promote excretion of water and sodium. Thiazide diuretics are avoided, as they impair urinary dilution and worsen hyponatremia. Attempts should be made to optimize the treatment of the underlying hypervolemic disorder (congestive heart failure, cirrhosis, advanced renal failure). Vasopressin receptor antagonists can also be used in selected cases of hypervolemic or euvolemic hyponatremia (see discussion below).
How to prescribe fluid restriction rationally
Ideally, patients should not ingest any more fluid than they can excrete in urine and insensible losses—otherwise, the serum sodium can continue to decrease.
Water excretion can be estimated from solute intake and urine osmolarity. In theory, a 70-kg person with a typical daily solute intake of about 10 mOsm/kg and intact urinary dilution to a urine osmolarity of 50 mOsm/L can excrete up to 14 L of urine (700 mOsm/50 mOsm/L) per day. However, a patient with the syndrome of inappropriate ADH secretion (SIADH) and a fixed urine osmolality of 700 mOsm/kg would excrete a similar solute load in only 1 L of urine. Thus, any fluid intake in excess of this volume could worsen hyponatremia.
To excrete free water, urinary sodium plus urinary potassium must be less than the serum sodium concentration. In this regard, the necessary degree of fluid restriction can also be estimated made on the basis of the patient’s urinary electrolytes.22
Increased solute intake to augment water excretion
In patients without hypervolemia, solute intake can be increased to augment water excretion. 22 This can be achieved with salt tablets or oral urea. Although urea can be effective, it is not commonly used because it is not available the United States and it has poor gastrointestinal tolerability. In patients whose nutritional intake is limited and who continue to ingest fluids (such as, for example, an elderly patient subsisting on tea and toast) every effort should be made to increase solute intake with high-protein foods or supplements.
DRUGS TO INHIBIT VASOPRESSIN
Unfortunately, patients often do not adhere to these strategies, as fluid restriction and unpalatable salt tablets or urea can become too burdensome. In such instances, pharmacologic inhibition of vasopressin-mediated water reabsorption can be considered using the following agents.
Demeclocycline (Declomycin) and lithium inhibit the kidney’s response to vasopressin. Because lithium may be nephrotoxic and has unwanted effects on the central nervous system, demeclocycline has become the preferred agent. Given in doses of 300 to 600 mg twice daily, demeclocycline promotes free water excretion, but often takes 1 to 2 weeks of therapy to begin working.
Renal failure due to demeclocycline has been reported in patients with concomitant liver disease.23 Demeclocycline can also cause photosensitivity and is contraindicated in children and pregnant women due to abnormalities in bone and enamel formation. In addition, it can be expensive and may not be covered fully by some prescription plans.
Vasopressin receptor antagonists (‘vaptans’)
ADH, also called vasopressin, interacts with various receptor subtypes, including V1a (causing vasoconstriction, platelet aggregation, inotropic stimulation, myocardial protein synthesis), V1b (causing secretion of adrenocorticotropic hormone), and V2 (causing water reabsorption and release of von Willebrand factor and factor VIII).
Conivaptan (Vaprisol) is a combined V1a-V2 antagonist that has been approved for the treatment of euvolemic and hypervolemic hyponatremia. Conivaptan inhibits the cytochrome P450 3A4 system and thus may interact with other drugs; therefore, its use has been limited to no more than 4 days of intravenous administration in the hospital setting. The recommended dosage is an initial 20-mg infusion over 30 minutes, followed by continuous infusions of 20 to 40 mg/day. Dosing adjustments in renal and hepatic impairment have not been well defined.
Tolvaptan (Samsca) is an oral selective V2 antagonist that has been studied in patients with euvolemic and hypervolemic hyponatremia. 26 Studies have included patients with congestive heart failure, cirrhosis, and SIADH. Although tolvaptan has not been shown to reduce rates of rehospitalization or death in congestive heart failure, it improves serum sodium, overall fluid balance, and congestive symptoms.27 Tolvaptan has recently been approved for the treatment of euvolemic and hypervolemic hyponatremia.
A recent study has confirmed the longterm efficacy of tolvaptan in 111 patients over a mean duration of treatment greater than 700 days.28 While the clinical benefits of chronic tolvaptan therapy have yet to be clearly demonstrated, this study shows that tolvaptan therapy can result in a sustained improvement in serum sodium concentration without an unacceptable increase in adverse events.29
Lixivaptan (VPA-985), another oral selective V2 receptor antagonist, is being studied in patients with euvolemic and hypervolemic hyponatremia.
Current role of vasopressin antagonists
Current studies of vasopressin antagonists in the treatment of hyponatremia are promising, though definite recommendations are needed to ensure slow, careful correction of hyponatremia. Most studies suggest that these agents provide slow, reliable increases in serum sodium. In one large study of patients with congestive heart failure, serum sodium rose by more than 12 mmol/L in 24 hours in fewer than 2% of patients.26
Notably, no cases of osmotic demyelination syndrome have been reported in these studies. However, it should be noted that therapy was started in the hospital with close monitoring of serum sodium levels and discontinuation of fluid restriction; the incidence of overly rapid correction of sodium may be higher outside of carefully done clinical studies. Clinicians should adopt monitoring strategies similar to those used in these rigorous studies.
At present, there is little experience with vasopressin antagonists in hyponatremic patients with serious signs or symptoms of cerebral edema, and most clinicians still view 3% saline as the gold standard for these patients.
Vasopressin antagonists should not be used in patients with hypovolemic hyponatremia, due to concerns about V1a blockade causing hypotension and about V2 blockade producing water excretion and a worsening of the volume-depleted state.
Recent clinical trials have reported that patients often experience increased thirst while taking these agents. This highlights the need to monitor serum sodium during treatment.
These agents are expensive. Tolvaptan costs about $250 per tablet; conivaptan, which is administered intravenously, may cost a little more per treatment course.
THERAPY IN SPECIFIC DISEASE STATES
Patients with hyponatremia and cirrhosis
The focus of treatment remains water and salt restriction and judicious use of loop diuretics and aldosterone antagonists such as spironolactone (Aldactone).
Tolvaptan has been effective at raising the serum sodium level in patients with cirrhosis, 26 while conivaptan should be avoided at present because of vasodilation from V1a receptor antagonism and its potential effects on systemic hemodynamics and risk of variceal bleeding.30
As the severity of cirrhosis increases, the only effective treatment of hyponatremia is liver transplantation.
Patients with SIADH
In most cases, water restriction is the mainstay of therapy. Adequate nutritional intake should also be stressed so that enough solute is available for ongoing water excretion. Although fluid restriction is usually effective, many patients cannot adhere to the level of restriction required.
In cases in which fluid restriction is not effective on its own, demeclocyline can be used to antagonize ADH action and increase water excretion. Sodium tablets and loop diuretics can also be used, taking care to avoid hypovolemia from diuretic-induced sodium losses. The use of tolvaptan in patients with SIADH has resulted in short-term increases in serum sodium.26 A recent study has suggested that this effect can be sustained with longer-term treatment,28 but further studies are needed to show a complementary clinical benefit (eg, improved neurocognition) to guide the use of these costly agents in clinical practice.
Patients with diuretic-induced hyponatremia
Thiazide diuretics should be discontinued and hypovolemia and hypokalemia should be corrected with isotonic saline and potassium supplementation. As the hypokalemia is corrected and the diuretic effect and hypovolemic stimulus to ADH dissipates, water excretion can increase rapidly, resulting in a brisk change in serum sodium.
Serum sodium levels should be closely monitored during therapy to avoid overcorrection. For this reason, use of hypertonic saline should generally be avoided. Hypotonic fluid— eg, half-normal (0.45%) or quarter-normal (0.22%) saline or even desmopressin—may become necessary in the later stages of therapy to avoid overly rapid correction.
Patients with exercise-associated hyponatremia
Patients at highest risk of exercise-associated hyponatremia include those who drink too much fluid during a long-distance race, who have low body weight, who are female, who exercise longer than 4 hours, and who use nonsteroidal anti-inflammatory drugs.31 The cause of hyponatremia is likely multifactorial, with excessive water intake coupled with sodium losses and impaired renal excretion of water due to ADH action and impaired renal dilution. To prevent exercise-associated hyponatremia, fluid intake should be limited to 400 to 800 mL/hour, with the higher end recommended for larger athletes and hotter climates.
Consensus recommendations suggest that most patients with mild hyponatremia (serum sodium 130 to 135 mmol/L) should be treated with fluid restriction and clinical observation, as spontaneous water diuresis leads to improvement in the serum sodium level. Importantly, the reflex to provide isotonic saline infusions should be avoided unless clear signs of volume depletion are present. Intravenous saline has the potential to worsen hyponatremia in the presence of ADH. In addition, some athletes will have retained water in the gastrointestinal tract that may be mobilized after the race, resulting in worsening of hyponatremia.32
In athletes with severe hyponatremia (serum sodium < 120 mmol/L) or symptomatic exercise-associated hyponatremia (lethargy, respiratory depression, seizures), hypertonic saline is the treatment of choice. One protocol suggests giving 100 mL of 3% saline over 10 minutes in the field, followed by prompt transportation to hospital.33
SUMMARY POINTS
- Hyponatremia is a common electrolyte disorder that in its most severe form requires urgent therapy with hypertonic saline to correct cerebral edema.
- In patients without serious signs or symptoms of cerebral edema, recent observations suggest there may be clinically important symptomatology relating to mild neurocognitive dysfunction and an association with risk of bone fracture.
- Multiple treatment strategies are available according to the underlying extracellular fluid volume status and cause of hyponatremia. These include fluid and sodium restriction and augmentation of urinary water excretion with various nutritional and pharmacologic strategies. The most novel therapy includes antagonism of the vasopressin V2 receptor with a class of aquaretic agents known as vaptans.
- There can be serious neurologic injury associated with overly rapid correction of chronic hyponatremia or undercorrection of acute symptomatic hyponatremia.
- Clinicians must be familiar with the details of each of the treatments and have an appreciation of the importance of careful monitoring during treatment.
- Flear CTG, Gill GV, Burn J. Hyponatremia: mechanisms and management. Lancet 1981; 2:26–31.
- Verbalis JG, Goldsmith SR, Greenberg A, Schrier RW, Sterns RH. Hyponatremia treatment guidelines 2007: expert panel recommendations. Am J Med 2007; 120(suppl 1):S1–S21.
- Freda BJ, Davidson MB, Hall PM. Evaluation of hyponatremia: a little physiology goes a long way. Cleve Clin J Med 2004; 71:639–650.
- Weisberg LS. Pseudohyponatremia: a reappraisal. Am J Med 1989; 86:315–318.
- Moritz L, Ayus JC. The pathophysiology and treatment of hyponatraemic encephalopathy: an update. Nephrol Dial Transplant 2003; 18:2486–2491.
- Widdess-Walsh P, Sabharwal V, Demirjian S, DeGeorgia M. Neurologic effects of hyponatremia and its treatment. Cleve Clin J Med 2007; 74:377–383.
- Melton JE, Patlak CS, Pettigrew KD, Cserr HF. Volume regulatory loss of Na, Cl, and K from rat brain during acute hyponatremia. Am J Physiol 1987; 252:F661–F669.
- Lauriat SM, Berl T. The hyponatremic patient: practical focus on therapy. J Am Soc Nephrol 1997; 8:1599–1607.
- Kokko JP. Symptomatic hyponatremia with hypoxia is a medical emergency. Kidney Int 2006; 69:1291–1293.
- Ellis SJ. Severe hyponatraemia: complications and treatment. QJM 1995; 88:905–909.
- Sterns RH, Cappuccio JD, Silver SM, Cohen EP. Neurologic sequelae after treatment of severe hyponatremia: a multicenter perspective. J Am Soc Nephrol 1994; 4:1522–1530.
- Perianayagam A, Sterns RH, Silver SM, et al. DDAVP is effective in preventing and reversing inadvertent overcorrection of hyponatremia. Clin J Am Soc Nephrol 2008; 3:331–336.
- Sterns RH, Hix JK. Overcorrection of hyponatremia is a medical emergency. Kidney Int 2009; 76:587–589.
- Nguyen MK, Kurtz I. Analysis of current formulas used for treatment of the dysnatremias. Clin Exp Nephrol 2004; 8:12–16.
- Adrogué HJ, Madias NE. Hyponatremia. N Engl J Med 2000; 342:1581–1589.
- Mohmand HK, Issa D, Ahmad Z, Cappuccio JD, Kouides RW, Sterns RH. Hypertonic saline for hyponatremia: risk of inadvertent overcorrection. Clin J Am Soc Nephrol 2007; 2:1110–1117.
- Ellison DH, Berl T. Clinical practice. The syndrome of inappropriate antidiuresis. N Engl J Med 2007; 356:2064–2072.
- Renneboog B, Musch W, Vandemergel X, Manto MU, Decaux G. Mild chronic hyponatremia is associated with falls, unsteadiness, and attention deficits. Am J Med 2006; 119:71.e1–e8.
- Kinsella S, Moran S, Sullivan MO, Molloy MG, Eustace JA. Hyponatremia independent of osteoporosis is associated with fracture occurrence. Clin J Am Soc Nephrol 2010; 5:275–280.
- Chung HM, Kluge R, Schrier RW, Anderson RJ. Clinical assessment of extracellular fluid volume in hyponatremia. Am J Med 1987; 83:905–988.
- Hoorn EJ, Halperin ML, Zietse R. Diagnostic approach to a patient with hyponatraemia: traditional versus physiology-based options. QJM 2005; 98:529–540.
- Berl T. Impact of solute intake on urine flow and water excretion. J Am Soc Nephrol 2008; 19:1076–1078.
- Carrilho F, Bosch J, Arroyo V, Mas A, Viver J, Rodes J. Renal failure associated with demeclocycline in cirrhosis. Ann Intern Med 1977; 87:195–197.
- Lehrich RW, Greenberg A. When is it appropriate to use vasopressin receptor antagonists? J Am Soc Nephrol 2008; 19:1054–1058.
- Decaux G, Soupart A, Vassart G. Non-peptide arginine-vasopressin antagonists: the vaptans. Lancet 2008; 371:1624–1632.
- Schrier RW, Gross P, Gheorghiade M, et al; SALT Investigators. Tolvaptan, a selective oral vasopressin V2-receptor antagonist, for hyponatremia. N Engl J Med 2006; 355:2099–2112.
- Konstam MA, Gheorghiade M, Burnett JC, et al; Efficacy of Vasopressin Antagonism in Heart Failure Outcome Study With Tolvaptan (EVEREST) Investigators. Effects of oral tolvaptan in patients hospitalized for worsening heart failure: the EVEREST Outcome Trial. JAMA 2007; 297:1319–1331.
- Berl T, Quittnat-Pelletier F, Verbalis JG, et al; SALTWATER Investigators. Oral tolvaptan is safe and effective in chronic hyponatremia. J Am Soc Nephrol 2010; 21:705–712.
- Greenberg A, Lehrich RW. Treatment of chronic hyponatremia: now we know how, but do we know when or if? J Am Soc Nephrol 2010; 21:552–555.
- Greenberg A, Verbalis JG. Vasopressin receptor antagonists. Kidney Int 2006; 69:2124–2130.
- Rosner MH, Kirven J. Exercise-associated hyponatremia. Clin J Am Soc Nephrol 2007; 2:151–161.
- Halperin ML, Kamel KS, Sterns R. Hyponatremia in marathon runners. N Engl J Med 2005; 353:427–428.
- Hew-Butler T, Almond C, Ayus JC, et al; Exercise-Associated Hyponatremia (EAH) Consensus Panel. Consensus statement of the 1st International Exercise-Associated Hyponatremia Consensus Development Conference, Cape Town, South Africa 2005. Clin J Sport Med 2005; 15:208–213.
KEY POINTS
- Some hyponatremic patients present with acute, life-threatening cerebral edema due to severe hyponatremia. In others, the hyponatremia may be chronic and less severe, causing relatively few symptoms, but representing an important, independent marker of poor prognosis due to an underlying disease (eg, heart failure).
- Even patients with chronic, less severe hyponatremia may have subtle symptoms of neurocognitive dysfunction and a higher risk of bone fractures.
- Overly rapid correction of chronic hyponatremia or undercorrection of acute symptomatic hyponatremia can lead to serious neurologic injury.
- Treatment strategies vary depending on the extracellular fluid volume status and the cause of hyponatremia.
- Vasopressin antagonists (“vaptans”), a new class of aquaretic agents, specifically target the mechanism driving hyponatremia in some patients.
Are antibiotics indicated for the treatment of aspiration pneumonia?
Antibiotics are indicated for primary bacterial aspiration pneumonia and secondary bacterial infection of aspiration (chemical) pneumonitis, but not for uncomplicated chemical pneumonitis.
THREE TYPES OF ‘ASPIRATION PNEUMONIA’
Aspiration pneumonia is a broad and vague term mainly used to refer to the pulmonary consequences of abnormal entry of exogenous or endogenous substances into the lower airways. It can be classified as:
- Aspiration (chemical) pneumonitis
- Primary bacterial aspiration pneumonia
- Secondary bacterial infection of chemical pneumonitis.
These three are sometimes difficult to differentiate, as their signs and symptoms can overlap.
CHEMICAL PNEUMONITIS
Aspiration of stomach contents is relatively common, even in healthy people, and usually has no clinical consequences.1 However, it has also been closely related to community-acquired and nosocomial pneumonia in some studies.2,3
Chemical pneumonitis is usually a consequence of the aspiration of a large volume (≥ 4 mL/kg) of sterile acidic (pH < 2.5) gastric contents into the lower airways (Mendelson syndrome).4,5 The clinical picture varies from asymptomatic to signs of severe dyspnea, hypoxia, cough, and low-grade fever; these signs and symptoms may develop rapidly, within minutes to hours after a witnessed or suspected episode of aspiration.2,6,7 However, they represent an inflammatory reaction to the gastric acid rather than a reaction to bacterial infection.8–10
Chemical pneumonitis affects the most dependent regions of the lungs
Chest radiography shows infiltrates in the most dependent regions of the lung. If aspiration occurs while the patient is supine, the posterior segments of the upper lobes and the apical segments of the lower lobes are most affected. The basal segments of the lower lobes are usually affected if aspiration occurs while the patient is standing or upright.1,2,11,12
Clinical course varies
The clinical course varies. In almost 60% of cases, the patient’s condition improves and the lung infiltrates resolve rapidly, within 2 to 4 days. On the other hand, in about 15% of cases, the patient’s condition deteriorates quickly, within 24 to 36 hours, and progresses to hypoxic respiratory failure and acute respiratory distress syndrome.
In the other 25% of cases, the patient’s condition may improve initially but then worsen as a secondary bacterial infection sets in. The death rate in these patients is almost three times higher than the rate in patients with uncomplicated chemical pneumonitis.11,13
Treatment of uncomplicated cases is mainly supportive
The treatment of uncomplicated chemical pneumonitis involves supportive measures such as airway clearance, oxygen supplementation, and positive pressure ventilation if needed. An obstructing foreign body may need to be removed.12,14 Corticosteroids have been tried, without success.11–13,15
Empiric antibiotic treatment is controversial
Chemical pneumonitis can be difficult to differentiate from bacterial aspiration pneumonia, and whether to give antibiotics is controversial. 16 A survey of current practices among intensivists showed that antimicrobial therapy was often given empirically for noninfectious chemical pneumonitis.17 This practice raises concerns of higher treatment costs and antibiotic resistance.16,18,19 Additionally, antibiotics do not seem to alter the clinical outcome, including radiographic resolution, duration of hospitalization, or death rate, nor do they influence the subsequent development of infection.1,11,13,20
In cases of witnessed or strongly suspected aspiration of gastric contents, antibiotics are not warranted since bacterial infection is not likely to be the cause of any signs or symptoms. 2,7,16 However, to detect secondary infection early, the patient’s respiratory status should be monitored carefully and chest radiography should be repeated.
In less clear-cut cases, ie, if it is not clear whether the patient actually has chemical pneumonitis or primary bacterial aspiration pneumonia, it is prudent to start antibiotics empirically after obtaining lower-respiratory-tract secretions for stains and cultures, and then to reassess within 48 to 72 hours. The antibiotics can be discontinued if the patient has rapid clinical and radiographic improvement and negative cultures. Those whose condition does not improve or who have positive cultures should receive a full course of antibiotics.21,22
PRIMARY BACTERIAL ASPIRATION PNEUMONIA
Primary bacterial aspiration pneumonia—ie, caused by bacteria residing in the upper airways and stomach gaining access to lower airways through aspiration in small or large amounts—is the most common form of aspiration pneumonia, although the actual episode of aspiration is seldom observed.
Signs of bacterial pneumonia
Primary bacterial aspiration pneumonia bears the hallmarks of bacterial pneumonia.12 The clinical picture is more indolent than chemical pneumonitis and includes cough, fever, and putrid sputum, mainly in patients who have clinical conditions predisposing to aspiration (eg, coma, stroke, alcoholism, poor dentition, tube feedings).1,12,20
The characteristic signs on chest radiography are infiltrates involving mainly the lung bases (the right more then the left). If untreated or inadequately treated, complications such as lung abscess, empyema, bronchiectasis, and broncopleural fistula are common.23
Are aerobic organisms replacing anaerobic ones in the community?
The causative organisms in community-acquired aspiration pneumonia are still debated despite abundant research. Older studies1,24,25 found mostly anaerobic organisms (pepto-streptococci, peptococci, Fusobacterium, Prevotela, Bacteroides) as the underlying pathogens, whereas more recent studies16,26,27 found mostly aerobic organisms (Streptococcus pneumoniae, Haemophilus influenzae, Staphylococcus aureus, Enterobacteriaceae) and failed to recover anaerobic organisms. These discrepancies may be the result of different techniques used to isolate organisms: older studies used transtracheal sampling, and transtracheal aspirates may be easily contaminated or colonized by oropharyngeal flora; more recent studies used protected specimen brushes to collect lower-airway specimens.2
In addition, the pathogenic organisms that predominate in community-acquired aspiration pneumonia, as listed above, are different from those most often found in nosocomial cases; gram-negative bacilli (Pseudomonas aeruginosa, Klebsiella pneumoniae, Escherichia coli) are most often isolated in patients with aspiration pneumonia acquired in hospitals and nursing homes.16,27,28S aureus also is an important causative organism in nosocomial cases.16,28
Knowing the causative organisms in bacterial aspiration pneumonia is important for guiding antimicrobial therapy.
Antibiotics are required for bacterial aspiration pneumonia
A course of antibiotics is required for bacterial aspiration pneumonia. While there are no definitive recommendations for the duration of treatment, 7 to 8 days is probably appropriate in uncomplicated cases (ie, no lung abscess, empyema, bronchopleural fistula).22,29 Patients who have complications may need drainage of abscesses or empyema along with a longer duration of antibiotic therapy until clinical and radiographic signs improve.
For community-acquired cases of aspiration pneumonia, a number of antibiotics have proven effective:
- Clindamycin (Cleocin) is still the agent most commonly used, although it lacks gram-negative bacterial coverage.
- Beta-lactam penicillins and newer quinolones have been used successfully.2,29–31 In addition to covering the previously mentioned bacteria, these antibiotics have the added benefit of covering anaerobic bacteria.
- Metronidazole (Flagyl) should not be used alone because it has a higher clinical failure rate.32,33
For nosocomial aspiration pneumonia, giving a broad-spectrum antibiotic empirically is warranted. Beta-lactam penicillins with extended gram-negative coverage, carbapenems, or monobactams in combination with an anti-staphylococcal drug have been advocated for nosocomial aspiration.2,22 A strategy of broad-spectrum coverage followed by narrowing or de-escalating coverage according to lower respiratory tract cultures is encouraged.21,22,34
SECONDARY BACTERIAL INFECTION OF CHEMICAL PNEUMONITIS
Nearly 25% of patients with chemical pneumonitis improve initially, then show clinical deterioration secondary to superimposed bacterial infection.13 Chest radiographs show worsening of initial infiltrates or the development of new ones. The causative organisms and treatment depend on whether the superimposed infection is community-acquired or nosocomial, as is the case in primary bacterial aspiration pneumonia.
PREVENTING ASPIRATION
Measures should be taken to prevent aspiration pneumonia and chemical pneumonitis, especially in institutionalized patients at high risk.12
Elevation of the head of the bed while feeding, dental prophylaxis, and good oral hygiene are known to reduce the incidence of these problems.35–37
A swallowing evaluation for patients with dysphagia can identify those at higher risk of aspiration. These patients may be candidates for postural adjustments, diet modification, strengthening, and other measures offered by the speech and language pathology teams to improve swallowing physiology, biomechanics, safety, and endurance.2,35
Although percutaneous endoscopic gastrostomy tubes are often placed in patients who have aspirated or who are at high risk of aspiration, they do not protect against aspiration, nor do orogastric or nasogastric tubes.38
To date, we have no evidence that prophylactic antibiotic therapy prevents bacterial aspiration pneumonia. In addition, this practice encourages the development of resistant organisms.19,39,40
- Bartlett JG, Gorbach SL. The triple threat of aspiration pneumonia. Chest 1975; 68:560–566.
- Marik PE. Aspiration pneumonitis and aspiration pneumonia. N Engl J Med 2001; 344:665–671.
- Kikuchi R, Watabe N, Konno T, Mishina N, Sekizawa K, Sasaki H. High incidence of silent aspiration in elderly patients with community-acquired pneumonia. Am J Respir Crit Care Med 1994; 150:251–253.
- Mendelson CL. The aspiration of stomach contents into lungs during obstetric anesthesia. Am J Obstet Gynecol 1946; 52:191–205.
- Cameron JL, Caldini P, Toung JK, Zuidema GD. Aspiration pneumonia: physiologic data following experimental aspiration. Surgery 1972; 72:238–245.
- Warner MA, Warner ME, Weber JG. Clinical significance of pulmonary aspiration during the perioperative period. Anesthesiology 1993; 78:56–62.
- DePaso WJ. Aspiration pneumonia. Clin Chest Med 1991; 12:269–284.
- Folkesson HG, Matthay MA, Hébert CA, Broaddus VC. Acid aspiration-induced lung injury in rabbits is mediated by interleukin-8-dependent mechanisms. J Clin Invest 1995; 96:107–116.
- Goldman G, Welbourn R, Kobzik L, Valeri CR, Shepro D, Hechtman HB. Tumor necrosis factor-alpha mediates acid aspiration-induced systemic organ injury. Ann Surg 1990; 212:513–519.
- LeFrock JL, Clark TS, Davies B, Klainer AS. Aspiration pneumonia: a ten-year review. Am Surg 1979; 45:305–313.
- Cameron JL, Mitchell WH, Zuidema GD. Aspiration pneumonia. Clinical outcome following documented aspiration. Arch Surg 1973; 106:49–52.
- Arms RA, Dines DE, Tinstman TC. Aspiration pneumonia. Chest 1974; 65:136–139.
- Bynum LJ, Pierce AK. Pulmonary aspiration of gastric contents. Am Rev Respir Dis 1976; 114:1129–1136.
- Merchant SN, Kirtane MV, Shah KL, Karnik PP. Foreign bodies in the bronchi (a 10 year review of 132 cases). J Postgrad Med 1984; 30:219–223.
- Wolfe JE, Bone RC, Ruth WE. Effects of corticosteroids in the treatment of patients with gastric aspiration. Am J Med 1977; 63:719–722.
- Kane-Gill SL, Olsen KM, Rebuck JA, et al; Aspiration Evaluation Group of the Clinical Pharmacy and Pharmacology Section. Multicenter treatment and outcome evaluation of aspiration syndromes in critically ill patients. Ann Pharmacother 2007; 41:549–555.
- Rebuck JA, Rasmussen JR, Olsen KM. Clinical aspiration-related practice patterns in the intensive care unit: a physician survey. Crit Care Med 2001; 29:2239–2244.
- Singh N, Rogers P, Atwood CW, Wagener MM, Yu VL. Short-course empiric antibiotic therapy for patients with pulmonary infiltrates in the intensive care unit. A proposed solution for indiscriminate antibiotic prescription. Am J Respir Crit Care Med 2000; 162:505–511.
- Kollef MH, Fraser VJ. Antibiotic resistance in the intensive care unit. Ann Intern Med 2001; 134:298–314.
- Lewis RT, Burgess JH, Hampson LG. Cardiorespiratory studies in critical illness. Changes in aspiration pneumonitis. Arch Surg 1971; 103:335–340.
- Rello J. Importance of appropriate initial antibiotic therapy and de-escalation in the treatment of nosocomial pneumonia. Eur Respir Rev 2007; 16:33–39.
- American Thoracic Society. Guidelines for the management of adults with hospital-acquired, ventilator-associated, and healthcare-associated pneumonia. Am J Respir Crit Care Med 2005; 171:388–416.
- Bartlett JG. Anaerobic bacterial infections of the lung and pleural space. Clin Infect Dis 1993; 16(suppl 4):S248–S255.
- Lorber B, Swenson RM. Bacteriology of aspiration pneumonia. A prospective study of community- and hospital-acquired cases. Ann Intern Med 1974; 81:329–331.
- Bartlett JG, Gorbach SL, Finegold SM. The bacteriology of aspiration pneumonia. Am J Med 1974; 56:202–207.
- Mier L, Dreyfuss D, Darchy B, et al. Is penicillin G an adequate initial treatment for aspiration pneumonia? A prospective evaluation using a protected specimen brush and quantitative cultures. Intensive Care Med 1993; 19:279–284.
- Marik PE, Careau P. The role of anaerobes in patients with ventilator-associated pneumonia and aspiration pneumonia: a prospective study. Chest 1999; 115:178–183.
- El-Solh AA, Pietrantoni C, Bhat A, et al. Microbiology of severe aspiration pneumonia in institutionalized elderly. Am J Respir Crit Care Med 2003; 167:1650–1654.
- Mandell LA, Wunderink RG, Anzueto A, et al; Infectious Diseases Society of America. Infectious Diseases Society of America/American Thoracic Society consensus guidelines on the management of community-acquired pneumonia in adults. Clin Infect Dis 2007; 44(suppl 2):S27–S72.
- Kadowaki M, Demura Y, Mizuno S, et al. Reappraisal of clindamycin IV monotherapy for treatment of mild-to-moderate aspiration pneumonia in elderly patients. Chest 2005; 127:1276–1282.
- Ott SR, Allewelt M, Lorenz J, Reimnitz P, Lode H; German Lung Abscess Study Group. Moxifloxacin vs ampicillin/sulbactam in aspiration pneumonia and primary lung abscess. Infection 2008; 36:23–30.
- Perlino CA. Metronidazole vs clindamycin treatment of anerobic pulmonary infection. Failure of metronidazole therapy. Arch Intern Med 1981; 141:1424–1427.
- Sanders CV, Hanna BJ, Lewis AC. Metronidazole in the treatment of anaerobic infections. Am Rev Respir Dis 1979; 120:337–343.
- Alvarez-Lerma F, Alvarez B, Luque P, et al; ADANN Study Group. Empiric broad-spectrum antibiotic therapy of nosocomial pneumonia in the intensive care unit: a prospective observational study. Crit Care 2006; 10:R78.
- Johnson JL, Hirsch CS. Aspiration pneumonia. Recognizing and managing a potentially growing disorder. Postgrad Med 2003; 113:99–112.
- Scolapio JS. Methods for decreasing risk of aspiration pneumonia in critically ill patients. JPEN J Parenter Enteral Nutr 2002; 26(suppl 6):S58–S61.
- Orozco-Levi M, Torres A, Ferrer M, et al. Semirecumbent position protects from pulmonary aspiration but not completely from gastroesophageal reflux in mechanically ventilated patients. Am J Respir Crit Care Med 1995; 152:1387–1390.
- Park RH, Allison MC, Lang J, et al. Randomised comparison of percutaneous endoscopic gastrostomy and nasogastric tube feeding in patients with persisting neurological dysphagia. BMJ 1992; 304( 6839):1406–1409.
- Donskey CJ, Chowdhry TK, Hecker MT, et al. Effect of antibiotic therapy on the density of vancomycin-resistant enterococci in the stool of colonized patients. N Engl J Med 2000; 343:1925–1932.
- Mouw DR, Langlois JP, Turner LF, Neher JO. Clinical inquiries. Are antibiotics effective in preventing pneumonia for nursing home patients? J Fam Pract 2004; 53:994–996.
Antibiotics are indicated for primary bacterial aspiration pneumonia and secondary bacterial infection of aspiration (chemical) pneumonitis, but not for uncomplicated chemical pneumonitis.
THREE TYPES OF ‘ASPIRATION PNEUMONIA’
Aspiration pneumonia is a broad and vague term mainly used to refer to the pulmonary consequences of abnormal entry of exogenous or endogenous substances into the lower airways. It can be classified as:
- Aspiration (chemical) pneumonitis
- Primary bacterial aspiration pneumonia
- Secondary bacterial infection of chemical pneumonitis.
These three are sometimes difficult to differentiate, as their signs and symptoms can overlap.
CHEMICAL PNEUMONITIS
Aspiration of stomach contents is relatively common, even in healthy people, and usually has no clinical consequences.1 However, it has also been closely related to community-acquired and nosocomial pneumonia in some studies.2,3
Chemical pneumonitis is usually a consequence of the aspiration of a large volume (≥ 4 mL/kg) of sterile acidic (pH < 2.5) gastric contents into the lower airways (Mendelson syndrome).4,5 The clinical picture varies from asymptomatic to signs of severe dyspnea, hypoxia, cough, and low-grade fever; these signs and symptoms may develop rapidly, within minutes to hours after a witnessed or suspected episode of aspiration.2,6,7 However, they represent an inflammatory reaction to the gastric acid rather than a reaction to bacterial infection.8–10
Chemical pneumonitis affects the most dependent regions of the lungs
Chest radiography shows infiltrates in the most dependent regions of the lung. If aspiration occurs while the patient is supine, the posterior segments of the upper lobes and the apical segments of the lower lobes are most affected. The basal segments of the lower lobes are usually affected if aspiration occurs while the patient is standing or upright.1,2,11,12
Clinical course varies
The clinical course varies. In almost 60% of cases, the patient’s condition improves and the lung infiltrates resolve rapidly, within 2 to 4 days. On the other hand, in about 15% of cases, the patient’s condition deteriorates quickly, within 24 to 36 hours, and progresses to hypoxic respiratory failure and acute respiratory distress syndrome.
In the other 25% of cases, the patient’s condition may improve initially but then worsen as a secondary bacterial infection sets in. The death rate in these patients is almost three times higher than the rate in patients with uncomplicated chemical pneumonitis.11,13
Treatment of uncomplicated cases is mainly supportive
The treatment of uncomplicated chemical pneumonitis involves supportive measures such as airway clearance, oxygen supplementation, and positive pressure ventilation if needed. An obstructing foreign body may need to be removed.12,14 Corticosteroids have been tried, without success.11–13,15
Empiric antibiotic treatment is controversial
Chemical pneumonitis can be difficult to differentiate from bacterial aspiration pneumonia, and whether to give antibiotics is controversial. 16 A survey of current practices among intensivists showed that antimicrobial therapy was often given empirically for noninfectious chemical pneumonitis.17 This practice raises concerns of higher treatment costs and antibiotic resistance.16,18,19 Additionally, antibiotics do not seem to alter the clinical outcome, including radiographic resolution, duration of hospitalization, or death rate, nor do they influence the subsequent development of infection.1,11,13,20
In cases of witnessed or strongly suspected aspiration of gastric contents, antibiotics are not warranted since bacterial infection is not likely to be the cause of any signs or symptoms. 2,7,16 However, to detect secondary infection early, the patient’s respiratory status should be monitored carefully and chest radiography should be repeated.
In less clear-cut cases, ie, if it is not clear whether the patient actually has chemical pneumonitis or primary bacterial aspiration pneumonia, it is prudent to start antibiotics empirically after obtaining lower-respiratory-tract secretions for stains and cultures, and then to reassess within 48 to 72 hours. The antibiotics can be discontinued if the patient has rapid clinical and radiographic improvement and negative cultures. Those whose condition does not improve or who have positive cultures should receive a full course of antibiotics.21,22
PRIMARY BACTERIAL ASPIRATION PNEUMONIA
Primary bacterial aspiration pneumonia—ie, caused by bacteria residing in the upper airways and stomach gaining access to lower airways through aspiration in small or large amounts—is the most common form of aspiration pneumonia, although the actual episode of aspiration is seldom observed.
Signs of bacterial pneumonia
Primary bacterial aspiration pneumonia bears the hallmarks of bacterial pneumonia.12 The clinical picture is more indolent than chemical pneumonitis and includes cough, fever, and putrid sputum, mainly in patients who have clinical conditions predisposing to aspiration (eg, coma, stroke, alcoholism, poor dentition, tube feedings).1,12,20
The characteristic signs on chest radiography are infiltrates involving mainly the lung bases (the right more then the left). If untreated or inadequately treated, complications such as lung abscess, empyema, bronchiectasis, and broncopleural fistula are common.23
Are aerobic organisms replacing anaerobic ones in the community?
The causative organisms in community-acquired aspiration pneumonia are still debated despite abundant research. Older studies1,24,25 found mostly anaerobic organisms (pepto-streptococci, peptococci, Fusobacterium, Prevotela, Bacteroides) as the underlying pathogens, whereas more recent studies16,26,27 found mostly aerobic organisms (Streptococcus pneumoniae, Haemophilus influenzae, Staphylococcus aureus, Enterobacteriaceae) and failed to recover anaerobic organisms. These discrepancies may be the result of different techniques used to isolate organisms: older studies used transtracheal sampling, and transtracheal aspirates may be easily contaminated or colonized by oropharyngeal flora; more recent studies used protected specimen brushes to collect lower-airway specimens.2
In addition, the pathogenic organisms that predominate in community-acquired aspiration pneumonia, as listed above, are different from those most often found in nosocomial cases; gram-negative bacilli (Pseudomonas aeruginosa, Klebsiella pneumoniae, Escherichia coli) are most often isolated in patients with aspiration pneumonia acquired in hospitals and nursing homes.16,27,28S aureus also is an important causative organism in nosocomial cases.16,28
Knowing the causative organisms in bacterial aspiration pneumonia is important for guiding antimicrobial therapy.
Antibiotics are required for bacterial aspiration pneumonia
A course of antibiotics is required for bacterial aspiration pneumonia. While there are no definitive recommendations for the duration of treatment, 7 to 8 days is probably appropriate in uncomplicated cases (ie, no lung abscess, empyema, bronchopleural fistula).22,29 Patients who have complications may need drainage of abscesses or empyema along with a longer duration of antibiotic therapy until clinical and radiographic signs improve.
For community-acquired cases of aspiration pneumonia, a number of antibiotics have proven effective:
- Clindamycin (Cleocin) is still the agent most commonly used, although it lacks gram-negative bacterial coverage.
- Beta-lactam penicillins and newer quinolones have been used successfully.2,29–31 In addition to covering the previously mentioned bacteria, these antibiotics have the added benefit of covering anaerobic bacteria.
- Metronidazole (Flagyl) should not be used alone because it has a higher clinical failure rate.32,33
For nosocomial aspiration pneumonia, giving a broad-spectrum antibiotic empirically is warranted. Beta-lactam penicillins with extended gram-negative coverage, carbapenems, or monobactams in combination with an anti-staphylococcal drug have been advocated for nosocomial aspiration.2,22 A strategy of broad-spectrum coverage followed by narrowing or de-escalating coverage according to lower respiratory tract cultures is encouraged.21,22,34
SECONDARY BACTERIAL INFECTION OF CHEMICAL PNEUMONITIS
Nearly 25% of patients with chemical pneumonitis improve initially, then show clinical deterioration secondary to superimposed bacterial infection.13 Chest radiographs show worsening of initial infiltrates or the development of new ones. The causative organisms and treatment depend on whether the superimposed infection is community-acquired or nosocomial, as is the case in primary bacterial aspiration pneumonia.
PREVENTING ASPIRATION
Measures should be taken to prevent aspiration pneumonia and chemical pneumonitis, especially in institutionalized patients at high risk.12
Elevation of the head of the bed while feeding, dental prophylaxis, and good oral hygiene are known to reduce the incidence of these problems.35–37
A swallowing evaluation for patients with dysphagia can identify those at higher risk of aspiration. These patients may be candidates for postural adjustments, diet modification, strengthening, and other measures offered by the speech and language pathology teams to improve swallowing physiology, biomechanics, safety, and endurance.2,35
Although percutaneous endoscopic gastrostomy tubes are often placed in patients who have aspirated or who are at high risk of aspiration, they do not protect against aspiration, nor do orogastric or nasogastric tubes.38
To date, we have no evidence that prophylactic antibiotic therapy prevents bacterial aspiration pneumonia. In addition, this practice encourages the development of resistant organisms.19,39,40
- Bartlett JG, Gorbach SL. The triple threat of aspiration pneumonia. Chest 1975; 68:560–566.
- Marik PE. Aspiration pneumonitis and aspiration pneumonia. N Engl J Med 2001; 344:665–671.
- Kikuchi R, Watabe N, Konno T, Mishina N, Sekizawa K, Sasaki H. High incidence of silent aspiration in elderly patients with community-acquired pneumonia. Am J Respir Crit Care Med 1994; 150:251–253.
- Mendelson CL. The aspiration of stomach contents into lungs during obstetric anesthesia. Am J Obstet Gynecol 1946; 52:191–205.
- Cameron JL, Caldini P, Toung JK, Zuidema GD. Aspiration pneumonia: physiologic data following experimental aspiration. Surgery 1972; 72:238–245.
- Warner MA, Warner ME, Weber JG. Clinical significance of pulmonary aspiration during the perioperative period. Anesthesiology 1993; 78:56–62.
- DePaso WJ. Aspiration pneumonia. Clin Chest Med 1991; 12:269–284.
- Folkesson HG, Matthay MA, Hébert CA, Broaddus VC. Acid aspiration-induced lung injury in rabbits is mediated by interleukin-8-dependent mechanisms. J Clin Invest 1995; 96:107–116.
- Goldman G, Welbourn R, Kobzik L, Valeri CR, Shepro D, Hechtman HB. Tumor necrosis factor-alpha mediates acid aspiration-induced systemic organ injury. Ann Surg 1990; 212:513–519.
- LeFrock JL, Clark TS, Davies B, Klainer AS. Aspiration pneumonia: a ten-year review. Am Surg 1979; 45:305–313.
- Cameron JL, Mitchell WH, Zuidema GD. Aspiration pneumonia. Clinical outcome following documented aspiration. Arch Surg 1973; 106:49–52.
- Arms RA, Dines DE, Tinstman TC. Aspiration pneumonia. Chest 1974; 65:136–139.
- Bynum LJ, Pierce AK. Pulmonary aspiration of gastric contents. Am Rev Respir Dis 1976; 114:1129–1136.
- Merchant SN, Kirtane MV, Shah KL, Karnik PP. Foreign bodies in the bronchi (a 10 year review of 132 cases). J Postgrad Med 1984; 30:219–223.
- Wolfe JE, Bone RC, Ruth WE. Effects of corticosteroids in the treatment of patients with gastric aspiration. Am J Med 1977; 63:719–722.
- Kane-Gill SL, Olsen KM, Rebuck JA, et al; Aspiration Evaluation Group of the Clinical Pharmacy and Pharmacology Section. Multicenter treatment and outcome evaluation of aspiration syndromes in critically ill patients. Ann Pharmacother 2007; 41:549–555.
- Rebuck JA, Rasmussen JR, Olsen KM. Clinical aspiration-related practice patterns in the intensive care unit: a physician survey. Crit Care Med 2001; 29:2239–2244.
- Singh N, Rogers P, Atwood CW, Wagener MM, Yu VL. Short-course empiric antibiotic therapy for patients with pulmonary infiltrates in the intensive care unit. A proposed solution for indiscriminate antibiotic prescription. Am J Respir Crit Care Med 2000; 162:505–511.
- Kollef MH, Fraser VJ. Antibiotic resistance in the intensive care unit. Ann Intern Med 2001; 134:298–314.
- Lewis RT, Burgess JH, Hampson LG. Cardiorespiratory studies in critical illness. Changes in aspiration pneumonitis. Arch Surg 1971; 103:335–340.
- Rello J. Importance of appropriate initial antibiotic therapy and de-escalation in the treatment of nosocomial pneumonia. Eur Respir Rev 2007; 16:33–39.
- American Thoracic Society. Guidelines for the management of adults with hospital-acquired, ventilator-associated, and healthcare-associated pneumonia. Am J Respir Crit Care Med 2005; 171:388–416.
- Bartlett JG. Anaerobic bacterial infections of the lung and pleural space. Clin Infect Dis 1993; 16(suppl 4):S248–S255.
- Lorber B, Swenson RM. Bacteriology of aspiration pneumonia. A prospective study of community- and hospital-acquired cases. Ann Intern Med 1974; 81:329–331.
- Bartlett JG, Gorbach SL, Finegold SM. The bacteriology of aspiration pneumonia. Am J Med 1974; 56:202–207.
- Mier L, Dreyfuss D, Darchy B, et al. Is penicillin G an adequate initial treatment for aspiration pneumonia? A prospective evaluation using a protected specimen brush and quantitative cultures. Intensive Care Med 1993; 19:279–284.
- Marik PE, Careau P. The role of anaerobes in patients with ventilator-associated pneumonia and aspiration pneumonia: a prospective study. Chest 1999; 115:178–183.
- El-Solh AA, Pietrantoni C, Bhat A, et al. Microbiology of severe aspiration pneumonia in institutionalized elderly. Am J Respir Crit Care Med 2003; 167:1650–1654.
- Mandell LA, Wunderink RG, Anzueto A, et al; Infectious Diseases Society of America. Infectious Diseases Society of America/American Thoracic Society consensus guidelines on the management of community-acquired pneumonia in adults. Clin Infect Dis 2007; 44(suppl 2):S27–S72.
- Kadowaki M, Demura Y, Mizuno S, et al. Reappraisal of clindamycin IV monotherapy for treatment of mild-to-moderate aspiration pneumonia in elderly patients. Chest 2005; 127:1276–1282.
- Ott SR, Allewelt M, Lorenz J, Reimnitz P, Lode H; German Lung Abscess Study Group. Moxifloxacin vs ampicillin/sulbactam in aspiration pneumonia and primary lung abscess. Infection 2008; 36:23–30.
- Perlino CA. Metronidazole vs clindamycin treatment of anerobic pulmonary infection. Failure of metronidazole therapy. Arch Intern Med 1981; 141:1424–1427.
- Sanders CV, Hanna BJ, Lewis AC. Metronidazole in the treatment of anaerobic infections. Am Rev Respir Dis 1979; 120:337–343.
- Alvarez-Lerma F, Alvarez B, Luque P, et al; ADANN Study Group. Empiric broad-spectrum antibiotic therapy of nosocomial pneumonia in the intensive care unit: a prospective observational study. Crit Care 2006; 10:R78.
- Johnson JL, Hirsch CS. Aspiration pneumonia. Recognizing and managing a potentially growing disorder. Postgrad Med 2003; 113:99–112.
- Scolapio JS. Methods for decreasing risk of aspiration pneumonia in critically ill patients. JPEN J Parenter Enteral Nutr 2002; 26(suppl 6):S58–S61.
- Orozco-Levi M, Torres A, Ferrer M, et al. Semirecumbent position protects from pulmonary aspiration but not completely from gastroesophageal reflux in mechanically ventilated patients. Am J Respir Crit Care Med 1995; 152:1387–1390.
- Park RH, Allison MC, Lang J, et al. Randomised comparison of percutaneous endoscopic gastrostomy and nasogastric tube feeding in patients with persisting neurological dysphagia. BMJ 1992; 304( 6839):1406–1409.
- Donskey CJ, Chowdhry TK, Hecker MT, et al. Effect of antibiotic therapy on the density of vancomycin-resistant enterococci in the stool of colonized patients. N Engl J Med 2000; 343:1925–1932.
- Mouw DR, Langlois JP, Turner LF, Neher JO. Clinical inquiries. Are antibiotics effective in preventing pneumonia for nursing home patients? J Fam Pract 2004; 53:994–996.
Pyogenic liver abscess
A 58-year-old woman presents with fever, chills, vomiting, and right-upperquadrant abdominal pain. She has had diarrhea for several days and has lost 15 lb over the last 6 weeks. Six months ago, she took a cruise through the Panama Canal to Nicaragua, Costa Rica, Mexico, and El Salvador.
The patient undergoes CT-guided liver biopsy with drain placement. Cultures grow Klebsiella pneumoniae, and she is started on intravenous piperacillin-tazobactam for 4 weeks, followed by 4 weeks of oral ciprofloxacin.
Follow-up evaluation at 4 weeks and at 8 weeks shows improvement in the patient’s condition, with CT of the abdomen and pelvis showing a gradual decrease in the size of the abscess.
INCREASING PREVALENCE
K pneumoniae has emerged as the most common organism seen in pyogenic liver abscess.1 Initially seen in Taiwan in the 1980s, K pneumoniae liver abscess is becoming more common in the United States.2 Diabetes and impaired fasting glucose have both been implicated as potential risk factors, but the condition is also seen in nondiabetic patients.3 Although pyogenic liver abscess is commonly a sequela of biliary disease, K pneumoniae liver abscess is more often cryptogenic. 1 Clinical manifestations usually include fever, abdominal pain in the right upper quadrant, nausea, and vomiting.
In this patient, no clear relationship was established between her travel and her illness.
GREATER RISK OF SPREAD
K pneumoniae liver abscess is more likely to spread than polymicrobial liver abscess.3 It is associated with endophthalmitis, meningitis, brain abscess, and septic pulmonary embolism.3 Diabetic patients are particularly susceptible to metastatic foci.3 The reason is not well understood, but poor glycemic control leading to impaired neutrophil phagocytosis is thought to play a role.4
DIAGNOSIS AND TREATMENT
Liver abscesses are associated with elevated alkaline phosphatase levels, hyperbilirubinemia, leukocytosis, hypoalbuminemia, and anemia. As bacteremia is often seen with K pneumoniae liver abscess, blood cultures should be obtained.1 Imaging studies should include right-upper-quadrant ultrasonography if suspicion is high for concomitant biliary disease, and also CT with intravenous contrast to better quantify the dimensions of the abscess.5
Treatment includes empiric parenteral antibiotics and percutaneous drainage. In addition, culture of purulent material for aerobic and anaerobic organisms helps guide antibiotic treatment.
The antibiotic regimen should consist of a first- or third-generation beta-lactamase inhibitor, with or without an aminoglycoside.3 Patients unable to tolerate beta-lactam antibiotics can be given a fluoroquinolone.
The results of cultures and determination of antibiotic sensitivities help to further modifiy antibiotic therapy. Antibiotic therapy may be needed for 4 to 6 weeks. Parenteral antibiotics are recommended initially, and if a patient responds to therapy, treatment can be switched to oral antibiotics to complete the course of treatment.
Although antibiotics with percutaneous drainage are the recommended course of therapy, surgical drainage is sometimes necessary and is best done with the input of a hepatobiliary surgeon. Patients with abscesses larger than 5 cm who had surgical drainage had better clinical outcomes than those who had percutaneous drainage,6 but monitoring the response to antibiotics and the patient’s clinical course is very important when determining the need for emergency surgical intervention vs percutaneous drainage.6
Follow-up imaging is necessary to evaluate the response to therapy, to determine the continued need for antibiotics, and to assess for any further need for drainage.
- Pope JV, Teich DL, Clardy P, McGillicuddy DC. Klebsiella pneumoniae liver abscess: an emerging problem in North America. J Emerg Med 2008; Epub ahead of print.
- Frazee BW, Hansen S, Lambert L. Invasive infection with hypermucoviscous Klebsiella pneumoniae: multiple cases presenting to a single emergency department in the United States. Ann Emerg Med 2009; 53:639–642.
- Lee SS, Chen YS, Tsai HC, et al. Predictors of septic metastatic infection and mortality among patients with Klebsiella pneumoniae liver abscess. Clin Infect Dis 2008; 47:642–650.
- Lin JC, Siu LK, Fung CP, et al. Impaired phagocytosis of capsular serotypes K1 or K2 Klebsiella pneumoniae in type 2 diabetes mellitus patients with poor glycemic control. J Clin Endocrinol Metab 2006; 91:3084–3087.
- Golia P, Sadler M. Pyogenic liver abscess: Klebsiella as an emerging pathogen. Emerg Radiol 2006; 13:87–88.
- Tan YM, Chung AY, Chow PK, et al. An appraisal of surgical and percutaneous drainage for pyogenic liver abscesses larger than 5 cm. Ann Surg 2005; 241:485–490.
A 58-year-old woman presents with fever, chills, vomiting, and right-upperquadrant abdominal pain. She has had diarrhea for several days and has lost 15 lb over the last 6 weeks. Six months ago, she took a cruise through the Panama Canal to Nicaragua, Costa Rica, Mexico, and El Salvador.
The patient undergoes CT-guided liver biopsy with drain placement. Cultures grow Klebsiella pneumoniae, and she is started on intravenous piperacillin-tazobactam for 4 weeks, followed by 4 weeks of oral ciprofloxacin.
Follow-up evaluation at 4 weeks and at 8 weeks shows improvement in the patient’s condition, with CT of the abdomen and pelvis showing a gradual decrease in the size of the abscess.
INCREASING PREVALENCE
K pneumoniae has emerged as the most common organism seen in pyogenic liver abscess.1 Initially seen in Taiwan in the 1980s, K pneumoniae liver abscess is becoming more common in the United States.2 Diabetes and impaired fasting glucose have both been implicated as potential risk factors, but the condition is also seen in nondiabetic patients.3 Although pyogenic liver abscess is commonly a sequela of biliary disease, K pneumoniae liver abscess is more often cryptogenic. 1 Clinical manifestations usually include fever, abdominal pain in the right upper quadrant, nausea, and vomiting.
In this patient, no clear relationship was established between her travel and her illness.
GREATER RISK OF SPREAD
K pneumoniae liver abscess is more likely to spread than polymicrobial liver abscess.3 It is associated with endophthalmitis, meningitis, brain abscess, and septic pulmonary embolism.3 Diabetic patients are particularly susceptible to metastatic foci.3 The reason is not well understood, but poor glycemic control leading to impaired neutrophil phagocytosis is thought to play a role.4
DIAGNOSIS AND TREATMENT
Liver abscesses are associated with elevated alkaline phosphatase levels, hyperbilirubinemia, leukocytosis, hypoalbuminemia, and anemia. As bacteremia is often seen with K pneumoniae liver abscess, blood cultures should be obtained.1 Imaging studies should include right-upper-quadrant ultrasonography if suspicion is high for concomitant biliary disease, and also CT with intravenous contrast to better quantify the dimensions of the abscess.5
Treatment includes empiric parenteral antibiotics and percutaneous drainage. In addition, culture of purulent material for aerobic and anaerobic organisms helps guide antibiotic treatment.
The antibiotic regimen should consist of a first- or third-generation beta-lactamase inhibitor, with or without an aminoglycoside.3 Patients unable to tolerate beta-lactam antibiotics can be given a fluoroquinolone.
The results of cultures and determination of antibiotic sensitivities help to further modifiy antibiotic therapy. Antibiotic therapy may be needed for 4 to 6 weeks. Parenteral antibiotics are recommended initially, and if a patient responds to therapy, treatment can be switched to oral antibiotics to complete the course of treatment.
Although antibiotics with percutaneous drainage are the recommended course of therapy, surgical drainage is sometimes necessary and is best done with the input of a hepatobiliary surgeon. Patients with abscesses larger than 5 cm who had surgical drainage had better clinical outcomes than those who had percutaneous drainage,6 but monitoring the response to antibiotics and the patient’s clinical course is very important when determining the need for emergency surgical intervention vs percutaneous drainage.6
Follow-up imaging is necessary to evaluate the response to therapy, to determine the continued need for antibiotics, and to assess for any further need for drainage.
- Pope JV, Teich DL, Clardy P, McGillicuddy DC. Klebsiella pneumoniae liver abscess: an emerging problem in North America. J Emerg Med 2008; Epub ahead of print.
- Frazee BW, Hansen S, Lambert L. Invasive infection with hypermucoviscous Klebsiella pneumoniae: multiple cases presenting to a single emergency department in the United States. Ann Emerg Med 2009; 53:639–642.
- Lee SS, Chen YS, Tsai HC, et al. Predictors of septic metastatic infection and mortality among patients with Klebsiella pneumoniae liver abscess. Clin Infect Dis 2008; 47:642–650.
- Lin JC, Siu LK, Fung CP, et al. Impaired phagocytosis of capsular serotypes K1 or K2 Klebsiella pneumoniae in type 2 diabetes mellitus patients with poor glycemic control. J Clin Endocrinol Metab 2006; 91:3084–3087.
- Golia P, Sadler M. Pyogenic liver abscess: Klebsiella as an emerging pathogen. Emerg Radiol 2006; 13:87–88.
- Tan YM, Chung AY, Chow PK, et al. An appraisal of surgical and percutaneous drainage for pyogenic liver abscesses larger than 5 cm. Ann Surg 2005; 241:485–490.