User login
An Acute Care for Elders Quality Improvement Program for Complex, High-Cost Patients Yields Savings for the System
In 2016, 15.2% of older Americans were hospitalized compared with 7% of the overall population and their length of stay (LOS) was 0.7 days greater.1 Geriatric hospitalizations frequently result in complications, functional decline, nursing home transfers, and increased cost.2-4 This pattern of decline has been termed “hospitalitis” or dysfunctional syndrome.5,6 Hospitals need data-driven approaches to improve outcomes for elders. The Acute Care for Elders (ACE) program, which has been in existence for roughly 25 years, is one such model. ACE features include an environment prepared for older adults, patient-centered care to prevent functional and cognitive decline, frequent medical review to prevent iatrogenic injury or new geriatric syndromes, and early discharge and rehabilitation planning to maximize the likelihood of return to the community.7 Although published data vary somewhat, ACE programs have robust evidence documenting improved safety, quality, and value.8-15 A recent meta-analysis found that ACE programs decrease LOS, costs, new nursing home discharges, falls, delirium, and functional decline.16 However, of the 13 ACE trials reported to date, only five were published in the last decade. Recent rising pressure to decrease hospitalizations and reduce LOS has shifted some care to other settings and it is unclear whether the same results would persist in today’s rapid-paced hospitals.
ACE programs require enhanced resources and restructured care processes but there is a notable lack of data to guide patient selection. Admission criteria vary among the published reports, and information on whether comorbidity burden impacts the magnitude of benefit is scarce. One ACE investigator commented, “We were not able to identify a subgroup of patients who were most likely to benefit.”17 Not all hospitalized older adults can receive ACE care, and some units have closed due to financial and logistic pressures; thus, criteria to target this scarce resource are urgently needed. Our hospital implemented an ACE program in 2014 and we have measured and internally benchmarked important quality improvement metrics. Using this data, we conducted an exploratory analysis to generate hypotheses on the differential impact across the spectrum of cost, LOS, 30-day readmissions, and variations across quartiles of comorbidity severity.
METHODS
Setting and Patients
In September 2014, our 716-bed teaching hospital in Springfield, Massachusetts launched an ACE program to improve care for older adults on a single medical unit. The program succeeded in engaging the senior leadership, and geriatrics was identified as a priority in Baystate’s 5-year strategic plan. ACE patients ≥70 years were admitted from the emergency department with inpatient status. Patients transferred from other units or with advanced dementia or nearing death were excluded. Core components of the ACE program were derived from published summaries (see supplementary material).7,16
Interprofessional ”ACE Rounds”
Interprofessional ACE Rounds occurred every weekday. As one ACE analyst has noted, “the interdisciplinary team…ensures that the multifactorial nature of functional decline is met with a multicomponent plan to prevent it.”18 Rounds participants shifted over time but always included a geriatrics physician assistant (PA) or geriatrician (team leader), a pharmacist, staff nurses, and a chaplain. The nurse educator, dietician, research assistant, and patient advocate/volunteers attended intermittently. Before rounds, the PA reviewed the admission notes for new ACE patients. Initially, rounds were lengthy and included nurse coaching. Later, nurses’ presentations were structured by the SPICES tool (Sleep, Problems with eating/feeding, Incontinence, Confusion, Evidence of falls, Skin Breakdown)19 and tracking and reporting templates. Coaching and education, along with conversations that did not require the full team, were removed from rounds. Thus, the time required for rounds declined from about 75 minutes to 35 minutes, which allowed more patients to be discussed efficiently. This change was critical as the number of ACE patients rose following the shift to the larger unit. The pharmacist reviewed medications focusing on potentially inappropriate drugs. Following rounds, the nurses and pharmacist conveyed recommendations to the hospitalists.
Patient-Centered Activities to Prevent Functional and Cognitive Decline
Project leaders coached staff about the importance of mobility, sleep, and delirium prevention and identification. The nurses screened patients using the Confusion Assessment Method (CAM) and reported delirium promptly. Specific care sets for ACE patients were implemented (see supplementary material).
The project was enhanced by several palliative care components, ie tracking pain, noting psychiatric symptoms, and considering prognosis by posing the “Surprise Question” during rounds.20 (“Would you be surprised if this patient died in the next year?”). As far as staffing and logistics allowed, the goals of care conversation were held by a geriatrics PA with patients/families who “screened in.”
Prepared Environment
The ACE program’s unit was remodeled to facilitate physical and cognitive functioning and promote sleep at night (quiet hours: 10 PM-6 AM).
In accordance with quality improvement processes, iterative shifts were implemented over time in terms of checklist, presentation format, timing, and team participation. In December 2016, the program relocated to a unit with 34 ACE beds and 5 end-of-life beds; this move markedly increased the number of eligible ACE patients.
Study Design, Data Source, and Patients
Since we were implementing and measuring our ACE program with a quality improvement lens, we chose a descriptive cross-sectional study design to generate hypotheses regarding our program’s impact compared to usual care. Using a hospital-wide billing database (McKesson Performance Analytics, v19, Alpharetta, Georgia) we sampled inpatients aged >70 years with a medical Diagnosis Related Group (DRGs) admitted through the emergency department and discharged from a medical unit from September 22, 2014 to August 31, 2017. These criteria mirrored those in the ACE unit. Older adults requiring specialized care (eg, those with myocardial infarct) were excluded, as were those with billing codes for mechanical ventilation, admission to critical care units, or discharge to hospice. Because one of our outcomes was readmission, we excluded patients who died during hospitalization. Patient characteristics collected included demographics and insurance category. To evaluate comorbidity burden, we collected ICD-9/ICD-10 diagnostic codes and generated a combined comorbidity score as described by Gagne, et al.21 This score was devised to predict mortality and 30-day readmissions and had better predictive ability in elders than the Elixhauser or Charlson scores. Scores ranged from −2 to 26, although values >20 are rare.
Exposure
Subjects were categorized as either discharged from the ACE or discharged from usual care. ACE discharges were tracked daily on a spreadsheet that was linked into our sample of eligible subjects.
Outcomes
Total cost of hospitalization (direct plus indirect costs), LOS, and all-cause 30-day readmissions were queried from the same billing database.
Statistical Analysis
As this study was a quality improvement project, analyses were descriptive and exploratory; no statistical hypothesis testing was conducted. We initially evaluated subject characteristics and comorbidities across study groups to determine group balance and comparability using means and standard deviations for continuous data and frequencies and percentages for categorical data. To analyze total cost and LOS, we utilized quantile regression with clustered standard errors to account for clustering by patient. We calculated the median difference between hospitalization cost and LOS for usual care versus ACE patients (with ACE as the referent group). To explore variations across the distributions of outcomes, we determined differences in cost and LOS and their 95% confidence intervals at the 25th, 50th, 75th, and 90th percentiles. Thirty-day readmission risk was estimated using a generalized estimating equation model with a logit link and binomial family. Readmission risk is presented along with 95% confidence intervals. For all models, we initially evaluated change over time (by quarter). After establishing the absence of time trends, we collapsed results into a comparison of usual care versus ACE care. Model estimates are presented both unadjusted and adjusted for age and comorbidity score. Following our initial analyses of cost, LOS, and 30-day readmission risk; we explored differences across quartiles of combined comorbidity scores. We used the same unadjusted models described above but incorporated an interaction term to generate estimates stratified by quartile of comorbidity score. We performed two additional analyses to evaluate the robustness of our findings. First, because hemiplegia prevalence was higher in the usual-care group than in the ACE group and can result in higher cost of care, we repeated the analysis after excluding those patients with hemiplegia. Second, because we were unable to control for functional capacity in the entire sample, we evaluated group differences in mobility for a subsample obtained prior to October 2015 using ICD-9 diagnostic codes, which can be considered surrogate markers for mobility.22 The results of our first analysis did not substantively change our main findings; in our second analysis, groups were balanced by mobility factors which suggested that confounding by functional capacity would be limited in our full sample. The results of these analyses are reported in the supplemental material.
Analysis was completed using Stata v15.1 (StataCorp, LP College Station, Texas). The Baystate Medical Center Institutional Review Board determined that the initiative was quality improvement and “not research.”
RESULTS
A total of 13,209 patients met the initial inclusion criteria; 1,621 were excluded, resulting in a sample of 11,588 patients. Over the 3-year study period, 1,429 (12.3%) were discharged from ACE and 10,159 (87.7%) were discharged from usual care. The groups were similar in age, sex, race and insurance status. Compared with the usual-care group, ACE patients had a higher median comorbidity score (3 vs 2 for usual care) and higher rates for anemia, dementia, fluid and electrolyte disorders, hypertension, and chronic obstructive pulmonary disease (COPD). However, ACE patients had lower rates of hemiplegia (0.9% vs 3%), arrhythmias, and pulmonary circulation disorders than those with usual care (Table 1).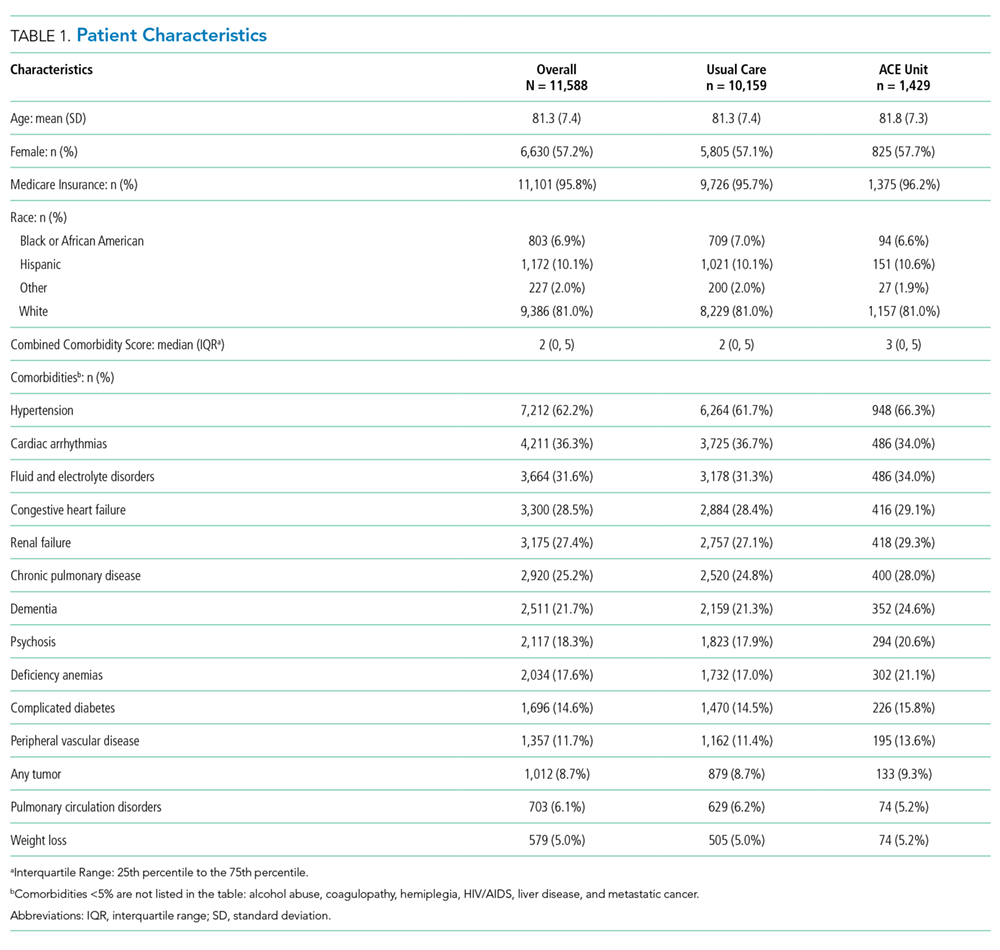
The median cost per ACE patient was slightly lower at $6,258 (interquartile range [IQR] = $4,683-$8,547) versus $6,858 (IQR = $4,855-$10,478) in usual care. Across the cost distribution, the ACE program had lower costs than usual care; however, these differences became more pronounced at the higher end of the distribution. For example, compared with the ACE group, the usual-care group’s unadjusted cost difference was $171 higher at the 25th percentile, $600 higher at the median, $1,932 higher at the 75th percentile, and $3,687 higher at the 90th percentile. The ACE median LOS was 3.7 days (IQR = 2.7-5.0) compared with 3.8 days (IQR = 2.7-6.0) for non-ACE patients. Similar to cost, LOS differences rose at higher percentiles of the distribution, with shorter stays for the ACE patients within each grouping. Compared with the ACE group, the unadjusted LOS difference for usual-care patients ranged from 0 days at the 25th percentile to 0.2 day longer at the median, 1.0 day longer at the 75th percentile, and 1.9 days longer at the 90th percentile. For both cost and LOS models, estimates remained stable after adjusting for age and combined comorbidity score (Table 2).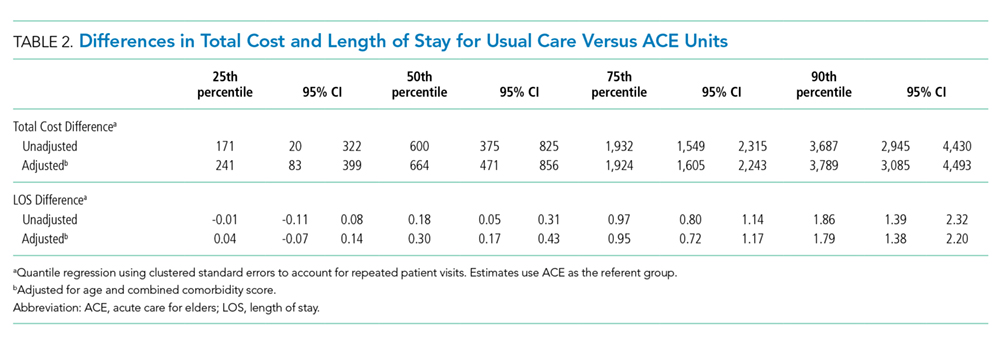
We explored the impact of increasing comorbidity burden on these outcomes using the following quartiles of the combined comorbidity score: −2 to 0 (387 ACE vs 3,322 usual-care patients), 1 to 2 (264 ACE vs 1,856 usual-care patients), 3 to 5 (476 ACE vs 2,859 usual-care patients), and 6 to 15 (301 ACE vs 2,122 usual-care patients). It was not surprising that cost and LOS paralleled each other, with the greatest cost and LOS benefits in the highest quartile of the combined comorbidity score (Figure 1). For example, at the 90th percentile, the cost difference approached $6,000 higher for the usual-care group in the top quartile of combined comorbidity score compared with nearly $3,000 higher for the lowest quartile. Similarly, at the 90th percentile, LOS for usual-care patients was 2.9 days longer at the top quartile compared with 1.7 days longer at the lowest quartile.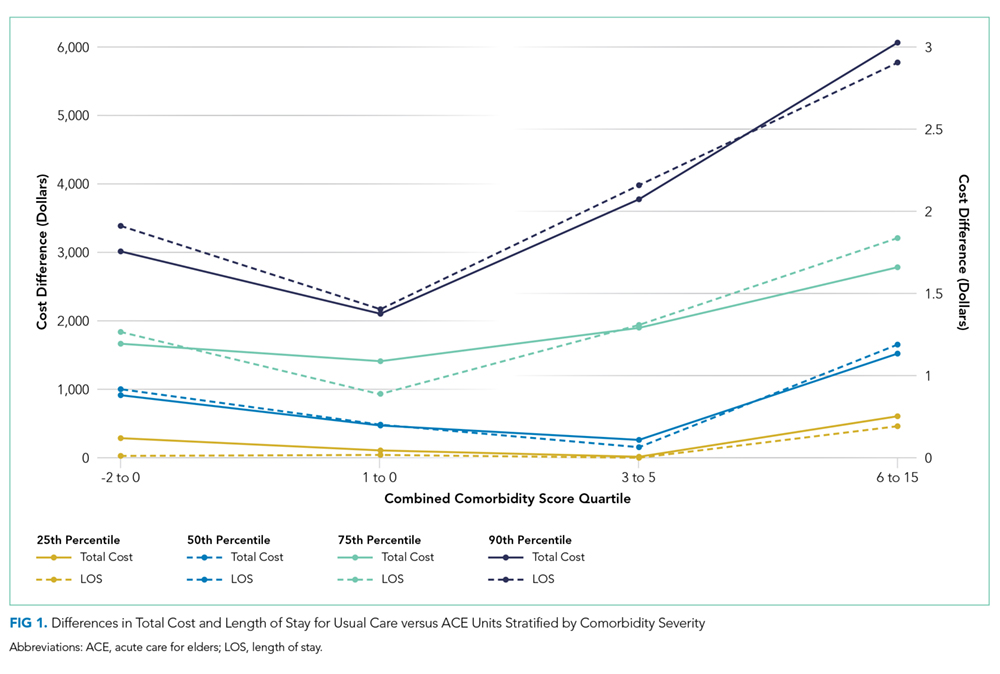
The all-cause 30-day readmission risk was similar for both groups, with an absolute risk difference of −0.7% (95% CI = −2.6% to 1.3%). Adjustment for age and comorbidity score did not substantially change this result. Following stratification by quartile of combined comorbidity scores, we observed similar readmission risks at each quartile (Figure 2).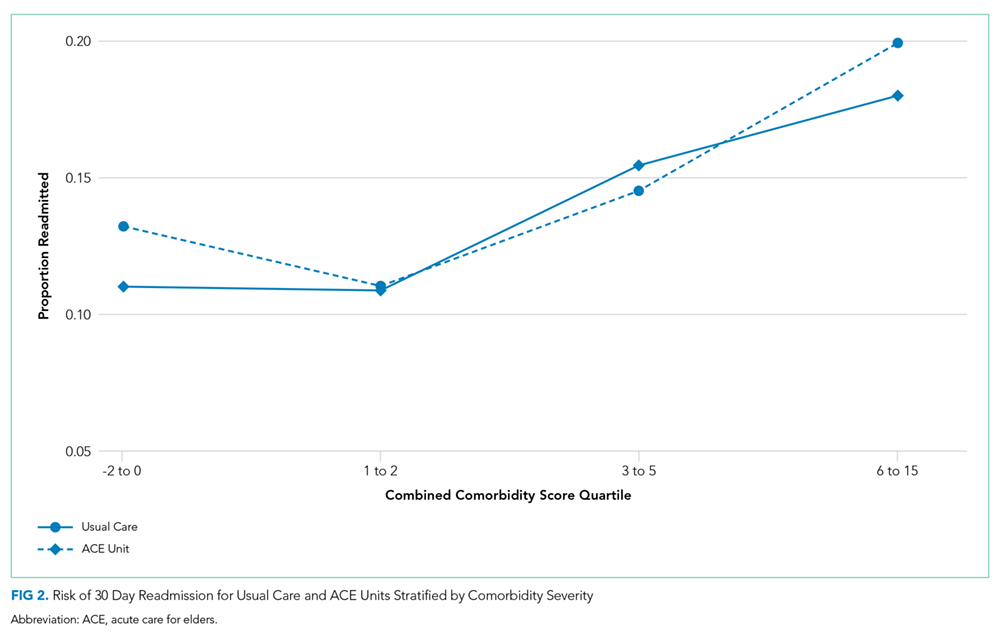
DISCUSSION
This quality improvement initiative evaluated which ACE admissions yielded the greatest value and found the largest reductions in LOS and cost in patients with the greatest comorbidity scores (frequently referred to as “high need, high cost”).23,24 Based on prior literature, we had anticipated that moderate risk patients would show the maximum benefit.15,25 In contrast to our findings, a University of Alabama (UAB) ACE program subgroup analysis using the CMS Case Mix Index (CMI) found a cost reduction for patients with low or intermediate CMI scores but not for those with high scores.15 The Hospital Elder Life Program (HELP) has yielded maximal impact for patients at moderate risk for delirium.26 Our results are supported by a University of Texas, Houston, study revealing lower LOS and cost for ACE patients, despite high CMI scores and endemic frailty, although it did not report outcomes across a range of comorbidities or costs.27 Our results may be determined by the specific characteristics of the Baystate ACE initiative. Our emphasis on considering prognosis and encouraging advance care planning could have contributed to the improved metrics for more complicated patients. It is possible that patients with high comorbidity burden were more likely to screen in with the surprise question, leading to more frequent goals of care discussions by the hospitalists or geriatrics team, which, in turn, may have resulted in less aggressive care and consequently lower costs. The emphasis on prognosis and palliative care was not a feature of the UAB or Texas studies. Additional components, such as the delirium screening and the presence of volunteer advocates, could also have impacted the results. Our tiered approach during rounds with rapid reviews for most patients and longer discussions for those at highest risk may have further contributed to the findings. Finally, although we did not track the recommendation acceptance rate for the entire study period, in the first 9 months of the project, 9,325 recommendations were made with an acceptance rate of >85%. We previously reported a similar acceptance rate for medication recommendations.28 Another factor contributing to our results may be the ways in which we categorized patients and calculated costs. We used the Gagne combined comorbidity score, which includes only prior conditions;21 the UAB study used CMI, which includes severity of presenting illness and complications, as well as baseline comorbidities. We also compared total cost, while UAB reported variable direct cost.
This study has a number of limitations. First, it was conducted at a single site and may not apply to other hospitals. Second, as a quality improvement program, its design, processes, and personnel evolved over time, and, as in any multicomponent initiative, the effect of individual factors on the outcomes is unknown. Third, this is an observational study with the aim of generating hypotheses for more rigorous studies in the future and residual confounding factors may exist despite efforts to adjust for variables present in an administrative database. Thus, we were unable to completely adjust for potentially important social factors, presence of delirium, or baseline functional status.
To our knowledge, this study is the first report on the differential impact of comorbidity scores and cost distribution on ACE total cost and LOS reductions. Despite its limitations, it contributes to the existing literature by suggesting that the Gagne comorbidity score can help identify which admissions will yield the greatest value. The Gagne score could be calculated at admission using the ePrognosis risk calculator or incorporated and automated in the EMR.29 Many health systems are reluctant to designate beds for specific subpopulations since doing so decreases flexibility and complicates the admission process. A dynamic tension exists between increasing income streams now and generating future savings by supporting initiatives with upfront costs. Other successful acute care geriatrics programs, such as NICHE,30 HELP,31 MACE,32 and consultation teams, exist.33 Studies reporting the outcomes of combining ACE units with these other approaches in a “portfolio approach” will inform the design of the most efficient and impactful programs.34 Scrupulous attention to symptom control and advance care planning are key features of our program, and, given the high prevalence of advanced serious illness in hospitalized older adults, this consideration may be critical for success.
As ACE units can only care for a small fraction of hospitalized older adults, determining which patients will maximally benefit from the structured, team-based care on ACE units is crucial. We found that the greatest impact on LOS and costs occurred in the subgroup with the highest comorbidity scores and overall cost. ACE care for the most vulnerable patients appeared to yield the greatest value for the system; thus, these older adults may need to be prioritized for admission. This improvement may enhance quality and value outcomes, maximize a scarce resource, and secure results needed to sustain the “clinician-led and data-driven” ACE model in the face of changing clinical and financial landscapes.35
Acknowledgments
All those with significant contributions to this work are included as authors.
The authors express their deep appreciation to all their Baystate collaborators, particularly to Rebecca Starr, MD, the first geriatrics medical director of the program, Ms. Virginia Chipps, RN, the program’s first nurse manager, and Tasmiah Chowdhury, PharmD, the program’s first pharmacist. We are also deeply grateful to those persons who provided programmatic advice and input on model ACE programs elsewhere, including Kyle Allen, MD, Michael Malone MD, Robert Palmer MD, and, especially, Kellie Flood, MD.
Disclosures
None of the authors have any existing or potential personal or financial conflicts relevant to this paper to report.
Funding
This work was supported in part by a Geriatric Workforce Enhancement Program award (grant # U1QHP28702) from the Health Resources and Services Administration and by internal support from Baystate Health
1. National Hospital Survey: number and rate of hospital discharge 2010 table. 2010; https://www.cdc.gov/nchs/fastats/hospital.htm. Accessed February, 10th 2019.
2. Brennan TA, Leape LL, Laird NM, Hebert L, Localio AR, Lawthers AG, Newhouse JP, Weiler PC, Hiatt HH. Incidence of adverse events and negligence in hospitalized patients. results of the Harvard medical practice study I. N Engl J Med. 1991;324(6):370-376. https://doi.org/10.1056/NEJM199102073240604.
3. Creditor MC. Hazards of hospitalization of the elderly. Ann Intern Med. 1993;118(3):219-223. PubMed
4. Levinson D. Adverse vents in hospitals: National incidence among Medicare beneficiaries; US Department of Health and Human Services, Office of the Inspector General 2010. Accessed February, 10th, 2019.
5. Palmer RM, Counsell S, Landefeld CS. Clinical intervention trials: the ACE unit. Clin Geriatr Med. 1998;14(4):831-849. PubMed
6. Landefeld CS. Foreword. In: Malone ML, Palmer MR, Capezuti E, eds. Acute Care for Elders New York Humana Press; 2014:v-xii.
7. Fox MT, Persaud M, Maimets I, O’Brien K, Brooks D, Tregunno D, Schraa E. Effectiveness of acute geriatric unit care using acute care for elders components: a systematic review and meta-analysis. J Am Geriatr Soc. 2012;60(12):2237-2245. https://doi.org/10.1111/jgs.12028.
8. Landefeld CS, Palmer RM, Kresevic DM, Fortinsky RH, Kowal J. A randomized trial of care in a hospital medical unit especially designed to improve the functional outcomes of acutely ill older patients. N Engl J Med. 1995;332(20):1338-1344. https://doi.org/10.1056/NEJM199505183322006.
9. Covinsky KE, King JT, Jr., Quinn LM, Siddique R, Palmer R, Kresevic DM, Fortinsky RH, Kowal J, Landefeld CS. Do acute care for elders units increase hospital costs? A cost analysis using the hospital perspective. J Am Geriatr Soc. 1997;45(6):729-734. PubMed
10. Counsell SR, Holder CM, Liebenauer LL, Palmer RM, Fortinsky RH, Kresevic DM, Quinn LM, Allen KR, Covinsky KE, Landefeld CS. Effects of a multicomponent intervention on functional outcomes and process of care in hospitalized older patients: a randomized controlled trial of Acute Care for Elders (ACE) in a community hospital. J Am Geriatr Soc. 2000;48(12):1572-1581. PubMed
11. Asplund K, Gustafson Y, Jacobsson C, Bucht G, Wahlin A, Peterson J, Blom JO, Angquist KA. Geriatric-based versus general wards for older acute medical patients: a randomized comparison of outcomes and use of resources. J Am Geriatr Soc. 2000;48(11):1381-1388. PubMed
12. Saltvedt I, Mo ES, Fayers P, Kaasa S, Sletvold O. Reduced mortality in treating acutely sick, frail older patients in a geriatric evaluation and management unit. A prospective randomized trial. J Am Geriatr Soc. 2002;50(5):792-798. PubMed
13. Jayadevappa R, Chhatre S, Weiner M, Raziano DB. Health resource utilization and medical care cost of Acute Care Elderly unit patients. Value Health. 2006;9(3):186-192. https://doi.org/10.1111/j.1524-4733.2006.00099.x.
14. Barnes DE, Palmer RM, Kresevic DM, Fortinsky RH, Kowal J, Chren MM, Landefeld CS. Acute Care for Elders units produced shorter hospital stays at lower cost while maintaining patients’ functional status. Health Aff (Millwood). 2012;31(6):1227-1236. https://doi.org/10.1377/hlthaff.2012.0142.
15. Flood KL, Maclennan PA, McGrew D, Green D, Dodd C, Brown CJ. Effects of an Acute Care for Elders unit on costs and 30-day readmissions. JAMA Intern Med. 2013;173(11):981-987. https://doi.org/10.1001/jamainternmed.2013.524.
16. Fox MT, Sidani S, Persaud M, Tregunno D, Maimets I, Brooks D, O’Brien K. Acute Care for Elders components of acute geriatric unit care: systematic descriptive review. J Am Geriatr Soc. 2013;61(6):939-946. https://doi.org/10.1111/jgs.12282.
17. Palmer MR, Kresevic DM. The Acute Care for Elders unit In: Malone ML, Palmer MR, Capezuti E, eds. Acute Care for Elders New York: Humana Press 2014:92.
18. Pierluissi E, Francis D, Covinsky KE. Patient and hospital factors that lead to adverse outcomes in hospitalized elders In: Malone ML, Palmer MR, Capezuti E, eds. Acute Care for Elders New York: Humana Press 2014:42.
19. Fulmer T. How to try this: Fulmer SPICES. Am J Nurs. 2007;107(10):40-48; quiz 48-49. https://doi.org/10.1097/01.NAJ.0000292197.76076.e1.
20. Downar J, Goldman R, Pinto R, Englesakis M, Adhikari NK. The “surprise question” for predicting death in seriously ill patients: a systematic review and meta-analysis. CMAJ. 2017;189(13):E484-E493. https://doi.org/10.1503/cmaj.160775.
21. Gagne JJ, Glynn RJ, Avorn J, Levin R, Schneeweiss S. A combined comorbidity score predicted mortality in elderly patients better than existing scores. J Clin Epidemiol. 2010;64(7):749-759. doi: 10.1016/j.jclinepi.2010.10.004.
22. Segal JB, Chang HY, Du Y, Walston JD, Carlson MC, Varadhan R. Development of a claims-based frailty indicator anchored to a well-established frailty phenotype. Med Care. 2017;55(7):716-722. https://doi.org/10.1097/MLR.0000000000000729.
23. Blumenthal D, Chernof B, Fulmer T, Lumpkin J, Selberg J. Caring for high-need, high-cost patients - an urgent priority. N Engl J Med. 2016;375(10):909-911. https://doi.org/10.1056/NEJMp1804276.
24. Blumenthal D. Caring for high-need, high-cost patients: what makes for a successful care management program? . https://www.commonwealthfund.org/publications/journal-article/2016/jul/caring-high-need-high-cost-patients-urgent-priority. Accessed March, 20th 2019.
25. Ahmed NN, Pearce SE. Acute Care for the Elderly: a literature review. Popul Health Manag. 2010;13(4):219-225. https://doi.org/10.1089/pop.2009.0058.
26. Inouye SK, Bogardus ST, Jr., Charpentier PA, Leo-Summers L, Acampora D, Holford TR, Cooney LM, Jr. A multicomponent intervention to prevent delirium in hospitalized older patients. N Engl J Med. 1999;340(9):669-676. https://doi.org/10.1056/NEJM199903043400901.
27. Ahmed N, Taylor K, McDaniel Y, Dyer CB. The role of an Acute Care for the Elderly unit in achieving hospital quality indicators while caring for frail hospitalized elders. Popul Health Manag. 2012;15(4):236-240. https://doi.org/10.1089/pop.2011.0055.
28. Chowdhury TP, Starr R, Brennan M, Knee A, Ehresman M, Velayutham L, Malanowski AJ, Courtney HA, Stefan MS. A quality improvement initiative to improve medication management in an Acute Care for Elders program through integration of a clinical pharmacist. J Pharm Pract. 2018:897190018786618. https://doi.org/10.1177/0897190018786618.
29. Lee S, Smith A, Widera E. ePrognosis -Gagne index. https://eprognosis.ucsf.edu/gagne.php. Accessed March 20th, 2019.
30. Turner JT, Lee V, Fletcher K, Hudson K, Barton D. Measuring quality of care with an inpatient elderly population. The geriatric resource nurse model. J Gerontol Nurs. 2001;27(3):8-18. PubMed
31. Hshieh TT, Yang T, Gartaganis SL, Yue J, Inouye SK. Hospital Elder Life Program: systematic review and meta-analysis of effectiveness. Am J Geriatr Psychiatry. 2018;26(10):1015-1033. https://doi.org/10.1016/j.jagp.2018.06.007.
32. Hung WW, Ross JS, Farber J, Siu AL. Evaluation of the Mobile Acute Care of the Elderly (MACE) service. JAMA Intern Med. 2013;173(11):990-996. https://doi.org/10.1001/jamainternmed.2013.478.
33. Sennour Y, Counsell SR, Jones J, Weiner M. Development and implementation of a proactive geriatrics consultation model in collaboration with hospitalists. J Am Geriatr Soc. 2009;57(11):2139-2145. https://doi.org/10.1111/j.1532-5415.2009.02496.x.
34. Capezuti E, Boltz M. An overview of hospital-based models of care. In: Malone ML, Palmer MR, Capezuti E, eds. Acute Care for Elders. New York: Humana Press 2014:49-68.
35. Malone ML, Yoo JW, Goodwin SJ. An introduction to the Acute Care for Elders In: Malone ML, Palmer MR, Capezuti E, eds. Acute Care for Elders New York: Humana Press 2014:1-9.
In 2016, 15.2% of older Americans were hospitalized compared with 7% of the overall population and their length of stay (LOS) was 0.7 days greater.1 Geriatric hospitalizations frequently result in complications, functional decline, nursing home transfers, and increased cost.2-4 This pattern of decline has been termed “hospitalitis” or dysfunctional syndrome.5,6 Hospitals need data-driven approaches to improve outcomes for elders. The Acute Care for Elders (ACE) program, which has been in existence for roughly 25 years, is one such model. ACE features include an environment prepared for older adults, patient-centered care to prevent functional and cognitive decline, frequent medical review to prevent iatrogenic injury or new geriatric syndromes, and early discharge and rehabilitation planning to maximize the likelihood of return to the community.7 Although published data vary somewhat, ACE programs have robust evidence documenting improved safety, quality, and value.8-15 A recent meta-analysis found that ACE programs decrease LOS, costs, new nursing home discharges, falls, delirium, and functional decline.16 However, of the 13 ACE trials reported to date, only five were published in the last decade. Recent rising pressure to decrease hospitalizations and reduce LOS has shifted some care to other settings and it is unclear whether the same results would persist in today’s rapid-paced hospitals.
ACE programs require enhanced resources and restructured care processes but there is a notable lack of data to guide patient selection. Admission criteria vary among the published reports, and information on whether comorbidity burden impacts the magnitude of benefit is scarce. One ACE investigator commented, “We were not able to identify a subgroup of patients who were most likely to benefit.”17 Not all hospitalized older adults can receive ACE care, and some units have closed due to financial and logistic pressures; thus, criteria to target this scarce resource are urgently needed. Our hospital implemented an ACE program in 2014 and we have measured and internally benchmarked important quality improvement metrics. Using this data, we conducted an exploratory analysis to generate hypotheses on the differential impact across the spectrum of cost, LOS, 30-day readmissions, and variations across quartiles of comorbidity severity.
METHODS
Setting and Patients
In September 2014, our 716-bed teaching hospital in Springfield, Massachusetts launched an ACE program to improve care for older adults on a single medical unit. The program succeeded in engaging the senior leadership, and geriatrics was identified as a priority in Baystate’s 5-year strategic plan. ACE patients ≥70 years were admitted from the emergency department with inpatient status. Patients transferred from other units or with advanced dementia or nearing death were excluded. Core components of the ACE program were derived from published summaries (see supplementary material).7,16
Interprofessional ”ACE Rounds”
Interprofessional ACE Rounds occurred every weekday. As one ACE analyst has noted, “the interdisciplinary team…ensures that the multifactorial nature of functional decline is met with a multicomponent plan to prevent it.”18 Rounds participants shifted over time but always included a geriatrics physician assistant (PA) or geriatrician (team leader), a pharmacist, staff nurses, and a chaplain. The nurse educator, dietician, research assistant, and patient advocate/volunteers attended intermittently. Before rounds, the PA reviewed the admission notes for new ACE patients. Initially, rounds were lengthy and included nurse coaching. Later, nurses’ presentations were structured by the SPICES tool (Sleep, Problems with eating/feeding, Incontinence, Confusion, Evidence of falls, Skin Breakdown)19 and tracking and reporting templates. Coaching and education, along with conversations that did not require the full team, were removed from rounds. Thus, the time required for rounds declined from about 75 minutes to 35 minutes, which allowed more patients to be discussed efficiently. This change was critical as the number of ACE patients rose following the shift to the larger unit. The pharmacist reviewed medications focusing on potentially inappropriate drugs. Following rounds, the nurses and pharmacist conveyed recommendations to the hospitalists.
Patient-Centered Activities to Prevent Functional and Cognitive Decline
Project leaders coached staff about the importance of mobility, sleep, and delirium prevention and identification. The nurses screened patients using the Confusion Assessment Method (CAM) and reported delirium promptly. Specific care sets for ACE patients were implemented (see supplementary material).
The project was enhanced by several palliative care components, ie tracking pain, noting psychiatric symptoms, and considering prognosis by posing the “Surprise Question” during rounds.20 (“Would you be surprised if this patient died in the next year?”). As far as staffing and logistics allowed, the goals of care conversation were held by a geriatrics PA with patients/families who “screened in.”
Prepared Environment
The ACE program’s unit was remodeled to facilitate physical and cognitive functioning and promote sleep at night (quiet hours: 10 PM-6 AM).
In accordance with quality improvement processes, iterative shifts were implemented over time in terms of checklist, presentation format, timing, and team participation. In December 2016, the program relocated to a unit with 34 ACE beds and 5 end-of-life beds; this move markedly increased the number of eligible ACE patients.
Study Design, Data Source, and Patients
Since we were implementing and measuring our ACE program with a quality improvement lens, we chose a descriptive cross-sectional study design to generate hypotheses regarding our program’s impact compared to usual care. Using a hospital-wide billing database (McKesson Performance Analytics, v19, Alpharetta, Georgia) we sampled inpatients aged >70 years with a medical Diagnosis Related Group (DRGs) admitted through the emergency department and discharged from a medical unit from September 22, 2014 to August 31, 2017. These criteria mirrored those in the ACE unit. Older adults requiring specialized care (eg, those with myocardial infarct) were excluded, as were those with billing codes for mechanical ventilation, admission to critical care units, or discharge to hospice. Because one of our outcomes was readmission, we excluded patients who died during hospitalization. Patient characteristics collected included demographics and insurance category. To evaluate comorbidity burden, we collected ICD-9/ICD-10 diagnostic codes and generated a combined comorbidity score as described by Gagne, et al.21 This score was devised to predict mortality and 30-day readmissions and had better predictive ability in elders than the Elixhauser or Charlson scores. Scores ranged from −2 to 26, although values >20 are rare.
Exposure
Subjects were categorized as either discharged from the ACE or discharged from usual care. ACE discharges were tracked daily on a spreadsheet that was linked into our sample of eligible subjects.
Outcomes
Total cost of hospitalization (direct plus indirect costs), LOS, and all-cause 30-day readmissions were queried from the same billing database.
Statistical Analysis
As this study was a quality improvement project, analyses were descriptive and exploratory; no statistical hypothesis testing was conducted. We initially evaluated subject characteristics and comorbidities across study groups to determine group balance and comparability using means and standard deviations for continuous data and frequencies and percentages for categorical data. To analyze total cost and LOS, we utilized quantile regression with clustered standard errors to account for clustering by patient. We calculated the median difference between hospitalization cost and LOS for usual care versus ACE patients (with ACE as the referent group). To explore variations across the distributions of outcomes, we determined differences in cost and LOS and their 95% confidence intervals at the 25th, 50th, 75th, and 90th percentiles. Thirty-day readmission risk was estimated using a generalized estimating equation model with a logit link and binomial family. Readmission risk is presented along with 95% confidence intervals. For all models, we initially evaluated change over time (by quarter). After establishing the absence of time trends, we collapsed results into a comparison of usual care versus ACE care. Model estimates are presented both unadjusted and adjusted for age and comorbidity score. Following our initial analyses of cost, LOS, and 30-day readmission risk; we explored differences across quartiles of combined comorbidity scores. We used the same unadjusted models described above but incorporated an interaction term to generate estimates stratified by quartile of comorbidity score. We performed two additional analyses to evaluate the robustness of our findings. First, because hemiplegia prevalence was higher in the usual-care group than in the ACE group and can result in higher cost of care, we repeated the analysis after excluding those patients with hemiplegia. Second, because we were unable to control for functional capacity in the entire sample, we evaluated group differences in mobility for a subsample obtained prior to October 2015 using ICD-9 diagnostic codes, which can be considered surrogate markers for mobility.22 The results of our first analysis did not substantively change our main findings; in our second analysis, groups were balanced by mobility factors which suggested that confounding by functional capacity would be limited in our full sample. The results of these analyses are reported in the supplemental material.
Analysis was completed using Stata v15.1 (StataCorp, LP College Station, Texas). The Baystate Medical Center Institutional Review Board determined that the initiative was quality improvement and “not research.”
RESULTS
A total of 13,209 patients met the initial inclusion criteria; 1,621 were excluded, resulting in a sample of 11,588 patients. Over the 3-year study period, 1,429 (12.3%) were discharged from ACE and 10,159 (87.7%) were discharged from usual care. The groups were similar in age, sex, race and insurance status. Compared with the usual-care group, ACE patients had a higher median comorbidity score (3 vs 2 for usual care) and higher rates for anemia, dementia, fluid and electrolyte disorders, hypertension, and chronic obstructive pulmonary disease (COPD). However, ACE patients had lower rates of hemiplegia (0.9% vs 3%), arrhythmias, and pulmonary circulation disorders than those with usual care (Table 1).
The median cost per ACE patient was slightly lower at $6,258 (interquartile range [IQR] = $4,683-$8,547) versus $6,858 (IQR = $4,855-$10,478) in usual care. Across the cost distribution, the ACE program had lower costs than usual care; however, these differences became more pronounced at the higher end of the distribution. For example, compared with the ACE group, the usual-care group’s unadjusted cost difference was $171 higher at the 25th percentile, $600 higher at the median, $1,932 higher at the 75th percentile, and $3,687 higher at the 90th percentile. The ACE median LOS was 3.7 days (IQR = 2.7-5.0) compared with 3.8 days (IQR = 2.7-6.0) for non-ACE patients. Similar to cost, LOS differences rose at higher percentiles of the distribution, with shorter stays for the ACE patients within each grouping. Compared with the ACE group, the unadjusted LOS difference for usual-care patients ranged from 0 days at the 25th percentile to 0.2 day longer at the median, 1.0 day longer at the 75th percentile, and 1.9 days longer at the 90th percentile. For both cost and LOS models, estimates remained stable after adjusting for age and combined comorbidity score (Table 2).
We explored the impact of increasing comorbidity burden on these outcomes using the following quartiles of the combined comorbidity score: −2 to 0 (387 ACE vs 3,322 usual-care patients), 1 to 2 (264 ACE vs 1,856 usual-care patients), 3 to 5 (476 ACE vs 2,859 usual-care patients), and 6 to 15 (301 ACE vs 2,122 usual-care patients). It was not surprising that cost and LOS paralleled each other, with the greatest cost and LOS benefits in the highest quartile of the combined comorbidity score (Figure 1). For example, at the 90th percentile, the cost difference approached $6,000 higher for the usual-care group in the top quartile of combined comorbidity score compared with nearly $3,000 higher for the lowest quartile. Similarly, at the 90th percentile, LOS for usual-care patients was 2.9 days longer at the top quartile compared with 1.7 days longer at the lowest quartile.
The all-cause 30-day readmission risk was similar for both groups, with an absolute risk difference of −0.7% (95% CI = −2.6% to 1.3%). Adjustment for age and comorbidity score did not substantially change this result. Following stratification by quartile of combined comorbidity scores, we observed similar readmission risks at each quartile (Figure 2).
DISCUSSION
This quality improvement initiative evaluated which ACE admissions yielded the greatest value and found the largest reductions in LOS and cost in patients with the greatest comorbidity scores (frequently referred to as “high need, high cost”).23,24 Based on prior literature, we had anticipated that moderate risk patients would show the maximum benefit.15,25 In contrast to our findings, a University of Alabama (UAB) ACE program subgroup analysis using the CMS Case Mix Index (CMI) found a cost reduction for patients with low or intermediate CMI scores but not for those with high scores.15 The Hospital Elder Life Program (HELP) has yielded maximal impact for patients at moderate risk for delirium.26 Our results are supported by a University of Texas, Houston, study revealing lower LOS and cost for ACE patients, despite high CMI scores and endemic frailty, although it did not report outcomes across a range of comorbidities or costs.27 Our results may be determined by the specific characteristics of the Baystate ACE initiative. Our emphasis on considering prognosis and encouraging advance care planning could have contributed to the improved metrics for more complicated patients. It is possible that patients with high comorbidity burden were more likely to screen in with the surprise question, leading to more frequent goals of care discussions by the hospitalists or geriatrics team, which, in turn, may have resulted in less aggressive care and consequently lower costs. The emphasis on prognosis and palliative care was not a feature of the UAB or Texas studies. Additional components, such as the delirium screening and the presence of volunteer advocates, could also have impacted the results. Our tiered approach during rounds with rapid reviews for most patients and longer discussions for those at highest risk may have further contributed to the findings. Finally, although we did not track the recommendation acceptance rate for the entire study period, in the first 9 months of the project, 9,325 recommendations were made with an acceptance rate of >85%. We previously reported a similar acceptance rate for medication recommendations.28 Another factor contributing to our results may be the ways in which we categorized patients and calculated costs. We used the Gagne combined comorbidity score, which includes only prior conditions;21 the UAB study used CMI, which includes severity of presenting illness and complications, as well as baseline comorbidities. We also compared total cost, while UAB reported variable direct cost.
This study has a number of limitations. First, it was conducted at a single site and may not apply to other hospitals. Second, as a quality improvement program, its design, processes, and personnel evolved over time, and, as in any multicomponent initiative, the effect of individual factors on the outcomes is unknown. Third, this is an observational study with the aim of generating hypotheses for more rigorous studies in the future and residual confounding factors may exist despite efforts to adjust for variables present in an administrative database. Thus, we were unable to completely adjust for potentially important social factors, presence of delirium, or baseline functional status.
To our knowledge, this study is the first report on the differential impact of comorbidity scores and cost distribution on ACE total cost and LOS reductions. Despite its limitations, it contributes to the existing literature by suggesting that the Gagne comorbidity score can help identify which admissions will yield the greatest value. The Gagne score could be calculated at admission using the ePrognosis risk calculator or incorporated and automated in the EMR.29 Many health systems are reluctant to designate beds for specific subpopulations since doing so decreases flexibility and complicates the admission process. A dynamic tension exists between increasing income streams now and generating future savings by supporting initiatives with upfront costs. Other successful acute care geriatrics programs, such as NICHE,30 HELP,31 MACE,32 and consultation teams, exist.33 Studies reporting the outcomes of combining ACE units with these other approaches in a “portfolio approach” will inform the design of the most efficient and impactful programs.34 Scrupulous attention to symptom control and advance care planning are key features of our program, and, given the high prevalence of advanced serious illness in hospitalized older adults, this consideration may be critical for success.
As ACE units can only care for a small fraction of hospitalized older adults, determining which patients will maximally benefit from the structured, team-based care on ACE units is crucial. We found that the greatest impact on LOS and costs occurred in the subgroup with the highest comorbidity scores and overall cost. ACE care for the most vulnerable patients appeared to yield the greatest value for the system; thus, these older adults may need to be prioritized for admission. This improvement may enhance quality and value outcomes, maximize a scarce resource, and secure results needed to sustain the “clinician-led and data-driven” ACE model in the face of changing clinical and financial landscapes.35
Acknowledgments
All those with significant contributions to this work are included as authors.
The authors express their deep appreciation to all their Baystate collaborators, particularly to Rebecca Starr, MD, the first geriatrics medical director of the program, Ms. Virginia Chipps, RN, the program’s first nurse manager, and Tasmiah Chowdhury, PharmD, the program’s first pharmacist. We are also deeply grateful to those persons who provided programmatic advice and input on model ACE programs elsewhere, including Kyle Allen, MD, Michael Malone MD, Robert Palmer MD, and, especially, Kellie Flood, MD.
Disclosures
None of the authors have any existing or potential personal or financial conflicts relevant to this paper to report.
Funding
This work was supported in part by a Geriatric Workforce Enhancement Program award (grant # U1QHP28702) from the Health Resources and Services Administration and by internal support from Baystate Health
1. National Hospital Survey: number and rate of hospital discharge 2010 table. 2010; https://www.cdc.gov/nchs/fastats/hospital.htm. Accessed February, 10th 2019.
2. Brennan TA, Leape LL, Laird NM, Hebert L, Localio AR, Lawthers AG, Newhouse JP, Weiler PC, Hiatt HH. Incidence of adverse events and negligence in hospitalized patients. results of the Harvard medical practice study I. N Engl J Med. 1991;324(6):370-376. https://doi.org/10.1056/NEJM199102073240604.
3. Creditor MC. Hazards of hospitalization of the elderly. Ann Intern Med. 1993;118(3):219-223. PubMed
4. Levinson D. Adverse vents in hospitals: National incidence among Medicare beneficiaries; US Department of Health and Human Services, Office of the Inspector General 2010. Accessed February, 10th, 2019.
5. Palmer RM, Counsell S, Landefeld CS. Clinical intervention trials: the ACE unit. Clin Geriatr Med. 1998;14(4):831-849. PubMed
6. Landefeld CS. Foreword. In: Malone ML, Palmer MR, Capezuti E, eds. Acute Care for Elders New York Humana Press; 2014:v-xii.
7. Fox MT, Persaud M, Maimets I, O’Brien K, Brooks D, Tregunno D, Schraa E. Effectiveness of acute geriatric unit care using acute care for elders components: a systematic review and meta-analysis. J Am Geriatr Soc. 2012;60(12):2237-2245. https://doi.org/10.1111/jgs.12028.
8. Landefeld CS, Palmer RM, Kresevic DM, Fortinsky RH, Kowal J. A randomized trial of care in a hospital medical unit especially designed to improve the functional outcomes of acutely ill older patients. N Engl J Med. 1995;332(20):1338-1344. https://doi.org/10.1056/NEJM199505183322006.
9. Covinsky KE, King JT, Jr., Quinn LM, Siddique R, Palmer R, Kresevic DM, Fortinsky RH, Kowal J, Landefeld CS. Do acute care for elders units increase hospital costs? A cost analysis using the hospital perspective. J Am Geriatr Soc. 1997;45(6):729-734. PubMed
10. Counsell SR, Holder CM, Liebenauer LL, Palmer RM, Fortinsky RH, Kresevic DM, Quinn LM, Allen KR, Covinsky KE, Landefeld CS. Effects of a multicomponent intervention on functional outcomes and process of care in hospitalized older patients: a randomized controlled trial of Acute Care for Elders (ACE) in a community hospital. J Am Geriatr Soc. 2000;48(12):1572-1581. PubMed
11. Asplund K, Gustafson Y, Jacobsson C, Bucht G, Wahlin A, Peterson J, Blom JO, Angquist KA. Geriatric-based versus general wards for older acute medical patients: a randomized comparison of outcomes and use of resources. J Am Geriatr Soc. 2000;48(11):1381-1388. PubMed
12. Saltvedt I, Mo ES, Fayers P, Kaasa S, Sletvold O. Reduced mortality in treating acutely sick, frail older patients in a geriatric evaluation and management unit. A prospective randomized trial. J Am Geriatr Soc. 2002;50(5):792-798. PubMed
13. Jayadevappa R, Chhatre S, Weiner M, Raziano DB. Health resource utilization and medical care cost of Acute Care Elderly unit patients. Value Health. 2006;9(3):186-192. https://doi.org/10.1111/j.1524-4733.2006.00099.x.
14. Barnes DE, Palmer RM, Kresevic DM, Fortinsky RH, Kowal J, Chren MM, Landefeld CS. Acute Care for Elders units produced shorter hospital stays at lower cost while maintaining patients’ functional status. Health Aff (Millwood). 2012;31(6):1227-1236. https://doi.org/10.1377/hlthaff.2012.0142.
15. Flood KL, Maclennan PA, McGrew D, Green D, Dodd C, Brown CJ. Effects of an Acute Care for Elders unit on costs and 30-day readmissions. JAMA Intern Med. 2013;173(11):981-987. https://doi.org/10.1001/jamainternmed.2013.524.
16. Fox MT, Sidani S, Persaud M, Tregunno D, Maimets I, Brooks D, O’Brien K. Acute Care for Elders components of acute geriatric unit care: systematic descriptive review. J Am Geriatr Soc. 2013;61(6):939-946. https://doi.org/10.1111/jgs.12282.
17. Palmer MR, Kresevic DM. The Acute Care for Elders unit In: Malone ML, Palmer MR, Capezuti E, eds. Acute Care for Elders New York: Humana Press 2014:92.
18. Pierluissi E, Francis D, Covinsky KE. Patient and hospital factors that lead to adverse outcomes in hospitalized elders In: Malone ML, Palmer MR, Capezuti E, eds. Acute Care for Elders New York: Humana Press 2014:42.
19. Fulmer T. How to try this: Fulmer SPICES. Am J Nurs. 2007;107(10):40-48; quiz 48-49. https://doi.org/10.1097/01.NAJ.0000292197.76076.e1.
20. Downar J, Goldman R, Pinto R, Englesakis M, Adhikari NK. The “surprise question” for predicting death in seriously ill patients: a systematic review and meta-analysis. CMAJ. 2017;189(13):E484-E493. https://doi.org/10.1503/cmaj.160775.
21. Gagne JJ, Glynn RJ, Avorn J, Levin R, Schneeweiss S. A combined comorbidity score predicted mortality in elderly patients better than existing scores. J Clin Epidemiol. 2010;64(7):749-759. doi: 10.1016/j.jclinepi.2010.10.004.
22. Segal JB, Chang HY, Du Y, Walston JD, Carlson MC, Varadhan R. Development of a claims-based frailty indicator anchored to a well-established frailty phenotype. Med Care. 2017;55(7):716-722. https://doi.org/10.1097/MLR.0000000000000729.
23. Blumenthal D, Chernof B, Fulmer T, Lumpkin J, Selberg J. Caring for high-need, high-cost patients - an urgent priority. N Engl J Med. 2016;375(10):909-911. https://doi.org/10.1056/NEJMp1804276.
24. Blumenthal D. Caring for high-need, high-cost patients: what makes for a successful care management program? . https://www.commonwealthfund.org/publications/journal-article/2016/jul/caring-high-need-high-cost-patients-urgent-priority. Accessed March, 20th 2019.
25. Ahmed NN, Pearce SE. Acute Care for the Elderly: a literature review. Popul Health Manag. 2010;13(4):219-225. https://doi.org/10.1089/pop.2009.0058.
26. Inouye SK, Bogardus ST, Jr., Charpentier PA, Leo-Summers L, Acampora D, Holford TR, Cooney LM, Jr. A multicomponent intervention to prevent delirium in hospitalized older patients. N Engl J Med. 1999;340(9):669-676. https://doi.org/10.1056/NEJM199903043400901.
27. Ahmed N, Taylor K, McDaniel Y, Dyer CB. The role of an Acute Care for the Elderly unit in achieving hospital quality indicators while caring for frail hospitalized elders. Popul Health Manag. 2012;15(4):236-240. https://doi.org/10.1089/pop.2011.0055.
28. Chowdhury TP, Starr R, Brennan M, Knee A, Ehresman M, Velayutham L, Malanowski AJ, Courtney HA, Stefan MS. A quality improvement initiative to improve medication management in an Acute Care for Elders program through integration of a clinical pharmacist. J Pharm Pract. 2018:897190018786618. https://doi.org/10.1177/0897190018786618.
29. Lee S, Smith A, Widera E. ePrognosis -Gagne index. https://eprognosis.ucsf.edu/gagne.php. Accessed March 20th, 2019.
30. Turner JT, Lee V, Fletcher K, Hudson K, Barton D. Measuring quality of care with an inpatient elderly population. The geriatric resource nurse model. J Gerontol Nurs. 2001;27(3):8-18. PubMed
31. Hshieh TT, Yang T, Gartaganis SL, Yue J, Inouye SK. Hospital Elder Life Program: systematic review and meta-analysis of effectiveness. Am J Geriatr Psychiatry. 2018;26(10):1015-1033. https://doi.org/10.1016/j.jagp.2018.06.007.
32. Hung WW, Ross JS, Farber J, Siu AL. Evaluation of the Mobile Acute Care of the Elderly (MACE) service. JAMA Intern Med. 2013;173(11):990-996. https://doi.org/10.1001/jamainternmed.2013.478.
33. Sennour Y, Counsell SR, Jones J, Weiner M. Development and implementation of a proactive geriatrics consultation model in collaboration with hospitalists. J Am Geriatr Soc. 2009;57(11):2139-2145. https://doi.org/10.1111/j.1532-5415.2009.02496.x.
34. Capezuti E, Boltz M. An overview of hospital-based models of care. In: Malone ML, Palmer MR, Capezuti E, eds. Acute Care for Elders. New York: Humana Press 2014:49-68.
35. Malone ML, Yoo JW, Goodwin SJ. An introduction to the Acute Care for Elders In: Malone ML, Palmer MR, Capezuti E, eds. Acute Care for Elders New York: Humana Press 2014:1-9.
© 2019 Society of Hospital Medicine
Retrospective Cohort Study of the Prevalence of Off-label Gabapentinoid Prescriptions in Hospitalized Medical Patients
In the1990s, gabapentin was licensed in the United States as an anticonvulsant and it became widely successful in the mid-2000s when marketed for the treatment of pain. Since then, prescriptions for gabapentinoids have accelerated dramatically.1,2 Between 2012 and 2016, the total spending on pregabalin in the United States increased from $1.9 to $4.4 billion, with pregabalin ranking eighth overall for specific drug spending.3
Despite a finite number of indications, there has been a steady rise in off-label use, with an increased risk of adverse drug events (ADEs).4,5 Several meta-analyses suggest either low-quality or no evidence of benefit for gabapentinoid use in settings including neuropathic pain in cancer, sciatica, and chronic low back pain.6-8 Lack of efficacy is compounded by adverse effects such as altered mental status, fluid retention, sedation, and increased risk of traumatic falls in older adults.6,9,10 Finally, dependency is a concern; opioids are coprescribed in up to 50% of patients,11 increasing the odds of opioid-related death by up to 60%.12
To better characterize gabapentinoid use in hospitalized patients, we analyzed a retrospective cohort of patients admitted to our tertiary care medical teaching unit, examining preadmission and in-hospital prescribing trends, off-label use, and deprescribing.
METHODS
Patient data were collected from a retrospective cohort, including all consecutive admissions to our 52-bed medical clinical teaching unit in Montréal, Canada, since December 2013.13 We reviewed admissions between December 17, 2013 and June 30, 2017 and identified three populations of gabapentinoid users from medication reconciliation documents: preadmission users continued at discharge, preadmission users deprescribed in hospital, and new in-hospital users continued at discharge. Deprescribing was defined as having the drug stopped at discharge or a prescribed taper that included stopping. The term “gabapentinoid users” refers to preadmission gabapentinoid use.
Gabapentinoid users were compared with nonusers with regard to demographic characteristics; select comorbidities; coprescription of opioids, benzodiazepines, and Z-drugs; length of stay (LOS); and inpatient mortality. Only the first eligible admission per patient was considered. Patients who had multiple admissions over the period of interest were classified as “users” in the patient-level analyses if they were taking a gabapentinoid at home or at discharge on at least one admission.
Doses and indications were collected from medication reconciliation performed by a clinical pharmacist, which included an interview with the patient or a proxy and a review of the indications for all drugs. These data were merged with any additional potential indications found in the admission notes (listing all chronic conditions from a detailed medical history) and review of the electronic medical record. The US Food and Drug Administration (FDA) approved the indications and the recommended doses were taken from product monographs and compared with doses prescribed to patients. When documented, the reason for new prescriptions and justification for deprescribing at discharge were manually abstracted from discharge summaries and medication reconciliation documents.
Continuous variables were expressed as median and interquartile range (IQR) and compared using the Wilcoxon rank-sum test. Categorical variables were compared using the χ2 test. Proportions of gabapentinoid use and deprescribing, including 95% confidence intervals around each proportion, were plotted and linear regression was performed versus fiscal quarter to evaluate for temporal trends. A two-sided α value of 0.05 was considered to be statistically significant. Statistical analyses were performed using Stata version 15 (StataCorp LLC, College Station, Texas). The McGill University Health Centre Research Ethics Board approved this study.
RESULTS
A total of 4,103 unique patients were admitted from December 2013 to July 2017, of whom 550 (13.4%) were receiving a gabapentinoid before admission. Two preadmission users were coprescribed gabapentin and pregabalin for a total of 552 prescriptions. The prevalence of preadmission gabapentinoid use remained steady during the period of interest (Appendix 1; P = .29 for temporal trend). There were no significant differences between gabapentinoid users and nonusers with regard to age or sex, but users had a higher prevalence of chronic disease (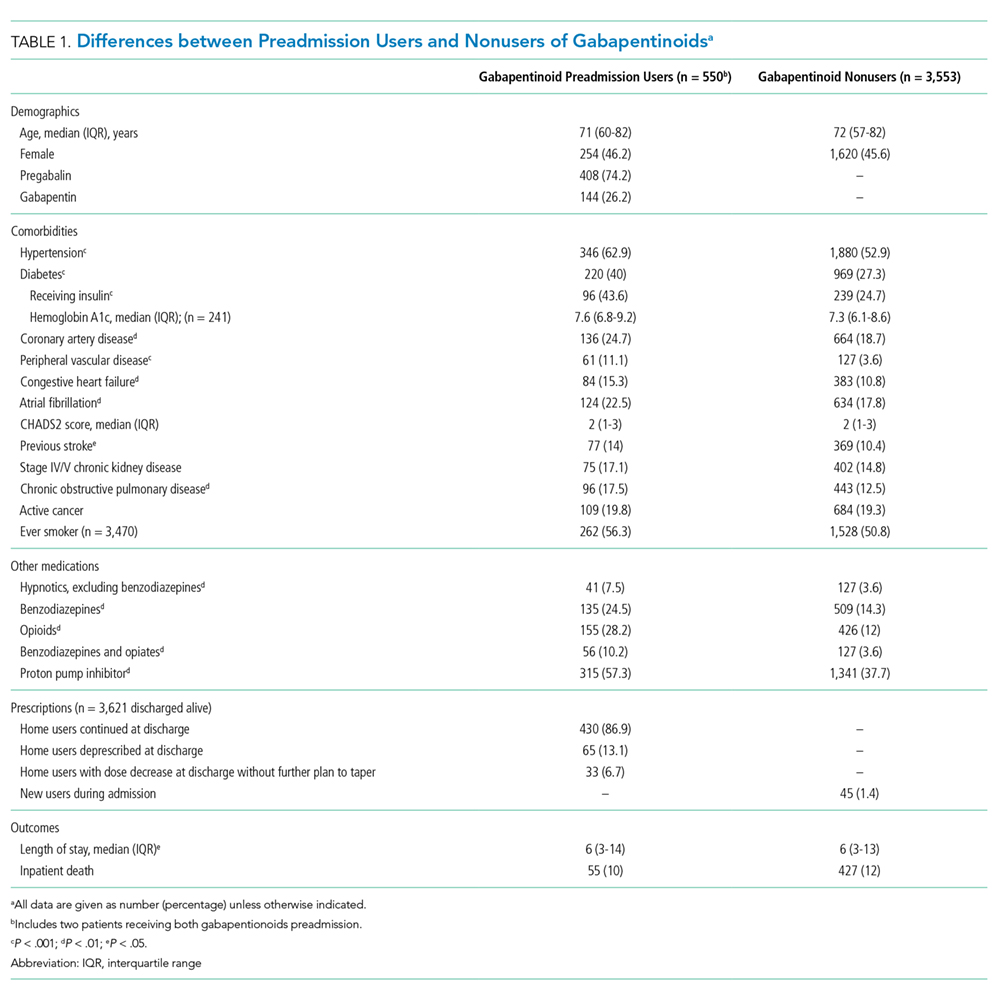
The indications for gabapentinoid use are presented in Table 2. Only a minority (17% or 94/552) had an approved indication. Among these 94 patients, 38 (40%) received FDA-recommended doses, 47 (50%) received doses below those demonstrated to be effective, and 9 (10%) received higher-than-recommended doses. New prescriptions at discharge were observed in 1.5% of patients, with the majority given for off-label indications (Appendix 2).
DISCUSSION
In this large cohort study of hospitalized medical patients, preadmission gabapentinoid use was present in one in every eight admitted patients. Most patients had off-label indications, including the small number of patients who had the drug started in hospital. Even for approved indications, the doses were often lower than what trials have suggested to be effective. Finally, although we have demonstrated that deprescribing occurred, it was uncommon and either precipitated by an adverse event or the justification was poorly documented.
To our knowledge, our study is one of the first to examine what happens to gabapentinoids in hospitalized patients and we present important new data with respect to dosing and prescribing patterns. The low rates of discontinuation, intent to taper, or dose decreases in our cohort represent a potential area of improvement in deprescribing.
Deprescribing should be considered for patients with serious adverse events, for whom less serious adverse effects preclude achieving clinically effective doses, and for those who do not perceive benefit. Given the magnitude of the problems presented by polypharmacy, we propose that stopping priority be given to off-label use (especially when clinically ineffective) and for patients coprescribed opioids or sedatives. Up to a third of users in our cohort were coprescribed opioids or benzodiazepines, which is particularly concerning given the association with increased opioid-related mortality.12,15 Although we did not observe a difference in inpatient mortality, such a study is underpowered for this outcome especially when considering the competing risks of death in hospital. Importantly, when deprescribing, the drug should be tapered over several weeks to limit symptoms of withdrawal and to prevent seizure.11
Presumed off-label use and subtherapeutic doses were common in our cohort, with only 17% of users having a clearly documented FDA-approved indication, in agreement with a previous study that reported only 5% on-label use.4 High doses of gabapentinoids required for efficacy in clinical trials may be difficult to achieve because of dose-limiting side effects, which may explain the relatively low median doses recorded in our real-world cohort. Another possibility is that frail, older patients with renal dysfunction experience effectiveness at lower median doses than those quoted from study populations. In our study, patients on lower doses of gabapentinoids had a higher prevalence of stage IV or V chronic kidney disease (CKD). Stage IV/V CKD was identified in 16/47 (34.0%) patients on lower doses of gabapentinoids, compared to 4/38 (10.5%) on doses within the FDA-recommended range.
Our study has limitations; findings from a single Canadian tertiary care hospital may not be generalizable to other hospitals or countries, particularly given the differences between the Canadian and US health systems. Indications were extracted from the patient chart and even with the best possible medication history and thorough review, sometimes they had to be inferred. Caution should also be exercised when interpreting the omission of an indication as equating to a lack of justifiable medication use; however, the rate of off-label use in our cohort is in agreement with prior research.4 Moreover, with a retrospective design, the effectiveness of the drug on an individual basis could not be assessed, which would have allowed a more precise estimate of the proportion of patients for whom deprescribing might have been appropriate. The strengths of this study include a large sample of real-world, heterogeneous, general medical patients spanning several years and our use of trained pharmacists and physicians to determine the drug indication as opposed to reliance on administrative data.
CONCLUSION
Gabapentinoid use was frequent in our cohort of hospitalized medical patients, with a high prevalence of off-label use, subtherapeutic doses, and coadministration with opioids and benzodiazepines. Deprescribing at discharge was uncommon and often triggered by an adverse event. The identification of gabapentinoids during hospitalization is an opportunity to reevaluate the indication for the drug, assess for effectiveness, and consider deprescribing to help reduce polypharmacy and ideally ADEs.
Acknowledgment
For the purposes of authorship, Dr. McDonald and Dr. Lee contributed equally.
Disclosures
Dr. Emily McDonald and Dr. Todd Lee have a patent pending for MedSafer, a deprescribing software, and both receive research salary support from the Fonds de Recherche Santé du Québec. Dr. Gingras, Dr. Lieu, and Dr. Papillon-Ferland have nothing to disclose.
1. Johansen ME. Gabapentinoid use in the United States 2002 through 2015. JAMA Intern Med. 2018;178(2):292-294. https://doi.org/10.1001/jamainternmed.2017.7856.
2. Kwok H, Khuu W, Fernandes K, et al. Impact of unrestricted access to pregabalin on the use of opioids and other CNS-active medications: a cross-sectional time series analysis. Pain Med. 2017;18(6):1019-1026. https://doi.org/10.1093/pm/pnw351.
3. Medicines use and spending in the U.S. — a review of 2016 and outlook to 2021: IMS Institute for Healthcare Informatics; 2017. https://structurecms-staging-psyclone.netdna-ssl.com/client_assets/dwonk/media/attachments/590c/6aa0/6970/2d2d/4182/0000/590c6aa069702d2d41820000.pdf?1493985952. Accessed March 21, 2019.
4. Hamer AM, Haxby DG, McFarland BH, Ketchum K. Gabapentin use in a managed medicaid population. J Manag Care Pharm. 2002;8(4):266-271. doi: 10.18553/jmcp.2002.8.4.266.
5. Eguale T, Buckeridge DL, Verma A, et al. Association of off-label drug use and adverse drug events in an adult population. JAMA Intern Med. 2016;176(1):55-63. https://doi.org/10.1001/jamainternmed.2015.6058.
6. Shanthanna H, Gilron I, Rajarathinam M, et al. Benefits and safety of gabapentinoids in chronic low back pain: a systematic review and meta-analysis of randomized controlled trials. PLoS Med. 2017;14(8):e1002369. https://doi.org/10.1371/journal.pmed.1002369.
7. Enke O, New HA, New CH, et al. Anticonvulsants in the treatment of low back pain and lumbar radicular pain: a systematic review and meta-analysis. CMAJ. 2018;190(26):E786-E793. https://doi.org/10.1503/cmaj.171333.
8. Kane CM, Mulvey MR, Wright S, Craigs C, Wright JM, Bennett MI. Opioids combined with antidepressants or antiepileptic drugs for cancer pain: systematic review and meta-analysis. Palliat Med. 2018;32(1):276-286. https://doi.org/10.1177/0269216317711826.
9. Zaccara G, Perucca P, Gangemi PF. The adverse event profile of pregabalin across different disorders: a meta-analysis. Eur J Clin Pharmacol. 2012;68(6):903-912. https://doi.org/10.1007/s00228-012-1213-x.
10. Huang AR, Mallet L, Rochefort CM, Eguale T, Buckeridge DL, Tamblyn R. Medication-related falls in the elderly: causative factors and preventive strategies. Drugs Aging. 2012;29(5):359-376. https://doi.org/10.2165/11599460-000000000-00000.
11. Evoy KE, Morrison MD, Saklad SR. Abuse and misuse of pregabalin and gabapentin. Drugs. 2017;77(4):403-426. https://doi.org/10.1007/s40265-017-0700-x.
12. Gomes T, Juurlink DN, Antoniou T, Mamdani MM, Paterson JM, van den Brink W. Gabapentin, opioids, and the risk of opioid-related death: a population-based nested case-control study. PLoS Med. 2017;14(10):e1002396. https://doi.org/10.1371/journal.pmed.1002396.
13. McDonald EG, Saleh RR, Lee TC. Ezetimibe use remains common among medical inpatients. Am J Med. 2015;128(2):193-195. https://doi.org/10.1016/j.amjmed.2014.10.016.
14. U.S. Food and Drug Administration. LYRICA - Highlights of Prescribing Information 2012. https://www.accessdata.fda.gov/drugsatfda_docs/label/2012/021446s028lbl.pdf. Accessed April 30, 2019.
15. U.S. Food and Drug Administration. NEURONTIN - Highlights of Prescribing Information 2017. https://www.accessdata.fda.gov/drugsatfda_docs/label/2017/020235s064_020882s047_021129s046lbl.pdf. Accessed April 30, 2019.
16. Gomes T, Greaves S, van den Brink W, et al. Pregabalin and the risk for opioid-related death: a nested case–control study. Ann Intern Med. 2018;169(10):732-734. https://doi.org/10.7326/M18-1136.
In the1990s, gabapentin was licensed in the United States as an anticonvulsant and it became widely successful in the mid-2000s when marketed for the treatment of pain. Since then, prescriptions for gabapentinoids have accelerated dramatically.1,2 Between 2012 and 2016, the total spending on pregabalin in the United States increased from $1.9 to $4.4 billion, with pregabalin ranking eighth overall for specific drug spending.3
Despite a finite number of indications, there has been a steady rise in off-label use, with an increased risk of adverse drug events (ADEs).4,5 Several meta-analyses suggest either low-quality or no evidence of benefit for gabapentinoid use in settings including neuropathic pain in cancer, sciatica, and chronic low back pain.6-8 Lack of efficacy is compounded by adverse effects such as altered mental status, fluid retention, sedation, and increased risk of traumatic falls in older adults.6,9,10 Finally, dependency is a concern; opioids are coprescribed in up to 50% of patients,11 increasing the odds of opioid-related death by up to 60%.12
To better characterize gabapentinoid use in hospitalized patients, we analyzed a retrospective cohort of patients admitted to our tertiary care medical teaching unit, examining preadmission and in-hospital prescribing trends, off-label use, and deprescribing.
METHODS
Patient data were collected from a retrospective cohort, including all consecutive admissions to our 52-bed medical clinical teaching unit in Montréal, Canada, since December 2013.13 We reviewed admissions between December 17, 2013 and June 30, 2017 and identified three populations of gabapentinoid users from medication reconciliation documents: preadmission users continued at discharge, preadmission users deprescribed in hospital, and new in-hospital users continued at discharge. Deprescribing was defined as having the drug stopped at discharge or a prescribed taper that included stopping. The term “gabapentinoid users” refers to preadmission gabapentinoid use.
Gabapentinoid users were compared with nonusers with regard to demographic characteristics; select comorbidities; coprescription of opioids, benzodiazepines, and Z-drugs; length of stay (LOS); and inpatient mortality. Only the first eligible admission per patient was considered. Patients who had multiple admissions over the period of interest were classified as “users” in the patient-level analyses if they were taking a gabapentinoid at home or at discharge on at least one admission.
Doses and indications were collected from medication reconciliation performed by a clinical pharmacist, which included an interview with the patient or a proxy and a review of the indications for all drugs. These data were merged with any additional potential indications found in the admission notes (listing all chronic conditions from a detailed medical history) and review of the electronic medical record. The US Food and Drug Administration (FDA) approved the indications and the recommended doses were taken from product monographs and compared with doses prescribed to patients. When documented, the reason for new prescriptions and justification for deprescribing at discharge were manually abstracted from discharge summaries and medication reconciliation documents.
Continuous variables were expressed as median and interquartile range (IQR) and compared using the Wilcoxon rank-sum test. Categorical variables were compared using the χ2 test. Proportions of gabapentinoid use and deprescribing, including 95% confidence intervals around each proportion, were plotted and linear regression was performed versus fiscal quarter to evaluate for temporal trends. A two-sided α value of 0.05 was considered to be statistically significant. Statistical analyses were performed using Stata version 15 (StataCorp LLC, College Station, Texas). The McGill University Health Centre Research Ethics Board approved this study.
RESULTS
A total of 4,103 unique patients were admitted from December 2013 to July 2017, of whom 550 (13.4%) were receiving a gabapentinoid before admission. Two preadmission users were coprescribed gabapentin and pregabalin for a total of 552 prescriptions. The prevalence of preadmission gabapentinoid use remained steady during the period of interest (Appendix 1; P = .29 for temporal trend). There were no significant differences between gabapentinoid users and nonusers with regard to age or sex, but users had a higher prevalence of chronic disease (
The indications for gabapentinoid use are presented in Table 2. Only a minority (17% or 94/552) had an approved indication. Among these 94 patients, 38 (40%) received FDA-recommended doses, 47 (50%) received doses below those demonstrated to be effective, and 9 (10%) received higher-than-recommended doses. New prescriptions at discharge were observed in 1.5% of patients, with the majority given for off-label indications (Appendix 2).
DISCUSSION
In this large cohort study of hospitalized medical patients, preadmission gabapentinoid use was present in one in every eight admitted patients. Most patients had off-label indications, including the small number of patients who had the drug started in hospital. Even for approved indications, the doses were often lower than what trials have suggested to be effective. Finally, although we have demonstrated that deprescribing occurred, it was uncommon and either precipitated by an adverse event or the justification was poorly documented.
To our knowledge, our study is one of the first to examine what happens to gabapentinoids in hospitalized patients and we present important new data with respect to dosing and prescribing patterns. The low rates of discontinuation, intent to taper, or dose decreases in our cohort represent a potential area of improvement in deprescribing.
Deprescribing should be considered for patients with serious adverse events, for whom less serious adverse effects preclude achieving clinically effective doses, and for those who do not perceive benefit. Given the magnitude of the problems presented by polypharmacy, we propose that stopping priority be given to off-label use (especially when clinically ineffective) and for patients coprescribed opioids or sedatives. Up to a third of users in our cohort were coprescribed opioids or benzodiazepines, which is particularly concerning given the association with increased opioid-related mortality.12,15 Although we did not observe a difference in inpatient mortality, such a study is underpowered for this outcome especially when considering the competing risks of death in hospital. Importantly, when deprescribing, the drug should be tapered over several weeks to limit symptoms of withdrawal and to prevent seizure.11
Presumed off-label use and subtherapeutic doses were common in our cohort, with only 17% of users having a clearly documented FDA-approved indication, in agreement with a previous study that reported only 5% on-label use.4 High doses of gabapentinoids required for efficacy in clinical trials may be difficult to achieve because of dose-limiting side effects, which may explain the relatively low median doses recorded in our real-world cohort. Another possibility is that frail, older patients with renal dysfunction experience effectiveness at lower median doses than those quoted from study populations. In our study, patients on lower doses of gabapentinoids had a higher prevalence of stage IV or V chronic kidney disease (CKD). Stage IV/V CKD was identified in 16/47 (34.0%) patients on lower doses of gabapentinoids, compared to 4/38 (10.5%) on doses within the FDA-recommended range.
Our study has limitations; findings from a single Canadian tertiary care hospital may not be generalizable to other hospitals or countries, particularly given the differences between the Canadian and US health systems. Indications were extracted from the patient chart and even with the best possible medication history and thorough review, sometimes they had to be inferred. Caution should also be exercised when interpreting the omission of an indication as equating to a lack of justifiable medication use; however, the rate of off-label use in our cohort is in agreement with prior research.4 Moreover, with a retrospective design, the effectiveness of the drug on an individual basis could not be assessed, which would have allowed a more precise estimate of the proportion of patients for whom deprescribing might have been appropriate. The strengths of this study include a large sample of real-world, heterogeneous, general medical patients spanning several years and our use of trained pharmacists and physicians to determine the drug indication as opposed to reliance on administrative data.
CONCLUSION
Gabapentinoid use was frequent in our cohort of hospitalized medical patients, with a high prevalence of off-label use, subtherapeutic doses, and coadministration with opioids and benzodiazepines. Deprescribing at discharge was uncommon and often triggered by an adverse event. The identification of gabapentinoids during hospitalization is an opportunity to reevaluate the indication for the drug, assess for effectiveness, and consider deprescribing to help reduce polypharmacy and ideally ADEs.
Acknowledgment
For the purposes of authorship, Dr. McDonald and Dr. Lee contributed equally.
Disclosures
Dr. Emily McDonald and Dr. Todd Lee have a patent pending for MedSafer, a deprescribing software, and both receive research salary support from the Fonds de Recherche Santé du Québec. Dr. Gingras, Dr. Lieu, and Dr. Papillon-Ferland have nothing to disclose.
1. Johansen ME. Gabapentinoid use in the United States 2002 through 2015. JAMA Intern Med. 2018;178(2):292-294. https://doi.org/10.1001/jamainternmed.2017.7856.
2. Kwok H, Khuu W, Fernandes K, et al. Impact of unrestricted access to pregabalin on the use of opioids and other CNS-active medications: a cross-sectional time series analysis. Pain Med. 2017;18(6):1019-1026. https://doi.org/10.1093/pm/pnw351.
3. Medicines use and spending in the U.S. — a review of 2016 and outlook to 2021: IMS Institute for Healthcare Informatics; 2017. https://structurecms-staging-psyclone.netdna-ssl.com/client_assets/dwonk/media/attachments/590c/6aa0/6970/2d2d/4182/0000/590c6aa069702d2d41820000.pdf?1493985952. Accessed March 21, 2019.
4. Hamer AM, Haxby DG, McFarland BH, Ketchum K. Gabapentin use in a managed medicaid population. J Manag Care Pharm. 2002;8(4):266-271. doi: 10.18553/jmcp.2002.8.4.266.
5. Eguale T, Buckeridge DL, Verma A, et al. Association of off-label drug use and adverse drug events in an adult population. JAMA Intern Med. 2016;176(1):55-63. https://doi.org/10.1001/jamainternmed.2015.6058.
6. Shanthanna H, Gilron I, Rajarathinam M, et al. Benefits and safety of gabapentinoids in chronic low back pain: a systematic review and meta-analysis of randomized controlled trials. PLoS Med. 2017;14(8):e1002369. https://doi.org/10.1371/journal.pmed.1002369.
7. Enke O, New HA, New CH, et al. Anticonvulsants in the treatment of low back pain and lumbar radicular pain: a systematic review and meta-analysis. CMAJ. 2018;190(26):E786-E793. https://doi.org/10.1503/cmaj.171333.
8. Kane CM, Mulvey MR, Wright S, Craigs C, Wright JM, Bennett MI. Opioids combined with antidepressants or antiepileptic drugs for cancer pain: systematic review and meta-analysis. Palliat Med. 2018;32(1):276-286. https://doi.org/10.1177/0269216317711826.
9. Zaccara G, Perucca P, Gangemi PF. The adverse event profile of pregabalin across different disorders: a meta-analysis. Eur J Clin Pharmacol. 2012;68(6):903-912. https://doi.org/10.1007/s00228-012-1213-x.
10. Huang AR, Mallet L, Rochefort CM, Eguale T, Buckeridge DL, Tamblyn R. Medication-related falls in the elderly: causative factors and preventive strategies. Drugs Aging. 2012;29(5):359-376. https://doi.org/10.2165/11599460-000000000-00000.
11. Evoy KE, Morrison MD, Saklad SR. Abuse and misuse of pregabalin and gabapentin. Drugs. 2017;77(4):403-426. https://doi.org/10.1007/s40265-017-0700-x.
12. Gomes T, Juurlink DN, Antoniou T, Mamdani MM, Paterson JM, van den Brink W. Gabapentin, opioids, and the risk of opioid-related death: a population-based nested case-control study. PLoS Med. 2017;14(10):e1002396. https://doi.org/10.1371/journal.pmed.1002396.
13. McDonald EG, Saleh RR, Lee TC. Ezetimibe use remains common among medical inpatients. Am J Med. 2015;128(2):193-195. https://doi.org/10.1016/j.amjmed.2014.10.016.
14. U.S. Food and Drug Administration. LYRICA - Highlights of Prescribing Information 2012. https://www.accessdata.fda.gov/drugsatfda_docs/label/2012/021446s028lbl.pdf. Accessed April 30, 2019.
15. U.S. Food and Drug Administration. NEURONTIN - Highlights of Prescribing Information 2017. https://www.accessdata.fda.gov/drugsatfda_docs/label/2017/020235s064_020882s047_021129s046lbl.pdf. Accessed April 30, 2019.
16. Gomes T, Greaves S, van den Brink W, et al. Pregabalin and the risk for opioid-related death: a nested case–control study. Ann Intern Med. 2018;169(10):732-734. https://doi.org/10.7326/M18-1136.
© 2019 Society of Hospital Medicine
Association of Herpes Simplex Virus Testing with Hospital Length of Stay for Infants ≤60 Days of Age Undergoing Evaluation for Meningitis
Neonatal herpes simplex virus (HSV) is associated with significant morbidity and mortality,1 particularly when the diagnosis or treatment is delayed.2 Therefore, many infants aged ≤60 days being evaluated for meningitis undergo cerebrospinal fluid (CSF) HSV polymerase chain reaction (PCR) testing even though the risk of HSV infection is low [estimated at 0.4% of those undergoing evaluation for central nervous system (CNS) infection].3 A single-center study demonstrated that CSF HSV PCR testing increases the hospital length of stay (LOS) for infants aged ≤56 days,4 although these single-center findings may not be generalizable. To this end, we measured the association between CSF HSV PCR testing and LOS in a multicenter cohort of hospitalized young infants.
METHODS
Study Design
We conducted a planned secondary analysis of a retrospective cohort of infants aged ≤60 days who presented to the emergency department (ED) between January 1, 2005 and December 31, 2013, enrolled in the Pediatric Emergency Medicine Collaborative Research Committee (PEM CRC) HSV study.3 Our study was limited to the 20 hospitals that contributed hospital LOS data. The study protocol was approved by each site’s institutional review board with permission for data sharing.
Study Population
Eligible infants were identified at each site using a site-specific electronic search strategy. Infants were eligible for inclusion if a CSF culture was obtained in the ED or within 24 hours of ED arrival. We excluded infants who were discharged from the ED and those with missing hospital LOS data.
Data Collection
Site investigators extracted the following data elements either electronically or from medical records: patient demographics; ED arrival date and time; hospital discharge date and time; urinalysis results; peripheral and CSF cell counts; blood, urine, and CSF bacterial culture results; as well as the results of HSV PCR and viral cultures. Infants with growth of a pathogen in blood or CSF, or a catheterized urine culture with ≥50,000 colony-forming units (CFUs)/mL of a single pathogenic bacteria, or 10,000-50,000 CFUs/mL of a single pathogenic bacteria with an abnormal urinalysis (ie, positive nitrite or leukocyte esterase on urine dipstick or >5 white blood cells [WBCs] per high power field on urine microscopy) were classified as having a serious bacterial infection (SBI).5,6 Infants with a positive HSV PCR or viral culture from any site were classified as having HSV infection.3 Hospitalized infants who did not have an HSV PCR test performed were assumed not to have HSV disease if not diagnosed during the hospital stay or repeat ED encounter.3
Outcome Measures
The primary outcome was hospital LOS, defined at all hospitals as the time from ED arrival to provider signature of the hospital discharge order, calculated in minutes and then converted into days.
Statistical Analysis
We described LOS using medians with interquartile ranges (IQR) and compared between infants with and without a CSF HSV PCR test performed using the Mann–Whitney U test. To evaluate the association between performance of CSF HSV PCR testing and hospital LOS, we used negative binomial regression given the count variable outcome (LOS) with an overdispersed distribution. For this analysis, we clustered by hospital after adjusting for the following factors determined a priori: age, gender, study year, and presence of serious bacterial or HSV infection. Using the relative marginal modeled estimates of LOS (tested vs not tested), we determined the percentage increase in LOS. We then repeated the analyses after stratifying by the location of testing (ie, in-house vs send-out), age (≤28 days vs 29-60 days), and presence or absence of CSF pleocytosis (defined as a CSF WBC of ≥16 cells/mm3for infants aged ≤28 days and ≥10 cells/mm3for infants aged 29-60 days),7 because infants aged 29-60 days and those without CSF pleocytosis are reported to be at very low risk for CNS HSV infection.3,8 We utilized Stata Data Analysis and Statistical Software, version 15.0 (StataCorp, Inc.; College Station, Texas) for statistical analyses.
RESULTS
Of 24,103 infants with CSF cultures obtained at the 20 participating sites, we excluded 2,673 (11.1%) discharged from the ED or with missing disposition and 934 (3.9%) with missing LOS, leaving a study cohort of 20,496 infants (Figure). Overall, 1,780 infants (8.7%) had an SBI and 99 (0.5%) had an HSV infection, of which 46 (46.5%) had a CNS HSV infection.
Among the 20,496 study infants, 7,399 (36.1%) had a CSF HSV PCR test performed; 5,935 infants (80.2% of those tested) had in-house and 1,464 (19.8%) had send-out testing. Among infants with available CSF cell counts, a CSF HSV PCR test was more commonly performed in infants with CSF pleocytosis than in those without (1,865/4,439 [42.0%] with CSF pleocytosis vs 3,705/12,002 [30.9%] without CSF pleocytosis; odds ratio [OR] 1.6, 95% CI 1.5-1.7). Of the 7,399 infants who had a CSF HSV PCR test performed, 46 (0.6%) had a positive test. Of the tested infants, 5,570 (75.3%) had an available CSF WBC count; a positive CSF HSV PCR test was more common in infants with CSF pleocytosis than in those without (25 positive tests/1,865 infants with CSF pleocytosis [1.3%] vs 9/3,705 [0.2%] without CSF pleocytosis; OR 5.6, 95% CI 2.6-12.0). Among the 5,308 infants aged 29-60 days without CSF pleocytosis, 1,110 (20.9%) had a CSF HSV PCR test performed and only one infant (0.09% of those tested) had a positive test.
Without adjustment, infants with a CSF HSV PCR test had a longer median LOS than infants who were not tested (2.5 vs 2.3 days; P < .001). After adjustment, infants with a CSF HSV PCR test performed had a 23% longer duration of hospitalization. The association between testing and LOS was similar for older vs younger infants, infants with and without CSF pleocytosis, and in-house vs send-out testing (Table).
DISCUSSION
In a large, multicenter cohort of more than 20,000 hospitalized infants aged ≤60 days undergoing evaluation for meningitis, we examined the association of CSF HSV PCR testing with hospital LOS. Approximately one-third of study infants had a CSF HSV PCR test obtained. After adjustment for patient- and hospital-level factors, the treating clinician’s decision to obtain a CSF HSV PCR test was associated with a 23% longer hospital LOS (nearly one-half day).
Our findings are consistent with those of previous studies. First, our observed association of the decision to obtain a CSF HSV PCR test and LOS was similar in magnitude to that of a previous single-center investigation.4 Second, we also found that older infants and those without CSF pleocytosis were at very low risk of HSV infection.3,8 For the otherwise low-risk infants, the longer LOS may be due to delays in obtaining CSF HSV PCR test results, which should be explored in future research. Our study has greater generalizability than previous single-center studies by substantially increasing the population size as well as the variety of clinical settings. Ensuring clinicians’ access to rapid HSV PCR testing platforms will further mitigate the impact of HSV testing on LOS.
When deciding to perform a CSF HSV PCR test for infants aged ≤60 days, clinicians must balance the low incidence of neonatal HSV3 with the risk of delayed diagnosis and treatment of HSV infection, which include neurologic sequelae or even death.1,2 As infants with CNS HSV infection commonly present nonspecifically and only a minority of infected infants have skin vesicles,1 controversy exists as to which infants should be evaluated for HSV infection, resulting in considerable variability in HSV testing.3 Some clinicians advocate for more conservative testing strategies that include the performance of CSF HSV PCR testing in all febrile infants aged ≤21 days.9 Others suggest limiting testing to infants who meet high-risk criteria (eg, seizures, ill-appearance, or CSF pleocytosis).10,11 Further investigation will need to elucidate the clinical and laboratory predictors of HSV infection to identify those infants who would benefit most from HSV testing as well as the outcomes of infants not tested.
Our study has several limitations. First, we could not determine the reason why clinicians elected to obtain a CSF HSV PCR test, and we do not know the test turnaround time or the time when results became available to the clinical team. Second, we did not abstract clinical data such as ill-appearance or seizures. Although we adjusted for the presence of serious bacterial or HSV infection as proxy measures for illness severity, it is possible that other clinical factors were associated with HSV testing and LOS. Third, although we adjusted for patient- and hospital-level factors in our regression model, the potential for residual confounding persists. Fourth, we did not explore acyclovir administration as a factor associated with LOS as some sites did not provide data on acyclovir. Fifth, we did not evaluate the impact of HSV testing of other sample types (eg, blood or skin) on LOS. Sixth, our study was conducted primarily at children’s hospitals, and our findings may not be generalizable to general hospitals with hospitalized neonates.
CONCLUSIONS
For infants aged ≤60 days undergoing evaluation for meningitis, CSF HSV PCR testing was associated with a slightly longer hospital LOS. Improved methods to identify and target testing to higher risk infants may mitigate the impact on LOS for low-risk infants.
Acknowledgments
The authors acknowledge the following collaborators in the Pediatric Emergency Medicine Clinical Research Network (PEM CRC) Herpes Simplex Virus (HSV) Study Group who collected data for this study and/or the parent study: Joseph L Arms, MD (Minneapolis, Minnesota), Stuart A Bradin, DO (Ann Arbor, Michigan), Sarah J Curtis, MD, MSc (Edmonton, Alberta, Canada), Paul T Ishimine, MD (San Diego, California), Dina Kulik, MD (Toronto, Ontario, Canada), Prashant Mahajan, MD, MPH, MBA (Ann Arbor, Michigan), Aaron S Miller, MD, MSPH (St. Louis, Missouri), Pamela J Okada, MD (Dallas, Texas), Christopher M Pruitt, MD (Birmingham, Alabama), Suzanne M Schmidt, MD (Chicago, Illinois), David Schnadower, Amy D Thompson, MD (Wilmington, Delaware), Joanna E Thomson, MD, MPH (Cincinnati, Ohio), MD, MPH (St. Louis, Missouri), and Neil G. Uspal, MD (Seattle, Washington).
Disclosures
Dr. Aronson reports grants from the Agency for Healthcare Research and Quality during the conduct of the study. Dr. Shah reports grants from Patient-Centered Outcomes Research Institute, grants from the National Institute of Allergy and Infectious Diseases, and grants from the National Heart Lung Blood Institute, outside the submitted work. Dr. Shah is the Editor-in-Chief of the Journal of Hospital Medicine. All other authors have no conflicts of interest or financial relationships relevant to this article to disclose.
Funding
This project was supported by the Section of Emergency Medicine of the American Academy of Pediatrics (AAP) and Baylor College of Medicine and by the grant number K08HS026006 (Aronson) from the Agency for Healthcare Research and Quality. The content is solely the responsibi
1. Kimberlin DW, Lin CY, Jacobs RF, et al. Natural history of neonatal herpes simplex virus infections in the acyclovir era. Pediatrics. 2001;108(2):223-229. PubMed
2. Shah SS, Aronson PL, Mohamad Z, Lorch SA. Delayed acyclovir therapy and death among neonates with herpes simplex virus infection. Pediatrics. 2011;128(6):1153-1160. https://doi.org/10.1136/eb-2012-100674.
3. Cruz AT, Freedman SB, Kulik DM, et al. Herpes simplex virus infection in infants undergoing meningitis evaluation. Pediatrics. 2018;141(2):e20171688. https://doi.org/10.1542/peds.2017-1688.
4. Shah SS, Volk J, Mohamad Z, Hodinka RL, Zorc JJ. Herpes simplex virus testing and hospital length of stay in neonates and young infants. J Pediatr. 2010;156(5):738-743. https://doi.org/10.1016/j.jpeds.2009.11.079.
5. Mahajan P, Kuppermann N, Mejias A, et al. Association of RNA biosignatures with bacterial infections in febrile infants aged 60 days or younger. JAMA. 2016;316(8):846-857. https://doi.org/10.1001/jama.2016.9207.
6. Schnadower D, Kuppermann N, Macias CG, et al. Febrile infants with urinary tract infections at very low risk for adverse events and bacteremia. Pediatrics. 2010;126(6):1074-1083. https://doi.org/10.1542/peds.2010-0479.
7. Thomson J, Sucharew H, Cruz AT, et al. Cerebrospinal fluid reference values for young infants undergoing lumbar puncture. Pediatrics. 2018;141(3):e20173405. https://doi.org/10.1542/peds.2017-3405.
8. Caviness AC, Demmler GJ, Almendarez Y, Selwyn BJ. The prevalence of neonatal herpes simplex virus infection compared with serious bacterial illness in hospitalized neonates. J Pediatr. 2008;153(2):164-169. https://doi.org/10.1016/j.jpeds.2008.02.031.
9. Long SS. In defense of empiric acyclovir therapy in certain neonates. J Pediatr. 2008;153(2):157-158. https://doi.org/10.1016/j.jpeds.2008.04.071.
10. Brower L, Schondelmeyer A, Wilson P, Shah SS. Testing and empiric treatment for neonatal herpes simplex virus: challenges and opportunities for improving the value of care. Hosp Pediatr. 2016;6(2):108-111. https://doi.org/10.1542/hpeds.2015-0166.
11. Kimberlin DW. When should you initiate acyclovir therapy in a neonate? J Pediatr. 2008;153(2):155-156. https://doi.org/10.1016/j.jpeds.2008.04.027.
Neonatal herpes simplex virus (HSV) is associated with significant morbidity and mortality,1 particularly when the diagnosis or treatment is delayed.2 Therefore, many infants aged ≤60 days being evaluated for meningitis undergo cerebrospinal fluid (CSF) HSV polymerase chain reaction (PCR) testing even though the risk of HSV infection is low [estimated at 0.4% of those undergoing evaluation for central nervous system (CNS) infection].3 A single-center study demonstrated that CSF HSV PCR testing increases the hospital length of stay (LOS) for infants aged ≤56 days,4 although these single-center findings may not be generalizable. To this end, we measured the association between CSF HSV PCR testing and LOS in a multicenter cohort of hospitalized young infants.
METHODS
Study Design
We conducted a planned secondary analysis of a retrospective cohort of infants aged ≤60 days who presented to the emergency department (ED) between January 1, 2005 and December 31, 2013, enrolled in the Pediatric Emergency Medicine Collaborative Research Committee (PEM CRC) HSV study.3 Our study was limited to the 20 hospitals that contributed hospital LOS data. The study protocol was approved by each site’s institutional review board with permission for data sharing.
Study Population
Eligible infants were identified at each site using a site-specific electronic search strategy. Infants were eligible for inclusion if a CSF culture was obtained in the ED or within 24 hours of ED arrival. We excluded infants who were discharged from the ED and those with missing hospital LOS data.
Data Collection
Site investigators extracted the following data elements either electronically or from medical records: patient demographics; ED arrival date and time; hospital discharge date and time; urinalysis results; peripheral and CSF cell counts; blood, urine, and CSF bacterial culture results; as well as the results of HSV PCR and viral cultures. Infants with growth of a pathogen in blood or CSF, or a catheterized urine culture with ≥50,000 colony-forming units (CFUs)/mL of a single pathogenic bacteria, or 10,000-50,000 CFUs/mL of a single pathogenic bacteria with an abnormal urinalysis (ie, positive nitrite or leukocyte esterase on urine dipstick or >5 white blood cells [WBCs] per high power field on urine microscopy) were classified as having a serious bacterial infection (SBI).5,6 Infants with a positive HSV PCR or viral culture from any site were classified as having HSV infection.3 Hospitalized infants who did not have an HSV PCR test performed were assumed not to have HSV disease if not diagnosed during the hospital stay or repeat ED encounter.3
Outcome Measures
The primary outcome was hospital LOS, defined at all hospitals as the time from ED arrival to provider signature of the hospital discharge order, calculated in minutes and then converted into days.
Statistical Analysis
We described LOS using medians with interquartile ranges (IQR) and compared between infants with and without a CSF HSV PCR test performed using the Mann–Whitney U test. To evaluate the association between performance of CSF HSV PCR testing and hospital LOS, we used negative binomial regression given the count variable outcome (LOS) with an overdispersed distribution. For this analysis, we clustered by hospital after adjusting for the following factors determined a priori: age, gender, study year, and presence of serious bacterial or HSV infection. Using the relative marginal modeled estimates of LOS (tested vs not tested), we determined the percentage increase in LOS. We then repeated the analyses after stratifying by the location of testing (ie, in-house vs send-out), age (≤28 days vs 29-60 days), and presence or absence of CSF pleocytosis (defined as a CSF WBC of ≥16 cells/mm3for infants aged ≤28 days and ≥10 cells/mm3for infants aged 29-60 days),7 because infants aged 29-60 days and those without CSF pleocytosis are reported to be at very low risk for CNS HSV infection.3,8 We utilized Stata Data Analysis and Statistical Software, version 15.0 (StataCorp, Inc.; College Station, Texas) for statistical analyses.
RESULTS
Of 24,103 infants with CSF cultures obtained at the 20 participating sites, we excluded 2,673 (11.1%) discharged from the ED or with missing disposition and 934 (3.9%) with missing LOS, leaving a study cohort of 20,496 infants (Figure). Overall, 1,780 infants (8.7%) had an SBI and 99 (0.5%) had an HSV infection, of which 46 (46.5%) had a CNS HSV infection.
Among the 20,496 study infants, 7,399 (36.1%) had a CSF HSV PCR test performed; 5,935 infants (80.2% of those tested) had in-house and 1,464 (19.8%) had send-out testing. Among infants with available CSF cell counts, a CSF HSV PCR test was more commonly performed in infants with CSF pleocytosis than in those without (1,865/4,439 [42.0%] with CSF pleocytosis vs 3,705/12,002 [30.9%] without CSF pleocytosis; odds ratio [OR] 1.6, 95% CI 1.5-1.7). Of the 7,399 infants who had a CSF HSV PCR test performed, 46 (0.6%) had a positive test. Of the tested infants, 5,570 (75.3%) had an available CSF WBC count; a positive CSF HSV PCR test was more common in infants with CSF pleocytosis than in those without (25 positive tests/1,865 infants with CSF pleocytosis [1.3%] vs 9/3,705 [0.2%] without CSF pleocytosis; OR 5.6, 95% CI 2.6-12.0). Among the 5,308 infants aged 29-60 days without CSF pleocytosis, 1,110 (20.9%) had a CSF HSV PCR test performed and only one infant (0.09% of those tested) had a positive test.
Without adjustment, infants with a CSF HSV PCR test had a longer median LOS than infants who were not tested (2.5 vs 2.3 days; P < .001). After adjustment, infants with a CSF HSV PCR test performed had a 23% longer duration of hospitalization. The association between testing and LOS was similar for older vs younger infants, infants with and without CSF pleocytosis, and in-house vs send-out testing (Table).
DISCUSSION
In a large, multicenter cohort of more than 20,000 hospitalized infants aged ≤60 days undergoing evaluation for meningitis, we examined the association of CSF HSV PCR testing with hospital LOS. Approximately one-third of study infants had a CSF HSV PCR test obtained. After adjustment for patient- and hospital-level factors, the treating clinician’s decision to obtain a CSF HSV PCR test was associated with a 23% longer hospital LOS (nearly one-half day).
Our findings are consistent with those of previous studies. First, our observed association of the decision to obtain a CSF HSV PCR test and LOS was similar in magnitude to that of a previous single-center investigation.4 Second, we also found that older infants and those without CSF pleocytosis were at very low risk of HSV infection.3,8 For the otherwise low-risk infants, the longer LOS may be due to delays in obtaining CSF HSV PCR test results, which should be explored in future research. Our study has greater generalizability than previous single-center studies by substantially increasing the population size as well as the variety of clinical settings. Ensuring clinicians’ access to rapid HSV PCR testing platforms will further mitigate the impact of HSV testing on LOS.
When deciding to perform a CSF HSV PCR test for infants aged ≤60 days, clinicians must balance the low incidence of neonatal HSV3 with the risk of delayed diagnosis and treatment of HSV infection, which include neurologic sequelae or even death.1,2 As infants with CNS HSV infection commonly present nonspecifically and only a minority of infected infants have skin vesicles,1 controversy exists as to which infants should be evaluated for HSV infection, resulting in considerable variability in HSV testing.3 Some clinicians advocate for more conservative testing strategies that include the performance of CSF HSV PCR testing in all febrile infants aged ≤21 days.9 Others suggest limiting testing to infants who meet high-risk criteria (eg, seizures, ill-appearance, or CSF pleocytosis).10,11 Further investigation will need to elucidate the clinical and laboratory predictors of HSV infection to identify those infants who would benefit most from HSV testing as well as the outcomes of infants not tested.
Our study has several limitations. First, we could not determine the reason why clinicians elected to obtain a CSF HSV PCR test, and we do not know the test turnaround time or the time when results became available to the clinical team. Second, we did not abstract clinical data such as ill-appearance or seizures. Although we adjusted for the presence of serious bacterial or HSV infection as proxy measures for illness severity, it is possible that other clinical factors were associated with HSV testing and LOS. Third, although we adjusted for patient- and hospital-level factors in our regression model, the potential for residual confounding persists. Fourth, we did not explore acyclovir administration as a factor associated with LOS as some sites did not provide data on acyclovir. Fifth, we did not evaluate the impact of HSV testing of other sample types (eg, blood or skin) on LOS. Sixth, our study was conducted primarily at children’s hospitals, and our findings may not be generalizable to general hospitals with hospitalized neonates.
CONCLUSIONS
For infants aged ≤60 days undergoing evaluation for meningitis, CSF HSV PCR testing was associated with a slightly longer hospital LOS. Improved methods to identify and target testing to higher risk infants may mitigate the impact on LOS for low-risk infants.
Acknowledgments
The authors acknowledge the following collaborators in the Pediatric Emergency Medicine Clinical Research Network (PEM CRC) Herpes Simplex Virus (HSV) Study Group who collected data for this study and/or the parent study: Joseph L Arms, MD (Minneapolis, Minnesota), Stuart A Bradin, DO (Ann Arbor, Michigan), Sarah J Curtis, MD, MSc (Edmonton, Alberta, Canada), Paul T Ishimine, MD (San Diego, California), Dina Kulik, MD (Toronto, Ontario, Canada), Prashant Mahajan, MD, MPH, MBA (Ann Arbor, Michigan), Aaron S Miller, MD, MSPH (St. Louis, Missouri), Pamela J Okada, MD (Dallas, Texas), Christopher M Pruitt, MD (Birmingham, Alabama), Suzanne M Schmidt, MD (Chicago, Illinois), David Schnadower, Amy D Thompson, MD (Wilmington, Delaware), Joanna E Thomson, MD, MPH (Cincinnati, Ohio), MD, MPH (St. Louis, Missouri), and Neil G. Uspal, MD (Seattle, Washington).
Disclosures
Dr. Aronson reports grants from the Agency for Healthcare Research and Quality during the conduct of the study. Dr. Shah reports grants from Patient-Centered Outcomes Research Institute, grants from the National Institute of Allergy and Infectious Diseases, and grants from the National Heart Lung Blood Institute, outside the submitted work. Dr. Shah is the Editor-in-Chief of the Journal of Hospital Medicine. All other authors have no conflicts of interest or financial relationships relevant to this article to disclose.
Funding
This project was supported by the Section of Emergency Medicine of the American Academy of Pediatrics (AAP) and Baylor College of Medicine and by the grant number K08HS026006 (Aronson) from the Agency for Healthcare Research and Quality. The content is solely the responsibi
1. Kimberlin DW, Lin CY, Jacobs RF, et al. Natural history of neonatal herpes simplex virus infections in the acyclovir era. Pediatrics. 2001;108(2):223-229. PubMed
2. Shah SS, Aronson PL, Mohamad Z, Lorch SA. Delayed acyclovir therapy and death among neonates with herpes simplex virus infection. Pediatrics. 2011;128(6):1153-1160. https://doi.org/10.1136/eb-2012-100674.
3. Cruz AT, Freedman SB, Kulik DM, et al. Herpes simplex virus infection in infants undergoing meningitis evaluation. Pediatrics. 2018;141(2):e20171688. https://doi.org/10.1542/peds.2017-1688.
4. Shah SS, Volk J, Mohamad Z, Hodinka RL, Zorc JJ. Herpes simplex virus testing and hospital length of stay in neonates and young infants. J Pediatr. 2010;156(5):738-743. https://doi.org/10.1016/j.jpeds.2009.11.079.
5. Mahajan P, Kuppermann N, Mejias A, et al. Association of RNA biosignatures with bacterial infections in febrile infants aged 60 days or younger. JAMA. 2016;316(8):846-857. https://doi.org/10.1001/jama.2016.9207.
6. Schnadower D, Kuppermann N, Macias CG, et al. Febrile infants with urinary tract infections at very low risk for adverse events and bacteremia. Pediatrics. 2010;126(6):1074-1083. https://doi.org/10.1542/peds.2010-0479.
7. Thomson J, Sucharew H, Cruz AT, et al. Cerebrospinal fluid reference values for young infants undergoing lumbar puncture. Pediatrics. 2018;141(3):e20173405. https://doi.org/10.1542/peds.2017-3405.
8. Caviness AC, Demmler GJ, Almendarez Y, Selwyn BJ. The prevalence of neonatal herpes simplex virus infection compared with serious bacterial illness in hospitalized neonates. J Pediatr. 2008;153(2):164-169. https://doi.org/10.1016/j.jpeds.2008.02.031.
9. Long SS. In defense of empiric acyclovir therapy in certain neonates. J Pediatr. 2008;153(2):157-158. https://doi.org/10.1016/j.jpeds.2008.04.071.
10. Brower L, Schondelmeyer A, Wilson P, Shah SS. Testing and empiric treatment for neonatal herpes simplex virus: challenges and opportunities for improving the value of care. Hosp Pediatr. 2016;6(2):108-111. https://doi.org/10.1542/hpeds.2015-0166.
11. Kimberlin DW. When should you initiate acyclovir therapy in a neonate? J Pediatr. 2008;153(2):155-156. https://doi.org/10.1016/j.jpeds.2008.04.027.
© 2019 Society of Hospital Medicine
Can Medicine Bring Good Out of War?
The title of this essay is more often posed as “Is War Good for Medicine?”2 The career VA physician in me, and the daughter and granddaughter of combat veterans, finds this question historically accurate, but ethically problematic. So I have rewritten the question to one that enables us to examine the historic relationship of medical advances and war from a more ethically justifiable posture. I am by no means ascribing to authors of other publications with this title anything but the highest motives of education and edification.
Yet the more I read and thought about the question(s), I realized that the moral assumptions underlying and supporting each concept are significantly different. What led me to that realization was a story my father told me when I was young which in my youthful ignorance I either dismissed or ignored. I now see that the narrative captured a profound truth about how war is not good especially for those who must wage it, but good may come from it for those who now live in peace.
My father was one of the founders of military pediatrics. Surprisingly, pediatricians were valuable members of the military medical forces because of their knowledge of infectious diseases.3 My father had gone in to the then new specialty of pediatrics because in the 1930s, infectious diseases were the primary cause of death in children. Before antibiotics, children would often die of common infections. Service as a combat medical officer in World War II stationed in the European Theater, my father had experience with and access to penicillin. After returning from the war to work in an Army hospital, he and his staff went into the acute pediatric ward and gave the drug to several very sick children, many of whom were likely to die. The next morning on rounds, they noted that many of the children were feeling much better, some even bouncing on their beds.
Perhaps either his telling or my remembering of these events is partly apocryphal, but the reality is that those lethal microbes had no idea what had hit them. Before human physicians overused the new drugs and nature struck back with antibiotic resistance, penicillin seemed miraculous.
Most likely, in 1945 those children would never have been prescribed penicillin, much less survived, if not for the unprecedented and war-driven consortium of industry and government that mass-produced penicillin to treat the troops with infections. Without a doubt then, from the sacrifice and devastation of World War II came the benefits and boons of the antibiotic era—one of the greatest discoveries in medical science.4
Penicillin is but one of legions of scientific discoveries that emerged during wartime. Many of these dramatic improvements, especially those in surgical techniques and emergency medicine, quickly entered the civilian sector. The French surgeon Amboise Paré, for example, revived an old Roman Army practice of using ligatures or tourniquets to stop excessive blood loss, now a staple of emergency responders in disasters. The ambulance services that transported wounded troops to the hospital began on the battlefields of the Civil War.5
These impressive contributions are the direct result of military medicine intended to preserve fighting strength. There are also indirect, although just as revolutionary, efforts of DoD and VA scientists and health care professionals to minimize disability and prevent progression especially of service-connected injuries and illnesses. Among the most groundbreaking is the VA’s 3D-printed artificial lung. I have to admit at first I thought that it was futuristic, but quickly I learned that it was a realistic possibility for the coming decades.6 VA researchers hope the lung will offer a treatment option for patients with chronic obstructive pulmonary disease (COPD), a lung condition more prevalent in veterans than in the civilian population.7 One contributing factor to the increased risk of COPD among former military is the higher rate of smoking among both active duty and veterans than that in the civilian population.8 And the last chain in the link of causation is that smoking is more common in those service members who have posttraumatic stress disorder.9
However, there also is a very dark side to the link between wartime research and medicine—most infamously the Nazi hypothermia experiments conducted at concentration camps. The proposed publication aroused a decades long ethical controversy regarding whether the data should be published, much less used, in research and practice even if it could save the lives of present or future warriors. In 1990, Marcia Angel, MD, then editor-in-chief of the prestigious New England Journal of Medicine, published the information with an accompanying ethical justification. “Finally, refusal to publish the unethical work serves notice to society at large that even scientists do not consider science the primary measure of a civilization. Knowledge, although important, may be less important to a decent society than the way it is obtained.”10 Ethicist Stephen Post writing on behalf of Holocaust victims strenuously disagreed with the decision to publish the research, “Because the Nazi experiments on human beings were so appallingly unethical, it follows, prima facie, that the use of the records is unethical.”11
This debate is key to the distinction between the 2 questions posed at the beginning of this column. Few who have been on a battlefield or who have cared for those who were can suggest or defend that wars should be fought as a catalyst for scientific research or an impetus to medical advancement. Such an instrumentalist view justifies the end of healing with the means of death, which is an intrinsic contradiction that would eventually corrode the integrity of the medical and scientific professions. Conversely, the second question challenges all of us in federal practice to assume a mantle of obligation to take the interventions that enabled combat medicine to save soldiers and apply them to improve the health and save the lives of veterans and civilians alike. It summons scientists laboring in the hundreds of DoD and VA laboratories to use the unparalleled funding and infrastructure of the institutions to develop promising therapeutics to treat the psychological toll and physical cost of war. And finally it charges the citizens whose family and friends have and will serve in uniform to enlist in a political process that enables military medicine and science to achieve the greatest good-health in peace.
1. Remarque EM. All Quiet on the Western Front. New York, NY: Fawcett Books; 1929:228.
2. Connell C. Is war good for medicine: war’s medical legacy? http://sm.stanford.edu/archive/stanmed/2007summer/main.html. Published 2007. Accessed April 18, 2019.
3. Burnett MW, Callahan CW. American pediatricians at war; a legacy of service. Pediatrics. 2012;129(suppl 1):S33-S49.
4. Ligon BL. Penicillin: its discovery and early development. Semin Pediatr Infect Dis. 2004;15(1):52-57.
5. Samuel L. 6 medical innovations that moved from the battlefield to mainstream medicine. https://www.scientificamercan.com/article/6-medical-innovations-that-moved-from-the-battlefield-to-mainstream-medicine. Published November 11, 2017. Accessed April 18, 2019.
6. Richman M. Breathing easier. https://www.research.va.gov/currents/0818-Researchers-strive-to-make-3D-printed-artificial-lung-to-help-Vets-with-respiratory-disease.cfm. Published August 1, 2018. Accessed April 18, 2019.
7. Murphy DE, Chaudry Z, Almoosa KF, Panos RJ. High prevalence of chronic obstructive pulmonary disease among veterans in the urban Midwest. Mill Med. 2011;176(5):552-560.
8. Thompson WH, St-Hilaire C. Prevalence of chronic obstructive pulmonary disease and tobacco use in veterans at Boise Veterans Affairs Medical Center. Respir Care. 2010;55(5):555-560.
9. Cook J, Jakupcak M, Rosenheck R, Fontana A, McFall M. Influence of PTSD symptom clusters on smoking status among help-seeking Iraq and Afghanistan veterans. Nicotine Tob Res. 2009;11(10):1189-1195.
10. Angell M. The Nazi hypothermia experiments and unethical research today. N Eng J Med 1990;322(20):1462-1464.
11. Post SG. The echo of Nuremberg: Nazi data and ethics. J Med Ethics. 1991;17(1):42-44.
The title of this essay is more often posed as “Is War Good for Medicine?”2 The career VA physician in me, and the daughter and granddaughter of combat veterans, finds this question historically accurate, but ethically problematic. So I have rewritten the question to one that enables us to examine the historic relationship of medical advances and war from a more ethically justifiable posture. I am by no means ascribing to authors of other publications with this title anything but the highest motives of education and edification.
Yet the more I read and thought about the question(s), I realized that the moral assumptions underlying and supporting each concept are significantly different. What led me to that realization was a story my father told me when I was young which in my youthful ignorance I either dismissed or ignored. I now see that the narrative captured a profound truth about how war is not good especially for those who must wage it, but good may come from it for those who now live in peace.
My father was one of the founders of military pediatrics. Surprisingly, pediatricians were valuable members of the military medical forces because of their knowledge of infectious diseases.3 My father had gone in to the then new specialty of pediatrics because in the 1930s, infectious diseases were the primary cause of death in children. Before antibiotics, children would often die of common infections. Service as a combat medical officer in World War II stationed in the European Theater, my father had experience with and access to penicillin. After returning from the war to work in an Army hospital, he and his staff went into the acute pediatric ward and gave the drug to several very sick children, many of whom were likely to die. The next morning on rounds, they noted that many of the children were feeling much better, some even bouncing on their beds.
Perhaps either his telling or my remembering of these events is partly apocryphal, but the reality is that those lethal microbes had no idea what had hit them. Before human physicians overused the new drugs and nature struck back with antibiotic resistance, penicillin seemed miraculous.
Most likely, in 1945 those children would never have been prescribed penicillin, much less survived, if not for the unprecedented and war-driven consortium of industry and government that mass-produced penicillin to treat the troops with infections. Without a doubt then, from the sacrifice and devastation of World War II came the benefits and boons of the antibiotic era—one of the greatest discoveries in medical science.4
Penicillin is but one of legions of scientific discoveries that emerged during wartime. Many of these dramatic improvements, especially those in surgical techniques and emergency medicine, quickly entered the civilian sector. The French surgeon Amboise Paré, for example, revived an old Roman Army practice of using ligatures or tourniquets to stop excessive blood loss, now a staple of emergency responders in disasters. The ambulance services that transported wounded troops to the hospital began on the battlefields of the Civil War.5
These impressive contributions are the direct result of military medicine intended to preserve fighting strength. There are also indirect, although just as revolutionary, efforts of DoD and VA scientists and health care professionals to minimize disability and prevent progression especially of service-connected injuries and illnesses. Among the most groundbreaking is the VA’s 3D-printed artificial lung. I have to admit at first I thought that it was futuristic, but quickly I learned that it was a realistic possibility for the coming decades.6 VA researchers hope the lung will offer a treatment option for patients with chronic obstructive pulmonary disease (COPD), a lung condition more prevalent in veterans than in the civilian population.7 One contributing factor to the increased risk of COPD among former military is the higher rate of smoking among both active duty and veterans than that in the civilian population.8 And the last chain in the link of causation is that smoking is more common in those service members who have posttraumatic stress disorder.9
However, there also is a very dark side to the link between wartime research and medicine—most infamously the Nazi hypothermia experiments conducted at concentration camps. The proposed publication aroused a decades long ethical controversy regarding whether the data should be published, much less used, in research and practice even if it could save the lives of present or future warriors. In 1990, Marcia Angel, MD, then editor-in-chief of the prestigious New England Journal of Medicine, published the information with an accompanying ethical justification. “Finally, refusal to publish the unethical work serves notice to society at large that even scientists do not consider science the primary measure of a civilization. Knowledge, although important, may be less important to a decent society than the way it is obtained.”10 Ethicist Stephen Post writing on behalf of Holocaust victims strenuously disagreed with the decision to publish the research, “Because the Nazi experiments on human beings were so appallingly unethical, it follows, prima facie, that the use of the records is unethical.”11
This debate is key to the distinction between the 2 questions posed at the beginning of this column. Few who have been on a battlefield or who have cared for those who were can suggest or defend that wars should be fought as a catalyst for scientific research or an impetus to medical advancement. Such an instrumentalist view justifies the end of healing with the means of death, which is an intrinsic contradiction that would eventually corrode the integrity of the medical and scientific professions. Conversely, the second question challenges all of us in federal practice to assume a mantle of obligation to take the interventions that enabled combat medicine to save soldiers and apply them to improve the health and save the lives of veterans and civilians alike. It summons scientists laboring in the hundreds of DoD and VA laboratories to use the unparalleled funding and infrastructure of the institutions to develop promising therapeutics to treat the psychological toll and physical cost of war. And finally it charges the citizens whose family and friends have and will serve in uniform to enlist in a political process that enables military medicine and science to achieve the greatest good-health in peace.
1. Remarque EM. All Quiet on the Western Front. New York, NY: Fawcett Books; 1929:228.
2. Connell C. Is war good for medicine: war’s medical legacy? http://sm.stanford.edu/archive/stanmed/2007summer/main.html. Published 2007. Accessed April 18, 2019.
3. Burnett MW, Callahan CW. American pediatricians at war; a legacy of service. Pediatrics. 2012;129(suppl 1):S33-S49.
4. Ligon BL. Penicillin: its discovery and early development. Semin Pediatr Infect Dis. 2004;15(1):52-57.
5. Samuel L. 6 medical innovations that moved from the battlefield to mainstream medicine. https://www.scientificamercan.com/article/6-medical-innovations-that-moved-from-the-battlefield-to-mainstream-medicine. Published November 11, 2017. Accessed April 18, 2019.
6. Richman M. Breathing easier. https://www.research.va.gov/currents/0818-Researchers-strive-to-make-3D-printed-artificial-lung-to-help-Vets-with-respiratory-disease.cfm. Published August 1, 2018. Accessed April 18, 2019.
7. Murphy DE, Chaudry Z, Almoosa KF, Panos RJ. High prevalence of chronic obstructive pulmonary disease among veterans in the urban Midwest. Mill Med. 2011;176(5):552-560.
8. Thompson WH, St-Hilaire C. Prevalence of chronic obstructive pulmonary disease and tobacco use in veterans at Boise Veterans Affairs Medical Center. Respir Care. 2010;55(5):555-560.
9. Cook J, Jakupcak M, Rosenheck R, Fontana A, McFall M. Influence of PTSD symptom clusters on smoking status among help-seeking Iraq and Afghanistan veterans. Nicotine Tob Res. 2009;11(10):1189-1195.
10. Angell M. The Nazi hypothermia experiments and unethical research today. N Eng J Med 1990;322(20):1462-1464.
11. Post SG. The echo of Nuremberg: Nazi data and ethics. J Med Ethics. 1991;17(1):42-44.

Development of a Program to Support VA Community Living Centers’ Quality Improvement
US Department of Veterans Affairs (VA) Community Living Centers (CLCs) provide a dynamic array of long- and short-term health and rehabilitative services in a person-centered environment designed to meet the individual needs of veteran residents. The VA Office of Geriatrics and Extended Care (GEC) manages CLCs as part of its commitment to “optimizing the health and well-being of veterans with multiple chronic conditions, life-limiting illness, frailty or disability associated with chronic disease, aging or injury.”1
CLCs are home to veterans who require short stays before going home, as well as those who require longer or permanent domicile. CLCs also are home to several special populations of veterans, including those with spinal cord injury and those who choose palliative or hospice care. CLCs have embraced cultural transformation, creating therapeutic environments that function as real homes, with the kitchen at the center, and daily activities scheduled around the veterans’ preferences. Data about CLC quality are now available to the public, highlighting the important role of support for and continual refinement to quality improvement (QI) processes in the CLC system. 2,3
CONCERT Program
High-functioning teams are critical to achieving improvement in such processes.4 In fiscal year (FY) 2017, GEC launched a national center to engage and support CLC staff in creating high-functioning, relationship-based teams through specific QI practices, thereby aiming to improve veteran experience and quality of care. The center, known as the CLCs’ Ongoing National Center for Enhancing Resources and Training (CONCERT), is based on extensive VA-funded research in CLCs5-7 and builds on existing, evidence-based literature emphasizing the importance of strengths-based learning, collaborative problem solving, and structured observation.8-13 The CONCERT mission is to support CLCs in ongoing QI efforts, providing guidance, training, and resources. This article summarizes the previous research on which CONCERT is based and describes its current activities, which focus on implementing a national team-based quality improvement initiative.
Earlier VA-funded CLC research included a VA Office of Patient Centered Care and Cultural Transformation local innovation project and 2 VA Office of Research and Development-funded research studies. The local innovation project focused on strengthening staff leadership and relational skills in 1 CLC by engaging leaders and staff in collaborative work to reduce stress. The goal was to build high-functioning team skills through shared projects that created positive work experiences and reduced job-related stress while also improving veteran experience and quality of care.14,15 Over the course of a year, 2 national consultants in nursing home quality improvement worked with CLC leadership and staff, including conducting nine 4-day site visits. Using an approach designed to foster development of high-functioning teams, individual CLC neighborhoods (ie, units) developed and implemented neighborhood-initiated, neighborhood-based pilot projects, such as an individualized finger foods dining option for residents with dementia who became distressed when sitting at a table during a meal. Outcomes of these projects included improved staff communication and staff satisfaction, particularly psychological safety.
In the concurrently conducted pilot research study, a research team comprehensively assessed the person-centered care efforts of 3 CLCs prior to their construction of Green House-type (small house) homes. This mixed-methods study included more than 50 qualitative interviews conducted with VA medical center leadership and CLC staff and residents. Researchers also administered online employee surveys and conducted site visits, including more than 60 hours of direct observation of CLC life and team functioning. The local institutional review boards approved all study procedures, and researchers notified local unions.
Analyses highlighted 2 important aspects of person-centered care not captured by then-existing measurement instruments: the type, quality, and number of staff/resident interactions and the type, quality, and level of resident engagement. The team therefore developed a structured, systematic, observation-based instrument to measure these concepts.5 But while researchers found this instrument useful, it was too complex to be used by CLC staff for QI.
LOCK Quality Improvement
A later and larger research study addressed this issue. In the study, researchers worked with CLC staff to convert the complex observation-based research instrument into several structured tools that were easier for CLC staff to use.6 The researchers then incorporated their experience with the prior local innovation project and designed and implemented a QI program, which operationalized an evidence-based bundle of practices to implement the new tools in 6 CLCs. Researchers called the bundle of practices “LOCK”: (1) Learn from the bright spots; (2) Observe; (3) Collaborate in huddles; and (4) Keep it bite-sized.
Learn from the bright spots. Studies on strengths-based learning indicate that recognizing and sharing positive instances of ideal practice helps provide clear direction regarding what needs to be done differently to achieve success. Identifying and learning from outlying instances of successful practice encourages staff to continue those behaviors and gives staff tangible examples of how they may improve.16-19 That is, concentrating on instances where a negative outcome was at risk of occurring but did not occur (ie, a positive outlier or “bright spot”) enables staff to analyze what facilitated the success and design and pilot strategies to replicate it.
Observe. Human factors engineering is built on the principle that integrated approaches for studying work systems can identify areas for improvement.8 Observation is a key tool in this approach. A recent review of 69 studies that used observation to assess clinical performance found it useful in identifying factors affecting quality and safety.9
Collaborate in huddles. A necessary component to overcoming barriers to successful QI is having high-functioning teams effectively coordinate work. In the theory of relational coordination, this is operationalized as high-quality interactions (frequent, timely, and accurate communication) and high-quality relationships (share knowledge, shared goals, and mutual respect).10,11 Improved relational coordination can lead to higher quality of care outcomes and job satisfaction by enabling individuals to manage their tasks with less delay, more rapid and effective responses, fewer errors, and less wasted effort.12
Keep it bite-sized. Regular practice of a new behavior is one of the keys to making that new behavior part of an automatic routine (ie, a habit). To be successfully integrated into staff work routines, QI initiatives must be perceived as congruent with and easily integrated into care goals and workplace practices. Quick, focused, team-building and solution-oriented QI initiatives, therefore, have the greatest chance of success, particularly if staff feel they have little time for participating in new initiatives.13
Researchers designed the 4 LOCK practices to be interrelated and build on one another, creating a bundle to be used together to help facilitate positive change in resident/staff interactions and resident engagement.7 For 6 months, researchers studied the 6 CLCs’ use of the new structured observation tools as part of the LOCK-based QI program. The participating CLCs had such success in improving staff interactions with residents and residents’ engagement in CLC life that GEC, under the CONCERT umbrella, rolled out the LOCK bundle of practices to CLCs nationwide.20
CONCERT’s current activities focus on helping CLCs implement the LOCK bundle nationwide as a relational coordination-based national QI initiative designed to improve quality of care and staff satisfaction. The CONCERT team began this implementation in FY 2017 using a train-the-trainer approach through a staggered veterans integrated service network (VISN) rollout. Each CLC sent 2 leaders to a VISN-wide training program at a host CLC site (the host site was able to have more participants attend). Afterward, the CONCERT team provided individualized phone support to help CLCs implement the program. A VA Pulse (intranet-based social media portal) site hosts all training materials, program videos, an active blog, community discussions, etc.
In FY 2018, the program shifted to a VISN-based support system, with a CONCERT team member assigned to each VISN and VISN-based webinars to facilitate information exchange, collaboration, and group learning. In FY 2018, the CONCERT team also conducted site visits to selected CLCs with strong implementation success records to learn about program facilitators and to disseminate the lessons learned. Spanning FYs 2018 and 2019, the CONCERT team also supports historically low-performing CLCs through a series of rapid-cycle learning intensives based on the Institute for Healthcare Improvement breakthrough collaborative series model for accelerated and sustained QI.21 These incorporate in-person or virtual learning sessions, in which participants learn about and share effective practices, and between-session learning assignments, to facilitate the piloting, implementation, and sustainment of system changes. As part of the CONCERT continuous QI process, the CONCERT team closely monitors the impact of the program and continues to pilot, adapt, and change practices as it learns more about how best to help CLCs improve.
Conclusion
A key CONCERT principle is that health care systems create health care outcomes. The CONCERT team uses the theory of relational coordination to support implementation of the LOCK bundle of practices to help CLCs change their systems to achieve high performance. Through implementation of the LOCK bundle of practices, CLC staff develop, pilot, and spread new systems for communication, teamwork, and collaborative problem solving, as well as developing skills to participate effectively in these systems. CONCERT represents just 1 way VA supports CLCs in their continual journeys toward ever-improved quality of veteran care.
Acknowledgments
The authors thank Barbara Frank and Cathie Brady for their contributions to the development of the CONCERT program.
1. US Department of Veterans Affairs, Geriatrics and Extended Care Services (GEC). https://www.va.gov/GERIATRICS/index.asp. Updated February 25, 2019. Accessed April 9, 2019.
2. US Department of Veterans Affairs. https://www.accesstocare.va.gov/CNH/Statemap. Accessed April 10, 2019.
3. US Department of Veterans Affairs. https://www.va.gov/QUALITYOFCARE/apps/aspire/clcsurvey.aspx/. U
4. Gittell JH, Weinberg D, Pfefferle S, Bishop C. Impact of relational coordination on job satisfaction and quality outcomes: a study of nursing homes. Hum Resour Manag. 2008;18(2):154-170
5. Snow AL, Dodson, ML, Palmer JA, et al. Development of a new systematic observation tool of nursing home resident and staff engagement and relationship. Gerontologist. 2018;58(2):e15-e24.
6. Hartmann CW, Palmer JA, Mills WL, et al. Adaptation of a nursing home culture change research instrument for frontline staff quality improvement use. Psychol Serv. 2017;14(3):337-346.
7. Mills WL, Pimentel CB, Palmer JA, et al. Applying a theory-driven framework to guide quality improvement efforts in nursing homes: the LOCK model. Gerontologist. 2018;58(3):598-605.
8. Caravon P, Hundt AS, Karsh B, et al. Work system design for patient safety: the SEIPS model. Quality & Safety in Health Care. 2006;15(suppl 1), i50-i58.
9. Yanes AF, McElroy LM, Abecassis ZA, Holl J, Woods D, Ladner DP. Observation for assessment of clinician performance: a narrative review. BMJ Qual Saf. 2016;25(1):46-55.
10. Gittell JH. Supervisory span, relational coordination and flight departure performance: a reassessment of postbureaucracy theory. Organ Sci. 2011;12(4):468-483.
11. Gittell JH. New Directions for Relational Coordination Theory. In Spreitzer GM, Cameron KS, eds. The Oxford Handbook of Positive Organizational Scholarship. Oxford University Press: New York; 2012:400-411.
12. Weinberg DB, Lusenhop RW, Gittell JH, Kautz CM. Coordination between formal providers and informal caregivers. Health Care Manage Rev. 2007;32(2):140-149.
13. Phillips J, Hebish LJ, Mann S, Ching JM, Blackmore CC. Engaging frontline leaders and staff in real-time improvement. Jt Comm J Qual Patient Saf. 2016;42(4):170-183.
14. Farrell D, Brady C, Frank B. Meeting the Leadership Challenge in Long-Term Care: What You Do Matters. Health Professions Press: Baltimore, MD; 2011.
15. Brady C, Farrell D, Frank B. A Long-Term Leaders’ Guide to High Performance: Doing Better Together. Health Professions Press: Baltimore, MD; 2018.
16. Bradley EH, Curry LA, Ramanadhan S, Rowe L, Nembhard IM, Krumholz HM. Research in action: using positive deviance to improve quality of health care. Implement Sci. 2009;4:25.
17. Marsh DR, Schroeder DG, Dearden KA, Sternin J, Sternin M. The power of positive deviance. BMJ. 2004; 329(7475):1177-1179.
18. Vogt K, Johnson F, Fraser V, et al. An innovative, strengths-based, peer mentoring approach to professional development for registered dietitians. Can J Diet Pract Res. 2015;76(4):185-189.
19. Beckett P, Field J, Molloy L, Yu N, Holmes D, Pile E. Practice what you preach: developing person-centered culture in inpatient mental health settings through strengths-based, transformational leadership. Issues Ment Health Nurs. 2013;34(8):595-601.
20. Hartmann CW, Mills WL, Pimentel CB, et al. Impact of intervention to improve nursing home resident-staff interactions and engagement. Gerontologist. 2018;58(4):e291-e301.
21. Institute for Healthcare Improvement. The breakthrough series: IHI’s collaborative model for achieving breakthrough improvement. http://www.ihi.org/resources/Pages/IHIWhitePapers/TheBreakthroughSeriesIHIsCollaborativeModelforAchievingBreakthroughImprovement.aspx. Published 2003. Accessed April 9, 2019.
US Department of Veterans Affairs (VA) Community Living Centers (CLCs) provide a dynamic array of long- and short-term health and rehabilitative services in a person-centered environment designed to meet the individual needs of veteran residents. The VA Office of Geriatrics and Extended Care (GEC) manages CLCs as part of its commitment to “optimizing the health and well-being of veterans with multiple chronic conditions, life-limiting illness, frailty or disability associated with chronic disease, aging or injury.”1
CLCs are home to veterans who require short stays before going home, as well as those who require longer or permanent domicile. CLCs also are home to several special populations of veterans, including those with spinal cord injury and those who choose palliative or hospice care. CLCs have embraced cultural transformation, creating therapeutic environments that function as real homes, with the kitchen at the center, and daily activities scheduled around the veterans’ preferences. Data about CLC quality are now available to the public, highlighting the important role of support for and continual refinement to quality improvement (QI) processes in the CLC system. 2,3
CONCERT Program
High-functioning teams are critical to achieving improvement in such processes.4 In fiscal year (FY) 2017, GEC launched a national center to engage and support CLC staff in creating high-functioning, relationship-based teams through specific QI practices, thereby aiming to improve veteran experience and quality of care. The center, known as the CLCs’ Ongoing National Center for Enhancing Resources and Training (CONCERT), is based on extensive VA-funded research in CLCs5-7 and builds on existing, evidence-based literature emphasizing the importance of strengths-based learning, collaborative problem solving, and structured observation.8-13 The CONCERT mission is to support CLCs in ongoing QI efforts, providing guidance, training, and resources. This article summarizes the previous research on which CONCERT is based and describes its current activities, which focus on implementing a national team-based quality improvement initiative.
Earlier VA-funded CLC research included a VA Office of Patient Centered Care and Cultural Transformation local innovation project and 2 VA Office of Research and Development-funded research studies. The local innovation project focused on strengthening staff leadership and relational skills in 1 CLC by engaging leaders and staff in collaborative work to reduce stress. The goal was to build high-functioning team skills through shared projects that created positive work experiences and reduced job-related stress while also improving veteran experience and quality of care.14,15 Over the course of a year, 2 national consultants in nursing home quality improvement worked with CLC leadership and staff, including conducting nine 4-day site visits. Using an approach designed to foster development of high-functioning teams, individual CLC neighborhoods (ie, units) developed and implemented neighborhood-initiated, neighborhood-based pilot projects, such as an individualized finger foods dining option for residents with dementia who became distressed when sitting at a table during a meal. Outcomes of these projects included improved staff communication and staff satisfaction, particularly psychological safety.
In the concurrently conducted pilot research study, a research team comprehensively assessed the person-centered care efforts of 3 CLCs prior to their construction of Green House-type (small house) homes. This mixed-methods study included more than 50 qualitative interviews conducted with VA medical center leadership and CLC staff and residents. Researchers also administered online employee surveys and conducted site visits, including more than 60 hours of direct observation of CLC life and team functioning. The local institutional review boards approved all study procedures, and researchers notified local unions.
Analyses highlighted 2 important aspects of person-centered care not captured by then-existing measurement instruments: the type, quality, and number of staff/resident interactions and the type, quality, and level of resident engagement. The team therefore developed a structured, systematic, observation-based instrument to measure these concepts.5 But while researchers found this instrument useful, it was too complex to be used by CLC staff for QI.
LOCK Quality Improvement
A later and larger research study addressed this issue. In the study, researchers worked with CLC staff to convert the complex observation-based research instrument into several structured tools that were easier for CLC staff to use.6 The researchers then incorporated their experience with the prior local innovation project and designed and implemented a QI program, which operationalized an evidence-based bundle of practices to implement the new tools in 6 CLCs. Researchers called the bundle of practices “LOCK”: (1) Learn from the bright spots; (2) Observe; (3) Collaborate in huddles; and (4) Keep it bite-sized.
Learn from the bright spots. Studies on strengths-based learning indicate that recognizing and sharing positive instances of ideal practice helps provide clear direction regarding what needs to be done differently to achieve success. Identifying and learning from outlying instances of successful practice encourages staff to continue those behaviors and gives staff tangible examples of how they may improve.16-19 That is, concentrating on instances where a negative outcome was at risk of occurring but did not occur (ie, a positive outlier or “bright spot”) enables staff to analyze what facilitated the success and design and pilot strategies to replicate it.
Observe. Human factors engineering is built on the principle that integrated approaches for studying work systems can identify areas for improvement.8 Observation is a key tool in this approach. A recent review of 69 studies that used observation to assess clinical performance found it useful in identifying factors affecting quality and safety.9
Collaborate in huddles. A necessary component to overcoming barriers to successful QI is having high-functioning teams effectively coordinate work. In the theory of relational coordination, this is operationalized as high-quality interactions (frequent, timely, and accurate communication) and high-quality relationships (share knowledge, shared goals, and mutual respect).10,11 Improved relational coordination can lead to higher quality of care outcomes and job satisfaction by enabling individuals to manage their tasks with less delay, more rapid and effective responses, fewer errors, and less wasted effort.12
Keep it bite-sized. Regular practice of a new behavior is one of the keys to making that new behavior part of an automatic routine (ie, a habit). To be successfully integrated into staff work routines, QI initiatives must be perceived as congruent with and easily integrated into care goals and workplace practices. Quick, focused, team-building and solution-oriented QI initiatives, therefore, have the greatest chance of success, particularly if staff feel they have little time for participating in new initiatives.13
Researchers designed the 4 LOCK practices to be interrelated and build on one another, creating a bundle to be used together to help facilitate positive change in resident/staff interactions and resident engagement.7 For 6 months, researchers studied the 6 CLCs’ use of the new structured observation tools as part of the LOCK-based QI program. The participating CLCs had such success in improving staff interactions with residents and residents’ engagement in CLC life that GEC, under the CONCERT umbrella, rolled out the LOCK bundle of practices to CLCs nationwide.20
CONCERT’s current activities focus on helping CLCs implement the LOCK bundle nationwide as a relational coordination-based national QI initiative designed to improve quality of care and staff satisfaction. The CONCERT team began this implementation in FY 2017 using a train-the-trainer approach through a staggered veterans integrated service network (VISN) rollout. Each CLC sent 2 leaders to a VISN-wide training program at a host CLC site (the host site was able to have more participants attend). Afterward, the CONCERT team provided individualized phone support to help CLCs implement the program. A VA Pulse (intranet-based social media portal) site hosts all training materials, program videos, an active blog, community discussions, etc.
In FY 2018, the program shifted to a VISN-based support system, with a CONCERT team member assigned to each VISN and VISN-based webinars to facilitate information exchange, collaboration, and group learning. In FY 2018, the CONCERT team also conducted site visits to selected CLCs with strong implementation success records to learn about program facilitators and to disseminate the lessons learned. Spanning FYs 2018 and 2019, the CONCERT team also supports historically low-performing CLCs through a series of rapid-cycle learning intensives based on the Institute for Healthcare Improvement breakthrough collaborative series model for accelerated and sustained QI.21 These incorporate in-person or virtual learning sessions, in which participants learn about and share effective practices, and between-session learning assignments, to facilitate the piloting, implementation, and sustainment of system changes. As part of the CONCERT continuous QI process, the CONCERT team closely monitors the impact of the program and continues to pilot, adapt, and change practices as it learns more about how best to help CLCs improve.
Conclusion
A key CONCERT principle is that health care systems create health care outcomes. The CONCERT team uses the theory of relational coordination to support implementation of the LOCK bundle of practices to help CLCs change their systems to achieve high performance. Through implementation of the LOCK bundle of practices, CLC staff develop, pilot, and spread new systems for communication, teamwork, and collaborative problem solving, as well as developing skills to participate effectively in these systems. CONCERT represents just 1 way VA supports CLCs in their continual journeys toward ever-improved quality of veteran care.
Acknowledgments
The authors thank Barbara Frank and Cathie Brady for their contributions to the development of the CONCERT program.
1. US Department of Veterans Affairs, Geriatrics and Extended Care Services (GEC). https://www.va.gov/GERIATRICS/index.asp. Updated February 25, 2019. Accessed April 9, 2019.
2. US Department of Veterans Affairs. https://www.accesstocare.va.gov/CNH/Statemap. Accessed April 10, 2019.
3. US Department of Veterans Affairs. https://www.va.gov/QUALITYOFCARE/apps/aspire/clcsurvey.aspx/. U
4. Gittell JH, Weinberg D, Pfefferle S, Bishop C. Impact of relational coordination on job satisfaction and quality outcomes: a study of nursing homes. Hum Resour Manag. 2008;18(2):154-170
5. Snow AL, Dodson, ML, Palmer JA, et al. Development of a new systematic observation tool of nursing home resident and staff engagement and relationship. Gerontologist. 2018;58(2):e15-e24.
6. Hartmann CW, Palmer JA, Mills WL, et al. Adaptation of a nursing home culture change research instrument for frontline staff quality improvement use. Psychol Serv. 2017;14(3):337-346.
7. Mills WL, Pimentel CB, Palmer JA, et al. Applying a theory-driven framework to guide quality improvement efforts in nursing homes: the LOCK model. Gerontologist. 2018;58(3):598-605.
8. Caravon P, Hundt AS, Karsh B, et al. Work system design for patient safety: the SEIPS model. Quality & Safety in Health Care. 2006;15(suppl 1), i50-i58.
9. Yanes AF, McElroy LM, Abecassis ZA, Holl J, Woods D, Ladner DP. Observation for assessment of clinician performance: a narrative review. BMJ Qual Saf. 2016;25(1):46-55.
10. Gittell JH. Supervisory span, relational coordination and flight departure performance: a reassessment of postbureaucracy theory. Organ Sci. 2011;12(4):468-483.
11. Gittell JH. New Directions for Relational Coordination Theory. In Spreitzer GM, Cameron KS, eds. The Oxford Handbook of Positive Organizational Scholarship. Oxford University Press: New York; 2012:400-411.
12. Weinberg DB, Lusenhop RW, Gittell JH, Kautz CM. Coordination between formal providers and informal caregivers. Health Care Manage Rev. 2007;32(2):140-149.
13. Phillips J, Hebish LJ, Mann S, Ching JM, Blackmore CC. Engaging frontline leaders and staff in real-time improvement. Jt Comm J Qual Patient Saf. 2016;42(4):170-183.
14. Farrell D, Brady C, Frank B. Meeting the Leadership Challenge in Long-Term Care: What You Do Matters. Health Professions Press: Baltimore, MD; 2011.
15. Brady C, Farrell D, Frank B. A Long-Term Leaders’ Guide to High Performance: Doing Better Together. Health Professions Press: Baltimore, MD; 2018.
16. Bradley EH, Curry LA, Ramanadhan S, Rowe L, Nembhard IM, Krumholz HM. Research in action: using positive deviance to improve quality of health care. Implement Sci. 2009;4:25.
17. Marsh DR, Schroeder DG, Dearden KA, Sternin J, Sternin M. The power of positive deviance. BMJ. 2004; 329(7475):1177-1179.
18. Vogt K, Johnson F, Fraser V, et al. An innovative, strengths-based, peer mentoring approach to professional development for registered dietitians. Can J Diet Pract Res. 2015;76(4):185-189.
19. Beckett P, Field J, Molloy L, Yu N, Holmes D, Pile E. Practice what you preach: developing person-centered culture in inpatient mental health settings through strengths-based, transformational leadership. Issues Ment Health Nurs. 2013;34(8):595-601.
20. Hartmann CW, Mills WL, Pimentel CB, et al. Impact of intervention to improve nursing home resident-staff interactions and engagement. Gerontologist. 2018;58(4):e291-e301.
21. Institute for Healthcare Improvement. The breakthrough series: IHI’s collaborative model for achieving breakthrough improvement. http://www.ihi.org/resources/Pages/IHIWhitePapers/TheBreakthroughSeriesIHIsCollaborativeModelforAchievingBreakthroughImprovement.aspx. Published 2003. Accessed April 9, 2019.
Infection or not infection, that is the question—Is procalcitonin the answer?

Diagnostic algorithms have been proposed to help recognize infection in chronic obstructive pulmonary disease, rhinosinusitis syndrome, acute arthritis, pharyngitis, and possible sepsis. The algorithms have included laboratory tests and potential biomarkers, but all are imperfect despite achieving various degrees of acceptance in practice.
In this issue of the Journal, Dr. Fakheri updates us on using the data on serum procalcitonin levels to guide starting and stopping antibiotics in different clinical scenarios. As I read the paper, I wondered what was different about procalcitonin that might allow it to succeed where seemingly similar biomarkers like C-reactive protein (CRP) and the erythrocyte sedimentation rate (ESR) have failed.
Procalcitonin is the approximately 15,000-kD product of the CALC1 gene and the precursor of calcitonin. Not surprisingly, then, it is increased in patients with thyroid medullary carcinoma, and it is also often elevated in nonthyroid neuroendocrine malignancies. Proteolytic cleavage of procalcitonin to active calcitonin takes place mainly or only in the thyroid, and under normal homeostatic conditions, procalcitonin is almost unmeasurable in the circulation. However, under major stress such as systemic inflammation, sepsis, or burns, the CALC1 gene is activated in parenchymal cells in many organs, and procalcitonin is synthesized and released. Notably, under these conditions, the procalcitonin does not seem to be of thyroid origin; hence, calcitonin levels do not rise markedly. The physiologic role of nonthyroidal procalcitonin is unknown.
Procalcitonin synthesis and secretion is turned on in nonthyroid tissue by multiple cytokines; the cytokines most likely relevant to its association with inflammation and infections are interleukin (IL) 1 beta, tumor necrosis factor (TNF) alpha, and IL-6. Since these same mediators drive the acute-phase response and elicit the increase in circulating CRP and fibrinogen (the major contributor to the ESR), the obvious question is why procalcitonin might be a more reliable biomarker to distinguish bacterial infection from inflammation or a viral infection than the CRP level or ESR. And although it does indeed seem to do so in several conditions, as Dr. Fakheri discusses, the explanation is not obvious. But it is intriguing to hypothesize.
Induction of procalcitonin by endotoxin-stimulated cytokines is rapid and seems to be slightly faster than that of CRP, although there may be issues of assay sensitivity. The half-life of procalcitonin is similar to that of CRP (about 24 hours). Its degradation does not seem to be altered in renal insufficiency, and its synthesis seems to rapidly shut off as the cytokine level drops. But interestingly, and perhaps relevant to its possible unique biomarker behavior, its synthesis seems to depend on factors other than the increase in inflammatory cytokines such as IL-6. Under certain circumstances, in the same patient, there is a discrepancy between the levels of procalcitonin and CRP.
In a small study of patients with pulmonary embolism and fever, IL-6 levels increased in many with an expected accompanying increase in CRP and ESR, but procalcitonin did not markedly rise,1 although all 3 markers rose as expected in patients with bacterial pneumonia.
Even more provocative is another study in 69 patients with systemic lupus erythematosus and bacterial infection (43 patients had sepsis, 11 of whom died). The CRP level rose dramatically in the infected patients, but procalcitonin did not.2
The intriguing aspect of this, assuming it holds true in other studies, is that interferon activity is high in lupus and many viral infections, and if interferon can suppress CALC1 gene activation3 but leave CRP activation unaffected, this may provide a clue as to why CRP but not procalcitonin is elevated in serious viral infections, thus allowing procalcitonin to more effectively distinguish bacterial from viral and other nonbacterial inflammatory responses.
The two studies I mention are small, some conflicting results have been published, and the results cannot yet be generalized. Plus, it has long been recognized there is sometimes discordance in a given patient between the elevation in ESR and CRP, not readily explained by the presence of a paraprotein, rheologic factors, or the different time course of decay in the ESR and CRP response. Whatever the explanation, procalcitonin’s biology is interesting, and clinical study results show promise. While tracking procalcitonin levels is not uniformly useful (eg, there is no convincing value in using procalcitonin in the diagnosis of prosthetic joint infections), there is accumulating evidence that it can guide us to using shorter but still effective courses of antibiotics in several clinical scenarios. Hopefully, more frequent use of the test will make a dent in our apparent excess use of antibiotics in patients with nonbacterial upper-respiratory infections.
- Köktürk N, Kanbay A, Bukan N, Ekim N. The value of serum procalcitonin in differential diagnosis of pulmonary embolism and community acquired pneumonia. Clin App Thromb Hemostasis 2011; 17(5):519–525. doi:10.1177/1076029610375425
- El-Serougy E, Zayed HS, Ibrahim NM, Maged LA. Procalcitonin and C-reactive protein as markers of infection in systemic lupus erythematosus: the controversy continues. Lupus 2018 Jan 1:961203318777101. doi:10.1177/0961203318777101 (e-pub ahead of print)
- Linscheid P, Seboek D, Nylen ES, et al. In vitro and in vivo calcitonin I gene expression in parenchymal cells: a novel product of human adipose tissue. Endocrinology 2003; 144(12): 5578–5584. doi:10.1210/en.2003-0854
Diagnostic algorithms have been proposed to help recognize infection in chronic obstructive pulmonary disease, rhinosinusitis syndrome, acute arthritis, pharyngitis, and possible sepsis. The algorithms have included laboratory tests and potential biomarkers, but all are imperfect despite achieving various degrees of acceptance in practice.
In this issue of the Journal, Dr. Fakheri updates us on using the data on serum procalcitonin levels to guide starting and stopping antibiotics in different clinical scenarios. As I read the paper, I wondered what was different about procalcitonin that might allow it to succeed where seemingly similar biomarkers like C-reactive protein (CRP) and the erythrocyte sedimentation rate (ESR) have failed.
Procalcitonin is the approximately 15,000-kD product of the CALC1 gene and the precursor of calcitonin. Not surprisingly, then, it is increased in patients with thyroid medullary carcinoma, and it is also often elevated in nonthyroid neuroendocrine malignancies. Proteolytic cleavage of procalcitonin to active calcitonin takes place mainly or only in the thyroid, and under normal homeostatic conditions, procalcitonin is almost unmeasurable in the circulation. However, under major stress such as systemic inflammation, sepsis, or burns, the CALC1 gene is activated in parenchymal cells in many organs, and procalcitonin is synthesized and released. Notably, under these conditions, the procalcitonin does not seem to be of thyroid origin; hence, calcitonin levels do not rise markedly. The physiologic role of nonthyroidal procalcitonin is unknown.
Procalcitonin synthesis and secretion is turned on in nonthyroid tissue by multiple cytokines; the cytokines most likely relevant to its association with inflammation and infections are interleukin (IL) 1 beta, tumor necrosis factor (TNF) alpha, and IL-6. Since these same mediators drive the acute-phase response and elicit the increase in circulating CRP and fibrinogen (the major contributor to the ESR), the obvious question is why procalcitonin might be a more reliable biomarker to distinguish bacterial infection from inflammation or a viral infection than the CRP level or ESR. And although it does indeed seem to do so in several conditions, as Dr. Fakheri discusses, the explanation is not obvious. But it is intriguing to hypothesize.
Induction of procalcitonin by endotoxin-stimulated cytokines is rapid and seems to be slightly faster than that of CRP, although there may be issues of assay sensitivity. The half-life of procalcitonin is similar to that of CRP (about 24 hours). Its degradation does not seem to be altered in renal insufficiency, and its synthesis seems to rapidly shut off as the cytokine level drops. But interestingly, and perhaps relevant to its possible unique biomarker behavior, its synthesis seems to depend on factors other than the increase in inflammatory cytokines such as IL-6. Under certain circumstances, in the same patient, there is a discrepancy between the levels of procalcitonin and CRP.
In a small study of patients with pulmonary embolism and fever, IL-6 levels increased in many with an expected accompanying increase in CRP and ESR, but procalcitonin did not markedly rise,1 although all 3 markers rose as expected in patients with bacterial pneumonia.
Even more provocative is another study in 69 patients with systemic lupus erythematosus and bacterial infection (43 patients had sepsis, 11 of whom died). The CRP level rose dramatically in the infected patients, but procalcitonin did not.2
The intriguing aspect of this, assuming it holds true in other studies, is that interferon activity is high in lupus and many viral infections, and if interferon can suppress CALC1 gene activation3 but leave CRP activation unaffected, this may provide a clue as to why CRP but not procalcitonin is elevated in serious viral infections, thus allowing procalcitonin to more effectively distinguish bacterial from viral and other nonbacterial inflammatory responses.
The two studies I mention are small, some conflicting results have been published, and the results cannot yet be generalized. Plus, it has long been recognized there is sometimes discordance in a given patient between the elevation in ESR and CRP, not readily explained by the presence of a paraprotein, rheologic factors, or the different time course of decay in the ESR and CRP response. Whatever the explanation, procalcitonin’s biology is interesting, and clinical study results show promise. While tracking procalcitonin levels is not uniformly useful (eg, there is no convincing value in using procalcitonin in the diagnosis of prosthetic joint infections), there is accumulating evidence that it can guide us to using shorter but still effective courses of antibiotics in several clinical scenarios. Hopefully, more frequent use of the test will make a dent in our apparent excess use of antibiotics in patients with nonbacterial upper-respiratory infections.
- Köktürk N, Kanbay A, Bukan N, Ekim N. The value of serum procalcitonin in differential diagnosis of pulmonary embolism and community acquired pneumonia. Clin App Thromb Hemostasis 2011; 17(5):519–525. doi:10.1177/1076029610375425
- El-Serougy E, Zayed HS, Ibrahim NM, Maged LA. Procalcitonin and C-reactive protein as markers of infection in systemic lupus erythematosus: the controversy continues. Lupus 2018 Jan 1:961203318777101. doi:10.1177/0961203318777101 (e-pub ahead of print)
- Linscheid P, Seboek D, Nylen ES, et al. In vitro and in vivo calcitonin I gene expression in parenchymal cells: a novel product of human adipose tissue. Endocrinology 2003; 144(12): 5578–5584. doi:10.1210/en.2003-0854

Leadership and Professional Development: The Healing Power of Laughter
“The most radical act anyone can commit is to be happy.”
—Patch Adams
“The most radical act anyone can commit is to be happy.”
—Patch Adams
“The most radical act anyone can commit is to be happy.”
—Patch Adams
© 2019 Society of Hospital Medicine
Electronic health records linked to lower patient safety
Higher reliance on electronic health records (EHRs) in ambulatory oncology practice was significantly associated with reduced safety actions among oncology nurses and prescribers, according to results of a statewide survey.
“The purpose of this study was to investigate the degree to which EHRs, satisfaction with technology, and clinician communication enable a safety culture in ambulatory oncology treatment settings,” wrote Minal R. Patel, PhD, MPH, of the University of Michigan, Ann Arbor, and colleagues. The report is published in the Journal of Oncology Practice.
The researchers conducted a statewide survey of 297 oncology nurses and prescribers in 29 ambulatory oncology practices in Michigan. They obtained quantitative data for May to October 2017 from clinician surveys and practice logs at these clinical sites.
The study methodology was built by use of the sociotechnical framework, which examined how EHR technologies influenced the safe administration of chemotherapy.
Eligible survey participants included physicians, nurses, physician assistants, and nurse practitioners who cared for adult patients receiving infusion treatments for cancer.
A total of 438 clinicians were recruited and confirmed to be eligible, and 297 (68%) completed a survey.
After analysis, the researchers found that higher reliance on electronic health records in practice was associated with reduced safety scores (P less than .001). The mean safety score was reported to be 5.3 (standard deviation, 1.1; practice-level range, 4.9-5.4).
In an opposite manner, increased satisfaction with technology and better-quality communication were associated with higher safety actions.
The researchers acknowledged a key limitation of the study was cross-sectional design. As a result, confounding factors could influence the findings.
“Careful attention to technology adoption and updates coupled with high-quality communication skills across clinicians are promising strategies to administer high-risk treatments safely in ambulatory oncology settings,” they concluded.
The study was supported by grant funding from the Agency for Healthcare Research and Quality and the National Cancer Institute. No conflicts of interest were reported.
SOURCE: Patel MR et al. J Oncol Pract. 2019 Apr 22. doi: 10.1200/JOP.18.00507.
FROM JOURNAL OF ONCOLOGY PRACTICE
Focus on Science, Not Format: Introducing No Hassle Submissions to the Journal of Hospital Medicine
The Journal of Hospital Medicine® is committed to continually improving the author experience. Our goal is to allow authors to focus more time on communicating their message and less time on navigating the submission and publication process. We commit to three initial areas of emphasis: (1) Make it easy for authors to submit their work; (2) Make timely disposition decisions; and (3) Facilitate dissemination of work that we publish.
We are pleased to introduce a new “No hassle” process for initial original research and brief report manuscript submissions. There is no universally followed format for manuscript submission to medical journals.1-3 As a result, authors spend considerable time reformatting manuscripts for submission to meet each journal’s unique requirements before knowing whether or not their manuscript will be accepted for publication—or even sent for peer review. To streamline the submission process and eliminate unnecessary and burdensome reformatting, we have eased formatting requirements for initial manuscript submissions. We will even accept all manuscript elements in a single PDF (portable document format) file in another journal’s format if your manuscript was submitted elsewhere first but not accepted for publication. Tables and figures can be included in the single document or uploaded separately, depending on your preference. Of course, common elements necessary to assess a manuscript, including declaration of funding sources and conflicts of interest, are required on the title page.1 Journal-specific formatting and signed disclosure and copyright forms will be deferred until a revision request.
We also seek to make timely decisions. Our rapid turnaround allows authors to submit elsewhere expeditiously if not accepted by the Journal of Hospital Medicine. We reject approximately 50% of original research and brief report manuscripts without formal peer review. The rationale for this approach is two-fold. We want to be respectful of how we engage our peer reviewers and we would rather not have them spend time reviewing manuscripts that we are unlikely to publish. We also want to be respectful of our authors’ time. If we are unlikely to publish a manuscript based on lower priority scores assigned by the Editor-in-Chief and other journal editors, we prefer to return the manuscript to authors for timely submission elsewhere. Our average time from submission to rejection without formal peer review is 1.3 days (median, <1 day). If we send a manuscript out for peer review, our time from submission to first decision is 23 days. Further, if we request a manuscript revision, we sincerely hope to publish the manuscript. Thus, most manuscripts for which we request a revision are ultimately accepted for publication. We are also tracking how quickly we can publish accepted manuscripts with a goal of 120 or fewer days from submission to publication and 60 or fewer days from acceptance to publication.
We highlight our published research in many ways to facilitate dissemination. We promote articles through formal press releases, tweets, visual abstracts, and, more recently, graphic medicine abstracts or comics. Select articles are discussed through our online journal club (#JHMChat).4 Other synergistic methods of dissemination are being planned and we’ll share these ideas with you in the coming year.
We are grateful to receive a large number of submissions and are honored that authors view the Journal of Hospital Medicine as an important venue to showcase their work. We continually strive to improve the author experience and welcome your input.
1. International Committee of Medical Journal Editors. Recommendations for the conduct, reporting, editing, and publication of scholarly work in medical journals. Updated December 2018. www.icmje.org/recommendations/browse/. Accessed April 2, 2019. PubMed
2. Schriger DL, Arora S, Altman DG. The content of medical journal instructions for authors. Ann Emerg Med. 2006;48(6):743-749. doi: 10.1016/j.annemergmed.2006.03.028 PubMed
3. Barron JP. The uniform requirements for manuscripts submitted to biomedical journals recommended by the International Committee of Medical Journal Editors. Chest. 2006;129(4):1098-1099. doi: 10.1378/chest.129.4.1098. PubMed
4. Wray CM, Auerbach AD, Arora VM. The adoption of an online journal club to improve research dissemination and social media engagement among hospitalists. J Hosp Med. 2018;13(11):764-769. doi: 10.12788/jhm.2987. PubMed
The Journal of Hospital Medicine® is committed to continually improving the author experience. Our goal is to allow authors to focus more time on communicating their message and less time on navigating the submission and publication process. We commit to three initial areas of emphasis: (1) Make it easy for authors to submit their work; (2) Make timely disposition decisions; and (3) Facilitate dissemination of work that we publish.
We are pleased to introduce a new “No hassle” process for initial original research and brief report manuscript submissions. There is no universally followed format for manuscript submission to medical journals.1-3 As a result, authors spend considerable time reformatting manuscripts for submission to meet each journal’s unique requirements before knowing whether or not their manuscript will be accepted for publication—or even sent for peer review. To streamline the submission process and eliminate unnecessary and burdensome reformatting, we have eased formatting requirements for initial manuscript submissions. We will even accept all manuscript elements in a single PDF (portable document format) file in another journal’s format if your manuscript was submitted elsewhere first but not accepted for publication. Tables and figures can be included in the single document or uploaded separately, depending on your preference. Of course, common elements necessary to assess a manuscript, including declaration of funding sources and conflicts of interest, are required on the title page.1 Journal-specific formatting and signed disclosure and copyright forms will be deferred until a revision request.
We also seek to make timely decisions. Our rapid turnaround allows authors to submit elsewhere expeditiously if not accepted by the Journal of Hospital Medicine. We reject approximately 50% of original research and brief report manuscripts without formal peer review. The rationale for this approach is two-fold. We want to be respectful of how we engage our peer reviewers and we would rather not have them spend time reviewing manuscripts that we are unlikely to publish. We also want to be respectful of our authors’ time. If we are unlikely to publish a manuscript based on lower priority scores assigned by the Editor-in-Chief and other journal editors, we prefer to return the manuscript to authors for timely submission elsewhere. Our average time from submission to rejection without formal peer review is 1.3 days (median, <1 day). If we send a manuscript out for peer review, our time from submission to first decision is 23 days. Further, if we request a manuscript revision, we sincerely hope to publish the manuscript. Thus, most manuscripts for which we request a revision are ultimately accepted for publication. We are also tracking how quickly we can publish accepted manuscripts with a goal of 120 or fewer days from submission to publication and 60 or fewer days from acceptance to publication.
We highlight our published research in many ways to facilitate dissemination. We promote articles through formal press releases, tweets, visual abstracts, and, more recently, graphic medicine abstracts or comics. Select articles are discussed through our online journal club (#JHMChat).4 Other synergistic methods of dissemination are being planned and we’ll share these ideas with you in the coming year.
We are grateful to receive a large number of submissions and are honored that authors view the Journal of Hospital Medicine as an important venue to showcase their work. We continually strive to improve the author experience and welcome your input.
1. International Committee of Medical Journal Editors. Recommendations for the conduct, reporting, editing, and publication of scholarly work in medical journals. Updated December 2018. www.icmje.org/recommendations/browse/. Accessed April 2, 2019. PubMed
2. Schriger DL, Arora S, Altman DG. The content of medical journal instructions for authors. Ann Emerg Med. 2006;48(6):743-749. doi: 10.1016/j.annemergmed.2006.03.028 PubMed
3. Barron JP. The uniform requirements for manuscripts submitted to biomedical journals recommended by the International Committee of Medical Journal Editors. Chest. 2006;129(4):1098-1099. doi: 10.1378/chest.129.4.1098. PubMed
4. Wray CM, Auerbach AD, Arora VM. The adoption of an online journal club to improve research dissemination and social media engagement among hospitalists. J Hosp Med. 2018;13(11):764-769. doi: 10.12788/jhm.2987. PubMed
© 2019 Society of Hospital Medicine
Things We Do For No Reason: HIT Testing in Low Probability Patients
Inspired by the ABIM Foundation’s Choosing Wisely® campaign, the “Things We Do for No Reason” series reviews practices which have become common parts of hospital care but which may provide little value to our patients. Practices reviewed in the TWDFNR series do not represent “black and white” conclusions or clinical practice standards, but are meant as a starting place for research and active discussions among hospitalists and patients. We invite you to be part of that discussion.
CLINICAL SCENARIO
A 59-year-old man with cirrhosis secondary to nonalcoholic steatohepatitis was admitted to the intensive care unit (ICU) for management of hepatorenal syndrome and work-up for liver transplantation. On admission, his platelet count was 90 × 109/L (normal 150-400 × 109/L), and he was started on thromboprophylaxis with unfractionated heparin (UFH) 5,000 units subcutaneously twice daily. His platelet count began to fall two days after admission. He did have a history of prior heparin exposure associated with his hemodialysis sessions in the past 30 days. During this period, he also had an episode of fever, and antibiotics were initiated for a presumed line infection. He also required periodic vasopressor support for hypotension. His platelet count reached 14 × 109/L by the end of two weeks. He did not have any symptoms of thrombosis, skin necrosis, or reaction to heparin exposure.
BACKGROUND
Thrombocytopenia is common, especially during critical illness, occurring in up to 50% of patients.1 In this population, thrombocytopenia is often due to sepsis, hemorrhage, liver dysfunction, and drug reactions.1,2 Heparin-induced thrombocytopenia (HIT) is an acquired thrombotic drug reaction resulting from platelet activation secondary to antibodies formed against the heparin-modified platelet factor 4 (PF4) complexes.3 This leads to platelet aggregation and dysregulation of the coagulation cascade, which can result in arterial or venous thromboembolic events in up to 50% of patients.3 Mortality associated with HIT can be as high as 30% in this critically ill population.3 Diagnosis of HIT can be made initially through the enzyme-linked immunosorbent assay (ELISA). Management of HIT involves immediate cessation of heparin and initiation of therapeutic anticoagulation with nonheparin agents in order to prevent or treat the thrombotic events.4,5
The true incidence of HIT remains low, occurring in 0.2% to 5% of patients exposed to heparin and less than 1% in the ICU population.2,3,6,7 However, given the high incidence of thrombocytopenia in the ICU, the diagnosis of HIT is often considered, resulting in over-testing in this population. Studies suggest that more than 200 ELISAs are requested per year at many hospitals.8,9 This can lead to significant clinical and economic consequences.
WHY YOU MIGHT THINK HIT TESTING WITH ELISA IS HELPFUL
Thrombocytopenia is common in hospitalized patients while heparin is frequently used for thromboprophylaxis or therapeutic anticoagulation. As a result, a diagnosis of HIT is often considered.1 The high stakes of the inpatient environment, coupled with the increased frequency of thrombocytopenia and heparin exposure, has led to increased use of HIT testing in this population.10
The most widely available diagnostic test for HIT is the ELISA which detects anti-PF4-heparin antibodies but also nonpathogenic antibodies.11 As a result, the ELISA has a sensitivity close to 100%, allowing physicians to rule out HIT if the test is negative, as indicated by an optical density (OD) of less than 0.4.7 Confirmatory testing with the functional serotonin release assay (SRA) is the reference standard as it confers both a high sensitivity and specificity for HIT.11 Due to technical aspects, SRA, unlike the ELISA, is not available in every center and is often outsourced to external labs. Turn-around time for external SRA testing can vary from days to weeks versus hours for the ELISA. The cost for SRA is approximately $120 (USD) per test compared to $30 (USD) per ELISA. Therefore, the ELISA is the recommended initial test due to its quick turn-around time and lower costs.12,13 For these reasons, the SRA test should not be used initially, but rather to confirm the diagnosis of HIT in patients with a positive ELISA.
WHY YOU SHOULD NOT TEST LOW PROBABILITY PATIENTS FOR HIT
The “4T’s” scoring system is a clinical scoring system that estimates the pretest probability of HIT using clinical and basic laboratory parameters (Table).14 The 4T’s score provides a pretest probability for HIT using four parameters: platelet count, timing of platelet fall, presence of thrombotic events, and the likelihood of another cause of thrombocytopenia. Based on these parameters, the pretest probability for HIT can be divided into three categories: low (4T’s score of ≤3), intermediate (score 4-5), or high (score 6-8).14-16
Validation of the 4T’s score has shown that a low probability score carries a negative predictive value of 99% in a patient population with varying HIT prevalence rates.14 Therefore, having a low score is sufficient to rule out HIT without the need for further laboratory testing.14-16 Although the HIT ELISA confers high sensitivity, due to its detection of nonpathogenic antibodies, its specificity can range from 74% to 84%.15 Therefore, in the setting of a low 4T’s score, HIT testing is not only unnecessary, it can be harmful due to the risk of treating a false positive result. For instance, assuming an average HIT prevalence of 1% and a false positive rate of 16% (specificity 84%), 1/17 (5.6%) patients with a positive ELISA will have HIT if testing is pursued in an indiscriminate manner. The American Society of Hematology Choosing Wisely® Campaign has highlighted this concern by advising physicians that they should “not test or treat for suspected HIT in patients with a low pretest probability of HIT.”17
False positive results on HIT tests are not a trivial concern. The most recognizable adverse event associated with HIT treatment is an elevated risk of bleeding while receiving nonheparin agents. Availability of nonheparin anticoagulants vary by center; however, the most commonly used agents include argatroban, danaparoid, bivalirudin, and off-label fondaparinux.4 Due to its short half-life and hepatic clearance, argatroban is commonly used for cases of confirmed or suspected HIT. A retrospective study assessing the bleeding risk of critically ill patients on argatroban therapy suggests a major bleeding risk of 10% within two days of argatroban initiation.18 In addition, factors such as the presence of elevated bilirubin, major surgery, weight >90 kg, and platelet count <70 × 109/L were found to be associated with increased risk for major bleeding.18 These identified risk factors are very common in the inpatient setting. As a result, monitoring and titration of argatroban can be
Over-diagnosis and over-treatment can also lead to significant costs to the healthcare system. A retrospective study assessing the use of HIT testing found that out of 218 HIT ELISA’s sent over a one-year period at a single institution, 161 (74%) were sent inappropriately (ie, in patients with a low pretest probability), with only one resulting in confirmed HIT by SRA. This incurred an additional cost of $33,000 (USD) for testing alone.8 A retrospective study of 85 patients assessed the costs of treating patients with a false positive HIT assay. They found that the average duration of treatment with a nonheparin agent was three days and the total cost per patient was $982 (USD).19 Treatment with a nonheparin agent such as argatroban costs more than $700 (USD) per day while the continuation of unfractionated heparin for prophylaxis costs less than $10 (USD) per day.20Lastly, a diagnosis of HIT can also result in late consequences due to heparin re-exposure. Clinicians may be wary of exposing patients to heparin in situations where heparin may be the most appropriate agent such as cardiovascular surgery, percutaneous interventions, routine thromboprophylaxis, or therapeutic anticoagulation. In these situations when heparin is the agent of choice, determining safety for re-exposure requires further antibody testing which may delay procedures or result in the use of alternative agents with their associated risks and cost implications.4
WHEN HIT TESTING WITH ELISA MAY BE HELPFUL
Laboratory testing for HIT is appropriate when the pretest probability for HIT is intermediate or high based on the 4T’s score.14-16 Studies assessing the application of the 4T’s score have shown that a moderate or high pretest probability carries a probability of having true HIT in 14% and 64% of the cases respectively.14 However, due to the subjective nature of the 4T’s score components, it is important to recognize that in nonexpert hands, the 4T’s scoring system can suffer from a lack of interrater reliability.16
As discussed above, a negative ELISA (OD < 0.4) helps to rule out HIT and allow heparin to be safely reintroduced without any further testing. If ELISA is positive (OD ≥ 0.4) confirmation testing with SRA should be performed.5 However, studies suggest that the magnitude of the OD is associated with increased likelihood for true HIT, with an OD of greater than 2.00 associated with a positive SRA approximately 90% of the time.21 This suggests that if OD values are strongly positive (≥2.00), SRA can be deferred.5
Due to the SRA limited availability, confirmatory testing is not always possible or in some situations, SRA results may be negative despite a positive OD. In both these cases, discussion with the Hematology service is recommended.
WHAT WE SHOULD DO INSTEAD OF SENDING ELISA
When presented with a case of thrombocytopenia, it is important for clinicians to consider a broad approach in their differential diagnosis. Hospitalists should investigate common etiologies, consider the coagulation parameters, liver enzymes, nutritional status, peripheral blood smear, and a detailed history and physical exam to identify other common potential cause such as sepsis.
The 4T’s score should be applied in patients who have had recent heparin exposure. A score of ≤3 indicates a low pretest probability; therefore, HIT is unlikely and further testing is not needed. A score of ≥4 indicates an intermediate or high pretest probability and should prompt clinicians to consider further HIT testing with ELISA. In these situations, heparin should be held, and nonheparin agents should be initiated to prevent thromboembolic complications. In their study of ICU patients, Pierce et al. found that 17% of patients did not have a concurrent cessation of heparin and initiation of alternative agents despite a high clinical suspicion for HIT.1 Lastly, if hospitalists have concerns regarding HIT testing or management, expert consultation with the Hematology service is recommended.
RECOMMENDATIONS
- Consider a broad differential diagnosis when presented with a hospitalized patient with new thrombocytopenia given the low incidence of HIT (<5%).
- Apply the 4T’s score in those who have thrombocytopenia and recent heparin exposure. A low scores 4T’s score (≤3) predicts a low pretest probability and further testing is not required.
- Patients with moderate or high 4T’s score (≥4) should have the ELISA test. During this time, heparin should be discontinued and nonheparin agents initiated while waiting for test results.
- Confirmatory testing with SRA should be performed for all positive ELISAs; however, they can be deferred in patients with strongly positive OD (≥2.00) on ELISA.
CONCLUSION
In the opening clinical scenario, the 4T’s score would have been 2 (1 point for the platelet count, 1 point for the platelet count fall after 10 days, 0 points for thrombosis, and 0 points for an alternative cause of thrombocytopenia), indicating a low pretest probability. Further HIT testing should be deferred as the likelihood for HIT is low. In this case, the more likely etiology for his thrombocytopenia would be sepsis. Therefore, heparin can be safely reinitiated once the platelet count recovers. This case helps to illustrate the importance of keeping a broad differential in cases of thrombocytopenia in the hospitalized patient while concurrently applying the 4T’s score to determine appropriateness for further HIT testing. Ultimately by choosing wisely, we can help reduce the cost and safety implications of a falsely positive HIT diagnosis.
What do you do?
Do you think this is a low-value practice? Is this truly a “Thing We Do for No Reason”? Let us know what you do in your practice and propose ideas for other “Things We Do for No Reason” topics. Please join in the conversation online at Twitter (#TWDFNR)/Facebook and don’t forget to “Like It” on Facebook or retweet it on Twitter.
Disclosures
The authors report no conflict of interest.
1. Pierce W, Mazur J, Greenberg C, Mueller J, Foster J, Lazarchick J. Evaluation of heparin-induced thrombocytopenia (HIT) laboratory testing and the 4Ts scoring system in the intensive care unit. Ann Clin Lab Sci. 2013;43(4):429-435. PubMed
2. Harada MY, Hoang DM, Zaw AA, et al. Overtreatment of heparin-induced thrombocytopenia in the surgical ICU. Crit Care Med. 2017;45(1):28-34. doi:10.1097/ccm.0000000000002002. PubMed
3. Warkentin TE, Sheppard JAI, Heels-Ansdell D, et al. Heparin-induced thrombocytopenia in medical-surgical critical illness. Chest. 2013;144(3):848-858. doi: 10.1378/chest.13-0057. PubMed
4. Linkins LA, Dans AL, Moores LK, et al. Treatment and prevention of heparin-induced thrombocytopenia. Chest. 2012;141(2):e495S-e530S. doi: 10.1378/chest.11-2303. PubMed
5. Cuker A, Arepally GM, Chong BH, et al. American Society of Hematology 2018 guidelines for management of venous thromboembolism: heparin-induced thrombocytopenia. Blood Adv. 2018;2(22):3360-3392. doi: 10.1182/bloodadvances.2018024489. PubMed
6. Lo GK, Juhl D, Warkentin TE, Sigouin CS, Eichler P, Greinacher A. Evaluation of pretest clinical score (4 T’s) for the diagnosis of heparin-induced thrombocytopenia in two clinical settings. J Thromb Haemost. 2006;4(4):759-765. doi: 10.1111/j.1538-7836.2006.01787.x PubMed
7. Cuker A, Cines DB. How I treat heparin-induced thrombocytopenia. Blood. 2012;119(10):2209-2218. doi: 10.1182/blood-2011-11-376293. PubMed
8. Elmer P, Passero FC, Xavier M. Retrospective Analysis of Heparin-Induced Thrombocytopenia Management at a Large Tertiary Hospital. J Hematol. 2014;3(2):27-33. doi: http://dx.doi.org/10.14740/jh157w.
9. Goldman R, Ustun B, Levine RL. Retrospective cost analysis of testing for HIT antibodies in a community hospital. Blood. 2008;112(11):4544.
10. Cuker A. Heparin-induced thrombocytopenia (HIT) in 2011: an epidemic of overdiagnosis. Thromb Haemost. 2011;106(6):993-994. doi: 10.1160/TH11-09-0677.
11. Warkentin TE. Heparin-induced thrombocytopenia in critically ill patients. Semin Thromb Hemost. 2015;41(5):49-60. doi: 10.1055/s-0034-1398381. PubMed
12. Caton S, O’Brien E, Pannelay AJ, Cook RG. Assessing the clinical and cost impact of on-demand immunoassay testing for the diagnosis of heparin-induced thrombocytopenia. Thromb Res. 2016;140:155-162. doi: 10.1016/j.thromres.2016.01.025 PubMed
13. Nanwa N, Mittmann N, Knowles S, et al. The direct medical costs associated with suspected heparin-induced thrombocytopenia. Pharmacoeconomics. 2011;29(6):511-520. doi: 10.2165/11584330-000000000-00000. PubMed
14. Cuker A, Gimotty PA, Crowther MA, Warkentin TE. Predictive value of the 4Ts scoring system for heparin-induced thrombocytopenia: a systematic review and meta-analysis. Blood. 2012;120(20):4160-4167. doi: 10.1182/blood-2012-07-443051. PubMed
15. Fiorenza MA, Frazee EN, Personett HA, Dierkhising RA, Schramm GE. Assessment of a modified 4T scoring system for heparin-induced thrombocytopenia in critically ill patients. J Crit Care. 2014;29(3):426-431. doi: 10.1016/j.jcrc.2013.12.010. PubMed
16. Crowther M, Cook D, Guyatt G, et al. Heparin-induced thrombocytopenia in the critically ill: interpreting the 4Ts test in a randomized trial. J Crit Care. 2014;29(3):470.e7-470.e15 doi: 10.1016/j.jcrc.2014.02.004. PubMed
17. Hicks LK, Bering H, Carson KR, et al. The ASH Choosing Wisely campaign: five hematologic tests and treatments to question. Blood. 2013;122(24):3879-3883. doi: 10.1182/blood-2013-07-518423. PubMed
18. Doepker B, Mount KL, Ryder LJ, Gerlach AT, Murphy CV, Philips GS. Bleeding risk factors associated with argatroban therapy in the critically ill. J Thromb Thrombolysis. 2012;34(4):491-498. doi: 10.1007/s11239-012-0758-y. PubMed
19. Marler J, Unzaga J, Stelts S, Oliphant CS. Consequences of treating false positive heparin-induced thrombocytopenia. J Thromb Thrombolysis. 2015;40(4):512-514. doi: 10.1007/s11239-015-1236-0. PubMed
20. Fowler RA, Mittmann N, Geerts W, et al. Cost-effectiveness of dalteparin vs unfractionated heparin for the prevention of venous thromboembolism in critically ill patients. JAMA. 2014;312(20):2135-2145. doi: 10.1001/jama.2014.15101. PubMed
21. Warkentin TE, Sheppard JI, Moore JC, Sigouin CS, Kelton JG. Quantitative interpretation of optical density measurements using PF4-dependent enzyme-immunoassays. J Thromb Haemost. 2008;6(8):1304-1312. doi: 10.1111/j.1538-7836.2008.03025.x. PubMed
Inspired by the ABIM Foundation’s Choosing Wisely® campaign, the “Things We Do for No Reason” series reviews practices which have become common parts of hospital care but which may provide little value to our patients. Practices reviewed in the TWDFNR series do not represent “black and white” conclusions or clinical practice standards, but are meant as a starting place for research and active discussions among hospitalists and patients. We invite you to be part of that discussion.
CLINICAL SCENARIO
A 59-year-old man with cirrhosis secondary to nonalcoholic steatohepatitis was admitted to the intensive care unit (ICU) for management of hepatorenal syndrome and work-up for liver transplantation. On admission, his platelet count was 90 × 109/L (normal 150-400 × 109/L), and he was started on thromboprophylaxis with unfractionated heparin (UFH) 5,000 units subcutaneously twice daily. His platelet count began to fall two days after admission. He did have a history of prior heparin exposure associated with his hemodialysis sessions in the past 30 days. During this period, he also had an episode of fever, and antibiotics were initiated for a presumed line infection. He also required periodic vasopressor support for hypotension. His platelet count reached 14 × 109/L by the end of two weeks. He did not have any symptoms of thrombosis, skin necrosis, or reaction to heparin exposure.
BACKGROUND
Thrombocytopenia is common, especially during critical illness, occurring in up to 50% of patients.1 In this population, thrombocytopenia is often due to sepsis, hemorrhage, liver dysfunction, and drug reactions.1,2 Heparin-induced thrombocytopenia (HIT) is an acquired thrombotic drug reaction resulting from platelet activation secondary to antibodies formed against the heparin-modified platelet factor 4 (PF4) complexes.3 This leads to platelet aggregation and dysregulation of the coagulation cascade, which can result in arterial or venous thromboembolic events in up to 50% of patients.3 Mortality associated with HIT can be as high as 30% in this critically ill population.3 Diagnosis of HIT can be made initially through the enzyme-linked immunosorbent assay (ELISA). Management of HIT involves immediate cessation of heparin and initiation of therapeutic anticoagulation with nonheparin agents in order to prevent or treat the thrombotic events.4,5
The true incidence of HIT remains low, occurring in 0.2% to 5% of patients exposed to heparin and less than 1% in the ICU population.2,3,6,7 However, given the high incidence of thrombocytopenia in the ICU, the diagnosis of HIT is often considered, resulting in over-testing in this population. Studies suggest that more than 200 ELISAs are requested per year at many hospitals.8,9 This can lead to significant clinical and economic consequences.
WHY YOU MIGHT THINK HIT TESTING WITH ELISA IS HELPFUL
Thrombocytopenia is common in hospitalized patients while heparin is frequently used for thromboprophylaxis or therapeutic anticoagulation. As a result, a diagnosis of HIT is often considered.1 The high stakes of the inpatient environment, coupled with the increased frequency of thrombocytopenia and heparin exposure, has led to increased use of HIT testing in this population.10
The most widely available diagnostic test for HIT is the ELISA which detects anti-PF4-heparin antibodies but also nonpathogenic antibodies.11 As a result, the ELISA has a sensitivity close to 100%, allowing physicians to rule out HIT if the test is negative, as indicated by an optical density (OD) of less than 0.4.7 Confirmatory testing with the functional serotonin release assay (SRA) is the reference standard as it confers both a high sensitivity and specificity for HIT.11 Due to technical aspects, SRA, unlike the ELISA, is not available in every center and is often outsourced to external labs. Turn-around time for external SRA testing can vary from days to weeks versus hours for the ELISA. The cost for SRA is approximately $120 (USD) per test compared to $30 (USD) per ELISA. Therefore, the ELISA is the recommended initial test due to its quick turn-around time and lower costs.12,13 For these reasons, the SRA test should not be used initially, but rather to confirm the diagnosis of HIT in patients with a positive ELISA.
WHY YOU SHOULD NOT TEST LOW PROBABILITY PATIENTS FOR HIT
The “4T’s” scoring system is a clinical scoring system that estimates the pretest probability of HIT using clinical and basic laboratory parameters (Table).14 The 4T’s score provides a pretest probability for HIT using four parameters: platelet count, timing of platelet fall, presence of thrombotic events, and the likelihood of another cause of thrombocytopenia. Based on these parameters, the pretest probability for HIT can be divided into three categories: low (4T’s score of ≤3), intermediate (score 4-5), or high (score 6-8).14-16
Validation of the 4T’s score has shown that a low probability score carries a negative predictive value of 99% in a patient population with varying HIT prevalence rates.14 Therefore, having a low score is sufficient to rule out HIT without the need for further laboratory testing.14-16 Although the HIT ELISA confers high sensitivity, due to its detection of nonpathogenic antibodies, its specificity can range from 74% to 84%.15 Therefore, in the setting of a low 4T’s score, HIT testing is not only unnecessary, it can be harmful due to the risk of treating a false positive result. For instance, assuming an average HIT prevalence of 1% and a false positive rate of 16% (specificity 84%), 1/17 (5.6%) patients with a positive ELISA will have HIT if testing is pursued in an indiscriminate manner. The American Society of Hematology Choosing Wisely® Campaign has highlighted this concern by advising physicians that they should “not test or treat for suspected HIT in patients with a low pretest probability of HIT.”17
False positive results on HIT tests are not a trivial concern. The most recognizable adverse event associated with HIT treatment is an elevated risk of bleeding while receiving nonheparin agents. Availability of nonheparin anticoagulants vary by center; however, the most commonly used agents include argatroban, danaparoid, bivalirudin, and off-label fondaparinux.4 Due to its short half-life and hepatic clearance, argatroban is commonly used for cases of confirmed or suspected HIT. A retrospective study assessing the bleeding risk of critically ill patients on argatroban therapy suggests a major bleeding risk of 10% within two days of argatroban initiation.18 In addition, factors such as the presence of elevated bilirubin, major surgery, weight >90 kg, and platelet count <70 × 109/L were found to be associated with increased risk for major bleeding.18 These identified risk factors are very common in the inpatient setting. As a result, monitoring and titration of argatroban can be
Over-diagnosis and over-treatment can also lead to significant costs to the healthcare system. A retrospective study assessing the use of HIT testing found that out of 218 HIT ELISA’s sent over a one-year period at a single institution, 161 (74%) were sent inappropriately (ie, in patients with a low pretest probability), with only one resulting in confirmed HIT by SRA. This incurred an additional cost of $33,000 (USD) for testing alone.8 A retrospective study of 85 patients assessed the costs of treating patients with a false positive HIT assay. They found that the average duration of treatment with a nonheparin agent was three days and the total cost per patient was $982 (USD).19 Treatment with a nonheparin agent such as argatroban costs more than $700 (USD) per day while the continuation of unfractionated heparin for prophylaxis costs less than $10 (USD) per day.20Lastly, a diagnosis of HIT can also result in late consequences due to heparin re-exposure. Clinicians may be wary of exposing patients to heparin in situations where heparin may be the most appropriate agent such as cardiovascular surgery, percutaneous interventions, routine thromboprophylaxis, or therapeutic anticoagulation. In these situations when heparin is the agent of choice, determining safety for re-exposure requires further antibody testing which may delay procedures or result in the use of alternative agents with their associated risks and cost implications.4
WHEN HIT TESTING WITH ELISA MAY BE HELPFUL
Laboratory testing for HIT is appropriate when the pretest probability for HIT is intermediate or high based on the 4T’s score.14-16 Studies assessing the application of the 4T’s score have shown that a moderate or high pretest probability carries a probability of having true HIT in 14% and 64% of the cases respectively.14 However, due to the subjective nature of the 4T’s score components, it is important to recognize that in nonexpert hands, the 4T’s scoring system can suffer from a lack of interrater reliability.16
As discussed above, a negative ELISA (OD < 0.4) helps to rule out HIT and allow heparin to be safely reintroduced without any further testing. If ELISA is positive (OD ≥ 0.4) confirmation testing with SRA should be performed.5 However, studies suggest that the magnitude of the OD is associated with increased likelihood for true HIT, with an OD of greater than 2.00 associated with a positive SRA approximately 90% of the time.21 This suggests that if OD values are strongly positive (≥2.00), SRA can be deferred.5
Due to the SRA limited availability, confirmatory testing is not always possible or in some situations, SRA results may be negative despite a positive OD. In both these cases, discussion with the Hematology service is recommended.
WHAT WE SHOULD DO INSTEAD OF SENDING ELISA
When presented with a case of thrombocytopenia, it is important for clinicians to consider a broad approach in their differential diagnosis. Hospitalists should investigate common etiologies, consider the coagulation parameters, liver enzymes, nutritional status, peripheral blood smear, and a detailed history and physical exam to identify other common potential cause such as sepsis.
The 4T’s score should be applied in patients who have had recent heparin exposure. A score of ≤3 indicates a low pretest probability; therefore, HIT is unlikely and further testing is not needed. A score of ≥4 indicates an intermediate or high pretest probability and should prompt clinicians to consider further HIT testing with ELISA. In these situations, heparin should be held, and nonheparin agents should be initiated to prevent thromboembolic complications. In their study of ICU patients, Pierce et al. found that 17% of patients did not have a concurrent cessation of heparin and initiation of alternative agents despite a high clinical suspicion for HIT.1 Lastly, if hospitalists have concerns regarding HIT testing or management, expert consultation with the Hematology service is recommended.
RECOMMENDATIONS
- Consider a broad differential diagnosis when presented with a hospitalized patient with new thrombocytopenia given the low incidence of HIT (<5%).
- Apply the 4T’s score in those who have thrombocytopenia and recent heparin exposure. A low scores 4T’s score (≤3) predicts a low pretest probability and further testing is not required.
- Patients with moderate or high 4T’s score (≥4) should have the ELISA test. During this time, heparin should be discontinued and nonheparin agents initiated while waiting for test results.
- Confirmatory testing with SRA should be performed for all positive ELISAs; however, they can be deferred in patients with strongly positive OD (≥2.00) on ELISA.
CONCLUSION
In the opening clinical scenario, the 4T’s score would have been 2 (1 point for the platelet count, 1 point for the platelet count fall after 10 days, 0 points for thrombosis, and 0 points for an alternative cause of thrombocytopenia), indicating a low pretest probability. Further HIT testing should be deferred as the likelihood for HIT is low. In this case, the more likely etiology for his thrombocytopenia would be sepsis. Therefore, heparin can be safely reinitiated once the platelet count recovers. This case helps to illustrate the importance of keeping a broad differential in cases of thrombocytopenia in the hospitalized patient while concurrently applying the 4T’s score to determine appropriateness for further HIT testing. Ultimately by choosing wisely, we can help reduce the cost and safety implications of a falsely positive HIT diagnosis.
What do you do?
Do you think this is a low-value practice? Is this truly a “Thing We Do for No Reason”? Let us know what you do in your practice and propose ideas for other “Things We Do for No Reason” topics. Please join in the conversation online at Twitter (#TWDFNR)/Facebook and don’t forget to “Like It” on Facebook or retweet it on Twitter.
Disclosures
The authors report no conflict of interest.
1. Pierce W, Mazur J, Greenberg C, Mueller J, Foster J, Lazarchick J. Evaluation of heparin-induced thrombocytopenia (HIT) laboratory testing and the 4Ts scoring system in the intensive care unit. Ann Clin Lab Sci. 2013;43(4):429-435. PubMed
2. Harada MY, Hoang DM, Zaw AA, et al. Overtreatment of heparin-induced thrombocytopenia in the surgical ICU. Crit Care Med. 2017;45(1):28-34. doi:10.1097/ccm.0000000000002002. PubMed
3. Warkentin TE, Sheppard JAI, Heels-Ansdell D, et al. Heparin-induced thrombocytopenia in medical-surgical critical illness. Chest. 2013;144(3):848-858. doi: 10.1378/chest.13-0057. PubMed
4. Linkins LA, Dans AL, Moores LK, et al. Treatment and prevention of heparin-induced thrombocytopenia. Chest. 2012;141(2):e495S-e530S. doi: 10.1378/chest.11-2303. PubMed
5. Cuker A, Arepally GM, Chong BH, et al. American Society of Hematology 2018 guidelines for management of venous thromboembolism: heparin-induced thrombocytopenia. Blood Adv. 2018;2(22):3360-3392. doi: 10.1182/bloodadvances.2018024489. PubMed
6. Lo GK, Juhl D, Warkentin TE, Sigouin CS, Eichler P, Greinacher A. Evaluation of pretest clinical score (4 T’s) for the diagnosis of heparin-induced thrombocytopenia in two clinical settings. J Thromb Haemost. 2006;4(4):759-765. doi: 10.1111/j.1538-7836.2006.01787.x PubMed
7. Cuker A, Cines DB. How I treat heparin-induced thrombocytopenia. Blood. 2012;119(10):2209-2218. doi: 10.1182/blood-2011-11-376293. PubMed
8. Elmer P, Passero FC, Xavier M. Retrospective Analysis of Heparin-Induced Thrombocytopenia Management at a Large Tertiary Hospital. J Hematol. 2014;3(2):27-33. doi: http://dx.doi.org/10.14740/jh157w.
9. Goldman R, Ustun B, Levine RL. Retrospective cost analysis of testing for HIT antibodies in a community hospital. Blood. 2008;112(11):4544.
10. Cuker A. Heparin-induced thrombocytopenia (HIT) in 2011: an epidemic of overdiagnosis. Thromb Haemost. 2011;106(6):993-994. doi: 10.1160/TH11-09-0677.
11. Warkentin TE. Heparin-induced thrombocytopenia in critically ill patients. Semin Thromb Hemost. 2015;41(5):49-60. doi: 10.1055/s-0034-1398381. PubMed
12. Caton S, O’Brien E, Pannelay AJ, Cook RG. Assessing the clinical and cost impact of on-demand immunoassay testing for the diagnosis of heparin-induced thrombocytopenia. Thromb Res. 2016;140:155-162. doi: 10.1016/j.thromres.2016.01.025 PubMed
13. Nanwa N, Mittmann N, Knowles S, et al. The direct medical costs associated with suspected heparin-induced thrombocytopenia. Pharmacoeconomics. 2011;29(6):511-520. doi: 10.2165/11584330-000000000-00000. PubMed
14. Cuker A, Gimotty PA, Crowther MA, Warkentin TE. Predictive value of the 4Ts scoring system for heparin-induced thrombocytopenia: a systematic review and meta-analysis. Blood. 2012;120(20):4160-4167. doi: 10.1182/blood-2012-07-443051. PubMed
15. Fiorenza MA, Frazee EN, Personett HA, Dierkhising RA, Schramm GE. Assessment of a modified 4T scoring system for heparin-induced thrombocytopenia in critically ill patients. J Crit Care. 2014;29(3):426-431. doi: 10.1016/j.jcrc.2013.12.010. PubMed
16. Crowther M, Cook D, Guyatt G, et al. Heparin-induced thrombocytopenia in the critically ill: interpreting the 4Ts test in a randomized trial. J Crit Care. 2014;29(3):470.e7-470.e15 doi: 10.1016/j.jcrc.2014.02.004. PubMed
17. Hicks LK, Bering H, Carson KR, et al. The ASH Choosing Wisely campaign: five hematologic tests and treatments to question. Blood. 2013;122(24):3879-3883. doi: 10.1182/blood-2013-07-518423. PubMed
18. Doepker B, Mount KL, Ryder LJ, Gerlach AT, Murphy CV, Philips GS. Bleeding risk factors associated with argatroban therapy in the critically ill. J Thromb Thrombolysis. 2012;34(4):491-498. doi: 10.1007/s11239-012-0758-y. PubMed
19. Marler J, Unzaga J, Stelts S, Oliphant CS. Consequences of treating false positive heparin-induced thrombocytopenia. J Thromb Thrombolysis. 2015;40(4):512-514. doi: 10.1007/s11239-015-1236-0. PubMed
20. Fowler RA, Mittmann N, Geerts W, et al. Cost-effectiveness of dalteparin vs unfractionated heparin for the prevention of venous thromboembolism in critically ill patients. JAMA. 2014;312(20):2135-2145. doi: 10.1001/jama.2014.15101. PubMed
21. Warkentin TE, Sheppard JI, Moore JC, Sigouin CS, Kelton JG. Quantitative interpretation of optical density measurements using PF4-dependent enzyme-immunoassays. J Thromb Haemost. 2008;6(8):1304-1312. doi: 10.1111/j.1538-7836.2008.03025.x. PubMed
© 2019 Society of Hospital Medicine