User login
Bringing you the latest news, research and reviews, exclusive interviews, podcasts, quizzes, and more.
Anticholinergic drugs linked to dementia in older populations
Exposures to various types of anticholinergic medications were associated with a significantly increased risk of dementia in people aged 55 years or older in a large pharmacoepidemiologic study.

“This study was designed to assess the association between cumulative anticholinergic drug use and risk of dementia in a large, representative British population,” wrote Carol A. C. Coupland, PhD, of the division of primary care at the University of Nottingham (England), and colleagues. The findings were published in JAMA Internal Medicine.
The researchers conducted a large nested case-control study that included 58,769 patients with dementia and 225,574 matched controls from the QResearch database in England. Each study participant was matched to five controls based on various characteristics, including sex, age, and calendar time, among others.
Prescription data related to 56 different drugs with strong anticholinergic properties, including antipsychotics, bladder antimuscarinics, antiepileptics, antiparkinson agents, and antidepressants were used to measure drug exposure. The study data were analyzed from 2016 to 2018.
“The primary exposure was the total standardized daily doses (TSDDs) of anticholinergic drugs prescribed in the 1 to 11 years prior to the date of diagnosis of dementia or equivalent date in matched controls,” Dr. Coupland and colleagues wrote.
After analysis, the researchers found that exposure to antipsychotics (adjusted odds ratio, 1.70), bladder antimuscarinics (aOR, 1.65), antiepileptics (aOR, 1.39), antiparkinson agents (aOR, 1.52), and anticholinergic antidepressants (aOR, 1.29) was associated with an increased risk of dementia after adjustment for confounding factors.
“Associations were stronger in [dementia] cases diagnosed before the age of 80 years,” the researchers noted.
However, antihistamine, antivertigo/antiemetic, skeletal muscle relaxant, gastrointestinal antispasmodic, antiarrhythmic, and antimuscarinic bronchodilator anticholinergic agents were not associated with any increased risk of dementia.
One key limitation of the study was the absence of medication compliance assessment, which could result in exposure misclassification. Dr. Coupland and colleagues acknowledged this could underestimate some associations with medication exposure.
The stronger risk of dementia found among people who had dementia before age 80 “indicates that anticholinergic drugs should be prescribed with caution in middle-aged and older people,” they concluded.
One question that remains from the current study is whether anticholinergic drugs are a definite modifiable risk factor for Alzheimer’s disease and related dementias, Noll L. Campbell, PharmD, of Purdue University, West Lafayette, Ind., and colleagues wrote in an editorial accompanying the study by Dr. Coupland and associates (JAMA Intern Med. 2019 Jun 24. doi: 10.1001/jamainternmed.2019.0676).
While a pharmacologic basis for this association has been proposed, causation has yet to be established by means of prospective randomized studies. The current supposition is that deprescribing anticholinergic medications has the potential to positively effect cholinergic neurotransmission in certain regions of the brain, which could lead to improved cognitive functioning, and lower the likelihood of developing Alzheimer’s disease and related dementias, they wrote in the editorial.
However, the discontinuation of some anticholinergic agents may pose other risks, such as worsening pain or depressive symptoms, in addition to increasing the utilization of acute care facilities. As a result, high-quality, well-designed, randomized trials are needed to better understand the long-term effects of deprescribing anticholinergic medications. These trials would help inform clinicians, patients, and policymakers about the risks and benefits of deprescribing interventions, Dr. Campbell and coauthors said.
The study was supported by the National Institute for Health Research and the University of Nottingham. The authors reported financial affiliations with ClinRisk Ltd. The authors of the editorial reported receiving support from the National Institute on Aging and the Agency for Healthcare Research and Quality. Dr. Campbell reported receiving personal fees from Astellas Pharma US.
SOURCE: Coupland C et al. JAMA Intern Med. 2019 Jun 24. doi: 10.1001/jamainternmed.2019.0677
Exposures to various types of anticholinergic medications were associated with a significantly increased risk of dementia in people aged 55 years or older in a large pharmacoepidemiologic study.
“This study was designed to assess the association between cumulative anticholinergic drug use and risk of dementia in a large, representative British population,” wrote Carol A. C. Coupland, PhD, of the division of primary care at the University of Nottingham (England), and colleagues. The findings were published in JAMA Internal Medicine.
The researchers conducted a large nested case-control study that included 58,769 patients with dementia and 225,574 matched controls from the QResearch database in England. Each study participant was matched to five controls based on various characteristics, including sex, age, and calendar time, among others.
Prescription data related to 56 different drugs with strong anticholinergic properties, including antipsychotics, bladder antimuscarinics, antiepileptics, antiparkinson agents, and antidepressants were used to measure drug exposure. The study data were analyzed from 2016 to 2018.
“The primary exposure was the total standardized daily doses (TSDDs) of anticholinergic drugs prescribed in the 1 to 11 years prior to the date of diagnosis of dementia or equivalent date in matched controls,” Dr. Coupland and colleagues wrote.
After analysis, the researchers found that exposure to antipsychotics (adjusted odds ratio, 1.70), bladder antimuscarinics (aOR, 1.65), antiepileptics (aOR, 1.39), antiparkinson agents (aOR, 1.52), and anticholinergic antidepressants (aOR, 1.29) was associated with an increased risk of dementia after adjustment for confounding factors.
“Associations were stronger in [dementia] cases diagnosed before the age of 80 years,” the researchers noted.
However, antihistamine, antivertigo/antiemetic, skeletal muscle relaxant, gastrointestinal antispasmodic, antiarrhythmic, and antimuscarinic bronchodilator anticholinergic agents were not associated with any increased risk of dementia.
One key limitation of the study was the absence of medication compliance assessment, which could result in exposure misclassification. Dr. Coupland and colleagues acknowledged this could underestimate some associations with medication exposure.
The stronger risk of dementia found among people who had dementia before age 80 “indicates that anticholinergic drugs should be prescribed with caution in middle-aged and older people,” they concluded.
One question that remains from the current study is whether anticholinergic drugs are a definite modifiable risk factor for Alzheimer’s disease and related dementias, Noll L. Campbell, PharmD, of Purdue University, West Lafayette, Ind., and colleagues wrote in an editorial accompanying the study by Dr. Coupland and associates (JAMA Intern Med. 2019 Jun 24. doi: 10.1001/jamainternmed.2019.0676).
While a pharmacologic basis for this association has been proposed, causation has yet to be established by means of prospective randomized studies. The current supposition is that deprescribing anticholinergic medications has the potential to positively effect cholinergic neurotransmission in certain regions of the brain, which could lead to improved cognitive functioning, and lower the likelihood of developing Alzheimer’s disease and related dementias, they wrote in the editorial.
However, the discontinuation of some anticholinergic agents may pose other risks, such as worsening pain or depressive symptoms, in addition to increasing the utilization of acute care facilities. As a result, high-quality, well-designed, randomized trials are needed to better understand the long-term effects of deprescribing anticholinergic medications. These trials would help inform clinicians, patients, and policymakers about the risks and benefits of deprescribing interventions, Dr. Campbell and coauthors said.
The study was supported by the National Institute for Health Research and the University of Nottingham. The authors reported financial affiliations with ClinRisk Ltd. The authors of the editorial reported receiving support from the National Institute on Aging and the Agency for Healthcare Research and Quality. Dr. Campbell reported receiving personal fees from Astellas Pharma US.
SOURCE: Coupland C et al. JAMA Intern Med. 2019 Jun 24. doi: 10.1001/jamainternmed.2019.0677
FROM JAMA INTERNAL MEDICINE
Food insecurity tied to migraine in young adults
, according to Jason M. Nagata, MD, of the University of California, San Francisco, and associates.
Data were collected from a cross-sectional, nationally representative set of 14,786 young adults in the United States aged 24-32 years who participated in the 2008 National Longitudinal Study of Adolescent to Adult Health, the investigators wrote in a research letter published in JAMA Neurology.
Food insecurity was assessed by self-report through the interview question, “In the past 12 months, was there a time when (you/your household were/was) worried whether food would run out before you would get money to buy more?” Migraine was assessed by a positive answer to the interview question, “Has a doctor, nurse, or other health care professional ever told you that you have or had migraine headaches?”
In all, 1,647 study participants (11%) reported food insecurity; the prevalence of migraine in this group was 23.9%, compared with a prevalence of 13.6% in participants who did not report food insecurity. The association between food insecurity and migraine was significant both before (odds ratio, 2.00; 95% confidence interval, 1.68-2.38; P less than .001) and after adjustment (adjusted OR, .58; 95% CI, 1.30-1.95; P less than .001).
“Health care clinicians caring for persons who experience migraine should consider screening for food insecurity as a potential contributor to migraine exacerbations and provide referrals to programs such as the Supplemental Nutrition Assistance Program [formerly the Food Stamp Program] when appropriate,” the investigators concluded (JAMA Neurol. 2019 Jun 24. doi: 10.1001/jamaneurol.2019.1663).
No conflicts of interest were reported. The study was supported by grants from the University of California Global Food Initiative Fellowship, the American Academy of Pediatrics, the American Pediatric Society, and the Norman Schlossberger Research Fund from the University of California.
FROM JAMA NEUROLOGY
Patients concerned about clinician burnout
Almost three-quarters of Americans are concerned about burnout among health care professionals, according to the American Society of Health-System Pharmacists.
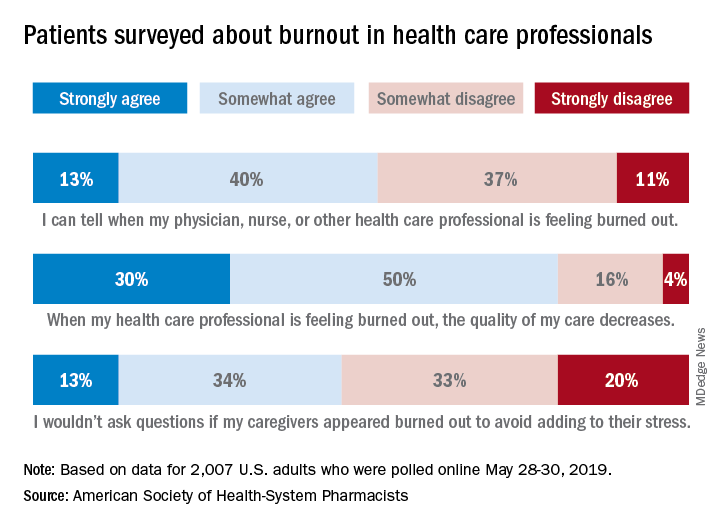
The public is aware “that burnout among pharmacists, physicians, nurses, and other professionals can lead to impaired attention and decreased functioning that threatens to cause medical errors and reduce safety,” the ASHP said when it released data from a survey conducted May 28-30, 2019, by the Harris Poll.
Those data show that 23% of respondents were very concerned and 51% were somewhat concerned about burnout among health care providers. Just over half (53%) of the 2,007 adults involved said that they could tell when a provider was burned out, suggesting that health care professionals “may be conveying signs of burnout to their patients without knowing it,” the society noted.
A majority of respondents (80%) felt that the quality of their care was affected when their physician, nurse, pharmacist, or other health care professional was burned out, and almost half (47%) said that they would avoid asking questions if their provider appeared burned out because they wouldn’t want to add to that person’s stress, the ASHP said.
“A healthy and thriving clinician workforce is essential to ensure optimal patient health outcomes and safety,” said Paul W. Abramowitz, PharmD, chief executive officer of the ASHP. “Within the healthcare industry, we are working to help build a culture of resilience and well-being to ensure that no patient or clinician is harmed due to burnout; but it takes a concerted effort from all entities involved – providers and healthcare organizations.”
Almost three-quarters of Americans are concerned about burnout among health care professionals, according to the American Society of Health-System Pharmacists.
The public is aware “that burnout among pharmacists, physicians, nurses, and other professionals can lead to impaired attention and decreased functioning that threatens to cause medical errors and reduce safety,” the ASHP said when it released data from a survey conducted May 28-30, 2019, by the Harris Poll.
Those data show that 23% of respondents were very concerned and 51% were somewhat concerned about burnout among health care providers. Just over half (53%) of the 2,007 adults involved said that they could tell when a provider was burned out, suggesting that health care professionals “may be conveying signs of burnout to their patients without knowing it,” the society noted.
A majority of respondents (80%) felt that the quality of their care was affected when their physician, nurse, pharmacist, or other health care professional was burned out, and almost half (47%) said that they would avoid asking questions if their provider appeared burned out because they wouldn’t want to add to that person’s stress, the ASHP said.
“A healthy and thriving clinician workforce is essential to ensure optimal patient health outcomes and safety,” said Paul W. Abramowitz, PharmD, chief executive officer of the ASHP. “Within the healthcare industry, we are working to help build a culture of resilience and well-being to ensure that no patient or clinician is harmed due to burnout; but it takes a concerted effort from all entities involved – providers and healthcare organizations.”
Briefest flash of light can alter the human circadian system
SAN ANTONIO –

“This becomes a complementary way to help people with various kinds of circadian phase disorders,” the study’s first author, Jamie M. Zeitzer, PhD, said during an interview at the annual meeting of the Associated Professional Sleep Societies. “Right now under ideal laboratory circumstances, you can change someone’s circadian timing by about 3 hours. That’s not happening in the real world; that’s what you do in a lab. That’s with very bright light for 6 hours and very dim light the rest of the time.”
In an effort to build on previous literature related to circadian phase shifting and continuous light exposure in rodents and in humans, Dr. Zeitzer, of the department of psychiatry and behavioral sciences at Stanford (Calif.) University, and colleagues enrolled 56 healthy young men and women in their 20s and 30s to take part in two parallel 16-day studies. For the first 14 days, study participants maintained a regular sleep/wake cycle at home as confirmed through actigraphy and sleep logs. They spent the final 2 days in a specialized time-isolation laboratory, during which the phase of the circadian pacemaker (salivary melatonin onset) was determined in constant routine conditions on evening one and two; light exposure occurred between these two phase determinations on night one.
Light exposure consisted of 1 hour of a sequence of light flashes delivered through a pair of modified welding goggles during enforced wake starting 2 hours after habitual bedtime. Flashes were presented every 15 seconds and varied either by duration (from 10 microseconds to 10 seconds at a fixed intensity of 2,200 lux) or intensity (a range between 3 and 9,500 lux, with a duration fixed at 2 milliseconds).
Dr. Zeitzer and colleagues observed no significant difference in the phase shift created between flashes that were given at 10 microseconds and flashes that were given at 10 seconds. “That’s a six-log unit variation,” he said during a presentation of the results at the meeting. “There are a million times more photons given in 10-second flashes over the hour than there are in the 10-microsecond flashes. Despite the fact that there are a million more photons, you get the exact same phase shift in both of these conditions. You need very little light in order to generate these phase shifts. You’re talking about less than 1 second of light stretched out over 1 hour.”
The researchers also observed that flash intensity showed a sigmoidal relationship with phase shifting, with a half-maximal shift observed at 8 lux and 90% of the maximal shift occurring after exposure to flashes as dim as 50 lux. None of the flash sequences caused acute suppression of melatonin.
“We did not anticipate the invariance, that anything from 10 microseconds to 10 seconds gives us no difference [in phase shifting],” Dr. Zeitzer said. “That was surprising. I thought that more light would be slightly less effective in terms of photons but still give a bigger [phase] shift, but that didn’t happen. In the intensity response, we see things are more sensitive to light flashes than they are to continuous light, which is also surprising. It implies that a different part of the eye is responding to light flashes than it is to continuous light. It provides more information about how to minimize the amount of light we’re using and maximize the amount of shift.”
Which photoreceptors underlie the responses remains unclear, he continued, “but given the characteristics of photoreceptors, our hypothesis is that flashes are being mediated through a cone cell response, while the response to continuous light is being primarily mediated through a melanopsin response. A future question we plan to investigate is, can selective sequential simultaneous activation of different photoreceptors create enhanced phase shifts?”
The study was supported by the Department of Defense. Dr. Zeitzer reported having no financial disclosures.
SAN ANTONIO –
“This becomes a complementary way to help people with various kinds of circadian phase disorders,” the study’s first author, Jamie M. Zeitzer, PhD, said during an interview at the annual meeting of the Associated Professional Sleep Societies. “Right now under ideal laboratory circumstances, you can change someone’s circadian timing by about 3 hours. That’s not happening in the real world; that’s what you do in a lab. That’s with very bright light for 6 hours and very dim light the rest of the time.”
In an effort to build on previous literature related to circadian phase shifting and continuous light exposure in rodents and in humans, Dr. Zeitzer, of the department of psychiatry and behavioral sciences at Stanford (Calif.) University, and colleagues enrolled 56 healthy young men and women in their 20s and 30s to take part in two parallel 16-day studies. For the first 14 days, study participants maintained a regular sleep/wake cycle at home as confirmed through actigraphy and sleep logs. They spent the final 2 days in a specialized time-isolation laboratory, during which the phase of the circadian pacemaker (salivary melatonin onset) was determined in constant routine conditions on evening one and two; light exposure occurred between these two phase determinations on night one.
Light exposure consisted of 1 hour of a sequence of light flashes delivered through a pair of modified welding goggles during enforced wake starting 2 hours after habitual bedtime. Flashes were presented every 15 seconds and varied either by duration (from 10 microseconds to 10 seconds at a fixed intensity of 2,200 lux) or intensity (a range between 3 and 9,500 lux, with a duration fixed at 2 milliseconds).
Dr. Zeitzer and colleagues observed no significant difference in the phase shift created between flashes that were given at 10 microseconds and flashes that were given at 10 seconds. “That’s a six-log unit variation,” he said during a presentation of the results at the meeting. “There are a million times more photons given in 10-second flashes over the hour than there are in the 10-microsecond flashes. Despite the fact that there are a million more photons, you get the exact same phase shift in both of these conditions. You need very little light in order to generate these phase shifts. You’re talking about less than 1 second of light stretched out over 1 hour.”
The researchers also observed that flash intensity showed a sigmoidal relationship with phase shifting, with a half-maximal shift observed at 8 lux and 90% of the maximal shift occurring after exposure to flashes as dim as 50 lux. None of the flash sequences caused acute suppression of melatonin.
“We did not anticipate the invariance, that anything from 10 microseconds to 10 seconds gives us no difference [in phase shifting],” Dr. Zeitzer said. “That was surprising. I thought that more light would be slightly less effective in terms of photons but still give a bigger [phase] shift, but that didn’t happen. In the intensity response, we see things are more sensitive to light flashes than they are to continuous light, which is also surprising. It implies that a different part of the eye is responding to light flashes than it is to continuous light. It provides more information about how to minimize the amount of light we’re using and maximize the amount of shift.”
Which photoreceptors underlie the responses remains unclear, he continued, “but given the characteristics of photoreceptors, our hypothesis is that flashes are being mediated through a cone cell response, while the response to continuous light is being primarily mediated through a melanopsin response. A future question we plan to investigate is, can selective sequential simultaneous activation of different photoreceptors create enhanced phase shifts?”
The study was supported by the Department of Defense. Dr. Zeitzer reported having no financial disclosures.
REPORTING FROM SLEEP 2019
Key clinical point: When distributed as flashes, the human circadian system can be phase shifted by extraordinarily brief and dim light.
Major finding: The researchers observed no significant difference in the phase shift created between flashes that were given at 10 microseconds and flashes that were given at 10 seconds.
Study details: Two parallel 16-day studies involving 56 healthy men and women in their 20s and 30s.
Disclosures: The study was supported by the Department of Defense. Dr. Zeitzer reported having no financial disclosures.
Sleep quality linked to gut microbiome biodiversity
SAN ANTONIO – , according to results from a population sample of adults.
“These findings are preliminary and very early in the growth of this field,” lead study author Erika W. Hagen, PhD, said during an interview at the annual meeting of the Associated Professional Sleep Societies
According to Dr. Hagen, an epidemiologist at the University of Wisconsin–Madison, experimental studies in mice have shown that disturbed sleep is associated with gut microbiota composition, and a few small experimental studies in humans have found associations between curtailed sleep and measures of gut microbiota richness and diversity.
In an effort to examine associations of subjectively and objectively assessed sleep metrics with indices of gut microbiome richness and diversity, Dr. Hagen and colleagues assessed 482 individuals who participated in the Survey of the Health of Wisconsin and completed in-home study visits in 2016. They provided fecal samples, participated in a week-long wrist actigraphy protocol to measure sleep, and completed questionnaires about sleep, diet, and other health and sociodemographic factors, and an assessment of physical activity by waist-worn actigraphy.
Metrics of species richness included the Chao1 and the ACE, which estimate the number of species. Metrics of the diversity of the gut microbiome included the Inverse Simpson index and the Shannon index. All metrics were regressed on self-reported sleep duration, extreme daytime sleepiness, the Epworth Sleepiness Scale (ESS), and actigraphy-measured sleep duration and wake after sleep onset (WASO). Next, the researchers estimated associations between each of the sleep and diversity measures separately, adjusting for age and sex and then additionally adjusting for body mass index, moderate-vigorous physical activity, and dietary fat and fiber.
The mean age of the 482 subjects was 56 years, 57% were female, and the mean body mass index was 30 kg/m2. After the researchers adjusted for gender and age, they found that greater WASO was statistically significantly associated with lower richness and alpha diversity (P less than .05). These associations remained significant on the Chao1 measure and borderline significant on the ACE and Shannon measures after further adjustment for BMI, physical activity, and dietary fiber and fat. For example, 60 minutes greater WASO was associated with an approximate 26% population standard deviation reduction in microbial richness as measured by Chao1. In fully-adjusted models, greater daytime sleepiness was associated with lower richness and diversity on all indices (P = .01-.06). The ESS and sleep duration were not associated with microbiota richness or diversity.
“Our results suggest that sleep quality is associated with gut microbiome richness and diversity,” Dr. Hagen said. “Our results are in line with other research on this topic. What’s interesting is how your sleep over a period of time is affecting these measures of your microbiome. That’s something people can do something about with [eating] habits over time. What would be great is to collect longitudinal data so that you could characterize sleep over a longer period of time, but also so you could measure the microbiome at different time points to see what’s changing with changes in sleep. That would be interesting to untangle.”
She acknowledged certain limitations of the study, including the small sample size and the cross-sectional design. The study was supported by the University of Wisconsin School of Medicine and Public Health through the Wisconsin Partnership Program.
SOURCE: Hagen EW et al. SLEEP 2019, Abstract 0106.
REPORTING FROM SLEEP 2019
Key clinical point: Better quality of sleep, but not duration of sleep, was associated with greater species richness and diversity of the gut microbiome.
Major finding: In fully adjusted models, greater daytime sleepiness was associated with lower richness and diversity of the gut microbiome on all indices (P = .01-.06).
Study details: An assessment of 482 individuals who participated in the Survey of the Health of Wisconsin.
Disclosures: The study was supported by the University of Wisconsin School of Medicine and Public Health through the Wisconsin Partnership Program.
Source: Hagen EW et al. SLEEP 2019, Abstract 0106.
Mortality risk from mild to moderate OSA modified by age
SAN ANTONIO – , results from a large longitudinal analysis showed.

“The association between severe OSA and significant morbidity and mortality – particularly cardiovascular in nature – is well established,” the study’s first author, Alexandros N. Vgontzas, MD, said at the annual meeting of the Associated Professional Sleep Societies. “In contrast, mild to moderate OSA is highly prevalent in the general population but its association with morbidity and mortality is not well established.”
In an effort to examine the association between mild to moderate OSA and all-cause mortality, Dr. Vgontzas and colleagues drew from the Penn State Adult Cohort, a random general population sample of 1,741 men and women who were studied in the sleep lab with an 8-hour polysomnography at baseline and followed for a mean of 19.2 years for all-cause mortality.
The researchers retrieved mortality data from the Centers for Disease Control and Prevention’s National Death Index and defined mild OSA as an apnea/hypopnea index (AHI) of 5-14.9 events per hour, while moderate OSA was defined as an AHI of 15-29.9 events per hour. They used Cox proportional hazards regression to estimate all-cause mortality and adjusted for race, sex, body mass index, smoking, hypertension, diabetes, heart problems, and stroke.
Dr. Vgontzas, of the Sleep Research and Treatment Center at Penn State University, Hershey, Pa., reported that 596 individuals have died since the study began. On adjusted analysis, patients with an AHI between 5 and 29 were 1.28 times as likely to die overall (P = .019). The researchers found that the association with mortality was stronger among patients younger than age 60, compared with those aged 60 and older. The hazard ratio was 1.44 for study participants younger than age 60 (P = .027), and 1.14 for those aged 60 and older (P = .34).
“Mild to moderate sleep apnea is associated with significant all-cause mortality risk, but the strength of the association decreases markedly with age,” Dr. Vgontzas concluded. “These findings are in line with previous findings that the association of mild to moderate OSA with cardiometabolic risk is modified by age and suggests that OSA in older adults is a distinctly different phenotype than in the young and middle-aged.”
The explanation for the association remains unclear. “Is it because the people of older age have some kind of genetic protection, or is because their sleep apnea is milder?” he asked. “We don’t have the data to tell.”
Dr. Vgontzas reported having no financial disclosures.
SOURCE: Vgontzas A et al. SLEEP 2019, abstract 0504.
SAN ANTONIO – , results from a large longitudinal analysis showed.
“The association between severe OSA and significant morbidity and mortality – particularly cardiovascular in nature – is well established,” the study’s first author, Alexandros N. Vgontzas, MD, said at the annual meeting of the Associated Professional Sleep Societies. “In contrast, mild to moderate OSA is highly prevalent in the general population but its association with morbidity and mortality is not well established.”
In an effort to examine the association between mild to moderate OSA and all-cause mortality, Dr. Vgontzas and colleagues drew from the Penn State Adult Cohort, a random general population sample of 1,741 men and women who were studied in the sleep lab with an 8-hour polysomnography at baseline and followed for a mean of 19.2 years for all-cause mortality.
The researchers retrieved mortality data from the Centers for Disease Control and Prevention’s National Death Index and defined mild OSA as an apnea/hypopnea index (AHI) of 5-14.9 events per hour, while moderate OSA was defined as an AHI of 15-29.9 events per hour. They used Cox proportional hazards regression to estimate all-cause mortality and adjusted for race, sex, body mass index, smoking, hypertension, diabetes, heart problems, and stroke.
Dr. Vgontzas, of the Sleep Research and Treatment Center at Penn State University, Hershey, Pa., reported that 596 individuals have died since the study began. On adjusted analysis, patients with an AHI between 5 and 29 were 1.28 times as likely to die overall (P = .019). The researchers found that the association with mortality was stronger among patients younger than age 60, compared with those aged 60 and older. The hazard ratio was 1.44 for study participants younger than age 60 (P = .027), and 1.14 for those aged 60 and older (P = .34).
“Mild to moderate sleep apnea is associated with significant all-cause mortality risk, but the strength of the association decreases markedly with age,” Dr. Vgontzas concluded. “These findings are in line with previous findings that the association of mild to moderate OSA with cardiometabolic risk is modified by age and suggests that OSA in older adults is a distinctly different phenotype than in the young and middle-aged.”
The explanation for the association remains unclear. “Is it because the people of older age have some kind of genetic protection, or is because their sleep apnea is milder?” he asked. “We don’t have the data to tell.”
Dr. Vgontzas reported having no financial disclosures.
SOURCE: Vgontzas A et al. SLEEP 2019, abstract 0504.
REPORTING FROM SLEEP 2019
Key clinical point: Among adults with mild to moderate obstructive sleep apnea, the risk of mortality is highest among those younger than age 60.
Major finding: The hazard ratio for mortality was 1.44 for study participants younger than age 60 (P = .027), and 1.14 for those aged 60 and older (P = .34).
Study details: An analysis of 1,741 men and women from the Penn State Adult Cohort.
Disclosures: Dr. Vgontzas reported having no financial disclosures.
Source: Vgontzas A et al. SLEEP 2019, Abstract 0504.
Daytime eating schedule found to help with weight management
SAN ANTONIO – In adults of normal weight, a small controlled study has shown that a , independent of caloric intake.

The findings come from an 8-week controlled trial presented at the annual meeting of the Associated Professional Sleep Societies, which set out to examine the impact of a daytime versus delayed eating schedule on body mass, adiposity, and energy homeostasis in adults of normal weight.
“It is best to stop eating as early as possible in the day, and to not eat late at night,” the study’s first author, Namni Goel, PhD, said in an interview at the meeting. “There’s an open question in our field: Should you stop eating at 7:00 p.m.? 8:00 p.m.? My own feeling is, the longer it is between when you stop eating and go to bed, the better off you are metabolically.”
Dr. Goel, associate professor in the division of sleep and chronobiology in the department of psychiatry at the University of Pennsylvania, Philadelphia, and colleagues enrolled 12 healthy adults to participate in a randomized cross-over study in free-living conditions. Three meals and two snacks consisting of comparable energy and macronutrient content were provided during two 8-week counterbalanced phases: 1) daytime eating (food consumed between 8:00 a.m. and 7:00 p.m, and 2) delayed eating (food consumed between 12:00 p.m. and 11:00 p.m. A 2-week washout period occurred between the conditions. “What we wanted to do is just manipulate the timing of eating and we provided all of the meals so we could control the caloric intake,” Dr. Goel said.
The researchers asked participants to maintain a sleep-wake cycle between 11:00 p.m. and 9:00 a.m. (verified by wrist actigraphy) and to limit physical activity. They assessed weight, adiposity, energy metabolism, and hormonal markers during four inpatient visits: 1) baseline; 2) after the first eating condition; 3) after the washout period, before the second eating condition began; and 4) after the second eating condition. They used two-way analysis of variance and Cohen’s d effect sizes to examine changes in anthropometrics and metabolic measures affected by eating schedule (daytime vs. delayed) and time (before vs. after each eating schedule).
The mean age of 12 study participants was 26 years; five were females. Their mean body mass index was 21.9 kg/m2. Dr. Goel reported that participants had excellent adherence to assigned eating schedules, with no differences between the conditions. Weight was decreased on the daytime vs. delayed eating schedule. Specifically, Cohen’s d effect sizes were 0.57 overall: 1.16 for females and 0.33 for males, all in the small to large range. Resting energy expenditure, respiratory quotient, and trunk fat percentage/leg fat percentage were decreased on the daytime vs. delayed eating condition, with Cohen’s d effect sizes of 0.45-1.02, all in the medium to large range. In addition, total cholesterol and insulin were decreased on the daytime eating condition (medium effect sizes of 0.60 and 0.57, respectively), while triglycerides and glucose were increased on the delayed condition (medium effect sizes of 0.46 and 0.52, respectively).
Weight, adiposity, energy metabolism, and hormonal measures did not differ significantly between the pre-daytime and pre-delayed eating conditions, suggesting that they returned to pre-condition levels after the washout period.
“One of the things we’re advocating is that with consistent daytime eating, you can lose weight and/or remain at weight maintenance,” Dr. Goel said. “Consistency is very important. Across 8 weeks, you’re becoming metabolically healthier because you’re not eating that late-night meal or snack. We had shown in previous sleep loss studies that people were eating 500 calories late in the evening on consecutive nights and gaining a substantial amount of weight.”
She and her colleagues are currently enrolling obese individuals into a similarly designed trial, “where we expect much bigger changes metabolically,” she said. The study was funded by a grant from the National Institutes of Health. Dr. Goel reported having no financial disclosures.
SOURCE: Goel N et al. SLEEP 2019, Abstract 0036.
SAN ANTONIO – In adults of normal weight, a small controlled study has shown that a , independent of caloric intake.
The findings come from an 8-week controlled trial presented at the annual meeting of the Associated Professional Sleep Societies, which set out to examine the impact of a daytime versus delayed eating schedule on body mass, adiposity, and energy homeostasis in adults of normal weight.
“It is best to stop eating as early as possible in the day, and to not eat late at night,” the study’s first author, Namni Goel, PhD, said in an interview at the meeting. “There’s an open question in our field: Should you stop eating at 7:00 p.m.? 8:00 p.m.? My own feeling is, the longer it is between when you stop eating and go to bed, the better off you are metabolically.”
Dr. Goel, associate professor in the division of sleep and chronobiology in the department of psychiatry at the University of Pennsylvania, Philadelphia, and colleagues enrolled 12 healthy adults to participate in a randomized cross-over study in free-living conditions. Three meals and two snacks consisting of comparable energy and macronutrient content were provided during two 8-week counterbalanced phases: 1) daytime eating (food consumed between 8:00 a.m. and 7:00 p.m, and 2) delayed eating (food consumed between 12:00 p.m. and 11:00 p.m. A 2-week washout period occurred between the conditions. “What we wanted to do is just manipulate the timing of eating and we provided all of the meals so we could control the caloric intake,” Dr. Goel said.
The researchers asked participants to maintain a sleep-wake cycle between 11:00 p.m. and 9:00 a.m. (verified by wrist actigraphy) and to limit physical activity. They assessed weight, adiposity, energy metabolism, and hormonal markers during four inpatient visits: 1) baseline; 2) after the first eating condition; 3) after the washout period, before the second eating condition began; and 4) after the second eating condition. They used two-way analysis of variance and Cohen’s d effect sizes to examine changes in anthropometrics and metabolic measures affected by eating schedule (daytime vs. delayed) and time (before vs. after each eating schedule).
The mean age of 12 study participants was 26 years; five were females. Their mean body mass index was 21.9 kg/m2. Dr. Goel reported that participants had excellent adherence to assigned eating schedules, with no differences between the conditions. Weight was decreased on the daytime vs. delayed eating schedule. Specifically, Cohen’s d effect sizes were 0.57 overall: 1.16 for females and 0.33 for males, all in the small to large range. Resting energy expenditure, respiratory quotient, and trunk fat percentage/leg fat percentage were decreased on the daytime vs. delayed eating condition, with Cohen’s d effect sizes of 0.45-1.02, all in the medium to large range. In addition, total cholesterol and insulin were decreased on the daytime eating condition (medium effect sizes of 0.60 and 0.57, respectively), while triglycerides and glucose were increased on the delayed condition (medium effect sizes of 0.46 and 0.52, respectively).
Weight, adiposity, energy metabolism, and hormonal measures did not differ significantly between the pre-daytime and pre-delayed eating conditions, suggesting that they returned to pre-condition levels after the washout period.
“One of the things we’re advocating is that with consistent daytime eating, you can lose weight and/or remain at weight maintenance,” Dr. Goel said. “Consistency is very important. Across 8 weeks, you’re becoming metabolically healthier because you’re not eating that late-night meal or snack. We had shown in previous sleep loss studies that people were eating 500 calories late in the evening on consecutive nights and gaining a substantial amount of weight.”
She and her colleagues are currently enrolling obese individuals into a similarly designed trial, “where we expect much bigger changes metabolically,” she said. The study was funded by a grant from the National Institutes of Health. Dr. Goel reported having no financial disclosures.
SOURCE: Goel N et al. SLEEP 2019, Abstract 0036.
REPORTING FROM SLEEP 2019
Key clinical point: A daytime eating schedule is likely beneficial for weight management and metabolic health.
Major finding: Weight was decreased on the daytime vs. delayed eating schedule with Cohen’s d effect of 0.57 overall: 1.16 for females and 0.33 for males, all in the small to large range.
Study details: A randomized trial of 12 healthy adults with normal body weight.
Disclosures: The study was funded by a grant from the National Institutes of Health. Dr. Goel reported having no financial disclosures.
Source: Goel N et al. SLEEP 2019, Abstract 0036.
Children with Down syndrome may need more screening for sleep-disordered breathing
because the condition frequently persists and recurs.

“Current screening recommendations to assess for SDB at a particular age may not be adequate in this population,” the authors of the study stated, adding that “persistence/recurrence of SDB is not easily predicted.”
The study, led by Joy Nehme, BSc, of Children’s Hospital of Eastern Ontario and the University of Ottawa, was published in Pediatric Pulmonology.
According to the study, research suggests that 43%-66% of children with Down syndrome have SDB, a category that encompasses sleep apnea (both obstructive and central) and hypoventilation. Those numbers are several times higher than the prevalence of SDB in children in the general population (1%-5%).
“Because SDB is associated with cardiometabolic and neurocognitive morbidity, its prompt and accurate diagnosis is important,” the researchers wrote. However, diagnosis requires a sleep study, which is not always performed although the American Academy of Pediatrics recommends children with Down syndrome undergo one by age 4.
Treatments include adenotonsillectomy (considered first-line), positive airway pressure, and lingual tonsillectomy.
The study aims to fill in gaps in knowledge about the condition over the long term since “there is little available literature on the trajectory of SDB in children and youth with Down syndrome over time.”
The researchers launched a retrospective study of 560 children with Down syndrome who were treated from 2004 to 2015 at Children’s Hospital of Eastern Ontario. Of those, 120 showed signs of SDB and underwent sleep studies (48% male, median age 6.6 years [range 4.5-10.5], median total apnea‐hypopnea index events per hour = 3.4 [1.6-10.8]).
Of the 120 children, 67 (56%) had obstructive-mixed SDB, 9 (8%) had central sleep apnea, and 5 (4%) had hypoventilation. The others (39, 32%) had no SDB.
Fifty-four children underwent at least two sleep studies during the period of the study, with at least one undergoing seven.
Researchers found weak, nonsignificant evidence that SDB persistence/occurrence varied by age (odds ratio per year = 1.15; 95% confidence interval, 0.96-1.41; P = .13).
As for treatment, adenotonsillectomy was most common, although “previous studies have ... shown that moderate to severe OSA in children with Down syndrome is likely to persist after a tonsillectomy.”
In regard to obstructive sleep apnea (OSA) specifically, the authors wrote, “our study ... showed that OSA‐SDB persisted or recurred in the vast majority of children. Further, persistence/recurrence could not be predicted by clinical features or SDB severity in our study. This, therefore, highlights the need for serial longitudinal screening for SDB in this population and for follow‐up PSG to ensure the success of treatment interventions.”
No study funding was reported. The study authors reported no disclosures.
SOURCE: Nehme J et al. Pediatr Pulmonol. 2019 Jun 6. doi: 10.1002/ppul.24380.
because the condition frequently persists and recurs.
“Current screening recommendations to assess for SDB at a particular age may not be adequate in this population,” the authors of the study stated, adding that “persistence/recurrence of SDB is not easily predicted.”
The study, led by Joy Nehme, BSc, of Children’s Hospital of Eastern Ontario and the University of Ottawa, was published in Pediatric Pulmonology.
According to the study, research suggests that 43%-66% of children with Down syndrome have SDB, a category that encompasses sleep apnea (both obstructive and central) and hypoventilation. Those numbers are several times higher than the prevalence of SDB in children in the general population (1%-5%).
“Because SDB is associated with cardiometabolic and neurocognitive morbidity, its prompt and accurate diagnosis is important,” the researchers wrote. However, diagnosis requires a sleep study, which is not always performed although the American Academy of Pediatrics recommends children with Down syndrome undergo one by age 4.
Treatments include adenotonsillectomy (considered first-line), positive airway pressure, and lingual tonsillectomy.
The study aims to fill in gaps in knowledge about the condition over the long term since “there is little available literature on the trajectory of SDB in children and youth with Down syndrome over time.”
The researchers launched a retrospective study of 560 children with Down syndrome who were treated from 2004 to 2015 at Children’s Hospital of Eastern Ontario. Of those, 120 showed signs of SDB and underwent sleep studies (48% male, median age 6.6 years [range 4.5-10.5], median total apnea‐hypopnea index events per hour = 3.4 [1.6-10.8]).
Of the 120 children, 67 (56%) had obstructive-mixed SDB, 9 (8%) had central sleep apnea, and 5 (4%) had hypoventilation. The others (39, 32%) had no SDB.
Fifty-four children underwent at least two sleep studies during the period of the study, with at least one undergoing seven.
Researchers found weak, nonsignificant evidence that SDB persistence/occurrence varied by age (odds ratio per year = 1.15; 95% confidence interval, 0.96-1.41; P = .13).
As for treatment, adenotonsillectomy was most common, although “previous studies have ... shown that moderate to severe OSA in children with Down syndrome is likely to persist after a tonsillectomy.”
In regard to obstructive sleep apnea (OSA) specifically, the authors wrote, “our study ... showed that OSA‐SDB persisted or recurred in the vast majority of children. Further, persistence/recurrence could not be predicted by clinical features or SDB severity in our study. This, therefore, highlights the need for serial longitudinal screening for SDB in this population and for follow‐up PSG to ensure the success of treatment interventions.”
No study funding was reported. The study authors reported no disclosures.
SOURCE: Nehme J et al. Pediatr Pulmonol. 2019 Jun 6. doi: 10.1002/ppul.24380.
FROM PEDIATRIC PULMONOLOGY
Key clinical point: Sleep-disordered breathing (SDB) can be persistent and recurrent in children with Down syndrome, and long-term monitoring is warranted.
Major finding: SDB persistence/recurrence did not vary by age (odds ratio per year = 1.15; 95% confidence interval, 0.96-1.41; P = .13).
Study details: Retrospective cohort analysis of 120 children with Down syndrome tested via sleep study at least once for SDB (48% male, median age 6.6 years).
Disclosures: No study funding or author disclosures were reported.
Source: Nehme J et al. Pediatr Pulmonol. 2019 Jun 6. doi: 10.1002/ppul.24380.
Many doubt Medicare-for-all would bring universal coverage
Does Medicare-for-all mean that everyone gets health insurance coverage?
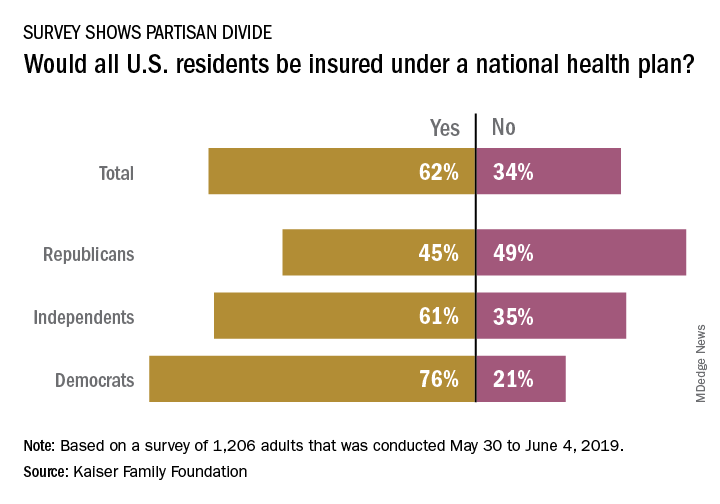
The public is not convinced that this would be the case, and Republicans are even more skeptical, according to a new survey from the Kaiser Family Foundation.
and there is a sizable split between Republicans and Democrats on the issue. Republicans, in fact, were more likely to say that all residents would not have coverage, with less than 49% of people identifying as Republican having answered “no” to the question and 45% having answered “yes”, Kaiser reported in its latest Health Tracking Poll.
Democrats were much more optimistic but not all were certain that all U.S. residents would have health insurance coverage. While 76% of Democrats responded yes when queried about whether all residents would get coverage, 21% answered no to the question. Responses to the question from independents – 61% said yes and 35% said no – very closely reflected the overall vote of 62% yes and 34% no, Kaiser said.
The partisan divide appeared again when respondents were asked if physicians and hospitals would be paid less under a national health plan: 64% of Republicans said payments would be reduced versus 42% of Democrats. Similarly, more than half of Republicans (53%) said that people who buy their own insurance would not be able to keep their current plans, compared with 24% of Democrats, the poll data show.
Those looking for common ground can point to responses regarding a couple of other potential effects of a national health plan. Republicans (57%) and Democrats (52%) largely agreed that private health insurance companies would not be the primary way Americans get health coverage, and they agreed that people would continue to pay deductibles and copays when they used health care services (68% for Republicans, 71% for Democrats), Kaiser said.
The poll was conducted from May 30 to June 4, 2019, and involved responses from 1,206 adults. The margin of sampling error was plus or minus 3 percentage points.
Does Medicare-for-all mean that everyone gets health insurance coverage?
The public is not convinced that this would be the case, and Republicans are even more skeptical, according to a new survey from the Kaiser Family Foundation.
and there is a sizable split between Republicans and Democrats on the issue. Republicans, in fact, were more likely to say that all residents would not have coverage, with less than 49% of people identifying as Republican having answered “no” to the question and 45% having answered “yes”, Kaiser reported in its latest Health Tracking Poll.
Democrats were much more optimistic but not all were certain that all U.S. residents would have health insurance coverage. While 76% of Democrats responded yes when queried about whether all residents would get coverage, 21% answered no to the question. Responses to the question from independents – 61% said yes and 35% said no – very closely reflected the overall vote of 62% yes and 34% no, Kaiser said.
The partisan divide appeared again when respondents were asked if physicians and hospitals would be paid less under a national health plan: 64% of Republicans said payments would be reduced versus 42% of Democrats. Similarly, more than half of Republicans (53%) said that people who buy their own insurance would not be able to keep their current plans, compared with 24% of Democrats, the poll data show.
Those looking for common ground can point to responses regarding a couple of other potential effects of a national health plan. Republicans (57%) and Democrats (52%) largely agreed that private health insurance companies would not be the primary way Americans get health coverage, and they agreed that people would continue to pay deductibles and copays when they used health care services (68% for Republicans, 71% for Democrats), Kaiser said.
The poll was conducted from May 30 to June 4, 2019, and involved responses from 1,206 adults. The margin of sampling error was plus or minus 3 percentage points.
Medical cannabis laws appear no longer tied to drop in opioid overdose mortality
Correlations do not hold when analysis is expanded to 2017
Contrary to previous research indicating that medical cannabis laws reduced opioid overdose mortality, the association between these two has reversed, with opioid overdose mortality increased in states with comprehensive medical cannabis laws, according to Chelsea L. Shover, PhD, and associates.

The original research by Marcus A. Bachhuber, MD, and associates showed that the introduction of state medical cannabis laws was associated with a 24.8% reduction in opioid overdose deaths per 100,000 population between 1999 and 2010. In contrast, the new research – which looked at a longer time period than the original research did – found that the association between state medical cannabis laws and opioid overdose mortality reversed direction, from –21% to +23%.
“We find it unlikely that medical cannabis – used by about 2.5% of the U.S. population – has exerted large conflicting effects on opioid overdose mortality,” wrote Dr. Shover, of the department of psychiatry and behavioral sciences at Stanford (Calif.) University, and associates. “A more plausible interpretation is that this association is spurious.” Their study was published in the Proceedings of the National Academy of Sciences.
To conduct their analysis, Dr. Shover and associates extended the timeline reviewed by Dr. Bachhuber and associates to 2017. During 2010-2017, 32 states enacted medical cannabis laws, including 17 allowing only medical cannabis with low levels of tetrahydrocannabinol (THC), and 8 legalized recreational marijuana. In the expanded timeline during 1999-2017, states possessing a comprehensive medical marijuana law saw an increase in opioid overdose mortality of 28.2%. Meanwhile, states with recreational marijuana laws saw a decrease of 14.7% in opioid overdose mortality, and states with low-THC medical cannabis laws saw a decrease of 7.1%. However, the investigators noted that those values had wide confidence intervals, which indicates “compatibility with large range of true associations.”
Corporate actors with deep pockets have substantial ability to promote congenial results, and suffering people are desperate for effective solutions. Cannabinoids have demonstrated therapeutic benefits, but reducing population-level opioid overdose mortality does not appear to be among them,” Dr. Shover and associates noted.
Dr. Shover reported receiving support from National Institute on Drug Abuse and the Wu Tsai Neurosciences Institute. Another coauthor received support from the Veterans Health Administration, Wu Tsai Neurosciences Institute, and the Esther Ting Memorial Professorship at Stanford.
SOURCE: Shover CL et al. Proc Natl Acad Sci U S A. 2019 Jun 10. doi: 10.1073/pnas.1903434116.
Correlations do not hold when analysis is expanded to 2017
Correlations do not hold when analysis is expanded to 2017
Contrary to previous research indicating that medical cannabis laws reduced opioid overdose mortality, the association between these two has reversed, with opioid overdose mortality increased in states with comprehensive medical cannabis laws, according to Chelsea L. Shover, PhD, and associates.
The original research by Marcus A. Bachhuber, MD, and associates showed that the introduction of state medical cannabis laws was associated with a 24.8% reduction in opioid overdose deaths per 100,000 population between 1999 and 2010. In contrast, the new research – which looked at a longer time period than the original research did – found that the association between state medical cannabis laws and opioid overdose mortality reversed direction, from –21% to +23%.
“We find it unlikely that medical cannabis – used by about 2.5% of the U.S. population – has exerted large conflicting effects on opioid overdose mortality,” wrote Dr. Shover, of the department of psychiatry and behavioral sciences at Stanford (Calif.) University, and associates. “A more plausible interpretation is that this association is spurious.” Their study was published in the Proceedings of the National Academy of Sciences.
To conduct their analysis, Dr. Shover and associates extended the timeline reviewed by Dr. Bachhuber and associates to 2017. During 2010-2017, 32 states enacted medical cannabis laws, including 17 allowing only medical cannabis with low levels of tetrahydrocannabinol (THC), and 8 legalized recreational marijuana. In the expanded timeline during 1999-2017, states possessing a comprehensive medical marijuana law saw an increase in opioid overdose mortality of 28.2%. Meanwhile, states with recreational marijuana laws saw a decrease of 14.7% in opioid overdose mortality, and states with low-THC medical cannabis laws saw a decrease of 7.1%. However, the investigators noted that those values had wide confidence intervals, which indicates “compatibility with large range of true associations.”
Corporate actors with deep pockets have substantial ability to promote congenial results, and suffering people are desperate for effective solutions. Cannabinoids have demonstrated therapeutic benefits, but reducing population-level opioid overdose mortality does not appear to be among them,” Dr. Shover and associates noted.
Dr. Shover reported receiving support from National Institute on Drug Abuse and the Wu Tsai Neurosciences Institute. Another coauthor received support from the Veterans Health Administration, Wu Tsai Neurosciences Institute, and the Esther Ting Memorial Professorship at Stanford.
SOURCE: Shover CL et al. Proc Natl Acad Sci U S A. 2019 Jun 10. doi: 10.1073/pnas.1903434116.
FROM PROCEEDINGS OF THE NATIONAL ACADEMY OF SCIENCES