User login
Is Patient Satisfaction the Same Immediately After the First Visit Compared to Two Weeks Later?
From the Department of Surgery and Perioperative Care, Dell Medical School, The University of Texas at Austin, Austin, TX (Dr. Kortlever, Ms. Haidar, Dr. Reichel, Dr. Driscoll, Dr. Ring, and Dr. Vagner) and University Medical Center Utrecht, Utrecht, The Netherlands (Dr. Teunis).
Abstract
- Objective: Patient satisfaction is considered a quality measure. Satisfaction is typically measured directly after an in-person visit in research and 2 weeks later in practice surveys. We assessed if there was a difference in immediate and delayed measurement of satisfaction.
- Questions: (1) There is no difference in patient satisfaction (measured by Numerical Rating Scale [NRS]) and (2) perceived empathy (measured by the Jefferson Scale of Patient Perceptions of Physician Empathy [JSPPPE]) immediately after the initial visit compared to 2 weeks later. (3) Change in disability (measured by the Patient-Reported Outcome Measurement Information System Physical Function-Upper Extremity [PROMIS PF-UE]) is not independently associated with change in satisfaction and (4) empathy after the initial visit compared to 2 weeks later.
- Methods: 150 new patients completed a survey of demographics, satisfaction with the surgeon, rating of the surgeon’s empathy, and upper extremity specific limitations. The satisfaction, empathy, and limitation questionnaires were repeated 2 weeks later.
- Results: We found a slight but significant decrease in satisfaction 2 weeks after the in-person visit (–0.41, P = 0.001). There was no significant change in perceived empathy (–0.71, P = 0.19). Change in limitations did not account for a change in satisfaction (P = 0.79) or perceived empathy (P = 0.93).
- Conclusion: Satisfaction and perceived empathy are relatively stable constructs that can be measured immediately after the visit.
Keywords: satisfaction, empathy, change, upper extremity, disability.
Patient satisfaction is increasingly being used as a performance measure to evaluate quality of care.1-8 Patient satisfaction correlates with adherence with recommended treatment.1,6,8-10 Satisfaction measured on an 11-point ordinal scale immediately after the visit correlates strongly with the perception of clinician empathy.2,3 Indeed, some satisfaction questionnaires such as the Medical Interview Satisfaction Scale (MISS)11,12 have questions very similar to empathy questionnaires. It may be that satisfaction is a construct similar to feeling that your doctor listened and cared about you as an individual (perceived physician empathy).
Higher ratings of satisfaction also seem to be related to a physician’s communication style.1,4,7-10 One study of 13 fertility doctors found that training in effective communication strategies led to improved patient satisfaction.7 A qualitative study of 36 patients, health professionals, and clinical support staff in an orthopaedic outpatient setting held interviews and focus group sessions to identify themes influencing patient satisfaction.4 Communication and expectation were among the 7 themes identified. We have noticed a high ceiling effect (maximum scores) with measures of patient satisfaction and perceived empathy.2,3 Another study also noted a high ceiling effect when using an ordinal scale.5 It may be that people with a positive feeling shortly after a health care encounter give top ratings out of politeness or gratefulness. It is also possible they will feel differently a few weeks after they leave the office. Furthermore, ratings of satisfaction gathered by a practice or health care system for practice assessment/improvement are often obtained several days to weeks after the visit, while research often obtains satisfaction ratings immediately after the visit for practical reasons. There may be differences between immediate and delayed measurement of satisfaction beyond the mentioned social norms.
Therefore, this study tested the primary null hypothesis that there is no difference in patient satisfaction (measured by Numerical Rating Scale [NRS]) immediately after the initial visit compared to 2 weeks later. Additionally, we assessed the difference in perceived empathy immediately after the initial visit compared to 2 weeks later, and whether change in disability was independently associated with change in satisfaction and empathy after the initial visit compared to 2 weeks later.
Methods
Study Design
After Institutional Review Board approval of this prospective, longitudinal, observational cohort study, we prospectively enrolled 150 adult patients between November 29, 2017 and January 10, 2018. Patients were seen at 5 orthopaedic clinics in a large urban area. We included all new English-speaking patients aged 18 to 89 years who were visiting 1 of 6 participating orthopaedic surgeons for any upper extremity problem and who were able to provide informed consent. We excluded follow-up visits and patients who were unable to speak and understand English. Four research assistants who were not involved with patient treatment described the study to patients before or after the visit with the surgeon. We were granted a waiver of written informed consent; patients indicated their consent by completing the surveys.
Patients could choose either phone or email as their preferred mode of contact for follow-up in this study. For patients who selected email as the preferred mode of contact, the follow-up survey was sent automatically 2 weeks after completion date, and a maximum of 3 reminder emails with 2-day time intervals between them were sent to those who did not respond to the initial invitation. For patients who selected phone as the preferred mode of contact, the follow-up survey was done by an English-speaking research assistant who was not involved with patient treatment. When a response was not obtained on the initial phone call, 3 additional phone calls were made (1 later that same day and 2 the next day). One patient declined participation because he was not interested in the study and had no time after his visit.
Measurements
Patients were asked to complete a set of questionnaires at the end of their visit:
1. A demographic questionnaire consisting of preferred mode of contact for follow-up (phone or email), age, sex, race/ethnicity, marital status, education status, work status, insurance status, and type of visit (first visit or second opinion);
2. An 11-point ordinal measure of satisfaction with the surgeon, with scores ranging from 0 (Worst Surgeon Possible) to 10 (Best Surgeon Possible);
3. The patient’s rating of the surgeon’s empathy, measured by the Jefferson Scale of Patient Perceptions of Physician Empathy (JSPPPE).13 The JSPPPE is a 5-item questionnaire, measured on a 7-point Likert scale, with scores ranging from 1 (Strongly Disagree) to 7 (Strongly Agree), that assesses agreement with statements about the physician. The total score is the sum of all item scores (5-35), with higher scores representing a higher degree of perceived physician empathy.
4. Upper extremity disability, measured by the Patient-Reported Outcomes Measurement Information System Physical Function-Upper Extremity (PROMIS PF-UE) Computer Adaptive Test (CAT).14-16 This is a measure of physical limitations in the upper extremity. It can be completed with as few as 4 questions while still achieving high precision in scoring and thereby decreasing survey burden. PROMIS presents a continuous T-score with a mean of 50 and standard deviation (SD) of 10, with higher scores reflecting better physical function compared to the average of the US general population.15
After completing the initial questionnaire, the research assistant filled out the office and surgeon name and asked the surgeon to complete the diagnosis. All questionnaires were administered on an encrypted tablet via the secure, HIPAA-compliant electronic platform REDCap (Research Electronic Data Capture), a web-based application for building and managing online surveys and databases.17 The follow-up survey was sent automatically or was done by phone call as previously described. The follow-up survey consisted of (1) the 11-point ordinal measure of satisfaction with the surgeon, (2) the JSPPPE for perceived empathy, and (3) the PROMIS PF-UE for physical limitations in the upper extremity.
Analysis
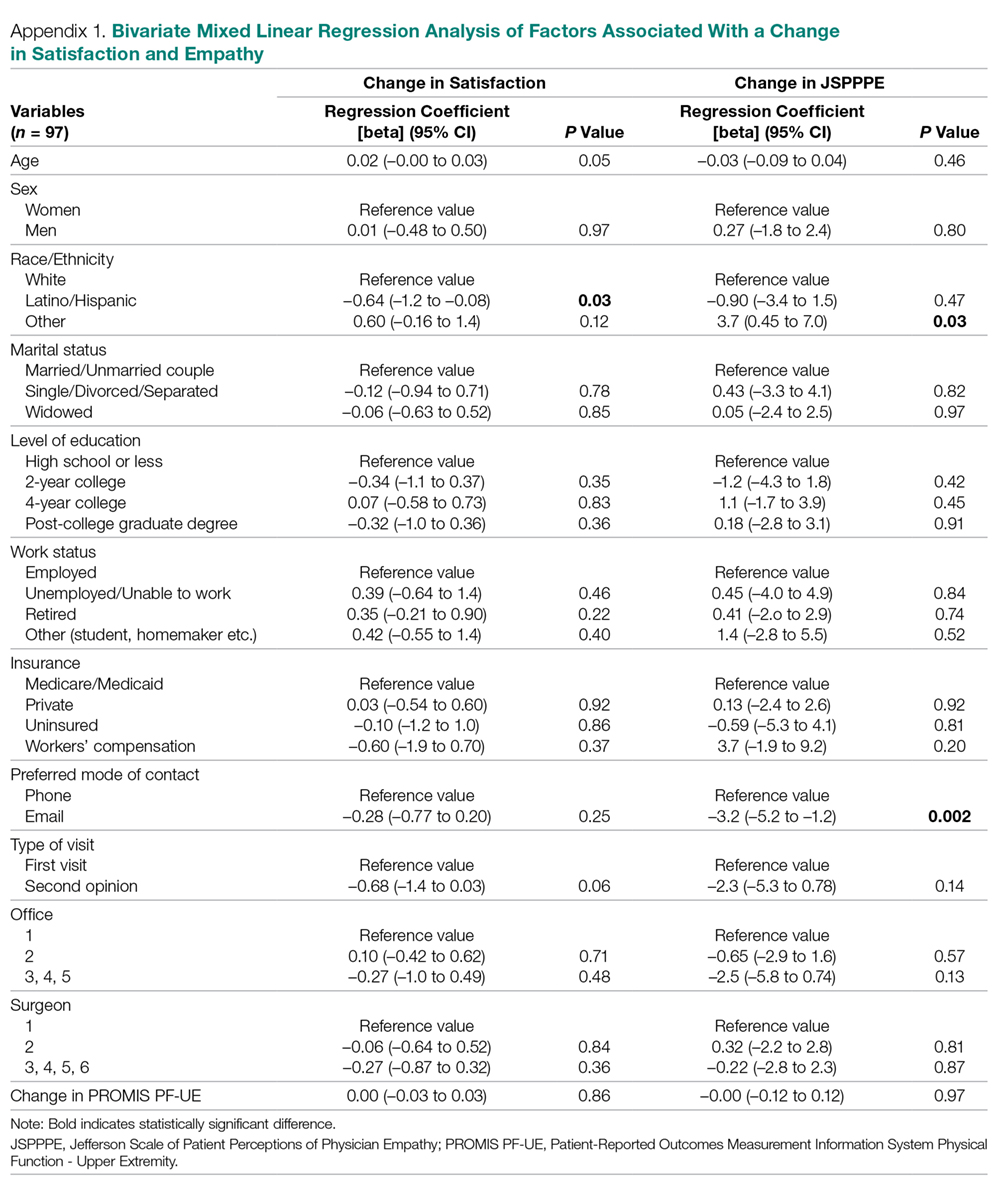
Continuous variables are presented as mean ± SD and discrete data as proportions. We used Student’s t-tests to assess baseline differences between continuous variables and Fisher’s exact tests for discrete variables. To assess differences in satisfaction and perceived empathy after 2 weeks, we used Student’s paired t-tests. We created 2 multilevel multivariable linear regression models to assess factors associated with (1) change in satisfaction with the surgeon and (2) change in perceived physician empathy. These models account for correlation of patients treated by the same surgeon. We selected variables to be included in the final models by running multilevel models with only 1 independent variable of interest (Appendix 1). Variables with P < 0.10 were included in our final models. We also included change in PROMIS PF-UE in both models because this was our variable of interest. We considered P < 0.05 significant.
We performed a power analysis for the difference in patient satisfaction immediately after the first visit compared to 2 weeks later. Based on our pilot data where we found an initial mean satisfaction score of 9.4 and mean satisfaction score after 2 weeks of 9.1 (SD of difference 1.0), a priori power analysis showed that we needed a minimum sample size of 90 patients to detect a difference with power set at 0.80 and alpha set at 0.05. In order to account for loss to follow-up as previously noted,18 we enrolled 67% more patients (total of 150).
Results
Respondent Characteristics
None of the 150 patients were excluded from the analysis. The study patients’ mean age was 51 ± 16 years (range, 18-87 years), and 73 (49%) were men (Table 1). Mean scores directly after the visit were 9.4 ± 1.2 (range, 2-10) for satisfaction with the surgeon, 31 ± 5.2 (range, 9-35) for perceived physician empathy, and 40 ± 10 (range 15-56) for upper extremity disability. Most patients (n = 130, 87%) were seen in 2 of 5 offices, and 106 (71%) were seen by 2 out of 6 participating surgeons.
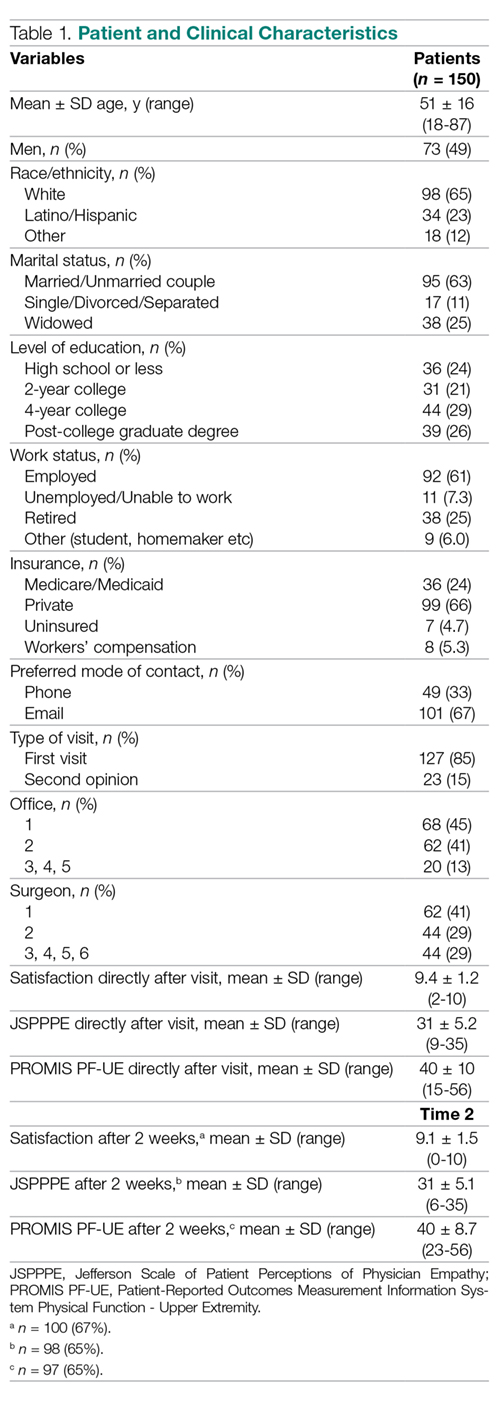
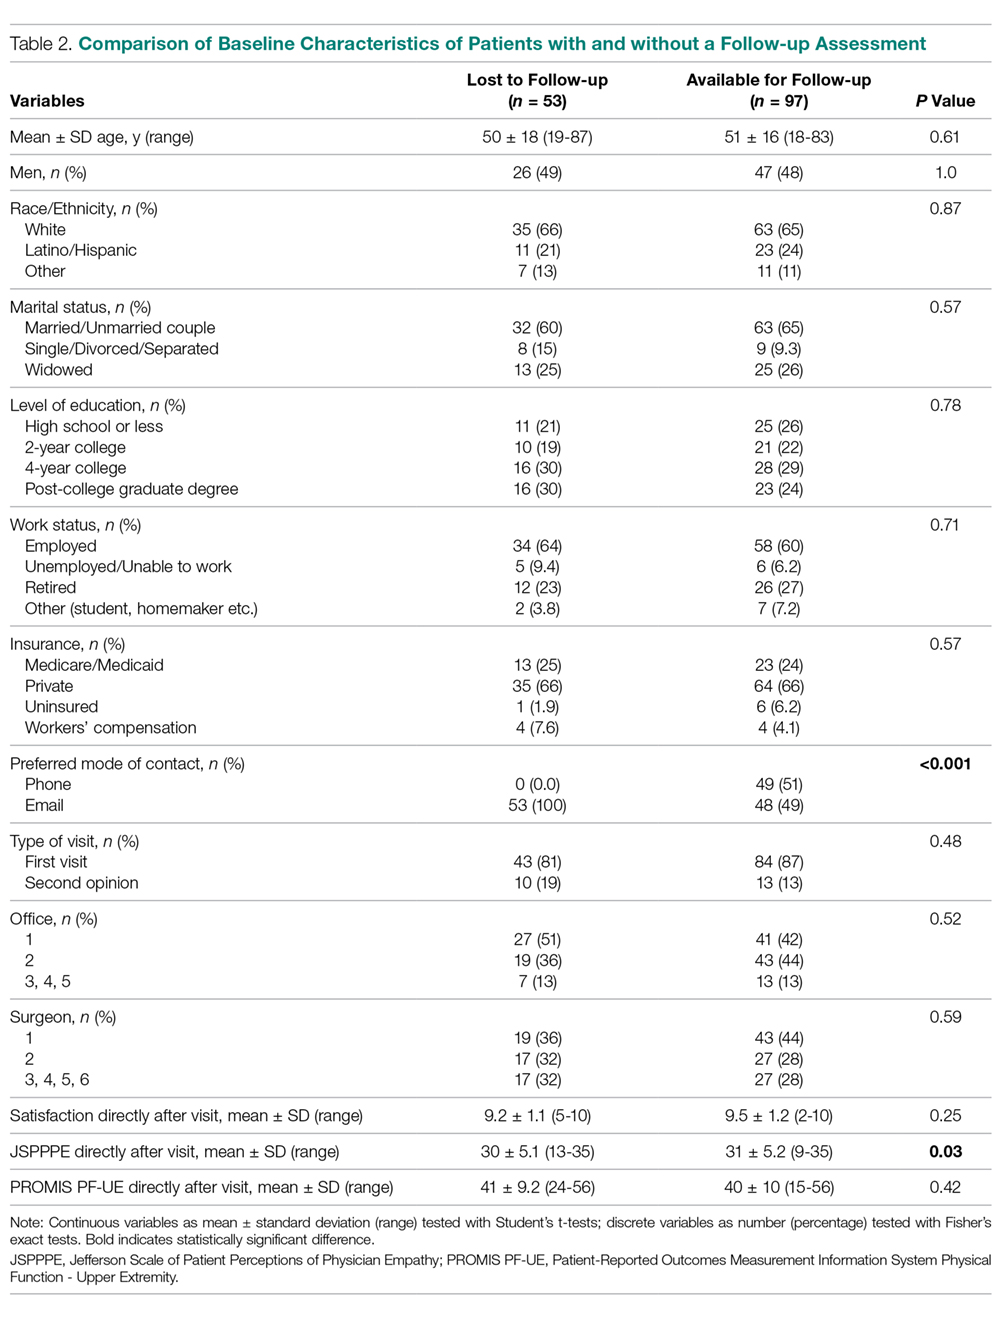
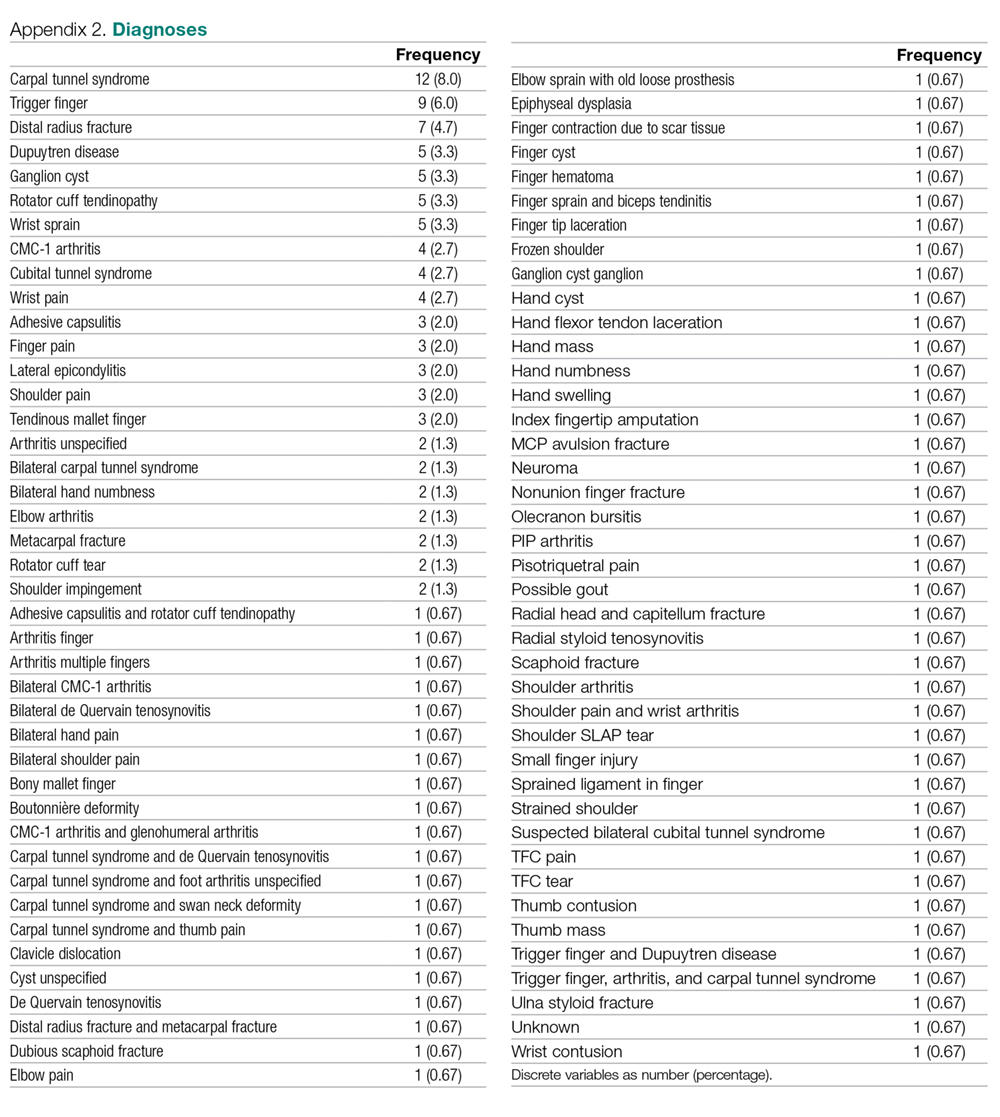
Ninety-seven (65%) patients completed their follow-up assessment 2 weeks after their initial visit, 49 (51%) by phone and 48 (49%) by email. This is a slightly better rate than the 36% rate reported in previous research.18 After 2 weeks, the mean score for satisfaction with the surgeon was 9.1 ± 1.5 (range, 0-10), the mean perceived empathy score was 31 ± 5.1 (range, 6-35), and the mean upper extremity disability score was 40 ± 8.7 (range, 23-56). Responders did not differ from nonresponders based on demographic data (Table 2). However, nonresponders had lower perceived empathy scores directly after their visit (P = 0.03) and none had initially chosen phone as their preferred mode of contact for follow-up (P < 0.001). A list of all diagnoses with frequencies the surgeons stated is listed in Appendix 2.
Difference in Satisfaction with the Surgeon
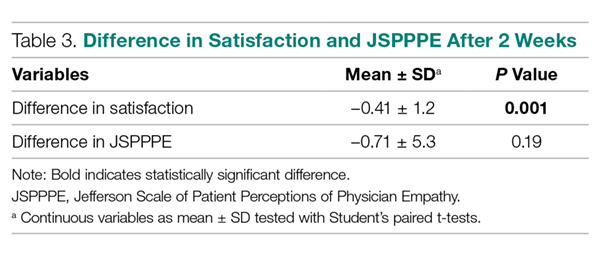
Satisfaction with the surgeon 2 weeks after the in-person visit was slightly, but significantly, lower on bivariate analysis compared to satisfaction with the surgeon immediately after the initial visit (–0.41 ± 1.2, P = 0.001; Table 3).
Difference in Perceived Physician Empathy
Perceived physician empathy 2 weeks after the in-person visit was not significantly lower on bivariate analysis compared to perceived physician empathy immediately after the initial visit (–0.71 ± 5.3, P = 0.19; Table 3).
Factors Associated with Change in Satisfaction with the Surgeon
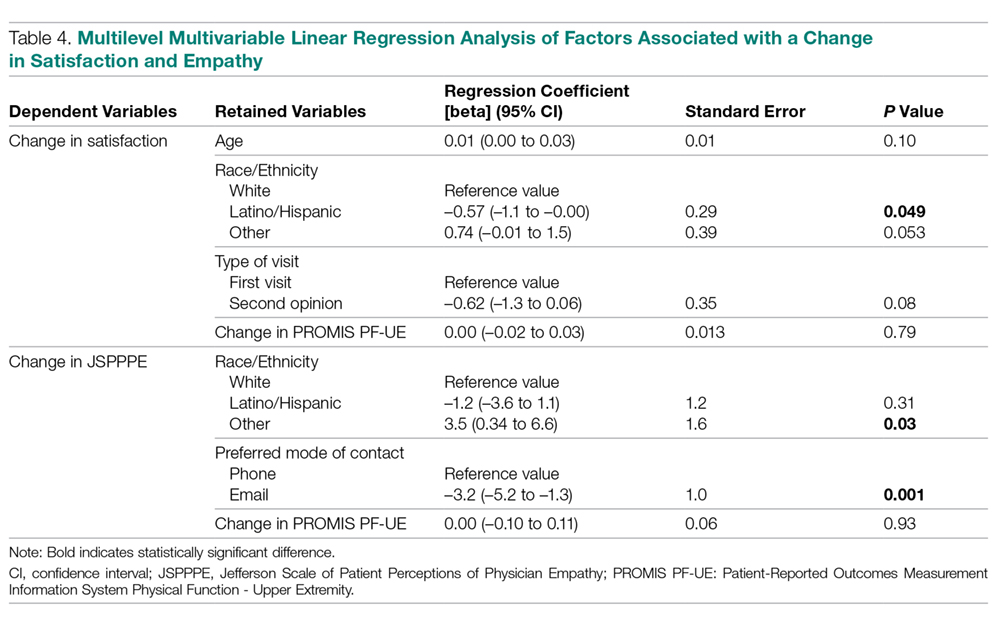
Accounting for potential interaction of variables using multilevel multivariable analysis, change in disability of the upper extremity was not associated with change in satisfaction with the surgeon (regression coefficient [beta], 0.00 [95% confidence interval {CI}, –0.02 to 0.03]; standard error [SE], 0.01; P = 0.79 [Table 4]). Being Latino was independently associated with less change in satisfaction with the surgeon (beta coefficient, –0.57 [95% CI, –1.1 to 0.00]; SE, 0.29; P = 0.049).
Factors Associated with Change in Perceived Physician Empathy
Accounting for potential interaction of variables using multilevel multivariable analysis, change in disability of the upper extremity was not associated with change in perceived physician empathy (beta coefficient = 0.00 [95% CI, –0.10 to 0.11]; SE, 0.06; P = 0.93 [Table 4]). Race/ethnicity other than white or Latino was independently associated with more change in perceived physician empathy (beta coefficient, 3.5 [95% CI, 0.34 to 6.6]; SE, 1.6; P = 0.030), and preferring email as mode of contact for follow-up was independently associated with less change in perceived physician empathy (beta coefficient, –3.2 [95% CI, –5.2 to –1.3]; SE, 1.0; P = 0.001).
Discussion
Patient satisfaction is considered a quality measure1-8 and is typically measured directly after an in-person visit. This study tested differences in patient satisfaction and perceived empathy immediately after the initial visit compared to 2 weeks later. In addition, we assessed whether change in disability was independently associated with change in satisfaction and empathy after the initial visit compared to 2 weeks later.
We acknowledge some study limitations. First, we only measured satisfaction based on 1 visit rather than multiple visits over time. It might be that satisfaction ratings differ when the physician-patient relationship is more established. However, we found overall high satisfaction ratings and a well-established relationship might not add to this finding. Second, surgeons were aware of the study and its purpose, which might have resulted in subconsciously altering the behavior to improve satisfaction. The effect of people acting differently as a result of being observed is called the Hawthorne effect.19 Third, we only used 1 simple ordinal measure to assess patient satisfaction with the surgeon. There is a wide variety of satisfaction measures,20 though the focus of this study was not to test the best possible satisfaction measure but to assess changes in satisfaction over time and its predictors. The simple 11-point ordinal satisfaction measure has proved reliable.6 Fourth, 35% of patients did not make a second rating. This is not unusual for phone or email studies. Our response rate was relatively high compared to other studies in our field,18 perhaps because the time to the second assessment was only 2 weeks and all people were available for follow-up by phone. Fifth, we analyzed 4 surgeons as 1 group and 3 offices as 1 group since we did not enroll enough patients per surgeon and office for individual analysis. However, multilevel linear analysis takes surgeon specific factors into account within that group.
The finding that satisfaction with the surgeon after 2 weeks was significantly lower on bivariate analysis compared to immediately after the initial visit is different from a study that found small increases in satisfaction after 2 weeks and 3 months,1 but comparable to another study in our field.21 Although significant, we believe the decrease in satisfaction is probably not clinically relevant. It might also be that satisfaction at follow-up is lower than measured, but that the least satisfied people did not respond on the follow-up survey.
We found no significant change in perceived empathy after 2 weeks. Since empathy is a strong driver of satisfaction,2,4-7 we did not expect to find differing results for empathy and for satisfaction over time. Both satisfaction and empathy seem to be relatively durable measures with current measurement tools.
The finding that change in disability was neither independently associated with change in satisfaction nor change in empathy is consistent with prior research.2,3,21 We cannot adequately study the impact of changes since we did not find an important change in either satisfaction or empathy over time. Jackson et al found higher satisfaction ratings over time in patients who had an increase in physical function and a decrease in symptoms.1 They also found that met expectations was associated with higher satisfaction immediately after the visit, after 2 weeks, and after 3 months.1 We feel that met expectations and fewer symptoms and limitations are likely highly co-linear with satisfaction. We therefore may not be able to learn much about one from the others.
The slight change we found in satisfaction with the surgeon among Latino patients was significantly less than the change among white patients. This suggests Latino patients might have a more stable opinion over time (a cultural phenomenon), or it might be spurious given the small number of Latino patients included in the study. The same can be said for the finding that race/ethnicity other than white or Latino was independently associated with greater change in empathy. Providing email as the preferred mode of contact was found to be independently associated with less change in perceived empathy compared to follow-up by phone. We had a 100% success rate for our follow-ups by phone. Our findings suggest that patients might more easily switch ratings on an 11-point ordinal scale than on a 5-item Likert scale. However, both measures are often rated at the ceiling of the scale.2,21
Conclusion
Satisfaction and perceived empathy are relatively stable constructs, are not clearly associated with other factors, and are strongly correlated with one another. This study supports the research practice of measuring satisfaction immediately after the visit, which is more convenient for both participant and researcher and avoids the loss of more than one third of the patients, and those with a worse experience in particular. To improve the utility and interpretation of patient-reported experience measures such as these, we might direct our efforts to developing scales with less ceiling effect.
Corresponding author: David Ring, MD, PhD, Dell Medical School, The University of Texas at Austin, Health Discovery Building HDB 6.706, 1701 Trinity St., Austin, TX 78705; david.ring@austin.utexas.edu.
Financial disclosures: Dr. Ring has or may receive payment or benefits from Skeletal Dynamics, Wright Medical for elbow implants, Deputy Editor for Clinical Orthopaedics and Related Research, Universities and Hospitals, Lawyers outside the submitted work.
Dr. Teunis has or may receive payment or benefits from VCC, PATIENT+, and AO Trauma TK network unrelated to this work and consultant fees from Synthes.
1. Jackson JL, Chamberlin J, Kroenke K. Predictors of patient satisfaction. Soc Sci Med. 2001;52:609-620.
2. Menendez ME, Chen NC, Mudgal CS, et al. Physician empathy as a driver of hand surgery patient satisfaction. J Hand Surg Am. 2015;40(9):1860-1865.
3. Parrish RC 2nd, Menendez ME, Mudgal CS, et al. Patient Satisfaction and its relation to perceived visit duration with a hand surgeon. J Hand Surg Am. 2016;41(2):257-262.
4. Waters S, Edmondston SJ, Yates PJ, Gucciardi DF. Identification of factors influencing patient satisfaction with orthopaedic outpatient clinic consultation: A qualitative study. Man Ther. 2016;25:48-55.
5. Voutilainen A, Pitkaaho T, Kvist T, Vehvilainen-Julkunen K. How to ask about patient satisfaction? The visual analogue scale is less vulnerable to confounding factors and ceiling effect than a symmetric Likert scale. J Adv Nurs. 2016;72:946-957.
6. van Berckel MM, Bosma NH, Hageman MG, et al. The correlation between a numerical rating scale of patient satisfaction with current management of an upper extremity disorder and a general measure of satisfaction with the medical visit. Hand (N Y). 2017;12:202-206.
7. Garcia D, Bautista O, Venereo L, et al. Training in empathic skills improves the patient-physician relationship during the first consultation in a fertility clinic. Fertil Steril. 2013;99:1413-1418.
8. Fitzpatrick RM, Hopkins A. Patients’ satisfaction with communication in neurological outpatient clinics. J Psychosom Res. 1981;25:329-334.
9. Kincey J, Bradshaw P, Ley P. Patients’ satisfaction and reported acceptance of advice in general practice. J R Coll Gen Pract. 1975;25:558-566.
10. Ley P, Whitworth MA, Skilbeck CE, et al. Improving doctor-patient communication in general practice. J R Coll Gen Pract. 1976;26:720-724.
11. Meakin R, Weinman J. The ‘Medical Interview Satisfaction Scale’ (MISS-21) adapted for British general practice. Fam Pract. 2002;19:257-263.
12. Wolf MH, Putnam SM, James SA, Stiles WB. The Medical Interview Satisfaction Scale: development of a scale to measure patient perceptions of physician behavior. J Behav Med. 1978;1:391-401.
13. Kane GC, Gotto JL, Mangione S, et al. Jefferson Scale of Patient’s Perceptions of Physician Empathy: preliminary psychometric data. Croat Med J. 2007;48:81-86.
14. Beckmann JT , Hung M, Voss MW, et al. Evaluation of the patient-reported outcomes measurement information system upper extremity computer adaptive test. J Hand Surg Am. 2016;41:739-744.
15. PROMIS. PROMIS PF Scoring. Available at www.healthmeasures.net/administrator/components/com_instruments/uploads/PROMIS%20Physical%20Function%20Scoring%20Manual.pdf. Accessed March 1, 2019.
16. PROMIS. PROMIS Measures. Available at wwwnihpromisorg. Accessed March 1, 2019.
17. Harris PA, Taylor R, Thielke R, et al. Research electronic data capture (REDCap)--a metadata-driven methodology and workflow process for providing translational research informatics support. J Biomed Inform. 2009;42:377-381.
18. Bot AG, Anderson JA, Neuhaus V, Ring D. Factors associated with survey response in hand surgery research. Clin Orthop Relat Res. 2013;471(10):3237-3242.
19. Sedgwick P, Greenwood N. Understanding the Hawthorne effect. BMJ. 2015;351:h4672.
20. Ross CK, Steward CA, Sinacore JM. A comparative study of seven measures of patient satisfaction. Med Care. 1995;33:392-406.
21. Teunis T, Thornton ER, Jayakumar P, Ring D. Time seeing a hand surgeon is not associated with patient satisfaction. Clin Orthop Relat Res. 2015;473:2362-2368.
From the Department of Surgery and Perioperative Care, Dell Medical School, The University of Texas at Austin, Austin, TX (Dr. Kortlever, Ms. Haidar, Dr. Reichel, Dr. Driscoll, Dr. Ring, and Dr. Vagner) and University Medical Center Utrecht, Utrecht, The Netherlands (Dr. Teunis).
Abstract
- Objective: Patient satisfaction is considered a quality measure. Satisfaction is typically measured directly after an in-person visit in research and 2 weeks later in practice surveys. We assessed if there was a difference in immediate and delayed measurement of satisfaction.
- Questions: (1) There is no difference in patient satisfaction (measured by Numerical Rating Scale [NRS]) and (2) perceived empathy (measured by the Jefferson Scale of Patient Perceptions of Physician Empathy [JSPPPE]) immediately after the initial visit compared to 2 weeks later. (3) Change in disability (measured by the Patient-Reported Outcome Measurement Information System Physical Function-Upper Extremity [PROMIS PF-UE]) is not independently associated with change in satisfaction and (4) empathy after the initial visit compared to 2 weeks later.
- Methods: 150 new patients completed a survey of demographics, satisfaction with the surgeon, rating of the surgeon’s empathy, and upper extremity specific limitations. The satisfaction, empathy, and limitation questionnaires were repeated 2 weeks later.
- Results: We found a slight but significant decrease in satisfaction 2 weeks after the in-person visit (–0.41, P = 0.001). There was no significant change in perceived empathy (–0.71, P = 0.19). Change in limitations did not account for a change in satisfaction (P = 0.79) or perceived empathy (P = 0.93).
- Conclusion: Satisfaction and perceived empathy are relatively stable constructs that can be measured immediately after the visit.
Keywords: satisfaction, empathy, change, upper extremity, disability.
Patient satisfaction is increasingly being used as a performance measure to evaluate quality of care.1-8 Patient satisfaction correlates with adherence with recommended treatment.1,6,8-10 Satisfaction measured on an 11-point ordinal scale immediately after the visit correlates strongly with the perception of clinician empathy.2,3 Indeed, some satisfaction questionnaires such as the Medical Interview Satisfaction Scale (MISS)11,12 have questions very similar to empathy questionnaires. It may be that satisfaction is a construct similar to feeling that your doctor listened and cared about you as an individual (perceived physician empathy).
Higher ratings of satisfaction also seem to be related to a physician’s communication style.1,4,7-10 One study of 13 fertility doctors found that training in effective communication strategies led to improved patient satisfaction.7 A qualitative study of 36 patients, health professionals, and clinical support staff in an orthopaedic outpatient setting held interviews and focus group sessions to identify themes influencing patient satisfaction.4 Communication and expectation were among the 7 themes identified. We have noticed a high ceiling effect (maximum scores) with measures of patient satisfaction and perceived empathy.2,3 Another study also noted a high ceiling effect when using an ordinal scale.5 It may be that people with a positive feeling shortly after a health care encounter give top ratings out of politeness or gratefulness. It is also possible they will feel differently a few weeks after they leave the office. Furthermore, ratings of satisfaction gathered by a practice or health care system for practice assessment/improvement are often obtained several days to weeks after the visit, while research often obtains satisfaction ratings immediately after the visit for practical reasons. There may be differences between immediate and delayed measurement of satisfaction beyond the mentioned social norms.
Therefore, this study tested the primary null hypothesis that there is no difference in patient satisfaction (measured by Numerical Rating Scale [NRS]) immediately after the initial visit compared to 2 weeks later. Additionally, we assessed the difference in perceived empathy immediately after the initial visit compared to 2 weeks later, and whether change in disability was independently associated with change in satisfaction and empathy after the initial visit compared to 2 weeks later.
Methods
Study Design
After Institutional Review Board approval of this prospective, longitudinal, observational cohort study, we prospectively enrolled 150 adult patients between November 29, 2017 and January 10, 2018. Patients were seen at 5 orthopaedic clinics in a large urban area. We included all new English-speaking patients aged 18 to 89 years who were visiting 1 of 6 participating orthopaedic surgeons for any upper extremity problem and who were able to provide informed consent. We excluded follow-up visits and patients who were unable to speak and understand English. Four research assistants who were not involved with patient treatment described the study to patients before or after the visit with the surgeon. We were granted a waiver of written informed consent; patients indicated their consent by completing the surveys.
Patients could choose either phone or email as their preferred mode of contact for follow-up in this study. For patients who selected email as the preferred mode of contact, the follow-up survey was sent automatically 2 weeks after completion date, and a maximum of 3 reminder emails with 2-day time intervals between them were sent to those who did not respond to the initial invitation. For patients who selected phone as the preferred mode of contact, the follow-up survey was done by an English-speaking research assistant who was not involved with patient treatment. When a response was not obtained on the initial phone call, 3 additional phone calls were made (1 later that same day and 2 the next day). One patient declined participation because he was not interested in the study and had no time after his visit.
Measurements
Patients were asked to complete a set of questionnaires at the end of their visit:
1. A demographic questionnaire consisting of preferred mode of contact for follow-up (phone or email), age, sex, race/ethnicity, marital status, education status, work status, insurance status, and type of visit (first visit or second opinion);
2. An 11-point ordinal measure of satisfaction with the surgeon, with scores ranging from 0 (Worst Surgeon Possible) to 10 (Best Surgeon Possible);
3. The patient’s rating of the surgeon’s empathy, measured by the Jefferson Scale of Patient Perceptions of Physician Empathy (JSPPPE).13 The JSPPPE is a 5-item questionnaire, measured on a 7-point Likert scale, with scores ranging from 1 (Strongly Disagree) to 7 (Strongly Agree), that assesses agreement with statements about the physician. The total score is the sum of all item scores (5-35), with higher scores representing a higher degree of perceived physician empathy.
4. Upper extremity disability, measured by the Patient-Reported Outcomes Measurement Information System Physical Function-Upper Extremity (PROMIS PF-UE) Computer Adaptive Test (CAT).14-16 This is a measure of physical limitations in the upper extremity. It can be completed with as few as 4 questions while still achieving high precision in scoring and thereby decreasing survey burden. PROMIS presents a continuous T-score with a mean of 50 and standard deviation (SD) of 10, with higher scores reflecting better physical function compared to the average of the US general population.15
After completing the initial questionnaire, the research assistant filled out the office and surgeon name and asked the surgeon to complete the diagnosis. All questionnaires were administered on an encrypted tablet via the secure, HIPAA-compliant electronic platform REDCap (Research Electronic Data Capture), a web-based application for building and managing online surveys and databases.17 The follow-up survey was sent automatically or was done by phone call as previously described. The follow-up survey consisted of (1) the 11-point ordinal measure of satisfaction with the surgeon, (2) the JSPPPE for perceived empathy, and (3) the PROMIS PF-UE for physical limitations in the upper extremity.
Analysis
Continuous variables are presented as mean ± SD and discrete data as proportions. We used Student’s t-tests to assess baseline differences between continuous variables and Fisher’s exact tests for discrete variables. To assess differences in satisfaction and perceived empathy after 2 weeks, we used Student’s paired t-tests. We created 2 multilevel multivariable linear regression models to assess factors associated with (1) change in satisfaction with the surgeon and (2) change in perceived physician empathy. These models account for correlation of patients treated by the same surgeon. We selected variables to be included in the final models by running multilevel models with only 1 independent variable of interest (Appendix 1). Variables with P < 0.10 were included in our final models. We also included change in PROMIS PF-UE in both models because this was our variable of interest. We considered P < 0.05 significant.
We performed a power analysis for the difference in patient satisfaction immediately after the first visit compared to 2 weeks later. Based on our pilot data where we found an initial mean satisfaction score of 9.4 and mean satisfaction score after 2 weeks of 9.1 (SD of difference 1.0), a priori power analysis showed that we needed a minimum sample size of 90 patients to detect a difference with power set at 0.80 and alpha set at 0.05. In order to account for loss to follow-up as previously noted,18 we enrolled 67% more patients (total of 150).
Results
Respondent Characteristics
None of the 150 patients were excluded from the analysis. The study patients’ mean age was 51 ± 16 years (range, 18-87 years), and 73 (49%) were men (Table 1). Mean scores directly after the visit were 9.4 ± 1.2 (range, 2-10) for satisfaction with the surgeon, 31 ± 5.2 (range, 9-35) for perceived physician empathy, and 40 ± 10 (range 15-56) for upper extremity disability. Most patients (n = 130, 87%) were seen in 2 of 5 offices, and 106 (71%) were seen by 2 out of 6 participating surgeons.
Ninety-seven (65%) patients completed their follow-up assessment 2 weeks after their initial visit, 49 (51%) by phone and 48 (49%) by email. This is a slightly better rate than the 36% rate reported in previous research.18 After 2 weeks, the mean score for satisfaction with the surgeon was 9.1 ± 1.5 (range, 0-10), the mean perceived empathy score was 31 ± 5.1 (range, 6-35), and the mean upper extremity disability score was 40 ± 8.7 (range, 23-56). Responders did not differ from nonresponders based on demographic data (Table 2). However, nonresponders had lower perceived empathy scores directly after their visit (P = 0.03) and none had initially chosen phone as their preferred mode of contact for follow-up (P < 0.001). A list of all diagnoses with frequencies the surgeons stated is listed in Appendix 2.
Difference in Satisfaction with the Surgeon
Satisfaction with the surgeon 2 weeks after the in-person visit was slightly, but significantly, lower on bivariate analysis compared to satisfaction with the surgeon immediately after the initial visit (–0.41 ± 1.2, P = 0.001; Table 3).
Difference in Perceived Physician Empathy
Perceived physician empathy 2 weeks after the in-person visit was not significantly lower on bivariate analysis compared to perceived physician empathy immediately after the initial visit (–0.71 ± 5.3, P = 0.19; Table 3).
Factors Associated with Change in Satisfaction with the Surgeon
Accounting for potential interaction of variables using multilevel multivariable analysis, change in disability of the upper extremity was not associated with change in satisfaction with the surgeon (regression coefficient [beta], 0.00 [95% confidence interval {CI}, –0.02 to 0.03]; standard error [SE], 0.01; P = 0.79 [Table 4]). Being Latino was independently associated with less change in satisfaction with the surgeon (beta coefficient, –0.57 [95% CI, –1.1 to 0.00]; SE, 0.29; P = 0.049).
Factors Associated with Change in Perceived Physician Empathy
Accounting for potential interaction of variables using multilevel multivariable analysis, change in disability of the upper extremity was not associated with change in perceived physician empathy (beta coefficient = 0.00 [95% CI, –0.10 to 0.11]; SE, 0.06; P = 0.93 [Table 4]). Race/ethnicity other than white or Latino was independently associated with more change in perceived physician empathy (beta coefficient, 3.5 [95% CI, 0.34 to 6.6]; SE, 1.6; P = 0.030), and preferring email as mode of contact for follow-up was independently associated with less change in perceived physician empathy (beta coefficient, –3.2 [95% CI, –5.2 to –1.3]; SE, 1.0; P = 0.001).
Discussion
Patient satisfaction is considered a quality measure1-8 and is typically measured directly after an in-person visit. This study tested differences in patient satisfaction and perceived empathy immediately after the initial visit compared to 2 weeks later. In addition, we assessed whether change in disability was independently associated with change in satisfaction and empathy after the initial visit compared to 2 weeks later.
We acknowledge some study limitations. First, we only measured satisfaction based on 1 visit rather than multiple visits over time. It might be that satisfaction ratings differ when the physician-patient relationship is more established. However, we found overall high satisfaction ratings and a well-established relationship might not add to this finding. Second, surgeons were aware of the study and its purpose, which might have resulted in subconsciously altering the behavior to improve satisfaction. The effect of people acting differently as a result of being observed is called the Hawthorne effect.19 Third, we only used 1 simple ordinal measure to assess patient satisfaction with the surgeon. There is a wide variety of satisfaction measures,20 though the focus of this study was not to test the best possible satisfaction measure but to assess changes in satisfaction over time and its predictors. The simple 11-point ordinal satisfaction measure has proved reliable.6 Fourth, 35% of patients did not make a second rating. This is not unusual for phone or email studies. Our response rate was relatively high compared to other studies in our field,18 perhaps because the time to the second assessment was only 2 weeks and all people were available for follow-up by phone. Fifth, we analyzed 4 surgeons as 1 group and 3 offices as 1 group since we did not enroll enough patients per surgeon and office for individual analysis. However, multilevel linear analysis takes surgeon specific factors into account within that group.
The finding that satisfaction with the surgeon after 2 weeks was significantly lower on bivariate analysis compared to immediately after the initial visit is different from a study that found small increases in satisfaction after 2 weeks and 3 months,1 but comparable to another study in our field.21 Although significant, we believe the decrease in satisfaction is probably not clinically relevant. It might also be that satisfaction at follow-up is lower than measured, but that the least satisfied people did not respond on the follow-up survey.
We found no significant change in perceived empathy after 2 weeks. Since empathy is a strong driver of satisfaction,2,4-7 we did not expect to find differing results for empathy and for satisfaction over time. Both satisfaction and empathy seem to be relatively durable measures with current measurement tools.
The finding that change in disability was neither independently associated with change in satisfaction nor change in empathy is consistent with prior research.2,3,21 We cannot adequately study the impact of changes since we did not find an important change in either satisfaction or empathy over time. Jackson et al found higher satisfaction ratings over time in patients who had an increase in physical function and a decrease in symptoms.1 They also found that met expectations was associated with higher satisfaction immediately after the visit, after 2 weeks, and after 3 months.1 We feel that met expectations and fewer symptoms and limitations are likely highly co-linear with satisfaction. We therefore may not be able to learn much about one from the others.
The slight change we found in satisfaction with the surgeon among Latino patients was significantly less than the change among white patients. This suggests Latino patients might have a more stable opinion over time (a cultural phenomenon), or it might be spurious given the small number of Latino patients included in the study. The same can be said for the finding that race/ethnicity other than white or Latino was independently associated with greater change in empathy. Providing email as the preferred mode of contact was found to be independently associated with less change in perceived empathy compared to follow-up by phone. We had a 100% success rate for our follow-ups by phone. Our findings suggest that patients might more easily switch ratings on an 11-point ordinal scale than on a 5-item Likert scale. However, both measures are often rated at the ceiling of the scale.2,21
Conclusion
Satisfaction and perceived empathy are relatively stable constructs, are not clearly associated with other factors, and are strongly correlated with one another. This study supports the research practice of measuring satisfaction immediately after the visit, which is more convenient for both participant and researcher and avoids the loss of more than one third of the patients, and those with a worse experience in particular. To improve the utility and interpretation of patient-reported experience measures such as these, we might direct our efforts to developing scales with less ceiling effect.
Corresponding author: David Ring, MD, PhD, Dell Medical School, The University of Texas at Austin, Health Discovery Building HDB 6.706, 1701 Trinity St., Austin, TX 78705; david.ring@austin.utexas.edu.
Financial disclosures: Dr. Ring has or may receive payment or benefits from Skeletal Dynamics, Wright Medical for elbow implants, Deputy Editor for Clinical Orthopaedics and Related Research, Universities and Hospitals, Lawyers outside the submitted work.
Dr. Teunis has or may receive payment or benefits from VCC, PATIENT+, and AO Trauma TK network unrelated to this work and consultant fees from Synthes.
From the Department of Surgery and Perioperative Care, Dell Medical School, The University of Texas at Austin, Austin, TX (Dr. Kortlever, Ms. Haidar, Dr. Reichel, Dr. Driscoll, Dr. Ring, and Dr. Vagner) and University Medical Center Utrecht, Utrecht, The Netherlands (Dr. Teunis).
Abstract
- Objective: Patient satisfaction is considered a quality measure. Satisfaction is typically measured directly after an in-person visit in research and 2 weeks later in practice surveys. We assessed if there was a difference in immediate and delayed measurement of satisfaction.
- Questions: (1) There is no difference in patient satisfaction (measured by Numerical Rating Scale [NRS]) and (2) perceived empathy (measured by the Jefferson Scale of Patient Perceptions of Physician Empathy [JSPPPE]) immediately after the initial visit compared to 2 weeks later. (3) Change in disability (measured by the Patient-Reported Outcome Measurement Information System Physical Function-Upper Extremity [PROMIS PF-UE]) is not independently associated with change in satisfaction and (4) empathy after the initial visit compared to 2 weeks later.
- Methods: 150 new patients completed a survey of demographics, satisfaction with the surgeon, rating of the surgeon’s empathy, and upper extremity specific limitations. The satisfaction, empathy, and limitation questionnaires were repeated 2 weeks later.
- Results: We found a slight but significant decrease in satisfaction 2 weeks after the in-person visit (–0.41, P = 0.001). There was no significant change in perceived empathy (–0.71, P = 0.19). Change in limitations did not account for a change in satisfaction (P = 0.79) or perceived empathy (P = 0.93).
- Conclusion: Satisfaction and perceived empathy are relatively stable constructs that can be measured immediately after the visit.
Keywords: satisfaction, empathy, change, upper extremity, disability.
Patient satisfaction is increasingly being used as a performance measure to evaluate quality of care.1-8 Patient satisfaction correlates with adherence with recommended treatment.1,6,8-10 Satisfaction measured on an 11-point ordinal scale immediately after the visit correlates strongly with the perception of clinician empathy.2,3 Indeed, some satisfaction questionnaires such as the Medical Interview Satisfaction Scale (MISS)11,12 have questions very similar to empathy questionnaires. It may be that satisfaction is a construct similar to feeling that your doctor listened and cared about you as an individual (perceived physician empathy).
Higher ratings of satisfaction also seem to be related to a physician’s communication style.1,4,7-10 One study of 13 fertility doctors found that training in effective communication strategies led to improved patient satisfaction.7 A qualitative study of 36 patients, health professionals, and clinical support staff in an orthopaedic outpatient setting held interviews and focus group sessions to identify themes influencing patient satisfaction.4 Communication and expectation were among the 7 themes identified. We have noticed a high ceiling effect (maximum scores) with measures of patient satisfaction and perceived empathy.2,3 Another study also noted a high ceiling effect when using an ordinal scale.5 It may be that people with a positive feeling shortly after a health care encounter give top ratings out of politeness or gratefulness. It is also possible they will feel differently a few weeks after they leave the office. Furthermore, ratings of satisfaction gathered by a practice or health care system for practice assessment/improvement are often obtained several days to weeks after the visit, while research often obtains satisfaction ratings immediately after the visit for practical reasons. There may be differences between immediate and delayed measurement of satisfaction beyond the mentioned social norms.
Therefore, this study tested the primary null hypothesis that there is no difference in patient satisfaction (measured by Numerical Rating Scale [NRS]) immediately after the initial visit compared to 2 weeks later. Additionally, we assessed the difference in perceived empathy immediately after the initial visit compared to 2 weeks later, and whether change in disability was independently associated with change in satisfaction and empathy after the initial visit compared to 2 weeks later.
Methods
Study Design
After Institutional Review Board approval of this prospective, longitudinal, observational cohort study, we prospectively enrolled 150 adult patients between November 29, 2017 and January 10, 2018. Patients were seen at 5 orthopaedic clinics in a large urban area. We included all new English-speaking patients aged 18 to 89 years who were visiting 1 of 6 participating orthopaedic surgeons for any upper extremity problem and who were able to provide informed consent. We excluded follow-up visits and patients who were unable to speak and understand English. Four research assistants who were not involved with patient treatment described the study to patients before or after the visit with the surgeon. We were granted a waiver of written informed consent; patients indicated their consent by completing the surveys.
Patients could choose either phone or email as their preferred mode of contact for follow-up in this study. For patients who selected email as the preferred mode of contact, the follow-up survey was sent automatically 2 weeks after completion date, and a maximum of 3 reminder emails with 2-day time intervals between them were sent to those who did not respond to the initial invitation. For patients who selected phone as the preferred mode of contact, the follow-up survey was done by an English-speaking research assistant who was not involved with patient treatment. When a response was not obtained on the initial phone call, 3 additional phone calls were made (1 later that same day and 2 the next day). One patient declined participation because he was not interested in the study and had no time after his visit.
Measurements
Patients were asked to complete a set of questionnaires at the end of their visit:
1. A demographic questionnaire consisting of preferred mode of contact for follow-up (phone or email), age, sex, race/ethnicity, marital status, education status, work status, insurance status, and type of visit (first visit or second opinion);
2. An 11-point ordinal measure of satisfaction with the surgeon, with scores ranging from 0 (Worst Surgeon Possible) to 10 (Best Surgeon Possible);
3. The patient’s rating of the surgeon’s empathy, measured by the Jefferson Scale of Patient Perceptions of Physician Empathy (JSPPPE).13 The JSPPPE is a 5-item questionnaire, measured on a 7-point Likert scale, with scores ranging from 1 (Strongly Disagree) to 7 (Strongly Agree), that assesses agreement with statements about the physician. The total score is the sum of all item scores (5-35), with higher scores representing a higher degree of perceived physician empathy.
4. Upper extremity disability, measured by the Patient-Reported Outcomes Measurement Information System Physical Function-Upper Extremity (PROMIS PF-UE) Computer Adaptive Test (CAT).14-16 This is a measure of physical limitations in the upper extremity. It can be completed with as few as 4 questions while still achieving high precision in scoring and thereby decreasing survey burden. PROMIS presents a continuous T-score with a mean of 50 and standard deviation (SD) of 10, with higher scores reflecting better physical function compared to the average of the US general population.15
After completing the initial questionnaire, the research assistant filled out the office and surgeon name and asked the surgeon to complete the diagnosis. All questionnaires were administered on an encrypted tablet via the secure, HIPAA-compliant electronic platform REDCap (Research Electronic Data Capture), a web-based application for building and managing online surveys and databases.17 The follow-up survey was sent automatically or was done by phone call as previously described. The follow-up survey consisted of (1) the 11-point ordinal measure of satisfaction with the surgeon, (2) the JSPPPE for perceived empathy, and (3) the PROMIS PF-UE for physical limitations in the upper extremity.
Analysis
Continuous variables are presented as mean ± SD and discrete data as proportions. We used Student’s t-tests to assess baseline differences between continuous variables and Fisher’s exact tests for discrete variables. To assess differences in satisfaction and perceived empathy after 2 weeks, we used Student’s paired t-tests. We created 2 multilevel multivariable linear regression models to assess factors associated with (1) change in satisfaction with the surgeon and (2) change in perceived physician empathy. These models account for correlation of patients treated by the same surgeon. We selected variables to be included in the final models by running multilevel models with only 1 independent variable of interest (Appendix 1). Variables with P < 0.10 were included in our final models. We also included change in PROMIS PF-UE in both models because this was our variable of interest. We considered P < 0.05 significant.
We performed a power analysis for the difference in patient satisfaction immediately after the first visit compared to 2 weeks later. Based on our pilot data where we found an initial mean satisfaction score of 9.4 and mean satisfaction score after 2 weeks of 9.1 (SD of difference 1.0), a priori power analysis showed that we needed a minimum sample size of 90 patients to detect a difference with power set at 0.80 and alpha set at 0.05. In order to account for loss to follow-up as previously noted,18 we enrolled 67% more patients (total of 150).
Results
Respondent Characteristics
None of the 150 patients were excluded from the analysis. The study patients’ mean age was 51 ± 16 years (range, 18-87 years), and 73 (49%) were men (Table 1). Mean scores directly after the visit were 9.4 ± 1.2 (range, 2-10) for satisfaction with the surgeon, 31 ± 5.2 (range, 9-35) for perceived physician empathy, and 40 ± 10 (range 15-56) for upper extremity disability. Most patients (n = 130, 87%) were seen in 2 of 5 offices, and 106 (71%) were seen by 2 out of 6 participating surgeons.
Ninety-seven (65%) patients completed their follow-up assessment 2 weeks after their initial visit, 49 (51%) by phone and 48 (49%) by email. This is a slightly better rate than the 36% rate reported in previous research.18 After 2 weeks, the mean score for satisfaction with the surgeon was 9.1 ± 1.5 (range, 0-10), the mean perceived empathy score was 31 ± 5.1 (range, 6-35), and the mean upper extremity disability score was 40 ± 8.7 (range, 23-56). Responders did not differ from nonresponders based on demographic data (Table 2). However, nonresponders had lower perceived empathy scores directly after their visit (P = 0.03) and none had initially chosen phone as their preferred mode of contact for follow-up (P < 0.001). A list of all diagnoses with frequencies the surgeons stated is listed in Appendix 2.
Difference in Satisfaction with the Surgeon
Satisfaction with the surgeon 2 weeks after the in-person visit was slightly, but significantly, lower on bivariate analysis compared to satisfaction with the surgeon immediately after the initial visit (–0.41 ± 1.2, P = 0.001; Table 3).
Difference in Perceived Physician Empathy
Perceived physician empathy 2 weeks after the in-person visit was not significantly lower on bivariate analysis compared to perceived physician empathy immediately after the initial visit (–0.71 ± 5.3, P = 0.19; Table 3).
Factors Associated with Change in Satisfaction with the Surgeon
Accounting for potential interaction of variables using multilevel multivariable analysis, change in disability of the upper extremity was not associated with change in satisfaction with the surgeon (regression coefficient [beta], 0.00 [95% confidence interval {CI}, –0.02 to 0.03]; standard error [SE], 0.01; P = 0.79 [Table 4]). Being Latino was independently associated with less change in satisfaction with the surgeon (beta coefficient, –0.57 [95% CI, –1.1 to 0.00]; SE, 0.29; P = 0.049).
Factors Associated with Change in Perceived Physician Empathy
Accounting for potential interaction of variables using multilevel multivariable analysis, change in disability of the upper extremity was not associated with change in perceived physician empathy (beta coefficient = 0.00 [95% CI, –0.10 to 0.11]; SE, 0.06; P = 0.93 [Table 4]). Race/ethnicity other than white or Latino was independently associated with more change in perceived physician empathy (beta coefficient, 3.5 [95% CI, 0.34 to 6.6]; SE, 1.6; P = 0.030), and preferring email as mode of contact for follow-up was independently associated with less change in perceived physician empathy (beta coefficient, –3.2 [95% CI, –5.2 to –1.3]; SE, 1.0; P = 0.001).
Discussion
Patient satisfaction is considered a quality measure1-8 and is typically measured directly after an in-person visit. This study tested differences in patient satisfaction and perceived empathy immediately after the initial visit compared to 2 weeks later. In addition, we assessed whether change in disability was independently associated with change in satisfaction and empathy after the initial visit compared to 2 weeks later.
We acknowledge some study limitations. First, we only measured satisfaction based on 1 visit rather than multiple visits over time. It might be that satisfaction ratings differ when the physician-patient relationship is more established. However, we found overall high satisfaction ratings and a well-established relationship might not add to this finding. Second, surgeons were aware of the study and its purpose, which might have resulted in subconsciously altering the behavior to improve satisfaction. The effect of people acting differently as a result of being observed is called the Hawthorne effect.19 Third, we only used 1 simple ordinal measure to assess patient satisfaction with the surgeon. There is a wide variety of satisfaction measures,20 though the focus of this study was not to test the best possible satisfaction measure but to assess changes in satisfaction over time and its predictors. The simple 11-point ordinal satisfaction measure has proved reliable.6 Fourth, 35% of patients did not make a second rating. This is not unusual for phone or email studies. Our response rate was relatively high compared to other studies in our field,18 perhaps because the time to the second assessment was only 2 weeks and all people were available for follow-up by phone. Fifth, we analyzed 4 surgeons as 1 group and 3 offices as 1 group since we did not enroll enough patients per surgeon and office for individual analysis. However, multilevel linear analysis takes surgeon specific factors into account within that group.
The finding that satisfaction with the surgeon after 2 weeks was significantly lower on bivariate analysis compared to immediately after the initial visit is different from a study that found small increases in satisfaction after 2 weeks and 3 months,1 but comparable to another study in our field.21 Although significant, we believe the decrease in satisfaction is probably not clinically relevant. It might also be that satisfaction at follow-up is lower than measured, but that the least satisfied people did not respond on the follow-up survey.
We found no significant change in perceived empathy after 2 weeks. Since empathy is a strong driver of satisfaction,2,4-7 we did not expect to find differing results for empathy and for satisfaction over time. Both satisfaction and empathy seem to be relatively durable measures with current measurement tools.
The finding that change in disability was neither independently associated with change in satisfaction nor change in empathy is consistent with prior research.2,3,21 We cannot adequately study the impact of changes since we did not find an important change in either satisfaction or empathy over time. Jackson et al found higher satisfaction ratings over time in patients who had an increase in physical function and a decrease in symptoms.1 They also found that met expectations was associated with higher satisfaction immediately after the visit, after 2 weeks, and after 3 months.1 We feel that met expectations and fewer symptoms and limitations are likely highly co-linear with satisfaction. We therefore may not be able to learn much about one from the others.
The slight change we found in satisfaction with the surgeon among Latino patients was significantly less than the change among white patients. This suggests Latino patients might have a more stable opinion over time (a cultural phenomenon), or it might be spurious given the small number of Latino patients included in the study. The same can be said for the finding that race/ethnicity other than white or Latino was independently associated with greater change in empathy. Providing email as the preferred mode of contact was found to be independently associated with less change in perceived empathy compared to follow-up by phone. We had a 100% success rate for our follow-ups by phone. Our findings suggest that patients might more easily switch ratings on an 11-point ordinal scale than on a 5-item Likert scale. However, both measures are often rated at the ceiling of the scale.2,21
Conclusion
Satisfaction and perceived empathy are relatively stable constructs, are not clearly associated with other factors, and are strongly correlated with one another. This study supports the research practice of measuring satisfaction immediately after the visit, which is more convenient for both participant and researcher and avoids the loss of more than one third of the patients, and those with a worse experience in particular. To improve the utility and interpretation of patient-reported experience measures such as these, we might direct our efforts to developing scales with less ceiling effect.
Corresponding author: David Ring, MD, PhD, Dell Medical School, The University of Texas at Austin, Health Discovery Building HDB 6.706, 1701 Trinity St., Austin, TX 78705; david.ring@austin.utexas.edu.
Financial disclosures: Dr. Ring has or may receive payment or benefits from Skeletal Dynamics, Wright Medical for elbow implants, Deputy Editor for Clinical Orthopaedics and Related Research, Universities and Hospitals, Lawyers outside the submitted work.
Dr. Teunis has or may receive payment or benefits from VCC, PATIENT+, and AO Trauma TK network unrelated to this work and consultant fees from Synthes.
1. Jackson JL, Chamberlin J, Kroenke K. Predictors of patient satisfaction. Soc Sci Med. 2001;52:609-620.
2. Menendez ME, Chen NC, Mudgal CS, et al. Physician empathy as a driver of hand surgery patient satisfaction. J Hand Surg Am. 2015;40(9):1860-1865.
3. Parrish RC 2nd, Menendez ME, Mudgal CS, et al. Patient Satisfaction and its relation to perceived visit duration with a hand surgeon. J Hand Surg Am. 2016;41(2):257-262.
4. Waters S, Edmondston SJ, Yates PJ, Gucciardi DF. Identification of factors influencing patient satisfaction with orthopaedic outpatient clinic consultation: A qualitative study. Man Ther. 2016;25:48-55.
5. Voutilainen A, Pitkaaho T, Kvist T, Vehvilainen-Julkunen K. How to ask about patient satisfaction? The visual analogue scale is less vulnerable to confounding factors and ceiling effect than a symmetric Likert scale. J Adv Nurs. 2016;72:946-957.
6. van Berckel MM, Bosma NH, Hageman MG, et al. The correlation between a numerical rating scale of patient satisfaction with current management of an upper extremity disorder and a general measure of satisfaction with the medical visit. Hand (N Y). 2017;12:202-206.
7. Garcia D, Bautista O, Venereo L, et al. Training in empathic skills improves the patient-physician relationship during the first consultation in a fertility clinic. Fertil Steril. 2013;99:1413-1418.
8. Fitzpatrick RM, Hopkins A. Patients’ satisfaction with communication in neurological outpatient clinics. J Psychosom Res. 1981;25:329-334.
9. Kincey J, Bradshaw P, Ley P. Patients’ satisfaction and reported acceptance of advice in general practice. J R Coll Gen Pract. 1975;25:558-566.
10. Ley P, Whitworth MA, Skilbeck CE, et al. Improving doctor-patient communication in general practice. J R Coll Gen Pract. 1976;26:720-724.
11. Meakin R, Weinman J. The ‘Medical Interview Satisfaction Scale’ (MISS-21) adapted for British general practice. Fam Pract. 2002;19:257-263.
12. Wolf MH, Putnam SM, James SA, Stiles WB. The Medical Interview Satisfaction Scale: development of a scale to measure patient perceptions of physician behavior. J Behav Med. 1978;1:391-401.
13. Kane GC, Gotto JL, Mangione S, et al. Jefferson Scale of Patient’s Perceptions of Physician Empathy: preliminary psychometric data. Croat Med J. 2007;48:81-86.
14. Beckmann JT , Hung M, Voss MW, et al. Evaluation of the patient-reported outcomes measurement information system upper extremity computer adaptive test. J Hand Surg Am. 2016;41:739-744.
15. PROMIS. PROMIS PF Scoring. Available at www.healthmeasures.net/administrator/components/com_instruments/uploads/PROMIS%20Physical%20Function%20Scoring%20Manual.pdf. Accessed March 1, 2019.
16. PROMIS. PROMIS Measures. Available at wwwnihpromisorg. Accessed March 1, 2019.
17. Harris PA, Taylor R, Thielke R, et al. Research electronic data capture (REDCap)--a metadata-driven methodology and workflow process for providing translational research informatics support. J Biomed Inform. 2009;42:377-381.
18. Bot AG, Anderson JA, Neuhaus V, Ring D. Factors associated with survey response in hand surgery research. Clin Orthop Relat Res. 2013;471(10):3237-3242.
19. Sedgwick P, Greenwood N. Understanding the Hawthorne effect. BMJ. 2015;351:h4672.
20. Ross CK, Steward CA, Sinacore JM. A comparative study of seven measures of patient satisfaction. Med Care. 1995;33:392-406.
21. Teunis T, Thornton ER, Jayakumar P, Ring D. Time seeing a hand surgeon is not associated with patient satisfaction. Clin Orthop Relat Res. 2015;473:2362-2368.
1. Jackson JL, Chamberlin J, Kroenke K. Predictors of patient satisfaction. Soc Sci Med. 2001;52:609-620.
2. Menendez ME, Chen NC, Mudgal CS, et al. Physician empathy as a driver of hand surgery patient satisfaction. J Hand Surg Am. 2015;40(9):1860-1865.
3. Parrish RC 2nd, Menendez ME, Mudgal CS, et al. Patient Satisfaction and its relation to perceived visit duration with a hand surgeon. J Hand Surg Am. 2016;41(2):257-262.
4. Waters S, Edmondston SJ, Yates PJ, Gucciardi DF. Identification of factors influencing patient satisfaction with orthopaedic outpatient clinic consultation: A qualitative study. Man Ther. 2016;25:48-55.
5. Voutilainen A, Pitkaaho T, Kvist T, Vehvilainen-Julkunen K. How to ask about patient satisfaction? The visual analogue scale is less vulnerable to confounding factors and ceiling effect than a symmetric Likert scale. J Adv Nurs. 2016;72:946-957.
6. van Berckel MM, Bosma NH, Hageman MG, et al. The correlation between a numerical rating scale of patient satisfaction with current management of an upper extremity disorder and a general measure of satisfaction with the medical visit. Hand (N Y). 2017;12:202-206.
7. Garcia D, Bautista O, Venereo L, et al. Training in empathic skills improves the patient-physician relationship during the first consultation in a fertility clinic. Fertil Steril. 2013;99:1413-1418.
8. Fitzpatrick RM, Hopkins A. Patients’ satisfaction with communication in neurological outpatient clinics. J Psychosom Res. 1981;25:329-334.
9. Kincey J, Bradshaw P, Ley P. Patients’ satisfaction and reported acceptance of advice in general practice. J R Coll Gen Pract. 1975;25:558-566.
10. Ley P, Whitworth MA, Skilbeck CE, et al. Improving doctor-patient communication in general practice. J R Coll Gen Pract. 1976;26:720-724.
11. Meakin R, Weinman J. The ‘Medical Interview Satisfaction Scale’ (MISS-21) adapted for British general practice. Fam Pract. 2002;19:257-263.
12. Wolf MH, Putnam SM, James SA, Stiles WB. The Medical Interview Satisfaction Scale: development of a scale to measure patient perceptions of physician behavior. J Behav Med. 1978;1:391-401.
13. Kane GC, Gotto JL, Mangione S, et al. Jefferson Scale of Patient’s Perceptions of Physician Empathy: preliminary psychometric data. Croat Med J. 2007;48:81-86.
14. Beckmann JT , Hung M, Voss MW, et al. Evaluation of the patient-reported outcomes measurement information system upper extremity computer adaptive test. J Hand Surg Am. 2016;41:739-744.
15. PROMIS. PROMIS PF Scoring. Available at www.healthmeasures.net/administrator/components/com_instruments/uploads/PROMIS%20Physical%20Function%20Scoring%20Manual.pdf. Accessed March 1, 2019.
16. PROMIS. PROMIS Measures. Available at wwwnihpromisorg. Accessed March 1, 2019.
17. Harris PA, Taylor R, Thielke R, et al. Research electronic data capture (REDCap)--a metadata-driven methodology and workflow process for providing translational research informatics support. J Biomed Inform. 2009;42:377-381.
18. Bot AG, Anderson JA, Neuhaus V, Ring D. Factors associated with survey response in hand surgery research. Clin Orthop Relat Res. 2013;471(10):3237-3242.
19. Sedgwick P, Greenwood N. Understanding the Hawthorne effect. BMJ. 2015;351:h4672.
20. Ross CK, Steward CA, Sinacore JM. A comparative study of seven measures of patient satisfaction. Med Care. 1995;33:392-406.
21. Teunis T, Thornton ER, Jayakumar P, Ring D. Time seeing a hand surgeon is not associated with patient satisfaction. Clin Orthop Relat Res. 2015;473:2362-2368.
Multicomponent Exercise Program Can Reverse Hospitalization-Associated Functional Decline in Elderly Patients
Study Overview
Objective. To assess the effects of an individualized, multicomponent exercise intervention on the functional status of very elderly patients who were acutely hospitalized compared with those who received usual care.
Design. A single-center, single-blind randomized clinical trial comparing elderly (≥ 75 years old) hospitalized patients who received in-hospital exercise (ie, individualized low-intensity resistance, balance, and walking exercises) versus control (ie, usual care that included physical rehabilitation if needed) interventions. The exercise intervention was adapted from the multicomponent physical exercise program Vivifrail and was supervised and conducted by a fitness specialist in 2 daily (1 morning and 1 evening) sessions lasting 20 minutes for 5 to 7 consecutive days. The morning session consisted of supervised and individualized progressive resistance, balance, and walking exercises. The evening session consisted of functional unsupervised exercises including light weights, extension and flexion of knee and hip, and walking.
Setting and participants. The study was conducted in an acute care unit in a tertiary public hospital in Navarra, Spain, between 1 February 2015 and 30 August 2017. A total of 370 elderly patients undergoing acute care hospitalization were enrolled in the study and randomly assigned to receive in-hospital exercise or control intervention. Inclusion criteria were: age ≥ 75 years, Barthel Index score ≥ 60, and ambulatory with or without assistance.
Main outcome measures. The primary outcome was change in functional capacity from baseline (beginning of exercise or control intervention) to hospital discharge as assessed by the Barthel Index of independence and the Short Physical Performance Battery (SPPB). Secondary outcomes were changes in cognitive capacity (Mini-Mental State Examination [MMSE]) and mood status (Yesavage Geriatric Depression Scale [GDS]), quality of life (QoL; EuroQol-5D), handgrip strength (dominant hand), incident delirium (Confusion Assessment Method), length of stay (LOS), falls during hospitalization, transfer after discharge, and readmission rate and mortality at 3 months after discharge. Intention-to-treat analysis was conducted.
Main results. Of the 370 patients included in the study’s analyses, 209 (56.5%) were women, mean age was 87.3 ± 4.9 years (range, 75-101 years; 130 [35.1%] nonagenarians). The median LOS was 8 days in both groups (interquartile range [IQR], 4 and 4 days, respectively). The median duration of the intervention was 5 days (IQR, 0 days), with 5 ± 1 morning and 4 ± 1 evening sessions in the exercise group. Adherence to the exercise intervention was high (95.8% for morning sessions; 83.4% for evening sessions), and no adverse effects were observed with the intervention.
The in-hospital exercise intervention program yielded significant benefits over usual care in functional outcomes in elderly patients. The exercise group had an increased change in measures of functional capacity compared to the usual care group (ie, Barthel Index, 6.9 points; 95% confidence interval [CI], 4.4-9.5; SPPB score, 2.2 points; 95% CI, 1.7-2.6). Furthermore, acute hospitalization led to an impairment in functional capacity from baseline to discharge in the Barthel Index (−5.0 points; 95% CI, −6.8 to −3.2) in the usual care group. In contrast, exercise intervention reversed this decline and improved functional outcomes as assessed by Barthel Index (1.9 points; 95% CI, 0.2-3.7) and SPPB score (2.4 points; 95% CI, 2.1-2.7).
The beneficial effects of the in-hospital exercise intervention extended to secondary end points indicative of cognitive capacity (MMSE, 1.8 points; 95% CI, 1.3-2.3), mood status (GDS, −2.0 points; 95% CI, −2.5 to −1.6), QoL (EuroQol-5D, 13.2 points; 95% CI, 8.2-18.2), and handgrip strength (2.3 kg; 95% CI, 1.8-2.8) compared to those who received usual care. In contrast, no differences were observed between groups that received exercise intervention and usual care in incident delirium, LOS, falls during hospitalization, transfer after discharge, and 3-month hospital readmission rate and mortality.
Conclusion. An individualized, multicomponent physical exercise program that includes low-intensity resistance, balance, and walking exercises performed during the course of hospitalization (average of 5 days) can reverse functional decline associated with acute hospitalization in very elderly patients. Furthermore, this in-hospital exercise intervention is safe and has a high adherence rate, and thus represents an opportunity to improve quality of care in this vulnerable population.
Commentary
Frail elderly patients are highly susceptible to adverse outcomes of acute hospitalization, including functional decline, disability, nursing home placement, rehospitalization, and mortality.1 Mobility limitation, a major hazard of hospitalization, has been associated with poorer functional recovery and increased vulnerability to these major adverse events after hospital discharge.2-4 Interdisciplinary care models delivered during hospitalization (eg, Geriatric Evaluation Unit, Acute Care for Elders) that emphasize functional independence and provide protocols for exercise and rehabilitation have demonstrated reduced hospital LOS, discharge to nursing home, and mortality, and improved functional status in elderly patients.5-7 Despite this evidence, significant gaps in knowledge exist in understanding whether early implementation of an individualized, multicomponent exercise training program can benefit the oldest old patients who are acutely hospitalized.
This study reported by Martinez-Velilla and colleagues provides an important and timely investigation in examining the effects of an individualized, multicomponent (ie, low-intensity resistance, balance, and walking) in-hospital exercise intervention on functional outcomes of hospitalized octogenarians and nonagenarians. The authors reported that such an intervention, administered 2 sessions per day for 5 to 7 consecutive days, can be safely implemented and reverse functional decline (ie, improvement in Barthel Index and SPPB score over course of hospital stay) typically associated with acute hospitalization in these vulnerable individuals. These findings are particularly significant given the paucity of randomized controlled trials evaluating the impact of exercise intervention in preserving functional capacity of geriatric patients in the setting of acute hospitalization. While much more research is needed to facilitate future development of a consensus opinion in this regard, results from this study provide the rationale that implementation of an individualized multicomponent exercise program is feasible and safe and may attenuate functional decline in hospitalized older patients. Finally, the beneficial effects of in-hospital exercise intervention may extend to cognitive capacity, mood status, and QoL—domains that are essential to optimizing patient-centered care in the frailest elderly patients.
The study was well conceived with a number of strengths, including its randomized clinical trial design. In addition, the trial patients were advanced in age (35.1% were nonagenarians), which is particularly important because this is a vulnerable population that is frequently excluded from participation in trials of exercise interventions and because the evidence-base for physical activity guidelines is suboptimal. Moreover, the authors demonstrated that an individualized multicomponent exercise program could be successfully implemented in elderly patients in an acute setting via daily exercise sessions. This test of feasibility is significant in that clinical trials in exercise intervention in geriatrics are commonly performed in nonacute settings in the community, long-term care facilities, or subacute care. The major limitation in this study centers on the generalizability of its findings. It was noted that some patients were not assessed for changes from baseline to discharge on the Barthel Index (6.1%) and SPPB (2.3%) because of their poor condition. The exclusion of the most debilitated patients limits the application of the study’s key findings to the frailest elderly patients, who are most likely to require acute hospital care.
Applications for Clinical Pract
Functional decline is an exceedingly common adverse outcome associated with hospitalization in older patients. While more evidence is needed, early implementation of an individualized, multicomponent exercise regimen during hospitalization may help to prevent functional decline in vulnerable elderly patients.
—Fred Ko, MD, MS
1. Goldwater DS, Dharmarajan K, McEwan BS, Krumholz HM. Is posthospital syndrome a result of hospitalization-induced allostatic overload? J Hosp Med. 2018;13(5).doi:10.12788/jhm.2986.
2. Creditor MC. Hazards of hospitalization of the elderly. Ann Intern Med. 1993;118:219-223.
3. Minnick AF, Mion LC, Johnson ME, et al. Prevalence and variation of physical restraint use in acute care settings in the US. J Nurs Scholarsh. 2007;39:30-37.
4. Zisberg A, Shadmi E, Sinoff G et al. Low mobility during hospitalization and functional decline in older adults. J Am Geriatr Soc. 2011;59:266-273.
5. Rubenstein LZ, et al. Effectiveness of a geriatric evaluation unit. A randomized clinical trial. N Engl J Med. 1984;311:1664-1670.
6. Landefeld CS, Palmer RM, Kresevic DM, et al. A randomized trial of care in a hospital medical unit especially designed to improve the functional outcomes of acutely ill older patients. N Engl J Med. 1995;332:1338-1344.
7. de Morton NA, Keating JL, Jeffs K. Exercise for acutely hospitalised older medical patients. Cochrane Database Syst Rev. 2007;CD005955.
Study Overview
Objective. To assess the effects of an individualized, multicomponent exercise intervention on the functional status of very elderly patients who were acutely hospitalized compared with those who received usual care.
Design. A single-center, single-blind randomized clinical trial comparing elderly (≥ 75 years old) hospitalized patients who received in-hospital exercise (ie, individualized low-intensity resistance, balance, and walking exercises) versus control (ie, usual care that included physical rehabilitation if needed) interventions. The exercise intervention was adapted from the multicomponent physical exercise program Vivifrail and was supervised and conducted by a fitness specialist in 2 daily (1 morning and 1 evening) sessions lasting 20 minutes for 5 to 7 consecutive days. The morning session consisted of supervised and individualized progressive resistance, balance, and walking exercises. The evening session consisted of functional unsupervised exercises including light weights, extension and flexion of knee and hip, and walking.
Setting and participants. The study was conducted in an acute care unit in a tertiary public hospital in Navarra, Spain, between 1 February 2015 and 30 August 2017. A total of 370 elderly patients undergoing acute care hospitalization were enrolled in the study and randomly assigned to receive in-hospital exercise or control intervention. Inclusion criteria were: age ≥ 75 years, Barthel Index score ≥ 60, and ambulatory with or without assistance.
Main outcome measures. The primary outcome was change in functional capacity from baseline (beginning of exercise or control intervention) to hospital discharge as assessed by the Barthel Index of independence and the Short Physical Performance Battery (SPPB). Secondary outcomes were changes in cognitive capacity (Mini-Mental State Examination [MMSE]) and mood status (Yesavage Geriatric Depression Scale [GDS]), quality of life (QoL; EuroQol-5D), handgrip strength (dominant hand), incident delirium (Confusion Assessment Method), length of stay (LOS), falls during hospitalization, transfer after discharge, and readmission rate and mortality at 3 months after discharge. Intention-to-treat analysis was conducted.
Main results. Of the 370 patients included in the study’s analyses, 209 (56.5%) were women, mean age was 87.3 ± 4.9 years (range, 75-101 years; 130 [35.1%] nonagenarians). The median LOS was 8 days in both groups (interquartile range [IQR], 4 and 4 days, respectively). The median duration of the intervention was 5 days (IQR, 0 days), with 5 ± 1 morning and 4 ± 1 evening sessions in the exercise group. Adherence to the exercise intervention was high (95.8% for morning sessions; 83.4% for evening sessions), and no adverse effects were observed with the intervention.
The in-hospital exercise intervention program yielded significant benefits over usual care in functional outcomes in elderly patients. The exercise group had an increased change in measures of functional capacity compared to the usual care group (ie, Barthel Index, 6.9 points; 95% confidence interval [CI], 4.4-9.5; SPPB score, 2.2 points; 95% CI, 1.7-2.6). Furthermore, acute hospitalization led to an impairment in functional capacity from baseline to discharge in the Barthel Index (−5.0 points; 95% CI, −6.8 to −3.2) in the usual care group. In contrast, exercise intervention reversed this decline and improved functional outcomes as assessed by Barthel Index (1.9 points; 95% CI, 0.2-3.7) and SPPB score (2.4 points; 95% CI, 2.1-2.7).
The beneficial effects of the in-hospital exercise intervention extended to secondary end points indicative of cognitive capacity (MMSE, 1.8 points; 95% CI, 1.3-2.3), mood status (GDS, −2.0 points; 95% CI, −2.5 to −1.6), QoL (EuroQol-5D, 13.2 points; 95% CI, 8.2-18.2), and handgrip strength (2.3 kg; 95% CI, 1.8-2.8) compared to those who received usual care. In contrast, no differences were observed between groups that received exercise intervention and usual care in incident delirium, LOS, falls during hospitalization, transfer after discharge, and 3-month hospital readmission rate and mortality.
Conclusion. An individualized, multicomponent physical exercise program that includes low-intensity resistance, balance, and walking exercises performed during the course of hospitalization (average of 5 days) can reverse functional decline associated with acute hospitalization in very elderly patients. Furthermore, this in-hospital exercise intervention is safe and has a high adherence rate, and thus represents an opportunity to improve quality of care in this vulnerable population.
Commentary
Frail elderly patients are highly susceptible to adverse outcomes of acute hospitalization, including functional decline, disability, nursing home placement, rehospitalization, and mortality.1 Mobility limitation, a major hazard of hospitalization, has been associated with poorer functional recovery and increased vulnerability to these major adverse events after hospital discharge.2-4 Interdisciplinary care models delivered during hospitalization (eg, Geriatric Evaluation Unit, Acute Care for Elders) that emphasize functional independence and provide protocols for exercise and rehabilitation have demonstrated reduced hospital LOS, discharge to nursing home, and mortality, and improved functional status in elderly patients.5-7 Despite this evidence, significant gaps in knowledge exist in understanding whether early implementation of an individualized, multicomponent exercise training program can benefit the oldest old patients who are acutely hospitalized.
This study reported by Martinez-Velilla and colleagues provides an important and timely investigation in examining the effects of an individualized, multicomponent (ie, low-intensity resistance, balance, and walking) in-hospital exercise intervention on functional outcomes of hospitalized octogenarians and nonagenarians. The authors reported that such an intervention, administered 2 sessions per day for 5 to 7 consecutive days, can be safely implemented and reverse functional decline (ie, improvement in Barthel Index and SPPB score over course of hospital stay) typically associated with acute hospitalization in these vulnerable individuals. These findings are particularly significant given the paucity of randomized controlled trials evaluating the impact of exercise intervention in preserving functional capacity of geriatric patients in the setting of acute hospitalization. While much more research is needed to facilitate future development of a consensus opinion in this regard, results from this study provide the rationale that implementation of an individualized multicomponent exercise program is feasible and safe and may attenuate functional decline in hospitalized older patients. Finally, the beneficial effects of in-hospital exercise intervention may extend to cognitive capacity, mood status, and QoL—domains that are essential to optimizing patient-centered care in the frailest elderly patients.
The study was well conceived with a number of strengths, including its randomized clinical trial design. In addition, the trial patients were advanced in age (35.1% were nonagenarians), which is particularly important because this is a vulnerable population that is frequently excluded from participation in trials of exercise interventions and because the evidence-base for physical activity guidelines is suboptimal. Moreover, the authors demonstrated that an individualized multicomponent exercise program could be successfully implemented in elderly patients in an acute setting via daily exercise sessions. This test of feasibility is significant in that clinical trials in exercise intervention in geriatrics are commonly performed in nonacute settings in the community, long-term care facilities, or subacute care. The major limitation in this study centers on the generalizability of its findings. It was noted that some patients were not assessed for changes from baseline to discharge on the Barthel Index (6.1%) and SPPB (2.3%) because of their poor condition. The exclusion of the most debilitated patients limits the application of the study’s key findings to the frailest elderly patients, who are most likely to require acute hospital care.
Applications for Clinical Pract
Functional decline is an exceedingly common adverse outcome associated with hospitalization in older patients. While more evidence is needed, early implementation of an individualized, multicomponent exercise regimen during hospitalization may help to prevent functional decline in vulnerable elderly patients.
—Fred Ko, MD, MS
Study Overview
Objective. To assess the effects of an individualized, multicomponent exercise intervention on the functional status of very elderly patients who were acutely hospitalized compared with those who received usual care.
Design. A single-center, single-blind randomized clinical trial comparing elderly (≥ 75 years old) hospitalized patients who received in-hospital exercise (ie, individualized low-intensity resistance, balance, and walking exercises) versus control (ie, usual care that included physical rehabilitation if needed) interventions. The exercise intervention was adapted from the multicomponent physical exercise program Vivifrail and was supervised and conducted by a fitness specialist in 2 daily (1 morning and 1 evening) sessions lasting 20 minutes for 5 to 7 consecutive days. The morning session consisted of supervised and individualized progressive resistance, balance, and walking exercises. The evening session consisted of functional unsupervised exercises including light weights, extension and flexion of knee and hip, and walking.
Setting and participants. The study was conducted in an acute care unit in a tertiary public hospital in Navarra, Spain, between 1 February 2015 and 30 August 2017. A total of 370 elderly patients undergoing acute care hospitalization were enrolled in the study and randomly assigned to receive in-hospital exercise or control intervention. Inclusion criteria were: age ≥ 75 years, Barthel Index score ≥ 60, and ambulatory with or without assistance.
Main outcome measures. The primary outcome was change in functional capacity from baseline (beginning of exercise or control intervention) to hospital discharge as assessed by the Barthel Index of independence and the Short Physical Performance Battery (SPPB). Secondary outcomes were changes in cognitive capacity (Mini-Mental State Examination [MMSE]) and mood status (Yesavage Geriatric Depression Scale [GDS]), quality of life (QoL; EuroQol-5D), handgrip strength (dominant hand), incident delirium (Confusion Assessment Method), length of stay (LOS), falls during hospitalization, transfer after discharge, and readmission rate and mortality at 3 months after discharge. Intention-to-treat analysis was conducted.
Main results. Of the 370 patients included in the study’s analyses, 209 (56.5%) were women, mean age was 87.3 ± 4.9 years (range, 75-101 years; 130 [35.1%] nonagenarians). The median LOS was 8 days in both groups (interquartile range [IQR], 4 and 4 days, respectively). The median duration of the intervention was 5 days (IQR, 0 days), with 5 ± 1 morning and 4 ± 1 evening sessions in the exercise group. Adherence to the exercise intervention was high (95.8% for morning sessions; 83.4% for evening sessions), and no adverse effects were observed with the intervention.
The in-hospital exercise intervention program yielded significant benefits over usual care in functional outcomes in elderly patients. The exercise group had an increased change in measures of functional capacity compared to the usual care group (ie, Barthel Index, 6.9 points; 95% confidence interval [CI], 4.4-9.5; SPPB score, 2.2 points; 95% CI, 1.7-2.6). Furthermore, acute hospitalization led to an impairment in functional capacity from baseline to discharge in the Barthel Index (−5.0 points; 95% CI, −6.8 to −3.2) in the usual care group. In contrast, exercise intervention reversed this decline and improved functional outcomes as assessed by Barthel Index (1.9 points; 95% CI, 0.2-3.7) and SPPB score (2.4 points; 95% CI, 2.1-2.7).
The beneficial effects of the in-hospital exercise intervention extended to secondary end points indicative of cognitive capacity (MMSE, 1.8 points; 95% CI, 1.3-2.3), mood status (GDS, −2.0 points; 95% CI, −2.5 to −1.6), QoL (EuroQol-5D, 13.2 points; 95% CI, 8.2-18.2), and handgrip strength (2.3 kg; 95% CI, 1.8-2.8) compared to those who received usual care. In contrast, no differences were observed between groups that received exercise intervention and usual care in incident delirium, LOS, falls during hospitalization, transfer after discharge, and 3-month hospital readmission rate and mortality.
Conclusion. An individualized, multicomponent physical exercise program that includes low-intensity resistance, balance, and walking exercises performed during the course of hospitalization (average of 5 days) can reverse functional decline associated with acute hospitalization in very elderly patients. Furthermore, this in-hospital exercise intervention is safe and has a high adherence rate, and thus represents an opportunity to improve quality of care in this vulnerable population.
Commentary
Frail elderly patients are highly susceptible to adverse outcomes of acute hospitalization, including functional decline, disability, nursing home placement, rehospitalization, and mortality.1 Mobility limitation, a major hazard of hospitalization, has been associated with poorer functional recovery and increased vulnerability to these major adverse events after hospital discharge.2-4 Interdisciplinary care models delivered during hospitalization (eg, Geriatric Evaluation Unit, Acute Care for Elders) that emphasize functional independence and provide protocols for exercise and rehabilitation have demonstrated reduced hospital LOS, discharge to nursing home, and mortality, and improved functional status in elderly patients.5-7 Despite this evidence, significant gaps in knowledge exist in understanding whether early implementation of an individualized, multicomponent exercise training program can benefit the oldest old patients who are acutely hospitalized.
This study reported by Martinez-Velilla and colleagues provides an important and timely investigation in examining the effects of an individualized, multicomponent (ie, low-intensity resistance, balance, and walking) in-hospital exercise intervention on functional outcomes of hospitalized octogenarians and nonagenarians. The authors reported that such an intervention, administered 2 sessions per day for 5 to 7 consecutive days, can be safely implemented and reverse functional decline (ie, improvement in Barthel Index and SPPB score over course of hospital stay) typically associated with acute hospitalization in these vulnerable individuals. These findings are particularly significant given the paucity of randomized controlled trials evaluating the impact of exercise intervention in preserving functional capacity of geriatric patients in the setting of acute hospitalization. While much more research is needed to facilitate future development of a consensus opinion in this regard, results from this study provide the rationale that implementation of an individualized multicomponent exercise program is feasible and safe and may attenuate functional decline in hospitalized older patients. Finally, the beneficial effects of in-hospital exercise intervention may extend to cognitive capacity, mood status, and QoL—domains that are essential to optimizing patient-centered care in the frailest elderly patients.
The study was well conceived with a number of strengths, including its randomized clinical trial design. In addition, the trial patients were advanced in age (35.1% were nonagenarians), which is particularly important because this is a vulnerable population that is frequently excluded from participation in trials of exercise interventions and because the evidence-base for physical activity guidelines is suboptimal. Moreover, the authors demonstrated that an individualized multicomponent exercise program could be successfully implemented in elderly patients in an acute setting via daily exercise sessions. This test of feasibility is significant in that clinical trials in exercise intervention in geriatrics are commonly performed in nonacute settings in the community, long-term care facilities, or subacute care. The major limitation in this study centers on the generalizability of its findings. It was noted that some patients were not assessed for changes from baseline to discharge on the Barthel Index (6.1%) and SPPB (2.3%) because of their poor condition. The exclusion of the most debilitated patients limits the application of the study’s key findings to the frailest elderly patients, who are most likely to require acute hospital care.
Applications for Clinical Pract
Functional decline is an exceedingly common adverse outcome associated with hospitalization in older patients. While more evidence is needed, early implementation of an individualized, multicomponent exercise regimen during hospitalization may help to prevent functional decline in vulnerable elderly patients.
—Fred Ko, MD, MS
1. Goldwater DS, Dharmarajan K, McEwan BS, Krumholz HM. Is posthospital syndrome a result of hospitalization-induced allostatic overload? J Hosp Med. 2018;13(5).doi:10.12788/jhm.2986.
2. Creditor MC. Hazards of hospitalization of the elderly. Ann Intern Med. 1993;118:219-223.
3. Minnick AF, Mion LC, Johnson ME, et al. Prevalence and variation of physical restraint use in acute care settings in the US. J Nurs Scholarsh. 2007;39:30-37.
4. Zisberg A, Shadmi E, Sinoff G et al. Low mobility during hospitalization and functional decline in older adults. J Am Geriatr Soc. 2011;59:266-273.
5. Rubenstein LZ, et al. Effectiveness of a geriatric evaluation unit. A randomized clinical trial. N Engl J Med. 1984;311:1664-1670.
6. Landefeld CS, Palmer RM, Kresevic DM, et al. A randomized trial of care in a hospital medical unit especially designed to improve the functional outcomes of acutely ill older patients. N Engl J Med. 1995;332:1338-1344.
7. de Morton NA, Keating JL, Jeffs K. Exercise for acutely hospitalised older medical patients. Cochrane Database Syst Rev. 2007;CD005955.
1. Goldwater DS, Dharmarajan K, McEwan BS, Krumholz HM. Is posthospital syndrome a result of hospitalization-induced allostatic overload? J Hosp Med. 2018;13(5).doi:10.12788/jhm.2986.
2. Creditor MC. Hazards of hospitalization of the elderly. Ann Intern Med. 1993;118:219-223.
3. Minnick AF, Mion LC, Johnson ME, et al. Prevalence and variation of physical restraint use in acute care settings in the US. J Nurs Scholarsh. 2007;39:30-37.
4. Zisberg A, Shadmi E, Sinoff G et al. Low mobility during hospitalization and functional decline in older adults. J Am Geriatr Soc. 2011;59:266-273.
5. Rubenstein LZ, et al. Effectiveness of a geriatric evaluation unit. A randomized clinical trial. N Engl J Med. 1984;311:1664-1670.
6. Landefeld CS, Palmer RM, Kresevic DM, et al. A randomized trial of care in a hospital medical unit especially designed to improve the functional outcomes of acutely ill older patients. N Engl J Med. 1995;332:1338-1344.
7. de Morton NA, Keating JL, Jeffs K. Exercise for acutely hospitalised older medical patients. Cochrane Database Syst Rev. 2007;CD005955.
Androgen Deprivation Therapy Combined with Radiation in High-Risk Prostate Cancer . . . How Long Do We Go?
Study Overview
Objective. To compare the outcomes of 18 months versus 36 months of androgen deprivation therapy (ADT) combined with radiation in high-risk prostate cancer (HRPC).
Design. Phase 3 multicenter, randomized superiority trial.
Participants. This study enrolled patients aged ≤ 80 years with HRPC. All patients had no evidence of regional or distant metastasis. High-risk disease was defined as any of the following: clinical stage T3 or T4, prostate-specific antigen (PSA) level > 20 ng/mL, or Gleason score > 7.
Methods. Prior to randomization, all patients received 4 months of ADT with goserelin 10.8 mg and anti-androgen therapy with bicalutamide 50 mg daily for 30 days. Patients were then randomly assigned to 18 (short arm) or 36 (long arm) months of ADT in combination with radiation therapy (RT). The randomization was stratified by stage (T1-2 vs T3-4), Gleason score (< 7 vs > 7) and PSA level (< 20 ng/mL vs > 20 ng/mL). The standard radiation dose was 70 Gy to the prostate and 44 Gy to the pelvis. Computed tomography or magnetic resonance imaging exam of the abdomen and pelvis and a bone scan were performed to rule out regional or distant metastases. PSA level was monitored every 3 months for 18 months, every 6 months up to the third year, and yearly thereafter.
Main outcome measures. The 2 primary outcomes were overall survival (OS) and quality of life (QoL) at 5 years. The secondary end points were biochemical failure (BF)defined as PSA nadir plus 2, disease-free survival (DFS), and site(s) of tumor relapse.
Main results. The 5-year OS was 91% and 86% for the 36- and 18-month groups, respectively (P = 0.07). The 10-year OS was 62% for both groups (P = 0.7), and the global hazard ratio (HR) was 1.02 (P = 0.8). The disease-specific survival (DSS) was similar in both groups at 5 years (98% vs 97%) and at 10 years (91% vs 92%) in the long versus short arm, respectively. The rate of prostate cancer–specific death was 21% versus 23% in the long versus short arm, respectively. In a multivariate analysis for OS, only age and Gleason score > 7 were statistically significant survival predictors. BF rate at 10 years was 25% for 36 months as compared with 31% for 18 months (HR, 0.71, P = 0.02). The 10-year DFS rates were 45% and 39% for 36 and 18 months, respectively (HR, 0.68, P = 0.08). Forty patients in the long arm versus 43 in the short arm developed distant metastasis. Both groups developed similar sites of metastasis, which was predominantly osseous. Some aspects of the EORTC30 and PR25 scales were significant, mostly pertaining to sexual activity, fatigue, and hormone-related symptoms in favor of the 18-month group. The median time to testosterone recovery after completion of ADT was 2.1 years for the short arm versus 4 years in the long arm (P = 0.02). The compliance rate with ADT was 88% in the short arm versus 53% in the long arm. The main reason for nonadherence was side effects in 54% of the patients in the long arm and 31% in the short arm.
Conclusion. The results of the current study suggest that 18 months of ADT in combination with RT yields similar 10-year OS and improved QoL compared with 36 months in patients with HRPC.
Commentary
The role of ADT for HRPC in combination with RT has been well established by evidence from several trials; however, the comparator arms and patient characteristics between these studies have been quite heterogeneous. For instance, the Radiation Therapy Oncology Group (RTOG) 85-31 trial compared indefinite ADT with RT versus RT alone and showed significantly better 10-year OS in the ADT plus RT arm.1 Similarly, the European Organisation for Research and Treatment of Cancer (EROTC) 22961 trial showed an OS benefit for 36 months versus 6 months of ADT in combination with radiation.2 Additionally, the RTOG 92-02 trial, which compared 4 months versus 24 months of ADT with radiation, also found a significantly improved 10-year OS with a longer course of ADT.3 Taken together these data suggest that 4 to 6 months of ADT is inferior to 24 to 36 months of ADT in HRPC.
Several differences, however, exist in patient characteristics between the present trial and the earlier trials, justifiably reflecting the change of practice in the PSA era. For instance, the present study has a higher percentage of patients with Gleason scores 8-10 (60%) compared to the EROTC and RTOG studies (15%-35%) and a lower percentage of patients with T3 and T4 tumors. Patients with high Gleason scores are believed to have a higher risk of micro-metastasis at the time of diagnosis and higher chances of castration resistance. Therefore, inclusion of a (presumably) larger high-risk patient subgroup in the present study lends further credence to results indicating similar OS with a shorter course of ADT. A post hoc analysis including only patients with Gleason score 8-10 performed for OS, DSS, BF, and DFS showed no significant difference in any of these variables between the arms. Analysis of the interaction between ADT duration in the Gleason 8-10 subgroup versus Gleason 7 for OS, DFS, DSS and BF found no significant differences. This again suggests that 18 months of ADT may be sufficient for this high-risk group; however, it is difficult to draw definitive conclusions from this unplanned subgroup analysis.
Based on the results of the current study, it seems that 18 months of ADT is adequate for many, but not necessarily all, patients. For instance, there was a significantly higher incidence of BF in the 18-month arm. Applying this data to younger patients may require a more nuanced approach, as it is possible that with longer follow-up this higher rate of BF may translate into a difference in OS. Therefore, life expectancy and comorbid conditions always need to be incorporated into clinical decision making with regards to ADT duration. In a study by Rose et al, the risk of prostate cancer–specific mortality significantly decreased by using ADT plus RT for men with HRPC with a low, but not a high, competing mortality score.4 The clinical significance of this finding is that adding ADT to RT might significantly reduce the risk of death from prostate cancer only in the setting of low competing risks.
Another concept to ponder is the optimum duration of ADT in the era of RT dose escalation. Currently, there are emerging techniques for delivering higher radiation doses and combining brachytherapy with external beam radiotherapy for HRPC, and the role of whole pelvic radiation is being investigated. New data suggests that higher radiation doses can lead to improvement in outcomes for HRPC. The DART01/05 study compared 4 versus 24 months of ADT with 76 to 82 Gy of RT and reported improved 5-year OS, DFS, and metastasis-free survival with longer ADT duration.5 Moreover, Kishan et al reported improved prostate cancer–specific mortality when brachytherapy boost was added to radiation compared to radiation alone in patients with Gleason scores 9 and 10.6 Therefore, the optimal duration of ADT in the setting of dose-escalated radiotherapy is not yet known. Also, it is important to note that unlike the prior RTOG and EORTC studies, this study did not include patients with evidence of regional nodal disease, and thus the present data should not be applied to this patient population.
Applications to Clinical Practice
This study’s results suggesting that 18 months of ADT in combination with RT yields similar 10-year OS and improved QoL compared with 36 months of ADT in patients with HRPC should be interpreted with caution when treating very young patients, since the higher rate of BF in the short arm may impact the OS with longer follow-up. Additionally, patients’ QoL and tolerance to ADT-related adverse effects should be taken into consideration given that compliance with 36 months of ADT was only 53% in this study.
—Jailan Elayoubi, MD, Michigan State University, East Lansing, MI
1. Pilepich MV, Winter K, Lawton CA, et al. Androgen suppression adjuvant to definitive radiotherapy in prostate carcinoma—long-term results of phase III RTOG 85–31. Int J Radiat Oncol Biol Phys. 2005;61:1285-1290.
2. Bolla M, de Reijke TM, Van Tienhoven G, et al. Duration of androgen suppression in the treatment of prostate cancer. N Engl J Med. 2009;360:2516-2527.
3. Horwitz EM, Bae K, Hanks GE, Porter A, et al. Ten-year follow-up of radiation therapy oncology group protocol 92-02: a phase III trial of the duration of elective androgen deprivation in locally advanced prostate cancer. J Clin Oncol. 2008;26:2497–2504.
4. Rose BS, Chen MH, Wu J, et al. Androgen deprivation therapy use in the setting of high-dose radiation therapy and the risk of prostate cancer-specific mortality stratified by the extent of competing mortality. Int J Radiat Oncol Biol Phys. 2016;96:778-784.
5. Zapatero A, Guerrero A, Maldonado X, et al. High-dose radiotherapy with short-term or long-term androgen deprivation in localised prostate cancer (DART01/05 GICOR): a randomised, controlled, phase 3 trial. Lancet Oncol. 2015;16:320-327.
6. Kishan, AU, Cook, RR, Ciezki, JP, et al. Radical prostatectomy, external beam radiotherapy, or external beam radiotherapy with brachytherapy boost and disease progression and mortality in patients with gleason score 9-10 prostate cancer. JAMA. 2018;319:896-905.
Study Overview
Objective. To compare the outcomes of 18 months versus 36 months of androgen deprivation therapy (ADT) combined with radiation in high-risk prostate cancer (HRPC).
Design. Phase 3 multicenter, randomized superiority trial.
Participants. This study enrolled patients aged ≤ 80 years with HRPC. All patients had no evidence of regional or distant metastasis. High-risk disease was defined as any of the following: clinical stage T3 or T4, prostate-specific antigen (PSA) level > 20 ng/mL, or Gleason score > 7.
Methods. Prior to randomization, all patients received 4 months of ADT with goserelin 10.8 mg and anti-androgen therapy with bicalutamide 50 mg daily for 30 days. Patients were then randomly assigned to 18 (short arm) or 36 (long arm) months of ADT in combination with radiation therapy (RT). The randomization was stratified by stage (T1-2 vs T3-4), Gleason score (< 7 vs > 7) and PSA level (< 20 ng/mL vs > 20 ng/mL). The standard radiation dose was 70 Gy to the prostate and 44 Gy to the pelvis. Computed tomography or magnetic resonance imaging exam of the abdomen and pelvis and a bone scan were performed to rule out regional or distant metastases. PSA level was monitored every 3 months for 18 months, every 6 months up to the third year, and yearly thereafter.
Main outcome measures. The 2 primary outcomes were overall survival (OS) and quality of life (QoL) at 5 years. The secondary end points were biochemical failure (BF)defined as PSA nadir plus 2, disease-free survival (DFS), and site(s) of tumor relapse.
Main results. The 5-year OS was 91% and 86% for the 36- and 18-month groups, respectively (P = 0.07). The 10-year OS was 62% for both groups (P = 0.7), and the global hazard ratio (HR) was 1.02 (P = 0.8). The disease-specific survival (DSS) was similar in both groups at 5 years (98% vs 97%) and at 10 years (91% vs 92%) in the long versus short arm, respectively. The rate of prostate cancer–specific death was 21% versus 23% in the long versus short arm, respectively. In a multivariate analysis for OS, only age and Gleason score > 7 were statistically significant survival predictors. BF rate at 10 years was 25% for 36 months as compared with 31% for 18 months (HR, 0.71, P = 0.02). The 10-year DFS rates were 45% and 39% for 36 and 18 months, respectively (HR, 0.68, P = 0.08). Forty patients in the long arm versus 43 in the short arm developed distant metastasis. Both groups developed similar sites of metastasis, which was predominantly osseous. Some aspects of the EORTC30 and PR25 scales were significant, mostly pertaining to sexual activity, fatigue, and hormone-related symptoms in favor of the 18-month group. The median time to testosterone recovery after completion of ADT was 2.1 years for the short arm versus 4 years in the long arm (P = 0.02). The compliance rate with ADT was 88% in the short arm versus 53% in the long arm. The main reason for nonadherence was side effects in 54% of the patients in the long arm and 31% in the short arm.
Conclusion. The results of the current study suggest that 18 months of ADT in combination with RT yields similar 10-year OS and improved QoL compared with 36 months in patients with HRPC.
Commentary
The role of ADT for HRPC in combination with RT has been well established by evidence from several trials; however, the comparator arms and patient characteristics between these studies have been quite heterogeneous. For instance, the Radiation Therapy Oncology Group (RTOG) 85-31 trial compared indefinite ADT with RT versus RT alone and showed significantly better 10-year OS in the ADT plus RT arm.1 Similarly, the European Organisation for Research and Treatment of Cancer (EROTC) 22961 trial showed an OS benefit for 36 months versus 6 months of ADT in combination with radiation.2 Additionally, the RTOG 92-02 trial, which compared 4 months versus 24 months of ADT with radiation, also found a significantly improved 10-year OS with a longer course of ADT.3 Taken together these data suggest that 4 to 6 months of ADT is inferior to 24 to 36 months of ADT in HRPC.
Several differences, however, exist in patient characteristics between the present trial and the earlier trials, justifiably reflecting the change of practice in the PSA era. For instance, the present study has a higher percentage of patients with Gleason scores 8-10 (60%) compared to the EROTC and RTOG studies (15%-35%) and a lower percentage of patients with T3 and T4 tumors. Patients with high Gleason scores are believed to have a higher risk of micro-metastasis at the time of diagnosis and higher chances of castration resistance. Therefore, inclusion of a (presumably) larger high-risk patient subgroup in the present study lends further credence to results indicating similar OS with a shorter course of ADT. A post hoc analysis including only patients with Gleason score 8-10 performed for OS, DSS, BF, and DFS showed no significant difference in any of these variables between the arms. Analysis of the interaction between ADT duration in the Gleason 8-10 subgroup versus Gleason 7 for OS, DFS, DSS and BF found no significant differences. This again suggests that 18 months of ADT may be sufficient for this high-risk group; however, it is difficult to draw definitive conclusions from this unplanned subgroup analysis.
Based on the results of the current study, it seems that 18 months of ADT is adequate for many, but not necessarily all, patients. For instance, there was a significantly higher incidence of BF in the 18-month arm. Applying this data to younger patients may require a more nuanced approach, as it is possible that with longer follow-up this higher rate of BF may translate into a difference in OS. Therefore, life expectancy and comorbid conditions always need to be incorporated into clinical decision making with regards to ADT duration. In a study by Rose et al, the risk of prostate cancer–specific mortality significantly decreased by using ADT plus RT for men with HRPC with a low, but not a high, competing mortality score.4 The clinical significance of this finding is that adding ADT to RT might significantly reduce the risk of death from prostate cancer only in the setting of low competing risks.
Another concept to ponder is the optimum duration of ADT in the era of RT dose escalation. Currently, there are emerging techniques for delivering higher radiation doses and combining brachytherapy with external beam radiotherapy for HRPC, and the role of whole pelvic radiation is being investigated. New data suggests that higher radiation doses can lead to improvement in outcomes for HRPC. The DART01/05 study compared 4 versus 24 months of ADT with 76 to 82 Gy of RT and reported improved 5-year OS, DFS, and metastasis-free survival with longer ADT duration.5 Moreover, Kishan et al reported improved prostate cancer–specific mortality when brachytherapy boost was added to radiation compared to radiation alone in patients with Gleason scores 9 and 10.6 Therefore, the optimal duration of ADT in the setting of dose-escalated radiotherapy is not yet known. Also, it is important to note that unlike the prior RTOG and EORTC studies, this study did not include patients with evidence of regional nodal disease, and thus the present data should not be applied to this patient population.
Applications to Clinical Practice
This study’s results suggesting that 18 months of ADT in combination with RT yields similar 10-year OS and improved QoL compared with 36 months of ADT in patients with HRPC should be interpreted with caution when treating very young patients, since the higher rate of BF in the short arm may impact the OS with longer follow-up. Additionally, patients’ QoL and tolerance to ADT-related adverse effects should be taken into consideration given that compliance with 36 months of ADT was only 53% in this study.
—Jailan Elayoubi, MD, Michigan State University, East Lansing, MI
Study Overview
Objective. To compare the outcomes of 18 months versus 36 months of androgen deprivation therapy (ADT) combined with radiation in high-risk prostate cancer (HRPC).
Design. Phase 3 multicenter, randomized superiority trial.
Participants. This study enrolled patients aged ≤ 80 years with HRPC. All patients had no evidence of regional or distant metastasis. High-risk disease was defined as any of the following: clinical stage T3 or T4, prostate-specific antigen (PSA) level > 20 ng/mL, or Gleason score > 7.
Methods. Prior to randomization, all patients received 4 months of ADT with goserelin 10.8 mg and anti-androgen therapy with bicalutamide 50 mg daily for 30 days. Patients were then randomly assigned to 18 (short arm) or 36 (long arm) months of ADT in combination with radiation therapy (RT). The randomization was stratified by stage (T1-2 vs T3-4), Gleason score (< 7 vs > 7) and PSA level (< 20 ng/mL vs > 20 ng/mL). The standard radiation dose was 70 Gy to the prostate and 44 Gy to the pelvis. Computed tomography or magnetic resonance imaging exam of the abdomen and pelvis and a bone scan were performed to rule out regional or distant metastases. PSA level was monitored every 3 months for 18 months, every 6 months up to the third year, and yearly thereafter.
Main outcome measures. The 2 primary outcomes were overall survival (OS) and quality of life (QoL) at 5 years. The secondary end points were biochemical failure (BF)defined as PSA nadir plus 2, disease-free survival (DFS), and site(s) of tumor relapse.
Main results. The 5-year OS was 91% and 86% for the 36- and 18-month groups, respectively (P = 0.07). The 10-year OS was 62% for both groups (P = 0.7), and the global hazard ratio (HR) was 1.02 (P = 0.8). The disease-specific survival (DSS) was similar in both groups at 5 years (98% vs 97%) and at 10 years (91% vs 92%) in the long versus short arm, respectively. The rate of prostate cancer–specific death was 21% versus 23% in the long versus short arm, respectively. In a multivariate analysis for OS, only age and Gleason score > 7 were statistically significant survival predictors. BF rate at 10 years was 25% for 36 months as compared with 31% for 18 months (HR, 0.71, P = 0.02). The 10-year DFS rates were 45% and 39% for 36 and 18 months, respectively (HR, 0.68, P = 0.08). Forty patients in the long arm versus 43 in the short arm developed distant metastasis. Both groups developed similar sites of metastasis, which was predominantly osseous. Some aspects of the EORTC30 and PR25 scales were significant, mostly pertaining to sexual activity, fatigue, and hormone-related symptoms in favor of the 18-month group. The median time to testosterone recovery after completion of ADT was 2.1 years for the short arm versus 4 years in the long arm (P = 0.02). The compliance rate with ADT was 88% in the short arm versus 53% in the long arm. The main reason for nonadherence was side effects in 54% of the patients in the long arm and 31% in the short arm.
Conclusion. The results of the current study suggest that 18 months of ADT in combination with RT yields similar 10-year OS and improved QoL compared with 36 months in patients with HRPC.
Commentary
The role of ADT for HRPC in combination with RT has been well established by evidence from several trials; however, the comparator arms and patient characteristics between these studies have been quite heterogeneous. For instance, the Radiation Therapy Oncology Group (RTOG) 85-31 trial compared indefinite ADT with RT versus RT alone and showed significantly better 10-year OS in the ADT plus RT arm.1 Similarly, the European Organisation for Research and Treatment of Cancer (EROTC) 22961 trial showed an OS benefit for 36 months versus 6 months of ADT in combination with radiation.2 Additionally, the RTOG 92-02 trial, which compared 4 months versus 24 months of ADT with radiation, also found a significantly improved 10-year OS with a longer course of ADT.3 Taken together these data suggest that 4 to 6 months of ADT is inferior to 24 to 36 months of ADT in HRPC.
Several differences, however, exist in patient characteristics between the present trial and the earlier trials, justifiably reflecting the change of practice in the PSA era. For instance, the present study has a higher percentage of patients with Gleason scores 8-10 (60%) compared to the EROTC and RTOG studies (15%-35%) and a lower percentage of patients with T3 and T4 tumors. Patients with high Gleason scores are believed to have a higher risk of micro-metastasis at the time of diagnosis and higher chances of castration resistance. Therefore, inclusion of a (presumably) larger high-risk patient subgroup in the present study lends further credence to results indicating similar OS with a shorter course of ADT. A post hoc analysis including only patients with Gleason score 8-10 performed for OS, DSS, BF, and DFS showed no significant difference in any of these variables between the arms. Analysis of the interaction between ADT duration in the Gleason 8-10 subgroup versus Gleason 7 for OS, DFS, DSS and BF found no significant differences. This again suggests that 18 months of ADT may be sufficient for this high-risk group; however, it is difficult to draw definitive conclusions from this unplanned subgroup analysis.
Based on the results of the current study, it seems that 18 months of ADT is adequate for many, but not necessarily all, patients. For instance, there was a significantly higher incidence of BF in the 18-month arm. Applying this data to younger patients may require a more nuanced approach, as it is possible that with longer follow-up this higher rate of BF may translate into a difference in OS. Therefore, life expectancy and comorbid conditions always need to be incorporated into clinical decision making with regards to ADT duration. In a study by Rose et al, the risk of prostate cancer–specific mortality significantly decreased by using ADT plus RT for men with HRPC with a low, but not a high, competing mortality score.4 The clinical significance of this finding is that adding ADT to RT might significantly reduce the risk of death from prostate cancer only in the setting of low competing risks.
Another concept to ponder is the optimum duration of ADT in the era of RT dose escalation. Currently, there are emerging techniques for delivering higher radiation doses and combining brachytherapy with external beam radiotherapy for HRPC, and the role of whole pelvic radiation is being investigated. New data suggests that higher radiation doses can lead to improvement in outcomes for HRPC. The DART01/05 study compared 4 versus 24 months of ADT with 76 to 82 Gy of RT and reported improved 5-year OS, DFS, and metastasis-free survival with longer ADT duration.5 Moreover, Kishan et al reported improved prostate cancer–specific mortality when brachytherapy boost was added to radiation compared to radiation alone in patients with Gleason scores 9 and 10.6 Therefore, the optimal duration of ADT in the setting of dose-escalated radiotherapy is not yet known. Also, it is important to note that unlike the prior RTOG and EORTC studies, this study did not include patients with evidence of regional nodal disease, and thus the present data should not be applied to this patient population.
Applications to Clinical Practice
This study’s results suggesting that 18 months of ADT in combination with RT yields similar 10-year OS and improved QoL compared with 36 months of ADT in patients with HRPC should be interpreted with caution when treating very young patients, since the higher rate of BF in the short arm may impact the OS with longer follow-up. Additionally, patients’ QoL and tolerance to ADT-related adverse effects should be taken into consideration given that compliance with 36 months of ADT was only 53% in this study.
—Jailan Elayoubi, MD, Michigan State University, East Lansing, MI
1. Pilepich MV, Winter K, Lawton CA, et al. Androgen suppression adjuvant to definitive radiotherapy in prostate carcinoma—long-term results of phase III RTOG 85–31. Int J Radiat Oncol Biol Phys. 2005;61:1285-1290.
2. Bolla M, de Reijke TM, Van Tienhoven G, et al. Duration of androgen suppression in the treatment of prostate cancer. N Engl J Med. 2009;360:2516-2527.
3. Horwitz EM, Bae K, Hanks GE, Porter A, et al. Ten-year follow-up of radiation therapy oncology group protocol 92-02: a phase III trial of the duration of elective androgen deprivation in locally advanced prostate cancer. J Clin Oncol. 2008;26:2497–2504.
4. Rose BS, Chen MH, Wu J, et al. Androgen deprivation therapy use in the setting of high-dose radiation therapy and the risk of prostate cancer-specific mortality stratified by the extent of competing mortality. Int J Radiat Oncol Biol Phys. 2016;96:778-784.
5. Zapatero A, Guerrero A, Maldonado X, et al. High-dose radiotherapy with short-term or long-term androgen deprivation in localised prostate cancer (DART01/05 GICOR): a randomised, controlled, phase 3 trial. Lancet Oncol. 2015;16:320-327.
6. Kishan, AU, Cook, RR, Ciezki, JP, et al. Radical prostatectomy, external beam radiotherapy, or external beam radiotherapy with brachytherapy boost and disease progression and mortality in patients with gleason score 9-10 prostate cancer. JAMA. 2018;319:896-905.
1. Pilepich MV, Winter K, Lawton CA, et al. Androgen suppression adjuvant to definitive radiotherapy in prostate carcinoma—long-term results of phase III RTOG 85–31. Int J Radiat Oncol Biol Phys. 2005;61:1285-1290.
2. Bolla M, de Reijke TM, Van Tienhoven G, et al. Duration of androgen suppression in the treatment of prostate cancer. N Engl J Med. 2009;360:2516-2527.
3. Horwitz EM, Bae K, Hanks GE, Porter A, et al. Ten-year follow-up of radiation therapy oncology group protocol 92-02: a phase III trial of the duration of elective androgen deprivation in locally advanced prostate cancer. J Clin Oncol. 2008;26:2497–2504.
4. Rose BS, Chen MH, Wu J, et al. Androgen deprivation therapy use in the setting of high-dose radiation therapy and the risk of prostate cancer-specific mortality stratified by the extent of competing mortality. Int J Radiat Oncol Biol Phys. 2016;96:778-784.
5. Zapatero A, Guerrero A, Maldonado X, et al. High-dose radiotherapy with short-term or long-term androgen deprivation in localised prostate cancer (DART01/05 GICOR): a randomised, controlled, phase 3 trial. Lancet Oncol. 2015;16:320-327.
6. Kishan, AU, Cook, RR, Ciezki, JP, et al. Radical prostatectomy, external beam radiotherapy, or external beam radiotherapy with brachytherapy boost and disease progression and mortality in patients with gleason score 9-10 prostate cancer. JAMA. 2018;319:896-905.
A.I. and U 2
In a previous Letter from Maine I wrote about a study performed in China in which more than half a million patients were diagnosed by an artificial intelligence (A.I.) system that was able to extract and analyze information from their electronic medical records. The system was at least as accurate as physicians who had access to the same data (“A.I. Shows Promise Assisting Physicians,” by Cade Metz, The New York Times, Feb. 11, 2019). I ended my column with the hopeful assumption that despite incredible advances in A.I., the practice of medicine always would include a human element. However, I left unexplained exactly how physicians would fit into the post-A.I. revolution. In the weeks since I submitted that column, I have been searching for roles that might remain for physicians after A.I. has snatched their bread and butter of diagnosis and management.

I easily can envision a system in which the patient enters her chief complaint and current symptoms into her smartphone or tablet. Using its database of the patient’s past, family, and social history, the system generates a list of laboratory and imaging studies, some of which the patient may be able to submit directly from her handheld device. For example, the system may be able to use the patient’s phone to “examine” her. The A.I. system then generates a diagnosis.
If the diagnosed condition and management is simple and straightforward, such as a rash, the information could be communicated to the patient directly, with a short paragraph of explanation and list of persistent symptoms that would indicate that the condition was not improving as expected. A contact dermatitis comes to mind here.
However, suppose the A.I. system determines that the patient has a 90% chance of having stage IV pancreatic cancer, with a life expectancy of 6 months. Is this the kind of information you would like to learn about yourself by clicking “Your Diagnosis” box on your phone while you were having lunch with a friend? Obviously, a diagnosis of this severity should be communicated human to human, even though it was generated by a highly accurate computer system. And this communication would best be done in the form of a dialogue with someone who knows the patient and has some understanding of how she might understand and cope with the information. In the absence of a prior relationship, the dialogue should occur in real time and face to face at a minimum. I guess we have to acknowledge that FaceTime or Skype might be acceptable here.
Fortunately, stage IV cancers are rare, but there are a bazillion other conditions that, while not serious, require a nuanced explanation as part of a successful management plan that takes into account the patient’s level of anxiety and cognitive abilities. A boilerplate paragraph or two spit out by an A.I. system isn’t good health care. Although I know many physicians do rely on printed handouts for conditions they feel is a no-brainer.

The bottom line is that even when a machine may be better than we are at making some diagnoses, there always will be a role for a human to help other humans understand and cope with those diagnoses. At this point, physicians would appear be the obvious choice to fill that role. How we will get reimbursed for our communication skills is unclear.
Dr. Wilkoff practiced primary care pediatrics in Brunswick, Maine for nearly 40 years. He has authored several books on behavioral pediatrics, including “How to Say No to Your Toddler.” Email him at pdnews@mdedge.com.
In a previous Letter from Maine I wrote about a study performed in China in which more than half a million patients were diagnosed by an artificial intelligence (A.I.) system that was able to extract and analyze information from their electronic medical records. The system was at least as accurate as physicians who had access to the same data (“A.I. Shows Promise Assisting Physicians,” by Cade Metz, The New York Times, Feb. 11, 2019). I ended my column with the hopeful assumption that despite incredible advances in A.I., the practice of medicine always would include a human element. However, I left unexplained exactly how physicians would fit into the post-A.I. revolution. In the weeks since I submitted that column, I have been searching for roles that might remain for physicians after A.I. has snatched their bread and butter of diagnosis and management.
I easily can envision a system in which the patient enters her chief complaint and current symptoms into her smartphone or tablet. Using its database of the patient’s past, family, and social history, the system generates a list of laboratory and imaging studies, some of which the patient may be able to submit directly from her handheld device. For example, the system may be able to use the patient’s phone to “examine” her. The A.I. system then generates a diagnosis.
If the diagnosed condition and management is simple and straightforward, such as a rash, the information could be communicated to the patient directly, with a short paragraph of explanation and list of persistent symptoms that would indicate that the condition was not improving as expected. A contact dermatitis comes to mind here.
However, suppose the A.I. system determines that the patient has a 90% chance of having stage IV pancreatic cancer, with a life expectancy of 6 months. Is this the kind of information you would like to learn about yourself by clicking “Your Diagnosis” box on your phone while you were having lunch with a friend? Obviously, a diagnosis of this severity should be communicated human to human, even though it was generated by a highly accurate computer system. And this communication would best be done in the form of a dialogue with someone who knows the patient and has some understanding of how she might understand and cope with the information. In the absence of a prior relationship, the dialogue should occur in real time and face to face at a minimum. I guess we have to acknowledge that FaceTime or Skype might be acceptable here.
Fortunately, stage IV cancers are rare, but there are a bazillion other conditions that, while not serious, require a nuanced explanation as part of a successful management plan that takes into account the patient’s level of anxiety and cognitive abilities. A boilerplate paragraph or two spit out by an A.I. system isn’t good health care. Although I know many physicians do rely on printed handouts for conditions they feel is a no-brainer.
The bottom line is that even when a machine may be better than we are at making some diagnoses, there always will be a role for a human to help other humans understand and cope with those diagnoses. At this point, physicians would appear be the obvious choice to fill that role. How we will get reimbursed for our communication skills is unclear.
Dr. Wilkoff practiced primary care pediatrics in Brunswick, Maine for nearly 40 years. He has authored several books on behavioral pediatrics, including “How to Say No to Your Toddler.” Email him at pdnews@mdedge.com.
In a previous Letter from Maine I wrote about a study performed in China in which more than half a million patients were diagnosed by an artificial intelligence (A.I.) system that was able to extract and analyze information from their electronic medical records. The system was at least as accurate as physicians who had access to the same data (“A.I. Shows Promise Assisting Physicians,” by Cade Metz, The New York Times, Feb. 11, 2019). I ended my column with the hopeful assumption that despite incredible advances in A.I., the practice of medicine always would include a human element. However, I left unexplained exactly how physicians would fit into the post-A.I. revolution. In the weeks since I submitted that column, I have been searching for roles that might remain for physicians after A.I. has snatched their bread and butter of diagnosis and management.
I easily can envision a system in which the patient enters her chief complaint and current symptoms into her smartphone or tablet. Using its database of the patient’s past, family, and social history, the system generates a list of laboratory and imaging studies, some of which the patient may be able to submit directly from her handheld device. For example, the system may be able to use the patient’s phone to “examine” her. The A.I. system then generates a diagnosis.
If the diagnosed condition and management is simple and straightforward, such as a rash, the information could be communicated to the patient directly, with a short paragraph of explanation and list of persistent symptoms that would indicate that the condition was not improving as expected. A contact dermatitis comes to mind here.
However, suppose the A.I. system determines that the patient has a 90% chance of having stage IV pancreatic cancer, with a life expectancy of 6 months. Is this the kind of information you would like to learn about yourself by clicking “Your Diagnosis” box on your phone while you were having lunch with a friend? Obviously, a diagnosis of this severity should be communicated human to human, even though it was generated by a highly accurate computer system. And this communication would best be done in the form of a dialogue with someone who knows the patient and has some understanding of how she might understand and cope with the information. In the absence of a prior relationship, the dialogue should occur in real time and face to face at a minimum. I guess we have to acknowledge that FaceTime or Skype might be acceptable here.
Fortunately, stage IV cancers are rare, but there are a bazillion other conditions that, while not serious, require a nuanced explanation as part of a successful management plan that takes into account the patient’s level of anxiety and cognitive abilities. A boilerplate paragraph or two spit out by an A.I. system isn’t good health care. Although I know many physicians do rely on printed handouts for conditions they feel is a no-brainer.
The bottom line is that even when a machine may be better than we are at making some diagnoses, there always will be a role for a human to help other humans understand and cope with those diagnoses. At this point, physicians would appear be the obvious choice to fill that role. How we will get reimbursed for our communication skills is unclear.
Dr. Wilkoff practiced primary care pediatrics in Brunswick, Maine for nearly 40 years. He has authored several books on behavioral pediatrics, including “How to Say No to Your Toddler.” Email him at pdnews@mdedge.com.

Food allergy can be revealed in the epidermis of children with atopic dermatitis
according to a study of children with and without AD and FA.
The researchers included 62 children aged 4-17 years, who were divided into three groups: atopic dermatitis and food allergy (AD FA+, n = 21), atopic dermatitis and no food allergy (AD FA−, n = 19), and nonatopic controls (NA, n = 22).
“In this prospective clinical study with laboratory personnel blinded to minimize bias, we demonstrate that children with AD FA+ represent a unique endotype that can be distinguished from AD FA− or NA,” wrote Donald Y. M. Leung, MD, of National Jewish Health, Denver, and his coauthors. Their work was published online in Science Translational Medicine.
According to three different scoring systems, the two AD groups were measured to have similar skin disease severity. Dr. Leung and colleagues then used skin tape stripping to measure the first layer of skin tissue for transepidermal water loss (TEWL) and stratum corneum (SC) composition, along with other variables that would indicate a difference between AD FA+ and the other groups.
Upon analysis, children in the AD FA+ group were found to have “a constellation of SC attributes,” including increased TEWL and lower levels of filaggrin gene breakdown products (urocanic acid and pyroglutamic acid) at nonlesional layers. In addition, there was an increase of Staphylococcus aureus on the nonlesional skin of AD FA+, compared with NA.
The coauthors shared the study’s limitations, which included transcriptome analysis being successful for only a fraction of the patients and the lack of skin biopsies, which would be useful to confirm “the potential role of changes in the deeper layers of skin.” However, they also noted that using minimally invasive STS led to more patients providing samples, and thus less bias in collection. “Although future studies are needed to validate our findings,” Dr. Leung and his associates wrote, “our current data support the concept that primary and secondary prevention of AD and FA in this subset of AD should focus on improving skin barrier function.”
The study was funded by the National Institute of Health/The National Institute of Allergy and Infectious Diseases’ Atopic Dermatitis Research Network, with partial support from the Edelstein Family Chair for Pediatric Allergy at NIH and a NIH/National Center for Advancing Translational Sciences Colorado Clinical and Translational Science Awards grant. Three of the authors declared being inventors of a patent that covers methods of identifying AD with FA as a unique endotype. No other conflicts of interest were reported.
SOURCE: Leung DYM et al. Sci Transl Med. 2019 Feb 20. doi: 10.1126/scitranslmed.aav2685.
according to a study of children with and without AD and FA.
The researchers included 62 children aged 4-17 years, who were divided into three groups: atopic dermatitis and food allergy (AD FA+, n = 21), atopic dermatitis and no food allergy (AD FA−, n = 19), and nonatopic controls (NA, n = 22).
“In this prospective clinical study with laboratory personnel blinded to minimize bias, we demonstrate that children with AD FA+ represent a unique endotype that can be distinguished from AD FA− or NA,” wrote Donald Y. M. Leung, MD, of National Jewish Health, Denver, and his coauthors. Their work was published online in Science Translational Medicine.
According to three different scoring systems, the two AD groups were measured to have similar skin disease severity. Dr. Leung and colleagues then used skin tape stripping to measure the first layer of skin tissue for transepidermal water loss (TEWL) and stratum corneum (SC) composition, along with other variables that would indicate a difference between AD FA+ and the other groups.
Upon analysis, children in the AD FA+ group were found to have “a constellation of SC attributes,” including increased TEWL and lower levels of filaggrin gene breakdown products (urocanic acid and pyroglutamic acid) at nonlesional layers. In addition, there was an increase of Staphylococcus aureus on the nonlesional skin of AD FA+, compared with NA.
The coauthors shared the study’s limitations, which included transcriptome analysis being successful for only a fraction of the patients and the lack of skin biopsies, which would be useful to confirm “the potential role of changes in the deeper layers of skin.” However, they also noted that using minimally invasive STS led to more patients providing samples, and thus less bias in collection. “Although future studies are needed to validate our findings,” Dr. Leung and his associates wrote, “our current data support the concept that primary and secondary prevention of AD and FA in this subset of AD should focus on improving skin barrier function.”
The study was funded by the National Institute of Health/The National Institute of Allergy and Infectious Diseases’ Atopic Dermatitis Research Network, with partial support from the Edelstein Family Chair for Pediatric Allergy at NIH and a NIH/National Center for Advancing Translational Sciences Colorado Clinical and Translational Science Awards grant. Three of the authors declared being inventors of a patent that covers methods of identifying AD with FA as a unique endotype. No other conflicts of interest were reported.
SOURCE: Leung DYM et al. Sci Transl Med. 2019 Feb 20. doi: 10.1126/scitranslmed.aav2685.
according to a study of children with and without AD and FA.
The researchers included 62 children aged 4-17 years, who were divided into three groups: atopic dermatitis and food allergy (AD FA+, n = 21), atopic dermatitis and no food allergy (AD FA−, n = 19), and nonatopic controls (NA, n = 22).
“In this prospective clinical study with laboratory personnel blinded to minimize bias, we demonstrate that children with AD FA+ represent a unique endotype that can be distinguished from AD FA− or NA,” wrote Donald Y. M. Leung, MD, of National Jewish Health, Denver, and his coauthors. Their work was published online in Science Translational Medicine.
According to three different scoring systems, the two AD groups were measured to have similar skin disease severity. Dr. Leung and colleagues then used skin tape stripping to measure the first layer of skin tissue for transepidermal water loss (TEWL) and stratum corneum (SC) composition, along with other variables that would indicate a difference between AD FA+ and the other groups.
Upon analysis, children in the AD FA+ group were found to have “a constellation of SC attributes,” including increased TEWL and lower levels of filaggrin gene breakdown products (urocanic acid and pyroglutamic acid) at nonlesional layers. In addition, there was an increase of Staphylococcus aureus on the nonlesional skin of AD FA+, compared with NA.
The coauthors shared the study’s limitations, which included transcriptome analysis being successful for only a fraction of the patients and the lack of skin biopsies, which would be useful to confirm “the potential role of changes in the deeper layers of skin.” However, they also noted that using minimally invasive STS led to more patients providing samples, and thus less bias in collection. “Although future studies are needed to validate our findings,” Dr. Leung and his associates wrote, “our current data support the concept that primary and secondary prevention of AD and FA in this subset of AD should focus on improving skin barrier function.”
The study was funded by the National Institute of Health/The National Institute of Allergy and Infectious Diseases’ Atopic Dermatitis Research Network, with partial support from the Edelstein Family Chair for Pediatric Allergy at NIH and a NIH/National Center for Advancing Translational Sciences Colorado Clinical and Translational Science Awards grant. Three of the authors declared being inventors of a patent that covers methods of identifying AD with FA as a unique endotype. No other conflicts of interest were reported.
SOURCE: Leung DYM et al. Sci Transl Med. 2019 Feb 20. doi: 10.1126/scitranslmed.aav2685.
FROM SCIENCE TRANSLATIONAL MEDICINE
Key clinical point: Children with both atopic dermatitis and food allergy can be distinguished from those with just atopic dermatitis via their nonlesional skin surface.
Major finding: Those in the AD FA+ group were found to have “a constellation of stratum corneum attributes,” including increased TEWL and lower levels of filaggrin gene breakdown products.
Study details: A prospective clinical study of 62 children aged 4-17 years who were divided into three groups: atopic dermatitis and food allergy, atopic dermatitis and no food allergy, and nonatopic controls.
Disclosures: The study was funded by the National Institute of Health/The National Institute of Allergy and Infectious Diseases’ Atopic Dermatitis Research Network, with partial support from the Edelstein Family Chair for Pediatric Allergy at NIH and a NIH/National Center for Advancing Translational Sciences Colorado Clinical and Translational Science Awards grant. Three of the authors declared being inventors of a patent that covers methods of identifying AD with FA as a unique endotype. No other conflicts of interest were reported.
Source: Leung DYM et al. Sci Transl Med. 2019 Feb 20. doi: 10.1126/scitranslmed.aav2685.
Sleeping poorly may mean itching more
Study results showing an association between active atopic dermatitis (AD) and poor sleep quality were published in JAMA Pediatrics by a group of dermatologists at the University of California, San Francisco (JAMA Pediatr. 2019 Mar 4. doi: 10.1001/jamapediatrics.2019.0025). The data on the sleep quality and quantity of nearly 14,000 children were collected over span of 11 years. Of these children, slightly fewer than 5,000 met the researchers’ definition of atopic dermatitis.

Although the sleep duration of children with and without AD was not statistically different, the reports of poor sleep quality and sleep disturbances by children with AD were dramatically more frequent – a nearly 50% higher chance of having more sleep-quality disturbances. In addition, children with more severe active disease were even more likely to report poor sleep quality – almost 80%.
I suspect that you’re not surprised by these findings. You have probably heard numerous tales of poor sleep from families who have children with AD. It just makes sense that a child whose skin is dry and itchy will have trouble sleeping. I’m sure you have struggled to help parents be more diligent about applying moisturizing creams and lotions, and have been aggressive with steroid creams during flare-ups. You may have added sleep onset-promoting antihistamines when topical treatments haven’t been as effective as you had hoped.
Has your working assumption always been that if you can get the child’s skin settled down, the itching will improve and the child will have an easier time falling asleep? But have you ever considered flipping the equation over and tried to be more aggressive in managing the child’s sleep problems?
Like many other folks with psoriasis, I have noticed that my itching is worse when I am tired, and particularly worse in that evil interval between crawling into bed and falling asleep. As the grandparent of a child with AD, I have observed a similar phenomenon. While I am not going to claim that sleep deprivation causes psoriasis or AD, I think that we need to consider the association between poor sleep quality and itching as a feedback loop that must be interrupted. This means that in addition to recommending topicals and moisturizing strategies, we must learn more about our patients’ sleep habits and suggest appropriate sleep hygiene practices.
Many parents aren’t aware of the cruel paradox that an overtired child is more likely to have trouble falling asleep. Has the child been allowed to give up his nap prematurely? Is bedtime at an appropriate hour, and does it consist of a limited number of sleep-promoting rituals? Is the bedroom dark enough, cool enough, and free of electronic distractions?
Providing effective counseling on sleep hygiene is time consuming and requires that you have first convinced the parents that the child’s itching is being aggravated by his sleep deprivation and not just the other way around. Successful management may require a close working relationship between the child’s pediatrician and his dermatologist, with both physicians reinforcing each other’s message that atopic dermatitis isn’t just skin deep.
Dr. Wilkoff practiced primary care pediatrics in Brunswick, Maine, for nearly 40 years. He has authored several books on behavioral pediatrics, including “Is My Child Overtired?: The Sleep Solution for Raising Happier, Healthier Children.” Email him at pdnews@mdedge.com.
Study results showing an association between active atopic dermatitis (AD) and poor sleep quality were published in JAMA Pediatrics by a group of dermatologists at the University of California, San Francisco (JAMA Pediatr. 2019 Mar 4. doi: 10.1001/jamapediatrics.2019.0025). The data on the sleep quality and quantity of nearly 14,000 children were collected over span of 11 years. Of these children, slightly fewer than 5,000 met the researchers’ definition of atopic dermatitis.
Although the sleep duration of children with and without AD was not statistically different, the reports of poor sleep quality and sleep disturbances by children with AD were dramatically more frequent – a nearly 50% higher chance of having more sleep-quality disturbances. In addition, children with more severe active disease were even more likely to report poor sleep quality – almost 80%.
I suspect that you’re not surprised by these findings. You have probably heard numerous tales of poor sleep from families who have children with AD. It just makes sense that a child whose skin is dry and itchy will have trouble sleeping. I’m sure you have struggled to help parents be more diligent about applying moisturizing creams and lotions, and have been aggressive with steroid creams during flare-ups. You may have added sleep onset-promoting antihistamines when topical treatments haven’t been as effective as you had hoped.
Has your working assumption always been that if you can get the child’s skin settled down, the itching will improve and the child will have an easier time falling asleep? But have you ever considered flipping the equation over and tried to be more aggressive in managing the child’s sleep problems?
Like many other folks with psoriasis, I have noticed that my itching is worse when I am tired, and particularly worse in that evil interval between crawling into bed and falling asleep. As the grandparent of a child with AD, I have observed a similar phenomenon. While I am not going to claim that sleep deprivation causes psoriasis or AD, I think that we need to consider the association between poor sleep quality and itching as a feedback loop that must be interrupted. This means that in addition to recommending topicals and moisturizing strategies, we must learn more about our patients’ sleep habits and suggest appropriate sleep hygiene practices.
Many parents aren’t aware of the cruel paradox that an overtired child is more likely to have trouble falling asleep. Has the child been allowed to give up his nap prematurely? Is bedtime at an appropriate hour, and does it consist of a limited number of sleep-promoting rituals? Is the bedroom dark enough, cool enough, and free of electronic distractions?
Providing effective counseling on sleep hygiene is time consuming and requires that you have first convinced the parents that the child’s itching is being aggravated by his sleep deprivation and not just the other way around. Successful management may require a close working relationship between the child’s pediatrician and his dermatologist, with both physicians reinforcing each other’s message that atopic dermatitis isn’t just skin deep.
Dr. Wilkoff practiced primary care pediatrics in Brunswick, Maine, for nearly 40 years. He has authored several books on behavioral pediatrics, including “Is My Child Overtired?: The Sleep Solution for Raising Happier, Healthier Children.” Email him at pdnews@mdedge.com.
Study results showing an association between active atopic dermatitis (AD) and poor sleep quality were published in JAMA Pediatrics by a group of dermatologists at the University of California, San Francisco (JAMA Pediatr. 2019 Mar 4. doi: 10.1001/jamapediatrics.2019.0025). The data on the sleep quality and quantity of nearly 14,000 children were collected over span of 11 years. Of these children, slightly fewer than 5,000 met the researchers’ definition of atopic dermatitis.
Although the sleep duration of children with and without AD was not statistically different, the reports of poor sleep quality and sleep disturbances by children with AD were dramatically more frequent – a nearly 50% higher chance of having more sleep-quality disturbances. In addition, children with more severe active disease were even more likely to report poor sleep quality – almost 80%.
I suspect that you’re not surprised by these findings. You have probably heard numerous tales of poor sleep from families who have children with AD. It just makes sense that a child whose skin is dry and itchy will have trouble sleeping. I’m sure you have struggled to help parents be more diligent about applying moisturizing creams and lotions, and have been aggressive with steroid creams during flare-ups. You may have added sleep onset-promoting antihistamines when topical treatments haven’t been as effective as you had hoped.
Has your working assumption always been that if you can get the child’s skin settled down, the itching will improve and the child will have an easier time falling asleep? But have you ever considered flipping the equation over and tried to be more aggressive in managing the child’s sleep problems?
Like many other folks with psoriasis, I have noticed that my itching is worse when I am tired, and particularly worse in that evil interval between crawling into bed and falling asleep. As the grandparent of a child with AD, I have observed a similar phenomenon. While I am not going to claim that sleep deprivation causes psoriasis or AD, I think that we need to consider the association between poor sleep quality and itching as a feedback loop that must be interrupted. This means that in addition to recommending topicals and moisturizing strategies, we must learn more about our patients’ sleep habits and suggest appropriate sleep hygiene practices.
Many parents aren’t aware of the cruel paradox that an overtired child is more likely to have trouble falling asleep. Has the child been allowed to give up his nap prematurely? Is bedtime at an appropriate hour, and does it consist of a limited number of sleep-promoting rituals? Is the bedroom dark enough, cool enough, and free of electronic distractions?
Providing effective counseling on sleep hygiene is time consuming and requires that you have first convinced the parents that the child’s itching is being aggravated by his sleep deprivation and not just the other way around. Successful management may require a close working relationship between the child’s pediatrician and his dermatologist, with both physicians reinforcing each other’s message that atopic dermatitis isn’t just skin deep.
Dr. Wilkoff practiced primary care pediatrics in Brunswick, Maine, for nearly 40 years. He has authored several books on behavioral pediatrics, including “Is My Child Overtired?: The Sleep Solution for Raising Happier, Healthier Children.” Email him at pdnews@mdedge.com.

Scales assessing pediatric OCD possess little symptom overlap
There is considerable heterogeneity among symptoms included in various freely available, self-reported scales assessing obsessive-compulsive disorder in pediatric populations, according to Rachel Visontay and her associates at the University of New South Wales, Sydney.

They reviewed seven scales that exclusively assessed obsessive-compulsive disorder (OCD) and measured both obsessive and compulsive components in their study, published in the Journal of Obsessive-Compulsive and Related Disorders. The scales are:
- Children’s Florida Obsessive Compulsive Inventory.
- Children’s Yale-Brown Obsessive Compulsive Scale Symptom Checklist.
- Leyton Obsessional Inventory–Child Version.
- Children’s Obsessional Compulsive Inventory–Revised–Self Report.
- Obsessive Compulsive Inventory–Child Version.
- OCD Family Functioning Scale.
- Short OCD Screener.
A total of 54 umbrella symptoms were included over all seven scales: 32 obsessions, 21 compulsion, and 1 other symptom (Give poor class presentations despite planning). Half of these symptoms were unique to one scale but were more commonly obsessions (18 of 32) than compulsions (8 of 21). No obsession symptom appeared on more than five of the seven scales, but two compulsion symptoms (cleaning and checking compulsion) did appear on all scales.
The mean overlap between scales after Jaccard analysis was 0.14 for obsessions and 0.39 for compulsions, indicating very weak and weak overlap, respectively. The correlation between number of included symptoms and mean overlap was 0.43 for obsessions, indicating that scale length did play a role in determining overlap, but was –0.09 for compulsions, indicating no relationship between scale length and symptom overlap.
“While youth OCD scales generally measure the same broader construct, they might have different scopes within that construct, or may be more or less comprehensive than one another. As such, low content overlap does not necessarily mean a scale is ‘worse’ than one with higher overlap,” the investigators wrote. “However, researchers and
The study authors reported no conflicts of interest. The study was funded by a University of New South Wales Medicine, Neuroscience, Mental Health and Addiction Theme and SPHERE Mindgardens Clinical Academic Group collaborative research seed funding grant.
There is considerable heterogeneity among symptoms included in various freely available, self-reported scales assessing obsessive-compulsive disorder in pediatric populations, according to Rachel Visontay and her associates at the University of New South Wales, Sydney.
They reviewed seven scales that exclusively assessed obsessive-compulsive disorder (OCD) and measured both obsessive and compulsive components in their study, published in the Journal of Obsessive-Compulsive and Related Disorders. The scales are:
- Children’s Florida Obsessive Compulsive Inventory.
- Children’s Yale-Brown Obsessive Compulsive Scale Symptom Checklist.
- Leyton Obsessional Inventory–Child Version.
- Children’s Obsessional Compulsive Inventory–Revised–Self Report.
- Obsessive Compulsive Inventory–Child Version.
- OCD Family Functioning Scale.
- Short OCD Screener.
A total of 54 umbrella symptoms were included over all seven scales: 32 obsessions, 21 compulsion, and 1 other symptom (Give poor class presentations despite planning). Half of these symptoms were unique to one scale but were more commonly obsessions (18 of 32) than compulsions (8 of 21). No obsession symptom appeared on more than five of the seven scales, but two compulsion symptoms (cleaning and checking compulsion) did appear on all scales.
The mean overlap between scales after Jaccard analysis was 0.14 for obsessions and 0.39 for compulsions, indicating very weak and weak overlap, respectively. The correlation between number of included symptoms and mean overlap was 0.43 for obsessions, indicating that scale length did play a role in determining overlap, but was –0.09 for compulsions, indicating no relationship between scale length and symptom overlap.
“While youth OCD scales generally measure the same broader construct, they might have different scopes within that construct, or may be more or less comprehensive than one another. As such, low content overlap does not necessarily mean a scale is ‘worse’ than one with higher overlap,” the investigators wrote. “However, researchers and
The study authors reported no conflicts of interest. The study was funded by a University of New South Wales Medicine, Neuroscience, Mental Health and Addiction Theme and SPHERE Mindgardens Clinical Academic Group collaborative research seed funding grant.
There is considerable heterogeneity among symptoms included in various freely available, self-reported scales assessing obsessive-compulsive disorder in pediatric populations, according to Rachel Visontay and her associates at the University of New South Wales, Sydney.
They reviewed seven scales that exclusively assessed obsessive-compulsive disorder (OCD) and measured both obsessive and compulsive components in their study, published in the Journal of Obsessive-Compulsive and Related Disorders. The scales are:
- Children’s Florida Obsessive Compulsive Inventory.
- Children’s Yale-Brown Obsessive Compulsive Scale Symptom Checklist.
- Leyton Obsessional Inventory–Child Version.
- Children’s Obsessional Compulsive Inventory–Revised–Self Report.
- Obsessive Compulsive Inventory–Child Version.
- OCD Family Functioning Scale.
- Short OCD Screener.
A total of 54 umbrella symptoms were included over all seven scales: 32 obsessions, 21 compulsion, and 1 other symptom (Give poor class presentations despite planning). Half of these symptoms were unique to one scale but were more commonly obsessions (18 of 32) than compulsions (8 of 21). No obsession symptom appeared on more than five of the seven scales, but two compulsion symptoms (cleaning and checking compulsion) did appear on all scales.
The mean overlap between scales after Jaccard analysis was 0.14 for obsessions and 0.39 for compulsions, indicating very weak and weak overlap, respectively. The correlation between number of included symptoms and mean overlap was 0.43 for obsessions, indicating that scale length did play a role in determining overlap, but was –0.09 for compulsions, indicating no relationship between scale length and symptom overlap.
“While youth OCD scales generally measure the same broader construct, they might have different scopes within that construct, or may be more or less comprehensive than one another. As such, low content overlap does not necessarily mean a scale is ‘worse’ than one with higher overlap,” the investigators wrote. “However, researchers and
The study authors reported no conflicts of interest. The study was funded by a University of New South Wales Medicine, Neuroscience, Mental Health and Addiction Theme and SPHERE Mindgardens Clinical Academic Group collaborative research seed funding grant.
FROM THE JOURNAL OF OBSESSIVE-COMPULSIVE AND RELATED DISORDERS

Register for VRIC
"Hard Science: Calcification and Vascular Solutions” is the theme of this year’s Vascular Research Initiatives Conference (VRIC). The meeting will be held in Boston on May 13 and will focus on emerging vascular science and biology. Abstracts will cover topic areas including, but not limited to, vascular remodeling, stem cells and wound healing, arterial injury, and diabetes. Don’t miss out on the essential meeting for translational vascular science and interdisciplinary research – make your travel plans now.
"Hard Science: Calcification and Vascular Solutions” is the theme of this year’s Vascular Research Initiatives Conference (VRIC). The meeting will be held in Boston on May 13 and will focus on emerging vascular science and biology. Abstracts will cover topic areas including, but not limited to, vascular remodeling, stem cells and wound healing, arterial injury, and diabetes. Don’t miss out on the essential meeting for translational vascular science and interdisciplinary research – make your travel plans now.
"Hard Science: Calcification and Vascular Solutions” is the theme of this year’s Vascular Research Initiatives Conference (VRIC). The meeting will be held in Boston on May 13 and will focus on emerging vascular science and biology. Abstracts will cover topic areas including, but not limited to, vascular remodeling, stem cells and wound healing, arterial injury, and diabetes. Don’t miss out on the essential meeting for translational vascular science and interdisciplinary research – make your travel plans now.
What does a Google search for cosmetic and laser procedures reveal?
DENVER – of professional societies only 8% of the time, and even less frequently to websites of academic centers and peer-reviewed medical journals, results from a novel study showed.

“An increasing number of patients are seeking information about cosmetic and laser dermatology from online sources,” Jennifer L. Sawaya, MD, said in an interview in advance of the annual conference of the American Society for Laser Medicine and Surgery. “There are several studies that have discussed the role of the Internet and social media in dermatology. To our knowledge, this is the first study to specifically look at the results of Google search terms within our field to investigate which sources are providing this information.”
Dr. Sawaya, a fellow at Massachusetts General Hospital and the Wellman Center for Photomedicine, Boston, and her colleagues cross-measured keyword analytics provided by Zalea, an online resource on cosmetic treatments for consumers, with the most used Instagram hashtags to obtain 10 online keywords: body contouring, Botox, fillers, CoolSculpting, laser hair removal, tattoo removal, skin tightening, skin rejuvenation, cosmetic surgery, and liposuction. Next, they used an advanced Google search to obtain the top 25 search results for each of those 10 keywords and categorized information sources as professional societies, peer-reviewed journals, non–peer-reviewed online health information, news/media, device/cosmeceutical companies, clinical practices, academic centers, or medical spas.
Overall, the top search results came from clinical practices 23% of the time, followed by online health information sites (19%), medical spas (16%), and news/media (15%). A much smaller percentage of the search results came from professional societies (8%), academic centers (6%), and peer-reviewed medical journals (5%). Within the clinical practices and medical spas, nearly half of these sources were plastic surgeons, while board-certified dermatologists comprised only 21% of the clinical information sources.
When Dr. Sawaya and her associates evaluated the source of search results for each keyword, results varied. For example, search results for “body contouring” came most frequently from professional societies and clinical practices (20% each), “Botox” from news/media (36%), “fillers” from online health information (28%), “CoolSculpting” from clinical practices (40%), “laser hair removal” from news/media (32%), “tattoo removal” from medical spas (28%), “skin tightening” from news/media (24%), “skin rejuvenation” from medical spas (28%), “cosmetic surgery” from clinical practices (52%), and “liposuction” from online health information (36%).
“Our clinical take-home message is essentially a call for an increasing amount of evidence-based, academic content to be made available for online consumption,” Dr. Sawaya said. “In an era when patients seek a lot of medical information online and make important decisions through this manner, we have an obligation to understand what is out there and do our best to improve the quality of available information.”

She acknowledged certain limitations of the study, including the fact that results of a Google search may vary depending on the type of device used (mobile, desktop) as well as the location of the device. “An additional limitation is how the search history on the device may impact results,” she said. “To control for this, the device history, cache, and cookies were cleared prior to the search. Despite these controls, it is unclear how and to what extent prior searches affect the Google ranking algorithm. We acknowledge that the findings in this study reflect a single point in time and that the results of a Google search will change dynamically based on many factors. Finally, we acknowledge that our study is based on a single search engine site and that the trends we observe with Google may not be extrapolated to other online channels.”
Dr. Sawaya reported having no financial disclosures.
DENVER – of professional societies only 8% of the time, and even less frequently to websites of academic centers and peer-reviewed medical journals, results from a novel study showed.
“An increasing number of patients are seeking information about cosmetic and laser dermatology from online sources,” Jennifer L. Sawaya, MD, said in an interview in advance of the annual conference of the American Society for Laser Medicine and Surgery. “There are several studies that have discussed the role of the Internet and social media in dermatology. To our knowledge, this is the first study to specifically look at the results of Google search terms within our field to investigate which sources are providing this information.”
Dr. Sawaya, a fellow at Massachusetts General Hospital and the Wellman Center for Photomedicine, Boston, and her colleagues cross-measured keyword analytics provided by Zalea, an online resource on cosmetic treatments for consumers, with the most used Instagram hashtags to obtain 10 online keywords: body contouring, Botox, fillers, CoolSculpting, laser hair removal, tattoo removal, skin tightening, skin rejuvenation, cosmetic surgery, and liposuction. Next, they used an advanced Google search to obtain the top 25 search results for each of those 10 keywords and categorized information sources as professional societies, peer-reviewed journals, non–peer-reviewed online health information, news/media, device/cosmeceutical companies, clinical practices, academic centers, or medical spas.
Overall, the top search results came from clinical practices 23% of the time, followed by online health information sites (19%), medical spas (16%), and news/media (15%). A much smaller percentage of the search results came from professional societies (8%), academic centers (6%), and peer-reviewed medical journals (5%). Within the clinical practices and medical spas, nearly half of these sources were plastic surgeons, while board-certified dermatologists comprised only 21% of the clinical information sources.
When Dr. Sawaya and her associates evaluated the source of search results for each keyword, results varied. For example, search results for “body contouring” came most frequently from professional societies and clinical practices (20% each), “Botox” from news/media (36%), “fillers” from online health information (28%), “CoolSculpting” from clinical practices (40%), “laser hair removal” from news/media (32%), “tattoo removal” from medical spas (28%), “skin tightening” from news/media (24%), “skin rejuvenation” from medical spas (28%), “cosmetic surgery” from clinical practices (52%), and “liposuction” from online health information (36%).
“Our clinical take-home message is essentially a call for an increasing amount of evidence-based, academic content to be made available for online consumption,” Dr. Sawaya said. “In an era when patients seek a lot of medical information online and make important decisions through this manner, we have an obligation to understand what is out there and do our best to improve the quality of available information.”
She acknowledged certain limitations of the study, including the fact that results of a Google search may vary depending on the type of device used (mobile, desktop) as well as the location of the device. “An additional limitation is how the search history on the device may impact results,” she said. “To control for this, the device history, cache, and cookies were cleared prior to the search. Despite these controls, it is unclear how and to what extent prior searches affect the Google ranking algorithm. We acknowledge that the findings in this study reflect a single point in time and that the results of a Google search will change dynamically based on many factors. Finally, we acknowledge that our study is based on a single search engine site and that the trends we observe with Google may not be extrapolated to other online channels.”
Dr. Sawaya reported having no financial disclosures.
DENVER – of professional societies only 8% of the time, and even less frequently to websites of academic centers and peer-reviewed medical journals, results from a novel study showed.
“An increasing number of patients are seeking information about cosmetic and laser dermatology from online sources,” Jennifer L. Sawaya, MD, said in an interview in advance of the annual conference of the American Society for Laser Medicine and Surgery. “There are several studies that have discussed the role of the Internet and social media in dermatology. To our knowledge, this is the first study to specifically look at the results of Google search terms within our field to investigate which sources are providing this information.”
Dr. Sawaya, a fellow at Massachusetts General Hospital and the Wellman Center for Photomedicine, Boston, and her colleagues cross-measured keyword analytics provided by Zalea, an online resource on cosmetic treatments for consumers, with the most used Instagram hashtags to obtain 10 online keywords: body contouring, Botox, fillers, CoolSculpting, laser hair removal, tattoo removal, skin tightening, skin rejuvenation, cosmetic surgery, and liposuction. Next, they used an advanced Google search to obtain the top 25 search results for each of those 10 keywords and categorized information sources as professional societies, peer-reviewed journals, non–peer-reviewed online health information, news/media, device/cosmeceutical companies, clinical practices, academic centers, or medical spas.
Overall, the top search results came from clinical practices 23% of the time, followed by online health information sites (19%), medical spas (16%), and news/media (15%). A much smaller percentage of the search results came from professional societies (8%), academic centers (6%), and peer-reviewed medical journals (5%). Within the clinical practices and medical spas, nearly half of these sources were plastic surgeons, while board-certified dermatologists comprised only 21% of the clinical information sources.
When Dr. Sawaya and her associates evaluated the source of search results for each keyword, results varied. For example, search results for “body contouring” came most frequently from professional societies and clinical practices (20% each), “Botox” from news/media (36%), “fillers” from online health information (28%), “CoolSculpting” from clinical practices (40%), “laser hair removal” from news/media (32%), “tattoo removal” from medical spas (28%), “skin tightening” from news/media (24%), “skin rejuvenation” from medical spas (28%), “cosmetic surgery” from clinical practices (52%), and “liposuction” from online health information (36%).
“Our clinical take-home message is essentially a call for an increasing amount of evidence-based, academic content to be made available for online consumption,” Dr. Sawaya said. “In an era when patients seek a lot of medical information online and make important decisions through this manner, we have an obligation to understand what is out there and do our best to improve the quality of available information.”
She acknowledged certain limitations of the study, including the fact that results of a Google search may vary depending on the type of device used (mobile, desktop) as well as the location of the device. “An additional limitation is how the search history on the device may impact results,” she said. “To control for this, the device history, cache, and cookies were cleared prior to the search. Despite these controls, it is unclear how and to what extent prior searches affect the Google ranking algorithm. We acknowledge that the findings in this study reflect a single point in time and that the results of a Google search will change dynamically based on many factors. Finally, we acknowledge that our study is based on a single search engine site and that the trends we observe with Google may not be extrapolated to other online channels.”
Dr. Sawaya reported having no financial disclosures.
REPORTING FROM ASLMS 2019
Key clinical point: There is a paucity of online information regarding cosmetic and laser dermatology from professional societies and academic, peer-reviewed sources.
Major finding: Top Google search results came from clinical practices 23% of the time and from professional societies only 8% of the time.
Study details: An online review of 25 Google search results for 10 keywords associated with cosmetic and laser dermatology.
Disclosures: Dr. Sawaya reported having no financial disclosures.

Study finds pain perception disconnect during vascular laser procedures
DENVER – There is an apparent disconnect between the level of periprocedural pain experienced by patients during vascular laser procedures and what device manufacturers say that level of pain should be, results from a retrospective study showed.

“Although there is an abundance of research on how pain signals are transmitted in the nervous system and how pain is perceived among certain patient demographics, there is not much known about how pain perception differs from that put forth by industry,” Lauren Bonati, MD, said in an interview in advance of the annual conference of the American Society for Laser Medicine and Surgery. “This study is unique because we are questioning not whether pain perception is reproducible between patients, but rather if it reflects what industry and device manufacturers are telling us.”
Dr. Bonati, a dermatologist at Edwards, Colo.–based Mountain Dermatology Specialists, and her colleagues collected median and mode pain scores from a past clinical trial that investigated a dual wavelength laser used for different types of treatments. “The treatment type (laser wavelength and treatment area) was largely based on the severity of facial redness for each individual patient,” she explained. “The options were spot treatment, nose and cheeks, or a global facial treatment with either wavelength.” The researchers reviewed industry-provided materials to determine language regarding procedural pain, and they interviewed the clinical trial’s principal investigator about how pain expectations were set during the trial. Next, they transferred subject-reported pain scores and verbal pain descriptors to the validated Numerical Rating Scale and the Verbal Rating Scale, for comparison.
In all, 85 procedural pain scores were collected from 22 subject charts. The researchers found that the average procedural pain scores for treatment types reported by subjects were translated to entirely different verbal and numerical categories of pain from those described by industry materials. “It was surprising to see how vague pain descriptions can be in device manuals and industry materials, if even addressed at all,” Dr. Bonati said.
She advised clinicians to be wary of whom they rely on for information related to pain expectations. “Also, remember that wrongly set pain expectations can have physiologic and emotional effects that may positively or negatively impact patient experience,” Dr. Bonati said.
She acknowledged certain limitations of the study, including the fact that it was a review of a previously conducted clinical trial, “which is not a perfect representation of real-life clinic.”
She reported having no conflicts of interest.
DENVER – There is an apparent disconnect between the level of periprocedural pain experienced by patients during vascular laser procedures and what device manufacturers say that level of pain should be, results from a retrospective study showed.
“Although there is an abundance of research on how pain signals are transmitted in the nervous system and how pain is perceived among certain patient demographics, there is not much known about how pain perception differs from that put forth by industry,” Lauren Bonati, MD, said in an interview in advance of the annual conference of the American Society for Laser Medicine and Surgery. “This study is unique because we are questioning not whether pain perception is reproducible between patients, but rather if it reflects what industry and device manufacturers are telling us.”
Dr. Bonati, a dermatologist at Edwards, Colo.–based Mountain Dermatology Specialists, and her colleagues collected median and mode pain scores from a past clinical trial that investigated a dual wavelength laser used for different types of treatments. “The treatment type (laser wavelength and treatment area) was largely based on the severity of facial redness for each individual patient,” she explained. “The options were spot treatment, nose and cheeks, or a global facial treatment with either wavelength.” The researchers reviewed industry-provided materials to determine language regarding procedural pain, and they interviewed the clinical trial’s principal investigator about how pain expectations were set during the trial. Next, they transferred subject-reported pain scores and verbal pain descriptors to the validated Numerical Rating Scale and the Verbal Rating Scale, for comparison.
In all, 85 procedural pain scores were collected from 22 subject charts. The researchers found that the average procedural pain scores for treatment types reported by subjects were translated to entirely different verbal and numerical categories of pain from those described by industry materials. “It was surprising to see how vague pain descriptions can be in device manuals and industry materials, if even addressed at all,” Dr. Bonati said.
She advised clinicians to be wary of whom they rely on for information related to pain expectations. “Also, remember that wrongly set pain expectations can have physiologic and emotional effects that may positively or negatively impact patient experience,” Dr. Bonati said.
She acknowledged certain limitations of the study, including the fact that it was a review of a previously conducted clinical trial, “which is not a perfect representation of real-life clinic.”
She reported having no conflicts of interest.
DENVER – There is an apparent disconnect between the level of periprocedural pain experienced by patients during vascular laser procedures and what device manufacturers say that level of pain should be, results from a retrospective study showed.
“Although there is an abundance of research on how pain signals are transmitted in the nervous system and how pain is perceived among certain patient demographics, there is not much known about how pain perception differs from that put forth by industry,” Lauren Bonati, MD, said in an interview in advance of the annual conference of the American Society for Laser Medicine and Surgery. “This study is unique because we are questioning not whether pain perception is reproducible between patients, but rather if it reflects what industry and device manufacturers are telling us.”
Dr. Bonati, a dermatologist at Edwards, Colo.–based Mountain Dermatology Specialists, and her colleagues collected median and mode pain scores from a past clinical trial that investigated a dual wavelength laser used for different types of treatments. “The treatment type (laser wavelength and treatment area) was largely based on the severity of facial redness for each individual patient,” she explained. “The options were spot treatment, nose and cheeks, or a global facial treatment with either wavelength.” The researchers reviewed industry-provided materials to determine language regarding procedural pain, and they interviewed the clinical trial’s principal investigator about how pain expectations were set during the trial. Next, they transferred subject-reported pain scores and verbal pain descriptors to the validated Numerical Rating Scale and the Verbal Rating Scale, for comparison.
In all, 85 procedural pain scores were collected from 22 subject charts. The researchers found that the average procedural pain scores for treatment types reported by subjects were translated to entirely different verbal and numerical categories of pain from those described by industry materials. “It was surprising to see how vague pain descriptions can be in device manuals and industry materials, if even addressed at all,” Dr. Bonati said.
She advised clinicians to be wary of whom they rely on for information related to pain expectations. “Also, remember that wrongly set pain expectations can have physiologic and emotional effects that may positively or negatively impact patient experience,” Dr. Bonati said.
She acknowledged certain limitations of the study, including the fact that it was a review of a previously conducted clinical trial, “which is not a perfect representation of real-life clinic.”
She reported having no conflicts of interest.
REPORTING FROM ASLMS 2019
Key clinical point: Industry-provided materials failed to capture the range of procedural pain scores reported by patients undergoing a variety of vascular laser procedures.
Major finding: The average procedural pain scores for treatment types reported by subjects were translated to entirely different verbal and numerical categories of pain from those described by industry materials.
Study details: A retrospective evaluation of 85 procedural pain scores collected from 22 subject charts.
Disclosures: Dr. Bonati reported having no financial disclosures.