User login
Follow-up blood cultures are often needed after bacteremia
Bacteremia is common and associated with significant morbidity and mortality. Bloodstream infections rank among the leading causes of death in North America and Europe.1
In this issue, Mushtaq et al2 contend that follow-up blood cultures after initial bacteremia are not needed for most hospitalized patients. Not repeating blood cultures after initial bacteremia has been proposed to decrease hospitalization length, consultations, and healthcare costs in some clinical settings. However, without follow-up cultures, it can be difficult to assess the adequacy of treatment of bacteremia and associated underlying infections.
GRAM-NEGATIVE ORGANISMS
Results of retrospective studies indicate that follow-up cultures may not be routinely needed for gram-negative bacteremia. In a review by Canzoneri et al of 383 cases with subsequent follow-up cultures,3 55 (14%) were positive. The mean duration of bacteremia was 2.8 days (range 1 to 15 days). Of the 55 persistently positive blood cultures, only 8 (15%) were caused by gram-negative organisms. Limitations to this study included the lack of patient outcome data, a low event rate, and the retrospective design.4
In a retrospective case-control study of follow-up cultures for 862 episodes of Klebsiella pneumoniae bacteremia,5 independent risk factors for persistent bacteremia were intra-abdominal infection, higher Charlson comorbidity index score, solid-organ transplant, and unfavorable treatment response.
These studies confirm that persistent bacteremia is uncommon with gram-negative organisms. They also support using comorbidities and treatment response to guide the ordering of follow-up blood cultures.
WHEN IS FOLLOW-UP CULTURE USEFUL?
Although follow-up blood cultures may not be needed routinely in patients with gram- negative bacteremia, it would be difficult to extrapolate this to gram-positive organisms, especially Staphylococcus aureus.
In Canzoneri et al,3 43 (78%) of the 55 positive follow-up cultures were due to gram-positive organisms. Factors associated with positive follow-up cultures were concurrent fever, presence of a central intravenous line, end-stage renal disease on hemodialysis, and diabetes mellitus. In addition, infectious disease consultation to decide the need for follow-up cultures for S aureus bacteremia has been associated with fewer deaths, fewer relapses, and lower readmission rates.6,7
In certain clinical scenarios, follow-up blood cultures can provide useful information, such as when the source of bacteremia is endocarditis or cardiac device infection, a vascular graft, or an intravascular line. In the Infectious Diseases Society of America guidelines for diagnosis and management of catheter-related bloodstream infections, persistent or relapsing bacteremia for some organisms is a criterion for removal of a long-term central venous catheter.8
Follow-up cultures are especially useful when the focus of infection is protected from antibiotic penetration, such as in the central nervous system, joints, and abdominal or other abscess. These foci may require drainage for cure. In these cases or in the setting of unfavorable clinical treatment response, follow-up blood cultures showing persistent bacteremia can prompt a search for unaddressed or incompletely addressed foci of infection and allow for source control.
The timing of follow-up cultures is generally 1 to 2 days after the initial culture. Although Mushtaq et al propose a different approach, traditional teaching has been that the last blood culture should not be positive, and this leads to ordering follow-up blood cultures until clearance of bacteremia is documented.
- Goto M, Al-Hasan MN. Overall burden of bloodstream infection and nosocomial bloodstream infection in North America and Europe. Clin Microbiol Infect 2013; 19(6):501–509. doi:10.1111/1469-0691.12195
- Mushtaq A, Bredell B, Soubani A. Repeating blood cultures after an initial bacteremia: when and how often? Cleve Clin J Med 2019; 86(2):89–92. doi:10.3949/ccjm.86a.18001
- Canzoneri CN, Akhavan BJ, Tosur Z, Andrade PEA, Aisenberg GM. Follow-up blood cultures in gram-negative bacteremia: are they needed? Clin Infect Dis 2017; 65(11):1776–1779. doi:10.1093/cid/cix648
- Jones RB, Paruchuri A, Shah SS. Prospective trials are required to alter practice for follow-up blood cultures for gram-negative bacilli bacteremia. Clin Infect Dis 2018; 67(2):315–316. doi:10.1093/cid/ciy070
- Kang CK, Kim ES, Song KH, et al. Can a routine follow-up blood culture be justified in Klebsiella pneumoniae bacteremia? A retrospective case-control study. BMC Infect Dis 2013; 13:365. doi:10.1186/1471-2334-13-365
- Honda H, Krauss MJ, Jones JC, Olsen MA, Warren DK. The value of infectious diseases consultation in Staphylococcus aureus bacteremia. Am J Med 2010; 123(7):631–637. doi:10.1016/j.amjmed.2010.01.015
- Fowler VG Jr, Sanders LL, Sexton DJ, et al. Outcome of Staphylococcus aureus bacteremia according to compliance with recommendations of infectious diseases specialists: experience with 244 patients. Clin Infect Dis 1998; 27(3):478–486. pmid:9770144
- Mermel LA, Allon M, Bouza E, et al. Clinical practice guidelines for the diagnosis and management of intravascular catheter-related infection: 2009 Update by the Infectious Diseases Society of America. Clin Infect Dis 2009; 49(1):1–45. doi:10.1086/599376
Bacteremia is common and associated with significant morbidity and mortality. Bloodstream infections rank among the leading causes of death in North America and Europe.1
In this issue, Mushtaq et al2 contend that follow-up blood cultures after initial bacteremia are not needed for most hospitalized patients. Not repeating blood cultures after initial bacteremia has been proposed to decrease hospitalization length, consultations, and healthcare costs in some clinical settings. However, without follow-up cultures, it can be difficult to assess the adequacy of treatment of bacteremia and associated underlying infections.
GRAM-NEGATIVE ORGANISMS
Results of retrospective studies indicate that follow-up cultures may not be routinely needed for gram-negative bacteremia. In a review by Canzoneri et al of 383 cases with subsequent follow-up cultures,3 55 (14%) were positive. The mean duration of bacteremia was 2.8 days (range 1 to 15 days). Of the 55 persistently positive blood cultures, only 8 (15%) were caused by gram-negative organisms. Limitations to this study included the lack of patient outcome data, a low event rate, and the retrospective design.4
In a retrospective case-control study of follow-up cultures for 862 episodes of Klebsiella pneumoniae bacteremia,5 independent risk factors for persistent bacteremia were intra-abdominal infection, higher Charlson comorbidity index score, solid-organ transplant, and unfavorable treatment response.
These studies confirm that persistent bacteremia is uncommon with gram-negative organisms. They also support using comorbidities and treatment response to guide the ordering of follow-up blood cultures.
WHEN IS FOLLOW-UP CULTURE USEFUL?
Although follow-up blood cultures may not be needed routinely in patients with gram- negative bacteremia, it would be difficult to extrapolate this to gram-positive organisms, especially Staphylococcus aureus.
In Canzoneri et al,3 43 (78%) of the 55 positive follow-up cultures were due to gram-positive organisms. Factors associated with positive follow-up cultures were concurrent fever, presence of a central intravenous line, end-stage renal disease on hemodialysis, and diabetes mellitus. In addition, infectious disease consultation to decide the need for follow-up cultures for S aureus bacteremia has been associated with fewer deaths, fewer relapses, and lower readmission rates.6,7
In certain clinical scenarios, follow-up blood cultures can provide useful information, such as when the source of bacteremia is endocarditis or cardiac device infection, a vascular graft, or an intravascular line. In the Infectious Diseases Society of America guidelines for diagnosis and management of catheter-related bloodstream infections, persistent or relapsing bacteremia for some organisms is a criterion for removal of a long-term central venous catheter.8
Follow-up cultures are especially useful when the focus of infection is protected from antibiotic penetration, such as in the central nervous system, joints, and abdominal or other abscess. These foci may require drainage for cure. In these cases or in the setting of unfavorable clinical treatment response, follow-up blood cultures showing persistent bacteremia can prompt a search for unaddressed or incompletely addressed foci of infection and allow for source control.
The timing of follow-up cultures is generally 1 to 2 days after the initial culture. Although Mushtaq et al propose a different approach, traditional teaching has been that the last blood culture should not be positive, and this leads to ordering follow-up blood cultures until clearance of bacteremia is documented.
- Goto M, Al-Hasan MN. Overall burden of bloodstream infection and nosocomial bloodstream infection in North America and Europe. Clin Microbiol Infect 2013; 19(6):501–509. doi:10.1111/1469-0691.12195
- Mushtaq A, Bredell B, Soubani A. Repeating blood cultures after an initial bacteremia: when and how often? Cleve Clin J Med 2019; 86(2):89–92. doi:10.3949/ccjm.86a.18001
- Canzoneri CN, Akhavan BJ, Tosur Z, Andrade PEA, Aisenberg GM. Follow-up blood cultures in gram-negative bacteremia: are they needed? Clin Infect Dis 2017; 65(11):1776–1779. doi:10.1093/cid/cix648
- Jones RB, Paruchuri A, Shah SS. Prospective trials are required to alter practice for follow-up blood cultures for gram-negative bacilli bacteremia. Clin Infect Dis 2018; 67(2):315–316. doi:10.1093/cid/ciy070
- Kang CK, Kim ES, Song KH, et al. Can a routine follow-up blood culture be justified in Klebsiella pneumoniae bacteremia? A retrospective case-control study. BMC Infect Dis 2013; 13:365. doi:10.1186/1471-2334-13-365
- Honda H, Krauss MJ, Jones JC, Olsen MA, Warren DK. The value of infectious diseases consultation in Staphylococcus aureus bacteremia. Am J Med 2010; 123(7):631–637. doi:10.1016/j.amjmed.2010.01.015
- Fowler VG Jr, Sanders LL, Sexton DJ, et al. Outcome of Staphylococcus aureus bacteremia according to compliance with recommendations of infectious diseases specialists: experience with 244 patients. Clin Infect Dis 1998; 27(3):478–486. pmid:9770144
- Mermel LA, Allon M, Bouza E, et al. Clinical practice guidelines for the diagnosis and management of intravascular catheter-related infection: 2009 Update by the Infectious Diseases Society of America. Clin Infect Dis 2009; 49(1):1–45. doi:10.1086/599376

Peer-reviewers for 2018
We thank those who reviewed manuscripts submitted to the Cleveland Clinic Journal of Medicine in 2018. Reviewing papers for the Journal—both for specialty content and for relevance to our readership—is an arduous task that involves considerable time and effort. Our publication decisions depend in no small part on the timely efforts of reviewers, and we are indebted to them for contributing their expertise this past year.
—Brian F. Mandell, MD, PhD, Editor in Chief
Patient, Caregiver, and Clinician Perspectives on Expectations for Home Healthcare after Discharge: A Qualitative Case Study
Patients who are discharged from the hospital with home healthcare (HHC) are older, sicker, and more likely to be readmitted to the hospital than patients discharged home without HHC.1-3 Communication between clinicians in different settings is a key factor in successful transitions. In prior work, we focused on communication between primary care providers, hospitalists, and HHC nurses to inform efforts to improve care transitions.4,5 In one study, HHC nurses described that patients frequently have expectations beyond the scope of what skilled HHC provides,5 which prompted us to also question experiences of patients and caregivers after discharge with skilled HHC (eg, nursing and physical therapy).
In a prior qualitative study by Foust and colleagues, HHC patients and caregivers described disparate experiences around preparation for hospital discharge—patients expressed knowing about the timing and plans for discharge, and the caregivers frequently felt left out of this discussion.6 In other studies, caregivers of recently discharged patients have described feeling excluded from interactions with clinicians both before and after discharge.7,8 In another recent qualitative study, caregivers described uncertainty about their role compared with the HHC role in caring for the patient.9
As of 2016, a majority of states had passed the Caregiver Advise, Record, and Enable (CARE) Act, which requires hospitals to (1) record a family caregiver in the medical record, (2) inform this caregiver about discharge, and (3) deliver instructions with education about medical tasks that they will need to complete after discharge.10
METHODS
Study Design
In this qualitative descriptive case study, we interviewed HHC patients, an involved caregiver, and the HHC clinician completing the first HHC visit within 7-14 days following hospital discharge. We chose this timeframe to allow patients to receive one or more HHC visits following hospital discharge.
Population
- >65 years old,12 eligibility was initially limited to patients
- >65 years old. Due to recruitment challenges, the age range was broadened to
- >50 years old in October 2017.
Because our goal was to better understand the experience of general medicine patients with multiple comorbidities, we recruited patients from one general medicine unit at an academic hospital in Colorado. Patients on this unit were screened for eligibility Monday-Friday (excluding weekends and holidays) based on research assistant availability.
Criteria included are as follows: HHC referral, three or more comorbidities, resides in the community prior to admission (ie, not in a facility), cognitively intact, English speaking, and able to identify a caregiver participating in their care. Eligible patients were approached for written consent prior to discharge to allow us to contact them 7-14 days after discharge for an interview by phone or in their home, per their preference. At the time of consent, patients provided contact information for their informal caregiver. Caregiver eligibility criteria included the following: age ≥18 years and provides caregiving at least one hour a week before hospital discharge. HHC clinicians approached for interviews had completed the first HHC visit for the patient following discharge. Both caregivers and HHC clinicians provided verbal consent for interviews. All participants received a $25 gift card for participation in the study.
Framework and Data Collection
Our interview guides were organized by the Agency for Healthcare Research and Quality Care Coordination Framework, an approach we have taken in prior work.4,5,13 We added questions about patient preparation and self-management support to build on findings from a prior study with HHC nurses and on prior work by Coleman and colleagues.5,14 Sample questions from the interview guides for patients, caregivers, and HHC clinicians within key analysis domains are included in Appendix 1. The patient and caregiver interviews were completed by an individual with prior experience in social work and healthcare (SS). The HHC clinician interviews were completed by either this individual (SS) or a physician-researcher with experience in qualitative methods (CJ). Patients and caregivers could choose to be interviewed individually or together. All interviews were digitally recorded and transcribed verbatim.
Analysis
Patient interviews lasted an average of 43 minutes, caregiver interviews an average of 41 minutes, and HHC clinician interviews an average of 25 minutes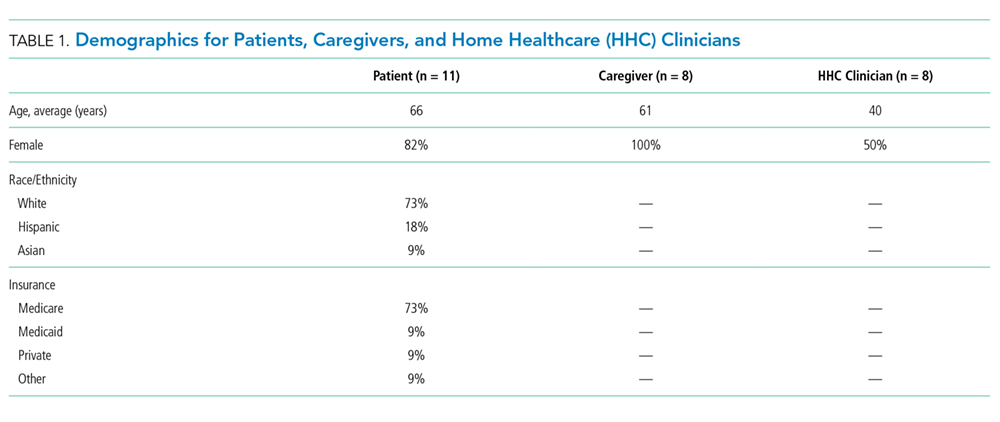
We observed the two main themes of clear and unclear expectations for HHC after discharge. Clear expectations occur when the patient and/or caregiver have expectations for HHC that align with the services they receive. Unclear expectations occur when the patient and/or caregiver expectations are either uncertain or misaligned with the services they receive. Although not all interviews yielded codes about clear or unclear expectations, patients described clear expectations in five cases and unclear expectations in another five cases.
In nine cases with more than one perspective available, expectations were compared within cases and found to be clear (three cases), unclear (three cases), or discordant (three cases) across perspectives. For the discordant cases, the description of clear and unclear expectations differed between patients and either their caregiver or their HHC clinician. Patients and caregivers with clear expectations for HHC frequently described prior experiences with skilled HHC or work experience within the healthcare field. In most cases with unclear expectations, the patient and caregiver did not have prior experience with HHC. In addition, the desire for assistance with personal care for patients such as showering and housekeeping was described by caregivers with unclear expectations. The results are organized into clear, unclear, and discordant expectations from the perspectives of patients, caregivers, and HHC clinicians within cases.
Clear Expectations within Cases
Clear expectations for HHC were identified across perspectives in three cases, with sample quotes provided in Table 2. In the case of patient 1, the patient and HHC nurse had known each other for over two years because the patient had a wound requiring long-term HHC services. A caregiver did not complete an interview in this case. With patient 2, the patient, caregiver, and HHC physical therapist (PT) all describe that the patient had clear expectations for HHC. In this case, the patient and caregiver describe feeling prepared because of previously receiving HHC, prior work experience in the healthcare field, and a caregiver with experience working in HHC. In the case of patient 3, the patient had previously received HHC from the same HHC nurse.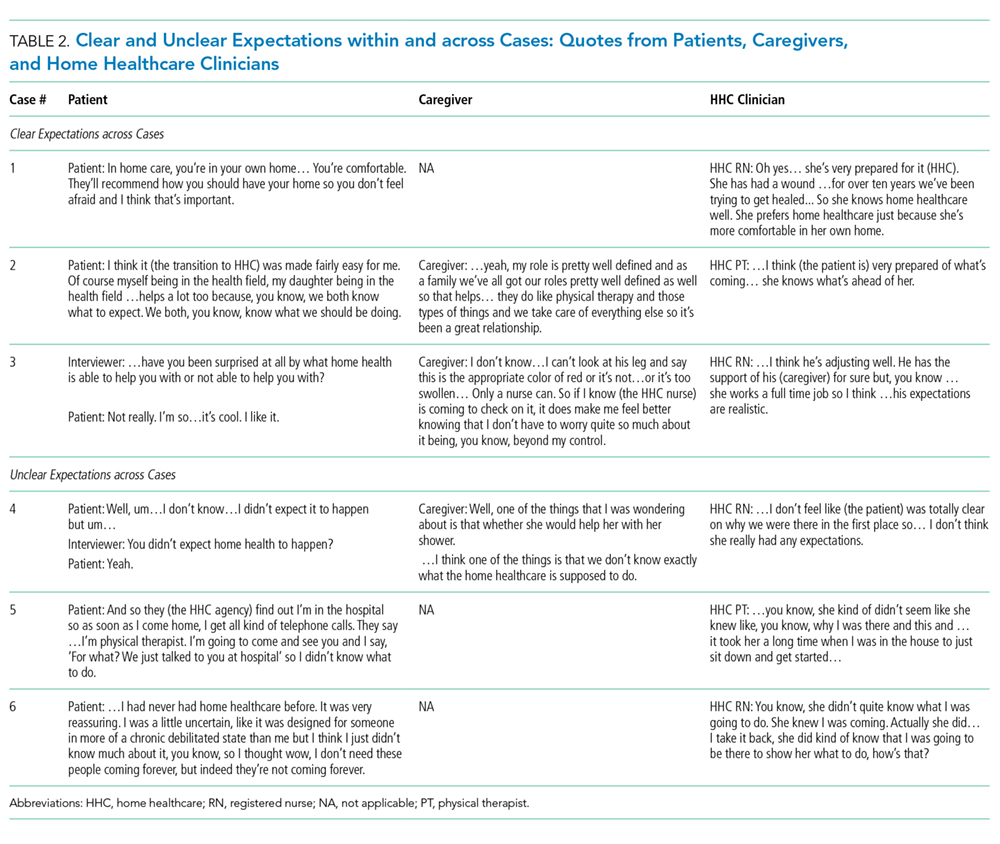
Unclear Expectations across Cases
For the three cases in which unclear expectations were described across perspectives, two of the patients described being new to HHC, with representative quotes in Table 2. Patient 4 and her caregiver are new to HHC and describe unclear expectations for both the HHC referral and the HHC role, which was also noted by the HHC clinician. Of note, the caregiver for patient 4 further described that she was unable to be present for the first HHC visit. In the case of patient 5, although the patient had previously received HHC, the patient describes not knowing why the HHC PT needs to see her after discharge, which is also noted by the HHC PT. Finally, both patient 6 and her HHC PT describe that the patient was not sure about their expectations for HHC and that HHC was a new experience for them.
Discordant Expectation Clarity across Cases
In three of the cases, the description of clear and unclear expectations was discrepant across roles. In case 7, the caregiver and patient are new to HHC and express different perspectives about expectations for HHC. The HHC clinician, in this case, did not complete an interview. The caregiver describes not being present for the first HHC visit and no awareness that the patient was being discharged with HHC:
Caregiver: Well, we didn’t even know she had home health until she got home.
The same caregiver also expresses unclear expectations for HHC:
Caregiver: It’s pretty cloudy. They (the HHC clinicians) don’t help her with her laundry, they don’t help with the housekeeping, they don’t help… with her showers so somebody is there when she showers. They don’t do anything. The only two things like I said is the…home healthcare comes in on Wednesdays to see what she needs and then the therapy comes in one day a week.
However, the patient expresses more clear expectations that are being met by HHC.
Patient: They (HHC) have met my expectations. They come in twice a week. They do vitals, take vitals and discuss with me, you know, what my feelings are, how I’m doing and I know they have met my expectations.
In case 8, although the patient describes knowing about the HHC PT involvement in her care, she expresses some unclear expectations about an HHC nurse after discharge.
Patient: As far as home health, I didn’t have a real …plan there at the hospital… They knew about (the HHC PT) coming once a week but as far as, you know, a nurse coming by to check on me, no.
However, the HHC PT describes feeling that the patient had clear expectations for HHC after discharge:
Interviewer: Can you reflect on whether she was prepared to receive home healthcare?
HHC PT: Yeah, she was ready.
Interviewer: …do you feel like she was prepared to know what to expect from you?
HHC PT: Yeah, but I think that comes from being a previous patient also.
Finally, in case 9, the patient describes clear expectations for HHC even though they were new to HHC:
Patient: …I knew what the PT was going to do and …I still need her because I’ve lost so much weight so she’s been really good, instrumental, at giving me exercises… Occupational therapist…she’s going to teach me how to shave, she’s going to teach me how to get ready for the day.
The HHC PT describes that although the patient knew the PT role, they reflect that the patient may have been somewhat unclear about expectations for the first HHC visit:
HHC PT: He knew all that it entailed with the exception of he didn’t really know what the first day was going to be like and the first day I don’t usually do treatment because it does take a long time to get all the paperwork signed, to do the evaluation and the fact that it takes two hours to do that note.
DISCUSSION
In this qualitative case study with HHC patients, caregivers, and clinicians, the participants described varying levels of expectation clarity for HHC after discharge. We triangulated across and within cases and found three cases with clear expectations and three cases with unclear expectations for HHC across perspectives. In three additional cases, we found discordant expectations across perspectives: patients and HHC clinician expectations differed in two of the cases and a patient and caregiver differed in one case. Of interest, in all three cases of clear expectations across perspectives, the patients and/or caregivers had prior HHC or healthcare work experience. In contrast,
Prior studies in this area have included a qualitative study HHC patients, caregivers, and clinicians by Foust and colleagues in which multiple caregivers described finding out about the discharge from the patient or other caregivers, rather than being actively engaged by clinicians.6 In another recent qualitative study by Arbaje and colleagues, a majority of caregivers described “mismatched expectations” about HHC services, in which caregivers
When caregivers have unclear expectations for HHC, they could be expressing the need for more support after hospital discharge, which suggests an active role for hospital teams to assess and address additional support needs with the patients and caregivers. For example, if the patient or caregiver request additional personal care services, a home health aide could help to reduce caregiver burden and improve the support network for the patient. In a prior study in which patients were asked what would help them to make informed decisions about postacute care options, the patients described wanting to receive practical information that could describe how it would apply to their specific situation and perceived needs.18 To provide this for patients and caregivers, it would follow that hospitals could provide information about skilled HHC nursing and therapies and information about services that could meet additional needs, such as home health aides.
Limitations of this study include that it was a small qualitative case study of patients, caregivers, and HHC clinicians from one medical unit at one academic medical center. Most patients in this study had Medicare insurance, were 65 years and older, white, and female.
In conclusion, to improve care transitions for HHC patients and their caregivers, emphasizing engagement of caregivers is key to ensure that they are educated about HHC, provided with additional support as needed, and included in initial HHC visits once the patients are at home. Even though patients and caregivers with prior HHC experience often had clear expectations for HHC, a strategy to uniformly engage caregivers across a range of experience can ensure caregivers have all the information and support needed to optimize care transitions to HHC.
Disclosures
The authors have nothing to disclose.
Funding
Dr. Christine Jones is supported by grant number K08HS024569 from the Agency for Healthcare Research and Quality. Jason Falvey was supported by grant F31AG056069 from the National Institute on Aging, National Institutes of Health and is currently supported by T32AG019134. The content is solely the responsibility of the authors and does not necessarily represent the official views of the Agency for Healthcare Research and Quality or the National Institutes of Health.
1. Jones CD, Wald HL, Boxer RS, et al. Characteristics associated with home health care referrals at hospital discharge: results from the 2012 National Inpatient Sample. Health Serv Res. 2017;52(2):879-894. doi: 10.1111/1475-6773. PubMed
2. Avalere Health. Home Health Chartbook 2015: Prepared for the Alliance for Home Health Quality and Innovation. 2016.
3. Hospital Compare. https://www.medicare.gov/hospitalcompare/search.html. Accessed May 1, 2017.
4. Jones CD, Vu MB, O’Donnell CM, et al. A failure to communicate: a qualitative exploration of care coordination between hospitalists and primary care providers around patient hospitalizations. J Gen Intern Med. 2015;30(4):417-424. doi: 10.1007/s11606-014-3056-x. PubMed
5. Jones CD, Jones J, Richard A, et al. “Connecting the dots”: a qualitative study of home health nurse perspectives on coordinating care for recently discharged patients. J Gen Intern Med. 2017;32(10):1114-1121. doi: 10.1007/s11606-017-4104-0. PubMed
6. Foust JB, Vuckovic N, Henriquez E. Hospital to home health care transition: patient, caregiver, and clinician perspectives. West J Nurs Res. 2012;34(2):194-212. doi: 10.1177/0193945911400448. PubMed
7. Blair J, Volpe M, Aggarwal B. Challenges, needs, and experiences of recently hospitalized cardiac patients and their informal caregivers. J Cardiovasc Nurs. 2014;29(1):29-37. doi: 10.1097/JCN.0b013e3182784123. PubMed
8. Coleman EA, Roman SP. Family caregivers’ experiences during transitions out of hospital. J Healthc Qual. 2015;37(1):12-21. doi: 10.1097/01.JHQ.0000460117.83437.b3. PubMed
9. Arbaje AI, Hughes A, Werner N, et al. Information management goals and process failures during home visits for middle-aged and older adults receiving skilled home healthcare services after hospital discharge: a multisite, qualitative study. BMJ Qual Saf. 2018. doi: 10.1136/bmjqs-2018-008163. PubMed
10. Coleman EA. Family caregivers as partners in care transitions: the caregiver advise record and enable act. J Hosp Med. 2016;11(12):883-885. doi: 10.1002/jhm.2637. PubMed
11. Jones AL, Harris-Kojetin L, Valverde R. Characteristics and use of home health care by men and women aged 65 and over. Natl Health Stat Report. 2012(52):1-7. PubMed
12. Tian W. An all-payer view of hospital discharge to postacute care, 2013. HCUP Statistical Brief #205. Rockville, Maryland; 2016. PubMed
13. McDonald KM, Sundaram V, Bravata DM, et al. Closing the Quality Gap: A Critical Analysis of Quality Improvement Strategies (Vol. 7: Care Coordination). Rockville, Maryland; 2007. PubMed
14. Coleman EA, Smith JD, Frank JC, Eilertsen TB, Thiare JN, Kramer AM. Development and testing of a measure designed to assess the quality of care transitions. Int J Integr Care. 2002;2:e02. doi: 10.5334/ijic.60. PubMed
15. Jones J, Nowels CT, Sudore R, Ahluwalia S, Bekelman DB. The future as a series of transitions: qualitative study of heart failure patients and their informal caregivers. J Gen Intern Med. 2015;30(2):176-182. doi: 10.1007/s11606-014-3085-5. PubMed
16. Lum HD, Jones J, Lahoff D, et al. Unique challenges of hospice for patients with heart failure: a qualitative study of hospice clinicians. Am Heart J. 2015;170(3):524-530 e523. doi: 10.1016/j.ahj.2015.06.019. PubMed
17. Kerr C, Nixon A, Wild D. Assessing and demonstrating data saturation in qualitative inquiry supporting patient-reported outcomes research. Expert Rev Pharmacoecon Outcomes Res. 2010;10(3):269-281. doi: 10.1586/erp.10.30. PubMed
18. Sefcik JS, Nock RH, Flores EJ, et al. Patient preferences for information on post-acute care services. Res Gerontol Nurs. 2016;9(4):175-182. doi: 10.3928/19404921-20160120-01. PubMed
19. Coleman EA, Roman SP, Hall KA, Min SJ. Enhancing the care transitions intervention protocol to better address the needs of family caregivers. J Healthc Qual. 2015;37(1):2-11. doi: 10.1097/01.JHQ.0000460118.60567.fe. PubMed
Patients who are discharged from the hospital with home healthcare (HHC) are older, sicker, and more likely to be readmitted to the hospital than patients discharged home without HHC.1-3 Communication between clinicians in different settings is a key factor in successful transitions. In prior work, we focused on communication between primary care providers, hospitalists, and HHC nurses to inform efforts to improve care transitions.4,5 In one study, HHC nurses described that patients frequently have expectations beyond the scope of what skilled HHC provides,5 which prompted us to also question experiences of patients and caregivers after discharge with skilled HHC (eg, nursing and physical therapy).
In a prior qualitative study by Foust and colleagues, HHC patients and caregivers described disparate experiences around preparation for hospital discharge—patients expressed knowing about the timing and plans for discharge, and the caregivers frequently felt left out of this discussion.6 In other studies, caregivers of recently discharged patients have described feeling excluded from interactions with clinicians both before and after discharge.7,8 In another recent qualitative study, caregivers described uncertainty about their role compared with the HHC role in caring for the patient.9
As of 2016, a majority of states had passed the Caregiver Advise, Record, and Enable (CARE) Act, which requires hospitals to (1) record a family caregiver in the medical record, (2) inform this caregiver about discharge, and (3) deliver instructions with education about medical tasks that they will need to complete after discharge.10
METHODS
Study Design
In this qualitative descriptive case study, we interviewed HHC patients, an involved caregiver, and the HHC clinician completing the first HHC visit within 7-14 days following hospital discharge. We chose this timeframe to allow patients to receive one or more HHC visits following hospital discharge.
Population
- >65 years old,12 eligibility was initially limited to patients
- >65 years old. Due to recruitment challenges, the age range was broadened to
- >50 years old in October 2017.
Because our goal was to better understand the experience of general medicine patients with multiple comorbidities, we recruited patients from one general medicine unit at an academic hospital in Colorado. Patients on this unit were screened for eligibility Monday-Friday (excluding weekends and holidays) based on research assistant availability.
Criteria included are as follows: HHC referral, three or more comorbidities, resides in the community prior to admission (ie, not in a facility), cognitively intact, English speaking, and able to identify a caregiver participating in their care. Eligible patients were approached for written consent prior to discharge to allow us to contact them 7-14 days after discharge for an interview by phone or in their home, per their preference. At the time of consent, patients provided contact information for their informal caregiver. Caregiver eligibility criteria included the following: age ≥18 years and provides caregiving at least one hour a week before hospital discharge. HHC clinicians approached for interviews had completed the first HHC visit for the patient following discharge. Both caregivers and HHC clinicians provided verbal consent for interviews. All participants received a $25 gift card for participation in the study.
Framework and Data Collection
Our interview guides were organized by the Agency for Healthcare Research and Quality Care Coordination Framework, an approach we have taken in prior work.4,5,13 We added questions about patient preparation and self-management support to build on findings from a prior study with HHC nurses and on prior work by Coleman and colleagues.5,14 Sample questions from the interview guides for patients, caregivers, and HHC clinicians within key analysis domains are included in Appendix 1. The patient and caregiver interviews were completed by an individual with prior experience in social work and healthcare (SS). The HHC clinician interviews were completed by either this individual (SS) or a physician-researcher with experience in qualitative methods (CJ). Patients and caregivers could choose to be interviewed individually or together. All interviews were digitally recorded and transcribed verbatim.
Analysis
Patient interviews lasted an average of 43 minutes, caregiver interviews an average of 41 minutes, and HHC clinician interviews an average of 25 minutes
We observed the two main themes of clear and unclear expectations for HHC after discharge. Clear expectations occur when the patient and/or caregiver have expectations for HHC that align with the services they receive. Unclear expectations occur when the patient and/or caregiver expectations are either uncertain or misaligned with the services they receive. Although not all interviews yielded codes about clear or unclear expectations, patients described clear expectations in five cases and unclear expectations in another five cases.
In nine cases with more than one perspective available, expectations were compared within cases and found to be clear (three cases), unclear (three cases), or discordant (three cases) across perspectives. For the discordant cases, the description of clear and unclear expectations differed between patients and either their caregiver or their HHC clinician. Patients and caregivers with clear expectations for HHC frequently described prior experiences with skilled HHC or work experience within the healthcare field. In most cases with unclear expectations, the patient and caregiver did not have prior experience with HHC. In addition, the desire for assistance with personal care for patients such as showering and housekeeping was described by caregivers with unclear expectations. The results are organized into clear, unclear, and discordant expectations from the perspectives of patients, caregivers, and HHC clinicians within cases.
Clear Expectations within Cases
Clear expectations for HHC were identified across perspectives in three cases, with sample quotes provided in Table 2. In the case of patient 1, the patient and HHC nurse had known each other for over two years because the patient had a wound requiring long-term HHC services. A caregiver did not complete an interview in this case. With patient 2, the patient, caregiver, and HHC physical therapist (PT) all describe that the patient had clear expectations for HHC. In this case, the patient and caregiver describe feeling prepared because of previously receiving HHC, prior work experience in the healthcare field, and a caregiver with experience working in HHC. In the case of patient 3, the patient had previously received HHC from the same HHC nurse.
Unclear Expectations across Cases
For the three cases in which unclear expectations were described across perspectives, two of the patients described being new to HHC, with representative quotes in Table 2. Patient 4 and her caregiver are new to HHC and describe unclear expectations for both the HHC referral and the HHC role, which was also noted by the HHC clinician. Of note, the caregiver for patient 4 further described that she was unable to be present for the first HHC visit. In the case of patient 5, although the patient had previously received HHC, the patient describes not knowing why the HHC PT needs to see her after discharge, which is also noted by the HHC PT. Finally, both patient 6 and her HHC PT describe that the patient was not sure about their expectations for HHC and that HHC was a new experience for them.
Discordant Expectation Clarity across Cases
In three of the cases, the description of clear and unclear expectations was discrepant across roles. In case 7, the caregiver and patient are new to HHC and express different perspectives about expectations for HHC. The HHC clinician, in this case, did not complete an interview. The caregiver describes not being present for the first HHC visit and no awareness that the patient was being discharged with HHC:
Caregiver: Well, we didn’t even know she had home health until she got home.
The same caregiver also expresses unclear expectations for HHC:
Caregiver: It’s pretty cloudy. They (the HHC clinicians) don’t help her with her laundry, they don’t help with the housekeeping, they don’t help… with her showers so somebody is there when she showers. They don’t do anything. The only two things like I said is the…home healthcare comes in on Wednesdays to see what she needs and then the therapy comes in one day a week.
However, the patient expresses more clear expectations that are being met by HHC.
Patient: They (HHC) have met my expectations. They come in twice a week. They do vitals, take vitals and discuss with me, you know, what my feelings are, how I’m doing and I know they have met my expectations.
In case 8, although the patient describes knowing about the HHC PT involvement in her care, she expresses some unclear expectations about an HHC nurse after discharge.
Patient: As far as home health, I didn’t have a real …plan there at the hospital… They knew about (the HHC PT) coming once a week but as far as, you know, a nurse coming by to check on me, no.
However, the HHC PT describes feeling that the patient had clear expectations for HHC after discharge:
Interviewer: Can you reflect on whether she was prepared to receive home healthcare?
HHC PT: Yeah, she was ready.
Interviewer: …do you feel like she was prepared to know what to expect from you?
HHC PT: Yeah, but I think that comes from being a previous patient also.
Finally, in case 9, the patient describes clear expectations for HHC even though they were new to HHC:
Patient: …I knew what the PT was going to do and …I still need her because I’ve lost so much weight so she’s been really good, instrumental, at giving me exercises… Occupational therapist…she’s going to teach me how to shave, she’s going to teach me how to get ready for the day.
The HHC PT describes that although the patient knew the PT role, they reflect that the patient may have been somewhat unclear about expectations for the first HHC visit:
HHC PT: He knew all that it entailed with the exception of he didn’t really know what the first day was going to be like and the first day I don’t usually do treatment because it does take a long time to get all the paperwork signed, to do the evaluation and the fact that it takes two hours to do that note.
DISCUSSION
In this qualitative case study with HHC patients, caregivers, and clinicians, the participants described varying levels of expectation clarity for HHC after discharge. We triangulated across and within cases and found three cases with clear expectations and three cases with unclear expectations for HHC across perspectives. In three additional cases, we found discordant expectations across perspectives: patients and HHC clinician expectations differed in two of the cases and a patient and caregiver differed in one case. Of interest, in all three cases of clear expectations across perspectives, the patients and/or caregivers had prior HHC or healthcare work experience. In contrast,
Prior studies in this area have included a qualitative study HHC patients, caregivers, and clinicians by Foust and colleagues in which multiple caregivers described finding out about the discharge from the patient or other caregivers, rather than being actively engaged by clinicians.6 In another recent qualitative study by Arbaje and colleagues, a majority of caregivers described “mismatched expectations” about HHC services, in which caregivers
When caregivers have unclear expectations for HHC, they could be expressing the need for more support after hospital discharge, which suggests an active role for hospital teams to assess and address additional support needs with the patients and caregivers. For example, if the patient or caregiver request additional personal care services, a home health aide could help to reduce caregiver burden and improve the support network for the patient. In a prior study in which patients were asked what would help them to make informed decisions about postacute care options, the patients described wanting to receive practical information that could describe how it would apply to their specific situation and perceived needs.18 To provide this for patients and caregivers, it would follow that hospitals could provide information about skilled HHC nursing and therapies and information about services that could meet additional needs, such as home health aides.
Limitations of this study include that it was a small qualitative case study of patients, caregivers, and HHC clinicians from one medical unit at one academic medical center. Most patients in this study had Medicare insurance, were 65 years and older, white, and female.
In conclusion, to improve care transitions for HHC patients and their caregivers, emphasizing engagement of caregivers is key to ensure that they are educated about HHC, provided with additional support as needed, and included in initial HHC visits once the patients are at home. Even though patients and caregivers with prior HHC experience often had clear expectations for HHC, a strategy to uniformly engage caregivers across a range of experience can ensure caregivers have all the information and support needed to optimize care transitions to HHC.
Disclosures
The authors have nothing to disclose.
Funding
Dr. Christine Jones is supported by grant number K08HS024569 from the Agency for Healthcare Research and Quality. Jason Falvey was supported by grant F31AG056069 from the National Institute on Aging, National Institutes of Health and is currently supported by T32AG019134. The content is solely the responsibility of the authors and does not necessarily represent the official views of the Agency for Healthcare Research and Quality or the National Institutes of Health.
1. Jones CD, Wald HL, Boxer RS, et al. Characteristics associated with home health care referrals at hospital discharge: results from the 2012 National Inpatient Sample. Health Serv Res. 2017;52(2):879-894. doi: 10.1111/1475-6773. PubMed
2. Avalere Health. Home Health Chartbook 2015: Prepared for the Alliance for Home Health Quality and Innovation. 2016.
3. Hospital Compare. https://www.medicare.gov/hospitalcompare/search.html. Accessed May 1, 2017.
4. Jones CD, Vu MB, O’Donnell CM, et al. A failure to communicate: a qualitative exploration of care coordination between hospitalists and primary care providers around patient hospitalizations. J Gen Intern Med. 2015;30(4):417-424. doi: 10.1007/s11606-014-3056-x. PubMed
5. Jones CD, Jones J, Richard A, et al. “Connecting the dots”: a qualitative study of home health nurse perspectives on coordinating care for recently discharged patients. J Gen Intern Med. 2017;32(10):1114-1121. doi: 10.1007/s11606-017-4104-0. PubMed
6. Foust JB, Vuckovic N, Henriquez E. Hospital to home health care transition: patient, caregiver, and clinician perspectives. West J Nurs Res. 2012;34(2):194-212. doi: 10.1177/0193945911400448. PubMed
7. Blair J, Volpe M, Aggarwal B. Challenges, needs, and experiences of recently hospitalized cardiac patients and their informal caregivers. J Cardiovasc Nurs. 2014;29(1):29-37. doi: 10.1097/JCN.0b013e3182784123. PubMed
8. Coleman EA, Roman SP. Family caregivers’ experiences during transitions out of hospital. J Healthc Qual. 2015;37(1):12-21. doi: 10.1097/01.JHQ.0000460117.83437.b3. PubMed
9. Arbaje AI, Hughes A, Werner N, et al. Information management goals and process failures during home visits for middle-aged and older adults receiving skilled home healthcare services after hospital discharge: a multisite, qualitative study. BMJ Qual Saf. 2018. doi: 10.1136/bmjqs-2018-008163. PubMed
10. Coleman EA. Family caregivers as partners in care transitions: the caregiver advise record and enable act. J Hosp Med. 2016;11(12):883-885. doi: 10.1002/jhm.2637. PubMed
11. Jones AL, Harris-Kojetin L, Valverde R. Characteristics and use of home health care by men and women aged 65 and over. Natl Health Stat Report. 2012(52):1-7. PubMed
12. Tian W. An all-payer view of hospital discharge to postacute care, 2013. HCUP Statistical Brief #205. Rockville, Maryland; 2016. PubMed
13. McDonald KM, Sundaram V, Bravata DM, et al. Closing the Quality Gap: A Critical Analysis of Quality Improvement Strategies (Vol. 7: Care Coordination). Rockville, Maryland; 2007. PubMed
14. Coleman EA, Smith JD, Frank JC, Eilertsen TB, Thiare JN, Kramer AM. Development and testing of a measure designed to assess the quality of care transitions. Int J Integr Care. 2002;2:e02. doi: 10.5334/ijic.60. PubMed
15. Jones J, Nowels CT, Sudore R, Ahluwalia S, Bekelman DB. The future as a series of transitions: qualitative study of heart failure patients and their informal caregivers. J Gen Intern Med. 2015;30(2):176-182. doi: 10.1007/s11606-014-3085-5. PubMed
16. Lum HD, Jones J, Lahoff D, et al. Unique challenges of hospice for patients with heart failure: a qualitative study of hospice clinicians. Am Heart J. 2015;170(3):524-530 e523. doi: 10.1016/j.ahj.2015.06.019. PubMed
17. Kerr C, Nixon A, Wild D. Assessing and demonstrating data saturation in qualitative inquiry supporting patient-reported outcomes research. Expert Rev Pharmacoecon Outcomes Res. 2010;10(3):269-281. doi: 10.1586/erp.10.30. PubMed
18. Sefcik JS, Nock RH, Flores EJ, et al. Patient preferences for information on post-acute care services. Res Gerontol Nurs. 2016;9(4):175-182. doi: 10.3928/19404921-20160120-01. PubMed
19. Coleman EA, Roman SP, Hall KA, Min SJ. Enhancing the care transitions intervention protocol to better address the needs of family caregivers. J Healthc Qual. 2015;37(1):2-11. doi: 10.1097/01.JHQ.0000460118.60567.fe. PubMed
© 2019 Society of Hospital Medicine
Outpatient Parenteral Antimicrobial Therapy in Vulnerable Populations—People Who Inject Drugs and the Homeless
Outpatient parenteral antimicrobial therapy (OPAT) programs allow patients to receive antibiotic therapy at home or in other settings.1-3 Bacterial infections among people who inject drugs (PWID) and the homeless are common, leading to complicated treatment strategies. Those with opioid dependence have frequent hospitalizations.4 Bacteremia and endocarditis frequently require intravenous (IV) antibiotics5-7 and may be difficult to treat. Creating outpatient treatment plans for PWID and the homeless is challenging, and there is a paucity of data on OPAT effectiveness in these groups as they are often excluded from OPAT services.1,2,8
We evaluated treatment outcomes in PWID and the homeless in our OPAT program.
METHODS
We conducted a retrospective cohort study of hospitalized adults discharged from Harborview Medical Center (HMC) with OPAT from January 1, 2015 to April 30, 2016. HMC is a county hospital in Seattle, Washington, affiliated with the University of Washington (UW). Infectious disease specialists supervise our OPAT program and provide follow-up care. We partner with a medical respite facility, a discharge option for homeless patients.9 Respite is staffed by HMC nurses, mental health specialists, and case managers.
Patients aged >18 years were enrolled in OPAT if they were discharged with >2 weeks of IV therapy or required laboratory monitoring while on oral antibiotics. Patients with multiple hospitalizations were included for their initial OPAT encounter only. PWID discharged to respite were instructed not to use their vascular access to inject drugs, but drug abstinence was not required. A tamper-evident sticker was placed over lines that nurses evaluated daily. Patients violating line-tampering restrictions were discharged from respite, and OPAT providers developed alternative antibiotic plans.
The two primary exposures evaluated were patient-reported injection drug use and housing status, and our primary exposure measure was the four-category combination: (1) housed non-PWID, (2) housed PWID, (3) homeless non-PWID, and (4) homeless PWID. Current drug use was defined as use within three months of hospitalization. Homelessness was defined as lack of stable housing. Patients receiving chemotherapy, prolonged steroids, biologic agents, or those with organ transplant were considered immunocompromised.
The primary outcome was clinical cure, defined as completion of antibiotic therapy and resolution of infection, determined by OPAT providers. Patients who were placed on oral suppressive antibiotics or died before treatment completion were considered not cured. Unknown status, including care transfer and lost to follow-up, were noted separately. Lost to follow-up was assumed if patients did not return for care, their care was not formally transferred, and no other medical information was available.
Secondary outcomes included hospital length of stay (LOS), secondary bacteremia, line-tampering, and 30-day readmissions. Secondary bacteremia was defined as bacteremia with a different pathogen from the index illness, which occurred during the initial treatment course. Readmission included readmissions related to OPAT (ie, recurrent or worsening infection, treatment-related toxicities, line-tampering, secondary bacteremia, and line-associated complications).
Data collection was performed using REDCap, a data-capturing software program linked to the electronic medical record (EMR).10 Hospitalization dates and demographics were electronically populated from the EMR. Details regarding drug use, homelessness, comorbidities, diagnosis, discharge complications, clinical cure, and lost to follow-up were manually entered.
Statistical Analysis
Statistical calculations were performed using SAS (v. 9.4). Chi-square testing and analysis of variance were conducted to assess group differences in demographics, infection types, and clinical outcomes.
Primary and secondary outcomes were further evaluated by univariable logistic regression and presented as odds ratios, with the non-PWID housed group serving as the reference. Given the large number of PWID and homeless patients lost to follow-up, sensitivity analyses were conducted using the assumption that patients with unknown clinical outcomes did not achieve cure (ie, chronic infection or death). Multivariable regression was performed on the outcomes of cure and 30-day readmission to OPAT using backward elimination to select a final model, initially including potential confounders of age, sex, and relevant comorbidities (DM and HIV). We assumed that those lost to follow-up were not cured (or readmitted). Other secondary outcomes were either rare events or those of uncertain relevance (eg, hospital LOS) to be evaluated in the multivariable analysis.
Our study did not meet the definition of research by the UW’s institutional review board. It was a quality improvement project funded by a UW Medicine Patient Safety Innovations Program Grant.
RESULTS
Overall, 596 patients received OPAT over 16 months. OPAT patients were categorized into groups as follows: homeless PWID (9%, n = 53), housed PWID (8%, n = 48), homeless non-PWID (8%, n = 45), and housed non-PWID (75%, n = 450).
PWID were younger than non-PWID, and the majority of patients in all groups were men (Table 1). PWID were more likely to have hepatitis C. Non-PWID appeared more likely to have diabetes and be immunosuppressed.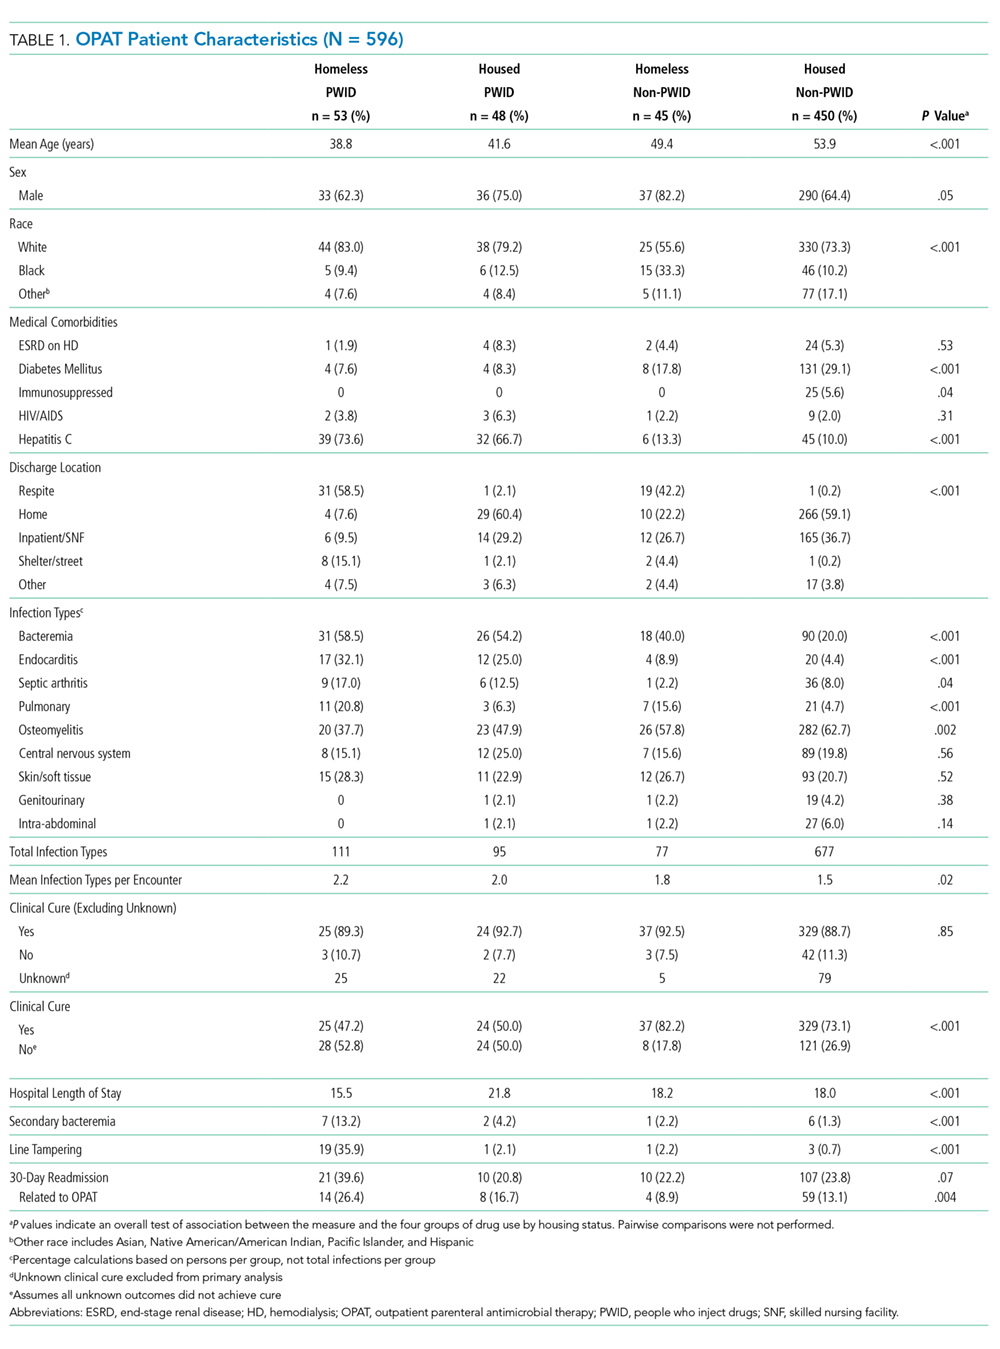
Patients had a total of 960 types of infection (Table 1). Bacteremia was the most common infection among PWID. Osteomyelitis was the most frequent infection in non-PWID.
Discharge location varied widely (P < .001; Table 1). The majority of patients with housing (housed PWID 60.4%, housed non-PWID 59.1%) were discharged to home, although 36.7% of housed non-PWID went to nursing facilities. Among homeless patients, 58.5% of PWID and 42.2% of non-PWID were discharged to respite; 10 patients were discharged to a shelter or street. Data specific to transition from IV to oral therapy were not recorded.
Cure rates among participants with known outcomes did not differ by group (Table 1; P = .85). In a sensitivity analysis of clinical cure, assuming those with unknown outcomes were not cured, housing status and drug use were significantly associated with cure (Table 1; P < .001, in the overall test), with rates lower among housed and homeless PWID groups (50.0% and 47.2%, respectively) compared with housed and homeless non-PWID groups (73.1% and 82.2%, respectively). In the multivariable analysis after backward elimination of noninfluential measures, only PWID and housing status were associated with cure; PWID, whether housed (OR = 0.37) or not (OR = 0.33), had lower odds of cure relative to housed non-PWID (Table 2).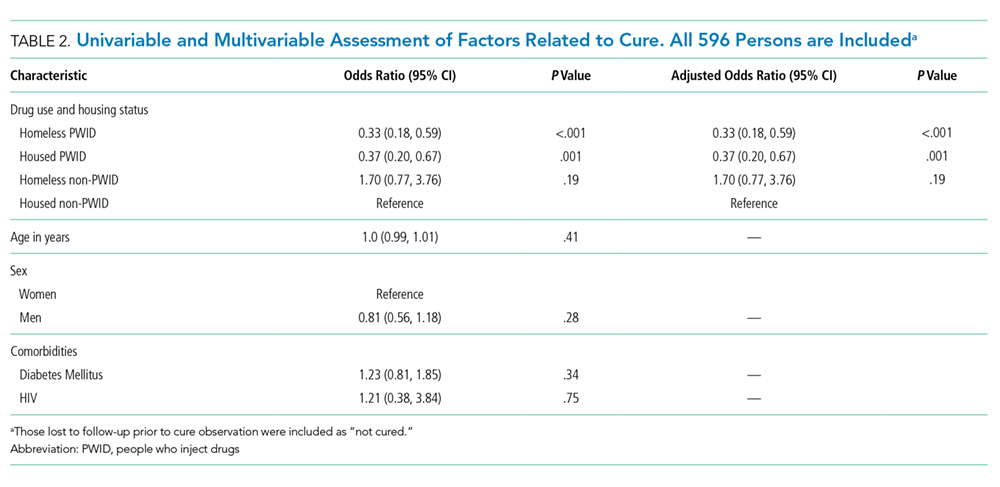
Secondary outcomes, evaluated on all patients regardless of cure, differed by group (Table 1). Mean LOS appeared to be shortest for homeless PWID (15.5 days versus ≥18.0 for other groups; P < .001 for overall test). Homeless PWID patients appeared more likely to have secondary bacteremia (13.2% versus <4.2% in other groups; P < .001 for overall test), line tampering (35.9% versus <2.2% in other groups; P < .001), and 30-day readmission related to OPAT (26.4% versus <16.7% in other groups; P = .004). Compared with housed non-PWID using logistic regression, homeless PWID had a higher risk of secondary bacteremia (OR = 12.9; 95% CI 3.8-37.8; P < .001), line tampering (OR 88.4; 95% CI 24.5-318.3; P < .001), and readmission for OPAT (OR 2.4; 95% CI 1.2-4.6; P = .007). After adjusting for age, sex, and comorbidities, readmission for OPAT remained elevated in homeless PWID (OR = 2.4; 95% CI 1.2-4.6). No significant differences in secondary outcomes were found between housed non-PWID and also between housed PWID and homeless non-PWID.
Among homeless persons, discharge to respite care was not associated with improved outcomes, assuming those lost to follow-up did not achieve cure. Among non-PWID discharged to respite, the cure rate was 74% (14/19) compared with 88% (23/26) discharged elsewhere (P = .20). Among PWID, 48% (15/31) discharged to respite were cured compared with 45% (10/22) discharged elsewhere (P = .83).
DISCUSSION
Our study compares the outcomes of 596 OPAT patients, including PWID and the homeless. Among those retained in care, PWID achieved similar rates of cure compared with non-PWID groups. When assuming that all lost to follow-up had poor outcomes, the cure rates were markedly lower for PWID, with no difference noted by housing status.
Data on PWID and homeless enrolled in OPAT programs are limited.5,11,12 Few studies have reported the outcomes of infections in PWID and the homeless, as these populations often experience significant loss to follow-up due to transiency, lack of care continuity, and effective means of communication.
Cure was achieved in less than half of PWID, when lack of cure was assumed for unknown outcomes. This rate was substantially less than that for non-PWID groups. The assumption that those lost to follow-up did not achieve cure dramatically alters the inference; the truth may lie somewhere between the primary and sensitivity analyses. Homeless PWID remained at the highest risk for lost to follow-up, secondary bacteremia, line-tampering, and 30-day readmission related to OPAT.
PWID have traditionally been considered as a high-risk group for OPAT,1,2,8 but to completely restrict PWID from OPAT may not be appropriate. Ho et al. studied 29 PWID who were selectively enrolled to receive OPAT, and 28 completed IV therapy without any instances of line-tampering, death, or unknown clinical status.6 Recent literature suggests that some candidates can succeed with OPAT, despite drug use.13,14
Homelessness is also considered a barrier to OPAT.1,8 Medical respite is a harm-reduction model implemented for patients who require subacute care.9 In our study, among homeless patients, PWID status was the primary determinant of whether therapy was successful, rather than respite care.
Our study may have limited generalizability to other populations. We are a single-center facility in a large, urban city. PWID and housing status were self-reported but were verified before discharge. Most of our patients were men and white; thus, outcomes may differ for others. Due to the nature of the data, cost effectiveness could not be directly calculated. LOS and readmissions serve as proxy measures.
When patients remain engaged in care, PWID and the homeless achieved comparable clinical cure rates to those of housed non-PWID. Moving forward, OPAT can be more effective in PWID and the homeless with careful patient selection and close clinical support. Access to medication-assisted therapy, such as methadone or buprenorphine,15 may improve follow-up rates and linkage to outpatient care. Additional treatment strategies to improve retention in and adherence to care may promote successful outcomes in these vulnerable populations.
Disclosures
Presented at the Poster Abstract Session: Clinical Practice Issues at ID Week, October 26–30, 2016, New Orleans, LA. No conflicts of interested related to this work for all authors.
Funding
AW and AM received NIH NIAID grant K24 AI 071113-06 and UW Medicine Patient Safety Innovations Program Grant.
1. Tice, AD, Rehm SJ, Dalovisio JR, et al. Practice guidelines for outpatient parenteral antimicrobial therapy. IDSA guidelines. Clin Infect Dis. 2004; 38(12):1651-1672. doi: 10.1086/420939. PubMed
2. Williams DN, Baker CA, Kind AC, Sannes MR. The history and evolution of outpatient parenteral antibiotic therapy (OPAT). Int J Antimicrob Agents. 2015;46(3):307-312. doi: 10.1016/j.ijantimicag.2015.07.001. PubMed
3. Gilchrist M, Seaton RA. Outpatient parenteral antimicrobial therapy and antimicrobial stewardship: challenges and checklists. J Antimicrob Chemother. 2015;70(4);965-970. doi: 10.1093/jac/dku517. PubMed
4. Ronan MV, Herzig SJ. Hospitalizations related to opioid abuse/dependence and associated serious infections from 2002-2012. Health Aff (Milwood). 2016;35(5):832-837. doi: 10.1377/hlthaff.2015.1424. PubMed
5. Beieler AM, Dellit TH, Chan JD, et al. Successful implementation of outpatient parenteral antibiotic therapy at a medical respite facility for homeless patients. J Hosp Med. 2016;11(8):531-535. doi: 10.1002/jhm.2597. PubMed
6. Ho J, Archuleta S, Sulaiman Z, Fisher D. Safe and successful treatment of intravenous drug users with a peripherally inserted central catheter in an outpatient parenteral antibiotic treatment service. J Antimicrob Chemother. 2010;65:2641-2644. doi: 10.1093/jac/dkq355. PubMed
7. Suleyman G, Kenney R, Zervos MJ, Weinmann A. Safety and efficacy of outpatient parenteral antibiotic therapy in an academic infectious disease clinic. J Clin Pharm Ther. 2017;42(1):39-43. doi: 10.1111/jcpt.12465. PubMed
8. Bhavan KP, Brown LS, Haley RW. Self-administered outpatient antimicrobial infusion by uninsured patients discharged from a safety-net hospital: a propensity-score-balanced retrospective cohort study. PLoS Med. 2015;12(12):e1001922. doi: 10.1371/journal.pmed. PubMed
9. Seattle-King County Medical Respite. https://www.kingcounty.gov/depts/health/locations/homeless-health/healthcare-for-the-homeless/services/medical-respite.aspx. Accessed October 2, 2018.
10. Harris PA, Taylor R, Thielke R, et al. Research electronic data capture (REDCap) – a metadata-driven methodology and workflow process for providing translational research informatics support. J Biomed Inform. 2009;42:377-3781. doi: 10.1016/j.jbi.2008.08.010. PubMed
11. Buerhle DJ, Shields RK, Shah N, Shoff C, Sheridan K. Risk factors associated with outpatient parenteral antibiotic therapy program failure among intravenous drug users. Open Forum Infect Dis.2017;4(3):ofx102. doi: 10.1093/ofid/ofx102. PubMed
12. Hernandez W, Price C, Knepper B, McLees M, Young H. Outpatient parenteral antimicrobial therapy administration in a homeless population. J Infus Nurs. 2016;39(2):81-85. doi: 10.1097/NAN.0000000000000165. PubMed
13. Sukuki J, Johnson J, Montgomery M, Hayden M, Price C. Outpatient parenteral antimicrobial therapy among people who inject drugs: a review of the literature. Open Forum Infect Dis. 2018;5(9):ofy194. doi: 10.1093/ofid/ofy194. PubMed
14. D’Couto HT, Robbins GK, Ard KL, Wakeman SE, Alves J, Nelson SB. Outcomes according to discharge location for persons who inject drugs receiving outpatient parenteral antimicrobial therapy. Open Forum Infect Dis. 2018;5(5):ofy056. doi: 10.1093/ofid/ofy056. PubMed
15. Rosenthal ES, Karchmer AW, Theisen-Toupal J, Castillo RA, Rowley CF. Suboptimal addiction interventions for patients hospitalized with injection drug use-associated infective endocarditis. Am J Med. 2016;129(5):481-485. doi: 10.1016/j.amjmed.2015.09.024. PubMed
Outpatient parenteral antimicrobial therapy (OPAT) programs allow patients to receive antibiotic therapy at home or in other settings.1-3 Bacterial infections among people who inject drugs (PWID) and the homeless are common, leading to complicated treatment strategies. Those with opioid dependence have frequent hospitalizations.4 Bacteremia and endocarditis frequently require intravenous (IV) antibiotics5-7 and may be difficult to treat. Creating outpatient treatment plans for PWID and the homeless is challenging, and there is a paucity of data on OPAT effectiveness in these groups as they are often excluded from OPAT services.1,2,8
We evaluated treatment outcomes in PWID and the homeless in our OPAT program.
METHODS
We conducted a retrospective cohort study of hospitalized adults discharged from Harborview Medical Center (HMC) with OPAT from January 1, 2015 to April 30, 2016. HMC is a county hospital in Seattle, Washington, affiliated with the University of Washington (UW). Infectious disease specialists supervise our OPAT program and provide follow-up care. We partner with a medical respite facility, a discharge option for homeless patients.9 Respite is staffed by HMC nurses, mental health specialists, and case managers.
Patients aged >18 years were enrolled in OPAT if they were discharged with >2 weeks of IV therapy or required laboratory monitoring while on oral antibiotics. Patients with multiple hospitalizations were included for their initial OPAT encounter only. PWID discharged to respite were instructed not to use their vascular access to inject drugs, but drug abstinence was not required. A tamper-evident sticker was placed over lines that nurses evaluated daily. Patients violating line-tampering restrictions were discharged from respite, and OPAT providers developed alternative antibiotic plans.
The two primary exposures evaluated were patient-reported injection drug use and housing status, and our primary exposure measure was the four-category combination: (1) housed non-PWID, (2) housed PWID, (3) homeless non-PWID, and (4) homeless PWID. Current drug use was defined as use within three months of hospitalization. Homelessness was defined as lack of stable housing. Patients receiving chemotherapy, prolonged steroids, biologic agents, or those with organ transplant were considered immunocompromised.
The primary outcome was clinical cure, defined as completion of antibiotic therapy and resolution of infection, determined by OPAT providers. Patients who were placed on oral suppressive antibiotics or died before treatment completion were considered not cured. Unknown status, including care transfer and lost to follow-up, were noted separately. Lost to follow-up was assumed if patients did not return for care, their care was not formally transferred, and no other medical information was available.
Secondary outcomes included hospital length of stay (LOS), secondary bacteremia, line-tampering, and 30-day readmissions. Secondary bacteremia was defined as bacteremia with a different pathogen from the index illness, which occurred during the initial treatment course. Readmission included readmissions related to OPAT (ie, recurrent or worsening infection, treatment-related toxicities, line-tampering, secondary bacteremia, and line-associated complications).
Data collection was performed using REDCap, a data-capturing software program linked to the electronic medical record (EMR).10 Hospitalization dates and demographics were electronically populated from the EMR. Details regarding drug use, homelessness, comorbidities, diagnosis, discharge complications, clinical cure, and lost to follow-up were manually entered.
Statistical Analysis
Statistical calculations were performed using SAS (v. 9.4). Chi-square testing and analysis of variance were conducted to assess group differences in demographics, infection types, and clinical outcomes.
Primary and secondary outcomes were further evaluated by univariable logistic regression and presented as odds ratios, with the non-PWID housed group serving as the reference. Given the large number of PWID and homeless patients lost to follow-up, sensitivity analyses were conducted using the assumption that patients with unknown clinical outcomes did not achieve cure (ie, chronic infection or death). Multivariable regression was performed on the outcomes of cure and 30-day readmission to OPAT using backward elimination to select a final model, initially including potential confounders of age, sex, and relevant comorbidities (DM and HIV). We assumed that those lost to follow-up were not cured (or readmitted). Other secondary outcomes were either rare events or those of uncertain relevance (eg, hospital LOS) to be evaluated in the multivariable analysis.
Our study did not meet the definition of research by the UW’s institutional review board. It was a quality improvement project funded by a UW Medicine Patient Safety Innovations Program Grant.
RESULTS
Overall, 596 patients received OPAT over 16 months. OPAT patients were categorized into groups as follows: homeless PWID (9%, n = 53), housed PWID (8%, n = 48), homeless non-PWID (8%, n = 45), and housed non-PWID (75%, n = 450).
PWID were younger than non-PWID, and the majority of patients in all groups were men (Table 1). PWID were more likely to have hepatitis C. Non-PWID appeared more likely to have diabetes and be immunosuppressed.
Patients had a total of 960 types of infection (Table 1). Bacteremia was the most common infection among PWID. Osteomyelitis was the most frequent infection in non-PWID.
Discharge location varied widely (P < .001; Table 1). The majority of patients with housing (housed PWID 60.4%, housed non-PWID 59.1%) were discharged to home, although 36.7% of housed non-PWID went to nursing facilities. Among homeless patients, 58.5% of PWID and 42.2% of non-PWID were discharged to respite; 10 patients were discharged to a shelter or street. Data specific to transition from IV to oral therapy were not recorded.
Cure rates among participants with known outcomes did not differ by group (Table 1; P = .85). In a sensitivity analysis of clinical cure, assuming those with unknown outcomes were not cured, housing status and drug use were significantly associated with cure (Table 1; P < .001, in the overall test), with rates lower among housed and homeless PWID groups (50.0% and 47.2%, respectively) compared with housed and homeless non-PWID groups (73.1% and 82.2%, respectively). In the multivariable analysis after backward elimination of noninfluential measures, only PWID and housing status were associated with cure; PWID, whether housed (OR = 0.37) or not (OR = 0.33), had lower odds of cure relative to housed non-PWID (Table 2).
Secondary outcomes, evaluated on all patients regardless of cure, differed by group (Table 1). Mean LOS appeared to be shortest for homeless PWID (15.5 days versus ≥18.0 for other groups; P < .001 for overall test). Homeless PWID patients appeared more likely to have secondary bacteremia (13.2% versus <4.2% in other groups; P < .001 for overall test), line tampering (35.9% versus <2.2% in other groups; P < .001), and 30-day readmission related to OPAT (26.4% versus <16.7% in other groups; P = .004). Compared with housed non-PWID using logistic regression, homeless PWID had a higher risk of secondary bacteremia (OR = 12.9; 95% CI 3.8-37.8; P < .001), line tampering (OR 88.4; 95% CI 24.5-318.3; P < .001), and readmission for OPAT (OR 2.4; 95% CI 1.2-4.6; P = .007). After adjusting for age, sex, and comorbidities, readmission for OPAT remained elevated in homeless PWID (OR = 2.4; 95% CI 1.2-4.6). No significant differences in secondary outcomes were found between housed non-PWID and also between housed PWID and homeless non-PWID.
Among homeless persons, discharge to respite care was not associated with improved outcomes, assuming those lost to follow-up did not achieve cure. Among non-PWID discharged to respite, the cure rate was 74% (14/19) compared with 88% (23/26) discharged elsewhere (P = .20). Among PWID, 48% (15/31) discharged to respite were cured compared with 45% (10/22) discharged elsewhere (P = .83).
DISCUSSION
Our study compares the outcomes of 596 OPAT patients, including PWID and the homeless. Among those retained in care, PWID achieved similar rates of cure compared with non-PWID groups. When assuming that all lost to follow-up had poor outcomes, the cure rates were markedly lower for PWID, with no difference noted by housing status.
Data on PWID and homeless enrolled in OPAT programs are limited.5,11,12 Few studies have reported the outcomes of infections in PWID and the homeless, as these populations often experience significant loss to follow-up due to transiency, lack of care continuity, and effective means of communication.
Cure was achieved in less than half of PWID, when lack of cure was assumed for unknown outcomes. This rate was substantially less than that for non-PWID groups. The assumption that those lost to follow-up did not achieve cure dramatically alters the inference; the truth may lie somewhere between the primary and sensitivity analyses. Homeless PWID remained at the highest risk for lost to follow-up, secondary bacteremia, line-tampering, and 30-day readmission related to OPAT.
PWID have traditionally been considered as a high-risk group for OPAT,1,2,8 but to completely restrict PWID from OPAT may not be appropriate. Ho et al. studied 29 PWID who were selectively enrolled to receive OPAT, and 28 completed IV therapy without any instances of line-tampering, death, or unknown clinical status.6 Recent literature suggests that some candidates can succeed with OPAT, despite drug use.13,14
Homelessness is also considered a barrier to OPAT.1,8 Medical respite is a harm-reduction model implemented for patients who require subacute care.9 In our study, among homeless patients, PWID status was the primary determinant of whether therapy was successful, rather than respite care.
Our study may have limited generalizability to other populations. We are a single-center facility in a large, urban city. PWID and housing status were self-reported but were verified before discharge. Most of our patients were men and white; thus, outcomes may differ for others. Due to the nature of the data, cost effectiveness could not be directly calculated. LOS and readmissions serve as proxy measures.
When patients remain engaged in care, PWID and the homeless achieved comparable clinical cure rates to those of housed non-PWID. Moving forward, OPAT can be more effective in PWID and the homeless with careful patient selection and close clinical support. Access to medication-assisted therapy, such as methadone or buprenorphine,15 may improve follow-up rates and linkage to outpatient care. Additional treatment strategies to improve retention in and adherence to care may promote successful outcomes in these vulnerable populations.
Disclosures
Presented at the Poster Abstract Session: Clinical Practice Issues at ID Week, October 26–30, 2016, New Orleans, LA. No conflicts of interested related to this work for all authors.
Funding
AW and AM received NIH NIAID grant K24 AI 071113-06 and UW Medicine Patient Safety Innovations Program Grant.
1. Tice, AD, Rehm SJ, Dalovisio JR, et al. Practice guidelines for outpatient parenteral antimicrobial therapy. IDSA guidelines. Clin Infect Dis. 2004; 38(12):1651-1672. doi: 10.1086/420939. PubMed
2. Williams DN, Baker CA, Kind AC, Sannes MR. The history and evolution of outpatient parenteral antibiotic therapy (OPAT). Int J Antimicrob Agents. 2015;46(3):307-312. doi: 10.1016/j.ijantimicag.2015.07.001. PubMed
3. Gilchrist M, Seaton RA. Outpatient parenteral antimicrobial therapy and antimicrobial stewardship: challenges and checklists. J Antimicrob Chemother. 2015;70(4);965-970. doi: 10.1093/jac/dku517. PubMed
4. Ronan MV, Herzig SJ. Hospitalizations related to opioid abuse/dependence and associated serious infections from 2002-2012. Health Aff (Milwood). 2016;35(5):832-837. doi: 10.1377/hlthaff.2015.1424. PubMed
5. Beieler AM, Dellit TH, Chan JD, et al. Successful implementation of outpatient parenteral antibiotic therapy at a medical respite facility for homeless patients. J Hosp Med. 2016;11(8):531-535. doi: 10.1002/jhm.2597. PubMed
6. Ho J, Archuleta S, Sulaiman Z, Fisher D. Safe and successful treatment of intravenous drug users with a peripherally inserted central catheter in an outpatient parenteral antibiotic treatment service. J Antimicrob Chemother. 2010;65:2641-2644. doi: 10.1093/jac/dkq355. PubMed
7. Suleyman G, Kenney R, Zervos MJ, Weinmann A. Safety and efficacy of outpatient parenteral antibiotic therapy in an academic infectious disease clinic. J Clin Pharm Ther. 2017;42(1):39-43. doi: 10.1111/jcpt.12465. PubMed
8. Bhavan KP, Brown LS, Haley RW. Self-administered outpatient antimicrobial infusion by uninsured patients discharged from a safety-net hospital: a propensity-score-balanced retrospective cohort study. PLoS Med. 2015;12(12):e1001922. doi: 10.1371/journal.pmed. PubMed
9. Seattle-King County Medical Respite. https://www.kingcounty.gov/depts/health/locations/homeless-health/healthcare-for-the-homeless/services/medical-respite.aspx. Accessed October 2, 2018.
10. Harris PA, Taylor R, Thielke R, et al. Research electronic data capture (REDCap) – a metadata-driven methodology and workflow process for providing translational research informatics support. J Biomed Inform. 2009;42:377-3781. doi: 10.1016/j.jbi.2008.08.010. PubMed
11. Buerhle DJ, Shields RK, Shah N, Shoff C, Sheridan K. Risk factors associated with outpatient parenteral antibiotic therapy program failure among intravenous drug users. Open Forum Infect Dis.2017;4(3):ofx102. doi: 10.1093/ofid/ofx102. PubMed
12. Hernandez W, Price C, Knepper B, McLees M, Young H. Outpatient parenteral antimicrobial therapy administration in a homeless population. J Infus Nurs. 2016;39(2):81-85. doi: 10.1097/NAN.0000000000000165. PubMed
13. Sukuki J, Johnson J, Montgomery M, Hayden M, Price C. Outpatient parenteral antimicrobial therapy among people who inject drugs: a review of the literature. Open Forum Infect Dis. 2018;5(9):ofy194. doi: 10.1093/ofid/ofy194. PubMed
14. D’Couto HT, Robbins GK, Ard KL, Wakeman SE, Alves J, Nelson SB. Outcomes according to discharge location for persons who inject drugs receiving outpatient parenteral antimicrobial therapy. Open Forum Infect Dis. 2018;5(5):ofy056. doi: 10.1093/ofid/ofy056. PubMed
15. Rosenthal ES, Karchmer AW, Theisen-Toupal J, Castillo RA, Rowley CF. Suboptimal addiction interventions for patients hospitalized with injection drug use-associated infective endocarditis. Am J Med. 2016;129(5):481-485. doi: 10.1016/j.amjmed.2015.09.024. PubMed
© 2019 Society of Hospital Medicine
Things We Do For No Reason: Sliding-Scale Insulin as Monotherapy for Glycemic Control in Hospitalized Patients
Inspired by the ABIM Foundation's Choosing Wisely campaign, the “Things We Do for No Reason” (TWDFNR) series reviews practices that have become common parts of hospital care but may provide little value to our patients. Practices reviewed in the TWDFNR series do not represent “black and white” conclusions or clinical practice standards but are meant as a starting place for research and active discussions among hospitalists and patients. We invite you to be part of that discussion. https://www.choosingwisely.org/
A CLINICAL SCENARIO
A 60-year-old man with a past medical history of obesity and type 2 diabetes presented to the emergency department with one week of myalgias and fever up to 103.5°F (39.7°C). Other vital signs were normal. He had no localizing symptoms, and physical examination was unrevealing, except for a small scab from a tick bite sustained two weeks prior to symptom onset. Before admission, he had been managing his diabetes with metformin 1,000 mg twice a day, and on arrival, his blood sugar level was 275 mg/dL. The admitting provider decided to hold the patient’s metformin and replace it with insulin per a sliding scale. Is monotherapy with sliding-scale insulin the best inpatient management option for this patient’s type 2 diabetes?
WHY YOU MIGHT THINK SLIDING-SCALE INSULIN AS MONOTHERAPY IS HELPFUL
The basic premise of sliding-scale insulin (SSI) is to correct hyperglycemia through the frequent administration of short-acting insulin dosed according to a patient’s blood glucose level with the help of a prespecified rubric. When blood glucose levels are low, patients receive little or no insulin, and when blood glucose levels are high, higher doses are given. This approach to inpatient blood glucose management was first popularized by Joslin in 1934,1 and it remains a common strategy today. For example, a 2007 survey of 44 hospitals in the United States showed that approximately 43% of all noncritically ill patients with hyperglycemia were treated with SSI alone.2 More recently, a single-center study showed that 30% of clinicians continued to use SSI as monotherapy even after the implementation of order sets designed to limit this practice.3
The rationale for SSI as monotherapy appears to have two components. First, guidelines suggest that certain patients should be screened periodically in the hospital for hyperglycemia (blood glucose persistently greater than 180 mg/dL) and that, if identified, hyperglycemia should be treated.4 By pairing finger-stick glucose monitoring with SSI, the diagnosis and treatment—although not the prevention—of hyperglycemia can be accomplished simultaneously. Second, inpatient providers do not want to cause harm in the form of hypoglycemia. SSI as monotherapy is sometimes viewed as a cautious approach in this regard as insulin is administered only if the blood sugar level is high.
Convenience is probably another key contributor to the enduring use of SSI as monotherapy. Several hospitals have ready-made order sets for SSI that are easier to prescribe than a patient-specific regimen including both short- and long-acting insulin. In at least one single-center survey, physicians and staff were found to favor convenience over perceived efficacy when asked about their attitudes toward inpatient glycemic control.5 Although efforts at individual hospitals to change practice patterns among residents have shown promise,6 reform on a broader scale remains elusive.
WHY SSI AS MONOTHERAPY IS NOT HELPFUL
SSI administration does not attempt to replicate normal pancreatic physiology, which involves basal insulin secretion to impair hepatic gluconeogenesis and meal-associated insulin spikes to promote uptake into glucose-avid tissues. SSI is a reactive strategy, not a proactive one, and perhaps unsurprisingly, to our knowledge, it has never been shown to prevent hyperglycemia in hospitalized patients, an impression corroborated by a systematic review of the topic between 1964 and 2003.7 More recently, one multicenter trial analyzed the effect of adding SSI to oral antihyperglycemic medications in hospitalized diabetics and found no differences in rates of hyperglycemia.8 Another study found that 84% of administered SSI doses failed to correct hyperglycemia.9
However, does adding basal insulin to SSI raise a patient’s risk of hypoglycemia? When basal insulin is dosed carefully, the answer appears to be no. In a trial in which diabetic long-term care residents who were receiving SSI at baseline were randomized to either continued SSI or basal-bolus insulin, the investigators found that the basal-bolus group experienced significantly lower average blood glucose levels without an increase in adverse glycemic events.10 Perhaps the most significant milestone to date, however, was the RABBIT 2 multicenter trial, published in 2007, that randomized hospitalized, insulin-naïve diabetics to either a weight-based regimen of basal and prandial insulin or SSI only.11 Rates of hypoglycemia and length of stay did not differ between the groups, and 66% of patients receiving basal-prandial insulin achieved their glycemic control target as opposed to just 38% of patients in the SSI-only group. The SSI group also required more total insulin. A weight-based, basal-bolus strategy was later proven to be similarly effective, without causing severe hypoglycemia, for patients undergoing surgery who could not maintain consistent oral alimentation.12 Basal-bolus insulin was associated with fewer surgical complications, and it produced a cost savings of $751 per day as determined by a post hoc comparative effectiveness study.13
Prolonged use of SSI as monotherapy may be not only ineffective but also harmful. Clearly, the absence of basal insulin will harm type 1 diabetics, who need basal insulin to prevent diabetic ketoacidosis. However, even for type 2 diabetics and nondiabetics, hyperglycemia has been established as a marker for adverse outcomes among hospitalized patients,14 and SSI monotherapy has been associated with a three-fold higher risk of hyperglycemia compared with the use of a sliding scale plus other forms of insulin.15 At least one other study has also linked this practice with a significantly increased length of stay compared with patients who were receiving insulin proactively.16 We believe that the potential for harm is difficult to disregard, especially because safer alternatives are available. Ultimately, it can be stated that in hospitalized patients with persistent hyperglycemia who require insulin, SSI alone should not be the preferred treatment choice regardless of whether the patient carries a known diagnosis of diabetes mellitus or has used insulin previously.
WHEN YOU MIGHT CONSIDER USING SSI AS MONOTHERAPY
As discussed above, there is no known clinical scenario in which SSI as monotherapy has been proven to be effective; however, the use of SSI as monotherapy as a short-term approach has not been well studied. Hospitalized patients who are at risk for adverse glycemic events should be monitored with periodic finger-stick blood glucose draws per guidelines, and in the first 24 hours, it may be reasonable to withhold basal insulin for insulin-naive patients, particularly if the medication reconciliation or other key components of the history are in doubt, or if there are risk factors for hypoglycemia such as a history of bariatric surgery. The amount of insulin received in the first 24 hours of such monitoring may inform subsequent insulin dosing, but this method of “dose finding” has not been validated in the literature.
Uncertain or interrupted alimentation status or stress hyperglycemia may complicate the assessment of a patient’s insulin needs. One of the insights from the RABBIT 2 surgery trial is that even with interrupted alimentation, patients on a weight-based, long-acting insulin regimen did not experience severe hypoglycemia. Nevertheless, if a patient without type 1 diabetes is felt to be at high risk for a severe hypoglycemic event, it may be prudent to withhold long-acting insulin. However, in that situation, adding SSI to finger-stick monitoring is unlikely to be beneficial. Cases of stress hyperglycemia in nondiabetics can also be challenging, as the persistence of hyperglycemia can be difficult to predict. Guidelines state that if hyperglycemia is persistent, then insulin therapy should be initiated and that this therapy is best accomplished in the form of a basal-prandial regimen.17
WHAT YOU SHOULD DO INSTEAD
Current guidelines from the American Diabetes Association17 and the American Association of Clinical Endocrinologists18 for hospitalized patients with hyperglycemia who require insulin recommend against the prolonged use of SSI as monotherapy (category A recommendation) and support the use of basal plus correctional insulin with the addition of nutritional insulin for patients with consistent oral intake (category A recommendation). Although a complete discourse on the determination of the appropriate starting dose of insulin is outside of the scope of this cas presentation, the basic approach begins with calculating a weight-based total daily dose of insulin, approximately half of which can be given as basal insulin with the remainder given with meals along with correctional insulin as needed to account for premeal hyperglycemia.4 For example, the protocol used in the RABBIT 2 trial, which involved known type 2 diabetics, started insulin based on a total daily dose of 0.4 units/kg for patients presenting with blood sugar levels ≤200 mg/dL and 0.5 units/kg for those with higher initial glucose levels.7 Half of the total daily dose was given as basal insulin, and the other half was divided among meals. Caution with insulin dosing may be required in patients aged >70 years, in those with impaired renal function, and in situations in which steroid doses are fluctuating. The Society of Hospital Medicine has formulated an online subcutaneous insulin order implementation guideline, eQUIPS, that can be a helpful resource to centers that are interested in changing their practice patterns.19
RECOMMENDATIONS
- Instead of using SSI monotherapy for hospitalized patients who require insulin, add basal and prandial insulin, using a weight-based approach if necessary for insulin-naive patients.
- Engage with leadership at your center to learn how inpatient hyperglycemia protocols and blood sugar management teams can help provide evidence-based and individualized treatment plans for your patients.
- If no infrastructure exists at your center, the Society of Hospital Medicine offers training and guidance through its eQUIPS inpatient hyperglycemia management program.
CONCLUSION
In the case presentation, the hyperglycemic patient whose metformin was on hold should have been started on a combination of basal and prandial insulin as determined by his weight and current renal function as opposed to monotherapy with SSI. Using SSI as monotherapy for hyperglycemia is a common practice, and although well-intentioned, it is an ineffective and possibly dangerous approach. Continued efforts must be made to address the gap between guidelines and suboptimal practice patterns locally and nationally.
Do you think this is a low-value practice? Is this truly a “Thing We Do for No Reason?” Share what you do in your practice and join in the conversation online by retweeting it on Twitter (#TWDFNR) and liking it on Facebook. We invite you to propose ideas for other “Things We Do for No Reason” topics by emailingTWDFNR@hospitalmedicine.org.
Acknowledgments
The authors would like to thank Dr. Asem Ali of the Division of Endocrinology at UMass Memorial Medical Center for his review of the manuscript.
Disclosures
The authors have nothing to disclose.
1. Joslin EP. A Diabetic Manual for the Mutual Use of Doctor and Patient. Philadelphia, PA: Lea & Febiger; 1934:108.
2. Wexler DJ, Meigs JB, Cagliero E, Nathan DM, Grant RW. Prevalence of hyper- and hypoglycemia among inpatients with diabetes: a national survey of 44 U.S. hospitals. Diabetes Care. 2007;30(2):367-369. doi: 10.2337/dc06-1715. PubMed
3. Valgardson JD, Merino M, Redgrave J, Hudson JI, Hudson MS. Effectiveness of inpatient insulin order sets using human insulins in noncritically ill patients in a rural hospital. Endocr Pract. 2015;21(7):794-806. doi: 10.4158/EP14153. PubMed
4. Clement S, Braithwaite SS, Magee MF, et al. Management of diabetes and hyperglycemia in hospitals. Diabetes Care. 2004;27(2):553-591. doi: 10.2337/diacare.27.2.553. PubMed
5. Beliard R, Muzykovsky K, Vincent W, 3rd, Shah B, Davanos E. Perceptions, barriers, and knowledge of inpatient glycemic control: a survey of health care workers. J Pharm Pract. 2016;29(4):348-354. doi: 10.1177/0897190014566309. PubMed
6. Baldwin D, Villanueva G, McNutt R, Bhatnagar S. Eliminating inpatient sliding-scale insulin: a reeducation project with medical house staff. Diabetes Care. 2005;28(5):1008-1011. doi: 10.2337/diacare.28.12.2987-a. PubMed
7. Browning LA, Dumo P. Sliding-scale insulin: an antiquated approach to glycemic control in hospitalized patients. Am J Health Syst Pharm. 2004;61(15):1611-1614. PubMed
8. Dickerson LM, Ye X, Sack JL, Hueston WJ. Glycemic control in medical inpatients with type 2 diabetes mellitus receiving sliding scale insulin regimens versus routine diabetes medications: a multicenter randomized controlled trial. Ann Fam Med. 2003;1(1):29-35. PubMed
9. Golightly LK, Jones MA, Hamamura DH, Stolpman NM, McDermott MT. Management of diabetes mellitus in hospitalized patients: efficiency and effectiveness of sliding-scale insulin therapy. Pharmacotherapy. 2006;26(10):1421-1432. doi: 10.1592/phco.26.10.1421. PubMed
10. Dharmarajan TS, Mahajan D, Zambrano A, et al. Sliding scale insulin vs basal-bolus insulin therapy in long-term care: a 21-day randomized controlled trial comparing efficacy, safety and feasibility. J Am Med Dir Assoc. 2016;17(3):206-213. doi: 10.1016/j.jamda.2015.08.015. PubMed
11. Umpierrez GE, Smiley D, Zisman A, et al. Randomized study of basal-bolus insulin therapy in the inpatient management of patients with type 2 diabetes (RABBIT 2 trial). Diabetes Care. 2007;30(9):2181-2186. doi: 10.2337/dc07-0295. PubMed
12. Umpierrez GE, Smiley D, Jacobs S, et al. Randomized study of basal-bolus insulin therapy in the inpatient management of patients with type 2 diabetes undergoing general surgery (RABBIT 2 surgery). Diabetes Care. 2011;34(2):256-261. doi: 10.2337/dc10-1407. PubMed
13. Phillips VL, Byrd AL, Adeel S, Peng L, Smiley DD, Umpierrez GE. A comparison of inpatient cost per day in general surgery patients with type 2 diabetes treated with basal-bolus versus sliding scale insulin regimens. Pharmacoecon Open. 2017;1(2):109-115. doi: 10.1007/s41669-017-0020-9.. PubMed
14. Umpierrez GE, Isaacs SD, Bazargan N, You X, Thaler LM, Kitabchi AE. Hyperglycemia: an independent marker of in-hospital mortality in patients with undiagnosed diabetes. J Clin Endocrinol Metab. 2002;87(3):978-982. doi: 10.1210/jcem.87.3.8341. PubMed
15. Queale WS, Seidler AJ, Brancati FL. Glycemic control and sliding scale insulin use in medical inpatients with diabetes mellitus. Arch Intern Med. 1997;157(5):545-552. PubMed
16. Gearhart JG, Duncan JL, 3rd, Replogle WH, Forbes RC, Walley EJ. Efficacy of sliding-scale insulin therapy: a comparison with prospective regimens. Fam Pract Res J. 1994;14(4):313-322. PubMed
17. American Diabetes A. 14. Diabetes care in the hospital: Standards of medical care in diabetes-2018. Diabetes Care. 2018;41(Suppl 1):S144-S151. doi: 10.2337/dc18-S014. PubMed
18. Moghissi ES, Korytkowski MT, DiNardo M, et al. American Association of Clinical Endocrinologists and American Diabetes Association consensus statement on inpatient glycemic control. Endocr Pract. 2009;15(4):353-369. doi: 10.2337/dc09-9029. PubMed
19. Maynard G, Wesorick DH, O’Malley C, Inzucchi SE, Society of Hospital Medicine Glycemic Control Task F. Subcutaneous insulin order sets and protocols: effective design and implementation strategies. J Hosp Med. 2008;3(5 Suppl):29-41. doi: 10.1002/jhm.354. PubMed
Inspired by the ABIM Foundation's Choosing Wisely campaign, the “Things We Do for No Reason” (TWDFNR) series reviews practices that have become common parts of hospital care but may provide little value to our patients. Practices reviewed in the TWDFNR series do not represent “black and white” conclusions or clinical practice standards but are meant as a starting place for research and active discussions among hospitalists and patients. We invite you to be part of that discussion. https://www.choosingwisely.org/
A CLINICAL SCENARIO
A 60-year-old man with a past medical history of obesity and type 2 diabetes presented to the emergency department with one week of myalgias and fever up to 103.5°F (39.7°C). Other vital signs were normal. He had no localizing symptoms, and physical examination was unrevealing, except for a small scab from a tick bite sustained two weeks prior to symptom onset. Before admission, he had been managing his diabetes with metformin 1,000 mg twice a day, and on arrival, his blood sugar level was 275 mg/dL. The admitting provider decided to hold the patient’s metformin and replace it with insulin per a sliding scale. Is monotherapy with sliding-scale insulin the best inpatient management option for this patient’s type 2 diabetes?
WHY YOU MIGHT THINK SLIDING-SCALE INSULIN AS MONOTHERAPY IS HELPFUL
The basic premise of sliding-scale insulin (SSI) is to correct hyperglycemia through the frequent administration of short-acting insulin dosed according to a patient’s blood glucose level with the help of a prespecified rubric. When blood glucose levels are low, patients receive little or no insulin, and when blood glucose levels are high, higher doses are given. This approach to inpatient blood glucose management was first popularized by Joslin in 1934,1 and it remains a common strategy today. For example, a 2007 survey of 44 hospitals in the United States showed that approximately 43% of all noncritically ill patients with hyperglycemia were treated with SSI alone.2 More recently, a single-center study showed that 30% of clinicians continued to use SSI as monotherapy even after the implementation of order sets designed to limit this practice.3
The rationale for SSI as monotherapy appears to have two components. First, guidelines suggest that certain patients should be screened periodically in the hospital for hyperglycemia (blood glucose persistently greater than 180 mg/dL) and that, if identified, hyperglycemia should be treated.4 By pairing finger-stick glucose monitoring with SSI, the diagnosis and treatment—although not the prevention—of hyperglycemia can be accomplished simultaneously. Second, inpatient providers do not want to cause harm in the form of hypoglycemia. SSI as monotherapy is sometimes viewed as a cautious approach in this regard as insulin is administered only if the blood sugar level is high.
Convenience is probably another key contributor to the enduring use of SSI as monotherapy. Several hospitals have ready-made order sets for SSI that are easier to prescribe than a patient-specific regimen including both short- and long-acting insulin. In at least one single-center survey, physicians and staff were found to favor convenience over perceived efficacy when asked about their attitudes toward inpatient glycemic control.5 Although efforts at individual hospitals to change practice patterns among residents have shown promise,6 reform on a broader scale remains elusive.
WHY SSI AS MONOTHERAPY IS NOT HELPFUL
SSI administration does not attempt to replicate normal pancreatic physiology, which involves basal insulin secretion to impair hepatic gluconeogenesis and meal-associated insulin spikes to promote uptake into glucose-avid tissues. SSI is a reactive strategy, not a proactive one, and perhaps unsurprisingly, to our knowledge, it has never been shown to prevent hyperglycemia in hospitalized patients, an impression corroborated by a systematic review of the topic between 1964 and 2003.7 More recently, one multicenter trial analyzed the effect of adding SSI to oral antihyperglycemic medications in hospitalized diabetics and found no differences in rates of hyperglycemia.8 Another study found that 84% of administered SSI doses failed to correct hyperglycemia.9
However, does adding basal insulin to SSI raise a patient’s risk of hypoglycemia? When basal insulin is dosed carefully, the answer appears to be no. In a trial in which diabetic long-term care residents who were receiving SSI at baseline were randomized to either continued SSI or basal-bolus insulin, the investigators found that the basal-bolus group experienced significantly lower average blood glucose levels without an increase in adverse glycemic events.10 Perhaps the most significant milestone to date, however, was the RABBIT 2 multicenter trial, published in 2007, that randomized hospitalized, insulin-naïve diabetics to either a weight-based regimen of basal and prandial insulin or SSI only.11 Rates of hypoglycemia and length of stay did not differ between the groups, and 66% of patients receiving basal-prandial insulin achieved their glycemic control target as opposed to just 38% of patients in the SSI-only group. The SSI group also required more total insulin. A weight-based, basal-bolus strategy was later proven to be similarly effective, without causing severe hypoglycemia, for patients undergoing surgery who could not maintain consistent oral alimentation.12 Basal-bolus insulin was associated with fewer surgical complications, and it produced a cost savings of $751 per day as determined by a post hoc comparative effectiveness study.13
Prolonged use of SSI as monotherapy may be not only ineffective but also harmful. Clearly, the absence of basal insulin will harm type 1 diabetics, who need basal insulin to prevent diabetic ketoacidosis. However, even for type 2 diabetics and nondiabetics, hyperglycemia has been established as a marker for adverse outcomes among hospitalized patients,14 and SSI monotherapy has been associated with a three-fold higher risk of hyperglycemia compared with the use of a sliding scale plus other forms of insulin.15 At least one other study has also linked this practice with a significantly increased length of stay compared with patients who were receiving insulin proactively.16 We believe that the potential for harm is difficult to disregard, especially because safer alternatives are available. Ultimately, it can be stated that in hospitalized patients with persistent hyperglycemia who require insulin, SSI alone should not be the preferred treatment choice regardless of whether the patient carries a known diagnosis of diabetes mellitus or has used insulin previously.
WHEN YOU MIGHT CONSIDER USING SSI AS MONOTHERAPY
As discussed above, there is no known clinical scenario in which SSI as monotherapy has been proven to be effective; however, the use of SSI as monotherapy as a short-term approach has not been well studied. Hospitalized patients who are at risk for adverse glycemic events should be monitored with periodic finger-stick blood glucose draws per guidelines, and in the first 24 hours, it may be reasonable to withhold basal insulin for insulin-naive patients, particularly if the medication reconciliation or other key components of the history are in doubt, or if there are risk factors for hypoglycemia such as a history of bariatric surgery. The amount of insulin received in the first 24 hours of such monitoring may inform subsequent insulin dosing, but this method of “dose finding” has not been validated in the literature.
Uncertain or interrupted alimentation status or stress hyperglycemia may complicate the assessment of a patient’s insulin needs. One of the insights from the RABBIT 2 surgery trial is that even with interrupted alimentation, patients on a weight-based, long-acting insulin regimen did not experience severe hypoglycemia. Nevertheless, if a patient without type 1 diabetes is felt to be at high risk for a severe hypoglycemic event, it may be prudent to withhold long-acting insulin. However, in that situation, adding SSI to finger-stick monitoring is unlikely to be beneficial. Cases of stress hyperglycemia in nondiabetics can also be challenging, as the persistence of hyperglycemia can be difficult to predict. Guidelines state that if hyperglycemia is persistent, then insulin therapy should be initiated and that this therapy is best accomplished in the form of a basal-prandial regimen.17
WHAT YOU SHOULD DO INSTEAD
Current guidelines from the American Diabetes Association17 and the American Association of Clinical Endocrinologists18 for hospitalized patients with hyperglycemia who require insulin recommend against the prolonged use of SSI as monotherapy (category A recommendation) and support the use of basal plus correctional insulin with the addition of nutritional insulin for patients with consistent oral intake (category A recommendation). Although a complete discourse on the determination of the appropriate starting dose of insulin is outside of the scope of this cas presentation, the basic approach begins with calculating a weight-based total daily dose of insulin, approximately half of which can be given as basal insulin with the remainder given with meals along with correctional insulin as needed to account for premeal hyperglycemia.4 For example, the protocol used in the RABBIT 2 trial, which involved known type 2 diabetics, started insulin based on a total daily dose of 0.4 units/kg for patients presenting with blood sugar levels ≤200 mg/dL and 0.5 units/kg for those with higher initial glucose levels.7 Half of the total daily dose was given as basal insulin, and the other half was divided among meals. Caution with insulin dosing may be required in patients aged >70 years, in those with impaired renal function, and in situations in which steroid doses are fluctuating. The Society of Hospital Medicine has formulated an online subcutaneous insulin order implementation guideline, eQUIPS, that can be a helpful resource to centers that are interested in changing their practice patterns.19
RECOMMENDATIONS
- Instead of using SSI monotherapy for hospitalized patients who require insulin, add basal and prandial insulin, using a weight-based approach if necessary for insulin-naive patients.
- Engage with leadership at your center to learn how inpatient hyperglycemia protocols and blood sugar management teams can help provide evidence-based and individualized treatment plans for your patients.
- If no infrastructure exists at your center, the Society of Hospital Medicine offers training and guidance through its eQUIPS inpatient hyperglycemia management program.
CONCLUSION
In the case presentation, the hyperglycemic patient whose metformin was on hold should have been started on a combination of basal and prandial insulin as determined by his weight and current renal function as opposed to monotherapy with SSI. Using SSI as monotherapy for hyperglycemia is a common practice, and although well-intentioned, it is an ineffective and possibly dangerous approach. Continued efforts must be made to address the gap between guidelines and suboptimal practice patterns locally and nationally.
Do you think this is a low-value practice? Is this truly a “Thing We Do for No Reason?” Share what you do in your practice and join in the conversation online by retweeting it on Twitter (#TWDFNR) and liking it on Facebook. We invite you to propose ideas for other “Things We Do for No Reason” topics by emailingTWDFNR@hospitalmedicine.org.
Acknowledgments
The authors would like to thank Dr. Asem Ali of the Division of Endocrinology at UMass Memorial Medical Center for his review of the manuscript.
Disclosures
The authors have nothing to disclose.
1. Joslin EP. A Diabetic Manual for the Mutual Use of Doctor and Patient. Philadelphia, PA: Lea & Febiger; 1934:108.
2. Wexler DJ, Meigs JB, Cagliero E, Nathan DM, Grant RW. Prevalence of hyper- and hypoglycemia among inpatients with diabetes: a national survey of 44 U.S. hospitals. Diabetes Care. 2007;30(2):367-369. doi: 10.2337/dc06-1715. PubMed
3. Valgardson JD, Merino M, Redgrave J, Hudson JI, Hudson MS. Effectiveness of inpatient insulin order sets using human insulins in noncritically ill patients in a rural hospital. Endocr Pract. 2015;21(7):794-806. doi: 10.4158/EP14153. PubMed
4. Clement S, Braithwaite SS, Magee MF, et al. Management of diabetes and hyperglycemia in hospitals. Diabetes Care. 2004;27(2):553-591. doi: 10.2337/diacare.27.2.553. PubMed
5. Beliard R, Muzykovsky K, Vincent W, 3rd, Shah B, Davanos E. Perceptions, barriers, and knowledge of inpatient glycemic control: a survey of health care workers. J Pharm Pract. 2016;29(4):348-354. doi: 10.1177/0897190014566309. PubMed
6. Baldwin D, Villanueva G, McNutt R, Bhatnagar S. Eliminating inpatient sliding-scale insulin: a reeducation project with medical house staff. Diabetes Care. 2005;28(5):1008-1011. doi: 10.2337/diacare.28.12.2987-a. PubMed
7. Browning LA, Dumo P. Sliding-scale insulin: an antiquated approach to glycemic control in hospitalized patients. Am J Health Syst Pharm. 2004;61(15):1611-1614. PubMed
8. Dickerson LM, Ye X, Sack JL, Hueston WJ. Glycemic control in medical inpatients with type 2 diabetes mellitus receiving sliding scale insulin regimens versus routine diabetes medications: a multicenter randomized controlled trial. Ann Fam Med. 2003;1(1):29-35. PubMed
9. Golightly LK, Jones MA, Hamamura DH, Stolpman NM, McDermott MT. Management of diabetes mellitus in hospitalized patients: efficiency and effectiveness of sliding-scale insulin therapy. Pharmacotherapy. 2006;26(10):1421-1432. doi: 10.1592/phco.26.10.1421. PubMed
10. Dharmarajan TS, Mahajan D, Zambrano A, et al. Sliding scale insulin vs basal-bolus insulin therapy in long-term care: a 21-day randomized controlled trial comparing efficacy, safety and feasibility. J Am Med Dir Assoc. 2016;17(3):206-213. doi: 10.1016/j.jamda.2015.08.015. PubMed
11. Umpierrez GE, Smiley D, Zisman A, et al. Randomized study of basal-bolus insulin therapy in the inpatient management of patients with type 2 diabetes (RABBIT 2 trial). Diabetes Care. 2007;30(9):2181-2186. doi: 10.2337/dc07-0295. PubMed
12. Umpierrez GE, Smiley D, Jacobs S, et al. Randomized study of basal-bolus insulin therapy in the inpatient management of patients with type 2 diabetes undergoing general surgery (RABBIT 2 surgery). Diabetes Care. 2011;34(2):256-261. doi: 10.2337/dc10-1407. PubMed
13. Phillips VL, Byrd AL, Adeel S, Peng L, Smiley DD, Umpierrez GE. A comparison of inpatient cost per day in general surgery patients with type 2 diabetes treated with basal-bolus versus sliding scale insulin regimens. Pharmacoecon Open. 2017;1(2):109-115. doi: 10.1007/s41669-017-0020-9.. PubMed
14. Umpierrez GE, Isaacs SD, Bazargan N, You X, Thaler LM, Kitabchi AE. Hyperglycemia: an independent marker of in-hospital mortality in patients with undiagnosed diabetes. J Clin Endocrinol Metab. 2002;87(3):978-982. doi: 10.1210/jcem.87.3.8341. PubMed
15. Queale WS, Seidler AJ, Brancati FL. Glycemic control and sliding scale insulin use in medical inpatients with diabetes mellitus. Arch Intern Med. 1997;157(5):545-552. PubMed
16. Gearhart JG, Duncan JL, 3rd, Replogle WH, Forbes RC, Walley EJ. Efficacy of sliding-scale insulin therapy: a comparison with prospective regimens. Fam Pract Res J. 1994;14(4):313-322. PubMed
17. American Diabetes A. 14. Diabetes care in the hospital: Standards of medical care in diabetes-2018. Diabetes Care. 2018;41(Suppl 1):S144-S151. doi: 10.2337/dc18-S014. PubMed
18. Moghissi ES, Korytkowski MT, DiNardo M, et al. American Association of Clinical Endocrinologists and American Diabetes Association consensus statement on inpatient glycemic control. Endocr Pract. 2009;15(4):353-369. doi: 10.2337/dc09-9029. PubMed
19. Maynard G, Wesorick DH, O’Malley C, Inzucchi SE, Society of Hospital Medicine Glycemic Control Task F. Subcutaneous insulin order sets and protocols: effective design and implementation strategies. J Hosp Med. 2008;3(5 Suppl):29-41. doi: 10.1002/jhm.354. PubMed
© 2018 Society of Hospital Medicine
Should the Diagnosis of UTI in Young Febrile Infants Require a Positive Urinalysis?
Reduction of antibiotic overuse is an important goal for improving the quality of care for children and is highlighted in many of the Choosing Wisely® recommendations across disciplines.1-3 However, the evidence supporting these recommendations vary widely and many are derived from expert opinion and clinical practice guidelines rather than from original research studies.2 In this issue of the Journal of Hospital Medicine, Schroeder and colleagues identify a potential area of antibiotic overuse among young febrile infants with possible urinary tract infection (UTI).4 A wide variation in antibiotic treatment rates (0%-35%) was observed across 124 hospitals in the United States for febrile infants 7-60 days of age with uropathogen detection by urine culture but a negative urinalysis (UA). Treated infants with a negative UA were more likely to be younger (7-30 days), have respiratory symptoms, and were less likely to have abnormal inflammatory markers than infants with a positive UA.
Clinicians faced with the decision of whether or not to treat a febrile infant with uropathogen detection in the setting of a negative UA must weigh the potential benefits and harms of antibiotic use in this population. Withholding antibiotics for a young infant with UTI may increase the risk of recurrent UTI and renal scarring,5,6 while antibiotic treatment in young infants can lead to the disruption of the gut microbiome, resulting in long-term consequences that are only beginning to be understood.7-10
The American Academy of Pediatrics (AAP) UTI practice parameter requires a positive UA to establish the diagnosis of UTI in children 2-24 months of age.11 This recommendation is based primarily on studies demonstrating that uropathogen detection in the setting of a negative UA commonly represents asymptomatic bacteriuria or contamination rather than true infection.12-14 This is supported by research showing that the UA demonstrates near perfect (>99%) sensitivity for UTI in children with bacteremic UTI,12,15 and studies demonstrating lower rates of subsequent urinary infections and renal injury among infants with uropathogen detection and a negative UA compared with those with uropathogen detection and a positive UA.13,14,16
An important question is whether febrile infants within the first two months of life with uropathogen detection should be treated with antimicrobials regardless of UA findings or specifically in the setting of a negative UA. The AAP practice guideline11 deliberately omits these young infants, recognizing that evidence derived from studies of older infants and children may not be applicable to this young age group, as they may not mount as robust an inflammatory response and thus may not demonstrate pyuria in the setting of a bacterial urinary infection. Schroeder et al. demonstrate lower rates of abnormal inflammatory markers in UA negative compared with UA positive infants, a finding the authors argue supports the possibility of asymptomatic bacteriuria or contamination rather than true infection.4 The counterargument is that young infants may not mount a significant inflammatory response to true infections.
The authors appropriately highlight the paucity of literature to help differentiate true infection from asymptomatic bacteriuria or contamination in infants less than two months of age. As infants in this age group are usually treated with antibiotics for a positive urine culture regardless of UA result, robust data on short- and long-term outcomes of untreated infants are lacking. Much of the existing literature evaluates the test performance of the UA for UTI using the urine culture as the reference standard, which presents inherent limitations with incorporating the results of the UA into the definition of UTI using these data. Additionally, reported test performance of the UA for UTI varies by uropathogen type,17 fever duration,18 associated bacteremia,19 and urine concentration,20 which are important considerations when applying a strict definition of UTI that includes the UA in this age group. Conversely, more recent studies have demonstrated improved sensitivity of the dipstick and microscopic UA for the detection of UTI.15,20,21 The improved test performance may not only enhance the use of the UA as a screen for UTI in this high-risk population but also allow its potential inclusion into the definition of UTI as the authors suggest, as previous false-negative UTIs would be less frequent with improved UA testing modalities.
Ultimately, what’s missing from the equation is whether treatment of young febrile infants with uropathogen detection in the setting of a negative UA affects either short-term or long-term complications of UTI. Unfortunately, limited information exists to help inform the decision to initiate antibiotic treatment for these infants. Ideally, this question can only be answered by either an observational study evaluating outcomes of untreated infants or a randomized trial of antibiotics for infants less than two months of age with uropathogen detection in the setting of a negative UA. Until then, we may continue to observe a wide variation in antibiotic treatment rates for febrile young infants with uropathogen detection in the setting of a negative UA.
Disclosures
The authors have nothing to disclose.
1. Quinonez RA, Garber MD, Schroeder AR, et al. Choosing wisely in pediatric hospital medicine: five opportunities for improved healthcare value. J Hosp Med. 2013;8(9):479-485. doi: 10.1002/jhm.2064. PubMed
2. Admon AJ, Gupta A, Williams M, et al. Appraising the evidence supporting Choosing Wisely® recommendations. J Hosp Med. 2018;13(10):688-691. doi: 10.12788/jhm.2964. PubMed
3. Reyes M, Paulus E, Hronek C, et al. Choosing Wisely Campaign: Report card and achievable benchmarks of care for children’s hospitals. Hosp Pediatr. 2017;7(11):633-641. doi: 10.1542/hpeds.2017-0029. PubMed
4. Schroeder AR, Lucas BP, Garber MD, McCulloh RJ, Joshi-Patel AA BE. Negative urinalyses in febrile infants 7-60 days of age treated for urinary tract infection. J Hosp Med. 2019;14(2):101-104. doi: 10.12788/jhm.3120..
5. Shaikh N, Mattoo TK, Keren R, et al. Early antibiotic treatment for pediatric febrile urinary tract infection and renal scarring. JAMA Pediatr. 2016;170(9):848-854. doi: 10.1001/jamapediatrics.2016.1181. PubMed
6. Keren R, Shaikh N, Pohl H, et al. Risk factors for recurrent urinary tract infection and renal scarring. Pediatrics. 2015;136(1):e13-e21. doi: 10.1542/peds.2015-0409. PubMed
7. Stiemsma LT, Michels KB. The role of the microbiome in the developmental origins of health and disease. Pediatrics. 2018;141(4):e20172437. doi: 10.1542/peds.2017-2437. PubMed
8. Gibson MK, Crofts TS, Dantas G. Antibiotics and the developing infant gut microbiota and resistome. Curr Opin Microbiol. 2015;27:51-56. doi: 10.1016/j.mib.2015.07.007. PubMed
9. Arboleya S, Sánchez B, Milani C, et al. Intestinal microbiota development in preterm neonates and effect of perinatal antibiotics. J Pediatr. 2015;166(3):538-544. doi: 10.1016/j.jpeds.2014.09.041. PubMed
10. Dardas M, Gill SR, Grier A, et al. The impact of postnatal antibiotics on the preterm intestinal microbiome. Pediatr Res. 2014;76(2):150-158. doi: 10.1038/pr.2014.69. PubMed
11. Roberts KB, Downs SM, Finnell SM, et al. Urinary tract infection: clinical practice guideline for the diagnosis and management of the initial UTI in febrile infants and children 2 to 24 months. Pediatrics. 2011;128(3):595-610. doi: 10.1542/peds.2011-1330. PubMed
12. Schroeder AR, Chang PW, Shen MW, Biondi EA, Greenhow TL. Diagnostic accuracy of the urinalysis for urinary tract infection in infants < 3 months of age. Pediatrics. 2015;135(6):965-971. doi: 10.1542/peds.2015-0012. PubMed
13. Wettergren B, Hellström M, Stokland E, Jodal U. Six year follow up of infants with bacteriuria on screening. BMJ. 1990;301(6756):845-848. doi: 10.1136/bmj.301.6756.845. PubMed
14. Wettergren B, Jodal U. Spontaneous clearance of asymptomatic bacteriuria in infants. Acta Paediatr Scand. 1990;79(3):300-304. doi: 10.1111/j.1651-2227.1990.tb11460.x. PubMed
15. Tzimenatos L, Mahajan P, Dayan PS, et al. Accuracy of the urinalysis for urinary tract infections in febrile infants 60 days and younger. Pediatrics. 2018;141(2):e20173068. doi: 10.1542/peds.2017-3068. PubMed
16. Wettergren B, Jodal U, Jonasson G. Epidemiology of bacteriuria during the first year of life. Acta Paediatr Scand. 1985;74(6):925-933. doi: 10.1111/j.1651-2227.1985.tb10059.x. PubMed
17. Shaikh N, Shope TR, Hoberman A, Vigliotti A, Kurs-Lasky M, Martin JM. Association between uropathogen and pyuria. Pediatrics. 2016;138(1):e20160087. doi: 10.1542/peds.2016-0087. PubMed
18. Hoberman A, Wald ER, Reynolds EA, Penchansky L, Charron M. Is urine culture necessary to rule out urinary tract infection in young febrile children? Pediatr Infect Dis J. 1996;15(4):304-309. PubMed
19. Roman HK, Chang PW, Schroeder AR. Diagnosis and management of bacteremic urinary tract infection in infants. Hosp Pediatr. 2015;5(1):1-8. doi: 10.1542/hpeds.2014-0051. PubMed
20. Chaudhari PP, Monuteaux MC, Bachur RG. Urine concentration and pyuria for identifying UTI in infants. Pediatrics. 2016;138(5):e20162370. PubMed
21. Glissmeyer EW, Korgenski EK, Wilkes J, et al. Dipstick screening for urinary tract infection in febrile infants. Pediatrics. 2014;133(5):e1121-e1127. doi: 10.1542/peds.2013-3291. PubMed
Reduction of antibiotic overuse is an important goal for improving the quality of care for children and is highlighted in many of the Choosing Wisely® recommendations across disciplines.1-3 However, the evidence supporting these recommendations vary widely and many are derived from expert opinion and clinical practice guidelines rather than from original research studies.2 In this issue of the Journal of Hospital Medicine, Schroeder and colleagues identify a potential area of antibiotic overuse among young febrile infants with possible urinary tract infection (UTI).4 A wide variation in antibiotic treatment rates (0%-35%) was observed across 124 hospitals in the United States for febrile infants 7-60 days of age with uropathogen detection by urine culture but a negative urinalysis (UA). Treated infants with a negative UA were more likely to be younger (7-30 days), have respiratory symptoms, and were less likely to have abnormal inflammatory markers than infants with a positive UA.
Clinicians faced with the decision of whether or not to treat a febrile infant with uropathogen detection in the setting of a negative UA must weigh the potential benefits and harms of antibiotic use in this population. Withholding antibiotics for a young infant with UTI may increase the risk of recurrent UTI and renal scarring,5,6 while antibiotic treatment in young infants can lead to the disruption of the gut microbiome, resulting in long-term consequences that are only beginning to be understood.7-10
The American Academy of Pediatrics (AAP) UTI practice parameter requires a positive UA to establish the diagnosis of UTI in children 2-24 months of age.11 This recommendation is based primarily on studies demonstrating that uropathogen detection in the setting of a negative UA commonly represents asymptomatic bacteriuria or contamination rather than true infection.12-14 This is supported by research showing that the UA demonstrates near perfect (>99%) sensitivity for UTI in children with bacteremic UTI,12,15 and studies demonstrating lower rates of subsequent urinary infections and renal injury among infants with uropathogen detection and a negative UA compared with those with uropathogen detection and a positive UA.13,14,16
An important question is whether febrile infants within the first two months of life with uropathogen detection should be treated with antimicrobials regardless of UA findings or specifically in the setting of a negative UA. The AAP practice guideline11 deliberately omits these young infants, recognizing that evidence derived from studies of older infants and children may not be applicable to this young age group, as they may not mount as robust an inflammatory response and thus may not demonstrate pyuria in the setting of a bacterial urinary infection. Schroeder et al. demonstrate lower rates of abnormal inflammatory markers in UA negative compared with UA positive infants, a finding the authors argue supports the possibility of asymptomatic bacteriuria or contamination rather than true infection.4 The counterargument is that young infants may not mount a significant inflammatory response to true infections.
The authors appropriately highlight the paucity of literature to help differentiate true infection from asymptomatic bacteriuria or contamination in infants less than two months of age. As infants in this age group are usually treated with antibiotics for a positive urine culture regardless of UA result, robust data on short- and long-term outcomes of untreated infants are lacking. Much of the existing literature evaluates the test performance of the UA for UTI using the urine culture as the reference standard, which presents inherent limitations with incorporating the results of the UA into the definition of UTI using these data. Additionally, reported test performance of the UA for UTI varies by uropathogen type,17 fever duration,18 associated bacteremia,19 and urine concentration,20 which are important considerations when applying a strict definition of UTI that includes the UA in this age group. Conversely, more recent studies have demonstrated improved sensitivity of the dipstick and microscopic UA for the detection of UTI.15,20,21 The improved test performance may not only enhance the use of the UA as a screen for UTI in this high-risk population but also allow its potential inclusion into the definition of UTI as the authors suggest, as previous false-negative UTIs would be less frequent with improved UA testing modalities.
Ultimately, what’s missing from the equation is whether treatment of young febrile infants with uropathogen detection in the setting of a negative UA affects either short-term or long-term complications of UTI. Unfortunately, limited information exists to help inform the decision to initiate antibiotic treatment for these infants. Ideally, this question can only be answered by either an observational study evaluating outcomes of untreated infants or a randomized trial of antibiotics for infants less than two months of age with uropathogen detection in the setting of a negative UA. Until then, we may continue to observe a wide variation in antibiotic treatment rates for febrile young infants with uropathogen detection in the setting of a negative UA.
Disclosures
The authors have nothing to disclose.
1. Quinonez RA, Garber MD, Schroeder AR, et al. Choosing wisely in pediatric hospital medicine: five opportunities for improved healthcare value. J Hosp Med. 2013;8(9):479-485. doi: 10.1002/jhm.2064. PubMed
2. Admon AJ, Gupta A, Williams M, et al. Appraising the evidence supporting Choosing Wisely® recommendations. J Hosp Med. 2018;13(10):688-691. doi: 10.12788/jhm.2964. PubMed
3. Reyes M, Paulus E, Hronek C, et al. Choosing Wisely Campaign: Report card and achievable benchmarks of care for children’s hospitals. Hosp Pediatr. 2017;7(11):633-641. doi: 10.1542/hpeds.2017-0029. PubMed
4. Schroeder AR, Lucas BP, Garber MD, McCulloh RJ, Joshi-Patel AA BE. Negative urinalyses in febrile infants 7-60 days of age treated for urinary tract infection. J Hosp Med. 2019;14(2):101-104. doi: 10.12788/jhm.3120..
5. Shaikh N, Mattoo TK, Keren R, et al. Early antibiotic treatment for pediatric febrile urinary tract infection and renal scarring. JAMA Pediatr. 2016;170(9):848-854. doi: 10.1001/jamapediatrics.2016.1181. PubMed
6. Keren R, Shaikh N, Pohl H, et al. Risk factors for recurrent urinary tract infection and renal scarring. Pediatrics. 2015;136(1):e13-e21. doi: 10.1542/peds.2015-0409. PubMed
7. Stiemsma LT, Michels KB. The role of the microbiome in the developmental origins of health and disease. Pediatrics. 2018;141(4):e20172437. doi: 10.1542/peds.2017-2437. PubMed
8. Gibson MK, Crofts TS, Dantas G. Antibiotics and the developing infant gut microbiota and resistome. Curr Opin Microbiol. 2015;27:51-56. doi: 10.1016/j.mib.2015.07.007. PubMed
9. Arboleya S, Sánchez B, Milani C, et al. Intestinal microbiota development in preterm neonates and effect of perinatal antibiotics. J Pediatr. 2015;166(3):538-544. doi: 10.1016/j.jpeds.2014.09.041. PubMed
10. Dardas M, Gill SR, Grier A, et al. The impact of postnatal antibiotics on the preterm intestinal microbiome. Pediatr Res. 2014;76(2):150-158. doi: 10.1038/pr.2014.69. PubMed
11. Roberts KB, Downs SM, Finnell SM, et al. Urinary tract infection: clinical practice guideline for the diagnosis and management of the initial UTI in febrile infants and children 2 to 24 months. Pediatrics. 2011;128(3):595-610. doi: 10.1542/peds.2011-1330. PubMed
12. Schroeder AR, Chang PW, Shen MW, Biondi EA, Greenhow TL. Diagnostic accuracy of the urinalysis for urinary tract infection in infants < 3 months of age. Pediatrics. 2015;135(6):965-971. doi: 10.1542/peds.2015-0012. PubMed
13. Wettergren B, Hellström M, Stokland E, Jodal U. Six year follow up of infants with bacteriuria on screening. BMJ. 1990;301(6756):845-848. doi: 10.1136/bmj.301.6756.845. PubMed
14. Wettergren B, Jodal U. Spontaneous clearance of asymptomatic bacteriuria in infants. Acta Paediatr Scand. 1990;79(3):300-304. doi: 10.1111/j.1651-2227.1990.tb11460.x. PubMed
15. Tzimenatos L, Mahajan P, Dayan PS, et al. Accuracy of the urinalysis for urinary tract infections in febrile infants 60 days and younger. Pediatrics. 2018;141(2):e20173068. doi: 10.1542/peds.2017-3068. PubMed
16. Wettergren B, Jodal U, Jonasson G. Epidemiology of bacteriuria during the first year of life. Acta Paediatr Scand. 1985;74(6):925-933. doi: 10.1111/j.1651-2227.1985.tb10059.x. PubMed
17. Shaikh N, Shope TR, Hoberman A, Vigliotti A, Kurs-Lasky M, Martin JM. Association between uropathogen and pyuria. Pediatrics. 2016;138(1):e20160087. doi: 10.1542/peds.2016-0087. PubMed
18. Hoberman A, Wald ER, Reynolds EA, Penchansky L, Charron M. Is urine culture necessary to rule out urinary tract infection in young febrile children? Pediatr Infect Dis J. 1996;15(4):304-309. PubMed
19. Roman HK, Chang PW, Schroeder AR. Diagnosis and management of bacteremic urinary tract infection in infants. Hosp Pediatr. 2015;5(1):1-8. doi: 10.1542/hpeds.2014-0051. PubMed
20. Chaudhari PP, Monuteaux MC, Bachur RG. Urine concentration and pyuria for identifying UTI in infants. Pediatrics. 2016;138(5):e20162370. PubMed
21. Glissmeyer EW, Korgenski EK, Wilkes J, et al. Dipstick screening for urinary tract infection in febrile infants. Pediatrics. 2014;133(5):e1121-e1127. doi: 10.1542/peds.2013-3291. PubMed
© 2019 Society of Hospital Medicine
Admittedly Simple? The Quest for Clarity in Medicare Claims Data
Every reader of a certain age will recognize this acronym: ADCVANDIML. In simpler times, we “admitted” to a location: medical intensive care unit, bone marrow transplant unit. At some point, admission orders changed from a synonym for “hospitalize” to chart evidence necessary for inpatient payment to the hospital. In the billing and payment world, “inpatient” and “outpatient” hospitalizations are paid at different rates. Observation stays are one type of “outpatient hospitalization,” a confusing and contradictory term to physicians and patients alike. In their article published in this month’s Journal of Hospital Medicine, Sheehy and colleagues attempt the herculean task of defining a reproducible methodology to identify observation hospital stays using Medicare claims data.1 They highlight the complexity of claims data, the variability of revenue codes used, and the probable high frequency of status changes from outpatient observation to inpatient, and vice-versa, during a single hospitalization. They also argue for reform to simplify payment policy for hospitalized patients.
In October 2013, the Center for Medicare and Medicaid Services (CMS) changed the definition of “inpatient” in the Hospital Inpatient Prospective Payment System rule.2 This change is known colloquially as the “two-midnight rule” and occurred on the heels of several years of Recovery Audit contractor (RAC) retroactive denials of short-stay inpatient payments to hospitals around the country. These denials appear to have been based solely on the visit status under which a claim was billed, rather than a dispute over the actual medical care delivered.3 The RAC audits alleged billions of dollars of improper payment to hospitals and resulted in a log-jam of hundreds of thousands of cases in the federal appeal system.4 The two-midnight rule altered the subjective characterization of an inpatient from patient-based (severity of illness) and physician-based (intensity of service) to an objective, time-based payment definition. For the hospital to submit a claim to Medicare Part A, a medical provider with admitting privileges should expect that the patient will need, for medically necessary reasons, a hospitalization that will span at least two midnights of hospital care. Notable exceptions to the rule include patients undergoing a procedure on the Medicare Inpatient Only list and hospitalizations that include an unplanned mechanical intubation. To receive payment for observation (an outpatient service billed under Part B) the physician must place an observation order in addition to other requirements. At its core, the two-midnight rule is a payment rule, not a patient care rule.
This change in the criteria for an inpatient hospitalization from a subjective to a more objective and measurable time-based criterion might lead us to believe that the process for determining the correct visit status would now be simple. Unfortunately, we are dealing with a messy real-world scenario, where doctors can make different judgments and patients can have an unpredictable hospital course. Physicians are familiar with the issues surrounding the choice of the “correct” admission order. In many hospitals, the Medicare patients in “observation” and those with an “inpatient” order can be on the same floor and even share the same room. From a hospital resource, nurse’s, and physician’s standpoint, the patients are often indistinguishable. While some facilities have observation units often associated with their emergency departments, the elderly and those patients with certain comorbidities can be excluded from these units based on protocols designed to improve outcomes and patient safety.
Additionally, most patients who spend at least one night in the hospital for medical treatment would not think that they could be an “outpatient.” To address this, CMS has produced specific beneficiary information5 and now requires hospitals to provide patients with the Medicare outpatient observation notice (MOON) if patients spend more than 24 hours in observation status.6 Beneficiaries must sign this notice, but unlike those admitted as inpatients, Medicare observation patients have no appeal rights. Recent articles in the lay press highlight the interplay between observation status, out-of-pocket expenses, and impact on postacute care.7,8
Following the implementation of the two-midnight rule, CMS directed the regional Medicare Administrative Contractors to perform audits in every hospital in the country. This has led to system-based processes at most facilities directing the “proper” visit class orders for our patients: direct education to providers, electronic medical record fixes and hard-stops, and real-time communications from the utilization review nurses and staff. These processes, based on a payment rule are burdensome to patients, physicians, and hospital support staff.
It’s not surprising to see that the billing of hospital-based observation care is also a quagmire. The methods and results sections of Sheehy et al.’s article reads like a calculus textbook written in a foreign language on first pass, even to an expert. Adding to an already complex issue, since October 2013, a hospital’s Utilization Review physicians can also “self-deny” Medicare inpatient stays that do not meet the two-midnight rule payment criteria and still bill for most of Part B charges. These cases are sometimes referred to as “Part A to B rebills” and may or may not have been captured in the claims data reported by CMS and reviewed by Sheehy et al. These cases represent another important status change that should be tracked.
There is a multitude of opinions on the pros and cons of observation care as a payment policy, and the data presented by Sheehy et al. is further evidence that the line between inpatient and observation hospitalizations remains blurred and mutable. The authors demonstrate the need for a consistent methodology to define observation stays and ultimately to study them using claims-based data. Simplicity may be the answer, but first, we must know what we are doing, then we can have a debate on whether or not it needs to change.
Disclosures
The authors have nothing to disclose.
1. Sheehy AM, Shi F, Kind AJH. Identifying observation stays in Medicare data. J Hosp Med. 2019;14(2):96-100. doi: 10.2788/jhm.3038. PubMed
2. Hospital Inpatient Prospective Payment Systems for Acute Care Hospitals and the Long- Term Care; Hospital Prospective Payment System and Fiscal Year 2014 Rates; Quality Reporting Requirements for Specific Providers; Hospital Conditions of Participation; Payment Policies Related to Patient Status; Final Rule. https://www.gpo.gov/fdsys/pkg/FR-2013-08-19/pdf/2013-18956.pdf. Accessed November 1, 2018.
3. Sheehy AM, Locke C, Engel JZ, et al. Recovery audit contractor audits and appeals at three academic medical centers. J Hosp Med. 2015;10(4):212-219. doi: 10.1002/jhm.2332. PubMed
4. Office of Medicare Hearings and Appeals. Memorandum to OMHA MedicareAppellants. http://www.modernhealthcare.com/assets/pdf/CH92573110.pdf. Accessed November 4, 2018.
5. Center for Medicare and Medicaid Services. Are You a Hospital Inpatient or Outpatient? https://www.medicare.gov/sites/default/files/2018-09/11435-Are-You-an-Inpatient-or-Outpatient.pdf. Accessed November 4, 2018.
6. Center for Medicare and Medicaid Services. Medicare Outpatient Observation Notice website. https://www.cms.gov/Medicare/Medicare-General-Information/BNI/MOON.html. Accessed November 1, 2018.
7. Kodjak, A. How Medicare’s Conflicting Hospitalization Rules MostMe Thousands of Dollars. https://www.npr.org/sections/health-shots/2018/04/20/583338114/how-medicares-conflicting-hospitalization-rules-cost-me-thousands-of-dollars. Accessed November 1, 2018.
8. Schroeder, MO. Have You Really Been Admitted as an Inpatient to the Hospital? https://health.usnews.com/health-care/patient-advice/articles/2018-10-18/have-you-really-been-admitted-as-an-inpatient-to-the-hospital. Accessed November 1, 2018.
Every reader of a certain age will recognize this acronym: ADCVANDIML. In simpler times, we “admitted” to a location: medical intensive care unit, bone marrow transplant unit. At some point, admission orders changed from a synonym for “hospitalize” to chart evidence necessary for inpatient payment to the hospital. In the billing and payment world, “inpatient” and “outpatient” hospitalizations are paid at different rates. Observation stays are one type of “outpatient hospitalization,” a confusing and contradictory term to physicians and patients alike. In their article published in this month’s Journal of Hospital Medicine, Sheehy and colleagues attempt the herculean task of defining a reproducible methodology to identify observation hospital stays using Medicare claims data.1 They highlight the complexity of claims data, the variability of revenue codes used, and the probable high frequency of status changes from outpatient observation to inpatient, and vice-versa, during a single hospitalization. They also argue for reform to simplify payment policy for hospitalized patients.
In October 2013, the Center for Medicare and Medicaid Services (CMS) changed the definition of “inpatient” in the Hospital Inpatient Prospective Payment System rule.2 This change is known colloquially as the “two-midnight rule” and occurred on the heels of several years of Recovery Audit contractor (RAC) retroactive denials of short-stay inpatient payments to hospitals around the country. These denials appear to have been based solely on the visit status under which a claim was billed, rather than a dispute over the actual medical care delivered.3 The RAC audits alleged billions of dollars of improper payment to hospitals and resulted in a log-jam of hundreds of thousands of cases in the federal appeal system.4 The two-midnight rule altered the subjective characterization of an inpatient from patient-based (severity of illness) and physician-based (intensity of service) to an objective, time-based payment definition. For the hospital to submit a claim to Medicare Part A, a medical provider with admitting privileges should expect that the patient will need, for medically necessary reasons, a hospitalization that will span at least two midnights of hospital care. Notable exceptions to the rule include patients undergoing a procedure on the Medicare Inpatient Only list and hospitalizations that include an unplanned mechanical intubation. To receive payment for observation (an outpatient service billed under Part B) the physician must place an observation order in addition to other requirements. At its core, the two-midnight rule is a payment rule, not a patient care rule.
This change in the criteria for an inpatient hospitalization from a subjective to a more objective and measurable time-based criterion might lead us to believe that the process for determining the correct visit status would now be simple. Unfortunately, we are dealing with a messy real-world scenario, where doctors can make different judgments and patients can have an unpredictable hospital course. Physicians are familiar with the issues surrounding the choice of the “correct” admission order. In many hospitals, the Medicare patients in “observation” and those with an “inpatient” order can be on the same floor and even share the same room. From a hospital resource, nurse’s, and physician’s standpoint, the patients are often indistinguishable. While some facilities have observation units often associated with their emergency departments, the elderly and those patients with certain comorbidities can be excluded from these units based on protocols designed to improve outcomes and patient safety.
Additionally, most patients who spend at least one night in the hospital for medical treatment would not think that they could be an “outpatient.” To address this, CMS has produced specific beneficiary information5 and now requires hospitals to provide patients with the Medicare outpatient observation notice (MOON) if patients spend more than 24 hours in observation status.6 Beneficiaries must sign this notice, but unlike those admitted as inpatients, Medicare observation patients have no appeal rights. Recent articles in the lay press highlight the interplay between observation status, out-of-pocket expenses, and impact on postacute care.7,8
Following the implementation of the two-midnight rule, CMS directed the regional Medicare Administrative Contractors to perform audits in every hospital in the country. This has led to system-based processes at most facilities directing the “proper” visit class orders for our patients: direct education to providers, electronic medical record fixes and hard-stops, and real-time communications from the utilization review nurses and staff. These processes, based on a payment rule are burdensome to patients, physicians, and hospital support staff.
It’s not surprising to see that the billing of hospital-based observation care is also a quagmire. The methods and results sections of Sheehy et al.’s article reads like a calculus textbook written in a foreign language on first pass, even to an expert. Adding to an already complex issue, since October 2013, a hospital’s Utilization Review physicians can also “self-deny” Medicare inpatient stays that do not meet the two-midnight rule payment criteria and still bill for most of Part B charges. These cases are sometimes referred to as “Part A to B rebills” and may or may not have been captured in the claims data reported by CMS and reviewed by Sheehy et al. These cases represent another important status change that should be tracked.
There is a multitude of opinions on the pros and cons of observation care as a payment policy, and the data presented by Sheehy et al. is further evidence that the line between inpatient and observation hospitalizations remains blurred and mutable. The authors demonstrate the need for a consistent methodology to define observation stays and ultimately to study them using claims-based data. Simplicity may be the answer, but first, we must know what we are doing, then we can have a debate on whether or not it needs to change.
Disclosures
The authors have nothing to disclose.
1. Sheehy AM, Shi F, Kind AJH. Identifying observation stays in Medicare data. J Hosp Med. 2019;14(2):96-100. doi: 10.2788/jhm.3038. PubMed
2. Hospital Inpatient Prospective Payment Systems for Acute Care Hospitals and the Long- Term Care; Hospital Prospective Payment System and Fiscal Year 2014 Rates; Quality Reporting Requirements for Specific Providers; Hospital Conditions of Participation; Payment Policies Related to Patient Status; Final Rule. https://www.gpo.gov/fdsys/pkg/FR-2013-08-19/pdf/2013-18956.pdf. Accessed November 1, 2018.
3. Sheehy AM, Locke C, Engel JZ, et al. Recovery audit contractor audits and appeals at three academic medical centers. J Hosp Med. 2015;10(4):212-219. doi: 10.1002/jhm.2332. PubMed
4. Office of Medicare Hearings and Appeals. Memorandum to OMHA MedicareAppellants. http://www.modernhealthcare.com/assets/pdf/CH92573110.pdf. Accessed November 4, 2018.
5. Center for Medicare and Medicaid Services. Are You a Hospital Inpatient or Outpatient? https://www.medicare.gov/sites/default/files/2018-09/11435-Are-You-an-Inpatient-or-Outpatient.pdf. Accessed November 4, 2018.
6. Center for Medicare and Medicaid Services. Medicare Outpatient Observation Notice website. https://www.cms.gov/Medicare/Medicare-General-Information/BNI/MOON.html. Accessed November 1, 2018.
7. Kodjak, A. How Medicare’s Conflicting Hospitalization Rules MostMe Thousands of Dollars. https://www.npr.org/sections/health-shots/2018/04/20/583338114/how-medicares-conflicting-hospitalization-rules-cost-me-thousands-of-dollars. Accessed November 1, 2018.
8. Schroeder, MO. Have You Really Been Admitted as an Inpatient to the Hospital? https://health.usnews.com/health-care/patient-advice/articles/2018-10-18/have-you-really-been-admitted-as-an-inpatient-to-the-hospital. Accessed November 1, 2018.
© 2019 Society of Hospital Medicine
Optimizing Well-being, Practice Culture, and Professional Thriving in an Era of Turbulence
In 2010, the Journal of Hospital Medicine published an article proposing a “talent facilitation” framework for addressing physician workforce challenges.1 Since then, continuous changes in healthcare work environments and shifts in relevant policies have intensified a sense of clinician workforce crisis in the United States,2,3 often described as an epidemic of burnout. Unfortunately, hospital medicine remains among the specialties most impacted by high burnout rates and related turnover.4-6
THE HEALTHCARE TALENT IMPERATIVE
Despite efforts to address the sustainability of careers in hospital medicine, common approaches remain mostly reactive. Existing research on burnout is largely descriptive, focusing on the magnitude of the problem,3 the links between burnout and diminished productivity or turnover,7 and the negative impact of burnout on patient care.8.9 Improvement efforts often focus on rescuing individuals from burnout, rather than prevention.10 While evidence exists that both individually targeted interventions (eg, mindfulness-based stress reduction) and institutional changes (eg, improvements in the operation of care teams) can reduce burnout, efforts to promote individuals’ resilience appear to have limited impact.11,12
Given our field’s reputation for innovation, we believe hospitalist groups must lead the way in developing practical solutions that enhance the well-being of their members, by doing more than exhorting clinicians to “heal themselves” or imploring executives to fix care delivery systems. In this article, we describe an approach to increase resilience and well-being in a large, academic hospital medicine practice and offer an emerging list of best practices.
FROM BURNOUT TO WELL-BEING—A PARADIGM SHIFT
Maslach et al. demonstrated that burnout reflects an individual’s experience of emotional exhaustion, depersonalization of human interactions, and decreased sense of accomplishment at work.13 Updated frameworks emphasize that well-being and lower burnout arise from workflow efficiency, a surrounding culture of wellness, and attention to individual resilience.14 Emerging evidence suggests that burnout and well-being are, in part, a collective experience.15 As outlined in the recently published “Charter on Physician Well-being,”16 this realization creates an opportunity for clinical groups to enhance collective well-being—or thriving—rather than asking individuals to take personal responsibility for resilience or waiting for a top-down system redesign to fix drivers of burnout.
APPLYING THE NEW PARADIGM TO HOSPITAL MEDICINE
In 2013, our academic hospital medicine group set a new vision: To become the best in the nation by being an outstanding place to work. We held an inclusive divisional strategic planning retreat, which focused on clarifying the group’s six core values and exploring how to translate the values into structures, processes, and behaviors that reinforced, rather than undermined, a positive work environment. We used these initial themes to create 16 novel interventions from 2014-2017 (Figure).
Notably, we pursued this work without explicit support or interference from senior leaders in our institution. There were no competing organizational efforts addressing hospitalist efficiency, turnover, or burnout until 2017 (Excellence in Communication, described below). Furthermore, we avoided individually targeted resilience efforts based on feedback from our group that “requiring resilience activities is like blaming the victim.” Intervention participation was not mandatory, out of respect for individual choice and to avoid impeding hospitalists’ daily work.
Before designing interventions, we created a measurement tool to assess our existing culture and track evolution over time (available upon request). We utilized the instrument to provoke emotional responses, surface paradoxes, uncover assumptions, and engage the group in iterative dialog that informed and calibrated interventions. The instrument itself drew from validated elements of existing tools to quantify perceptions across nine domains: meaningful work, autonomy, professional development, logistical support, health, fulfillment outside of work, collegiality, organizational learning, and safety culture.
Several subsequent interventions focused on the emotional experience of work. For example, we developed a formal mechanism (Something Awesome) for members to share the experience of positive emotions during daily work (eg, gratitude and awe) for five minutes at monthly group meetings. We created a Collaborative Case Review process, allowing members to submit concerning cases for nonpunitive discussion and coaching among peers. Finally, we created Above and Beyond Awards, through which members’ written praise of peers’ extraordinary efforts were distributed to the entire group.
We also pursued interventions designed to increase empathy and translate it to action. These included leader rounding on our clinical units, which sought to recognize and thank individuals for daily work and to uncover exigent needs, such as food or assistance with conflict resolution between services. We created “Flash Mobs” or group conversations, which are facilitated by a leader and convened in the hospital, in order to hear from people and discuss topics of concern in real time, such as increased patient volumes. Likewise, we established “The Incubator,” a half-day meeting held four to six times annually when selected clinical faculty applied design thinking techniques to create, test, and implement ideas to enhance workplace experience (eg, supplying healthy food to our common work space at low cost).
Another key focus was professional development for group members. Examples included a three-year development program for new faculty (LaunchPad), increasing the number of available leadership roles for aspiring leaders, modifying annual reviews to focus on increasing individuals’ strengths-based work rather than solely grading performance, and creating a peer-support coaching program for newly hired members. In 2017, we began offering members a full shift credit to attend the hospital’s four-hour Excellence in Communication course, which covers six high-yield skills that increase efficiency, efficacy, and joy in practice.
Finally, we revised a number of structures and operational processes within our group’s control. We created a task force to address the needs of new parents and acquired a lactation room in the hospital. Instead of only covering offsite conference attendance (our old policy), we enhanced autonomy regarding use of continuing education dollars to allow faculty to fund any activity supporting their clinical practice. Finally, we applied quality improvement methodology to redesign the clinical schedule. This included blending value-stream mapping, software solutions, and a values-based framework to analyze proposed changes through the lens of waste elimination, IT feasibility, and whether the proposed changes aligned with the group’s core values.
IMPACT ON GROUP CULTURE AND WELL-BEING
We examined the impact of these tactics on workplace experience over a four-year period (Figure). In 2014, 30% of group members reported psychological safety, 24% had become more callous toward people in their current job, and 45% were experiencing burnout. By 2017, 59% felt a sense of psychological safety (69% increase), 15% had become more callous toward people (38% decrease), and 33% were experiencing burnout (27% decrease). Average annual turnover in the five years before the first survey was 13.2%; turnover declined during the intervention period to 6.6% (adjusted for increased number of positions). While few comprehensive models exist for calculating well-being program return on investment, the American Medical Association’s calculator17 demonstrated our group’s cost of burnout plus turnover in 2013 was $464,385 per year (assumptions in Appendix 1). We spent $343,517 on the 16 interventions between 2013 and 2017, representing an average annual cost of $86,000: $190,094 to buy-down clinical time for new leadership roles, $133,023 to fund time for the Incubator, $2,500 on gifts and awards, $4,900 on program supplies, and $10,000 on leadership training.
BEST PRACTICES FOR HOSPITALIST GROUPS
Based on the current literature and our experience, hospital medicine groups seeking to improve culture, resilience, and well-being should:
- Collaborate to define the group’s sense of purpose. Mission and vision are important, but most of the focus should be on surfacing, naming, and agreeing upon the group’s essential core values—the beliefs that inform whether hospitalists see the workplace as attractive, fair, and sustainable. Utilizing an expert, neutral facilitator is helpful.
- Assess culture—including, but not limited to, individual burnout and well-being—using preexisting questions from validated instruments. As culture is a product of systems, team climate, and leadership, measurement should include these domains.
- Monitor and share anonymous data from the assessment regularly (at least annually) as soon as possible after survey results are available. The data should drive inclusive, open, nonjudgmental dialog among group members and leaders in order to clarify, explore, and refine what the data mean.
- Undertake improvement efforts that emerge from the steps above, with a balanced focus on the three domains of well-being: efficiency of practice, culture of wellness, and personal resilience. Modify the number and intensity of interventions based on the group’s readiness and ability to control change in these domains. For example, some groups may have more excitement and ability to work on factors impacting the efficiency of practice, such as electronic health record templates, while others may wish to enhance opportunities for collegial interaction during the workday.
- Strive for codesign. Group members must be an integral part of the solution, rather than simply raise complaints with the expectation that leaders will devise solutions. Ideally, group members should have time, funding, or titles to lead improvement efforts.
- Opportunities to improve resilience and well-being should be widely available to all group members, but should not be mandatory.
CONCLUSION
The healthcare industry will continue to grapple with high rates of burnout and rapid change for the foreseeable future. We believe significant improvements in burnout rates and workplace experience can result from hospitalist-led interventions designed to improve experience of work among hospitalist clinicians, even as we await broader and necessary systematic efforts to address structural drivers of professional satisfaction. This work is vital if we are to honor our field’s history of productive innovation and navigate dynamic change in healthcare by attracting, engaging, developing, and retaining our most valuable asset: our people.
Disclosures
The authors declare they have no conflicts of interest/competing interests.
1. Kneeland PP, Kneeland C, Wachter RM. Bleeding talent: a lesson from industry on embracing physician workforce challenges. J Hosp Med. 2010;5(5):306-310. doi: 10.1002/jhm.594. PubMed
2. Shanafelt TD, Balch CM, Bechamps G, et al. Burnout and medical errors among American surgeons. Ann Surg. 2010;251(6):995-1000. doi: 10.1097/SLA.0b013e3181bfdab3. PubMed
3. Roberts DL, Shanafelt TD, Dyrbye LN, West CP. A national comparison of burnout and work-life balance among internal medicine hospitalists and outpatient general internists. J Hosp Med. 2014;9(3):176-181. doi: 10.1002/jhm.2146. PubMed
4. Shanafelt TD, Hasan O, Dyrbye LN, et al. Changes in burnout and satisfaction with work-life balance in physicians and the General US Working population between 2011 and 2014. Mayo Clin Proc. 2015;90(12):1600-1613. doi: 10.1016/j.mayocp.2015.08.023. PubMed
5. Vuong K. Turnover rate for hospitalist groups trending downward. The Hospitalist. http://www.thehospitalist.org/hospitalist/article/130462/turnover-rate-hospitalist-groups-trending-downward; 2017, Feb 1.
6. Hinami K, Whelan CT, Wolosin RJ, Miller JA, Wetterneck TB. Worklife and satisfaction of hospitalists: toward flourishing careers. J Gen Intern Med. 2012;27(1):28-36. doi: 10.1007/s11606-011-1780-z. PubMed
7. Farr C. Siren song of tech lures New Doctors away from medicine. Shots. Health news from NPR. https://www.npr.org/sections/health-shots/2015/07/19/423882899/siren-song-of-tech-lures-new-doctors-away-from-medicine; 2015, July 19.
8. Shanafelt TD, Balch CM, Bechamps G, et al. Burnout and medical errors among American surgeons. Ann Surg. 2010;251(6):995-1000. doi: 10.1097/SLA.0b013e3181bfdab3. PubMed
9. Dewa CS, Loong D, Bonato S, Thanh NX, Jacobs P. How does burnout affect physician productivity? A systematic literature review. BMC Health Serv Res. 2014;14:325. doi: 10.1186/1472-6963-14-325. PubMed
10. Panagioti M, Geraghty K, Johnson J, et al. Association between physician burnout and patient safety, professionalism, and patient satisfaction: A systematic review and meta-analysis. JAMA Intern Med. 2018;178(10):1317-1330. doi: 10.1001/jamainternmed.2018.3713. PubMed
11. Hall LH, Johnson J, Watt I, Tsipa A, O’Connor DB. Healthcare staff wellbeing, burnout, and patient safety: A systematic review PLOS ONE. 2016;11(7):e0159015. doi: 10.1371/journal.pone.0159015. PubMed
12. Panagioti M, Panagopoulou E, Bower P, et al. Controlled interventions to reduce burnout in physicians: A systematic review and meta-analysis. JAMA Intern Med. 2017;177(2):195-205. doi: 10.1001/jamainternmed.2016.7674. PubMed
13. West CP, Dyrbye LN, Erwin PJ, Shanafelt TD. Interventions to prevent and reduce physician burnout: a systematic review and meta-analysis. Lancet. 2016;388(10057):2272-2281. doi: 10.1016/S0140-6736(16)31279-X. PubMed
14. Maslach C, Schaufeli WB, Leiter MP. Job Burnout. Annu Rev Psychol. 2001;52:397-422. doi: 10.1146/annurev.psych.52.1.397. PubMed
15. Bohman B, Dyrbye L, Sinsky CA, et al. Physician well-being: the reciprocity of practice efficiency, culture of wellness, and personal resilience. NEJM Catalyst. 2017 Aug.
16. Sexton JB, Adair KC, Leonard MW, et al. Providing feedback following Leadership WalkRounds is associated with better patient safety culture, higher employee engagement and lower burnout. BMJ Qual Saf. 2018;27(4):261-270. doi: 10.1136/bmjqs-2016-006399. PubMed
17. Thomas LR, Ripp JA, West CP. Charter on physician well-being. JAMA. 2018;319(15):1541-1542. doi: 10.1001/jama.2018.1331. PubMed
18. American Medical Association. Nine Steps to Creating the Organizational Foundation for Joy in Medicine: culture of Wellness—track the business case for well-being. https://www.stepsforward.org/modules/joy-in-medicine.
In 2010, the Journal of Hospital Medicine published an article proposing a “talent facilitation” framework for addressing physician workforce challenges.1 Since then, continuous changes in healthcare work environments and shifts in relevant policies have intensified a sense of clinician workforce crisis in the United States,2,3 often described as an epidemic of burnout. Unfortunately, hospital medicine remains among the specialties most impacted by high burnout rates and related turnover.4-6
THE HEALTHCARE TALENT IMPERATIVE
Despite efforts to address the sustainability of careers in hospital medicine, common approaches remain mostly reactive. Existing research on burnout is largely descriptive, focusing on the magnitude of the problem,3 the links between burnout and diminished productivity or turnover,7 and the negative impact of burnout on patient care.8.9 Improvement efforts often focus on rescuing individuals from burnout, rather than prevention.10 While evidence exists that both individually targeted interventions (eg, mindfulness-based stress reduction) and institutional changes (eg, improvements in the operation of care teams) can reduce burnout, efforts to promote individuals’ resilience appear to have limited impact.11,12
Given our field’s reputation for innovation, we believe hospitalist groups must lead the way in developing practical solutions that enhance the well-being of their members, by doing more than exhorting clinicians to “heal themselves” or imploring executives to fix care delivery systems. In this article, we describe an approach to increase resilience and well-being in a large, academic hospital medicine practice and offer an emerging list of best practices.
FROM BURNOUT TO WELL-BEING—A PARADIGM SHIFT
Maslach et al. demonstrated that burnout reflects an individual’s experience of emotional exhaustion, depersonalization of human interactions, and decreased sense of accomplishment at work.13 Updated frameworks emphasize that well-being and lower burnout arise from workflow efficiency, a surrounding culture of wellness, and attention to individual resilience.14 Emerging evidence suggests that burnout and well-being are, in part, a collective experience.15 As outlined in the recently published “Charter on Physician Well-being,”16 this realization creates an opportunity for clinical groups to enhance collective well-being—or thriving—rather than asking individuals to take personal responsibility for resilience or waiting for a top-down system redesign to fix drivers of burnout.
APPLYING THE NEW PARADIGM TO HOSPITAL MEDICINE
In 2013, our academic hospital medicine group set a new vision: To become the best in the nation by being an outstanding place to work. We held an inclusive divisional strategic planning retreat, which focused on clarifying the group’s six core values and exploring how to translate the values into structures, processes, and behaviors that reinforced, rather than undermined, a positive work environment. We used these initial themes to create 16 novel interventions from 2014-2017 (Figure).
Notably, we pursued this work without explicit support or interference from senior leaders in our institution. There were no competing organizational efforts addressing hospitalist efficiency, turnover, or burnout until 2017 (Excellence in Communication, described below). Furthermore, we avoided individually targeted resilience efforts based on feedback from our group that “requiring resilience activities is like blaming the victim.” Intervention participation was not mandatory, out of respect for individual choice and to avoid impeding hospitalists’ daily work.
Before designing interventions, we created a measurement tool to assess our existing culture and track evolution over time (available upon request). We utilized the instrument to provoke emotional responses, surface paradoxes, uncover assumptions, and engage the group in iterative dialog that informed and calibrated interventions. The instrument itself drew from validated elements of existing tools to quantify perceptions across nine domains: meaningful work, autonomy, professional development, logistical support, health, fulfillment outside of work, collegiality, organizational learning, and safety culture.
Several subsequent interventions focused on the emotional experience of work. For example, we developed a formal mechanism (Something Awesome) for members to share the experience of positive emotions during daily work (eg, gratitude and awe) for five minutes at monthly group meetings. We created a Collaborative Case Review process, allowing members to submit concerning cases for nonpunitive discussion and coaching among peers. Finally, we created Above and Beyond Awards, through which members’ written praise of peers’ extraordinary efforts were distributed to the entire group.
We also pursued interventions designed to increase empathy and translate it to action. These included leader rounding on our clinical units, which sought to recognize and thank individuals for daily work and to uncover exigent needs, such as food or assistance with conflict resolution between services. We created “Flash Mobs” or group conversations, which are facilitated by a leader and convened in the hospital, in order to hear from people and discuss topics of concern in real time, such as increased patient volumes. Likewise, we established “The Incubator,” a half-day meeting held four to six times annually when selected clinical faculty applied design thinking techniques to create, test, and implement ideas to enhance workplace experience (eg, supplying healthy food to our common work space at low cost).
Another key focus was professional development for group members. Examples included a three-year development program for new faculty (LaunchPad), increasing the number of available leadership roles for aspiring leaders, modifying annual reviews to focus on increasing individuals’ strengths-based work rather than solely grading performance, and creating a peer-support coaching program for newly hired members. In 2017, we began offering members a full shift credit to attend the hospital’s four-hour Excellence in Communication course, which covers six high-yield skills that increase efficiency, efficacy, and joy in practice.
Finally, we revised a number of structures and operational processes within our group’s control. We created a task force to address the needs of new parents and acquired a lactation room in the hospital. Instead of only covering offsite conference attendance (our old policy), we enhanced autonomy regarding use of continuing education dollars to allow faculty to fund any activity supporting their clinical practice. Finally, we applied quality improvement methodology to redesign the clinical schedule. This included blending value-stream mapping, software solutions, and a values-based framework to analyze proposed changes through the lens of waste elimination, IT feasibility, and whether the proposed changes aligned with the group’s core values.
IMPACT ON GROUP CULTURE AND WELL-BEING
We examined the impact of these tactics on workplace experience over a four-year period (Figure). In 2014, 30% of group members reported psychological safety, 24% had become more callous toward people in their current job, and 45% were experiencing burnout. By 2017, 59% felt a sense of psychological safety (69% increase), 15% had become more callous toward people (38% decrease), and 33% were experiencing burnout (27% decrease). Average annual turnover in the five years before the first survey was 13.2%; turnover declined during the intervention period to 6.6% (adjusted for increased number of positions). While few comprehensive models exist for calculating well-being program return on investment, the American Medical Association’s calculator17 demonstrated our group’s cost of burnout plus turnover in 2013 was $464,385 per year (assumptions in Appendix 1). We spent $343,517 on the 16 interventions between 2013 and 2017, representing an average annual cost of $86,000: $190,094 to buy-down clinical time for new leadership roles, $133,023 to fund time for the Incubator, $2,500 on gifts and awards, $4,900 on program supplies, and $10,000 on leadership training.
BEST PRACTICES FOR HOSPITALIST GROUPS
Based on the current literature and our experience, hospital medicine groups seeking to improve culture, resilience, and well-being should:
- Collaborate to define the group’s sense of purpose. Mission and vision are important, but most of the focus should be on surfacing, naming, and agreeing upon the group’s essential core values—the beliefs that inform whether hospitalists see the workplace as attractive, fair, and sustainable. Utilizing an expert, neutral facilitator is helpful.
- Assess culture—including, but not limited to, individual burnout and well-being—using preexisting questions from validated instruments. As culture is a product of systems, team climate, and leadership, measurement should include these domains.
- Monitor and share anonymous data from the assessment regularly (at least annually) as soon as possible after survey results are available. The data should drive inclusive, open, nonjudgmental dialog among group members and leaders in order to clarify, explore, and refine what the data mean.
- Undertake improvement efforts that emerge from the steps above, with a balanced focus on the three domains of well-being: efficiency of practice, culture of wellness, and personal resilience. Modify the number and intensity of interventions based on the group’s readiness and ability to control change in these domains. For example, some groups may have more excitement and ability to work on factors impacting the efficiency of practice, such as electronic health record templates, while others may wish to enhance opportunities for collegial interaction during the workday.
- Strive for codesign. Group members must be an integral part of the solution, rather than simply raise complaints with the expectation that leaders will devise solutions. Ideally, group members should have time, funding, or titles to lead improvement efforts.
- Opportunities to improve resilience and well-being should be widely available to all group members, but should not be mandatory.
CONCLUSION
The healthcare industry will continue to grapple with high rates of burnout and rapid change for the foreseeable future. We believe significant improvements in burnout rates and workplace experience can result from hospitalist-led interventions designed to improve experience of work among hospitalist clinicians, even as we await broader and necessary systematic efforts to address structural drivers of professional satisfaction. This work is vital if we are to honor our field’s history of productive innovation and navigate dynamic change in healthcare by attracting, engaging, developing, and retaining our most valuable asset: our people.
Disclosures
The authors declare they have no conflicts of interest/competing interests.
1. Kneeland PP, Kneeland C, Wachter RM. Bleeding talent: a lesson from industry on embracing physician workforce challenges. J Hosp Med. 2010;5(5):306-310. doi: 10.1002/jhm.594. PubMed
2. Shanafelt TD, Balch CM, Bechamps G, et al. Burnout and medical errors among American surgeons. Ann Surg. 2010;251(6):995-1000. doi: 10.1097/SLA.0b013e3181bfdab3. PubMed
3. Roberts DL, Shanafelt TD, Dyrbye LN, West CP. A national comparison of burnout and work-life balance among internal medicine hospitalists and outpatient general internists. J Hosp Med. 2014;9(3):176-181. doi: 10.1002/jhm.2146. PubMed
4. Shanafelt TD, Hasan O, Dyrbye LN, et al. Changes in burnout and satisfaction with work-life balance in physicians and the General US Working population between 2011 and 2014. Mayo Clin Proc. 2015;90(12):1600-1613. doi: 10.1016/j.mayocp.2015.08.023. PubMed
5. Vuong K. Turnover rate for hospitalist groups trending downward. The Hospitalist. http://www.thehospitalist.org/hospitalist/article/130462/turnover-rate-hospitalist-groups-trending-downward; 2017, Feb 1.
6. Hinami K, Whelan CT, Wolosin RJ, Miller JA, Wetterneck TB. Worklife and satisfaction of hospitalists: toward flourishing careers. J Gen Intern Med. 2012;27(1):28-36. doi: 10.1007/s11606-011-1780-z. PubMed
7. Farr C. Siren song of tech lures New Doctors away from medicine. Shots. Health news from NPR. https://www.npr.org/sections/health-shots/2015/07/19/423882899/siren-song-of-tech-lures-new-doctors-away-from-medicine; 2015, July 19.
8. Shanafelt TD, Balch CM, Bechamps G, et al. Burnout and medical errors among American surgeons. Ann Surg. 2010;251(6):995-1000. doi: 10.1097/SLA.0b013e3181bfdab3. PubMed
9. Dewa CS, Loong D, Bonato S, Thanh NX, Jacobs P. How does burnout affect physician productivity? A systematic literature review. BMC Health Serv Res. 2014;14:325. doi: 10.1186/1472-6963-14-325. PubMed
10. Panagioti M, Geraghty K, Johnson J, et al. Association between physician burnout and patient safety, professionalism, and patient satisfaction: A systematic review and meta-analysis. JAMA Intern Med. 2018;178(10):1317-1330. doi: 10.1001/jamainternmed.2018.3713. PubMed
11. Hall LH, Johnson J, Watt I, Tsipa A, O’Connor DB. Healthcare staff wellbeing, burnout, and patient safety: A systematic review PLOS ONE. 2016;11(7):e0159015. doi: 10.1371/journal.pone.0159015. PubMed
12. Panagioti M, Panagopoulou E, Bower P, et al. Controlled interventions to reduce burnout in physicians: A systematic review and meta-analysis. JAMA Intern Med. 2017;177(2):195-205. doi: 10.1001/jamainternmed.2016.7674. PubMed
13. West CP, Dyrbye LN, Erwin PJ, Shanafelt TD. Interventions to prevent and reduce physician burnout: a systematic review and meta-analysis. Lancet. 2016;388(10057):2272-2281. doi: 10.1016/S0140-6736(16)31279-X. PubMed
14. Maslach C, Schaufeli WB, Leiter MP. Job Burnout. Annu Rev Psychol. 2001;52:397-422. doi: 10.1146/annurev.psych.52.1.397. PubMed
15. Bohman B, Dyrbye L, Sinsky CA, et al. Physician well-being: the reciprocity of practice efficiency, culture of wellness, and personal resilience. NEJM Catalyst. 2017 Aug.
16. Sexton JB, Adair KC, Leonard MW, et al. Providing feedback following Leadership WalkRounds is associated with better patient safety culture, higher employee engagement and lower burnout. BMJ Qual Saf. 2018;27(4):261-270. doi: 10.1136/bmjqs-2016-006399. PubMed
17. Thomas LR, Ripp JA, West CP. Charter on physician well-being. JAMA. 2018;319(15):1541-1542. doi: 10.1001/jama.2018.1331. PubMed
18. American Medical Association. Nine Steps to Creating the Organizational Foundation for Joy in Medicine: culture of Wellness—track the business case for well-being. https://www.stepsforward.org/modules/joy-in-medicine.
© 2019 Society of Hospital Medicine
Negative Urinalyses in Febrile Infants Age 7 to 60 Days Treated for Urinary Tract Infection
The sensitivity of the urinalysis (UA) in young infants has been reported to be in the 75% to 85% range.1-4 This suboptimal sensitivity has prevented a widespread adoption of the UA as a true screening test for urinary tract infection (UTI). Although infants with a positive urine culture and a negative UA may have asymptomatic bacteriuria (AB) or contamination,5-7 they are often treated for UTI.
Due to these concerns, the American Academy of Pediatrics (AAP) recommended in their 2011 UTI Practice Guidelines that UA criteria should be incorporated into the definition of UTI.1 However, these guidelines were intended for the 2-24 month age range, leaving a gap in our understanding of the appropriate management of infants <2 months. It is unknown how UA results influence the current management of UTI in young, febrile infants. Using data from a large, nationally representative quality improvement project surrounding the management of febrile infants, this investigation aimed to examine how frequently infants are treated for UTI despite having normal UAs and to determine whether infant and hospital characteristics are different in infants treated for UTI with a positive UA as compared to those treated for UTI with a negative UA.
METHODS
Subjects and Setting
This is a secondary analysis of the AAP’s Reducing Excessive Variability in the Infant Sepsis Evaluation (REVISE) project that involved 20,570 well-appearing infants 7-60 days of age evaluated in the emergency department and/or inpatient setting for fever ≥38◦C without a source between September 2015 and November 2017 at 124 community- and university-based hospitals in the United States. Data were collected via chart review and entered into a standardized tool for the project. This project was deemed exempt by the AAP Institutional Review Board. Because all data were de-identified, some sites did not require Institutional Review Board approval while others required data sharing agreements.
Variables and Definitions
A positive UA was defined as having any leukocyte esterase, positive nitrites, or >5 white blood cells (WBCs) per high power field. Treatment for UTI was defined using the question “Did the urine culture grow an organism that was treated as a pathogen with a full course of antibiotics?” Subjects treated for meningitis or bacteremia were excluded in order to focus on uncomplicated UTI. “Abnormal inflammatory markers” were defined as having a WBC count <5,000 or >15,000 cells/mm3, an absolute band count ≥ 1,500 cells/mm3, a band to neutrophil ratio of >0.2, cerebrospinal fluid (CSF) WBC count of >8/mm3, a positive CSF gram stain, or an elevated C-reactive protein or procalcitonin level, as defined by the institutional range. Although technically not an “inflammatory marker,” CSF gram stain was included in this composite variable because in the rare cases that it is positive, the result would likely influence risk stratification and immediate management. Infants’ ages were categorized as either 7-30 days or 31-60 days. Hospital length-of-stay (LOS) was recorded to the nearest hour and infants who were not hospitalized were assigned a LOS of 0 hours. Hospital characteristics were determined through a survey completed by site leads.
Statistics
Proportions were compared using chi-square test. We used multilevel mixed-effects logistic regression to determine associations between patients and hospital characteristics and UA-positivity in subjects treated for UTI. We accounted for the hospital clustering effect with a random effect that did not vary with patient characteristics. We “marginalized” the regression coefficients to reflect the average effect across hospitals.8,9 We tested the overall importance of the hospital clustering effect on the treatment by comparing our multilevel model to a single-level model without hospital random effects using the likelihood ratio test.
RESULTS
A total of 20,570 infants from 124 hospitals were enrolled in the REVISE project, and 648 (3.2%) were treated for bacteremia and/or meningitis. Of the remaining 19,922 infants, 2,407 (12.1%) were treated for UTI, of whom 2,298 (95.5%) had an initial UA performed. Urine cultures were obtained by catheterization or suprapubic aspirate in 90.3% and “other/unknown” in 9.7% of these 2,298 subjects.
UAs were negative in 337/2,298 (14.7%) treated subjects. UA-negative subjects were more likely to be 7-30 days old (adjusted odds ratio [aOR] 1.3, 95% CI 1.02-1.7) and have upper respiratory symptoms (aOR 1.7, 95% CI 1.3-2.3) and were less likely to have abnormal inflammatory markers (aOR 0.3, 95% CI 0.3-0.4) than UA+ subjects (Table). Even after accounting for the hospital characteristics depicted in the Table, treatment of UA-negative UTI was affected by the hospital (P < .001), and the intraclass correlation coefficient was 6% (95% CI, 3% to 14%). The Figure illustrates substantial site variability in the proportion of infants treated for UTIs that were UA-negative, ranging from 0% to 35% in hospitals with ≥20 UTI cases.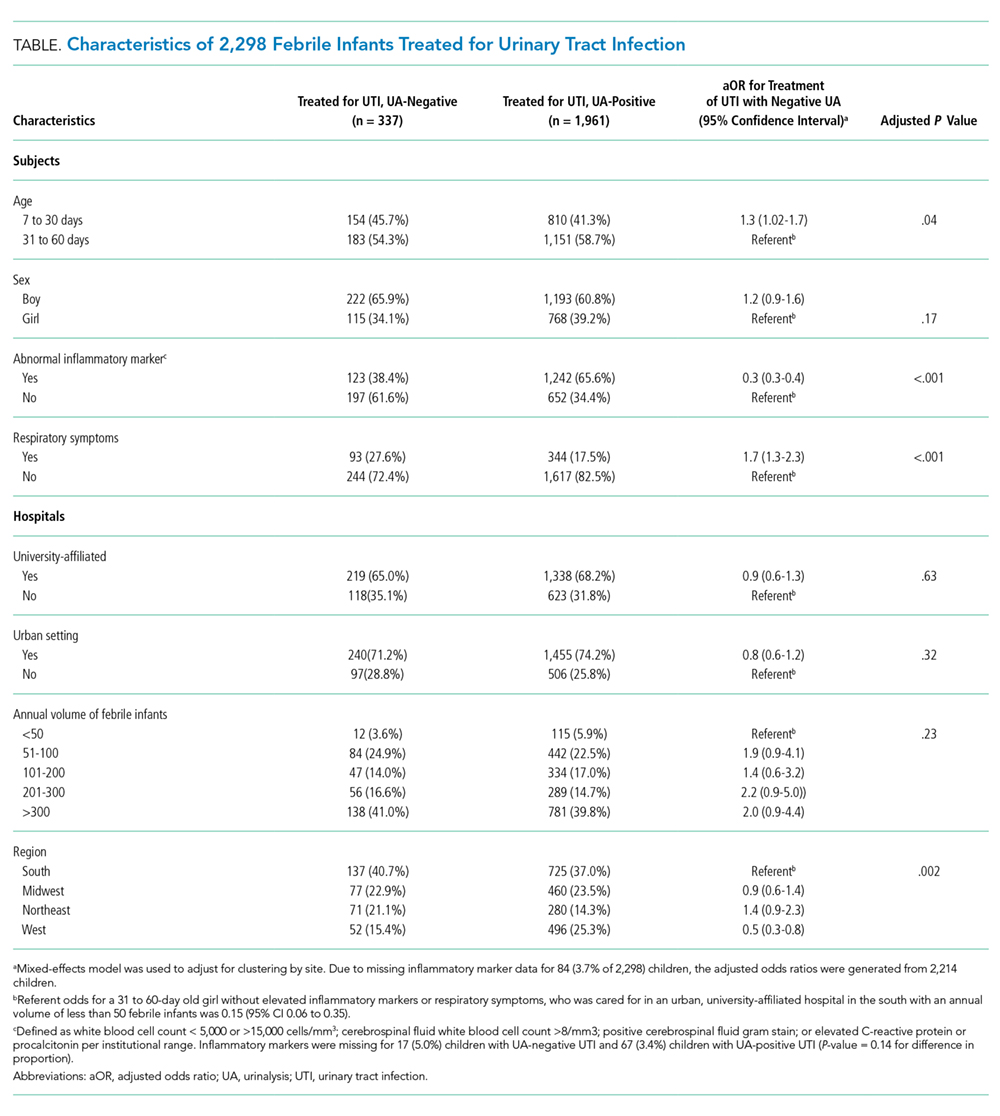
There was no significant difference in the proportion of catheterized specimens in infants treated for UTIs with negative versus positive UAs (90% vs 92%, P = .26). The median hospital (interquartile range) LOS in infants treated for UTI with positive UAs was 58 (45-78) hours, compared to 54 (38-76) hours in infants treated for UTI with negative UAs and 34 (0-49) hours in infants who were not treated for UTI, meningitis, or bacteremia.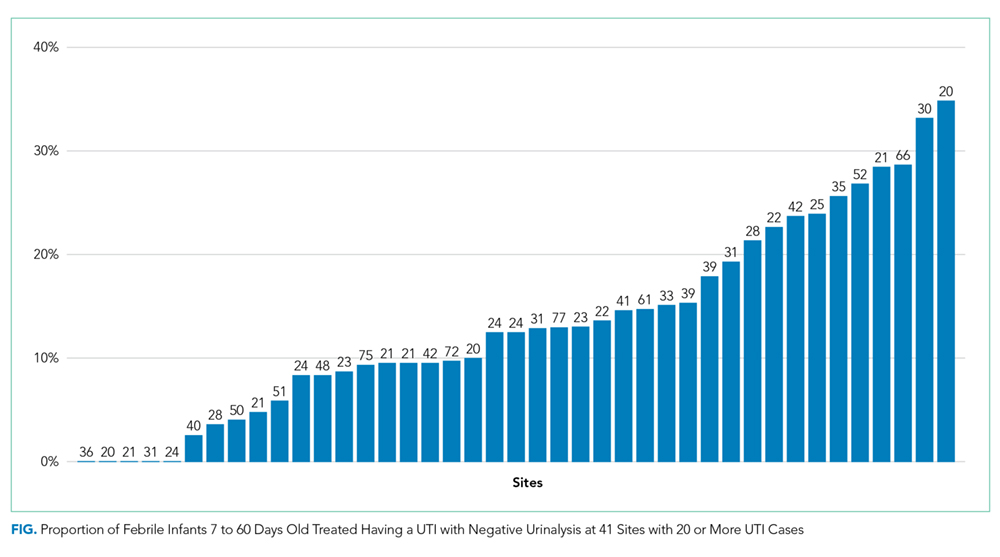
DISCUSSION
In this large, nationally representative sample of febrile infants 7-60 days of age, we demonstrate that nearly 15% of young febrile infants who are treated for UTIs have normal UAs. This proportion varied considerably among hospitals, suggesting that there are institutional differences in the approach to the UA. Infants treated for UA-negative UTIs were more likely to have respiratory symptoms and less likely to have abnormal inflammatory markers than infants treated for UA-positive UTIs, indicating that these infants are either developing a milder inflammatory response to their underlying illness and/or might not have true UTIs (eg due to AB or contamination).
The AAP recently updated their UTI practice parameter to recommend inclusion of UA results as diagnostic criteria for UTI.1 However, the fact that these guidelines do not include infants <2 months creates a gap in our understanding of the appropriate diagnostic criteria in this age group, as reflected by the site variability demonstrated in our investigation. The fact that up to 35% of infants treated for UTI at these different sites have normal UAs suggests that many practitioners continue to treat positive urine cultures regardless of UA values.
Several prior studies provide insight into the clinical significance of a positive urine culture in the absence of pyuria. Wettergren et al.6,7,10 reported growth from suprapubic aspirate in 1.4% of infants who were screened periodically with urine cultures obtained by bag at well-child checks over the course of the first year (with a point prevalence as high as 1.5% in boys aged 0.25 to 1.9 months).10 These infants were not more likely to have subsequent UTIs7 or renal damage6 than infants without asymptomatic growth, leading the authors to conclude that this growth likely represented AB. These findings emphasize that the probability of a positive urine culture in any infant, even asymptomatic infants, is not insignificant.
Hoberman et al.11 demonstrated that dimercaptosuccinic acid scans did not reveal signs of pyelonephritis in 14/15 children < 2 years of age with urine cultures growing >50,000 CFU/mL but no pyuria on UA, and concluded that AB was the most likely explanation for this combination of findings. Schroeder et al.5 and Tzimenatos et al.12 examined infants <2-3 months with UTI and bacteremia caused by the same organism (and hence a true infection that cannot be explained by AB or contamination) and demonstrated that the UA sensitivity in this population was 99.5% and 100%, respectively, suggesting that the prior lower estimates of UA sensitivity in UTI in general, may have been biased by inclusion of positive urine cultures that did not represent UTI.
On the other hand, Shaikh et al.13 recently demonstrated that the sensitivity of the UA appears to vary by organism, with lower reported sensitivity in non-Escherichia coli organisms, leading the authors to conclude that this variability is evidence of suboptimal UA sensitivity. However, an alternative explanation for their findings is that non-E coli organisms may be more likely to cause AB or contamination.14 The fact that follow-up suprapubic aspirates on infants with untreated catheterized cultures yielding these organisms are often negative supports this alternative explanation.15
The median LOS in infants with UA-negative UTI was nearly one day longer than infants not treated for serious bacterial infection. These infants may have also undergone urinary imaging and possibly prophylactic antibiotics, indicating high resource burden created by this subgroup of infants. Expanding AAP UTI guidelines to infants <2 months of age would likely reduce resource utilization, but continued research is needed to assess the safety of this approach. Young infants have immature immune systems and may not develop a timely inflammatory response to UTI, which raises concerns about missing bacterial infections.
Our investigation has several strengths, including the large, nationally representative sample that includes both children’s and non-children’s hospitals. Similar febrile infant investigations of this size have previously been possible only using administrative databases, but our investigation required chart review for all enrolled infants, ensuring that the subjects were febrile, well-appearing, and were treated for UTI. However, our findings are limited in that data were collected primarily as part of a quality improvement initiative, and some of our thresholds for “abnormal” laboratory values might be controversial. For example, urine WBC thresholds differ across studies, and our CSF WBC threshold of >8/mm3 may be somewhat low given prior reports that values slightly above this threshold might be normal in infants under one month of age.16 The original intent of the inflammatory marker composite variable was to aid in risk stratification, but we were unable to collect granular data for all potentially relevant variables. In planning the REVISE project, we attempted to create straightforward, unambiguous variables to facilitate the anticipated high volume of chart reviews. Although patients categorized as having UTI might not have had true UTIs, by linking the “UTI” variable to practitioner management (rather than UA and microbiologic definitions), our data reflect real-world practice.
Acknowledgments
The authors would like to thank all of the site directors who participated in the REVISE project, and Brittany Jennings, Naji Hattar, Faiza Wasif, and Vanessa Shorte at the American Academy of Pediatrics for their leadership and management.
Disclosures
Dr. Schroeder has received honoraria for grand rounds presentations on the subject of urinary tract infections, and Dr. Biondi has received consulting fees from McKesson Inc. The other authors have no financial relationships to disclose.
1. Roberts KB. Urinary tract infection: Clinical practice guideline for the diagnosis and management of the initial UTI in febrile infants and children 2 to 24 months. Pediatrics. 2011;128(3):595-610. doi: 10.1542/peds.2011-1330. PubMed
2. Bachur R, Harper MB. Reliability of the urinalysis for predicting urinary tract infections in young febrile children. Arch Pediatr Adolesc Med. 2001;155(1):60. doi: 10.1001/archpedi.155.1.60. PubMed
3. Bonadio W, Maida G. Urinary tract infection in outpatient febrile infants younger than 30 days of age. Pediatr Infect Dis J. 2014;33(4):342-344. doi: 10.1097/inf.0000000000000110. PubMed
4. Hoberman A, Wald ER. Urinary tract infections in young febrile children. Pediatr Infect Dis J. 1997;16(1):11-17. doi: 10.1097/00006454-199701000-00004. PubMed
5. Schroeder AR, Chang PW, Shen MW, Biondi EA, Greenhow TL. Diagnostic accuracy of the urinalysis for urinary tract infection in infants <3 months of age. Pediatrics. 2015;135(6). doi: 10.1542/peds.2015-0012d. PubMed
6. Wettergren B, Hellstrom M, Stokland E, Jodal U. Six-year follow up of infants with bacteriuria on screening. BMJ. 1990;301(6756):845-848. doi: 10.1136/bmj.301.6756.845. PubMed
7. Wettergren B, Jodal U. Spontaneous clearance of asymptomatic bacteriuria in infants. Acta Paediatrica. 1990;79(3):300-304. doi: 10.1111/j.1651-2227.1990.tb11460.x. PubMed
8. Hedeker D, Toit SHCD, Demirtas H, Gibbons RD. A note on the marginalization of regression parameters from mixed models of binary outcomes. Biometrics. 2017;74(1):354-361. doi: 10.1111/biom.12707. PubMed
9. Neuhaus JM, Kalbfleisch JD, Hauck WW. A comparison of cluster-specific and population-averaged approaches for analyzing correlated binary data. Int Stat Rev. 1991;59(1):25. doi: 10.2307/1403572.
10. Wettergren B, Jodal U, Jonasson G. Epidemiology of bacteriuria during the first year of life. Acta Paediatrica. 1985;74(6):925-933. doi: 10.1111/j.1651-2227.1985.tb10059.x. PubMed
11. Hoberman A, Wald ER, Reynolds EA, Penchansky L, Charron M. Is urine culture necessary to rule out urinary tract infection in young febrile children? Pediatr Infect Dis J. 1996;15(4):304-309. doi: 10.1097/00006454-199604000-00005. PubMed
12. Tzimenatos L, Mahajan P, Dayan PS, et al. Accuracy of the urinalysis for urinary tract infections in febrile infants 60 days and younger. Pediatrics. 2018;141(2). doi: 10.1542/peds.2017-3068. PubMed
13. Shaikh N, Shope TR, Hoberman A, Vigliotti A, Kurs-Lasky M, Martin JM. Association between uropathogen and pyuria. Pediatrics. 2016;138(1). doi: 10.1542/peds.2016-0087. PubMed
14. Schroeder AR. UTI and faulty gold standards. Pediatrics. 2017;139(3). doi: 10.1542/peds.2016-3814a. PubMed
15. Eliacik K, Kanik A, Yavascan O, et al. A comparison of bladder catheterization and suprapubic aspiration methods for urine sample collection from infants with a suspected urinary tract infection. Clinical Pediatrics. 2016;55(9):819-824. doi: 10.1177/0009922815608278. PubMed
16. Thomson J, Sucharew H, Cruz AT, et al. Cerebrospinal fluid reference values for young infants undergoing lumbar puncture. Pediatrics. 2018;141(3). doi: 10.1542/peds.2017-3405. PubMed
The sensitivity of the urinalysis (UA) in young infants has been reported to be in the 75% to 85% range.1-4 This suboptimal sensitivity has prevented a widespread adoption of the UA as a true screening test for urinary tract infection (UTI). Although infants with a positive urine culture and a negative UA may have asymptomatic bacteriuria (AB) or contamination,5-7 they are often treated for UTI.
Due to these concerns, the American Academy of Pediatrics (AAP) recommended in their 2011 UTI Practice Guidelines that UA criteria should be incorporated into the definition of UTI.1 However, these guidelines were intended for the 2-24 month age range, leaving a gap in our understanding of the appropriate management of infants <2 months. It is unknown how UA results influence the current management of UTI in young, febrile infants. Using data from a large, nationally representative quality improvement project surrounding the management of febrile infants, this investigation aimed to examine how frequently infants are treated for UTI despite having normal UAs and to determine whether infant and hospital characteristics are different in infants treated for UTI with a positive UA as compared to those treated for UTI with a negative UA.
METHODS
Subjects and Setting
This is a secondary analysis of the AAP’s Reducing Excessive Variability in the Infant Sepsis Evaluation (REVISE) project that involved 20,570 well-appearing infants 7-60 days of age evaluated in the emergency department and/or inpatient setting for fever ≥38◦C without a source between September 2015 and November 2017 at 124 community- and university-based hospitals in the United States. Data were collected via chart review and entered into a standardized tool for the project. This project was deemed exempt by the AAP Institutional Review Board. Because all data were de-identified, some sites did not require Institutional Review Board approval while others required data sharing agreements.
Variables and Definitions
A positive UA was defined as having any leukocyte esterase, positive nitrites, or >5 white blood cells (WBCs) per high power field. Treatment for UTI was defined using the question “Did the urine culture grow an organism that was treated as a pathogen with a full course of antibiotics?” Subjects treated for meningitis or bacteremia were excluded in order to focus on uncomplicated UTI. “Abnormal inflammatory markers” were defined as having a WBC count <5,000 or >15,000 cells/mm3, an absolute band count ≥ 1,500 cells/mm3, a band to neutrophil ratio of >0.2, cerebrospinal fluid (CSF) WBC count of >8/mm3, a positive CSF gram stain, or an elevated C-reactive protein or procalcitonin level, as defined by the institutional range. Although technically not an “inflammatory marker,” CSF gram stain was included in this composite variable because in the rare cases that it is positive, the result would likely influence risk stratification and immediate management. Infants’ ages were categorized as either 7-30 days or 31-60 days. Hospital length-of-stay (LOS) was recorded to the nearest hour and infants who were not hospitalized were assigned a LOS of 0 hours. Hospital characteristics were determined through a survey completed by site leads.
Statistics
Proportions were compared using chi-square test. We used multilevel mixed-effects logistic regression to determine associations between patients and hospital characteristics and UA-positivity in subjects treated for UTI. We accounted for the hospital clustering effect with a random effect that did not vary with patient characteristics. We “marginalized” the regression coefficients to reflect the average effect across hospitals.8,9 We tested the overall importance of the hospital clustering effect on the treatment by comparing our multilevel model to a single-level model without hospital random effects using the likelihood ratio test.
RESULTS
A total of 20,570 infants from 124 hospitals were enrolled in the REVISE project, and 648 (3.2%) were treated for bacteremia and/or meningitis. Of the remaining 19,922 infants, 2,407 (12.1%) were treated for UTI, of whom 2,298 (95.5%) had an initial UA performed. Urine cultures were obtained by catheterization or suprapubic aspirate in 90.3% and “other/unknown” in 9.7% of these 2,298 subjects.
UAs were negative in 337/2,298 (14.7%) treated subjects. UA-negative subjects were more likely to be 7-30 days old (adjusted odds ratio [aOR] 1.3, 95% CI 1.02-1.7) and have upper respiratory symptoms (aOR 1.7, 95% CI 1.3-2.3) and were less likely to have abnormal inflammatory markers (aOR 0.3, 95% CI 0.3-0.4) than UA+ subjects (Table). Even after accounting for the hospital characteristics depicted in the Table, treatment of UA-negative UTI was affected by the hospital (P < .001), and the intraclass correlation coefficient was 6% (95% CI, 3% to 14%). The Figure illustrates substantial site variability in the proportion of infants treated for UTIs that were UA-negative, ranging from 0% to 35% in hospitals with ≥20 UTI cases.
There was no significant difference in the proportion of catheterized specimens in infants treated for UTIs with negative versus positive UAs (90% vs 92%, P = .26). The median hospital (interquartile range) LOS in infants treated for UTI with positive UAs was 58 (45-78) hours, compared to 54 (38-76) hours in infants treated for UTI with negative UAs and 34 (0-49) hours in infants who were not treated for UTI, meningitis, or bacteremia.
DISCUSSION
In this large, nationally representative sample of febrile infants 7-60 days of age, we demonstrate that nearly 15% of young febrile infants who are treated for UTIs have normal UAs. This proportion varied considerably among hospitals, suggesting that there are institutional differences in the approach to the UA. Infants treated for UA-negative UTIs were more likely to have respiratory symptoms and less likely to have abnormal inflammatory markers than infants treated for UA-positive UTIs, indicating that these infants are either developing a milder inflammatory response to their underlying illness and/or might not have true UTIs (eg due to AB or contamination).
The AAP recently updated their UTI practice parameter to recommend inclusion of UA results as diagnostic criteria for UTI.1 However, the fact that these guidelines do not include infants <2 months creates a gap in our understanding of the appropriate diagnostic criteria in this age group, as reflected by the site variability demonstrated in our investigation. The fact that up to 35% of infants treated for UTI at these different sites have normal UAs suggests that many practitioners continue to treat positive urine cultures regardless of UA values.
Several prior studies provide insight into the clinical significance of a positive urine culture in the absence of pyuria. Wettergren et al.6,7,10 reported growth from suprapubic aspirate in 1.4% of infants who were screened periodically with urine cultures obtained by bag at well-child checks over the course of the first year (with a point prevalence as high as 1.5% in boys aged 0.25 to 1.9 months).10 These infants were not more likely to have subsequent UTIs7 or renal damage6 than infants without asymptomatic growth, leading the authors to conclude that this growth likely represented AB. These findings emphasize that the probability of a positive urine culture in any infant, even asymptomatic infants, is not insignificant.
Hoberman et al.11 demonstrated that dimercaptosuccinic acid scans did not reveal signs of pyelonephritis in 14/15 children < 2 years of age with urine cultures growing >50,000 CFU/mL but no pyuria on UA, and concluded that AB was the most likely explanation for this combination of findings. Schroeder et al.5 and Tzimenatos et al.12 examined infants <2-3 months with UTI and bacteremia caused by the same organism (and hence a true infection that cannot be explained by AB or contamination) and demonstrated that the UA sensitivity in this population was 99.5% and 100%, respectively, suggesting that the prior lower estimates of UA sensitivity in UTI in general, may have been biased by inclusion of positive urine cultures that did not represent UTI.
On the other hand, Shaikh et al.13 recently demonstrated that the sensitivity of the UA appears to vary by organism, with lower reported sensitivity in non-Escherichia coli organisms, leading the authors to conclude that this variability is evidence of suboptimal UA sensitivity. However, an alternative explanation for their findings is that non-E coli organisms may be more likely to cause AB or contamination.14 The fact that follow-up suprapubic aspirates on infants with untreated catheterized cultures yielding these organisms are often negative supports this alternative explanation.15
The median LOS in infants with UA-negative UTI was nearly one day longer than infants not treated for serious bacterial infection. These infants may have also undergone urinary imaging and possibly prophylactic antibiotics, indicating high resource burden created by this subgroup of infants. Expanding AAP UTI guidelines to infants <2 months of age would likely reduce resource utilization, but continued research is needed to assess the safety of this approach. Young infants have immature immune systems and may not develop a timely inflammatory response to UTI, which raises concerns about missing bacterial infections.
Our investigation has several strengths, including the large, nationally representative sample that includes both children’s and non-children’s hospitals. Similar febrile infant investigations of this size have previously been possible only using administrative databases, but our investigation required chart review for all enrolled infants, ensuring that the subjects were febrile, well-appearing, and were treated for UTI. However, our findings are limited in that data were collected primarily as part of a quality improvement initiative, and some of our thresholds for “abnormal” laboratory values might be controversial. For example, urine WBC thresholds differ across studies, and our CSF WBC threshold of >8/mm3 may be somewhat low given prior reports that values slightly above this threshold might be normal in infants under one month of age.16 The original intent of the inflammatory marker composite variable was to aid in risk stratification, but we were unable to collect granular data for all potentially relevant variables. In planning the REVISE project, we attempted to create straightforward, unambiguous variables to facilitate the anticipated high volume of chart reviews. Although patients categorized as having UTI might not have had true UTIs, by linking the “UTI” variable to practitioner management (rather than UA and microbiologic definitions), our data reflect real-world practice.
Acknowledgments
The authors would like to thank all of the site directors who participated in the REVISE project, and Brittany Jennings, Naji Hattar, Faiza Wasif, and Vanessa Shorte at the American Academy of Pediatrics for their leadership and management.
Disclosures
Dr. Schroeder has received honoraria for grand rounds presentations on the subject of urinary tract infections, and Dr. Biondi has received consulting fees from McKesson Inc. The other authors have no financial relationships to disclose.
1. Roberts KB. Urinary tract infection: Clinical practice guideline for the diagnosis and management of the initial UTI in febrile infants and children 2 to 24 months. Pediatrics. 2011;128(3):595-610. doi: 10.1542/peds.2011-1330. PubMed
2. Bachur R, Harper MB. Reliability of the urinalysis for predicting urinary tract infections in young febrile children. Arch Pediatr Adolesc Med. 2001;155(1):60. doi: 10.1001/archpedi.155.1.60. PubMed
3. Bonadio W, Maida G. Urinary tract infection in outpatient febrile infants younger than 30 days of age. Pediatr Infect Dis J. 2014;33(4):342-344. doi: 10.1097/inf.0000000000000110. PubMed
4. Hoberman A, Wald ER. Urinary tract infections in young febrile children. Pediatr Infect Dis J. 1997;16(1):11-17. doi: 10.1097/00006454-199701000-00004. PubMed
5. Schroeder AR, Chang PW, Shen MW, Biondi EA, Greenhow TL. Diagnostic accuracy of the urinalysis for urinary tract infection in infants <3 months of age. Pediatrics. 2015;135(6). doi: 10.1542/peds.2015-0012d. PubMed
6. Wettergren B, Hellstrom M, Stokland E, Jodal U. Six-year follow up of infants with bacteriuria on screening. BMJ. 1990;301(6756):845-848. doi: 10.1136/bmj.301.6756.845. PubMed
7. Wettergren B, Jodal U. Spontaneous clearance of asymptomatic bacteriuria in infants. Acta Paediatrica. 1990;79(3):300-304. doi: 10.1111/j.1651-2227.1990.tb11460.x. PubMed
8. Hedeker D, Toit SHCD, Demirtas H, Gibbons RD. A note on the marginalization of regression parameters from mixed models of binary outcomes. Biometrics. 2017;74(1):354-361. doi: 10.1111/biom.12707. PubMed
9. Neuhaus JM, Kalbfleisch JD, Hauck WW. A comparison of cluster-specific and population-averaged approaches for analyzing correlated binary data. Int Stat Rev. 1991;59(1):25. doi: 10.2307/1403572.
10. Wettergren B, Jodal U, Jonasson G. Epidemiology of bacteriuria during the first year of life. Acta Paediatrica. 1985;74(6):925-933. doi: 10.1111/j.1651-2227.1985.tb10059.x. PubMed
11. Hoberman A, Wald ER, Reynolds EA, Penchansky L, Charron M. Is urine culture necessary to rule out urinary tract infection in young febrile children? Pediatr Infect Dis J. 1996;15(4):304-309. doi: 10.1097/00006454-199604000-00005. PubMed
12. Tzimenatos L, Mahajan P, Dayan PS, et al. Accuracy of the urinalysis for urinary tract infections in febrile infants 60 days and younger. Pediatrics. 2018;141(2). doi: 10.1542/peds.2017-3068. PubMed
13. Shaikh N, Shope TR, Hoberman A, Vigliotti A, Kurs-Lasky M, Martin JM. Association between uropathogen and pyuria. Pediatrics. 2016;138(1). doi: 10.1542/peds.2016-0087. PubMed
14. Schroeder AR. UTI and faulty gold standards. Pediatrics. 2017;139(3). doi: 10.1542/peds.2016-3814a. PubMed
15. Eliacik K, Kanik A, Yavascan O, et al. A comparison of bladder catheterization and suprapubic aspiration methods for urine sample collection from infants with a suspected urinary tract infection. Clinical Pediatrics. 2016;55(9):819-824. doi: 10.1177/0009922815608278. PubMed
16. Thomson J, Sucharew H, Cruz AT, et al. Cerebrospinal fluid reference values for young infants undergoing lumbar puncture. Pediatrics. 2018;141(3). doi: 10.1542/peds.2017-3405. PubMed
© 2019 Society of Hospital Medicine
Deimplementation of Routine Chest X-rays in Adult Intensive Care Units
Despite increased awareness of Choosing Wisely (CW)® recommendations to reduce low-value care,1 there is limited published data about strategies to implement these guidelines or evidence that they have influenced ordering patterns or reduced healthcare spending
In ICUs, CXR ordering strategies may be routine (daily) or on-demand (with clinical indication). The former strategy’s principal advantage is the potential to detect life-threatening situations that may otherwise escape diagnosis.11 Disadvantages include cost, radiation exposure, patient inconvenience, false-positive workups, and low diagnostic and therapeutic value.12,13 On-demand strategies may safely reduce CXR ordering by 32% to 45%.11-17 Based on this evidence, the Critical Care Societies Collaborative and the American College of Radiology have recommended on-demand CXR ordering.18,19 Here, we describe the effectiveness of an intervention to reduce CXR ordering in two ICUs while evaluating the deimplementation strategies using a validated framework.
METHODS
Setting and Design
Vanderbilt University Medical Center (VUMC) is an academic referral center in Nashville, Tennessee. The cardiovascular ICU (CVICU) has 27 beds and the medical ICU (MICU) has 34 beds. Acute care nurse practitioners (ACNPs) and two critical care physicians staff the CVICU; cardiology fellows, anesthesia critical care fellows, and transplant and cardiac surgeons are also active in patient care. The MICU is staffed by two critical care physicians who supervise one team of ACNPs and two teams of medical residents who rotate through the unit every two weeks. Each MICU team is assigned a fellow in pulmonary and critical care.
We conducted a prospective, nonrandomized study in these units from October 2015 to June 2016. The VUMC Institutional Review Board approved the intervention as a quality improvement (QI) activity, waiving the requirement for informed consent.
Intervention
Following the top CW recommendation of the Critical Care Societies Collaborative—“Don’t order diagnostic tests at regular intervals (such as every day), but rather in response to specific clinical questions.”19—the VUMC resident-led CW Steering Committee designed a multifaceted approach to reduce ordering of routine CXRs in ICUs. The intervention included a didactic session on CW and proper CXR ordering practices, peer champions, data audits, and feedback to providers through weekly e-mails (see Supplemental Materials, 1 – Resident Presentation and 2 – CXR Flyer). 20
In September 2015, CVICU and MICU teams received a didactic session highlighting CW, current CXR ordering rates, and the plan for reducing CXR ordering. On October 5, 2015, teams began receiving weekly e-mails with ordering rates defined as CXRs ordered per patient per day and a brief rationale for reducing unnecessary CXRs. To encourage friendly competition, we provided weekly rates to the MICU teams, allowing for transparent benchmarking against one another. A similar competition strategy was not used in the CVICU due to the lack of multiple teams.
In the CVICU, two ACNPs volunteered as peer champions. These champions coordinated data feedback and advocated for the intervention among their colleagues. In the MICU, three internal medicine residents volunteered as peer champions and fulfilled similar roles.
To facilitate deimplementation, we conducted two Plan-Do-Study-Act (PDSA) cycles, the first from November to mid-December 2015 and the second from mid-December 2015 to mid-January 2016. During these cycles, we tailored our deimplementation strategy based on barriers identified by the peer champions and ICU leaders (described in the Qualitative Results section). Peer champions and the CW Steering Committee generated potential solutions by conversing with stakeholders and using the Expert Recommendations for Implementing Change (ERIC).20 Interventions included disseminating promotional flyers, holding meetings with stakeholders, and providing monthly CXR ordering rates. After the PDSA cycles, we continued reexamining the deimplementation efforts by reviewing ordering rates and soliciting feedback from ICU leaders and peer champions. However, no significant changes to the intervention were made during this time.
Quantitative Evaluation
We extracted data from VUMC’s Enterprise Data Warehouse during the intervention period (October 5, 2015 to May 24, 2016) and a historical control period (October 1, 2014 to October 4, 2015). Within each ICU, descriptive statistics were used to compare patient cohorts in the baseline and intervention periods by age, sex, and race.
The primary outcome was CXRs ordered per patient per day by hospital unit (CVICU or MICU). The baseline period included all data between October 1, 2014 and September 15, 2015. To account for priming of providers from didactic education, we allowed a washout period from September 16, 2015 to October 4, 2015. As a preliminary analysis, we compared CXR rates in the baseline and intervention periods using Wilcoxon rank-sum tests. We then conducted interrupted time-series analyses with segmented linear regression to assess differences in linear trends in CXR rates over the two periods. To account for different staffing models in the MICU, we stratified the impact of the intervention by team—medical resident (physician) or ACNP. R version 3.4.0 was used for statistical analysis.21
Qualitative Evaluation
Our qualitative evaluation consisted of embedded observation and semistructured interviews with stakeholders. The qualitative portion was guided by the Consolidated Framework for Implementation Research (CFIR), a widely used framework for design and evaluation of improvement initiatives that helped us to determine major facilitators and barriers to implementation.22,23
Embedded Observation
From November 2015 to January 2016, we observed morning rounds in the CVICU and MICU one to two times weekly to understand factors facilitating and inhibiting uptake of the intervention. Observations were recorded and organized using a CFIR-based template and directed toward understanding interactions among team members (eg, the decision-making process hierarchy), team workflows and decision-making processes, process of ordering CXRs, and providers’ knowledge and perceptions of the CXR intervention (see Supplemental Material, 3 – CFIR Table).22,23 After rounds, ICU team members were invited to share suggestions for improving the intervention. All observations occurred during and shortly following morning rounds when the vast majority of routine CXRs are ordered; we did not evaluate night or evening workflows. In the spirit of continuous improvement, we evaluated data in real-time.
Semistructured Interviews
Based on the direct observations, we developed semistructured interview questions to further evaluate provider perspectives (eg, “Do you believe ICU patients need a daily CXR?”) and constructs aligning with CFIR (eg, “intervention source—internally vs externally developed;” see Supplemental Material, 4 – Interview Questions).
Stakeholders from both ICUs were recruited through e-mail and in-person requests to participate in semistructured interviews. In the CVICU, we interviewed critical care physicians, anesthesia critical care fellows, and ACNPs. In the MICU, we interviewed medical students, interns, residents, critical care fellows, attending intensivist physicians, and ACNPs. We also interviewed X-ray technologists who routinely perform portable films in the units.
RESULTS
Quantitative Results

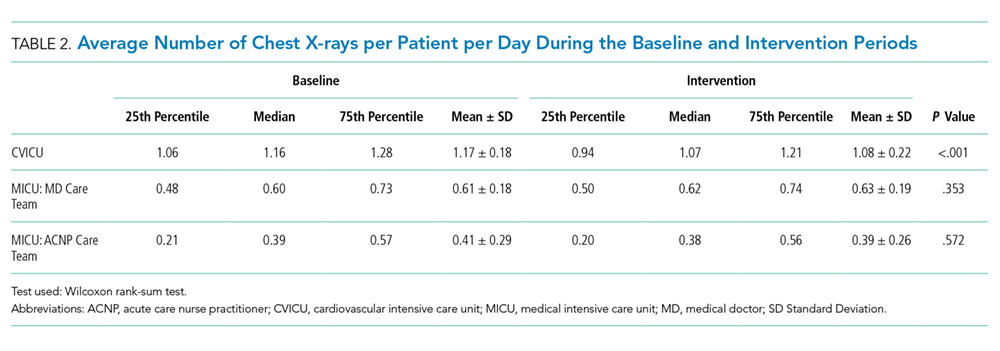
Cardiovascular Intensive Care Unit
The median baseline CXR ordering rate in the CVICU was 1.16 CXRs per patient per day, with interquartile range (IQR) 1.06-1.28. During the intervention period, the rate dropped to 1.07 (IQR 0.94-1.21; P < .001; Table 2). The time-series analysis suggested an essentially flat trend during the baseline period, followed by a small but significant drop in ordering rates during the intervention period (P < .001; Table 3 and Figure 1). Ordering rates appeared to increase slightly over the course of the intervention period, but this slight upward trend was not significantly different from the flat trend seen during the baseline period.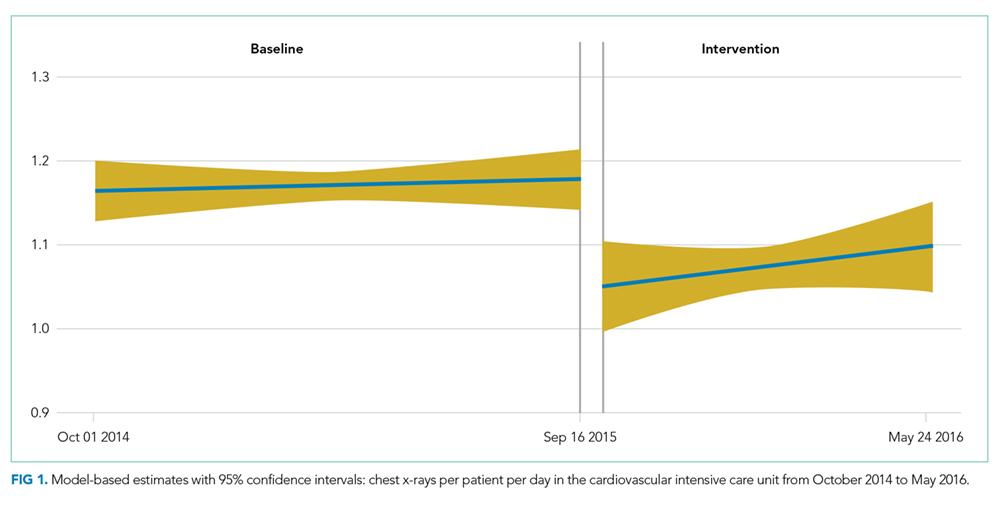
Medical Intensive Care Unit
For both physician and ACPN teams, the median baseline CXR ordering rates in the MICU were much lower than the baseline rate in the CVICU (Table 2). For the MICU physician care team, the baseline CXR ordering rate was 0.60 CXRs per patient per day (IQR 0.48-0.73). For the ACNP team, the median rate was 0.39 CXRs per patient per day (IQR 0.21-0.57). Both rates stayed approximately the same during the intervention period (Table 2). The time-series analysis suggested a statistically significant but very slight downward trend in CXR ordering rates during the baseline period, in the physician (P = .011) and ACNP (P = .022) teams (Table 3, Figure 2). Under this model, a small increase in CXR ordering initially occurred during the intervention period for both physician and ACNP teams (P = .010 and P = .055, respectively), after which the rates declined slightly. Trends in ordering rates during the intervention period were not significantly different from the slight downward trends seen during the baseline period.
Qualitative Results
We identified 25 of 39 CFIR constructs as relevant to the initiative (see Supplemental Materials, 3 – CFIR Table.) We determined the major facilitators of deimplementation to be peer champion discussions about CXR ordering on rounds and weekly data feedback, particularly if accompanied by in-person follow-up.
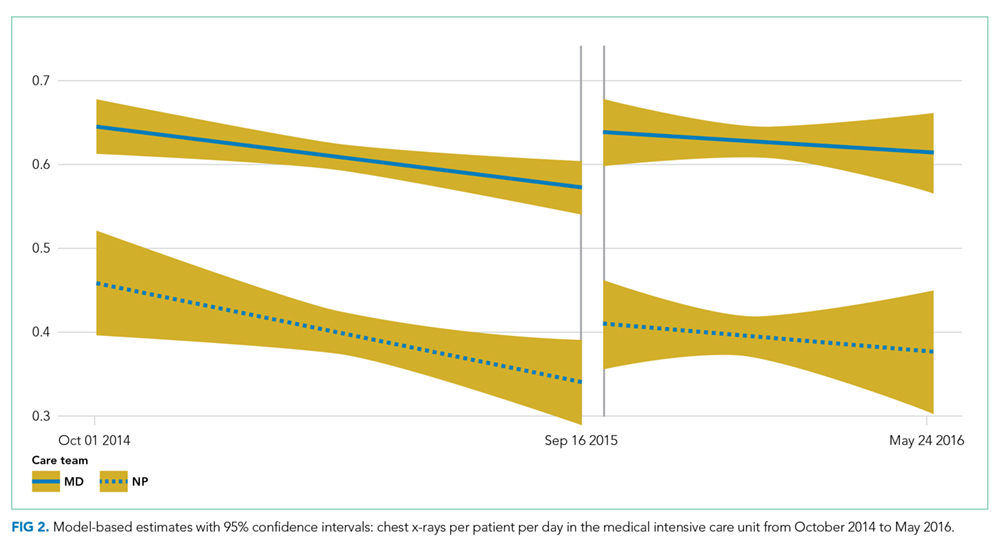
We also noted differences in CXR ordering rationales and decisions between the units. Generally, residents in the MICU and ACNPs in the CVICU made decisions to order CXRs. However, decisions were influenced by the expectations of attending physicians. While CVICU providers tended to order CXRs reflexively as part of morning labs, MICU providers—in particular, ACNPs who had been trained on indications for proper CXR ordering—generally ordered CXRs for specific indications (eg, worsening respiratory status). Of note, MICU ACNPs reported the use of bedside ultrasound as an alternate imaging modality and a reason for their higher threshold to order CXRs.
Deimplementation barriers in both units included the need to identify goal CXR ordering rates and the intervention’s limited visibility. To address these barriers, we conducted PDSA cycles and used the CFIR and ERIC to generate potential solutions.24 We established a goal of a 20% absolute reduction in the CVICU, added monthly CXR rates to weekly e-mail reports to better account for variations in patient populations and ordering practices, and circulated materials to promote on-demand CXR ordering. Promotional materials contained guidelines on CXR ordering and five “Frequently Held Misconceptions” about ordering practices with succinct, evidence-based explanations (see Supplemental Material, 2 – CXR Flyer).
Approximately four months after the start of intervention, some CVICU physicians became concerned that on-demand CXR ordering might be inappropriate for high-risk surgical patients, including those who are undergoing or have undergone heart transplants, lung transplants, or left-ventricular assist device placement. This concern arose following two adverse outcomes, which were not attributed to the CXR initiative, but which heightened concerns about patient safety. A rise in CXR ordering then occurred, and CVICU providers requested that we perform an analysis of these high-risk groups. While segmented linear regression in this subgroup suggested that average daily CXR ordering rates did decrease among the high-risk group at the start of the intervention period (P = .001), the difference between the rates in the two periods was not significant using the Wilcoxon rank-sum test. Exclusion of these patients from the main analysis did not alter the interpretation of the findings reported above for the CVICU.
DISCUSSION
A deimplementation intervention using provider education, peer champions, and data feedback was associated with fewer CXRs in the CVICU (P < .001) but not in the MICU. The CFIR-guided qualitative analysis was valuable for evaluating our deimplementation strategy and for identifying differences between the two ICUs.
Relatively few studies have demonstrated effective interventions that address CW recommendations.25-28 However, three population-level analyses of insurance claims show mixed results.3,4,29 Experts have thus proposed using implementation science to improve uptake of CW recommendations.2,3,7,8 Our study demonstrates the effectiveness of this approach. As expected, providers largely endorsed an on-demand CXR ordering strategy. Using the CFIR, however, we discovered barriers (eg, concern that data feedback did not reflect variations in patients’ needs). Using methods from implementation science allowed us to diagnose and tailor our approaches.
Our qualitative evaluation suggested that the intervention was ineffective mostly due to CFIR’s “inner setting” constructs, including resident fatigue, competing priorities, and decreased investment in QI projects because of the rotating nature of providers in training. Baseline CXR ordering rates in the MICU were also considerably lower than in the CVICU. We observed that CVICU providers ordered many CXRs following the placement of lines or tubes and that ACNPs in the MICU had received education on appropriate CXR ordering practices and had access to an alternate imaging modality in ultrasound. These factors may partially explain the difference in baseline rates.
As noted in a study of cardiac stress testing guidelines, the existence of high-value care recommendations does not mean overuse.30 Indeed, the lack of significant CXR over-ordering in the MICU highlights the importance of baseline measurement and partnering with information technology departments to create the best possible data feedback systems.30-32 Our experience shows that these systems should provide sufficient pre-implementation data (ideally >1 year), such that teams selecting QI projects can ensure that a project is a good use of institutional resources and change capital.
To inform future work, we informally assessed program costs and savings. We estimate the initiative cost $1,600, including $1,000 for curriculum development and teaching time, $300 for educational materials, and $300 for CXR tracking dashboard development. Hospital charges and reimbursements for CXR vary widely.33 We calculated savings using a range of rates, from a conservative $23 (the Medicare reimbursement rate for single-view CXR, CPT code 71010, global fee) to $50 (an approximate blended reimbursement rate across payers).34,35 In the CVICU, we estimate that 51 CXRs were avoided each month, saving $1,173-$2,550 per month or $9,384-$20,400 over eight months of follow-up. Annualizing these figures, we estimate net savings of $12,476-$29,000 in the first year in a 27-bed ICU. Costs to continue the program include education of new employees, booster training, and dashboard maintenance for an estimated annual cost of $1,000. It is difficult to estimate effectiveness over time, but if we conservatively assume that 30 CXRs were avoided each month, then the projected savings would be $8,280-$18,000 per year or an annual net savings of $7,280-$17,000 in the ICU. Although these amounts are modest, providing trainees with experiential learning opportunities in high-value care is valuable in its own right, meets curricular goals, may result in spill-over effects to other diagnostic and therapeutic decisions, and may influence long-term practice patterns. Institutional decisions to pursue projects such as this should take into account these potential benefits.
This evaluation is not without limitations. First, the study was conducted in a single tertiary-care hospital, potentially limiting its generalizability.36 Second, the study design lacked a concurrent control group, and observed outcomes may have been influenced by broader CXR utilization trends, increased awareness of low-value care generally or from previous CW projects at VUMC, seasonal effects, or the Hawthorne effect. Third, the study outcome was all CXRs ordered, rather than CXRs that were unnecessary or not clinically indicated. We chose all CXRs because it was more pragmatic, did not require clinical case review, and could be incorporated promptly into dashboards, enabling timely performance feedback. Other performance measures have taken a similar tack (eg, tracking all-cause readmissions rather than preventable readmissions). Given this approach, we did not track clinical indications for CXRs (eg, central line placement). Fourth, although we compared resident and APRN orders, we did not collect data on other provider characteristics such as years in/out of training or board certification status. These considerations should be addressed in future research.
Finally, the increase in CVICU CXR ordering at the end of the intervention period, which occurred following two adverse events, raises concerns about sustainability. While unrelated to CXR orders, the events resulted in increased ordering of diagnostic tests and showed the difficulty of deimplementation in ICUs. Indeed, some CVICU providers argued that on-demand CXR ordering represented minimal potential cost savings and had not been studied among heart and lung transplant patients. Subsequently, Tonna et al. have shown that on-demand CXR ordering can be safely implemented among such patients.37 Also similar to our study, Tonna et al. observed an initial decrease in CXR ordering, followed by a gradual increase toward baseline ordering rates. These findings highlight the need for sustained awareness and interventions and for the careful selection of high-value projects.
In conclusion, our study shows that a deimplementation intervention based on CW recommendations can reduce CXR ordering and that ongoing evaluation of contextual factors provides insights for both real-time modifications of current interventions and the design of future interventions. We found that messaging about reducing unnecessary tests works well when discussions are framed at the unit level but may be counterproductive if used to question individual ordering decisions.38 Additional lessons learned include the value of participation on rounds to build trust among stakeholders, the utility of monthly rather than weekly statistics for feedback, stakeholder input and peer champions, and differences in approach with physician and ACNP audiences.
Acknowledgments
The authors thank the VUMC Choosing Wisely committee; Mr. Bill Harrell in Advanced Data Analytics for developing the Tableau platform used in our data feedback strategy; Emily Feld, MD, Jerry Zifodya, MD, and Ryan Kindle, MD for assisting with data feedback to providers in the MICU; Todd Rice, MD, Director of the MICU, for his support of the initiative; and Beth Prusaczyk, PhD, MSW and David Stevenson, PhD for providing feedback on earlier drafts of this manuscript.
Disclosures
Dr. Kripalani reports personal fees from Verustat, personal fees from SAI Interactive, and equity from Bioscape Digital, outside the submitted work. All other authors have nothing to disclose.
Funding
This work was supported by an Innovation Grant from the Alliance for Academic Internal Medicine (AAIM, 2016) and by the Departments of Internal Medicine and Graduate Medical Education at Vanderbilt University Medical Center. The AAIM did not have a role in the study design, data collection, data analysis, data interpretation, or manuscript writing.
1. Cassel CK, Guest JA. Choosing Wisely: Helping physicians and patients make smart decisions about their care. JAMA. 2012;307(17):1801-1802.
2. Gonzales R, Cattamanchi A. Changing clinician behavior when less is more. JAMA Intern Med. 2015;175(12):1921-1922.
3. Rosenberg A, Agiro A, Gottlieb M, et al. Early trends among seven recommendations from the Choosing Wisely campaign. JAMA Intern Med. 2015;175(12):1913-1920.
4. Hong AS, Ross-Degnan D, Zhang F, Wharam JF. Small decline in low-value back imaging associated with the ‘Choosing Wisely’ campaign, 2012-14. Health Aff (Millwood). 2017;36(4):671-679. doi: 10.1377/hlthaff.2016.1263.
5. Parks AL, O’Malley PG. From choosing wisely to practicing value—more to the story. JAMA Intern Med. 2016;176(10):1571-1572.
6. Johnson PT, Pahwa AK, Feldman LS, Ziegelstein RC, Hellmann DB. Advancing high-value health care: a new AJM column dedicated to cost-conscious care quality improvement. Am J Med. 2017;130(6):619-621. doi: 10.1016/j.amjmed.2016.12.018.
7. Eccles MP, Mittman BS. Welcome to implementation science. Implement Sci. 2006;1:1. doi: 10.1186/1748-5908-1-1.
8. Bhatia RS, Levinson W, Shortt S, et al. Measuring the effect of Choosing Wisely: an integrated framework to assess campaign impact on low-value care. BMJ Qual Saf. 2015;24:523-531. doi: 10.1136/bmjqs-2015-004070.
9. Selby K, Barnes GD. Learning to de-adopt ineffective healthcare practices. Am J Med. 2018;131(7):721-722. doi: 10.1016/j.amjmed.2018.03.014.
10. Curran GM, Bauer M, Mittman B, Pyne JM, Stetler C. Effectiveness-implementation hybrid designs. Med Care. 2012;50(3):217-226. doi: 10.1097/MLR.0b013e3182408812.
11. Ganapathy A, Adhikari NK, Spiegelman J, Scales DC. Routine chest x-rays in intensive care units: a systematic review and meta-analysis. Crit Care. 2012;16(2):R68. doi: 10.1186/cc11321.
12. Graat ME, Kröner A, Spronk PE, et al. Elimination of daily routine chest radiographs in a mixed medical-surgical intensive care unit. Intensive Care Med. 2007;33(4):639-644. doi: 10.1007/s00134-007-0542-1.
13. Hendrikse KA, Gratama JWC, Ten Hove W, Rommes JH, Schultz MJ, Spronk PE. Low value of routine chest radiographs in a mixed medical-surgical ICU. Chest. 2007;132(3):823-828. doi: 10.1378/chest.07-1162.
14. Clec’h C, Simon P, Hamdi A, et al. Are daily routine chest radiographs useful in critically ill, mechanically ventilated patients? A randomized study. Intensive Care Med. 2008;34(2):264-270. doi: 10.1007/s00134-007-0919-1.
15. Oba Y, Zaza T. Abandoning daily routine chest radiography in the intensive care unit: meta-analysis. Radiology. 2010;255(2):386-395. doi: 10.1148/radiol.10090946.
16. Mets O, Spronk PE, Binnekade J, Stoker J, de Mol BAJM, Schultz MJ. Elimination of daily routine chest radiographs does not change on-demand radiography practice in post-cardiothoracic surgery patients. J Thorac Cardiovasc Surg. 2007;134(1):139-144. doi: 10.1016/j.jtcvs.2007.02.029.
17. Hejblum G, Chalumeau-Lemoine L, Ioos V, et al. Comparison of routine and on-demand prescription of chest radiographs in mechanically ventilated adults: a multicentre, cluster-randomised, two-period crossover study. Lancet. 2009;374(9702):1687-1693. doi: 10.1016/S0140-6736(09)61459-8.
18. McComb BL, Chung JH, Crabtree TD, et al. ACR appropriateness criteria® routine chest radiography. J Thorac Imaging. 2016;31(2):W13-W15. doi: 10.1097/RTI.0000000000000200.
19. Halpern SD, Becker D, Curtis JR, et al. An official American Thoracic Society/American Association of Critical-Care Nurses/American College of Chest Physicians/Society of Critical Care Medicine policy statement: the Choosing Wisely® top 5 list in critical care medicine. Am J Respir Crit Care Med. 2014;190(7):818-826. doi: 10.1164/rccm.201407-1317ST.
20. Powell BJ, Waltz TJ, Chinman MJ, et al. A refined compilation of implementation strategies: Results from the Expert Recommendations for Implementing Change (ERIC) project. Implement Sci. 2015;10:21. doi: 10.1186/s13012-015-0209-1.
21. R [computer program]. Version 3.4.0. Vienna, Austria: R Foundation for Statistical Computing; 2013.
22. Damschroder LJ, Aron DC, Keith RE, Kirsh SR, Alexander JA, Lowery JC. Fostering implementation of health services research findings into practice: a consolidated framework for advancing implementation science. Implement Sci. 2009;4:50. doi: 10.1186/1748-5908-4-50.
23. Kirk MA, Kelley C, Yankey N, Birken SA, Abadie B, Damschroder L. A systematic review of the use of the Consolidated Framework for Implementation Research. Implement Sci. 2016;11:72. doi: 10.1186/s13012-016-0437-z.
24. Speroff T, James BC, Nelson EC, Headrick LA, Brommels M, Reed JE. Guidelines for appraisal and publication of PDSA quality improvement. Qual Manag Health Care. 2014;13(1):33-39. doi: 10.1097/00019514-200401000-00003.
25. Corson AH, Fan VS, White T, et al. A multifaceted hospitalist quality improvement intervention: Decreased frequency of common labs. J Hosp Med. 2015;10(6):390-395. doi: 10.1002/jhm.2354.
26. Ferrari R. Evaluation of the Canadian Rheumatology Association Choosing Wisely recommendation concerning anti-nuclear antibody (ANA) testing. Clin Rheumatol. 2015;34(9):1551-1556. doi: 10.1007/s10067-015-2985-z.
27. Ferrari R, Prosser C. Testing vitamin D levels and choosing wisely. JAMA Intern Med. 2016;176(7):1019-1020.
28. Iams W, Heck J, Kapp M, et al. A multidisciplinary housestaff-led initiative to safely reduce daily laboratory testing. Acad Med. 2016;91(6):813-820. doi: 10.1097/ACM.0000000000001149.
29. Kost A, Genao I, Lee JW, Smith SR. Clinical decisions made in primary care clinics before and after Choosing WiselyTM. J Am Board Fam Med. 2015;28(4):471-474. doi: 10.3122/jabfm.2015.05.140332.
30. Kerr EA, Chen J, Sussman JB, Klamerus ML, Nallamothu BK. Stress testing before low-risk surgery: so many recommendations, so little overuse. JAMA Intern Med. 2015;175(4):645-647. doi: 10.1001/jamainternmed.2014.7877.
31. Colla CH, Morden NE, Sequist TD, Schpero WL, Rosenthal MB. Choosing wisely: prevalence and correlates of low-value health care services in the United States. J Gen Intern Med. 2014;30(2):221-228. doi: 10.1007/s11606-014-3070-z.
32. Shetty KD, Meeker D, Schneider EC, Hussey PS, Damberg CL. Evaluating the feasibility and utility of translating Choosing Wisely recommendations into e-Measures. Healthcare. 2015;3(1):24-37. doi: 10.1016/j.hjdsi.2014.12.002.
33. Woodland DC, Cooper CR, Rashid MF, et al. Routine chest X-ray is unnecessary after ultrasound-guided central venous line placement in the operating room. J Crit Care. 2018;46:13-16. doi: 10.1016/j.jcrc.2018.03.027.
34. Krause TM, Ukhanova M, Revere FL. Private carriers’ physician payment rates compared with Medicare and Medicaid. Tex Med. 2016;112(6):e1.
35. American College of Radiology. Medicare physician fee schedule. Available at https://www.acr.org/Advocacy-and-Economics/Radiology-Economics/Medicare-Medicaid/MPFS. Accessed October 15, 2018.
36. Siegel MD, Rubinowitz AN. Routine daily vs on-demand chest radiographs in intensive care. Lancet. 2009;374(9702):1656-1658. doi: 10.1016/S0140-6736(09)61632-9.
37. Tonna JE, Kawamoto K, Presson AP, et al. Single intervention for a reduction in portable chest radiography (pCXR) in cardiovascular and surgical/trauma ICUs and associated outcomes. J Crit Care. 2018;44:18-23. doi: 10.1016/j.jcrc.2017.10.003.
38. Wolfson D, Santa J, Slass L. Engaging physicians and consumers in conversations about treatment overuse and waste: a short history of the choosing wisely campaign. Acad Med. 2014;89(7):990-995. doi: 10.1097/ACM.0000000000000270.
Despite increased awareness of Choosing Wisely (CW)® recommendations to reduce low-value care,1 there is limited published data about strategies to implement these guidelines or evidence that they have influenced ordering patterns or reduced healthcare spending
In ICUs, CXR ordering strategies may be routine (daily) or on-demand (with clinical indication). The former strategy’s principal advantage is the potential to detect life-threatening situations that may otherwise escape diagnosis.11 Disadvantages include cost, radiation exposure, patient inconvenience, false-positive workups, and low diagnostic and therapeutic value.12,13 On-demand strategies may safely reduce CXR ordering by 32% to 45%.11-17 Based on this evidence, the Critical Care Societies Collaborative and the American College of Radiology have recommended on-demand CXR ordering.18,19 Here, we describe the effectiveness of an intervention to reduce CXR ordering in two ICUs while evaluating the deimplementation strategies using a validated framework.
METHODS
Setting and Design
Vanderbilt University Medical Center (VUMC) is an academic referral center in Nashville, Tennessee. The cardiovascular ICU (CVICU) has 27 beds and the medical ICU (MICU) has 34 beds. Acute care nurse practitioners (ACNPs) and two critical care physicians staff the CVICU; cardiology fellows, anesthesia critical care fellows, and transplant and cardiac surgeons are also active in patient care. The MICU is staffed by two critical care physicians who supervise one team of ACNPs and two teams of medical residents who rotate through the unit every two weeks. Each MICU team is assigned a fellow in pulmonary and critical care.
We conducted a prospective, nonrandomized study in these units from October 2015 to June 2016. The VUMC Institutional Review Board approved the intervention as a quality improvement (QI) activity, waiving the requirement for informed consent.
Intervention
Following the top CW recommendation of the Critical Care Societies Collaborative—“Don’t order diagnostic tests at regular intervals (such as every day), but rather in response to specific clinical questions.”19—the VUMC resident-led CW Steering Committee designed a multifaceted approach to reduce ordering of routine CXRs in ICUs. The intervention included a didactic session on CW and proper CXR ordering practices, peer champions, data audits, and feedback to providers through weekly e-mails (see Supplemental Materials, 1 – Resident Presentation and 2 – CXR Flyer). 20
In September 2015, CVICU and MICU teams received a didactic session highlighting CW, current CXR ordering rates, and the plan for reducing CXR ordering. On October 5, 2015, teams began receiving weekly e-mails with ordering rates defined as CXRs ordered per patient per day and a brief rationale for reducing unnecessary CXRs. To encourage friendly competition, we provided weekly rates to the MICU teams, allowing for transparent benchmarking against one another. A similar competition strategy was not used in the CVICU due to the lack of multiple teams.
In the CVICU, two ACNPs volunteered as peer champions. These champions coordinated data feedback and advocated for the intervention among their colleagues. In the MICU, three internal medicine residents volunteered as peer champions and fulfilled similar roles.
To facilitate deimplementation, we conducted two Plan-Do-Study-Act (PDSA) cycles, the first from November to mid-December 2015 and the second from mid-December 2015 to mid-January 2016. During these cycles, we tailored our deimplementation strategy based on barriers identified by the peer champions and ICU leaders (described in the Qualitative Results section). Peer champions and the CW Steering Committee generated potential solutions by conversing with stakeholders and using the Expert Recommendations for Implementing Change (ERIC).20 Interventions included disseminating promotional flyers, holding meetings with stakeholders, and providing monthly CXR ordering rates. After the PDSA cycles, we continued reexamining the deimplementation efforts by reviewing ordering rates and soliciting feedback from ICU leaders and peer champions. However, no significant changes to the intervention were made during this time.
Quantitative Evaluation
We extracted data from VUMC’s Enterprise Data Warehouse during the intervention period (October 5, 2015 to May 24, 2016) and a historical control period (October 1, 2014 to October 4, 2015). Within each ICU, descriptive statistics were used to compare patient cohorts in the baseline and intervention periods by age, sex, and race.
The primary outcome was CXRs ordered per patient per day by hospital unit (CVICU or MICU). The baseline period included all data between October 1, 2014 and September 15, 2015. To account for priming of providers from didactic education, we allowed a washout period from September 16, 2015 to October 4, 2015. As a preliminary analysis, we compared CXR rates in the baseline and intervention periods using Wilcoxon rank-sum tests. We then conducted interrupted time-series analyses with segmented linear regression to assess differences in linear trends in CXR rates over the two periods. To account for different staffing models in the MICU, we stratified the impact of the intervention by team—medical resident (physician) or ACNP. R version 3.4.0 was used for statistical analysis.21
Qualitative Evaluation
Our qualitative evaluation consisted of embedded observation and semistructured interviews with stakeholders. The qualitative portion was guided by the Consolidated Framework for Implementation Research (CFIR), a widely used framework for design and evaluation of improvement initiatives that helped us to determine major facilitators and barriers to implementation.22,23
Embedded Observation
From November 2015 to January 2016, we observed morning rounds in the CVICU and MICU one to two times weekly to understand factors facilitating and inhibiting uptake of the intervention. Observations were recorded and organized using a CFIR-based template and directed toward understanding interactions among team members (eg, the decision-making process hierarchy), team workflows and decision-making processes, process of ordering CXRs, and providers’ knowledge and perceptions of the CXR intervention (see Supplemental Material, 3 – CFIR Table).22,23 After rounds, ICU team members were invited to share suggestions for improving the intervention. All observations occurred during and shortly following morning rounds when the vast majority of routine CXRs are ordered; we did not evaluate night or evening workflows. In the spirit of continuous improvement, we evaluated data in real-time.
Semistructured Interviews
Based on the direct observations, we developed semistructured interview questions to further evaluate provider perspectives (eg, “Do you believe ICU patients need a daily CXR?”) and constructs aligning with CFIR (eg, “intervention source—internally vs externally developed;” see Supplemental Material, 4 – Interview Questions).
Stakeholders from both ICUs were recruited through e-mail and in-person requests to participate in semistructured interviews. In the CVICU, we interviewed critical care physicians, anesthesia critical care fellows, and ACNPs. In the MICU, we interviewed medical students, interns, residents, critical care fellows, attending intensivist physicians, and ACNPs. We also interviewed X-ray technologists who routinely perform portable films in the units.
RESULTS
Quantitative Results
Cardiovascular Intensive Care Unit
The median baseline CXR ordering rate in the CVICU was 1.16 CXRs per patient per day, with interquartile range (IQR) 1.06-1.28. During the intervention period, the rate dropped to 1.07 (IQR 0.94-1.21; P < .001; Table 2). The time-series analysis suggested an essentially flat trend during the baseline period, followed by a small but significant drop in ordering rates during the intervention period (P < .001; Table 3 and Figure 1). Ordering rates appeared to increase slightly over the course of the intervention period, but this slight upward trend was not significantly different from the flat trend seen during the baseline period.
Medical Intensive Care Unit
For both physician and ACPN teams, the median baseline CXR ordering rates in the MICU were much lower than the baseline rate in the CVICU (Table 2). For the MICU physician care team, the baseline CXR ordering rate was 0.60 CXRs per patient per day (IQR 0.48-0.73). For the ACNP team, the median rate was 0.39 CXRs per patient per day (IQR 0.21-0.57). Both rates stayed approximately the same during the intervention period (Table 2). The time-series analysis suggested a statistically significant but very slight downward trend in CXR ordering rates during the baseline period, in the physician (P = .011) and ACNP (P = .022) teams (Table 3, Figure 2). Under this model, a small increase in CXR ordering initially occurred during the intervention period for both physician and ACNP teams (P = .010 and P = .055, respectively), after which the rates declined slightly. Trends in ordering rates during the intervention period were not significantly different from the slight downward trends seen during the baseline period.
Qualitative Results
We identified 25 of 39 CFIR constructs as relevant to the initiative (see Supplemental Materials, 3 – CFIR Table.) We determined the major facilitators of deimplementation to be peer champion discussions about CXR ordering on rounds and weekly data feedback, particularly if accompanied by in-person follow-up.
We also noted differences in CXR ordering rationales and decisions between the units. Generally, residents in the MICU and ACNPs in the CVICU made decisions to order CXRs. However, decisions were influenced by the expectations of attending physicians. While CVICU providers tended to order CXRs reflexively as part of morning labs, MICU providers—in particular, ACNPs who had been trained on indications for proper CXR ordering—generally ordered CXRs for specific indications (eg, worsening respiratory status). Of note, MICU ACNPs reported the use of bedside ultrasound as an alternate imaging modality and a reason for their higher threshold to order CXRs.
Deimplementation barriers in both units included the need to identify goal CXR ordering rates and the intervention’s limited visibility. To address these barriers, we conducted PDSA cycles and used the CFIR and ERIC to generate potential solutions.24 We established a goal of a 20% absolute reduction in the CVICU, added monthly CXR rates to weekly e-mail reports to better account for variations in patient populations and ordering practices, and circulated materials to promote on-demand CXR ordering. Promotional materials contained guidelines on CXR ordering and five “Frequently Held Misconceptions” about ordering practices with succinct, evidence-based explanations (see Supplemental Material, 2 – CXR Flyer).
Approximately four months after the start of intervention, some CVICU physicians became concerned that on-demand CXR ordering might be inappropriate for high-risk surgical patients, including those who are undergoing or have undergone heart transplants, lung transplants, or left-ventricular assist device placement. This concern arose following two adverse outcomes, which were not attributed to the CXR initiative, but which heightened concerns about patient safety. A rise in CXR ordering then occurred, and CVICU providers requested that we perform an analysis of these high-risk groups. While segmented linear regression in this subgroup suggested that average daily CXR ordering rates did decrease among the high-risk group at the start of the intervention period (P = .001), the difference between the rates in the two periods was not significant using the Wilcoxon rank-sum test. Exclusion of these patients from the main analysis did not alter the interpretation of the findings reported above for the CVICU.
DISCUSSION
A deimplementation intervention using provider education, peer champions, and data feedback was associated with fewer CXRs in the CVICU (P < .001) but not in the MICU. The CFIR-guided qualitative analysis was valuable for evaluating our deimplementation strategy and for identifying differences between the two ICUs.
Relatively few studies have demonstrated effective interventions that address CW recommendations.25-28 However, three population-level analyses of insurance claims show mixed results.3,4,29 Experts have thus proposed using implementation science to improve uptake of CW recommendations.2,3,7,8 Our study demonstrates the effectiveness of this approach. As expected, providers largely endorsed an on-demand CXR ordering strategy. Using the CFIR, however, we discovered barriers (eg, concern that data feedback did not reflect variations in patients’ needs). Using methods from implementation science allowed us to diagnose and tailor our approaches.
Our qualitative evaluation suggested that the intervention was ineffective mostly due to CFIR’s “inner setting” constructs, including resident fatigue, competing priorities, and decreased investment in QI projects because of the rotating nature of providers in training. Baseline CXR ordering rates in the MICU were also considerably lower than in the CVICU. We observed that CVICU providers ordered many CXRs following the placement of lines or tubes and that ACNPs in the MICU had received education on appropriate CXR ordering practices and had access to an alternate imaging modality in ultrasound. These factors may partially explain the difference in baseline rates.
As noted in a study of cardiac stress testing guidelines, the existence of high-value care recommendations does not mean overuse.30 Indeed, the lack of significant CXR over-ordering in the MICU highlights the importance of baseline measurement and partnering with information technology departments to create the best possible data feedback systems.30-32 Our experience shows that these systems should provide sufficient pre-implementation data (ideally >1 year), such that teams selecting QI projects can ensure that a project is a good use of institutional resources and change capital.
To inform future work, we informally assessed program costs and savings. We estimate the initiative cost $1,600, including $1,000 for curriculum development and teaching time, $300 for educational materials, and $300 for CXR tracking dashboard development. Hospital charges and reimbursements for CXR vary widely.33 We calculated savings using a range of rates, from a conservative $23 (the Medicare reimbursement rate for single-view CXR, CPT code 71010, global fee) to $50 (an approximate blended reimbursement rate across payers).34,35 In the CVICU, we estimate that 51 CXRs were avoided each month, saving $1,173-$2,550 per month or $9,384-$20,400 over eight months of follow-up. Annualizing these figures, we estimate net savings of $12,476-$29,000 in the first year in a 27-bed ICU. Costs to continue the program include education of new employees, booster training, and dashboard maintenance for an estimated annual cost of $1,000. It is difficult to estimate effectiveness over time, but if we conservatively assume that 30 CXRs were avoided each month, then the projected savings would be $8,280-$18,000 per year or an annual net savings of $7,280-$17,000 in the ICU. Although these amounts are modest, providing trainees with experiential learning opportunities in high-value care is valuable in its own right, meets curricular goals, may result in spill-over effects to other diagnostic and therapeutic decisions, and may influence long-term practice patterns. Institutional decisions to pursue projects such as this should take into account these potential benefits.
This evaluation is not without limitations. First, the study was conducted in a single tertiary-care hospital, potentially limiting its generalizability.36 Second, the study design lacked a concurrent control group, and observed outcomes may have been influenced by broader CXR utilization trends, increased awareness of low-value care generally or from previous CW projects at VUMC, seasonal effects, or the Hawthorne effect. Third, the study outcome was all CXRs ordered, rather than CXRs that were unnecessary or not clinically indicated. We chose all CXRs because it was more pragmatic, did not require clinical case review, and could be incorporated promptly into dashboards, enabling timely performance feedback. Other performance measures have taken a similar tack (eg, tracking all-cause readmissions rather than preventable readmissions). Given this approach, we did not track clinical indications for CXRs (eg, central line placement). Fourth, although we compared resident and APRN orders, we did not collect data on other provider characteristics such as years in/out of training or board certification status. These considerations should be addressed in future research.
Finally, the increase in CVICU CXR ordering at the end of the intervention period, which occurred following two adverse events, raises concerns about sustainability. While unrelated to CXR orders, the events resulted in increased ordering of diagnostic tests and showed the difficulty of deimplementation in ICUs. Indeed, some CVICU providers argued that on-demand CXR ordering represented minimal potential cost savings and had not been studied among heart and lung transplant patients. Subsequently, Tonna et al. have shown that on-demand CXR ordering can be safely implemented among such patients.37 Also similar to our study, Tonna et al. observed an initial decrease in CXR ordering, followed by a gradual increase toward baseline ordering rates. These findings highlight the need for sustained awareness and interventions and for the careful selection of high-value projects.
In conclusion, our study shows that a deimplementation intervention based on CW recommendations can reduce CXR ordering and that ongoing evaluation of contextual factors provides insights for both real-time modifications of current interventions and the design of future interventions. We found that messaging about reducing unnecessary tests works well when discussions are framed at the unit level but may be counterproductive if used to question individual ordering decisions.38 Additional lessons learned include the value of participation on rounds to build trust among stakeholders, the utility of monthly rather than weekly statistics for feedback, stakeholder input and peer champions, and differences in approach with physician and ACNP audiences.
Acknowledgments
The authors thank the VUMC Choosing Wisely committee; Mr. Bill Harrell in Advanced Data Analytics for developing the Tableau platform used in our data feedback strategy; Emily Feld, MD, Jerry Zifodya, MD, and Ryan Kindle, MD for assisting with data feedback to providers in the MICU; Todd Rice, MD, Director of the MICU, for his support of the initiative; and Beth Prusaczyk, PhD, MSW and David Stevenson, PhD for providing feedback on earlier drafts of this manuscript.
Disclosures
Dr. Kripalani reports personal fees from Verustat, personal fees from SAI Interactive, and equity from Bioscape Digital, outside the submitted work. All other authors have nothing to disclose.
Funding
This work was supported by an Innovation Grant from the Alliance for Academic Internal Medicine (AAIM, 2016) and by the Departments of Internal Medicine and Graduate Medical Education at Vanderbilt University Medical Center. The AAIM did not have a role in the study design, data collection, data analysis, data interpretation, or manuscript writing.
1. Cassel CK, Guest JA. Choosing Wisely: Helping physicians and patients make smart decisions about their care. JAMA. 2012;307(17):1801-1802.
2. Gonzales R, Cattamanchi A. Changing clinician behavior when less is more. JAMA Intern Med. 2015;175(12):1921-1922.
3. Rosenberg A, Agiro A, Gottlieb M, et al. Early trends among seven recommendations from the Choosing Wisely campaign. JAMA Intern Med. 2015;175(12):1913-1920.
4. Hong AS, Ross-Degnan D, Zhang F, Wharam JF. Small decline in low-value back imaging associated with the ‘Choosing Wisely’ campaign, 2012-14. Health Aff (Millwood). 2017;36(4):671-679. doi: 10.1377/hlthaff.2016.1263.
5. Parks AL, O’Malley PG. From choosing wisely to practicing value—more to the story. JAMA Intern Med. 2016;176(10):1571-1572.
6. Johnson PT, Pahwa AK, Feldman LS, Ziegelstein RC, Hellmann DB. Advancing high-value health care: a new AJM column dedicated to cost-conscious care quality improvement. Am J Med. 2017;130(6):619-621. doi: 10.1016/j.amjmed.2016.12.018.
7. Eccles MP, Mittman BS. Welcome to implementation science. Implement Sci. 2006;1:1. doi: 10.1186/1748-5908-1-1.
8. Bhatia RS, Levinson W, Shortt S, et al. Measuring the effect of Choosing Wisely: an integrated framework to assess campaign impact on low-value care. BMJ Qual Saf. 2015;24:523-531. doi: 10.1136/bmjqs-2015-004070.
9. Selby K, Barnes GD. Learning to de-adopt ineffective healthcare practices. Am J Med. 2018;131(7):721-722. doi: 10.1016/j.amjmed.2018.03.014.
10. Curran GM, Bauer M, Mittman B, Pyne JM, Stetler C. Effectiveness-implementation hybrid designs. Med Care. 2012;50(3):217-226. doi: 10.1097/MLR.0b013e3182408812.
11. Ganapathy A, Adhikari NK, Spiegelman J, Scales DC. Routine chest x-rays in intensive care units: a systematic review and meta-analysis. Crit Care. 2012;16(2):R68. doi: 10.1186/cc11321.
12. Graat ME, Kröner A, Spronk PE, et al. Elimination of daily routine chest radiographs in a mixed medical-surgical intensive care unit. Intensive Care Med. 2007;33(4):639-644. doi: 10.1007/s00134-007-0542-1.
13. Hendrikse KA, Gratama JWC, Ten Hove W, Rommes JH, Schultz MJ, Spronk PE. Low value of routine chest radiographs in a mixed medical-surgical ICU. Chest. 2007;132(3):823-828. doi: 10.1378/chest.07-1162.
14. Clec’h C, Simon P, Hamdi A, et al. Are daily routine chest radiographs useful in critically ill, mechanically ventilated patients? A randomized study. Intensive Care Med. 2008;34(2):264-270. doi: 10.1007/s00134-007-0919-1.
15. Oba Y, Zaza T. Abandoning daily routine chest radiography in the intensive care unit: meta-analysis. Radiology. 2010;255(2):386-395. doi: 10.1148/radiol.10090946.
16. Mets O, Spronk PE, Binnekade J, Stoker J, de Mol BAJM, Schultz MJ. Elimination of daily routine chest radiographs does not change on-demand radiography practice in post-cardiothoracic surgery patients. J Thorac Cardiovasc Surg. 2007;134(1):139-144. doi: 10.1016/j.jtcvs.2007.02.029.
17. Hejblum G, Chalumeau-Lemoine L, Ioos V, et al. Comparison of routine and on-demand prescription of chest radiographs in mechanically ventilated adults: a multicentre, cluster-randomised, two-period crossover study. Lancet. 2009;374(9702):1687-1693. doi: 10.1016/S0140-6736(09)61459-8.
18. McComb BL, Chung JH, Crabtree TD, et al. ACR appropriateness criteria® routine chest radiography. J Thorac Imaging. 2016;31(2):W13-W15. doi: 10.1097/RTI.0000000000000200.
19. Halpern SD, Becker D, Curtis JR, et al. An official American Thoracic Society/American Association of Critical-Care Nurses/American College of Chest Physicians/Society of Critical Care Medicine policy statement: the Choosing Wisely® top 5 list in critical care medicine. Am J Respir Crit Care Med. 2014;190(7):818-826. doi: 10.1164/rccm.201407-1317ST.
20. Powell BJ, Waltz TJ, Chinman MJ, et al. A refined compilation of implementation strategies: Results from the Expert Recommendations for Implementing Change (ERIC) project. Implement Sci. 2015;10:21. doi: 10.1186/s13012-015-0209-1.
21. R [computer program]. Version 3.4.0. Vienna, Austria: R Foundation for Statistical Computing; 2013.
22. Damschroder LJ, Aron DC, Keith RE, Kirsh SR, Alexander JA, Lowery JC. Fostering implementation of health services research findings into practice: a consolidated framework for advancing implementation science. Implement Sci. 2009;4:50. doi: 10.1186/1748-5908-4-50.
23. Kirk MA, Kelley C, Yankey N, Birken SA, Abadie B, Damschroder L. A systematic review of the use of the Consolidated Framework for Implementation Research. Implement Sci. 2016;11:72. doi: 10.1186/s13012-016-0437-z.
24. Speroff T, James BC, Nelson EC, Headrick LA, Brommels M, Reed JE. Guidelines for appraisal and publication of PDSA quality improvement. Qual Manag Health Care. 2014;13(1):33-39. doi: 10.1097/00019514-200401000-00003.
25. Corson AH, Fan VS, White T, et al. A multifaceted hospitalist quality improvement intervention: Decreased frequency of common labs. J Hosp Med. 2015;10(6):390-395. doi: 10.1002/jhm.2354.
26. Ferrari R. Evaluation of the Canadian Rheumatology Association Choosing Wisely recommendation concerning anti-nuclear antibody (ANA) testing. Clin Rheumatol. 2015;34(9):1551-1556. doi: 10.1007/s10067-015-2985-z.
27. Ferrari R, Prosser C. Testing vitamin D levels and choosing wisely. JAMA Intern Med. 2016;176(7):1019-1020.
28. Iams W, Heck J, Kapp M, et al. A multidisciplinary housestaff-led initiative to safely reduce daily laboratory testing. Acad Med. 2016;91(6):813-820. doi: 10.1097/ACM.0000000000001149.
29. Kost A, Genao I, Lee JW, Smith SR. Clinical decisions made in primary care clinics before and after Choosing WiselyTM. J Am Board Fam Med. 2015;28(4):471-474. doi: 10.3122/jabfm.2015.05.140332.
30. Kerr EA, Chen J, Sussman JB, Klamerus ML, Nallamothu BK. Stress testing before low-risk surgery: so many recommendations, so little overuse. JAMA Intern Med. 2015;175(4):645-647. doi: 10.1001/jamainternmed.2014.7877.
31. Colla CH, Morden NE, Sequist TD, Schpero WL, Rosenthal MB. Choosing wisely: prevalence and correlates of low-value health care services in the United States. J Gen Intern Med. 2014;30(2):221-228. doi: 10.1007/s11606-014-3070-z.
32. Shetty KD, Meeker D, Schneider EC, Hussey PS, Damberg CL. Evaluating the feasibility and utility of translating Choosing Wisely recommendations into e-Measures. Healthcare. 2015;3(1):24-37. doi: 10.1016/j.hjdsi.2014.12.002.
33. Woodland DC, Cooper CR, Rashid MF, et al. Routine chest X-ray is unnecessary after ultrasound-guided central venous line placement in the operating room. J Crit Care. 2018;46:13-16. doi: 10.1016/j.jcrc.2018.03.027.
34. Krause TM, Ukhanova M, Revere FL. Private carriers’ physician payment rates compared with Medicare and Medicaid. Tex Med. 2016;112(6):e1.
35. American College of Radiology. Medicare physician fee schedule. Available at https://www.acr.org/Advocacy-and-Economics/Radiology-Economics/Medicare-Medicaid/MPFS. Accessed October 15, 2018.
36. Siegel MD, Rubinowitz AN. Routine daily vs on-demand chest radiographs in intensive care. Lancet. 2009;374(9702):1656-1658. doi: 10.1016/S0140-6736(09)61632-9.
37. Tonna JE, Kawamoto K, Presson AP, et al. Single intervention for a reduction in portable chest radiography (pCXR) in cardiovascular and surgical/trauma ICUs and associated outcomes. J Crit Care. 2018;44:18-23. doi: 10.1016/j.jcrc.2017.10.003.
38. Wolfson D, Santa J, Slass L. Engaging physicians and consumers in conversations about treatment overuse and waste: a short history of the choosing wisely campaign. Acad Med. 2014;89(7):990-995. doi: 10.1097/ACM.0000000000000270.
© 2019 Society of Hospital Medicine