User login
Setting and Method of Measurement Affect Blood Pressure Readings in Older Veterans
Seventy-five percent of adults aged >75 years have hypertension.1-3 According to the Joint National Commission 8 (JNC 8), the recommended target blood pressure (BP) is < 150/80 mm Hg for adults aged > 60 years.4 In 2016 the Systolic Blood Pressure Intervention Trial (SPRINT) suggested that more aggressive BP control with a goal of < 120/80 mm Hg reduced rates of cardiovascular disease and lowered the risk of death in adults aged > 50 years with hypertension.5 It is anticipated that as a result of the landmark SPRINT results, clinicians may attempt to treat hypertension more intensely in older patients with an increased risk of adverse consequences if BPs are not appropriately measured.
There is a standardized protocol for BP measurement, but these recommendations typically are not followed in routine office visits.6,7 Some studies have noted that home BP measurement may be more accurate than office measurement.8 However, clinicians may not always trust the accuracy of home BP readings, and many patients are not adherent with home measurement. As a result, physicians usually manage hypertension in older patients based on office readings, though it is likely that most office measurements do not follow protocol on proper measurement. Office measurements have been noted to be inaccurate with high likelihood of overestimating or underestimating BP control.9
Office BP measurements demonstrate poor correlation with home measurements and have not been shown to be as good of a predictor for target organ damage or long-term cardiovascular outcomes compared with that of home measurements.10,11 Although there have been studies comparing home and office BP measurements and comparing office and ambulatory BP measurement, no literature has been found that reports on the difference between routine office and standardized measurement of BP.9,12-14
This study seeks to identify the magnitude of difference among BP measured according to a standardized protocol, routine clinical, and home BP. The authors hypothesized that there would be a significant, clinically relevant difference among the 3 BP measurement methods, especially between the routine office and standardized office measurements. This study has implications for implementing intensive treatment of hypertension based on office measurements.
Methods
Participants included 30 male veterans aged > 65 years who were actively participating in the Gerofit program at the VA Greater Los Angeles Healthcare System (VAGLAHS). The Gerofit program is a model clinical demonstration exercise and health promotion program targeting older and veterans at risk for falls or institutionalization. Gerofit was established in 1987 at the Durham VA Health System and successfully implemented in 2014 at VAGLAHS. Supervised exercise is offered 3 times per week and consists of individually tailored exercises aimed at reducing functional deficits that are identified and monitored by an initial and quarterly functional assessment. Blood pressures are checked routinely once a week as a part of the program. Gerofit was reviewed and approved by the institutional review board at VAGLAHS as a quality improvement/quality assurance project.
Data
Routine office and standardized protocol measurements were obtained by a single CasMED 740 (Branford, CT) automated BP machine and were conducted separately on different days. The CasMED 740 machine was not otherwise calibrated; however, a one-time correlation was performed between the CasMED 740 and the home BP monitor for each participant, when it was brought to VAGLAHS. Two measurements were made with the CasMed 740 automated BP machine on the arm that gave the higher BP reading throughout the standardized and routine protocol. Two subsequent measurements were made with the participant’s home automated BP cuff. Averages for the CasMED 740 and the home BP monitoring device were compared and assessed for significance by paired t test. No rest was scheduled prior to the first measurement, but there was a 1-minute rest after each subsequent measurement.
Mean values (SD) were used for participant characteristics and mean values (standard error [SE]) were used for BP measurements. Data were analyzed using Microsoft Excel (Redmond, WA) and GraphPad Prism version 7.03 (San Diego, CA). T tests were used for analysis of home BP measurements due to low sample size. Values of P < .05 were considered to be statistically significant.
Routine office protocol. Automated BP was measured to mimic routine office visits. Upon arrival, participants sat down, and the BP cuff was placed around their arm. Any rest before a measurement was incidental and not intentionally structured. Appropriate cuff size was determined by visual estimation of arm circumference. Only 1 measurement was made unless BP was > 150/90 mm Hg, in which case a repeat measurement was made after 2 to 4 minutes of rest. The BP was then determined based on the average of 2 or more readings. The BPs were recorded by hand in a weekly log. Participants had at least 12 weeks of BP readings measured by the routine method, and these BPs were averaged over 12 weeks to yield their average routine measured BP.
Standardized protocol. Automated BP was measured according to the 2015 USPSTF Guidelines and Look AHEAD trial protocol.7,15 A participant’s arm circumference was measured, and appropriate cuff size was determined. The participant rested quietly in a chair for at least 5 minutes with feet flat on the floor and back supported. The cuff was snugly placed 2 to 3 cm above the antecubital fossa, and the arm was supported at the level of the right atrium during the measurement. Blood pressure was determined using the mean of 4 automated cuff readings, 2 on each arm, taken 1 minute apart. Participants did not necessarily have their BP measured by the standardized method immediately following the routine method but all measurements were performed during the same 12-week time period.
Home blood pressure protocol. Participants were given instructions according to the American Heart Association (AHA) recommendations for measuring home BP. Patients were instructed to use a calibrated, automated arm BP cuff. Home BP machines were not provided in advance, and each individual’s BP machine was not calibrated. They also were instructed to rest at least 5 minutes before measuring their BP. The mean home BP was determined by the cumulative average of 3 readings in the morning and evening, taken 1 minute between each reading, for a total of 6 readings/d. Participants recorded home BPs for 2 weeks before submitting their readings. Each participant affirmed clear understanding of how to measure BP by correctly demonstrating placement of the cuff 1 time under supervision.
Results
Thirty veterans aged > 65 years participated in the study. The average age (SD) was 82.7 (9.3) years. The average BMI (SD) was overweight at 29.7 kg/m2 (5.7). Most (87.6%) of the study participants had been diagnosed with hypertension prior to the study, and no new diagnoses were made as a result of the study. 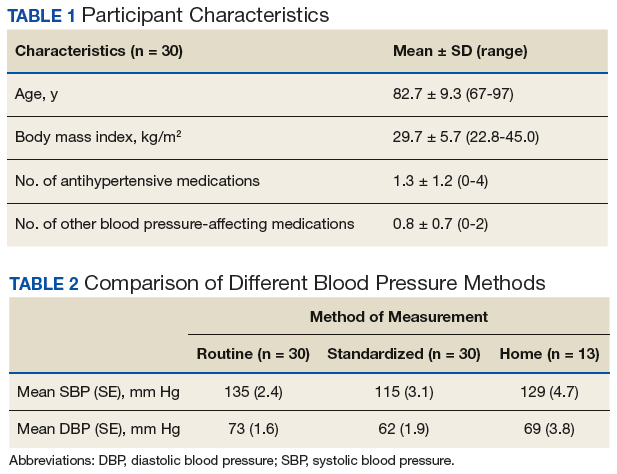
Both systolic BP (SBP) and diastolic BPs (DBP) measured by the standardized method were significantly lower than those by the routine method (P < .01 and P < .01, respectively) (Figure 1). 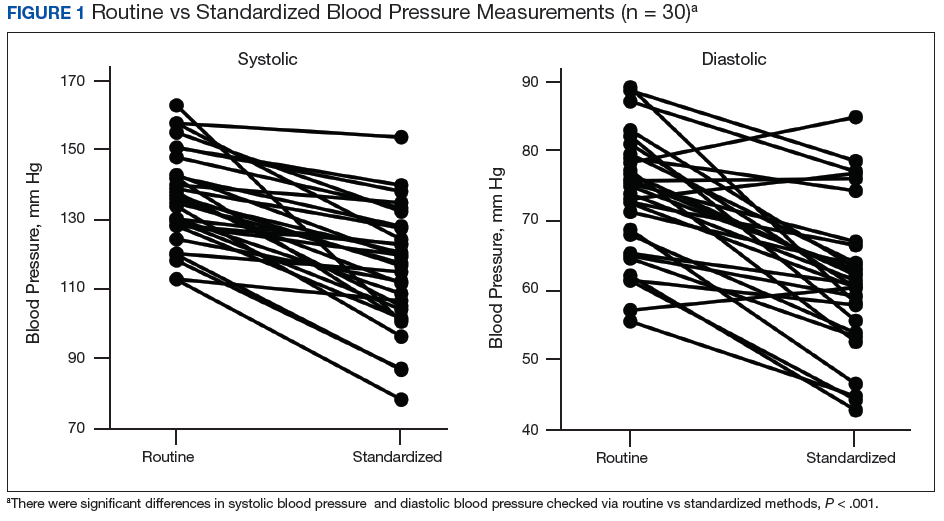
To determine the accuracy of the home BP monitors, the average routine VAGLAHS BP measure was compared with home BP results. For SBPs, there was a significant correlation coefficient of 0.91 (P < .01). 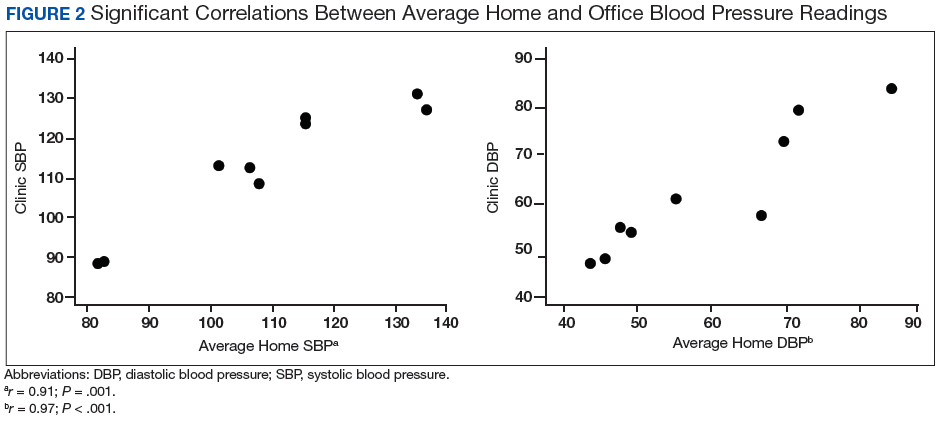
Discussion
The present study demonstrated that standardized measurements of BP were lower than that of the routine method used in most office settings. These results suggest that there could be a risk of overtreatment for some patients those of whose results are higher than the SPRINT BP target of < 120/80 mm Hg. Clinicians might be treating BPs that are elevated due to improper measurement, which can lead to deleterious consequences in older adults, such as syncope and falls.16
Each participant exhibited a significantly lower BP reading with the standardized method than the routine method. The 20-point decrease in SBP and 10-point decrease in DBP are clinically significant. The routine method of measurement was intended to simulate BP measurement in outpatient settings. There is usually little time structured for rest, and because the protocol established by the AHA and other professional organizations is time consuming, it usually is not strictly followed. With guidelines proposed by JNC 8 and new findings from SPRINT, the method of BP readings should be reviewed in all clinical settings.
While changes in BP management are not necessarily immediate, the differences in recommendations proposed by SPRINT and JNC 8 can lead to confusion regarding how intensely to treat BP. These recommendations guide clinical practice, but clinicians’ best judgment ultimately determines BP management. Physicians who utilize routine office measurements likely rely on BP readings that are higher on average than are readings done under proper conditions. This leads to the prospect of overtreatment, where physicians attempt to control hypertension too aggressively, potentially leading to orthostatic hypotension, syncope, and increased risk for falls.16 With findings from SPRINT recommending even lower BPs than that by JNC 8, overtreatment risk becomes especially relevant. While BP protocol was strictly followed in SPRINT, some clinicians may not necessarily follow the same fastidious protocol.
The average differences between the home and standardized BPs were not statistically significant possibly due to the small sample size in the home BP measurements; however, the difference might represent some clinical relevance. There was a 15-point difference in SBP results between home (129 mm Hg) and standardized (115 mm Hg) measures. There also was a difference in DBP between home (69 mm Hg) and standardized (62 mm Hg) results. The close correlation between both home and BPs measured in VAGLAHS demonstrated that any difference was not due to variability in the measurement devices. Previous studies have demonstrated that home BPs are better indicators of cardiovascular risk than office BP.8
Despite lack of statistical significance, home BPs were lower than routine, which suggests that they still may be more reliable than routine office measurements. Definitive conclusions regarding the accuracy of the home BPs in the present study cannot be drawn due to the small sample size (n = 13). Further exploration with comparisons to ambulatory BP monitoring could yield more information on accuracy of home BP monitoring.
In this study’s cohort of older veterans, the average BMI was between 25 and 30 (overweight), which is a risk factor for hypertension.17 Every participant with hypertension was taking at least 1 antihypertensive medication and being actively managed. In this study, the authors accounted for other medications that may affect BP, such as α blockers used in patients with benign prostatic hyperplasia.18 These could have potential elevating or lowering effects on BP measurements.
An issue in this study was the lack of adherence to home BP monitoring. Many patients forgot to bring in their records or to measure their BPs at home. The difficulties highlight real-life issues. Clinicians often request that patients monitor their BP at home, but few may actually remember, let alone keep diligent records. There are many barriers between measuring and reporting home BPs, which may prevent the usefulness of monitoring BP at home.
Limitations
There were several limitations to the study. There was no specific protocol for the routine method of BP measurement, as it was intended to simulate the haphazard nature of office measurements. However, this approach limits its reproducibility. For home BP monitoring, it would have been ideal to provide the same calibrated, automated BP device to each participant. This study of older veterans may not be applicable to the general population. Finally, the relatively small number of participants in the study (n = 30) may have limited power in drawing definitive conclusions.
Future Directions
For future studies, comparing the standardized method to ambulatory BP monitoring would provide more information on accuracy. In addition, the authors would like to evaluate the effect of exercise on BP measurements in the different settings: home, standardized, and routine methods.
1. Mozaffarian D, Benjamin EJ, Go AS, et al; American Heart Association Statistics Committee and Stroke Statistics Subcommittee. Heart disease and stroke statistics—2015 update: a report from the American Heart Association. Circulation. 2015;131(4):e29-e322.
2. Benjamin EJ, Blaha MJ, Chiuve SE, et al; American Heart Association Statistics Committee and Stroke Statistics Subcommittee. Heart disease and stroke statistics—2017 update: a report from the American Heart Association. Circulation. 2017;135(10):e146-e603.
3. Nwankwo T, Yoon SS, Burt V, Gu Q. Hypertension among adults in the United States: National Health and Nutrition Examination Survey, 2011-2012. NCHS Data Brief. 2013;(133):1-8.
4. James PA, Oparil S, Carter BL, et al. 2014 evidence-based guideline for the management of high blood pressure in adults: report from the panel members appointed to the Eighth Joint National Committee (JNC 8). JAMA. 2014;311(5):507-520.
5. Williamson JD, Supiano MA, Applegate WB, et al; SPRINT Research Group. Intensive vs standard blood pressure control and cardiovascular disease outcomes in adults aged ≥ 75 years: a randomized clinical trial. JAMA. 2016;315(24):2673-2682.
6. Pickering TG, Hall JE, Appel LJ, et al; Council on High Blood Pressure Research Professional and Public Education Subcommittee, American Heart Association. Recommendations for blood pressure measurement in humans: an AHA scientific statement from the Council on High Blood Pressure Research Professional and Public Education Subcommittee. J Clin Hypertens (Greenwich). 2005;7(2):102-109.
7. Siu AL; U.S. Preventive Services Task Force. Screening for high blood pressure in adults: U.S. Preventive Services Task Force recommendation statement. Ann Intern Med. 2015;163(10):778-786.
8. Niiranen TJ, Hänninen MR, Johansson J, Reunanen A, Jula AM. Home-measured blood pressure is a stronger predictor of cardiovascular risk than office blood pressure: the Finn-Home study. Hypertension. 2010;55(6):1346-1351.
9. Reino-Gonzalez S, Pita-Fernández S, Seoane-Pillado T, López-Calviño B, Pértega Díaz S. How in-office and ambulatory BP monitoring compare: a systematic review and meta-analysis. J Fam Pract. 2017;66(1):E5-E12.
10. Cohen JB, Cohen DL. Integrating out-of-office blood pressure in the diagnosis and management of hypertension. Curr Cardiol Rep. 2016;18(11):112.
11. Fuchs SC, Mello RB, Fuchs FC. Home blood pressure monitoring is better predictor of cardiovascular disease and target organ damage than office blood pressure: a systematic review and meta-analysis. Curr Cardiol Rep. 2013;15(11):413.
12. Imai Y, Obara T, Asamaya K, Ohkubo T. The reason why home blood pressure measurements are preferred over clinic or ambulatory blood pressure in Japan. Hypertens Res. 2013;36(8):661-672.
13. Bliziotis IA, Destounis A, Stergiou GS. Home versus ambulatory and office blood pressure in predicting target organ damage in hypertension: a systematic review and meta-analysis. J Hypertens. 2012;30(7):1289-1299.
14. Yang Y, Xu JZ, Wang Y, Gao PJ. Ambulatory versus clinic blood pressure in predicting overall subclinical target organ damage progression in essential hypertensive patients: a 3-year follow-up study. Blood Press Monit. 2016;21(6):319-326.
15. Espeland MA, Probstfield J, Hire D, et al; Look AHEAD Research Group; ACCORD Study Group. Systolic blood pressure control among individuals with type 2 diabetes: a comparative effectiveness analysis of three interventions. Am J Hypertens. 2015;28(8):995-1009.
16. Weiss J, Freeman M, Low A, et al. Benefits and harms of intensive blood pressure treatment in adults aged 60 years or older: a systematic review and meta-analysis. Ann Intern Med. 2017;166(6):419-429.
17. Nagai M, Ohkubo T, Murakami Y, et al; NIPPON DATA80/90/2010 Research Group. Secular trends of the impact of overweight and obesity on hypertension in Japan, 1980-2010. Hypertens Res. 2015;38(11):790-795.
18. Press Y, Punchik B, Freud T. Orthostatic hypotension and drug therapy in patients at an outpatient comprehensive geriatric assessment unit. J Hypertens. 2016;34(2):351-358.
Seventy-five percent of adults aged >75 years have hypertension.1-3 According to the Joint National Commission 8 (JNC 8), the recommended target blood pressure (BP) is < 150/80 mm Hg for adults aged > 60 years.4 In 2016 the Systolic Blood Pressure Intervention Trial (SPRINT) suggested that more aggressive BP control with a goal of < 120/80 mm Hg reduced rates of cardiovascular disease and lowered the risk of death in adults aged > 50 years with hypertension.5 It is anticipated that as a result of the landmark SPRINT results, clinicians may attempt to treat hypertension more intensely in older patients with an increased risk of adverse consequences if BPs are not appropriately measured.
There is a standardized protocol for BP measurement, but these recommendations typically are not followed in routine office visits.6,7 Some studies have noted that home BP measurement may be more accurate than office measurement.8 However, clinicians may not always trust the accuracy of home BP readings, and many patients are not adherent with home measurement. As a result, physicians usually manage hypertension in older patients based on office readings, though it is likely that most office measurements do not follow protocol on proper measurement. Office measurements have been noted to be inaccurate with high likelihood of overestimating or underestimating BP control.9
Office BP measurements demonstrate poor correlation with home measurements and have not been shown to be as good of a predictor for target organ damage or long-term cardiovascular outcomes compared with that of home measurements.10,11 Although there have been studies comparing home and office BP measurements and comparing office and ambulatory BP measurement, no literature has been found that reports on the difference between routine office and standardized measurement of BP.9,12-14
This study seeks to identify the magnitude of difference among BP measured according to a standardized protocol, routine clinical, and home BP. The authors hypothesized that there would be a significant, clinically relevant difference among the 3 BP measurement methods, especially between the routine office and standardized office measurements. This study has implications for implementing intensive treatment of hypertension based on office measurements.
Methods
Participants included 30 male veterans aged > 65 years who were actively participating in the Gerofit program at the VA Greater Los Angeles Healthcare System (VAGLAHS). The Gerofit program is a model clinical demonstration exercise and health promotion program targeting older and veterans at risk for falls or institutionalization. Gerofit was established in 1987 at the Durham VA Health System and successfully implemented in 2014 at VAGLAHS. Supervised exercise is offered 3 times per week and consists of individually tailored exercises aimed at reducing functional deficits that are identified and monitored by an initial and quarterly functional assessment. Blood pressures are checked routinely once a week as a part of the program. Gerofit was reviewed and approved by the institutional review board at VAGLAHS as a quality improvement/quality assurance project.
Data
Routine office and standardized protocol measurements were obtained by a single CasMED 740 (Branford, CT) automated BP machine and were conducted separately on different days. The CasMED 740 machine was not otherwise calibrated; however, a one-time correlation was performed between the CasMED 740 and the home BP monitor for each participant, when it was brought to VAGLAHS. Two measurements were made with the CasMed 740 automated BP machine on the arm that gave the higher BP reading throughout the standardized and routine protocol. Two subsequent measurements were made with the participant’s home automated BP cuff. Averages for the CasMED 740 and the home BP monitoring device were compared and assessed for significance by paired t test. No rest was scheduled prior to the first measurement, but there was a 1-minute rest after each subsequent measurement.
Mean values (SD) were used for participant characteristics and mean values (standard error [SE]) were used for BP measurements. Data were analyzed using Microsoft Excel (Redmond, WA) and GraphPad Prism version 7.03 (San Diego, CA). T tests were used for analysis of home BP measurements due to low sample size. Values of P < .05 were considered to be statistically significant.
Routine office protocol. Automated BP was measured to mimic routine office visits. Upon arrival, participants sat down, and the BP cuff was placed around their arm. Any rest before a measurement was incidental and not intentionally structured. Appropriate cuff size was determined by visual estimation of arm circumference. Only 1 measurement was made unless BP was > 150/90 mm Hg, in which case a repeat measurement was made after 2 to 4 minutes of rest. The BP was then determined based on the average of 2 or more readings. The BPs were recorded by hand in a weekly log. Participants had at least 12 weeks of BP readings measured by the routine method, and these BPs were averaged over 12 weeks to yield their average routine measured BP.
Standardized protocol. Automated BP was measured according to the 2015 USPSTF Guidelines and Look AHEAD trial protocol.7,15 A participant’s arm circumference was measured, and appropriate cuff size was determined. The participant rested quietly in a chair for at least 5 minutes with feet flat on the floor and back supported. The cuff was snugly placed 2 to 3 cm above the antecubital fossa, and the arm was supported at the level of the right atrium during the measurement. Blood pressure was determined using the mean of 4 automated cuff readings, 2 on each arm, taken 1 minute apart. Participants did not necessarily have their BP measured by the standardized method immediately following the routine method but all measurements were performed during the same 12-week time period.
Home blood pressure protocol. Participants were given instructions according to the American Heart Association (AHA) recommendations for measuring home BP. Patients were instructed to use a calibrated, automated arm BP cuff. Home BP machines were not provided in advance, and each individual’s BP machine was not calibrated. They also were instructed to rest at least 5 minutes before measuring their BP. The mean home BP was determined by the cumulative average of 3 readings in the morning and evening, taken 1 minute between each reading, for a total of 6 readings/d. Participants recorded home BPs for 2 weeks before submitting their readings. Each participant affirmed clear understanding of how to measure BP by correctly demonstrating placement of the cuff 1 time under supervision.
Results
Thirty veterans aged > 65 years participated in the study. The average age (SD) was 82.7 (9.3) years. The average BMI (SD) was overweight at 29.7 kg/m2 (5.7). Most (87.6%) of the study participants had been diagnosed with hypertension prior to the study, and no new diagnoses were made as a result of the study.
Both systolic BP (SBP) and diastolic BPs (DBP) measured by the standardized method were significantly lower than those by the routine method (P < .01 and P < .01, respectively) (Figure 1).
To determine the accuracy of the home BP monitors, the average routine VAGLAHS BP measure was compared with home BP results. For SBPs, there was a significant correlation coefficient of 0.91 (P < .01).
Discussion
The present study demonstrated that standardized measurements of BP were lower than that of the routine method used in most office settings. These results suggest that there could be a risk of overtreatment for some patients those of whose results are higher than the SPRINT BP target of < 120/80 mm Hg. Clinicians might be treating BPs that are elevated due to improper measurement, which can lead to deleterious consequences in older adults, such as syncope and falls.16
Each participant exhibited a significantly lower BP reading with the standardized method than the routine method. The 20-point decrease in SBP and 10-point decrease in DBP are clinically significant. The routine method of measurement was intended to simulate BP measurement in outpatient settings. There is usually little time structured for rest, and because the protocol established by the AHA and other professional organizations is time consuming, it usually is not strictly followed. With guidelines proposed by JNC 8 and new findings from SPRINT, the method of BP readings should be reviewed in all clinical settings.
While changes in BP management are not necessarily immediate, the differences in recommendations proposed by SPRINT and JNC 8 can lead to confusion regarding how intensely to treat BP. These recommendations guide clinical practice, but clinicians’ best judgment ultimately determines BP management. Physicians who utilize routine office measurements likely rely on BP readings that are higher on average than are readings done under proper conditions. This leads to the prospect of overtreatment, where physicians attempt to control hypertension too aggressively, potentially leading to orthostatic hypotension, syncope, and increased risk for falls.16 With findings from SPRINT recommending even lower BPs than that by JNC 8, overtreatment risk becomes especially relevant. While BP protocol was strictly followed in SPRINT, some clinicians may not necessarily follow the same fastidious protocol.
The average differences between the home and standardized BPs were not statistically significant possibly due to the small sample size in the home BP measurements; however, the difference might represent some clinical relevance. There was a 15-point difference in SBP results between home (129 mm Hg) and standardized (115 mm Hg) measures. There also was a difference in DBP between home (69 mm Hg) and standardized (62 mm Hg) results. The close correlation between both home and BPs measured in VAGLAHS demonstrated that any difference was not due to variability in the measurement devices. Previous studies have demonstrated that home BPs are better indicators of cardiovascular risk than office BP.8
Despite lack of statistical significance, home BPs were lower than routine, which suggests that they still may be more reliable than routine office measurements. Definitive conclusions regarding the accuracy of the home BPs in the present study cannot be drawn due to the small sample size (n = 13). Further exploration with comparisons to ambulatory BP monitoring could yield more information on accuracy of home BP monitoring.
In this study’s cohort of older veterans, the average BMI was between 25 and 30 (overweight), which is a risk factor for hypertension.17 Every participant with hypertension was taking at least 1 antihypertensive medication and being actively managed. In this study, the authors accounted for other medications that may affect BP, such as α blockers used in patients with benign prostatic hyperplasia.18 These could have potential elevating or lowering effects on BP measurements.
An issue in this study was the lack of adherence to home BP monitoring. Many patients forgot to bring in their records or to measure their BPs at home. The difficulties highlight real-life issues. Clinicians often request that patients monitor their BP at home, but few may actually remember, let alone keep diligent records. There are many barriers between measuring and reporting home BPs, which may prevent the usefulness of monitoring BP at home.
Limitations
There were several limitations to the study. There was no specific protocol for the routine method of BP measurement, as it was intended to simulate the haphazard nature of office measurements. However, this approach limits its reproducibility. For home BP monitoring, it would have been ideal to provide the same calibrated, automated BP device to each participant. This study of older veterans may not be applicable to the general population. Finally, the relatively small number of participants in the study (n = 30) may have limited power in drawing definitive conclusions.
Future Directions
For future studies, comparing the standardized method to ambulatory BP monitoring would provide more information on accuracy. In addition, the authors would like to evaluate the effect of exercise on BP measurements in the different settings: home, standardized, and routine methods.
1. Mozaffarian D, Benjamin EJ, Go AS, et al; American Heart Association Statistics Committee and Stroke Statistics Subcommittee. Heart disease and stroke statistics—2015 update: a report from the American Heart Association. Circulation. 2015;131(4):e29-e322.
2. Benjamin EJ, Blaha MJ, Chiuve SE, et al; American Heart Association Statistics Committee and Stroke Statistics Subcommittee. Heart disease and stroke statistics—2017 update: a report from the American Heart Association. Circulation. 2017;135(10):e146-e603.
3. Nwankwo T, Yoon SS, Burt V, Gu Q. Hypertension among adults in the United States: National Health and Nutrition Examination Survey, 2011-2012. NCHS Data Brief. 2013;(133):1-8.
4. James PA, Oparil S, Carter BL, et al. 2014 evidence-based guideline for the management of high blood pressure in adults: report from the panel members appointed to the Eighth Joint National Committee (JNC 8). JAMA. 2014;311(5):507-520.
5. Williamson JD, Supiano MA, Applegate WB, et al; SPRINT Research Group. Intensive vs standard blood pressure control and cardiovascular disease outcomes in adults aged ≥ 75 years: a randomized clinical trial. JAMA. 2016;315(24):2673-2682.
6. Pickering TG, Hall JE, Appel LJ, et al; Council on High Blood Pressure Research Professional and Public Education Subcommittee, American Heart Association. Recommendations for blood pressure measurement in humans: an AHA scientific statement from the Council on High Blood Pressure Research Professional and Public Education Subcommittee. J Clin Hypertens (Greenwich). 2005;7(2):102-109.
7. Siu AL; U.S. Preventive Services Task Force. Screening for high blood pressure in adults: U.S. Preventive Services Task Force recommendation statement. Ann Intern Med. 2015;163(10):778-786.
8. Niiranen TJ, Hänninen MR, Johansson J, Reunanen A, Jula AM. Home-measured blood pressure is a stronger predictor of cardiovascular risk than office blood pressure: the Finn-Home study. Hypertension. 2010;55(6):1346-1351.
9. Reino-Gonzalez S, Pita-Fernández S, Seoane-Pillado T, López-Calviño B, Pértega Díaz S. How in-office and ambulatory BP monitoring compare: a systematic review and meta-analysis. J Fam Pract. 2017;66(1):E5-E12.
10. Cohen JB, Cohen DL. Integrating out-of-office blood pressure in the diagnosis and management of hypertension. Curr Cardiol Rep. 2016;18(11):112.
11. Fuchs SC, Mello RB, Fuchs FC. Home blood pressure monitoring is better predictor of cardiovascular disease and target organ damage than office blood pressure: a systematic review and meta-analysis. Curr Cardiol Rep. 2013;15(11):413.
12. Imai Y, Obara T, Asamaya K, Ohkubo T. The reason why home blood pressure measurements are preferred over clinic or ambulatory blood pressure in Japan. Hypertens Res. 2013;36(8):661-672.
13. Bliziotis IA, Destounis A, Stergiou GS. Home versus ambulatory and office blood pressure in predicting target organ damage in hypertension: a systematic review and meta-analysis. J Hypertens. 2012;30(7):1289-1299.
14. Yang Y, Xu JZ, Wang Y, Gao PJ. Ambulatory versus clinic blood pressure in predicting overall subclinical target organ damage progression in essential hypertensive patients: a 3-year follow-up study. Blood Press Monit. 2016;21(6):319-326.
15. Espeland MA, Probstfield J, Hire D, et al; Look AHEAD Research Group; ACCORD Study Group. Systolic blood pressure control among individuals with type 2 diabetes: a comparative effectiveness analysis of three interventions. Am J Hypertens. 2015;28(8):995-1009.
16. Weiss J, Freeman M, Low A, et al. Benefits and harms of intensive blood pressure treatment in adults aged 60 years or older: a systematic review and meta-analysis. Ann Intern Med. 2017;166(6):419-429.
17. Nagai M, Ohkubo T, Murakami Y, et al; NIPPON DATA80/90/2010 Research Group. Secular trends of the impact of overweight and obesity on hypertension in Japan, 1980-2010. Hypertens Res. 2015;38(11):790-795.
18. Press Y, Punchik B, Freud T. Orthostatic hypotension and drug therapy in patients at an outpatient comprehensive geriatric assessment unit. J Hypertens. 2016;34(2):351-358.
Eltrombopag receives priority review designation for SAA

Eltrombopag (Promacta®) in combination with standard immunosuppressive therapy (IST) has received priority review designation from the US Food and Drug Administration (FDA) for first-line treatment of severe aplastic anemia (SAA).
The drug is already approved for SAA in the refractory setting for patients who have had an insufficient response to IST.
And it is approved for adults and children with chronic immune thrombocytopenia (ITP) who are refractory to other treatments and for patients with chronic hepatitis C virus infection who are thrombocytopenic.
Eltrombopag, an oral thrombopoietin receptor agonist, had received breakthrough therapy designation from the FDA earlier this year for use in combination with IST as first-line treatment of SAA.
The priority review designation for the agent as a first-line treatment for SAA is supported by data from a phase 1/2 trial published in NEJM in April 2017 and subsequent data on file with Novartis.
The FDA intends to take action on a priority review application within 6 months of receiving it, rather than the standard 10 months.
The agency grants priority review to applications for products that may provide significant improvements in the treatment, diagnosis, or prevention of serious conditions.
Trial data
Ninety-two patients with previously untreated SAA were enrolled on the trial and received IST and eltrombopag in 3 different cohorts.
Cohorts varied by start day of eltrombopag and duration of eltrombopag therapy. Patients in cohort 1 received eltrombopag from day 14 to 6 months. Patients in cohort 2 received the drug from day 14 to 3 months. And patients in cohort 3 received eltrombopag from day 1 to 6 months.
The overall response rate (ORR) at 6 months was 80% (cohort 1), 87% (cohort 2), and 94% (cohort 3).
The complete response rate at 6 months was 33%, 26%, and 58% in the 3 cohorts, respectively.
At a median follow-up of 2 years, the overall survival rate was 97%.
In the corporate announcement of the priority review designation, Novartis reported an ORR of 85% at 6 months.
Adverse events included transient elevations in liver enzyme levels (7 patients) and 2 severe adverse events—grades 2 and 3 cutaneous eruption—related to eltrombopag that resulted in patients stopping the drug.
Eltrombopag is marketed as Revolade in countries outside the US.
Equal treatment, equal or better prostate cancer outcomes for black men
CHICAGO – Black men with advanced prostate cancer have survival with chemotherapy that rivals or surpasses that of white men with advanced disease, and black men with castration-resistant prostate cancer have better outcomes with abiraterone than white men.
Those conclusions come from two studies presented here at the annual meeting of the American Society of Clinical Oncology. Taken together, they suggest that although there may be genetic or biologic differences in cancer presentation among different racial groups, receiving the appropriate care can level out those differences.
In the first study, Susan Halabi, PhD, from Duke University in Durham, N.C., and colleagues pooled data from nine randomized phase 3 chemotherapy trials in men with advanced prostate cancer and found that black and white men had the same median survival, 21 months, but black men had an adjusted hazard ratio [HR} for death of 0.81, compared with white men.
For the subpopulation of African Americans who were enrolled in trials funded by the National Cancer Institute (NCI), the HR for death was 0.76 (P less than .0001).
“The bottom line, in a sense, is that African American men with advanced prostate cancer need to get to an oncologist and ideally need to get on a clinical trial, and if they do, their outcomes are every bit as good as Caucasian men, if not even a little bit better,” Richard Schilsky, MD, chief medical officer of ASCO, said at a briefing prior to presentation of the studies.

In the second study, a prospective clinical trial of abiraterone (Zytiga) in 100 men with metastatic castration-resistant prostate cancer (mCRPC), black men were more likely to have a decline in prostate-specific antigen (PSA), and a longer median time to PSA rise than white men (16.6 vs. 11.5 months), reported Daniel George, MD, also from Duke.
“There’s a 1.6 times greater likelihood that African Americans are diagnosed with prostate cancer, but a 2.4 times greater chance they die from that disease, and although there very well may be multi-factorial reasons for that, I think some of this is genetic,” he said.
Pooled analysis
In the United States, black men are more likely to be diagnosed with prostate cancer in their 40s and 50s than white men and are often diagnosed with advanced-stage and higher grade cancers. Black men also have double the rate of prostate cancer-specific deaths as white men.

Black men, however, are underrepresented in clinical trials, making it difficult to draw firm conclusions about racial differences due to small sample sizes.
To overcome this problem, Dr. Halabi and colleagues pooled data on 8,452 patients with mCRPC - including 7,528 white men and 500 African American men – from nine randomized phase 3 trials of docetaxel and prednisone or a regimen containing those agents.
Median overall survival, the primary endpoint, was 21.0 months for black men and 21.2 months for white men.
In multivariate analysis adjusted for age, PSA, performance status, alkaline phosphatase, hemoglobin, and metastatic sites, the pooled hazard ratio (HR) for black vs. white men was 0.81 (P = .001) for all patients in the study, and when the analysis was restricted to those patients who received only docetaxel and prednisone (4,172), the results were similar, Dr. Halabi said.
“I would argue that what this tells us is pretty striking: that African-American men have potentially better survival by getting conventional therapy,” commented ASCO expert Robert Dreicer, MD, MS, from the University of Virginia in Charlottesville.
“The nihilism associated with prostate cancer in African-American men is not supported by this really interesting work,” he continued. “What it says to us is when we treat those with bad prostate cancer, African Americans, they do well.”
Abiraterone Study
In the abiraterone study, 50 men who self-identified as white and 50 as black were enrolled and treated with abiraterone acetate and prednisone until disease progression or intolerable toxicity.
Radiographic progression-free survival, the primary endpoint, was 16.8 months in each group. As previously noted, however, median PFS was 16.6 months for black patients, vs. 11.5 months for white men. Black men also had a longer median PSA PFS, with 82% of black men having a 30% or greater PSA decline, compared with 78% of white patients. Respective proportions of men having higher declines were 74% vs. 66% experiencing a PSA decline of at least 50%, and 48% vs. 38% having a decline of at least 90%.
Rates of tumor flare, however, were higher among African Americans, at 16% vs. 4%.
Adverse event rates were generally similar between the study arms, although more white than black patients experienced fatigue, and more black than white patients had hypokalemia.
Single-nucletoide polymorphism (SNP) profiling showed differences between the two groups in key genes involved in androgen metabolism and transport, which may explain the improved responses to abiraterone among African Americans.
“We talk about access to care; we have now demonstrated that if you treat African Americans with standard-of-care drugs for advanced prostate cancer, there’s compelling evidence that they respond as well or maybe better than white men,” Dr. Dreicer commented.
“[We are] beginning to understand the differences that drive differential responses,” he continued. “When African-American men are under-represented in clinical trials, the trial outcomes might be different, frankly, because people respond differently to drugs. I think those are the take homes.”
SOURCE: Halabi et al, George et al. ASCO 2018 Abstracts LBA5005 and LBA5009
CHICAGO – Black men with advanced prostate cancer have survival with chemotherapy that rivals or surpasses that of white men with advanced disease, and black men with castration-resistant prostate cancer have better outcomes with abiraterone than white men.
Those conclusions come from two studies presented here at the annual meeting of the American Society of Clinical Oncology. Taken together, they suggest that although there may be genetic or biologic differences in cancer presentation among different racial groups, receiving the appropriate care can level out those differences.
In the first study, Susan Halabi, PhD, from Duke University in Durham, N.C., and colleagues pooled data from nine randomized phase 3 chemotherapy trials in men with advanced prostate cancer and found that black and white men had the same median survival, 21 months, but black men had an adjusted hazard ratio [HR} for death of 0.81, compared with white men.
For the subpopulation of African Americans who were enrolled in trials funded by the National Cancer Institute (NCI), the HR for death was 0.76 (P less than .0001).
“The bottom line, in a sense, is that African American men with advanced prostate cancer need to get to an oncologist and ideally need to get on a clinical trial, and if they do, their outcomes are every bit as good as Caucasian men, if not even a little bit better,” Richard Schilsky, MD, chief medical officer of ASCO, said at a briefing prior to presentation of the studies.
In the second study, a prospective clinical trial of abiraterone (Zytiga) in 100 men with metastatic castration-resistant prostate cancer (mCRPC), black men were more likely to have a decline in prostate-specific antigen (PSA), and a longer median time to PSA rise than white men (16.6 vs. 11.5 months), reported Daniel George, MD, also from Duke.
“There’s a 1.6 times greater likelihood that African Americans are diagnosed with prostate cancer, but a 2.4 times greater chance they die from that disease, and although there very well may be multi-factorial reasons for that, I think some of this is genetic,” he said.
Pooled analysis
In the United States, black men are more likely to be diagnosed with prostate cancer in their 40s and 50s than white men and are often diagnosed with advanced-stage and higher grade cancers. Black men also have double the rate of prostate cancer-specific deaths as white men.
Black men, however, are underrepresented in clinical trials, making it difficult to draw firm conclusions about racial differences due to small sample sizes.
To overcome this problem, Dr. Halabi and colleagues pooled data on 8,452 patients with mCRPC - including 7,528 white men and 500 African American men – from nine randomized phase 3 trials of docetaxel and prednisone or a regimen containing those agents.
Median overall survival, the primary endpoint, was 21.0 months for black men and 21.2 months for white men.
In multivariate analysis adjusted for age, PSA, performance status, alkaline phosphatase, hemoglobin, and metastatic sites, the pooled hazard ratio (HR) for black vs. white men was 0.81 (P = .001) for all patients in the study, and when the analysis was restricted to those patients who received only docetaxel and prednisone (4,172), the results were similar, Dr. Halabi said.
“I would argue that what this tells us is pretty striking: that African-American men have potentially better survival by getting conventional therapy,” commented ASCO expert Robert Dreicer, MD, MS, from the University of Virginia in Charlottesville.
“The nihilism associated with prostate cancer in African-American men is not supported by this really interesting work,” he continued. “What it says to us is when we treat those with bad prostate cancer, African Americans, they do well.”
Abiraterone Study
In the abiraterone study, 50 men who self-identified as white and 50 as black were enrolled and treated with abiraterone acetate and prednisone until disease progression or intolerable toxicity.
Radiographic progression-free survival, the primary endpoint, was 16.8 months in each group. As previously noted, however, median PFS was 16.6 months for black patients, vs. 11.5 months for white men. Black men also had a longer median PSA PFS, with 82% of black men having a 30% or greater PSA decline, compared with 78% of white patients. Respective proportions of men having higher declines were 74% vs. 66% experiencing a PSA decline of at least 50%, and 48% vs. 38% having a decline of at least 90%.
Rates of tumor flare, however, were higher among African Americans, at 16% vs. 4%.
Adverse event rates were generally similar between the study arms, although more white than black patients experienced fatigue, and more black than white patients had hypokalemia.
Single-nucletoide polymorphism (SNP) profiling showed differences between the two groups in key genes involved in androgen metabolism and transport, which may explain the improved responses to abiraterone among African Americans.
“We talk about access to care; we have now demonstrated that if you treat African Americans with standard-of-care drugs for advanced prostate cancer, there’s compelling evidence that they respond as well or maybe better than white men,” Dr. Dreicer commented.
“[We are] beginning to understand the differences that drive differential responses,” he continued. “When African-American men are under-represented in clinical trials, the trial outcomes might be different, frankly, because people respond differently to drugs. I think those are the take homes.”
SOURCE: Halabi et al, George et al. ASCO 2018 Abstracts LBA5005 and LBA5009
REPORTING FROM ASCO 2018
Key clinical point: Apparent racial disparities in prostate cancer care may be reduced or eliminated with proper care and access to clinical trials.
Major finding: In a pooled analysis, black men with advanced prostate cancer treated with docetaxel prednisone had a 19% lower risk for death than white men,
Study details: Pooled analysis of 9 randomized phase III trials with a total of 8,452 men and a prospective trial with 100 men with advanced prostate cancer.
Disclosures: The study by Halabi et al was funded by Congressionally Directed Medical Research Programs. The study by George et al was funded by Janssen. Dr. Halabi disclosed a consulting or advisory role with Tokai Pharmaceuticals, Eisai, and Bayer, and travel expenses from Bayer. Dr. George disclosed consulting/advising with Janssen and several other pharmaceutical companies, in addition to speakers’ bureau, travel expenses, and honoraria from various companies. He has also received institutional research funding from Exelixis, Genentech/Roche, Janssen Oncology, Novartis, Pfizer, Astellas Pharma, Bristol-Myers Squibb, Millennium, Acerta Pharma, Bayer, Dendreon, and Innocrin Pharma.
Source: Halabi et al, George et al. ASCO 2018 Abstracts LBA5005 and LBA5009.
Post-traumatic osteoarthritis needs to be prevention focus
, Jackie Whittaker, PT, PhD, said at the World Congress of Osteoarthritis.
“We all know that the burden of this disease is enormous and it’s expanding at an alarming rate,” she said at the congress, sponsored by the Osteoarthritis Research Society International.
“The only way that we have at this moment to try to reduce the burden of this disease is to shift our approach to management upstream and focus on prevention,” said Dr. Whittaker, who is an associate professor and research director at the University of Alberta, Edmonton, Canada.
According to the World Health Organization, OA is expected to become the fourth leading cause of disability worldwide by 2020. Furthermore, there will be a projected rise in prevalence from 12% to 25% in North America by 2030.
Dr. Whittaker suggested that it was time to try to identify those at risk of developing OA, such as after a joint injury, and ran through some suggestions on how posttraumatic OA (PTOA) might be preventable.
Secondary prevention of posttraumatic osteoarthritis
The prevention of PTOA can be split into primary, secondary and tertiary prevention, with primary prevention trying to prevent injuries from occurring in the first place.
“Strategies aimed at identifying and slowing down the onset of symptomatic osteoarthritis in preclinical populations would be referred to as secondary prevention,” Dr. Whittaker explained, adding that tertiary prevention would then be strategies aimed at improving function and reducing disability in those who already have symptomatic PTOA.
While there are programs that address primary and tertiary prevention – such as Footy First, an exercise training program adopted by the Australian Football League to reduce the risk of common leg injuries and the Good Life with osteoArthritis in Denmark (GLA:D®) education and supervised exercise program for those with symptomatic OA – there is more of a gap for secondary prevention.
Some of the first steps to developing a secondary prevention model would be to determine the extent of PTOA after joint injury and then identify risk factors or causal mechanisms. Then, prevention strategies could be developed and tested before implementation and effectiveness studies are performed.
Performing the necessary prospective cohort studies, however, is when things get challenging – PTOA can take 10–15 years to manifest and studies would potentially need to run for long periods of time, which comes at a cost. Other challenges are that there is no commonly agree definition. PTOA is multifactorial, and because people may be in their 20s, there could be other contributing factors to the disease course.
Identifying modifiable risk factors
There are a “fair number” of prospective and retrospective studies that have been done to try to identify patients at risk for OA after joint injury. Several have looked at unmodifiable risk factors, such as age and sex, and the type of injury. Others have looked at potentially modifiable factors such as the treatment approach and avoiding re-injury, joint mechanics and strength, body composition and aerobic fitness and behavioral characteristics such as physical activity and return to sport.
Data from the Alberta Youth PrE-OA Study, an ongoing longitudinal cohort study, have shown that structural changes consistent with OA are not unique to tears in the anterior cruciate ligament or to meniscal tears, which are known to up the risk of PTOA. Furthermore, the odds of having MRI-defined OA 3–10 years after a knee injury varies by the injury history, type, and surgery.
Other findings from the Alberta Youth PrE-OA Study data have shown that previously injured subjects have a 30% risk for re-injury, with weaker knee extensors and flexors and poorer dynamic balance than uninjured study participants. The results have also shown that there is reduced physical activity and avoidance in those who have been injured.
Who is the population at risk?
“Although the supporting evidence and the level of evidence for some of the risk factors is not as thorough as we would like it, there are some common themes across the literature, that are consistent to what we see in clinical practice, and what we know from primary and tertiary prevention,” Dr. Whittaker said. “Based upon that, we can start to hypothesize who’s at greatest risk of developing posttraumatic osteoarthritis and what we might start doing about it right now.”
Dr. Whittaker proposed the following risk factors could be used to “build a profile” of someone at risk of PTOA:
- Having sustained an anterior cruciate ligament (ACL) tear with or without a damaged meniscus
- Elevated body mass index (BMI) or adiposity, and low grade systemic inflammation
- Weak knee muscles, and poor dynamic balance
- Reduced or disengaged from physical activity
- Insufficient rehabilitation, pain or stiffness, or fear of movement
There is also an argument for nutrition being involved, Dr. Whittaker said, with levels of micronutrients such as vitamins D and K and calcium playing an integral role in bone health.
What could secondary prevention look like?
“So, with this risk profile, what can be done?” Dr. Whittaker asked rhetorically. Exercise therapy is key, and increasing the muscle strength of the knee and lower extremity are an important component of this strategy. Strength alone may not be enough, so exercise programs will need to increase the neuromuscular control of functional movements. Tackling people’s fear of movement will also be a priority. “I think it’s very important that we promote, if not implement, physical activity guidelines.”
Education is also going to be an important part of any secondary prevention program for PTOA, ensuring that people have realistic expectations about re-injury and their risk of developing osteoarthritis and the importance of remaining physically active. Balancing physical activity against their likelihood of flare-ups and learning how to avoid re-injury if at all possible. Weight control and diet will also be a component to include.
One final component is how clinicians work with patients to minimize their risk of PTOA. “We need to co-manage these patients,” Dr. Whittaker said. “We need to have difficult conversations with them and really balance giving them a picture of reality without over medicalizing the situation.”
Dr. Whitaker stated that she had no financial relationships or commercial interests to disclose.
SOURCE: Whittaker J, et al. Osteoarthritis Cartilage 2018:26(1):S7-8. Abstract I-22.
REPORTING FROM OARSI 2018
A blood test to detect lung cancer inches toward the clinic
The video associated with this article is no longer available on this site. Please view all of our videos on the MDedge YouTube channel
CHICAGO - Uptake of recommended low-dose CT for lung cancer screening has been dismal. Blood-based assays are an attractive alternative being explored by the Circulating Cell–Free Genome Atlas (CCGA) project. Interim results of a CCGA study of 561 individuals without cancer and 118 patients with lung cancers of all stages have found that a trio of assays searching for molecular signatures in plasma cell-free DNA achieved roughly 50% sensitivity for detection of early-stage (stage I-IIIA) lung cancers and 91% sensitivity for detection of late-stage (stage IIIB-IV) lung cancers.
In this video interview from the annual meeting of the American Society of Clinical Oncology, lead study author Geoffrey R. Oxnard, MD, of the Dana-Farber Cancer Institute, Boston, discusses the science behind these assays, how they may fill an unmet medical need, and ongoing work to bring them into the clinic.
REPORTING FROM ASCO 2018

Heading down the wrong pathway in advanced breast cancer?
The video associated with this article is no longer available on this site. Please view all of our videos on the MDedge YouTube channel
CHICAGO – In the SANDPIPER trial, the combination of the phosphatidylinositol 3-kinase (PI3K) inhibitor taselisib and the selective estrogen receptor modifier fulvestrant (Faslodex) was associated with a small but significant progression-free survival (PFS) benefit, compared with fulvestrant alone in women with advanced estrogen-receptor positive, HER2-negative breast cancer.
That 2-month PFS benefit, described as “modest” by investigators, came at the cost of significant toxicities, with nearly 50% of patients treated with the combination having grade 3 or greater toxicities, compared with 16% of patients treated with fulvestrant alone.
In this video interview from the annual meeting of the American Society of Clinical Oncology, ASCO expert Harold Burstein, MD, PhD, from the Dana-Farber Cancer Institute in Boston, questions whether the PI3K pathway, shown to be targetable in hematologic malignancies, is worth continuing to pursue in breast cancer.
Dr. Burstein had no disclosures.
REPORTING FROM ASCO 2018

Mediterranean diet cut fatty liver risk
Middle-aged and older adults who closely followed a Mediterranean-style diet for 6 years were at significantly lower risk of developing fatty liver disease than others in a large prospective study.
Each 1-standard-deviation rise in Mediterranean-style Diet Score (MDS) correlated with significantly decreased hepatic fat accumulation and a 26% lower odds of new onset fatty liver disease (P = .002). “To our knowledge, ours is the first prospective study to examine the relations of long-term habitual diet to fatty liver,” Jiantao Ma, MBBS, PhD, and his associates wrote in Gastroenterology. “Our findings indicate that improved diet quality may be particularly important for those with high genetic risk for NAFLD.”

Over a median 6 years of follow-up, each 1-standard deviation rise in MDS correlated with a 26% decrease in odds of new-onset fatty liver (95% CI, 10% to 39%; P = .002) and with a significant increase in liver phantom ratio (0.57; 95% confidence interval, 0.27 to 0.86; P less than .001), which signifies lower accumulation of liver fat. Similarly, every 1-standard deviation rise in the AHEI dietary score correlated with a 0.56 rise in liver phantom ratio (95% CI, 0.29 to 0.84; P less than .001) and with a 21% lower odds of incident fatty liver disease (95% CI, 5% to 35%; P = .02).
Individuals whose diets improved the most (those in the highest quartile of dietary score change) over time had about 80% less liver fat accumulate between baseline and follow-up compared with those whose diets worsened the most (those in the lowest quartile of dietary score change). Furthermore, relationship between diet and liver fat remained statistically significant (P = .02) even after accounting for changes in body mass index.
The investigators also studied whether the presence of single nucleotide polymorphisms (SNPs) linked with NAFLD modified dietary effects. High genetic risk for NAFLD did not appear to lead to increased liver fat as long as diet improved or remained stable over time, they found. But when diet worsened over time, high genetic NAFLD risk did correlate with significantly greater accumulation of liver fat (P less than .001).
“Future intervention studies are needed to test the efficacy and efficiency of diet-based approaches for NAFLD prevention as well as to examine mechanisms underlying the association between diet and NAFLD,” the researchers wrote.
The National Heart, Lung and Blood Institute’s Framingham Heart Study provided funding. Affymetrix provided genotyping. The researchers reported having no financial conflicts of interest.
SOURCE: Ma J, et al. Gastroenterology. 2018 Mar 28. doi: 10.1053/j.gastro.2018.03.038
Middle-aged and older adults who closely followed a Mediterranean-style diet for 6 years were at significantly lower risk of developing fatty liver disease than others in a large prospective study.
Each 1-standard-deviation rise in Mediterranean-style Diet Score (MDS) correlated with significantly decreased hepatic fat accumulation and a 26% lower odds of new onset fatty liver disease (P = .002). “To our knowledge, ours is the first prospective study to examine the relations of long-term habitual diet to fatty liver,” Jiantao Ma, MBBS, PhD, and his associates wrote in Gastroenterology. “Our findings indicate that improved diet quality may be particularly important for those with high genetic risk for NAFLD.”
Over a median 6 years of follow-up, each 1-standard deviation rise in MDS correlated with a 26% decrease in odds of new-onset fatty liver (95% CI, 10% to 39%; P = .002) and with a significant increase in liver phantom ratio (0.57; 95% confidence interval, 0.27 to 0.86; P less than .001), which signifies lower accumulation of liver fat. Similarly, every 1-standard deviation rise in the AHEI dietary score correlated with a 0.56 rise in liver phantom ratio (95% CI, 0.29 to 0.84; P less than .001) and with a 21% lower odds of incident fatty liver disease (95% CI, 5% to 35%; P = .02).
Individuals whose diets improved the most (those in the highest quartile of dietary score change) over time had about 80% less liver fat accumulate between baseline and follow-up compared with those whose diets worsened the most (those in the lowest quartile of dietary score change). Furthermore, relationship between diet and liver fat remained statistically significant (P = .02) even after accounting for changes in body mass index.
The investigators also studied whether the presence of single nucleotide polymorphisms (SNPs) linked with NAFLD modified dietary effects. High genetic risk for NAFLD did not appear to lead to increased liver fat as long as diet improved or remained stable over time, they found. But when diet worsened over time, high genetic NAFLD risk did correlate with significantly greater accumulation of liver fat (P less than .001).
“Future intervention studies are needed to test the efficacy and efficiency of diet-based approaches for NAFLD prevention as well as to examine mechanisms underlying the association between diet and NAFLD,” the researchers wrote.
The National Heart, Lung and Blood Institute’s Framingham Heart Study provided funding. Affymetrix provided genotyping. The researchers reported having no financial conflicts of interest.
SOURCE: Ma J, et al. Gastroenterology. 2018 Mar 28. doi: 10.1053/j.gastro.2018.03.038
FROM GASTROENTEROLOGY
Key clinical point: A Mediterranean-style diet was associated with significantly less liver fat accumulation and significantly lower risk of fatty liver disease.
Major finding: Each 1-standard-deviation increase in the Mediterranean Diet Score (MDS) correlated with a 26% lower odds of de novo NAFLD (P = .002).
Study details: Prospective study of 1,521 adults from the Framingham Heart Study.
Disclosures: The National Heart, Lung and Blood Institute’s Framingham Heart Study provided funding. Affymetrix provided genotyping. The researchers reported having no conflicts of interest.
Source: Ma J, et al. Gastroenterology. 2018 Mar 28.
Global MS trends: A chaotic picture with risk as the central theme
NASHVILLE, Tenn. – Recent epidemiologic studies of multiple sclerosis from around the globe paint a confusing picture, with incidence up in some countries and down in others, latitudinal associations strong in some regions and waning in others, and an overall lack of well-managed databases to bring order to these findings.
Alberto Ascherio, MD, who moderated a global epidemiology session during the annual meeting of the Consortium of Multiple Sclerosis Centers, said it’s tough to draw firm conclusions from the vastly varied studies assessing epidemiologic patterns of MS around the world. Most researchers are trying to extrapolate population data from smaller groups – a process always fraught with the potential for misinterpretation.
Global data, however, converge on some of the most well-established risk factors for the disease, he said. “There seems to be no doubt that vitamin D deficiency, teenager obesity, Epstein-Barr virus infection, and smoking remain strong risk factors for MS in every database in every country that has examined this,” said Dr. Ascherio, a professor of epidemiology and nutrition at Harvard University, Boston.
He sat down for a video interview to pick apart some of the findings from studies in Australia, New Zealand, Western Europe, Canada, and the United States.
Dr. Ascherio had no financial disclosures.
REPORTING FROM THE CMSC ANNUAL MEETING

Focus on preventing comorbidities in MS, physician urges
NASHVILLE, TENN. – Some patients use multiple sclerosis as an excuse to make poor health choices, but Allen C. Bowling, MD, PhD, of the Colorado Neurological Institute has seen another kind of story unfold. Fifteen to 20 years ago, Dr. Bowling said, he treated patients who took the development of MS in their 20s as a sign they needed to take better care of themselves. “They said MS was the best thing that happened to them ‘because it motivated me to make these healthy lifestyle changes I wouldn’t have made otherwise.’ ”
These patients have maintained their lifestyle changes, he said, lowering their risk of comorbidities and – perhaps – changing the course of their MS for the better.
“It’s all one machine, and sometimes we lose sight of that in our sub-sub-specialized world of treating MS ... You’re caring for a whole person. If you start thinking about that, it does make you think differently about how you treat the person, how you try to prevent disease in terms of certain pathways,” Dr. Bowling said in an interview at the annual meeting of the Consortium of Multiple Sclerosis Centers, where he spoke to colleagues about the importance of helping patients to adopt lifestyle changes.
According to Dr. Bowling, there’s evidence linking lifestyle-related comorbidities, poorer food quality, and tobacco use to higher levels of overall MS risk, relapses, disability, and symptoms.
Researchers have also linked other life factors to higher MS risks: obesity (linked to overall MS risk, disability, symptoms); lack of physical activity (linked to relapses, disability, symptoms); emotional factors (relapses, symptoms); and alcohol overuse (linked to overall risk, disability, symptoms).
“Data is mild to moderate to strong in all those areas for lifestyle approaches like diet, physical activity, emotional health, alcohol in moderation or less, and no tobacco smoking,” Dr. Bowling said.
He said he believes physical activity leads to “much higher and earlier success than diet” in MS patients, although there’s no confirmed “best exercise.”
As for nutrition, he said vitamins D and B12 are possibly beneficial. But he cautioned against the potential for harm from supplements and added that there’s no proven best diet for MS.
As for finding time to address these issues in clinic, Dr. Bowling recommended mentioning various lifestyle issues over multiple office visits.
“Some of the effort should be switched to the primary care doctor,” he said, “but you can use a strong collection of words to convey to the person with MS that this is serious: ‘It’s not MS, but it’s a serious issue, and you must see your primary care doctor.’ ”
He believes that this approach can have a significant impact, “especially for those aged 20-40, because the doctor they pay the most attention to may be their MS clinician.”
Dr. Bowling said that he receives royalties from a book he authored, “Optimal Health With Multiple Sclerosis.”
REPORTING FROM THE CMSC ANNUAL MEETING

Pregnancy may be ideal time to consider switching MS drugs
The video associated with this article is no longer available on this site. Please view all of our videos on the MDedge YouTube channel
NASHVILLE, TENN – Women with multiple sclerosis who fare poorly on specific medications before pregnancy don’t tend to do any better afterward, a new study finds. This suggests that pregnancy – a period when many women with MS stop taking their medication – should trigger discussions about switching from drugs that aren’t doing the job, the study’s lead author said.
“It’s a good time to consider the therapy that the individual is on, whether it’s one that’s effective for them, and whether it’s one they should return to when they start up therapy post-partum. It’s likely it will affect them the same way” after pregnancy as before, Caila Vaughn, MPH, PhD, of the University of Buffalo, said in an interview at the 2018 annual meeting of the Consortium of Multiple Sclerosis Clinics.
From 2012-2017, the study authors sent surveys to 1,651 women in the New York State Multiple Sclerosis Consortium as part of an effort to understand how pregnancy affects women with MS, especially when relapses return in the post-partum period.
Of the 1,651 women, 635 (38% of the total) agreed to answer questions about their reproductive history.
Pregnancy data was available for 627 patients of whom 490 (78%) had been pregnant. Of those, 109 said they became pregnant after their MS diagnosis.
Fifty-three (49%) reported relapses in the 2 years prior to pregnancy and 46% reported them in the 2 subsequent years. Just 12% reported relapses during pregnancy, and 16% said they took disease-modifying drugs during pregnancy (60% had taken them before pregnancy).
Why does MS become less severe during pregnancy? “We believe the dormancy of the disease is related to an immune system that is naturally decreased and depressed during pregnancy,” Dr. Vaughn said. Afterward, she said, “the relapses are related to the recovery of the immune system post-partum.”
The researchers didn’t find any links between the use of disease-modifying drugs and relapses before, during, or after pregnancy.
Those who had relapses prior to pregnancy were more likely (P = 0.011) to have them afterward too. But researchers didn’t find a statistically significant link between relapses that occurred during and after pregnancy.
More than three-quarters of those who took disease-modifying drugs before pregnancy returned to using them afterward, in most cases within 3 months.
The study findings suggest that pregnancy is a helpful decision point when patients should take a closer look at the effects of their medications, Dr. Vaughn said. “In conjunction with a physician, they should decide if it’s a good one they should return to.”
Reflecting the findings of other research that suggests pregnancy is safe in women with MS, the study shows no sign that pregnancy – either before or after diagnosis of MS – boosts the risk that MS will get worse.
As for the possible effects of disease-modifying drugs on new mothers who breast-feed, the researchers found no evidence of adverse outcomes in 5 patients who took the medications while breast-feeding.
The study was funded by Teva. Dr. Vaughn reported no relevant disclosures. Several other study authors report various disclosures, including relationships with Teva.
SOURCE: Vaughn C. et al. Abstract FC04, 2018 annual meeting, Consortium of Multiple Sclerosis Centers.
REPORTING FROM THE CMSC ANNUAL MEETING
Key clinical point: Multiple sclerosis relapse rates are similar before and after pregnancy, suggesting it may be a good time to consider switching medications if feasible.
Major finding: 49% of women who were pregnant after MS diagnosis reported relapses in the 2 years prior to pregnancy and 46% reported them in the 2 subsequent years. Those who had relapses prior to pregnancy were more likely to have them afterward, too.
Study details: Survey of 109 women who became pregnant after MS diagnosis.
Disclosures: Teva funded the study. Several study authors report various disclosures, including relationships with Teva.
Source: Vaughn C. et al. Abstract FC04, 2018 annual meeting, Consortium of Multiple Sclerosis Centers.