User login
Does HPV testing lead to improved diagnosis of cervical dysplasia for patients with ASC-US cytology?
EXPERT COMMENTARY
The American Society for Colposcopy and Cervical Pathology (ASCCP) has recommended HPV triage for ASC-US cytology for more than 15 years. Since the ALTS trial demonstrated improved detection of CIN2+ in women with ASC-US cytology, HPV testing has become the preferred triage strategy for women with ASC-US cytology, except for women under age 25.1 However, we do not know the long-term outcomes for these women. The study by Cuzick and colleagues uniquely addresses this question.
Details of the study
The retrospective review of data from the New Mexico HPV Pap Registry examined the influence of HPV testing on outcomes in 20,677 women with ASC-US cytology between 2008 and 2012. Of those women, 80.5% had an HPV test, and the authors estimated that 80.6% of those HPV tests were for triage after ASC-US cytology as opposed to co-testing (that is, cytology and HPV testing together). Of note, the majority of these Pap tests were performed prior to the 2012 ASCCP guidelines that recommend HPV co-testing for all women aged 30 to 64 years regardless of cytology. Of the HPV tests performed, 43.1% were positive. The investigators then examined rates of CIN in the interval between ASC-US cytology and biopsy-confirmed CIN, and rates of loop electrosurgical excision procedures (LEEP) and results at 5 years.
The investigators found a non–statistically significant increase in overall detection of CIN3 (relative risk [RR], 1.16; 95% confidence interval [CI], 0.92–1.45) in women who had been triaged with HPV testing, and a significant increase in overall detection of CIN2 (RR, 1.27; 95% CI, 1.06–1.53) and CIN1 (RR, 1.76; 95% CI, 1.56–2.00). CIN1, CIN2, and CIN3 were detected significantly earlier in patients with HPV testing. As expected, the majority of CIN2 and CIN3 was diagnosed in women who were HPV positive.
Related article:
2017 Update on cervical disease
The proportion of women undergoing either endocervical curettage or cervical biopsy was higher in those with HPV testing (32.1% vs 20.6%, P<.001), as were LEEP rates (4.9% vs 4.0%, P = .03). LEEP rates were highest in the year after a positive HPV test and were mostly attributable to CIN1 results. However, the overall ratio of LEEP to CIN3+ diagnosis was similar in women who were tested for HPV compared with those who were not. A larger proportion of patients with HPV testing had follow-up compared with those without HPV testing (84.1% vs 78.9%, P<.001).
The authors concluded that HPV testing in women with ASC-US cytology leads to detecting high-grade disease earlier, but that HPV positivity results in more interventions, largely due to an overdiagnosis of CIN1. They also confirmed that the majority of high-grade lesions are found in women with positive HPV tests.
Related article:
2015 Update on cervical disease: New ammo for HPV prevention and screening
Study strengths and weaknesses
This is the first comprehensive long-term look at women with ASC-US cytology and the impact of HPV testing. The New Mexico HPV Pap Registry is the only US state-based registry with comprehensive follow-up data. This study’s results build on previous data that showed sensitivity is increased with the addition of HPV testing to cervical cytology,1 and they support current ASCCP guidelines that emphasize HPV triage or co-testing for women age 25 or older.
Potential bias. While this study has the benefit of a large cohort, it is limited by biases inherent in retrospective study design. One important potential bias is the differential utilization of HPV testing or procedures by providers. The authors acknowledge preliminary analyses that show that some clinics (rural, federally qualified health centers, public health clinics) serving underserved populations may underutilize or inappropriately utilize HPV testing.
Further, the 2008–2012 study period may make the results less generalizable to current practices since the ASCCP guidelines were adjusted to include more HPV testing in women aged 25 and older in 2012.
Finally, this study examines CIN but does not specifically look at the impact of HPV testing on the ultimate outcome of interest, cervical cancer rates.
The data from the study by Cuzick and colleagues support the importance of continued screening for cervical cancer and its precursors with HPV testing. However, the results also show that we need to improve our strategies for stratifying patients who actually need colposcopy. The authors assert an "enormous predictive value of HPV testing," but this comes at the expense of many unnecessary procedures. Clinicians should continue to use cytology with HPV triage in women aged 25 years and older, but the ASCCP should reconsider guidelines to improve screening specificity. The addition of other screening modalities, such as extended genotyping, methylation testing, and p16/Ki-67 staining, are considerations for ASC-US triage.
-- Sarah Dilley, MD, MPH, and Warner K. Huh, MD
Share your thoughts! Send your Letter to the Editor to rbarbieri@frontlinemedcom.com. Please include your name and the city and state in which you practice.
- ASCUS-LSIL Triage Study (ALTS) Group. Results of a randomized trial on the management of cytology interpretations of atypical squamous cells of undetermined significance. Am J Obstet Gynecol. 2003;188(6):1383–1392.
EXPERT COMMENTARY
The American Society for Colposcopy and Cervical Pathology (ASCCP) has recommended HPV triage for ASC-US cytology for more than 15 years. Since the ALTS trial demonstrated improved detection of CIN2+ in women with ASC-US cytology, HPV testing has become the preferred triage strategy for women with ASC-US cytology, except for women under age 25.1 However, we do not know the long-term outcomes for these women. The study by Cuzick and colleagues uniquely addresses this question.
Details of the study
The retrospective review of data from the New Mexico HPV Pap Registry examined the influence of HPV testing on outcomes in 20,677 women with ASC-US cytology between 2008 and 2012. Of those women, 80.5% had an HPV test, and the authors estimated that 80.6% of those HPV tests were for triage after ASC-US cytology as opposed to co-testing (that is, cytology and HPV testing together). Of note, the majority of these Pap tests were performed prior to the 2012 ASCCP guidelines that recommend HPV co-testing for all women aged 30 to 64 years regardless of cytology. Of the HPV tests performed, 43.1% were positive. The investigators then examined rates of CIN in the interval between ASC-US cytology and biopsy-confirmed CIN, and rates of loop electrosurgical excision procedures (LEEP) and results at 5 years.
The investigators found a non–statistically significant increase in overall detection of CIN3 (relative risk [RR], 1.16; 95% confidence interval [CI], 0.92–1.45) in women who had been triaged with HPV testing, and a significant increase in overall detection of CIN2 (RR, 1.27; 95% CI, 1.06–1.53) and CIN1 (RR, 1.76; 95% CI, 1.56–2.00). CIN1, CIN2, and CIN3 were detected significantly earlier in patients with HPV testing. As expected, the majority of CIN2 and CIN3 was diagnosed in women who were HPV positive.
Related article:
2017 Update on cervical disease
The proportion of women undergoing either endocervical curettage or cervical biopsy was higher in those with HPV testing (32.1% vs 20.6%, P<.001), as were LEEP rates (4.9% vs 4.0%, P = .03). LEEP rates were highest in the year after a positive HPV test and were mostly attributable to CIN1 results. However, the overall ratio of LEEP to CIN3+ diagnosis was similar in women who were tested for HPV compared with those who were not. A larger proportion of patients with HPV testing had follow-up compared with those without HPV testing (84.1% vs 78.9%, P<.001).
The authors concluded that HPV testing in women with ASC-US cytology leads to detecting high-grade disease earlier, but that HPV positivity results in more interventions, largely due to an overdiagnosis of CIN1. They also confirmed that the majority of high-grade lesions are found in women with positive HPV tests.
Related article:
2015 Update on cervical disease: New ammo for HPV prevention and screening
Study strengths and weaknesses
This is the first comprehensive long-term look at women with ASC-US cytology and the impact of HPV testing. The New Mexico HPV Pap Registry is the only US state-based registry with comprehensive follow-up data. This study’s results build on previous data that showed sensitivity is increased with the addition of HPV testing to cervical cytology,1 and they support current ASCCP guidelines that emphasize HPV triage or co-testing for women age 25 or older.
Potential bias. While this study has the benefit of a large cohort, it is limited by biases inherent in retrospective study design. One important potential bias is the differential utilization of HPV testing or procedures by providers. The authors acknowledge preliminary analyses that show that some clinics (rural, federally qualified health centers, public health clinics) serving underserved populations may underutilize or inappropriately utilize HPV testing.
Further, the 2008–2012 study period may make the results less generalizable to current practices since the ASCCP guidelines were adjusted to include more HPV testing in women aged 25 and older in 2012.
Finally, this study examines CIN but does not specifically look at the impact of HPV testing on the ultimate outcome of interest, cervical cancer rates.
The data from the study by Cuzick and colleagues support the importance of continued screening for cervical cancer and its precursors with HPV testing. However, the results also show that we need to improve our strategies for stratifying patients who actually need colposcopy. The authors assert an "enormous predictive value of HPV testing," but this comes at the expense of many unnecessary procedures. Clinicians should continue to use cytology with HPV triage in women aged 25 years and older, but the ASCCP should reconsider guidelines to improve screening specificity. The addition of other screening modalities, such as extended genotyping, methylation testing, and p16/Ki-67 staining, are considerations for ASC-US triage.
-- Sarah Dilley, MD, MPH, and Warner K. Huh, MD
Share your thoughts! Send your Letter to the Editor to rbarbieri@frontlinemedcom.com. Please include your name and the city and state in which you practice.
- ASCUS-LSIL Triage Study (ALTS) Group. Results of a randomized trial on the management of cytology interpretations of atypical squamous cells of undetermined significance. Am J Obstet Gynecol. 2003;188(6):1383–1392.
- ASCUS-LSIL Triage Study (ALTS) Group. Results of a randomized trial on the management of cytology interpretations of atypical squamous cells of undetermined significance. Am J Obstet Gynecol. 2003;188(6):1383–1392.
Fast Tracks
- To assess long-term outcomes of women with ASC-US cytology and HPV triage, researchers examined the interval between ASC-US cytology and biopsy-confirmed CIN, LEEP rates, and results at 5 years
- HPV testing in women with ASC-US cytology leads to earlier detection of high-grade disease, but HPV positivity results in more interventions, largely due to overdiagnosis of CIN1

Impact of an Educational Training Program on Restorative Care Practice of Nursing Assistants Working with Hospitalized Older Patients
Abstract
- Background: Acute and prolonged exposure to hospital medical care can cause hospital-associated deconditioning with deleterious effects on patient care provision and quality of life. Physical rehabilitation provided by allied healthcare professionals can enable reacquisition of function via professional input into attainment of set goals. Separate to rehabilitative efforts, restorative care optimizes independence by motivating individuals to maintain and restore function. Nursing assistants (NAs) provide a significant amount of direct patient care and are well placed to deliver restorative care.
- Objective: To increase proportional restorative care interactions with hospitalized older adults by training NAs.
- Methods: A prospective cohort quality improvement (QI) project was undertaken at 3 acute hospital wards (patient minimum age 65 years) and 2 community subacute care wards in the UK. NAs working within the target settings received a 2-part restorative care training package. The primary evaluation tool was 51 hours in total of observation measuring the proportional change in restorative care events delivered by NAs.
- Results: NA-led restorative care events increased from 40 (pre-intervention) to 94 (post-intervention), representing a statistically significant proportional increase from 74% to 92% (χ2(1) 9.53, P = 0.002). NAs on occasions inadvertently emphasized restriction of function to manage risk and oblige with rest periods.
- Conclusion: Investing in NAs can influence the amount of restorative care delivered to hospitalized older adults at risk of hospital-associated deconditioning. Continued investment in NAs is indicated to influence top-down, mandated restorative care practice in this patient group.
Key words: older people; restorative care; hospital associated deconditioning; nursing assistants; rehabilitation; training.
Hospital-associated deconditioning is defined as a significant decline in functional abilities developed through acute and prolonged exposure to a medical care facility environment, and is independent of that attributed to primary pathologies resulting in acute admission [1]. Considerable research on iatrogenic complications in older hospitalized populations [1–5] has shown the impacts of hospital-associated deconditioning and associated dysfunctions on quality of life for patients and the resultant burden on health and social care provision [6].
Physical rehabilitation has been shown to restore function through high-dose repetition of task-specific activity [7], and the benefits attributed to extra physical therapy include improved mobility, activity, and participation [8]. Simply defined, physical rehabilitation is the reacquisition of function through multidisciplinary assessment and professional therapeutic input in attainment of set goals. A more recent nomenclature in health settings is “restorative care,” defined as a philosophy of care that encourages, enables, and motivates individuals to maintain and restore function, thereby optimizing independence [9]. It has been clearly defined as a philosophy separate from that of rehabilitation [9] and remote from task-related or “custodial care,” which is designed to assist in meeting patients’ daily activity needs without any therapeutic value.
In UK rehabilitation wards, nursing staff provide 4.5 times as much direct patient care time compared with allied health professionals, with paraprofessional nursing assistants (NAs, equivalent to certified nurse assistants [CNAs] in the United States) responsible for half of this direct nursing care [10]. Kessler’s group examined the evolving role of NAs in UK hospitals [11]. From a national survey of 700 NAs and 600 trained nurses, the authors upheld the view that NAs act as direct caregivers including through routine tasks traditionally delivered by nurses. They identified that NAs exhibit distinct qualities, which are valued by qualified nurses, including routine task fulfilment and abilities relating to patients, which enable NAs to enhance care quality. Indeed, the national findings of Kessler’s group were generalizable to our own clinical setting where a NA cohort was a well-placed, available, and motivated resource to deliver therapeutically focused care for our hospitalized older population.
The theoretical relationship between care approaches is complex and represents a challenge for service users and policy makers. For instance, comprehensive rehabilitation delivery during an acute care episode may lead to users not seeking custodial care at home. Conversely, day-to-day activities realized by custodial care at home may lead to users not seeking acute rehabilitative care [12]. With stable resources being assigned to more dependent users in higher numbers, reactive care regardless of environment has often been the model of choice.
However, an economic rationale has developed more recently where investment in maintenance and preventative models results in healthcare savings with models including the 4Rs; reablement, reactivation, rehabilitation, and restorative care [13]. In North America, restorative care approaches have resulted in favorable results in nursing home facilities [14] and at home [15], and restorative care education and motivation training for nursing assistants was effective in supporting a change in beliefs and practice behaviors [16]. While results show restorative care practices in the non-acute care sector are advantageous, it is unknown whether these approaches if adopted in hospital settings affect subsequent healthcare utilization in the non-acute facilities, or even if they are feasible to implement in acute facilities by a staff group able to do so. Therefore, the purpose of this QI project was to deploy a restorative care educational intervention for NA staff working with hospitalized older adults with the aim of increasing the proportion of restorative care delivered.
Methods
Context
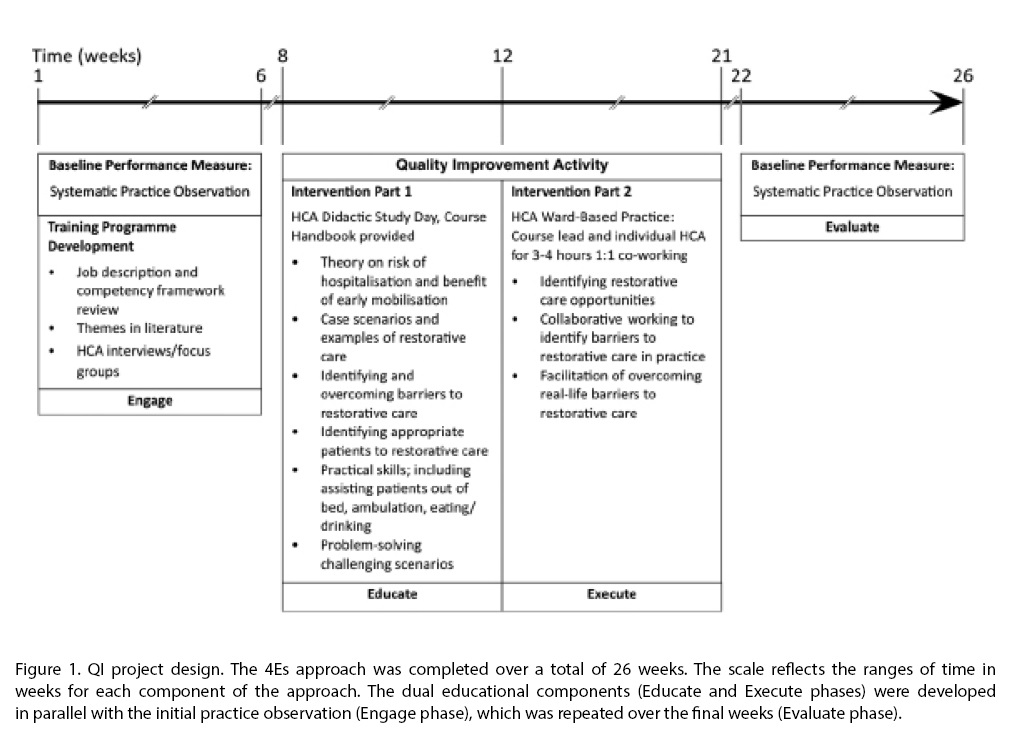
This project was conducted at a UK National Health Service university teaching hospital trust at 3 acute hospital wards (patient minimum age 65 years) and 2 community subacute care wards for older patients. Participants consisted of all permanent or long-term temporary (> 3 months continuous employment) NAs working in the target settings (n = 36). The QI project design is summarized in Figure 1. The project applied the 4Es translational approach to regulate the QI intervention: Engage, Educate, Execute, and Evaluate [17]. The reporting of this study follows SQUIRE guidance [18].
Intervention
The QI activity was a holistic educational process for all NA participants.
Didactic Study Day
Each NA attended a study day led by a physical therapist (up to 10 NAs per group). A student-centered training approach was adopted, recognizing variations in adult learning styles [19], and included seminar style theory, video case scenarios, group work, practical skills, open discussion, and reflection. The training package outline was compiled following consensus among the multi-disciplinary team working in the target settings and the steering group. Topics covered were theory on the risk of hospitalization and benefits of early mobilization; case scenarios and examples of restorative care; identifying and overcoming barriers to restorative care; identifying appro-priate patients for a restorative care approach; practical skills, including assisting patients out of bed, ambulation, and eating/drinking; and challenging, problem-solving scenarios. All participants received a course handbook to facilitate learning.
Ward-Based Practice
Measures
Type of Care Event
The quantity and nature of all NA-patient functional task-related care events was established by independent systematic observation pre- and post-intervention. Observers rated the type of care for observed patients as either custodial or restorative events using a tool described below. In addition, the numbers of patients receiving no restorative care events at all during observation was calculated to capture changes in rates between patients observed. The observational tool used was adapted from that utilized in a North American study of a long-term care facility [20], which demonstrated favorable intra-rater reliability (person separation reliability of 0.77), inter-rater reliability (80% to 100% agreement on each of the care behaviors), and validity (evidence of unidimensionality and good fit of the items). Adaptations accommodated for data collection in a hospital environment and alteration to UK nomenclature.
Three blinded volunteer assessors undertook observations. The observers monitored for activity in any 1 of 8 functional domains: bed mobility, transfers, mobility, washing and dressing, exercise, hygiene (mouth care/shaving/hair/nail care), toileting, and eating. Patient activity observed within these domains was identified as either a restorative or custodial care event. For example: “asks or encourages patient to walk/independently propel wheelchair to bathroom/toilet/day room/activities and gives them time to perform activity” was identified as a restorative care event, while “utilizes wheelchair instead of encourages ambulation and does not encourage patient to self-propel” was considered a custodial care event. All observations were carried out by student physical therapists in training or physical therapy assistants, all of whom were familiar in working in the acute facility with hospitalized older people. In an attempt to optimize internal consistency, observer skill was quality-controlled by ensuring observers were trained and their competency assessed in the use of the evaluation measurement tool.
Bays of 3 to 6 beds comprised each observation space. Three 90-minute time epochs were selected for observation—awakening (early morning), lunchtime (middle of the day), and afternoon (before evening meal)—with the aim that each time frame be observed on a minimum of 1 occasion on each of the 5 wards to generate a minimum of 15 observation sessions. Resources dictated observational periods to be 90-minutes maximum, per epoch, on weekdays only. The mean (range) time between the didactic study day and the ward-based practice day was 4 (1–8) weeks, and between the ward-based practice day and the second observational period was 6 (1–14) weeks.
Patient Characteristics
Differences in the acuity of patients between pre- and post-QI activity in the observational environments could influence care demands. Therefore, patient characteristics before and after the QI activity were measured to assess for stability. Prior to each session, observers recorded patient demographic details and current STRATIFY score, a predictive tool used at the time to segment fall risk [21], from patients’ clinical records. Two measures were used to offer contemporaneous representation of the observed population in the observation environment: a modified Barthel index [22], which provides a measure of activities of daily living [23], and the Abbreviated Mental Test Score [24], a simple diagnostic screen for cognitive impairment. All patients were considered as recuperating and thus eligible for observation except those with a “Patient-At-Risk” score ≥ 4, indicating physiological factors associated with established or impending critical illness [25], or if an end of life care plan was clearly detailed in the clinical record.
Data Analysis
Patient demographics are reported descriptively. Ordinal data are summarized using median and inter-quartile ranges (IQR), interval/ratio data using mean and standard deviation (SD) unless otherwise stated. Categorical data are reported as percentages. Comparison of observed patient samples before and after the QI period were compared with the Mann-Whitney U-test for ordinal data, 2 sample t tests for interval/ratio data, and chi squared tests of proportions for other variables.
Analyses were carried out using STATA 11 ME (StataCorp, College Station, TX) and SPSS v17 (SPSS, Chicago). Statistical significance was set at P ≤ 0.05.
Ethical Issues
This study was approved by the local UK NHS Trust clinical audit committee (Quality Improvement project 2038).
Results
Care Events by NAs
Observations were undertaken across the 5 wards on 14 workdays (Monday–Friday) over 6 weeks in the pre-QI period, and on 16 workdays over 4 weeks in the post-QI period, yielding a total of 51 hours of observation.
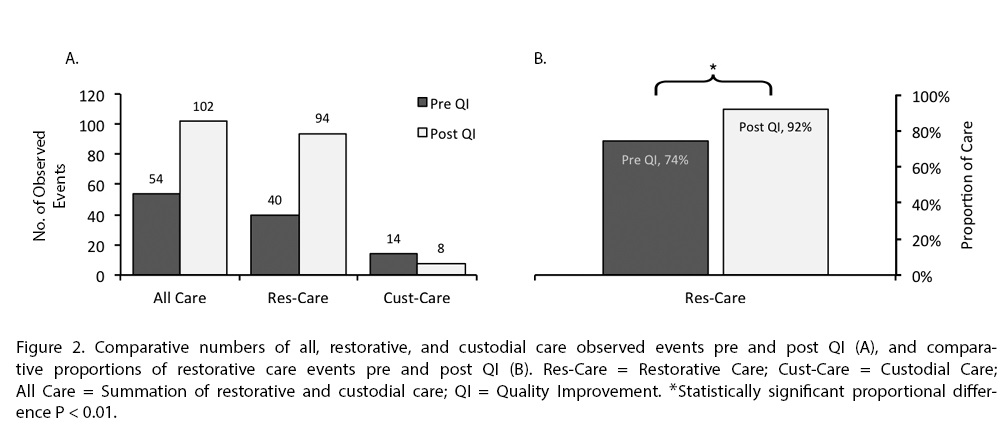
Overall, across all care environments, there was a statistically significant proportional increase in restorative care from 74% to 92% [χ2(1) 9.53, P = 0.002] (Figure 2). This represents an increase in restorative care events from 40 to 94. Observed custodial care events decreased from 14 to 8, a 43% reduction in custodial care events overall, a difference which remained irrespective of the environment (acute or subacute care), pre- and post-QI activity (P = 0.538 and P = 0.695, respectively).
There was a marked decrease in the number of patients receiving no NA-led restorative care events from 59 (74%) to 32 (48%) before and after QI activity respectively, [χ2 (1) 10.63, P = 0.001].
Patients Observed
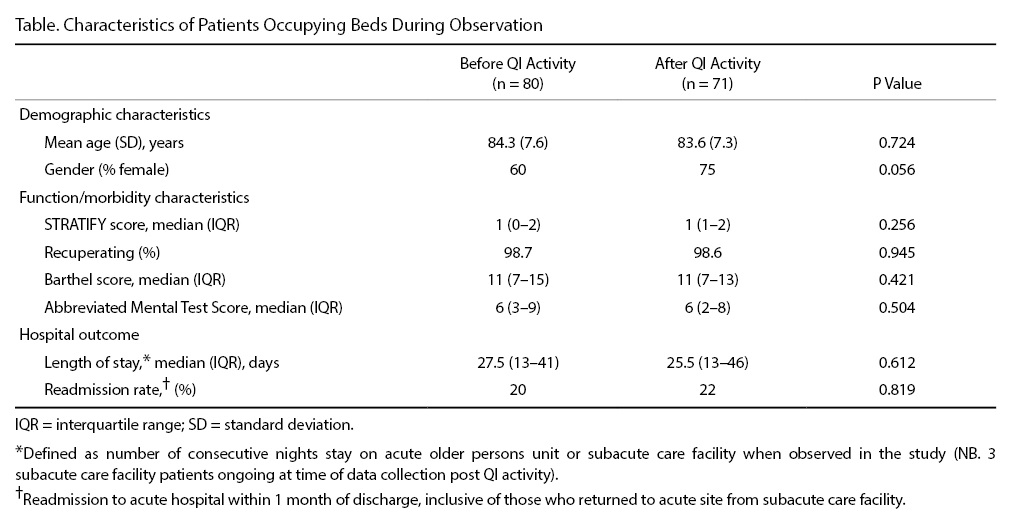
Patient population characteristics remained stable during the course of the QI activity; there were no significant differences in the observed patient characteristics pre- and post-QI activity (Table). In 51 hours of observation undertaken by 3 independent observers there were 80 and 71 occupied beds before and after QI activity, respectively, representing a stable bed occupancy rate of 94% and 83% (P = 0.074). Of the occupied beds, 98.7% and 98.6% of patients (pre- and post-QI activity, respectively) were considered recuperating and therefore appropriate for a restorative care approach.
Discussion
although significantly decreased from pre-QI proportions (74%). We therefore conclude that a meaningful decrease across patients receiving no restorative care and a meaningful increase in within-patient restorative care events post-QI intervention occurred.
Our study furthers research in methods of increasing restorative care events delivered by NAs. In a randomized controlled trial by Resnick et al [16], a structured 6-week restorative care program incorporating teaching NAs
restorative care philosophies (tier 1) and facilitating NAs to motivate residents to engage in functional activities (tier 2) was compared to placebo (a single 30-minute educational session in managing residents’ behavioral symptoms) [16]. Results showed the 6-week program led to more restorative care, with NAs demonstrating enhanced knowledge and expectations of restorative care outcomes and better job satisfaction. Our educational package (1 day) and ward-based-learning session (3–4 hours) was much shorter than Resnick et al’s 6-week intervention [16], and the optimal dose of educational packages for NAs is yet to be determined and needs to be addressed in future studies. Furthermore, while we found education increased restorative care across multiple environments, it is yet to be determined whether more restorative care has a positive impact on patient function downstream of an acute inpatient stay. In fact, determination of restorative care’s influence on augmenting rehabilitation outcomes is a neglected aspect of nursing-AHP practice that we aim to define and investigate in ongoing studies.
The patient population characteristics within the target wards were stable over the course of the QI project. Observed patients’ median Barthel (11) and Abbreviated Mental Test (6) scores remained stable and are indicative of high levels of day-to-day activity dependence [24,26–28]. Over the QI activity period it was therefore unsurprising that modest proportions of patients direc-ted their own care (28% and 33% pre and post-QI, respectively). Subsequently, demands on staff to lead patient care were substantial, leading to high risks of social or clinical iatrogenesis and hospital-associated deconditioning.
In a previous observational study, substantial patient inactivity was found in a highly dependent cohort of patients [29]. Fear of falling and insignificant emphasis on ambulation were cited as patient and organizational-centric reasons, respectively. Furthermore, in a selective observational study, patients receiving function-focused care (FFC; synonymous to restorative care) in an acute hospital environment developed less physical functional decline compared to those receiving custodial care [30]. However, patients who had fallen during their hospital stay received less FFC. The authors suggest limited FFC in fallers was deployed to minimize further risk but concluded there is need for nursing and therapy interventions that manage fall risks through endorsing functional activities instead of mobility restriction [30].
Limitations
While observational studies are more robust for measuring behavioral activities compared to self or proxy reporting [34], they are exposed to observer judgment and drift. An attempt was made to minimize this with the binary measurement of restorative versus custodial care and by random sampling of wards and time frames to capture an entire healthcare environment.
The observational study tool was based on one previously developed where acceptable reliability and validity was established and where observations were based on what individual care staff were practicing regardless of their operational environment [20]. In contrast, our observations were based in predetermined environmental spaces regardless of what care practice occurred within it. We consider our approach justifiable in minimizing observer influence on an individual’s practice by emphasizing to them that observers were interested in what happened in an environment [35,36]. However, we acknowledge the risk of under representation of care by observers not following the care delivery, and that local validity and reliability of our methods was not undertaken. Lastly, whilst training for observers was undertaken in this study to standardize the observations undertaken, validation of this method would be a feature required of any future experimental work.
Conclusions
Our findings support the current understanding of restorative care [14–16] and provides proof of concept that dedicating resources in a previously under-invested part of the workforce is feasible, well-accepted, and meaningful. The results are in keeping with the concept that the NA staff group is ready and able to fulfil their roles as direct caregivers, supporting and relieving other trained staff [11].
Corresponding author: Gareth D. Jones, MSc, Physiotherapy Dept, 3rd Fl Lambeth Wing, St Thomas’ Hospital, Westminster Bridge Rd, London SE1 7EH, UK, gareth.jones@gstt.nhs.uk.
Funding/support: This work was supported by a small grants application to the Guy's and St Thomas' Charity, project code S100414.
Financial disclosures: No conflicts of interest to declare.
Acknowledgment: The authors acknowledge members of the steering group for their input: Rebekah Schiff, Carrie-Ann Wood, Judith Centofanti, Judith Hall, and Richard Page; Anne Bisset-Smith and Claudia Jacob for their initial pilot work; Amanda Buttery, Lottie Prowse, and Ryan Mackie for practical assistance; Siobhan Crichton for her statistical help; and Jacky Jones, Michael Thacker, Tisha Pryor, and Sarah Ritchie for helping review the manuscript.
1. Kortebein P. Rehabilitation for hospital-associated deconditioning. Am J Phys Med Rehabil 2009;88:66–77.
2. Creditor MC. Hazards of hospitalization of the elderly. Ann Intern Med 1993;118:219–23.
3. Davydow DS, Hough CL, Levine DA, et al. Functional disability, cognitive impairment, and depression after hospitalization for pneumonia. Am J Med 2013;126:615–24.e5.
4. Sager MA, Franke T, Inouye SK, et al. Functional outcomes of acute medical illness and hospitalization in older persons. Arch Intern Med 1996;156:645–52.
5. Warshaw GA, Moore JT, Friedman SW, et al. Functional disability in the hospitalized elderly. JAMA 1982;248:847–50.
6. Covinsky KE, Pierluissi E, Johnston CB. Hospitalization-associated disability: "She was probably able to ambulate, but I'm not sure". JAMA 2011;306:1782–93.
7. Kwakkel G, Kollen B, Lindeman E. Understanding the pattern of functional recovery after stroke: facts and theories. Restor Neurol Neurosci 2004;22:281–99.
8. Peiris CL, Taylor NF, Shields N. Extra physical therapy reduces patient length of stay and improves functional outcomes and quality of life in people with acute or subacute conditions: a systematic review. Arch Phys Med
Rehabil 2011;92:1490–500.
9. Resnick B, Boltz M, Galik E, Pretzer-Aboff I. Restorative care nursing for older adults: a guide for all care settings. 2nd ed. New York: Springer; 2012.
10. Rudd AG, Jenkinson D, Grant RL, Hoffman A. Staffing levels and patient dependence in English stroke units. Clin Med (Lond). 2009;9:110–5.
11. Kessler I, Heron P, Dopson S, et al. The nature and consequences of support workers in a hospital setting, Final Report. London: National Institute for Health Research, Service Delivery and Organization Programme; 2010.
12. Kashner TM, Krompholz B, McDonnell C, et al. Acute and custodial care among impaired aged. J Aging Health 1990;2:28–41.
13. Sims-Gould J, Tong CE, Wallis-Mayer L, Ashe MC. Reablement, reactivation, rehabilitation and restorative interventions with older adults in receipt of home care: a systematic review. J Am Med Dir Assoc 2017;18:653–63.
14. Shanti C, Johnson J, Meyers AM, et al. Evaluation of the restorative care education and training program for nursing homes. Can J Aging 2005;24:115–26.
15. Tinetti ME, Baker D, Gallo WT, et al. Evaluation of restorative care vs usual care for older adults receiving an acute episode of home care. JAMA 2002;287:2098–105.
16. Resnick B, Gruber-Baldini AL, Galik E, et al. Changing the philosophy of care in long-term care: testing of the restorative care intervention. Gerontologist 2009;49:175–84.
17. Pronovost PJ, Berenholtz SM, Needham DM. Translating evidence into practice: a model for large scale knowledge translation. BMJ 2008;337:a1714.
18. Davidoff F, Batalden P, Stevens D, et al; SQUIRE development group. Publication guidelines for quality improvement studies in health care: evolution of the SQUIRE project. BMJ 2009;338:a3152.
19. Sweeney JF. Nurse education: learner-centred or teacher-centred? Nurse Educ Today 1986;6:257–62.
20. Resnick B, Rogers V, Galik E, Gruber-Baldini AL. Measuring restorative care provided by nursing assistants: reliability and validity of the Restorative Care Behavior Checklist. Nurs Res 2007;56:387–98.
21. Oliver D, Britton M, Seed P, et al. Development and evaluation of evidence based risk assessment tool (STRATIFY) to predict which elderly inpatients will fall: case-control and cohort studies. BMJ 1997;315:1049–53.
22. Colin C, Wade DT, Davies S, Horne V. The Barthel ADL Index: a reliability study. Int Disabil Stud 1988;10:61–3.
23. Richards SH, Peters TJ, Coast J, et al. Inter-rater reliability of the Barthel ADL index: how does a researcher compare to a nurse? Clin Rehabil 2000;14:72–8.
24. Hodkinson HM. Evaluation of a mental test score for assessment of mental impairment in the elderly. Age Ageing 1972;1:233–8.
25. Morgan CD, Baade LE. Neuropsychological testing and assessment scales for dementia of the Alzheimer's type. Psychiatr Clin North Am 1997;20:25–43.
26. Granger CV, Hamilton BB, Gresham GE, Kramer AA. The stroke rehabilitation outcome study: Part II. Relative merits of the total Barthel index score and a four-item subscore in predicting patient outcomes. Arch Phys Med Rehabil
1989;70:100–3.
27. MacKenzie DM, Copp P, Shaw RJ, Goodwin GM. Brief cognitive screening of the elderly: a comparison of the Mini-Mental State Examination (MMSE), Abbreviated Mental Test (AMT) and Mental Status Questionnaire (MSQ). Psychol Med
1996;26:427–30.
28. Uyttenboogaart M, Stewart RE, Vroomen PC, et al. Optimizing cutoff scores for the Barthel index and the modified Rankin scale for defining outcome in acute stroke trials. Stroke 2005;36:1984–7.
29. Callen BL, Mahoney JE, Grieves CB, et al. Frequency of hallway ambulation by hospitalized older adults on medical units of an academic hospital. Geriatr Nurs 2004;25:212–7.
30. Boltz M, Resnick B, Capezuti E, Shuluk J. Activity restriction vs. self-direction: hospitalised older adults' response to fear of falling. Int J Older People Nurs 2014;9:44–53.
31. Moyle W, Borbasi S, Wallis M, et al. Acute care management of older people with dementia: a qualitative perspective. J Clin Nurs 2011;20:420–8.
32. Olson DM, Borel CO, Laskowitz DT, et al. Quiet time: a nursing intervention to promote sleep in neurocritical care units. Am J Crit Care 2001;10:74–8.
33. Gardner C, Collins C, Osborne S, et al. Creating a therapeutic environment: a non-randomised controlled trial of a quiet time intervention for patients in acute care. Int J Nurs Stud 2009;46:778–86.
34. Kupek E. Bias and heteroscedastic memory error in self-reported health behavior: an investigation using covariance structure analysis. BMC Med Res Methodol 2002;2:14.
35. Fromme HB, Karani R, Downing SM. Direct observation in medical education: a review of the literature and evidence for validity. Mt Sinai J Med 2009;76:365–71.
36. Williams RG, Klamen DA, McGaghie WC. Cognitive, social and environmental sources of bias in clinical performance ratings. Teach Learn Med 2003;15:270–92.
Abstract
- Background: Acute and prolonged exposure to hospital medical care can cause hospital-associated deconditioning with deleterious effects on patient care provision and quality of life. Physical rehabilitation provided by allied healthcare professionals can enable reacquisition of function via professional input into attainment of set goals. Separate to rehabilitative efforts, restorative care optimizes independence by motivating individuals to maintain and restore function. Nursing assistants (NAs) provide a significant amount of direct patient care and are well placed to deliver restorative care.
- Objective: To increase proportional restorative care interactions with hospitalized older adults by training NAs.
- Methods: A prospective cohort quality improvement (QI) project was undertaken at 3 acute hospital wards (patient minimum age 65 years) and 2 community subacute care wards in the UK. NAs working within the target settings received a 2-part restorative care training package. The primary evaluation tool was 51 hours in total of observation measuring the proportional change in restorative care events delivered by NAs.
- Results: NA-led restorative care events increased from 40 (pre-intervention) to 94 (post-intervention), representing a statistically significant proportional increase from 74% to 92% (χ2(1) 9.53, P = 0.002). NAs on occasions inadvertently emphasized restriction of function to manage risk and oblige with rest periods.
- Conclusion: Investing in NAs can influence the amount of restorative care delivered to hospitalized older adults at risk of hospital-associated deconditioning. Continued investment in NAs is indicated to influence top-down, mandated restorative care practice in this patient group.
Key words: older people; restorative care; hospital associated deconditioning; nursing assistants; rehabilitation; training.
Hospital-associated deconditioning is defined as a significant decline in functional abilities developed through acute and prolonged exposure to a medical care facility environment, and is independent of that attributed to primary pathologies resulting in acute admission [1]. Considerable research on iatrogenic complications in older hospitalized populations [1–5] has shown the impacts of hospital-associated deconditioning and associated dysfunctions on quality of life for patients and the resultant burden on health and social care provision [6].
Physical rehabilitation has been shown to restore function through high-dose repetition of task-specific activity [7], and the benefits attributed to extra physical therapy include improved mobility, activity, and participation [8]. Simply defined, physical rehabilitation is the reacquisition of function through multidisciplinary assessment and professional therapeutic input in attainment of set goals. A more recent nomenclature in health settings is “restorative care,” defined as a philosophy of care that encourages, enables, and motivates individuals to maintain and restore function, thereby optimizing independence [9]. It has been clearly defined as a philosophy separate from that of rehabilitation [9] and remote from task-related or “custodial care,” which is designed to assist in meeting patients’ daily activity needs without any therapeutic value.
In UK rehabilitation wards, nursing staff provide 4.5 times as much direct patient care time compared with allied health professionals, with paraprofessional nursing assistants (NAs, equivalent to certified nurse assistants [CNAs] in the United States) responsible for half of this direct nursing care [10]. Kessler’s group examined the evolving role of NAs in UK hospitals [11]. From a national survey of 700 NAs and 600 trained nurses, the authors upheld the view that NAs act as direct caregivers including through routine tasks traditionally delivered by nurses. They identified that NAs exhibit distinct qualities, which are valued by qualified nurses, including routine task fulfilment and abilities relating to patients, which enable NAs to enhance care quality. Indeed, the national findings of Kessler’s group were generalizable to our own clinical setting where a NA cohort was a well-placed, available, and motivated resource to deliver therapeutically focused care for our hospitalized older population.
The theoretical relationship between care approaches is complex and represents a challenge for service users and policy makers. For instance, comprehensive rehabilitation delivery during an acute care episode may lead to users not seeking custodial care at home. Conversely, day-to-day activities realized by custodial care at home may lead to users not seeking acute rehabilitative care [12]. With stable resources being assigned to more dependent users in higher numbers, reactive care regardless of environment has often been the model of choice.
However, an economic rationale has developed more recently where investment in maintenance and preventative models results in healthcare savings with models including the 4Rs; reablement, reactivation, rehabilitation, and restorative care [13]. In North America, restorative care approaches have resulted in favorable results in nursing home facilities [14] and at home [15], and restorative care education and motivation training for nursing assistants was effective in supporting a change in beliefs and practice behaviors [16]. While results show restorative care practices in the non-acute care sector are advantageous, it is unknown whether these approaches if adopted in hospital settings affect subsequent healthcare utilization in the non-acute facilities, or even if they are feasible to implement in acute facilities by a staff group able to do so. Therefore, the purpose of this QI project was to deploy a restorative care educational intervention for NA staff working with hospitalized older adults with the aim of increasing the proportion of restorative care delivered.
Methods
Context
This project was conducted at a UK National Health Service university teaching hospital trust at 3 acute hospital wards (patient minimum age 65 years) and 2 community subacute care wards for older patients. Participants consisted of all permanent or long-term temporary (> 3 months continuous employment) NAs working in the target settings (n = 36). The QI project design is summarized in Figure 1. The project applied the 4Es translational approach to regulate the QI intervention: Engage, Educate, Execute, and Evaluate [17]. The reporting of this study follows SQUIRE guidance [18].
Intervention
The QI activity was a holistic educational process for all NA participants.
Didactic Study Day
Each NA attended a study day led by a physical therapist (up to 10 NAs per group). A student-centered training approach was adopted, recognizing variations in adult learning styles [19], and included seminar style theory, video case scenarios, group work, practical skills, open discussion, and reflection. The training package outline was compiled following consensus among the multi-disciplinary team working in the target settings and the steering group. Topics covered were theory on the risk of hospitalization and benefits of early mobilization; case scenarios and examples of restorative care; identifying and overcoming barriers to restorative care; identifying appro-priate patients for a restorative care approach; practical skills, including assisting patients out of bed, ambulation, and eating/drinking; and challenging, problem-solving scenarios. All participants received a course handbook to facilitate learning.
Ward-Based Practice
Measures
Type of Care Event
The quantity and nature of all NA-patient functional task-related care events was established by independent systematic observation pre- and post-intervention. Observers rated the type of care for observed patients as either custodial or restorative events using a tool described below. In addition, the numbers of patients receiving no restorative care events at all during observation was calculated to capture changes in rates between patients observed. The observational tool used was adapted from that utilized in a North American study of a long-term care facility [20], which demonstrated favorable intra-rater reliability (person separation reliability of 0.77), inter-rater reliability (80% to 100% agreement on each of the care behaviors), and validity (evidence of unidimensionality and good fit of the items). Adaptations accommodated for data collection in a hospital environment and alteration to UK nomenclature.
Three blinded volunteer assessors undertook observations. The observers monitored for activity in any 1 of 8 functional domains: bed mobility, transfers, mobility, washing and dressing, exercise, hygiene (mouth care/shaving/hair/nail care), toileting, and eating. Patient activity observed within these domains was identified as either a restorative or custodial care event. For example: “asks or encourages patient to walk/independently propel wheelchair to bathroom/toilet/day room/activities and gives them time to perform activity” was identified as a restorative care event, while “utilizes wheelchair instead of encourages ambulation and does not encourage patient to self-propel” was considered a custodial care event. All observations were carried out by student physical therapists in training or physical therapy assistants, all of whom were familiar in working in the acute facility with hospitalized older people. In an attempt to optimize internal consistency, observer skill was quality-controlled by ensuring observers were trained and their competency assessed in the use of the evaluation measurement tool.
Bays of 3 to 6 beds comprised each observation space. Three 90-minute time epochs were selected for observation—awakening (early morning), lunchtime (middle of the day), and afternoon (before evening meal)—with the aim that each time frame be observed on a minimum of 1 occasion on each of the 5 wards to generate a minimum of 15 observation sessions. Resources dictated observational periods to be 90-minutes maximum, per epoch, on weekdays only. The mean (range) time between the didactic study day and the ward-based practice day was 4 (1–8) weeks, and between the ward-based practice day and the second observational period was 6 (1–14) weeks.
Patient Characteristics
Differences in the acuity of patients between pre- and post-QI activity in the observational environments could influence care demands. Therefore, patient characteristics before and after the QI activity were measured to assess for stability. Prior to each session, observers recorded patient demographic details and current STRATIFY score, a predictive tool used at the time to segment fall risk [21], from patients’ clinical records. Two measures were used to offer contemporaneous representation of the observed population in the observation environment: a modified Barthel index [22], which provides a measure of activities of daily living [23], and the Abbreviated Mental Test Score [24], a simple diagnostic screen for cognitive impairment. All patients were considered as recuperating and thus eligible for observation except those with a “Patient-At-Risk” score ≥ 4, indicating physiological factors associated with established or impending critical illness [25], or if an end of life care plan was clearly detailed in the clinical record.
Data Analysis
Patient demographics are reported descriptively. Ordinal data are summarized using median and inter-quartile ranges (IQR), interval/ratio data using mean and standard deviation (SD) unless otherwise stated. Categorical data are reported as percentages. Comparison of observed patient samples before and after the QI period were compared with the Mann-Whitney U-test for ordinal data, 2 sample t tests for interval/ratio data, and chi squared tests of proportions for other variables.
Analyses were carried out using STATA 11 ME (StataCorp, College Station, TX) and SPSS v17 (SPSS, Chicago). Statistical significance was set at P ≤ 0.05.
Ethical Issues
This study was approved by the local UK NHS Trust clinical audit committee (Quality Improvement project 2038).
Results
Care Events by NAs
Observations were undertaken across the 5 wards on 14 workdays (Monday–Friday) over 6 weeks in the pre-QI period, and on 16 workdays over 4 weeks in the post-QI period, yielding a total of 51 hours of observation.
Overall, across all care environments, there was a statistically significant proportional increase in restorative care from 74% to 92% [χ2(1) 9.53, P = 0.002] (Figure 2). This represents an increase in restorative care events from 40 to 94. Observed custodial care events decreased from 14 to 8, a 43% reduction in custodial care events overall, a difference which remained irrespective of the environment (acute or subacute care), pre- and post-QI activity (P = 0.538 and P = 0.695, respectively).
There was a marked decrease in the number of patients receiving no NA-led restorative care events from 59 (74%) to 32 (48%) before and after QI activity respectively, [χ2 (1) 10.63, P = 0.001].
Patients Observed
Patient population characteristics remained stable during the course of the QI activity; there were no significant differences in the observed patient characteristics pre- and post-QI activity (Table). In 51 hours of observation undertaken by 3 independent observers there were 80 and 71 occupied beds before and after QI activity, respectively, representing a stable bed occupancy rate of 94% and 83% (P = 0.074). Of the occupied beds, 98.7% and 98.6% of patients (pre- and post-QI activity, respectively) were considered recuperating and therefore appropriate for a restorative care approach.
Discussion
although significantly decreased from pre-QI proportions (74%). We therefore conclude that a meaningful decrease across patients receiving no restorative care and a meaningful increase in within-patient restorative care events post-QI intervention occurred.
Our study furthers research in methods of increasing restorative care events delivered by NAs. In a randomized controlled trial by Resnick et al [16], a structured 6-week restorative care program incorporating teaching NAs
restorative care philosophies (tier 1) and facilitating NAs to motivate residents to engage in functional activities (tier 2) was compared to placebo (a single 30-minute educational session in managing residents’ behavioral symptoms) [16]. Results showed the 6-week program led to more restorative care, with NAs demonstrating enhanced knowledge and expectations of restorative care outcomes and better job satisfaction. Our educational package (1 day) and ward-based-learning session (3–4 hours) was much shorter than Resnick et al’s 6-week intervention [16], and the optimal dose of educational packages for NAs is yet to be determined and needs to be addressed in future studies. Furthermore, while we found education increased restorative care across multiple environments, it is yet to be determined whether more restorative care has a positive impact on patient function downstream of an acute inpatient stay. In fact, determination of restorative care’s influence on augmenting rehabilitation outcomes is a neglected aspect of nursing-AHP practice that we aim to define and investigate in ongoing studies.
The patient population characteristics within the target wards were stable over the course of the QI project. Observed patients’ median Barthel (11) and Abbreviated Mental Test (6) scores remained stable and are indicative of high levels of day-to-day activity dependence [24,26–28]. Over the QI activity period it was therefore unsurprising that modest proportions of patients direc-ted their own care (28% and 33% pre and post-QI, respectively). Subsequently, demands on staff to lead patient care were substantial, leading to high risks of social or clinical iatrogenesis and hospital-associated deconditioning.
In a previous observational study, substantial patient inactivity was found in a highly dependent cohort of patients [29]. Fear of falling and insignificant emphasis on ambulation were cited as patient and organizational-centric reasons, respectively. Furthermore, in a selective observational study, patients receiving function-focused care (FFC; synonymous to restorative care) in an acute hospital environment developed less physical functional decline compared to those receiving custodial care [30]. However, patients who had fallen during their hospital stay received less FFC. The authors suggest limited FFC in fallers was deployed to minimize further risk but concluded there is need for nursing and therapy interventions that manage fall risks through endorsing functional activities instead of mobility restriction [30].
Limitations
While observational studies are more robust for measuring behavioral activities compared to self or proxy reporting [34], they are exposed to observer judgment and drift. An attempt was made to minimize this with the binary measurement of restorative versus custodial care and by random sampling of wards and time frames to capture an entire healthcare environment.
The observational study tool was based on one previously developed where acceptable reliability and validity was established and where observations were based on what individual care staff were practicing regardless of their operational environment [20]. In contrast, our observations were based in predetermined environmental spaces regardless of what care practice occurred within it. We consider our approach justifiable in minimizing observer influence on an individual’s practice by emphasizing to them that observers were interested in what happened in an environment [35,36]. However, we acknowledge the risk of under representation of care by observers not following the care delivery, and that local validity and reliability of our methods was not undertaken. Lastly, whilst training for observers was undertaken in this study to standardize the observations undertaken, validation of this method would be a feature required of any future experimental work.
Conclusions
Our findings support the current understanding of restorative care [14–16] and provides proof of concept that dedicating resources in a previously under-invested part of the workforce is feasible, well-accepted, and meaningful. The results are in keeping with the concept that the NA staff group is ready and able to fulfil their roles as direct caregivers, supporting and relieving other trained staff [11].
Corresponding author: Gareth D. Jones, MSc, Physiotherapy Dept, 3rd Fl Lambeth Wing, St Thomas’ Hospital, Westminster Bridge Rd, London SE1 7EH, UK, gareth.jones@gstt.nhs.uk.
Funding/support: This work was supported by a small grants application to the Guy's and St Thomas' Charity, project code S100414.
Financial disclosures: No conflicts of interest to declare.
Acknowledgment: The authors acknowledge members of the steering group for their input: Rebekah Schiff, Carrie-Ann Wood, Judith Centofanti, Judith Hall, and Richard Page; Anne Bisset-Smith and Claudia Jacob for their initial pilot work; Amanda Buttery, Lottie Prowse, and Ryan Mackie for practical assistance; Siobhan Crichton for her statistical help; and Jacky Jones, Michael Thacker, Tisha Pryor, and Sarah Ritchie for helping review the manuscript.
1. Kortebein P. Rehabilitation for hospital-associated deconditioning. Am J Phys Med Rehabil 2009;88:66–77.
2. Creditor MC. Hazards of hospitalization of the elderly. Ann Intern Med 1993;118:219–23.
3. Davydow DS, Hough CL, Levine DA, et al. Functional disability, cognitive impairment, and depression after hospitalization for pneumonia. Am J Med 2013;126:615–24.e5.
4. Sager MA, Franke T, Inouye SK, et al. Functional outcomes of acute medical illness and hospitalization in older persons. Arch Intern Med 1996;156:645–52.
5. Warshaw GA, Moore JT, Friedman SW, et al. Functional disability in the hospitalized elderly. JAMA 1982;248:847–50.
6. Covinsky KE, Pierluissi E, Johnston CB. Hospitalization-associated disability: "She was probably able to ambulate, but I'm not sure". JAMA 2011;306:1782–93.
7. Kwakkel G, Kollen B, Lindeman E. Understanding the pattern of functional recovery after stroke: facts and theories. Restor Neurol Neurosci 2004;22:281–99.
8. Peiris CL, Taylor NF, Shields N. Extra physical therapy reduces patient length of stay and improves functional outcomes and quality of life in people with acute or subacute conditions: a systematic review. Arch Phys Med
Rehabil 2011;92:1490–500.
9. Resnick B, Boltz M, Galik E, Pretzer-Aboff I. Restorative care nursing for older adults: a guide for all care settings. 2nd ed. New York: Springer; 2012.
10. Rudd AG, Jenkinson D, Grant RL, Hoffman A. Staffing levels and patient dependence in English stroke units. Clin Med (Lond). 2009;9:110–5.
11. Kessler I, Heron P, Dopson S, et al. The nature and consequences of support workers in a hospital setting, Final Report. London: National Institute for Health Research, Service Delivery and Organization Programme; 2010.
12. Kashner TM, Krompholz B, McDonnell C, et al. Acute and custodial care among impaired aged. J Aging Health 1990;2:28–41.
13. Sims-Gould J, Tong CE, Wallis-Mayer L, Ashe MC. Reablement, reactivation, rehabilitation and restorative interventions with older adults in receipt of home care: a systematic review. J Am Med Dir Assoc 2017;18:653–63.
14. Shanti C, Johnson J, Meyers AM, et al. Evaluation of the restorative care education and training program for nursing homes. Can J Aging 2005;24:115–26.
15. Tinetti ME, Baker D, Gallo WT, et al. Evaluation of restorative care vs usual care for older adults receiving an acute episode of home care. JAMA 2002;287:2098–105.
16. Resnick B, Gruber-Baldini AL, Galik E, et al. Changing the philosophy of care in long-term care: testing of the restorative care intervention. Gerontologist 2009;49:175–84.
17. Pronovost PJ, Berenholtz SM, Needham DM. Translating evidence into practice: a model for large scale knowledge translation. BMJ 2008;337:a1714.
18. Davidoff F, Batalden P, Stevens D, et al; SQUIRE development group. Publication guidelines for quality improvement studies in health care: evolution of the SQUIRE project. BMJ 2009;338:a3152.
19. Sweeney JF. Nurse education: learner-centred or teacher-centred? Nurse Educ Today 1986;6:257–62.
20. Resnick B, Rogers V, Galik E, Gruber-Baldini AL. Measuring restorative care provided by nursing assistants: reliability and validity of the Restorative Care Behavior Checklist. Nurs Res 2007;56:387–98.
21. Oliver D, Britton M, Seed P, et al. Development and evaluation of evidence based risk assessment tool (STRATIFY) to predict which elderly inpatients will fall: case-control and cohort studies. BMJ 1997;315:1049–53.
22. Colin C, Wade DT, Davies S, Horne V. The Barthel ADL Index: a reliability study. Int Disabil Stud 1988;10:61–3.
23. Richards SH, Peters TJ, Coast J, et al. Inter-rater reliability of the Barthel ADL index: how does a researcher compare to a nurse? Clin Rehabil 2000;14:72–8.
24. Hodkinson HM. Evaluation of a mental test score for assessment of mental impairment in the elderly. Age Ageing 1972;1:233–8.
25. Morgan CD, Baade LE. Neuropsychological testing and assessment scales for dementia of the Alzheimer's type. Psychiatr Clin North Am 1997;20:25–43.
26. Granger CV, Hamilton BB, Gresham GE, Kramer AA. The stroke rehabilitation outcome study: Part II. Relative merits of the total Barthel index score and a four-item subscore in predicting patient outcomes. Arch Phys Med Rehabil
1989;70:100–3.
27. MacKenzie DM, Copp P, Shaw RJ, Goodwin GM. Brief cognitive screening of the elderly: a comparison of the Mini-Mental State Examination (MMSE), Abbreviated Mental Test (AMT) and Mental Status Questionnaire (MSQ). Psychol Med
1996;26:427–30.
28. Uyttenboogaart M, Stewart RE, Vroomen PC, et al. Optimizing cutoff scores for the Barthel index and the modified Rankin scale for defining outcome in acute stroke trials. Stroke 2005;36:1984–7.
29. Callen BL, Mahoney JE, Grieves CB, et al. Frequency of hallway ambulation by hospitalized older adults on medical units of an academic hospital. Geriatr Nurs 2004;25:212–7.
30. Boltz M, Resnick B, Capezuti E, Shuluk J. Activity restriction vs. self-direction: hospitalised older adults' response to fear of falling. Int J Older People Nurs 2014;9:44–53.
31. Moyle W, Borbasi S, Wallis M, et al. Acute care management of older people with dementia: a qualitative perspective. J Clin Nurs 2011;20:420–8.
32. Olson DM, Borel CO, Laskowitz DT, et al. Quiet time: a nursing intervention to promote sleep in neurocritical care units. Am J Crit Care 2001;10:74–8.
33. Gardner C, Collins C, Osborne S, et al. Creating a therapeutic environment: a non-randomised controlled trial of a quiet time intervention for patients in acute care. Int J Nurs Stud 2009;46:778–86.
34. Kupek E. Bias and heteroscedastic memory error in self-reported health behavior: an investigation using covariance structure analysis. BMC Med Res Methodol 2002;2:14.
35. Fromme HB, Karani R, Downing SM. Direct observation in medical education: a review of the literature and evidence for validity. Mt Sinai J Med 2009;76:365–71.
36. Williams RG, Klamen DA, McGaghie WC. Cognitive, social and environmental sources of bias in clinical performance ratings. Teach Learn Med 2003;15:270–92.
Implementation of the ABCDEF Bundle in an Academic Medical Center
Abstract
- Objective: To describe the highlights of our medical center’s implementation of the Society of Critical Care Medicine’s ABCDEF bundle in 3 medical intensive care units (ICUs).
- Methods: After a review of our current clinical practices and written clinical guidelines, we evaluated deficiencies in clinical care and employed a variety of educational and clinical change interventions for each element of the bundle. We utilized an interdisciplinary team approach to facilitate the change process.
- Results: As a result of our efforts, improvement in the accuracy of assessments of pain, agitation, and delir-ium across all clinical disciplines and improved adherence to clinical practice guidelines, protocols, and instruments for all bundle elements was seen. These changes have been sustained following completion of the data collection phase of the project.
- Conclusion: ICU care is a team effort. As a result of participation in this initiative, there has been an increased awareness of the bundle elements, improved collaboration among team members, and increased patient and family communication.
Key words: intensive care; delirium; sedation; mobility.
Admission to the intensive care unit (ICU) is a stressful and challenging time for patients and their families. In addition, significant negative sequelae following an ICU stay have been reported in the literature, including such post-ICU complications as post-traumatic stress disorder [1–9], depression [10,11], ICU-acquired weakness [12–19], and post-intensive care syndrome [20–23]. Pain, anxiety, and delirium all contribute to patient distress and agitation, and the prevention or treatment of pain, anxiety, and delirium in the ICU is an important goal. The Society of Critical Care Medicine (SCCM) developed the ABCDEF bundle (Table) to facilitate implementation of their 2013 clinical practice guidelines for the management of pain, agitation, and delirium (PAD) [24]. The bundle emphasizes an integrated approach to assessing, treating and preventing significant pain, over or undersedation, and delirium in critically ill patients.
In 2015, SCCM began the ICU Liberation Collaborative, a clinical care collaborative designed to implement the ABCDEF bundle through team-based care at hospitals and health systems across the country. The Liberation Collaborative’s intent was to “liberate” patients from iatrogenic aspects of care [25]. Our medical center participated in the collaborative. In this article, we describe the highlights of our medical center’s implementation of the ABCDEF bundle in 3 medical ICUs.
Settings
The Ohio State University Wexner Medical Center is a 1000+–bed academic medical center located in Columbus, Ohio, containing more than 180 ICU beds. These ICU beds provide care to patients with medical, surgical, burn, trauma, oncology, and transplantation needs. The care of the critically ill patient is central to the organization’s mission “to improve people’s lives through innovation in research, education and patient care.”
At the start of our colloborative participation, all of the ABCDEF bundle elements were protocolized in these ICUs. However, there was a lack of knowledge of the content of the bundle elements and corresponding guidelines among all members of our interdisciplinary teams, and our written protocols and guidelines supporting many of the bundle elements had inconsistent application across the 3 clinical settings.
We convened an ABCDEF bundle/ICU liberation team consisting of an interdisciplinary group of clinicians. The team leader was a critical care clinical nurse specialist. The project required outcome and demographic data collection for all patients in the collaborative as well as concurrent (daily) data collection on each bundle element. The clinical pharmacists who work in the MICUs and are part of daily interdisciplinary rounds collected the daily bundle element data while the patient demographic and outcome data were collected by the clinical nurse specialist, nurse practitioner, and clinical quality manager. Oversight and accountability for the ABCDEF bundle/ICU liberation project was provided by an interdisciplinary critical care quality committee. Our ABCDEF bundle/ICU liberation team met weekly to discuss progress of the initiative and provided monthly updates to the larger quality committee.
Impacting the Bundle—Nursing Assessments
The PAD guidelines recommend the routine assessment of pain, agitation, and delirium in ICU patients. For pain, they recommend the use of patient self-report or the use of a behavioral pain scale as the most valid and reliable method for completing this assessment [24]. Our medical center had chosen to use the Critical Care Pain Observation Tool (CPOT), a valid and reliable pain scale, for assessment of pain in patients who are unable to communicate [26], which had been in use in the clinical setting for over a year when this project began. For agitation, the PAD guidelines recommended assessment of the adequacy and depth of sedation using the Richmond Agitation Sedation Scale (RASS) or Sedation Agitation Scale (SAS) [24] for all ICU patients. Our medical center has chosen to use the RASS as our delirium assessment. The RASS had been in use in the clinical setting for approximately 10 years when this project started. For delirium assessment, the Confusion Assessment Method for ICU (CAM-ICU) [27] or the Intensive Care Delirium Screening Checklist (ICDSC) [28] is recommended. Our medical center used the CAM-ICU, which had been in place for approximately 10 years prior to the start of this project. Even though the assessment tools were in place in our MICU unit and hospital-based policies and guidelines, the accuracy of the assessments for PAD was questioned by many clinicians.
To improve the accuracy of our nursing assessments for PAD, a group of clinical nurse specialists and nursing educators developed an education and competency program for all critical care nursing staff. This education program focused on the PAD guidelines and our medical center’s chosen assessment tools. Education included in-person continuing education lectures, online modules, demonstrations, and practice in the clinical setting. After several months of education and practice, all staff registered nurses (RNs) had to demonstrate PAD assessment competency on a live person. We used standardized patients who followed written scenarios for all of the testing. The RN was given 1 of 8 scenarios and was charged with completing a PAD assessment on the standardized patient. RNs who did not pass had to review the education materials and re-test at a later date. More than 600 RNs completed the PAD competency. After completion of the PAD competency, the clinical nurse specialists observed clinical practice and audited nursing documentation. The accuracy of assessments for PAD had increased. Anecdotally, many our critical care clinicians acknowledged that they had increased confidence in the accuracy of the PAD assessments. There was increased agreement between the results of the assessments performed by all members of the interdisciplinary team.
Impacting the Bundle—Standardized Nurse Early Report Facilitation
Communication among the members of the interdisciplinary team is essential in caring for critically ill patients. One of the ways that the members of the interdisciplinary team communicate is through daily patient rounds. Our ABCDEF bundle/ICU liberation team members attend and participate in daily patient rounds in our 3 MICUs on a regular basis. The ABCDEF bundle/ICU liberation team members wanted to improve communication during patient rounds for all elements of the bundle.
Nurse Early Report Facilitation was a standard that was implemented approximately 5 years prior to the start of the ICU Liberation Collaborative. Nurse early report facilitation requires that the bedside staff RN starts the daily patient rounds discussion on each of his/her patients. The report given by the bedside RN was designed to last 60 to 90 seconds and provide dynamic information on the patient’s condition. Requiring the bedside RN to start the patient rounding provides the following benefits: requires bedside RN presence, provides up-to-the-minute information, increases bedside RN engagement in the patient’s plan of care, and allows for questions and answers. Compliance from the bedside RNs with this process of beginning patient rounds was very high; however, the information that was shared when the bedside RN began rounds was variable. Some bedside RNs provided a lengthy report on the patient while others provided 1 or 2 words.
The ABCDEF bundle/ICU liberation team members thought that a way to hardwire the ABCDEF bundle elements would be to add structure to the nurse early report. By using the ABCDEF elements as a guide, the ABCDEF bundle/ICU liberation team members developed the Structured Nurse Early Report Facilitation in which the bedside RN provides the following information at the beginning of each patient discussion during rounds: name of patient, overnight events (travels, clinical changes, etc.), pain (pain score and PRN use), agitation (RASS and PRN use), delirium (results of CAM-ICU). When the bedside RN performs the nurse early report using the structured format, the team is primed to discuss the A, B, C, and D elements of the bundle.
To implement the Structured Nurse Early Report Facilitation in the MICUs, the critical care clinical nurse specialists provided in-person education at the monthly staff meetings. They also sent emails, developed education bulletin boards, made reminder cards that were placed on the in-room computers, and distributed “badge buddy” reminder cards that fit on the RNs’ hospital ID badges. We provided emails and in-person education to our physician and nurse practitioner teams so they were aware of the changes. Our physician and nurse practitioners were encouraged to ask for information about any elements missing from the Structured Nurse Early Report in the early days of the process change.
After a few months, the critical care clinical nurse specialists reported that the Structured Nurse Early Report Facilitation was occurring for more than 80% of MICU patients. Besides the increase in information related to pain, agitation, and delirium, the Structured Nurse Early Report Facilitation increased the interdisciplinary team’s use of the term “delirium.” Prior to the structured nurse early report, most of the interdisciplinary team members were not naming delirium as a diagnosis for our MICU patients and used terms such as ICU psychosis, confused, and disoriented to describe the mental status of patients with delirium. As a result of this lack of naming, there may have been a lack of recognition of delirium. Using the word “delirium” has increased our interdisciplinary team’s awareness of this diagnosis and has increased the treatment of delirium in patients who have the diagnosis.
In addition to improved assessment and diagnosis, the clinical pharmacist began leading the discussions around choice of sedation during daily rounds. Team members began to discuss the patient’s sedation level, sedation goals, and develop a plan for each patient. This discussion included input from all members of the interdisciplinary team and allowed for a comprehensive patient-specific plan to be formed during the daily patient rounds episode.
Impacting the Bundle—Focus on Mobility
There have been many articles published in the critical care literature on the topic of mobility in the ICU. The evidence shows that early mobilization and rehabilitation of patients in ICUs is safe and may improve physical function, and reduce the duration of delirium, mechanical ventilation, and ICU length of stay [29–31]. Our institution had developed a critical care mobility guideline in 2008 for staff RNs to follow in determining the level of mobility that the patient required during the shift. Over the years, the mobility guideline was used less and less. As other tasks and interventions became a priority, mobility became an intervention that was completed for very few patients.
Our ABCDEF bundle/ICU liberation team determined that increasing mobility of our MICU patients needed to be a plan of care priority. We organized an interdisciplinary team to discuss the issues and barriers to mobility for our MICU patients. The interdisciplinary mobility team had representatives from medicine, nursing, respiratory therapy, physical therapy, occupational therapy, and speech therapy. Initially, this team sent a survey to all disciplines who provided care for the patients in the MICU. Data from this survey was analyzed by the team to determine next steps.
Despite the fact that there were responses from 6 unique disciplines, several common barriers emerged. The largest barrier to overcome was staffing/time for mobility. It was clear from the survey respondents that all health care team members were busy providing patient care. Any change in the mobility guideline or practice needed to make efficient use of the practitioner’s time. Other barriers included space/equipment, communication, patient schedules, knowledge, patient and staff safety, and unit culture. The interdisciplinary mobility team divided into smaller workgroups to tackle the issues and barriers.
Mobility Rounds
Mobility rounds were implemented to attempt to decrease the barriers of time, communication, and know-ledge. Mobility rounds were designed as a start to the shift discussion on the topic of mobility. Mobility rounds included a clinical nurse specialist, a physical therapist (PT), an occupational therapist (OT), and a pulmonary physician/ nurse practitioner. This team met at 7:30 each weekday morning and walked room-to-room through our MICUs. The mobility rounds team laid eyes on each patient, developed a mobility plan for the day, and communicated this plan with the staff RN assigned to the patient. Mobility rounds were completed on all 48 MICU patients in 30 minutes.
Having the mobility rounds team at each patient’s bedside was important in several ways. First, it allowed the team members to see each patient, which gave the patient an opportunity to be part of his/her mobility plan. Also, the staff RNs and respiratory therapists (RTs) were often in the patient’s room. This improved communication as the staff RNs and RTs discussed the mobility plan with the PT and OT. For patients who required many resources for a mobility session, the morning bedside meeting allowed RNs, RTs, PTs, OTs, and physicians to set a schedule for the day’s mobility session. Having a scheduled time for mobility increased staff and patient communication. Also, it allowed all of the team members to adjust their workloads to be present for a complex mobility session.
Another benefit of mobility rounds was the opportunity for the PT and OT team members to provide education to their nursing and physician colleagues. Many nursing and physician providers do not understand the intricacies of physical and occupational therapy practice. This daily dialogue provided the PT/OT a forum to explain which patients would benefit from PT/OT services and which would not. It allowed the RNs and physicians to hear the type of therapy provided on past sessions. It allowed the PT/OT to discuss and evaluate the appropriateness of each patient consult. It allowed the RN and physician to communicate which patients they felt were highest priority for therapy for that day. Mobility rounds are ongoing. Data are being collected to determine the impact of mobility rounds on the intensity of mobility for our MICU patients.
Nurse-Driven Mobility Guideline
Another subgroup revised the outdated critical care mobility guideline and developed the new “Nurse-Driven Critical Care Mobility Guideline.” The guideline has been approved through all of the medical center quality committees and is in the final copyright and publication stages, with implementation training to begin in the fall. The updated guideline is in an easy-to-read flowchart format and provides the staff RN with a pathway to follow to determine if mobility is safe for the patient. After determining safety, the staff RN uses the guideline to determine and perform the patient’s correct mobility interventions for his/her shift. The guideline has built in consultation points with the provider team and the therapy experts.
Other Mobility Issues
A third subgroup from the interdisciplinary mobility team has been working on the equipment and space barriers. This subgroup is evaluating equipment such as bedside chairs, specialty beds, and assistive devices. Many of our MICU patient rooms have overhead lifts built into the ceilings. This equipment is available to all staff at all times. The equipment/space subgroup made sure that there were slings for use with the overhead lifts in all of the MICU equipment rooms. They provided staff education on proper use of the overhead lifts. They worked with the financial department and MICU nurse managers to purchase 2 bariatric chairs for patient use in the MICU.
A fourth subgroup has been working on the electronic documentation system. They are partnering with members of the information technology department to update the nursing and provider documentation regarding mobility. They have also worked on updating and elaborating on the electronic activity orders for our MICU patients. There have been many changes to various patient order sets to clarify mobility and activity restrictions. The admission order set for our MICU patients has an activity order that allows our staff RNs to fully utilize the new nurse-driven critical care mobility guideline.
Impacting the Bundle—Family Engagement and Empowerment
Family support is important for all hospitalized patients but is crucial for ICU patients. The medical center implemented an open visitation policy for all ICUs in 2015. Despite open visitation, the communication between patients, families, and interdisciplinary ICU teams was deficient. Families spoke to many different team members and had difficulty remembering all of the information that they received.
To increase family participation in the care of the MICU patient, we invited family members to participate in daily rounds. The families were invited to listen and encouraged to ask questions. During daily rounds, there is a time when all care providers stop talking and allow family members to inquire about the proposed plan of care for their family member. For family members who cannot attend daily rounds, our ICU teams arrange daily in-person or telephone meetings to discuss the patient’s plan of care. RNs provide a daily telefamily call to update the designated family member on the patient’s status, answer questions, and provide support.
In addition to the medical support for families, there is an art therapy program integrated into the ICU to assist families while they are in the medical center. This program is run by a certified art therapist who holds art therapy classes 2 afternoons a week. This provides family members with respite time during long hospital days. There are also nondenominational services offered multiple times during the week and a respite area is located in the lobby of the medical center.
In addition to these programs, the medical center added full-time social workers to be available 24 hours a day/ 7 days a week. The social worker can provide social support for our patients and families as well as help facilitate accommodations for those who travel a far distance. The social worker plays in integral part on the ICU team, often bridging the gap for families that can be overlooked by the medical team.
Conclusion
Care of the ICU patient is complex. Too often we work in our silos of responsibility with our list of tasks for the day. Participating in the ABCDEF bundle/ICU Liberation Collaborative required us to work together as a team. We were able to have candid conversations that improved our understanding of other team members’ perspectives, helping us to reflect on our behaviors and overcome barriers to improving patient care.
Even though the ICU Liberation Collaborative has ended, our work at the medical center continues. We are in the process of evaluating all of the interventions, processes, and guideline updates that our ABCEDF bundle/ICU liberation team worked on during our 18-month program. There have been many improvements such as increased accuracy of pain and delirium assessments, along with improved treatment of pain in the MICU patient. We have noticed increased communication with the patient and family and among all of the members of the interdisciplinary team. We have changed our language to accurately reflect the patient’s sedation level by using the correct RASS score and delirium status by using the term “delirium” when this condition exists. There is increased collaboration among team members in the area of mobility. More patients are out of bed on bedside chairs and more patients are walking in the halls. Over the next several months our ABCEDF bundle/ICU liberation team will continue to review and analyze the data that we collected in the collaborative. We will use that data and the clinical changes we see on a daily basis to continue to improve the care for our MICU patients.
Corresponding author: Michele L. Weber, DNP, RN, CCRN, CCNS, AOCNS, OCN, ANP-BC, The Ohio State University Wexner Medical Center, 410 West 10th Ave., Columbus, OH 43210, Michele.weber@osumc.edu.
1. Svenningsen H, Egerod I, Christensen D, et al Symptoms of posttraumatic stress after intensive care delirium. Biomed Res Int 2015;2015:876–947.
2. Warlan H, Howland L. Posttraumatic stress syndrome associated with stays in the intensive care unit: importance of nurses; involvement. Crit Care Nurse 2015;35:44–52.
3. Bienvenu OJ, Gerstenblith TA. Posttraumatic stress disorder phenomena after critical illness. Crit Care Clin 2017;33:649–58.
4. Wintermann GB, Rosendahl J, Weidner K, et al. Risk factors of delayed onset posttraumatic stress disorder in chronically critically ill patients. J Nerv Ment Dis 2017 Jul 5.
5. Wolters AE, Peelen LM, Welling MC, et al. Long-term mental health problems after delirium in the ICU. Crit Care Med 2016;44:1808–13.
6. Wintermann GB, Weidner K, Stafuss B. Predictors of posttraumatic stress and quality of life in family members of chronically critically ill patients after intensive care Ann Intensive Care 2016;6:69.
7. Patel MD, Jackson JC, Morandi A et al. Incidence and risk factors for intensive care unit-related post-traumatic stress disorder in veterans and civilians Am J Respir Crit Care Med 2016;193:1373–81.
8. Girad TD, Shintani AK, Jackson JC et al. Risk factors for post-traumatic stress disorder symptoms following critical illness requiring mechanical ventilation: a prospective cohort study. Crit Care 2007;11:R28.
9. Jackson JC, Hart RP, Gordon SM, et al. Post-traumatic stress disorder and post-traumatic stress symptoms following critical illness in medical intensive care unit patients: assessing the magnitude of the problem. Crit Care 2007;11:R27.
10. Jackson JC, Pandharipande PP, Girad TD et al. Depression, post-traumatic stress disorder, and functional disability in survivors of critical illness in the BRAIN-ICU study: a longitudinal cohort study. Lancet Resp Med 2014;2:369–79.
11. Davydow DS, Hough CL, Langa KM, Iwashyna TJ. Depressive symptoms in spouses of older patients with severe sepsis. Crit Care Med 2012;40:2335–41.
12. Farhan H, Moeno-Duarte I, Latronico N, et al. Acquired muscle weakness in the surgical intensive care unit: nosology, epidemiology, diagnosis and prevention. Anesthesiology 2016;124:207–34.
13. Stevens, RD, Zink EK. Inflammatory signatures in ICU-acquired weakness. Crit Care Med 2017;45:1098–100.
14. Lotronico, N, Herridge M, Hopkins O, et al. The ICM research agenda on intensive care unit-acquired weakness. Intensive Care Med 2017 Mar 13.
15. Batt J, Herridge M, Dos Santos C. Mechanism of ICU-acquired weakness: skeletal muscle loss in critical illness. Intensive Care Med 2017 Mar 10.
16. Batt J, Mathur S, Katzberg HD. Mechanism of ICU-acquired weakness: muscle contractility in critical illness. Intensive Care Med 2017;43:584–86.
17. Schweickert WD, Hall J. ICU-acquired weakness. Chest 2007;131:1541–9.
18. Deem S. Intensive care unit-acquired muscle weakness. Repir Care 2006;51:1042–52.
19. Kahn J, Burnham EL, Moss M. Acquired weakness in the ICU: critical illness myopathy and polyneuropathy. Minerva Anesthesiol 2006;72:401–6.
20. Jeitziner MM, Hamers JP, Burgin R et al. Long-term consequences of pain, anxiety, and agitation for critically ill older patients after an intensive care unit stay. J Clin Nurs 2015;24:2419–28.
21. Svennigsen H, Langhorn L, Agard AS, Dereyer P. Post-ICU symptoms, consequences, and follow-up: an integrative review. Nurs Crit Care 2017;22:212–20.
22. Torres J, Carvalho D, Molinos E et al. The impact of the patient post-intensive care syndrome components upon caregiver burden. Med Intensiva 2017 Feb 7
23. Rawal G, Yadav S, Sumar R. Post-Intensive care syndrome: an overview. J Transl Int Med 2017;305:90–2.
24. Barr J, Fraser GL, Puntillo K , et al. Clinical practice guidelines for the management of pain, agitation, and delirium in adult patients in the intensive care unit. Crit Care Med 2013;41:263–306.
25. Ely EW. The ABCDEF bundle: science and philosophy of how ICU liberation serves patients and families. Crit Care Med 2017;45:321–30.
26. Gelinas C, Fillion L, Puntillo K, et al. Validation of the critical-care pain observation tool in adult patients. Am J Crit Care 2006;15:420–7.
27. Ely EW, Margolin R, Francis J, et al. Evaluation of delirium in critically ill patients: validation of the Confusion Assessment Method for the Intensive Care Unit (CAM-ICU). Crit Care Med 2001;29:1370–9.
28. Bergeron N, Dubois MJ, Dumont M, et al. Intensive Care Delirium Screening Checklist: Evaluation of a new screening tool. Intensive Care Med 2001;27:859–64.
29. Bailey P, Thomsen GE, Spuhler VJ, et al. Early activity is feasible and safe in respiratory failure patients. Crit Care Med 2007;35:139–45.
30. Morris PE. Moving our critically ill patients: Mobility barriers and benefits. Crit Care Clin 2007;23:1–20.
31. Nydahl P, Sricharoenchai T, Chandra S, et al. Safety of patient mobilization and rehabilitation in the intensive care unit. Systematic review with meta-analysis. Ann Am Thorac Soc 2017;14:766–77.
Abstract
- Objective: To describe the highlights of our medical center’s implementation of the Society of Critical Care Medicine’s ABCDEF bundle in 3 medical intensive care units (ICUs).
- Methods: After a review of our current clinical practices and written clinical guidelines, we evaluated deficiencies in clinical care and employed a variety of educational and clinical change interventions for each element of the bundle. We utilized an interdisciplinary team approach to facilitate the change process.
- Results: As a result of our efforts, improvement in the accuracy of assessments of pain, agitation, and delir-ium across all clinical disciplines and improved adherence to clinical practice guidelines, protocols, and instruments for all bundle elements was seen. These changes have been sustained following completion of the data collection phase of the project.
- Conclusion: ICU care is a team effort. As a result of participation in this initiative, there has been an increased awareness of the bundle elements, improved collaboration among team members, and increased patient and family communication.
Key words: intensive care; delirium; sedation; mobility.
Admission to the intensive care unit (ICU) is a stressful and challenging time for patients and their families. In addition, significant negative sequelae following an ICU stay have been reported in the literature, including such post-ICU complications as post-traumatic stress disorder [1–9], depression [10,11], ICU-acquired weakness [12–19], and post-intensive care syndrome [20–23]. Pain, anxiety, and delirium all contribute to patient distress and agitation, and the prevention or treatment of pain, anxiety, and delirium in the ICU is an important goal. The Society of Critical Care Medicine (SCCM) developed the ABCDEF bundle (Table) to facilitate implementation of their 2013 clinical practice guidelines for the management of pain, agitation, and delirium (PAD) [24]. The bundle emphasizes an integrated approach to assessing, treating and preventing significant pain, over or undersedation, and delirium in critically ill patients.
In 2015, SCCM began the ICU Liberation Collaborative, a clinical care collaborative designed to implement the ABCDEF bundle through team-based care at hospitals and health systems across the country. The Liberation Collaborative’s intent was to “liberate” patients from iatrogenic aspects of care [25]. Our medical center participated in the collaborative. In this article, we describe the highlights of our medical center’s implementation of the ABCDEF bundle in 3 medical ICUs.
Settings
The Ohio State University Wexner Medical Center is a 1000+–bed academic medical center located in Columbus, Ohio, containing more than 180 ICU beds. These ICU beds provide care to patients with medical, surgical, burn, trauma, oncology, and transplantation needs. The care of the critically ill patient is central to the organization’s mission “to improve people’s lives through innovation in research, education and patient care.”
At the start of our colloborative participation, all of the ABCDEF bundle elements were protocolized in these ICUs. However, there was a lack of knowledge of the content of the bundle elements and corresponding guidelines among all members of our interdisciplinary teams, and our written protocols and guidelines supporting many of the bundle elements had inconsistent application across the 3 clinical settings.
We convened an ABCDEF bundle/ICU liberation team consisting of an interdisciplinary group of clinicians. The team leader was a critical care clinical nurse specialist. The project required outcome and demographic data collection for all patients in the collaborative as well as concurrent (daily) data collection on each bundle element. The clinical pharmacists who work in the MICUs and are part of daily interdisciplinary rounds collected the daily bundle element data while the patient demographic and outcome data were collected by the clinical nurse specialist, nurse practitioner, and clinical quality manager. Oversight and accountability for the ABCDEF bundle/ICU liberation project was provided by an interdisciplinary critical care quality committee. Our ABCDEF bundle/ICU liberation team met weekly to discuss progress of the initiative and provided monthly updates to the larger quality committee.
Impacting the Bundle—Nursing Assessments
The PAD guidelines recommend the routine assessment of pain, agitation, and delirium in ICU patients. For pain, they recommend the use of patient self-report or the use of a behavioral pain scale as the most valid and reliable method for completing this assessment [24]. Our medical center had chosen to use the Critical Care Pain Observation Tool (CPOT), a valid and reliable pain scale, for assessment of pain in patients who are unable to communicate [26], which had been in use in the clinical setting for over a year when this project began. For agitation, the PAD guidelines recommended assessment of the adequacy and depth of sedation using the Richmond Agitation Sedation Scale (RASS) or Sedation Agitation Scale (SAS) [24] for all ICU patients. Our medical center has chosen to use the RASS as our delirium assessment. The RASS had been in use in the clinical setting for approximately 10 years when this project started. For delirium assessment, the Confusion Assessment Method for ICU (CAM-ICU) [27] or the Intensive Care Delirium Screening Checklist (ICDSC) [28] is recommended. Our medical center used the CAM-ICU, which had been in place for approximately 10 years prior to the start of this project. Even though the assessment tools were in place in our MICU unit and hospital-based policies and guidelines, the accuracy of the assessments for PAD was questioned by many clinicians.
To improve the accuracy of our nursing assessments for PAD, a group of clinical nurse specialists and nursing educators developed an education and competency program for all critical care nursing staff. This education program focused on the PAD guidelines and our medical center’s chosen assessment tools. Education included in-person continuing education lectures, online modules, demonstrations, and practice in the clinical setting. After several months of education and practice, all staff registered nurses (RNs) had to demonstrate PAD assessment competency on a live person. We used standardized patients who followed written scenarios for all of the testing. The RN was given 1 of 8 scenarios and was charged with completing a PAD assessment on the standardized patient. RNs who did not pass had to review the education materials and re-test at a later date. More than 600 RNs completed the PAD competency. After completion of the PAD competency, the clinical nurse specialists observed clinical practice and audited nursing documentation. The accuracy of assessments for PAD had increased. Anecdotally, many our critical care clinicians acknowledged that they had increased confidence in the accuracy of the PAD assessments. There was increased agreement between the results of the assessments performed by all members of the interdisciplinary team.
Impacting the Bundle—Standardized Nurse Early Report Facilitation
Communication among the members of the interdisciplinary team is essential in caring for critically ill patients. One of the ways that the members of the interdisciplinary team communicate is through daily patient rounds. Our ABCDEF bundle/ICU liberation team members attend and participate in daily patient rounds in our 3 MICUs on a regular basis. The ABCDEF bundle/ICU liberation team members wanted to improve communication during patient rounds for all elements of the bundle.
Nurse Early Report Facilitation was a standard that was implemented approximately 5 years prior to the start of the ICU Liberation Collaborative. Nurse early report facilitation requires that the bedside staff RN starts the daily patient rounds discussion on each of his/her patients. The report given by the bedside RN was designed to last 60 to 90 seconds and provide dynamic information on the patient’s condition. Requiring the bedside RN to start the patient rounding provides the following benefits: requires bedside RN presence, provides up-to-the-minute information, increases bedside RN engagement in the patient’s plan of care, and allows for questions and answers. Compliance from the bedside RNs with this process of beginning patient rounds was very high; however, the information that was shared when the bedside RN began rounds was variable. Some bedside RNs provided a lengthy report on the patient while others provided 1 or 2 words.
The ABCDEF bundle/ICU liberation team members thought that a way to hardwire the ABCDEF bundle elements would be to add structure to the nurse early report. By using the ABCDEF elements as a guide, the ABCDEF bundle/ICU liberation team members developed the Structured Nurse Early Report Facilitation in which the bedside RN provides the following information at the beginning of each patient discussion during rounds: name of patient, overnight events (travels, clinical changes, etc.), pain (pain score and PRN use), agitation (RASS and PRN use), delirium (results of CAM-ICU). When the bedside RN performs the nurse early report using the structured format, the team is primed to discuss the A, B, C, and D elements of the bundle.
To implement the Structured Nurse Early Report Facilitation in the MICUs, the critical care clinical nurse specialists provided in-person education at the monthly staff meetings. They also sent emails, developed education bulletin boards, made reminder cards that were placed on the in-room computers, and distributed “badge buddy” reminder cards that fit on the RNs’ hospital ID badges. We provided emails and in-person education to our physician and nurse practitioner teams so they were aware of the changes. Our physician and nurse practitioners were encouraged to ask for information about any elements missing from the Structured Nurse Early Report in the early days of the process change.
After a few months, the critical care clinical nurse specialists reported that the Structured Nurse Early Report Facilitation was occurring for more than 80% of MICU patients. Besides the increase in information related to pain, agitation, and delirium, the Structured Nurse Early Report Facilitation increased the interdisciplinary team’s use of the term “delirium.” Prior to the structured nurse early report, most of the interdisciplinary team members were not naming delirium as a diagnosis for our MICU patients and used terms such as ICU psychosis, confused, and disoriented to describe the mental status of patients with delirium. As a result of this lack of naming, there may have been a lack of recognition of delirium. Using the word “delirium” has increased our interdisciplinary team’s awareness of this diagnosis and has increased the treatment of delirium in patients who have the diagnosis.
In addition to improved assessment and diagnosis, the clinical pharmacist began leading the discussions around choice of sedation during daily rounds. Team members began to discuss the patient’s sedation level, sedation goals, and develop a plan for each patient. This discussion included input from all members of the interdisciplinary team and allowed for a comprehensive patient-specific plan to be formed during the daily patient rounds episode.
Impacting the Bundle—Focus on Mobility
There have been many articles published in the critical care literature on the topic of mobility in the ICU. The evidence shows that early mobilization and rehabilitation of patients in ICUs is safe and may improve physical function, and reduce the duration of delirium, mechanical ventilation, and ICU length of stay [29–31]. Our institution had developed a critical care mobility guideline in 2008 for staff RNs to follow in determining the level of mobility that the patient required during the shift. Over the years, the mobility guideline was used less and less. As other tasks and interventions became a priority, mobility became an intervention that was completed for very few patients.
Our ABCDEF bundle/ICU liberation team determined that increasing mobility of our MICU patients needed to be a plan of care priority. We organized an interdisciplinary team to discuss the issues and barriers to mobility for our MICU patients. The interdisciplinary mobility team had representatives from medicine, nursing, respiratory therapy, physical therapy, occupational therapy, and speech therapy. Initially, this team sent a survey to all disciplines who provided care for the patients in the MICU. Data from this survey was analyzed by the team to determine next steps.
Despite the fact that there were responses from 6 unique disciplines, several common barriers emerged. The largest barrier to overcome was staffing/time for mobility. It was clear from the survey respondents that all health care team members were busy providing patient care. Any change in the mobility guideline or practice needed to make efficient use of the practitioner’s time. Other barriers included space/equipment, communication, patient schedules, knowledge, patient and staff safety, and unit culture. The interdisciplinary mobility team divided into smaller workgroups to tackle the issues and barriers.
Mobility Rounds
Mobility rounds were implemented to attempt to decrease the barriers of time, communication, and know-ledge. Mobility rounds were designed as a start to the shift discussion on the topic of mobility. Mobility rounds included a clinical nurse specialist, a physical therapist (PT), an occupational therapist (OT), and a pulmonary physician/ nurse practitioner. This team met at 7:30 each weekday morning and walked room-to-room through our MICUs. The mobility rounds team laid eyes on each patient, developed a mobility plan for the day, and communicated this plan with the staff RN assigned to the patient. Mobility rounds were completed on all 48 MICU patients in 30 minutes.
Having the mobility rounds team at each patient’s bedside was important in several ways. First, it allowed the team members to see each patient, which gave the patient an opportunity to be part of his/her mobility plan. Also, the staff RNs and respiratory therapists (RTs) were often in the patient’s room. This improved communication as the staff RNs and RTs discussed the mobility plan with the PT and OT. For patients who required many resources for a mobility session, the morning bedside meeting allowed RNs, RTs, PTs, OTs, and physicians to set a schedule for the day’s mobility session. Having a scheduled time for mobility increased staff and patient communication. Also, it allowed all of the team members to adjust their workloads to be present for a complex mobility session.
Another benefit of mobility rounds was the opportunity for the PT and OT team members to provide education to their nursing and physician colleagues. Many nursing and physician providers do not understand the intricacies of physical and occupational therapy practice. This daily dialogue provided the PT/OT a forum to explain which patients would benefit from PT/OT services and which would not. It allowed the RNs and physicians to hear the type of therapy provided on past sessions. It allowed the PT/OT to discuss and evaluate the appropriateness of each patient consult. It allowed the RN and physician to communicate which patients they felt were highest priority for therapy for that day. Mobility rounds are ongoing. Data are being collected to determine the impact of mobility rounds on the intensity of mobility for our MICU patients.
Nurse-Driven Mobility Guideline
Another subgroup revised the outdated critical care mobility guideline and developed the new “Nurse-Driven Critical Care Mobility Guideline.” The guideline has been approved through all of the medical center quality committees and is in the final copyright and publication stages, with implementation training to begin in the fall. The updated guideline is in an easy-to-read flowchart format and provides the staff RN with a pathway to follow to determine if mobility is safe for the patient. After determining safety, the staff RN uses the guideline to determine and perform the patient’s correct mobility interventions for his/her shift. The guideline has built in consultation points with the provider team and the therapy experts.
Other Mobility Issues
A third subgroup from the interdisciplinary mobility team has been working on the equipment and space barriers. This subgroup is evaluating equipment such as bedside chairs, specialty beds, and assistive devices. Many of our MICU patient rooms have overhead lifts built into the ceilings. This equipment is available to all staff at all times. The equipment/space subgroup made sure that there were slings for use with the overhead lifts in all of the MICU equipment rooms. They provided staff education on proper use of the overhead lifts. They worked with the financial department and MICU nurse managers to purchase 2 bariatric chairs for patient use in the MICU.
A fourth subgroup has been working on the electronic documentation system. They are partnering with members of the information technology department to update the nursing and provider documentation regarding mobility. They have also worked on updating and elaborating on the electronic activity orders for our MICU patients. There have been many changes to various patient order sets to clarify mobility and activity restrictions. The admission order set for our MICU patients has an activity order that allows our staff RNs to fully utilize the new nurse-driven critical care mobility guideline.
Impacting the Bundle—Family Engagement and Empowerment
Family support is important for all hospitalized patients but is crucial for ICU patients. The medical center implemented an open visitation policy for all ICUs in 2015. Despite open visitation, the communication between patients, families, and interdisciplinary ICU teams was deficient. Families spoke to many different team members and had difficulty remembering all of the information that they received.
To increase family participation in the care of the MICU patient, we invited family members to participate in daily rounds. The families were invited to listen and encouraged to ask questions. During daily rounds, there is a time when all care providers stop talking and allow family members to inquire about the proposed plan of care for their family member. For family members who cannot attend daily rounds, our ICU teams arrange daily in-person or telephone meetings to discuss the patient’s plan of care. RNs provide a daily telefamily call to update the designated family member on the patient’s status, answer questions, and provide support.
In addition to the medical support for families, there is an art therapy program integrated into the ICU to assist families while they are in the medical center. This program is run by a certified art therapist who holds art therapy classes 2 afternoons a week. This provides family members with respite time during long hospital days. There are also nondenominational services offered multiple times during the week and a respite area is located in the lobby of the medical center.
In addition to these programs, the medical center added full-time social workers to be available 24 hours a day/ 7 days a week. The social worker can provide social support for our patients and families as well as help facilitate accommodations for those who travel a far distance. The social worker plays in integral part on the ICU team, often bridging the gap for families that can be overlooked by the medical team.
Conclusion
Care of the ICU patient is complex. Too often we work in our silos of responsibility with our list of tasks for the day. Participating in the ABCDEF bundle/ICU Liberation Collaborative required us to work together as a team. We were able to have candid conversations that improved our understanding of other team members’ perspectives, helping us to reflect on our behaviors and overcome barriers to improving patient care.
Even though the ICU Liberation Collaborative has ended, our work at the medical center continues. We are in the process of evaluating all of the interventions, processes, and guideline updates that our ABCEDF bundle/ICU liberation team worked on during our 18-month program. There have been many improvements such as increased accuracy of pain and delirium assessments, along with improved treatment of pain in the MICU patient. We have noticed increased communication with the patient and family and among all of the members of the interdisciplinary team. We have changed our language to accurately reflect the patient’s sedation level by using the correct RASS score and delirium status by using the term “delirium” when this condition exists. There is increased collaboration among team members in the area of mobility. More patients are out of bed on bedside chairs and more patients are walking in the halls. Over the next several months our ABCEDF bundle/ICU liberation team will continue to review and analyze the data that we collected in the collaborative. We will use that data and the clinical changes we see on a daily basis to continue to improve the care for our MICU patients.
Corresponding author: Michele L. Weber, DNP, RN, CCRN, CCNS, AOCNS, OCN, ANP-BC, The Ohio State University Wexner Medical Center, 410 West 10th Ave., Columbus, OH 43210, Michele.weber@osumc.edu.
1. Svenningsen H, Egerod I, Christensen D, et al Symptoms of posttraumatic stress after intensive care delirium. Biomed Res Int 2015;2015:876–947.
2. Warlan H, Howland L. Posttraumatic stress syndrome associated with stays in the intensive care unit: importance of nurses; involvement. Crit Care Nurse 2015;35:44–52.
3. Bienvenu OJ, Gerstenblith TA. Posttraumatic stress disorder phenomena after critical illness. Crit Care Clin 2017;33:649–58.
4. Wintermann GB, Rosendahl J, Weidner K, et al. Risk factors of delayed onset posttraumatic stress disorder in chronically critically ill patients. J Nerv Ment Dis 2017 Jul 5.
5. Wolters AE, Peelen LM, Welling MC, et al. Long-term mental health problems after delirium in the ICU. Crit Care Med 2016;44:1808–13.
6. Wintermann GB, Weidner K, Stafuss B. Predictors of posttraumatic stress and quality of life in family members of chronically critically ill patients after intensive care Ann Intensive Care 2016;6:69.
7. Patel MD, Jackson JC, Morandi A et al. Incidence and risk factors for intensive care unit-related post-traumatic stress disorder in veterans and civilians Am J Respir Crit Care Med 2016;193:1373–81.
8. Girad TD, Shintani AK, Jackson JC et al. Risk factors for post-traumatic stress disorder symptoms following critical illness requiring mechanical ventilation: a prospective cohort study. Crit Care 2007;11:R28.
9. Jackson JC, Hart RP, Gordon SM, et al. Post-traumatic stress disorder and post-traumatic stress symptoms following critical illness in medical intensive care unit patients: assessing the magnitude of the problem. Crit Care 2007;11:R27.
10. Jackson JC, Pandharipande PP, Girad TD et al. Depression, post-traumatic stress disorder, and functional disability in survivors of critical illness in the BRAIN-ICU study: a longitudinal cohort study. Lancet Resp Med 2014;2:369–79.
11. Davydow DS, Hough CL, Langa KM, Iwashyna TJ. Depressive symptoms in spouses of older patients with severe sepsis. Crit Care Med 2012;40:2335–41.
12. Farhan H, Moeno-Duarte I, Latronico N, et al. Acquired muscle weakness in the surgical intensive care unit: nosology, epidemiology, diagnosis and prevention. Anesthesiology 2016;124:207–34.
13. Stevens, RD, Zink EK. Inflammatory signatures in ICU-acquired weakness. Crit Care Med 2017;45:1098–100.
14. Lotronico, N, Herridge M, Hopkins O, et al. The ICM research agenda on intensive care unit-acquired weakness. Intensive Care Med 2017 Mar 13.
15. Batt J, Herridge M, Dos Santos C. Mechanism of ICU-acquired weakness: skeletal muscle loss in critical illness. Intensive Care Med 2017 Mar 10.
16. Batt J, Mathur S, Katzberg HD. Mechanism of ICU-acquired weakness: muscle contractility in critical illness. Intensive Care Med 2017;43:584–86.
17. Schweickert WD, Hall J. ICU-acquired weakness. Chest 2007;131:1541–9.
18. Deem S. Intensive care unit-acquired muscle weakness. Repir Care 2006;51:1042–52.
19. Kahn J, Burnham EL, Moss M. Acquired weakness in the ICU: critical illness myopathy and polyneuropathy. Minerva Anesthesiol 2006;72:401–6.
20. Jeitziner MM, Hamers JP, Burgin R et al. Long-term consequences of pain, anxiety, and agitation for critically ill older patients after an intensive care unit stay. J Clin Nurs 2015;24:2419–28.
21. Svennigsen H, Langhorn L, Agard AS, Dereyer P. Post-ICU symptoms, consequences, and follow-up: an integrative review. Nurs Crit Care 2017;22:212–20.
22. Torres J, Carvalho D, Molinos E et al. The impact of the patient post-intensive care syndrome components upon caregiver burden. Med Intensiva 2017 Feb 7
23. Rawal G, Yadav S, Sumar R. Post-Intensive care syndrome: an overview. J Transl Int Med 2017;305:90–2.
24. Barr J, Fraser GL, Puntillo K , et al. Clinical practice guidelines for the management of pain, agitation, and delirium in adult patients in the intensive care unit. Crit Care Med 2013;41:263–306.
25. Ely EW. The ABCDEF bundle: science and philosophy of how ICU liberation serves patients and families. Crit Care Med 2017;45:321–30.
26. Gelinas C, Fillion L, Puntillo K, et al. Validation of the critical-care pain observation tool in adult patients. Am J Crit Care 2006;15:420–7.
27. Ely EW, Margolin R, Francis J, et al. Evaluation of delirium in critically ill patients: validation of the Confusion Assessment Method for the Intensive Care Unit (CAM-ICU). Crit Care Med 2001;29:1370–9.
28. Bergeron N, Dubois MJ, Dumont M, et al. Intensive Care Delirium Screening Checklist: Evaluation of a new screening tool. Intensive Care Med 2001;27:859–64.
29. Bailey P, Thomsen GE, Spuhler VJ, et al. Early activity is feasible and safe in respiratory failure patients. Crit Care Med 2007;35:139–45.
30. Morris PE. Moving our critically ill patients: Mobility barriers and benefits. Crit Care Clin 2007;23:1–20.
31. Nydahl P, Sricharoenchai T, Chandra S, et al. Safety of patient mobilization and rehabilitation in the intensive care unit. Systematic review with meta-analysis. Ann Am Thorac Soc 2017;14:766–77.
Reducing Lost-to-Follow-Up Rates in Patients Discharged from an Early Psychosis Intervention Program
From the Early Psychosis Intervention Program, Institute of Mental Health, Singapore.
Abstract
- Objective: To develop and apply interventions to reduce lost-to-follow-up rates in patients discharged from an early psychosis intervention program.
- Methods: A team comprising clinical staff, case managers, and patients was formed to carry out a clinical practice improvement project. Tools such as brainstorming and root cause analysis were used to derive causes of patient loss to follow-up and interventions to address them were implemented. Plan, Do, Study, and Act cycles were used to evaluate the effectiveness of identified interventions.
- Results: After the 3 interventions were implemented, there was a decrease in the default rate, and the target default rate of 0% was achieved in less than 6 months.
- Conclusion: Easily implemented program changes led to rapid and sustained improvement in reducing lost-to-follow-up rates in patients discharged from an early psychosis intervention program.
Key words: Transfusion; red blood cells; plasma; platelets; veterans.
Psychosis is a mental illness in which affected individuals lose contact with reality. The lifetime prevalence of all psychotic disorders is 3.06% [1]. The typical symptoms consist of hallucinations, delusions, disorganized speech and thinking and negative symptoms (apathy, avolition, alogia, affective flattening, and anhedonia). Treatment is primarily with antipsychotics and psychological and social therapies.
The key to better prognosis is shortening the duration of untreated psychoses (DUP), defined as the period of time between the onset of psychosis and initiation of adequate treatment [2]. Longer DUP is one of the poorer prognostic factors in the outcome of first episode psychosis patients [3]. Over the past 2 decades, there has been considerable interest in developing and implementing specialized treatment programs for first episode psychosis [4], and early intervention is now a well-established therapeutic approach [5]. Early intervention has 2 elements that are distinct from standard care: early detection and phase-specific treatment (phase-specific treatment is a psychological, social, or physical treatment developed, or modified, specifically for use with people at an early stage of the illness). It is not only the initial care that is important, but regular follow up in the stable phase is necessary to reduce chances of relapse.
The Early Psychosis Intervention Programme (EPIP) in Singapore is a national program whose mission is early detection of young people with early psychosis or at risk of developing a psychotic illness and engagement with these individuals and families with the aim of providing accessible, empowering, individualized, evidence-based care in a least restrictive environment. The program was initiated in April 2001 under the auspices of the Ministry of Health, Singapore. EPIP has a multidisciplinary team of doctors, case managers, occupational therapists, psychologists, family therapists, social workers, and nurses to provide a comprehensive and personalized client-centered service across inpatient, outpatient, and community settings. The program spans 3 years and has 3 phases, beginning with acute intervention, followed by the stabilization phase, and then the stable phase, which focuses on relapse prevention, healthy lifestyle, stress management and plan for transition to downstream care. The frequency of visits and interaction with the team is tailored to suit individual patient needs and phase of care and can range from every day to once every 3 months. Following the 3-year program, clients are discharged from EPIP to continuity care (community psychiatry teams).
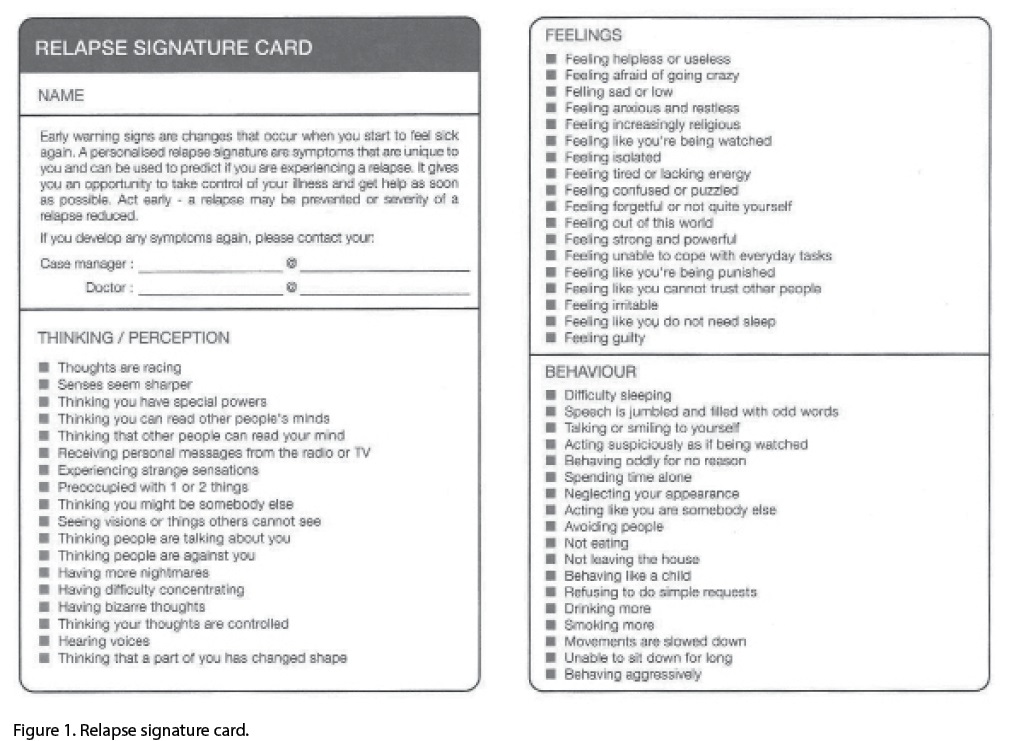
The relapse signature card was used every 2 months in the last 6 months during the period that the improvement project was ongoing. As it was found effective, now we use it every 6 months until 30 months and then every 2 months until conclusion of the 3-year program.
In addition, an appreciation card (Figure 2) was designed that is given to patients who keep their first downstream appointment. The card highlights independence and responsibility for one’s own care.
3. Provide a designated contact person
To ensure a smooth transition to the new service, we provided a designated person to contact for continuity care. Arrangement was made to transfer care to a specific community team of specific doctors and case managers, and their hospital contact details were provided on a card that was given to patients. Of the 8 patients who were transferred, 1 defaulted, 1 went overseas, 1 followed up with a private psychiatrist and the remaining 5 came for their first visit appointments.
Results
shown).
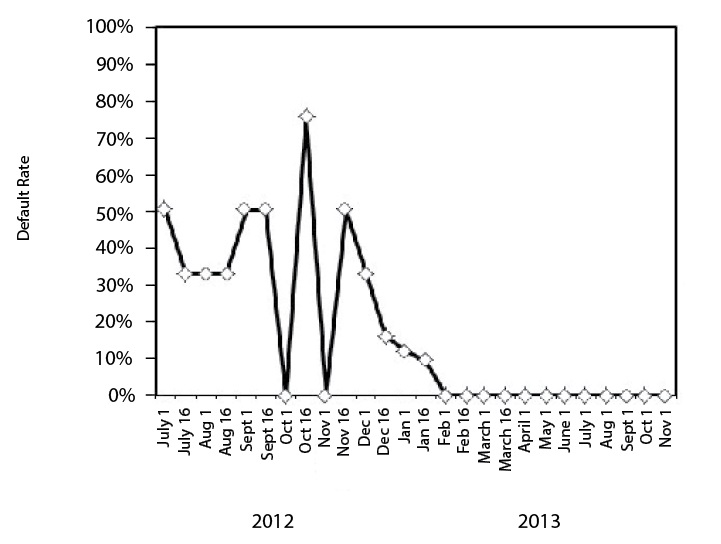
Figure 3. Run chart showing percentage of patients who failed to attend their first appointment with continuity care following transfer out of the program. Pre-intervention, default rates ranged from 9% to 75%. In the first 2 months after all the interventions were instituted (Dec 1 2012–March 1 2013), 2 patients defaulted, after which the default rate decreased to 0%.
Discussion
Making 3 small changes in our early psychosis intervention program led to rewarding gains in improving our patients’ follow-up with continuity care and the changes have become part of our standard operating procedure. In reviewing our processes to identify the root causes for loss of patients to follow-up, we found that obtaining the patient’s perspective was invaluable. It was interesting to learn that the word “discharge” might be impacting the way patients thought about follow-up after completion of the early intervention program. The interventions have become part of our standard operating procedure and we continue to audit the results every month to ensure that 0% default is being maintained. We are also looking into improving out psychoeducational materials for patients and caregivers and using more visual and interactive materials.
Corresponding author: Basu Sutapa, MD, Institute of Mental Health, Buangkok Green Medical Park, 10 Buangkok View, Singapore, S539747, Sutapa_Basu@imh.co.sg.
Financial disclosures: None.
1. Yung AR, Yuen HP, McGorry PD, et al. Mapping the onset of psychosis: the Comprehensive Assessment of At-Risk Mental States. Aust NZJ Psychiatry 2005;39:964–71.
2. Chang WC, Chan GH, Jim OT, et al. Optimal duration of an early intervention programme for first-episode psychosis: randomised controlled trial. Br J Psychiatry. 2015;206:
492–500.
3. Koch A, Gillis LS. Non-attendance of psychiatric outpatients. S Afr Med J 1991;80:289–91.
4. Mueser KT, Penn DL, Addington J, et al. The NAVIGATE Program for first-episode psychosis: rationale, overview, and description of psychosocial components. Psychiatr Serv 2015;66:680–90.
5. Marshall M, Rathbone J. Early intervention for psychosis. Cochrane Database Syst Rev 2011;(6):CD004718.
6. Mitchell AJ, Selmes T. Why don’t patients attend their appointments? Maintaining engagement with psychiatric services. Adv Psychiatr Treat 2007;13:423–34.
7. Magnes RM. Outpatient appointments: a necessary evil? A literature review and survey of patient attendance records. Psychiatr Bull 2008;32:458–60.
8. Appleby L, Shaw J, Amos T, et al. Suicide within 12 months of contact with mental health services: national clinical survey. Br Med J 1999;318:1235–39.
9. Chen A. Noncompliance in community psychiatry: a review of clinical interventions. Hosp Community Psychiatry 1991;
42:282–7.
10. Killaspy H, Banerjee S, King M, et al. Prospective controlled study of psychiatric outpatient nonattendance: characteristics and outcome. Br J Psych 2000;176:160–5.
11. Nelson EA, Maruish ME, Axler JL. Effects of discharge planning and compliance with outpatient appointments on readmission rates. Psychiatr Serv 2000;51:885–9.
12. Gutiérrez-Maldonado J, Caqueo-Urízar A, Kavanagh D. Burden of care and general health in families of patients with schizophrenia. Soc Psychiatr Epidemiol 2005;40:899–904.
13. Skarsholm H, Stoevring H, Nielsen B. Effect of a system-oriented intervention on compliance problems in schizophrenia: a pragmatic controlled trial. Schiz Res Treat 2014;
2014:789403.
14. The Clinical Practice Improvement Programme (CPIP), Institute of Healthcare Quality, National Healthcare Group 2002.
From the Early Psychosis Intervention Program, Institute of Mental Health, Singapore.
Abstract
- Objective: To develop and apply interventions to reduce lost-to-follow-up rates in patients discharged from an early psychosis intervention program.
- Methods: A team comprising clinical staff, case managers, and patients was formed to carry out a clinical practice improvement project. Tools such as brainstorming and root cause analysis were used to derive causes of patient loss to follow-up and interventions to address them were implemented. Plan, Do, Study, and Act cycles were used to evaluate the effectiveness of identified interventions.
- Results: After the 3 interventions were implemented, there was a decrease in the default rate, and the target default rate of 0% was achieved in less than 6 months.
- Conclusion: Easily implemented program changes led to rapid and sustained improvement in reducing lost-to-follow-up rates in patients discharged from an early psychosis intervention program.
Key words: Transfusion; red blood cells; plasma; platelets; veterans.
Psychosis is a mental illness in which affected individuals lose contact with reality. The lifetime prevalence of all psychotic disorders is 3.06% [1]. The typical symptoms consist of hallucinations, delusions, disorganized speech and thinking and negative symptoms (apathy, avolition, alogia, affective flattening, and anhedonia). Treatment is primarily with antipsychotics and psychological and social therapies.
The key to better prognosis is shortening the duration of untreated psychoses (DUP), defined as the period of time between the onset of psychosis and initiation of adequate treatment [2]. Longer DUP is one of the poorer prognostic factors in the outcome of first episode psychosis patients [3]. Over the past 2 decades, there has been considerable interest in developing and implementing specialized treatment programs for first episode psychosis [4], and early intervention is now a well-established therapeutic approach [5]. Early intervention has 2 elements that are distinct from standard care: early detection and phase-specific treatment (phase-specific treatment is a psychological, social, or physical treatment developed, or modified, specifically for use with people at an early stage of the illness). It is not only the initial care that is important, but regular follow up in the stable phase is necessary to reduce chances of relapse.
The Early Psychosis Intervention Programme (EPIP) in Singapore is a national program whose mission is early detection of young people with early psychosis or at risk of developing a psychotic illness and engagement with these individuals and families with the aim of providing accessible, empowering, individualized, evidence-based care in a least restrictive environment. The program was initiated in April 2001 under the auspices of the Ministry of Health, Singapore. EPIP has a multidisciplinary team of doctors, case managers, occupational therapists, psychologists, family therapists, social workers, and nurses to provide a comprehensive and personalized client-centered service across inpatient, outpatient, and community settings. The program spans 3 years and has 3 phases, beginning with acute intervention, followed by the stabilization phase, and then the stable phase, which focuses on relapse prevention, healthy lifestyle, stress management and plan for transition to downstream care. The frequency of visits and interaction with the team is tailored to suit individual patient needs and phase of care and can range from every day to once every 3 months. Following the 3-year program, clients are discharged from EPIP to continuity care (community psychiatry teams).
The relapse signature card was used every 2 months in the last 6 months during the period that the improvement project was ongoing. As it was found effective, now we use it every 6 months until 30 months and then every 2 months until conclusion of the 3-year program.
In addition, an appreciation card (Figure 2) was designed that is given to patients who keep their first downstream appointment. The card highlights independence and responsibility for one’s own care.
3. Provide a designated contact person
To ensure a smooth transition to the new service, we provided a designated person to contact for continuity care. Arrangement was made to transfer care to a specific community team of specific doctors and case managers, and their hospital contact details were provided on a card that was given to patients. Of the 8 patients who were transferred, 1 defaulted, 1 went overseas, 1 followed up with a private psychiatrist and the remaining 5 came for their first visit appointments.
Results
shown).
Figure 3. Run chart showing percentage of patients who failed to attend their first appointment with continuity care following transfer out of the program. Pre-intervention, default rates ranged from 9% to 75%. In the first 2 months after all the interventions were instituted (Dec 1 2012–March 1 2013), 2 patients defaulted, after which the default rate decreased to 0%.
Discussion
Making 3 small changes in our early psychosis intervention program led to rewarding gains in improving our patients’ follow-up with continuity care and the changes have become part of our standard operating procedure. In reviewing our processes to identify the root causes for loss of patients to follow-up, we found that obtaining the patient’s perspective was invaluable. It was interesting to learn that the word “discharge” might be impacting the way patients thought about follow-up after completion of the early intervention program. The interventions have become part of our standard operating procedure and we continue to audit the results every month to ensure that 0% default is being maintained. We are also looking into improving out psychoeducational materials for patients and caregivers and using more visual and interactive materials.
Corresponding author: Basu Sutapa, MD, Institute of Mental Health, Buangkok Green Medical Park, 10 Buangkok View, Singapore, S539747, Sutapa_Basu@imh.co.sg.
Financial disclosures: None.
1. Yung AR, Yuen HP, McGorry PD, et al. Mapping the onset of psychosis: the Comprehensive Assessment of At-Risk Mental States. Aust NZJ Psychiatry 2005;39:964–71.
2. Chang WC, Chan GH, Jim OT, et al. Optimal duration of an early intervention programme for first-episode psychosis: randomised controlled trial. Br J Psychiatry. 2015;206:
492–500.
3. Koch A, Gillis LS. Non-attendance of psychiatric outpatients. S Afr Med J 1991;80:289–91.
4. Mueser KT, Penn DL, Addington J, et al. The NAVIGATE Program for first-episode psychosis: rationale, overview, and description of psychosocial components. Psychiatr Serv 2015;66:680–90.
5. Marshall M, Rathbone J. Early intervention for psychosis. Cochrane Database Syst Rev 2011;(6):CD004718.
6. Mitchell AJ, Selmes T. Why don’t patients attend their appointments? Maintaining engagement with psychiatric services. Adv Psychiatr Treat 2007;13:423–34.
7. Magnes RM. Outpatient appointments: a necessary evil? A literature review and survey of patient attendance records. Psychiatr Bull 2008;32:458–60.
8. Appleby L, Shaw J, Amos T, et al. Suicide within 12 months of contact with mental health services: national clinical survey. Br Med J 1999;318:1235–39.
9. Chen A. Noncompliance in community psychiatry: a review of clinical interventions. Hosp Community Psychiatry 1991;
42:282–7.
10. Killaspy H, Banerjee S, King M, et al. Prospective controlled study of psychiatric outpatient nonattendance: characteristics and outcome. Br J Psych 2000;176:160–5.
11. Nelson EA, Maruish ME, Axler JL. Effects of discharge planning and compliance with outpatient appointments on readmission rates. Psychiatr Serv 2000;51:885–9.
12. Gutiérrez-Maldonado J, Caqueo-Urízar A, Kavanagh D. Burden of care and general health in families of patients with schizophrenia. Soc Psychiatr Epidemiol 2005;40:899–904.
13. Skarsholm H, Stoevring H, Nielsen B. Effect of a system-oriented intervention on compliance problems in schizophrenia: a pragmatic controlled trial. Schiz Res Treat 2014;
2014:789403.
14. The Clinical Practice Improvement Programme (CPIP), Institute of Healthcare Quality, National Healthcare Group 2002.
Melanoma Prevention Via App That Photoages College Students’ Selfies
Study Overview
Objective. To develop and test a photoaging app designed for melanoma prevention through enhancing sun protective behaviors.
Design. Cross-sectional pilot study.
Setting and participants. 25 students (56% male) with a median age of 22 years (range 19–25) attending the University of Essen in Germany.
Intervention. The researchers tested a free mobile app called Sunface. The app has the user take a self-portrait (selfie) and then photoages the image based on self-reported Fitzpatrick skin type and individual UV protection behavior. The 6 categories of skin on the Fitzpatrick Scale are Type I – always burns, never tans; Type II – usually burns, tans minimally; Type III – sometimes mild burn, gradually tans; Type IV – rarely burns, tans with ease; Type V – very rarely burns, tans very easily; Type VI – never burns, tans very easily. Afterward, the app explains the results and provides recommendations on sun protection as well as the ABCDE rule for skin cancer detection (asymmetrical shape, border, color, diameter, evolution). An interviewer walked up to each student, asked for oral consent, handed them an iPod Touch with the app pre-installed, and let them use the app.
Main outcome measures. Student attitudes about the app as collected on an anonymous paper and pencil questionnaire. Items were statements (see Results below), and responses were on a Likert scale ranging from fully agree to fully disagree.
Results. The majority of students (82%) stated that they would download the app, that the intervention had the potential to motivate them to use sun protection (92%) and that they thought such an app could change their perceptions that tanning makes you attractive (76%). Only a minority of students disagreed or fully disagreed that they would download such an app (2/25, 8%) or that such an app could change their perceptions on tanning and attractiveness (4/25, 16%).
Conclusion. Based on previous studies and the initial study results presented here, it is reasonable to speculate that the app may induce behavioral change in the target population. Further work is required to implement and examine the effectiveness of app-based photoaging interventions within risk groups from various cultural backgrounds.
Commentary
The relationship between skin cancer and ultraviolet radiation is well established [1]. Despite the known risks, tanning behavior, including use of tanning beds, is common. Indoor tanning is prevalent, particularly among female adolescents, and aligns with other risk behaviors, appearance-related factors, and intentional sunbathing [2]. Behaviors such as seeking shade, avoiding sun exposure during peak hours of radiation, wearing protective clothing, or some combination of these behaviors can provide protection against ultraviolet radiation [1].Significantly lower frequencies of almost all recommended sun-protective measures are found in younger patient subgroups (age 14 to 25 years) [3]. Thus, it makes sense to target interventions at the adolescent age-group.
Counseling adolescents regarding the dangers of tanning can be difficult due to the pressure the media places on young women and men to enhance their appearance. As a result, appeals to the negative cosmetic impact of sun and indoor tanning may be more effective than health-based appeals [4].
In this pilot study, the authors tested a creative sun protection app that photoages the user’s image based on skin type and aging algorithms. The underlying aging algorithms are based on publications showing UV-induced skin damage by outdoor as well as indoor tanning. Afterward, the app explains the visual results and aims at increasing self-competence on skin cancer prevention by providing guideline recommendations on sun protection and the ABCDE rule for melanoma self-detection. The app was very well received by the partipating college students, and the researchers concluded that the app may aid in the prevention of melanoma by enhancing the adoption of sun protective behaviors. However, this study was very small.
Mobile phone apps are proliferating and they are recognized as a potential low cost way to deliver health interventions [5]. A previous trial by Buller [6] used a randomized controlled design to evaluate a smartphone app that delivered real-time advice about sun protection, such as alerts to apply or reapply sunscreen or wear a hat. Only 1 out of 7 sun-safety practices was used more frequently by intervention versus control participants. The authors of an evidence review of the effectiveness of mobile phone apps in achieving health-related behavior change note that adequately powered and relatively longer RCTs are needed to better determine the effectiveness of app-based interventions [5].
Applications for Clinical Practice
Warnings on the dangers of sunburn and indoor tanning at any age should be emphasized, and there is an important role for primary care physician and other clinician counseling as well as public health outreach. Phone apps have the benefit of being able to reach large numbers at low cost and can offer an interactive and personalized health education experience. Such nontraditional strategies offer promise. Further studies should shed light on what app features are most important to users and whether their deployment can have a measurable impact on cancer prevention.
1. Saraiya M, Glanz K, Briss PA, et al. Interventions to prevent skin cancer by reducing exposure to ultraviolet radiation: a systematic review. Am J Prev Med 2004;27:422–66.
2. Demko CA, Borawski EA, Debanne SM, et al. Use of indoor tanning facilities by white adolescents in the United States. Arch Pediatr Adolesc Med 2003;157:854–60.
3. Görig T, Diehl K, Greinert R, et al. Prevalence of sun-protective behaviour and intentional sun tanning in German adolescents and adults: results of a nationwide telephone survey.
J Eur Acad Dermatol Venereol 2017 Jun 2.
4. Blattner CM, Lal K, Murase JE. Non-traditional melanoma prevention strategies in the young adult and adolescent population. Dermatol Pract Concept 2014;4:73–4.
5. Zhao J, Freeman B, Li M. Can mobile phone apps influence people’s health behavior change? an evidence review. J Med Internet Res 2016;18:e287.
6. Buller DB, Berwick M, Lantz K, Buller MK, Shane J, Kane I, Liu X. Evaluation of immediate and 12-week effects of a smartphone sun-safety mobile application: a randomized clinical trial. JAMA Dermatol 2015;151:505–12.
Study Overview
Objective. To develop and test a photoaging app designed for melanoma prevention through enhancing sun protective behaviors.
Design. Cross-sectional pilot study.
Setting and participants. 25 students (56% male) with a median age of 22 years (range 19–25) attending the University of Essen in Germany.
Intervention. The researchers tested a free mobile app called Sunface. The app has the user take a self-portrait (selfie) and then photoages the image based on self-reported Fitzpatrick skin type and individual UV protection behavior. The 6 categories of skin on the Fitzpatrick Scale are Type I – always burns, never tans; Type II – usually burns, tans minimally; Type III – sometimes mild burn, gradually tans; Type IV – rarely burns, tans with ease; Type V – very rarely burns, tans very easily; Type VI – never burns, tans very easily. Afterward, the app explains the results and provides recommendations on sun protection as well as the ABCDE rule for skin cancer detection (asymmetrical shape, border, color, diameter, evolution). An interviewer walked up to each student, asked for oral consent, handed them an iPod Touch with the app pre-installed, and let them use the app.
Main outcome measures. Student attitudes about the app as collected on an anonymous paper and pencil questionnaire. Items were statements (see Results below), and responses were on a Likert scale ranging from fully agree to fully disagree.
Results. The majority of students (82%) stated that they would download the app, that the intervention had the potential to motivate them to use sun protection (92%) and that they thought such an app could change their perceptions that tanning makes you attractive (76%). Only a minority of students disagreed or fully disagreed that they would download such an app (2/25, 8%) or that such an app could change their perceptions on tanning and attractiveness (4/25, 16%).
Conclusion. Based on previous studies and the initial study results presented here, it is reasonable to speculate that the app may induce behavioral change in the target population. Further work is required to implement and examine the effectiveness of app-based photoaging interventions within risk groups from various cultural backgrounds.
Commentary
The relationship between skin cancer and ultraviolet radiation is well established [1]. Despite the known risks, tanning behavior, including use of tanning beds, is common. Indoor tanning is prevalent, particularly among female adolescents, and aligns with other risk behaviors, appearance-related factors, and intentional sunbathing [2]. Behaviors such as seeking shade, avoiding sun exposure during peak hours of radiation, wearing protective clothing, or some combination of these behaviors can provide protection against ultraviolet radiation [1].Significantly lower frequencies of almost all recommended sun-protective measures are found in younger patient subgroups (age 14 to 25 years) [3]. Thus, it makes sense to target interventions at the adolescent age-group.
Counseling adolescents regarding the dangers of tanning can be difficult due to the pressure the media places on young women and men to enhance their appearance. As a result, appeals to the negative cosmetic impact of sun and indoor tanning may be more effective than health-based appeals [4].
In this pilot study, the authors tested a creative sun protection app that photoages the user’s image based on skin type and aging algorithms. The underlying aging algorithms are based on publications showing UV-induced skin damage by outdoor as well as indoor tanning. Afterward, the app explains the visual results and aims at increasing self-competence on skin cancer prevention by providing guideline recommendations on sun protection and the ABCDE rule for melanoma self-detection. The app was very well received by the partipating college students, and the researchers concluded that the app may aid in the prevention of melanoma by enhancing the adoption of sun protective behaviors. However, this study was very small.
Mobile phone apps are proliferating and they are recognized as a potential low cost way to deliver health interventions [5]. A previous trial by Buller [6] used a randomized controlled design to evaluate a smartphone app that delivered real-time advice about sun protection, such as alerts to apply or reapply sunscreen or wear a hat. Only 1 out of 7 sun-safety practices was used more frequently by intervention versus control participants. The authors of an evidence review of the effectiveness of mobile phone apps in achieving health-related behavior change note that adequately powered and relatively longer RCTs are needed to better determine the effectiveness of app-based interventions [5].
Applications for Clinical Practice
Warnings on the dangers of sunburn and indoor tanning at any age should be emphasized, and there is an important role for primary care physician and other clinician counseling as well as public health outreach. Phone apps have the benefit of being able to reach large numbers at low cost and can offer an interactive and personalized health education experience. Such nontraditional strategies offer promise. Further studies should shed light on what app features are most important to users and whether their deployment can have a measurable impact on cancer prevention.
1. Saraiya M, Glanz K, Briss PA, et al. Interventions to prevent skin cancer by reducing exposure to ultraviolet radiation: a systematic review. Am J Prev Med 2004;27:422–66.
2. Demko CA, Borawski EA, Debanne SM, et al. Use of indoor tanning facilities by white adolescents in the United States. Arch Pediatr Adolesc Med 2003;157:854–60.
3. Görig T, Diehl K, Greinert R, et al. Prevalence of sun-protective behaviour and intentional sun tanning in German adolescents and adults: results of a nationwide telephone survey.
J Eur Acad Dermatol Venereol 2017 Jun 2.
4. Blattner CM, Lal K, Murase JE. Non-traditional melanoma prevention strategies in the young adult and adolescent population. Dermatol Pract Concept 2014;4:73–4.
5. Zhao J, Freeman B, Li M. Can mobile phone apps influence people’s health behavior change? an evidence review. J Med Internet Res 2016;18:e287.
6. Buller DB, Berwick M, Lantz K, Buller MK, Shane J, Kane I, Liu X. Evaluation of immediate and 12-week effects of a smartphone sun-safety mobile application: a randomized clinical trial. JAMA Dermatol 2015;151:505–12.
On the Move: Group Exercise Program Targeting Timing and Coordination Improves Mobility in Community-Dwelling Adults
Study Overview
Objective. To compare the effectiveness of a group exercise program focusing on the timing and coordination of movement (ie, On the Move [OTM]) with a seated strength, endurance, and flexibility program (usual care) at improving function, disability, and walking ability in older adults.
Design. Cross-sectional pilot study.
Setting and participants. Participants were community-dwelling older adults who were residents or members of 32 independent living facilities, senior apartment buildings, and community centers in the greater Pittsburgh, Pennsylvania, area. Participants were recruted between April 2012 and January 2014. Inclusion criteria included age 65 years or older, ability to walk independently with a gait speed of at least 0.60 m/s, and ability to follow 2-step commands. Individuals were excluded if they were non-English speaking, medically unstable, planning to leave the area for an extended time period, or had abnormal blood pressure or heart rate following a 6-minute walk test. The 32 participating facilities were randomly assigned to the OTM intervention (16 sites, 152 participants) or usual care (16 sites, 146 participants). The OTM and usual care exercise programs had the same frequency and duration (50 minutes per session, twice weekly for 12 weeks), and all exercise sessions were held on site at the facilities. The usual care program was a strength, flexibility, and endurance program based on programs that were being conducted in the participating facilities. It included a warm-up (range-of-motion exercises and stretching), upper and lower extremity strength exercises, aerobic activities, and a cool-down and was conducted with the participants sitting.
Intervention. The OTM program consisted of warm-up, timing and coordination (stepping and walking patterns), strengthening, and cool down exercises, with most of the exercises conducted in a standing position (40 minutes) and the remainder (10 minutes) sitting. The stepping and walking patterns were designed to promote the timing and coordination of stepping, integrated with the phases of the gait pattern.
Main Results. The average participant age was 80.0 (SD, 8.1) years, most participants were female (84.2%) and white (83.65%), and the average number of chronic conditions was 2.8 (SD, 1.4). The 2 groups were similar except for small differences in facility type. 142 (93.4%) OTM participants and 139 (95.2%) usual care participants completed post-intervention testing. The OTM group had significantly greater mean (SD) improvements than the usual care group in gait speed (0.05 [0.13] m/s versus −0.01 [0.11] m/s; adjusted difference 0.05 [0.02] m/s; P = 0.002) and 6MWD (20.6 [57.1] m versus 4.1 [55.6] m; adjusted difference = 16.7 [7.4] m; P = 0.03). Class attendance was lower in the OTM group than in the usual care group (76 [50.0%] OTM participants versus 95 [65.1%] usual care participants attended at least 20 classes; P = 0.03). There were no other significant differences between the groups in primary or secondary outcomes.
Conclusion. The OTM intervention was more effective at improving mobility than a usual care exercise program.
Commentary
The ability to walk is fundamental to maintaining a high quality of life and living independently in the community. Walking difficulty is a common problem among older persons and is linked to higher rates of loss of independence, morbidity, disability, and mortality in this population [1,2]. Walking difficulty associated with aging is often reflected in reduced gait speed and walking distance. A decline in gait speed of as little as 1 m/s is associated with a 10% decrease in ability to perform activities of daily living [3,4].
According to the authors, previous studies that explored the impact of structured exercise programs on walking ability in older individuals have had mixed results. These studies typically used exercise interventions focused on improving lower extremity muscle strength, flexibility, and general conditioning. In this study, the authors examined a community-based group exercise program (OTM) that incorporated exercises targeting the timing and coordination of movement important for walking in addition to flexibility and strengthening exercises. The results showed that the OTM program was more effective at improving walking ability than usual care. This intervention produced changes in gait speed (0.5 m/s) and 6MWD (16.7 m) that met or nearly met the clinically meaningful change criteria established for research use (0.5 m/s and 20 m, respectively) [5].
The authors pointed out several strengths of this study. First, the OTM program was compared to a usual care exercise program taught by trained exercise professionals, making it more difficult to demonstrate a difference between the 2 interventions. Similar prior studies have used nonexercise controls as the comparator. In addition, the effectiveness of the OTM program was demonstrated in 3 different community settings, suggesting that it can be implemented in various settings. Finally, the study participants were frail, older-old adults, who typically are not included in exercise studies. An important limitation of this study is that because outcomes were measured only at the conclusion of the intervention, it is not known whether the walking improvements persist over time or what effects the intervention has on mobility, function, and disability over the long term.
Applications for Clinical Practice
This study adds to the current literature on group exercise programs for improving mobility among community-dwelling older adults and supports incorporation of timing and coordination exercises into such programs. As the authors note, however, follow-up studies exploring the impact of the OTM intervention on long-term disability outcomes are needed before routine implementation in clinical practice can be recommended.
—Ajay Dharod, MD, Wake Forest School of Medicine, Winston-Salem, NC
1. Khokhar SR, Stern Y, Bell K, et al. Persistent mobility deficit in the absence of deficits in activities of daily living: a risk factor for mortality. J Am Geriatr Soc 2001;49:1539–43.
2. Newman AB, Simonsick EM, Naydeck EM, et al. Association of long-distance corridor walk performance with mortality, cardiovascular disease, mobility limitation, and disability. JAMA 2006;295:2018–26.
3. Hortobagyi T, Lesinski M, Gabler M, et al. Effects of three types of exercise interventions on healthy old adults’ gait speed: a systematic review and meta-analysis. Sports Med 2015;
45:1627–43.
4. Judge JO, Schechtman K, Cress E. The relationship between physical performance measures and independence in instrumental activities of daily living. The FICSIT Group. Frailty and Injury: Cooperative Studies of Intervention Trials. J Am Geriatr Soc 1996;44:1332–41.
5. Perera S, Mody SH, Woodman RC, Studenski SA. Meaningful change and responsiveness in common physical performance measures in older adults. J Am Geriatr Soc 2006;54:743–9.
Study Overview
Objective. To compare the effectiveness of a group exercise program focusing on the timing and coordination of movement (ie, On the Move [OTM]) with a seated strength, endurance, and flexibility program (usual care) at improving function, disability, and walking ability in older adults.
Design. Cross-sectional pilot study.
Setting and participants. Participants were community-dwelling older adults who were residents or members of 32 independent living facilities, senior apartment buildings, and community centers in the greater Pittsburgh, Pennsylvania, area. Participants were recruted between April 2012 and January 2014. Inclusion criteria included age 65 years or older, ability to walk independently with a gait speed of at least 0.60 m/s, and ability to follow 2-step commands. Individuals were excluded if they were non-English speaking, medically unstable, planning to leave the area for an extended time period, or had abnormal blood pressure or heart rate following a 6-minute walk test. The 32 participating facilities were randomly assigned to the OTM intervention (16 sites, 152 participants) or usual care (16 sites, 146 participants). The OTM and usual care exercise programs had the same frequency and duration (50 minutes per session, twice weekly for 12 weeks), and all exercise sessions were held on site at the facilities. The usual care program was a strength, flexibility, and endurance program based on programs that were being conducted in the participating facilities. It included a warm-up (range-of-motion exercises and stretching), upper and lower extremity strength exercises, aerobic activities, and a cool-down and was conducted with the participants sitting.
Intervention. The OTM program consisted of warm-up, timing and coordination (stepping and walking patterns), strengthening, and cool down exercises, with most of the exercises conducted in a standing position (40 minutes) and the remainder (10 minutes) sitting. The stepping and walking patterns were designed to promote the timing and coordination of stepping, integrated with the phases of the gait pattern.
Main Results. The average participant age was 80.0 (SD, 8.1) years, most participants were female (84.2%) and white (83.65%), and the average number of chronic conditions was 2.8 (SD, 1.4). The 2 groups were similar except for small differences in facility type. 142 (93.4%) OTM participants and 139 (95.2%) usual care participants completed post-intervention testing. The OTM group had significantly greater mean (SD) improvements than the usual care group in gait speed (0.05 [0.13] m/s versus −0.01 [0.11] m/s; adjusted difference 0.05 [0.02] m/s; P = 0.002) and 6MWD (20.6 [57.1] m versus 4.1 [55.6] m; adjusted difference = 16.7 [7.4] m; P = 0.03). Class attendance was lower in the OTM group than in the usual care group (76 [50.0%] OTM participants versus 95 [65.1%] usual care participants attended at least 20 classes; P = 0.03). There were no other significant differences between the groups in primary or secondary outcomes.
Conclusion. The OTM intervention was more effective at improving mobility than a usual care exercise program.
Commentary
The ability to walk is fundamental to maintaining a high quality of life and living independently in the community. Walking difficulty is a common problem among older persons and is linked to higher rates of loss of independence, morbidity, disability, and mortality in this population [1,2]. Walking difficulty associated with aging is often reflected in reduced gait speed and walking distance. A decline in gait speed of as little as 1 m/s is associated with a 10% decrease in ability to perform activities of daily living [3,4].
According to the authors, previous studies that explored the impact of structured exercise programs on walking ability in older individuals have had mixed results. These studies typically used exercise interventions focused on improving lower extremity muscle strength, flexibility, and general conditioning. In this study, the authors examined a community-based group exercise program (OTM) that incorporated exercises targeting the timing and coordination of movement important for walking in addition to flexibility and strengthening exercises. The results showed that the OTM program was more effective at improving walking ability than usual care. This intervention produced changes in gait speed (0.5 m/s) and 6MWD (16.7 m) that met or nearly met the clinically meaningful change criteria established for research use (0.5 m/s and 20 m, respectively) [5].
The authors pointed out several strengths of this study. First, the OTM program was compared to a usual care exercise program taught by trained exercise professionals, making it more difficult to demonstrate a difference between the 2 interventions. Similar prior studies have used nonexercise controls as the comparator. In addition, the effectiveness of the OTM program was demonstrated in 3 different community settings, suggesting that it can be implemented in various settings. Finally, the study participants were frail, older-old adults, who typically are not included in exercise studies. An important limitation of this study is that because outcomes were measured only at the conclusion of the intervention, it is not known whether the walking improvements persist over time or what effects the intervention has on mobility, function, and disability over the long term.
Applications for Clinical Practice
This study adds to the current literature on group exercise programs for improving mobility among community-dwelling older adults and supports incorporation of timing and coordination exercises into such programs. As the authors note, however, follow-up studies exploring the impact of the OTM intervention on long-term disability outcomes are needed before routine implementation in clinical practice can be recommended.
—Ajay Dharod, MD, Wake Forest School of Medicine, Winston-Salem, NC
1. Khokhar SR, Stern Y, Bell K, et al. Persistent mobility deficit in the absence of deficits in activities of daily living: a risk factor for mortality. J Am Geriatr Soc 2001;49:1539–43.
2. Newman AB, Simonsick EM, Naydeck EM, et al. Association of long-distance corridor walk performance with mortality, cardiovascular disease, mobility limitation, and disability. JAMA 2006;295:2018–26.
3. Hortobagyi T, Lesinski M, Gabler M, et al. Effects of three types of exercise interventions on healthy old adults’ gait speed: a systematic review and meta-analysis. Sports Med 2015;
45:1627–43.
4. Judge JO, Schechtman K, Cress E. The relationship between physical performance measures and independence in instrumental activities of daily living. The FICSIT Group. Frailty and Injury: Cooperative Studies of Intervention Trials. J Am Geriatr Soc 1996;44:1332–41.
5. Perera S, Mody SH, Woodman RC, Studenski SA. Meaningful change and responsiveness in common physical performance measures in older adults. J Am Geriatr Soc 2006;54:743–9.
A Comprehensive Multidisciplinary Addiction Consultation Program for Hospitalized Patients with Substance Abuse Disorder
Study Overview
Objective. To evaluate the impact of addiction consultation during hospitalization on addiction severity and self-reported abstinence at 30 days post discharge.
Design. Prospective quasi-experimental study.
Setting and participants. 399 adults admitted to an urban academic medical center between 1 April 2015 and 1 April 2016 who screened as high risk for having an alcohol or drug use disorder (using the Alcohol Use Disorders Identification Test–Consumption and the National Institute on Drug Abuse single-question screen for drug use) or who were clinically identified by the primary nurse as having a substance use disorder. Pregnant patients, those who were unable to be interviewed due to medical reasons, and those who screened solely for marijuana use were excluded.
Intervention. The intervention was a multidisciplinary addiction consult team (ACT) comprising a psychiatrist, an internist with addiction expertise, advanced practice nurses, 3 social workers, a clinical pharmacist, a recovery coach, and a resource specialist. The ACT provided patients with a diagnosis and longitudinal management plan begun in the hospital including pharmacotherapy initiation when appropriate, motivational counseling, treatment planning, and direct linkage to ongoing addiction treatment upon discharge. The ACT was available to patients on 12 of the hospital’s 14 floors. Patients on the 2 floors where ACT was not implemented and patients who were eligible for inpatient addiction consults but did nor receive them served as controls. Control patients received access to a general psychiatry consult liaison team and floor social work, and management of control patients included withdrawal treatment and referral to outpatient addiction care.
Main outcome measures. The primary outcomes were change in Addiction Severity Index (ASI) composite score for alcohol and drug use and self-reported abstinence at 30 days post discharge compared to baseline. The ASI is a standardized instrument for assessing the severity of problems for patients with substance use disorder. Participants were assessed at enrollment (baseline) and at 30 and 90 days post discharge.
Main results. 256 patients received the intervention and 143 did not (control). Of the 399 participants, 265 completed the 30-day assessment, which showed that patients in the intervention group (n = 165) had a greater reduction in the ASI composite score for alcohol and drug use than patients in the control group (n = 100), with mean ASI-alcohol and ASI-drug decreases of 0.24 (vs 0.08, P < 0.001) and 0.05 (vs 0.02, P = 0.003), respectively. The intervention group also had a greater increase in number of days of abstinence than the control group (12.7 days vs 5.6 days, P < 0.001). These differences all remained statistically significant after controlling for age, gender, employment status, smoking status, and baseline addiction severity. The increase in abstinence days and reduction in alcohol use severity remained significantly greater in the intervention group 90 days after discharge.
Conclusion. Inpatient addiction consultation reduced alcohol and drug addiction severity and increased the number of days of abstinence in the 30 days following discharge.
Commentary
In the United States, national mortality rates due to unintentional overdose, driven largely by opioid misuse and abuse, have surpassed mortality due to HIV and motor vehicle accidents [1]. Individuals with substance use disorder frequently use hospital services for management of acute problems, and up to 1 in 7 hospitalized patients has an active substance use disorder [2]. Hospitalization thus provides an opportunity to engage these patients in addiction treatment. Evidence supports the use of several interventions for patients with substance use disorders in the general medical setting [2–5], but implementation of these interventions in clinical practice remains limited.
This study adds to the literature demonstrating the efficacy of hospital-based interventions for substance abuse disorders. The authors note that the ACT intervention combined pharmacotherapy and behavioral interventions that were shown in prior studies to improve treatment retention, decrease substance use, and reduce hospital readmission. In addition to reducing alcohol/drug addiction severity and increasing days of abstinence at 1 month follow-up, the ACT intervention also reduced the number of self-reported hospital and emergency department visits by treated patients for substance use issues. The effects of the intervention on abstinence days and alcohol use severity were still evident after 3 months, suggesting that similar interventions can have benefits over the long term.
The authors highlighted several limitations of this study, including lack of randomization, which led to differences between the 2 groups on several variables. They controlled for these differences in their analysis, but there is still the potential for confounding. Also, the outcomes data was gathered through patient self-reporting without biological confirmation; however, as the authors note, this approach is widely used and self-report of substance use has shown good agreement with biological measures.
Applications for Clinical Practice
Hospitalization represents an opportunity to engage persons with substance abuse disorders in addiction treatment. This study demonstrates the effectiveness of a comprehensive inpatient substance use disorder intervention in improving substance-use–related outcomes in the first month after discharge. Further study of similar interventions in other care settings and for a longer duration is warranted.
—Ajay Dharod, MD, Wake Forest School of Medicine
Winston-Salem, NC
1. Voon P, Karamouzian M, Kerr T. Chronic pain and opioid misuse: a review of reviews. Subst Abuse Treat Prev Policy 2017;12:36.
2. Trowbridge P, Weinstein ZM, Roy P, et al. Addiction consultation services - Linking hospitalized patients to outpatient addiction treatment. J Subst Abuse Treat 2017;79:1–5.
3. Shanahan CW, Beers D, Alford DP, et al. A transitional opioid program to engage hospitalized drug users. J Gen Intern Med 2010;25:803–8.
4. McQueen J, Howe TE, Allan L, et al. Brief interventions for heavy alcohol users admitted to general hospital wards.Cochrane Database Syst Rev 2011;(8):CD005191.
5. Wei J, Defries T, Lozada M, et al. An inpatient treatment and discharge planning protocol for alcohol dependence: efficacy in reducing 30-day readmissions and emergency department visits. J Gen Intern Med 2015;30:365–70.
Study Overview
Objective. To evaluate the impact of addiction consultation during hospitalization on addiction severity and self-reported abstinence at 30 days post discharge.
Design. Prospective quasi-experimental study.
Setting and participants. 399 adults admitted to an urban academic medical center between 1 April 2015 and 1 April 2016 who screened as high risk for having an alcohol or drug use disorder (using the Alcohol Use Disorders Identification Test–Consumption and the National Institute on Drug Abuse single-question screen for drug use) or who were clinically identified by the primary nurse as having a substance use disorder. Pregnant patients, those who were unable to be interviewed due to medical reasons, and those who screened solely for marijuana use were excluded.
Intervention. The intervention was a multidisciplinary addiction consult team (ACT) comprising a psychiatrist, an internist with addiction expertise, advanced practice nurses, 3 social workers, a clinical pharmacist, a recovery coach, and a resource specialist. The ACT provided patients with a diagnosis and longitudinal management plan begun in the hospital including pharmacotherapy initiation when appropriate, motivational counseling, treatment planning, and direct linkage to ongoing addiction treatment upon discharge. The ACT was available to patients on 12 of the hospital’s 14 floors. Patients on the 2 floors where ACT was not implemented and patients who were eligible for inpatient addiction consults but did nor receive them served as controls. Control patients received access to a general psychiatry consult liaison team and floor social work, and management of control patients included withdrawal treatment and referral to outpatient addiction care.
Main outcome measures. The primary outcomes were change in Addiction Severity Index (ASI) composite score for alcohol and drug use and self-reported abstinence at 30 days post discharge compared to baseline. The ASI is a standardized instrument for assessing the severity of problems for patients with substance use disorder. Participants were assessed at enrollment (baseline) and at 30 and 90 days post discharge.
Main results. 256 patients received the intervention and 143 did not (control). Of the 399 participants, 265 completed the 30-day assessment, which showed that patients in the intervention group (n = 165) had a greater reduction in the ASI composite score for alcohol and drug use than patients in the control group (n = 100), with mean ASI-alcohol and ASI-drug decreases of 0.24 (vs 0.08, P < 0.001) and 0.05 (vs 0.02, P = 0.003), respectively. The intervention group also had a greater increase in number of days of abstinence than the control group (12.7 days vs 5.6 days, P < 0.001). These differences all remained statistically significant after controlling for age, gender, employment status, smoking status, and baseline addiction severity. The increase in abstinence days and reduction in alcohol use severity remained significantly greater in the intervention group 90 days after discharge.
Conclusion. Inpatient addiction consultation reduced alcohol and drug addiction severity and increased the number of days of abstinence in the 30 days following discharge.
Commentary
In the United States, national mortality rates due to unintentional overdose, driven largely by opioid misuse and abuse, have surpassed mortality due to HIV and motor vehicle accidents [1]. Individuals with substance use disorder frequently use hospital services for management of acute problems, and up to 1 in 7 hospitalized patients has an active substance use disorder [2]. Hospitalization thus provides an opportunity to engage these patients in addiction treatment. Evidence supports the use of several interventions for patients with substance use disorders in the general medical setting [2–5], but implementation of these interventions in clinical practice remains limited.
This study adds to the literature demonstrating the efficacy of hospital-based interventions for substance abuse disorders. The authors note that the ACT intervention combined pharmacotherapy and behavioral interventions that were shown in prior studies to improve treatment retention, decrease substance use, and reduce hospital readmission. In addition to reducing alcohol/drug addiction severity and increasing days of abstinence at 1 month follow-up, the ACT intervention also reduced the number of self-reported hospital and emergency department visits by treated patients for substance use issues. The effects of the intervention on abstinence days and alcohol use severity were still evident after 3 months, suggesting that similar interventions can have benefits over the long term.
The authors highlighted several limitations of this study, including lack of randomization, which led to differences between the 2 groups on several variables. They controlled for these differences in their analysis, but there is still the potential for confounding. Also, the outcomes data was gathered through patient self-reporting without biological confirmation; however, as the authors note, this approach is widely used and self-report of substance use has shown good agreement with biological measures.
Applications for Clinical Practice
Hospitalization represents an opportunity to engage persons with substance abuse disorders in addiction treatment. This study demonstrates the effectiveness of a comprehensive inpatient substance use disorder intervention in improving substance-use–related outcomes in the first month after discharge. Further study of similar interventions in other care settings and for a longer duration is warranted.
—Ajay Dharod, MD, Wake Forest School of Medicine
Winston-Salem, NC
1. Voon P, Karamouzian M, Kerr T. Chronic pain and opioid misuse: a review of reviews. Subst Abuse Treat Prev Policy 2017;12:36.
2. Trowbridge P, Weinstein ZM, Roy P, et al. Addiction consultation services - Linking hospitalized patients to outpatient addiction treatment. J Subst Abuse Treat 2017;79:1–5.
3. Shanahan CW, Beers D, Alford DP, et al. A transitional opioid program to engage hospitalized drug users. J Gen Intern Med 2010;25:803–8.
4. McQueen J, Howe TE, Allan L, et al. Brief interventions for heavy alcohol users admitted to general hospital wards.Cochrane Database Syst Rev 2011;(8):CD005191.
5. Wei J, Defries T, Lozada M, et al. An inpatient treatment and discharge planning protocol for alcohol dependence: efficacy in reducing 30-day readmissions and emergency department visits. J Gen Intern Med 2015;30:365–70.
A Longitudinal Study of Transfusion Utilization in Hospitalized Veterans
Abstract
- Background: Although transfusion guidelines have changed considerably over the past 2 decades, the adoption of patient blood management programs has not been fully realized across hospitals in the United States.
- Objective: To evaluate trends in red blood cell (RBC), platelet, and plasma transfusion at 3 Veterans Health Administration (VHA) hospitals from 2000 through 2010.
- Methods: Data from all hospitalizations were collected from January 2000 through December 2010. Blood bank data (including the type and volume of products administered) were available electronically from each hospital. These files were linked to inpatient data, which included ICD-9-CM diagnoses (principal and secondary) and procedures during hospitalization. Statistical analyses were conducted using generalized linear models to evaluate trends over time. The unit of observation was hospitalization, with categorization by type.
- Results: There were 176,521 hospitalizations in 69,621 patients; of these, 13.6% of hospitalizations involved transfusion of blood products (12.7% RBCs, 1.4% platelets, 3.0% plasma). Transfusion occurred in 25.2% of surgical and 5.3% of medical hospitalizations. Transfusion use peaked in 2002 for surgical hospitalizations and declined afterwards (P < 0.001). There was no significant change in transfusion use over time (P = 0.126) for medical hospitalizations. In hospitalizations that involved transfusions, there was a 20.3% reduction in the proportion of hospitalizations in which ≥ 3 units of RBCs were given (from 51.7% to 41.1%; P < 0.001) and a 73.6% increase when 1 RBC unit was given (from 8.0% to 13.8%; P < 0.001) from 2000-2010. Of the hospitalizations with RBC transfusion, 9.6% involved the use of 1 unit over the entire study period. The most common principal diagnoses for medical patients receiving transfusion were anemia, malignancy, heart failure, pneumonia and renal failure. Over time, transfusion utilization increased in patients who were admitted for infection (P = 0.009).
- Conclusion: Blood transfusions in 3 VHA hospitals have decreased over time for surgical patients but remained the same for medical patients. Further study examining appropriateness of blood products in medical patients appears necessary.
Key words: Transfusion; red blood cells; plasma; platelets; veterans.
Transfusion practices during hospitalization have changed considerably over the past 2 decades. Guided by evidence from randomized controlled trials, patient blood management programs have been expanded [1]. Such programs include recommendations regarding minimization of blood loss during surgery, prevention and treatment of anemia, strategies for reducing transfusions in both medical and surgical patients, improved blood utilization, education of health professionals, and standardization of blood management-related metrics [2]. Some of the guidelines have been incorporated into the Choosing Wisely initiative of the American Board of Internal Medicine Foundation, including: (a) don’t transfuse more units of blood than absolutely necessary, (b) don’t transfuse red blood cells for iron deficiency without hemodynamic instability, (c) don’t routinely use blood products to reverse warfarin, and (d) don’t perform serial blood counts on clinically stable patients [3]. Although there has been growing interest in blood management, only 37.8% of the 607 AABB (formerly, American Association of Blood Banks) facilities in the United States reported having a patient blood management program in 2013 [2].
While the importance of blood safety is recognized, data regarding the overall trends in practices are conflicting. A study using the Nationwide Inpatient Sample indicated that there was a 5.6% annual mean increase in the transfusion of blood products from 2002 to 2011 in the United States [4]. This contrasts with the experience of Kaiser Permanente in Northern California, in which the incidence of RBC transfusion decreased by 3.2% from 2009 to 2013 [5]. A decline in rates of intraoperative transfusion was also reported among elderly veterans in the United States from 1997 to 2009 [6].
We conducted a study in hospitalized veterans with 2 main objectives: (a) to evaluate trends in utilization of red blood cells (RBCs), platelets, and plasma over time, and (b) to identify those groups of veterans who received specific blood products. We were particularly interested in transfusion use in medical patients.
Methods
Participants were hospitalized veterans at 3 Department of Veterans Affairs (VA) medical centers. Data from all hospitalizations were collected from January 2000 through December 2010. Blood bank data (including the type and volume of products administered) were available electronically from each hospital. These files were linked to inpatient data, which included ICD-9-CM diagnoses (principal and secondary) and procedures during hospitalization.
Statistical analyses were conducted using generalized linear models to evaluate trends over time. The unit of observation was hospitalization, with categorization by type. Surgical hospitalizations were defined as admissions in which any surgical procedure occurred, whereas medical hospitalizations were defined as admissions without any surgery. Alpha was set at 0.05, 2-tailed. All analyses were conducted in Stata/MP 14.1 (StataCorp, College Station, TX). The study received institutional review board approval from the VA Ann Arbor Healthcare System.
Results
From 2000 through 2010, there were 176,521 hospitalizations in 69,621 patients. Within this cohort, 6% were < 40 years of age, 66% were 40 to 69 years of age, and 28% were 70 years or older at the time of admission. In this cohort, 96% of patients were male. Overall, 13.6% of all hospitalizations involved transfusion of a blood product (12.7% RBCs, 1.4% platelets, 3.0% plasma).
Transfusion occurred in 25.2% of surgical hospitalizations and 5.3% of medical hospitalizations. For surgical hospitalizations, transfusion use peaked in 2002 (when 30.9% of the surgical hospitalizations involved a trans-fusion) and significantly declined afterwards (P < 0.001). By 2010, 22.5% of the surgical hospitalizations involved a transfusion. Most of the surgeries where blood products were transfused involved cardiovascular procedures. For medical hospitalizations only, there was no significant change in transfusion use over time, either from 2000 to 2010 (P = 0.126) or from 2002 to 2010 (P = 0.072). In 2010, 5.2% of the medical hospitalizations involved a transfusion.
Rates of transfusion varied by principal diagnosis (Figure 1). For patients admitted with a principal diagnosis of infection (n = 20,981 hospitalizations), there was an increase in the percentage of hospitalizations in which transfusions (RBCs, platelet, plasma) were administered over time (P = 0.009) (Figure 1). For patients admitted with a principal diagnosis of malignancy (n = 12,904 hospitalizations), cardiovascular disease (n = 40,324 hospitalizations), and other diagnoses (n = 102,312 hospitalizations), there were no significant linear trends over the entire study period (P = 0.191, P = 0.052, P = 0.314, respectively). Rather, blood utilization peaked in year 2002 and significantly declined afterwards for patients admitted for malignancy (P < 0.001) and for cardiovascular disease (P < 0.001).
The most common principal diagnoses for medical patients receiving any transfusion (RBCs, platelet, plasma) are listed in Table 1. For medical patients with a principal diagnosis of anemia, 88% of hospitalizations involved a transfusion (Table 1). Transfusion occurred in 6% to 11% of medical hospitalizations with malignancies, heart failure, pneumonia or renal failure (Table 1). A considerable proportion (43%) of medical patients with gastrointestinal hemorrhage received a transfusion.
![]()
![]()
9.6% (2154/22,344) involved the use of only 1 unit, 43.8% (9791/22,344) involved 2 units, and 46.5% (10,399/22,344) involved 3 or more units during the hospitalization. From 2000 through 2010, there was a 20.3% reduction in the proportion of hospitalizations in which 3 or more units of RBCs were given (from 51.7% to 41.1%; P < 0.001). That is, among those hospitalizations in which a RBC transfusion occurred, a smaller proportion of hospitalizations involved the administration of 3 or more units of RBCs from 2000 through 2010 (Figure 2). There was an 11.5% increase in the proportion of hospitalizations in which 2 units of RBCs were used (from 40.4% to 45.0%; P < 0.001). In addition, there was a 73.6% increase in the proportion of hospitalizations in which 1 RBC unit was given (from 8.0% to 13.8%;
P = 0.001).
![]()
16.8 mL/hospitalization in 2010. For plasma, the mean mL/hospitalization was 28.9 in year 2000, increased to 50.1 mL/hospitalization in year 2008, and declined, thereafter, to 35.1 mL/hospitalization in year 2010.
Discussion
![]()
We also observed secular trends in the volume of RBCs administered. There was an increase in the percentage of hospitalizations in which 1 or 2 RBC units were used and a decline in transfusion of 3 or more units. The reduction in the use of 3 or more RBC units may reflect the adoption and integration of recommendations in patient blood management by clinicians,
which encourage assessment of the patients’ symptoms in determining whether additional units are necessary [7]. Such guidelines also endorse the avoidance of routine
administration of 2 units of RBCs if 1 unit is sufficient [8]. We have previously shown that, after coronary artery bypass grafting, 2 RBC units doubled the risk of pneumonia [9]; additional analyses indicated that 1 or 2 units of RBCs were associated with increased postoperative morbidity [10]. In addition, our previous research indicated that the probability of infection increased considerably between 1 and 2 RBC units, with a more gradual increase beyond 2 units [11]. With this evidence in mind, some studies at single sites have reported that there was a dramatic decline from 2 RBC units before initiation of patient blood management programs to 1 unit after the programs were implemented [12,13].
![]()
Medical patients who received a transfusion were often admitted for reason of anemia, cancer, organ failure, or pneumonia. Some researchers are now reporting that blood use, at certain sites, is becoming more common in medical rather than surgical patients, which may be due to an expansion of patient blood management procedures in surgery [16]. There are a substantial number of patient blood management programs among surgical specialties and their adoption has expanded [17]. Although there are fewer patient blood management programs in the nonsurgical setting, some have been targeted to internal medicine physicians and specifically, to hospitalists [1,18]. For example, a toolkit from the Society of Hospital Medicine centers on anemia management and includes anemia assessment, treatment, evaluation of RBC transfusion risk, blood conservation, optimization of coagulation, and patient-centered decision-making [19]. Additionally, bundling of patient blood management strategies has been launched to help encourage a wider adoption of such programs [20].
While guidelines regarding use of RBCs are becoming increasingly recognized, recommendations for the use of platelets and plasma are hampered by the paucity of evidence from randomized controlled trials [21,22]. There is moderate-quality evidence for the use of platelets with therapy-induced hypoproliferative thrombocytopenia in hospitalized patients [21], but low quality evidence for other uses. Moreover, a recent review of plasma transfusion in bleeding patients found no randomized controlled trials on plasma use in hospitalized patients, although several trials were currently underway [22].
Our findings need to be considered in the context of the following limitations. The data were from 3 VA hospitals, so the results may not reflect patterns of usage at other hospitals. However, AABB reports that there has been a general decrease in transfusion of allogeneic whole blood and RBC units since 2008 at the AABB-affiliated sites in the United States [2]; this is similar to the pattern that we observed in surgical patients. In addition, we report an overall view of trends without having details regarding which specific factors influenced changes in transfusion during this 11-year period. It is possible that the severity of hospitalized patients may have changed with time which could have influenced decisions regarding the need for transfusion.
In conclusion, the use of blood products decreased in surgical patients since 2002 but remained the same in medical patients in this VA population. Transfusions increased over time for patients who were admitted to the hospital for reason of infection, but decreased since 2002 for those admitted for cardiovascular disease or cancer. The number of RBC units per hospitalization decreased over time. Additional surveillance is needed to determine whether recent evidence regarding blood management has been incorporated into clinical practice for medical patients, as we strive to deliver optimal care to our veterans.
Corresponding author: Mary A.M. Rogers, PhD, MS, Dept. of Internal Medicine, Univ. of Michigan, 016-422W NCRC, Ann Arbor, MI 48109-2800, maryroge@umich.edu.
Funding/support: Department of Veterans Affairs, Clinical Sciences Research & Development Service Merit Review Award (EPID-011-11S). The contents do not represent the views of the U.S. Department of Veterans Affairs or the U.S. Government.
Financial disclosures: None.
Author contributions: conception and design, MAMR, SS; analysis and interpretation of data, MAMR, JDB, DR, LK, SS; drafting of article, MAMR; critical revision of the article, MAMR, MTG, DR, LK, SS, VC; statistical expertise, MAMR, DR; obtaining of funding, MTG, SS, VC; administrative or technical support, MTG, LK, SS, VC; collection and assembly of data, JDB, LK.
1. Hohmuth B, Ozawa S, Ashton M, Melseth RL. Patient-centered blood management. J Hosp Med 2014;9:60–5.
2. Whitaker B, Rajbhandary S, Harris A. The 2013 AABB blood collection, utilization, and patient blood management survey report. United States Department of Health and Human Services, AABB; 2015.
3. Cassel CK, Guest JA. Choosing wisely: helping physicians and patients make smart decisions about their care. JAMA 2012;307:1801–2.
4. Pathak R, Bhatt VR, Karmacharya P, et al. Trends in blood-product transfusion among inpatients in the United States from 2002 to 2011: data from the nationwide inpatient sample. J Hosp Med 2014;9:800–1.
5. Roubinian NH, Escobar GJ, Liu V, et al. Trends in red blood cell transfusion and 30-day mortality among hospitalized patients. Transfusion 2014;54:2678–86.
6. Chen A, Trivedi AN, Jiang L, et al. Hospital blood transfusion patterns during major noncardiac surgery and surgical mortality. Medicine (Baltimore) 2015;94:e1342.
7. Carson JL, Guyatt G, Heddle NM, et al. Clinical practice guidelines from the AABB: Red blood cell transfusion thresholds and storage. JAMA 2016;316:2025–35.
8. Hicks LK, Bering H, Carson KR, et al. The ASH choosing wisely® campaign: five hematologic tests and treatments to question. Blood 2013;122:3879–83.
9. Likosky DS, Paone G, Zhang M, et al. Red blood cell transfusions impact pneumonia rates after coronary artery bypass grafting. Ann Thorac Surg 2015;100:794–801.
10. Paone G, Likosky DS, Brewer R, et al. Transfusion of 1 and 2 units of red blood cells is associated with increased morbidity and mortality. Ann Thorac Surg 2014;97:87–93; discussion 93–4.
11. Rogers MAM, Blumberg N, Heal JM, et al. Role of transfusion in the development of urinary tract–related bloodstream infection. Arch Intern Med 2011;171:1587–9.
12. Oliver JC, Griffin RL, Hannon T, Marques MB. The success of our patient blood management program depended on an institution-wide change in transfusion practices. Transfusion 2014;54:2617–24.
13. Yerrabothala S, Desrosiers KP, Szczepiorkowski ZM, Dunbar NM. Significant reduction in red blood cell transfusions in a general hospital after successful implementation of a restrictive transfusion policy supported by prospective computerized order auditing. Transfusion 2014;54:2640–5.
14. Rehm JP, Otto PS, West WW, et al. Hospital-wide educational program decreases red blood cell transfusions. J Surg Res 1998;75:183–6.
15. Lawler EV, Bradbury BD, Fonda JR, et al. Transfusion burden among patients with chronic kidney disease and anemia. Clin J Am Soc Nephrol 2010;5:667–72.
16. Tinegate H, Pendry K, Murphy M, et al. Where do all the red blood cells (RBCs) go? Results of a survey of RBC use in England and North Wales in 2014. Transfusion 2016;56:139–45.
17. Meybohm P, Herrmann E, Steinbicker AU, et al. Patient blood management is associated with a substantial reduction of red blood cell utilization and safe for patient’s outcome: a prospective, multicenter cohort study with a noninferiority design. Ann Surg 2016;264:203–11.
18. Corwin HL, Theus JW, Cargile CS, Lang NP. Red blood cell transfusion: impact of an education program and a clinical guideline on transfusion practice. J Hosp Med 2014;9:745–9.
19. Society of Hospital Medicine. Anemia prevention and management program implementation toolkit. Accessed at www.hospitalmedicine.org/Web/Quality___Innovation/Implementation_Toolkit/Anemia/anemia_overview.aspx on 9 June 2017.
20. Meybohm P, Richards T, Isbister J, et al. Patient blood management bundles to facilitate implementation. Transfus Med Rev 2017;31:62–71.
21. Kaufman RM, Djulbegovic B, Gernsheimer T, et al. Platelet transfusion: a clinical practice guideline from the AABB. Ann Intern Med 2015;162:205–13.
22. Levy JH, Grottke O, Fries D, Kozek-Langenecker S. Therapeutic plasma transfusion in bleeding patients: A systematic review. Anesth Analg 2017;124:1268–76.
Abstract
- Background: Although transfusion guidelines have changed considerably over the past 2 decades, the adoption of patient blood management programs has not been fully realized across hospitals in the United States.
- Objective: To evaluate trends in red blood cell (RBC), platelet, and plasma transfusion at 3 Veterans Health Administration (VHA) hospitals from 2000 through 2010.
- Methods: Data from all hospitalizations were collected from January 2000 through December 2010. Blood bank data (including the type and volume of products administered) were available electronically from each hospital. These files were linked to inpatient data, which included ICD-9-CM diagnoses (principal and secondary) and procedures during hospitalization. Statistical analyses were conducted using generalized linear models to evaluate trends over time. The unit of observation was hospitalization, with categorization by type.
- Results: There were 176,521 hospitalizations in 69,621 patients; of these, 13.6% of hospitalizations involved transfusion of blood products (12.7% RBCs, 1.4% platelets, 3.0% plasma). Transfusion occurred in 25.2% of surgical and 5.3% of medical hospitalizations. Transfusion use peaked in 2002 for surgical hospitalizations and declined afterwards (P < 0.001). There was no significant change in transfusion use over time (P = 0.126) for medical hospitalizations. In hospitalizations that involved transfusions, there was a 20.3% reduction in the proportion of hospitalizations in which ≥ 3 units of RBCs were given (from 51.7% to 41.1%; P < 0.001) and a 73.6% increase when 1 RBC unit was given (from 8.0% to 13.8%; P < 0.001) from 2000-2010. Of the hospitalizations with RBC transfusion, 9.6% involved the use of 1 unit over the entire study period. The most common principal diagnoses for medical patients receiving transfusion were anemia, malignancy, heart failure, pneumonia and renal failure. Over time, transfusion utilization increased in patients who were admitted for infection (P = 0.009).
- Conclusion: Blood transfusions in 3 VHA hospitals have decreased over time for surgical patients but remained the same for medical patients. Further study examining appropriateness of blood products in medical patients appears necessary.
Key words: Transfusion; red blood cells; plasma; platelets; veterans.
Transfusion practices during hospitalization have changed considerably over the past 2 decades. Guided by evidence from randomized controlled trials, patient blood management programs have been expanded [1]. Such programs include recommendations regarding minimization of blood loss during surgery, prevention and treatment of anemia, strategies for reducing transfusions in both medical and surgical patients, improved blood utilization, education of health professionals, and standardization of blood management-related metrics [2]. Some of the guidelines have been incorporated into the Choosing Wisely initiative of the American Board of Internal Medicine Foundation, including: (a) don’t transfuse more units of blood than absolutely necessary, (b) don’t transfuse red blood cells for iron deficiency without hemodynamic instability, (c) don’t routinely use blood products to reverse warfarin, and (d) don’t perform serial blood counts on clinically stable patients [3]. Although there has been growing interest in blood management, only 37.8% of the 607 AABB (formerly, American Association of Blood Banks) facilities in the United States reported having a patient blood management program in 2013 [2].
While the importance of blood safety is recognized, data regarding the overall trends in practices are conflicting. A study using the Nationwide Inpatient Sample indicated that there was a 5.6% annual mean increase in the transfusion of blood products from 2002 to 2011 in the United States [4]. This contrasts with the experience of Kaiser Permanente in Northern California, in which the incidence of RBC transfusion decreased by 3.2% from 2009 to 2013 [5]. A decline in rates of intraoperative transfusion was also reported among elderly veterans in the United States from 1997 to 2009 [6].
We conducted a study in hospitalized veterans with 2 main objectives: (a) to evaluate trends in utilization of red blood cells (RBCs), platelets, and plasma over time, and (b) to identify those groups of veterans who received specific blood products. We were particularly interested in transfusion use in medical patients.
Methods
Participants were hospitalized veterans at 3 Department of Veterans Affairs (VA) medical centers. Data from all hospitalizations were collected from January 2000 through December 2010. Blood bank data (including the type and volume of products administered) were available electronically from each hospital. These files were linked to inpatient data, which included ICD-9-CM diagnoses (principal and secondary) and procedures during hospitalization.
Statistical analyses were conducted using generalized linear models to evaluate trends over time. The unit of observation was hospitalization, with categorization by type. Surgical hospitalizations were defined as admissions in which any surgical procedure occurred, whereas medical hospitalizations were defined as admissions without any surgery. Alpha was set at 0.05, 2-tailed. All analyses were conducted in Stata/MP 14.1 (StataCorp, College Station, TX). The study received institutional review board approval from the VA Ann Arbor Healthcare System.
Results
From 2000 through 2010, there were 176,521 hospitalizations in 69,621 patients. Within this cohort, 6% were < 40 years of age, 66% were 40 to 69 years of age, and 28% were 70 years or older at the time of admission. In this cohort, 96% of patients were male. Overall, 13.6% of all hospitalizations involved transfusion of a blood product (12.7% RBCs, 1.4% platelets, 3.0% plasma).
Transfusion occurred in 25.2% of surgical hospitalizations and 5.3% of medical hospitalizations. For surgical hospitalizations, transfusion use peaked in 2002 (when 30.9% of the surgical hospitalizations involved a trans-fusion) and significantly declined afterwards (P < 0.001). By 2010, 22.5% of the surgical hospitalizations involved a transfusion. Most of the surgeries where blood products were transfused involved cardiovascular procedures. For medical hospitalizations only, there was no significant change in transfusion use over time, either from 2000 to 2010 (P = 0.126) or from 2002 to 2010 (P = 0.072). In 2010, 5.2% of the medical hospitalizations involved a transfusion.
Rates of transfusion varied by principal diagnosis (Figure 1). For patients admitted with a principal diagnosis of infection (n = 20,981 hospitalizations), there was an increase in the percentage of hospitalizations in which transfusions (RBCs, platelet, plasma) were administered over time (P = 0.009) (Figure 1). For patients admitted with a principal diagnosis of malignancy (n = 12,904 hospitalizations), cardiovascular disease (n = 40,324 hospitalizations), and other diagnoses (n = 102,312 hospitalizations), there were no significant linear trends over the entire study period (P = 0.191, P = 0.052, P = 0.314, respectively). Rather, blood utilization peaked in year 2002 and significantly declined afterwards for patients admitted for malignancy (P < 0.001) and for cardiovascular disease (P < 0.001).
The most common principal diagnoses for medical patients receiving any transfusion (RBCs, platelet, plasma) are listed in Table 1. For medical patients with a principal diagnosis of anemia, 88% of hospitalizations involved a transfusion (Table 1). Transfusion occurred in 6% to 11% of medical hospitalizations with malignancies, heart failure, pneumonia or renal failure (Table 1). A considerable proportion (43%) of medical patients with gastrointestinal hemorrhage received a transfusion.
![]()
![]()
9.6% (2154/22,344) involved the use of only 1 unit, 43.8% (9791/22,344) involved 2 units, and 46.5% (10,399/22,344) involved 3 or more units during the hospitalization. From 2000 through 2010, there was a 20.3% reduction in the proportion of hospitalizations in which 3 or more units of RBCs were given (from 51.7% to 41.1%; P < 0.001). That is, among those hospitalizations in which a RBC transfusion occurred, a smaller proportion of hospitalizations involved the administration of 3 or more units of RBCs from 2000 through 2010 (Figure 2). There was an 11.5% increase in the proportion of hospitalizations in which 2 units of RBCs were used (from 40.4% to 45.0%; P < 0.001). In addition, there was a 73.6% increase in the proportion of hospitalizations in which 1 RBC unit was given (from 8.0% to 13.8%;
P = 0.001).
![]()
16.8 mL/hospitalization in 2010. For plasma, the mean mL/hospitalization was 28.9 in year 2000, increased to 50.1 mL/hospitalization in year 2008, and declined, thereafter, to 35.1 mL/hospitalization in year 2010.
Discussion
![]()
We also observed secular trends in the volume of RBCs administered. There was an increase in the percentage of hospitalizations in which 1 or 2 RBC units were used and a decline in transfusion of 3 or more units. The reduction in the use of 3 or more RBC units may reflect the adoption and integration of recommendations in patient blood management by clinicians,
which encourage assessment of the patients’ symptoms in determining whether additional units are necessary [7]. Such guidelines also endorse the avoidance of routine
administration of 2 units of RBCs if 1 unit is sufficient [8]. We have previously shown that, after coronary artery bypass grafting, 2 RBC units doubled the risk of pneumonia [9]; additional analyses indicated that 1 or 2 units of RBCs were associated with increased postoperative morbidity [10]. In addition, our previous research indicated that the probability of infection increased considerably between 1 and 2 RBC units, with a more gradual increase beyond 2 units [11]. With this evidence in mind, some studies at single sites have reported that there was a dramatic decline from 2 RBC units before initiation of patient blood management programs to 1 unit after the programs were implemented [12,13].
![]()
Medical patients who received a transfusion were often admitted for reason of anemia, cancer, organ failure, or pneumonia. Some researchers are now reporting that blood use, at certain sites, is becoming more common in medical rather than surgical patients, which may be due to an expansion of patient blood management procedures in surgery [16]. There are a substantial number of patient blood management programs among surgical specialties and their adoption has expanded [17]. Although there are fewer patient blood management programs in the nonsurgical setting, some have been targeted to internal medicine physicians and specifically, to hospitalists [1,18]. For example, a toolkit from the Society of Hospital Medicine centers on anemia management and includes anemia assessment, treatment, evaluation of RBC transfusion risk, blood conservation, optimization of coagulation, and patient-centered decision-making [19]. Additionally, bundling of patient blood management strategies has been launched to help encourage a wider adoption of such programs [20].
While guidelines regarding use of RBCs are becoming increasingly recognized, recommendations for the use of platelets and plasma are hampered by the paucity of evidence from randomized controlled trials [21,22]. There is moderate-quality evidence for the use of platelets with therapy-induced hypoproliferative thrombocytopenia in hospitalized patients [21], but low quality evidence for other uses. Moreover, a recent review of plasma transfusion in bleeding patients found no randomized controlled trials on plasma use in hospitalized patients, although several trials were currently underway [22].
Our findings need to be considered in the context of the following limitations. The data were from 3 VA hospitals, so the results may not reflect patterns of usage at other hospitals. However, AABB reports that there has been a general decrease in transfusion of allogeneic whole blood and RBC units since 2008 at the AABB-affiliated sites in the United States [2]; this is similar to the pattern that we observed in surgical patients. In addition, we report an overall view of trends without having details regarding which specific factors influenced changes in transfusion during this 11-year period. It is possible that the severity of hospitalized patients may have changed with time which could have influenced decisions regarding the need for transfusion.
In conclusion, the use of blood products decreased in surgical patients since 2002 but remained the same in medical patients in this VA population. Transfusions increased over time for patients who were admitted to the hospital for reason of infection, but decreased since 2002 for those admitted for cardiovascular disease or cancer. The number of RBC units per hospitalization decreased over time. Additional surveillance is needed to determine whether recent evidence regarding blood management has been incorporated into clinical practice for medical patients, as we strive to deliver optimal care to our veterans.
Corresponding author: Mary A.M. Rogers, PhD, MS, Dept. of Internal Medicine, Univ. of Michigan, 016-422W NCRC, Ann Arbor, MI 48109-2800, maryroge@umich.edu.
Funding/support: Department of Veterans Affairs, Clinical Sciences Research & Development Service Merit Review Award (EPID-011-11S). The contents do not represent the views of the U.S. Department of Veterans Affairs or the U.S. Government.
Financial disclosures: None.
Author contributions: conception and design, MAMR, SS; analysis and interpretation of data, MAMR, JDB, DR, LK, SS; drafting of article, MAMR; critical revision of the article, MAMR, MTG, DR, LK, SS, VC; statistical expertise, MAMR, DR; obtaining of funding, MTG, SS, VC; administrative or technical support, MTG, LK, SS, VC; collection and assembly of data, JDB, LK.
1. Hohmuth B, Ozawa S, Ashton M, Melseth RL. Patient-centered blood management. J Hosp Med 2014;9:60–5.
2. Whitaker B, Rajbhandary S, Harris A. The 2013 AABB blood collection, utilization, and patient blood management survey report. United States Department of Health and Human Services, AABB; 2015.
3. Cassel CK, Guest JA. Choosing wisely: helping physicians and patients make smart decisions about their care. JAMA 2012;307:1801–2.
4. Pathak R, Bhatt VR, Karmacharya P, et al. Trends in blood-product transfusion among inpatients in the United States from 2002 to 2011: data from the nationwide inpatient sample. J Hosp Med 2014;9:800–1.
5. Roubinian NH, Escobar GJ, Liu V, et al. Trends in red blood cell transfusion and 30-day mortality among hospitalized patients. Transfusion 2014;54:2678–86.
6. Chen A, Trivedi AN, Jiang L, et al. Hospital blood transfusion patterns during major noncardiac surgery and surgical mortality. Medicine (Baltimore) 2015;94:e1342.
7. Carson JL, Guyatt G, Heddle NM, et al. Clinical practice guidelines from the AABB: Red blood cell transfusion thresholds and storage. JAMA 2016;316:2025–35.
8. Hicks LK, Bering H, Carson KR, et al. The ASH choosing wisely® campaign: five hematologic tests and treatments to question. Blood 2013;122:3879–83.
9. Likosky DS, Paone G, Zhang M, et al. Red blood cell transfusions impact pneumonia rates after coronary artery bypass grafting. Ann Thorac Surg 2015;100:794–801.
10. Paone G, Likosky DS, Brewer R, et al. Transfusion of 1 and 2 units of red blood cells is associated with increased morbidity and mortality. Ann Thorac Surg 2014;97:87–93; discussion 93–4.
11. Rogers MAM, Blumberg N, Heal JM, et al. Role of transfusion in the development of urinary tract–related bloodstream infection. Arch Intern Med 2011;171:1587–9.
12. Oliver JC, Griffin RL, Hannon T, Marques MB. The success of our patient blood management program depended on an institution-wide change in transfusion practices. Transfusion 2014;54:2617–24.
13. Yerrabothala S, Desrosiers KP, Szczepiorkowski ZM, Dunbar NM. Significant reduction in red blood cell transfusions in a general hospital after successful implementation of a restrictive transfusion policy supported by prospective computerized order auditing. Transfusion 2014;54:2640–5.
14. Rehm JP, Otto PS, West WW, et al. Hospital-wide educational program decreases red blood cell transfusions. J Surg Res 1998;75:183–6.
15. Lawler EV, Bradbury BD, Fonda JR, et al. Transfusion burden among patients with chronic kidney disease and anemia. Clin J Am Soc Nephrol 2010;5:667–72.
16. Tinegate H, Pendry K, Murphy M, et al. Where do all the red blood cells (RBCs) go? Results of a survey of RBC use in England and North Wales in 2014. Transfusion 2016;56:139–45.
17. Meybohm P, Herrmann E, Steinbicker AU, et al. Patient blood management is associated with a substantial reduction of red blood cell utilization and safe for patient’s outcome: a prospective, multicenter cohort study with a noninferiority design. Ann Surg 2016;264:203–11.
18. Corwin HL, Theus JW, Cargile CS, Lang NP. Red blood cell transfusion: impact of an education program and a clinical guideline on transfusion practice. J Hosp Med 2014;9:745–9.
19. Society of Hospital Medicine. Anemia prevention and management program implementation toolkit. Accessed at www.hospitalmedicine.org/Web/Quality___Innovation/Implementation_Toolkit/Anemia/anemia_overview.aspx on 9 June 2017.
20. Meybohm P, Richards T, Isbister J, et al. Patient blood management bundles to facilitate implementation. Transfus Med Rev 2017;31:62–71.
21. Kaufman RM, Djulbegovic B, Gernsheimer T, et al. Platelet transfusion: a clinical practice guideline from the AABB. Ann Intern Med 2015;162:205–13.
22. Levy JH, Grottke O, Fries D, Kozek-Langenecker S. Therapeutic plasma transfusion in bleeding patients: A systematic review. Anesth Analg 2017;124:1268–76.
Surgical catastrophe: Offering a lifeline to the second victim
CASE A surgeon's story of patient loss
It was a Wednesday morning and Ms. M was my first case of the day. I knew her well, having delivered her 2 children. Now she had a 7-cm complex cyst on her right ovary, she was in pain, and she was possibly experiencing ovarian torsion. My resident took care of the paperwork, I met the patient in preop, answered her few questions, and reassured her husband that I would call him as soon as surgery was over. She was rolled to the operating room.
When I entered the OR, Ms. M was under general anesthesia, draped, and placed on the operating table in the usual position. I made a 5-mm incision at the umbilicus and inserted the trocar under direct visualization. There was blood and the camera became blurry. I removed the camera to clean it, and the anesthesiologist alerted me that there was sudden hypotension. I reinserted the camera and saw blood in the abdomen. I feared the worst—major vessel injury. I requested a scalpel and made a midline skin sub–umbilical incision, entered the peritoneal cavity, and observed blood everywhere. The massive transfusion protocol was activated and vascular surgery was called in. I could not find the source of the bleeding. Using a laparotomy towel I applied pressure on the aorta. The vascular surgeon arrived and pushed my resident away. He identified the source of the bleeding: The right common iliac artery was injured.
The patient coded, the anesthesiologist initiated CPR, bleeding continued, blood was being transfused, and after 20 long minutes of CPR the lifeless body of my patient could not hold any more. She was pronounced dead on the table.
At that moment, there were multiple victims: Ms. M lying on the surgical table; her family members, who did not know what was happening; and the surgical team members, who were looking at each other in denial and feeling that we had failed this patient, hoping that we would wake up from this nightmare.
Defining patient harm
Many patients experience harm each year because of an adverse medical event or preventable medical error.1 A 2013 report revealed that 210,000 to 440,000 deaths occur each year in the United States related to preventable patient harm.2 Although this fact is deeply disturbing, it is well known that modern health care is a high-risk industry.
Medical errors vary in terms of the degree of potential or actual damage. A “near miss” is any event that could have resulted in adverse consequences but did not (for example, an incorrect drug or dose ordered but not administered). On the other hand, an “adverse event” describes an error that resulted in some degree of patient harm or suffering.3
Related article:
Medical errors: Meeting ethical obligations and reducing liability with proper communication
For each patient who dies because of a medical error or a surgical complication, whether preventable or not, many clinicians are involved in the unfolding of the case. These events have a profound impact on well-intentioned, competent, and caring physicians, and they elicit intense emotional responses.4 When a patient experiences an unexpected adverse surgical outcome, the surgeons involved in their care may become “second victims.” They may feel that they have failed the patient and they second-guess their surgical skills and knowledge base; some express concern about their reputation and perhaps career choice.
Psychological responses. It is importantto understand this process to ensure a healthy recovery. Psychological responses to an adverse medical event include guilt; distress, anxiety, and fear; frustration and anger; feelings of insufficiency; and long-standing suffering. Clinicians who experienced an adverse medical event have reported additional psychological as well as physical symptoms in the aftermath of the event (TABLE 1).5
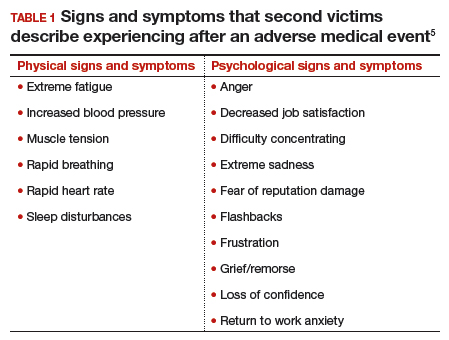
Risk factors. Certain factors are associated with a greater emotional impact of an adverse medical event, including6:
- severity of the harm or leaving permanent sequelae
- death of a healthy patient or a child (for example, from a motor vehicle accident)
- self-blame for the error
- unexpected patient death (for example, a catastrophic complication after a relatively benign procedure)
- physicians-in-training responsible for the patient
- first death under a clinician’s watch.
While most research in the field of medical error focuses on systems or process improvement, it is important not to neglect the individual and personal aspects of the clinicians involved in the event. The health care system must include care for our injured colleagues, the so-called second victims.
Read about the steps to recovery for the second victim.
Steps in recovery for the second victim
Based on a semistructured interview of 31 physicians involved in adverse events, Scott and colleagues described the following 6 stages of healing5:
Chaos and accident response. Immediately after the event, the physician feels a sense of confusion, panic, and denial. How can this be happening to me? The physician is frequently distracted, immersed in self-reflection.
Intrusive reflections. This is a period of self-questioning. Thoughts of the event and different possible scenarios dominate the physician’s mind. What if I had done this or that?
Restoring personal integrity. During this phase, the physician seeks support from individuals with whom trusted relationships exist, such as colleagues, peers, close friends, and family members. Advice from a colleague who has your same level of expertise is precious. The second victim often fears that friends and family will not be understanding.
Enduring the inquisition. Root cause analysis and in-depth case review is an important part of the quality improvement process after an adverse event. A debriefing or departmental morbidity and mortality conference can trigger emotions and increase the sense of shame, guilt, and self-doubt. The second victim starts to wonder about repercussions that may affect job security, licensure, and future litigation.
Obtaining emotional first aid. At this stage, the second victim begins to heal, but it is important to obtain external help from a colleague, mentor, counselor, department chair, or loved ones. Many physicians express concerns about not knowing who is a “safe person” to trust in this situation. Often, second victims perceive that their loved ones just do not understand their professional life or should be protected from this situation.
Moving on. There is an urge to move forward with life and simply put the event behind. This is difficult, however. A second victim may follow one of these paths:
- drop out—stop practicing clinical medicine
- survive—maintain the same career but with significant residual emotional burden from the event
- thrive—make something good out of the unfortunate clinical experience.
Related article:
TRUST: How to build a support net for ObGyns affected by a medical error
All these programs offer immediate help to any clinician in psychological distress. They provide confidentiality, and the individual is reassured that he or she can safely use the service without further consequences (TABLE 2).10
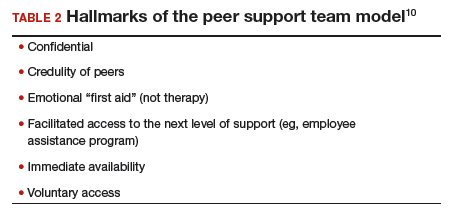
The normal human response to an adverse medical event can lead to significant psychological consequences, long-term emotional incapacity, impaired performance of clinical care, and feelings of guilt, fear, isolation, or even suicide. At some point during his or her career, almost every physician will be involved in a serious adverse medical event and is at risk of experiencing strong emotional reactions. Health care facilities should have a support system in place to help clinicians cope with these stressful circumstances.
Use these 5 strategies to facilitate recovery
- Be determined. No matter how bad you feel about the event, you need to get up and moving.
- Avoid isolation. Get outside and interact with people. Avoid long periods in isolation. Bring your team together and talk about the event.
- Sleep well. Most symptoms of posttraumatic stress disorder occur at night. If you have trouble falling asleep or you wake up in the middle of the night with nightmares related to the event, attempt to regulate your body’s sleep schedule. Seek professional help if needed.
- Avoid negative coping habits. Sometimes people turn to alcohol, cigarettes, food, or drugs to cope. Although these strategies may help in the short term, they will do more harm than good over time.
- Enroll in activities that provide positive distraction. While the mind focuses on the traumatic event (this is normal), you need to get busy with such positive distractions as sports, going to the movies, and engaging in outdoor activities. Do things that you enjoy.
Share your thoughts! Send your Letter to the Editor to rbarbieri@frontlinemedcom.com. Please include your name and the city and state in which you practice.
- Kohn L. To err is human: an interview with the Institute of Medicine's Linda Kohn. Jt Comm J Qual Improv. 2000;26(4):227-234.
- James JT. A new, evidence-based estimate of patient harms associated with hospital care. J Patient Saf. 2013;9(3):122-128.
- Harrison R, Lawton R, Perlo J, Gardner P, Armitage G, Shapiro J. Emotion and coping in the aftermath of medical error: a cross-country exploration. J Patient Saf. 2015;11(1):28-35.
- Chan ST, Khong PC, Wang W. Psychological responses, coping and supporting needs of healthcare professionals as second victims. Int Nurs Rev. 2017;64(2):242-262.
- Scott SD, Hirschinger LE, Cox KR, McCoig M, Brandt J, Hall LW. The natural history of recovery for the healthcare provider "second victim" after adverse patient events. Qual Saf Health Care. 2009;18(5):325-330.
- Waterman AD, Garbutt J, Hazel E, et al. The emotional impact of medical errors on practicing physicians in the United States and Canada. Jt Comm J Qual Patient Saf. 2007;33(8):467-476.
- Shapiro J, Galowitz P. Peer support for clinicians: a programmatic approach. Acad Med. 2016;91(9):1200-1204.
- Edrees H, Connors C, Paine L, Norvell M, Taylor H, Wu AW. Implementing the RISE second victim support programme at the Johns Hopkins Hospital: a case study. BMJ Open. 2016;6(9):e011708.
- Johnson B. Code lavender: initiating holistic rapid response at the Cleveland Clinic. Beginnings. 2014;34(2):10-11.
- van Pelt F. Peer support: healthcare professionals supporting each other after adverse medical events. Qual Saf Health Care. 2008;17(4):249-252.

Dr. Carugno is Assistant Professor of Obstetrics and Gynecology, Gynecologic Minimally Invasive Surgery and Robotics Unit Director, University of Miami Miller School of Medicine, Miami, Florida.

Dr. Andrade is Assistant Professor of Obstetrics and Gynecology, Gynecologic Minimally Invasive Surgery and Robotics Unit Associate Director, University of Miami Miller School of Medicine.
The authors report no financial relationships relevant to this article.
Dr. Carugno is Assistant Professor of Obstetrics and Gynecology, Gynecologic Minimally Invasive Surgery and Robotics Unit Director, University of Miami Miller School of Medicine, Miami, Florida.
Dr. Andrade is Assistant Professor of Obstetrics and Gynecology, Gynecologic Minimally Invasive Surgery and Robotics Unit Associate Director, University of Miami Miller School of Medicine.
The authors report no financial relationships relevant to this article.
CASE A surgeon's story of patient loss
It was a Wednesday morning and Ms. M was my first case of the day. I knew her well, having delivered her 2 children. Now she had a 7-cm complex cyst on her right ovary, she was in pain, and she was possibly experiencing ovarian torsion. My resident took care of the paperwork, I met the patient in preop, answered her few questions, and reassured her husband that I would call him as soon as surgery was over. She was rolled to the operating room.
When I entered the OR, Ms. M was under general anesthesia, draped, and placed on the operating table in the usual position. I made a 5-mm incision at the umbilicus and inserted the trocar under direct visualization. There was blood and the camera became blurry. I removed the camera to clean it, and the anesthesiologist alerted me that there was sudden hypotension. I reinserted the camera and saw blood in the abdomen. I feared the worst—major vessel injury. I requested a scalpel and made a midline skin sub–umbilical incision, entered the peritoneal cavity, and observed blood everywhere. The massive transfusion protocol was activated and vascular surgery was called in. I could not find the source of the bleeding. Using a laparotomy towel I applied pressure on the aorta. The vascular surgeon arrived and pushed my resident away. He identified the source of the bleeding: The right common iliac artery was injured.
The patient coded, the anesthesiologist initiated CPR, bleeding continued, blood was being transfused, and after 20 long minutes of CPR the lifeless body of my patient could not hold any more. She was pronounced dead on the table.
At that moment, there were multiple victims: Ms. M lying on the surgical table; her family members, who did not know what was happening; and the surgical team members, who were looking at each other in denial and feeling that we had failed this patient, hoping that we would wake up from this nightmare.
Defining patient harm
Many patients experience harm each year because of an adverse medical event or preventable medical error.1 A 2013 report revealed that 210,000 to 440,000 deaths occur each year in the United States related to preventable patient harm.2 Although this fact is deeply disturbing, it is well known that modern health care is a high-risk industry.
Medical errors vary in terms of the degree of potential or actual damage. A “near miss” is any event that could have resulted in adverse consequences but did not (for example, an incorrect drug or dose ordered but not administered). On the other hand, an “adverse event” describes an error that resulted in some degree of patient harm or suffering.3
Related article:
Medical errors: Meeting ethical obligations and reducing liability with proper communication
For each patient who dies because of a medical error or a surgical complication, whether preventable or not, many clinicians are involved in the unfolding of the case. These events have a profound impact on well-intentioned, competent, and caring physicians, and they elicit intense emotional responses.4 When a patient experiences an unexpected adverse surgical outcome, the surgeons involved in their care may become “second victims.” They may feel that they have failed the patient and they second-guess their surgical skills and knowledge base; some express concern about their reputation and perhaps career choice.
Psychological responses. It is importantto understand this process to ensure a healthy recovery. Psychological responses to an adverse medical event include guilt; distress, anxiety, and fear; frustration and anger; feelings of insufficiency; and long-standing suffering. Clinicians who experienced an adverse medical event have reported additional psychological as well as physical symptoms in the aftermath of the event (TABLE 1).5
Risk factors. Certain factors are associated with a greater emotional impact of an adverse medical event, including6:
- severity of the harm or leaving permanent sequelae
- death of a healthy patient or a child (for example, from a motor vehicle accident)
- self-blame for the error
- unexpected patient death (for example, a catastrophic complication after a relatively benign procedure)
- physicians-in-training responsible for the patient
- first death under a clinician’s watch.
While most research in the field of medical error focuses on systems or process improvement, it is important not to neglect the individual and personal aspects of the clinicians involved in the event. The health care system must include care for our injured colleagues, the so-called second victims.
Read about the steps to recovery for the second victim.
Steps in recovery for the second victim
Based on a semistructured interview of 31 physicians involved in adverse events, Scott and colleagues described the following 6 stages of healing5:
Chaos and accident response. Immediately after the event, the physician feels a sense of confusion, panic, and denial. How can this be happening to me? The physician is frequently distracted, immersed in self-reflection.
Intrusive reflections. This is a period of self-questioning. Thoughts of the event and different possible scenarios dominate the physician’s mind. What if I had done this or that?
Restoring personal integrity. During this phase, the physician seeks support from individuals with whom trusted relationships exist, such as colleagues, peers, close friends, and family members. Advice from a colleague who has your same level of expertise is precious. The second victim often fears that friends and family will not be understanding.
Enduring the inquisition. Root cause analysis and in-depth case review is an important part of the quality improvement process after an adverse event. A debriefing or departmental morbidity and mortality conference can trigger emotions and increase the sense of shame, guilt, and self-doubt. The second victim starts to wonder about repercussions that may affect job security, licensure, and future litigation.
Obtaining emotional first aid. At this stage, the second victim begins to heal, but it is important to obtain external help from a colleague, mentor, counselor, department chair, or loved ones. Many physicians express concerns about not knowing who is a “safe person” to trust in this situation. Often, second victims perceive that their loved ones just do not understand their professional life or should be protected from this situation.
Moving on. There is an urge to move forward with life and simply put the event behind. This is difficult, however. A second victim may follow one of these paths:
- drop out—stop practicing clinical medicine
- survive—maintain the same career but with significant residual emotional burden from the event
- thrive—make something good out of the unfortunate clinical experience.
Related article:
TRUST: How to build a support net for ObGyns affected by a medical error
All these programs offer immediate help to any clinician in psychological distress. They provide confidentiality, and the individual is reassured that he or she can safely use the service without further consequences (TABLE 2).10
The normal human response to an adverse medical event can lead to significant psychological consequences, long-term emotional incapacity, impaired performance of clinical care, and feelings of guilt, fear, isolation, or even suicide. At some point during his or her career, almost every physician will be involved in a serious adverse medical event and is at risk of experiencing strong emotional reactions. Health care facilities should have a support system in place to help clinicians cope with these stressful circumstances.
Use these 5 strategies to facilitate recovery
- Be determined. No matter how bad you feel about the event, you need to get up and moving.
- Avoid isolation. Get outside and interact with people. Avoid long periods in isolation. Bring your team together and talk about the event.
- Sleep well. Most symptoms of posttraumatic stress disorder occur at night. If you have trouble falling asleep or you wake up in the middle of the night with nightmares related to the event, attempt to regulate your body’s sleep schedule. Seek professional help if needed.
- Avoid negative coping habits. Sometimes people turn to alcohol, cigarettes, food, or drugs to cope. Although these strategies may help in the short term, they will do more harm than good over time.
- Enroll in activities that provide positive distraction. While the mind focuses on the traumatic event (this is normal), you need to get busy with such positive distractions as sports, going to the movies, and engaging in outdoor activities. Do things that you enjoy.
Share your thoughts! Send your Letter to the Editor to rbarbieri@frontlinemedcom.com. Please include your name and the city and state in which you practice.
- Kohn L. To err is human: an interview with the Institute of Medicine's Linda Kohn. Jt Comm J Qual Improv. 2000;26(4):227-234.
- James JT. A new, evidence-based estimate of patient harms associated with hospital care. J Patient Saf. 2013;9(3):122-128.
- Harrison R, Lawton R, Perlo J, Gardner P, Armitage G, Shapiro J. Emotion and coping in the aftermath of medical error: a cross-country exploration. J Patient Saf. 2015;11(1):28-35.
- Chan ST, Khong PC, Wang W. Psychological responses, coping and supporting needs of healthcare professionals as second victims. Int Nurs Rev. 2017;64(2):242-262.
- Scott SD, Hirschinger LE, Cox KR, McCoig M, Brandt J, Hall LW. The natural history of recovery for the healthcare provider "second victim" after adverse patient events. Qual Saf Health Care. 2009;18(5):325-330.
- Waterman AD, Garbutt J, Hazel E, et al. The emotional impact of medical errors on practicing physicians in the United States and Canada. Jt Comm J Qual Patient Saf. 2007;33(8):467-476.
- Shapiro J, Galowitz P. Peer support for clinicians: a programmatic approach. Acad Med. 2016;91(9):1200-1204.
- Edrees H, Connors C, Paine L, Norvell M, Taylor H, Wu AW. Implementing the RISE second victim support programme at the Johns Hopkins Hospital: a case study. BMJ Open. 2016;6(9):e011708.
- Johnson B. Code lavender: initiating holistic rapid response at the Cleveland Clinic. Beginnings. 2014;34(2):10-11.
- van Pelt F. Peer support: healthcare professionals supporting each other after adverse medical events. Qual Saf Health Care. 2008;17(4):249-252.
Fast Tracks
- A "near miss" is any event that could have resulted in adverse consequences but did not. An "adverse event" describes an error that resulted in some degree of patient harm or suffering.
- At some point in his or her career, almost every physician will be involved in a serious adverse medical event and is at risk of experiencing strong emotional reactions

In-Office Diagnostic Needle Arthroscopy: Understanding the Potential Value for the US Healthcare System
Take-Home Points
- In-office diagnostic needle arthroscopy is a minimally invasive, rapid method for identification of intra-articular joint pathology.
- Cost savings of a significant value can be realized to both the patient and healthcare system via small-bore needle arthroscopy as opposed to MRI.
- Diagnostic needle arthroscopy can lead to quicker identification of pathology than MRI.
- Diagnostic needle arthroscopy can reduce the number of undue "formal" surgical diagnostic arthroscopies.
- Standardization of image quality of small bore arthroscopy may pose benefits to the variable quality of MRI.
Patient satisfaction and healthcare costs have taken a leading role in today’s health care market. Patient satisfaction, often categorized as the "patient experience," can be measured on numerous levels, such as access to healthcare professionals and diagnostic testing, wait time for appointments, and timely test results. Furthermore, patients’ having a full understanding of their pathology and treatment options may correlate with their overall satisfaction. Some metrics are subjective, but procedure costs are objective.
The algorithm for treating patients who present with knee or shoulder pathology to an orthopedic office involves taking a thorough history, performing a physical examination, and, in many cases, obtaining diagnostic imaging. After arriving at a diagnosis, the physician plans the patient’s treatment. In most cases in which magnetic resonance imaging (MRI) is required, the process can take 2 to 3 weeks.1
Surgical knee arthroscopy is one of the most common procedures in the United States.2,3 Worldwide, more than 2 million knee arthroscopies are performed yearly.4 For most procedures, the decision to treat is based on physical examination findings, and the diagnosis is confirmed with MRI. MRI has 86% sensitivity and 91% specificity for diagnosing ligamentous and meniscal tears.5 However, regular use of MRI has led to increased healthcare expenditures and a larger financial burden for patients, which can delay diagnosis.6
Since 2000, MRI use in the United States has risen significantly—by 10% over a 10-year period.7 According to a 2013 population analysis, 107 in 1000 US inhabitants had an MRI yearly.8
MRI costs vary widely because of several factors, including state/regional consideration, scanning in a hospital or an independent facility, and use of contrast and arthrography. In a 2017 study of the variation in noncontrast MRI costs at 71 hospitals and 26 independent facilities in Iowa, Westermann and colleagues9 found that, excluding radiologist interpretation fees, the mean MRI technical component cost to consumers was US $1874 (SD, $694; range, $500-$4000).
Patient factors may preclude use of MRI (Table). 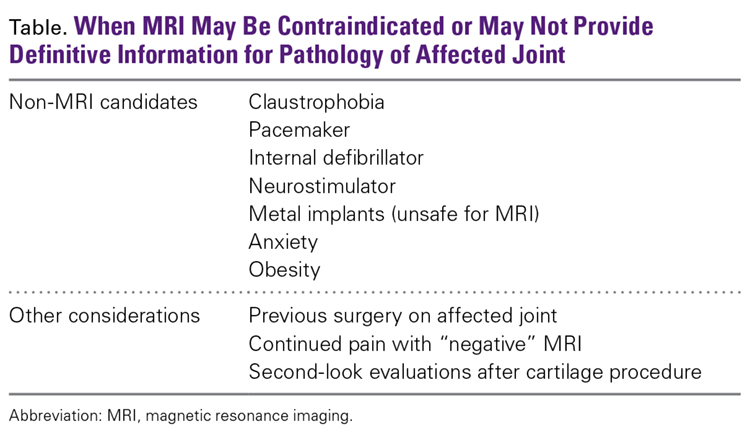
Small-bore needle arthroscopy is a cost-effective alternative diagnostic tool with efficacy and accuracy similar to those of MRI and standard arthroscopy for intra-articular pathologies.6,11 The procedure is performed with a disposable handpiece equipped with an internal light source and optics; this handpiece attaches to a reusable tablet for ease of transportation and visualization (Figure 1). 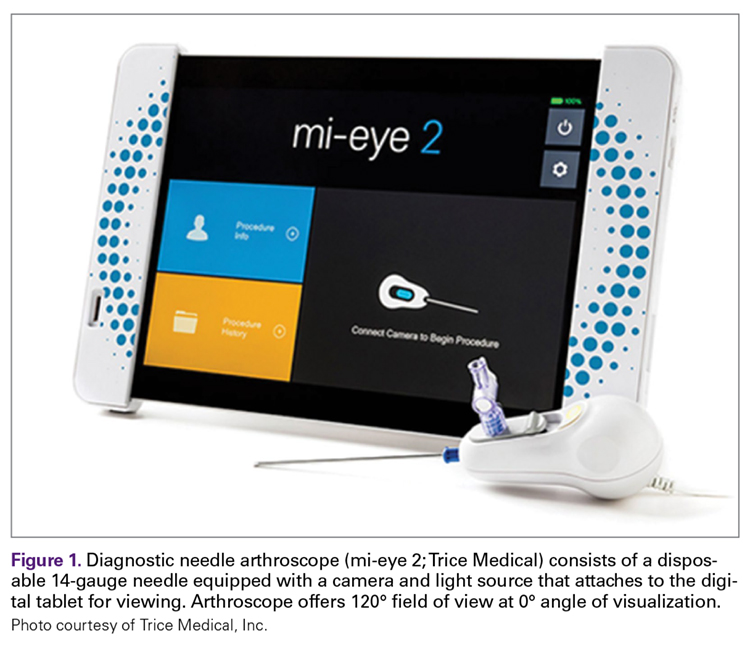
In 2014, Voigt and colleagues6 reported a significant net healthcare system cost saving with use of a small-needle arthroscope for diagnostic testing. The saving was estimated at $115 million to $177 million for simple isolation of medial meniscus pathology—or, more specifically, for appropriate care after more accurate visualization with the diagnostic needle arthroscope coupled with a decrease in false positives compared with MRI use. Other factors include the economic impact of the patient’s lost work hours, often associated with the time off needed for the MRI and for the follow-up visit for review of results.
Methods
We retrospectively reviewed the patient charts for 200 in-office knee and shoulder diagnostic needle arthroscopies performed by 5 surgeons over a 12-month period and examined the costs. Medicare, Medicaid, worker’s compensation, self-pay, and motor vehicle cases were excluded to provide uniformity across commercial insurance payers. Only the reimbursement amounts for Current Procedural Terminology codes 29870 (diagnostic knee arthroscopy) and 29805 (diagnostic shoulder arthroscopy) were examined. Geographical differences in commercial payer reimbursements were considered. The 5 surgeons who submitted data for this study practice in different parts of the United States—the Northeast, the Mid-Atlantic, the Southeast, the Midwest, and the West Coast. Similarly, the costs of outpatient and inpatient MRI and MRA were reported by each physician based on regional rates. MRI reimbursement was considered only if the MRI magnet was 1.5 Tesla or stronger.
Results
We reviewed 200 (175 knee, 25 shoulder) in-office diagnostic needle arthroscopies of patients with commercial insurances. Average reimbursement was calculated across all commercial payers for both knee and shoulder arthroscopies (Figure 2). 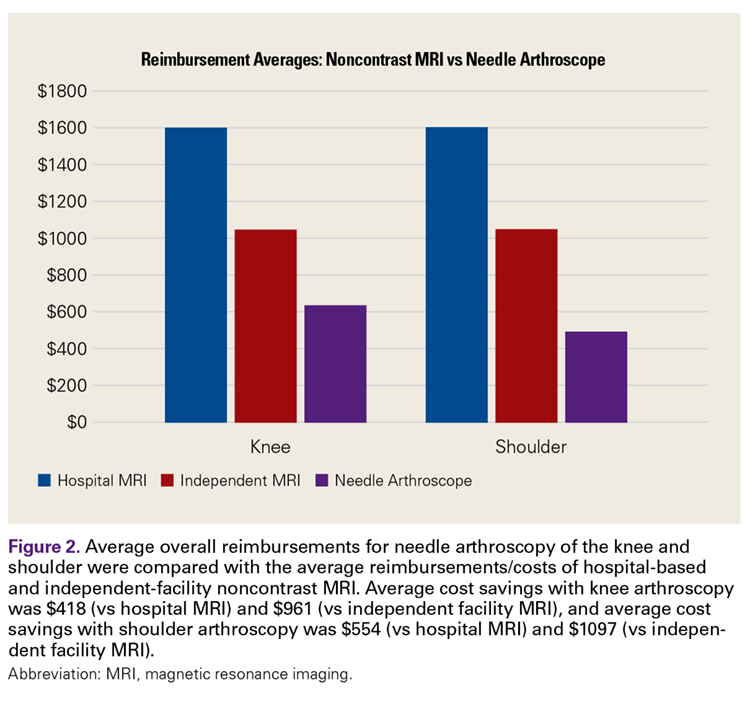
For in-office diagnostic needle arthroscopy of the knee, average reimbursement was $628.92 (range, $340-$1391). For in-office diagnostic needle arthroscopy of the shoulder, average reimbursement was $492.38 (range, $471-$593). Outpatient MRI without contrast of the knee or shoulder averaged $1047 (range, $565-$2100) (Figure 3). 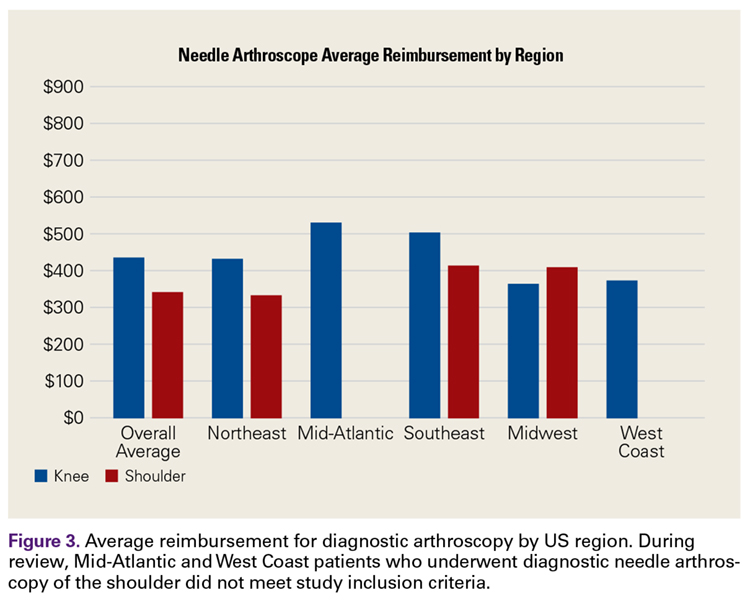
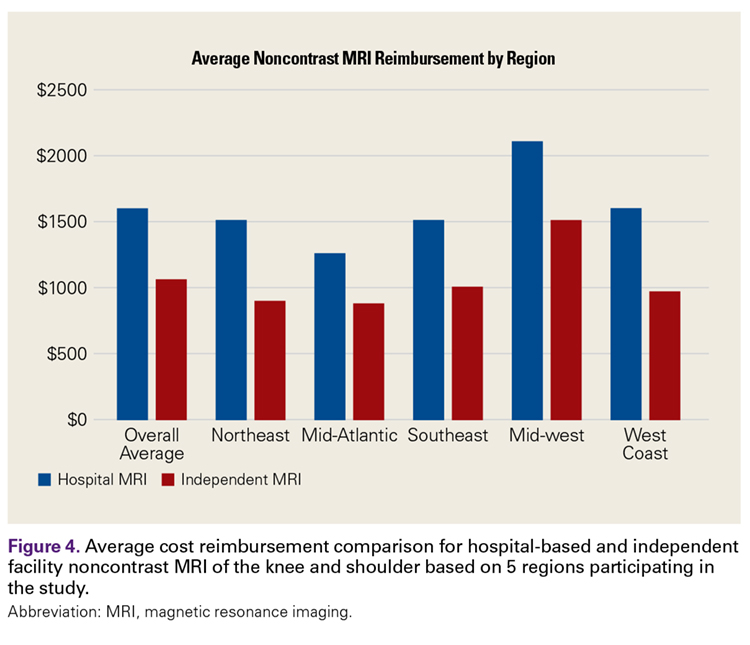
Discussion
Over the past decade, the combination of health and economics has often driven patient care and consumer demand. With rising deductibles and variations in secondary insurance carriers, patients often base healthcare decisions on their financial impact. Conversely, physicians are often in the difficult position of treating patients who are hesitant to obtain medical imaging out of financial concern. In addition, physicians and patients routinely are concerned about delays in care and timely reporting of test results. A patient’s ability to quickly obtain test results and start a course of definitive treatment may affect the patient’s perception of the overall healthcare experience with the physician, as has been noted in popular healthcare polls, such as Press-Ganey.13
Diagnostic needle arthroscopy performed in an office can yield a cost saving over MRI. Our review revealed in-office needle arthroscopy of the knee provided an average cost saving of $418.08 over standard MRI performed in an outpatient facility (Figure 3). That saving more than doubled, to $961.08, when MRI was performed in a hospital. Similarly, in-office needle arthroscopy of the shoulder provided an average cost saving of $554.62 over standard MRI. This saving also increased substantially, to $1097.62, over hospital MRI. An additional cost saving of $100 to $350 was found for knee or shoulder diagnostic needle arthroscopy over MRA.
Other factors affect the economic benefit of diagnostic needle arthroscopy over standard MRI. Having the procedure performed the same day as the presenting office visit can save the patient time and allow the physician to create a medical treatment plan sooner. In addition, the patient (and the insurance company) can save costs by avoiding a later office visit for review of MRI findings. Time spent going to MRI follow-up visits potentially can be analyzed as lost wages or as time lost from other segments of life. For the patient, this time can be defined as value hours. Last, there is a cost saving in avoiding nonoperative treatments in cases in which the initial definitive diagnosis would have called for surgical intervention. Accordingly, for patients who cannot undergo MRI, obtaining information on intra-articular pathology in the office may also decrease unnecessary "traditional" diagnostic arthroscopy in the operating room. Therefore, patients who do not require true formal arthroscopy to determine lack of pertinent intra-articular pathology can avoid unnecessary anesthesia, time off work, and associated healthcare expenses.
This study had several limitations. First, evaluating more cases would have increased the strength of the findings. Second, the large number of knee cases relative to shoulder cases may have been a by-product of the practice makeup of the surgeons rather than a matter of preference with this relatively new technology. However, the significant gap in cost savings between needle arthroscope and MRI cannot be discounted, and it provides a window on the potential cost savings the healthcare system can realize. Furthermore, analysis of payments made by the commercial payers in each state may have revealed a reimbursement fluctuation. The largest challenge in this study was the extreme variation in MRI costs. According to the literature, MRI of the upper or lower extremity ranges in cost from $500 to $4000.4 In addition, this cost is often negotiated between the patient and the MRI facility if the patient is willing to work outside insurance, which potentially can alter the overall average MRI cost.
The last points to consider are the reliability of users and the reproducibility of in-office diagnostic needle arthroscopy. Much as with true surgical arthroscopy and other diagnostic imaging practices, this procedure has a learning curve. We know that the number of successful diagnoses will increase with training and repetition, but so far there are no data on the number of procedures needed for proficiency. However, diagnostic needle arthroscopy images are of high quality and are static across users (Figures 5A, 5B). By contrast, the quality of MRI in the United States varies with the quality of the magnets used in individual facilities. 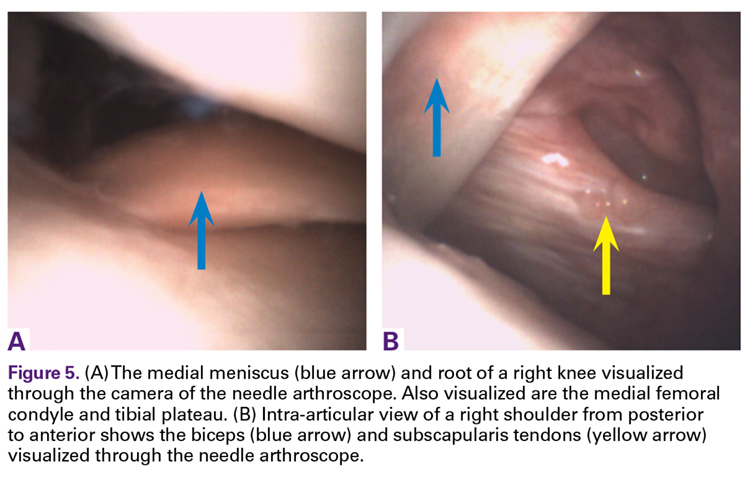
Conclusion
In-office diagnostic needle arthroscopy is a cost-effective and reproducible procedure with potential cost and quality-of-life benefits for commercial payers and patients. Although further study of long-term cost savings for the health care system is needed, significant value was realized in this 200-patient retrospective review. Minimum savings of $418 and $554.62 were realized for noncontrast knee and shoulder MRIs, respectively, in independent facilities. Those cost savings more than doubled in hospital-based facilities: $961.08 and $1097.62, respectively, for knee and shoulder noncontrast MRIs.
For More on In-office Arthroscopy...
Don’t miss Dr. Sean McMillan’s “Innovative Technique Update: In-Office Arthroscopy: My Technique and Results” at the upcoming Innovative Techniques® Knee, Hip, and Shoulder Course in Las Vegas. 29.5 CME/MOC available. Learn more
1. O’Donnell J. Trice Medical literature. #4-10-0032 Rev A.
2. Kim S, Bosque J, Meehan JP, Jamali A, Marder R. Increase in outpatient knee arthroscopy in the United States: a comparison of National Surveys of Ambulatory Surgery, 1996 and 2006. J Bone Joint Surg Am. 2011;93(11):994-1000.
3. Cullen KA, Hall MJ, Golosinskiy A. Ambulatory surgery in the United States, 2006. Natl Health Stat Rep. 2009;(11):1-25.
4. Siemieniuk RAC, Harris IA, Agoritsas T, et al. Arthroscopic surgery for degenerative knee arthritis and meniscal tears: a clinical practice guideline. BMJ. 2017;(357):j1982.
5. Crawford R, Walley G, Bridgman S, Maffulli N. Magnetic resonance imaging versus arthroscopy in the diagnosis of knee pathology, concentrating on meniscal lesions and ACL tears: a systematic review. Br Med Bull. 2007;(84):5-23.
6. Voigt JD, Mosier M, Huber B. Diagnostic needle arthroscopy and the economics of improved diagnostic accuracy: a cost analysis. Appl Health Econ Health Policy. 2014;12(5):523-535.
7. Sharpe RE Jr, Levin DC, Parker L, Rao VM. The recent reversal of the growth trend in MRI: a harbinger of the future? J Am Coll Radiol. 2013;10(8):599-602.
8. Organisation for Economic Cooperation and Development (OECD). 46. Magnetic resonance imaging (MRI) exams, total per 1 000 population. OECD website. http://dx.doi.org/10.1787/mri-exam-total-table-2014-1-en. Published June 30, 2014. Accessed August 14, 2017.
9. Westermann RW, Schick C, Graves CM, Duchman KR, Weinstein SL. What does a shoulder MRI cost the consumer? Clin Orthop Relat Res. 2017;475(3):580-584.
10. Thakkar RS, Thakkar SC, Srikumaran U, McFarland EG, Fayad LM. Complications of rotator cuff surgery—the role of post-operative imaging in patient care. Br J Radiol. 2014;87(1039):20130630.
11. Gramas DA, Antounian FS, Peterfy CG, Genant HK, Lane NE. Assessment of needle arthroscopy, standard arthroscopy, physical examination, and magnetic resonance imaging in knee pain: a pilot study. J Clin Rheumatol. 1995;1(1):26-34.
12. McMillan S, Saini S, Alyea E, Ford EA. Office-based needle arthroscopy: a standardized diagnostic approach to the knee. Arthrosc Tech. 2017.
13. Keeping me waiting: medical practice wait times and patient satisfaction [white paper]. South Bend, IN: Press Ganey; 2010. https://helpandtraining.pressganey.com/Documents_secure/Medical%20Practices/White%20Papers/Keep_Me_Waiting.pdf. Published 2010. Accessed August 14, 2017.
Take-Home Points
- In-office diagnostic needle arthroscopy is a minimally invasive, rapid method for identification of intra-articular joint pathology.
- Cost savings of a significant value can be realized to both the patient and healthcare system via small-bore needle arthroscopy as opposed to MRI.
- Diagnostic needle arthroscopy can lead to quicker identification of pathology than MRI.
- Diagnostic needle arthroscopy can reduce the number of undue "formal" surgical diagnostic arthroscopies.
- Standardization of image quality of small bore arthroscopy may pose benefits to the variable quality of MRI.
Patient satisfaction and healthcare costs have taken a leading role in today’s health care market. Patient satisfaction, often categorized as the "patient experience," can be measured on numerous levels, such as access to healthcare professionals and diagnostic testing, wait time for appointments, and timely test results. Furthermore, patients’ having a full understanding of their pathology and treatment options may correlate with their overall satisfaction. Some metrics are subjective, but procedure costs are objective.
The algorithm for treating patients who present with knee or shoulder pathology to an orthopedic office involves taking a thorough history, performing a physical examination, and, in many cases, obtaining diagnostic imaging. After arriving at a diagnosis, the physician plans the patient’s treatment. In most cases in which magnetic resonance imaging (MRI) is required, the process can take 2 to 3 weeks.1
Surgical knee arthroscopy is one of the most common procedures in the United States.2,3 Worldwide, more than 2 million knee arthroscopies are performed yearly.4 For most procedures, the decision to treat is based on physical examination findings, and the diagnosis is confirmed with MRI. MRI has 86% sensitivity and 91% specificity for diagnosing ligamentous and meniscal tears.5 However, regular use of MRI has led to increased healthcare expenditures and a larger financial burden for patients, which can delay diagnosis.6
Since 2000, MRI use in the United States has risen significantly—by 10% over a 10-year period.7 According to a 2013 population analysis, 107 in 1000 US inhabitants had an MRI yearly.8
MRI costs vary widely because of several factors, including state/regional consideration, scanning in a hospital or an independent facility, and use of contrast and arthrography. In a 2017 study of the variation in noncontrast MRI costs at 71 hospitals and 26 independent facilities in Iowa, Westermann and colleagues9 found that, excluding radiologist interpretation fees, the mean MRI technical component cost to consumers was US $1874 (SD, $694; range, $500-$4000).
Patient factors may preclude use of MRI (Table).
Small-bore needle arthroscopy is a cost-effective alternative diagnostic tool with efficacy and accuracy similar to those of MRI and standard arthroscopy for intra-articular pathologies.6,11 The procedure is performed with a disposable handpiece equipped with an internal light source and optics; this handpiece attaches to a reusable tablet for ease of transportation and visualization (Figure 1).
In 2014, Voigt and colleagues6 reported a significant net healthcare system cost saving with use of a small-needle arthroscope for diagnostic testing. The saving was estimated at $115 million to $177 million for simple isolation of medial meniscus pathology—or, more specifically, for appropriate care after more accurate visualization with the diagnostic needle arthroscope coupled with a decrease in false positives compared with MRI use. Other factors include the economic impact of the patient’s lost work hours, often associated with the time off needed for the MRI and for the follow-up visit for review of results.
Methods
We retrospectively reviewed the patient charts for 200 in-office knee and shoulder diagnostic needle arthroscopies performed by 5 surgeons over a 12-month period and examined the costs. Medicare, Medicaid, worker’s compensation, self-pay, and motor vehicle cases were excluded to provide uniformity across commercial insurance payers. Only the reimbursement amounts for Current Procedural Terminology codes 29870 (diagnostic knee arthroscopy) and 29805 (diagnostic shoulder arthroscopy) were examined. Geographical differences in commercial payer reimbursements were considered. The 5 surgeons who submitted data for this study practice in different parts of the United States—the Northeast, the Mid-Atlantic, the Southeast, the Midwest, and the West Coast. Similarly, the costs of outpatient and inpatient MRI and MRA were reported by each physician based on regional rates. MRI reimbursement was considered only if the MRI magnet was 1.5 Tesla or stronger.
Results
We reviewed 200 (175 knee, 25 shoulder) in-office diagnostic needle arthroscopies of patients with commercial insurances. Average reimbursement was calculated across all commercial payers for both knee and shoulder arthroscopies (Figure 2).
For in-office diagnostic needle arthroscopy of the knee, average reimbursement was $628.92 (range, $340-$1391). For in-office diagnostic needle arthroscopy of the shoulder, average reimbursement was $492.38 (range, $471-$593). Outpatient MRI without contrast of the knee or shoulder averaged $1047 (range, $565-$2100) (Figure 3).
Discussion
Over the past decade, the combination of health and economics has often driven patient care and consumer demand. With rising deductibles and variations in secondary insurance carriers, patients often base healthcare decisions on their financial impact. Conversely, physicians are often in the difficult position of treating patients who are hesitant to obtain medical imaging out of financial concern. In addition, physicians and patients routinely are concerned about delays in care and timely reporting of test results. A patient’s ability to quickly obtain test results and start a course of definitive treatment may affect the patient’s perception of the overall healthcare experience with the physician, as has been noted in popular healthcare polls, such as Press-Ganey.13
Diagnostic needle arthroscopy performed in an office can yield a cost saving over MRI. Our review revealed in-office needle arthroscopy of the knee provided an average cost saving of $418.08 over standard MRI performed in an outpatient facility (Figure 3). That saving more than doubled, to $961.08, when MRI was performed in a hospital. Similarly, in-office needle arthroscopy of the shoulder provided an average cost saving of $554.62 over standard MRI. This saving also increased substantially, to $1097.62, over hospital MRI. An additional cost saving of $100 to $350 was found for knee or shoulder diagnostic needle arthroscopy over MRA.
Other factors affect the economic benefit of diagnostic needle arthroscopy over standard MRI. Having the procedure performed the same day as the presenting office visit can save the patient time and allow the physician to create a medical treatment plan sooner. In addition, the patient (and the insurance company) can save costs by avoiding a later office visit for review of MRI findings. Time spent going to MRI follow-up visits potentially can be analyzed as lost wages or as time lost from other segments of life. For the patient, this time can be defined as value hours. Last, there is a cost saving in avoiding nonoperative treatments in cases in which the initial definitive diagnosis would have called for surgical intervention. Accordingly, for patients who cannot undergo MRI, obtaining information on intra-articular pathology in the office may also decrease unnecessary "traditional" diagnostic arthroscopy in the operating room. Therefore, patients who do not require true formal arthroscopy to determine lack of pertinent intra-articular pathology can avoid unnecessary anesthesia, time off work, and associated healthcare expenses.
This study had several limitations. First, evaluating more cases would have increased the strength of the findings. Second, the large number of knee cases relative to shoulder cases may have been a by-product of the practice makeup of the surgeons rather than a matter of preference with this relatively new technology. However, the significant gap in cost savings between needle arthroscope and MRI cannot be discounted, and it provides a window on the potential cost savings the healthcare system can realize. Furthermore, analysis of payments made by the commercial payers in each state may have revealed a reimbursement fluctuation. The largest challenge in this study was the extreme variation in MRI costs. According to the literature, MRI of the upper or lower extremity ranges in cost from $500 to $4000.4 In addition, this cost is often negotiated between the patient and the MRI facility if the patient is willing to work outside insurance, which potentially can alter the overall average MRI cost.
The last points to consider are the reliability of users and the reproducibility of in-office diagnostic needle arthroscopy. Much as with true surgical arthroscopy and other diagnostic imaging practices, this procedure has a learning curve. We know that the number of successful diagnoses will increase with training and repetition, but so far there are no data on the number of procedures needed for proficiency. However, diagnostic needle arthroscopy images are of high quality and are static across users (Figures 5A, 5B). By contrast, the quality of MRI in the United States varies with the quality of the magnets used in individual facilities.
Conclusion
In-office diagnostic needle arthroscopy is a cost-effective and reproducible procedure with potential cost and quality-of-life benefits for commercial payers and patients. Although further study of long-term cost savings for the health care system is needed, significant value was realized in this 200-patient retrospective review. Minimum savings of $418 and $554.62 were realized for noncontrast knee and shoulder MRIs, respectively, in independent facilities. Those cost savings more than doubled in hospital-based facilities: $961.08 and $1097.62, respectively, for knee and shoulder noncontrast MRIs.
For More on In-office Arthroscopy...
Don’t miss Dr. Sean McMillan’s “Innovative Technique Update: In-Office Arthroscopy: My Technique and Results” at the upcoming Innovative Techniques® Knee, Hip, and Shoulder Course in Las Vegas. 29.5 CME/MOC available. Learn more
1. O’Donnell J. Trice Medical literature. #4-10-0032 Rev A.
2. Kim S, Bosque J, Meehan JP, Jamali A, Marder R. Increase in outpatient knee arthroscopy in the United States: a comparison of National Surveys of Ambulatory Surgery, 1996 and 2006. J Bone Joint Surg Am. 2011;93(11):994-1000.
3. Cullen KA, Hall MJ, Golosinskiy A. Ambulatory surgery in the United States, 2006. Natl Health Stat Rep. 2009;(11):1-25.
4. Siemieniuk RAC, Harris IA, Agoritsas T, et al. Arthroscopic surgery for degenerative knee arthritis and meniscal tears: a clinical practice guideline. BMJ. 2017;(357):j1982.
5. Crawford R, Walley G, Bridgman S, Maffulli N. Magnetic resonance imaging versus arthroscopy in the diagnosis of knee pathology, concentrating on meniscal lesions and ACL tears: a systematic review. Br Med Bull. 2007;(84):5-23.
6. Voigt JD, Mosier M, Huber B. Diagnostic needle arthroscopy and the economics of improved diagnostic accuracy: a cost analysis. Appl Health Econ Health Policy. 2014;12(5):523-535.
7. Sharpe RE Jr, Levin DC, Parker L, Rao VM. The recent reversal of the growth trend in MRI: a harbinger of the future? J Am Coll Radiol. 2013;10(8):599-602.
8. Organisation for Economic Cooperation and Development (OECD). 46. Magnetic resonance imaging (MRI) exams, total per 1 000 population. OECD website. http://dx.doi.org/10.1787/mri-exam-total-table-2014-1-en. Published June 30, 2014. Accessed August 14, 2017.
9. Westermann RW, Schick C, Graves CM, Duchman KR, Weinstein SL. What does a shoulder MRI cost the consumer? Clin Orthop Relat Res. 2017;475(3):580-584.
10. Thakkar RS, Thakkar SC, Srikumaran U, McFarland EG, Fayad LM. Complications of rotator cuff surgery—the role of post-operative imaging in patient care. Br J Radiol. 2014;87(1039):20130630.
11. Gramas DA, Antounian FS, Peterfy CG, Genant HK, Lane NE. Assessment of needle arthroscopy, standard arthroscopy, physical examination, and magnetic resonance imaging in knee pain: a pilot study. J Clin Rheumatol. 1995;1(1):26-34.
12. McMillan S, Saini S, Alyea E, Ford EA. Office-based needle arthroscopy: a standardized diagnostic approach to the knee. Arthrosc Tech. 2017.
13. Keeping me waiting: medical practice wait times and patient satisfaction [white paper]. South Bend, IN: Press Ganey; 2010. https://helpandtraining.pressganey.com/Documents_secure/Medical%20Practices/White%20Papers/Keep_Me_Waiting.pdf. Published 2010. Accessed August 14, 2017.