AMSTERDAM – Prolonged oral treatment with norfloxacin improved the survival of patients with Child-Pugh class C liver disease versus no antibiotic prophylaxis in a randomized, double-blind, placebo-controlled, phase III multicenter trial.
Fewer patients (15.3% vs. 24.5%) treated with norfloxacin for 6 months died by the 6-month mortality primary endpoint than did those treated with placebo, with a hazard ratio of 0.59 (95% confidence interval, 0.35-0.99; P = .047) favoring prolonged antibiotic treatment. Adjustments for the concomitant use of nonselective beta-blockers and corticosteroids did not greatly alter the significance of the findings (adjusted HR, 0.58; 95% CI, 0.34-0.98; P = .042).
Dr. Richard Moreau
The survival benefit was lost by 1 year of follow-up, however, suggesting that perhaps treatment needs to continue beyond 12 months, according to author Richard Moreau, MD, of Hôpital Beaujon, Clichy, France, who reported the results at a meeting sponsored by the European Association for the Study of the Liver.
“The results of this study provide evidence that 6 months of norfloxacin therapy reduces the risk of death in the short term, but not in the long term,” he observed in an official EASL press release.
The occurrence of infections at 6 months and 12 months were secondary outcomes of the study and showed that fewer infections overall (23.9% vs. 35.0%, P = .04) had occurred in the norfloxacin group versus the placebo group at 6 months, which was sustained at 12 months, suggesting an overhanging effect of the antibiotic treatment.
There was no difference between the groups in the incidence of other secondary endpoints including septic shock, systolic blood pressure, liver transplantation, kidney dysfunction, encephalopathy, and variceal bleeding at 6 months, Dr. Moreau reported on behalf of the NORFLOCIR study group.
Norfloxacin is a fluoroquinolone antibiotic and earlier data (Gastroenterology 2007;133:818-24) had suggested that its prolonged use could improve survival in patients with advanced cirrhosis significantly at 3 months and nonsignificantly at 12 months. This was a small study, however, and although several other small-sized trials followed, the long-term use of fluoroquinolone therapy to improve outcomes in patients cirrhosis remained debated,” Dr. Moreau said during his presentation of the study’s findings.
There was also the concern that such prolonged antibiotic use might up the risk for infection with gram-positive bacteria, he observed, but the current study’s finding showed that this was not the case. The cumulative incidence of gram-positive (3.4% vs. 8.1%, P = .08) infections was numerically although not significantly lower in the antibiotic-treated patients at 6 months while the cumulative incidence of gram-negative infections was significantly lowered (3.2% vs. 13.0%, P less than .005).
The study does have its limitations, Dr. Moreau conceded. Fewer patients were recruited than anticipated, 291 rather than a planned sample size of 392 patients, which was caused by a combination of factors – slow recruitment, termination of funding, and time expiry of the trial drug. Nevertheless, the study findings are strengthened by the fact it was conducted in 18 centers throughout France and that liver transplantation was taken into account as a potential competing risk.
During the trial, 144 patients with Child-Pugh class C cirrhosis were randomized to receive oral norfloxacin at a dose of 400 mg/day and 147 were randomized to a matching placebo daily for 6 months. Patients were followed for 6 additional months.
Just 3% of patients were lost to follow-up by the time of the primary endpoint assessment at 6 months, with just over half (55%) modifying their consent and almost half (46%) discontinuing the study because of death (15%), liver transplant (9%), elevated systolic blood pressure (9%), or patient decision (12%).
Patients included in the study were mostly middle-aged (55 years or older), male (more than 65%), and had alcoholic cirrhosis (greater than 74%) or alcoholic hepatitis (39%), with around 88% having ascites.
Dr. Moreau had nothing to disclose. The study was sponsored by the French government.
AMSTERDAM – Prolonged oral treatment with norfloxacin improved the survival of patients with Child-Pugh class C liver disease versus no antibiotic prophylaxis in a randomized, double-blind, placebo-controlled, phase III multicenter trial.
Fewer patients (15.3% vs. 24.5%) treated with norfloxacin for 6 months died by the 6-month mortality primary endpoint than did those treated with placebo, with a hazard ratio of 0.59 (95% confidence interval, 0.35-0.99; P = .047) favoring prolonged antibiotic treatment. Adjustments for the concomitant use of nonselective beta-blockers and corticosteroids did not greatly alter the significance of the findings (adjusted HR, 0.58; 95% CI, 0.34-0.98; P = .042).
Dr. Richard Moreau
The survival benefit was lost by 1 year of follow-up, however, suggesting that perhaps treatment needs to continue beyond 12 months, according to author Richard Moreau, MD, of Hôpital Beaujon, Clichy, France, who reported the results at a meeting sponsored by the European Association for the Study of the Liver.
“The results of this study provide evidence that 6 months of norfloxacin therapy reduces the risk of death in the short term, but not in the long term,” he observed in an official EASL press release.
The occurrence of infections at 6 months and 12 months were secondary outcomes of the study and showed that fewer infections overall (23.9% vs. 35.0%, P = .04) had occurred in the norfloxacin group versus the placebo group at 6 months, which was sustained at 12 months, suggesting an overhanging effect of the antibiotic treatment.
There was no difference between the groups in the incidence of other secondary endpoints including septic shock, systolic blood pressure, liver transplantation, kidney dysfunction, encephalopathy, and variceal bleeding at 6 months, Dr. Moreau reported on behalf of the NORFLOCIR study group.
Norfloxacin is a fluoroquinolone antibiotic and earlier data (Gastroenterology 2007;133:818-24) had suggested that its prolonged use could improve survival in patients with advanced cirrhosis significantly at 3 months and nonsignificantly at 12 months. This was a small study, however, and although several other small-sized trials followed, the long-term use of fluoroquinolone therapy to improve outcomes in patients cirrhosis remained debated,” Dr. Moreau said during his presentation of the study’s findings.
There was also the concern that such prolonged antibiotic use might up the risk for infection with gram-positive bacteria, he observed, but the current study’s finding showed that this was not the case. The cumulative incidence of gram-positive (3.4% vs. 8.1%, P = .08) infections was numerically although not significantly lower in the antibiotic-treated patients at 6 months while the cumulative incidence of gram-negative infections was significantly lowered (3.2% vs. 13.0%, P less than .005).
The study does have its limitations, Dr. Moreau conceded. Fewer patients were recruited than anticipated, 291 rather than a planned sample size of 392 patients, which was caused by a combination of factors – slow recruitment, termination of funding, and time expiry of the trial drug. Nevertheless, the study findings are strengthened by the fact it was conducted in 18 centers throughout France and that liver transplantation was taken into account as a potential competing risk.
During the trial, 144 patients with Child-Pugh class C cirrhosis were randomized to receive oral norfloxacin at a dose of 400 mg/day and 147 were randomized to a matching placebo daily for 6 months. Patients were followed for 6 additional months.
Just 3% of patients were lost to follow-up by the time of the primary endpoint assessment at 6 months, with just over half (55%) modifying their consent and almost half (46%) discontinuing the study because of death (15%), liver transplant (9%), elevated systolic blood pressure (9%), or patient decision (12%).
Patients included in the study were mostly middle-aged (55 years or older), male (more than 65%), and had alcoholic cirrhosis (greater than 74%) or alcoholic hepatitis (39%), with around 88% having ascites.
Dr. Moreau had nothing to disclose. The study was sponsored by the French government.
AMSTERDAM – Prolonged oral treatment with norfloxacin improved the survival of patients with Child-Pugh class C liver disease versus no antibiotic prophylaxis in a randomized, double-blind, placebo-controlled, phase III multicenter trial.
Fewer patients (15.3% vs. 24.5%) treated with norfloxacin for 6 months died by the 6-month mortality primary endpoint than did those treated with placebo, with a hazard ratio of 0.59 (95% confidence interval, 0.35-0.99; P = .047) favoring prolonged antibiotic treatment. Adjustments for the concomitant use of nonselective beta-blockers and corticosteroids did not greatly alter the significance of the findings (adjusted HR, 0.58; 95% CI, 0.34-0.98; P = .042).
Dr. Richard Moreau
The survival benefit was lost by 1 year of follow-up, however, suggesting that perhaps treatment needs to continue beyond 12 months, according to author Richard Moreau, MD, of Hôpital Beaujon, Clichy, France, who reported the results at a meeting sponsored by the European Association for the Study of the Liver.
“The results of this study provide evidence that 6 months of norfloxacin therapy reduces the risk of death in the short term, but not in the long term,” he observed in an official EASL press release.
The occurrence of infections at 6 months and 12 months were secondary outcomes of the study and showed that fewer infections overall (23.9% vs. 35.0%, P = .04) had occurred in the norfloxacin group versus the placebo group at 6 months, which was sustained at 12 months, suggesting an overhanging effect of the antibiotic treatment.
There was no difference between the groups in the incidence of other secondary endpoints including septic shock, systolic blood pressure, liver transplantation, kidney dysfunction, encephalopathy, and variceal bleeding at 6 months, Dr. Moreau reported on behalf of the NORFLOCIR study group.
Norfloxacin is a fluoroquinolone antibiotic and earlier data (Gastroenterology 2007;133:818-24) had suggested that its prolonged use could improve survival in patients with advanced cirrhosis significantly at 3 months and nonsignificantly at 12 months. This was a small study, however, and although several other small-sized trials followed, the long-term use of fluoroquinolone therapy to improve outcomes in patients cirrhosis remained debated,” Dr. Moreau said during his presentation of the study’s findings.
There was also the concern that such prolonged antibiotic use might up the risk for infection with gram-positive bacteria, he observed, but the current study’s finding showed that this was not the case. The cumulative incidence of gram-positive (3.4% vs. 8.1%, P = .08) infections was numerically although not significantly lower in the antibiotic-treated patients at 6 months while the cumulative incidence of gram-negative infections was significantly lowered (3.2% vs. 13.0%, P less than .005).
The study does have its limitations, Dr. Moreau conceded. Fewer patients were recruited than anticipated, 291 rather than a planned sample size of 392 patients, which was caused by a combination of factors – slow recruitment, termination of funding, and time expiry of the trial drug. Nevertheless, the study findings are strengthened by the fact it was conducted in 18 centers throughout France and that liver transplantation was taken into account as a potential competing risk.
During the trial, 144 patients with Child-Pugh class C cirrhosis were randomized to receive oral norfloxacin at a dose of 400 mg/day and 147 were randomized to a matching placebo daily for 6 months. Patients were followed for 6 additional months.
Just 3% of patients were lost to follow-up by the time of the primary endpoint assessment at 6 months, with just over half (55%) modifying their consent and almost half (46%) discontinuing the study because of death (15%), liver transplant (9%), elevated systolic blood pressure (9%), or patient decision (12%).
Patients included in the study were mostly middle-aged (55 years or older), male (more than 65%), and had alcoholic cirrhosis (greater than 74%) or alcoholic hepatitis (39%), with around 88% having ascites.
Dr. Moreau had nothing to disclose. The study was sponsored by the French government.
Key clinical point: Prolonged antibiotic therapy proved beneficial in patients with advanced cirrhosis.
Major finding: Mortality at 6 months was significantly reduced with norfloxacin vs. placebo treatment (adjusted HR, 0.58; 95% CI, 0.34-0.98; P = .042).
Data source: A phase III, multicenter, randomized, double-blind, placebo-controlled trial of 291 patients with Child-Pugh class C cirrhosis who received either 400 mg of norfloxacin or placebo orally, once daily, for 6 months.
Disclosures: Dr. Moreau had nothing to disclose. The study was sponsored by the French government.
With patient co-management arrangements between hospitalists and other surgical and medical subspecialists becoming more common, HM17 attendees won’t want to miss Tuesday afternoon’s session at 3:15–4:20 p.m., “Redefining Co-management in Hospital Medicine.”
“We’ll provide hospitalists effective co-management programs at their respective hospitals,” said copresenter William Atchley Jr., MD, FACP, SFHM, a hospitalist with Sentara Heart Hospital in Norfolk, Va.
Dr. William Atchley Jr.
The session will review the history of co-management research and the metrics studied, discuss the practice management benefits of co-management, look at real-world examples, and glimpse into future directions and implications for practice.
More hospital medicine groups are getting involved in co-management, the presenters said. There are two primary models: one in which the hospitalist is the attending of record and the subspecialist is the co-manager and another in which the subspecialist is the attending of record and the hospitalist serves as the co-manager. “Either model can work with the right agreements put in place,” Dr. Atchley said.
Dr. Corey Karlin-Zysman
There are several drivers for these agreements, added co-presenter Corey Karlin-Zysman, MD, FHM, FACP, chief of the division of hospital medicine at North Shore University Hospital, Manhasset, N.Y., and Long Island (N.Y.) Jewish Medical Center, which has multiple co-management arrangements in place in areas including orthopedics, urology, otolaryngology, trauma, neurosurgery, cardiology, and psychiatry. “Sometimes surgical co-managers want help and someone to take shared responsibility of the patient so they can focus on their area of expertise. Sometimes the driver is administrative, where someone reviews a subspecialty’s performance or throughput metrics and notes opportunities to work together to reduce hospital length of stay or readmissions.” With the average age of surgical patients rising, surgical subspecialists are becoming more reliant on hospitalists to manage co-morbidities to prevent them from being exacerbated perioperatively.
“We’ll go through some of what we feel are the undiscovered benefits of having a co-management service,” said copresenter Mark Goldin, MD, FACP, a hospitalist at Long Island Jewish Medical Center. “I think a lot of people will be interested to hear that because research on co-management has been mixed, up to this point.” For example, he said, SHM engagement surveys have indicated that hospitalists who do co-management may be at reduced risk of burnout.
Dr. Mark Goldin
For co-management to work well, said Dr. Goldin, “have a very clear, mutually agreed-upon service agreement that details who does what for the patient. That way, you can avoid a lot of the pitfalls of having a mission creep, with hospitalists taking on more and more responsibility.”
Also important is creating a metrics dashboard and monitoring and updating it regularly, Dr. Karlin-Zysman added. “Not only does it keep both sides honest, but it’s how you garner support from the C-suite.”
The Society of Hospital Medicine has resources available to help, Dr. Atchley said. The SHM website includes a white paper on co-management. There also is a listserv called HMS Exchange, in which hospitalists can discuss comanagement topics.
“Co-management is not going away. It’s something that hospitalists are going to be involved with,” Dr. Atchley said. “It’s important to come up with the right agreement and, at the same time, work with everybody in collaboration to improve patient care.”
Redefining Co-management in Hospital Medicine Tuesday, 3:15–4:20 p.m.
With patient co-management arrangements between hospitalists and other surgical and medical subspecialists becoming more common, HM17 attendees won’t want to miss Tuesday afternoon’s session at 3:15–4:20 p.m., “Redefining Co-management in Hospital Medicine.”
“We’ll provide hospitalists effective co-management programs at their respective hospitals,” said copresenter William Atchley Jr., MD, FACP, SFHM, a hospitalist with Sentara Heart Hospital in Norfolk, Va.
Dr. William Atchley Jr.
The session will review the history of co-management research and the metrics studied, discuss the practice management benefits of co-management, look at real-world examples, and glimpse into future directions and implications for practice.
More hospital medicine groups are getting involved in co-management, the presenters said. There are two primary models: one in which the hospitalist is the attending of record and the subspecialist is the co-manager and another in which the subspecialist is the attending of record and the hospitalist serves as the co-manager. “Either model can work with the right agreements put in place,” Dr. Atchley said.
Dr. Corey Karlin-Zysman
There are several drivers for these agreements, added co-presenter Corey Karlin-Zysman, MD, FHM, FACP, chief of the division of hospital medicine at North Shore University Hospital, Manhasset, N.Y., and Long Island (N.Y.) Jewish Medical Center, which has multiple co-management arrangements in place in areas including orthopedics, urology, otolaryngology, trauma, neurosurgery, cardiology, and psychiatry. “Sometimes surgical co-managers want help and someone to take shared responsibility of the patient so they can focus on their area of expertise. Sometimes the driver is administrative, where someone reviews a subspecialty’s performance or throughput metrics and notes opportunities to work together to reduce hospital length of stay or readmissions.” With the average age of surgical patients rising, surgical subspecialists are becoming more reliant on hospitalists to manage co-morbidities to prevent them from being exacerbated perioperatively.
“We’ll go through some of what we feel are the undiscovered benefits of having a co-management service,” said copresenter Mark Goldin, MD, FACP, a hospitalist at Long Island Jewish Medical Center. “I think a lot of people will be interested to hear that because research on co-management has been mixed, up to this point.” For example, he said, SHM engagement surveys have indicated that hospitalists who do co-management may be at reduced risk of burnout.
Dr. Mark Goldin
For co-management to work well, said Dr. Goldin, “have a very clear, mutually agreed-upon service agreement that details who does what for the patient. That way, you can avoid a lot of the pitfalls of having a mission creep, with hospitalists taking on more and more responsibility.”
Also important is creating a metrics dashboard and monitoring and updating it regularly, Dr. Karlin-Zysman added. “Not only does it keep both sides honest, but it’s how you garner support from the C-suite.”
The Society of Hospital Medicine has resources available to help, Dr. Atchley said. The SHM website includes a white paper on co-management. There also is a listserv called HMS Exchange, in which hospitalists can discuss comanagement topics.
“Co-management is not going away. It’s something that hospitalists are going to be involved with,” Dr. Atchley said. “It’s important to come up with the right agreement and, at the same time, work with everybody in collaboration to improve patient care.”
Redefining Co-management in Hospital Medicine Tuesday, 3:15–4:20 p.m.
With patient co-management arrangements between hospitalists and other surgical and medical subspecialists becoming more common, HM17 attendees won’t want to miss Tuesday afternoon’s session at 3:15–4:20 p.m., “Redefining Co-management in Hospital Medicine.”
“We’ll provide hospitalists effective co-management programs at their respective hospitals,” said copresenter William Atchley Jr., MD, FACP, SFHM, a hospitalist with Sentara Heart Hospital in Norfolk, Va.
Dr. William Atchley Jr.
The session will review the history of co-management research and the metrics studied, discuss the practice management benefits of co-management, look at real-world examples, and glimpse into future directions and implications for practice.
More hospital medicine groups are getting involved in co-management, the presenters said. There are two primary models: one in which the hospitalist is the attending of record and the subspecialist is the co-manager and another in which the subspecialist is the attending of record and the hospitalist serves as the co-manager. “Either model can work with the right agreements put in place,” Dr. Atchley said.
Dr. Corey Karlin-Zysman
There are several drivers for these agreements, added co-presenter Corey Karlin-Zysman, MD, FHM, FACP, chief of the division of hospital medicine at North Shore University Hospital, Manhasset, N.Y., and Long Island (N.Y.) Jewish Medical Center, which has multiple co-management arrangements in place in areas including orthopedics, urology, otolaryngology, trauma, neurosurgery, cardiology, and psychiatry. “Sometimes surgical co-managers want help and someone to take shared responsibility of the patient so they can focus on their area of expertise. Sometimes the driver is administrative, where someone reviews a subspecialty’s performance or throughput metrics and notes opportunities to work together to reduce hospital length of stay or readmissions.” With the average age of surgical patients rising, surgical subspecialists are becoming more reliant on hospitalists to manage co-morbidities to prevent them from being exacerbated perioperatively.
“We’ll go through some of what we feel are the undiscovered benefits of having a co-management service,” said copresenter Mark Goldin, MD, FACP, a hospitalist at Long Island Jewish Medical Center. “I think a lot of people will be interested to hear that because research on co-management has been mixed, up to this point.” For example, he said, SHM engagement surveys have indicated that hospitalists who do co-management may be at reduced risk of burnout.
Dr. Mark Goldin
For co-management to work well, said Dr. Goldin, “have a very clear, mutually agreed-upon service agreement that details who does what for the patient. That way, you can avoid a lot of the pitfalls of having a mission creep, with hospitalists taking on more and more responsibility.”
Also important is creating a metrics dashboard and monitoring and updating it regularly, Dr. Karlin-Zysman added. “Not only does it keep both sides honest, but it’s how you garner support from the C-suite.”
The Society of Hospital Medicine has resources available to help, Dr. Atchley said. The SHM website includes a white paper on co-management. There also is a listserv called HMS Exchange, in which hospitalists can discuss comanagement topics.
“Co-management is not going away. It’s something that hospitalists are going to be involved with,” Dr. Atchley said. “It’s important to come up with the right agreement and, at the same time, work with everybody in collaboration to improve patient care.”
Redefining Co-management in Hospital Medicine Tuesday, 3:15–4:20 p.m.
The Food and Drug Administration has approved midostaurin for the treatment of FLT3 mutation–positive acute myeloid leukemia (FLT3+ AML) in adult patients in combination with standard cytarabine and daunorubicin induction and cytarabine consolidation.
Approval was based on results from a randomized, double-blind, placebo-controlled trial of 717 patients with previously untreated FLT3+ AML. The hazard ratio for overall survival in patients receiving midostaurin, compared with a placebo, was 0.77 (P = .016). A companion diagnostic tool, the LeukoStrat CDx FLT3 Mutation Assay manufactured by Invivoscribe Technologies, was also approved.
Febrile neutropenia, nausea, mucositis, vomiting, headache, petechiae, musculoskeletal pain, epistaxis, device-related infection, hyperglycemia, and upper respiratory tract infection were the most common side effects of treatment with midostaurin, occurring in at least 20% of patients, the FDA said in a written statement.
Midostaurin was also approved for the treatment of aggressive systemic mastocytosis, SM with associated hematological neoplasm, or mast cell leukemia. This indication approval was based on a single-arm, open-label study of midostaurin 100 mg, taken orally twice daily. Complete plus incomplete remission rates were 38% for ASM and 16% for SM with associated hematological neoplasm. Common adverse events included nausea, vomiting, diarrhea, edema, musculoskeletal pain, abdominal pain, fatigue, upper respiratory tract infection, fever, headache, and dyspnea.
The recommended dose of midostaurin in AML is 50 mg twice daily with food on days 8 to 21 of each cycle of induction and consolidation chemotherapy followed by 50 mg with food as a single agent for up to 12 months. The recommended dose for the treatment of adults with aggressive SM, SM with associated hematological neoplasm, or mast cell leukemia is 100 mg twice daily with food, the FDA said.
Midostaurin will be marketed as Rydapt by Novartis Pharmaceuticals.
The Food and Drug Administration has approved midostaurin for the treatment of FLT3 mutation–positive acute myeloid leukemia (FLT3+ AML) in adult patients in combination with standard cytarabine and daunorubicin induction and cytarabine consolidation.
Approval was based on results from a randomized, double-blind, placebo-controlled trial of 717 patients with previously untreated FLT3+ AML. The hazard ratio for overall survival in patients receiving midostaurin, compared with a placebo, was 0.77 (P = .016). A companion diagnostic tool, the LeukoStrat CDx FLT3 Mutation Assay manufactured by Invivoscribe Technologies, was also approved.
Febrile neutropenia, nausea, mucositis, vomiting, headache, petechiae, musculoskeletal pain, epistaxis, device-related infection, hyperglycemia, and upper respiratory tract infection were the most common side effects of treatment with midostaurin, occurring in at least 20% of patients, the FDA said in a written statement.
Midostaurin was also approved for the treatment of aggressive systemic mastocytosis, SM with associated hematological neoplasm, or mast cell leukemia. This indication approval was based on a single-arm, open-label study of midostaurin 100 mg, taken orally twice daily. Complete plus incomplete remission rates were 38% for ASM and 16% for SM with associated hematological neoplasm. Common adverse events included nausea, vomiting, diarrhea, edema, musculoskeletal pain, abdominal pain, fatigue, upper respiratory tract infection, fever, headache, and dyspnea.
The recommended dose of midostaurin in AML is 50 mg twice daily with food on days 8 to 21 of each cycle of induction and consolidation chemotherapy followed by 50 mg with food as a single agent for up to 12 months. The recommended dose for the treatment of adults with aggressive SM, SM with associated hematological neoplasm, or mast cell leukemia is 100 mg twice daily with food, the FDA said.
Midostaurin will be marketed as Rydapt by Novartis Pharmaceuticals.
The Food and Drug Administration has approved midostaurin for the treatment of FLT3 mutation–positive acute myeloid leukemia (FLT3+ AML) in adult patients in combination with standard cytarabine and daunorubicin induction and cytarabine consolidation.
Approval was based on results from a randomized, double-blind, placebo-controlled trial of 717 patients with previously untreated FLT3+ AML. The hazard ratio for overall survival in patients receiving midostaurin, compared with a placebo, was 0.77 (P = .016). A companion diagnostic tool, the LeukoStrat CDx FLT3 Mutation Assay manufactured by Invivoscribe Technologies, was also approved.
Febrile neutropenia, nausea, mucositis, vomiting, headache, petechiae, musculoskeletal pain, epistaxis, device-related infection, hyperglycemia, and upper respiratory tract infection were the most common side effects of treatment with midostaurin, occurring in at least 20% of patients, the FDA said in a written statement.
Midostaurin was also approved for the treatment of aggressive systemic mastocytosis, SM with associated hematological neoplasm, or mast cell leukemia. This indication approval was based on a single-arm, open-label study of midostaurin 100 mg, taken orally twice daily. Complete plus incomplete remission rates were 38% for ASM and 16% for SM with associated hematological neoplasm. Common adverse events included nausea, vomiting, diarrhea, edema, musculoskeletal pain, abdominal pain, fatigue, upper respiratory tract infection, fever, headache, and dyspnea.
The recommended dose of midostaurin in AML is 50 mg twice daily with food on days 8 to 21 of each cycle of induction and consolidation chemotherapy followed by 50 mg with food as a single agent for up to 12 months. The recommended dose for the treatment of adults with aggressive SM, SM with associated hematological neoplasm, or mast cell leukemia is 100 mg twice daily with food, the FDA said.
Midostaurin will be marketed as Rydapt by Novartis Pharmaceuticals.
Aggressive resection to negative margins, combined with neoadjuvant chemotherapy and postsurgical radiation, resulted in a 96% 5-year locoregional recurrence-free survival in nonmetastatic inflammatory breast cancer, Kelly Rosso, MD, reported.
Dr. Rosso of MD Anderson Cancer Center, Houston, and her colleagues identified 277 women diagnosed with inflammatory breast cancer between 2007 and 2015 from a prospective database; 114 of those had nonmetastatic disease and received aggressive trimodality therapy with curative intent.
Dr. Kelly Rosso
Trimodality therapy at MD Anderson is defined as neoadjuvant chemotherapy and targeted systemic therapies followed by aggressive surgical resection to negative surgical margins and specific radiotherapy, Dr. Rosso said.
Median age at diagnosis was 52 years and all patients were diagnosed at Stage III; 55% presented with N2 disease while 45% presented with N3. Patients were followed for a median 3.6 years.
“Historically, prognosis for patients with inflammatory breast cancer has been very poor,” Dr. Rosso said at a press conference in advance of the annual meeting of the American Society of Breast Surgeons. “Data from our institution has failed to identify any significant improvement in survival from the 1970s to the 2000s.”
In this study, 29 patients died and 4 experienced a locoregional recurrence (3.5%) during follow-up. The 2-year probability of locoregional recurrence was low, at 3.19%, while the 2-year probability of recurrence or distant metastasis was 23.1%. The 5-year disease-free survival was 72.5%, significantly lower than local/regional recurrence-free survival because some patients developed metastatic cancer in other organs, Dr. Rosso reported.
Diminished overall survival and increased risk for recurrence or metastasis were more likely in women over the age of 65 years and those with HER2-negative status, limited clinical response to chemotherapy, and absence of a pathologically complete response. Recurrence or metastasis also were more likely in women with Stage IIIC disease and more lymphovascular involvement.
“It is encouraging to see the high 5-year breast cancer specific survival rates reported in this cohort,” Judy C. Boughey, MD, professor of surgery and vice chair of research at the Mayo Clinic, Rochester, Minn., said in a statement. “This study supports that the current management of these patients with neoadjuvant chemotherapy, mastectomy and post-mastectomy radiation is the optimal multimodal approach for inflammatory breast cancer. The improvements in systemic therapy, with increased use of directed therapy, being used in breast cancer, together with appropriate local-regional therapies, is likely responsible for the improvement in survival over historical cohorts.”
Aggressive resection to negative margins, combined with neoadjuvant chemotherapy and postsurgical radiation, resulted in a 96% 5-year locoregional recurrence-free survival in nonmetastatic inflammatory breast cancer, Kelly Rosso, MD, reported.
Dr. Rosso of MD Anderson Cancer Center, Houston, and her colleagues identified 277 women diagnosed with inflammatory breast cancer between 2007 and 2015 from a prospective database; 114 of those had nonmetastatic disease and received aggressive trimodality therapy with curative intent.
Dr. Kelly Rosso
Trimodality therapy at MD Anderson is defined as neoadjuvant chemotherapy and targeted systemic therapies followed by aggressive surgical resection to negative surgical margins and specific radiotherapy, Dr. Rosso said.
Median age at diagnosis was 52 years and all patients were diagnosed at Stage III; 55% presented with N2 disease while 45% presented with N3. Patients were followed for a median 3.6 years.
“Historically, prognosis for patients with inflammatory breast cancer has been very poor,” Dr. Rosso said at a press conference in advance of the annual meeting of the American Society of Breast Surgeons. “Data from our institution has failed to identify any significant improvement in survival from the 1970s to the 2000s.”
In this study, 29 patients died and 4 experienced a locoregional recurrence (3.5%) during follow-up. The 2-year probability of locoregional recurrence was low, at 3.19%, while the 2-year probability of recurrence or distant metastasis was 23.1%. The 5-year disease-free survival was 72.5%, significantly lower than local/regional recurrence-free survival because some patients developed metastatic cancer in other organs, Dr. Rosso reported.
Diminished overall survival and increased risk for recurrence or metastasis were more likely in women over the age of 65 years and those with HER2-negative status, limited clinical response to chemotherapy, and absence of a pathologically complete response. Recurrence or metastasis also were more likely in women with Stage IIIC disease and more lymphovascular involvement.
“It is encouraging to see the high 5-year breast cancer specific survival rates reported in this cohort,” Judy C. Boughey, MD, professor of surgery and vice chair of research at the Mayo Clinic, Rochester, Minn., said in a statement. “This study supports that the current management of these patients with neoadjuvant chemotherapy, mastectomy and post-mastectomy radiation is the optimal multimodal approach for inflammatory breast cancer. The improvements in systemic therapy, with increased use of directed therapy, being used in breast cancer, together with appropriate local-regional therapies, is likely responsible for the improvement in survival over historical cohorts.”
Aggressive resection to negative margins, combined with neoadjuvant chemotherapy and postsurgical radiation, resulted in a 96% 5-year locoregional recurrence-free survival in nonmetastatic inflammatory breast cancer, Kelly Rosso, MD, reported.
Dr. Rosso of MD Anderson Cancer Center, Houston, and her colleagues identified 277 women diagnosed with inflammatory breast cancer between 2007 and 2015 from a prospective database; 114 of those had nonmetastatic disease and received aggressive trimodality therapy with curative intent.
Dr. Kelly Rosso
Trimodality therapy at MD Anderson is defined as neoadjuvant chemotherapy and targeted systemic therapies followed by aggressive surgical resection to negative surgical margins and specific radiotherapy, Dr. Rosso said.
Median age at diagnosis was 52 years and all patients were diagnosed at Stage III; 55% presented with N2 disease while 45% presented with N3. Patients were followed for a median 3.6 years.
“Historically, prognosis for patients with inflammatory breast cancer has been very poor,” Dr. Rosso said at a press conference in advance of the annual meeting of the American Society of Breast Surgeons. “Data from our institution has failed to identify any significant improvement in survival from the 1970s to the 2000s.”
In this study, 29 patients died and 4 experienced a locoregional recurrence (3.5%) during follow-up. The 2-year probability of locoregional recurrence was low, at 3.19%, while the 2-year probability of recurrence or distant metastasis was 23.1%. The 5-year disease-free survival was 72.5%, significantly lower than local/regional recurrence-free survival because some patients developed metastatic cancer in other organs, Dr. Rosso reported.
Diminished overall survival and increased risk for recurrence or metastasis were more likely in women over the age of 65 years and those with HER2-negative status, limited clinical response to chemotherapy, and absence of a pathologically complete response. Recurrence or metastasis also were more likely in women with Stage IIIC disease and more lymphovascular involvement.
“It is encouraging to see the high 5-year breast cancer specific survival rates reported in this cohort,” Judy C. Boughey, MD, professor of surgery and vice chair of research at the Mayo Clinic, Rochester, Minn., said in a statement. “This study supports that the current management of these patients with neoadjuvant chemotherapy, mastectomy and post-mastectomy radiation is the optimal multimodal approach for inflammatory breast cancer. The improvements in systemic therapy, with increased use of directed therapy, being used in breast cancer, together with appropriate local-regional therapies, is likely responsible for the improvement in survival over historical cohorts.”
BIRMINGHAM, ENGLAND – One in five people with ankylosing spondylitis could have comorbid fibromyalgia, according to data from the British Society for Rheumatology Biologics Register for Ankylosing Spondylitis (BSRBR-AS).
The analysis, which included more than 880 patients with axial spondyloarthritis (SpA), found that 20.7% met 2011 research criteria for the chronic pain condition.
The prevalence of fibromyalgia was similar when the modified New York (mNY) criteria were used to diagnose SpA, at 19.7%, but slightly higher at 25.2% when SpA patients met the Assessment of SpondyloArthritis international Society (ASAS) imaging criteria but not mNY criteria, and substantially lower at 9.5% when SpA patients met ASAS clinical criteria only.
Courtesy Dr. Gary J. Macfarlane
Dr. Gary J. Macfarlane
“The background is that some patients with axial SpA are recognized clinically to have comorbid fibromyalgia,” Gary J. Macfarlane, MD, PhD, said at the British Society for Rheumatology annual conference.
Dr. Macfarlane, chief investigator of the BSRBR-AS and professor and chair of clinical epidemiology at the University of Aberdeen (Scotland), added that having comorbid fibromyalgia might “distort the responses of some of the key patient-reported measures and that may lead to some patients having inappropriate therapy.”
So the aim of the present analysis was to provide data on the frequency of SpA and fibromyalgia co-occurrence, characterize which patients might be more likely to have both conditions, and also provide information that would inform future studies looking at the optimal management of such patients.
“The patients most likely to meet fibromyalgia criteria were female, either HLA-B27 negative or untested, and there was a particularly strong association with higher levels of [social] deprivation,” Dr. Macfarlane reported.
Patients who had both SpA and fibromyalgia also were found to be more likely to have been treated with a biologic than those who had SpA alone (51% vs. 32%), and there also was an associated with the time missed (15.1% vs. 2.5%) or impaired (50.8% vs. 22.8%) at work.
In a comparison of the characteristics of patients with SpA who met the fibromyalgia research criteria with those who did not, Dr. Macfarlane observed that they had worse disease activity, function, metrology, and global scores as measured using Bath Ankylosing Spondylitis disease indices:
• Disease activity scores were a respective 6.7 and 3.6, giving a difference of 3.1 (95% confidence interval, 2.9-3.3).
• Function scores were a respective 6.6 and 3.7, with a difference of 2.9 (95% CI, 2.6-3.3).
• Metrology scores were a respective 4.2 and 3.6, with a difference of 0.6 (95% CI, 0.3-0.9).
• Global scores were a respective 6.9 and 3.7, with a different of 3.2 (95% CI, 2.9-3.6).
Dr. Macfarlane reported that there were “extremely large differences” on the patient-reported measures of quality of life, depression, and anxiety. Other common problems in the group meeting the fibromyalgia criteria were sleeping difficulties and high levels of fatigue, he said.
Patients with both SpA and fibromyalgia fared worse on quality of life scores measured using the disease-specific Ankylosing Spondylitis Quality of Life (ASQoL) questionnaire where they scored a mean of 7.1 points (95% CI, 6.4-7.7) higher than did those with SpA alone.
The mean differences in depression and anxiety, both measured using the Hospital Anxiety and Depression Scale (HADS), was 4.8 (95% CI, 4.3-5.2) and 4.7 (95% CI, 4.1-5.2).
The mean difference in the sleep disturbance scale was 5.3 (95% CI, 4.5-6.0), and the mean difference in Chalder Fatigue Scale scores was 4.0 (95% CI, 3.5-4.4).
In contrast, there was no difference in the proportion of patients who had levels of C-reactive protein above 1 mg/dL or in the number of proportion of patients who had extraspinal manifestations of SpA, with the exception of tender or swollen joint counts.
Dr. Macfarlane noted that the fibromyalgia research criteria had not been validated for use in patients with axial SpA but that a grant had been awarded by Arthritis Research UK to look at this and also to look into optimizing options for managing patients with both conditions.
The BSRBR-AS is currently the newest of the biologics registries and began recruiting patients with axial SpA as of December 2012 from 82 centers across the United Kingdom. The register enrolls patients who have not previously been treated with a tumor necrosis factor inhibitor drug and are then followed-up for a 5-year period. The 2011 fibromyalgia research criteria have been used as part of the baseline assessment since September 2015, and clinicians also are asked to report whether they think that patients have fibromyalgia.
The BSRBR-AS is funded by the British Society for Rheumatology, which receives funds from AbbVie, Pfizer, and UCB. Dr. Macfarlane did not report having any conflicts of interest.
BIRMINGHAM, ENGLAND – One in five people with ankylosing spondylitis could have comorbid fibromyalgia, according to data from the British Society for Rheumatology Biologics Register for Ankylosing Spondylitis (BSRBR-AS).
The analysis, which included more than 880 patients with axial spondyloarthritis (SpA), found that 20.7% met 2011 research criteria for the chronic pain condition.
The prevalence of fibromyalgia was similar when the modified New York (mNY) criteria were used to diagnose SpA, at 19.7%, but slightly higher at 25.2% when SpA patients met the Assessment of SpondyloArthritis international Society (ASAS) imaging criteria but not mNY criteria, and substantially lower at 9.5% when SpA patients met ASAS clinical criteria only.
Courtesy Dr. Gary J. Macfarlane
Dr. Gary J. Macfarlane
“The background is that some patients with axial SpA are recognized clinically to have comorbid fibromyalgia,” Gary J. Macfarlane, MD, PhD, said at the British Society for Rheumatology annual conference.
Dr. Macfarlane, chief investigator of the BSRBR-AS and professor and chair of clinical epidemiology at the University of Aberdeen (Scotland), added that having comorbid fibromyalgia might “distort the responses of some of the key patient-reported measures and that may lead to some patients having inappropriate therapy.”
So the aim of the present analysis was to provide data on the frequency of SpA and fibromyalgia co-occurrence, characterize which patients might be more likely to have both conditions, and also provide information that would inform future studies looking at the optimal management of such patients.
“The patients most likely to meet fibromyalgia criteria were female, either HLA-B27 negative or untested, and there was a particularly strong association with higher levels of [social] deprivation,” Dr. Macfarlane reported.
Patients who had both SpA and fibromyalgia also were found to be more likely to have been treated with a biologic than those who had SpA alone (51% vs. 32%), and there also was an associated with the time missed (15.1% vs. 2.5%) or impaired (50.8% vs. 22.8%) at work.
In a comparison of the characteristics of patients with SpA who met the fibromyalgia research criteria with those who did not, Dr. Macfarlane observed that they had worse disease activity, function, metrology, and global scores as measured using Bath Ankylosing Spondylitis disease indices:
• Disease activity scores were a respective 6.7 and 3.6, giving a difference of 3.1 (95% confidence interval, 2.9-3.3).
• Function scores were a respective 6.6 and 3.7, with a difference of 2.9 (95% CI, 2.6-3.3).
• Metrology scores were a respective 4.2 and 3.6, with a difference of 0.6 (95% CI, 0.3-0.9).
• Global scores were a respective 6.9 and 3.7, with a different of 3.2 (95% CI, 2.9-3.6).
Dr. Macfarlane reported that there were “extremely large differences” on the patient-reported measures of quality of life, depression, and anxiety. Other common problems in the group meeting the fibromyalgia criteria were sleeping difficulties and high levels of fatigue, he said.
Patients with both SpA and fibromyalgia fared worse on quality of life scores measured using the disease-specific Ankylosing Spondylitis Quality of Life (ASQoL) questionnaire where they scored a mean of 7.1 points (95% CI, 6.4-7.7) higher than did those with SpA alone.
The mean differences in depression and anxiety, both measured using the Hospital Anxiety and Depression Scale (HADS), was 4.8 (95% CI, 4.3-5.2) and 4.7 (95% CI, 4.1-5.2).
The mean difference in the sleep disturbance scale was 5.3 (95% CI, 4.5-6.0), and the mean difference in Chalder Fatigue Scale scores was 4.0 (95% CI, 3.5-4.4).
In contrast, there was no difference in the proportion of patients who had levels of C-reactive protein above 1 mg/dL or in the number of proportion of patients who had extraspinal manifestations of SpA, with the exception of tender or swollen joint counts.
Dr. Macfarlane noted that the fibromyalgia research criteria had not been validated for use in patients with axial SpA but that a grant had been awarded by Arthritis Research UK to look at this and also to look into optimizing options for managing patients with both conditions.
The BSRBR-AS is currently the newest of the biologics registries and began recruiting patients with axial SpA as of December 2012 from 82 centers across the United Kingdom. The register enrolls patients who have not previously been treated with a tumor necrosis factor inhibitor drug and are then followed-up for a 5-year period. The 2011 fibromyalgia research criteria have been used as part of the baseline assessment since September 2015, and clinicians also are asked to report whether they think that patients have fibromyalgia.
The BSRBR-AS is funded by the British Society for Rheumatology, which receives funds from AbbVie, Pfizer, and UCB. Dr. Macfarlane did not report having any conflicts of interest.
BIRMINGHAM, ENGLAND – One in five people with ankylosing spondylitis could have comorbid fibromyalgia, according to data from the British Society for Rheumatology Biologics Register for Ankylosing Spondylitis (BSRBR-AS).
The analysis, which included more than 880 patients with axial spondyloarthritis (SpA), found that 20.7% met 2011 research criteria for the chronic pain condition.
The prevalence of fibromyalgia was similar when the modified New York (mNY) criteria were used to diagnose SpA, at 19.7%, but slightly higher at 25.2% when SpA patients met the Assessment of SpondyloArthritis international Society (ASAS) imaging criteria but not mNY criteria, and substantially lower at 9.5% when SpA patients met ASAS clinical criteria only.
Courtesy Dr. Gary J. Macfarlane
Dr. Gary J. Macfarlane
“The background is that some patients with axial SpA are recognized clinically to have comorbid fibromyalgia,” Gary J. Macfarlane, MD, PhD, said at the British Society for Rheumatology annual conference.
Dr. Macfarlane, chief investigator of the BSRBR-AS and professor and chair of clinical epidemiology at the University of Aberdeen (Scotland), added that having comorbid fibromyalgia might “distort the responses of some of the key patient-reported measures and that may lead to some patients having inappropriate therapy.”
So the aim of the present analysis was to provide data on the frequency of SpA and fibromyalgia co-occurrence, characterize which patients might be more likely to have both conditions, and also provide information that would inform future studies looking at the optimal management of such patients.
“The patients most likely to meet fibromyalgia criteria were female, either HLA-B27 negative or untested, and there was a particularly strong association with higher levels of [social] deprivation,” Dr. Macfarlane reported.
Patients who had both SpA and fibromyalgia also were found to be more likely to have been treated with a biologic than those who had SpA alone (51% vs. 32%), and there also was an associated with the time missed (15.1% vs. 2.5%) or impaired (50.8% vs. 22.8%) at work.
In a comparison of the characteristics of patients with SpA who met the fibromyalgia research criteria with those who did not, Dr. Macfarlane observed that they had worse disease activity, function, metrology, and global scores as measured using Bath Ankylosing Spondylitis disease indices:
• Disease activity scores were a respective 6.7 and 3.6, giving a difference of 3.1 (95% confidence interval, 2.9-3.3).
• Function scores were a respective 6.6 and 3.7, with a difference of 2.9 (95% CI, 2.6-3.3).
• Metrology scores were a respective 4.2 and 3.6, with a difference of 0.6 (95% CI, 0.3-0.9).
• Global scores were a respective 6.9 and 3.7, with a different of 3.2 (95% CI, 2.9-3.6).
Dr. Macfarlane reported that there were “extremely large differences” on the patient-reported measures of quality of life, depression, and anxiety. Other common problems in the group meeting the fibromyalgia criteria were sleeping difficulties and high levels of fatigue, he said.
Patients with both SpA and fibromyalgia fared worse on quality of life scores measured using the disease-specific Ankylosing Spondylitis Quality of Life (ASQoL) questionnaire where they scored a mean of 7.1 points (95% CI, 6.4-7.7) higher than did those with SpA alone.
The mean differences in depression and anxiety, both measured using the Hospital Anxiety and Depression Scale (HADS), was 4.8 (95% CI, 4.3-5.2) and 4.7 (95% CI, 4.1-5.2).
The mean difference in the sleep disturbance scale was 5.3 (95% CI, 4.5-6.0), and the mean difference in Chalder Fatigue Scale scores was 4.0 (95% CI, 3.5-4.4).
In contrast, there was no difference in the proportion of patients who had levels of C-reactive protein above 1 mg/dL or in the number of proportion of patients who had extraspinal manifestations of SpA, with the exception of tender or swollen joint counts.
Dr. Macfarlane noted that the fibromyalgia research criteria had not been validated for use in patients with axial SpA but that a grant had been awarded by Arthritis Research UK to look at this and also to look into optimizing options for managing patients with both conditions.
The BSRBR-AS is currently the newest of the biologics registries and began recruiting patients with axial SpA as of December 2012 from 82 centers across the United Kingdom. The register enrolls patients who have not previously been treated with a tumor necrosis factor inhibitor drug and are then followed-up for a 5-year period. The 2011 fibromyalgia research criteria have been used as part of the baseline assessment since September 2015, and clinicians also are asked to report whether they think that patients have fibromyalgia.
The BSRBR-AS is funded by the British Society for Rheumatology, which receives funds from AbbVie, Pfizer, and UCB. Dr. Macfarlane did not report having any conflicts of interest.
Key clinical point:Fibromyalgia can coexist in patients with axial spondyloarthritis and appears associated with worse disease activity and quality of life.
Major finding: Of more than 880 patients with axial SpA, 20.7% met 2011 research criteria for the chronic pain condition.
Data source: British Society for Rheumatology Biologics Register for Ankylosing Spondylitis (BSRBR-AS).
Disclosures: The BSRBR-AS is funded by the British Society for Rheumatology, which receives funds from AbbVie, Pfizer, and UCB. Dr. Macfarlane did not report having any conflicts of interest.
BOSTON – Both the soon-to-be chair and vice chair of the AGA Center for GI Innovation and Technology, which sponsors the AGA Tech Summit, are looking forward to building upon the successes of this year’s meeting.
“Giving folks a road map and seeing physicians come to the meeting to network and meet the right people, that is the really satisfying part for me,” V. Raman Muthusamy, MD, the incoming chair of the committee, said in an interview.
“I was honored to be asked to take over this position,” he said. “I have been contemplating . . .where we are and where we’ve been and where we need to go next.”
Dr. Muthusamy, director of interventional endoscopy and general GI endoscopy and current professor of medicine at the University of California, Los Angeles, is keenly interested in the intersection of technical innovation and gastroenterology, especially concerning endoscopic technology.
The committee’s incoming vice chair, Srinadh Komanduri, MD, of Northwestern University’s Feinberg School of Medicine, Chicago, takes a deep interest in innovative medical technologies that are applicable to gastroenterology. “A lot of what I’m doing at Northwestern is cutting-edge techniques and looking for new innovation, especially for early cancers in the GI tract,” Dr. Komanduri said.
Dr. Muthusamy and Dr. Komanduri will assume their new roles June 1 when Michael L. Kochman, MD, AGAF, of the University of Pennsylvania, Philadelphia, retires from his position as executive chairman of the committee, shortly after the close of this year’s AGA Tech Summit. “It’s been an honor and humbling to have been entrusted with running the CGIT over the past term; we solidified a number of critical relationships and added new programs. I am thrilled that Raman and Sri will be taking the reins as the plans that they have will build on the foundation and take the CGIT to a new level.”
The meeting, according to the incoming chairs, offers a great opportunity for physician-innovators to share their interests and ideas.
“The Tech Summit is unlike any other meeting I’ve gone to. It is a time to see the business of science and the gaps in technology as well as the technicalities of business that are not part of the standard medical training,” said Dr. Muthusamy, who moderated this year’s “Shark Tank” session, considered the highlight event of the meeting during which entrepreneurs present their ideas to a panel of doctors and business leaders to gain a diverse range of insight on how to take their projects to the next level.
Learn more about the AGA Center for GI Innovation and Technology at www.gastro.org/CGIT.
BOSTON – Both the soon-to-be chair and vice chair of the AGA Center for GI Innovation and Technology, which sponsors the AGA Tech Summit, are looking forward to building upon the successes of this year’s meeting.
“Giving folks a road map and seeing physicians come to the meeting to network and meet the right people, that is the really satisfying part for me,” V. Raman Muthusamy, MD, the incoming chair of the committee, said in an interview.
“I was honored to be asked to take over this position,” he said. “I have been contemplating . . .where we are and where we’ve been and where we need to go next.”
Dr. Muthusamy, director of interventional endoscopy and general GI endoscopy and current professor of medicine at the University of California, Los Angeles, is keenly interested in the intersection of technical innovation and gastroenterology, especially concerning endoscopic technology.
The committee’s incoming vice chair, Srinadh Komanduri, MD, of Northwestern University’s Feinberg School of Medicine, Chicago, takes a deep interest in innovative medical technologies that are applicable to gastroenterology. “A lot of what I’m doing at Northwestern is cutting-edge techniques and looking for new innovation, especially for early cancers in the GI tract,” Dr. Komanduri said.
Dr. Muthusamy and Dr. Komanduri will assume their new roles June 1 when Michael L. Kochman, MD, AGAF, of the University of Pennsylvania, Philadelphia, retires from his position as executive chairman of the committee, shortly after the close of this year’s AGA Tech Summit. “It’s been an honor and humbling to have been entrusted with running the CGIT over the past term; we solidified a number of critical relationships and added new programs. I am thrilled that Raman and Sri will be taking the reins as the plans that they have will build on the foundation and take the CGIT to a new level.”
The meeting, according to the incoming chairs, offers a great opportunity for physician-innovators to share their interests and ideas.
“The Tech Summit is unlike any other meeting I’ve gone to. It is a time to see the business of science and the gaps in technology as well as the technicalities of business that are not part of the standard medical training,” said Dr. Muthusamy, who moderated this year’s “Shark Tank” session, considered the highlight event of the meeting during which entrepreneurs present their ideas to a panel of doctors and business leaders to gain a diverse range of insight on how to take their projects to the next level.
Learn more about the AGA Center for GI Innovation and Technology at www.gastro.org/CGIT.
BOSTON – Both the soon-to-be chair and vice chair of the AGA Center for GI Innovation and Technology, which sponsors the AGA Tech Summit, are looking forward to building upon the successes of this year’s meeting.
“Giving folks a road map and seeing physicians come to the meeting to network and meet the right people, that is the really satisfying part for me,” V. Raman Muthusamy, MD, the incoming chair of the committee, said in an interview.
“I was honored to be asked to take over this position,” he said. “I have been contemplating . . .where we are and where we’ve been and where we need to go next.”
Dr. Muthusamy, director of interventional endoscopy and general GI endoscopy and current professor of medicine at the University of California, Los Angeles, is keenly interested in the intersection of technical innovation and gastroenterology, especially concerning endoscopic technology.
The committee’s incoming vice chair, Srinadh Komanduri, MD, of Northwestern University’s Feinberg School of Medicine, Chicago, takes a deep interest in innovative medical technologies that are applicable to gastroenterology. “A lot of what I’m doing at Northwestern is cutting-edge techniques and looking for new innovation, especially for early cancers in the GI tract,” Dr. Komanduri said.
Dr. Muthusamy and Dr. Komanduri will assume their new roles June 1 when Michael L. Kochman, MD, AGAF, of the University of Pennsylvania, Philadelphia, retires from his position as executive chairman of the committee, shortly after the close of this year’s AGA Tech Summit. “It’s been an honor and humbling to have been entrusted with running the CGIT over the past term; we solidified a number of critical relationships and added new programs. I am thrilled that Raman and Sri will be taking the reins as the plans that they have will build on the foundation and take the CGIT to a new level.”
The meeting, according to the incoming chairs, offers a great opportunity for physician-innovators to share their interests and ideas.
“The Tech Summit is unlike any other meeting I’ve gone to. It is a time to see the business of science and the gaps in technology as well as the technicalities of business that are not part of the standard medical training,” said Dr. Muthusamy, who moderated this year’s “Shark Tank” session, considered the highlight event of the meeting during which entrepreneurs present their ideas to a panel of doctors and business leaders to gain a diverse range of insight on how to take their projects to the next level.
Learn more about the AGA Center for GI Innovation and Technology at www.gastro.org/CGIT.
Supply of the only U.S.-licensed yellow fever vaccine will be depleted by mid-2017 because of manufacturing issues, according to the Centers for Disease Control and Prevention.
Sanofi Pasteur, the manufacturer of the YF-VAX vaccine, notified the CDC and the Food and Drug Administration in 2016 there could be a shortage this year after the manufacturing complications during a factory switch over led to the loss of a large amount of vaccine supply, according to an article published online in the Morbidity and Mortality Weekly Report.
The shortage is expected to affect government workers and military personnel as well as private travelers, 8 million of whom traveled to at least one of 42 countries with endemic yellow fever virus transmission in 2015 (MMWR. 2017 Apr 28. doi: 10.15585/mmwr.mm6617e2).
The CDC, Sanofi Pasteur, and the FDA are working to supplement the shortage. The manufacturer submitted an expanded investigational new drug (eIND) application to the FDA in September 2016 for marketing permission for Stamaril, an alternative vaccine manufactured by Sanofi Pasteur France and used in around 70 countries.
The application included planning for strategic distribution sites, which the CDC is determining using a tiered system based on volume of doses ordered in 2016.
As of April 2017, 250 civilian sites have been invited to participate in the eIND program, significantly less than the 4,000 currently distributing YF-VAX.
The CDC will “monitor for critical gaps in vaccine access and collaborate to address any issues, including considering the possibility of recruiting additional clinics to participate as necessary,” according to a statement.
Supply of the only U.S.-licensed yellow fever vaccine will be depleted by mid-2017 because of manufacturing issues, according to the Centers for Disease Control and Prevention.
Sanofi Pasteur, the manufacturer of the YF-VAX vaccine, notified the CDC and the Food and Drug Administration in 2016 there could be a shortage this year after the manufacturing complications during a factory switch over led to the loss of a large amount of vaccine supply, according to an article published online in the Morbidity and Mortality Weekly Report.
The shortage is expected to affect government workers and military personnel as well as private travelers, 8 million of whom traveled to at least one of 42 countries with endemic yellow fever virus transmission in 2015 (MMWR. 2017 Apr 28. doi: 10.15585/mmwr.mm6617e2).
The CDC, Sanofi Pasteur, and the FDA are working to supplement the shortage. The manufacturer submitted an expanded investigational new drug (eIND) application to the FDA in September 2016 for marketing permission for Stamaril, an alternative vaccine manufactured by Sanofi Pasteur France and used in around 70 countries.
The application included planning for strategic distribution sites, which the CDC is determining using a tiered system based on volume of doses ordered in 2016.
As of April 2017, 250 civilian sites have been invited to participate in the eIND program, significantly less than the 4,000 currently distributing YF-VAX.
The CDC will “monitor for critical gaps in vaccine access and collaborate to address any issues, including considering the possibility of recruiting additional clinics to participate as necessary,” according to a statement.
Supply of the only U.S.-licensed yellow fever vaccine will be depleted by mid-2017 because of manufacturing issues, according to the Centers for Disease Control and Prevention.
Sanofi Pasteur, the manufacturer of the YF-VAX vaccine, notified the CDC and the Food and Drug Administration in 2016 there could be a shortage this year after the manufacturing complications during a factory switch over led to the loss of a large amount of vaccine supply, according to an article published online in the Morbidity and Mortality Weekly Report.
The shortage is expected to affect government workers and military personnel as well as private travelers, 8 million of whom traveled to at least one of 42 countries with endemic yellow fever virus transmission in 2015 (MMWR. 2017 Apr 28. doi: 10.15585/mmwr.mm6617e2).
The CDC, Sanofi Pasteur, and the FDA are working to supplement the shortage. The manufacturer submitted an expanded investigational new drug (eIND) application to the FDA in September 2016 for marketing permission for Stamaril, an alternative vaccine manufactured by Sanofi Pasteur France and used in around 70 countries.
The application included planning for strategic distribution sites, which the CDC is determining using a tiered system based on volume of doses ordered in 2016.
As of April 2017, 250 civilian sites have been invited to participate in the eIND program, significantly less than the 4,000 currently distributing YF-VAX.
The CDC will “monitor for critical gaps in vaccine access and collaborate to address any issues, including considering the possibility of recruiting additional clinics to participate as necessary,” according to a statement.
Association of inpatient antimicrobial utilization measures with antimicrobial stewardship activities and facility characteristics of Veterans Affairs medical centers
The deleterious impact of inappropriate and/or excessive antimicrobial usage is well recognized. In the United States, the Centers for Disease Control and Prevention (CDC) estimates that at least 2 million people become infected with antimicrobial-resistant bacteria with 23,000 subsequent deaths and at least $1 billion in excess medical costs per year.1
In response, many healthcare organizations have developed antimicrobial stewardship programs (ASPs). Guidelines co-sponsored by the Infectious Diseases Society of America and the Society for Healthcare Epidemiology of America, as well as recent statements from the CDC and the Transatlantic Taskforce on Antimicrobial Resistance,all recommend core ASP elements.2-5 The guidelines provide general recommendations on ASP structure, strategies, and activities. The recommended ASP structure is a team of physicians and pharmacists that collaborates with facility governing committees and other stakeholders to optimize antimicrobial use. While personnel with expertise in infectious diseases (ID) often lead ASPs, hospitalists are also recognized as key contributors, especially in quality improvement.6,7 Recommended strategies include prospective audit of antimicrobial use with intervention and feedback and formulary restriction with preauthorization. Recommended activities include education, creation of guidelines, clinical pathways, and order forms, and programs to promote de-escalation and conversion from parenteral (IV) to oral (PO) antimicrobial therapy. However, limited evidence exists regarding the effectiveness of these ASP core elements.8,9 While Cochrane reviews found clear evidence that particular stewardship strategies (eg, audit and feedback, formulary restriction, guidelines implemented with or without feedback, protocols, computerized decision support) can be effective in reducing antimicrobial usage and improving clinical outcomes over the long term, little evidence exists favoring 1 strategy over another.8 Furthermore, most individual studies of ASPs are single-center, making their conclusions less generalizable.
In 2012, the VA National Antimicrobial Stewardship Task Force (ASTF), in conjunction with the VA Healthcare Analysis and Information Group (HAIG) administered a survey on the characteristics of ASPs at all 130 acute care VA facilities (Appendix A). We used these survey results to build an implementation model and then assess associations between facility-level variables and 4 antimicrobial utilization measures.
METHODS
Survey and Data
In 2011, the ASTF was chartered to develop, deploy, and monitor a strategic plan for optimizing antimicrobial therapy management. Monthly educational webinars and sample policies were offered to all facilities, including a sample business plan for stewardship and policies to encourage de-escalation from broad-spectrum antimicrobials, promote conversion from parenteral to oral antimicrobial therapy, avoid unnecessary double anaerobic coverage, and mitigate unnecessary antimicrobial usage in the context of Clostridium difficile infection.10
At the time that ASTF was chartered, the understanding of how ASP structures across VA facilities operated was limited. Hence, to capture baseline institutional characteristics and stewardship activities, ASTF and HAIG developed an inventory assessment of ASPs that was distributed online in November 2012. All 130 VA facilities providing inpatient acute care services responded.
We derived 57 facility characteristics relevant to antimicrobial utilization and conducted a series of factor analyses to simplify the complex dataset, and identify underlying latent constructs. We categorized resulting factors into domains of evidence, context, or facilitation as guided by the Promoting Action on Research Implementation in Health Services framework.11 Briefly, the evidence domain describes how the facility uses codified and noncodified sources of knowledge (eg, research evidence, clinical experience). Organizational context comprises a facility’s characteristics that ensure a more conducive environment to put evidence into practice (eg, supportive leadership, organizational structure, evaluative systems). Facilitation emphasizes a facility personnel’s “state of preparedness” and receptivity to implementation.
Using factor analysis to identify facility factors as correlates of the outcomes, we first examined polychoric correlations among facility characteristics to assess multicollinearity. We performed independent component analysis to create latent constructs of variables that were defined by factor loadings (that indicated the proportion of variance accounted for by the construct) and uniqueness factors (that determined how well the variables were interpreted by the construct). Factors retained included variables that had uniqueness values of less than 0.7 and factor loadings greater than 0.3. Those associated with uniqueness values greater than 0.7 were left as single items, as were characteristics deemed a priori to be particularly important to antimicrobial stewardship. Factor scales that had only 2 items were converted into indices, while factor scores were generated for those factors that contained 3 or more items.12-15
Data for facility-level antimicrobial utilization measures were obtained from the VA Corporate Data Warehouse from calendar year 2012. The analysis was conducted within the VA Informatics and Computing Infrastructure. All study procedures were approved by the VA Central Institutional Review Board.
Measures
Four utilization measures were defined as dependent measures: overall antimicrobial use; antimicrobial use in patients with non-infectious discharge diagnoses; missed opportunities to convert from parenteral to oral antimicrobial therapy; and missed opportunities to avoid double anaerobic coverage with metronidazole.
Overall antimicrobial use was defined as total acute care (ie, medical/surgical/intensive care) antibacterial use for each facility aggregated as per CDC National Healthcare Safety Network Antimicrobial Use Option guidelines (antimicrobial days per 1000 patient days present). A subanalysis of overall antimicrobial use was restricted to antimicrobial use among patients without an infection-related discharge diagnosis, as we surmised that this measure may capture a greater proportion of potentially unnecessary antimicrobial use. International Classification of Diseases, Ninth Revision, Clinical Modification (ICD-9-CM)16 codes for infectious processes were identified by a combination of those classified previously in the literature,17 and those identified by finding the descendants of all infections named in the Systematized Nomenclature of Medicine--Clinical Terms.18 Next, all remaining codes for principal discharge diagnoses for which antimicrobials were administered were reviewed for potential indications for systemic antibacterial use. Discharges were considered noninfectious if no codes were identified when systemic antimicrobials were or could be indicated. For this measure, antimicrobial days were not counted if administered on or 1 day after the calendar day of surgery warranting antimicrobial prophylaxis.
Missed opportunities for conversion from parenteral to oral (IV to PO) formulations of highly bioavailable oral antimicrobials (ciprofloxacin, levofloxacin, moxifloxacin, azithromycin, clindamycin, linezolid, metronidazole, and fluconazole) were defined as the percentage of days of unnecessary IV therapy that were given when PO therapy could have been used among patients who were not in intensive care units at the time of antimicrobial administration who were receiving other oral medications, using previously described methodology.19Missed opportunities for avoiding redundant anaerobic coverage with metronidazole were defined as the percentage of days in which patients receiving metronidazole also receivedantibiotics with activity against anaerobic bacteria, specifically beta-lactam/beta-lactamase inhibitors, carbapenems, cefotetan/cefoxitin, clindamycin, moxifloxacin, or tigecycline), using previously described methodology.20 Patients for whom C. difficile testing was either ordered or positive within the prior 28 days (indicating potential clinical concern for C. difficile infection) were excluded from this endpoint.
Analysis
The variables derived above were entered into a multivariable model for each of the 4 antimicrobial utilization measures. The least absolute shrinkage and selection operator (LASSO) regression was used to determine significant associations between variables and individual utilization measures.21 LASSO was chosen because it offers advantages over traditional subset selection approaches in large multivariable analyses by assessing covariates simultaneously rather than sequentially, supporting prediction rather than estimation of effect.22P values were not reported as they are not useful in determining statistical significance in this methodology. A tuning parameter of 0.025 was determined for the model based on a cross-validation approach. Significant variables remaining in the model were reported with the percent change in each utilization measure per unit change in the variable of interest. For binary factors, percent change was reported according to whether the variable was present or not. For ordinal variables, percent change was reported according to incremental increase in ordinal score. For continuous variables or variables represented by factor or index scores, percent change was reported per each 25% increase in the range of the score.
RESULTS
Inpatient Facility Antimicrobial Stewardship Characteristics and Antimicrobial Utilization
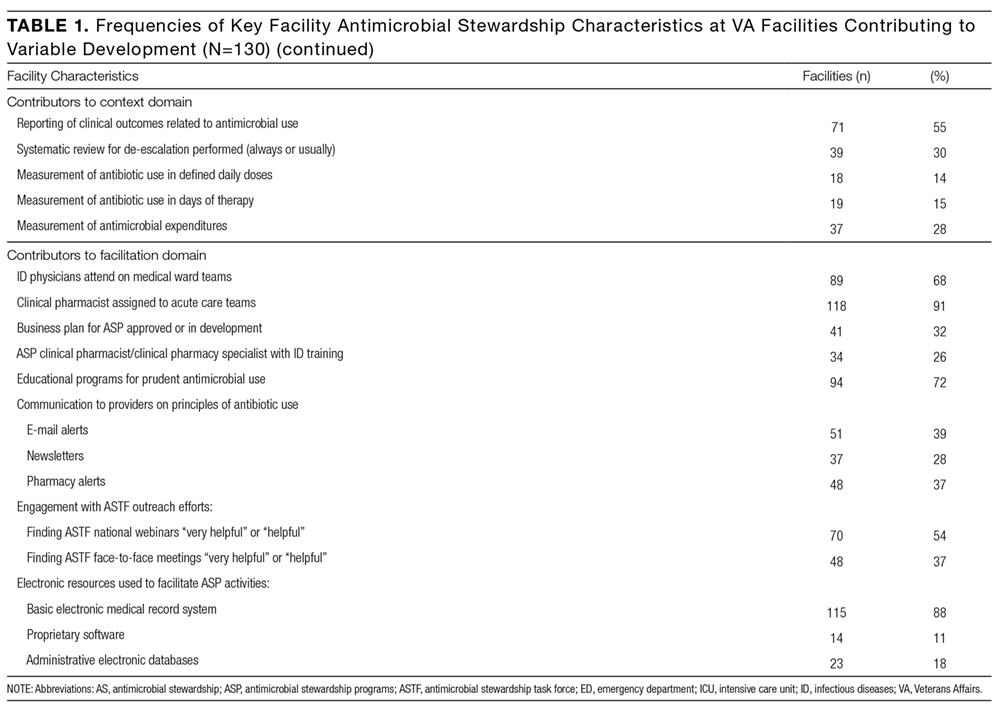
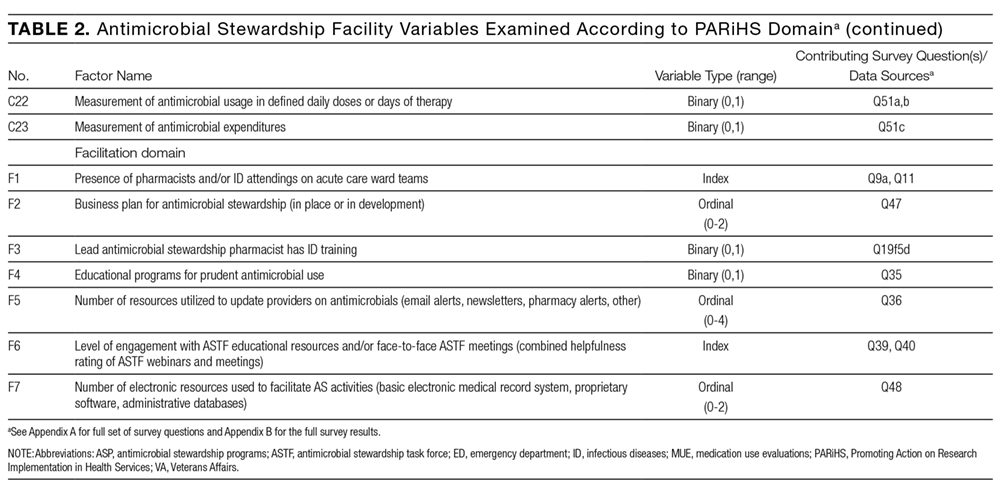
Frequencies of key facility characteristics that contributed to variable development are included in Table 1. Full survey results across all facilities are included in Appendix B. Factor analysis reduced the total number of variables to 32; however, we also included hospital size and VA complexity score. Thus, 34 variables were evaluated for association with antimicrobial utilization measures: 4 in the evidence domain, 23 in the context domain, and 7 in the facilitation domain (Table 2).
Table 1
Table 1 (continued)
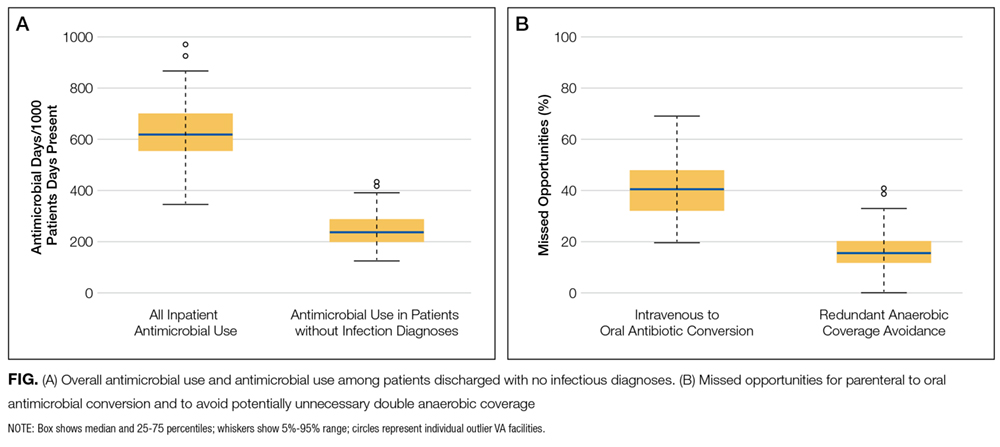
Median facility antimicrobial use was 619 antimicrobial days per 1000 days present (interquartile range [IQR], 554-700; overall range, 346-974). Median facility noninfectious antimicrobial use was 236 per 1000 days present (IQR, 200-286). Missed opportunities for conversion from IV to PO antimicrobial therapy were common, with a median facility value of 40.4% (391/969) of potentially eligible days of therapy (IQR, 32.2-47.8%). Missed opportunities to avoid double anaerobic coverage were less common (median 15.3% (186/1214) of potentially eligible days of therapy (IQR, 11.8%-20.2%; Figure).
Overall Antimicrobial Use
Four variables were associated with decreased overall antimicrobial use, although with small magnitude of change: presence of postgraduate physician/pharmacy training programs (0.03% decrease per quarter increase in factor score; on the order of 0.2 antimicrobial days per 1000 patient days present), presence of pharmacists and/or ID attendings on general medicine ward teams (0.02% decrease per quarter increase in index score), frequency of systematic de-escalation review (0.01% decrease per ordinal increase in score), and degree of involvement of ID physicians and/or fellows in antimicrobial approvals (0.007% decrease per quarter increase in index score). No variables were associated with increased overall antimicrobial use.
Table 2
Table 2 (continued)
Antimicrobial Use among Discharges without Infectious Diagnoses
Six variables were associated with decreased antimicrobial use in patients without infectious discharge diagnoses, while 4 variables were associated with increased use. Variables associated with the greatest magnitude of decreased use included facility educational programs for prudent antimicrobial use (1.8% on the order of 4 antimicrobial days per 1000 patient days present), frequency of systematic de-escalation review (1.5% per incremental increase in score), and whether a facility’s lead antimicrobial stewardship pharmacist had ID training (1.3%). Also significantly associated with decreased use was a factor summarizing the presence of 4 condition-specific stewardship processes (de-escalation policies, policies for addressing antimicrobial use in the context of C. difficile infection, blood culture review, and automatic ID consults for certain conditions) (0.6% per quarter increase in factor score range), the extent to which postgraduate physician/pharmacy training programs were present (0.6% per quarter increase in factor score range), and the number of electronic antimicrobial-specific order sets present (0.4% per order set). The variables associated with increased use of antimicrobials included the presence of antimicrobial stop orders (4.6%), the degree to which non-ID physicians were involved in antimicrobial approvals (0.7% per increase in ordinal score), the level engagement with ASTF online resources (0.6% per quarter increase in factor score range), and hospital size (0.6% per 50-bed increase).
Figure
Missed Opportunities for Parenteral to Oral Antimicrobial Conversion
Missed opportunities for IV to PO antimicrobial conversion had the largest number of significant associations with organizational variables: 14 variables were associated with fewer missed opportunities, while 5 were associated with greater missed opportunities. Variables associated with the largest reductions in missed opportunities for IV to PO conversion included having guidelines for antimicrobial duration (12.8%), participating in regional stewardship collaboratives (8.1%), number of antimicrobial-specific order sets (6.0% per order set), ID training of the ASP pharmacist (4.9%), and VA facility complexity designation (4.2% per quarter increase in score indicating greater complexity).23 Variables associated with more missed opportunities included stop orders (11.7%), overall perceived receptiveness to antimicrobial stewardship among clinical services (9.4%), the degree of engagement with ASTF online resources (6.9% per quarter increase in factor score range), educational programs for prudent antimicrobial use (4.1%), and hospital size (1.0% per 50-bed increase).
Missed Opportunities for Avoidance of Double Anaerobic Coverage
Four variables were associated with more avoidance of double anaerobic coverage: ID training of the lead ASP pharmacist (8.8%), presence of pharmacists and/or ID attendings on acute care ward teams (6.2% per quarter increase in index score), degree of ID pharmacist involvement in antimicrobial approvals, ranging from not at all (score=0) to both weekdays and nights/weekends (score=2; 4.3% per ordinal increase), and the number of antimicrobial-specific order sets (1.5% per order set). No variables were associated with less avoidance of double anaerobic coverage.
Variables Associated with Multiple Favorable or Unfavorable Antimicrobial Utilization Measures
To better assess the consistency of the relationship between organizational variables and measures of antimicrobial use, we tabulated variables that were associated with at least 3 potentially favorable (ie, reduced overall or noninfectious antimicrobial use or fewer missed opportunities) measures. Altogether, 5 variables satisfied this criterion: the presence of postgraduate physician/pharmacy training programs, the number of antimicrobial-specific order sets, frequency of systematic de-escalation review, the presence of pharmacists and/or ID attendings on acute care ward teams, and formal ID training of the lead ASP pharmacist (Table 3). Three other variables were associated with at least 2 unfavorable measures: hospital size, the degree to which the facility engaged with ASTF online resources, and presence of antimicrobial stop orders.
Table 3
DISCUSSION
Variability in ASP implementation across VA allowed us to assess the relationship between ASP and facility elements and baseline patterns of antimicrobial utilization. Hospitalists and hospital policy-makers are becoming more and more engaged in inpatient antimicrobial stewardship. While our results suggest that having pharmacists and/or physicians with formal ID training participate in everyday inpatient activities can favorably improve antimicrobial utilization, considerable input into stewardship can be made by hospitalists and policy makers. In particular, based on this work, the highest yield from an organizational standpoint may be in working to develop order sets within the electronic medical record and systematic efforts to promote de-escalation of broad-spectrum therapy, as well as encouraging hospital administration to devote specific physician and pharmacy salary support to stewardship efforts.
While we noted that finding the ASTF online resources helpful was associated with potentially unfavorable antimicrobial utilization, we speculate that this may represent reverse causality due to facilities recognizing that their antimicrobial usage is suboptimal and thus seeking out sample ASTF policies to implement. The association between the presence of automatic stop orders and potentially unfavorable antimicrobial utilization is less clear since the timeframe was not specified in the survey; it may be that setting stop orders too far in advance may promote an environment in which critical thinking about antimicrobial de-escalation is not encouraged or timely. The larger magnitude of association between ASP characteristics and antimicrobial usage among patients without infectious discharge diagnoses versus overall antimicrobial usage also suggests that clinical situations where infection was of low enough suspicion to not even have the providers eventually list an infectious diagnosis on their discharge summaries may be particularly malleable to ASP interventions, though further exploration is needed in determining how useful this utilization measure may be as a marker for inappropriate antimicrobial use.
Our results complement those of Pakyz et al.24 who surveyed 44 academic medical facilities in March 2013 to develop an ASP intensity score and correlate this score and its specific components to overall and targeted antimicrobial use. This study found that the overall ASP intensity score was not significantly associated with total or targeted antimicrobial use. However, ASP strategies were more associated with decreased total and targeted antimicrobial use than were specific ASP resources. In particular, the presence of a preauthorization strategy was associated with decreased targeted antimicrobial use. Our particular findings that order set establishment and de-escalation efforts are associated with multiple antibiotic outcomes also line up with the findings of Schuts et al,who performed a meta-analysis of the effects of meeting antimicrobial stewardship objectives and found that achieving guideline concordance (such as through establishment of order sets) and successfully de-escalating antimicrobial therapy was associated with reduced mortality.25,26 This meta-analysis, however, was limited by low rigor of its studies and potential for reverse causality. While our study has the advantages of capturing an entire national network of 130 acute care facilities with a 100% response rate, it, too, is limited by a number of issues, most notably by the fact that the survey was not specifically designed for the analysis of antimicrobial utilization measures, patient-level risk stratification was not available, the VA population does not reflect the U.S. population at-large, recall bias, and that antimicrobial prescribing and stewardship practices have evolved in VA since 2012. Furthermore, all of the antimicrobial utilization measures studied are imperfect at capturing inappropriate antibiotic use; in particular, our reliance on principal ICD-9 codes for noninfectious outcomes requires prospective validation. Many survey questions were subjective and subject to misinterpretation; other unmeasured confounders may also be present. Causality cannot be inferred from association. Nevertheless, our findings support many core indicators for hospital ASP recommended by the CDC and the Transatlantic Taskforce on Antimicrobial Resistance,3,4 most notably, having personnel with ID training involved in stewardship and establishing a formal procedure for ASP review for the appropriateness of an antimicrobial at or after 48 hours from the initial order.
In summary, the VA has made efforts to advance the practice of antimicrobial stewardship system-wide, including a 2014 directive that all VA facilities have an ASP,27 since the 2012 HAIG assessment reported considerable variability in antimicrobial utilization and antimicrobial stewardship activities. Our study identifies areas of stewardship that may correlate with, positively or negatively, antimicrobial utilization measures that will require further investigation. A repeat and more detailed antimicrobial stewardship survey was recently completed and will help VA gauge ongoing effects of ASTF activities. We hope to re-evaluate our model with newer data when available.
Acknowledgments
The authors wish to thank Michael Fletcher, Jaime Lopez, and Catherine Loc-Carrillo for their administrative and organizational support of the project and Allison Kelly, MD, for her pivotal role in survey development and distribution. This work was supported by the VA Health Services Research and Development Service Collaborative Research to Enhance and Advance Transformation and Excellence (CREATE) Initiative; Cognitive Support Informatics for Antimicrobial Stewardshipproject (CRE 12-313).
Disclosure
The authors report no financial conflicts of interest.
1. Antibiotic resistance threats in the United States, 2013. Atlanta, GA: Centers for Disease Control and Prevention. http://www.cdc.gov/drugresistance/threat-report-2013/. Published 2013. Accessed January 7, 2016. 2. Dellit TH, Owens RC, McGowan JE Jr, et al. Infectious Diseases Society of America and the Society for Healthcare Epidemiology of America guidelines for developing an institutional program to enhance antimicrobial stewardship. Clin Infect Dis. 2007;44(2):159-177. PubMed 3. Centers for Disease Control and Prevention. Core elements of hospital antibiotic stewardship programs. Atlanta, GA: Centers for Disease Control and Prevention. http://www.cdc.gov/getsmart/healthcare/implementation/core-elements.html. Published 2015. Accessed January 7, 2016. 4. Pollack LA, Plachouras D, Gruhler H, Sinkowitz-Cochran R. Transatlantic taskforce on antimicrobial resistance (TATFAR) summary of the modified Delphi process for common structure and process indicators for hospital antimicrobial stewardship programs. http://www.cdc.gov/drugresistance/pdf/summary_of_tatfar_recommendation_1.pdf. Published 2015. Accessed January 7, 2016. 5. Barlam TF, Cosgrove SE, Abbo LM, MacDougal C, Schuetz AN, Septimus EJ, et al. Implementing an Antibiotic Stewardship Program: Guidelines by the Infectious Diseases Society of America and the Society for Healthcare Epidemiology of America. Clin Infect Dis. 2016;62(10):e51-e77. PubMed 6. Rohde JM, Jacobsen D, Rosenberg DJ. Role of the hospitalist in antimicrobial stewardship: a review of work completed and description of a multisite collaborative. Clin Ther. 2013;35(6):751-757. PubMed 7. Mack MR, Rohde JM, Jacobsen D, Barron JR, Ko C, Goonewardene M, et al. Engaging hospitalists in antimicrobial stewardship: lessons from a multihosopital collaborative. J Hosp Med. 2016;11(8):576-580. PubMed 8. Davey P, Brown E, Charani E, Fenelon L, Gould IM, Holmes A, et al. Interventions to improve antibiotic prescribing practices for hospital inpatients. Cochrane Database Syst Rev. 2013;4:CD003543. PubMed 9. Filice G, Drekonja D, Wilt TJ, Greer N, Butler M, Wagner B. Antimicrobial stewardship programs in inpatient settings: a systematic review. Washington, DC: Department of Veterans Affairs Health Services Research and Development. http://www.hsrd.research.va.gov/publications/esp/antimicrobial.pdf. Published 2013. Accessed January 7, 2016. 10. Graber CJ, Madaras-Kelly K, Jones MM, Neuhauser MM, Goetz MB. Unnecessary antimicrobial use in the context of Clostridium difficile infection: a call to arms for the Veterans Affairs Antimicrobial Stewardship Task Force. Infect Control Hosp Epidemiol. 2013(6);34:651-653. PubMed 11. Rycroft-Malone J. The PARIHS framework--a framework for guiding the implementation of evidence-based practice. J Nurs Care Qual. 2004;19(4):297-304. PubMed 12. Chou AF, Graber CJ, Jones MM, Zhang Y, Goetz MB, Madaras-Kelly K, et al. Specifying an implementation framework for VA antimicrobial stewardship programs. Oral presentation at the VA HSR&D/QUERI National Conference, July 8-9, 2015. Washington, DC: U.S. Department of Veterans Affairs. http://www.hsrd.research.va.gov/meetings/2015/abstract-display.cfm?RecordID=862. Accessed July 5, 2016. 13. Bartholomew DJ. Factor analysis for categorical data. J R Stat Soc. 1980;42:293-321. 14. Flanagan M, Ramanujam R, Sutherland J, Vaughn T, Diekema D, Doebbeling BN. Development and validation of measures to assess prevention and control of AMR in hospitals. Med Care. 2007;45(6): 537-544. PubMed 15. Kline P. An easy guide to factor analysis. New York: Routledge, 1994. 16. Centers for Disease Control and Prevention, National Center for Health Statistics. International Classification of Diseases, Ninth Revision, Clinical Modification (ICD-9-CM). Atlanta GA: Centers for Disease Control and Prevention. http://www.cdc.gov/nchs/icd/icd9cm.htm. Published 2013. Accessed January 7, 2016. 17. Huttner B, Jones M, Huttner A, Rubin M, Samore MH. Antibiotic prescription practices for pneumonia, skin and soft tissue infections and urinary tract infections throughout the US Veterans Affairs system. J Antimicrob Chemother. 2013;68(10):2393-2399. PubMed 18. National Institutes of Health. SNOMED Clinical Terms (SNOMED CT). Bethesda, MD: U.S. National Library of Medicine. https://www.nlm.nih.gov/research/umls/Snomed/snomed_main.html. NIH website. Published 2009. Accessed January 7. 2016. 19. Jones M, Huttner B, Madaras-Kelly K, Nechodom K, Nielson C, Bidwell Goetz M, et al. Parenteral to oral conversion of fluoroquinolones: low-hanging fruit for antimicrobial stewardship programs? Infect Control Hosp Epidemiol 2012;33(4): 362-367. PubMed 20. Huttner B, Jones M, Rubin MA, Madaras-Kelly K, Nielson C, Goetz MB, et al. Double trouble: how big a problem is redundant anaerobic antibiotic coverage in Veterans Affairs medical centres? J Antimicrob Chemother. 2012;67(6):1537-1539. PubMed 21. Tibshirani R. Regression shrinkage and selection via the lasso. J R Stat Soc B. 1996;58:267-288. 22. Taylor J, Tibshirani RJ. Statistical learning and selective inference. Proc Natl Acad Sci U S A. 2015;112(25):7629-7634. PubMed 23. VHA Office of Productivity, Efficiency, and Staffing. Facility Complexity Levels. Department of Veterans Affairs website. http://opes.vssc.med.va.gov/FacilityComplexityLevels/Pages/default.aspx. Published 2008. Accessed January 7, 2016. 24. Pakyz AL, Moczygemba LR, Wang H, Stevens MP, Edmond MB. An evaluation of the association between an antimicrobial stewardship score and antimicrobial usage. J Antimicrob Chemother. 2015;70(5):1588-1591. PubMed 25. Schuts EC, Hulscher ME, Mouton JW, Verduin CM, Stuart JW, Overdiek HW, et al. Current evidence on hospital antimicrobial stewardship objectives: a systematic review and meta-analysis. Lancet Infect Dis. 2016;16(7):847-856. PubMed 26. Graber CJ, Goetz MB. Next steps for antimicrobial stewardship. Lancet Infect Dis. 2016;16(7):764-765. PubMed 27. Petzel RA. VHA Directive 1031: Antimicrobial stewardship programs (ASP). Washington, DC: Department of Veterans Affairs.http://www.va.gov/vhapublications/ViewPublication.asp?pub_ID=2964. Published January 22, 2014. Accessed July 5, 2016.
The deleterious impact of inappropriate and/or excessive antimicrobial usage is well recognized. In the United States, the Centers for Disease Control and Prevention (CDC) estimates that at least 2 million people become infected with antimicrobial-resistant bacteria with 23,000 subsequent deaths and at least $1 billion in excess medical costs per year.1
In response, many healthcare organizations have developed antimicrobial stewardship programs (ASPs). Guidelines co-sponsored by the Infectious Diseases Society of America and the Society for Healthcare Epidemiology of America, as well as recent statements from the CDC and the Transatlantic Taskforce on Antimicrobial Resistance,all recommend core ASP elements.2-5 The guidelines provide general recommendations on ASP structure, strategies, and activities. The recommended ASP structure is a team of physicians and pharmacists that collaborates with facility governing committees and other stakeholders to optimize antimicrobial use. While personnel with expertise in infectious diseases (ID) often lead ASPs, hospitalists are also recognized as key contributors, especially in quality improvement.6,7 Recommended strategies include prospective audit of antimicrobial use with intervention and feedback and formulary restriction with preauthorization. Recommended activities include education, creation of guidelines, clinical pathways, and order forms, and programs to promote de-escalation and conversion from parenteral (IV) to oral (PO) antimicrobial therapy. However, limited evidence exists regarding the effectiveness of these ASP core elements.8,9 While Cochrane reviews found clear evidence that particular stewardship strategies (eg, audit and feedback, formulary restriction, guidelines implemented with or without feedback, protocols, computerized decision support) can be effective in reducing antimicrobial usage and improving clinical outcomes over the long term, little evidence exists favoring 1 strategy over another.8 Furthermore, most individual studies of ASPs are single-center, making their conclusions less generalizable.
In 2012, the VA National Antimicrobial Stewardship Task Force (ASTF), in conjunction with the VA Healthcare Analysis and Information Group (HAIG) administered a survey on the characteristics of ASPs at all 130 acute care VA facilities (Appendix A). We used these survey results to build an implementation model and then assess associations between facility-level variables and 4 antimicrobial utilization measures.
METHODS
Survey and Data
In 2011, the ASTF was chartered to develop, deploy, and monitor a strategic plan for optimizing antimicrobial therapy management. Monthly educational webinars and sample policies were offered to all facilities, including a sample business plan for stewardship and policies to encourage de-escalation from broad-spectrum antimicrobials, promote conversion from parenteral to oral antimicrobial therapy, avoid unnecessary double anaerobic coverage, and mitigate unnecessary antimicrobial usage in the context of Clostridium difficile infection.10
At the time that ASTF was chartered, the understanding of how ASP structures across VA facilities operated was limited. Hence, to capture baseline institutional characteristics and stewardship activities, ASTF and HAIG developed an inventory assessment of ASPs that was distributed online in November 2012. All 130 VA facilities providing inpatient acute care services responded.
We derived 57 facility characteristics relevant to antimicrobial utilization and conducted a series of factor analyses to simplify the complex dataset, and identify underlying latent constructs. We categorized resulting factors into domains of evidence, context, or facilitation as guided by the Promoting Action on Research Implementation in Health Services framework.11 Briefly, the evidence domain describes how the facility uses codified and noncodified sources of knowledge (eg, research evidence, clinical experience). Organizational context comprises a facility’s characteristics that ensure a more conducive environment to put evidence into practice (eg, supportive leadership, organizational structure, evaluative systems). Facilitation emphasizes a facility personnel’s “state of preparedness” and receptivity to implementation.
Using factor analysis to identify facility factors as correlates of the outcomes, we first examined polychoric correlations among facility characteristics to assess multicollinearity. We performed independent component analysis to create latent constructs of variables that were defined by factor loadings (that indicated the proportion of variance accounted for by the construct) and uniqueness factors (that determined how well the variables were interpreted by the construct). Factors retained included variables that had uniqueness values of less than 0.7 and factor loadings greater than 0.3. Those associated with uniqueness values greater than 0.7 were left as single items, as were characteristics deemed a priori to be particularly important to antimicrobial stewardship. Factor scales that had only 2 items were converted into indices, while factor scores were generated for those factors that contained 3 or more items.12-15
Data for facility-level antimicrobial utilization measures were obtained from the VA Corporate Data Warehouse from calendar year 2012. The analysis was conducted within the VA Informatics and Computing Infrastructure. All study procedures were approved by the VA Central Institutional Review Board.
Measures
Four utilization measures were defined as dependent measures: overall antimicrobial use; antimicrobial use in patients with non-infectious discharge diagnoses; missed opportunities to convert from parenteral to oral antimicrobial therapy; and missed opportunities to avoid double anaerobic coverage with metronidazole.
Overall antimicrobial use was defined as total acute care (ie, medical/surgical/intensive care) antibacterial use for each facility aggregated as per CDC National Healthcare Safety Network Antimicrobial Use Option guidelines (antimicrobial days per 1000 patient days present). A subanalysis of overall antimicrobial use was restricted to antimicrobial use among patients without an infection-related discharge diagnosis, as we surmised that this measure may capture a greater proportion of potentially unnecessary antimicrobial use. International Classification of Diseases, Ninth Revision, Clinical Modification (ICD-9-CM)16 codes for infectious processes were identified by a combination of those classified previously in the literature,17 and those identified by finding the descendants of all infections named in the Systematized Nomenclature of Medicine--Clinical Terms.18 Next, all remaining codes for principal discharge diagnoses for which antimicrobials were administered were reviewed for potential indications for systemic antibacterial use. Discharges were considered noninfectious if no codes were identified when systemic antimicrobials were or could be indicated. For this measure, antimicrobial days were not counted if administered on or 1 day after the calendar day of surgery warranting antimicrobial prophylaxis.
Missed opportunities for conversion from parenteral to oral (IV to PO) formulations of highly bioavailable oral antimicrobials (ciprofloxacin, levofloxacin, moxifloxacin, azithromycin, clindamycin, linezolid, metronidazole, and fluconazole) were defined as the percentage of days of unnecessary IV therapy that were given when PO therapy could have been used among patients who were not in intensive care units at the time of antimicrobial administration who were receiving other oral medications, using previously described methodology.19Missed opportunities for avoiding redundant anaerobic coverage with metronidazole were defined as the percentage of days in which patients receiving metronidazole also receivedantibiotics with activity against anaerobic bacteria, specifically beta-lactam/beta-lactamase inhibitors, carbapenems, cefotetan/cefoxitin, clindamycin, moxifloxacin, or tigecycline), using previously described methodology.20 Patients for whom C. difficile testing was either ordered or positive within the prior 28 days (indicating potential clinical concern for C. difficile infection) were excluded from this endpoint.
Analysis
The variables derived above were entered into a multivariable model for each of the 4 antimicrobial utilization measures. The least absolute shrinkage and selection operator (LASSO) regression was used to determine significant associations between variables and individual utilization measures.21 LASSO was chosen because it offers advantages over traditional subset selection approaches in large multivariable analyses by assessing covariates simultaneously rather than sequentially, supporting prediction rather than estimation of effect.22P values were not reported as they are not useful in determining statistical significance in this methodology. A tuning parameter of 0.025 was determined for the model based on a cross-validation approach. Significant variables remaining in the model were reported with the percent change in each utilization measure per unit change in the variable of interest. For binary factors, percent change was reported according to whether the variable was present or not. For ordinal variables, percent change was reported according to incremental increase in ordinal score. For continuous variables or variables represented by factor or index scores, percent change was reported per each 25% increase in the range of the score.
RESULTS
Inpatient Facility Antimicrobial Stewardship Characteristics and Antimicrobial Utilization
Frequencies of key facility characteristics that contributed to variable development are included in Table 1. Full survey results across all facilities are included in Appendix B. Factor analysis reduced the total number of variables to 32; however, we also included hospital size and VA complexity score. Thus, 34 variables were evaluated for association with antimicrobial utilization measures: 4 in the evidence domain, 23 in the context domain, and 7 in the facilitation domain (Table 2).
Table 1
Table 1 (continued)
Median facility antimicrobial use was 619 antimicrobial days per 1000 days present (interquartile range [IQR], 554-700; overall range, 346-974). Median facility noninfectious antimicrobial use was 236 per 1000 days present (IQR, 200-286). Missed opportunities for conversion from IV to PO antimicrobial therapy were common, with a median facility value of 40.4% (391/969) of potentially eligible days of therapy (IQR, 32.2-47.8%). Missed opportunities to avoid double anaerobic coverage were less common (median 15.3% (186/1214) of potentially eligible days of therapy (IQR, 11.8%-20.2%; Figure).
Overall Antimicrobial Use
Four variables were associated with decreased overall antimicrobial use, although with small magnitude of change: presence of postgraduate physician/pharmacy training programs (0.03% decrease per quarter increase in factor score; on the order of 0.2 antimicrobial days per 1000 patient days present), presence of pharmacists and/or ID attendings on general medicine ward teams (0.02% decrease per quarter increase in index score), frequency of systematic de-escalation review (0.01% decrease per ordinal increase in score), and degree of involvement of ID physicians and/or fellows in antimicrobial approvals (0.007% decrease per quarter increase in index score). No variables were associated with increased overall antimicrobial use.
Table 2
Table 2 (continued)
Antimicrobial Use among Discharges without Infectious Diagnoses
Six variables were associated with decreased antimicrobial use in patients without infectious discharge diagnoses, while 4 variables were associated with increased use. Variables associated with the greatest magnitude of decreased use included facility educational programs for prudent antimicrobial use (1.8% on the order of 4 antimicrobial days per 1000 patient days present), frequency of systematic de-escalation review (1.5% per incremental increase in score), and whether a facility’s lead antimicrobial stewardship pharmacist had ID training (1.3%). Also significantly associated with decreased use was a factor summarizing the presence of 4 condition-specific stewardship processes (de-escalation policies, policies for addressing antimicrobial use in the context of C. difficile infection, blood culture review, and automatic ID consults for certain conditions) (0.6% per quarter increase in factor score range), the extent to which postgraduate physician/pharmacy training programs were present (0.6% per quarter increase in factor score range), and the number of electronic antimicrobial-specific order sets present (0.4% per order set). The variables associated with increased use of antimicrobials included the presence of antimicrobial stop orders (4.6%), the degree to which non-ID physicians were involved in antimicrobial approvals (0.7% per increase in ordinal score), the level engagement with ASTF online resources (0.6% per quarter increase in factor score range), and hospital size (0.6% per 50-bed increase).
Figure
Missed Opportunities for Parenteral to Oral Antimicrobial Conversion
Missed opportunities for IV to PO antimicrobial conversion had the largest number of significant associations with organizational variables: 14 variables were associated with fewer missed opportunities, while 5 were associated with greater missed opportunities. Variables associated with the largest reductions in missed opportunities for IV to PO conversion included having guidelines for antimicrobial duration (12.8%), participating in regional stewardship collaboratives (8.1%), number of antimicrobial-specific order sets (6.0% per order set), ID training of the ASP pharmacist (4.9%), and VA facility complexity designation (4.2% per quarter increase in score indicating greater complexity).23 Variables associated with more missed opportunities included stop orders (11.7%), overall perceived receptiveness to antimicrobial stewardship among clinical services (9.4%), the degree of engagement with ASTF online resources (6.9% per quarter increase in factor score range), educational programs for prudent antimicrobial use (4.1%), and hospital size (1.0% per 50-bed increase).
Missed Opportunities for Avoidance of Double Anaerobic Coverage
Four variables were associated with more avoidance of double anaerobic coverage: ID training of the lead ASP pharmacist (8.8%), presence of pharmacists and/or ID attendings on acute care ward teams (6.2% per quarter increase in index score), degree of ID pharmacist involvement in antimicrobial approvals, ranging from not at all (score=0) to both weekdays and nights/weekends (score=2; 4.3% per ordinal increase), and the number of antimicrobial-specific order sets (1.5% per order set). No variables were associated with less avoidance of double anaerobic coverage.
Variables Associated with Multiple Favorable or Unfavorable Antimicrobial Utilization Measures
To better assess the consistency of the relationship between organizational variables and measures of antimicrobial use, we tabulated variables that were associated with at least 3 potentially favorable (ie, reduced overall or noninfectious antimicrobial use or fewer missed opportunities) measures. Altogether, 5 variables satisfied this criterion: the presence of postgraduate physician/pharmacy training programs, the number of antimicrobial-specific order sets, frequency of systematic de-escalation review, the presence of pharmacists and/or ID attendings on acute care ward teams, and formal ID training of the lead ASP pharmacist (Table 3). Three other variables were associated with at least 2 unfavorable measures: hospital size, the degree to which the facility engaged with ASTF online resources, and presence of antimicrobial stop orders.
Table 3
DISCUSSION
Variability in ASP implementation across VA allowed us to assess the relationship between ASP and facility elements and baseline patterns of antimicrobial utilization. Hospitalists and hospital policy-makers are becoming more and more engaged in inpatient antimicrobial stewardship. While our results suggest that having pharmacists and/or physicians with formal ID training participate in everyday inpatient activities can favorably improve antimicrobial utilization, considerable input into stewardship can be made by hospitalists and policy makers. In particular, based on this work, the highest yield from an organizational standpoint may be in working to develop order sets within the electronic medical record and systematic efforts to promote de-escalation of broad-spectrum therapy, as well as encouraging hospital administration to devote specific physician and pharmacy salary support to stewardship efforts.
While we noted that finding the ASTF online resources helpful was associated with potentially unfavorable antimicrobial utilization, we speculate that this may represent reverse causality due to facilities recognizing that their antimicrobial usage is suboptimal and thus seeking out sample ASTF policies to implement. The association between the presence of automatic stop orders and potentially unfavorable antimicrobial utilization is less clear since the timeframe was not specified in the survey; it may be that setting stop orders too far in advance may promote an environment in which critical thinking about antimicrobial de-escalation is not encouraged or timely. The larger magnitude of association between ASP characteristics and antimicrobial usage among patients without infectious discharge diagnoses versus overall antimicrobial usage also suggests that clinical situations where infection was of low enough suspicion to not even have the providers eventually list an infectious diagnosis on their discharge summaries may be particularly malleable to ASP interventions, though further exploration is needed in determining how useful this utilization measure may be as a marker for inappropriate antimicrobial use.
Our results complement those of Pakyz et al.24 who surveyed 44 academic medical facilities in March 2013 to develop an ASP intensity score and correlate this score and its specific components to overall and targeted antimicrobial use. This study found that the overall ASP intensity score was not significantly associated with total or targeted antimicrobial use. However, ASP strategies were more associated with decreased total and targeted antimicrobial use than were specific ASP resources. In particular, the presence of a preauthorization strategy was associated with decreased targeted antimicrobial use. Our particular findings that order set establishment and de-escalation efforts are associated with multiple antibiotic outcomes also line up with the findings of Schuts et al,who performed a meta-analysis of the effects of meeting antimicrobial stewardship objectives and found that achieving guideline concordance (such as through establishment of order sets) and successfully de-escalating antimicrobial therapy was associated with reduced mortality.25,26 This meta-analysis, however, was limited by low rigor of its studies and potential for reverse causality. While our study has the advantages of capturing an entire national network of 130 acute care facilities with a 100% response rate, it, too, is limited by a number of issues, most notably by the fact that the survey was not specifically designed for the analysis of antimicrobial utilization measures, patient-level risk stratification was not available, the VA population does not reflect the U.S. population at-large, recall bias, and that antimicrobial prescribing and stewardship practices have evolved in VA since 2012. Furthermore, all of the antimicrobial utilization measures studied are imperfect at capturing inappropriate antibiotic use; in particular, our reliance on principal ICD-9 codes for noninfectious outcomes requires prospective validation. Many survey questions were subjective and subject to misinterpretation; other unmeasured confounders may also be present. Causality cannot be inferred from association. Nevertheless, our findings support many core indicators for hospital ASP recommended by the CDC and the Transatlantic Taskforce on Antimicrobial Resistance,3,4 most notably, having personnel with ID training involved in stewardship and establishing a formal procedure for ASP review for the appropriateness of an antimicrobial at or after 48 hours from the initial order.
In summary, the VA has made efforts to advance the practice of antimicrobial stewardship system-wide, including a 2014 directive that all VA facilities have an ASP,27 since the 2012 HAIG assessment reported considerable variability in antimicrobial utilization and antimicrobial stewardship activities. Our study identifies areas of stewardship that may correlate with, positively or negatively, antimicrobial utilization measures that will require further investigation. A repeat and more detailed antimicrobial stewardship survey was recently completed and will help VA gauge ongoing effects of ASTF activities. We hope to re-evaluate our model with newer data when available.
Acknowledgments
The authors wish to thank Michael Fletcher, Jaime Lopez, and Catherine Loc-Carrillo for their administrative and organizational support of the project and Allison Kelly, MD, for her pivotal role in survey development and distribution. This work was supported by the VA Health Services Research and Development Service Collaborative Research to Enhance and Advance Transformation and Excellence (CREATE) Initiative; Cognitive Support Informatics for Antimicrobial Stewardshipproject (CRE 12-313).
Disclosure
The authors report no financial conflicts of interest.
The deleterious impact of inappropriate and/or excessive antimicrobial usage is well recognized. In the United States, the Centers for Disease Control and Prevention (CDC) estimates that at least 2 million people become infected with antimicrobial-resistant bacteria with 23,000 subsequent deaths and at least $1 billion in excess medical costs per year.1
In response, many healthcare organizations have developed antimicrobial stewardship programs (ASPs). Guidelines co-sponsored by the Infectious Diseases Society of America and the Society for Healthcare Epidemiology of America, as well as recent statements from the CDC and the Transatlantic Taskforce on Antimicrobial Resistance,all recommend core ASP elements.2-5 The guidelines provide general recommendations on ASP structure, strategies, and activities. The recommended ASP structure is a team of physicians and pharmacists that collaborates with facility governing committees and other stakeholders to optimize antimicrobial use. While personnel with expertise in infectious diseases (ID) often lead ASPs, hospitalists are also recognized as key contributors, especially in quality improvement.6,7 Recommended strategies include prospective audit of antimicrobial use with intervention and feedback and formulary restriction with preauthorization. Recommended activities include education, creation of guidelines, clinical pathways, and order forms, and programs to promote de-escalation and conversion from parenteral (IV) to oral (PO) antimicrobial therapy. However, limited evidence exists regarding the effectiveness of these ASP core elements.8,9 While Cochrane reviews found clear evidence that particular stewardship strategies (eg, audit and feedback, formulary restriction, guidelines implemented with or without feedback, protocols, computerized decision support) can be effective in reducing antimicrobial usage and improving clinical outcomes over the long term, little evidence exists favoring 1 strategy over another.8 Furthermore, most individual studies of ASPs are single-center, making their conclusions less generalizable.
In 2012, the VA National Antimicrobial Stewardship Task Force (ASTF), in conjunction with the VA Healthcare Analysis and Information Group (HAIG) administered a survey on the characteristics of ASPs at all 130 acute care VA facilities (Appendix A). We used these survey results to build an implementation model and then assess associations between facility-level variables and 4 antimicrobial utilization measures.
METHODS
Survey and Data
In 2011, the ASTF was chartered to develop, deploy, and monitor a strategic plan for optimizing antimicrobial therapy management. Monthly educational webinars and sample policies were offered to all facilities, including a sample business plan for stewardship and policies to encourage de-escalation from broad-spectrum antimicrobials, promote conversion from parenteral to oral antimicrobial therapy, avoid unnecessary double anaerobic coverage, and mitigate unnecessary antimicrobial usage in the context of Clostridium difficile infection.10
At the time that ASTF was chartered, the understanding of how ASP structures across VA facilities operated was limited. Hence, to capture baseline institutional characteristics and stewardship activities, ASTF and HAIG developed an inventory assessment of ASPs that was distributed online in November 2012. All 130 VA facilities providing inpatient acute care services responded.
We derived 57 facility characteristics relevant to antimicrobial utilization and conducted a series of factor analyses to simplify the complex dataset, and identify underlying latent constructs. We categorized resulting factors into domains of evidence, context, or facilitation as guided by the Promoting Action on Research Implementation in Health Services framework.11 Briefly, the evidence domain describes how the facility uses codified and noncodified sources of knowledge (eg, research evidence, clinical experience). Organizational context comprises a facility’s characteristics that ensure a more conducive environment to put evidence into practice (eg, supportive leadership, organizational structure, evaluative systems). Facilitation emphasizes a facility personnel’s “state of preparedness” and receptivity to implementation.
Using factor analysis to identify facility factors as correlates of the outcomes, we first examined polychoric correlations among facility characteristics to assess multicollinearity. We performed independent component analysis to create latent constructs of variables that were defined by factor loadings (that indicated the proportion of variance accounted for by the construct) and uniqueness factors (that determined how well the variables were interpreted by the construct). Factors retained included variables that had uniqueness values of less than 0.7 and factor loadings greater than 0.3. Those associated with uniqueness values greater than 0.7 were left as single items, as were characteristics deemed a priori to be particularly important to antimicrobial stewardship. Factor scales that had only 2 items were converted into indices, while factor scores were generated for those factors that contained 3 or more items.12-15
Data for facility-level antimicrobial utilization measures were obtained from the VA Corporate Data Warehouse from calendar year 2012. The analysis was conducted within the VA Informatics and Computing Infrastructure. All study procedures were approved by the VA Central Institutional Review Board.
Measures
Four utilization measures were defined as dependent measures: overall antimicrobial use; antimicrobial use in patients with non-infectious discharge diagnoses; missed opportunities to convert from parenteral to oral antimicrobial therapy; and missed opportunities to avoid double anaerobic coverage with metronidazole.
Overall antimicrobial use was defined as total acute care (ie, medical/surgical/intensive care) antibacterial use for each facility aggregated as per CDC National Healthcare Safety Network Antimicrobial Use Option guidelines (antimicrobial days per 1000 patient days present). A subanalysis of overall antimicrobial use was restricted to antimicrobial use among patients without an infection-related discharge diagnosis, as we surmised that this measure may capture a greater proportion of potentially unnecessary antimicrobial use. International Classification of Diseases, Ninth Revision, Clinical Modification (ICD-9-CM)16 codes for infectious processes were identified by a combination of those classified previously in the literature,17 and those identified by finding the descendants of all infections named in the Systematized Nomenclature of Medicine--Clinical Terms.18 Next, all remaining codes for principal discharge diagnoses for which antimicrobials were administered were reviewed for potential indications for systemic antibacterial use. Discharges were considered noninfectious if no codes were identified when systemic antimicrobials were or could be indicated. For this measure, antimicrobial days were not counted if administered on or 1 day after the calendar day of surgery warranting antimicrobial prophylaxis.
Missed opportunities for conversion from parenteral to oral (IV to PO) formulations of highly bioavailable oral antimicrobials (ciprofloxacin, levofloxacin, moxifloxacin, azithromycin, clindamycin, linezolid, metronidazole, and fluconazole) were defined as the percentage of days of unnecessary IV therapy that were given when PO therapy could have been used among patients who were not in intensive care units at the time of antimicrobial administration who were receiving other oral medications, using previously described methodology.19Missed opportunities for avoiding redundant anaerobic coverage with metronidazole were defined as the percentage of days in which patients receiving metronidazole also receivedantibiotics with activity against anaerobic bacteria, specifically beta-lactam/beta-lactamase inhibitors, carbapenems, cefotetan/cefoxitin, clindamycin, moxifloxacin, or tigecycline), using previously described methodology.20 Patients for whom C. difficile testing was either ordered or positive within the prior 28 days (indicating potential clinical concern for C. difficile infection) were excluded from this endpoint.
Analysis
The variables derived above were entered into a multivariable model for each of the 4 antimicrobial utilization measures. The least absolute shrinkage and selection operator (LASSO) regression was used to determine significant associations between variables and individual utilization measures.21 LASSO was chosen because it offers advantages over traditional subset selection approaches in large multivariable analyses by assessing covariates simultaneously rather than sequentially, supporting prediction rather than estimation of effect.22P values were not reported as they are not useful in determining statistical significance in this methodology. A tuning parameter of 0.025 was determined for the model based on a cross-validation approach. Significant variables remaining in the model were reported with the percent change in each utilization measure per unit change in the variable of interest. For binary factors, percent change was reported according to whether the variable was present or not. For ordinal variables, percent change was reported according to incremental increase in ordinal score. For continuous variables or variables represented by factor or index scores, percent change was reported per each 25% increase in the range of the score.
RESULTS
Inpatient Facility Antimicrobial Stewardship Characteristics and Antimicrobial Utilization
Frequencies of key facility characteristics that contributed to variable development are included in Table 1. Full survey results across all facilities are included in Appendix B. Factor analysis reduced the total number of variables to 32; however, we also included hospital size and VA complexity score. Thus, 34 variables were evaluated for association with antimicrobial utilization measures: 4 in the evidence domain, 23 in the context domain, and 7 in the facilitation domain (Table 2).
Table 1
Table 1 (continued)
Median facility antimicrobial use was 619 antimicrobial days per 1000 days present (interquartile range [IQR], 554-700; overall range, 346-974). Median facility noninfectious antimicrobial use was 236 per 1000 days present (IQR, 200-286). Missed opportunities for conversion from IV to PO antimicrobial therapy were common, with a median facility value of 40.4% (391/969) of potentially eligible days of therapy (IQR, 32.2-47.8%). Missed opportunities to avoid double anaerobic coverage were less common (median 15.3% (186/1214) of potentially eligible days of therapy (IQR, 11.8%-20.2%; Figure).
Overall Antimicrobial Use
Four variables were associated with decreased overall antimicrobial use, although with small magnitude of change: presence of postgraduate physician/pharmacy training programs (0.03% decrease per quarter increase in factor score; on the order of 0.2 antimicrobial days per 1000 patient days present), presence of pharmacists and/or ID attendings on general medicine ward teams (0.02% decrease per quarter increase in index score), frequency of systematic de-escalation review (0.01% decrease per ordinal increase in score), and degree of involvement of ID physicians and/or fellows in antimicrobial approvals (0.007% decrease per quarter increase in index score). No variables were associated with increased overall antimicrobial use.
Table 2
Table 2 (continued)
Antimicrobial Use among Discharges without Infectious Diagnoses
Six variables were associated with decreased antimicrobial use in patients without infectious discharge diagnoses, while 4 variables were associated with increased use. Variables associated with the greatest magnitude of decreased use included facility educational programs for prudent antimicrobial use (1.8% on the order of 4 antimicrobial days per 1000 patient days present), frequency of systematic de-escalation review (1.5% per incremental increase in score), and whether a facility’s lead antimicrobial stewardship pharmacist had ID training (1.3%). Also significantly associated with decreased use was a factor summarizing the presence of 4 condition-specific stewardship processes (de-escalation policies, policies for addressing antimicrobial use in the context of C. difficile infection, blood culture review, and automatic ID consults for certain conditions) (0.6% per quarter increase in factor score range), the extent to which postgraduate physician/pharmacy training programs were present (0.6% per quarter increase in factor score range), and the number of electronic antimicrobial-specific order sets present (0.4% per order set). The variables associated with increased use of antimicrobials included the presence of antimicrobial stop orders (4.6%), the degree to which non-ID physicians were involved in antimicrobial approvals (0.7% per increase in ordinal score), the level engagement with ASTF online resources (0.6% per quarter increase in factor score range), and hospital size (0.6% per 50-bed increase).
Figure
Missed Opportunities for Parenteral to Oral Antimicrobial Conversion
Missed opportunities for IV to PO antimicrobial conversion had the largest number of significant associations with organizational variables: 14 variables were associated with fewer missed opportunities, while 5 were associated with greater missed opportunities. Variables associated with the largest reductions in missed opportunities for IV to PO conversion included having guidelines for antimicrobial duration (12.8%), participating in regional stewardship collaboratives (8.1%), number of antimicrobial-specific order sets (6.0% per order set), ID training of the ASP pharmacist (4.9%), and VA facility complexity designation (4.2% per quarter increase in score indicating greater complexity).23 Variables associated with more missed opportunities included stop orders (11.7%), overall perceived receptiveness to antimicrobial stewardship among clinical services (9.4%), the degree of engagement with ASTF online resources (6.9% per quarter increase in factor score range), educational programs for prudent antimicrobial use (4.1%), and hospital size (1.0% per 50-bed increase).
Missed Opportunities for Avoidance of Double Anaerobic Coverage
Four variables were associated with more avoidance of double anaerobic coverage: ID training of the lead ASP pharmacist (8.8%), presence of pharmacists and/or ID attendings on acute care ward teams (6.2% per quarter increase in index score), degree of ID pharmacist involvement in antimicrobial approvals, ranging from not at all (score=0) to both weekdays and nights/weekends (score=2; 4.3% per ordinal increase), and the number of antimicrobial-specific order sets (1.5% per order set). No variables were associated with less avoidance of double anaerobic coverage.
Variables Associated with Multiple Favorable or Unfavorable Antimicrobial Utilization Measures
To better assess the consistency of the relationship between organizational variables and measures of antimicrobial use, we tabulated variables that were associated with at least 3 potentially favorable (ie, reduced overall or noninfectious antimicrobial use or fewer missed opportunities) measures. Altogether, 5 variables satisfied this criterion: the presence of postgraduate physician/pharmacy training programs, the number of antimicrobial-specific order sets, frequency of systematic de-escalation review, the presence of pharmacists and/or ID attendings on acute care ward teams, and formal ID training of the lead ASP pharmacist (Table 3). Three other variables were associated with at least 2 unfavorable measures: hospital size, the degree to which the facility engaged with ASTF online resources, and presence of antimicrobial stop orders.
Table 3
DISCUSSION
Variability in ASP implementation across VA allowed us to assess the relationship between ASP and facility elements and baseline patterns of antimicrobial utilization. Hospitalists and hospital policy-makers are becoming more and more engaged in inpatient antimicrobial stewardship. While our results suggest that having pharmacists and/or physicians with formal ID training participate in everyday inpatient activities can favorably improve antimicrobial utilization, considerable input into stewardship can be made by hospitalists and policy makers. In particular, based on this work, the highest yield from an organizational standpoint may be in working to develop order sets within the electronic medical record and systematic efforts to promote de-escalation of broad-spectrum therapy, as well as encouraging hospital administration to devote specific physician and pharmacy salary support to stewardship efforts.
While we noted that finding the ASTF online resources helpful was associated with potentially unfavorable antimicrobial utilization, we speculate that this may represent reverse causality due to facilities recognizing that their antimicrobial usage is suboptimal and thus seeking out sample ASTF policies to implement. The association between the presence of automatic stop orders and potentially unfavorable antimicrobial utilization is less clear since the timeframe was not specified in the survey; it may be that setting stop orders too far in advance may promote an environment in which critical thinking about antimicrobial de-escalation is not encouraged or timely. The larger magnitude of association between ASP characteristics and antimicrobial usage among patients without infectious discharge diagnoses versus overall antimicrobial usage also suggests that clinical situations where infection was of low enough suspicion to not even have the providers eventually list an infectious diagnosis on their discharge summaries may be particularly malleable to ASP interventions, though further exploration is needed in determining how useful this utilization measure may be as a marker for inappropriate antimicrobial use.
Our results complement those of Pakyz et al.24 who surveyed 44 academic medical facilities in March 2013 to develop an ASP intensity score and correlate this score and its specific components to overall and targeted antimicrobial use. This study found that the overall ASP intensity score was not significantly associated with total or targeted antimicrobial use. However, ASP strategies were more associated with decreased total and targeted antimicrobial use than were specific ASP resources. In particular, the presence of a preauthorization strategy was associated with decreased targeted antimicrobial use. Our particular findings that order set establishment and de-escalation efforts are associated with multiple antibiotic outcomes also line up with the findings of Schuts et al,who performed a meta-analysis of the effects of meeting antimicrobial stewardship objectives and found that achieving guideline concordance (such as through establishment of order sets) and successfully de-escalating antimicrobial therapy was associated with reduced mortality.25,26 This meta-analysis, however, was limited by low rigor of its studies and potential for reverse causality. While our study has the advantages of capturing an entire national network of 130 acute care facilities with a 100% response rate, it, too, is limited by a number of issues, most notably by the fact that the survey was not specifically designed for the analysis of antimicrobial utilization measures, patient-level risk stratification was not available, the VA population does not reflect the U.S. population at-large, recall bias, and that antimicrobial prescribing and stewardship practices have evolved in VA since 2012. Furthermore, all of the antimicrobial utilization measures studied are imperfect at capturing inappropriate antibiotic use; in particular, our reliance on principal ICD-9 codes for noninfectious outcomes requires prospective validation. Many survey questions were subjective and subject to misinterpretation; other unmeasured confounders may also be present. Causality cannot be inferred from association. Nevertheless, our findings support many core indicators for hospital ASP recommended by the CDC and the Transatlantic Taskforce on Antimicrobial Resistance,3,4 most notably, having personnel with ID training involved in stewardship and establishing a formal procedure for ASP review for the appropriateness of an antimicrobial at or after 48 hours from the initial order.
In summary, the VA has made efforts to advance the practice of antimicrobial stewardship system-wide, including a 2014 directive that all VA facilities have an ASP,27 since the 2012 HAIG assessment reported considerable variability in antimicrobial utilization and antimicrobial stewardship activities. Our study identifies areas of stewardship that may correlate with, positively or negatively, antimicrobial utilization measures that will require further investigation. A repeat and more detailed antimicrobial stewardship survey was recently completed and will help VA gauge ongoing effects of ASTF activities. We hope to re-evaluate our model with newer data when available.
Acknowledgments
The authors wish to thank Michael Fletcher, Jaime Lopez, and Catherine Loc-Carrillo for their administrative and organizational support of the project and Allison Kelly, MD, for her pivotal role in survey development and distribution. This work was supported by the VA Health Services Research and Development Service Collaborative Research to Enhance and Advance Transformation and Excellence (CREATE) Initiative; Cognitive Support Informatics for Antimicrobial Stewardshipproject (CRE 12-313).
Disclosure
The authors report no financial conflicts of interest.
References
1. Antibiotic resistance threats in the United States, 2013. Atlanta, GA: Centers for Disease Control and Prevention. http://www.cdc.gov/drugresistance/threat-report-2013/. Published 2013. Accessed January 7, 2016. 2. Dellit TH, Owens RC, McGowan JE Jr, et al. Infectious Diseases Society of America and the Society for Healthcare Epidemiology of America guidelines for developing an institutional program to enhance antimicrobial stewardship. Clin Infect Dis. 2007;44(2):159-177. PubMed 3. Centers for Disease Control and Prevention. Core elements of hospital antibiotic stewardship programs. Atlanta, GA: Centers for Disease Control and Prevention. http://www.cdc.gov/getsmart/healthcare/implementation/core-elements.html. Published 2015. Accessed January 7, 2016. 4. Pollack LA, Plachouras D, Gruhler H, Sinkowitz-Cochran R. Transatlantic taskforce on antimicrobial resistance (TATFAR) summary of the modified Delphi process for common structure and process indicators for hospital antimicrobial stewardship programs. http://www.cdc.gov/drugresistance/pdf/summary_of_tatfar_recommendation_1.pdf. Published 2015. Accessed January 7, 2016. 5. Barlam TF, Cosgrove SE, Abbo LM, MacDougal C, Schuetz AN, Septimus EJ, et al. Implementing an Antibiotic Stewardship Program: Guidelines by the Infectious Diseases Society of America and the Society for Healthcare Epidemiology of America. Clin Infect Dis. 2016;62(10):e51-e77. PubMed 6. Rohde JM, Jacobsen D, Rosenberg DJ. Role of the hospitalist in antimicrobial stewardship: a review of work completed and description of a multisite collaborative. Clin Ther. 2013;35(6):751-757. PubMed 7. Mack MR, Rohde JM, Jacobsen D, Barron JR, Ko C, Goonewardene M, et al. Engaging hospitalists in antimicrobial stewardship: lessons from a multihosopital collaborative. J Hosp Med. 2016;11(8):576-580. PubMed 8. Davey P, Brown E, Charani E, Fenelon L, Gould IM, Holmes A, et al. Interventions to improve antibiotic prescribing practices for hospital inpatients. Cochrane Database Syst Rev. 2013;4:CD003543. PubMed 9. Filice G, Drekonja D, Wilt TJ, Greer N, Butler M, Wagner B. Antimicrobial stewardship programs in inpatient settings: a systematic review. Washington, DC: Department of Veterans Affairs Health Services Research and Development. http://www.hsrd.research.va.gov/publications/esp/antimicrobial.pdf. Published 2013. Accessed January 7, 2016. 10. Graber CJ, Madaras-Kelly K, Jones MM, Neuhauser MM, Goetz MB. Unnecessary antimicrobial use in the context of Clostridium difficile infection: a call to arms for the Veterans Affairs Antimicrobial Stewardship Task Force. Infect Control Hosp Epidemiol. 2013(6);34:651-653. PubMed 11. Rycroft-Malone J. The PARIHS framework--a framework for guiding the implementation of evidence-based practice. J Nurs Care Qual. 2004;19(4):297-304. PubMed 12. Chou AF, Graber CJ, Jones MM, Zhang Y, Goetz MB, Madaras-Kelly K, et al. Specifying an implementation framework for VA antimicrobial stewardship programs. Oral presentation at the VA HSR&D/QUERI National Conference, July 8-9, 2015. Washington, DC: U.S. Department of Veterans Affairs. http://www.hsrd.research.va.gov/meetings/2015/abstract-display.cfm?RecordID=862. Accessed July 5, 2016. 13. Bartholomew DJ. Factor analysis for categorical data. J R Stat Soc. 1980;42:293-321. 14. Flanagan M, Ramanujam R, Sutherland J, Vaughn T, Diekema D, Doebbeling BN. Development and validation of measures to assess prevention and control of AMR in hospitals. Med Care. 2007;45(6): 537-544. PubMed 15. Kline P. An easy guide to factor analysis. New York: Routledge, 1994. 16. Centers for Disease Control and Prevention, National Center for Health Statistics. International Classification of Diseases, Ninth Revision, Clinical Modification (ICD-9-CM). Atlanta GA: Centers for Disease Control and Prevention. http://www.cdc.gov/nchs/icd/icd9cm.htm. Published 2013. Accessed January 7, 2016. 17. Huttner B, Jones M, Huttner A, Rubin M, Samore MH. Antibiotic prescription practices for pneumonia, skin and soft tissue infections and urinary tract infections throughout the US Veterans Affairs system. J Antimicrob Chemother. 2013;68(10):2393-2399. PubMed 18. National Institutes of Health. SNOMED Clinical Terms (SNOMED CT). Bethesda, MD: U.S. National Library of Medicine. https://www.nlm.nih.gov/research/umls/Snomed/snomed_main.html. NIH website. Published 2009. Accessed January 7. 2016. 19. Jones M, Huttner B, Madaras-Kelly K, Nechodom K, Nielson C, Bidwell Goetz M, et al. Parenteral to oral conversion of fluoroquinolones: low-hanging fruit for antimicrobial stewardship programs? Infect Control Hosp Epidemiol 2012;33(4): 362-367. PubMed 20. Huttner B, Jones M, Rubin MA, Madaras-Kelly K, Nielson C, Goetz MB, et al. Double trouble: how big a problem is redundant anaerobic antibiotic coverage in Veterans Affairs medical centres? J Antimicrob Chemother. 2012;67(6):1537-1539. PubMed 21. Tibshirani R. Regression shrinkage and selection via the lasso. J R Stat Soc B. 1996;58:267-288. 22. Taylor J, Tibshirani RJ. Statistical learning and selective inference. Proc Natl Acad Sci U S A. 2015;112(25):7629-7634. PubMed 23. VHA Office of Productivity, Efficiency, and Staffing. Facility Complexity Levels. Department of Veterans Affairs website. http://opes.vssc.med.va.gov/FacilityComplexityLevels/Pages/default.aspx. Published 2008. Accessed January 7, 2016. 24. Pakyz AL, Moczygemba LR, Wang H, Stevens MP, Edmond MB. An evaluation of the association between an antimicrobial stewardship score and antimicrobial usage. J Antimicrob Chemother. 2015;70(5):1588-1591. PubMed 25. Schuts EC, Hulscher ME, Mouton JW, Verduin CM, Stuart JW, Overdiek HW, et al. Current evidence on hospital antimicrobial stewardship objectives: a systematic review and meta-analysis. Lancet Infect Dis. 2016;16(7):847-856. PubMed 26. Graber CJ, Goetz MB. Next steps for antimicrobial stewardship. Lancet Infect Dis. 2016;16(7):764-765. PubMed 27. Petzel RA. VHA Directive 1031: Antimicrobial stewardship programs (ASP). Washington, DC: Department of Veterans Affairs.http://www.va.gov/vhapublications/ViewPublication.asp?pub_ID=2964. Published January 22, 2014. Accessed July 5, 2016.
References
1. Antibiotic resistance threats in the United States, 2013. Atlanta, GA: Centers for Disease Control and Prevention. http://www.cdc.gov/drugresistance/threat-report-2013/. Published 2013. Accessed January 7, 2016. 2. Dellit TH, Owens RC, McGowan JE Jr, et al. Infectious Diseases Society of America and the Society for Healthcare Epidemiology of America guidelines for developing an institutional program to enhance antimicrobial stewardship. Clin Infect Dis. 2007;44(2):159-177. PubMed 3. Centers for Disease Control and Prevention. Core elements of hospital antibiotic stewardship programs. Atlanta, GA: Centers for Disease Control and Prevention. http://www.cdc.gov/getsmart/healthcare/implementation/core-elements.html. Published 2015. Accessed January 7, 2016. 4. Pollack LA, Plachouras D, Gruhler H, Sinkowitz-Cochran R. Transatlantic taskforce on antimicrobial resistance (TATFAR) summary of the modified Delphi process for common structure and process indicators for hospital antimicrobial stewardship programs. http://www.cdc.gov/drugresistance/pdf/summary_of_tatfar_recommendation_1.pdf. Published 2015. Accessed January 7, 2016. 5. Barlam TF, Cosgrove SE, Abbo LM, MacDougal C, Schuetz AN, Septimus EJ, et al. Implementing an Antibiotic Stewardship Program: Guidelines by the Infectious Diseases Society of America and the Society for Healthcare Epidemiology of America. Clin Infect Dis. 2016;62(10):e51-e77. PubMed 6. Rohde JM, Jacobsen D, Rosenberg DJ. Role of the hospitalist in antimicrobial stewardship: a review of work completed and description of a multisite collaborative. Clin Ther. 2013;35(6):751-757. PubMed 7. Mack MR, Rohde JM, Jacobsen D, Barron JR, Ko C, Goonewardene M, et al. Engaging hospitalists in antimicrobial stewardship: lessons from a multihosopital collaborative. J Hosp Med. 2016;11(8):576-580. PubMed 8. Davey P, Brown E, Charani E, Fenelon L, Gould IM, Holmes A, et al. Interventions to improve antibiotic prescribing practices for hospital inpatients. Cochrane Database Syst Rev. 2013;4:CD003543. PubMed 9. Filice G, Drekonja D, Wilt TJ, Greer N, Butler M, Wagner B. Antimicrobial stewardship programs in inpatient settings: a systematic review. Washington, DC: Department of Veterans Affairs Health Services Research and Development. http://www.hsrd.research.va.gov/publications/esp/antimicrobial.pdf. Published 2013. Accessed January 7, 2016. 10. Graber CJ, Madaras-Kelly K, Jones MM, Neuhauser MM, Goetz MB. Unnecessary antimicrobial use in the context of Clostridium difficile infection: a call to arms for the Veterans Affairs Antimicrobial Stewardship Task Force. Infect Control Hosp Epidemiol. 2013(6);34:651-653. PubMed 11. Rycroft-Malone J. The PARIHS framework--a framework for guiding the implementation of evidence-based practice. J Nurs Care Qual. 2004;19(4):297-304. PubMed 12. Chou AF, Graber CJ, Jones MM, Zhang Y, Goetz MB, Madaras-Kelly K, et al. Specifying an implementation framework for VA antimicrobial stewardship programs. Oral presentation at the VA HSR&D/QUERI National Conference, July 8-9, 2015. Washington, DC: U.S. Department of Veterans Affairs. http://www.hsrd.research.va.gov/meetings/2015/abstract-display.cfm?RecordID=862. Accessed July 5, 2016. 13. Bartholomew DJ. Factor analysis for categorical data. J R Stat Soc. 1980;42:293-321. 14. Flanagan M, Ramanujam R, Sutherland J, Vaughn T, Diekema D, Doebbeling BN. Development and validation of measures to assess prevention and control of AMR in hospitals. Med Care. 2007;45(6): 537-544. PubMed 15. Kline P. An easy guide to factor analysis. New York: Routledge, 1994. 16. Centers for Disease Control and Prevention, National Center for Health Statistics. International Classification of Diseases, Ninth Revision, Clinical Modification (ICD-9-CM). Atlanta GA: Centers for Disease Control and Prevention. http://www.cdc.gov/nchs/icd/icd9cm.htm. Published 2013. Accessed January 7, 2016. 17. Huttner B, Jones M, Huttner A, Rubin M, Samore MH. Antibiotic prescription practices for pneumonia, skin and soft tissue infections and urinary tract infections throughout the US Veterans Affairs system. J Antimicrob Chemother. 2013;68(10):2393-2399. PubMed 18. National Institutes of Health. SNOMED Clinical Terms (SNOMED CT). Bethesda, MD: U.S. National Library of Medicine. https://www.nlm.nih.gov/research/umls/Snomed/snomed_main.html. NIH website. Published 2009. Accessed January 7. 2016. 19. Jones M, Huttner B, Madaras-Kelly K, Nechodom K, Nielson C, Bidwell Goetz M, et al. Parenteral to oral conversion of fluoroquinolones: low-hanging fruit for antimicrobial stewardship programs? Infect Control Hosp Epidemiol 2012;33(4): 362-367. PubMed 20. Huttner B, Jones M, Rubin MA, Madaras-Kelly K, Nielson C, Goetz MB, et al. Double trouble: how big a problem is redundant anaerobic antibiotic coverage in Veterans Affairs medical centres? J Antimicrob Chemother. 2012;67(6):1537-1539. PubMed 21. Tibshirani R. Regression shrinkage and selection via the lasso. J R Stat Soc B. 1996;58:267-288. 22. Taylor J, Tibshirani RJ. Statistical learning and selective inference. Proc Natl Acad Sci U S A. 2015;112(25):7629-7634. PubMed 23. VHA Office of Productivity, Efficiency, and Staffing. Facility Complexity Levels. Department of Veterans Affairs website. http://opes.vssc.med.va.gov/FacilityComplexityLevels/Pages/default.aspx. Published 2008. Accessed January 7, 2016. 24. Pakyz AL, Moczygemba LR, Wang H, Stevens MP, Edmond MB. An evaluation of the association between an antimicrobial stewardship score and antimicrobial usage. J Antimicrob Chemother. 2015;70(5):1588-1591. PubMed 25. Schuts EC, Hulscher ME, Mouton JW, Verduin CM, Stuart JW, Overdiek HW, et al. Current evidence on hospital antimicrobial stewardship objectives: a systematic review and meta-analysis. Lancet Infect Dis. 2016;16(7):847-856. PubMed 26. Graber CJ, Goetz MB. Next steps for antimicrobial stewardship. Lancet Infect Dis. 2016;16(7):764-765. PubMed 27. Petzel RA. VHA Directive 1031: Antimicrobial stewardship programs (ASP). Washington, DC: Department of Veterans Affairs.http://www.va.gov/vhapublications/ViewPublication.asp?pub_ID=2964. Published January 22, 2014. Accessed July 5, 2016.
Association of inpatient antimicrobial utilization measures with antimicrobial stewardship activities and facility characteristics of Veterans Affairs medical centers
Display Headline
Association of inpatient antimicrobial utilization measures with antimicrobial stewardship activities and facility characteristics of Veterans Affairs medical centers
Address for correspondence and reprint requests: Christopher J. Graber, MD, MPH, Infectious Diseases Section, VA Greater Los Angeles Healthcare System, 11301 Wilshire Blvd, 111-F, Los Angeles, CA 90073; Telephone: 310-268-3763; Fax: 310 268-4928; E-mail: christopher.graber@va.gov
Content Gating
Open Access (article Unlocked/Open Access)
Alternative CME
Consolidated Pubs: Do Not Show Source Publication Logo
Older adults commonly experience insomnia and agitation during hospitalization. Unfortunately, the use of benzodiazepines and sedative hypnotics (BSH) to treat these conditions can be ineffective and expose patients to significant adverse effects.1,2 Choosing Wisely® is a campaign that promotes dialogue to reduce unnecessary medical tests, procedures, or treatments. This international campaign has highlighted BSHs as potentially harmful and has recommended against their use as first-line treatment of insomnia and agitation.3-5 Examples of harm with benzodiazepine use include cognitive impairment, impaired postural stability, and an increased incidence of falls and hip fractures in both community and acute care settings.6-8 In addition, prescriptions initiated in hospital appear to be associated with a higher risk of falls and unplanned readmission.9,10 The newer nonbenzodiazepine sedative hypnotics, commonly referred to as “z-drugs”, were initially marketed as a safer alternative in older adults due to their more favorable pharmacokinetics. Evidence has emerged that they carry similar risks.6,11,12 A study comparing benzodiazepines and zolpidem found relatively greater risk of fractures requiring hospitalization with the use of zolpidem compared to lorazepam.13
The use of benzodiazepines in the acute care setting has been evaluated in a number of studies and ranges from 20% to 45%.14-16 Few studies focus on the initiation of these medications in BSH-naïve hospitalized patients; however, reports range from 18% to 29%.17,18 Factors found to be associated with potentially inappropriate prescriptions (PIP) include Hispanic ethnicity, residing in an assisted care setting, and a greater number of BSH prescriptions prior to admission.16,19 Additionally, Cumbler et al.15 found that the presence of dementia was associated with fewer prescriptions for sleep aids in hospital. To our knowledge, there are no published studies that have investigated prescriber factors associated with the use of BSH.
The purpose of our study was to determine the frequency of PIPs of BSH in our academic hospital. Additionally, we aimed to identify patient and prescriber factors that were associated with increased likelihood of prescriptions to help guide future quality improvement initiatives.
METHODS
Study Design and Setting
This was a retrospective observational study conducted at Mount Sinai Hospital (MSH) in Toronto over a 4-month period from January 2013 to April 2013. The hospital is a 442-bed acute care academic health science center affiliated with the University of Toronto. The MSH electronic health record contains demographic data, medications and allergies, nursing documentation, and medical histories from prior encounters. It also includes computerized physician order entry (CPOE) and a detailed medication administration record. This system is integrated with an electronic pharmacy database used to monitor and dispense medications for each patient.
Patient and Medication Selection
We included inpatients over the age of 65 who were prescribed a BSH during the study period from the following services: general internal medicine, cardiology, general surgery, orthopedic surgery, and otolaryngology. To identify new exposure to BSHs, we excluded patients who were regularly prescribed a BSH prior to admission to hospital. The medications of interest included all benzodiazepines and the nonbenzodiazepine sedative hypnotic, zopiclone. Zopiclone is the most commonly used nonbenzodiazepine sedative hypnotic in Canada and the only 1 available on our hospital formulary. These were selected based on the strength of evidence to recommend against their use as first-line agents in older adults and in consultation with our geriatric medicine consultation team pharmacist.20
Data Collection
The hospital administrative database provided patient demographic information, admission service, admitting diagnosis, length of stay, and the total number of patients discharged from the study units over the study period. We then searched the pharmacy electronic database for all benzodiazepines and zopiclone prescribed during the study period for patients who met the inclusion criteria. Manual review of paper and electronic health records for this cohort of patients was conducted to extract additional variables. We used a standardized form to record data elements. Dr. Pek collected all data elements. Dr. Remfry reviewed a random sample of patient records (10%) to ensure accuracy. The agreement between reviewers was 100%.
In compliance with hospital accreditation standards, a clinical pharmacist documents a best possible medication history (BPMH) on every inpatient on admission. We used the BPMH to identify and exclude patients who were prescribed a BSH prior to hospitalization. Because all medications were ordered through the CPOE system, as-needed medication prescriptions required the selection of a specified indication. Available options included ‘agitation/anxiety’ and necessitated combining these 2 indications into 1 category. Indications were primarily extracted through electronic order entry reviews. Paper charts were reviewed when further clarification was needed.
We identified ordering physicians’ training level and familiarity with the service from administrative records obtained from medical education offices, hospital records, and relevant call schedules. Fellows were defined as trainees with a minimum of 6 years of postgraduate training.
Our primary outcome of interest was the proportion of eligible patients age 65 and older who received a PIP for a BSH. Patient variables of interest included age, sex, comorbid conditions, and a pre-admission diagnosis of dementia. Comorbid conditions and age were used to calculate the Carlson Comorbidity Index for each patient.21 Prescription variables included the medication prescribed, time of first prescription (“overnight hours” refer to prescriptions ordered after 7:00 PM and before 7:00 AM), and whether the medication was ordered as part of an admission or postoperative order set. To determine whether patients were discharged home with a prescription for a BSH, we reviewed electronic discharge prescriptions of BSH-naïve patients who received a sedative in hospital. Only medical and cardiology inpatients receive electronic discharge prescriptions, and these were available for 189 patients in our cohort. Provider variables included training level, service, and familiarity with patients. We used the provider’s training program or department of appointment to define the ‘physician on-service’ variable. As an example, a resident registered in internal medicine is defined as ‘on-service’ when prescribing sedatives for a medical inpatient. In contrast, a psychiatry resident would be considered “off-service” if he prescribed a sedative for a surgical inpatient. The familiarity of a provider was categorized as ‘regular’ if they were responsible for a patient’s care on a day-to-day basis and ‘covering’ if they were only covering on call. Other variables included admitting service and hospital length of stay.
Appropriateness Criteria
Criteria for potentially inappropriate use were modified from the American and Canadian Geriatrics Societies’ Choosing Wisely recommendations,4,5 and included insomnia and agitation. These recommendations are in line with other evidence based guidelines for safe prescribing in older adults.20 For the purposes of our study, prescriptions for “agitation/anxiety”, “agitation”, or “insomnia/sleep” were considered potentially inappropriate. Appropriate indications included alcohol withdrawal, end-of-life symptom control, preprocedural sedation, and seizure.5 Patients who were already using a BSH prior to admission for any indication, including a psychiatric diagnosis, were excluded.
Statistical Analyses
We determined the proportion of patients with at least one PIP, as well as the proportion of all prescribing events that were potentially inappropriate. We used the Chi-square statistic and 2-sample t tests to compare the unadjusted associations between patient-level characteristics and receipt of at least 1 inappropriate prescription and prescribing event-level factors with inappropriate prescriptions. Given that first-year residents are more likely to be working overnight when most PIPs are prescribed, we performed a simple logistic regression of potentially inappropriate prescribing by level of training stratified by time of prescription. A multivariable random-intercept logistic regression model was used to assess the adjusted association between patient- and prescribing event-level characteristics with inappropriate prescribing, adjusting for clustering of prescribing events within patients. Characteristics of interest were identified a priori and those with significant bivariate associations with potentially inappropriate were selected for inclusion in the model. Additionally, we included time of prescription in our model to control for potential confounding. All statistical analyses were performed using SAS 9.4 (SAS Institute Inc, Cary, North Carolina). The MSH Research Ethics Board approved the study.
RESULTS
Description of Patients Prescribed a Benzodiazepine Sedative Hypnotic
There were 1540 patients over the age of 65 discharged during the 4-month study period. We excluded the 232 patients who had been prescribed a BSH prior to admission. Of the remaining eligible 1308 BSH-naïve patients, 251 (19.2%) were prescribed a new BSH in hospital and were included in the study. Of this cohort of 251 patients, 193 (76.9%) patients were prescribed a single BSH during their admission while 58 (23.1%) received 2 or more. Of all eligible patients, 208 (15.9%) were prescribed at least 1 PIP. Approximately half of the cohort was admitted to the general internal medicine service, and the most common reason for admission was cardiovascular disease (Table 1).
Table 1
Description of Prescriptions of Benzodiazepine Sedative Hypnotic
We reviewed 328 prescriptions for BSH during the study period. The majority of these, 254 (77.4%) were potentially inappropriate (Table 2). The most common PIPs were zopiclone (167; 65.7%) and lorazepam (82; 32.3%). The PIPs were most frequently ordered on an as-needed basis (219; 86%), followed by one-time orders (30; 12%), and standing orders (5; 2%). The majority of PIPs (222; 87.4%) was prescribed for insomnia with a minority (32; 12.6%) prescribed for agitation and/or anxiety.
Table 2
Most PIP were prescribed during overnight hours (159; 62.6%) and when an in-house pharmacist was unavailable (211; 83.1%). These variables were highly correlated with prescription of sleep aid, which was defined in our criteria as potentially inappropriate. Copies of discharge prescriptions were available for 189 patients. Of these 189 patients, 19 (10.1%) were sent home with a prescription for a new sedative.
Association Between Patient/Provider Variables and Prescriptions
Patient factors associated with fewer PIPs in our bivariate analyses included older age and dementia (Table 1). A greater proportion of nighttime prescriptions were PIPs; however, this finding was not statistically significant (P = 0.067). The majority of all prescriptions was prescribed by residents in their first year of training (64.9%; Table 2), and there was a significant difference in rates of PIP across level of training (P = 0.0007). When stratified by time of prescription, there was no significant difference by level of training for nighttime prescriptions. Among daytime prescriptions, second-year residents and staff (attending physicians and fellows) were less likely to prescribe a PIP than first-year residents (odds ratio [OR], 0.24; 95% confidence interval [CI], 0.09-0.66 and OR, 0.39; 95% CI, 0.14-1.13, respectively; Table 3); however, the association between staff and first-years only approached statistical significance (P = 0.08). Interestingly, 20.4% of all PIPs were ordered routinely as part of an admission or postoperative order set.
Table 3
In our regression model, admission to a specialty or surgical service, compared to the general internal medicine service, was associated with a significantly higher likelihood of a PIP (OR, 6.61; 95% CI, 2.70-16.17; Table 4). Additionally, compared to cardiovascular admission diagnoses, neoplastic admitting diagnoses were associated with a higher likelihood of a PIP (OR, 4.43; 95% CI, 1.23-15.95). Time of prescription was a significant predictor in our multivariable regression model with nighttime prescriptions having increased odds of a PIP (OR, 4.48; 95% CI, 2.21-9.06,). When comparing prescribers at the extremes of training, attending physicians and fellows were much less likely to prescribe a PIP compared to first-year residents (OR, 0.23; 95% CI, 0.08-0.69; Table 4). However, there were no other significant differences across training levels after adjusting for patient and prescribing event characteristics.
Table 4
DISCUSSION
We found that the majority of newly prescribed BSH in hospital was for the potentially inappropriate indications of insomnia and agitation/anxiety. Medications for insomnia were primarily initiated during overnight hours. Training level of prescribers and admitting service were found to be associated with appropriateness of prescriptions.
Our study showed that 15.9% of hospitalized older adults were newly prescribed a PIP during their admission. Of all new in hospital prescriptions, 77% were deemed potentially inappropriate. These numbers are similar to those reported by other centers; however, wide ranges exist.16,19 This is likely the result of differences in appropriate use and inclusion criteria. Gillis et al.17 focused their investigation on sleep aids and showed that 26% of all admitted patients and 18% of BSH naïve patients received a prescription for insomnia. While this is similar to our findings, more than half of these patients were under the age of 65, and additional medications, such as trazodone, antihistamines, and antipsychotics were included.17 Other studies did not exclude patients who used a BSH regularly prior to admission. For example, 21% of veterans admitted to an acute care facility received a prescription for potentially inappropriate indications, but this included continuation of prior home medications.19 In contrast, we chose to focus on older adults in whom BSH pose a greater risk of harm. Exclusion of patients who regularly used a BSH prior to admission allowed us to better understand the circumstances surrounding the initiation of these medications in hospital. Furthermore, abrupt cessation of benzodiazepines can cause withdrawal and worsen confusion.22
We found that 10% of patients newly prescribed a BSH in hospital were discharged with a prescription for a BSH. The accuracy of this is limited by the lack of availability of electronic discharge prescriptions on our surgical wards; however, it is likely an underrepresentation of the true effect given the high rates of PIPs on these wards. Our study highlights the concerning practice of continuing newly prescribed BSH following discharge from hospital.
Sleep disruption and poor quality sleep in hospital is a common issue that leads to significant use of BSH.15 Nonpharmacologic interventions in older adults can be effective in improving sleep quality and reducing the need for BSH; however, they can be time-consuming to implement.23 With the exception of preventative strategies used on our Acute Care for Elders unit, formal nonpharmacologic interventions for sleep are not practiced in our hospital. We found that the majority of PIPs were prescribed as sleep aids in the overnight hours. This suggests that disruptions in sleep are leading patients and nursing staff to request pharmacologic treatments and highlights an area with significant room for improvement. Work is underway to implement and evaluate safe sleep protocols for older adults.
To our knowledge, we are the first to report an association between training level and PIP of BSH in older adults. The highest rates of PIPs were found among the first-year residents and, after controlling for patient and prescribing event characteristics, such as time of prescription, first-year residents were significantly more likely to prescribe a PIP. First-year residents are more likely to respond first to issues on the wards. There may be pressure on first-year trainees to prescribe sleep aids, as many patients and nurses may seek pharmacologic solutions for symptom management. Knowledge gaps may also be a contributing factor early in their training. A survey of physicians found that residents were more likely than attending physicians to list lack of formal education as a barrier to appropriate prescribing.24
Similarities are seen in a study of antibiotic appropriateness, where residents demonstrated gaps in knowledge of treatment of asymptomatic bacteriuria that seemed to vary by specialty.25 Interestingly, we found that patients admitted to general internal medicine were prescribed fewer PIPs. This service includes our Acute Care for Elders unit, which is staffed by trained geriatric nurses and other allied health professionals. Residents who rotated on internal medicine are also likely to have received informal teaching about medication safety in older adults. Educational interventions highlighting adverse effects of BSH and promoting nonpharmacologic solutions should be targeted at first-year residents. However, an interprofessional team approach to sleep disturbance in hospital, in combination with decision support for appropriate BSH use will achieve greater impact than education alone.
Several limitations of this study merit discussion. First, findings from a single academic center may lack generalizability. However, the demographics of our patient population and our rates of BSH use were similar to those reported in previous studies. Second, our study may be subject to observer bias, as the data collectors were not blinded. To minimize this, a strict template and clear appropriateness criteria were developed. Additionally, a second reviewer independently conducted data validation with 100% agreement among reviewers. Third, we studied prescribing patterns rather than medication administration and lacked data on filling of new BSH prescriptions in the postdischarge period. However, our primary goal is to determine risk of exposure to a BSH to minimize it. Fourth, although BSH are discouraged as “first choice for insomnia, anxiety or delirium,”4 they may be appropriate in limited situations where all nonpharmacologic strategies have failed and patient or staff safety is at risk. In our chart reviews, we were unable to determine whether all nonpharmacologic strategies were exhausted prior to prescription initiation. However, more than 20% of all PIP were routinely prescribed as part of an admission or postoperative order set, suggesting a reflexive rather than reflective approach to sedative use. Furthermore, the indications of anxiety and agitation were combined as they appear in the CPOE as a combination indication, thus leaving us unable to determine the true proportion for each indication. However, more than 87% of all PIPs were for insomnia, reflecting a clear opportunity to improve sleep management in hospital. Last, the lack of a power calculation may have resulted in the study being underpowered and thus affected the ability to detect a significant effect of covariates that have real differences on the likelihood of sedative prescriptions. For example, the low number of prescribing events by second-year residents and staff may have resulted in a type II error when comparing PIP rates with first-year residents.
We found that the majority of newly prescribed BSH among older adults in hospital were potentially inappropriate. They were most frequently prescribed by first-year residents overnight in response to insomnia. Our findings demonstrate BSH overuse remains prevalent and is associated with poor sleep in hospital. Future work will focus on implementing and evaluating safe sleep protocols and educational interventions aimed at first-year residents.
Acknowledgments
Elisabeth Pek had full access to all of the data in the study and takes responsibility for the integrity of the data and the accuracy of the data analysis. Ciara Pendrith conducted and is responsible for the statistical analysis.
Disclosure
The authors report no financial conflicts of interest.
References
1. Glass J, Lanctot KL, Herrmann N, Sproule BA, Busto UE. Sedative hypnotics in older people with insomnia: meta-analysis of risks and benefits. BMJ. 2005;331(7526):1169. PubMed 2. Inouye SK. Delirium in older persons. N Engl J Med. 2006;354(11):1157-1165. PubMed 3. Morden NE, Colla CH, Sequist TD, Rosenthal MB. Choosing wisely--the politics and economics of labeling low-value services. N Engl J Med. 2014;370(7):589-592. PubMed 4. Ten Things Physicians and Patients Should Question. American Geriatrics Society 2013. Revised April 23, 2015. http://www.choosingwisely.org/societies/american-geriatrics-society/. Accessed April 30, 2016. 5. Five Things Physicians and Patients Should Question. Canadian Geriatrics Society. Released April 2, 2014. http://www.choosingwiselycanada.org/recommendations/geriatrics/. Accessed April 30, 2016. 6. de Groot MH, van Campen JP, Moek MA, Tulner LR, Beijnen JH, Lamoth CJ. The effects of fall-risk-increasing drugs on postural control: a literature review. Drugs Aging. 2013;30(11):901-920. PubMed 7. Woolcott JC, Richardson KJ, Wiens MO, et al. Meta-analysis of the impact of 9 medication classes on falls in elderly persons. Arch Intern Med. 2009;169(21):1952-1960. PubMed 8. Pariente A, Dartigues JF, Benichou J, Letenneur L, Moore N, Fourrier-Réglat A. Benzodiazepines and injurious falls in community dwelling elders. Drugs Aging. 2008;25(1):61-70. PubMed 9. Frels C, Williams P, Narayanan S, Gariballa SE. Iatrogenic causes of falls in hospitalised elderly patients: a case-control study. Postgrad Med J. 2002;78(922):487-489. PubMed 10. Pavon JM, Zhao Y, McConnell E, Hastings SN. Identifying risk of readmission in hospitalized elderly adults through inpatient medication exposure. J Am Geriatr Soc. 2014;62(6):1116-1121. PubMed 11. Kang DY, Park S, Rhee CW, et al. Zolpidem use and risk of fracture in elderly insomnia patients. J Prev Med Public Health. 2012;45(4):219-226. PubMed 12. Kolla BP, Lovely JK, Mansukhani MP, Morgenthaler TI. Zolpidem is independently associated with increased risk of inpatient falls. J Hosp Med. 2013;8(1):1-6. PubMed 13. Finkle WD, Der JS, Greenland S, et al. Risk of fractures requiring hospitalization after an initial prescription for zolpidem, alprazolam, lorazepam, or diazepam in older adults. J Am Geriatr Soc. 2011;59(10):1883-1890. PubMed 14. Elliott RA, Woodward MC, Oborne CA. Improving benzodiazepine prescribing for elderly hospital inpatients using audit and multidisciplinary feedback. Intern Med J. 2001;31(9):529-535. PubMed 15. Cumbler E, Guerrasio J, Kim J, Glasheen J. Use of medications for insomnia in the hospitalized geriatric population. J Am Geriatr Soc. 2008;56(3):579-581. PubMed 16. Somers A, Robays H, Audenaert K, Van Maele G, Bogaert M, Petrovic M. The use of hypnosedative drugs in a university hospital: has anything changed in 10 years? Eur J Clin Pharmacol. 2011;67(7):723-729. PubMed 17. Gillis CM, Poyant JO, Degrado JR, Ye L, Anger KE, Owens RL. Inpatient pharmacological sleep aid utilization is common at a tertiary medical center. J Hosp Med. 2014;9(10):652-657. PubMed 18. Frighetto L, Marra C, Bandali S, Wilbur K, Naumann T, Jewesson P. An assessment of quality of sleep and the use of drugs with sedating properties in hospitalized adult patients. Health Qual Life Outcomes. 2004;2:17. PubMed 19. Garrido MM, Prigerson HG, Penrod JD, Jones SC, Boockvar KS. Benzodiazepine and sedative-hypnotic use among older seriously Ill veterans: choosing wisely? Clin Ther. 2014;36(11):1547-1554. PubMed 20. American Geriatrics Society updated Beers Criteria for potentially inappropriate medication use in older adults: The American Geriatrics Society 2012 Beers Criteria Update Expert Panel. J Am Geriatr Soc. 2012;60(4):616-631. PubMed 21. Charlson ME, Pompei P, Ales KL, MacKenzie CR. A new method of classifying prognostic comorbidity in longitudinal studies: development and validation. J Chronic Dis. 1987;40(5):373-383. PubMed 22. Foy A, Drinkwater V, March S, Mearrick P. Confusion after admission to hospital in elderly patients using benzodiazepines. Br Med J (Clin Res Ed). 1986;293(6554):1072. PubMed 23. McDowell JA, Mion LC, Lydon TJ, Inouye SK. A nonpharmacologic sleep protocol for hospitalized older patients. J Am Geriatr Soc. 1998;46(6):700-705. PubMed 24. Ramaswamy R, Maio V, Diamond JJ, et al. Potentially inappropriate prescribing in elderly: assessing doctor knowledge, confidence and barriers. J Eval Clin Pract. 2011;17(6):1153-1159. PubMed 25. Lee MJ, Kim M, Kim NH, et al. Why is asymptomatic bacteriuria overtreated?: A tertiary care institutional survey of resident physicians. BMC Infect Dis. 2015;15:289. PubMed
Older adults commonly experience insomnia and agitation during hospitalization. Unfortunately, the use of benzodiazepines and sedative hypnotics (BSH) to treat these conditions can be ineffective and expose patients to significant adverse effects.1,2 Choosing Wisely® is a campaign that promotes dialogue to reduce unnecessary medical tests, procedures, or treatments. This international campaign has highlighted BSHs as potentially harmful and has recommended against their use as first-line treatment of insomnia and agitation.3-5 Examples of harm with benzodiazepine use include cognitive impairment, impaired postural stability, and an increased incidence of falls and hip fractures in both community and acute care settings.6-8 In addition, prescriptions initiated in hospital appear to be associated with a higher risk of falls and unplanned readmission.9,10 The newer nonbenzodiazepine sedative hypnotics, commonly referred to as “z-drugs”, were initially marketed as a safer alternative in older adults due to their more favorable pharmacokinetics. Evidence has emerged that they carry similar risks.6,11,12 A study comparing benzodiazepines and zolpidem found relatively greater risk of fractures requiring hospitalization with the use of zolpidem compared to lorazepam.13
The use of benzodiazepines in the acute care setting has been evaluated in a number of studies and ranges from 20% to 45%.14-16 Few studies focus on the initiation of these medications in BSH-naïve hospitalized patients; however, reports range from 18% to 29%.17,18 Factors found to be associated with potentially inappropriate prescriptions (PIP) include Hispanic ethnicity, residing in an assisted care setting, and a greater number of BSH prescriptions prior to admission.16,19 Additionally, Cumbler et al.15 found that the presence of dementia was associated with fewer prescriptions for sleep aids in hospital. To our knowledge, there are no published studies that have investigated prescriber factors associated with the use of BSH.
The purpose of our study was to determine the frequency of PIPs of BSH in our academic hospital. Additionally, we aimed to identify patient and prescriber factors that were associated with increased likelihood of prescriptions to help guide future quality improvement initiatives.
METHODS
Study Design and Setting
This was a retrospective observational study conducted at Mount Sinai Hospital (MSH) in Toronto over a 4-month period from January 2013 to April 2013. The hospital is a 442-bed acute care academic health science center affiliated with the University of Toronto. The MSH electronic health record contains demographic data, medications and allergies, nursing documentation, and medical histories from prior encounters. It also includes computerized physician order entry (CPOE) and a detailed medication administration record. This system is integrated with an electronic pharmacy database used to monitor and dispense medications for each patient.
Patient and Medication Selection
We included inpatients over the age of 65 who were prescribed a BSH during the study period from the following services: general internal medicine, cardiology, general surgery, orthopedic surgery, and otolaryngology. To identify new exposure to BSHs, we excluded patients who were regularly prescribed a BSH prior to admission to hospital. The medications of interest included all benzodiazepines and the nonbenzodiazepine sedative hypnotic, zopiclone. Zopiclone is the most commonly used nonbenzodiazepine sedative hypnotic in Canada and the only 1 available on our hospital formulary. These were selected based on the strength of evidence to recommend against their use as first-line agents in older adults and in consultation with our geriatric medicine consultation team pharmacist.20
Data Collection
The hospital administrative database provided patient demographic information, admission service, admitting diagnosis, length of stay, and the total number of patients discharged from the study units over the study period. We then searched the pharmacy electronic database for all benzodiazepines and zopiclone prescribed during the study period for patients who met the inclusion criteria. Manual review of paper and electronic health records for this cohort of patients was conducted to extract additional variables. We used a standardized form to record data elements. Dr. Pek collected all data elements. Dr. Remfry reviewed a random sample of patient records (10%) to ensure accuracy. The agreement between reviewers was 100%.
In compliance with hospital accreditation standards, a clinical pharmacist documents a best possible medication history (BPMH) on every inpatient on admission. We used the BPMH to identify and exclude patients who were prescribed a BSH prior to hospitalization. Because all medications were ordered through the CPOE system, as-needed medication prescriptions required the selection of a specified indication. Available options included ‘agitation/anxiety’ and necessitated combining these 2 indications into 1 category. Indications were primarily extracted through electronic order entry reviews. Paper charts were reviewed when further clarification was needed.
We identified ordering physicians’ training level and familiarity with the service from administrative records obtained from medical education offices, hospital records, and relevant call schedules. Fellows were defined as trainees with a minimum of 6 years of postgraduate training.
Our primary outcome of interest was the proportion of eligible patients age 65 and older who received a PIP for a BSH. Patient variables of interest included age, sex, comorbid conditions, and a pre-admission diagnosis of dementia. Comorbid conditions and age were used to calculate the Carlson Comorbidity Index for each patient.21 Prescription variables included the medication prescribed, time of first prescription (“overnight hours” refer to prescriptions ordered after 7:00 PM and before 7:00 AM), and whether the medication was ordered as part of an admission or postoperative order set. To determine whether patients were discharged home with a prescription for a BSH, we reviewed electronic discharge prescriptions of BSH-naïve patients who received a sedative in hospital. Only medical and cardiology inpatients receive electronic discharge prescriptions, and these were available for 189 patients in our cohort. Provider variables included training level, service, and familiarity with patients. We used the provider’s training program or department of appointment to define the ‘physician on-service’ variable. As an example, a resident registered in internal medicine is defined as ‘on-service’ when prescribing sedatives for a medical inpatient. In contrast, a psychiatry resident would be considered “off-service” if he prescribed a sedative for a surgical inpatient. The familiarity of a provider was categorized as ‘regular’ if they were responsible for a patient’s care on a day-to-day basis and ‘covering’ if they were only covering on call. Other variables included admitting service and hospital length of stay.
Appropriateness Criteria
Criteria for potentially inappropriate use were modified from the American and Canadian Geriatrics Societies’ Choosing Wisely recommendations,4,5 and included insomnia and agitation. These recommendations are in line with other evidence based guidelines for safe prescribing in older adults.20 For the purposes of our study, prescriptions for “agitation/anxiety”, “agitation”, or “insomnia/sleep” were considered potentially inappropriate. Appropriate indications included alcohol withdrawal, end-of-life symptom control, preprocedural sedation, and seizure.5 Patients who were already using a BSH prior to admission for any indication, including a psychiatric diagnosis, were excluded.
Statistical Analyses
We determined the proportion of patients with at least one PIP, as well as the proportion of all prescribing events that were potentially inappropriate. We used the Chi-square statistic and 2-sample t tests to compare the unadjusted associations between patient-level characteristics and receipt of at least 1 inappropriate prescription and prescribing event-level factors with inappropriate prescriptions. Given that first-year residents are more likely to be working overnight when most PIPs are prescribed, we performed a simple logistic regression of potentially inappropriate prescribing by level of training stratified by time of prescription. A multivariable random-intercept logistic regression model was used to assess the adjusted association between patient- and prescribing event-level characteristics with inappropriate prescribing, adjusting for clustering of prescribing events within patients. Characteristics of interest were identified a priori and those with significant bivariate associations with potentially inappropriate were selected for inclusion in the model. Additionally, we included time of prescription in our model to control for potential confounding. All statistical analyses were performed using SAS 9.4 (SAS Institute Inc, Cary, North Carolina). The MSH Research Ethics Board approved the study.
RESULTS
Description of Patients Prescribed a Benzodiazepine Sedative Hypnotic
There were 1540 patients over the age of 65 discharged during the 4-month study period. We excluded the 232 patients who had been prescribed a BSH prior to admission. Of the remaining eligible 1308 BSH-naïve patients, 251 (19.2%) were prescribed a new BSH in hospital and were included in the study. Of this cohort of 251 patients, 193 (76.9%) patients were prescribed a single BSH during their admission while 58 (23.1%) received 2 or more. Of all eligible patients, 208 (15.9%) were prescribed at least 1 PIP. Approximately half of the cohort was admitted to the general internal medicine service, and the most common reason for admission was cardiovascular disease (Table 1).
Table 1
Description of Prescriptions of Benzodiazepine Sedative Hypnotic
We reviewed 328 prescriptions for BSH during the study period. The majority of these, 254 (77.4%) were potentially inappropriate (Table 2). The most common PIPs were zopiclone (167; 65.7%) and lorazepam (82; 32.3%). The PIPs were most frequently ordered on an as-needed basis (219; 86%), followed by one-time orders (30; 12%), and standing orders (5; 2%). The majority of PIPs (222; 87.4%) was prescribed for insomnia with a minority (32; 12.6%) prescribed for agitation and/or anxiety.
Table 2
Most PIP were prescribed during overnight hours (159; 62.6%) and when an in-house pharmacist was unavailable (211; 83.1%). These variables were highly correlated with prescription of sleep aid, which was defined in our criteria as potentially inappropriate. Copies of discharge prescriptions were available for 189 patients. Of these 189 patients, 19 (10.1%) were sent home with a prescription for a new sedative.
Association Between Patient/Provider Variables and Prescriptions
Patient factors associated with fewer PIPs in our bivariate analyses included older age and dementia (Table 1). A greater proportion of nighttime prescriptions were PIPs; however, this finding was not statistically significant (P = 0.067). The majority of all prescriptions was prescribed by residents in their first year of training (64.9%; Table 2), and there was a significant difference in rates of PIP across level of training (P = 0.0007). When stratified by time of prescription, there was no significant difference by level of training for nighttime prescriptions. Among daytime prescriptions, second-year residents and staff (attending physicians and fellows) were less likely to prescribe a PIP than first-year residents (odds ratio [OR], 0.24; 95% confidence interval [CI], 0.09-0.66 and OR, 0.39; 95% CI, 0.14-1.13, respectively; Table 3); however, the association between staff and first-years only approached statistical significance (P = 0.08). Interestingly, 20.4% of all PIPs were ordered routinely as part of an admission or postoperative order set.
Table 3
In our regression model, admission to a specialty or surgical service, compared to the general internal medicine service, was associated with a significantly higher likelihood of a PIP (OR, 6.61; 95% CI, 2.70-16.17; Table 4). Additionally, compared to cardiovascular admission diagnoses, neoplastic admitting diagnoses were associated with a higher likelihood of a PIP (OR, 4.43; 95% CI, 1.23-15.95). Time of prescription was a significant predictor in our multivariable regression model with nighttime prescriptions having increased odds of a PIP (OR, 4.48; 95% CI, 2.21-9.06,). When comparing prescribers at the extremes of training, attending physicians and fellows were much less likely to prescribe a PIP compared to first-year residents (OR, 0.23; 95% CI, 0.08-0.69; Table 4). However, there were no other significant differences across training levels after adjusting for patient and prescribing event characteristics.
Table 4
DISCUSSION
We found that the majority of newly prescribed BSH in hospital was for the potentially inappropriate indications of insomnia and agitation/anxiety. Medications for insomnia were primarily initiated during overnight hours. Training level of prescribers and admitting service were found to be associated with appropriateness of prescriptions.
Our study showed that 15.9% of hospitalized older adults were newly prescribed a PIP during their admission. Of all new in hospital prescriptions, 77% were deemed potentially inappropriate. These numbers are similar to those reported by other centers; however, wide ranges exist.16,19 This is likely the result of differences in appropriate use and inclusion criteria. Gillis et al.17 focused their investigation on sleep aids and showed that 26% of all admitted patients and 18% of BSH naïve patients received a prescription for insomnia. While this is similar to our findings, more than half of these patients were under the age of 65, and additional medications, such as trazodone, antihistamines, and antipsychotics were included.17 Other studies did not exclude patients who used a BSH regularly prior to admission. For example, 21% of veterans admitted to an acute care facility received a prescription for potentially inappropriate indications, but this included continuation of prior home medications.19 In contrast, we chose to focus on older adults in whom BSH pose a greater risk of harm. Exclusion of patients who regularly used a BSH prior to admission allowed us to better understand the circumstances surrounding the initiation of these medications in hospital. Furthermore, abrupt cessation of benzodiazepines can cause withdrawal and worsen confusion.22
We found that 10% of patients newly prescribed a BSH in hospital were discharged with a prescription for a BSH. The accuracy of this is limited by the lack of availability of electronic discharge prescriptions on our surgical wards; however, it is likely an underrepresentation of the true effect given the high rates of PIPs on these wards. Our study highlights the concerning practice of continuing newly prescribed BSH following discharge from hospital.
Sleep disruption and poor quality sleep in hospital is a common issue that leads to significant use of BSH.15 Nonpharmacologic interventions in older adults can be effective in improving sleep quality and reducing the need for BSH; however, they can be time-consuming to implement.23 With the exception of preventative strategies used on our Acute Care for Elders unit, formal nonpharmacologic interventions for sleep are not practiced in our hospital. We found that the majority of PIPs were prescribed as sleep aids in the overnight hours. This suggests that disruptions in sleep are leading patients and nursing staff to request pharmacologic treatments and highlights an area with significant room for improvement. Work is underway to implement and evaluate safe sleep protocols for older adults.
To our knowledge, we are the first to report an association between training level and PIP of BSH in older adults. The highest rates of PIPs were found among the first-year residents and, after controlling for patient and prescribing event characteristics, such as time of prescription, first-year residents were significantly more likely to prescribe a PIP. First-year residents are more likely to respond first to issues on the wards. There may be pressure on first-year trainees to prescribe sleep aids, as many patients and nurses may seek pharmacologic solutions for symptom management. Knowledge gaps may also be a contributing factor early in their training. A survey of physicians found that residents were more likely than attending physicians to list lack of formal education as a barrier to appropriate prescribing.24
Similarities are seen in a study of antibiotic appropriateness, where residents demonstrated gaps in knowledge of treatment of asymptomatic bacteriuria that seemed to vary by specialty.25 Interestingly, we found that patients admitted to general internal medicine were prescribed fewer PIPs. This service includes our Acute Care for Elders unit, which is staffed by trained geriatric nurses and other allied health professionals. Residents who rotated on internal medicine are also likely to have received informal teaching about medication safety in older adults. Educational interventions highlighting adverse effects of BSH and promoting nonpharmacologic solutions should be targeted at first-year residents. However, an interprofessional team approach to sleep disturbance in hospital, in combination with decision support for appropriate BSH use will achieve greater impact than education alone.
Several limitations of this study merit discussion. First, findings from a single academic center may lack generalizability. However, the demographics of our patient population and our rates of BSH use were similar to those reported in previous studies. Second, our study may be subject to observer bias, as the data collectors were not blinded. To minimize this, a strict template and clear appropriateness criteria were developed. Additionally, a second reviewer independently conducted data validation with 100% agreement among reviewers. Third, we studied prescribing patterns rather than medication administration and lacked data on filling of new BSH prescriptions in the postdischarge period. However, our primary goal is to determine risk of exposure to a BSH to minimize it. Fourth, although BSH are discouraged as “first choice for insomnia, anxiety or delirium,”4 they may be appropriate in limited situations where all nonpharmacologic strategies have failed and patient or staff safety is at risk. In our chart reviews, we were unable to determine whether all nonpharmacologic strategies were exhausted prior to prescription initiation. However, more than 20% of all PIP were routinely prescribed as part of an admission or postoperative order set, suggesting a reflexive rather than reflective approach to sedative use. Furthermore, the indications of anxiety and agitation were combined as they appear in the CPOE as a combination indication, thus leaving us unable to determine the true proportion for each indication. However, more than 87% of all PIPs were for insomnia, reflecting a clear opportunity to improve sleep management in hospital. Last, the lack of a power calculation may have resulted in the study being underpowered and thus affected the ability to detect a significant effect of covariates that have real differences on the likelihood of sedative prescriptions. For example, the low number of prescribing events by second-year residents and staff may have resulted in a type II error when comparing PIP rates with first-year residents.
We found that the majority of newly prescribed BSH among older adults in hospital were potentially inappropriate. They were most frequently prescribed by first-year residents overnight in response to insomnia. Our findings demonstrate BSH overuse remains prevalent and is associated with poor sleep in hospital. Future work will focus on implementing and evaluating safe sleep protocols and educational interventions aimed at first-year residents.
Acknowledgments
Elisabeth Pek had full access to all of the data in the study and takes responsibility for the integrity of the data and the accuracy of the data analysis. Ciara Pendrith conducted and is responsible for the statistical analysis.
Disclosure
The authors report no financial conflicts of interest.
Older adults commonly experience insomnia and agitation during hospitalization. Unfortunately, the use of benzodiazepines and sedative hypnotics (BSH) to treat these conditions can be ineffective and expose patients to significant adverse effects.1,2 Choosing Wisely® is a campaign that promotes dialogue to reduce unnecessary medical tests, procedures, or treatments. This international campaign has highlighted BSHs as potentially harmful and has recommended against their use as first-line treatment of insomnia and agitation.3-5 Examples of harm with benzodiazepine use include cognitive impairment, impaired postural stability, and an increased incidence of falls and hip fractures in both community and acute care settings.6-8 In addition, prescriptions initiated in hospital appear to be associated with a higher risk of falls and unplanned readmission.9,10 The newer nonbenzodiazepine sedative hypnotics, commonly referred to as “z-drugs”, were initially marketed as a safer alternative in older adults due to their more favorable pharmacokinetics. Evidence has emerged that they carry similar risks.6,11,12 A study comparing benzodiazepines and zolpidem found relatively greater risk of fractures requiring hospitalization with the use of zolpidem compared to lorazepam.13
The use of benzodiazepines in the acute care setting has been evaluated in a number of studies and ranges from 20% to 45%.14-16 Few studies focus on the initiation of these medications in BSH-naïve hospitalized patients; however, reports range from 18% to 29%.17,18 Factors found to be associated with potentially inappropriate prescriptions (PIP) include Hispanic ethnicity, residing in an assisted care setting, and a greater number of BSH prescriptions prior to admission.16,19 Additionally, Cumbler et al.15 found that the presence of dementia was associated with fewer prescriptions for sleep aids in hospital. To our knowledge, there are no published studies that have investigated prescriber factors associated with the use of BSH.
The purpose of our study was to determine the frequency of PIPs of BSH in our academic hospital. Additionally, we aimed to identify patient and prescriber factors that were associated with increased likelihood of prescriptions to help guide future quality improvement initiatives.
METHODS
Study Design and Setting
This was a retrospective observational study conducted at Mount Sinai Hospital (MSH) in Toronto over a 4-month period from January 2013 to April 2013. The hospital is a 442-bed acute care academic health science center affiliated with the University of Toronto. The MSH electronic health record contains demographic data, medications and allergies, nursing documentation, and medical histories from prior encounters. It also includes computerized physician order entry (CPOE) and a detailed medication administration record. This system is integrated with an electronic pharmacy database used to monitor and dispense medications for each patient.
Patient and Medication Selection
We included inpatients over the age of 65 who were prescribed a BSH during the study period from the following services: general internal medicine, cardiology, general surgery, orthopedic surgery, and otolaryngology. To identify new exposure to BSHs, we excluded patients who were regularly prescribed a BSH prior to admission to hospital. The medications of interest included all benzodiazepines and the nonbenzodiazepine sedative hypnotic, zopiclone. Zopiclone is the most commonly used nonbenzodiazepine sedative hypnotic in Canada and the only 1 available on our hospital formulary. These were selected based on the strength of evidence to recommend against their use as first-line agents in older adults and in consultation with our geriatric medicine consultation team pharmacist.20
Data Collection
The hospital administrative database provided patient demographic information, admission service, admitting diagnosis, length of stay, and the total number of patients discharged from the study units over the study period. We then searched the pharmacy electronic database for all benzodiazepines and zopiclone prescribed during the study period for patients who met the inclusion criteria. Manual review of paper and electronic health records for this cohort of patients was conducted to extract additional variables. We used a standardized form to record data elements. Dr. Pek collected all data elements. Dr. Remfry reviewed a random sample of patient records (10%) to ensure accuracy. The agreement between reviewers was 100%.
In compliance with hospital accreditation standards, a clinical pharmacist documents a best possible medication history (BPMH) on every inpatient on admission. We used the BPMH to identify and exclude patients who were prescribed a BSH prior to hospitalization. Because all medications were ordered through the CPOE system, as-needed medication prescriptions required the selection of a specified indication. Available options included ‘agitation/anxiety’ and necessitated combining these 2 indications into 1 category. Indications were primarily extracted through electronic order entry reviews. Paper charts were reviewed when further clarification was needed.
We identified ordering physicians’ training level and familiarity with the service from administrative records obtained from medical education offices, hospital records, and relevant call schedules. Fellows were defined as trainees with a minimum of 6 years of postgraduate training.
Our primary outcome of interest was the proportion of eligible patients age 65 and older who received a PIP for a BSH. Patient variables of interest included age, sex, comorbid conditions, and a pre-admission diagnosis of dementia. Comorbid conditions and age were used to calculate the Carlson Comorbidity Index for each patient.21 Prescription variables included the medication prescribed, time of first prescription (“overnight hours” refer to prescriptions ordered after 7:00 PM and before 7:00 AM), and whether the medication was ordered as part of an admission or postoperative order set. To determine whether patients were discharged home with a prescription for a BSH, we reviewed electronic discharge prescriptions of BSH-naïve patients who received a sedative in hospital. Only medical and cardiology inpatients receive electronic discharge prescriptions, and these were available for 189 patients in our cohort. Provider variables included training level, service, and familiarity with patients. We used the provider’s training program or department of appointment to define the ‘physician on-service’ variable. As an example, a resident registered in internal medicine is defined as ‘on-service’ when prescribing sedatives for a medical inpatient. In contrast, a psychiatry resident would be considered “off-service” if he prescribed a sedative for a surgical inpatient. The familiarity of a provider was categorized as ‘regular’ if they were responsible for a patient’s care on a day-to-day basis and ‘covering’ if they were only covering on call. Other variables included admitting service and hospital length of stay.
Appropriateness Criteria
Criteria for potentially inappropriate use were modified from the American and Canadian Geriatrics Societies’ Choosing Wisely recommendations,4,5 and included insomnia and agitation. These recommendations are in line with other evidence based guidelines for safe prescribing in older adults.20 For the purposes of our study, prescriptions for “agitation/anxiety”, “agitation”, or “insomnia/sleep” were considered potentially inappropriate. Appropriate indications included alcohol withdrawal, end-of-life symptom control, preprocedural sedation, and seizure.5 Patients who were already using a BSH prior to admission for any indication, including a psychiatric diagnosis, were excluded.
Statistical Analyses
We determined the proportion of patients with at least one PIP, as well as the proportion of all prescribing events that were potentially inappropriate. We used the Chi-square statistic and 2-sample t tests to compare the unadjusted associations between patient-level characteristics and receipt of at least 1 inappropriate prescription and prescribing event-level factors with inappropriate prescriptions. Given that first-year residents are more likely to be working overnight when most PIPs are prescribed, we performed a simple logistic regression of potentially inappropriate prescribing by level of training stratified by time of prescription. A multivariable random-intercept logistic regression model was used to assess the adjusted association between patient- and prescribing event-level characteristics with inappropriate prescribing, adjusting for clustering of prescribing events within patients. Characteristics of interest were identified a priori and those with significant bivariate associations with potentially inappropriate were selected for inclusion in the model. Additionally, we included time of prescription in our model to control for potential confounding. All statistical analyses were performed using SAS 9.4 (SAS Institute Inc, Cary, North Carolina). The MSH Research Ethics Board approved the study.
RESULTS
Description of Patients Prescribed a Benzodiazepine Sedative Hypnotic
There were 1540 patients over the age of 65 discharged during the 4-month study period. We excluded the 232 patients who had been prescribed a BSH prior to admission. Of the remaining eligible 1308 BSH-naïve patients, 251 (19.2%) were prescribed a new BSH in hospital and were included in the study. Of this cohort of 251 patients, 193 (76.9%) patients were prescribed a single BSH during their admission while 58 (23.1%) received 2 or more. Of all eligible patients, 208 (15.9%) were prescribed at least 1 PIP. Approximately half of the cohort was admitted to the general internal medicine service, and the most common reason for admission was cardiovascular disease (Table 1).
Table 1
Description of Prescriptions of Benzodiazepine Sedative Hypnotic
We reviewed 328 prescriptions for BSH during the study period. The majority of these, 254 (77.4%) were potentially inappropriate (Table 2). The most common PIPs were zopiclone (167; 65.7%) and lorazepam (82; 32.3%). The PIPs were most frequently ordered on an as-needed basis (219; 86%), followed by one-time orders (30; 12%), and standing orders (5; 2%). The majority of PIPs (222; 87.4%) was prescribed for insomnia with a minority (32; 12.6%) prescribed for agitation and/or anxiety.
Table 2
Most PIP were prescribed during overnight hours (159; 62.6%) and when an in-house pharmacist was unavailable (211; 83.1%). These variables were highly correlated with prescription of sleep aid, which was defined in our criteria as potentially inappropriate. Copies of discharge prescriptions were available for 189 patients. Of these 189 patients, 19 (10.1%) were sent home with a prescription for a new sedative.
Association Between Patient/Provider Variables and Prescriptions
Patient factors associated with fewer PIPs in our bivariate analyses included older age and dementia (Table 1). A greater proportion of nighttime prescriptions were PIPs; however, this finding was not statistically significant (P = 0.067). The majority of all prescriptions was prescribed by residents in their first year of training (64.9%; Table 2), and there was a significant difference in rates of PIP across level of training (P = 0.0007). When stratified by time of prescription, there was no significant difference by level of training for nighttime prescriptions. Among daytime prescriptions, second-year residents and staff (attending physicians and fellows) were less likely to prescribe a PIP than first-year residents (odds ratio [OR], 0.24; 95% confidence interval [CI], 0.09-0.66 and OR, 0.39; 95% CI, 0.14-1.13, respectively; Table 3); however, the association between staff and first-years only approached statistical significance (P = 0.08). Interestingly, 20.4% of all PIPs were ordered routinely as part of an admission or postoperative order set.
Table 3
In our regression model, admission to a specialty or surgical service, compared to the general internal medicine service, was associated with a significantly higher likelihood of a PIP (OR, 6.61; 95% CI, 2.70-16.17; Table 4). Additionally, compared to cardiovascular admission diagnoses, neoplastic admitting diagnoses were associated with a higher likelihood of a PIP (OR, 4.43; 95% CI, 1.23-15.95). Time of prescription was a significant predictor in our multivariable regression model with nighttime prescriptions having increased odds of a PIP (OR, 4.48; 95% CI, 2.21-9.06,). When comparing prescribers at the extremes of training, attending physicians and fellows were much less likely to prescribe a PIP compared to first-year residents (OR, 0.23; 95% CI, 0.08-0.69; Table 4). However, there were no other significant differences across training levels after adjusting for patient and prescribing event characteristics.
Table 4
DISCUSSION
We found that the majority of newly prescribed BSH in hospital was for the potentially inappropriate indications of insomnia and agitation/anxiety. Medications for insomnia were primarily initiated during overnight hours. Training level of prescribers and admitting service were found to be associated with appropriateness of prescriptions.
Our study showed that 15.9% of hospitalized older adults were newly prescribed a PIP during their admission. Of all new in hospital prescriptions, 77% were deemed potentially inappropriate. These numbers are similar to those reported by other centers; however, wide ranges exist.16,19 This is likely the result of differences in appropriate use and inclusion criteria. Gillis et al.17 focused their investigation on sleep aids and showed that 26% of all admitted patients and 18% of BSH naïve patients received a prescription for insomnia. While this is similar to our findings, more than half of these patients were under the age of 65, and additional medications, such as trazodone, antihistamines, and antipsychotics were included.17 Other studies did not exclude patients who used a BSH regularly prior to admission. For example, 21% of veterans admitted to an acute care facility received a prescription for potentially inappropriate indications, but this included continuation of prior home medications.19 In contrast, we chose to focus on older adults in whom BSH pose a greater risk of harm. Exclusion of patients who regularly used a BSH prior to admission allowed us to better understand the circumstances surrounding the initiation of these medications in hospital. Furthermore, abrupt cessation of benzodiazepines can cause withdrawal and worsen confusion.22
We found that 10% of patients newly prescribed a BSH in hospital were discharged with a prescription for a BSH. The accuracy of this is limited by the lack of availability of electronic discharge prescriptions on our surgical wards; however, it is likely an underrepresentation of the true effect given the high rates of PIPs on these wards. Our study highlights the concerning practice of continuing newly prescribed BSH following discharge from hospital.
Sleep disruption and poor quality sleep in hospital is a common issue that leads to significant use of BSH.15 Nonpharmacologic interventions in older adults can be effective in improving sleep quality and reducing the need for BSH; however, they can be time-consuming to implement.23 With the exception of preventative strategies used on our Acute Care for Elders unit, formal nonpharmacologic interventions for sleep are not practiced in our hospital. We found that the majority of PIPs were prescribed as sleep aids in the overnight hours. This suggests that disruptions in sleep are leading patients and nursing staff to request pharmacologic treatments and highlights an area with significant room for improvement. Work is underway to implement and evaluate safe sleep protocols for older adults.
To our knowledge, we are the first to report an association between training level and PIP of BSH in older adults. The highest rates of PIPs were found among the first-year residents and, after controlling for patient and prescribing event characteristics, such as time of prescription, first-year residents were significantly more likely to prescribe a PIP. First-year residents are more likely to respond first to issues on the wards. There may be pressure on first-year trainees to prescribe sleep aids, as many patients and nurses may seek pharmacologic solutions for symptom management. Knowledge gaps may also be a contributing factor early in their training. A survey of physicians found that residents were more likely than attending physicians to list lack of formal education as a barrier to appropriate prescribing.24
Similarities are seen in a study of antibiotic appropriateness, where residents demonstrated gaps in knowledge of treatment of asymptomatic bacteriuria that seemed to vary by specialty.25 Interestingly, we found that patients admitted to general internal medicine were prescribed fewer PIPs. This service includes our Acute Care for Elders unit, which is staffed by trained geriatric nurses and other allied health professionals. Residents who rotated on internal medicine are also likely to have received informal teaching about medication safety in older adults. Educational interventions highlighting adverse effects of BSH and promoting nonpharmacologic solutions should be targeted at first-year residents. However, an interprofessional team approach to sleep disturbance in hospital, in combination with decision support for appropriate BSH use will achieve greater impact than education alone.
Several limitations of this study merit discussion. First, findings from a single academic center may lack generalizability. However, the demographics of our patient population and our rates of BSH use were similar to those reported in previous studies. Second, our study may be subject to observer bias, as the data collectors were not blinded. To minimize this, a strict template and clear appropriateness criteria were developed. Additionally, a second reviewer independently conducted data validation with 100% agreement among reviewers. Third, we studied prescribing patterns rather than medication administration and lacked data on filling of new BSH prescriptions in the postdischarge period. However, our primary goal is to determine risk of exposure to a BSH to minimize it. Fourth, although BSH are discouraged as “first choice for insomnia, anxiety or delirium,”4 they may be appropriate in limited situations where all nonpharmacologic strategies have failed and patient or staff safety is at risk. In our chart reviews, we were unable to determine whether all nonpharmacologic strategies were exhausted prior to prescription initiation. However, more than 20% of all PIP were routinely prescribed as part of an admission or postoperative order set, suggesting a reflexive rather than reflective approach to sedative use. Furthermore, the indications of anxiety and agitation were combined as they appear in the CPOE as a combination indication, thus leaving us unable to determine the true proportion for each indication. However, more than 87% of all PIPs were for insomnia, reflecting a clear opportunity to improve sleep management in hospital. Last, the lack of a power calculation may have resulted in the study being underpowered and thus affected the ability to detect a significant effect of covariates that have real differences on the likelihood of sedative prescriptions. For example, the low number of prescribing events by second-year residents and staff may have resulted in a type II error when comparing PIP rates with first-year residents.
We found that the majority of newly prescribed BSH among older adults in hospital were potentially inappropriate. They were most frequently prescribed by first-year residents overnight in response to insomnia. Our findings demonstrate BSH overuse remains prevalent and is associated with poor sleep in hospital. Future work will focus on implementing and evaluating safe sleep protocols and educational interventions aimed at first-year residents.
Acknowledgments
Elisabeth Pek had full access to all of the data in the study and takes responsibility for the integrity of the data and the accuracy of the data analysis. Ciara Pendrith conducted and is responsible for the statistical analysis.
Disclosure
The authors report no financial conflicts of interest.
References
1. Glass J, Lanctot KL, Herrmann N, Sproule BA, Busto UE. Sedative hypnotics in older people with insomnia: meta-analysis of risks and benefits. BMJ. 2005;331(7526):1169. PubMed 2. Inouye SK. Delirium in older persons. N Engl J Med. 2006;354(11):1157-1165. PubMed 3. Morden NE, Colla CH, Sequist TD, Rosenthal MB. Choosing wisely--the politics and economics of labeling low-value services. N Engl J Med. 2014;370(7):589-592. PubMed 4. Ten Things Physicians and Patients Should Question. American Geriatrics Society 2013. Revised April 23, 2015. http://www.choosingwisely.org/societies/american-geriatrics-society/. Accessed April 30, 2016. 5. Five Things Physicians and Patients Should Question. Canadian Geriatrics Society. Released April 2, 2014. http://www.choosingwiselycanada.org/recommendations/geriatrics/. Accessed April 30, 2016. 6. de Groot MH, van Campen JP, Moek MA, Tulner LR, Beijnen JH, Lamoth CJ. The effects of fall-risk-increasing drugs on postural control: a literature review. Drugs Aging. 2013;30(11):901-920. PubMed 7. Woolcott JC, Richardson KJ, Wiens MO, et al. Meta-analysis of the impact of 9 medication classes on falls in elderly persons. Arch Intern Med. 2009;169(21):1952-1960. PubMed 8. Pariente A, Dartigues JF, Benichou J, Letenneur L, Moore N, Fourrier-Réglat A. Benzodiazepines and injurious falls in community dwelling elders. Drugs Aging. 2008;25(1):61-70. PubMed 9. Frels C, Williams P, Narayanan S, Gariballa SE. Iatrogenic causes of falls in hospitalised elderly patients: a case-control study. Postgrad Med J. 2002;78(922):487-489. PubMed 10. Pavon JM, Zhao Y, McConnell E, Hastings SN. Identifying risk of readmission in hospitalized elderly adults through inpatient medication exposure. J Am Geriatr Soc. 2014;62(6):1116-1121. PubMed 11. Kang DY, Park S, Rhee CW, et al. Zolpidem use and risk of fracture in elderly insomnia patients. J Prev Med Public Health. 2012;45(4):219-226. PubMed 12. Kolla BP, Lovely JK, Mansukhani MP, Morgenthaler TI. Zolpidem is independently associated with increased risk of inpatient falls. J Hosp Med. 2013;8(1):1-6. PubMed 13. Finkle WD, Der JS, Greenland S, et al. Risk of fractures requiring hospitalization after an initial prescription for zolpidem, alprazolam, lorazepam, or diazepam in older adults. J Am Geriatr Soc. 2011;59(10):1883-1890. PubMed 14. Elliott RA, Woodward MC, Oborne CA. Improving benzodiazepine prescribing for elderly hospital inpatients using audit and multidisciplinary feedback. Intern Med J. 2001;31(9):529-535. PubMed 15. Cumbler E, Guerrasio J, Kim J, Glasheen J. Use of medications for insomnia in the hospitalized geriatric population. J Am Geriatr Soc. 2008;56(3):579-581. PubMed 16. Somers A, Robays H, Audenaert K, Van Maele G, Bogaert M, Petrovic M. The use of hypnosedative drugs in a university hospital: has anything changed in 10 years? Eur J Clin Pharmacol. 2011;67(7):723-729. PubMed 17. Gillis CM, Poyant JO, Degrado JR, Ye L, Anger KE, Owens RL. Inpatient pharmacological sleep aid utilization is common at a tertiary medical center. J Hosp Med. 2014;9(10):652-657. PubMed 18. Frighetto L, Marra C, Bandali S, Wilbur K, Naumann T, Jewesson P. An assessment of quality of sleep and the use of drugs with sedating properties in hospitalized adult patients. Health Qual Life Outcomes. 2004;2:17. PubMed 19. Garrido MM, Prigerson HG, Penrod JD, Jones SC, Boockvar KS. Benzodiazepine and sedative-hypnotic use among older seriously Ill veterans: choosing wisely? Clin Ther. 2014;36(11):1547-1554. PubMed 20. American Geriatrics Society updated Beers Criteria for potentially inappropriate medication use in older adults: The American Geriatrics Society 2012 Beers Criteria Update Expert Panel. J Am Geriatr Soc. 2012;60(4):616-631. PubMed 21. Charlson ME, Pompei P, Ales KL, MacKenzie CR. A new method of classifying prognostic comorbidity in longitudinal studies: development and validation. J Chronic Dis. 1987;40(5):373-383. PubMed 22. Foy A, Drinkwater V, March S, Mearrick P. Confusion after admission to hospital in elderly patients using benzodiazepines. Br Med J (Clin Res Ed). 1986;293(6554):1072. PubMed 23. McDowell JA, Mion LC, Lydon TJ, Inouye SK. A nonpharmacologic sleep protocol for hospitalized older patients. J Am Geriatr Soc. 1998;46(6):700-705. PubMed 24. Ramaswamy R, Maio V, Diamond JJ, et al. Potentially inappropriate prescribing in elderly: assessing doctor knowledge, confidence and barriers. J Eval Clin Pract. 2011;17(6):1153-1159. PubMed 25. Lee MJ, Kim M, Kim NH, et al. Why is asymptomatic bacteriuria overtreated?: A tertiary care institutional survey of resident physicians. BMC Infect Dis. 2015;15:289. PubMed
References
1. Glass J, Lanctot KL, Herrmann N, Sproule BA, Busto UE. Sedative hypnotics in older people with insomnia: meta-analysis of risks and benefits. BMJ. 2005;331(7526):1169. PubMed 2. Inouye SK. Delirium in older persons. N Engl J Med. 2006;354(11):1157-1165. PubMed 3. Morden NE, Colla CH, Sequist TD, Rosenthal MB. Choosing wisely--the politics and economics of labeling low-value services. N Engl J Med. 2014;370(7):589-592. PubMed 4. Ten Things Physicians and Patients Should Question. American Geriatrics Society 2013. Revised April 23, 2015. http://www.choosingwisely.org/societies/american-geriatrics-society/. Accessed April 30, 2016. 5. Five Things Physicians and Patients Should Question. Canadian Geriatrics Society. Released April 2, 2014. http://www.choosingwiselycanada.org/recommendations/geriatrics/. Accessed April 30, 2016. 6. de Groot MH, van Campen JP, Moek MA, Tulner LR, Beijnen JH, Lamoth CJ. The effects of fall-risk-increasing drugs on postural control: a literature review. Drugs Aging. 2013;30(11):901-920. PubMed 7. Woolcott JC, Richardson KJ, Wiens MO, et al. Meta-analysis of the impact of 9 medication classes on falls in elderly persons. Arch Intern Med. 2009;169(21):1952-1960. PubMed 8. Pariente A, Dartigues JF, Benichou J, Letenneur L, Moore N, Fourrier-Réglat A. Benzodiazepines and injurious falls in community dwelling elders. Drugs Aging. 2008;25(1):61-70. PubMed 9. Frels C, Williams P, Narayanan S, Gariballa SE. Iatrogenic causes of falls in hospitalised elderly patients: a case-control study. Postgrad Med J. 2002;78(922):487-489. PubMed 10. Pavon JM, Zhao Y, McConnell E, Hastings SN. Identifying risk of readmission in hospitalized elderly adults through inpatient medication exposure. J Am Geriatr Soc. 2014;62(6):1116-1121. PubMed 11. Kang DY, Park S, Rhee CW, et al. Zolpidem use and risk of fracture in elderly insomnia patients. J Prev Med Public Health. 2012;45(4):219-226. PubMed 12. Kolla BP, Lovely JK, Mansukhani MP, Morgenthaler TI. Zolpidem is independently associated with increased risk of inpatient falls. J Hosp Med. 2013;8(1):1-6. PubMed 13. Finkle WD, Der JS, Greenland S, et al. Risk of fractures requiring hospitalization after an initial prescription for zolpidem, alprazolam, lorazepam, or diazepam in older adults. J Am Geriatr Soc. 2011;59(10):1883-1890. PubMed 14. Elliott RA, Woodward MC, Oborne CA. Improving benzodiazepine prescribing for elderly hospital inpatients using audit and multidisciplinary feedback. Intern Med J. 2001;31(9):529-535. PubMed 15. Cumbler E, Guerrasio J, Kim J, Glasheen J. Use of medications for insomnia in the hospitalized geriatric population. J Am Geriatr Soc. 2008;56(3):579-581. PubMed 16. Somers A, Robays H, Audenaert K, Van Maele G, Bogaert M, Petrovic M. The use of hypnosedative drugs in a university hospital: has anything changed in 10 years? Eur J Clin Pharmacol. 2011;67(7):723-729. PubMed 17. Gillis CM, Poyant JO, Degrado JR, Ye L, Anger KE, Owens RL. Inpatient pharmacological sleep aid utilization is common at a tertiary medical center. J Hosp Med. 2014;9(10):652-657. PubMed 18. Frighetto L, Marra C, Bandali S, Wilbur K, Naumann T, Jewesson P. An assessment of quality of sleep and the use of drugs with sedating properties in hospitalized adult patients. Health Qual Life Outcomes. 2004;2:17. PubMed 19. Garrido MM, Prigerson HG, Penrod JD, Jones SC, Boockvar KS. Benzodiazepine and sedative-hypnotic use among older seriously Ill veterans: choosing wisely? Clin Ther. 2014;36(11):1547-1554. PubMed 20. American Geriatrics Society updated Beers Criteria for potentially inappropriate medication use in older adults: The American Geriatrics Society 2012 Beers Criteria Update Expert Panel. J Am Geriatr Soc. 2012;60(4):616-631. PubMed 21. Charlson ME, Pompei P, Ales KL, MacKenzie CR. A new method of classifying prognostic comorbidity in longitudinal studies: development and validation. J Chronic Dis. 1987;40(5):373-383. PubMed 22. Foy A, Drinkwater V, March S, Mearrick P. Confusion after admission to hospital in elderly patients using benzodiazepines. Br Med J (Clin Res Ed). 1986;293(6554):1072. PubMed 23. McDowell JA, Mion LC, Lydon TJ, Inouye SK. A nonpharmacologic sleep protocol for hospitalized older patients. J Am Geriatr Soc. 1998;46(6):700-705. PubMed 24. Ramaswamy R, Maio V, Diamond JJ, et al. Potentially inappropriate prescribing in elderly: assessing doctor knowledge, confidence and barriers. J Eval Clin Pract. 2011;17(6):1153-1159. PubMed 25. Lee MJ, Kim M, Kim NH, et al. Why is asymptomatic bacteriuria overtreated?: A tertiary care institutional survey of resident physicians. BMC Infect Dis. 2015;15:289. PubMed
Hospital-acquired anemia (HAA) is defined as having a normal hemoglobin value upon admission but developing anemia during the course of hospitalization. The condition is common, with an incidence ranging from approximately 25% when defined by using the hemoglobin value prior to discharge to 74% when using the nadir hemoglobin value during hospitalization.1-5 While there are many potential etiologies for HAA, given that iatrogenic blood loss from phlebotomy may lead to its development,6,7 HAA has been postulated to be a hazard of hospitalization that is potentially preventable.8 However, it is unclear whether the development of HAA portends worse outcomes after hospital discharge.
The limited number of studies on the association between HAA and postdischarge outcomes has been restricted to patients hospitalized for acute myocardial infarction (AMI).3,9,10 Among this subpopulation, HAA is independently associated with greater morbidity and mortality following hospital discharge.3,9,10 In a more broadly representative population of hospitalized adults, Koch et al.2 found that the development of HAA is associated with greater length of stay (LOS), hospital charges, and inpatient mortality. However, given that HAA was defined by the lowest hemoglobin level during hospitalization (and not necessarily the last value prior to discharge), it is unclear if the worse outcomes observed were the cause of the HAA, rather than its effect, since hospital LOS is a robust predictor for the development of HAA, as well as a major driver of hospital costs and a prognostic marker for inpatient mortality.3,9 Furthermore, this study evaluated outcomes only during the index hospitalization, so it is unclear if patients who develop HAA have worse clinical outcomes after discharge.
Therefore, in this study, we used clinically granular electronic health record (EHR) data from a diverse cohort of consecutive medicine inpatients hospitalized for any reason at 1 of 6 hospitals to: 1) describe the epidemiology of HAA; 2) identify predictors of its development; and 3) examine its association with 30-day postdischarge adverse outcomes. We hypothesized that the development of HAA would be independently associated with 30-day readmission and mortality in a dose-dependent fashion, with increasing severity of HAA associated with worse outcomes.
METHODS
Study Design, Population, and Data Sources
We conducted a retrospective observational cohort study using EHR data collected from November 1, 2009 to October 30, 2010 from 6 hospitals in the north Texas region. One site was a university-affiliated safety-net hospital; the remaining 5 community hospitals were a mix of teaching and nonteaching sites. All hospitals used the Epic EHR system (Epic Systems Corporation, Verona, Wisconsin). Details of this cohort have been published.11,12This study included consecutive hospitalizations among adults age 18 years or older who were discharged from a medicine inpatient service with any diagnosis. We excluded hospitalizations by individuals who were anemic within the first 24 hours of admission (hematocrit less than 36% for women and less than 40% for men), were missing a hematocrit value within the first 24 hours of hospitalization or a repeat hematocrit value prior to discharge, had a hospitalization in the preceding 30 days (ie, index hospitalization was considered a readmission), died in the hospital, were transferred to another hospital, or left against medical advice. For individuals with multiple eligible hospitalizations during the study period, we included only the first hospitalization. We also excluded those discharged to hospice, given that this population of individuals may have intentionally desired less aggressive care.
Definition of Hospital-Acquired Anemia
HAA was defined as having a normal hematocrit value (36% or greater for women and 40% or greater for men) within the first 24 hours of admission and a hematocrit value at the time of hospital discharge lower than the World Health Organization’s sex-specific cut points.13 If there was more than 1 hematocrit value on the same day, we chose the lowest value. Based on prior studies, HAA was further categorized by severity as mild (hematocrit greater than 33% and less than 36% in women; and greater than 33% and less than 40% in men), moderate (hematocrit greater than 27% and 33% or less for all), or severe (hematocrit 27% or less for all).2,14
Characteristics
We extracted information on sociodemographic characteristics, comorbidities, LOS, procedures, blood transfusions, and laboratory values from the EHR. Hospitalizations in the 12 months preceding the index hospitalization were ascertained from the EHR and from an all-payer regional hospitalization database that captures hospitalizations from 75 acute care hospitals within a 100-mile radius of Dallas-Fort Worth. International Classification of Diseases, Ninth Revision, Clinical Modification (ICD-9-CM) discharge diagnosis codes were categorized according to the Agency for Healthcare Research and Quality (AHRQ) Clinical Classifications Software (CCS).15 We defined a diagnosis for hemorrhage and coagulation, and hemorrhagic disorder as the presence of any ICD-9-CM code (primary or secondary) that mapped to the AHRQ CCS diagnoses 60 and 153, and 62, respectively. Procedures were categorized as minor diagnostic, minor therapeutic, major diagnostic, and major therapeutic using the AHRQ Healthcare Cost and Utilization Procedure Classes tool.16
Outcomes
The primary outcome was a composite of death or readmission within 30 days of hospital discharge. Hospital readmissions were ascertained at the index hospital and at any of 75 acute care hospitals in the region as described earlier. Death was ascertained from each of the hospitals’ EHR and administrative data and the Social Security Death Index. Individuals who had both outcomes (eg, a 30-day readmission and death) were considered to have only 1 occurrence of the composite primary outcome measure. Our secondary outcomes were death and readmission within 30 days of discharge, considered as separate outcomes.
Statistical Analysis
We used logistic regression models to evaluate predictors of HAA and to estimate the association of HAA on subsequent 30-day adverse outcomes after hospital discharge. All models accounted for clustering of patients by hospital. For the outcomes analyses, models were adjusted for potential confounders based on prior literature and our group’s expertise, which included age, sex, race/ethnicity, Charlson comorbidity index, prior hospitalizations, nonelective admission status, creatinine level on admission, blood urea nitrogen (BUN) to creatinine ratio of more than 20:1 on admission, LOS, receipt of a major diagnostic or therapeutic procedure during the index hospitalization, a discharge diagnosis for hemorrhage, and a discharge diagnosis for a coagulation or hemorrhagic disorder. For the mortality analyses, given the limited number of 30-day deaths after hospital discharge in our cohort, we collapsed moderate and severe HAA into a single category. In sensitivity analyses, we repeated the adjusted model, but excluded patients in our cohort who had received at least 1 blood transfusion during the index hospitalization (2.6%) given its potential for harm, and patients with a primary discharge diagnosis for AMI (3.1%).17
The functional forms of continuous variables were assessed using restricted cubic splines and locally weighted scatterplot smoothing techniques. All analyses were performed using STATA statistical software version 12.0 (StataCorp, College Station, Texas). The University of Texas Southwestern Medical Center institutional review board approved this study.
Figure
RESULTS
Of 53,995 consecutive medicine hospitalizations among adults age 18 years or older during our study period, 11,309 index hospitalizations were included in our study cohort (Supplemental Figure 1). The majority of patients excluded were because of having documented anemia within the first 24 hours of admission (n=24,950). With increasing severity of HAA, patients were older, more likely to be female, non-Hispanic white, electively admitted, have fewer comorbidities, less likely to be hospitalized in the past year, more likely to have had a major procedure, receive a blood transfusion, have a longer LOS, and have a primary or secondary discharge diagnosis for a hemorrhage or a coagulation or hemorrhagic disorder (Table 1).
Table 1
Epidemiology of HAA
Among this cohort of patients without anemia on admission, the median hematocrit value on admission was 40.6 g/dL and on discharge was 38.9 g/dL. One-third of patients with normal hematocrit value at admission developed HAA, with 21.6% developing mild HAA, 10.1% developing moderate HAA, and 1.4% developing severe HAA. The median discharge hematocrit value was 36 g/dL (interquartile range [IQR]), 35-38 g/dL) for the group of patients who developed mild HAA, 31 g/dL (IQR, 30-32 g/dL) for moderate HAA, and 26 g/dL (IQR, 25-27 g/dL) for severe HAA (Supplemental Figure 2). Among the severe HAA group, 135 of the 159 patients (85%) had a major procedure (n=123, accounting for 219 unique major procedures), a diagnosis for hemorrhage (n=30), and/or a diagnosis for a coagulation or hemorrhagic disorder (n=23) during the index hospitalization. Of the 219 major procedures among patients with severe HAA, most were musculoskeletal (92 procedures), cardiovascular (61 procedures), or digestive system-related (41 procedures). The most common types of procedures were coronary artery bypass graft (36 procedures), hip replacement (25 procedures), knee replacement (17 procedures), and femur fracture reduction (15 procedures). The 10 most common principal discharge diagnoses of the index hospitalization by HAA group are shown in Supplemental Table 1. For the severe HAA group, the most common diagnosis was hip fracture (20.8%).
Predictors of HAA
Compared to no or mild HAA, female sex, elective admission status, serum creatinine on admission, BUN to creatinine ratio greater than 20 to 1, hospital LOS, and undergoing a major diagnostic or therapeutic procedure were predictors for the development of moderate or severe HAA (Table 2). The model explained 23% of the variance (McFadden’s pseudo R2).
Table 2
Incidence of Postdischarge Outcomes by Severity of HAA
The severity of HAA was associated with a dose-dependent increase in the incidence of 30-day adverse outcomes, such that patients with increasing severity of HAA had greater 30-day composite, mortality, and readmission outcomes (P < 0.001; Figure). The 30-day postdischarge composite outcome was primarily driven by hospital readmissions given the low mortality rate in our cohort. Patients who did not develop HAA had an incidence of 9.7% for the composite outcome, whereas patients with severe HAA had an incidence of 16.4%. Among the 24 patients with severe HAA but who had not undergone a major procedure or had a discharge diagnosis for hemorrhage or for a coagulation or hemorrhagic disorder, only 3 (12.5%) had a composite postdischarge adverse outcome (2 readmissions and 1 death). The median time to readmission was similar between groups, but more patients with severe HAA had an early readmission within 7 days of hospital discharge than patients who did not develop HAA (6.9% vs. 2.9%, P = 0.001; Supplemental Table 2).
Association of HAA and Postdischarge Outcomes
In unadjusted analyses, compared to not developing HAA, mild, moderate, and severe HAA were associated with a 29%, 61%, and 81% increase in the odds for a composite outcome, respectively (Table 3). After adjustment for confounders, the effect size for HAA attenuated and was no longer statistically significant for mild and moderate HAA. However, severe HAA was significantly associated with a 39% increase in the odds for the composite outcome and a 41% increase in the odds for 30-day readmission (P = 0.008 and P = 0.02, respectively).
Table 3
In sensitivity analyses, the exclusion of individuals who received at least 1 blood transfusion during the index hospitalization (n=298) and individuals who had a primary discharge diagnosis for AMI (n=353) did not substantively change the estimates of the association between severe HAA and postdischarge outcomes (Supplemental Tables 3 and 4). However, because of the fewer number of adverse events for each analysis, the confidence intervals were wider and the association of severe HAA and the composite outcome and readmission were no longer statistically significant in these subcohorts.
DISCUSSION
In this large and diverse sample of medical inpatients, we found that HAA occurs in one-third of adults with normal hematocrit value at admission, where 10.1% of the cohort developed moderately severe HAA and 1.4% developed severe HAA by the time of discharge. Length of stay and undergoing a major diagnostic or therapeutic procedure were the 2 strongest potentially modifiable predictors of developing moderate or severe HAA. Severe HAA was independently associated with a 39% increase in the odds of being readmitted or dying within 30 days after hospital discharge compared to not developing HAA. However, the associations between mild or moderate HAA with adverse outcomes were attenuated after adjusting for confounders and were no longer statistically significant.
To our knowledge, this is the first study on the postdischarge adverse outcomes of HAA among a diverse cohort of medical inpatients hospitalized for any reason. In a more restricted population, Salisbury et al.3 found that patients hospitalized for AMI who developed moderate to severe HAA (hemoglobin value at discharge of 11 g/dL or less) had greater 1-year mortality than those without HAA (8.4% vs. 2.6%, P < 0.001), and had an 82% increase in the hazard for mortality (95% confidence interval, hazard ratio 1.11-2.98). Others have similarly shown that HAA is common among patients hospitalized with AMI and is associated with greater mortality.5,9,18 Our study extends upon this prior research by showing that severe HAA increases the risk for adverse outcomes for all adult inpatients, not only those hospitalized for AMI or among those receiving blood transfusions.
Despite the increased harm associated with severe HAA, it is unclear whether HAA is a preventable hazard of hospitalization, as suggested by others.6,8 Most patients in our cohort who developed severe HAA underwent a major procedure, had a discharge diagnosis for hemorrhage, and/or had a discharge diagnosis for a coagulation or hemorrhagic disorder. Thus, blood loss due to phlebotomy, 1 of the more modifiable etiologies of HAA, was unlikely to have been the primary driver for most patients who developed severe HAA. Since it has been estimated to take 15 days of daily phlebotomy of 53 mL of whole blood in females of average body weight (and 20 days for average weight males) with no bone marrow synthesis for severe anemia to develop, it is even less likely that phlebotomy was the principal etiology given an 8-day median LOS among patients with severe HAA.19,20 However, since the etiology of HAA can be multifactorial, limiting blood loss due to phlebotomy by using smaller volume tubes, blood conservation devices, or reducing unnecessary testing may mitigate the development of severe HAA.21,22 Additionally, since more than three-quarters of patients who developed severe HAA underwent a major procedure, more care and attention to minimizing operative blood loss could lessen the severity of HAA and facilitate better recovery. If minimizing blood loss is not feasible, in the absence of symptoms related to anemia or ongoing blood loss, randomized controlled trials overwhelmingly support a restrictive transfusion strategy using a hemoglobin value threshold of 7 mg/dL, even in the postoperative setting.23-25
The implications of mild to moderate HAA are less clear. The odds ratios for mild and moderate HAA, while not statistically significant, suggest a small increase in harm compared to not developing HAA. Furthermore, the upper boundary of the confidence intervals for mild and moderate HAA cannot exclude a possible 30% and 56% increase in the odds for the 30-day composite outcome, respectively. Thus, a better powered study, including more patients and extending the time interval for ascertaining postdischarge adverse events beyond 30 days, may reveal a harmful association. Lastly, our study assessed only the association of HAA with 30-day readmission and mortality. Examining the association between HAA and other patient-centered outcomes such as fatigue, functional impairment, and prolonged posthospitalization recovery time may uncover other important adverse effects of mild and moderate HAA, both of which occur far more frequently than severe HAA.
Our findings should be interpreted in the context of several limitations. First, although we included a diverse group of patients from a multihospital cohort, generalizability to other settings is uncertain. Second, as this was a retrospective study using EHR data, we had limited information to infer the precise mechanism of HAA for each patient. However, procedure codes and discharge diagnoses enabled us to assess which patients underwent a major procedure or had a hemorrhage or hemorrhagic disorder during the hospitalization. Third, given the relatively few number of patients with severe HAA in our cohort, we were unable to assess if the association of severe HAA differed by suspected etiology. Lastly, because we were unable to ascertain the timing of the hematocrit values within the first 24 hours of admission, we excluded both patients with preexisting anemia on admission and those who developed HAA within the first 24 hours of admission, which is not uncommon.26 Thus, we were unable to assess the effect of acute on chronic anemia arising during hospitalization and HAA that develops within the first 24 hours, both of which may also be harmful.18,27,28
In conclusion, severe HAA occurs in 1.4% of all medical hospitalizations and is associated with increased odds of death or readmission within 30 days. Since most patients with severe HAA had undergone a major procedure or had a discharge diagnosis of hemorrhage or a coagulation or hemorrhagic disorder, it is unclear if severe HAA is potentially preventable through preventing blood loss from phlebotomy or by reducing iatrogenic injury during procedures. Future research should assess the potential preventability of severe HAA, and examine other patient-centered outcomes potentially related to anemia, including fatigue, functional impairment, and trajectory of posthospital recovery.
Acknowledgments
The authors would like to acknowledge Ruben Amarasingham, MD, MBA, President and Chief Executive Officer of the Parkland Center for Clinical Innovation, and Ferdinand Velasco, MD, Chief Health Information Officer at Texas Health Resources, for their assistance in assembling the 6 hospital cohort used in this study. The authors would also like to thank Valy Fontil, MD, MAS, Assistant Professor of Medicine at the University of California San Francisco School of Medicine, and Elizabeth Rogers, MD, MAS, Assistant Professor of Internal Medicine and Pediatrics at the University of Minnesota Medical School, for their constructive feedback on an earlier version of this manuscript.
Disclosures
This work was supported by the Agency for Healthcare Research and Quality-funded UT Southwestern Center for Patient-Centered Outcomes Research (R24 HS022418-01); the Commonwealth Foundation (#20100323); the UT Southwestern KL2 Scholars Program supported by the National Institutes of Health (KL2 TR001103); the National Center for Advancing Translational Sciences at the National Institute of Health (U54 RFA-TR-12-006); and the National Institute on Aging (K23AG052603). The study sponsors had no role in design and conduct of the study; collection, management, analysis, and interpretation of the data; and preparation, review, or approval of the manuscript. The authors have no financial conflicts of interest to disclose.
1. Kurniali PC, Curry S, Brennan KW, et al. A retrospective study investigating the incidence and predisposing factors of hospital-acquired anemia. Anemia. 2014;2014:634582. PubMed 2. Koch CG, Li L, Sun Z, et al. Hospital-acquired anemia: prevalence, outcomes, and healthcare implications. J Hosp Med. 2013;8(9):506-512. PubMed 3. Salisbury AC, Alexander KP, Reid KJ, et al. Incidence, correlates, and outcomes of acute, hospital-acquired anemia in patients with acute myocardial infarction. Circ Cardiovasc Qual Outcomes. 2010;3(4):337-346. PubMed 4. Salisbury AC, Amin AP, Reid KJ, et al. Hospital-acquired anemia and in-hospital mortality in patients with acute myocardial infarction. Am Heart J. 2011;162(2):300-309 e303. PubMed 5. Meroño O, Cladellas M, Recasens L, et al. In-hospital acquired anemia in acute coronary syndrome. Predictors, in-hospital prognosis and one-year mortality. Rev Esp Cardiol (Engl Ed). 2012;65(8):742-748. PubMed 6. Salisbury AC, Reid KJ, Alexander KP, et al. Diagnostic blood loss from phlebotomy and hospital-acquired anemia during acute myocardial infarction. Arch Intern Med. 2011;171(18):1646-1653. PubMed 7. Thavendiranathan P, Bagai A, Ebidia A, Detsky AS, Choudhry NK. Do blood tests cause anemia in hospitalized patients? The effect of diagnostic phlebotomy on hemoglobin and hematocrit levels. J Gen Intern Med. 2005;20(6):520-524. PubMed 8. Rennke S, Fang MC. Hazards of hospitalization: more than just “never events”. Arch Intern Med. 2011;171(18):1653-1654. PubMed 9. Choi JS, Kim YA, Kang YU, et al. Clinical impact of hospital-acquired anemia in association with acute kidney injury and chronic kidney disease in patients with acute myocardial infarction. PLoS One. 2013;8(9):e75583. PubMed 10. Salisbury AC, Kosiborod M, Amin AP, et al. Recovery from hospital-acquired anemia after acute myocardial infarction and effect on outcomes. Am J Cardiol. 2011;108(7):949-954. PubMed 11. Nguyen OK, Makam AN, Clark C, et al. Predicting all-cause readmissions using electronic health record data from the entire hospitalization: Model development and comparison. J Hosp Med. 2016;11(7):473-480. PubMed 12. Amarasingham R, Velasco F, Xie B, et al. Electronic medical record-based multicondition models to predict the risk of 30 day readmission or death among adult medicine patients: validation and comparison to existing models. BMC Med Inform Decis Mak. 2015;15:39. PubMed 13. World Health Organization. Hemoglobin concentrations for the diagnosis of anaemia and assessment of severity. http://www.who.int/vmnis/indicators/haemoglobin.pdf. Accessed March 15, 2016. 14. Martin ND, Scantling D. Hospital-acquired anemia: a contemporary review of etiologies and prevention strategies. J Infus Nurs. 2015;38(5):330-338. PubMed 15. Agency for Healthcare Research and Quality, Rockville, MD. Clinical classification software (CCS) for ICD-9-CM. Healthcare Cost and Utilization Project. 2015 http://www.hcup-us.ahrq.gov/toolssoftware/ccs/ccs.jsp. Accessed November 18, 2015. 16. Agency for Healthcare Research and Quality, Rockville, MD. Procedure classes2015. Healthcare Cost and Utilization Project. 2015. https://www.hcup-us.ahrq.gov/toolssoftware/procedure/procedure.jsp. Accessed November 18, 2015. 17. Corwin HL, Gettinger A, Pearl RG, et al. The CRIT Study: Anemia and blood transfusion in the critically ill--current clinical practice in the United States. Crit Care Med. 2004;32(1):39-52. PubMed 18. Aronson D, Suleiman M, Agmon Y, et al. Changes in haemoglobin levels during hospital course and long-term outcome after acute myocardial infarction. Eur Heart J. 2007;28(11):1289-1296. PubMed 19. Lyon AW, Chin AC, Slotsve GA, Lyon ME. Simulation of repetitive diagnostic blood loss and onset of iatrogenic anemia in critical care patients with a mathematical model. Comput Biol Med. 2013;43(2):84-90. PubMed 20. van der Bom JG, Cannegieter SC. Hospital-acquired anemia: the contribution of diagnostic blood loss. J Thromb Haemost. 2015;13(6):1157-1159. PubMed 21. Sanchez-Giron F, Alvarez-Mora F. Reduction of blood loss from laboratory testing in hospitalized adult patients using small-volume (pediatric) tubes. Arch Pathol Lab Med. 2008;132(12):1916-1919. PubMed 22. Smoller BR, Kruskall MS. Phlebotomy for diagnostic laboratory tests in adults. Pattern of use and effect on transfusion requirements. N Engl J Med. 1986;314(19):1233-1235. PubMed 23. Carson JL, Carless PA, Hebert PC. Transfusion thresholds and other strategies for guiding allogeneic red blood cell transfusion. Cochrane Database Syst Rev. 2012(4):CD002042. PubMed 24. Carson JL, Carless PA, Hébert PC. Outcomes using lower vs higher hemoglobin thresholds for red blood cell transfusion. JAMA. 2013;309(1):83-84. PubMed 25. Carson JL, Sieber F, Cook DR, et al. Liberal versus restrictive blood transfusion strategy: 3-year survival and cause of death results from the FOCUS randomised controlled trial. Lancet. 2015;385(9974):1183-1189. PubMed 26. Rajkomar A, McCulloch CE, Fang MC. Low diagnostic utility of rechecking hemoglobins within 24 hours in hospitalized patients. Am J Med. 2016;129(11):1194-1197. PubMed 27. Reade MC, Weissfeld L, Angus DC, Kellum JA, Milbrandt EB. The prevalence of anemia and its association with 90-day mortality in hospitalized community-acquired pneumonia. BMC Pulm Med. 2010;10:15. PubMed 28. Halm EA, Wang JJ, Boockvar K, et al. The effect of perioperative anemia on clinical and functional outcomes in patients with hip fracture. J Orthop Trauma. 2004;18(6):369-374. PubMed
Hospital-acquired anemia (HAA) is defined as having a normal hemoglobin value upon admission but developing anemia during the course of hospitalization. The condition is common, with an incidence ranging from approximately 25% when defined by using the hemoglobin value prior to discharge to 74% when using the nadir hemoglobin value during hospitalization.1-5 While there are many potential etiologies for HAA, given that iatrogenic blood loss from phlebotomy may lead to its development,6,7 HAA has been postulated to be a hazard of hospitalization that is potentially preventable.8 However, it is unclear whether the development of HAA portends worse outcomes after hospital discharge.
The limited number of studies on the association between HAA and postdischarge outcomes has been restricted to patients hospitalized for acute myocardial infarction (AMI).3,9,10 Among this subpopulation, HAA is independently associated with greater morbidity and mortality following hospital discharge.3,9,10 In a more broadly representative population of hospitalized adults, Koch et al.2 found that the development of HAA is associated with greater length of stay (LOS), hospital charges, and inpatient mortality. However, given that HAA was defined by the lowest hemoglobin level during hospitalization (and not necessarily the last value prior to discharge), it is unclear if the worse outcomes observed were the cause of the HAA, rather than its effect, since hospital LOS is a robust predictor for the development of HAA, as well as a major driver of hospital costs and a prognostic marker for inpatient mortality.3,9 Furthermore, this study evaluated outcomes only during the index hospitalization, so it is unclear if patients who develop HAA have worse clinical outcomes after discharge.
Therefore, in this study, we used clinically granular electronic health record (EHR) data from a diverse cohort of consecutive medicine inpatients hospitalized for any reason at 1 of 6 hospitals to: 1) describe the epidemiology of HAA; 2) identify predictors of its development; and 3) examine its association with 30-day postdischarge adverse outcomes. We hypothesized that the development of HAA would be independently associated with 30-day readmission and mortality in a dose-dependent fashion, with increasing severity of HAA associated with worse outcomes.
METHODS
Study Design, Population, and Data Sources
We conducted a retrospective observational cohort study using EHR data collected from November 1, 2009 to October 30, 2010 from 6 hospitals in the north Texas region. One site was a university-affiliated safety-net hospital; the remaining 5 community hospitals were a mix of teaching and nonteaching sites. All hospitals used the Epic EHR system (Epic Systems Corporation, Verona, Wisconsin). Details of this cohort have been published.11,12This study included consecutive hospitalizations among adults age 18 years or older who were discharged from a medicine inpatient service with any diagnosis. We excluded hospitalizations by individuals who were anemic within the first 24 hours of admission (hematocrit less than 36% for women and less than 40% for men), were missing a hematocrit value within the first 24 hours of hospitalization or a repeat hematocrit value prior to discharge, had a hospitalization in the preceding 30 days (ie, index hospitalization was considered a readmission), died in the hospital, were transferred to another hospital, or left against medical advice. For individuals with multiple eligible hospitalizations during the study period, we included only the first hospitalization. We also excluded those discharged to hospice, given that this population of individuals may have intentionally desired less aggressive care.
Definition of Hospital-Acquired Anemia
HAA was defined as having a normal hematocrit value (36% or greater for women and 40% or greater for men) within the first 24 hours of admission and a hematocrit value at the time of hospital discharge lower than the World Health Organization’s sex-specific cut points.13 If there was more than 1 hematocrit value on the same day, we chose the lowest value. Based on prior studies, HAA was further categorized by severity as mild (hematocrit greater than 33% and less than 36% in women; and greater than 33% and less than 40% in men), moderate (hematocrit greater than 27% and 33% or less for all), or severe (hematocrit 27% or less for all).2,14
Characteristics
We extracted information on sociodemographic characteristics, comorbidities, LOS, procedures, blood transfusions, and laboratory values from the EHR. Hospitalizations in the 12 months preceding the index hospitalization were ascertained from the EHR and from an all-payer regional hospitalization database that captures hospitalizations from 75 acute care hospitals within a 100-mile radius of Dallas-Fort Worth. International Classification of Diseases, Ninth Revision, Clinical Modification (ICD-9-CM) discharge diagnosis codes were categorized according to the Agency for Healthcare Research and Quality (AHRQ) Clinical Classifications Software (CCS).15 We defined a diagnosis for hemorrhage and coagulation, and hemorrhagic disorder as the presence of any ICD-9-CM code (primary or secondary) that mapped to the AHRQ CCS diagnoses 60 and 153, and 62, respectively. Procedures were categorized as minor diagnostic, minor therapeutic, major diagnostic, and major therapeutic using the AHRQ Healthcare Cost and Utilization Procedure Classes tool.16
Outcomes
The primary outcome was a composite of death or readmission within 30 days of hospital discharge. Hospital readmissions were ascertained at the index hospital and at any of 75 acute care hospitals in the region as described earlier. Death was ascertained from each of the hospitals’ EHR and administrative data and the Social Security Death Index. Individuals who had both outcomes (eg, a 30-day readmission and death) were considered to have only 1 occurrence of the composite primary outcome measure. Our secondary outcomes were death and readmission within 30 days of discharge, considered as separate outcomes.
Statistical Analysis
We used logistic regression models to evaluate predictors of HAA and to estimate the association of HAA on subsequent 30-day adverse outcomes after hospital discharge. All models accounted for clustering of patients by hospital. For the outcomes analyses, models were adjusted for potential confounders based on prior literature and our group’s expertise, which included age, sex, race/ethnicity, Charlson comorbidity index, prior hospitalizations, nonelective admission status, creatinine level on admission, blood urea nitrogen (BUN) to creatinine ratio of more than 20:1 on admission, LOS, receipt of a major diagnostic or therapeutic procedure during the index hospitalization, a discharge diagnosis for hemorrhage, and a discharge diagnosis for a coagulation or hemorrhagic disorder. For the mortality analyses, given the limited number of 30-day deaths after hospital discharge in our cohort, we collapsed moderate and severe HAA into a single category. In sensitivity analyses, we repeated the adjusted model, but excluded patients in our cohort who had received at least 1 blood transfusion during the index hospitalization (2.6%) given its potential for harm, and patients with a primary discharge diagnosis for AMI (3.1%).17
The functional forms of continuous variables were assessed using restricted cubic splines and locally weighted scatterplot smoothing techniques. All analyses were performed using STATA statistical software version 12.0 (StataCorp, College Station, Texas). The University of Texas Southwestern Medical Center institutional review board approved this study.
Figure
RESULTS
Of 53,995 consecutive medicine hospitalizations among adults age 18 years or older during our study period, 11,309 index hospitalizations were included in our study cohort (Supplemental Figure 1). The majority of patients excluded were because of having documented anemia within the first 24 hours of admission (n=24,950). With increasing severity of HAA, patients were older, more likely to be female, non-Hispanic white, electively admitted, have fewer comorbidities, less likely to be hospitalized in the past year, more likely to have had a major procedure, receive a blood transfusion, have a longer LOS, and have a primary or secondary discharge diagnosis for a hemorrhage or a coagulation or hemorrhagic disorder (Table 1).
Table 1
Epidemiology of HAA
Among this cohort of patients without anemia on admission, the median hematocrit value on admission was 40.6 g/dL and on discharge was 38.9 g/dL. One-third of patients with normal hematocrit value at admission developed HAA, with 21.6% developing mild HAA, 10.1% developing moderate HAA, and 1.4% developing severe HAA. The median discharge hematocrit value was 36 g/dL (interquartile range [IQR]), 35-38 g/dL) for the group of patients who developed mild HAA, 31 g/dL (IQR, 30-32 g/dL) for moderate HAA, and 26 g/dL (IQR, 25-27 g/dL) for severe HAA (Supplemental Figure 2). Among the severe HAA group, 135 of the 159 patients (85%) had a major procedure (n=123, accounting for 219 unique major procedures), a diagnosis for hemorrhage (n=30), and/or a diagnosis for a coagulation or hemorrhagic disorder (n=23) during the index hospitalization. Of the 219 major procedures among patients with severe HAA, most were musculoskeletal (92 procedures), cardiovascular (61 procedures), or digestive system-related (41 procedures). The most common types of procedures were coronary artery bypass graft (36 procedures), hip replacement (25 procedures), knee replacement (17 procedures), and femur fracture reduction (15 procedures). The 10 most common principal discharge diagnoses of the index hospitalization by HAA group are shown in Supplemental Table 1. For the severe HAA group, the most common diagnosis was hip fracture (20.8%).
Predictors of HAA
Compared to no or mild HAA, female sex, elective admission status, serum creatinine on admission, BUN to creatinine ratio greater than 20 to 1, hospital LOS, and undergoing a major diagnostic or therapeutic procedure were predictors for the development of moderate or severe HAA (Table 2). The model explained 23% of the variance (McFadden’s pseudo R2).
Table 2
Incidence of Postdischarge Outcomes by Severity of HAA
The severity of HAA was associated with a dose-dependent increase in the incidence of 30-day adverse outcomes, such that patients with increasing severity of HAA had greater 30-day composite, mortality, and readmission outcomes (P < 0.001; Figure). The 30-day postdischarge composite outcome was primarily driven by hospital readmissions given the low mortality rate in our cohort. Patients who did not develop HAA had an incidence of 9.7% for the composite outcome, whereas patients with severe HAA had an incidence of 16.4%. Among the 24 patients with severe HAA but who had not undergone a major procedure or had a discharge diagnosis for hemorrhage or for a coagulation or hemorrhagic disorder, only 3 (12.5%) had a composite postdischarge adverse outcome (2 readmissions and 1 death). The median time to readmission was similar between groups, but more patients with severe HAA had an early readmission within 7 days of hospital discharge than patients who did not develop HAA (6.9% vs. 2.9%, P = 0.001; Supplemental Table 2).
Association of HAA and Postdischarge Outcomes
In unadjusted analyses, compared to not developing HAA, mild, moderate, and severe HAA were associated with a 29%, 61%, and 81% increase in the odds for a composite outcome, respectively (Table 3). After adjustment for confounders, the effect size for HAA attenuated and was no longer statistically significant for mild and moderate HAA. However, severe HAA was significantly associated with a 39% increase in the odds for the composite outcome and a 41% increase in the odds for 30-day readmission (P = 0.008 and P = 0.02, respectively).
Table 3
In sensitivity analyses, the exclusion of individuals who received at least 1 blood transfusion during the index hospitalization (n=298) and individuals who had a primary discharge diagnosis for AMI (n=353) did not substantively change the estimates of the association between severe HAA and postdischarge outcomes (Supplemental Tables 3 and 4). However, because of the fewer number of adverse events for each analysis, the confidence intervals were wider and the association of severe HAA and the composite outcome and readmission were no longer statistically significant in these subcohorts.
DISCUSSION
In this large and diverse sample of medical inpatients, we found that HAA occurs in one-third of adults with normal hematocrit value at admission, where 10.1% of the cohort developed moderately severe HAA and 1.4% developed severe HAA by the time of discharge. Length of stay and undergoing a major diagnostic or therapeutic procedure were the 2 strongest potentially modifiable predictors of developing moderate or severe HAA. Severe HAA was independently associated with a 39% increase in the odds of being readmitted or dying within 30 days after hospital discharge compared to not developing HAA. However, the associations between mild or moderate HAA with adverse outcomes were attenuated after adjusting for confounders and were no longer statistically significant.
To our knowledge, this is the first study on the postdischarge adverse outcomes of HAA among a diverse cohort of medical inpatients hospitalized for any reason. In a more restricted population, Salisbury et al.3 found that patients hospitalized for AMI who developed moderate to severe HAA (hemoglobin value at discharge of 11 g/dL or less) had greater 1-year mortality than those without HAA (8.4% vs. 2.6%, P < 0.001), and had an 82% increase in the hazard for mortality (95% confidence interval, hazard ratio 1.11-2.98). Others have similarly shown that HAA is common among patients hospitalized with AMI and is associated with greater mortality.5,9,18 Our study extends upon this prior research by showing that severe HAA increases the risk for adverse outcomes for all adult inpatients, not only those hospitalized for AMI or among those receiving blood transfusions.
Despite the increased harm associated with severe HAA, it is unclear whether HAA is a preventable hazard of hospitalization, as suggested by others.6,8 Most patients in our cohort who developed severe HAA underwent a major procedure, had a discharge diagnosis for hemorrhage, and/or had a discharge diagnosis for a coagulation or hemorrhagic disorder. Thus, blood loss due to phlebotomy, 1 of the more modifiable etiologies of HAA, was unlikely to have been the primary driver for most patients who developed severe HAA. Since it has been estimated to take 15 days of daily phlebotomy of 53 mL of whole blood in females of average body weight (and 20 days for average weight males) with no bone marrow synthesis for severe anemia to develop, it is even less likely that phlebotomy was the principal etiology given an 8-day median LOS among patients with severe HAA.19,20 However, since the etiology of HAA can be multifactorial, limiting blood loss due to phlebotomy by using smaller volume tubes, blood conservation devices, or reducing unnecessary testing may mitigate the development of severe HAA.21,22 Additionally, since more than three-quarters of patients who developed severe HAA underwent a major procedure, more care and attention to minimizing operative blood loss could lessen the severity of HAA and facilitate better recovery. If minimizing blood loss is not feasible, in the absence of symptoms related to anemia or ongoing blood loss, randomized controlled trials overwhelmingly support a restrictive transfusion strategy using a hemoglobin value threshold of 7 mg/dL, even in the postoperative setting.23-25
The implications of mild to moderate HAA are less clear. The odds ratios for mild and moderate HAA, while not statistically significant, suggest a small increase in harm compared to not developing HAA. Furthermore, the upper boundary of the confidence intervals for mild and moderate HAA cannot exclude a possible 30% and 56% increase in the odds for the 30-day composite outcome, respectively. Thus, a better powered study, including more patients and extending the time interval for ascertaining postdischarge adverse events beyond 30 days, may reveal a harmful association. Lastly, our study assessed only the association of HAA with 30-day readmission and mortality. Examining the association between HAA and other patient-centered outcomes such as fatigue, functional impairment, and prolonged posthospitalization recovery time may uncover other important adverse effects of mild and moderate HAA, both of which occur far more frequently than severe HAA.
Our findings should be interpreted in the context of several limitations. First, although we included a diverse group of patients from a multihospital cohort, generalizability to other settings is uncertain. Second, as this was a retrospective study using EHR data, we had limited information to infer the precise mechanism of HAA for each patient. However, procedure codes and discharge diagnoses enabled us to assess which patients underwent a major procedure or had a hemorrhage or hemorrhagic disorder during the hospitalization. Third, given the relatively few number of patients with severe HAA in our cohort, we were unable to assess if the association of severe HAA differed by suspected etiology. Lastly, because we were unable to ascertain the timing of the hematocrit values within the first 24 hours of admission, we excluded both patients with preexisting anemia on admission and those who developed HAA within the first 24 hours of admission, which is not uncommon.26 Thus, we were unable to assess the effect of acute on chronic anemia arising during hospitalization and HAA that develops within the first 24 hours, both of which may also be harmful.18,27,28
In conclusion, severe HAA occurs in 1.4% of all medical hospitalizations and is associated with increased odds of death or readmission within 30 days. Since most patients with severe HAA had undergone a major procedure or had a discharge diagnosis of hemorrhage or a coagulation or hemorrhagic disorder, it is unclear if severe HAA is potentially preventable through preventing blood loss from phlebotomy or by reducing iatrogenic injury during procedures. Future research should assess the potential preventability of severe HAA, and examine other patient-centered outcomes potentially related to anemia, including fatigue, functional impairment, and trajectory of posthospital recovery.
Acknowledgments
The authors would like to acknowledge Ruben Amarasingham, MD, MBA, President and Chief Executive Officer of the Parkland Center for Clinical Innovation, and Ferdinand Velasco, MD, Chief Health Information Officer at Texas Health Resources, for their assistance in assembling the 6 hospital cohort used in this study. The authors would also like to thank Valy Fontil, MD, MAS, Assistant Professor of Medicine at the University of California San Francisco School of Medicine, and Elizabeth Rogers, MD, MAS, Assistant Professor of Internal Medicine and Pediatrics at the University of Minnesota Medical School, for their constructive feedback on an earlier version of this manuscript.
Disclosures
This work was supported by the Agency for Healthcare Research and Quality-funded UT Southwestern Center for Patient-Centered Outcomes Research (R24 HS022418-01); the Commonwealth Foundation (#20100323); the UT Southwestern KL2 Scholars Program supported by the National Institutes of Health (KL2 TR001103); the National Center for Advancing Translational Sciences at the National Institute of Health (U54 RFA-TR-12-006); and the National Institute on Aging (K23AG052603). The study sponsors had no role in design and conduct of the study; collection, management, analysis, and interpretation of the data; and preparation, review, or approval of the manuscript. The authors have no financial conflicts of interest to disclose.
Hospital-acquired anemia (HAA) is defined as having a normal hemoglobin value upon admission but developing anemia during the course of hospitalization. The condition is common, with an incidence ranging from approximately 25% when defined by using the hemoglobin value prior to discharge to 74% when using the nadir hemoglobin value during hospitalization.1-5 While there are many potential etiologies for HAA, given that iatrogenic blood loss from phlebotomy may lead to its development,6,7 HAA has been postulated to be a hazard of hospitalization that is potentially preventable.8 However, it is unclear whether the development of HAA portends worse outcomes after hospital discharge.
The limited number of studies on the association between HAA and postdischarge outcomes has been restricted to patients hospitalized for acute myocardial infarction (AMI).3,9,10 Among this subpopulation, HAA is independently associated with greater morbidity and mortality following hospital discharge.3,9,10 In a more broadly representative population of hospitalized adults, Koch et al.2 found that the development of HAA is associated with greater length of stay (LOS), hospital charges, and inpatient mortality. However, given that HAA was defined by the lowest hemoglobin level during hospitalization (and not necessarily the last value prior to discharge), it is unclear if the worse outcomes observed were the cause of the HAA, rather than its effect, since hospital LOS is a robust predictor for the development of HAA, as well as a major driver of hospital costs and a prognostic marker for inpatient mortality.3,9 Furthermore, this study evaluated outcomes only during the index hospitalization, so it is unclear if patients who develop HAA have worse clinical outcomes after discharge.
Therefore, in this study, we used clinically granular electronic health record (EHR) data from a diverse cohort of consecutive medicine inpatients hospitalized for any reason at 1 of 6 hospitals to: 1) describe the epidemiology of HAA; 2) identify predictors of its development; and 3) examine its association with 30-day postdischarge adverse outcomes. We hypothesized that the development of HAA would be independently associated with 30-day readmission and mortality in a dose-dependent fashion, with increasing severity of HAA associated with worse outcomes.
METHODS
Study Design, Population, and Data Sources
We conducted a retrospective observational cohort study using EHR data collected from November 1, 2009 to October 30, 2010 from 6 hospitals in the north Texas region. One site was a university-affiliated safety-net hospital; the remaining 5 community hospitals were a mix of teaching and nonteaching sites. All hospitals used the Epic EHR system (Epic Systems Corporation, Verona, Wisconsin). Details of this cohort have been published.11,12This study included consecutive hospitalizations among adults age 18 years or older who were discharged from a medicine inpatient service with any diagnosis. We excluded hospitalizations by individuals who were anemic within the first 24 hours of admission (hematocrit less than 36% for women and less than 40% for men), were missing a hematocrit value within the first 24 hours of hospitalization or a repeat hematocrit value prior to discharge, had a hospitalization in the preceding 30 days (ie, index hospitalization was considered a readmission), died in the hospital, were transferred to another hospital, or left against medical advice. For individuals with multiple eligible hospitalizations during the study period, we included only the first hospitalization. We also excluded those discharged to hospice, given that this population of individuals may have intentionally desired less aggressive care.
Definition of Hospital-Acquired Anemia
HAA was defined as having a normal hematocrit value (36% or greater for women and 40% or greater for men) within the first 24 hours of admission and a hematocrit value at the time of hospital discharge lower than the World Health Organization’s sex-specific cut points.13 If there was more than 1 hematocrit value on the same day, we chose the lowest value. Based on prior studies, HAA was further categorized by severity as mild (hematocrit greater than 33% and less than 36% in women; and greater than 33% and less than 40% in men), moderate (hematocrit greater than 27% and 33% or less for all), or severe (hematocrit 27% or less for all).2,14
Characteristics
We extracted information on sociodemographic characteristics, comorbidities, LOS, procedures, blood transfusions, and laboratory values from the EHR. Hospitalizations in the 12 months preceding the index hospitalization were ascertained from the EHR and from an all-payer regional hospitalization database that captures hospitalizations from 75 acute care hospitals within a 100-mile radius of Dallas-Fort Worth. International Classification of Diseases, Ninth Revision, Clinical Modification (ICD-9-CM) discharge diagnosis codes were categorized according to the Agency for Healthcare Research and Quality (AHRQ) Clinical Classifications Software (CCS).15 We defined a diagnosis for hemorrhage and coagulation, and hemorrhagic disorder as the presence of any ICD-9-CM code (primary or secondary) that mapped to the AHRQ CCS diagnoses 60 and 153, and 62, respectively. Procedures were categorized as minor diagnostic, minor therapeutic, major diagnostic, and major therapeutic using the AHRQ Healthcare Cost and Utilization Procedure Classes tool.16
Outcomes
The primary outcome was a composite of death or readmission within 30 days of hospital discharge. Hospital readmissions were ascertained at the index hospital and at any of 75 acute care hospitals in the region as described earlier. Death was ascertained from each of the hospitals’ EHR and administrative data and the Social Security Death Index. Individuals who had both outcomes (eg, a 30-day readmission and death) were considered to have only 1 occurrence of the composite primary outcome measure. Our secondary outcomes were death and readmission within 30 days of discharge, considered as separate outcomes.
Statistical Analysis
We used logistic regression models to evaluate predictors of HAA and to estimate the association of HAA on subsequent 30-day adverse outcomes after hospital discharge. All models accounted for clustering of patients by hospital. For the outcomes analyses, models were adjusted for potential confounders based on prior literature and our group’s expertise, which included age, sex, race/ethnicity, Charlson comorbidity index, prior hospitalizations, nonelective admission status, creatinine level on admission, blood urea nitrogen (BUN) to creatinine ratio of more than 20:1 on admission, LOS, receipt of a major diagnostic or therapeutic procedure during the index hospitalization, a discharge diagnosis for hemorrhage, and a discharge diagnosis for a coagulation or hemorrhagic disorder. For the mortality analyses, given the limited number of 30-day deaths after hospital discharge in our cohort, we collapsed moderate and severe HAA into a single category. In sensitivity analyses, we repeated the adjusted model, but excluded patients in our cohort who had received at least 1 blood transfusion during the index hospitalization (2.6%) given its potential for harm, and patients with a primary discharge diagnosis for AMI (3.1%).17
The functional forms of continuous variables were assessed using restricted cubic splines and locally weighted scatterplot smoothing techniques. All analyses were performed using STATA statistical software version 12.0 (StataCorp, College Station, Texas). The University of Texas Southwestern Medical Center institutional review board approved this study.
Figure
RESULTS
Of 53,995 consecutive medicine hospitalizations among adults age 18 years or older during our study period, 11,309 index hospitalizations were included in our study cohort (Supplemental Figure 1). The majority of patients excluded were because of having documented anemia within the first 24 hours of admission (n=24,950). With increasing severity of HAA, patients were older, more likely to be female, non-Hispanic white, electively admitted, have fewer comorbidities, less likely to be hospitalized in the past year, more likely to have had a major procedure, receive a blood transfusion, have a longer LOS, and have a primary or secondary discharge diagnosis for a hemorrhage or a coagulation or hemorrhagic disorder (Table 1).
Table 1
Epidemiology of HAA
Among this cohort of patients without anemia on admission, the median hematocrit value on admission was 40.6 g/dL and on discharge was 38.9 g/dL. One-third of patients with normal hematocrit value at admission developed HAA, with 21.6% developing mild HAA, 10.1% developing moderate HAA, and 1.4% developing severe HAA. The median discharge hematocrit value was 36 g/dL (interquartile range [IQR]), 35-38 g/dL) for the group of patients who developed mild HAA, 31 g/dL (IQR, 30-32 g/dL) for moderate HAA, and 26 g/dL (IQR, 25-27 g/dL) for severe HAA (Supplemental Figure 2). Among the severe HAA group, 135 of the 159 patients (85%) had a major procedure (n=123, accounting for 219 unique major procedures), a diagnosis for hemorrhage (n=30), and/or a diagnosis for a coagulation or hemorrhagic disorder (n=23) during the index hospitalization. Of the 219 major procedures among patients with severe HAA, most were musculoskeletal (92 procedures), cardiovascular (61 procedures), or digestive system-related (41 procedures). The most common types of procedures were coronary artery bypass graft (36 procedures), hip replacement (25 procedures), knee replacement (17 procedures), and femur fracture reduction (15 procedures). The 10 most common principal discharge diagnoses of the index hospitalization by HAA group are shown in Supplemental Table 1. For the severe HAA group, the most common diagnosis was hip fracture (20.8%).
Predictors of HAA
Compared to no or mild HAA, female sex, elective admission status, serum creatinine on admission, BUN to creatinine ratio greater than 20 to 1, hospital LOS, and undergoing a major diagnostic or therapeutic procedure were predictors for the development of moderate or severe HAA (Table 2). The model explained 23% of the variance (McFadden’s pseudo R2).
Table 2
Incidence of Postdischarge Outcomes by Severity of HAA
The severity of HAA was associated with a dose-dependent increase in the incidence of 30-day adverse outcomes, such that patients with increasing severity of HAA had greater 30-day composite, mortality, and readmission outcomes (P < 0.001; Figure). The 30-day postdischarge composite outcome was primarily driven by hospital readmissions given the low mortality rate in our cohort. Patients who did not develop HAA had an incidence of 9.7% for the composite outcome, whereas patients with severe HAA had an incidence of 16.4%. Among the 24 patients with severe HAA but who had not undergone a major procedure or had a discharge diagnosis for hemorrhage or for a coagulation or hemorrhagic disorder, only 3 (12.5%) had a composite postdischarge adverse outcome (2 readmissions and 1 death). The median time to readmission was similar between groups, but more patients with severe HAA had an early readmission within 7 days of hospital discharge than patients who did not develop HAA (6.9% vs. 2.9%, P = 0.001; Supplemental Table 2).
Association of HAA and Postdischarge Outcomes
In unadjusted analyses, compared to not developing HAA, mild, moderate, and severe HAA were associated with a 29%, 61%, and 81% increase in the odds for a composite outcome, respectively (Table 3). After adjustment for confounders, the effect size for HAA attenuated and was no longer statistically significant for mild and moderate HAA. However, severe HAA was significantly associated with a 39% increase in the odds for the composite outcome and a 41% increase in the odds for 30-day readmission (P = 0.008 and P = 0.02, respectively).
Table 3
In sensitivity analyses, the exclusion of individuals who received at least 1 blood transfusion during the index hospitalization (n=298) and individuals who had a primary discharge diagnosis for AMI (n=353) did not substantively change the estimates of the association between severe HAA and postdischarge outcomes (Supplemental Tables 3 and 4). However, because of the fewer number of adverse events for each analysis, the confidence intervals were wider and the association of severe HAA and the composite outcome and readmission were no longer statistically significant in these subcohorts.
DISCUSSION
In this large and diverse sample of medical inpatients, we found that HAA occurs in one-third of adults with normal hematocrit value at admission, where 10.1% of the cohort developed moderately severe HAA and 1.4% developed severe HAA by the time of discharge. Length of stay and undergoing a major diagnostic or therapeutic procedure were the 2 strongest potentially modifiable predictors of developing moderate or severe HAA. Severe HAA was independently associated with a 39% increase in the odds of being readmitted or dying within 30 days after hospital discharge compared to not developing HAA. However, the associations between mild or moderate HAA with adverse outcomes were attenuated after adjusting for confounders and were no longer statistically significant.
To our knowledge, this is the first study on the postdischarge adverse outcomes of HAA among a diverse cohort of medical inpatients hospitalized for any reason. In a more restricted population, Salisbury et al.3 found that patients hospitalized for AMI who developed moderate to severe HAA (hemoglobin value at discharge of 11 g/dL or less) had greater 1-year mortality than those without HAA (8.4% vs. 2.6%, P < 0.001), and had an 82% increase in the hazard for mortality (95% confidence interval, hazard ratio 1.11-2.98). Others have similarly shown that HAA is common among patients hospitalized with AMI and is associated with greater mortality.5,9,18 Our study extends upon this prior research by showing that severe HAA increases the risk for adverse outcomes for all adult inpatients, not only those hospitalized for AMI or among those receiving blood transfusions.
Despite the increased harm associated with severe HAA, it is unclear whether HAA is a preventable hazard of hospitalization, as suggested by others.6,8 Most patients in our cohort who developed severe HAA underwent a major procedure, had a discharge diagnosis for hemorrhage, and/or had a discharge diagnosis for a coagulation or hemorrhagic disorder. Thus, blood loss due to phlebotomy, 1 of the more modifiable etiologies of HAA, was unlikely to have been the primary driver for most patients who developed severe HAA. Since it has been estimated to take 15 days of daily phlebotomy of 53 mL of whole blood in females of average body weight (and 20 days for average weight males) with no bone marrow synthesis for severe anemia to develop, it is even less likely that phlebotomy was the principal etiology given an 8-day median LOS among patients with severe HAA.19,20 However, since the etiology of HAA can be multifactorial, limiting blood loss due to phlebotomy by using smaller volume tubes, blood conservation devices, or reducing unnecessary testing may mitigate the development of severe HAA.21,22 Additionally, since more than three-quarters of patients who developed severe HAA underwent a major procedure, more care and attention to minimizing operative blood loss could lessen the severity of HAA and facilitate better recovery. If minimizing blood loss is not feasible, in the absence of symptoms related to anemia or ongoing blood loss, randomized controlled trials overwhelmingly support a restrictive transfusion strategy using a hemoglobin value threshold of 7 mg/dL, even in the postoperative setting.23-25
The implications of mild to moderate HAA are less clear. The odds ratios for mild and moderate HAA, while not statistically significant, suggest a small increase in harm compared to not developing HAA. Furthermore, the upper boundary of the confidence intervals for mild and moderate HAA cannot exclude a possible 30% and 56% increase in the odds for the 30-day composite outcome, respectively. Thus, a better powered study, including more patients and extending the time interval for ascertaining postdischarge adverse events beyond 30 days, may reveal a harmful association. Lastly, our study assessed only the association of HAA with 30-day readmission and mortality. Examining the association between HAA and other patient-centered outcomes such as fatigue, functional impairment, and prolonged posthospitalization recovery time may uncover other important adverse effects of mild and moderate HAA, both of which occur far more frequently than severe HAA.
Our findings should be interpreted in the context of several limitations. First, although we included a diverse group of patients from a multihospital cohort, generalizability to other settings is uncertain. Second, as this was a retrospective study using EHR data, we had limited information to infer the precise mechanism of HAA for each patient. However, procedure codes and discharge diagnoses enabled us to assess which patients underwent a major procedure or had a hemorrhage or hemorrhagic disorder during the hospitalization. Third, given the relatively few number of patients with severe HAA in our cohort, we were unable to assess if the association of severe HAA differed by suspected etiology. Lastly, because we were unable to ascertain the timing of the hematocrit values within the first 24 hours of admission, we excluded both patients with preexisting anemia on admission and those who developed HAA within the first 24 hours of admission, which is not uncommon.26 Thus, we were unable to assess the effect of acute on chronic anemia arising during hospitalization and HAA that develops within the first 24 hours, both of which may also be harmful.18,27,28
In conclusion, severe HAA occurs in 1.4% of all medical hospitalizations and is associated with increased odds of death or readmission within 30 days. Since most patients with severe HAA had undergone a major procedure or had a discharge diagnosis of hemorrhage or a coagulation or hemorrhagic disorder, it is unclear if severe HAA is potentially preventable through preventing blood loss from phlebotomy or by reducing iatrogenic injury during procedures. Future research should assess the potential preventability of severe HAA, and examine other patient-centered outcomes potentially related to anemia, including fatigue, functional impairment, and trajectory of posthospital recovery.
Acknowledgments
The authors would like to acknowledge Ruben Amarasingham, MD, MBA, President and Chief Executive Officer of the Parkland Center for Clinical Innovation, and Ferdinand Velasco, MD, Chief Health Information Officer at Texas Health Resources, for their assistance in assembling the 6 hospital cohort used in this study. The authors would also like to thank Valy Fontil, MD, MAS, Assistant Professor of Medicine at the University of California San Francisco School of Medicine, and Elizabeth Rogers, MD, MAS, Assistant Professor of Internal Medicine and Pediatrics at the University of Minnesota Medical School, for their constructive feedback on an earlier version of this manuscript.
Disclosures
This work was supported by the Agency for Healthcare Research and Quality-funded UT Southwestern Center for Patient-Centered Outcomes Research (R24 HS022418-01); the Commonwealth Foundation (#20100323); the UT Southwestern KL2 Scholars Program supported by the National Institutes of Health (KL2 TR001103); the National Center for Advancing Translational Sciences at the National Institute of Health (U54 RFA-TR-12-006); and the National Institute on Aging (K23AG052603). The study sponsors had no role in design and conduct of the study; collection, management, analysis, and interpretation of the data; and preparation, review, or approval of the manuscript. The authors have no financial conflicts of interest to disclose.
References
1. Kurniali PC, Curry S, Brennan KW, et al. A retrospective study investigating the incidence and predisposing factors of hospital-acquired anemia. Anemia. 2014;2014:634582. PubMed 2. Koch CG, Li L, Sun Z, et al. Hospital-acquired anemia: prevalence, outcomes, and healthcare implications. J Hosp Med. 2013;8(9):506-512. PubMed 3. Salisbury AC, Alexander KP, Reid KJ, et al. Incidence, correlates, and outcomes of acute, hospital-acquired anemia in patients with acute myocardial infarction. Circ Cardiovasc Qual Outcomes. 2010;3(4):337-346. PubMed 4. Salisbury AC, Amin AP, Reid KJ, et al. Hospital-acquired anemia and in-hospital mortality in patients with acute myocardial infarction. Am Heart J. 2011;162(2):300-309 e303. PubMed 5. Meroño O, Cladellas M, Recasens L, et al. In-hospital acquired anemia in acute coronary syndrome. Predictors, in-hospital prognosis and one-year mortality. Rev Esp Cardiol (Engl Ed). 2012;65(8):742-748. PubMed 6. Salisbury AC, Reid KJ, Alexander KP, et al. Diagnostic blood loss from phlebotomy and hospital-acquired anemia during acute myocardial infarction. Arch Intern Med. 2011;171(18):1646-1653. PubMed 7. Thavendiranathan P, Bagai A, Ebidia A, Detsky AS, Choudhry NK. Do blood tests cause anemia in hospitalized patients? The effect of diagnostic phlebotomy on hemoglobin and hematocrit levels. J Gen Intern Med. 2005;20(6):520-524. PubMed 8. Rennke S, Fang MC. Hazards of hospitalization: more than just “never events”. Arch Intern Med. 2011;171(18):1653-1654. PubMed 9. Choi JS, Kim YA, Kang YU, et al. Clinical impact of hospital-acquired anemia in association with acute kidney injury and chronic kidney disease in patients with acute myocardial infarction. PLoS One. 2013;8(9):e75583. PubMed 10. Salisbury AC, Kosiborod M, Amin AP, et al. Recovery from hospital-acquired anemia after acute myocardial infarction and effect on outcomes. Am J Cardiol. 2011;108(7):949-954. PubMed 11. Nguyen OK, Makam AN, Clark C, et al. Predicting all-cause readmissions using electronic health record data from the entire hospitalization: Model development and comparison. J Hosp Med. 2016;11(7):473-480. PubMed 12. Amarasingham R, Velasco F, Xie B, et al. Electronic medical record-based multicondition models to predict the risk of 30 day readmission or death among adult medicine patients: validation and comparison to existing models. BMC Med Inform Decis Mak. 2015;15:39. PubMed 13. World Health Organization. Hemoglobin concentrations for the diagnosis of anaemia and assessment of severity. http://www.who.int/vmnis/indicators/haemoglobin.pdf. Accessed March 15, 2016. 14. Martin ND, Scantling D. Hospital-acquired anemia: a contemporary review of etiologies and prevention strategies. J Infus Nurs. 2015;38(5):330-338. PubMed 15. Agency for Healthcare Research and Quality, Rockville, MD. Clinical classification software (CCS) for ICD-9-CM. Healthcare Cost and Utilization Project. 2015 http://www.hcup-us.ahrq.gov/toolssoftware/ccs/ccs.jsp. Accessed November 18, 2015. 16. Agency for Healthcare Research and Quality, Rockville, MD. Procedure classes2015. Healthcare Cost and Utilization Project. 2015. https://www.hcup-us.ahrq.gov/toolssoftware/procedure/procedure.jsp. Accessed November 18, 2015. 17. Corwin HL, Gettinger A, Pearl RG, et al. The CRIT Study: Anemia and blood transfusion in the critically ill--current clinical practice in the United States. Crit Care Med. 2004;32(1):39-52. PubMed 18. Aronson D, Suleiman M, Agmon Y, et al. Changes in haemoglobin levels during hospital course and long-term outcome after acute myocardial infarction. Eur Heart J. 2007;28(11):1289-1296. PubMed 19. Lyon AW, Chin AC, Slotsve GA, Lyon ME. Simulation of repetitive diagnostic blood loss and onset of iatrogenic anemia in critical care patients with a mathematical model. Comput Biol Med. 2013;43(2):84-90. PubMed 20. van der Bom JG, Cannegieter SC. Hospital-acquired anemia: the contribution of diagnostic blood loss. J Thromb Haemost. 2015;13(6):1157-1159. PubMed 21. Sanchez-Giron F, Alvarez-Mora F. Reduction of blood loss from laboratory testing in hospitalized adult patients using small-volume (pediatric) tubes. Arch Pathol Lab Med. 2008;132(12):1916-1919. PubMed 22. Smoller BR, Kruskall MS. Phlebotomy for diagnostic laboratory tests in adults. Pattern of use and effect on transfusion requirements. N Engl J Med. 1986;314(19):1233-1235. PubMed 23. Carson JL, Carless PA, Hebert PC. Transfusion thresholds and other strategies for guiding allogeneic red blood cell transfusion. Cochrane Database Syst Rev. 2012(4):CD002042. PubMed 24. Carson JL, Carless PA, Hébert PC. Outcomes using lower vs higher hemoglobin thresholds for red blood cell transfusion. JAMA. 2013;309(1):83-84. PubMed 25. Carson JL, Sieber F, Cook DR, et al. Liberal versus restrictive blood transfusion strategy: 3-year survival and cause of death results from the FOCUS randomised controlled trial. Lancet. 2015;385(9974):1183-1189. PubMed 26. Rajkomar A, McCulloch CE, Fang MC. Low diagnostic utility of rechecking hemoglobins within 24 hours in hospitalized patients. Am J Med. 2016;129(11):1194-1197. PubMed 27. Reade MC, Weissfeld L, Angus DC, Kellum JA, Milbrandt EB. The prevalence of anemia and its association with 90-day mortality in hospitalized community-acquired pneumonia. BMC Pulm Med. 2010;10:15. PubMed 28. Halm EA, Wang JJ, Boockvar K, et al. The effect of perioperative anemia on clinical and functional outcomes in patients with hip fracture. J Orthop Trauma. 2004;18(6):369-374. PubMed
References
1. Kurniali PC, Curry S, Brennan KW, et al. A retrospective study investigating the incidence and predisposing factors of hospital-acquired anemia. Anemia. 2014;2014:634582. PubMed 2. Koch CG, Li L, Sun Z, et al. Hospital-acquired anemia: prevalence, outcomes, and healthcare implications. J Hosp Med. 2013;8(9):506-512. PubMed 3. Salisbury AC, Alexander KP, Reid KJ, et al. Incidence, correlates, and outcomes of acute, hospital-acquired anemia in patients with acute myocardial infarction. Circ Cardiovasc Qual Outcomes. 2010;3(4):337-346. PubMed 4. Salisbury AC, Amin AP, Reid KJ, et al. Hospital-acquired anemia and in-hospital mortality in patients with acute myocardial infarction. Am Heart J. 2011;162(2):300-309 e303. PubMed 5. Meroño O, Cladellas M, Recasens L, et al. In-hospital acquired anemia in acute coronary syndrome. Predictors, in-hospital prognosis and one-year mortality. Rev Esp Cardiol (Engl Ed). 2012;65(8):742-748. PubMed 6. Salisbury AC, Reid KJ, Alexander KP, et al. Diagnostic blood loss from phlebotomy and hospital-acquired anemia during acute myocardial infarction. Arch Intern Med. 2011;171(18):1646-1653. PubMed 7. Thavendiranathan P, Bagai A, Ebidia A, Detsky AS, Choudhry NK. Do blood tests cause anemia in hospitalized patients? The effect of diagnostic phlebotomy on hemoglobin and hematocrit levels. J Gen Intern Med. 2005;20(6):520-524. PubMed 8. Rennke S, Fang MC. Hazards of hospitalization: more than just “never events”. Arch Intern Med. 2011;171(18):1653-1654. PubMed 9. Choi JS, Kim YA, Kang YU, et al. Clinical impact of hospital-acquired anemia in association with acute kidney injury and chronic kidney disease in patients with acute myocardial infarction. PLoS One. 2013;8(9):e75583. PubMed 10. Salisbury AC, Kosiborod M, Amin AP, et al. Recovery from hospital-acquired anemia after acute myocardial infarction and effect on outcomes. Am J Cardiol. 2011;108(7):949-954. PubMed 11. Nguyen OK, Makam AN, Clark C, et al. Predicting all-cause readmissions using electronic health record data from the entire hospitalization: Model development and comparison. J Hosp Med. 2016;11(7):473-480. PubMed 12. Amarasingham R, Velasco F, Xie B, et al. Electronic medical record-based multicondition models to predict the risk of 30 day readmission or death among adult medicine patients: validation and comparison to existing models. BMC Med Inform Decis Mak. 2015;15:39. PubMed 13. World Health Organization. Hemoglobin concentrations for the diagnosis of anaemia and assessment of severity. http://www.who.int/vmnis/indicators/haemoglobin.pdf. Accessed March 15, 2016. 14. Martin ND, Scantling D. Hospital-acquired anemia: a contemporary review of etiologies and prevention strategies. J Infus Nurs. 2015;38(5):330-338. PubMed 15. Agency for Healthcare Research and Quality, Rockville, MD. Clinical classification software (CCS) for ICD-9-CM. Healthcare Cost and Utilization Project. 2015 http://www.hcup-us.ahrq.gov/toolssoftware/ccs/ccs.jsp. Accessed November 18, 2015. 16. Agency for Healthcare Research and Quality, Rockville, MD. Procedure classes2015. Healthcare Cost and Utilization Project. 2015. https://www.hcup-us.ahrq.gov/toolssoftware/procedure/procedure.jsp. Accessed November 18, 2015. 17. Corwin HL, Gettinger A, Pearl RG, et al. The CRIT Study: Anemia and blood transfusion in the critically ill--current clinical practice in the United States. Crit Care Med. 2004;32(1):39-52. PubMed 18. Aronson D, Suleiman M, Agmon Y, et al. Changes in haemoglobin levels during hospital course and long-term outcome after acute myocardial infarction. Eur Heart J. 2007;28(11):1289-1296. PubMed 19. Lyon AW, Chin AC, Slotsve GA, Lyon ME. Simulation of repetitive diagnostic blood loss and onset of iatrogenic anemia in critical care patients with a mathematical model. Comput Biol Med. 2013;43(2):84-90. PubMed 20. van der Bom JG, Cannegieter SC. Hospital-acquired anemia: the contribution of diagnostic blood loss. J Thromb Haemost. 2015;13(6):1157-1159. PubMed 21. Sanchez-Giron F, Alvarez-Mora F. Reduction of blood loss from laboratory testing in hospitalized adult patients using small-volume (pediatric) tubes. Arch Pathol Lab Med. 2008;132(12):1916-1919. PubMed 22. Smoller BR, Kruskall MS. Phlebotomy for diagnostic laboratory tests in adults. Pattern of use and effect on transfusion requirements. N Engl J Med. 1986;314(19):1233-1235. PubMed 23. Carson JL, Carless PA, Hebert PC. Transfusion thresholds and other strategies for guiding allogeneic red blood cell transfusion. Cochrane Database Syst Rev. 2012(4):CD002042. PubMed 24. Carson JL, Carless PA, Hébert PC. Outcomes using lower vs higher hemoglobin thresholds for red blood cell transfusion. JAMA. 2013;309(1):83-84. PubMed 25. Carson JL, Sieber F, Cook DR, et al. Liberal versus restrictive blood transfusion strategy: 3-year survival and cause of death results from the FOCUS randomised controlled trial. Lancet. 2015;385(9974):1183-1189. PubMed 26. Rajkomar A, McCulloch CE, Fang MC. Low diagnostic utility of rechecking hemoglobins within 24 hours in hospitalized patients. Am J Med. 2016;129(11):1194-1197. PubMed 27. Reade MC, Weissfeld L, Angus DC, Kellum JA, Milbrandt EB. The prevalence of anemia and its association with 90-day mortality in hospitalized community-acquired pneumonia. BMC Pulm Med. 2010;10:15. PubMed 28. Halm EA, Wang JJ, Boockvar K, et al. The effect of perioperative anemia on clinical and functional outcomes in patients with hip fracture. J Orthop Trauma. 2004;18(6):369-374. PubMed