User login
Is the Rx to blame for the patient’s weight gain?
One of my brothers has adult onset bipolar disorder. As luck would have it, he also has type 2 diabetes mellitus. He struggles constantly with blood sugar control since he needs to take 2 psychotropic medications, both of which cause weight gain.
His situation has prompted me to think about the responsibility we have as we care, and advocate, for our patients with major mental illness who require these effective medications. At a minimum, we must be knowledgeable about the adverse metabolic effects of these drugs, avoid prescribing them when possible, and advocate for dose reductions when feasible. Knowing, for example, that these drugs fall on a spectrum, with haloperidol causing the least weight gain and olanzapine causing the most, is important.1
An eye-opener. The article by Saunders in this issue provides advice on avoiding medications that commonly cause weight gain when prescribing for overweight or obese patients with diabetes, hypertension, and/or depression. I was unaware that some of the drugs on the list contribute to the problem. For example, I saw a new patient last week who has hypertension and is obese; she has been taking the beta-blocker metoprolol for the past 8 years. She has tried unsuccessfully to lose weight. She asked me if the metoprolol could be interfering with weight loss, and I mistakenly told her “No.” Thankfully, we decided to discontinue it anyway. I will admit to her my knowledge gap when I see her next month for follow-up. Errors are great teachers, especially when no harm is done.
The scope of the Saunders article is not meant to be comprehensive, since it focuses on medications for diabetes, hypertension, and depression. I think all of us are aware of the weight gain associated with other commonly prescribed drugs, such as systemic corticosteroids and long-acting progesterone for contraception. Thankfully, combination oral contraceptives do not appear to be associated with weight gain2—answering one of the more common questions I receive from patients about weight and medications.
The bottom line. Avoid prescribing medications that can cause weight gain in overweight and obese patients when possible, use the lowest effective dose when such agents are necessary, and warn patients of this adverse effect so that they can take precautions, such as walking an extra mile a day or giving up that high-calorie latte in the morning.
1. Leucht S, Cipriani A, Spineli L, et al. Comparative efficacy and tolerability of 15 antipsychotic drugs in schizophrenia: a multiple-treatments meta-analysis. Lancet. 2013;382:951-962.
2. Gallo MF, Lopez LM, Grimes DA, et al. Combination contraceptives: effects on weight. Cochrane Database Syst Rev. 2011;CD003987.
John Hickner, MD, MSc
Editor-in-Chief

John Hickner, MD, MSc
Editor-in-Chief
John Hickner, MD, MSc
Editor-in-Chief
One of my brothers has adult onset bipolar disorder. As luck would have it, he also has type 2 diabetes mellitus. He struggles constantly with blood sugar control since he needs to take 2 psychotropic medications, both of which cause weight gain.
His situation has prompted me to think about the responsibility we have as we care, and advocate, for our patients with major mental illness who require these effective medications. At a minimum, we must be knowledgeable about the adverse metabolic effects of these drugs, avoid prescribing them when possible, and advocate for dose reductions when feasible. Knowing, for example, that these drugs fall on a spectrum, with haloperidol causing the least weight gain and olanzapine causing the most, is important.1
An eye-opener. The article by Saunders in this issue provides advice on avoiding medications that commonly cause weight gain when prescribing for overweight or obese patients with diabetes, hypertension, and/or depression. I was unaware that some of the drugs on the list contribute to the problem. For example, I saw a new patient last week who has hypertension and is obese; she has been taking the beta-blocker metoprolol for the past 8 years. She has tried unsuccessfully to lose weight. She asked me if the metoprolol could be interfering with weight loss, and I mistakenly told her “No.” Thankfully, we decided to discontinue it anyway. I will admit to her my knowledge gap when I see her next month for follow-up. Errors are great teachers, especially when no harm is done.
The scope of the Saunders article is not meant to be comprehensive, since it focuses on medications for diabetes, hypertension, and depression. I think all of us are aware of the weight gain associated with other commonly prescribed drugs, such as systemic corticosteroids and long-acting progesterone for contraception. Thankfully, combination oral contraceptives do not appear to be associated with weight gain2—answering one of the more common questions I receive from patients about weight and medications.
The bottom line. Avoid prescribing medications that can cause weight gain in overweight and obese patients when possible, use the lowest effective dose when such agents are necessary, and warn patients of this adverse effect so that they can take precautions, such as walking an extra mile a day or giving up that high-calorie latte in the morning.
1. Leucht S, Cipriani A, Spineli L, et al. Comparative efficacy and tolerability of 15 antipsychotic drugs in schizophrenia: a multiple-treatments meta-analysis. Lancet. 2013;382:951-962.
2. Gallo MF, Lopez LM, Grimes DA, et al. Combination contraceptives: effects on weight. Cochrane Database Syst Rev. 2011;CD003987.
Fibromyalgia management: A multimodal approach
![]()
Wendy L. Wright, MS, APRN, FNP, FAANP, FAAN
Adult/Family Nurse Practitioner
Owner, Wright & Associates Family Healthcare
Amherst, NH
![]()
Wendy L. Wright, MS, APRN, FNP, FAANP, FAAN
Adult/Family Nurse Practitioner
Owner, Wright & Associates Family Healthcare
Amherst, NH
![]()
Wendy L. Wright, MS, APRN, FNP, FAANP, FAAN
Adult/Family Nurse Practitioner
Owner, Wright & Associates Family Healthcare
Amherst, NH
VIDEO: Duodenal bulb sampling barely increased celiac yield in low-probability cohort
Separate sampling of the duodenal bulb increased detection of celiac disease by only 0.1% when endoscopy patients had a low pretest probability of celiac disease, according to research published in the November issue of Clinical Gastroenterology and Hepatology.
Duodenal bulb histology did reveal other abnormal findings, such as chronic peptic duodenitis, gastric heterotopia, and Brunner gland hyperplasia, wrote Samantha Stoven, MD, of Mayo Clinic, Rochester, Minn., and her associates. These findings did not seem to impede the identification of celiac disease, but their clinical implications were unclear, the researchers noted.

Most studies of the diagnostic yield of duodenal bulb specimens have been performed in patients with known celiac disease or positive serology. In past studies of these high-probability cohorts, duodenal bulb sampling increased the diagnostic yield of celiac disease anywhere from 1.8% to 18%, but whether and how that finding translates to low-probability cohorts is unclear, the researchers said. Therefore, they retrospectively analyzed data from 679 endoscopy patients who had both duodenal bulb and small bowel biopsies collected at three Mayo Clinic sites in 2011. These sites are “open access,” meaning that patients can be referred for endoscopy without the approval of a gastroenterologist.
The average age of the patients was 50 years, and 63% were female. They were most commonly referred for duodenal biopsy because of chronic dyspepsia (46% of patients), diarrhea (35%), or nausea (17%). Patients with either known celiac disease or positive serology were excluded from the study (Clin Gastroenterol Hepatol. 2016 Mar 7. doi: 10.1016/j.cgh.2016.02.026). A total of 265 patients (39%) had abnormal duodenal histology, which was most often diagnosed as chronic peptic duodenitis, the researchers said. Histologic abnormalities usually involved the duodenal bulb (36% of cases), not the distal duodenum (15%; P less than .0001). However, among the 16 patients (2%) found to have celiac disease, just one patient had disease only in the duodenal bulb. Thus, duodenal bulb sampling increased the diagnostic yield of celiac disease by only 0.1% when considering the overall cohort. The patient with celiac disease limited to the bulb was a 46-year-old female presenting with diarrhea and anemia who had normal serologies but a permissive human leukocyte antigen test. Her duodenal bulb had villous atrophy and more than 25 intraepithelial lymphocytes per 100 epithelial cells, while her distal duodenum was normal.
Among the 85% of patients who had normal distal duodenums, 28% had abnormal bulb histology, most often chronic peptic duodenitis, active chronic peptic duodenitis, or gastric heterotopia, the researchers said. Among the 59% of patients whose celiac serology before endoscopy was truly unknown, only two (0.5%) had histologic changes consistent with celiac disease, which in both cases were located in the distal duodenum.
SOURCE: American Gastroenterological Association
“Individual sampling of the duodenal bulb in patients with either negative or unknown celiac serologic status can be considered in practices where expert gastrointestinal pathologists are present and there is agreement that both samples can be submitted in the same bottle, or there is not a separate charge for the additional container. Further studies may be needed to assess the diagnostic yield of separate bulb biopsies for celiac detection in all comers.”
An American College of Gastroenterology Junior Faculty Development Award helped support the work. Senior author Joseph A. Murray, MD, disclosed ties to Alba Therapeutics, Alvine Pharmaceuticals, AMAG Pharmaceuticals, and several other corporate entities. The remaining authors had no disclosures.
Histologic diagnosis of celiac disease has traditionally relied upon endoscopic biopsies from the second and third portions of the duodenum. However, several recent studies indicate that duodenal bulb biopsies may show changes of celiac disease, despite normal histology in the more distal duodenum.
In their study, Dr. Stoven and her colleagues evaluated the diagnostic utility of endoscopic duodenal bulb biopsy in patients with a low probability for celiac disease. A new diagnosis of celiac disease was made in 16 of their 679 patients (2.4%). Only one patient showed villous atrophy of the duodenal bulb with normal histology of the more distal duodenum. Although a diagnosis of celiac disease was made, the case was atypical not only because distal duodenal biopsies were normal but also because multiple celiac serology tests were negative, raising the possibility of nonceliac villous atrophy. Thus, the added diagnostic yield of duodenal bulb biopsies in this low-risk population was extremely low (0.15% at most).

Ciaran P. Kelly, MD, AGAF, professor of medicine, Harvard Medical School, director Celiac Center, Beth Israel Deaconess Medical Center, Boston, has acted as a scientific adviser to companies including Celimmune, Cour Pharmaceuticals, ImmunogenX, and Takeda; he also acts as principal investigator on a research grant on celiac disease supported by Aptalis.
Histologic diagnosis of celiac disease has traditionally relied upon endoscopic biopsies from the second and third portions of the duodenum. However, several recent studies indicate that duodenal bulb biopsies may show changes of celiac disease, despite normal histology in the more distal duodenum.
In their study, Dr. Stoven and her colleagues evaluated the diagnostic utility of endoscopic duodenal bulb biopsy in patients with a low probability for celiac disease. A new diagnosis of celiac disease was made in 16 of their 679 patients (2.4%). Only one patient showed villous atrophy of the duodenal bulb with normal histology of the more distal duodenum. Although a diagnosis of celiac disease was made, the case was atypical not only because distal duodenal biopsies were normal but also because multiple celiac serology tests were negative, raising the possibility of nonceliac villous atrophy. Thus, the added diagnostic yield of duodenal bulb biopsies in this low-risk population was extremely low (0.15% at most).
Ciaran P. Kelly, MD, AGAF, professor of medicine, Harvard Medical School, director Celiac Center, Beth Israel Deaconess Medical Center, Boston, has acted as a scientific adviser to companies including Celimmune, Cour Pharmaceuticals, ImmunogenX, and Takeda; he also acts as principal investigator on a research grant on celiac disease supported by Aptalis.
Separate sampling of the duodenal bulb increased detection of celiac disease by only 0.1% when endoscopy patients had a low pretest probability of celiac disease, according to research published in the November issue of Clinical Gastroenterology and Hepatology.
Duodenal bulb histology did reveal other abnormal findings, such as chronic peptic duodenitis, gastric heterotopia, and Brunner gland hyperplasia, wrote Samantha Stoven, MD, of Mayo Clinic, Rochester, Minn., and her associates. These findings did not seem to impede the identification of celiac disease, but their clinical implications were unclear, the researchers noted.
Most studies of the diagnostic yield of duodenal bulb specimens have been performed in patients with known celiac disease or positive serology. In past studies of these high-probability cohorts, duodenal bulb sampling increased the diagnostic yield of celiac disease anywhere from 1.8% to 18%, but whether and how that finding translates to low-probability cohorts is unclear, the researchers said. Therefore, they retrospectively analyzed data from 679 endoscopy patients who had both duodenal bulb and small bowel biopsies collected at three Mayo Clinic sites in 2011. These sites are “open access,” meaning that patients can be referred for endoscopy without the approval of a gastroenterologist.
The average age of the patients was 50 years, and 63% were female. They were most commonly referred for duodenal biopsy because of chronic dyspepsia (46% of patients), diarrhea (35%), or nausea (17%). Patients with either known celiac disease or positive serology were excluded from the study (Clin Gastroenterol Hepatol. 2016 Mar 7. doi: 10.1016/j.cgh.2016.02.026). A total of 265 patients (39%) had abnormal duodenal histology, which was most often diagnosed as chronic peptic duodenitis, the researchers said. Histologic abnormalities usually involved the duodenal bulb (36% of cases), not the distal duodenum (15%; P less than .0001). However, among the 16 patients (2%) found to have celiac disease, just one patient had disease only in the duodenal bulb. Thus, duodenal bulb sampling increased the diagnostic yield of celiac disease by only 0.1% when considering the overall cohort. The patient with celiac disease limited to the bulb was a 46-year-old female presenting with diarrhea and anemia who had normal serologies but a permissive human leukocyte antigen test. Her duodenal bulb had villous atrophy and more than 25 intraepithelial lymphocytes per 100 epithelial cells, while her distal duodenum was normal.
Among the 85% of patients who had normal distal duodenums, 28% had abnormal bulb histology, most often chronic peptic duodenitis, active chronic peptic duodenitis, or gastric heterotopia, the researchers said. Among the 59% of patients whose celiac serology before endoscopy was truly unknown, only two (0.5%) had histologic changes consistent with celiac disease, which in both cases were located in the distal duodenum.
SOURCE: American Gastroenterological Association
“Individual sampling of the duodenal bulb in patients with either negative or unknown celiac serologic status can be considered in practices where expert gastrointestinal pathologists are present and there is agreement that both samples can be submitted in the same bottle, or there is not a separate charge for the additional container. Further studies may be needed to assess the diagnostic yield of separate bulb biopsies for celiac detection in all comers.”
An American College of Gastroenterology Junior Faculty Development Award helped support the work. Senior author Joseph A. Murray, MD, disclosed ties to Alba Therapeutics, Alvine Pharmaceuticals, AMAG Pharmaceuticals, and several other corporate entities. The remaining authors had no disclosures.
FROM CLINICAL GASTROENTEROLOGY AND HEPATOLOGY
Key clinical point: Separate sampling of the duodenal bulb increased detection of celiac disease by only 0.1% when endoscopy patients had a low pretest probability of celiac disease.
Major finding: One (0.1%) patient had celiac disease limited to the duodenal bulb.
Data source: A multicenter retrospective study of 679 patients without celiac disease or positive serology from whom duodenal bulb and small bowel biopsies were collected during endoscopy.
Disclosures: An American College of Gastroenterology Junior Faculty Development Award helped support the work. Senior author Joseph A. Murray, MD, disclosed ties to Alba Therapeutics, Alvine Pharmaceuticals, AMAG Pharmaceuticals, and several other corporate entities. The remaining authors had no disclosures.
Left ventricular thrombosis can still complicate acute myocardial infarction
A 62-year-old man with hypertension, type 2 diabetes mellitus, and hypercholesterolemia presented to the emergency department with substernal chest pain that started about 15 hours earlier while he was at rest watching television.
On examination, his pulse was 92 beats per minute and regular, his blood pressure was 160/88 mm Hg, and he had no evidence of jugular venous distention or pedal edema. Lung examination was positive for bibasilar crackles.
Electrocardiography revealed Q waves with ST elevation in leads I, aVL, V4, V5, and V6 with reciprocal ST depression in leads II, III, and aVF.
His troponin T level on presentation was markedly elevated.

He underwent heart catheterization and was found to have 100% occlusion of the proximal left anterior descending artery. He underwent successful percutaneous coronary intervention with placement of a drug-eluting stent, and afterward had grade 3 flow on the Thrombolysis in Myocardial Infarction (TIMI) scale.
Echocardiography the next day revealed a mobile echo-dense mass in the left ventricular apex (Figure 1) and a left ventricular ejection fraction of 35%.
THE INCIDENCE OF LEFT VENTRICULAR THROMBOSIS IN ACUTE MI
1. What is the incidence of left ventricular thrombosis after acute myocardial infarction (MI), now that primary percutaneous coronary intervention is common?
- 0.1%
- 2%
- 20%
- 40%
Left ventricular thrombosis is a serious complication of acute MI that can cause systemic thromboembolism, including stroke.1 Before thrombolytic therapy was available, this complication occurred in 20% to 60% of patients with acute MI.2,3 But early reperfusion strategies, anticoagulation for the first 48 hours, and dual antiplatelet therapy have reduced the incidence of this complication significantly.
In the thrombolytic era, the incidence of left ventricular thrombosis was 5.1% in the Gruppo Italiano per lo Studio della Sopravvivenza nell’Infarto Miocardico (GISSI) 3 study, which had 8,326 patients. A subset of patients who had an anterior MI had almost double the incidence (11.5%).3

The incidence has further declined with the advent of primary percutaneous coronary intervention, likely thanks to enhanced myocardial salvage, and now ranges from 2.5% to 15% (Table 1).4–11 The largest observational study, with 2,911 patients undergoing percutaneous coronary intervention, reported an incidence of 2.5% within 3 to 5 days of the MI.7 At our center, the incidence was found to be even lower, 1.8% in 1,700 patients presenting with ST-elevation MI undergoing primary percutaneous coronary intervention. Hence, of the answers to the question above, 2% would be closest.
Large infarct size with a low left ventricular ejection fraction (< 40%), anterior wall MI, hypertension, and delay in time from symptom onset to intervention were independent predictors of left ventricular thrombus formation in most studies.7,12 The risk is highest during the first 2 weeks after MI, and thrombosis almost never occurs more than 3 months after the index event.5,13–16
WHAT IS THE PATHOGENESIS OF LEFT VENTRICULAR THROMBOSIS?
A large transmural infarct results in loss of contractile function, which causes stagnation and pooling of blood adjacent to the infarcted ventricular segment. In addition, endocardial injury exposes tissue factor, which then initiates the coagulation cascade. To make matters worse, MI results in a hypercoagulable state through unclear mechanisms, which completes the Virchow triad for thrombus formation. Elevations of D-dimer, fibrinogen, anticardiolipin antibodies (IgM and IgG), and tissue factor have also been reported after acute MI.17
Thrombus formation begins with platelet aggregation at the site of endocardial damage, forming a platelet plug, followed by activation of clotting factors. These thrombi are referred to as “mural,” as they adhere to the chamber wall (endocardium). They are composed of fibrin and entrapped red and white blood cells (Figure 2).
The natural course of thrombus evolution is established but variable. A left ventricular thrombus may dislodge and embolize, resulting in stroke or other thromboembolic complications. Alternately, it can dissolve over time, aided by intrinsic fibrinolytic mechanisms. On other occasions, the thrombus may organize, a process characterized by ingrowth of smooth muscle cells, fibroblasts, and endothelium.
HOW IS LEFT VENTRICULAR THROMBOSIS DIAGNOSED?
2. What is the best imaging test for detecting a thrombus?
- Transesophageal echocardiography
- Transthoracic echocardiography
- Cardiac magnetic resonance imaging (MRI) without gadolinium contrast
- Cardiac MRI with gadolinium contrast
Evaluation of left ventricular function after acute MI carries a class I indication (ie, it should be performed).18
Echocardiography is commonly used, and it has a 60% sensitivity to detect a thrombus.19 In patients with poorer transthoracic echocardiographic windows, contrast can be used to better delineate the left ventricular cavity and show the thrombus. Transesophageal echocardiography is seldom useful, as the left ventricular apex is foreshortened and in the far field.
A left ventricular thrombus is confirmed if an echo-dense mass with well-demarcated margins distinct from the endocardium is seen throughout the cardiac cycle. It should be evident in at least two different views (apical and short-axis) and should be adjacent to a hypokinetic or akinetic left ventricular wall. False-positive findings can occur due to misidentified false tendons, papillary muscles, and trabeculae.
Cardiac MRI with late gadolinium enhancement is now the gold standard for diagnostic imaging, as it accurately characterizes the shape, size, and location of the thrombus (Figure 3). Gadolinium contrast increases the enhancement of the ventricular cavity, thus allowing easy detection of thrombus, which appears dark. Cardiac MRI with delayed enhancement has 88% to 91% sensitivity and 99% specificity to detect left ventricular thrombosis.20,21 However, compared with echocardiography, routine cardiac MRI is time-intensive, costly, and not routinely available. As a result, it should be performed only in patients with poor acoustic windows and a high clinical suspicion of left ventricular thrombosis.
Delayed-contrast cardiac computed tomography can be used to identify left ventricular thrombosis, using absence of contrast uptake. The need to use contrast is a disadvantage, but computed tomography can be an alternative in patients with contraindications to cardiac MRI.
WHAT COMPLICATIONS ARISE FROM LEFT VENTRICULAR THROMBOSIS?
The most feared complication of left ventricular thrombosis is thromboembolism. Cardioembolic stroke is generally severe, prone to early and long-term recurrence, and associated with a higher death rate than noncardioembolic ischemic stroke.22,23 Thrombi associated with thromboembolism are often acute and mobile rather than organized and immobile.24 They may embolize to the brain, spleen, kidneys, and bowel.25 In a meta-analysis of 11 studies, the pooled odds ratio for risk of embolization was 5.45 (95% confidence interval [CI] 3.02–9.83) with left ventricular thrombi vs without.26 Before systemic thrombolysis and antiplatelet therapy became available, stroke rates ranged from 1.5% to 10%.27–29
In a meta-analysis of 22 studies from 1978 to 2004, the incidence of ischemic stroke after MI during hospitalization was around 11.1 per 1,000 MIs.30 This study found that anterior MI was associated with a higher risk of stroke, but reported no difference in the incidence of stroke with percutaneous coronary intervention, systemic thrombolysis, or no reperfusion.
In a large prospective cohort study of 2,160 patients,31 259 (12%) had a stroke after MI. In multivariable analysis, age, diabetes, and previous stroke were predictors of stroke after MI. This study reported significantly fewer strokes in patients who underwent percutaneous coronary intervention than with other or no reperfusion therapies.31
ANTICOAGULATION TREATMENT
3. How would you treat a patient who has a drug-eluting stent in the left anterior descending artery and a new diagnosis of left ventricular thrombosis?
- Warfarin
- Aspirin and clopidogrel
- Aspirin, clopidogrel, and warfarin
- Aspirin and warfarin
The management of left ventricular thrombosis has been summarized in guidelines from the American College of Chest Physicians (ACCP) in 2012,32 and from the American College of Cardiology/American Heart Association in 2013,18 which recommend anticoagulation for at least 3 months, or indefinitely if bleeding risk is low, for all patients developing a left ventricular thrombus.
For patients with acute MI and left ventricular thrombosis, the ACCP guidelines recommend warfarin with a target international normalized ratio of 2.0 to 3.0 plus dual antiplatelet therapy (eg, aspirin plus clopidogrel) for 3 months, after which warfarin is discontinued but dual antiplatelet therapy is continued for up to 12 months.32
The European Society of Cardiology guidelines33 recommend 6 months of anticoagulation. However, if the patient is receiving dual antiplatelet therapy, they recommend repeated imaging of the left ventricle after 3 months of anticoagulation, which may allow for earlier discontinuation of anticoagulation if the thrombus has resolved and apical wall motion has recovered. Therefore, most experts recommend 3 months of anticoagulation when used in combination with dual antiplatelet therapy and repeating echocardiography at 3 months to safely discontinue anticoagulation. The best answer to the question posed here is aspirin, clopidogrel, and warfarin.
Decisions about antithrombotic therapy may also depend on stent type and the patient’s bleeding risk. With bare-metal stents, dual antiplatelet therapy along with anticoagulation should be used for 1 month, after which anticoagulation should be used with a single antiplatelet agent for another 2 months; after this, the anticoagulant can be discontinued and dual antiplatelet therapy can be resumed for a total of 12 months. Newer anticoagulants such as rivaroxaban, dabigatran, edoxaban, and apixaban may also have a role, but they have not yet been studied for this indication.
Surgical thrombectomy is rarely considered now, given the known efficacy of anticoagulants in dissolving the thrombus. It was done in the past for large, mobile, or protruding left ventricular thrombi, which have a higher potential for embolization.34 Currently, it can be done under very special circumstances, such as before placement of a left ventricular assist device or if the thrombus is large, to prevent embolism.35,36
BLEEDING COMPLICATIONS WITH TRIPLE ANTITHROMBOTIC THERAPY
After stent placement, almost all patients need to be on dual antiplatelet therapy for a specified duration depending on the type and generation of stent used. Such patients end up on “triple” antithrombotic therapy (two antiplatelet drugs plus an anticoagulant), which poses a high risk of bleeding.37 Consideration needs to be given to the risks of stroke, stent thrombosis, and major bleeding when selecting the antithrombotic regimen.38 Triple antithrombotic therapy has been associated with a risk of fatal and nonfatal bleeding of 4% to 16% when used for indications such as atrial fibrillation.39–41
Risks of triple antithrombotic therapy (aspirin 80–100 mg, clopidogrel 75 mg, and warfarin) were compared with those of clopidogrel plus warfarin in the What Is the Optimal Antiplatelet and Anticoagulant therapy in Patients With Oral Anticoagulation and Coronary Stenting Trial,37 which reported a significantly lower risk of major and minor bleeding with clopidogrel-plus-warfarin therapy than with triple antithrombotic therapy, 14.3% vs 31.7% (hazard ratio 0.40, 95% CI 0.28–0.58, P < .0001).
Additionally, the increased risk of major and minor bleeding associated with triple antithrombotic therapy has been confirmed in many observational studies; other studies found a trend toward lower risk with triple therapy, but this was not statistically significant (Table 2).38,40,42–55 A large multicenter European trial is being conducted to compare dual antiplatelet therapy vs triple antithrombotic therapy in patients with left ventricular thrombosis.
CASE FOLLOW-UP
Our patient was started on warfarin, clopidogrel 75 mg, and aspirin 75 mg at the time of discharge. He was continued on warfarin for 3 months, at which time a follow-up echocardiogram showed no thrombus in the left ventricle. Warfarin was discontinued, and he had no thromboembolic complications.
TAKE-HOME POINTS
Left ventricular thrombosis after an acute MI is very important to detect, as it can lead to serious complications through arterial embolism.
The incidence of left ventricular thrombosis has declined significantly with the use of percutaneous coronary intervention. However, it may still occur in a small number of patients with larger infarcts owing to delay in revascularization or proximal (left main or left anterior descending) occlusions with larger infarct size.
Echocardiography, which is routinely performed after acute MI to assess myocardial function, uncovers most left ventricular thrombi. In high-risk cases, MRI with late gadolinium enhancement can increase the diagnostic yield.
Anticoagulation with warfarin is recommended for at least 3 months. Post-MI patients undergoing stent implantation may need triple antithrombotic therapy, which, however, increases the bleeding risk significantly. Large randomized trials are needed to guide physicians in risk stratification of such patients.
- Lip GY, Piotrponikowski P, Andreotti F, et al; Heart Failure Association (EHFA) of the European Society of Cardiology (ESC) and the ESC Working Group on Thrombosis. Thromboembolism and antithrombotic therapy for heart failure in sinus rhythm: an executive summary of a joint consensus document from the ESC Heart Failure Association and the ESC Working Group on Thrombosis. Thromb Haemost 2012; 108:1009–1022.
- Turpie AG, Robinson JG, Doyle DJ, et al. Comparison of high-dose with low-dose subcutaneous heparin to prevent left ventricular mural thrombosis in patients with acute transmural anterior myocardial infarction. N Engl J Med 1989; 320:352–357.
- Chiarella F, Santoro E, Domenicucci S, Maggioni A, Vecchio C. Predischarge two-dimensional echocardiographic evaluation of left ventricular thrombosis after acute myocardial infarction in the GISSI-3 study. Am J Cardiol 1998; 81:822–827.
- Kalra A, Jang IK. Prevalence of early left ventricular thrombus after primary coronary intervention for acute myocardial infarction. J Thromb Thrombolysis 2000; 10:133–136.
- Nayak D, Aronow WS, Sukhija R, McClung JA, Monsen CE, Belkin RN. Comparison of frequency of left ventricular thrombi in patients with anterior wall versus non-anterior wall acute myocardial infarction treated with antithrombotic and antiplatelet therapy with or without coronary revascularization. Am J Cardiol 2004; 93:1529–1530.
- Rehan A, Kanwar M, Rosman H, et al. Incidence of post myocardial infarction left ventricular thrombus formation in the era of primary percutaneous intervention and glycoprotein IIb/IIIa inhibitors. A prospective observational study. Cardiovasc Ultrasound 2006;4:20.
- Zielinska M, Kaczmarek K, Tylkowski M. Predictors of left ventricular thrombus formation in acute myocardial infarction treated with successful primary angioplasty with stenting. Am J Med Sci 2008; 335:171–176.
- Osherov AB, Borovik-Raz M, Aronson D, et al. Incidence of early left ventricular thrombus after acute anterior wall myocardial infarction in the primary coronary intervention era. Am Heart J 2009; 157:1074–1080.
- Solheim S, Seljeflot I, Lunde K, et al. Frequency of left ventricular thrombus in patients with anterior wall acute myocardial infarction treated with percutaneous coronary intervention and dual antiplatelet therapy. Am J Cardiol 2010; 106:1197–1200.
- Shacham Y, Leshem-Rubinow E, Ben Assa E, et al. Comparison of C-reactive protein and fibrinogen levels in patients having anterior wall ST-segment elevation myocardial infarction with versus without left ventricular thrombus (from a primary percutaneous coronary intervention cohort). Am J Cardiol 2013; 112:57–60.
- Gianstefani S, Douiri A, Delithanasis I, et al. Incidence and predictors of early left ventricular thrombus after ST-elevation myocardial infarction in the contemporary era of primary percutaneous coronary intervention. Am J Cardiol 2014; 113:1111–1116.
- Shacham Y, Birati EY, Rogovski O, Cogan Y, Keren G, Roth A. Left ventricular thrombus formation and bleeding complications during continuous in-hospital anticoagulation for acute anterior myocardial infarction. Isr Med Assoc J 2012; 14:742–746.
- Asinger RW, Mikell FL, Elsperger J, Hodges M. Incidence of left-ventricular thrombosis after acute transmural myocardial infarction. Serial evaluation by two-dimensional echocardiography. N Engl J Med 1981; 305:297–302.
- Nihoyannopoulos P, Smith GC, Maseri A, Foale RA. The natural history of left ventricular thrombus in myocardial infarction: a rationale in support of masterly inactivity. J Am Coll Cardiol 1989; 14:903–911.
- Weinreich DJ, Burke JF, Pauletto FJ. Left ventricular mural thrombi complicating acute myocardial infarction. Long-term follow-up with serial echocardiography. Ann Intern Med 1984; 100:789–794.
- Greaves SC, Zhi G, Lee RT, et al. Incidence and natural history of left ventricular thrombus following anterior wall acute myocardial infarction. Am J Cardiol 1997; 80:442–448.
- Solheim S, Seljeflot I, Lunde K, et al. Prothrombotic markers in patients with acute myocardial infarction and left ventricular thrombus formation treated with pci and dual antiplatelet therapy. Thromb J 2013; 11:1.
- O’Gara PT, Kushner FG, Ascheim DD, et al; American College of Cardiology Foundation/American Heart Association Task Force on Practice Guidelines. 2013 ACCF/AHA guideline for the management of ST-elevation myocardial infarction: a report of the American College of Cardiology Foundation/American Heart Association Task Force on Practice Guidelines. Circulation 2013; 127:e362–e425.
- Weinsaft JW, Kim HW, Crowley AL, et al. LV thrombus detection by routine echocardiography: insights into performance characteristics using delayed enhancement CMR. JACC Cardiovasc Imaging 2011; 4:702–712.
- Mollet NR, Dymarkowski S, Volders W, et al. Visualization of ventricular thrombi with contrast-enhanced magnetic resonance imaging in patients with ischemic heart disease. Circulation 2002; 106:2873–2876.
- Srichai MB, Junor C, Rodriguez LL, et al. Clinical, imaging, and pathological characteristics of left ventricular thrombus: a comparison of contrast-enhanced magnetic resonance imaging, transthoracic echocardiography, and transesophageal echocardiography with surgical or pathological validation. Am Heart J 2006; 152:75–84.
- Eriksson SE, Olsson JE. Survival and recurrent strokes in patients with different subtypes of stroke: a fourteen-year follow-up study. Cerebrovasc Dis 2001; 12:171–180.
- Grau AJ, Weimar C, Buggle F, et al. Risk factors, outcome, and treatment in subtypes of ischemic stroke: the German Stroke Data Bank. Stroke 2001; 32:2559–2566.
- Keren A, Goldberg S, Gottlieb S, et al. Natural history of left ventricular thrombi: their appearance and resolution in the posthospitalization period of acute myocardial infarction. J Am Coll Cardiol 1990; 15:790–800.
- Jordan RA, Miller RD, Edwards JE, Parker RL. Thrombo-embolism in acute and in healed myocardial infarction. I. Intracardiac mural thrombosis. Circulation 1952; 6:1–6.
- Vaitkus PT, Barnathan ES. Embolic potential, prevention and management of mural thrombus complicating anterior myocardial infarction: a meta-analysis. J Am Coll Cardiol 1993; 22:1004–1009.
- ISIS-2 (Second International Study of Infarct Survival) Collaborative Group. Randomised trial of intravenous streptokinase, oral aspirin, both, or neither among 17,187 cases of suspected acute myocardial infarction: ISIS-2. Lancet 1988; 2:349–360.
- Cabin HS, Roberts WC. Left ventricular aneurysm, intraaneurysmal thrombus and systemic embolus in coronary heart disease. Chest 1980; 77:586–590.
- Keating EC, Gross SA, Schlamowitz RA, et al. Mural thrombi in myocardial infarctions. Prospective evaluation by two-dimensional echocardiography. Am J Med 1983; 74:989–995.
- Witt BJ, Ballman KV, Brown RD Jr, Meverden RA, Jacobsen SJ, Roger VL. The incidence of stroke after myocardial infarction: a meta-analysis. Am J Med 2006; 119:354.e1–354.e9.
- Witt BJ, Brown RD Jr, Jacobsen SJ, Weston SA, Yawn BP, Roger VL. A community-based study of stroke incidence after myocardial infarction. Ann Intern Med 2005; 143:785–792.
- Vandvik PO, Lincoff AM, Gore JM, et al; American College of Chest Physicians. Primary and secondary prevention of cardiovascular disease: antithrombotic therapy and prevention of thrombosis, 9th ed: American College of Chest Physicians Evidence-Based Clinical Practice Guidelines. Chest 2012; 141(suppl):e637S–e68S.
- Steg G, James SK, Atar D, et al. ESC guidelines for the management of acute myocardial infarction in patients presenting with ST-segment elevation. Eur Heart J 2012; 33:2569–2619.
- Nili M, Deviri E, Jortner R, Strasberg B, Levy MJ. Surgical removal of a mobile, pedunculated left ventricular thrombus: report of 4 cases. Ann Thorac Surg 1988; 46:396–400.
- Kanemitsu S, Miyake Y, Okabe M. Surgical removal of a left ventricular thrombus associated with cardiac sarcoidosis. Interact Cardiovasc Thorac Surg 2008; 7:333–335.
- Engin C, Yagdi T, Balcioglu O, et al. Left ventricular assist device implantation in heart failure patients with a left ventricular thrombus. Transplant Proc 2013; 45:1017–1019.
- Dewilde WJ, Oirbans T, Verheugt FW, et al; WOEST study investigators. Use of clopidogrel with or without aspirin in patients taking oral anticoagulant therapy and undergoing percutaneous coronary intervention: an open-label, randomised, controlled trial. Lancet 2013; 381:1107–1115.
- Faxon DP, Eikelboom JW, Berger PB, et al. Antithrombotic therapy in patients with atrial fibrillation undergoing coronary stenting: a North American perspective: executive summary. Circ Cardiovasc Interv 2011; 4:522–534.
- Hansen ML, Sorensen R, Clausen MT, et al. Risk of bleeding with single, dual, or triple therapy with warfarin, aspirin, and clopidogrel in patients with atrial fibrillation. Arch Intern Med 2010; 170:1433–1441.
- Karjalainen PP, Porela P, Ylitalo A, et al. Safety and efficacy of combined antiplatelet-warfarin therapy after coronary stenting. Eur Heart J 2007; 28:726–732.
- Doyle BJ, Rihal CS, Gastineau DA, Holmes DR Jr. Bleeding, blood transfusion, and increased mortality after percutaneous coronary intervention: implications for contemporary practice. J Am Coll Cardiol 2009; 53:2019–2027.
- Azoulay L, Dell’Aniello S, Simon T, Renoux C, Suissa S. The concurrent use of antithrombotic therapies and the risk of bleeding in patients with atrial fibrillation. Thromb Haemost 2013; 109:431–439.
- Deshmukh A, Hilleman DE, Del Core M, Nair CK. Antithrombotic regimens in patients with indication for long-term anticoagulation undergoing coronary interventions-systematic analysis, review of literature, and implications on management. Am J Ther 2013; 20:654–663.
- Fosbol EL, Wang TY, Li S, et al. Warfarin use among older atrial fibrillation patients with non-ST-segment elevation myocardial infarction managed with coronary stenting and dual antiplatelet therapy. Am Heart J 2013; 166:864–870.
- Gao F, Zhou YJ, Wang ZJ, et al. Meta-analysis of the combination of warfarin and dual antiplatelet therapy after coronary stenting in patients with indications for chronic oral anticoagulation. Int J Cardiol 2011; 148:96–101.
- Hansen ML, Sorensen R, Clausen MT, et al. Risk of bleeding with single, dual, or triple therapy with warfarin, aspirin, and clopidogrel in patients with atrial fibrillation. Arch Intern Med 2010; 170:1433–1441.
- Hermosillo AJ, Spinler SA. Aspirin, clopidogrel, and warfarin: is the combination appropriate and effective or inappropriate and too dangerous? Ann Pharmacother 2008; 42:790–805.
- Holmes DR Jr, Kereiakes DJ, Kleiman NS, Moliterno DJ, Patti G, Grines CL. Combining antiplatelet and anticoagulant therapies. J Am Coll Cardiol 2009; 54:95–109.
- Khurram Z, Chou E, Minutello R, et al. Combination therapy with aspirin, clopidogrel and warfarin following coronary stenting is associated with a significant risk of bleeding. J Invasive Cardiol 2006; 18:162–164.
- Orford JL, Fasseas P, Melby S, et al. Safety and efficacy of aspirin, clopidogrel, and warfarin after coronary stent placement in patients with an indication for anticoagulation. Am Heart J 2004; 147:463–467.
- Porter A, Konstantino Y, Iakobishvili Z, Shachar L, Battler A, Hasdai D. Short-term triple therapy with aspirin, warfarin, and a thienopyridine among patients undergoing percutaneous coronary intervention. Catheter Cardiovasc Interv 2006; 68:56–61.
- DeEugenio D, Kolman L, DeCaro M, et al. Risk of major bleeding with concomitant dual antiplatelet therapy after percutaneous coronary intervention in patients receiving long-term warfarin therapy. Pharmacotherapy 2007; 27:691–696.
- Ruiz-Nodar JM, Marin F, Hurtado JA, et al. Anticoagulant and antiplatelet therapy use in 426 patients with atrial fibrillation undergoing percutaneous coronary intervention and stent implantation implications for bleeding risk and prognosis. J Am Coll Cardiol 2008; 51:818–825.
- Sarafoff N, Ndrepepa G, Mehilli J, et al. Aspirin and clopidogrel with or without phenprocoumon after drug eluting coronary stent placement in patients on chronic oral anticoagulation. J Intern Med 2008; 264:472–480.
- Rossini R, Musumeci GF, Lettieri CF, et al. Long-term outcomes in patients undergoing coronary stenting on dual oral antiplatelet treatment requiring oral anticoagulant therapy. Am J Cardiol 2008; 102:1618–1623.
A 62-year-old man with hypertension, type 2 diabetes mellitus, and hypercholesterolemia presented to the emergency department with substernal chest pain that started about 15 hours earlier while he was at rest watching television.
On examination, his pulse was 92 beats per minute and regular, his blood pressure was 160/88 mm Hg, and he had no evidence of jugular venous distention or pedal edema. Lung examination was positive for bibasilar crackles.
Electrocardiography revealed Q waves with ST elevation in leads I, aVL, V4, V5, and V6 with reciprocal ST depression in leads II, III, and aVF.
His troponin T level on presentation was markedly elevated.
He underwent heart catheterization and was found to have 100% occlusion of the proximal left anterior descending artery. He underwent successful percutaneous coronary intervention with placement of a drug-eluting stent, and afterward had grade 3 flow on the Thrombolysis in Myocardial Infarction (TIMI) scale.
Echocardiography the next day revealed a mobile echo-dense mass in the left ventricular apex (Figure 1) and a left ventricular ejection fraction of 35%.
THE INCIDENCE OF LEFT VENTRICULAR THROMBOSIS IN ACUTE MI
1. What is the incidence of left ventricular thrombosis after acute myocardial infarction (MI), now that primary percutaneous coronary intervention is common?
- 0.1%
- 2%
- 20%
- 40%
Left ventricular thrombosis is a serious complication of acute MI that can cause systemic thromboembolism, including stroke.1 Before thrombolytic therapy was available, this complication occurred in 20% to 60% of patients with acute MI.2,3 But early reperfusion strategies, anticoagulation for the first 48 hours, and dual antiplatelet therapy have reduced the incidence of this complication significantly.
In the thrombolytic era, the incidence of left ventricular thrombosis was 5.1% in the Gruppo Italiano per lo Studio della Sopravvivenza nell’Infarto Miocardico (GISSI) 3 study, which had 8,326 patients. A subset of patients who had an anterior MI had almost double the incidence (11.5%).3
The incidence has further declined with the advent of primary percutaneous coronary intervention, likely thanks to enhanced myocardial salvage, and now ranges from 2.5% to 15% (Table 1).4–11 The largest observational study, with 2,911 patients undergoing percutaneous coronary intervention, reported an incidence of 2.5% within 3 to 5 days of the MI.7 At our center, the incidence was found to be even lower, 1.8% in 1,700 patients presenting with ST-elevation MI undergoing primary percutaneous coronary intervention. Hence, of the answers to the question above, 2% would be closest.
Large infarct size with a low left ventricular ejection fraction (< 40%), anterior wall MI, hypertension, and delay in time from symptom onset to intervention were independent predictors of left ventricular thrombus formation in most studies.7,12 The risk is highest during the first 2 weeks after MI, and thrombosis almost never occurs more than 3 months after the index event.5,13–16
WHAT IS THE PATHOGENESIS OF LEFT VENTRICULAR THROMBOSIS?
A large transmural infarct results in loss of contractile function, which causes stagnation and pooling of blood adjacent to the infarcted ventricular segment. In addition, endocardial injury exposes tissue factor, which then initiates the coagulation cascade. To make matters worse, MI results in a hypercoagulable state through unclear mechanisms, which completes the Virchow triad for thrombus formation. Elevations of D-dimer, fibrinogen, anticardiolipin antibodies (IgM and IgG), and tissue factor have also been reported after acute MI.17
Thrombus formation begins with platelet aggregation at the site of endocardial damage, forming a platelet plug, followed by activation of clotting factors. These thrombi are referred to as “mural,” as they adhere to the chamber wall (endocardium). They are composed of fibrin and entrapped red and white blood cells (Figure 2).
The natural course of thrombus evolution is established but variable. A left ventricular thrombus may dislodge and embolize, resulting in stroke or other thromboembolic complications. Alternately, it can dissolve over time, aided by intrinsic fibrinolytic mechanisms. On other occasions, the thrombus may organize, a process characterized by ingrowth of smooth muscle cells, fibroblasts, and endothelium.
HOW IS LEFT VENTRICULAR THROMBOSIS DIAGNOSED?
2. What is the best imaging test for detecting a thrombus?
- Transesophageal echocardiography
- Transthoracic echocardiography
- Cardiac magnetic resonance imaging (MRI) without gadolinium contrast
- Cardiac MRI with gadolinium contrast
Evaluation of left ventricular function after acute MI carries a class I indication (ie, it should be performed).18
Echocardiography is commonly used, and it has a 60% sensitivity to detect a thrombus.19 In patients with poorer transthoracic echocardiographic windows, contrast can be used to better delineate the left ventricular cavity and show the thrombus. Transesophageal echocardiography is seldom useful, as the left ventricular apex is foreshortened and in the far field.
A left ventricular thrombus is confirmed if an echo-dense mass with well-demarcated margins distinct from the endocardium is seen throughout the cardiac cycle. It should be evident in at least two different views (apical and short-axis) and should be adjacent to a hypokinetic or akinetic left ventricular wall. False-positive findings can occur due to misidentified false tendons, papillary muscles, and trabeculae.
Cardiac MRI with late gadolinium enhancement is now the gold standard for diagnostic imaging, as it accurately characterizes the shape, size, and location of the thrombus (Figure 3). Gadolinium contrast increases the enhancement of the ventricular cavity, thus allowing easy detection of thrombus, which appears dark. Cardiac MRI with delayed enhancement has 88% to 91% sensitivity and 99% specificity to detect left ventricular thrombosis.20,21 However, compared with echocardiography, routine cardiac MRI is time-intensive, costly, and not routinely available. As a result, it should be performed only in patients with poor acoustic windows and a high clinical suspicion of left ventricular thrombosis.
Delayed-contrast cardiac computed tomography can be used to identify left ventricular thrombosis, using absence of contrast uptake. The need to use contrast is a disadvantage, but computed tomography can be an alternative in patients with contraindications to cardiac MRI.
WHAT COMPLICATIONS ARISE FROM LEFT VENTRICULAR THROMBOSIS?
The most feared complication of left ventricular thrombosis is thromboembolism. Cardioembolic stroke is generally severe, prone to early and long-term recurrence, and associated with a higher death rate than noncardioembolic ischemic stroke.22,23 Thrombi associated with thromboembolism are often acute and mobile rather than organized and immobile.24 They may embolize to the brain, spleen, kidneys, and bowel.25 In a meta-analysis of 11 studies, the pooled odds ratio for risk of embolization was 5.45 (95% confidence interval [CI] 3.02–9.83) with left ventricular thrombi vs without.26 Before systemic thrombolysis and antiplatelet therapy became available, stroke rates ranged from 1.5% to 10%.27–29
In a meta-analysis of 22 studies from 1978 to 2004, the incidence of ischemic stroke after MI during hospitalization was around 11.1 per 1,000 MIs.30 This study found that anterior MI was associated with a higher risk of stroke, but reported no difference in the incidence of stroke with percutaneous coronary intervention, systemic thrombolysis, or no reperfusion.
In a large prospective cohort study of 2,160 patients,31 259 (12%) had a stroke after MI. In multivariable analysis, age, diabetes, and previous stroke were predictors of stroke after MI. This study reported significantly fewer strokes in patients who underwent percutaneous coronary intervention than with other or no reperfusion therapies.31
ANTICOAGULATION TREATMENT
3. How would you treat a patient who has a drug-eluting stent in the left anterior descending artery and a new diagnosis of left ventricular thrombosis?
- Warfarin
- Aspirin and clopidogrel
- Aspirin, clopidogrel, and warfarin
- Aspirin and warfarin
The management of left ventricular thrombosis has been summarized in guidelines from the American College of Chest Physicians (ACCP) in 2012,32 and from the American College of Cardiology/American Heart Association in 2013,18 which recommend anticoagulation for at least 3 months, or indefinitely if bleeding risk is low, for all patients developing a left ventricular thrombus.
For patients with acute MI and left ventricular thrombosis, the ACCP guidelines recommend warfarin with a target international normalized ratio of 2.0 to 3.0 plus dual antiplatelet therapy (eg, aspirin plus clopidogrel) for 3 months, after which warfarin is discontinued but dual antiplatelet therapy is continued for up to 12 months.32
The European Society of Cardiology guidelines33 recommend 6 months of anticoagulation. However, if the patient is receiving dual antiplatelet therapy, they recommend repeated imaging of the left ventricle after 3 months of anticoagulation, which may allow for earlier discontinuation of anticoagulation if the thrombus has resolved and apical wall motion has recovered. Therefore, most experts recommend 3 months of anticoagulation when used in combination with dual antiplatelet therapy and repeating echocardiography at 3 months to safely discontinue anticoagulation. The best answer to the question posed here is aspirin, clopidogrel, and warfarin.
Decisions about antithrombotic therapy may also depend on stent type and the patient’s bleeding risk. With bare-metal stents, dual antiplatelet therapy along with anticoagulation should be used for 1 month, after which anticoagulation should be used with a single antiplatelet agent for another 2 months; after this, the anticoagulant can be discontinued and dual antiplatelet therapy can be resumed for a total of 12 months. Newer anticoagulants such as rivaroxaban, dabigatran, edoxaban, and apixaban may also have a role, but they have not yet been studied for this indication.
Surgical thrombectomy is rarely considered now, given the known efficacy of anticoagulants in dissolving the thrombus. It was done in the past for large, mobile, or protruding left ventricular thrombi, which have a higher potential for embolization.34 Currently, it can be done under very special circumstances, such as before placement of a left ventricular assist device or if the thrombus is large, to prevent embolism.35,36
BLEEDING COMPLICATIONS WITH TRIPLE ANTITHROMBOTIC THERAPY
After stent placement, almost all patients need to be on dual antiplatelet therapy for a specified duration depending on the type and generation of stent used. Such patients end up on “triple” antithrombotic therapy (two antiplatelet drugs plus an anticoagulant), which poses a high risk of bleeding.37 Consideration needs to be given to the risks of stroke, stent thrombosis, and major bleeding when selecting the antithrombotic regimen.38 Triple antithrombotic therapy has been associated with a risk of fatal and nonfatal bleeding of 4% to 16% when used for indications such as atrial fibrillation.39–41
Risks of triple antithrombotic therapy (aspirin 80–100 mg, clopidogrel 75 mg, and warfarin) were compared with those of clopidogrel plus warfarin in the What Is the Optimal Antiplatelet and Anticoagulant therapy in Patients With Oral Anticoagulation and Coronary Stenting Trial,37 which reported a significantly lower risk of major and minor bleeding with clopidogrel-plus-warfarin therapy than with triple antithrombotic therapy, 14.3% vs 31.7% (hazard ratio 0.40, 95% CI 0.28–0.58, P < .0001).
Additionally, the increased risk of major and minor bleeding associated with triple antithrombotic therapy has been confirmed in many observational studies; other studies found a trend toward lower risk with triple therapy, but this was not statistically significant (Table 2).38,40,42–55 A large multicenter European trial is being conducted to compare dual antiplatelet therapy vs triple antithrombotic therapy in patients with left ventricular thrombosis.
CASE FOLLOW-UP
Our patient was started on warfarin, clopidogrel 75 mg, and aspirin 75 mg at the time of discharge. He was continued on warfarin for 3 months, at which time a follow-up echocardiogram showed no thrombus in the left ventricle. Warfarin was discontinued, and he had no thromboembolic complications.
TAKE-HOME POINTS
Left ventricular thrombosis after an acute MI is very important to detect, as it can lead to serious complications through arterial embolism.
The incidence of left ventricular thrombosis has declined significantly with the use of percutaneous coronary intervention. However, it may still occur in a small number of patients with larger infarcts owing to delay in revascularization or proximal (left main or left anterior descending) occlusions with larger infarct size.
Echocardiography, which is routinely performed after acute MI to assess myocardial function, uncovers most left ventricular thrombi. In high-risk cases, MRI with late gadolinium enhancement can increase the diagnostic yield.
Anticoagulation with warfarin is recommended for at least 3 months. Post-MI patients undergoing stent implantation may need triple antithrombotic therapy, which, however, increases the bleeding risk significantly. Large randomized trials are needed to guide physicians in risk stratification of such patients.
- Lip GY, Piotrponikowski P, Andreotti F, et al; Heart Failure Association (EHFA) of the European Society of Cardiology (ESC) and the ESC Working Group on Thrombosis. Thromboembolism and antithrombotic therapy for heart failure in sinus rhythm: an executive summary of a joint consensus document from the ESC Heart Failure Association and the ESC Working Group on Thrombosis. Thromb Haemost 2012; 108:1009–1022.
- Turpie AG, Robinson JG, Doyle DJ, et al. Comparison of high-dose with low-dose subcutaneous heparin to prevent left ventricular mural thrombosis in patients with acute transmural anterior myocardial infarction. N Engl J Med 1989; 320:352–357.
- Chiarella F, Santoro E, Domenicucci S, Maggioni A, Vecchio C. Predischarge two-dimensional echocardiographic evaluation of left ventricular thrombosis after acute myocardial infarction in the GISSI-3 study. Am J Cardiol 1998; 81:822–827.
- Kalra A, Jang IK. Prevalence of early left ventricular thrombus after primary coronary intervention for acute myocardial infarction. J Thromb Thrombolysis 2000; 10:133–136.
- Nayak D, Aronow WS, Sukhija R, McClung JA, Monsen CE, Belkin RN. Comparison of frequency of left ventricular thrombi in patients with anterior wall versus non-anterior wall acute myocardial infarction treated with antithrombotic and antiplatelet therapy with or without coronary revascularization. Am J Cardiol 2004; 93:1529–1530.
- Rehan A, Kanwar M, Rosman H, et al. Incidence of post myocardial infarction left ventricular thrombus formation in the era of primary percutaneous intervention and glycoprotein IIb/IIIa inhibitors. A prospective observational study. Cardiovasc Ultrasound 2006;4:20.
- Zielinska M, Kaczmarek K, Tylkowski M. Predictors of left ventricular thrombus formation in acute myocardial infarction treated with successful primary angioplasty with stenting. Am J Med Sci 2008; 335:171–176.
- Osherov AB, Borovik-Raz M, Aronson D, et al. Incidence of early left ventricular thrombus after acute anterior wall myocardial infarction in the primary coronary intervention era. Am Heart J 2009; 157:1074–1080.
- Solheim S, Seljeflot I, Lunde K, et al. Frequency of left ventricular thrombus in patients with anterior wall acute myocardial infarction treated with percutaneous coronary intervention and dual antiplatelet therapy. Am J Cardiol 2010; 106:1197–1200.
- Shacham Y, Leshem-Rubinow E, Ben Assa E, et al. Comparison of C-reactive protein and fibrinogen levels in patients having anterior wall ST-segment elevation myocardial infarction with versus without left ventricular thrombus (from a primary percutaneous coronary intervention cohort). Am J Cardiol 2013; 112:57–60.
- Gianstefani S, Douiri A, Delithanasis I, et al. Incidence and predictors of early left ventricular thrombus after ST-elevation myocardial infarction in the contemporary era of primary percutaneous coronary intervention. Am J Cardiol 2014; 113:1111–1116.
- Shacham Y, Birati EY, Rogovski O, Cogan Y, Keren G, Roth A. Left ventricular thrombus formation and bleeding complications during continuous in-hospital anticoagulation for acute anterior myocardial infarction. Isr Med Assoc J 2012; 14:742–746.
- Asinger RW, Mikell FL, Elsperger J, Hodges M. Incidence of left-ventricular thrombosis after acute transmural myocardial infarction. Serial evaluation by two-dimensional echocardiography. N Engl J Med 1981; 305:297–302.
- Nihoyannopoulos P, Smith GC, Maseri A, Foale RA. The natural history of left ventricular thrombus in myocardial infarction: a rationale in support of masterly inactivity. J Am Coll Cardiol 1989; 14:903–911.
- Weinreich DJ, Burke JF, Pauletto FJ. Left ventricular mural thrombi complicating acute myocardial infarction. Long-term follow-up with serial echocardiography. Ann Intern Med 1984; 100:789–794.
- Greaves SC, Zhi G, Lee RT, et al. Incidence and natural history of left ventricular thrombus following anterior wall acute myocardial infarction. Am J Cardiol 1997; 80:442–448.
- Solheim S, Seljeflot I, Lunde K, et al. Prothrombotic markers in patients with acute myocardial infarction and left ventricular thrombus formation treated with pci and dual antiplatelet therapy. Thromb J 2013; 11:1.
- O’Gara PT, Kushner FG, Ascheim DD, et al; American College of Cardiology Foundation/American Heart Association Task Force on Practice Guidelines. 2013 ACCF/AHA guideline for the management of ST-elevation myocardial infarction: a report of the American College of Cardiology Foundation/American Heart Association Task Force on Practice Guidelines. Circulation 2013; 127:e362–e425.
- Weinsaft JW, Kim HW, Crowley AL, et al. LV thrombus detection by routine echocardiography: insights into performance characteristics using delayed enhancement CMR. JACC Cardiovasc Imaging 2011; 4:702–712.
- Mollet NR, Dymarkowski S, Volders W, et al. Visualization of ventricular thrombi with contrast-enhanced magnetic resonance imaging in patients with ischemic heart disease. Circulation 2002; 106:2873–2876.
- Srichai MB, Junor C, Rodriguez LL, et al. Clinical, imaging, and pathological characteristics of left ventricular thrombus: a comparison of contrast-enhanced magnetic resonance imaging, transthoracic echocardiography, and transesophageal echocardiography with surgical or pathological validation. Am Heart J 2006; 152:75–84.
- Eriksson SE, Olsson JE. Survival and recurrent strokes in patients with different subtypes of stroke: a fourteen-year follow-up study. Cerebrovasc Dis 2001; 12:171–180.
- Grau AJ, Weimar C, Buggle F, et al. Risk factors, outcome, and treatment in subtypes of ischemic stroke: the German Stroke Data Bank. Stroke 2001; 32:2559–2566.
- Keren A, Goldberg S, Gottlieb S, et al. Natural history of left ventricular thrombi: their appearance and resolution in the posthospitalization period of acute myocardial infarction. J Am Coll Cardiol 1990; 15:790–800.
- Jordan RA, Miller RD, Edwards JE, Parker RL. Thrombo-embolism in acute and in healed myocardial infarction. I. Intracardiac mural thrombosis. Circulation 1952; 6:1–6.
- Vaitkus PT, Barnathan ES. Embolic potential, prevention and management of mural thrombus complicating anterior myocardial infarction: a meta-analysis. J Am Coll Cardiol 1993; 22:1004–1009.
- ISIS-2 (Second International Study of Infarct Survival) Collaborative Group. Randomised trial of intravenous streptokinase, oral aspirin, both, or neither among 17,187 cases of suspected acute myocardial infarction: ISIS-2. Lancet 1988; 2:349–360.
- Cabin HS, Roberts WC. Left ventricular aneurysm, intraaneurysmal thrombus and systemic embolus in coronary heart disease. Chest 1980; 77:586–590.
- Keating EC, Gross SA, Schlamowitz RA, et al. Mural thrombi in myocardial infarctions. Prospective evaluation by two-dimensional echocardiography. Am J Med 1983; 74:989–995.
- Witt BJ, Ballman KV, Brown RD Jr, Meverden RA, Jacobsen SJ, Roger VL. The incidence of stroke after myocardial infarction: a meta-analysis. Am J Med 2006; 119:354.e1–354.e9.
- Witt BJ, Brown RD Jr, Jacobsen SJ, Weston SA, Yawn BP, Roger VL. A community-based study of stroke incidence after myocardial infarction. Ann Intern Med 2005; 143:785–792.
- Vandvik PO, Lincoff AM, Gore JM, et al; American College of Chest Physicians. Primary and secondary prevention of cardiovascular disease: antithrombotic therapy and prevention of thrombosis, 9th ed: American College of Chest Physicians Evidence-Based Clinical Practice Guidelines. Chest 2012; 141(suppl):e637S–e68S.
- Steg G, James SK, Atar D, et al. ESC guidelines for the management of acute myocardial infarction in patients presenting with ST-segment elevation. Eur Heart J 2012; 33:2569–2619.
- Nili M, Deviri E, Jortner R, Strasberg B, Levy MJ. Surgical removal of a mobile, pedunculated left ventricular thrombus: report of 4 cases. Ann Thorac Surg 1988; 46:396–400.
- Kanemitsu S, Miyake Y, Okabe M. Surgical removal of a left ventricular thrombus associated with cardiac sarcoidosis. Interact Cardiovasc Thorac Surg 2008; 7:333–335.
- Engin C, Yagdi T, Balcioglu O, et al. Left ventricular assist device implantation in heart failure patients with a left ventricular thrombus. Transplant Proc 2013; 45:1017–1019.
- Dewilde WJ, Oirbans T, Verheugt FW, et al; WOEST study investigators. Use of clopidogrel with or without aspirin in patients taking oral anticoagulant therapy and undergoing percutaneous coronary intervention: an open-label, randomised, controlled trial. Lancet 2013; 381:1107–1115.
- Faxon DP, Eikelboom JW, Berger PB, et al. Antithrombotic therapy in patients with atrial fibrillation undergoing coronary stenting: a North American perspective: executive summary. Circ Cardiovasc Interv 2011; 4:522–534.
- Hansen ML, Sorensen R, Clausen MT, et al. Risk of bleeding with single, dual, or triple therapy with warfarin, aspirin, and clopidogrel in patients with atrial fibrillation. Arch Intern Med 2010; 170:1433–1441.
- Karjalainen PP, Porela P, Ylitalo A, et al. Safety and efficacy of combined antiplatelet-warfarin therapy after coronary stenting. Eur Heart J 2007; 28:726–732.
- Doyle BJ, Rihal CS, Gastineau DA, Holmes DR Jr. Bleeding, blood transfusion, and increased mortality after percutaneous coronary intervention: implications for contemporary practice. J Am Coll Cardiol 2009; 53:2019–2027.
- Azoulay L, Dell’Aniello S, Simon T, Renoux C, Suissa S. The concurrent use of antithrombotic therapies and the risk of bleeding in patients with atrial fibrillation. Thromb Haemost 2013; 109:431–439.
- Deshmukh A, Hilleman DE, Del Core M, Nair CK. Antithrombotic regimens in patients with indication for long-term anticoagulation undergoing coronary interventions-systematic analysis, review of literature, and implications on management. Am J Ther 2013; 20:654–663.
- Fosbol EL, Wang TY, Li S, et al. Warfarin use among older atrial fibrillation patients with non-ST-segment elevation myocardial infarction managed with coronary stenting and dual antiplatelet therapy. Am Heart J 2013; 166:864–870.
- Gao F, Zhou YJ, Wang ZJ, et al. Meta-analysis of the combination of warfarin and dual antiplatelet therapy after coronary stenting in patients with indications for chronic oral anticoagulation. Int J Cardiol 2011; 148:96–101.
- Hansen ML, Sorensen R, Clausen MT, et al. Risk of bleeding with single, dual, or triple therapy with warfarin, aspirin, and clopidogrel in patients with atrial fibrillation. Arch Intern Med 2010; 170:1433–1441.
- Hermosillo AJ, Spinler SA. Aspirin, clopidogrel, and warfarin: is the combination appropriate and effective or inappropriate and too dangerous? Ann Pharmacother 2008; 42:790–805.
- Holmes DR Jr, Kereiakes DJ, Kleiman NS, Moliterno DJ, Patti G, Grines CL. Combining antiplatelet and anticoagulant therapies. J Am Coll Cardiol 2009; 54:95–109.
- Khurram Z, Chou E, Minutello R, et al. Combination therapy with aspirin, clopidogrel and warfarin following coronary stenting is associated with a significant risk of bleeding. J Invasive Cardiol 2006; 18:162–164.
- Orford JL, Fasseas P, Melby S, et al. Safety and efficacy of aspirin, clopidogrel, and warfarin after coronary stent placement in patients with an indication for anticoagulation. Am Heart J 2004; 147:463–467.
- Porter A, Konstantino Y, Iakobishvili Z, Shachar L, Battler A, Hasdai D. Short-term triple therapy with aspirin, warfarin, and a thienopyridine among patients undergoing percutaneous coronary intervention. Catheter Cardiovasc Interv 2006; 68:56–61.
- DeEugenio D, Kolman L, DeCaro M, et al. Risk of major bleeding with concomitant dual antiplatelet therapy after percutaneous coronary intervention in patients receiving long-term warfarin therapy. Pharmacotherapy 2007; 27:691–696.
- Ruiz-Nodar JM, Marin F, Hurtado JA, et al. Anticoagulant and antiplatelet therapy use in 426 patients with atrial fibrillation undergoing percutaneous coronary intervention and stent implantation implications for bleeding risk and prognosis. J Am Coll Cardiol 2008; 51:818–825.
- Sarafoff N, Ndrepepa G, Mehilli J, et al. Aspirin and clopidogrel with or without phenprocoumon after drug eluting coronary stent placement in patients on chronic oral anticoagulation. J Intern Med 2008; 264:472–480.
- Rossini R, Musumeci GF, Lettieri CF, et al. Long-term outcomes in patients undergoing coronary stenting on dual oral antiplatelet treatment requiring oral anticoagulant therapy. Am J Cardiol 2008; 102:1618–1623.
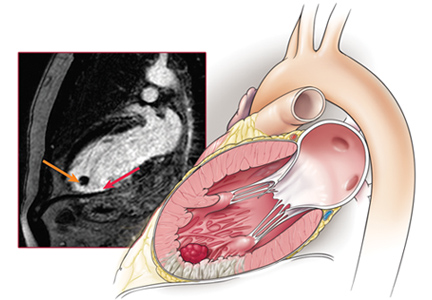
AGA Clinical Practice Update: Refer early Barrett’s dysplasia to a specialist
Low-grade esophageal dysplasia must be confirmed by a GI pathologist with a special interest in Barrett’s esophagus, one who deals with the problem on a daily basis and whom peers recognize as an expert in the field, according to a new expert review from the American Gastroenterological Association (Gastroenterology. doi: http://dx.doi.org/10.1053/j.gastro.2016.09.040).
In the absence of reliable biomarkers, it’s the best guarantee that low-grade dysplasia (LGD) is truly present. Overdiagnosis of early dysplasia is common, and it leads to mistreatment and uncertainty about study results, the AGA said.
In the absence of reliable biomarkers, AGA turned to expertise to combat mistreatment. Although it’s clear that high-grade disease and esophageal adenocarcinoma need intervention, LGD sometimes seems to regress on its own, but it’s unclear if it’s due to natural history or diagnosis in patients who don’t really have it.
For now, expertise is the best solution. “Unfortunately, there is no database that clearly identifies experts in the field of Barrett’s esophagus,” but most practitioners can identify people to “refer these patients to within their state or region.” Meanwhile, “we are working tirelessly” to establish a referral and outcome database. “We owe it to” patients to let them know “how good the” people we are referring them to are, Dr. Wani said.
Given the diagnosis uncertainty, AGA side-stepped the biggest controversy in LGD: whether patients should be treated or watched. Among “patients with confirmed Barrett’s esophagus with LGD by expert GI pathology review that persists on a [second] endoscopy despite intensification of acid-suppressive therapy” at 8-12 weeks with proton pump inhibitors twice a day, “risks and benefits of management options of endoscopic eradication therapy (specifically adverse events associated with endoscopic resection and ablation) and ongoing surveillance should be discussed and documented,” the group said.
When patients opt for treatment, endoscopic eradication should proceed “with the goal of achieving complete eradication of intestinal metaplasia ... radiofrequency ablation should be used,” AGA said.
Meanwhile, “patients with LGD undergoing surveillance rather than endoscopic eradication therapy should undergo surveillance every 6 months times two, then annually unless there is reversion to nondysplastic Barrett’s esophagus. Biopsies should be obtained in 4-quadrants every 1-2 cm and of any visible lesions.”
AGA funded the work. Dr. Wani is a Medtronic and Boston Scientific consultant.
ACP on gout: Treat to symptoms, not to urate targets
New gout treatment guidelines support the use of urate-lowering therapy, but find no place for treating patients to achieve any specific serum urate target – a dichotomy that has some rheumatologists scratching their heads.
Created by the American College of Physicians, the gout diagnosis and treatment guideline doesn’t recommend monitoring physiologic response to urate-lowering therapy or treating to specific serum urate target (Ann Int Med. 2016 Nov 1. doi: 10.7326/M16-0570). Instead, it says patients should be treated according to their symptomatic response – a recommendation that flies in the face of accepted clinical practice.
“When we step back and ask the question, ‘Has a randomized, controlled trial looked at this approach?’ The answer is simply no. And we are not willing to take that leap of faith without data.”
Reliance on lower-grade clinical evidence is simply no longer a strong-enough basis for a clinical practice recommendation, Dr. McLean said in an interview. In 2011, the Institute of Medicine raised the bar for guidelines evidence in its report, “Finding What Works in Health Care: Standards for Systematic Reviews.”
That report explicitly states that a clinical guideline cannot be driven by low-grade evidence, including meta-analysis and expert opinion, Dr. McLean said. The Agency for Healthcare Research and Quality National Guideline Clearinghouse incorporated this into its 2013 revision of guidelines acceptance policy: A review must be based on the highest level of evidence – randomized, controlled studies – and not be driven by expert opinion or review articles. Additionally, the literature reviews upon which guidelines are based must be published in a peer-reviewed journal. Guidelines that don’t meet these criteria will no longer be accepted into the clearinghouse.
“The 2012 ACR guidelines didn’t meet that criteria,” he said. “The authors clearly point out in their methodology section where the evidence is weak and admit that 80% of it is low grade. How can you make a guideline that is 80% based on weak evidence? The ACP doesn’t allow us to do that.”
The argument about whether or not to treat to a specific urate target is not simply philosophical, said Dr. McLean, who authored an accompanying editorial (Ann Int Med. 2016 Nov 1. doi: 10.7326/M16-2401). In it, he argued that treating to a prespecified target would certainly help some patients but would probably hurt others.
“Treating to a target necessarily means increasing doses of medication in patients who may be asymptomatic,” he wrote. “Examples exist from other studies using intermediary biomarkers (such as elevated blood pressure or blood glucose level or low hemoglobin level), in which treating to a target resulted in more adverse effects than benefits. Thus, despite the strong biologic appeal of such a strategy and its advocacy by major specialty society guidelines, we judged the strength of evidence for monitoring to be low.”
“This paradigm also has not been formally tested in a randomized clinical trial, and there’s no scientific evidence to support that strategy and a lot of evidence to show its harm,” she said in an interview. “We have a large clinical experience about the ineffectiveness of that strategy. Patients eventually develop tophi, joint damage, and functional limitations when their physicians only treat their gout flares using anti-inflammatory therapy without addressing their underlying cause of gout – high uric acid. They are often dismayed and upset when they realize their physician had let their gout get to that point by just treating their gout flares.”
In other important ways, the two documents are complementary. Both put NSAIDs, corticosteroids, and colchicine at the heart of treating acute gout attacks.
According to the ACP guideline, these treatment strategies are all supported by high-level evidence, which was drawn from a review of 28 studies.
• Corticosteroids, NSAIDs, and colchicine are effective treatments to reduce pain in patients with acute gout.
• Lower doses of colchicine (1.2 mg, followed by 0.6 mg 1 hour later) are as effective as higher doses (1.2 mg, followed by 0.6 mg/hour for 6 hours) at reducing pain and are associated with fewer gastrointestinal adverse effects.
• Do not initiate long-term uric acid–lowering therapy in most patients after a first gout attack or in patients with infrequent attacks.
• Although evidence supports the benefits of using uric acid–lowering therapy for shorter durations to reduce gout flares, the benefits of long-term use in patients with a single or infrequent gout attacks have not been studied.
• Clinicians should discuss benefits, harms, costs, and individual preferences with patients before initiating uric acid–lowering therapy, including concomitant prophylaxis, in patients with recurrent gout attacks. (Grade: strong recommendation, moderate-quality evidence).
• Febuxostat (40 mg/day) and allopurinol (300 mg/day) are equally effective at decreasing serum urate levels, and prophylactic therapy with low-dose colchicine or low-dose NSAIDs reduces the risk for acute gout attacks in patients initiating urate-lowering therapy.
Allopurinol dosage, however, is one key point upon which the ACP and ACR guidelines are sharply divided. The ACR guideline calls for starting at low doses – 100 mg/day, and even lower in patients with kidney disease – with very slow upward titration, only if necessary, to 300 mg/day or more. Allopurinol is not without risk and should be used with caution, Dr. Neogi wrote in her commentary.
“Continuing a management strategy of starting allopurinol at an inappropriately high dose will perpetuate the problem of unnecessarily increasing flare risk, because this risk in the early treatment phase is directly proportional to the potency of the urate-lowering therapy used.”
However, allopurinol doses of 300 mg/day or less leave more than half of all patients undertreated, she said. This dilemma points up the difficulty with symptomatic treatment. Without checking urate levels, clinicians may be shooting blind when trying to dose appropriately.
She refuted any suggestion that the ACR guidelines were based on a lesser degree of evidence than the ACP document.
“The ACR uses a rigorous evidence-based method to develop treatment guidelines. It is inaccurate to say that ACR relies on lower-class evidence or expert opinion ‘to a large extent.’ In the absence of randomized controlled data, other peer-reviewed, available published data are used to formulate guidance, supported by the known biology.”
Current practices outlined in the ACR document are based on a thorough understanding of the biology of gout and how it progresses. Hard data on uric acid targets would greatly impact current therapeutic thinking. But in the meantime, there are patients to be treated, Dr. Neogi said.
“Of course, it would be ideal if we had randomized trial data to definitively provide insights, but we don’t have that right now. So does that mean that patients should suffer unnecessarily because we can’t use the remaining existing body of scientific knowledge to guide rational treatment decisions? What if funding agencies never fund such a study – should gout patients remain poorly managed? Should we abandon all scientific knowledge that isn’t randomized trial data and just not treat at all while waiting to see if a randomized trial will ever be funded and conducted?”
Dr. McLean sees the flip side of that coin.
“I think the effect of our guideline will be to help push the need for more explicit evidence in treat to target being the right way to go. But right now there is not enough evidence now to endorse that approach.”
Dr. McLean reports personal fees from Takeda Pharmaceuticals speakers’ bureau before 2015. Dr. Neogi had no financial disclosures.
Selected liver-transplant patients thrive off immunosuppression
MONTREAL – Three-fifths of pediatric liver-transplant recipients who were doing well enough to attempt weaning from their immunosuppression regimen succeeded in getting off immunosuppression and staying off for more than a year. In the process, they also significantly improved their health-related quality of life.
“Health-related quality of life domains associated with social interactions, worry, and medications improved” in pediatric liver recipients who had undergone immunosuppression withdrawal, Saeed Mohammad, MD, said at the World Congress of Pediatric Gastroenterology, Hepatology and Nutrition.
Patients who succeeded in staying off immunosuppressant drugs for at least 2 years after they first began ratcheting down their regimen showed better quality of life scores compared with their scores at baseline, and also compared with the scores of other pediatric liver transplant patients who unsuccessfully tried coming off immunosuppression.
Not every pediatric liver transplant patient should attempt withdrawing immunosuppression, cautioned Dr. Mohammad, a pediatric gastroenterologist at Northwestern University in Chicago. “To be successful withdrawal of immunosuppression needs to be in selected patients; not every patient is a good candidate.”
The Immunosuppression Withdrawal for Stable Pediatric Liver Transplant Recipients (iWITH) study ran at 11 U.S. center and one center in Toronto during October 2012 through June 2014. Pediatric liver transplant recipients were eligible to start a 9-10 month graduated withdrawal from their immunosuppression regimen if they met several criteria of stability including no rejection episode over at least the prior 12 months, normal laboratory-test results, no autoimmune disease and no problems detected in a liver biopsy. The prospective study enrolled 88 patients who averaged 10 years old. Patients underwent comprehensive examinations and laboratory testing at baseline and again several times during the subsequent 2 years including assessment of several quality of life measures.
During follow-up, 35 of the 88 patients (40%) developed symptoms of rejection and had to go back on immunosuppression. Most of these patients developed their rejection symptoms early during immunosuppression weaning, but a few patients failed later including one patient who failed 22 months after starting immunosuppression withdrawal, Dr. Mohammad said. Researchers from the iWITH study first reported these results at the American Transplant Congress in June 2016.
The quality of life findings reported by Dr. Mohammad came from assessments at baseline, after 12 months, and after 24 months, and included 30 of the patients who resumed immunosuppression and 48 patients who remained off immunosuppression for 2 years. All of these 78 patients had relatively robust quality of life profiles at baseline. Their scores for both physical and social subscales as well as for total score were significantly superior to the average scores for a large number of primarily U.S. pediatric liver transplant patients in the SPLIT database. Dr. Mohammad called the patients who attempted immunosuppression discontinuation as the “creme de la creme” of pediatric liver transplant patients in terms of their clinical status.
Analysis of scores after 2 years compared with baseline showed statistically significant improvements among patients who stayed off immunosuppression for the domains of social function, treatment attitudes and compliance, communication, and worry. A comparison of changes in quality of life scores from baseline to 2 years showed that patients who stayed off immunosuppression had improvements in several of their scores while patients who went back onto immunosuppression had on average a small deterioration of their scores.
Dr. Mohammad had no disclosures.
mzoler@frontlinemedcom.com
On Twitter @mitchelzoler
AT WCPGHAN 2016
Key clinical point: Selected pediatric liver-transplant patients who successfully weaned off immunosuppression responded with significantly improved quality of life scores.
Major finding: Patient and parent treatment satisfaction improved by 6-7 points when patients stopped immunosuppression and fell by 2-3 points when they did not.
Data source: iWISH, a multicenter study with 88 enrolled patients.
Disclosures: Dr. Mohammad had no disclosures.
Resorbable scaffold appears safe, effective in diabetes patients
An everolimus-eluting resorbable scaffold appeared to be safe and effective for percutaneous coronary intervention (PCI) in patients with diabetes and noncomplex coronary lesions, according to a study presented at the Transcatheter Cardiovascular Therapeutics annual meeting and published simultaneously in the Journal of the American College of Cardiology: Cardiovascular Interventions.
Patients with diabetes constitute an important and increasingly prevalent subgroup of PCI patients, who are at high risk of adverse clinical and angiographic outcomes such as MI, stent thrombosis, restenosis, and death. This is thought to be due to diabetic patients’ greater level of vascular inflammation and tendency toward a prothrombotic state and more complex angiographic features, said Dean J. Kereiakes, MD, of the Christ Hospital Heart and Vascular Center, Lindner Research Center, Cincinnati.
The substudy participants all received at least one resorbable scaffold in at least one target lesion. A total of 27.3% were insulin dependent and nearly 60% had HbA1c levels exceeding 7.0%. Notably, 18% of all the treated lesions in this analysis were less than 2.25 mm in diameter as assessed by quantitative coronary angiography, and approximately 60% had moderately to severely complex morphology.
The primary endpoint – the rate of target-lesion failure at 1-year follow-up – was 8.3%, which was well below the prespecified performance goal of 12.7%. This rate ranged from 4.4% to 10.9% across the different trials. A sensitivity analysis confirmed that the 1-year rate of target-lesion failure was significantly lower than the prespecified performance goal.
The rates of target-lesion failure, target-vessel MI, ischemia-driven target-lesion revascularization, and scaffold thrombosis were significantly higher in diabetic patients who required insulin than in those who did not. Older patient age, insulin dependency, and small target-vessel diameter all were independent predictors of target-lesion failure at 1 year.
The overall 1-year rate of scaffold thrombosis in this study was 2.3%, which is not surprising given the study population’s risk factors. For diabetic patients with appropriately sized vessels of greater than 2.25 mm diameter, the scaffold thrombosis rate was lower (1.3%).
In addition to being underpowered to assess rare adverse events, this study was limited in that it reported outcomes at 1 year, before resorption of the device was complete. It also reflects the first-time clinical experience with a resorbable scaffold for most of the participating investigators, “and one would expect that as with all new medical procedures, results will improve over time with increased operator experience,” the coauthors wrote.
Dr. Kereiakes reported being a consultant to Abbott Vascular, and his associates also reported ties to the company and to other industry sources.
Key clinical point:
Major finding: The primary endpoint – the rate of target-lesion failure at 1 year follow-up – was 8.3%, which was well below the prespecified performance goal of 12.7%.
Data source: A prespecified formal substudy of 754 patients with diabetes who participated in three clinical trials and one device registry, assessing 1-year outcomes after PCI.
Disclosures: This pooled analysis, plus all the contributing trials and the device registry, were funded by Abbott Vascular, maker of the resorbable scaffold. Dr. Kereiakes reported being a consultant to Abbott Vascular, and his associates also reported ties to the company and to other industry sources.
Intravitreal sirolimus proves effective in reducing noninfectious uveitis inflammation
Intravitreal sirolimus 440 mcg or 880 mcg administered on days 1, 60, and 120, was shown to significantly improve ocular inflammation with preservation of best-corrected visual acuity in patients with noninfectious uveitis of the posterior segment, a phase III study has shown.
In the multinational SAKURA (Study Assessing Double-masked Uveitis Treatment) study, 346 study eyes were analyzed in this randomly assigned, double-masked, actively controlled study. In the study arm given intravitreal sirolimus 440 mcg, 22.8% (P = .025) met the primary endpoint of no vitreous haze (VH) at month 5 in the study eye without the aid of rescue therapy. In the group given intravitreal sirolimus 880 mcg, 16.4% (P = .182) met the primary endpoint, compared with 10.3% of active controls who were given 44 mcg intravitreal sirolimus.
For the secondary outcome, 52.6% (P = .008) of the intravitreal sirolimus 440 mcg arm had VH scores of 0 or a 0.5+ response rate at month 5. In the intravitreal sirolimus 880 mcg, 43.1% (P = .228) achieved a VH score of 0 or a 0.5+ response rate, compared with 35% of the 44 mcg active control group. Mean best-corrected visual acuity was maintained throughout the study in each study arm, with 76.9% of those who received corticosteroids at baseline in the 440 mcg study arm successfully tapering them to 5 mg per day or less by month 5, and 66.7% of those receiving corticosteroids in the 880 mcg group doing so. This was in comparison with 63.6% of those using corticosteroids in the active control group. Adverse events were similar across the study, and all doses were well tolerated. The study was funded by Santen.
Read the full study in Ophthalmology (2016;23[11]:2413-23).
Amyloid PET scans may have clinical utility in patients with cognitive impairment
Amyloid PET scans can affect diagnostic thinking and patient management when used alongside routine diagnostic work up in adults suspected of having Alzheimer’s disease, results from the multicenter, open-label Assessment of the Incremental Diagnostic Value of Florbetapir 18F Imaging in Patients with Cognitive Impairment (INDIA-FBP) study reveal.
The investigators, led by Marina Boccardi, PhD, of the LANVIE-Laboratory of Neuroimaging of Aging at the University of Geneva, conducted the study to provide evidence of whether amyloid PET imaging has diagnostic utility in patients suspected of having Alzheimer’s disease because amyloid PET scanning in its current state has debatable clinical value because of a lack of disease-modifying drugs available to treat Alzheimer’s and the expense of the scans.
The trial was published in this week’s edition of JAMA Neurology and Dr. Boccardi and her colleagues found that amyloid PET scans in 228 cognitively impaired Italian adults improved diagnostic confidence and led to a change in diagnosis in 28% of patients whose prescan diagnosis was Alzheimer’s disease and in 25% (P = .02) of patients who had a non–Alzheimer’s disease–related dementia diagnosis. A positive scan resulted in a change in diagnosis to Alzheimer’s disease 72% of the time in patients with a prescan diagnosis of frontotemporal lobar degeneration (FTLD). Cognition-specific medications were initiated in 66% of previously untreated patients and were withdrawn in 33% of previously treated patients, results from the study showed (JAMA Neurol. 2016 Oct 31. doi: 10.1001/jamaneurol.2016.3751).
The scans’ ability to provide additional information to change a diagnosis justifies their use, especially when considering “reports of adverse events in patients with FTLD treated with cholinesterase inhibitors and of ineffectiveness for cognitive impairment of vascular etiology,” the investigators wrote.
The use of amyloid PET scans to change a diagnosis to Alzheimer’s disease or confirm its diagnosis also allowed for earlier detection and intervention, gave patients an opportunity to be included in clinical trials, and allowed patients to make residential and financial arrangements at a time when they were still able to express their preference.
Anticipated results from the Imaging Dementia—Evidence for Amyloid Scanning (IDEAS) and Amyloid Imaging to Prevent Alzheimer’s Disease (AMYPAD) studies will expand on the current observations on a larger scale as well as help to quantify the cost-effectiveness of amyloid PET in clinical routine practice, they said.
In the current study, a prescan diagnosis was made by clinicians who, at the time of the work-up, estimated diagnostic confidence and provided drug treatment. At the same time, an amyloid PET/CT scan was performed and the result was communicated to the clinicians upon work-up completion. Clinicians relied on the scan results for their final clinical diagnoses and identification of the most-appropriate treatment.
Amyloid PET scans are currently not reimbursed by the Centers for Medicare & Medicaid Services outside of their use in clinical trials.
This study was sponsored by Istituto di Ricovero e Cura a Carattere Scientifico Centro San Giovanni di Dio Fatebenefratelli in Brescia, Italy, and Avid Radiopharmaceuticals. Several of the authors reported serving on the scientific advisory boards of pharmaceutical companies.
While amyloid PET scans have a clear role in research and in the right clinical setting they can support a suspected diagnosis of Alzheimer’s disease or help a clinician to choose between Alzheimer’s and a non-Alzheimer’s condition, their use can have pitfalls even at a diagnostically simplified level.

There are at least four patient populations in whom amyloid PET scans could potentially have clinical utility, but these are not addressed in the current debate over their use or in this study: patients with early-onset dementia, patients with normal pressure hydrocephalus, patients with rapidly progressive dementia in which the differential diagnosis includes some reversible conditions that may require a diagnostic brain biopsy, and rare patients with cerebral amyloid angiopathy who develop tumorlike accumulations that necessitate a brain biopsy for diagnosis.
Richard J. Caselli, MD, and Bryan K. Woodruff, MD, are with the department of neurology at the Mayo Clinic Arizona, Scottsdale. Their comments are derived from an editorial accompanying Dr. Boccardi and colleagues’ report (JAMA Neurol. 2016 Oct 31. doi: 10.1001/jamaneurol.2016.3792). Dr. Caselli reported receiving research funding from Merck, and Dr. Woodruff reported receiving research funding from Genentech and Avid Pharmaceuticals.
While amyloid PET scans have a clear role in research and in the right clinical setting they can support a suspected diagnosis of Alzheimer’s disease or help a clinician to choose between Alzheimer’s and a non-Alzheimer’s condition, their use can have pitfalls even at a diagnostically simplified level.
There are at least four patient populations in whom amyloid PET scans could potentially have clinical utility, but these are not addressed in the current debate over their use or in this study: patients with early-onset dementia, patients with normal pressure hydrocephalus, patients with rapidly progressive dementia in which the differential diagnosis includes some reversible conditions that may require a diagnostic brain biopsy, and rare patients with cerebral amyloid angiopathy who develop tumorlike accumulations that necessitate a brain biopsy for diagnosis.
Richard J. Caselli, MD, and Bryan K. Woodruff, MD, are with the department of neurology at the Mayo Clinic Arizona, Scottsdale. Their comments are derived from an editorial accompanying Dr. Boccardi and colleagues’ report (JAMA Neurol. 2016 Oct 31. doi: 10.1001/jamaneurol.2016.3792). Dr. Caselli reported receiving research funding from Merck, and Dr. Woodruff reported receiving research funding from Genentech and Avid Pharmaceuticals.
Amyloid PET scans can affect diagnostic thinking and patient management when used alongside routine diagnostic work up in adults suspected of having Alzheimer’s disease, results from the multicenter, open-label Assessment of the Incremental Diagnostic Value of Florbetapir 18F Imaging in Patients with Cognitive Impairment (INDIA-FBP) study reveal.
The investigators, led by Marina Boccardi, PhD, of the LANVIE-Laboratory of Neuroimaging of Aging at the University of Geneva, conducted the study to provide evidence of whether amyloid PET imaging has diagnostic utility in patients suspected of having Alzheimer’s disease because amyloid PET scanning in its current state has debatable clinical value because of a lack of disease-modifying drugs available to treat Alzheimer’s and the expense of the scans.
The trial was published in this week’s edition of JAMA Neurology and Dr. Boccardi and her colleagues found that amyloid PET scans in 228 cognitively impaired Italian adults improved diagnostic confidence and led to a change in diagnosis in 28% of patients whose prescan diagnosis was Alzheimer’s disease and in 25% (P = .02) of patients who had a non–Alzheimer’s disease–related dementia diagnosis. A positive scan resulted in a change in diagnosis to Alzheimer’s disease 72% of the time in patients with a prescan diagnosis of frontotemporal lobar degeneration (FTLD). Cognition-specific medications were initiated in 66% of previously untreated patients and were withdrawn in 33% of previously treated patients, results from the study showed (JAMA Neurol. 2016 Oct 31. doi: 10.1001/jamaneurol.2016.3751).
The scans’ ability to provide additional information to change a diagnosis justifies their use, especially when considering “reports of adverse events in patients with FTLD treated with cholinesterase inhibitors and of ineffectiveness for cognitive impairment of vascular etiology,” the investigators wrote.
The use of amyloid PET scans to change a diagnosis to Alzheimer’s disease or confirm its diagnosis also allowed for earlier detection and intervention, gave patients an opportunity to be included in clinical trials, and allowed patients to make residential and financial arrangements at a time when they were still able to express their preference.
Anticipated results from the Imaging Dementia—Evidence for Amyloid Scanning (IDEAS) and Amyloid Imaging to Prevent Alzheimer’s Disease (AMYPAD) studies will expand on the current observations on a larger scale as well as help to quantify the cost-effectiveness of amyloid PET in clinical routine practice, they said.
In the current study, a prescan diagnosis was made by clinicians who, at the time of the work-up, estimated diagnostic confidence and provided drug treatment. At the same time, an amyloid PET/CT scan was performed and the result was communicated to the clinicians upon work-up completion. Clinicians relied on the scan results for their final clinical diagnoses and identification of the most-appropriate treatment.
Amyloid PET scans are currently not reimbursed by the Centers for Medicare & Medicaid Services outside of their use in clinical trials.
This study was sponsored by Istituto di Ricovero e Cura a Carattere Scientifico Centro San Giovanni di Dio Fatebenefratelli in Brescia, Italy, and Avid Radiopharmaceuticals. Several of the authors reported serving on the scientific advisory boards of pharmaceutical companies.
Key clinical point:
Main finding: Amyloid PET scans led to a change in diagnosis in 28% of patients whose prescan diagnosis was Alzheimer’s disease (AD) and in 25% of patients who had a non–AD related dementia diagnosis.
Source: Multicenter, open-label study of the incremental diagnostic value of Florbetapir 18F imaging in 228 adult patients with cognitive impairment.
Disclosures: This study was sponsored by Istituto di Ricovero e Cura a Carattere Scientifico (IRCCS) Centro San Giovanni di Dio Fatebenefratelli in Brescia, Italy, and Avid Radiopharmaceuticals. Several of the authors reported serving on the scientific advisory boards of pharmaceutical companies.