User login
An Enhanced Recovery Program for Elective Spinal Surgery Patients
From Musgrove Park Hospital, Taunton, England.
Abstract
- Objective: To describe a redesign of the clinical pathway for patients undergoing elective spinal surgery in order to improve quality of care and reduce length of stay.
- Methods: A multidisciplinary team undertook a process-mapping exercise and shadowed patients to analyse problems with the existing clinical pathway. Further ideas were taken from best evidence and other published enhanced recovery programs. Change ideas were tested using Plan-Do-Study-Act cycles. Measures included length of hospital stay, compliance with the pathway, and patient satisfaction.
- Results: The new pathway, the SpinaL Enhanced Recovery Program, is now used by 99% of elective spinal surgery patients with 100% of patients rating their care as good or excellent. Length of stay was reduced by 52%, improving from 5.7 days at the start of the intervention to 2.7 days. The pathway improved reliability of care, with preoperative carbohydrate drinks used in 83% of patients.
- Conclusion: The pathway improved reliability of care in our institution with excellent patient satisfaction and a significant reduction in length of hospital stay.
Enhanced recovery programs (ERPs) have been developed in many surgical specialties to improve patient outcomes and recovery after elective surgery. They involve multiple interventions throughout the patient journey, from preoperative patient education to postoperative mobilization and analgesia schedules. A meta-analysis of 38 trials involving 5099 participants showed ERPs could reduce length of stay and overall complication rates across surgical specialties [1].
There have been few studies of ERP for spinal surgery populations [2]. Most of them have studied selected patients or selected interventions such as analgesia schedules and did not use quality improvement methodology. For example, a small retrospective study compared patients undergoing multilevel spinal fusion surgery before and after introduction of a multimodal analgesia regimen [3]. A review of innovative perioperative and intraoperative treatment algorithms showed that they can influence postoperative recovery and patient outcomes from lumbar spinal surgery [4]. A study from the same group found that patient education and a “fast-track” pathway reduced length of hospital stay and improved patient satisfaction for patients undergoing 1- or 2- level lumbar spinal fusion [5].
At our hospital, a meeting of the clinicians and staff involved in elective spinal surgery was held to discuss the service. Leadership came from a consultant anesthesiologist and a consultant spinal surgeon, who recognized that care was not as efficient as it could be. A multidisciplinary team was formed consisting of 30 members, including surgeons, clinical nurse practitioners, physiotherapists, occupational therapists, and secretarial staff. The team undertook a process-mapping exercise that revealed that patients followed an ill-defined care pathway with variability in administrative processes and clinical care. Patient feedback and reports from both secretarial and community staff revealed that communications from the spinal team could be inconsistent, and patients had unclear expectations of their care and recovery. Lengths of stay for the same procedure could vary by 3 days.
With support from the hospital’s chief executive and medical director, the team embarked on a process to redesign the clinical pathway for patients undergoing elective spinal surgery at our hospital. We developed the SpinaL Enhanced Recovery Program; our primary aims were to to have 95% of patients managed according to the new pathway, to reduce length of stay by 30% without a rise in readmission rates, and to improve patient satisfaction.
Methods
Ethical Issues
This work met criteria for operational improvement activities and as such was exempt from ethics review. The team engaged patients who had undergone spinal surgery to serve as representatives to ensure that the improvements studied were important to them.
Setting and Patients
Our institution is a District General Hospital that serves a population of over 340,000 and has 3 consultant spinal surgeons. They work with 5 anesthesiologists on a regular basis and the patients are cared for by 3 clinical nurse practitioners. The patients are cared for on an elective orthopedic ward with nursing staff, physiotherapists, and occupational therapists who work regularly with spinal surgery patients. The mean age of our spinal surgery patients is 55 years and 55% are female. By age-group, 6.6% are aged 1–16 years, 50.8% aged 17–65 years, and 42.6% over 65 years. We define elective spinal surgery as non-emergency surgery, including discectomy, decompression, fusion and realignment operations to the cervical, thoracic and lumbar spine.
Developing the Pathway
To develop the new pathway, input from the expert team of anesthesiologists and surgeons, other clinicians and staff, as well as patients were sought. Four patients were approached prior to surgery and asked for their thoughts on the existing clinical pathway. They were then shadowed during their journey by clinical staff to see where improvements to their clinical care could be made.
In addition to gathering input from staff and patients, we reviewed the literature for the best available evidence. We found a Cochrane review of 27 trials involving 1976 surgical patients that concluded that preoperative carbohydrate drinks reduced length of stay [6]. Similarly, although laxatives have not been shown to improve length of stay [7], it is known that constipation is exacerbated by opioid analgesia and causes distress [8].
Finally, we examined the ERPs for patients undergoing hip and knee replacement that already existed in our institution. We found they used standardized anesthetic regimens as well as “patient passports,” leaflets given to give patients telling them what to expect during and following joint replacement surgery. They were also implementing methods to help patients set daily aims on the ward.
PDSA Cycles
We began PDSA testing in November 2013. Below we describe selected pathway changes that we expected to be challenging because they involved many staff from different groups. Interventions that involved fewer people or a smaller group (eg, a change in anesthetic regimen or surgical technique) were easier to implement.

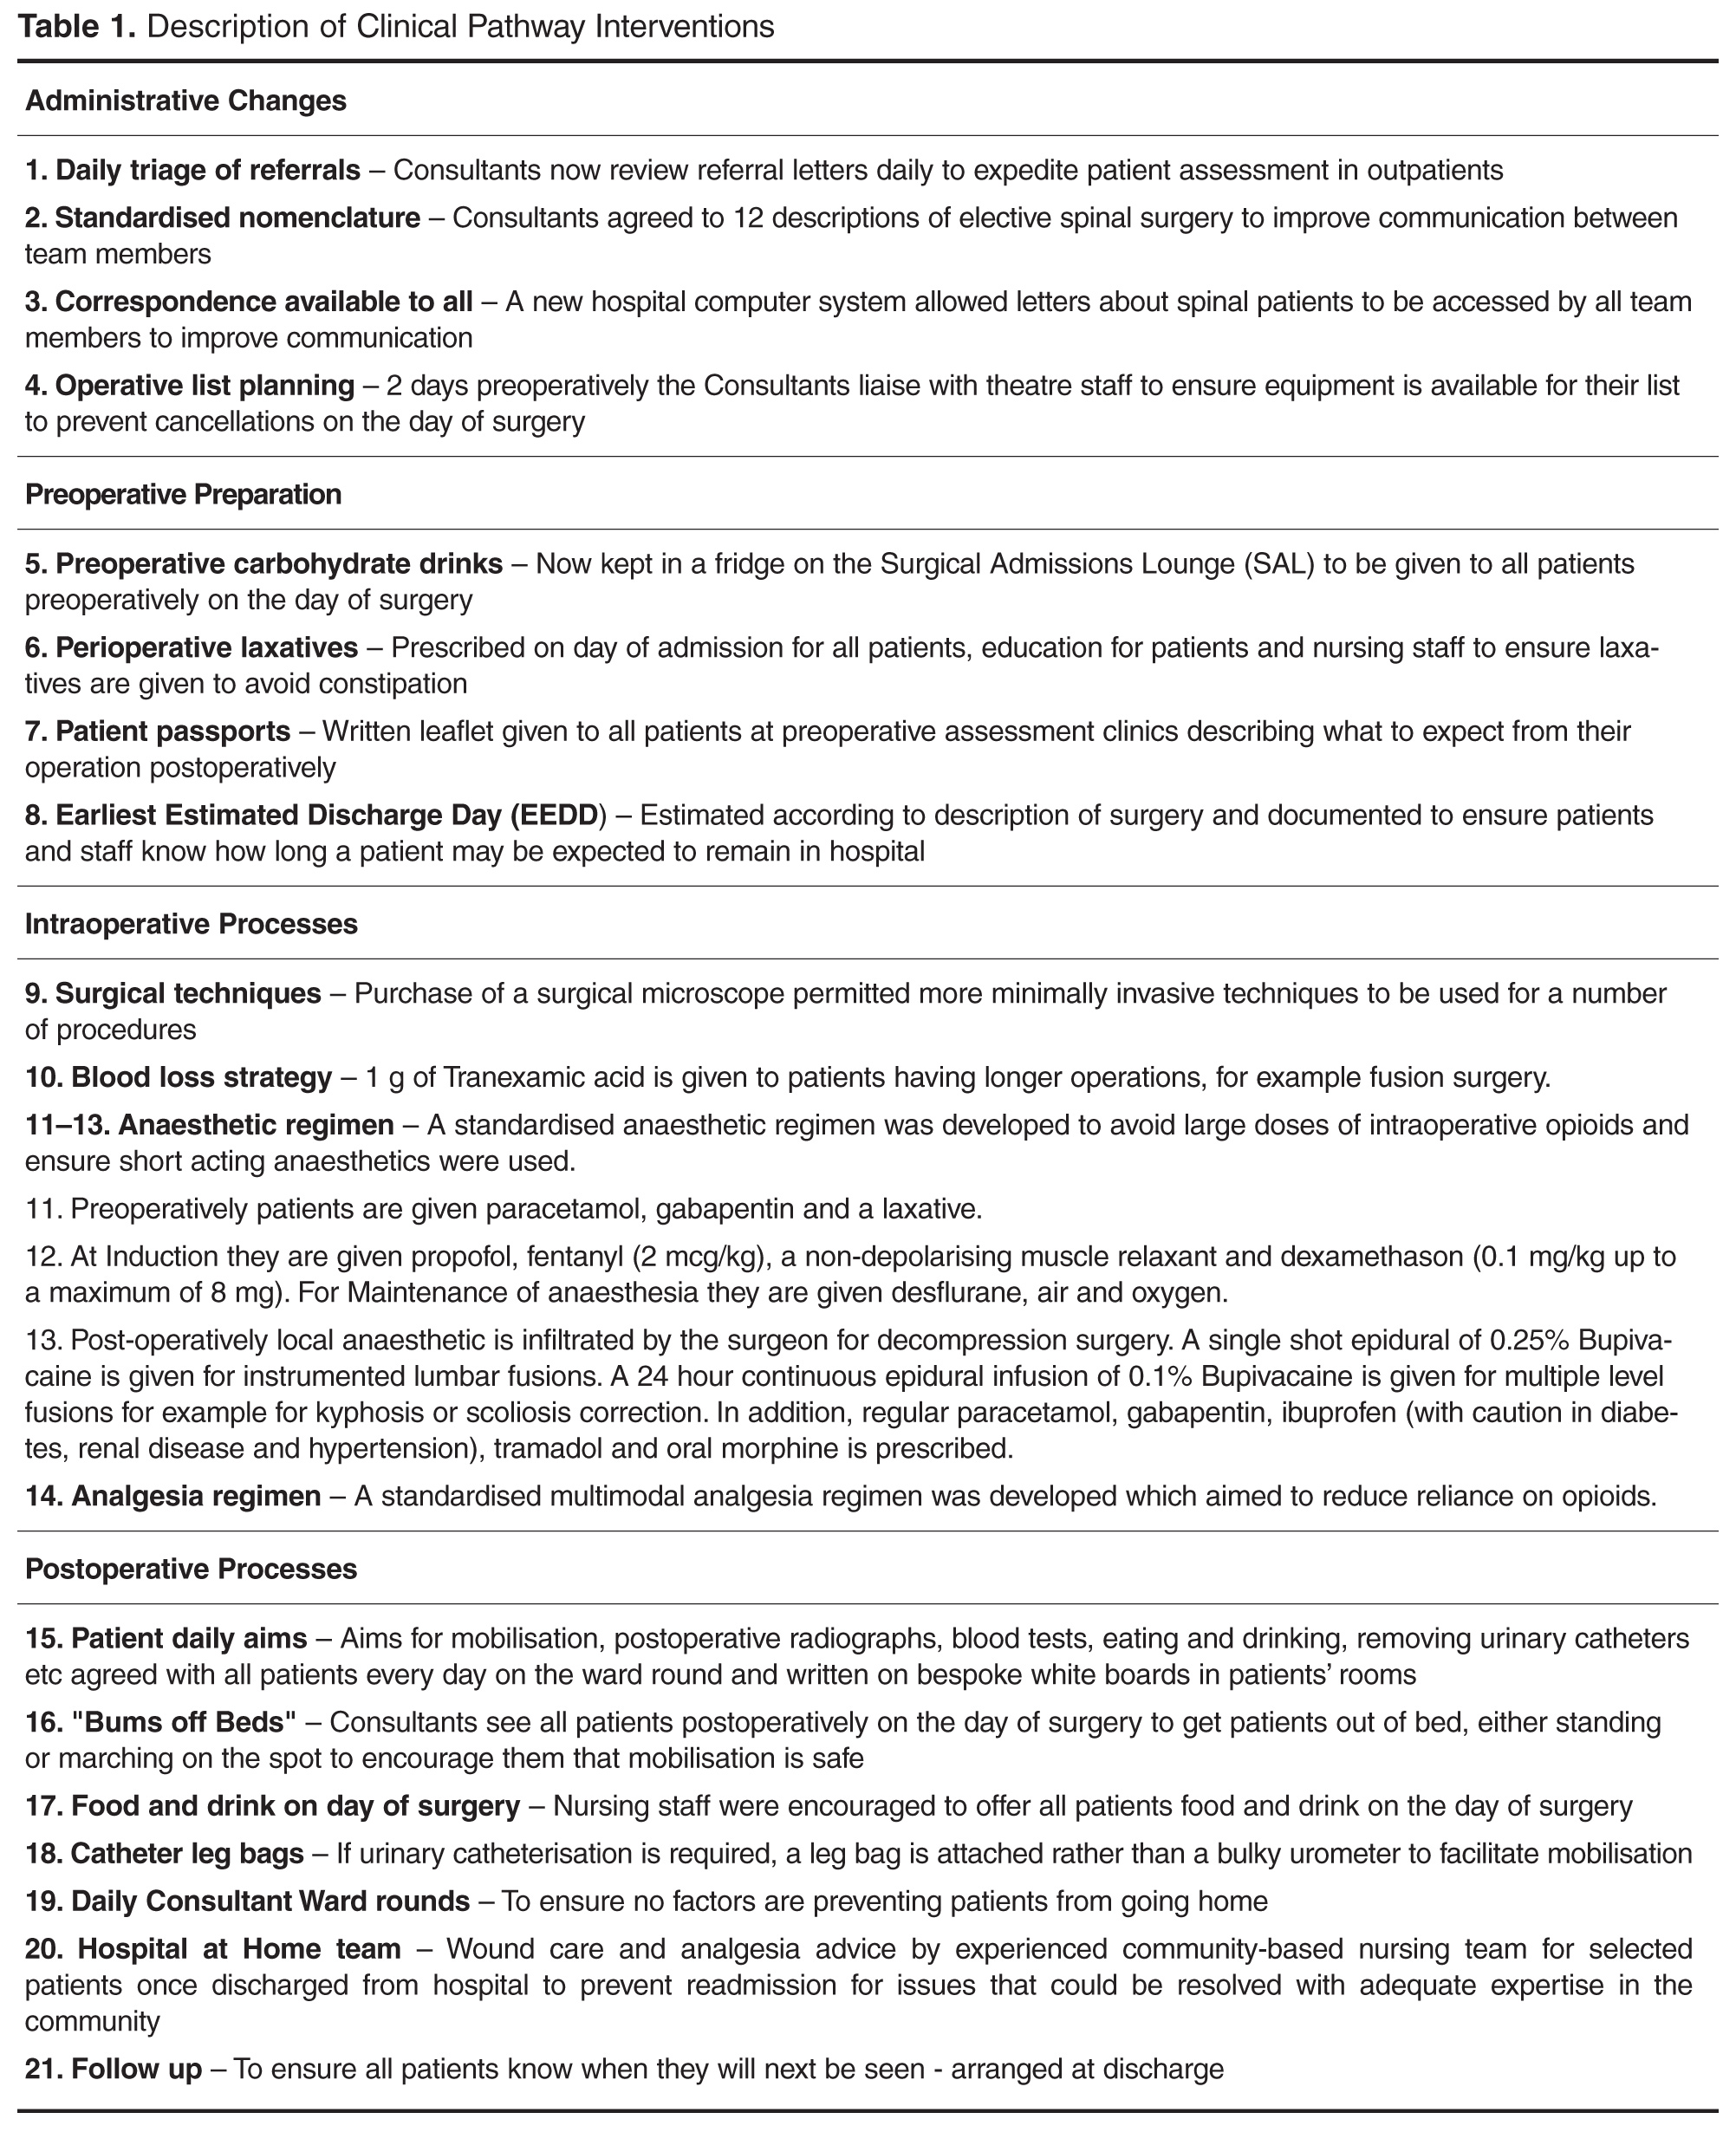
Standardizing Nomenclature
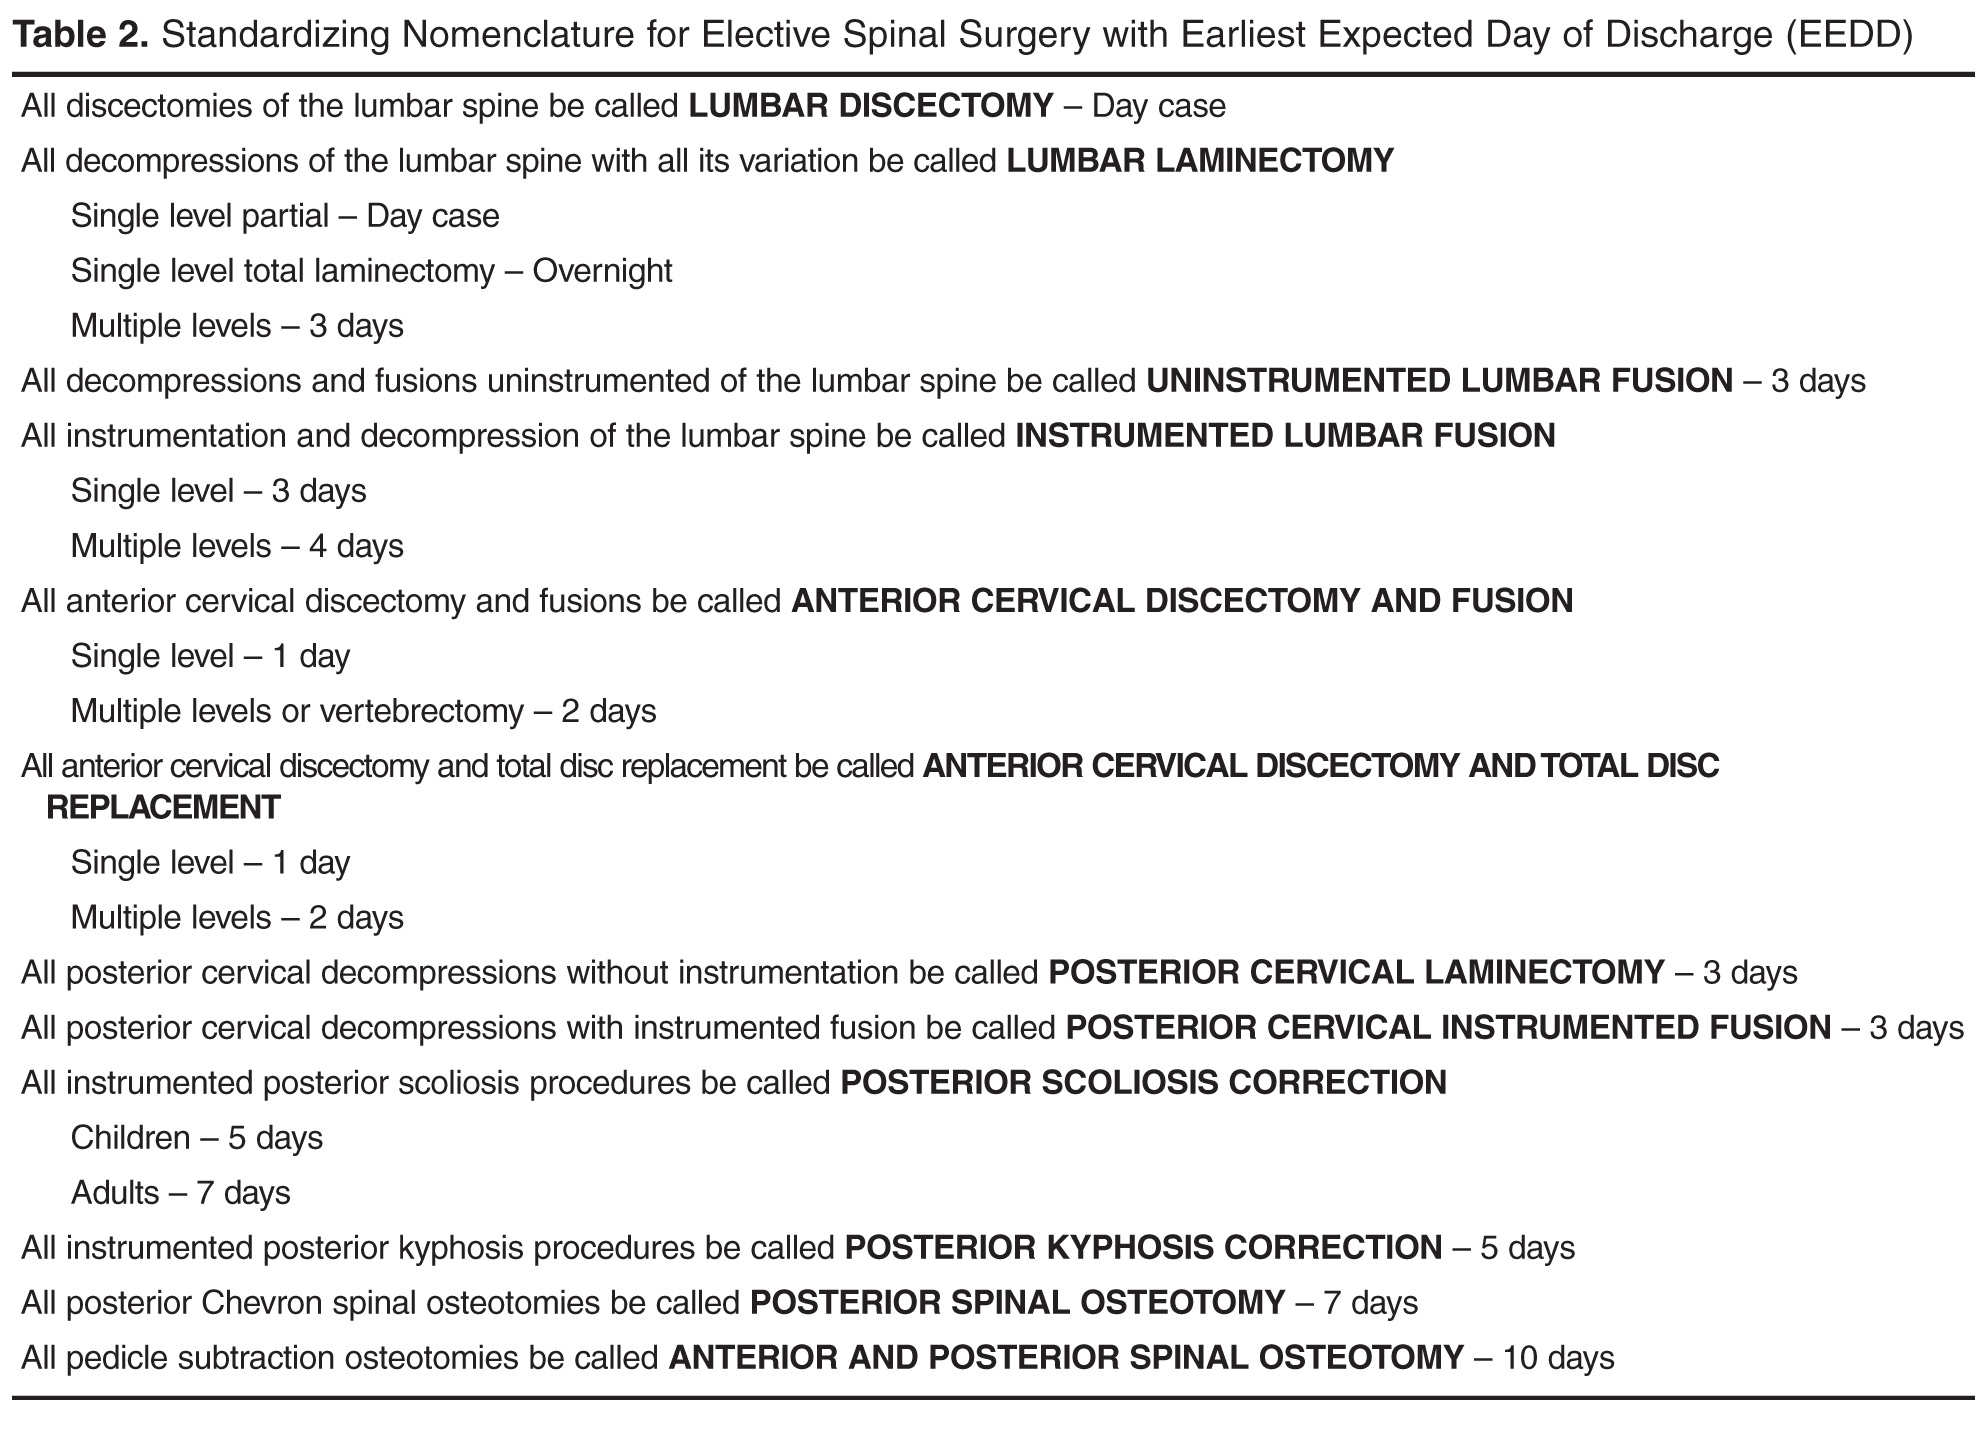
The spinal consultants agreed to 12 descriptions of elective spinal surgery to improve communication between team members (Table 2). They were able to reduce the number of procedure descriptions from 135 to just 12. Theatre staff could determine from the procedure descriptions which equipment was required for the operation and ensure it was available at the time needed. Anesthetic staff felt better able to prepare for their operating lists with a prescription for preoperative, intraoperative, and postoperative analgesia.
They also defined an earliest expected day of discharge (EEDD) (Table 2), which was distributed to all members of the team. This information helped ward nurses and therapists were better able to plan to mobilize patients appropriately postoperatively and ensure consistency in communication of expected length of stay to patients.
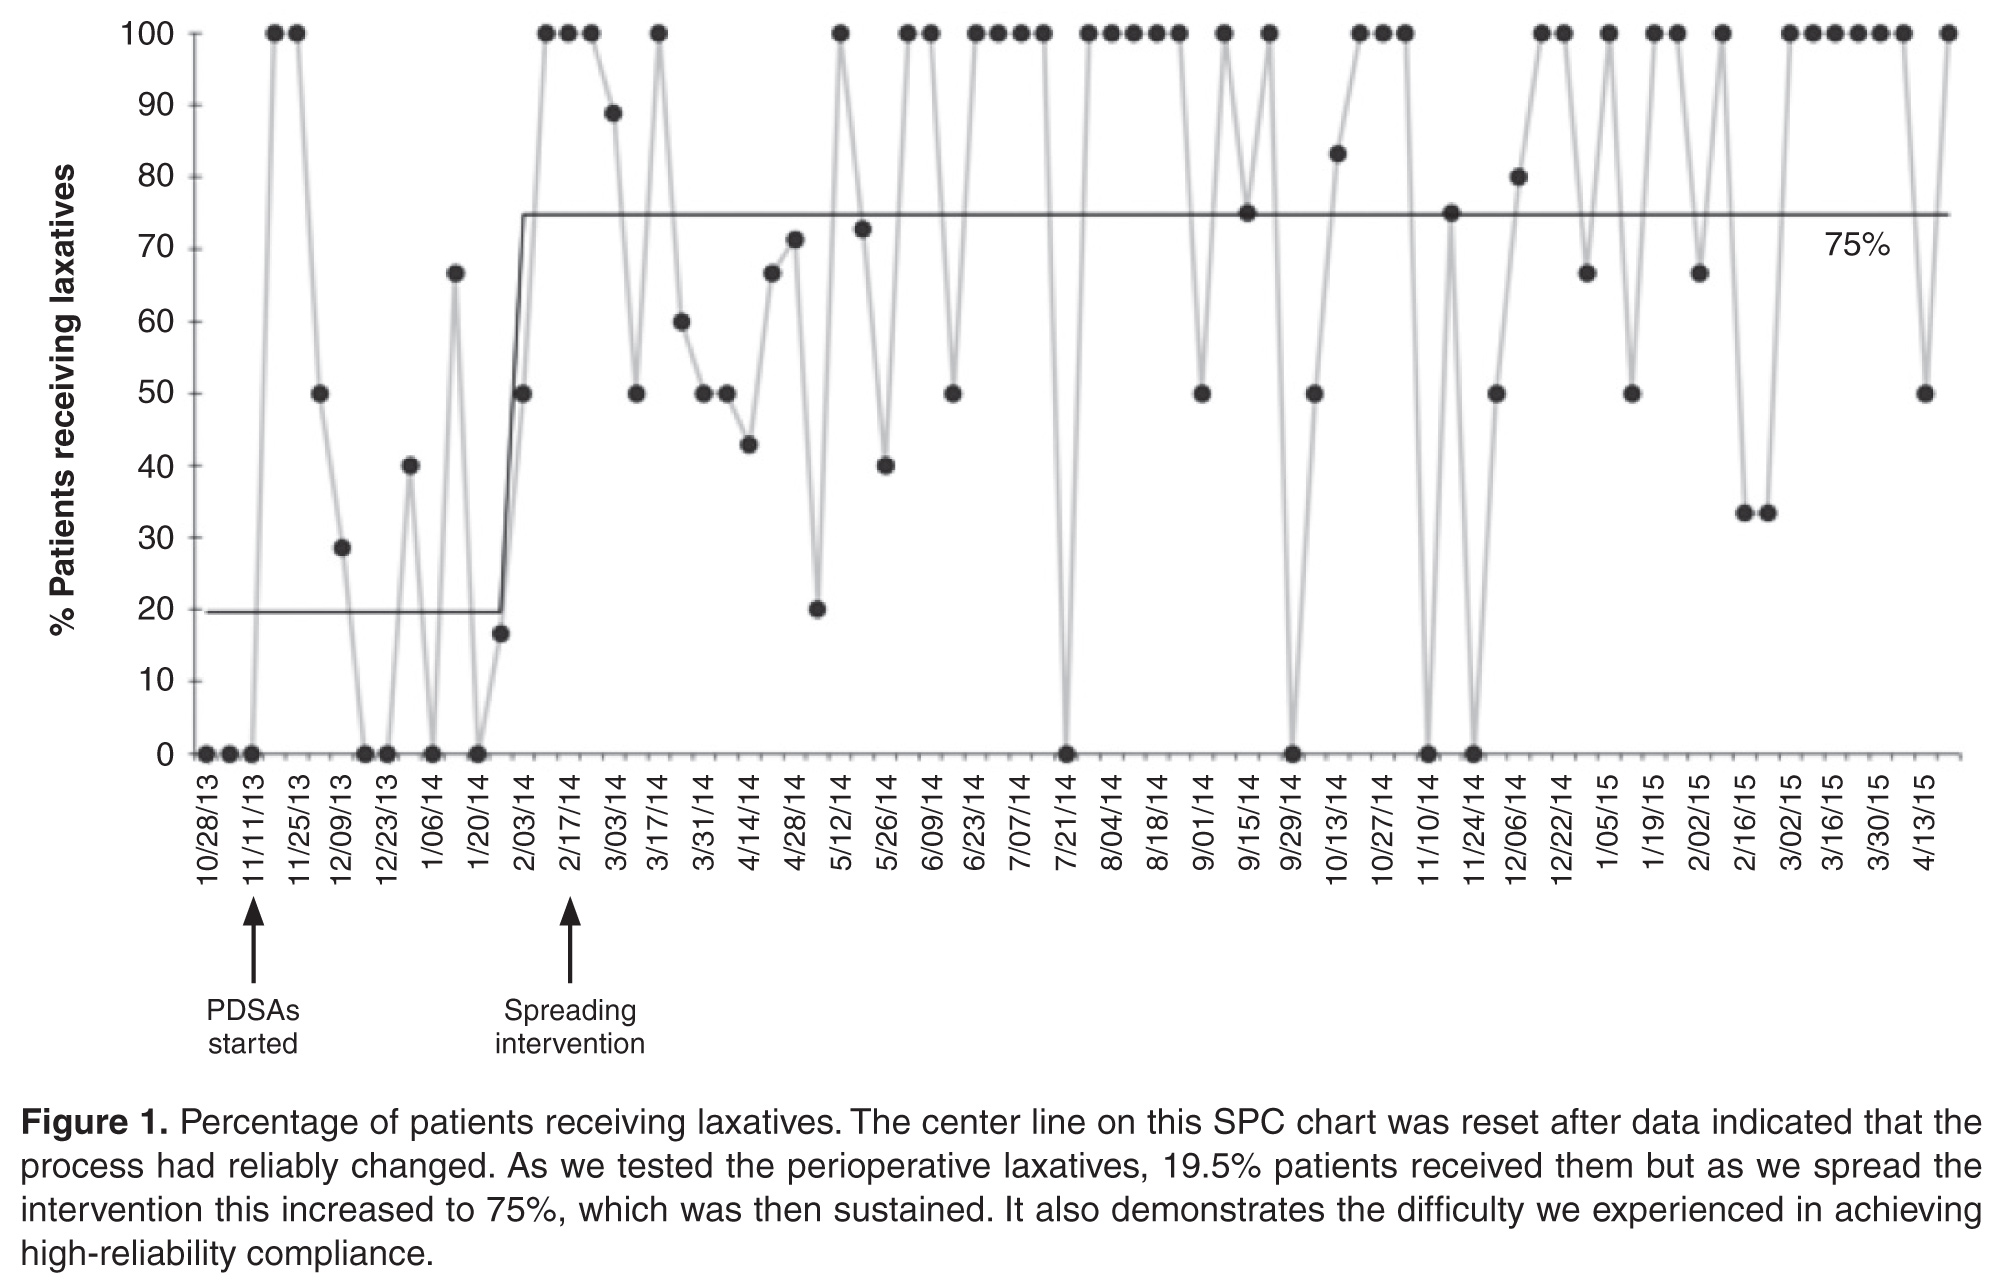
Perioperative Laxatives
Laxatives were prescribed initially for one patient and we checked to see if the patient and nursing staff were happy with the change. In the next test cycle all patients on one consultant’s list were prescribed laxatives. To track laxative use, a data collection sheet was attached to the patient's medical records on admission. With improved data collection, laxatives were then prescribed on admission for all elective spinal patients. The process has now become routine, occurring even when key change agents are absent.
Preoperative Carbohydrate Drinks
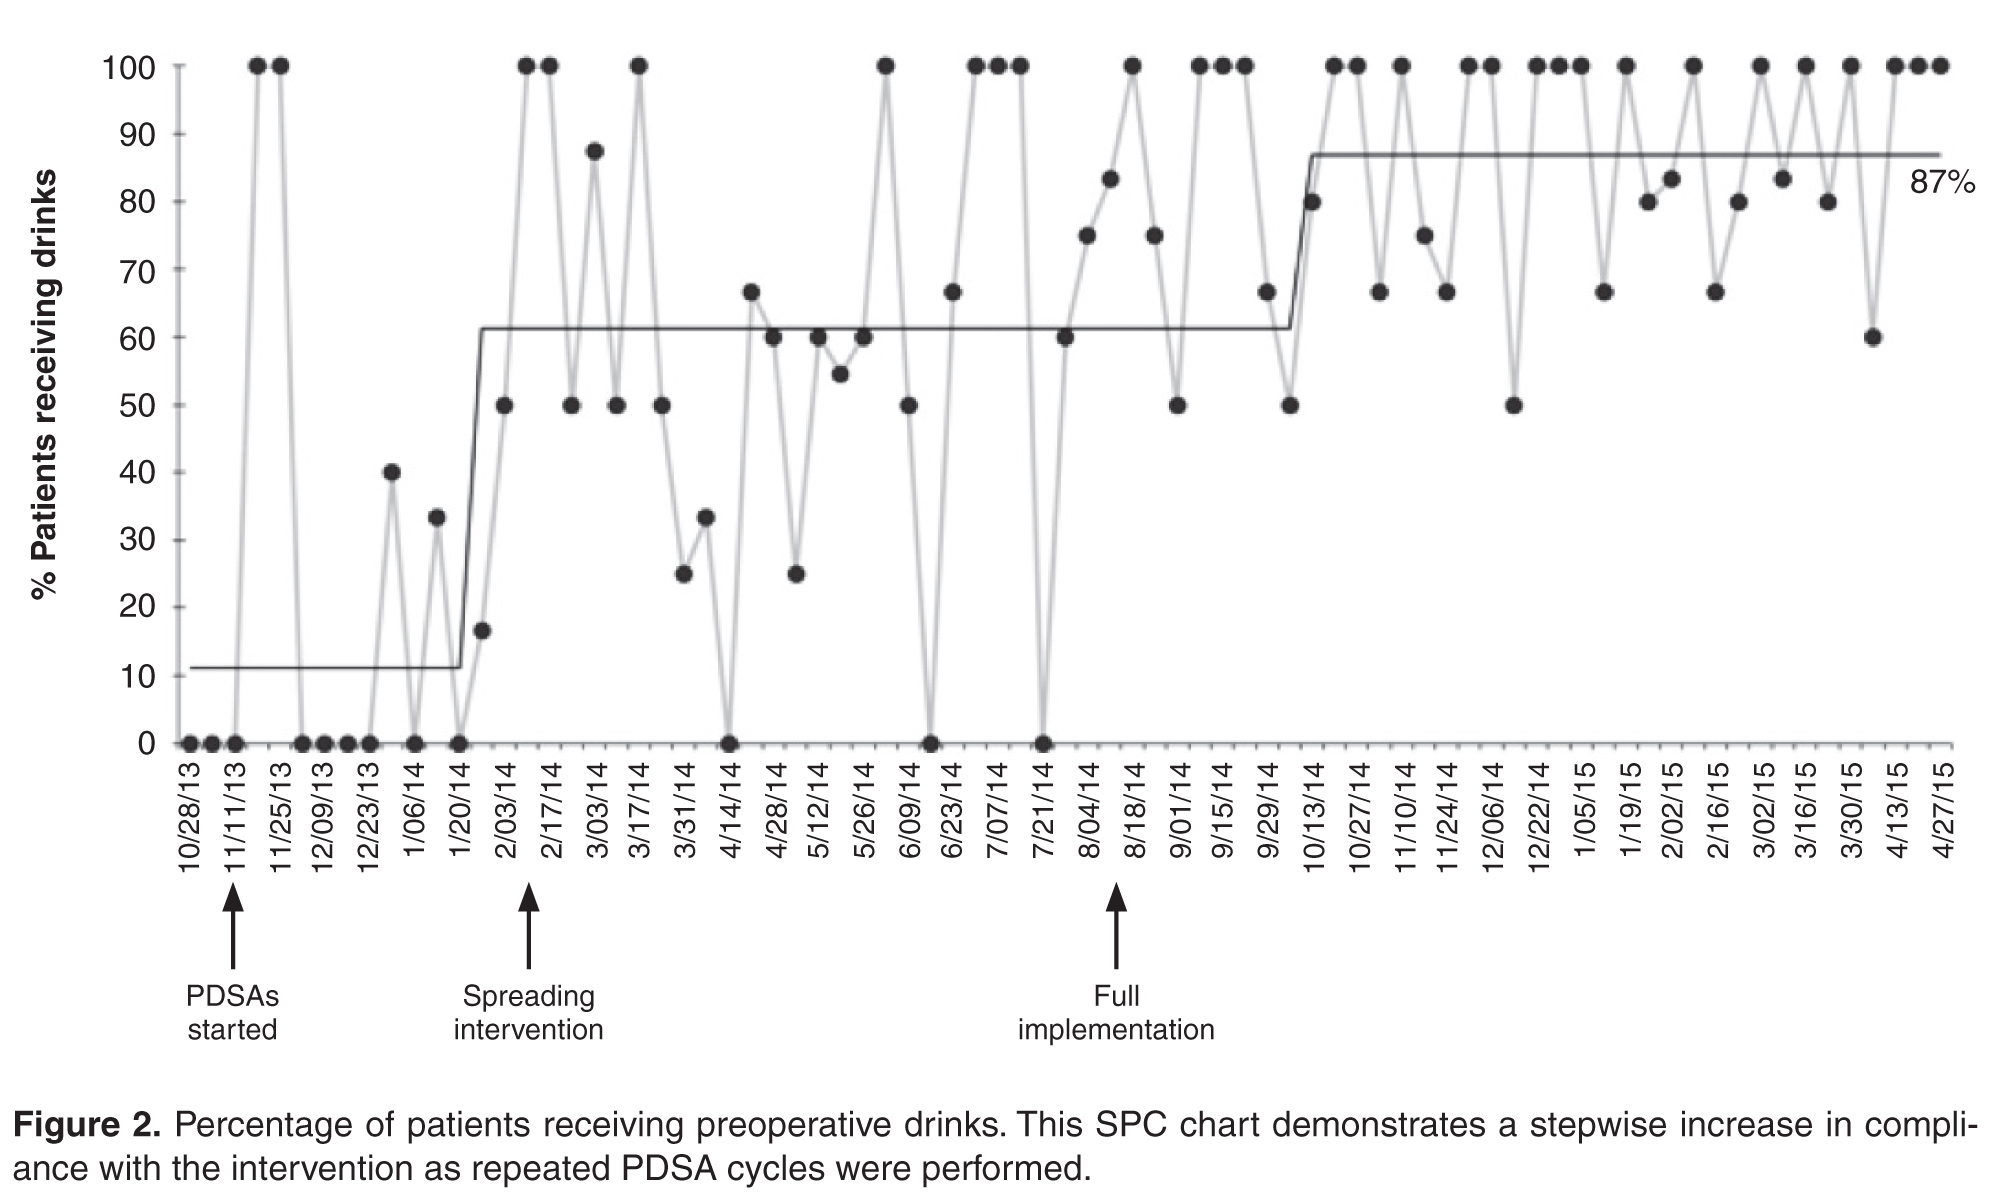
Preoperative high-calorie drinks were initially prescribed for one surgeon’s patients who were predicted to be staying 2 or more nights in the hospital. The preoperative assessment clinic (POAC) staff were asked to give these patients preoperative carbohydrate drinks at their pre-assessment clinic, and patients would self-administer their carbohydrate drinks preoperatively. However, POAC staff found it too difficult to give drinks to some patients and not to others, so it was decided that all patients should receive a drink. The clinical nurse practitioners note that the drink is given on the data collection sheet. However, it was observed that when team champions did not remind staff to administer the preoperative carbohydrate drinks, they were not given. We then asked the surgical admissions lounge staff if they would give preoperative carbohydrate drinks to patients and they agreed. This worked better than using POAC staff.
Patient Daily Aims
Members of the team felt that setting daily aims with patients would help optimize and prepare them for discharge. A laminated sheet with handwritten aims was trialed with 1 patient. He found it very useful, particularly the aims on diet and mobilization. When tested on all patients for a week, not only did they find it useful but nursing staff felt it improved communication between shifts. With greater staff buy-in and a move into a new purpose-built ward, we used white boards that were affixed to the door to the ensuite bathroom in each single patient room. Aims were discussed on ward rounds with patients by consultants or clinical nurse practitioners, and the goals agreed upon with patients before being written on the white boards. They included goals such as removal of urinary catheters, mobilization independently or with staff, and requirements such as radiographs to check position of instrumentation. Spot-checks on the ward showed good compliance with setting daily aims and high rates of satisfaction from patients.
Hospital at Home
The Hospital at Home team consists of experienced community-based nurses who provide wound care and analgesia advice for selected patients postdischarge to prevent readmission. This team supported early discharge for patients undergoing hip and knee replacements, and when approached they felt they could offer wound care and analgesia advice in the community for spinal surgery patients. This was tested with one patient with a wound who had daily care at home for 8 days following discharge from hospital. A further 2 patients were later cared for by the Hospital at Home team, with a total of 7 bed days saved. It has now become routine for the team to accept spinal patients when they have the capacity.
Outcomes
Working with the IT department and data collection tools attached to the medical records, we collected data on key measures every 2 weeks. Statistical process control charts (Process Improvement Products, Austin, TX) [9,10] were used to analyze the data.
Length of stay was reduced by 52% (Figure 4), improving from an average of 6 days during the baseline period to 2.9 days by April 2015. Readmissions for elective spinal surgery patients did not increase and in fact were reduced from 7% to 3%.
By October 2014, 99% of eligible patients were managed on the new pathway and most patients were receiving key 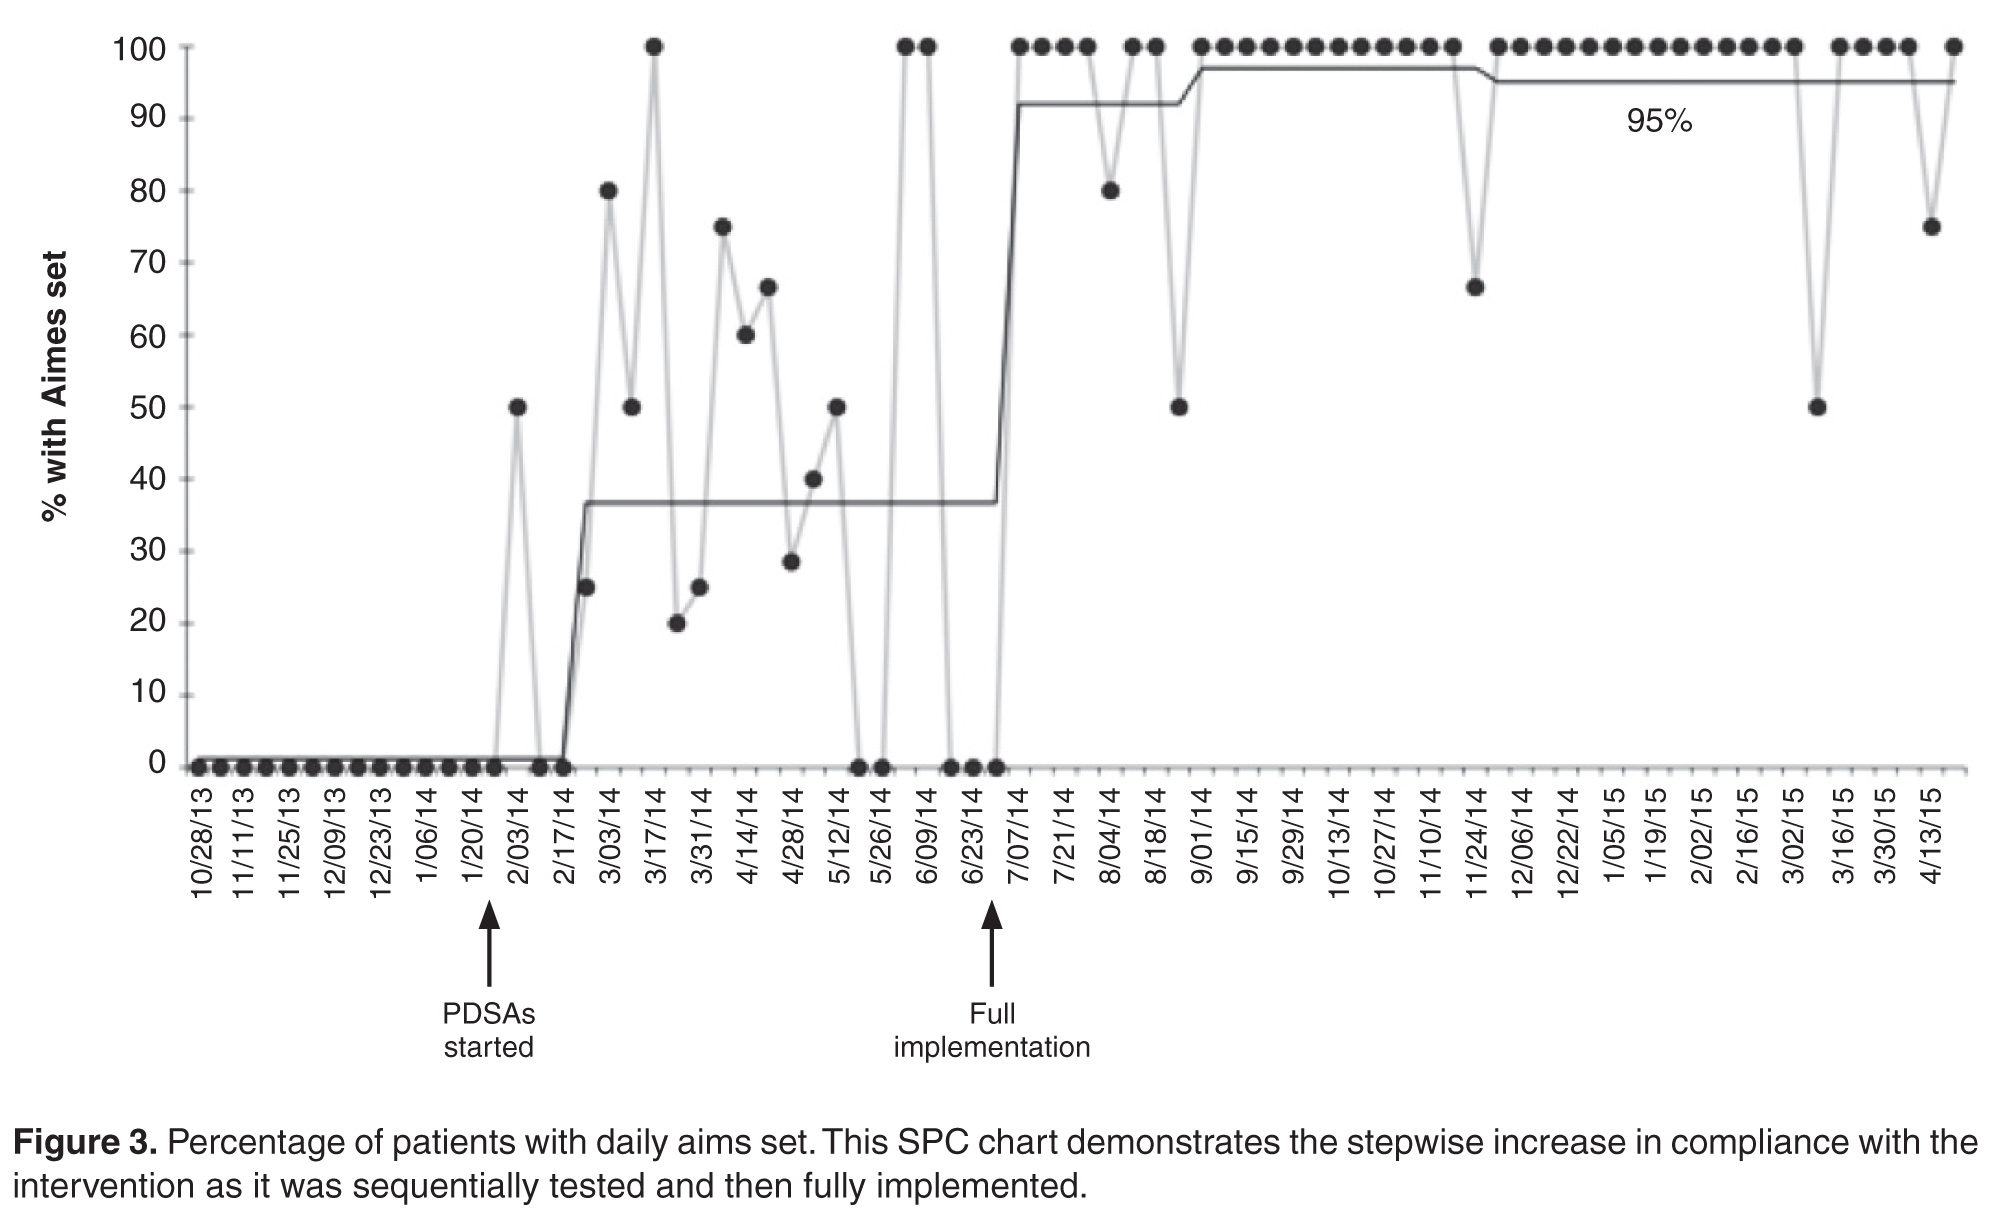
Discussion
The new pathway, the SpinaL Enhanced Recovery Program, improved reliability of care in our institution, with excellent patient satisfaction. It also exceeded its target in reducing length of stay for elective spinal surgery patients 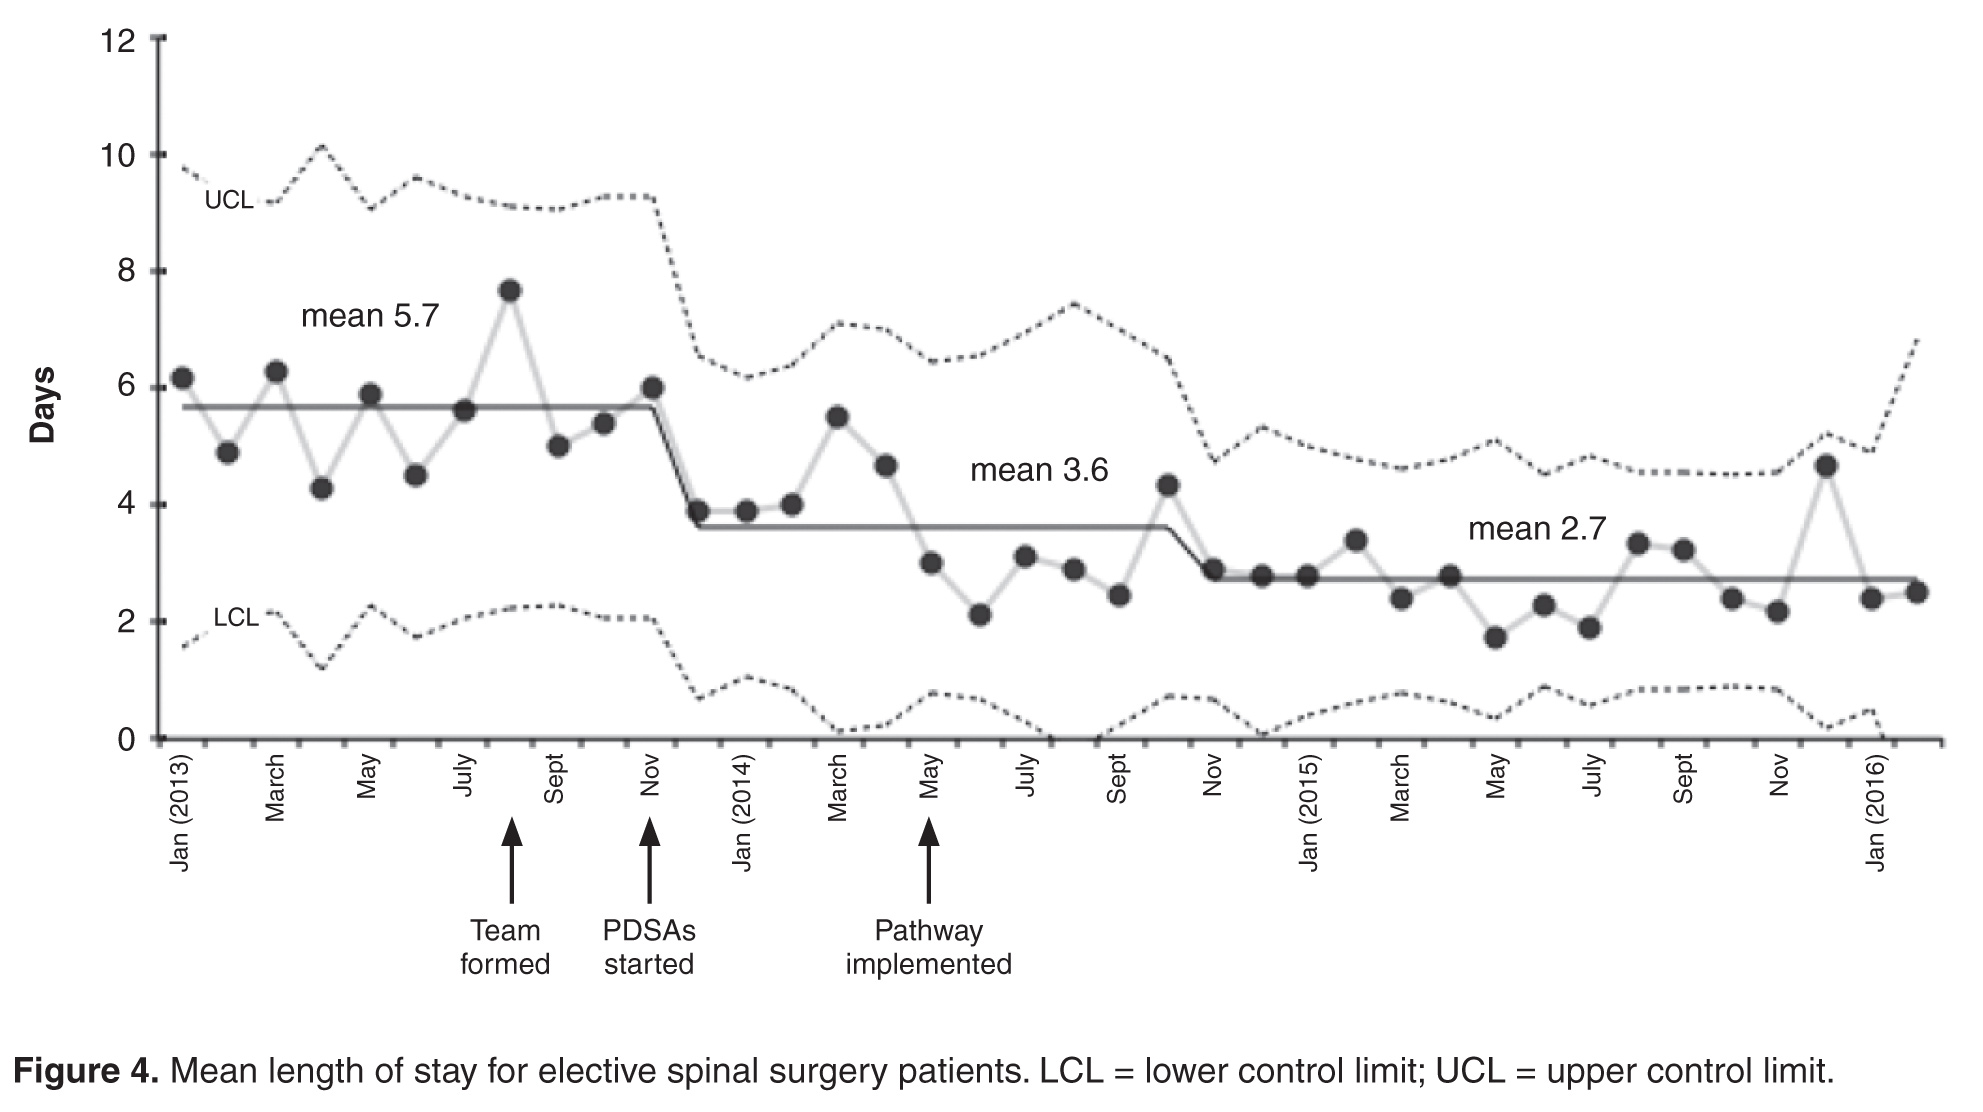
One of the main strengths of this work was the use of small scale testing for each change idea using PDSA cycles, ramping up the idea prior to full implementation. The team could see the impact of changes on a small scale, then make adaptations in the next cycle to increase the likelihood of success.
The development and implementation of the pathway has led to a positive culture change. The spinal team has taken ownership of the pathway and continues to monitor its impact. Seeing the impact of their work on improving the quality of patient care has enhanced the team’s self-efficacy.
The methods used to plan and study our interventions, as well as some of the change ideas themselves, may be helpful for other elective spinal surgical teams. The simple application of the interventions without the improvement process may not have delivered the same outcome. Meeting regularly as a team to discuss ideas and implement new interventions with the guidance of a quality improvement advisor (M.W.) was felt to be the most important factor for success. The team also felt that it was important to collect data by any means possible to monitor interventions and motivate staff before better automated systems were implemented.
The SpinaL Enhanced Recovery Program pathway has now become “business as usual,” and the team plans to incorporate the process and outcome measures onto a monthly performance dashboard to continue to monitor the interventions. Further interventions are planned, including improving preoperative education with a patient pathway video. The team has started to try to stagger admissions for all-day theatre lists, to avoid patients having to wait all day for an afternoon operation. Further improvements in the reliability of care will also potentially allow the team to run controlled studies of single interventions to see how these can impact quality of patient care in a stable process.
Acknowledgments: The authors acknowledge Deborah Ray, Institute for Healthcare Improvement; Sandra Murray, Associates in Healthcare Improvement; Matthew Beebee, Clinical Nurse Practitioner Spinal Surgery; Debbie Vile and Lorraine Sandford, Clinical Nurse Practitioners Spinal Surgery; Sophie Hudson and Sallie Durman, Secretaries; Eleanor Palfreman, Occupational Therapist; Sarah Woodhill, Physiotherapist; Lee Scott, Improvement Nurse; Gervaise Khan-Davis, Directorate Manager; and “SG,” previous patient.
Corresponding author: Dr Julia Blackburn, Musgrove Park Hospital, Taunton, England, TA1 5DA, jlrkblackburn@doctors.org.uk.
Financial disclosures: None.
1. Nicholson A, Lowe MC, Parker J, et al. Systematic review and meta-analysis of enhanced recovery programmes in surgical patients. Br J Surg 2014;101:172–88.
2. Venkata H, Van Dellen J. A perspective on the use of an Enhanced Recovery Programme in open, non-instrumented, ‘day-surgery’ for degenerative lumbar and cervical spinal conditions. J Neurosurg Sci 2016.
3. Mathiesen O, Dahl B, Thomsen B, et al. A comprehensive multimodal pain treatment reduces opioid consumption after multilevel spine surgery. Eur Spine J 2013;22:2089–96.
4. Fleege C, Almajali A, Rauschmann M, et al. Improve of surgical outcome in spinal fusion surgery. Evidence based peri- and intra-operative aspects to reduce complications and earlier recovery. Der Orthopade 2014;43:1070–8.
5. Fleege C, Arabmotlagh M, Almajali A, et al. Pre- and postoperative fast-track treatment concepts in spinal surgery. Patient information and patient cooperation. Der Orthopade 2014;43:1062.
6. Smith MD, McCall J, Plank L, et al. Preoperative carbohydrate treatment for enhancing recovery after elective surgery. Cochrane Database Syst Rev 2014;8:CD009161.
7. Hendry PO, van Dam RM, Bukkems SF, et al. Randomized clinical trial of laxatives and oral nutritional supplements within an enhanced recovery after surgery protocol following liver resection. Br J Surg 2010;97:1198–206.
8. Marciniak CM, Toledo S, Lee J, et al. Lubiprostone vs senna in postoperative orthopedic surgery patients with opioid-induced constipation: a double-blind, active-comparator trial. World J Gastroenterol 2014;20:16323–33.
9. Benneyan J, Lloyd R, Plsek P. Statistical process control as a tool for research and healthcare improvement. Qual Safety Health Care 2003;12:458–64.
10. Portela MC, Pronovost PJ, Woodcock T, et al. How to study improvement interventions: a brief overview of possible study types. BMJ Qual Safety 2015;24:325–36.
From Musgrove Park Hospital, Taunton, England.
Abstract
- Objective: To describe a redesign of the clinical pathway for patients undergoing elective spinal surgery in order to improve quality of care and reduce length of stay.
- Methods: A multidisciplinary team undertook a process-mapping exercise and shadowed patients to analyse problems with the existing clinical pathway. Further ideas were taken from best evidence and other published enhanced recovery programs. Change ideas were tested using Plan-Do-Study-Act cycles. Measures included length of hospital stay, compliance with the pathway, and patient satisfaction.
- Results: The new pathway, the SpinaL Enhanced Recovery Program, is now used by 99% of elective spinal surgery patients with 100% of patients rating their care as good or excellent. Length of stay was reduced by 52%, improving from 5.7 days at the start of the intervention to 2.7 days. The pathway improved reliability of care, with preoperative carbohydrate drinks used in 83% of patients.
- Conclusion: The pathway improved reliability of care in our institution with excellent patient satisfaction and a significant reduction in length of hospital stay.
Enhanced recovery programs (ERPs) have been developed in many surgical specialties to improve patient outcomes and recovery after elective surgery. They involve multiple interventions throughout the patient journey, from preoperative patient education to postoperative mobilization and analgesia schedules. A meta-analysis of 38 trials involving 5099 participants showed ERPs could reduce length of stay and overall complication rates across surgical specialties [1].
There have been few studies of ERP for spinal surgery populations [2]. Most of them have studied selected patients or selected interventions such as analgesia schedules and did not use quality improvement methodology. For example, a small retrospective study compared patients undergoing multilevel spinal fusion surgery before and after introduction of a multimodal analgesia regimen [3]. A review of innovative perioperative and intraoperative treatment algorithms showed that they can influence postoperative recovery and patient outcomes from lumbar spinal surgery [4]. A study from the same group found that patient education and a “fast-track” pathway reduced length of hospital stay and improved patient satisfaction for patients undergoing 1- or 2- level lumbar spinal fusion [5].
At our hospital, a meeting of the clinicians and staff involved in elective spinal surgery was held to discuss the service. Leadership came from a consultant anesthesiologist and a consultant spinal surgeon, who recognized that care was not as efficient as it could be. A multidisciplinary team was formed consisting of 30 members, including surgeons, clinical nurse practitioners, physiotherapists, occupational therapists, and secretarial staff. The team undertook a process-mapping exercise that revealed that patients followed an ill-defined care pathway with variability in administrative processes and clinical care. Patient feedback and reports from both secretarial and community staff revealed that communications from the spinal team could be inconsistent, and patients had unclear expectations of their care and recovery. Lengths of stay for the same procedure could vary by 3 days.
With support from the hospital’s chief executive and medical director, the team embarked on a process to redesign the clinical pathway for patients undergoing elective spinal surgery at our hospital. We developed the SpinaL Enhanced Recovery Program; our primary aims were to to have 95% of patients managed according to the new pathway, to reduce length of stay by 30% without a rise in readmission rates, and to improve patient satisfaction.
Methods
Ethical Issues
This work met criteria for operational improvement activities and as such was exempt from ethics review. The team engaged patients who had undergone spinal surgery to serve as representatives to ensure that the improvements studied were important to them.
Setting and Patients
Our institution is a District General Hospital that serves a population of over 340,000 and has 3 consultant spinal surgeons. They work with 5 anesthesiologists on a regular basis and the patients are cared for by 3 clinical nurse practitioners. The patients are cared for on an elective orthopedic ward with nursing staff, physiotherapists, and occupational therapists who work regularly with spinal surgery patients. The mean age of our spinal surgery patients is 55 years and 55% are female. By age-group, 6.6% are aged 1–16 years, 50.8% aged 17–65 years, and 42.6% over 65 years. We define elective spinal surgery as non-emergency surgery, including discectomy, decompression, fusion and realignment operations to the cervical, thoracic and lumbar spine.
Developing the Pathway
To develop the new pathway, input from the expert team of anesthesiologists and surgeons, other clinicians and staff, as well as patients were sought. Four patients were approached prior to surgery and asked for their thoughts on the existing clinical pathway. They were then shadowed during their journey by clinical staff to see where improvements to their clinical care could be made.
In addition to gathering input from staff and patients, we reviewed the literature for the best available evidence. We found a Cochrane review of 27 trials involving 1976 surgical patients that concluded that preoperative carbohydrate drinks reduced length of stay [6]. Similarly, although laxatives have not been shown to improve length of stay [7], it is known that constipation is exacerbated by opioid analgesia and causes distress [8].
Finally, we examined the ERPs for patients undergoing hip and knee replacement that already existed in our institution. We found they used standardized anesthetic regimens as well as “patient passports,” leaflets given to give patients telling them what to expect during and following joint replacement surgery. They were also implementing methods to help patients set daily aims on the ward.
PDSA Cycles
We began PDSA testing in November 2013. Below we describe selected pathway changes that we expected to be challenging because they involved many staff from different groups. Interventions that involved fewer people or a smaller group (eg, a change in anesthetic regimen or surgical technique) were easier to implement.
Standardizing Nomenclature
The spinal consultants agreed to 12 descriptions of elective spinal surgery to improve communication between team members (Table 2). They were able to reduce the number of procedure descriptions from 135 to just 12. Theatre staff could determine from the procedure descriptions which equipment was required for the operation and ensure it was available at the time needed. Anesthetic staff felt better able to prepare for their operating lists with a prescription for preoperative, intraoperative, and postoperative analgesia.
They also defined an earliest expected day of discharge (EEDD) (Table 2), which was distributed to all members of the team. This information helped ward nurses and therapists were better able to plan to mobilize patients appropriately postoperatively and ensure consistency in communication of expected length of stay to patients.
Perioperative Laxatives
Laxatives were prescribed initially for one patient and we checked to see if the patient and nursing staff were happy with the change. In the next test cycle all patients on one consultant’s list were prescribed laxatives. To track laxative use, a data collection sheet was attached to the patient's medical records on admission. With improved data collection, laxatives were then prescribed on admission for all elective spinal patients. The process has now become routine, occurring even when key change agents are absent.
Preoperative Carbohydrate Drinks
Preoperative high-calorie drinks were initially prescribed for one surgeon’s patients who were predicted to be staying 2 or more nights in the hospital. The preoperative assessment clinic (POAC) staff were asked to give these patients preoperative carbohydrate drinks at their pre-assessment clinic, and patients would self-administer their carbohydrate drinks preoperatively. However, POAC staff found it too difficult to give drinks to some patients and not to others, so it was decided that all patients should receive a drink. The clinical nurse practitioners note that the drink is given on the data collection sheet. However, it was observed that when team champions did not remind staff to administer the preoperative carbohydrate drinks, they were not given. We then asked the surgical admissions lounge staff if they would give preoperative carbohydrate drinks to patients and they agreed. This worked better than using POAC staff.
Patient Daily Aims
Members of the team felt that setting daily aims with patients would help optimize and prepare them for discharge. A laminated sheet with handwritten aims was trialed with 1 patient. He found it very useful, particularly the aims on diet and mobilization. When tested on all patients for a week, not only did they find it useful but nursing staff felt it improved communication between shifts. With greater staff buy-in and a move into a new purpose-built ward, we used white boards that were affixed to the door to the ensuite bathroom in each single patient room. Aims were discussed on ward rounds with patients by consultants or clinical nurse practitioners, and the goals agreed upon with patients before being written on the white boards. They included goals such as removal of urinary catheters, mobilization independently or with staff, and requirements such as radiographs to check position of instrumentation. Spot-checks on the ward showed good compliance with setting daily aims and high rates of satisfaction from patients.
Hospital at Home
The Hospital at Home team consists of experienced community-based nurses who provide wound care and analgesia advice for selected patients postdischarge to prevent readmission. This team supported early discharge for patients undergoing hip and knee replacements, and when approached they felt they could offer wound care and analgesia advice in the community for spinal surgery patients. This was tested with one patient with a wound who had daily care at home for 8 days following discharge from hospital. A further 2 patients were later cared for by the Hospital at Home team, with a total of 7 bed days saved. It has now become routine for the team to accept spinal patients when they have the capacity.
Outcomes
Working with the IT department and data collection tools attached to the medical records, we collected data on key measures every 2 weeks. Statistical process control charts (Process Improvement Products, Austin, TX) [9,10] were used to analyze the data.
Length of stay was reduced by 52% (Figure 4), improving from an average of 6 days during the baseline period to 2.9 days by April 2015. Readmissions for elective spinal surgery patients did not increase and in fact were reduced from 7% to 3%.
By October 2014, 99% of eligible patients were managed on the new pathway and most patients were receiving key
Discussion
The new pathway, the SpinaL Enhanced Recovery Program, improved reliability of care in our institution, with excellent patient satisfaction. It also exceeded its target in reducing length of stay for elective spinal surgery patients
One of the main strengths of this work was the use of small scale testing for each change idea using PDSA cycles, ramping up the idea prior to full implementation. The team could see the impact of changes on a small scale, then make adaptations in the next cycle to increase the likelihood of success.
The development and implementation of the pathway has led to a positive culture change. The spinal team has taken ownership of the pathway and continues to monitor its impact. Seeing the impact of their work on improving the quality of patient care has enhanced the team’s self-efficacy.
The methods used to plan and study our interventions, as well as some of the change ideas themselves, may be helpful for other elective spinal surgical teams. The simple application of the interventions without the improvement process may not have delivered the same outcome. Meeting regularly as a team to discuss ideas and implement new interventions with the guidance of a quality improvement advisor (M.W.) was felt to be the most important factor for success. The team also felt that it was important to collect data by any means possible to monitor interventions and motivate staff before better automated systems were implemented.
The SpinaL Enhanced Recovery Program pathway has now become “business as usual,” and the team plans to incorporate the process and outcome measures onto a monthly performance dashboard to continue to monitor the interventions. Further interventions are planned, including improving preoperative education with a patient pathway video. The team has started to try to stagger admissions for all-day theatre lists, to avoid patients having to wait all day for an afternoon operation. Further improvements in the reliability of care will also potentially allow the team to run controlled studies of single interventions to see how these can impact quality of patient care in a stable process.
Acknowledgments: The authors acknowledge Deborah Ray, Institute for Healthcare Improvement; Sandra Murray, Associates in Healthcare Improvement; Matthew Beebee, Clinical Nurse Practitioner Spinal Surgery; Debbie Vile and Lorraine Sandford, Clinical Nurse Practitioners Spinal Surgery; Sophie Hudson and Sallie Durman, Secretaries; Eleanor Palfreman, Occupational Therapist; Sarah Woodhill, Physiotherapist; Lee Scott, Improvement Nurse; Gervaise Khan-Davis, Directorate Manager; and “SG,” previous patient.
Corresponding author: Dr Julia Blackburn, Musgrove Park Hospital, Taunton, England, TA1 5DA, jlrkblackburn@doctors.org.uk.
Financial disclosures: None.
1. Nicholson A, Lowe MC, Parker J, et al. Systematic review and meta-analysis of enhanced recovery programmes in surgical patients. Br J Surg 2014;101:172–88.
2. Venkata H, Van Dellen J. A perspective on the use of an Enhanced Recovery Programme in open, non-instrumented, ‘day-surgery’ for degenerative lumbar and cervical spinal conditions. J Neurosurg Sci 2016.
3. Mathiesen O, Dahl B, Thomsen B, et al. A comprehensive multimodal pain treatment reduces opioid consumption after multilevel spine surgery. Eur Spine J 2013;22:2089–96.
4. Fleege C, Almajali A, Rauschmann M, et al. Improve of surgical outcome in spinal fusion surgery. Evidence based peri- and intra-operative aspects to reduce complications and earlier recovery. Der Orthopade 2014;43:1070–8.
5. Fleege C, Arabmotlagh M, Almajali A, et al. Pre- and postoperative fast-track treatment concepts in spinal surgery. Patient information and patient cooperation. Der Orthopade 2014;43:1062.
6. Smith MD, McCall J, Plank L, et al. Preoperative carbohydrate treatment for enhancing recovery after elective surgery. Cochrane Database Syst Rev 2014;8:CD009161.
7. Hendry PO, van Dam RM, Bukkems SF, et al. Randomized clinical trial of laxatives and oral nutritional supplements within an enhanced recovery after surgery protocol following liver resection. Br J Surg 2010;97:1198–206.
8. Marciniak CM, Toledo S, Lee J, et al. Lubiprostone vs senna in postoperative orthopedic surgery patients with opioid-induced constipation: a double-blind, active-comparator trial. World J Gastroenterol 2014;20:16323–33.
9. Benneyan J, Lloyd R, Plsek P. Statistical process control as a tool for research and healthcare improvement. Qual Safety Health Care 2003;12:458–64.
10. Portela MC, Pronovost PJ, Woodcock T, et al. How to study improvement interventions: a brief overview of possible study types. BMJ Qual Safety 2015;24:325–36.
A Comparison of Conventional and Expanded Physician Assistant Hospitalist Staffing Models at a Community Hospital
From Physicians Inpatient Care Specialists (MDICS), Hanover, MD (Dr. Capstack, Ms. Vollono), Versant Statistical Solutions, Raleigh, NC (Ms. Segujja), Anne Arundel Medical Center, Annapolis, MD (Dr. Moser [at the time of the study], Dr. Meisenberg), and Johns Hopkins Hospital, Baltimore, MD (Dr. Michtalik).
Abstract
- Objective: To determine whether a higher than conventional physician assistant (PA)–to-physician hospitalist staffing ratio can achieve similar clinical outcomes for inpatients at a community hospital.
- Methods: Retrospective cohort study comparing 2 hospitalist groups at a 384-bed community hospital, one with a high PA-to-physician ratio model (“expanded PA”), with 3 physicians/3 PAs and the PAs rounding on 14 patients a day (35.73% of all visits), and the other with a low PA-to-physician ratio model (“conventional”), with 9 physicians/2 PAs and the PAs rounding on 9 patients a day (5.89% of all visits). For 16,964 adult patients discharged by the hospitalist groups with a medical principal APR-DRG code between January 2012 and June 2013, in-hospital mortality, cost of care, readmissions, length of stay (LOS) and consultant use were analyzed using logistic regression and adjusted for age, insurance status, severity of illness, and risk of mortality.
- Results: No statistically significant differences were found between the 2 groups for in-hospital mortality (odds ratio [OR], 0.89 [95% confidence interval {CI}, 0.66–1.19]; P = 0.42), readmissions (OR, 0.95 [95% CI, 0.87–1.04]; P = 0.27), length of stay (effect size 0.99 days shorter LOS in expanded PA group, 95% CI, 0.97 to 1.01 days; P = 0.34) or consultant use (OR 1.00, 95% CI 0.94–1.07, P = 0.90). Cost of care was less in the expanded PA group (effect size 3.52% less; estimated cost $2644 vs $2724; 95% CI 2.66%–4.39%, P < 0.001).
- Conclusion: An expanded PA hospitalist staffing model at a community hospital provided similar outcomes at a lower cost of care.
Hospitalist program staffing models must optimize efficiency while maintaining clinical outcomes in order to increase value and decrease costs [1]. The cost of hospitalist programs is burdensome, with nearly 94% of groups nationally requiring financial support beyond professional fees [2]. Nationally, for hospitalist groups serving adults, average institutional support is over $156,000 per physician full time equivalent (FTE) (182 twelve-hour clinical shifts per calendar year) [2]. Significant savings could be achieved if less costly physician assistants could be incorporated into clinical teams to provide similar care without sacrificing quality.
Nurse practitioners (NPs) and physician assistants (PAs) have been successfully employed on academic hospitalist services to complement physician staffing [3–10]. They perform admissions, consults, rounding visits and discharges with physician collaboration as permitted by each group’s policies and in accordance with hospital by-laws and state regulations. A median of 0.25 NP and 0.28 PA FTEs per physician FTE are employed by hospitalist groups that incorporate them, though staffing ratios vary widely [2].
Physicians Inpatient Care Specialists (MDICS) devel-oped a staffing model that deploys PAs to see a large proportion of its patients collaboratively with physicians, and with a higher patient census per PA than has been previously reported [2–5]. The group leaders believed that this would yield similar outcomes for patients at a lower cost to the supporting institution than a conventional staffing model which used fewer PAs to render patient care. Prior inpatient studies have demonstrated comparable clinical outcomes when comparing hospitalist PAs and NPs to residents and fellows [4–10], but to our knowledge no data exist directly comparing hospitalist PAs to hospitalist physicians. This study goes beyond prior work by examining the community, non-teaching setting, and directly comparing outcomes from the expanded use of PAs to those of a hospitalist group staffed with a greater proportion of attending physicians at the same hospital during the same time.
Methods
Setting
The study was performed at Anne Arundel Medical Center (AAMC), a 384-bed community hospital in Annapolis, Maryland, that serves a region of over 1 million people. Approximately 26,000 adult patients are discharged annually. During the study, more than 90% of internal medicine service inpatients were cared for by one of 2 hospitalist groups: a hospital-employed group (“conventional” group, Anne Arundel Medical Group) and a contracted hospitalist group (“expanded PA” group, Physicians Inpatient Care Specialists). The conventional group’s providers received a small incentive for Core Measures compliance for patients with stroke, myocardial infarction, congestive heart failure and pneumonia. The expanded PA group received a flat fee for providing hospitalist services and the group’s providers received a small incentive for productivity from their employer. The study was deemed exempt by the AAMC institutional review board.
Staffing Models, Patient Allocation, and Assignment
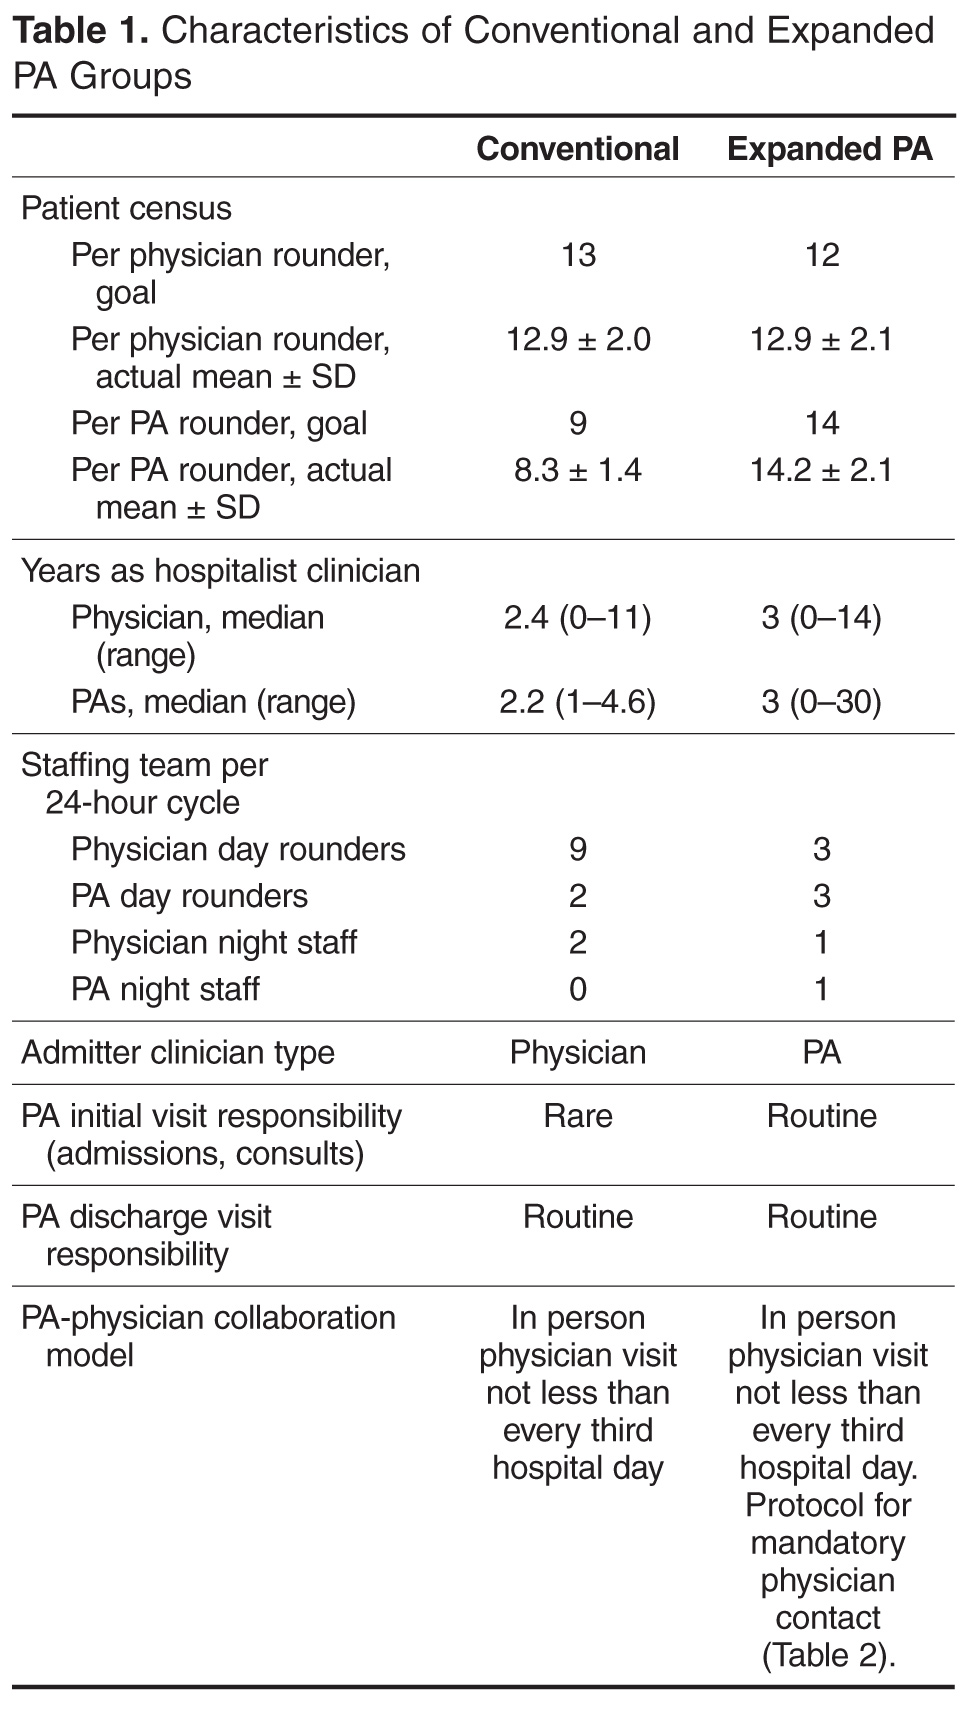
Admitted patients were designated to be admitted to one group or the other on the basis of standing arrangements with the patients’ primary care providers. Consultative referrals could also be made from subspecialists, who had discretion as to which group they wished to use.
Each morning, following sign-out report from the night team, each team of day providers determined which patients would be seen by which of their providers. Patients still on service from the previous day would be seen by the same provider again whenever possible in order to maintain continuity. Each individual provider had their own patients for the day who they rounded on independently and were responsible for. Physician involvement with patients seen primarily by PAs occurred as described below. Physicians in both groups were expected to take primary rounding responsibility for patients who were more acute or more complex based on morning sign-out report; there was no more formal mandate for patient allocation to particular provider type.
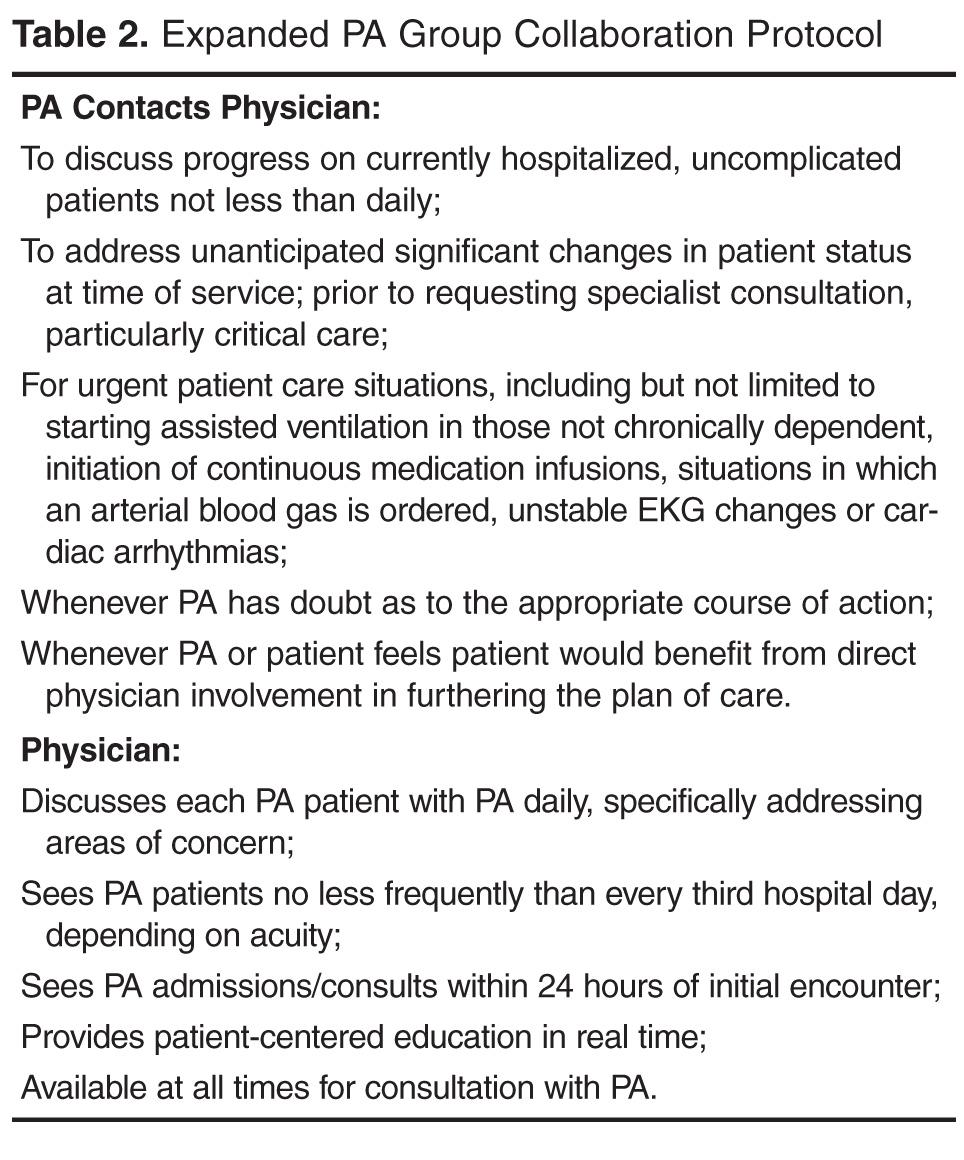
Physician-PA Collaboration
Patients
Patients discharged between 1 January 2012 and 30 June 2013 by the hospitalist groups were identified by searching AAMC’s Crimson Continuuum of Care (The Advisory Board, Washington, DC), a software analytic tool that is integrated with coded clinical data. Adult patient hospitalizations determined by Crimson to have a medical (non-surgical, non-obstetrical) APR-DRG code as the final principal diagnosis were included. Critically ill patients or those appropriate for “step-down unit” care were cared for by the in-house critical care staff; upon transfer out of critical or step-down care, patients were referred back to the admitting hospitalist team. A diagnosis (and its associated hospitalizations) was excluded for referral bias if the diagnosis was the principal diagnosis for at least 1% of a group’s discharges and the percentage of patients with that diagnosis was at least two times greater in one group than the other. Hospitalizations with a diagnosis of “ungroupable” (APR-DRG 956) were also excluded.
Measurements
Demographic, insurance status, cost of care, length of stay (LOS), APR-DRG (All Patient Refined Diagnosis-Related Group) severity of illness (SOI) and risk of mortality (ROM), consultant utilization, 30-day all-cause readmission (“readmission rate”), and mortality information was obtained from administrative data and exported into a single database for statistical analysis. Readmissions, inpatient mortality, and cost of care were the primary outcomes; consultant use and length of stay were secondary outcomes. A hospitalization was considered a readmission if the patient returned to inpatient status at AAMC for any reason within 30 days of a previous inpatient discharge. Inpatient mortality was defined as patient death during hospitalization. The cost of care was measured using the case charges associated with each encounter. Charge capture data from both groups was analyzed to classify visits as “physician-only,” “physician co-visit,” and “PA-only” visits. A co-visit consists of the physician visiting the patient after the PA has already done so on the same day, taking their own history and performing their own physical exam, and writing a brief progress note. These data were compared against the exported administrative data to find matching encounters and associated visits, with only matching visits included in the analysis. If a duplicate charge was entered on the same day for a patient, any conflict was resolved in favor of the physician visit. A total of 49,883 and 28,663 matching charges were identified for the conventional and expanded PA groups.
Statistical Methods
Odds of inpatient mortality were calculated using logistic regression and adjusted for age, insurance status, APR-DRG ROM, and LOS. Odds of readmission were calculated using logistic regression and adjusted for age, LOS, insurance and APR-DRG SOI. Cost of care (effect size) was examined using multiple linear regression and adjusted for age, APR-DRG SOI, insurance status and LOS. This model was fit using the logarithmic transformations of cost of care and LOS to correct deviation from normality. Robust regression using MM estimation was used to estimate group effects due to the existence of outliers and high leverage points. Length of stay (effect size) was assessed using the log-transformed variable and adjusted for APR-DRG SOI, age, insurance status and consultant use. Finally, category logistic regression models were fit to estimate the odds of consultant use in the study groups and adjusted for age, LOS, insurance status and APR-DRG SOI.
Results
Records review identified 17,294 adult patient hospitalizations determined by Crimson to have a medical (non-surgical, non-obstetrical) APR-DRG code as the final principal diagnosis. We excluded 15 expanded PA and 11 conventional hospitalizations that fell under APR-DRG code 956 “ungroupable.” Exclusion for referral bias resulted in the removal of 304 hospitalizations, 207 (3.03%) from the expanded PA group and 97 (0.92%) from the conventional group. These excluded hospitalizations came from 2 APR-DRG codes, urinary stones (code 465) and “other kidney and urinary tract diagnoses” (code 468). This left 6612 hospitalizations in the expanded PA group and 10,352 in the conventional group.
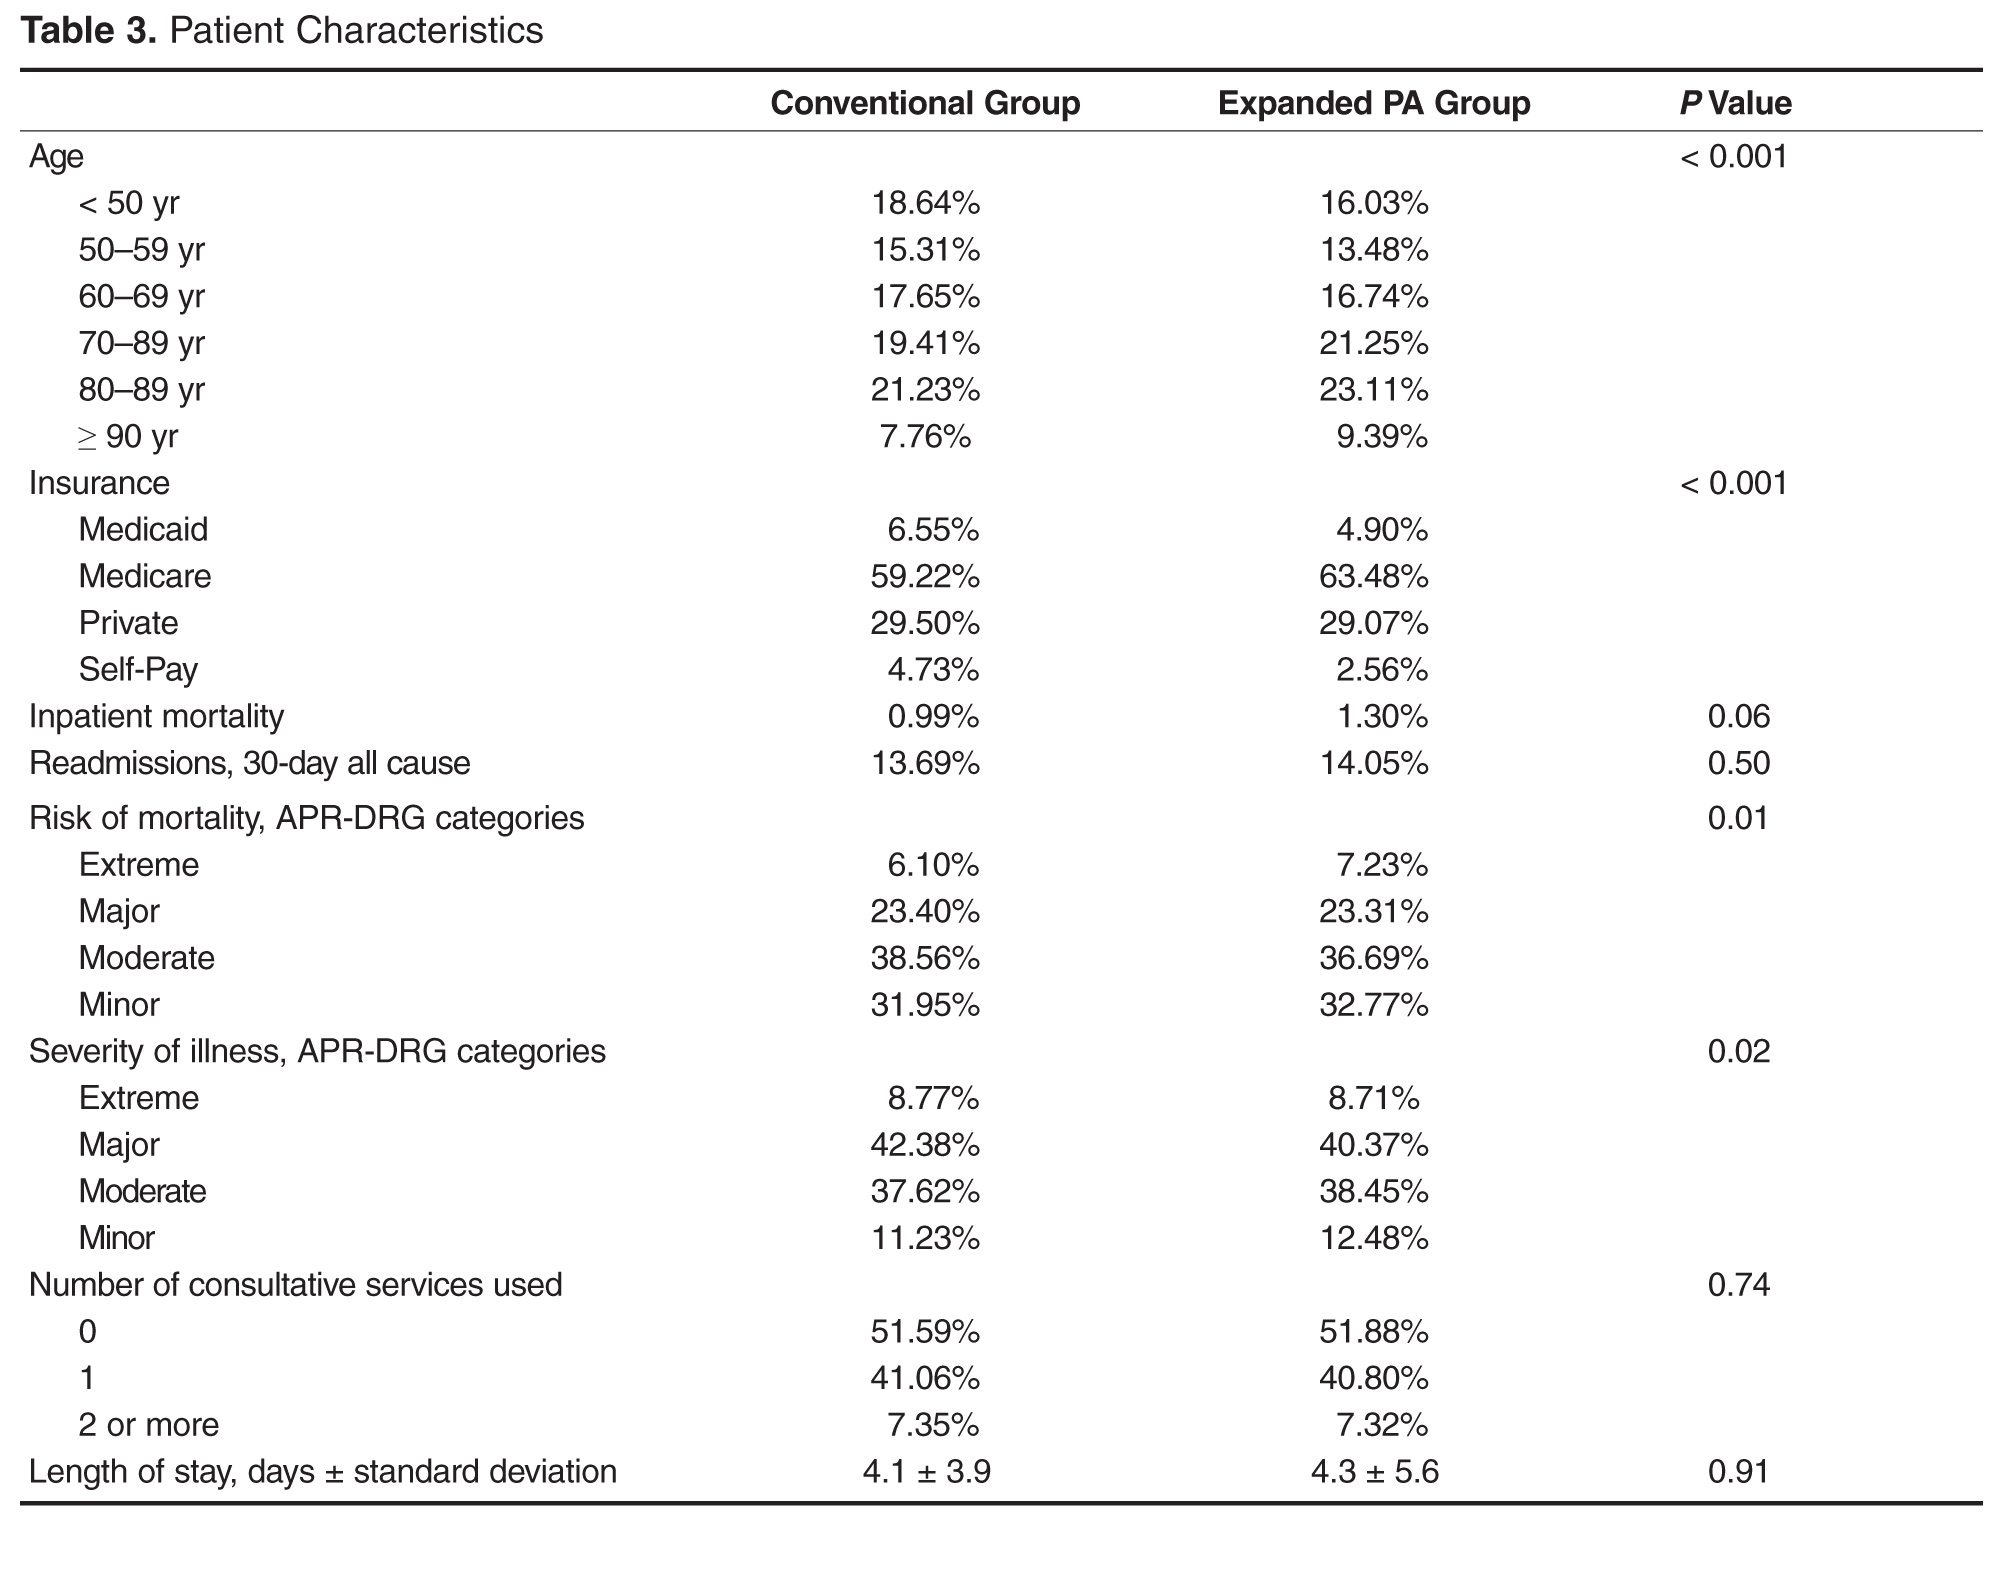
Charge capture data for both groups was used to determine the proportion of encounters rendered by each provider type or combination. In the expanded PA group, 35.73% of visits (10,241 of 28,663) were conducted by a PA, and 64.27% were conducted by a physician or by a PA with a billable physician “co-visit.” In the conventional group, 5.89% of visits (2938 of 49,883) were conducted by a PA, and 94.11% were conducted by a physician only or by a PA with a billable physician “co-visit”.
Readmissions
Overall, 929 of 6612 (14.05%) and 1417 of 10,352 (13.69%) patients were readmitted after being discharged by the expanded PA and conventional groups, respectively. After multivariate analysis, there was no statistically significant difference in odds of readmission between the groups (OR for conventional group, 0.95 [95% CI, 0.87–1.04]; P = 0.27).
Inpatient Mortality
Unadjusted inpatient mortality for the expanded PA group was 1.30% and 0.99% for the conventional group. After multivariate analysis, there was no statistically significant difference in odds of in-hospital mortality between the groups (OR for conventional group, 0.89 [95% CI, 0.66–1.19]; P = 0.42).
Patient Charges
The unadjusted mean patient charge in the expanded PA group was $7822 ± $7755 and in the conventional group mean patient charge was $8307 ± 10,034. Multivariate analysis found significantly lower adjusted patient charges in the expanded PA group relative to the conventional group (3.52% lower in the expanded PA group [95% CI, 2.66%–4.39%, P < 0.001). When comparing a “standard” patient who was between 80–89 and had Medicare insurance and an SOI of “major,” the cost of care was $2644 in the expanded PA group vs $2724 in the conventional group.
Length of Stay
Unadjusted mean length of stay was 4.1 ± 3.9 days and 4.3 ± 5.6 days for the expanded PA and conventional groups, respectively. After multivariate analysis, when comparing the statistical model “standard” patient, there was no significant difference in the length of stay between the 2 groups (effect size, 0.99 days shorter LOS in the expanded PA group [95% CI, 0.97–1.01 days]; P = 0.34)
Consultant Use
Utilization of consultants was also assessed. The expanded PA group used a mean of 0.55 consultants per case, and the conventional group used 0.56. After multivariate adjustment, there was no significant difference in consulting service use between groups (OR 1.00 [95% CI, 0.94–1.07]; P = 0.90).
Discussion
Maximizing value and minimizing health care costs is a national priority. To our knowledge, this is the first study to compare hospitalist PAs in a community, non-teaching practice directly and contemporaneously to peer PAs and attending physicians and examine the impact on outcomes. In our study, a much larger proportion of patient visits were conducted primarily by PAs without a same-day physician visit in the expanded PA group (35.73%, vs 5.89% in the conventional group). There was no statistically significant difference in inpatient mortality, length of stay or readmissions. In addition, costs of care measured as hospital charges to patients were lower in the expanded PA group. Consultants were not used disproportionately by the expanded PA group in order to achieve these results. Our results are consistent with studies that have compared PAs and NPs at academic centers to traditional housestaff teams and which show that services staffed with PAs or NPs that provide direct care to medical inpatients are non-inferior [4–10].
This study’s expanded PA group’s PAs rounded on 14 patients per day, close to the “magic 15” that is considered by many a good compromise for hospitalist physicians between productivity and quality [11,12]. This is substantially more than the 6 to 10 patients PAs have been responsible for in previously reported studies [3,4,6]. As the median salary for a PA hospitalist is $102,960 compared with the median internal medicine physician hospitalist salary of $253,977 [2], using hospitalist PAs in a collaboration model as described herein could result in significant savings for supporting institutions without sacrificing quality.
We recognize several limitations to this study. First, the data were obtained retrospectively from a single center and patient assignment between groups was nonrandomized. The significant differences in the baseline characteristics of patients between the study groups, however, were adjusted for in multivariate analysis, and potential referral bias was addressed through our exclusion criteria. Second, our comparison relied on coding rather than clinical data for diagnosis grouping. However, administrative data is commonly used to determine the primary diagnosis for study patients and the standard for reimbursement. Third, we recognize that there may have been unmeasured confounders that may have affected the outcomes. However, the same resources, including consultants and procedure services, were readily available to both groups and there was no significant difference in consultation rates. Fourth, “cost of care” was measured as overall charges to patients, not cost to the hospital. However, given that all the encounters occurred at the same hospital in the same time frame, the difference should be proportional and equal between groups. Finally, our readmission rates did not account for patients readmitted to other institutions. However, there should not have been a differential effect between the 2 study groups, given the shared patient catchment area and our exclusion for referral bias.
It should also be noted that the expanded PA group used a structured collaboration framework and incorporated a structured education program for its PAs. These components are integral to the expanded PA model, and our results may not be generalizable outside of a similar framework. The expanded PA group’s PAs were carefully selected at the time of hire, specifically educated, and supported through ongoing collaboration to provide efficient and appropriate care at the “top of their licenses”. Not all medical groups will be able to provide this level of support and education, and not all hospitalist PAs will want to and/or be able to reach this level of proficiency. However, successful implementation is entirely achievable for groups that invest the effort. The MDICS education process included 80 hours of didactic sessions spread over several months and is based on the Society of Hospital Medicine Core Competencies [13] as well as 6 months of supervised bedside education with escalating clinical responsibilities under the tutelage of an experienced physician or PA. Year-long academic PA fellowships have also been developed for purposes of similar training at several institutions [14].
Conclusion
Our results show that expanded use of well-educated PAs functioning within a formal collaboration arrangement with physicians provides similar clinical quality to a conventional PA staffing model with no excess patient care costs. The model also allows substantial salary savings to supporting institutions, which is important to hospital and policy stakeholders given the implications for hospitalist group staffing, increasing value, and allocation of precious time and financial resources.
Acknowledgements: The authors wish to thank Kevin Funk, MBA, of MDICS, Clarence Richardson, MBA, of GeBBs Software International, and Heather Channing, Kayla King, and Laura Knox of Anne Arundel Healthcare Enterprise, who provided invaluable help with the data aggregation used for this study.
Corresponding author: Timothy M. Capstack, MD, 7250 Parkway Dr, Suite 500, Hanover, MD 21076, tcapstack@mdics.com.
Financial disclosures: Dr. Capstack has ownership interest in Physicians Inpatient Care Specialists (MDICS). Ms. Segujja received compensation from MDICS for statistical analysis.
1. Michtalik HJ, Pronovost PJ, Marsteller JA, et al. Developing a model for attending physician workload and outcomes. JAMA Intern Med 2013;173:1026–8.
2. Society of Hospital Medicine. State of hospital medicine report. Philadelphia: Society of Hospital Medicine; 2014.
3. Kartha A, Restuccia J, Burgess J, et al. Nurse practitioner and physician assistant scope of practice in 118 acute care hospitals. J Hosp Med 2014;9:615–20.
4. Dhuper S, Choksi S. Replacing an academic internal medicine residency program with a physician assistant--hospitalist model: a comparative analysis study. Am J Med Qual 2008;24:132–9.
5. Morris D, Reilly P, Rohrbach J, et al. The influence of unit-based nurse practitioners on hospital outcomes and readmission rates for patients with trauma. J Trauma Acute Care Surg 2012;73:474–8.
6. Roy C, Liang C, Lund M, et al. Implementation of a physician assistant/hospitalist service in an academic medical center: impact on efficiency and patient outcomes. J Hosp Med 2008;3:361–8.
7. Singh S, Fletcher K, Schapira M, et al. A comparison of outcomes of general medical inpatient care provided by a hospitalist-physician assistant model vs a traditional resident-based model. J Hosp Med 2011;6:122–30.
8. Hoffman L, Tasota F, Zullo T, et al. Outcomes of care managed by an acute care nurse practitioner/attending physician team in an subacute medical intensive care unit. Am J Crit Care 2005;14:121–30.
9. Kapu A, Kleinpell R, Pilon B. Quality and financial impact of adding nurse practitioners to inpatient care teams. J Nurs Adm 2014;44:87–96.
10. Cowan M, Shapiro M, Hays R, et al. The effect of a multidisciplinary hospitalist/physician and advanced practice nurse collaboration on hospital costs. J Nurs Adm 2006;36:79–85.
11. Michtalik HJ, Yeh HC, Pronovost PJ, Brotman DJ. Impact of attending physician workload on patient care: A survey of hospitalists. JAMA Intern Med 2013;173:375–7.
12. Elliott D, Young R, Brice J, et al. Effect of hospitalist workload on the quality and efficiency of care. JAMA Internal Med 2014;174:786–93.
13. McKean S, Budnitz T, Dressler D, et al. How to use the core competencies in hospital medicine: a framework for curriculum development. J Hosp Med 2006; 1 Suppl 1:57–67.
14. Will K, Budavari A, Wilkens J, et al. A hospitalist postgraduate training program for physician assistants. J Hosp Med 2010;5:94–8.
From Physicians Inpatient Care Specialists (MDICS), Hanover, MD (Dr. Capstack, Ms. Vollono), Versant Statistical Solutions, Raleigh, NC (Ms. Segujja), Anne Arundel Medical Center, Annapolis, MD (Dr. Moser [at the time of the study], Dr. Meisenberg), and Johns Hopkins Hospital, Baltimore, MD (Dr. Michtalik).
Abstract
- Objective: To determine whether a higher than conventional physician assistant (PA)–to-physician hospitalist staffing ratio can achieve similar clinical outcomes for inpatients at a community hospital.
- Methods: Retrospective cohort study comparing 2 hospitalist groups at a 384-bed community hospital, one with a high PA-to-physician ratio model (“expanded PA”), with 3 physicians/3 PAs and the PAs rounding on 14 patients a day (35.73% of all visits), and the other with a low PA-to-physician ratio model (“conventional”), with 9 physicians/2 PAs and the PAs rounding on 9 patients a day (5.89% of all visits). For 16,964 adult patients discharged by the hospitalist groups with a medical principal APR-DRG code between January 2012 and June 2013, in-hospital mortality, cost of care, readmissions, length of stay (LOS) and consultant use were analyzed using logistic regression and adjusted for age, insurance status, severity of illness, and risk of mortality.
- Results: No statistically significant differences were found between the 2 groups for in-hospital mortality (odds ratio [OR], 0.89 [95% confidence interval {CI}, 0.66–1.19]; P = 0.42), readmissions (OR, 0.95 [95% CI, 0.87–1.04]; P = 0.27), length of stay (effect size 0.99 days shorter LOS in expanded PA group, 95% CI, 0.97 to 1.01 days; P = 0.34) or consultant use (OR 1.00, 95% CI 0.94–1.07, P = 0.90). Cost of care was less in the expanded PA group (effect size 3.52% less; estimated cost $2644 vs $2724; 95% CI 2.66%–4.39%, P < 0.001).
- Conclusion: An expanded PA hospitalist staffing model at a community hospital provided similar outcomes at a lower cost of care.
Hospitalist program staffing models must optimize efficiency while maintaining clinical outcomes in order to increase value and decrease costs [1]. The cost of hospitalist programs is burdensome, with nearly 94% of groups nationally requiring financial support beyond professional fees [2]. Nationally, for hospitalist groups serving adults, average institutional support is over $156,000 per physician full time equivalent (FTE) (182 twelve-hour clinical shifts per calendar year) [2]. Significant savings could be achieved if less costly physician assistants could be incorporated into clinical teams to provide similar care without sacrificing quality.
Nurse practitioners (NPs) and physician assistants (PAs) have been successfully employed on academic hospitalist services to complement physician staffing [3–10]. They perform admissions, consults, rounding visits and discharges with physician collaboration as permitted by each group’s policies and in accordance with hospital by-laws and state regulations. A median of 0.25 NP and 0.28 PA FTEs per physician FTE are employed by hospitalist groups that incorporate them, though staffing ratios vary widely [2].
Physicians Inpatient Care Specialists (MDICS) devel-oped a staffing model that deploys PAs to see a large proportion of its patients collaboratively with physicians, and with a higher patient census per PA than has been previously reported [2–5]. The group leaders believed that this would yield similar outcomes for patients at a lower cost to the supporting institution than a conventional staffing model which used fewer PAs to render patient care. Prior inpatient studies have demonstrated comparable clinical outcomes when comparing hospitalist PAs and NPs to residents and fellows [4–10], but to our knowledge no data exist directly comparing hospitalist PAs to hospitalist physicians. This study goes beyond prior work by examining the community, non-teaching setting, and directly comparing outcomes from the expanded use of PAs to those of a hospitalist group staffed with a greater proportion of attending physicians at the same hospital during the same time.
Methods
Setting
The study was performed at Anne Arundel Medical Center (AAMC), a 384-bed community hospital in Annapolis, Maryland, that serves a region of over 1 million people. Approximately 26,000 adult patients are discharged annually. During the study, more than 90% of internal medicine service inpatients were cared for by one of 2 hospitalist groups: a hospital-employed group (“conventional” group, Anne Arundel Medical Group) and a contracted hospitalist group (“expanded PA” group, Physicians Inpatient Care Specialists). The conventional group’s providers received a small incentive for Core Measures compliance for patients with stroke, myocardial infarction, congestive heart failure and pneumonia. The expanded PA group received a flat fee for providing hospitalist services and the group’s providers received a small incentive for productivity from their employer. The study was deemed exempt by the AAMC institutional review board.
Staffing Models, Patient Allocation, and Assignment
Admitted patients were designated to be admitted to one group or the other on the basis of standing arrangements with the patients’ primary care providers. Consultative referrals could also be made from subspecialists, who had discretion as to which group they wished to use.
Each morning, following sign-out report from the night team, each team of day providers determined which patients would be seen by which of their providers. Patients still on service from the previous day would be seen by the same provider again whenever possible in order to maintain continuity. Each individual provider had their own patients for the day who they rounded on independently and were responsible for. Physician involvement with patients seen primarily by PAs occurred as described below. Physicians in both groups were expected to take primary rounding responsibility for patients who were more acute or more complex based on morning sign-out report; there was no more formal mandate for patient allocation to particular provider type.
Physician-PA Collaboration
Patients
Patients discharged between 1 January 2012 and 30 June 2013 by the hospitalist groups were identified by searching AAMC’s Crimson Continuuum of Care (The Advisory Board, Washington, DC), a software analytic tool that is integrated with coded clinical data. Adult patient hospitalizations determined by Crimson to have a medical (non-surgical, non-obstetrical) APR-DRG code as the final principal diagnosis were included. Critically ill patients or those appropriate for “step-down unit” care were cared for by the in-house critical care staff; upon transfer out of critical or step-down care, patients were referred back to the admitting hospitalist team. A diagnosis (and its associated hospitalizations) was excluded for referral bias if the diagnosis was the principal diagnosis for at least 1% of a group’s discharges and the percentage of patients with that diagnosis was at least two times greater in one group than the other. Hospitalizations with a diagnosis of “ungroupable” (APR-DRG 956) were also excluded.
Measurements
Demographic, insurance status, cost of care, length of stay (LOS), APR-DRG (All Patient Refined Diagnosis-Related Group) severity of illness (SOI) and risk of mortality (ROM), consultant utilization, 30-day all-cause readmission (“readmission rate”), and mortality information was obtained from administrative data and exported into a single database for statistical analysis. Readmissions, inpatient mortality, and cost of care were the primary outcomes; consultant use and length of stay were secondary outcomes. A hospitalization was considered a readmission if the patient returned to inpatient status at AAMC for any reason within 30 days of a previous inpatient discharge. Inpatient mortality was defined as patient death during hospitalization. The cost of care was measured using the case charges associated with each encounter. Charge capture data from both groups was analyzed to classify visits as “physician-only,” “physician co-visit,” and “PA-only” visits. A co-visit consists of the physician visiting the patient after the PA has already done so on the same day, taking their own history and performing their own physical exam, and writing a brief progress note. These data were compared against the exported administrative data to find matching encounters and associated visits, with only matching visits included in the analysis. If a duplicate charge was entered on the same day for a patient, any conflict was resolved in favor of the physician visit. A total of 49,883 and 28,663 matching charges were identified for the conventional and expanded PA groups.
Statistical Methods
Odds of inpatient mortality were calculated using logistic regression and adjusted for age, insurance status, APR-DRG ROM, and LOS. Odds of readmission were calculated using logistic regression and adjusted for age, LOS, insurance and APR-DRG SOI. Cost of care (effect size) was examined using multiple linear regression and adjusted for age, APR-DRG SOI, insurance status and LOS. This model was fit using the logarithmic transformations of cost of care and LOS to correct deviation from normality. Robust regression using MM estimation was used to estimate group effects due to the existence of outliers and high leverage points. Length of stay (effect size) was assessed using the log-transformed variable and adjusted for APR-DRG SOI, age, insurance status and consultant use. Finally, category logistic regression models were fit to estimate the odds of consultant use in the study groups and adjusted for age, LOS, insurance status and APR-DRG SOI.
Results
Records review identified 17,294 adult patient hospitalizations determined by Crimson to have a medical (non-surgical, non-obstetrical) APR-DRG code as the final principal diagnosis. We excluded 15 expanded PA and 11 conventional hospitalizations that fell under APR-DRG code 956 “ungroupable.” Exclusion for referral bias resulted in the removal of 304 hospitalizations, 207 (3.03%) from the expanded PA group and 97 (0.92%) from the conventional group. These excluded hospitalizations came from 2 APR-DRG codes, urinary stones (code 465) and “other kidney and urinary tract diagnoses” (code 468). This left 6612 hospitalizations in the expanded PA group and 10,352 in the conventional group.
Charge capture data for both groups was used to determine the proportion of encounters rendered by each provider type or combination. In the expanded PA group, 35.73% of visits (10,241 of 28,663) were conducted by a PA, and 64.27% were conducted by a physician or by a PA with a billable physician “co-visit.” In the conventional group, 5.89% of visits (2938 of 49,883) were conducted by a PA, and 94.11% were conducted by a physician only or by a PA with a billable physician “co-visit”.
Readmissions
Overall, 929 of 6612 (14.05%) and 1417 of 10,352 (13.69%) patients were readmitted after being discharged by the expanded PA and conventional groups, respectively. After multivariate analysis, there was no statistically significant difference in odds of readmission between the groups (OR for conventional group, 0.95 [95% CI, 0.87–1.04]; P = 0.27).
Inpatient Mortality
Unadjusted inpatient mortality for the expanded PA group was 1.30% and 0.99% for the conventional group. After multivariate analysis, there was no statistically significant difference in odds of in-hospital mortality between the groups (OR for conventional group, 0.89 [95% CI, 0.66–1.19]; P = 0.42).
Patient Charges
The unadjusted mean patient charge in the expanded PA group was $7822 ± $7755 and in the conventional group mean patient charge was $8307 ± 10,034. Multivariate analysis found significantly lower adjusted patient charges in the expanded PA group relative to the conventional group (3.52% lower in the expanded PA group [95% CI, 2.66%–4.39%, P < 0.001). When comparing a “standard” patient who was between 80–89 and had Medicare insurance and an SOI of “major,” the cost of care was $2644 in the expanded PA group vs $2724 in the conventional group.
Length of Stay
Unadjusted mean length of stay was 4.1 ± 3.9 days and 4.3 ± 5.6 days for the expanded PA and conventional groups, respectively. After multivariate analysis, when comparing the statistical model “standard” patient, there was no significant difference in the length of stay between the 2 groups (effect size, 0.99 days shorter LOS in the expanded PA group [95% CI, 0.97–1.01 days]; P = 0.34)
Consultant Use
Utilization of consultants was also assessed. The expanded PA group used a mean of 0.55 consultants per case, and the conventional group used 0.56. After multivariate adjustment, there was no significant difference in consulting service use between groups (OR 1.00 [95% CI, 0.94–1.07]; P = 0.90).
Discussion
Maximizing value and minimizing health care costs is a national priority. To our knowledge, this is the first study to compare hospitalist PAs in a community, non-teaching practice directly and contemporaneously to peer PAs and attending physicians and examine the impact on outcomes. In our study, a much larger proportion of patient visits were conducted primarily by PAs without a same-day physician visit in the expanded PA group (35.73%, vs 5.89% in the conventional group). There was no statistically significant difference in inpatient mortality, length of stay or readmissions. In addition, costs of care measured as hospital charges to patients were lower in the expanded PA group. Consultants were not used disproportionately by the expanded PA group in order to achieve these results. Our results are consistent with studies that have compared PAs and NPs at academic centers to traditional housestaff teams and which show that services staffed with PAs or NPs that provide direct care to medical inpatients are non-inferior [4–10].
This study’s expanded PA group’s PAs rounded on 14 patients per day, close to the “magic 15” that is considered by many a good compromise for hospitalist physicians between productivity and quality [11,12]. This is substantially more than the 6 to 10 patients PAs have been responsible for in previously reported studies [3,4,6]. As the median salary for a PA hospitalist is $102,960 compared with the median internal medicine physician hospitalist salary of $253,977 [2], using hospitalist PAs in a collaboration model as described herein could result in significant savings for supporting institutions without sacrificing quality.
We recognize several limitations to this study. First, the data were obtained retrospectively from a single center and patient assignment between groups was nonrandomized. The significant differences in the baseline characteristics of patients between the study groups, however, were adjusted for in multivariate analysis, and potential referral bias was addressed through our exclusion criteria. Second, our comparison relied on coding rather than clinical data for diagnosis grouping. However, administrative data is commonly used to determine the primary diagnosis for study patients and the standard for reimbursement. Third, we recognize that there may have been unmeasured confounders that may have affected the outcomes. However, the same resources, including consultants and procedure services, were readily available to both groups and there was no significant difference in consultation rates. Fourth, “cost of care” was measured as overall charges to patients, not cost to the hospital. However, given that all the encounters occurred at the same hospital in the same time frame, the difference should be proportional and equal between groups. Finally, our readmission rates did not account for patients readmitted to other institutions. However, there should not have been a differential effect between the 2 study groups, given the shared patient catchment area and our exclusion for referral bias.
It should also be noted that the expanded PA group used a structured collaboration framework and incorporated a structured education program for its PAs. These components are integral to the expanded PA model, and our results may not be generalizable outside of a similar framework. The expanded PA group’s PAs were carefully selected at the time of hire, specifically educated, and supported through ongoing collaboration to provide efficient and appropriate care at the “top of their licenses”. Not all medical groups will be able to provide this level of support and education, and not all hospitalist PAs will want to and/or be able to reach this level of proficiency. However, successful implementation is entirely achievable for groups that invest the effort. The MDICS education process included 80 hours of didactic sessions spread over several months and is based on the Society of Hospital Medicine Core Competencies [13] as well as 6 months of supervised bedside education with escalating clinical responsibilities under the tutelage of an experienced physician or PA. Year-long academic PA fellowships have also been developed for purposes of similar training at several institutions [14].
Conclusion
Our results show that expanded use of well-educated PAs functioning within a formal collaboration arrangement with physicians provides similar clinical quality to a conventional PA staffing model with no excess patient care costs. The model also allows substantial salary savings to supporting institutions, which is important to hospital and policy stakeholders given the implications for hospitalist group staffing, increasing value, and allocation of precious time and financial resources.
Acknowledgements: The authors wish to thank Kevin Funk, MBA, of MDICS, Clarence Richardson, MBA, of GeBBs Software International, and Heather Channing, Kayla King, and Laura Knox of Anne Arundel Healthcare Enterprise, who provided invaluable help with the data aggregation used for this study.
Corresponding author: Timothy M. Capstack, MD, 7250 Parkway Dr, Suite 500, Hanover, MD 21076, tcapstack@mdics.com.
Financial disclosures: Dr. Capstack has ownership interest in Physicians Inpatient Care Specialists (MDICS). Ms. Segujja received compensation from MDICS for statistical analysis.
1. Michtalik HJ, Pronovost PJ, Marsteller JA, et al. Developing a model for attending physician workload and outcomes. JAMA Intern Med 2013;173:1026–8.
2. Society of Hospital Medicine. State of hospital medicine report. Philadelphia: Society of Hospital Medicine; 2014.
3. Kartha A, Restuccia J, Burgess J, et al. Nurse practitioner and physician assistant scope of practice in 118 acute care hospitals. J Hosp Med 2014;9:615–20.
4. Dhuper S, Choksi S. Replacing an academic internal medicine residency program with a physician assistant--hospitalist model: a comparative analysis study. Am J Med Qual 2008;24:132–9.
5. Morris D, Reilly P, Rohrbach J, et al. The influence of unit-based nurse practitioners on hospital outcomes and readmission rates for patients with trauma. J Trauma Acute Care Surg 2012;73:474–8.
6. Roy C, Liang C, Lund M, et al. Implementation of a physician assistant/hospitalist service in an academic medical center: impact on efficiency and patient outcomes. J Hosp Med 2008;3:361–8.
7. Singh S, Fletcher K, Schapira M, et al. A comparison of outcomes of general medical inpatient care provided by a hospitalist-physician assistant model vs a traditional resident-based model. J Hosp Med 2011;6:122–30.
8. Hoffman L, Tasota F, Zullo T, et al. Outcomes of care managed by an acute care nurse practitioner/attending physician team in an subacute medical intensive care unit. Am J Crit Care 2005;14:121–30.
9. Kapu A, Kleinpell R, Pilon B. Quality and financial impact of adding nurse practitioners to inpatient care teams. J Nurs Adm 2014;44:87–96.
10. Cowan M, Shapiro M, Hays R, et al. The effect of a multidisciplinary hospitalist/physician and advanced practice nurse collaboration on hospital costs. J Nurs Adm 2006;36:79–85.
11. Michtalik HJ, Yeh HC, Pronovost PJ, Brotman DJ. Impact of attending physician workload on patient care: A survey of hospitalists. JAMA Intern Med 2013;173:375–7.
12. Elliott D, Young R, Brice J, et al. Effect of hospitalist workload on the quality and efficiency of care. JAMA Internal Med 2014;174:786–93.
13. McKean S, Budnitz T, Dressler D, et al. How to use the core competencies in hospital medicine: a framework for curriculum development. J Hosp Med 2006; 1 Suppl 1:57–67.
14. Will K, Budavari A, Wilkens J, et al. A hospitalist postgraduate training program for physician assistants. J Hosp Med 2010;5:94–8.
An Automated Electronic Tool to Assess the Risk of 30-Day Readmission: Validation of Predictive Performance
From the Divisions of Hospital Medicine (Drs. Dawson, Chirila, Bhide, and Burton) and Biomedical Statistics and Informatics (Ms. Thomas), Mayo Clinic, Jacksonville, FL, and the Division of Hospital Medicine, Mayo Clinic, Phoenix, AZ (Dr. Cannon).
Abstract
- Objective: To validate an electronic tool created to identify inpatients who are at risk of readmission within 30 days and quantify the predictive performance of the readmission risk score (RRS).
- Methods: Retrospective cohort study including inpa-tients who were discharged between 1 Nov 2012 and 31 Dec 2012. The ability of the RRS to discriminate between those who did and did not have a 30-day urgent readmission was quantified by the c statistic. Calibration was assessed by plotting the observed and predicted probability of 30-day urgent readmission. Predicted probabilities were obtained from generalized estimating equations, clustering on patient.
- Results: Of 1689 hospital inpatient discharges (1515 patients), 159 (9.4%) had a 30-day urgent readmission. The RRS had some discriminative ability (c statistic: 0.612; 95% confidence interval: 0.570–0.655) and good calibration.
- Conclusions: Our study shows that the RRS has some discriminative ability. The automated tool can be used to estimate the probability of a 30-day urgent readmission.
Hospital readmissions are increasingly scrutinized by the Center for Medicare and Medicaid Services and other payers due to their frequency and high cost. It is estimated that up to 25% of all patients discharged from acute care hospitals are readmitted within 30 days [1]. To address this problem, the Center for Medicare and Medicaid Services is using these rates as one of the benchmarks for quality for hospitals and health care organizations and has begun to assess penalties to those institutions with the highest rates. This scrutiny and the desire for better patient care transitions has resulted in most hospitals implementing various initiatives to reduce potentially avoidable readmissions.
Multiple interventions have been shown to reduce readmissions [2,3]. These interventions have varying effectiveness and are often labor intensive and thus costly to the institutions implementing them. In fact, no one intervention has been shown to be effective alone [4], and it may take several concurrent interventions targeting the highest risk patients to improve transitions of care at discharge that result in reduced readmissions. Many experts do recommend risk stratifying patients in order to target interventions to the highest risk patients for effective use of resources [5,6]. Several risk factor assessments have been proposed with varying success [7–13]. Multiple factors can limit the effectiveness of these risk stratification profiles. They may have low sensitivity and specificity, be based solely on retrospective data, be limited to certain populations, or be created from administrative data only without taking psychosocial factors into consideration [14].
An effective risk assessment ideally would encompass multiple known risk factors including certain comorbidities such as malignancy and heart failure, psychosocial factors such as health literacy and social support, and administrative data including payment source and demographics. All of these have been shown in prior studies to contribute to readmissions [7–13]. In addition, availability of the assessment early in the hospitalization would allow for interventions throughout the hospital stay to mitigate the effect of these factors where possible. To address these needs, our institution formed a readmission task force in January 2010 to review published literature on hospital 30-day readmissions and create a readmission risk score (RRS). The aim of this study was to quantify the predictive performance of the RRS after it was first implemented into the electronic medical record (EMR) in November 2012.
Methods
Study Design and Cohort
All consecutive adult inpatients who were discharged between 1 November 2012 and 31 December 2012 were included in this retrospective cohort study. This narrow time frame corresponded to the period from RRS tool implementation to the start of readmission interventions. We excluded hospitalizations if the patient died in the hospital.
Outcome Measures
The primary outcome was a 30-day urgent readmission, which included readmissions categorized as either emergency, urgent, or semi-urgent. Secondary outcomes included any 30-day readmission and 30-day death. Only readmissions to Mayo Clinic were examined.
Predictors
In collaboration with the information technology department, an algorithm was written to extract data from the EMR for each patient within 24 hours of admission to the hospital. This data was retrieved from existing repositories of patient information, such as demographic information, payer source, medication list, problem list, and past medical history. In addition, each patient was interviewed by a nurse at the time of admission, and the nurse completed an “admission profile” in the EMR that confirmed or entered past medical history, medications, social support at home, depression symptoms, and learning styles, among other information (Table 1). The algorithm was able to extract data from this evaluation also, so that each element of the risk score was correlated to at least one data source in the EMR. The algorithm then assigned the correct value to each element, and the total score was electronically calculated and placed in a discrete cell in each patient’s record. The algorithm was automatically run again 48 hours after the initial scoring in order to assure completeness of the information. If the patient had a length of stay greater than 5 days, an additional score was generated to include the length of stay component.
Statistical Analysis
The predictive performance of the RRS was assessed by evaluating the discrimination and calibration. Discrimination is the ability of the RRS to separate those who had a 30-day urgent readmission and those who did not. Discrimination was quantified by the c statistic, which is equivalent to the area under the receiver operating characteristic curve in this study owing to the use of binary endpoints. A c statistic of 1.0 would indicate that the RRS perfectly predicts 30-day urgent readmission while a c statistic of 0.5 would indicate the RRS has no apparent accuracy in predicting 30-day urgent readmission. Calibration assesses how closely predicted outcomes agree with observed outcomes. The predicted probability of 30-day urgent readmission was estimated utilizing a generalized estimating equation model, clustering on patient, with RRS as the only predictor variable. Inpatient discharges were divided into deciles of the predicted probabilities for 30-day urgent readmission. Agreement of the predicted and observed outcomes was displayed graphically according to decile of the predicted outcomes. All analyses were performed using SAS (version 9.3, SAS Institute, Cary, NC) and R statistical software (version 3.1.1, R Foundation for Statistical Computing, Vienna, Austria).
Results
The RRS was significantly associated with 30-day urgent readmission (odds ratio [OR] for 1-point increase in the RRS, 1.07 [95% confidence interval {CI} 1.05–1.10]; P < 0.001). A c statistic of 0.612 (95% CI 0.570–0.655) indicates that the RRS has some ability to discriminate between those with and without a 30-day urgent readmission (Figure, Table 3). The expected and observed probabilities of 30-day urgent readmission were similar in each decile of the RRS. The calibration (Table 4) shows that although there is some deviation between the observed and expected probabilities, 
The RRS was also significantly associated with each of the secondary outcome measures. The odds ratios for a 1-point increase in the RRS for any 30-day readmission was 1.06 (95% CI 1.03–1.09, P < 0.001) and the c statistic was 0.591 (95% CI 0.551–0.631, Table 2). The odds ratios for a 1-point increase in the 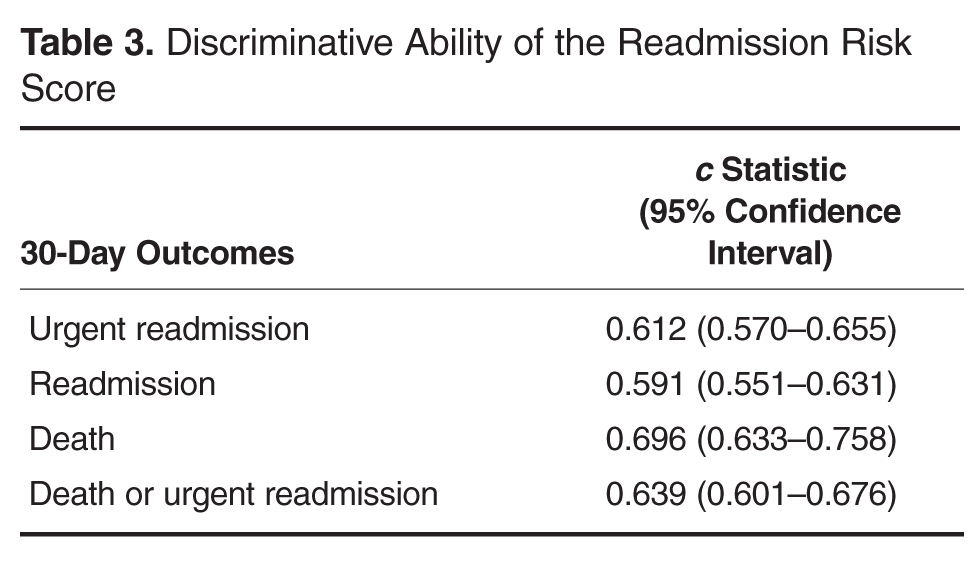
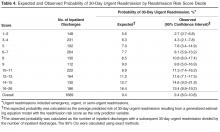
Discussion

Our study provides evidence that the RRS has some ability to discriminate between patients who did and did not have a 30-day urgent readmission (c statistic 0.612 [95% CI 0.570–0.655]). More importantly the calibration appears to be good particularly in the higher risk patients, which are the most crucial to identify in order to target interventions.
In addition to predicting the risk of readmission, our method of risk evaluation has several other advantages. First, the risk score is assigned to each patient within 24 to 48 hours of admission by using elements available at the time of, or soon after, admission. This early evaluation during the hospitalization identifies patients who could benefit from interventions throughout the stay that could help mitigate the risks and allow for a safer transition. Other studies have used elements available only at discharge, such as lab values and length of stay [7,11]. Donze et al used 7 elements in a validated scoring system, but several of the elements were discharge values and the risk assessment system had a fair discriminatory value with a c statistic of 0.71, similar to our results. The advantage to having the score available at admission is that several of the factors used to compose the RRS could be addressed during the hospitalization, including increased education for those with greater than 7 medications, intensive care management intervention for those with a lack of social support, and increased or modified education for those with low health literacy.
Second, the score is derived entirely from elements available in the EMR, thus the score is calculated automatically within 24 hours of admission and displayed in the chart for all providers to access. This eliminates any need for individual chart review or patient evaluation outside the normal admission process, making this system extremely efficient. Van Walraven et al [9] devised a scoring system using length of stay, acuity of admission, comorbidities and emergency department use (LACE index), with a validation c statistic of 0.684, which again is similar to our results. However, the LACE index uses the Charlson comorbidity index as a measure of patient comorbidity and this can be cumbersome to calculate in clinical practice. Having the score automatically available to all providers caring for the patient increases their awareness of the patient’s level of risk. Allaudeen and colleagues showed that providers are unable to intuitively predict those patients who are at high-risk for readmission [15]; therefore, an objective, readily available risk stratification is necessary to inform the providers.
Third, the risk scoring system uses elements from varied sources to include social, medical, and individual factors, all of which have been shown to increase risk of 30-day readmissions [9,15]. An accurate risk scoring system, ideally, should include elements from multiple sources, and use of the EMR allows for this varied compilation. The risk evaluation is done on every patient, regardless of admitting diagnosis, and in spite of this heterogeneous population, it was still found to be significantly accurate. Prior studies have looked at individual populations [7,10,12,13,16]; however, this can miss many patient populations that are also high-risk. Tailoring individual risk algorithms by diagnosis can also be labor intensive.
Our study has limitations. It is a retrospective study and included a relatively short study period of 2 months. This period was chosen because it represented the time from when the RRS was first implemented to when interventions to reduce readmission according to the RRS began, however, it still encompassed a significant number of discharges. We were only able to evaluate readmissions to our own facility; therefore, patients readmitted to other facilities were not included. Although readmission to any facility is undesirable, having a risk scoring system that can reliably predict readmission to the index admission hospital is still helpful. In addition, we only validated the risk score on patients in our own facility. A larger population from multiple facilities would be helpful for further validation. In spite of this limitation we would expect that most of our readmissions return to our own facility given our community setting. In fact, based on Medicare data for readmissions to all facilities, the difference in readmission rate between our facility and all facilities differs by less than 4%.
In summary, we developed a comprehensive risk scoring system that proved to be moderately predictive of readmission that encompasses multiple factors, is available to all providers early in a hospitalization, and is completely automated via the EMR. Further studies are ongoing to refine this score and improve the predictive performance.
Corresponding author: Nancy L. Dawson, MD, Division of Hospital Medicine, Mayo Clinic, 4500 San Pablo Road, Jacksonville, FL 32224, dawson.nancy11@mayo.edu.
Financial disclosures: None.
1. Elixhauser A, Steiner C. Statistical Brief #153: Readmissions to U.S. hospitals by diagnosis, 2010. Agency for Healthcare Research and Quality; 2013. Available at www.hcup-us.ahrq.gov/reports/statbriefs/sb153.pdf.
2. Jack BW, Chetty VK, Anthony D, et al. A reengineered hospital discharge program to decrease rehospitalization: a randomized trial. Ann Intern Med 2009;150:178–87.
3. Boutwell A, Hwu S. Effective interventions to reduce rehospitalizations: a survey of the published evidence. Cambridge, MA: Institute for Healthcare Improvement; 2009. Available at www.ihi.org/resources/Pages/Publications/EffectiveInterventionsReduceRehospitalizationsASurveyPublishedEvidence.aspx.
4. Hansen LO, Young RS, Hinami K, et al. Interventions to reduce 30-day rehospitalization: a systematic review. Ann Intern Med 2011;155:520–8.
5. Kripalani S, Theobald CN, Anctil B, Vasilevskis EE. Reducing hospital readmission rates: current strategies and future directions. Ann Rev Med 2014;65:471–85.
6. Osei-Anto A, Joshi M, Audet AM, et al. Health care leader action guide to reduce avoidable readmissions. Chicago: Health Research & Educational Trust; 2010. Available at www.hret.org/care/projects/resources/readmissions_cp.pdf.
7. Zaya M, Phan A, Schwarz ER. Predictors of re-hospitalization in patients with chronic heart failure. World J Cardiol 2012;4:23–30.
8. Hu J, Gonsahn MD, Nerenz DR. Socioeconomic status and readmissions: evidence from an urban teaching hospital. Health Aff (Millwood) 2014;33:778–85.
9. van Walraven C, Dhalla IA, Bell C, et al. Derivation and validation of an index to predict early death or unplanned readmission after discharge from hospital to the community. CMAJ 2010;182:551–7.
10. Rana S, Tran T, Luo W, et al. Predicting unplanned readmission after myocardial infarction from routinely collected administrative hospital data. Aust Health Rev 2014;38:377–82.
11. Donze J, Aujesky D, Williams D, Schnipper JL. Potentially avoidable 30-day hospital readmissions in medical patients: derivation and validation of a prediction model. JAMA Intern Med 2013;173:632–8.
12. Kogon B, Jain A, Oster M, et al. Risk factors associated with readmission after pediatric cardiothoracic surgery. Ann Thorac Surg 2012;94:865–73.
13. Harhay M, Lin E, Pai A, et al. Early rehospitalization after kidney transplantation: assessing preventability and prognosis. Am J Transplant 2013;13:3164–72.
14. Preventing unnecessary readmissions: transcending the hospital’s four walls to achieve collaborative care coordination. The Advisory Board Company; 2010. Available at www.advisory.com/research/physician-executive-council/studies/2010/preventing-unnecessary-readmissions.
15. Allaudeen N, Schnipper JL, Orav EJ, et al. Inability of providers to predict unplanned readmissions. J Gen Intern Med 2011;26:771–6.
16. Calvillo-King L, Arnold D, Eubank KJ, et al. Impact of social factors on risk of readmission or mortality in pneumonia and heart failure: systematic review. J Gen Intern Med 2013;28:269–82.
From the Divisions of Hospital Medicine (Drs. Dawson, Chirila, Bhide, and Burton) and Biomedical Statistics and Informatics (Ms. Thomas), Mayo Clinic, Jacksonville, FL, and the Division of Hospital Medicine, Mayo Clinic, Phoenix, AZ (Dr. Cannon).
Abstract
- Objective: To validate an electronic tool created to identify inpatients who are at risk of readmission within 30 days and quantify the predictive performance of the readmission risk score (RRS).
- Methods: Retrospective cohort study including inpa-tients who were discharged between 1 Nov 2012 and 31 Dec 2012. The ability of the RRS to discriminate between those who did and did not have a 30-day urgent readmission was quantified by the c statistic. Calibration was assessed by plotting the observed and predicted probability of 30-day urgent readmission. Predicted probabilities were obtained from generalized estimating equations, clustering on patient.
- Results: Of 1689 hospital inpatient discharges (1515 patients), 159 (9.4%) had a 30-day urgent readmission. The RRS had some discriminative ability (c statistic: 0.612; 95% confidence interval: 0.570–0.655) and good calibration.
- Conclusions: Our study shows that the RRS has some discriminative ability. The automated tool can be used to estimate the probability of a 30-day urgent readmission.
Hospital readmissions are increasingly scrutinized by the Center for Medicare and Medicaid Services and other payers due to their frequency and high cost. It is estimated that up to 25% of all patients discharged from acute care hospitals are readmitted within 30 days [1]. To address this problem, the Center for Medicare and Medicaid Services is using these rates as one of the benchmarks for quality for hospitals and health care organizations and has begun to assess penalties to those institutions with the highest rates. This scrutiny and the desire for better patient care transitions has resulted in most hospitals implementing various initiatives to reduce potentially avoidable readmissions.
Multiple interventions have been shown to reduce readmissions [2,3]. These interventions have varying effectiveness and are often labor intensive and thus costly to the institutions implementing them. In fact, no one intervention has been shown to be effective alone [4], and it may take several concurrent interventions targeting the highest risk patients to improve transitions of care at discharge that result in reduced readmissions. Many experts do recommend risk stratifying patients in order to target interventions to the highest risk patients for effective use of resources [5,6]. Several risk factor assessments have been proposed with varying success [7–13]. Multiple factors can limit the effectiveness of these risk stratification profiles. They may have low sensitivity and specificity, be based solely on retrospective data, be limited to certain populations, or be created from administrative data only without taking psychosocial factors into consideration [14].
An effective risk assessment ideally would encompass multiple known risk factors including certain comorbidities such as malignancy and heart failure, psychosocial factors such as health literacy and social support, and administrative data including payment source and demographics. All of these have been shown in prior studies to contribute to readmissions [7–13]. In addition, availability of the assessment early in the hospitalization would allow for interventions throughout the hospital stay to mitigate the effect of these factors where possible. To address these needs, our institution formed a readmission task force in January 2010 to review published literature on hospital 30-day readmissions and create a readmission risk score (RRS). The aim of this study was to quantify the predictive performance of the RRS after it was first implemented into the electronic medical record (EMR) in November 2012.
Methods
Study Design and Cohort
All consecutive adult inpatients who were discharged between 1 November 2012 and 31 December 2012 were included in this retrospective cohort study. This narrow time frame corresponded to the period from RRS tool implementation to the start of readmission interventions. We excluded hospitalizations if the patient died in the hospital.
Outcome Measures
The primary outcome was a 30-day urgent readmission, which included readmissions categorized as either emergency, urgent, or semi-urgent. Secondary outcomes included any 30-day readmission and 30-day death. Only readmissions to Mayo Clinic were examined.
Predictors
In collaboration with the information technology department, an algorithm was written to extract data from the EMR for each patient within 24 hours of admission to the hospital. This data was retrieved from existing repositories of patient information, such as demographic information, payer source, medication list, problem list, and past medical history. In addition, each patient was interviewed by a nurse at the time of admission, and the nurse completed an “admission profile” in the EMR that confirmed or entered past medical history, medications, social support at home, depression symptoms, and learning styles, among other information (Table 1). The algorithm was able to extract data from this evaluation also, so that each element of the risk score was correlated to at least one data source in the EMR. The algorithm then assigned the correct value to each element, and the total score was electronically calculated and placed in a discrete cell in each patient’s record. The algorithm was automatically run again 48 hours after the initial scoring in order to assure completeness of the information. If the patient had a length of stay greater than 5 days, an additional score was generated to include the length of stay component.
Statistical Analysis
The predictive performance of the RRS was assessed by evaluating the discrimination and calibration. Discrimination is the ability of the RRS to separate those who had a 30-day urgent readmission and those who did not. Discrimination was quantified by the c statistic, which is equivalent to the area under the receiver operating characteristic curve in this study owing to the use of binary endpoints. A c statistic of 1.0 would indicate that the RRS perfectly predicts 30-day urgent readmission while a c statistic of 0.5 would indicate the RRS has no apparent accuracy in predicting 30-day urgent readmission. Calibration assesses how closely predicted outcomes agree with observed outcomes. The predicted probability of 30-day urgent readmission was estimated utilizing a generalized estimating equation model, clustering on patient, with RRS as the only predictor variable. Inpatient discharges were divided into deciles of the predicted probabilities for 30-day urgent readmission. Agreement of the predicted and observed outcomes was displayed graphically according to decile of the predicted outcomes. All analyses were performed using SAS (version 9.3, SAS Institute, Cary, NC) and R statistical software (version 3.1.1, R Foundation for Statistical Computing, Vienna, Austria).
Results
The RRS was significantly associated with 30-day urgent readmission (odds ratio [OR] for 1-point increase in the RRS, 1.07 [95% confidence interval {CI} 1.05–1.10]; P < 0.001). A c statistic of 0.612 (95% CI 0.570–0.655) indicates that the RRS has some ability to discriminate between those with and without a 30-day urgent readmission (Figure, Table 3). The expected and observed probabilities of 30-day urgent readmission were similar in each decile of the RRS. The calibration (Table 4) shows that although there is some deviation between the observed and expected probabilities,
The RRS was also significantly associated with each of the secondary outcome measures. The odds ratios for a 1-point increase in the RRS for any 30-day readmission was 1.06 (95% CI 1.03–1.09, P < 0.001) and the c statistic was 0.591 (95% CI 0.551–0.631, Table 2). The odds ratios for a 1-point increase in the
Discussion
Our study provides evidence that the RRS has some ability to discriminate between patients who did and did not have a 30-day urgent readmission (c statistic 0.612 [95% CI 0.570–0.655]). More importantly the calibration appears to be good particularly in the higher risk patients, which are the most crucial to identify in order to target interventions.
In addition to predicting the risk of readmission, our method of risk evaluation has several other advantages. First, the risk score is assigned to each patient within 24 to 48 hours of admission by using elements available at the time of, or soon after, admission. This early evaluation during the hospitalization identifies patients who could benefit from interventions throughout the stay that could help mitigate the risks and allow for a safer transition. Other studies have used elements available only at discharge, such as lab values and length of stay [7,11]. Donze et al used 7 elements in a validated scoring system, but several of the elements were discharge values and the risk assessment system had a fair discriminatory value with a c statistic of 0.71, similar to our results. The advantage to having the score available at admission is that several of the factors used to compose the RRS could be addressed during the hospitalization, including increased education for those with greater than 7 medications, intensive care management intervention for those with a lack of social support, and increased or modified education for those with low health literacy.
Second, the score is derived entirely from elements available in the EMR, thus the score is calculated automatically within 24 hours of admission and displayed in the chart for all providers to access. This eliminates any need for individual chart review or patient evaluation outside the normal admission process, making this system extremely efficient. Van Walraven et al [9] devised a scoring system using length of stay, acuity of admission, comorbidities and emergency department use (LACE index), with a validation c statistic of 0.684, which again is similar to our results. However, the LACE index uses the Charlson comorbidity index as a measure of patient comorbidity and this can be cumbersome to calculate in clinical practice. Having the score automatically available to all providers caring for the patient increases their awareness of the patient’s level of risk. Allaudeen and colleagues showed that providers are unable to intuitively predict those patients who are at high-risk for readmission [15]; therefore, an objective, readily available risk stratification is necessary to inform the providers.
Third, the risk scoring system uses elements from varied sources to include social, medical, and individual factors, all of which have been shown to increase risk of 30-day readmissions [9,15]. An accurate risk scoring system, ideally, should include elements from multiple sources, and use of the EMR allows for this varied compilation. The risk evaluation is done on every patient, regardless of admitting diagnosis, and in spite of this heterogeneous population, it was still found to be significantly accurate. Prior studies have looked at individual populations [7,10,12,13,16]; however, this can miss many patient populations that are also high-risk. Tailoring individual risk algorithms by diagnosis can also be labor intensive.
Our study has limitations. It is a retrospective study and included a relatively short study period of 2 months. This period was chosen because it represented the time from when the RRS was first implemented to when interventions to reduce readmission according to the RRS began, however, it still encompassed a significant number of discharges. We were only able to evaluate readmissions to our own facility; therefore, patients readmitted to other facilities were not included. Although readmission to any facility is undesirable, having a risk scoring system that can reliably predict readmission to the index admission hospital is still helpful. In addition, we only validated the risk score on patients in our own facility. A larger population from multiple facilities would be helpful for further validation. In spite of this limitation we would expect that most of our readmissions return to our own facility given our community setting. In fact, based on Medicare data for readmissions to all facilities, the difference in readmission rate between our facility and all facilities differs by less than 4%.
In summary, we developed a comprehensive risk scoring system that proved to be moderately predictive of readmission that encompasses multiple factors, is available to all providers early in a hospitalization, and is completely automated via the EMR. Further studies are ongoing to refine this score and improve the predictive performance.
Corresponding author: Nancy L. Dawson, MD, Division of Hospital Medicine, Mayo Clinic, 4500 San Pablo Road, Jacksonville, FL 32224, dawson.nancy11@mayo.edu.
Financial disclosures: None.
1. Elixhauser A, Steiner C. Statistical Brief #153: Readmissions to U.S. hospitals by diagnosis, 2010. Agency for Healthcare Research and Quality; 2013. Available at www.hcup-us.ahrq.gov/reports/statbriefs/sb153.pdf.
2. Jack BW, Chetty VK, Anthony D, et al. A reengineered hospital discharge program to decrease rehospitalization: a randomized trial. Ann Intern Med 2009;150:178–87.
3. Boutwell A, Hwu S. Effective interventions to reduce rehospitalizations: a survey of the published evidence. Cambridge, MA: Institute for Healthcare Improvement; 2009. Available at www.ihi.org/resources/Pages/Publications/EffectiveInterventionsReduceRehospitalizationsASurveyPublishedEvidence.aspx.
4. Hansen LO, Young RS, Hinami K, et al. Interventions to reduce 30-day rehospitalization: a systematic review. Ann Intern Med 2011;155:520–8.
5. Kripalani S, Theobald CN, Anctil B, Vasilevskis EE. Reducing hospital readmission rates: current strategies and future directions. Ann Rev Med 2014;65:471–85.
6. Osei-Anto A, Joshi M, Audet AM, et al. Health care leader action guide to reduce avoidable readmissions. Chicago: Health Research & Educational Trust; 2010. Available at www.hret.org/care/projects/resources/readmissions_cp.pdf.
7. Zaya M, Phan A, Schwarz ER. Predictors of re-hospitalization in patients with chronic heart failure. World J Cardiol 2012;4:23–30.
8. Hu J, Gonsahn MD, Nerenz DR. Socioeconomic status and readmissions: evidence from an urban teaching hospital. Health Aff (Millwood) 2014;33:778–85.
9. van Walraven C, Dhalla IA, Bell C, et al. Derivation and validation of an index to predict early death or unplanned readmission after discharge from hospital to the community. CMAJ 2010;182:551–7.
10. Rana S, Tran T, Luo W, et al. Predicting unplanned readmission after myocardial infarction from routinely collected administrative hospital data. Aust Health Rev 2014;38:377–82.
11. Donze J, Aujesky D, Williams D, Schnipper JL. Potentially avoidable 30-day hospital readmissions in medical patients: derivation and validation of a prediction model. JAMA Intern Med 2013;173:632–8.
12. Kogon B, Jain A, Oster M, et al. Risk factors associated with readmission after pediatric cardiothoracic surgery. Ann Thorac Surg 2012;94:865–73.
13. Harhay M, Lin E, Pai A, et al. Early rehospitalization after kidney transplantation: assessing preventability and prognosis. Am J Transplant 2013;13:3164–72.
14. Preventing unnecessary readmissions: transcending the hospital’s four walls to achieve collaborative care coordination. The Advisory Board Company; 2010. Available at www.advisory.com/research/physician-executive-council/studies/2010/preventing-unnecessary-readmissions.
15. Allaudeen N, Schnipper JL, Orav EJ, et al. Inability of providers to predict unplanned readmissions. J Gen Intern Med 2011;26:771–6.
16. Calvillo-King L, Arnold D, Eubank KJ, et al. Impact of social factors on risk of readmission or mortality in pneumonia and heart failure: systematic review. J Gen Intern Med 2013;28:269–82.
Can Cardiovascular Magnetic Resonance, Myocardial Perfusion Scintigraphy, or NICE Guidelines Prevent Unnecessary Angiography?
Study Overview
Objective. To assess whether noninvasive functional imaging strategies reduced unnecessary angiography compared with UK national guidelines–directed care.
Design. 3–parallel group, multicenter randomized clinical trial using a pragmatic comparative effectiveness design.
Setting and participants. Participants were patients from 6 UK centers (Leeds, Glasgow, Leicester, Bristol, Oxford, London) age 30 years or older with suspected angina pectoris, a coronary heart disease (CHD) pretest likelihood of 10% to 90%, and who were suitable for revascularization. They were randomly assigned at a 1:2:2 allocation ratio to the UK NICE (National Institute for Health Care Excellence) guidelines or to care guided by the results of cardiovascular magnetic resonance (CMR) or myocardial perfusion scintigraphy (MPS).
Main outcome measures. The primary outcome of the study was protocol-defined unnecessary coronary angiography occurring within 12 months, defined by a normal FFR (fractional flow reserve) > 0.8, or quantitative coronary angiography (QCA) showing no percentage diameter stenosis ≥ 70% in 1 view or ≥ 70% in 2 orthogonal views in all vessels 2.5 mm or more in diameter within 12 months. Because of the study design, this included any unnecessary angiography occurring after a false-positive test result, patients with high CHD pretest likelihood sent directly to coronary angiography in the NICE guidelines group, and imaging results that were either inconclusive or negative but overruled by the responsible physician.
Secondary endpoints included positive angiography rates, a composite of major adverse cardiovascular events (MACEs: cardiovascular death, myocardial infarction, unplanned coronary revascularization, and hospital admission for cardiovascular cause), and procedural complications.
Main results. Among 2205 patients assessed for eligibility between 23 November 2012 and 13 March 2015, 1202 patients (55% of eligible) were recruited and allocated to NICE guidelines–directed care (n = 240), or management by CMR (n = 481) or MPS (n = 481). While there were no statistical differences between the 3 groups in terms of baseline characteristics, the study population had a substantial burden of cardiovascular risk factors: 150 patients (12.5%) had diabetes, 458 patients (38.1%) had hypertension, 702 patients (58.4%) were past or current tobacco users, 483 patients (40.2%) had dyslipidemia, and 651 patients (54.2%) had a family history of premature CHD. All patients were symptomatic, with 401 patients (33.4%) reporting typical chest pain and 801 patients (66.6%) reporting atypical chest pain as their primary symptom. Overall, 265 patients (22.0%) underwent at least 1 coronary angiogram and 10 patients underwent 2 angiograms.
The number of patients with invasive coronary angiography after 12 months were as follows: 102 of the 240 patients in the NICE guidelines group (42.5% [95% confidence interval {CI} 36.2%–49.0%]), 85 of the 481 patients in the CMR group (17.7% [95% CI 14.4%–21.4%]), and 78 of the 481 patients in the MPS group (16.2% [95% CI 13.0%–19.8%]). The primary endpoint of unnecessary angiography occurred in 69 patients (28.8%) in the NICE guidelines group, 36 patients (7.5%) in the CMR group, and 34 patients (7.1%) in the MPS group. Using CMR group as reference, adjusted odds ratio (AOR) of unnecessary angiography for CMR group vs. NICE guidelines group was 0.21 (95% CI 0.12–0.34, P < 0.001), and the AOR for CMR group vs. the MPS groups was 1.27 (95% CI 0.79–2.03, P = 0.32).
For the secondary endpoints, positive angiography was observed in 29 patients (12.1% [95% CI 8.2%–16.9%]) in the NICE guidelines group, 47 patients (9.8% [95% CI 7.3%–12.8%]) in the CMR group, and 42 patients (8.7% [95% CI 6.4%–11.6%]) in the MPS group, overall P = 0.36. Annualized MACE rates ware 1.6% in the NICE guidelines group, 2.0% for the CMR group, and 2.0% for the MPS group. Adjusted hazard ratios for MACE were 1.37 (95% CI 0.52–3.57, P = 0.52) for the CMR group vs. NICE guidelines group and 0.95 (95% CI 0.46–1.95, P = 0.88) for the CMR group vs. the MPS group.
Conclusion. In patients with suspected CHD, investigation by CMR or MPS resulted in lower probability of unnecessary angiography within 12 months of care than using the NICE guideline–directed care. There was no difference in adverse outcomes as measured by MACE by using NICE guidelines, CMR, or MPS.
Commentary
Coronary heart disease is a leading cause of morbidity and mortality worldwide. Despite the advancement in noninvasive imaging and recommendations in international guidelines, invasive coronary angiography is still commonly used early in diagnostic pathways in patients with suspected CHD [1]. Previous studies demonstrated that majority of patients presenting with chest pain will not have significant obstructive coronary disease; a large US study reported that approximately 60% of elective cardiac catheterizations found no obstructive CHD [2]. Thus, avoiding unnecessary angiography should reduce patient risk and provide significant financial savings. Current guidelines for investigation of stable chest pain rely on pretest likelihood of CHD. These pretest likelihood models can overestimate CHD risk, resulting in the increase in probability of invasive coronary angiography [1,3].
The current study by Greenwood et al investigated whether CMR-guided care is superior to MPS or NICE guidelines–directed care in reducing the occurrence of unnecessary angiography within 12 months. Overall, rates of disease detection based on positive angiogram were comparable for the 3 strategies. In addition, there was no difference in adverse events as measured by a composite of MACE.
While this was an excellently performed multicenter study, there were several major limitations. First, the study population was predominately white northern European (92% were classified ethnically as white), and therefore the results may not translate to other populations. Second, the NICE guidelines for estimation of high-risk CHD changed after initiation of the study due to overestimation, and recent guidelines have adopted a recalibrated risk model [4,5]. Finally, MACE is not a proxy for a missed diagnosis or treatment. It remains debatable whether revascularization for stable angina has prognostic benefit over optimal medical therapy.
Applications for Clinical Practice
This multicenter randomized clinical trial provides strong evidence to use either cardiovascular magnetic resonance–guided care or myocardial perfusion scintigraphy–guided care instead of NICE guidelines–directed care for symptomatic patients with suspected CHD in reducing unnecessary angiography.
—Ka Ming Gordon Ngai, MD, MPH
1. 2012 ACCF/AHA/ACP/AATS/PCNA/SCAI/STS guideline for the diagnosis and management of patients with stable ischemic heart disease. Circulation 2012;126:e354–e471.
2. Patel MR, Peterson ED, Dai D, et al. Low diagnostic yield of elective coronary angiography. N Engl J Med 2010;362:
886–95.
3. Fox KA, McLean S. Nice guidance on the investigation of chest pain. Heart 2010;96:903–6.
4. Montalescot G, Sechtem U, Achenbach S, et al. 2013 ESC guidelines on the management of stable coronary artery disease. Eur Heart J 2013;34:2949–3003.
5. Genders TSS, Steyerberg EW, Alkadhi H, et al. A clinical prediction rule for the diagnosis of coronary artery disease. Eur Heart J 2011;32:1316–30.
Study Overview
Objective. To assess whether noninvasive functional imaging strategies reduced unnecessary angiography compared with UK national guidelines–directed care.
Design. 3–parallel group, multicenter randomized clinical trial using a pragmatic comparative effectiveness design.
Setting and participants. Participants were patients from 6 UK centers (Leeds, Glasgow, Leicester, Bristol, Oxford, London) age 30 years or older with suspected angina pectoris, a coronary heart disease (CHD) pretest likelihood of 10% to 90%, and who were suitable for revascularization. They were randomly assigned at a 1:2:2 allocation ratio to the UK NICE (National Institute for Health Care Excellence) guidelines or to care guided by the results of cardiovascular magnetic resonance (CMR) or myocardial perfusion scintigraphy (MPS).
Main outcome measures. The primary outcome of the study was protocol-defined unnecessary coronary angiography occurring within 12 months, defined by a normal FFR (fractional flow reserve) > 0.8, or quantitative coronary angiography (QCA) showing no percentage diameter stenosis ≥ 70% in 1 view or ≥ 70% in 2 orthogonal views in all vessels 2.5 mm or more in diameter within 12 months. Because of the study design, this included any unnecessary angiography occurring after a false-positive test result, patients with high CHD pretest likelihood sent directly to coronary angiography in the NICE guidelines group, and imaging results that were either inconclusive or negative but overruled by the responsible physician.
Secondary endpoints included positive angiography rates, a composite of major adverse cardiovascular events (MACEs: cardiovascular death, myocardial infarction, unplanned coronary revascularization, and hospital admission for cardiovascular cause), and procedural complications.
Main results. Among 2205 patients assessed for eligibility between 23 November 2012 and 13 March 2015, 1202 patients (55% of eligible) were recruited and allocated to NICE guidelines–directed care (n = 240), or management by CMR (n = 481) or MPS (n = 481). While there were no statistical differences between the 3 groups in terms of baseline characteristics, the study population had a substantial burden of cardiovascular risk factors: 150 patients (12.5%) had diabetes, 458 patients (38.1%) had hypertension, 702 patients (58.4%) were past or current tobacco users, 483 patients (40.2%) had dyslipidemia, and 651 patients (54.2%) had a family history of premature CHD. All patients were symptomatic, with 401 patients (33.4%) reporting typical chest pain and 801 patients (66.6%) reporting atypical chest pain as their primary symptom. Overall, 265 patients (22.0%) underwent at least 1 coronary angiogram and 10 patients underwent 2 angiograms.
The number of patients with invasive coronary angiography after 12 months were as follows: 102 of the 240 patients in the NICE guidelines group (42.5% [95% confidence interval {CI} 36.2%–49.0%]), 85 of the 481 patients in the CMR group (17.7% [95% CI 14.4%–21.4%]), and 78 of the 481 patients in the MPS group (16.2% [95% CI 13.0%–19.8%]). The primary endpoint of unnecessary angiography occurred in 69 patients (28.8%) in the NICE guidelines group, 36 patients (7.5%) in the CMR group, and 34 patients (7.1%) in the MPS group. Using CMR group as reference, adjusted odds ratio (AOR) of unnecessary angiography for CMR group vs. NICE guidelines group was 0.21 (95% CI 0.12–0.34, P < 0.001), and the AOR for CMR group vs. the MPS groups was 1.27 (95% CI 0.79–2.03, P = 0.32).
For the secondary endpoints, positive angiography was observed in 29 patients (12.1% [95% CI 8.2%–16.9%]) in the NICE guidelines group, 47 patients (9.8% [95% CI 7.3%–12.8%]) in the CMR group, and 42 patients (8.7% [95% CI 6.4%–11.6%]) in the MPS group, overall P = 0.36. Annualized MACE rates ware 1.6% in the NICE guidelines group, 2.0% for the CMR group, and 2.0% for the MPS group. Adjusted hazard ratios for MACE were 1.37 (95% CI 0.52–3.57, P = 0.52) for the CMR group vs. NICE guidelines group and 0.95 (95% CI 0.46–1.95, P = 0.88) for the CMR group vs. the MPS group.
Conclusion. In patients with suspected CHD, investigation by CMR or MPS resulted in lower probability of unnecessary angiography within 12 months of care than using the NICE guideline–directed care. There was no difference in adverse outcomes as measured by MACE by using NICE guidelines, CMR, or MPS.
Commentary
Coronary heart disease is a leading cause of morbidity and mortality worldwide. Despite the advancement in noninvasive imaging and recommendations in international guidelines, invasive coronary angiography is still commonly used early in diagnostic pathways in patients with suspected CHD [1]. Previous studies demonstrated that majority of patients presenting with chest pain will not have significant obstructive coronary disease; a large US study reported that approximately 60% of elective cardiac catheterizations found no obstructive CHD [2]. Thus, avoiding unnecessary angiography should reduce patient risk and provide significant financial savings. Current guidelines for investigation of stable chest pain rely on pretest likelihood of CHD. These pretest likelihood models can overestimate CHD risk, resulting in the increase in probability of invasive coronary angiography [1,3].
The current study by Greenwood et al investigated whether CMR-guided care is superior to MPS or NICE guidelines–directed care in reducing the occurrence of unnecessary angiography within 12 months. Overall, rates of disease detection based on positive angiogram were comparable for the 3 strategies. In addition, there was no difference in adverse events as measured by a composite of MACE.
While this was an excellently performed multicenter study, there were several major limitations. First, the study population was predominately white northern European (92% were classified ethnically as white), and therefore the results may not translate to other populations. Second, the NICE guidelines for estimation of high-risk CHD changed after initiation of the study due to overestimation, and recent guidelines have adopted a recalibrated risk model [4,5]. Finally, MACE is not a proxy for a missed diagnosis or treatment. It remains debatable whether revascularization for stable angina has prognostic benefit over optimal medical therapy.
Applications for Clinical Practice
This multicenter randomized clinical trial provides strong evidence to use either cardiovascular magnetic resonance–guided care or myocardial perfusion scintigraphy–guided care instead of NICE guidelines–directed care for symptomatic patients with suspected CHD in reducing unnecessary angiography.
—Ka Ming Gordon Ngai, MD, MPH
1. 2012 ACCF/AHA/ACP/AATS/PCNA/SCAI/STS guideline for the diagnosis and management of patients with stable ischemic heart disease. Circulation 2012;126:e354–e471.
2. Patel MR, Peterson ED, Dai D, et al. Low diagnostic yield of elective coronary angiography. N Engl J Med 2010;362:
886–95.
3. Fox KA, McLean S. Nice guidance on the investigation of chest pain. Heart 2010;96:903–6.
4. Montalescot G, Sechtem U, Achenbach S, et al. 2013 ESC guidelines on the management of stable coronary artery disease. Eur Heart J 2013;34:2949–3003.
5. Genders TSS, Steyerberg EW, Alkadhi H, et al. A clinical prediction rule for the diagnosis of coronary artery disease. Eur Heart J 2011;32:1316–30.
Is There a Dose-Response Relationship Between Weight Loss and Symptom Improvement in Persons With Knee Osteoarthritis?
Study Overview
Objective. To determine if there is an additive benefit of weight loss for pain and functioning in patients with established symptomatic osteoarthritis (OA) of the knee.
Design. Cohort study.
Setting and participants. Participants living in Australia who had completed the Osteoarthritis Healthy Weight For Life program (OAHWFL), a program run by Prima Health Solutions on behalf of participating health funds in Australia and New Zealand; its full cost is borne by the insurance/health care fund. Patients in the program are invited to enroll based on age (≥ 50) and claims data indicating knee OA; patients wishing to enroll must obtain a referral from their doctor confirming weight and height and radiographic or arthroscopic diagnosis of knee OA. Participants in the program had a body mass index (BMI) > 28 kg/m2 and met 1986 American College of Rheumatology clinical criteria for knee OA. Further, participants were deemed to clinically require referral to orthopedic surgeon and were surgical candidates by medical opinion.
Intervention. The OAHWFL program is a specialized knee and hip OA management program that focuses on weight loss, utilizing a portion-controlled eating plan with meal replacements, an activity plan, a personalized online tracker, and personal support. It is delivered remotely via phone, texts, email, message board, and mail. The 18-week program consists of 3 phases. During the first 6-week phase, participants were instructed to consume a nutritionally complete very low calorie meal replacement (KicStart, Prima Health Solutions) for 2 meals per day with controlled portions and “free foods” (eg, berries and leafy greens). During the second 6-week phase, participants were transitioned off the meal replacements onto a portion-controlled meal plan, with 1 meal replacement per day. In the final phase, participants consumed portion-controlled whole foods for all 3 meals. All phases included recommendations for moderate aerobic exercise 3 times per week for an increasing time period and intensity, online healthy eating and lifestyle education, and telephone motivation and support at predetermined intervals and on demand.
Main outcome measure. The main outcome measure was percentage of body weight lost from baseline to 18 weeks. Additionally, the validated Knee Injury and Osteoarthritis Outcome Score (KOOS) questionnaire was administered to all participants. The 5 KOOS subscales (pain, other symptoms, function in daily living, function in recreation, and knee-related quality of life) were co-primary outcomes. The validated Western Ontario McMaster Universities Osteoarthritis Index (WOMAC) function score was derived from KOOS. The dose-response relationship was assessed using weight change categories (< 2.5%, 2.5–5.0%, 5.1–7.5%, 7.6%–10%, and > 10%) and change in KOOS scores.
Main results. At the time of analysis, 3827 persons with knee or hip OA were approved by their doctor to participate. Of these 155 had not yet started the program, 728 were undergoing the program, and 846 had discontinued or were lost to follow-up. Of the 2098 who completed the program, 715 were excluded because of incomplete data or OA of the hip, leaving 1383 participants. Overall the baseline mean weight was 95.12 ± 17.2 kg with a mean BMI of 34.39 ± 5.17. Average age was 64 ± 8.7.
94.2% (1304 participants) had a greater than 2.5% reduction in body weight at the end of 18 weeks. 31.1% lost ≥ 10% body weight, 22.9% lost between 7.5 and 10%, 24% lost between 5 and 7.5%, 16.1% lost between 2.5–5%, and 5.7% of participants lost ≤ 2.5%. The greatest amount of weight loss was associated with the greatest improvement of both KOOS and WOMAC scores, with a significant dose-response relationship between weight loss and knee OA symptoms. This persisted in regression analysis adjusted for baseline KOOS and weight, sex, and age. Those with the largest weight loss improved their KOOS scores by 16.17 ± 16.1. The second highest weight loss group has an improvement in KOOS scores by 13.3 ± 15.1, then next highest 12.0 ± 17.1, followed by 9.9 ± 16.8 and finally an improvement of 6.1 ± 13.0 in the weight loss of ≤ 2.5% cohort.
Conclusion. This study showed a relationship between weight loss and improvement in knee OA pain and functioning, with greater weight loss resulting in greater improvement in both categories. Those who were better functioning at the commencement of the study required less weight loss to reach a meaningful improvement in functioning and pain compared to those who started with worse functional status. The OAHWFL intervention was shown to be an effective method of weight loss over an 18-month period.
Commentary
OA is the most common form of arthritis in the United States and the incidence has been rising. A recent study conducted by the Mayo Clinic found OA to be the second most common reason for ambulatory primary care visits, second only to dermatologic complaints [1].It is estimated that the average direct cost of OA per patient is $2600 per year [2], with job-related costs of $3.4 to $13.2 billion per year [3]. Knee replacements alone amounted to $28.5 billion in 2009 [4]. Aside from the financial burden of OA is its impact on quality of life. While genetic predisposition is important in disease pathogenesis, there are well established modifiable risk factors for OA. Among these is maintenance of a healthy weight and physical activity, both of which were addressed in this study.
There is high-quality evidence that weight loss improves the symptoms of knee OA [5]. The current study evaluated whether a dietary intervention for knee OA would be effective in a real-world setting, outside the controlled conditions of a randomized trial. Short-term weight loss did provide pain relief and increase functioning; however, the study does not report weight trajectory after cessation of the intervention. It would be more meaningful to know how many of the participants maintained weight loss after a longer period of time. In addition, it is unclear if the gain in function and pain control was from the weight loss or regular physical activity. A control group that participated in the physical activity without significant weight loss would have strengthened the association between weight loss and KOOS and WOMAC measures.
Though this study took place in a community setting and was tested in both rural and urban settings, the results may not be generalizable to patients who are not already motivated to lose weight, as patients self-nominated themselves to enroll in the program. This study also made use of meal supplements, which were supplied at no cost to patients. Without dedicated funding to supply the meal replacements in addition to the support program, it would be difficult to replicate these results. However, some insurance carriers will cover similar programs that provide validated methods for weight loss, which may be a feasible alternative. Other limitations to the study included lack of a control group, reliance on self-reported weight loss data, and that persons who discontinued the program were not included in the analysis.
Applications for Clinical Practice
Body mechanics and increased inflammation associated with obesity both contribute to worsening of knee OA. The dose-response relationship shown in this study of weight loss in overweight or obese people with OA of the knee is encouraging. Previous studies have shown a clear relationship between weight loss and improvement in pain. The most well-known is perhaps the 4-pound weight rule, which states that for every pound of weight lost, there is a 4-pound reduction in the load exerted on the knee for each step taken [5].Concrete examples of the benefits of weight loss that providers can share with their patients makes discussion about weight loss tangible. Further, the study teased out that those with better physical functioning at the start of the study required less weight loss to achieve gains in pain reduction and functional status. As the hazards of obesity continue to come to light, more community-based weight loss programs are becoming available. Most of the participants in this study successfully lost weight using a community-based approach, highlighting the usefulness of these programs. Weight loss in a community setting is a challenge to all providers. Knowing which patients will benefit the most from a weight loss program can help direct providers to personalized recommendations.
—Christina Downey, MD,
Geisinger Medical Center, Danville, PA.
1. St. Sauver JL, Warner DO, Yawn BP, et al. Why patients visit their doctors: assessing the most prevalent conditions in a defined American population. Mayo Clin Proc 2013;88:56–67.
2. Maetzel A, Li LC, Pencharz J, et al. The economic burden associated with osteoarthritis, rheumatoid arthritis, and hypertension: a comparative study. Ann Rheum Dis 2004;63:395–401.
3. Buckwalter JA, Saltzman C, Brown T. The impact of osteoarthritis. Clin Orthoped Rel Res 2004;42 7S:S6–S15.
4. Murphy L, Helmick CG.The impact of osteoarthritis in the United States: a population-health perspective. Am J Nurs 2012;112(3 Suppl 1):S13–9.
5. Messier SP1, Gutekunst DJ, Davis C, DeVita P. Weight loss reduces knee-joint loads in overweight and obese older adults with knee osteoarthritis. Arthrit Rheum 2005;52:2026–32.
Study Overview
Objective. To determine if there is an additive benefit of weight loss for pain and functioning in patients with established symptomatic osteoarthritis (OA) of the knee.
Design. Cohort study.
Setting and participants. Participants living in Australia who had completed the Osteoarthritis Healthy Weight For Life program (OAHWFL), a program run by Prima Health Solutions on behalf of participating health funds in Australia and New Zealand; its full cost is borne by the insurance/health care fund. Patients in the program are invited to enroll based on age (≥ 50) and claims data indicating knee OA; patients wishing to enroll must obtain a referral from their doctor confirming weight and height and radiographic or arthroscopic diagnosis of knee OA. Participants in the program had a body mass index (BMI) > 28 kg/m2 and met 1986 American College of Rheumatology clinical criteria for knee OA. Further, participants were deemed to clinically require referral to orthopedic surgeon and were surgical candidates by medical opinion.
Intervention. The OAHWFL program is a specialized knee and hip OA management program that focuses on weight loss, utilizing a portion-controlled eating plan with meal replacements, an activity plan, a personalized online tracker, and personal support. It is delivered remotely via phone, texts, email, message board, and mail. The 18-week program consists of 3 phases. During the first 6-week phase, participants were instructed to consume a nutritionally complete very low calorie meal replacement (KicStart, Prima Health Solutions) for 2 meals per day with controlled portions and “free foods” (eg, berries and leafy greens). During the second 6-week phase, participants were transitioned off the meal replacements onto a portion-controlled meal plan, with 1 meal replacement per day. In the final phase, participants consumed portion-controlled whole foods for all 3 meals. All phases included recommendations for moderate aerobic exercise 3 times per week for an increasing time period and intensity, online healthy eating and lifestyle education, and telephone motivation and support at predetermined intervals and on demand.
Main outcome measure. The main outcome measure was percentage of body weight lost from baseline to 18 weeks. Additionally, the validated Knee Injury and Osteoarthritis Outcome Score (KOOS) questionnaire was administered to all participants. The 5 KOOS subscales (pain, other symptoms, function in daily living, function in recreation, and knee-related quality of life) were co-primary outcomes. The validated Western Ontario McMaster Universities Osteoarthritis Index (WOMAC) function score was derived from KOOS. The dose-response relationship was assessed using weight change categories (< 2.5%, 2.5–5.0%, 5.1–7.5%, 7.6%–10%, and > 10%) and change in KOOS scores.
Main results. At the time of analysis, 3827 persons with knee or hip OA were approved by their doctor to participate. Of these 155 had not yet started the program, 728 were undergoing the program, and 846 had discontinued or were lost to follow-up. Of the 2098 who completed the program, 715 were excluded because of incomplete data or OA of the hip, leaving 1383 participants. Overall the baseline mean weight was 95.12 ± 17.2 kg with a mean BMI of 34.39 ± 5.17. Average age was 64 ± 8.7.
94.2% (1304 participants) had a greater than 2.5% reduction in body weight at the end of 18 weeks. 31.1% lost ≥ 10% body weight, 22.9% lost between 7.5 and 10%, 24% lost between 5 and 7.5%, 16.1% lost between 2.5–5%, and 5.7% of participants lost ≤ 2.5%. The greatest amount of weight loss was associated with the greatest improvement of both KOOS and WOMAC scores, with a significant dose-response relationship between weight loss and knee OA symptoms. This persisted in regression analysis adjusted for baseline KOOS and weight, sex, and age. Those with the largest weight loss improved their KOOS scores by 16.17 ± 16.1. The second highest weight loss group has an improvement in KOOS scores by 13.3 ± 15.1, then next highest 12.0 ± 17.1, followed by 9.9 ± 16.8 and finally an improvement of 6.1 ± 13.0 in the weight loss of ≤ 2.5% cohort.
Conclusion. This study showed a relationship between weight loss and improvement in knee OA pain and functioning, with greater weight loss resulting in greater improvement in both categories. Those who were better functioning at the commencement of the study required less weight loss to reach a meaningful improvement in functioning and pain compared to those who started with worse functional status. The OAHWFL intervention was shown to be an effective method of weight loss over an 18-month period.
Commentary
OA is the most common form of arthritis in the United States and the incidence has been rising. A recent study conducted by the Mayo Clinic found OA to be the second most common reason for ambulatory primary care visits, second only to dermatologic complaints [1].It is estimated that the average direct cost of OA per patient is $2600 per year [2], with job-related costs of $3.4 to $13.2 billion per year [3]. Knee replacements alone amounted to $28.5 billion in 2009 [4]. Aside from the financial burden of OA is its impact on quality of life. While genetic predisposition is important in disease pathogenesis, there are well established modifiable risk factors for OA. Among these is maintenance of a healthy weight and physical activity, both of which were addressed in this study.
There is high-quality evidence that weight loss improves the symptoms of knee OA [5]. The current study evaluated whether a dietary intervention for knee OA would be effective in a real-world setting, outside the controlled conditions of a randomized trial. Short-term weight loss did provide pain relief and increase functioning; however, the study does not report weight trajectory after cessation of the intervention. It would be more meaningful to know how many of the participants maintained weight loss after a longer period of time. In addition, it is unclear if the gain in function and pain control was from the weight loss or regular physical activity. A control group that participated in the physical activity without significant weight loss would have strengthened the association between weight loss and KOOS and WOMAC measures.
Though this study took place in a community setting and was tested in both rural and urban settings, the results may not be generalizable to patients who are not already motivated to lose weight, as patients self-nominated themselves to enroll in the program. This study also made use of meal supplements, which were supplied at no cost to patients. Without dedicated funding to supply the meal replacements in addition to the support program, it would be difficult to replicate these results. However, some insurance carriers will cover similar programs that provide validated methods for weight loss, which may be a feasible alternative. Other limitations to the study included lack of a control group, reliance on self-reported weight loss data, and that persons who discontinued the program were not included in the analysis.
Applications for Clinical Practice
Body mechanics and increased inflammation associated with obesity both contribute to worsening of knee OA. The dose-response relationship shown in this study of weight loss in overweight or obese people with OA of the knee is encouraging. Previous studies have shown a clear relationship between weight loss and improvement in pain. The most well-known is perhaps the 4-pound weight rule, which states that for every pound of weight lost, there is a 4-pound reduction in the load exerted on the knee for each step taken [5].Concrete examples of the benefits of weight loss that providers can share with their patients makes discussion about weight loss tangible. Further, the study teased out that those with better physical functioning at the start of the study required less weight loss to achieve gains in pain reduction and functional status. As the hazards of obesity continue to come to light, more community-based weight loss programs are becoming available. Most of the participants in this study successfully lost weight using a community-based approach, highlighting the usefulness of these programs. Weight loss in a community setting is a challenge to all providers. Knowing which patients will benefit the most from a weight loss program can help direct providers to personalized recommendations.
—Christina Downey, MD,
Geisinger Medical Center, Danville, PA.
1. St. Sauver JL, Warner DO, Yawn BP, et al. Why patients visit their doctors: assessing the most prevalent conditions in a defined American population. Mayo Clin Proc 2013;88:56–67.
2. Maetzel A, Li LC, Pencharz J, et al. The economic burden associated with osteoarthritis, rheumatoid arthritis, and hypertension: a comparative study. Ann Rheum Dis 2004;63:395–401.
3. Buckwalter JA, Saltzman C, Brown T. The impact of osteoarthritis. Clin Orthoped Rel Res 2004;42 7S:S6–S15.
4. Murphy L, Helmick CG.The impact of osteoarthritis in the United States: a population-health perspective. Am J Nurs 2012;112(3 Suppl 1):S13–9.
5. Messier SP1, Gutekunst DJ, Davis C, DeVita P. Weight loss reduces knee-joint loads in overweight and obese older adults with knee osteoarthritis. Arthrit Rheum 2005;52:2026–32.
Managing Pain in Postoperative Patients: What the Hospitalist Needs to Know

Start earning free CME credits today at www.shmconsults.com.
Start earning free CME credits today at www.shmconsults.com.
Start earning free CME credits today at www.shmconsults.com.
You Can Earn CME with shmConsults

Appropriate Use of Targeted Oral Anticoagulants to Prevent Stroke in Patients with Nonvalvular Atrial Fibrillation
This activity includes thorough discussions on initial management of patients with nonvalvular atrial fibrillation (NVAF), appropriate situations for oral anticoagulation in the presence of NVAF, appropriate choice of oral anticoagulant, reversal of oral anticoagulation, and guidelines for oral anticoagulation and stroke prevention in NVAF patients and special-population NVAF patients.
Four modules addressing various aspects of anticoagulation/thrombosis have been updated and include:
- Target-Specific Oral Anticoagulants for Stroke Prophylaxis in Patients with NVAF
- Management of Postoperative Atrial Fibrillation
- Perioperative Bridging of Anticoagulant Therapy
- Perioperative Management of Anticoagulation

FDA clears use of coagulation analyzer

The US Food and Drug Administration (FDA) has granted 510(k) clearance for the Xprecia Stride Coagulation Analyzer from Siemens Healthcare Diagnostics.
This hand-held, portable coagulation analyzer is designed to deliver prothrombin time/international normalized ratio (PT/INR) testing for point-of-care (POC) monitoring and management of oral anticoagulation therapy with the vitamin K antagonist warfarin.
The Xprecia Stride Coagulation Analyzer is the first POC PT/INR device cleared by the FDA based on the new rules published in March 2016.
The analyzer uses fresh capillary whole blood, and results are expressed as INR. The Xprecia Stride Coagulation Analyzer utilizes the same Dade® Innovin® reagent used by Siemens Healthineers central lab analyzers to minimize any potential for variability.
Research has shown the performance of the Xprecia Stride Coagulation Analyzer to be equivalent to a reference laboratory hemostasis system,* with results available within minutes.
According to Siemens, the Xprecia Stride Coagulation Analyzer includes a number of innovations and features not found on most other POC analyzers.
The Xprecia Stride Coagulation Analyzer has a touchscreen interface with step-by-step instructions that help guide the user.
To further enhance usability, the analyzer features simple icons and animation in a color display more commonly found in mobile devices than medical instruments.
The Xprecia Stride Coagulation Analyzer is no bigger than a smartphone and weighs just 10.5 oz, so it can be held at virtually any angle and brought directly to the patient’s finger for blood sample collection.
The analyzer has an integrated barcode scanner intended to simplify data capture and improve patient workflow. The scanner offers patient and operator ID entry.
The Xprecia Stride Coagulation Analyzer has an operator lockout feature that restricts the analyzer’s use to trained staff only.
And the analyzer includes a first-of-its kind test strip eject button that allows the user to eject a used test strip and easily dispose of it without touching it, minimizing potential biohazard exposure.
For more information on the Xprecia Stride Coagulation Analyzer, visit www.siemens.com/xprecia. ![]()
Clinical Challenges - October 2016: Boerhaave’s syndrome (spontaneous rupture of the esophagus)
What's Your Diagnosis?
The diagnosis
Gastrografin swallow (Figure C) demonstrated rupture of the distal esophagus, with leakage of gastrografin into the mediastinum (arrow). Upper gastrointestinal endoscopy confirmed rupture of the left posterolateral wall of the distal esophagus consistent with Boerhaave’s syndrome (Figure D), and a self-expanding covered metal stent was placed.
Broad-spectrum antibiotics and nasogastric feeding were commenced, and the left pleural effusion drained with a tube thoracostomy. Unfortunately, despite initial improvement, the patient subsequently deteriorated and died 30 days after admission.
Boerhaave’s is a rare clinical entity defined as spontaneous esophageal rupture, excluding perforations resulting from foreign bodies or iatrogenic instrumentation.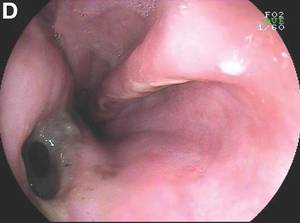
Mackler’s triad of vomiting, lower chest pain, and subcutaneous emphysema is the classical presentation but is seen in only a minority of cases; thus, diagnostic errors are common.2 Importantly, the chest radiograph is almost always abnormal, with pleural effusions or pneumomediastinum often seen.3 Surgical repair is the definitive treatment, but in patients considered unfit for surgery, conservative or endoscopic management is advocated. Mortality remains greater than 30%, and rises sharply if diagnosis is delayed,2 emphasizing the importance of awareness of this unusual diagnosis.
References
1. Lucendo, A.J., Fringal-Ruiz, A.B., Rodriguez, B. Boerhaave’s syndrome as the primary manifestation of adult eosinophilic esophagitis. (Two case reports and a review of the literature.) Dis Esophagus. 2011 Feb;24:E11-5.
2. Brauer, R.B., Liebermann-Meffert, D., Stein, H.J., et al. Boerhaave’s syndrome: Analysis of the literature and report of 18 new cases. Dis Esophagus. 1997 Jan;10:64-8.
3. Pate, J.W., Walker, W.A., Cole, F.H. Jr, et al. Spontaneous rupture of the esophagus: a 30-year experience. Ann Thorac Surg. 1989 May;47:689-92.
What's Your Diagnosis?
What's Your Diagnosis?
What's Your Diagnosis?
By Thomas P. Chapman, MD, David A. Gorard, MBBS, MD, and Emily A. Johns, MD. Published previously in Gastroenterology (2012;143:1438, 1692).
An 84-year-old man presented to the emergency department with acute left-sided chest pain, after a recent diarrheal and vomiting illness. He had a background of severe Alzheimer’s dementia and was a resident in a care home. On arrival in the emergency department, he was unable to give a clear history and was distressed by the chest pain.
Why Required Pediatric Hospital Medicine Fellowships Are Unnecessary
The Joint Council of Pediatric Hospital Medicine (JCPHM), successor to the Strategic Planning (STP) Committee, recently recommended submitting a petition for two-year pediatric hospital medicine (PHM) fellowship certification to the American Board of Pediatrics (ABP), which was completed in 2014. In December 2015, the ABP Board of Directors voted to (1) approve the proposal for a two-year PHM fellowship incorporating scholarly activity with the provision that entrustable professional activities (EPAs) be used as the framework for assessing competencies and (2) not require those who achieve and maintain PHM certification to maintain general pediatrics certification. The proposal for certification of a two-year PHM fellowship will now be submitted to the American Board of Medical Specialties (ABMS). Concerns regarding the formal certification of PHM as an ABMS-recognized subspecialty have been raised by many stakeholders, including community pediatric hospitalists, pediatric residency program directors, and med-peds physicians.
We feel that the “first, do no harm” guiding principle seems to have been forgotten by the ABP as it attempts to formalize the training of pediatric hospitalists. In December 2015, the ABP voted in favor of a two-year ACGME-accredited PHM fellowship. The intent was to “assure the best care of hospitalized children,” “assure the public,” “accelerate improvements and innovation in quality improvement,” and “raise the level of care of all hospitalized children by establishing best practices in clinical care.” To be clear, these goals are shared by all of us (although there is no indication that the public is seeking additional assurance). Prior to launching broad-scale, time-intensive, and financially costly initiatives, we should ensure that our efforts would achieve—rather than obstruct—their intended aims. In addition to a lack of evidence supporting that subspecialty certification will advance our path toward achieving these goals, there are numerous reasons a required PHM fellowship is unnecessary and potentially even harmful to the hospitalist workforce. The negative unintended consequences need to be weighed heavily.
We have found no data to support that children would receive inferior inpatient care from pediatric hospitalists due to lack of formal certification. Hospital medicine physicians are paving the way in quality improvement, high-value care, medical education, palliative care, and global health, supported in part through training in various non-accredited hospital medicine fellowships. There is nothing stopping pediatric hospitalists from establishing and disseminating best practices in clinical care. Hospitalists are already making strides in providing high-quality care at low costs, as demonstrated by the abundant PHM scholarly work described in the ABP application to the ABMS. The alleged problem of needing to build trust within the community is yet to be demonstrated, as we have leaders at local, regional, and national levels. The chief medical officer of the Centers for Medicare & Medicaid Services is a hospitalist as is our surgeon general. Hospital medicine is the fastest-growing specialty in the history of medicine,1 and we should seek to propel rather than fetter our future colleagues.
Below are our reasons for opposing this formal certification.
We already have a fellowship system.
As we all know, advanced training opportunities already exist for those interested in pursuing extra research and quality improvement training. Similar to other pediatric subspecialty fellowships, these PHM fellowships are undersubscribed (20% of PHM fellowships did not fill in 2016),2 with the majority of graduating pediatric residents transitioning to hospitalists opting not to pursue fellowship training. We should continue to let graduating pediatric residents vote with their feet without the undue influence of subspecialty certification.
Subspecialization has opportunity costs that may reduce the PHM pipeline.
Even if we assume an adequate number of fellowship programs could be developed and funded, our fear is that the decision to turn PHM into an accredited subspecialty could paradoxically reduce the pipeline of inpatient providers. Residency is already a three- to four-year endeavor (pediatrics and med-peds) that is poorly compensated and time-intensive. In the absence of evidence supporting the value of additional training, tacking on another two years seems unreasonable in the face of the student loan debt crisis, reduced compensation, and lost time for career advancement. These are significant opportunity costs. While most specialties lead to a significant pay raise to compensate for the added training time, pediatrics remains the lowest-paid physician specialty.3 Should PHM follow the trend of most pediatric subspecialties, pursuit of fellowship training would be a negative financial decision for residency graduates.4 For the health system, increasing debt-to-income ratios runs the risk of creating a medical education bubble market.5
More than 25% of med-peds graduates pursue careers in hospital medicine, a percentage that continues to grow, accounting for more than 100 new hospitalists per year.6 As a result, med-peds-trained hospitalists constitute more than 10% of the pediatric hospitalist workforce.6 Requiring PHM fellowship training may reduce this crucial pipeline of practitioners. In a 2014 unpublished survey of 225 med-peds practitioners, 78% of residents and 96% of attendings responded that they would not consider pursuing an ACGME-accredited PHM fellowship.7 This is compounded by a lack of parity with the practice of adult hospital medicine both in compensation and required training and is heightened by the fact that the training in question does not incorporate care for adult patients. There is clear consensus by 96% of med-peds hospitalists that the creation of an ACGME-certified PHM subspecialty will negatively affect the likelihood of med-peds providers pursuing PHM.7
Certification will pose a potential risk to specific patient populations.
We are also concerned that a reduced PHM workforce could disproportionately impact young adults with special healthcare needs and those children cared for in rural or community-based hospitals. Med-peds training equips providers to care for children with chronic diseases that then transition into adulthood; more than 25% provide care for young adults with special healthcare needs.6 With the increasing number of children with chronic health conditions surviving into adulthood,8 med-peds hospitalists serve essential roles in providing care and coordination for this vulnerable population. Furthermore, hospital medicine groups in medical systems that cannot support a full-time categorical pediatric hospitalist tend to employ med-peds physicians or family practitioners. Concerns with PHM certification are thus extended to those family medicine physicians who practice PHM.
Pediatric residency trains pediatricians in inpatient care.
We feel that the decision to move forward on PHM subspecialty certification calls into question the value of pediatric residency training. There is no evidence that clinical inpatient training in pediatrics residency is inadequate. If one leaves residency trained to do anything, it is practicing hospital medicine. A significant portion of residency takes place inpatient, both on wards and in the intensive care units. The 2009 ABP Foundation–funded study of PHM reported that 94% of pediatric hospitalist respondents rated their training in general clinical skills during residency as fully adequate, 85% rated their training in communication skills as fully adequate, and 73% did not believe any additional training beyond residency should be required.9 With respect to med-peds graduates, more than 90% feel equipped to care for children and adults upon residency completion.10 If the ABMS carries forward with this decision, the only clinical work one would be “certified” to do after residency is primary care. However, after completion of residency training, most of us feel at least as comfortable, if not more comfortable, caring for children in the inpatient setting.
Primary care should require subspecialty certification as well.
Furthermore, the decision to create a certified subspecialty begs the question as to why fellowship should not be mandated for those entering the field of primary care. Does the field of primary care not require research to move it forward? Does the field of primary care not require providers who can adeptly apply quality improvement methodologies to improve primary-care delivery? Does the public not require the same type of assurance? By these measures, primary care should require subspecialty certification as well. These arguments could easily be construed as an indictment of residency training.
The target should be residency training.
The PHM ABMS application describes a clinical curriculum consisting of eight core clinical rotations in various settings. That small number emphasizes the fact that extra clinical training is really not needed and that we do not require a complete overhaul of the current training system. The skills in question for the accredited PHM fellowship include communication, negotiation, leadership, quality improvement, pain management, sedation, procedures, transport, billing/coding, autonomous decision making, and scholarly practice. Are most of these not skills that we should foster in all practicing pediatricians? If graduating pediatric residents lack competence in core pediatric skills (e.g., communication, pain management, autonomous decision making), we should target improvements in residency education rather than require years of further training. Pediatrics residency training already requires training in quality improvement and is incorporating “tracks” that target areas of perceived deficiency. Those physicians who actually require specialized hospital-based skills (e.g., sedation, procedures, and transport) could receive core training during residency (e.g., through PHM tracks or electives) and further hone these skills through faculty development efforts. While non-PhD researchers may benefit from additional training in research methodologies, this training comes at the expense of time spent caring for patients on the wards and should not be required training for the majority of pediatric hospitalists pursuing purely clinical roles.
Broad-based support for a PHM subspecialty has not been demonstrated.
While approximately 40 pediatric hospitalists originated the PHM certification petition, we have not seen clear support for subspecialty certification from the community. PHM certification runs the risk of alienating the general pediatrics community, as many outpatient pediatricians continue to care for their patients in the inpatient setting. Furthermore, at tertiary-care medical centers, pediatric subspecialists often serve as hospitalists, yet this stakeholder group has not entered into this conversation. Importantly, the Association of Pediatric Program Directors (APPD) did not endorse this proposal. Many of the APPD members were quite concerned about the harm this certification could cause. While the APA Board and the AAP Board of Directors support PHM subspecialty certification, it is not clear that the rank-and-file members do. The Society of Hospital Medicine did not support or oppose certification. In an era of controversy surrounding certification requirements, prior to making a decision that will alter the direction of an entire field and impact all future residency graduates interested in entering that field, we should ensure there is broad-based support for this decision.
An alternative path has already been established and validated.
A more prudent, cost-effective, and universally acceptable approach would be to follow in the footsteps of the American Board of Internal Medicine (ABIM) and American Board of Family Medicine (ABFM) in establishing a Focused Practice in Pediatric Hospital Medicine program. This approach respects the unique body of knowledge required of those who care for hospitalized children while maintaining the required flexibility to nurture and help to mature existing training pipelines. Core hospital medicine skills should be further honed through residency curricular changes and faculty development efforts, while hospital-based physicians interested in developing niche skills could still do so via already existing fellowships.
When it comes to pediatric hospital medicine, first, do no harm.
Pediatric hospitalists are inpatient generalists by training and clinical approach. Our practices vary from large academic medical centers with every imaginable subspecialty consult service available to remote rural settings that require hospitalists to possess unique and specific skills. Some pediatric hospitalists participate in newborn care, some perform sedations, and some perform a variety of diagnostic and therapeutic procedures. The current system is meeting the needs of the vast majority of our PHM community. Changes to the residency curriculum that are already under way can address any clinical and quality improvement gaps. More than enough PHM fellowships are available to those who choose to pursue them. The public is not requesting reassurance, and the field is already advancing at a rapid rate both clinically and scholarly. Subspecialty recognition is not necessary and will likely lead to negative unintended consequences. Given the financial constraints on our current system and the need for pediatric hospitalists to be stewards of high-value care, we should make collective decisions that will clearly benefit our patients and health system. As medical professionals, our priority should always be first, do no harm.
Weijen W. Chang, MD, is chief of the Division of Pediatric Hospital Medicine at Baystate Children’s Hospital and associate professor of pediatrics at the University of Massachusetts Medical School.
Leonard Samuel Feldman, MD, is director of the Medicine-Pediatrics Urban Health Residency Program and associate professor of medicine and pediatrics at Johns Hopkins School of Medicine.
Bradley Monash, MD, is associate chief of medicine at University of California, San Francisco and assistant clinical professor of medicine and pediatrics at UCSF School of Medicine.
Archna Eniasivam, MD, is assistant clinical professor of medicine at UCSF School of Medicine.
References
- Chen C, Eagle S. “Should Pediatric HM Pursue Subspecialty Certification, Required Fellowship Training?” The Hospitalist. July 31, 2012
- Results and Data: Specialties Matching Service 2016 Appointment Year. National Resident Matching Program website. Accessed May 15, 2016.
- Medscape Pediatrician Compensation Report 2015. Medscape website. Accessed April 29, 2016.
- Rochlin JM, Simon HK. Does fellowship pay: what is the long-term financial impact of subspecialty training in pediatrics? Pediatrics. 2001;127(2):254-260.
- Asch DA, Nicholson S, Vujicic M. Are we in a medical education bubble market? N Engl J Med. 2013;369(21):1973-1975.
- O’Toole JK, Friedland AR, Gonzaga AM, et al. The practice patterns of recently graduated internal medicine-pediatric hospitalists. Hosp Pediatr. 2015;5(6):309-314.
- Society of Hospital Medicine: Survey of Med-Peds Physicians about PHM Certification. May 2014 (unpublished).
- Goodman DM, Hall M, Levin A, et al. Adults with chronic health conditions originating in childhood: inpatient experience in children’s hospitals. Pediatrics. 2011;128(1):5-13.
- Freed GL, Dunham KM, Research Advisory Committee of the American Board of P. Pediatric hospitalists: training, current practice, and career goals. J Hosp Med. 2009;4(3):179-186.
- Donnelly MJ, Lubrano L, Radabaugh CL, Lukela MP, Friedland AR, Ruch-Ross HS. The med-peds hospitalist workforce: results from the American Academy of Pediatrics Workforce Survey. Hosp Pediatr. 2015;5(11):574-579.