User login
Preventing Patient Falls
Patient falls are a national issue, creating costs for every player in the healthcare system.
“Patient falls negatively impact patient outcomes, hospital costs, and costs for insurance and health systems,” says Jennifer Hefner, PhD, MPH, lead author of “A Falls Wheel in a Large Academic Medical Center: An Intervention to Reduce Patient Falls with Harm,” published in the Journal of Healthcare Quality.
“Patients are negatively impacted by falls in terms of outcomes like loss of confidence and readmission risks,” Dr. Hefner says. “Centers for Medicare & Medicaid Services in 2008 declared they wouldn’t reimburse hospitals for treatment of fall injuries if they occurred during a patient’s stay and they could be prevented by hospitals. In terms of the cost to society, the length of stay is longer if there’s been a fall with harm, and the total charges are 60% higher between those who fell and sustained an injury and those who didn’t.”
In the researchers’ yearlong study, a falls wheel—a tool that categorized each patient on two dimensions: risk of fall and risk of injury from fall—was placed on every patient’s door. During the year, the rate of falls with harm dropped by almost 50%.
The falls wheel was just one element—the main innovative element—of the hospital’s multifaceted approach to falls prevention. The hospital also enhanced staff education and focus on the issue, launched a resource website, and sent a daily email reporting the number of falls.
“The most important thing we learned is that falls are not a nurse-sensitive indicator,” says co-author Susan Moffatt-Bruce, MD, PhD. “Falls are a team-sensitive indicator. It’s only when you realize falls are not just a nurse’s responsibility but everybody’s responsibility can you actually impact them and reduce them.”
Focusing on the problem and developing specific, multifaceted interventions was the key, the authors say.
“I don’t think everybody needs to use a falls wheel, but you need some kind of system or program,” Dr. Moffatt-Bruce says. “Just putting a wristband on someone to say they’re at high risk is great, but so what? What are you going to do about it? What are the actual items you’re asking the team to do to prevent falls?”
Reference
- Hefner JL, McAlearney AS, Mansfield J, Knupp AM, Moffatt-Bruce SD. A falls wheel in a large academic medical center: an intervention to reduce patient falls with harm. J Healthc Qual. 2015;37(6):374-380.
Fast Fact

Reference
- Barnet S, Green M, Punke H. 10 top patient safety issues for 2016. Becker’s Infection Control and Clinical Quality website. Available at: http://www.beckershospitalreview.com/quality/10-top-patient-safety-issues-for-2016.html. Published January 12, 2016. Accessed January 28, 2016.
Patient falls are a national issue, creating costs for every player in the healthcare system.
“Patient falls negatively impact patient outcomes, hospital costs, and costs for insurance and health systems,” says Jennifer Hefner, PhD, MPH, lead author of “A Falls Wheel in a Large Academic Medical Center: An Intervention to Reduce Patient Falls with Harm,” published in the Journal of Healthcare Quality.
“Patients are negatively impacted by falls in terms of outcomes like loss of confidence and readmission risks,” Dr. Hefner says. “Centers for Medicare & Medicaid Services in 2008 declared they wouldn’t reimburse hospitals for treatment of fall injuries if they occurred during a patient’s stay and they could be prevented by hospitals. In terms of the cost to society, the length of stay is longer if there’s been a fall with harm, and the total charges are 60% higher between those who fell and sustained an injury and those who didn’t.”
In the researchers’ yearlong study, a falls wheel—a tool that categorized each patient on two dimensions: risk of fall and risk of injury from fall—was placed on every patient’s door. During the year, the rate of falls with harm dropped by almost 50%.
The falls wheel was just one element—the main innovative element—of the hospital’s multifaceted approach to falls prevention. The hospital also enhanced staff education and focus on the issue, launched a resource website, and sent a daily email reporting the number of falls.
“The most important thing we learned is that falls are not a nurse-sensitive indicator,” says co-author Susan Moffatt-Bruce, MD, PhD. “Falls are a team-sensitive indicator. It’s only when you realize falls are not just a nurse’s responsibility but everybody’s responsibility can you actually impact them and reduce them.”
Focusing on the problem and developing specific, multifaceted interventions was the key, the authors say.
“I don’t think everybody needs to use a falls wheel, but you need some kind of system or program,” Dr. Moffatt-Bruce says. “Just putting a wristband on someone to say they’re at high risk is great, but so what? What are you going to do about it? What are the actual items you’re asking the team to do to prevent falls?”
Reference
- Hefner JL, McAlearney AS, Mansfield J, Knupp AM, Moffatt-Bruce SD. A falls wheel in a large academic medical center: an intervention to reduce patient falls with harm. J Healthc Qual. 2015;37(6):374-380.
Fast Fact
Reference
- Barnet S, Green M, Punke H. 10 top patient safety issues for 2016. Becker’s Infection Control and Clinical Quality website. Available at: http://www.beckershospitalreview.com/quality/10-top-patient-safety-issues-for-2016.html. Published January 12, 2016. Accessed January 28, 2016.

Frontline Teams Needed for Rapidly Changing Healthcare
Healthcare is changing rapidly, shifting focus from volume to value, says Jeffrey Glasheen, MD, SFHM, lead author of the abstract “Developing Frontline Teams to Drive Health System Transformation.” To support this transformation, frontline clinical leaders need to be able to build and manage teams and care processes—skills not taught in traditional health professional training.
That’s why the University of Colorado Anschutz Medical Campus launched the Certificate Training Program (CTP). The CTP curriculum focuses on enhancing team performance, leadership development, and process improvement. Participants meet weekly and receive support from a coach, a process-improvement specialist, and a data analyst.
Following the yearlong program, participants showed significant improvements in self-perception of leadership (37% to 75% able to manage change), quality improvement (23% to 78% able to use QI tools), and efficiency (31% to 69% able to reduce operational waste) skills. The participants’ work resulted in measurable improvements for the hospital: multiday reductions in length of stays, more than $200,000 in antibiotic cost avoidance for hospitalized pediatric patients, and improvement in pain and symptom scores for palliative care patients. Overall cost avoidance and revenue benefit exceeded $5 million.\
“We aimed to demonstrate that the work that we all need to accomplish—improving the value equation—can best be accomplished through the creation, development, and resourcing of high-functioning teams,” says Dr. Glasheen, an SHM board member. “Most important, we showed that a comprehensive training and development program aimed at creating, resourcing, and supporting high-functioning clinical leadership teams can facilitate academic medical centers’ efforts to pursue high-value care and achieve measurable improvement.”
Reference
1. Glasheen J, Cumbler E, Kneeland P, et al. Developing frontline teams to drive health system transformation [abstract]. Journal of Hospital Medicine. 2015;10(suppl 2). Available at: http://www.shmabstracts.com/abstract/developing-frontline-teams-to-drive-health-system-transformation/. Accessed January 28, 2016.
The Cost of Oncology Drugs: A Pharmacy Perspective, Part I
Health care costs are the fastest growing financial segment of the U.S. economy. The Centers for Medicare and Medicaid Services (CMS) estimates health care spending in the U.S. will increase from $3.0 trillion in 2014 to $5.4 trillion by 2024.1 About 19.3% of the U.S. gross domestic product is consumed by health care, which is twice that of any other country in the world. It is often stated that the increasing cost of health care is the most significant financial threat to the U.S. economy. The cost of medications, including those for treating cancer, is the leading cause of increased health care spending.2
The cost of cancer care is the most rapidly increasing component of U.S. health care spending and will increase from $125 billion in 2010 to an estimated $158 billion in 2020, a 27% increase.3 Most experts agree that the current escalation of costs is unsustainable and, if left unchecked, will have a devastating effect on the quality of health care and an increasing negative financial impact on individuals, businesses, and government. However, that discussion is outside the scope of this article.
The affordability of health care has become a major concern for most Americans. During the recent U.S. financial crisis, most of the focus was on the bursting of the housing bubble, plummeting real estate prices, the loss of jobs, and the failure of large financial institutions. However, medical bills were still the leading cause of personal bankruptcies during this period. In 2007, 62% of personal bankruptcies in the U.S. were due to medical costs, and 78% of those bankruptcies involved patients who had health insurance at the beginning of their illness.4
The cost of prescription medications is causing financial difficulties for many patients, especially elderly.
Americans who have multiple chronic medical conditions and live on fixed incomes. A recently released survey by the nonpartisan Kaiser Family Foundation found that the high cost of prescription medications, especially those to treat serious medical conditions such as cancer, is the top health concern of 77% of those Americans polled.5 In this environment, oncology providers face many challenges in their obligation to treat cancer patients in a cost-effective manner.
This article will appear in 2 parts. Part 1 will focus on the emerging discussion of the financial impact of high-cost drugs in the U.S. The drivers of increasing oncology drug costs will also be reviewed. Part 2 will focus on the challenges of high cost medications in the VA and the role the VA Pharmacy Benefits Management (PBM) Service has in evaluating new oncology agents. Clinical guidance tools designed to aid the clinician in the cost-effective use of these agents and results of a nationwide survey of VA oncology pharmacists regarding the use of cost-containment strategies will also be presented.
Background
When discussing the value of targeted therapies, it is useful to define both targeted therapy and value. A targeted therapy is a type of treatment using drugs or other substances to identify and attack cancer cells with less harm to normal cells, according to the National Cancer Institute. 6 Some targeted therapies block the action of certain enzymes, proteins, or other molecules involved in the growth and spread of cancer cells (the molecular target). Other types of targeted therapies help the immune system kill cancer cells or deliver toxic substances directly to cancer cells and kill them.
Targeted therapy may have fewer adverse effects (AEs) than do other types of cancer treatment. Most targeted therapies are either small molecules or monoclonal antibodies. Although imatinib, released in 2001, is the drug that coined the phrase targeted therapy, many drugs released earlier, such as rituximab, can be considered targeted therapies due to their specific, or targeted, mechanism of action.
Value is the price an object will bring in an open and competitive, or free, market as determined by the consumer. To put the definition of value in simpler terms, Warren Buffet has been quoted as saying, “Cost is what you pay, value is what you get.” The oncology market is not entirely free and open. Market price is determined by the manufacturer, entry into the market is regulated by the FDA, purchasers (like the VA and the Centers for Medicare and Medicaid Services) have only limited ability to negotiate prices, and refusing to pay for life-saving or life-prolonging medications often is not an option. As costs for oncology drugs rapidly increase, the cost-benefit ratio, or value, is being increasingly debated. When comparing the clinical benefits these agents provide with cost, the perception of value is highly subjective and can change significantly based on who is paying the bill.
Questioning High-Cost Drugs
Charles Moertel and colleagues published a landmark trial 25 years ago, which reported that treatment with fluorouracil and levamisole for 1 year decreased the death rate of patients with stage C (stage III) colon cancer by 33% following curative surgery.7 Although this trial was clinically significant, there was as much discussion about the high cost of levamisole (Ergamisol) tablets as there
was about its clinical benefit for patients.
In a 1991 letter to the New England Journal of Medicine, Rossof and colleagues questioned the high cost of the levamisole in the treatment regimen.8 Rossof and colleagues were surprised at the drug’s price on approval, about $5 for each tablet, and detailed their concerns on how this price was determined. “On the basis of the cost to a veterinarian, the calculated cost of a hypothetical 50-mg tablet should be in the range of 3 to 6 cents,” they argued. The total cost to the patient of 1 year of treament was nearly $1,200. Their conclusion was that “…the price chosen for the new American consumer is far too high and requires justification by the manufacturer.”
A reply from Janssen Pharmaceutica, the drug’s manufacturer, offered many justifications for the price.8 According to the company, Ergamisol was supplied free to 5,000 research patients prior to FDA approval. It was also given for free to indigent patients. The company also insisted that its pricing compared favorably with its competitors, such as zidovudine, octreotide, newer generation nonsteroidal anti-inflammatories, and antihypertension drugs. “Drug pricing includes additional expensive research, physician education, compassionate use programs, and ensuring high-quality control. Janssen scientists studied immunomodulating effect of Ergamisol for 25 years with no financial return. Drug development is high-risk, so companies must be able to derive a reasonable return on sales.”8
The cost of levamisole was $1,200 per year in 1991, and after adjustment for inflation would cost about $1,988 in 2015, or $166 per month. If these prices caused outrage in 1990, it is easy to see how current prices of well over $10,000 per month for therapies, which often render small clinical benefits, can seem outrageous by comparison.
Public Debate Over Cancer Drug Prices
In the U.S., about 1.66 million patients will be diagnosed with cancer in 2015.9 Although about 30% to 40% of these patients will be effectively cured, only 3% to 4% will be cured using pharmacotherapy (usually traditional chemotherapy) as a sole modality. Therefore, the use of oncology drugs by the vast majority of cancer patients is not to cure but to control or palliate patients with advanced cancer. It is important to note that the cost of most curative regimens is cheap compared with many medications used for advanced disease. Until a few years ago, discussion of the high costs of cancer treatment was rarely made public due to the devastating nature of cancer. However, with the rapid price increases and relatively disappointing clinical benefits of the many new drugs entering the market, the question of value can no longer be ignored. Many authors havepresented commentaries and strategies addressing the issues
surrounding the high cost of cancer drugs.10-15
It was a groundbreaking 2012 letter to the New York Times that brought the issue to public attention.16 Dr. Peter Bach and his colleagues at Memorial Sloan Kettering Cancer Center announced they would not purchase a “phenomenally expensive new cancer drug” for their patients, calling their decision a no-brainer. The drug, ziv-afilbercept (Zaltrap), was twice the price of a similar drug, bevacizumab (Avastin), but was no more efficacious in the treatment of metastatic colorectal cancer. Bach and colleagues went on to say how high drug prices are having a potentially devastating financial impact on patients and that laws protect drug manufacturers to set drug prices at what they feel the market will bear.
Considering the value of cancer treatments is now actively encouraged. To that point, the American Society of Clinical Oncology (ASCO) has recently published a groundbreaking paper entitled “A Conceptual Framework to Assess the Value of Cancer Treatment Options.”17 This tool, which is still in development, will allow oncologists to quantify clinical benefit, toxicity, and out-of-pocket drug costs so patients can compare treatment options with cost as a consideration.
The financial burden put on patients has become the driving force for drug cost reform. In an attempt to control their costs, third-party payers have increased the cost burden for patients by demanding larger copays and other out-of-pocket expenses for medications. It is felt that requiring patients to have more “skin in the game” would force them to make treatment decisions based on cost. Unfortunately, this approach may lead to devastating financial consequences for patients.18-20 The overwhelming emotions patients experience following the diagnosis of cancer make it difficult to focus on the financial impact of treatment recommendations. In addition, many oncologists are not comfortable, or even capable, of discussing costs so patients can make financially informed treatment decisions.14 Unfortunately for patients, “shopping for health care” has very little in common with shopping for a car, television sets, or any other commodity.
The VA Health Care System
The VA is government-sponsored health care and is therefore unique in the U.S. health care environment. The VA might be considered a form of “socialized medicine” that operates under a different economic model than do private health care systems. The treatment of VA patients for common diseases is based on nationally accepted evidence-based guidelines, which allow the best care in a cost-effective manner. For the treatment of cancer, the use of expensive therapies must be made in the context of the finite resources allocated for the treatment of all veterans within the system.
The VA provides lifelong free or minimal cost health care to eligible veterans. For veterans receiving care within the VA, out-of-pocket expenses are considerably less than for non-VA patients. Current medication copays range from free to $9 per month for all medications, regardless of acquisition cost. This is in stark contrast to the private sector, where patients must often pay large, percentage- based copays for oncology medications, which can reach several thousand dollars per month. VA patients are not subject to percentage-based copays; therefore, they are not a financial stakeholder in the treatment
decision process.
Prior to 1995, the VA was a much criticized and poorly performing health care system that had experienced significant budget cuts, forcing many veterans to lose their benefits and seek care outside the VA. Beginning in 1995 with the creation of PBM, a remarkable transformation occurred that modernized and transformed the VA into a system that consistently outperforms the private sector in quality of care, patient safety, and patient satisfaction while maintaining low overall costs. The role of the VA PBM was to develop and maintain the National Drug Formulary, create clinical guidance documents, and manage drug costs and use.
Part 2 of this article will more closely examine the high cost of cancer drugs. It will also discuss the role of VA PBM and other VA efforts to control cost
Author disclosures
The author reports no actual or potential conflicts of interest with regard to this article.
Disclaimer
The opinions expressed herein are those of the author and do not necessarily reflect those of Federal Practitioner, Frontline Medical Communications Inc., the U.S. Government, or any of its agencies. This article may discuss unlabeled or investigational use of certain drugs. Please review the complete prescribing information for specific drugs or drug combinations—including indications, contraindications, warnings, and adverse effects—before administering pharmacologic therapy to patients.
Click here for the digital edition.
1. Centers for Medicare and Medicaid. National health expenditure projections 2014-2024 Table 01. Centers for Medicare and Medicaid Website. https://www.cms.gov/research-statistics-data-and-systems/statistics-trends-and-reports/nationalhealthexpenddata/nationalhealthaccountsprojected.html. Updated July 30, 2015. Accessed January 11, 2016.
2. Bach PB. Limits of Medicare’s ability to control rising spending on cancer drugs. N Engl J Med. 2009;360(6):626-633.
3. Mariotto AB, Yabroff KR, Shao Y, Feuer EJ, Brown ML. Projections of the cost of cancer in the United States: 2010-2020. J Natl Cancer Inst. 2011;103(2):117-128.
4. Himmelstein DU, Thorne D, Warren E, Woolhandler S. Medical bankruptcy in the United States, 2007: results of a national study. Am J Med. 2009;122(8):741-746.
5. The Henry J. Kaiser Family Foundation. Prescription drug costs remain atop the public’s national health care agenda, well ahead of Affordable Care Act revisions and repeal [press release]. Kaiser Family Foundation Website. http://kff.org/health-costs/press-release/prescription-drug-costs-remain-atop-the-publics-national-health-care-agenda-well-ahead-of-affordable-care-act-revisions-and-repeal. Published October 28, 2015. Accessed January 11, 2016.
6. National Cancer Institute (NCI). NCI dictionary of cancer terms: targeted therapy. National Cancer Institute Website. http://www.cancer.gov/publications/dictionaries/cancer-terms?cdrid=270742. Accessed January 11, 2016.
7. Moertel CG, Fleming TR, Macdonald JS, et al. Levamisole and fluorouracil for adjuvant therapy resected colon carcinoma. N Engl J Med. 1990;322(6):352-358.
8. Rossof AH, Philpot TR, Bunch RS, Letcher J. The high cost of levamisole for humans. N Engl J Med. 1991;324(10):701-702.
9. Siegel RL, Miller KD, Jemal A. Cancer statistics, 2015. CA Cancer J Clin. 2015;65(1):5-29.
10. Nadler E, Eckert B, Neumann PJ. Do oncologists believe new cancer drugs offer good value? Oncologist. 2006;11(2):90-95.
11. Hillner BE, Smith TJ. Efficacy does not necessarily translate into cost effectiveness: a case study of the challenges associated with 21st century cancer drug pricing. J Clin Oncol. 2009;27(13):2111-2113.
12. Neumann PJ, Weinstein MC. Legislating against use of cost-effectiveness information. N Engl J Med. 2010;363(16):1495-1497.
13. Elkin EB, Bach PB. Cancer’s next frontier: addressing high and increasing costs. JAMA. 2010;303(11):1086-1087.
14. Smith TJ, Hillner BE. Bending the cost curve in cancer care. N Engl J Med. 2011;364(21):2060-2065.
15. Siddiqui M, Rajkumar SV. The high cost of cancer drugs and what we can do
about it. Mayo Clin Proc. 2012;87(10):935-943.
16. Bach PB, Saltz LB, Wittes RE. In cancer care, cost matters [op-ed]. New York Times. October 14, 2012.
17. Schnipper LE, Davidson NE, Wollins DS, et al; American Society of Clinical Oncology. American Society of Clinical Oncology statement: a conceptual framework to assess the value of cancer treatment options. J Clin Oncol. 2015;33(23): 2563-2577.
18. Zafar SY, Peppercorn JM, Schrag D, et al. The financial toxicity of cancer treatment: a pilot study assessing out-of-pocket expenses and the insured cancer patient’s experience. Oncologist. 2013;18(4):381-390.
19. Fenn KM, Evans SB, McCorkle R, et al. Impact of financial burden of cancer on
survivors’ quality of life. J Oncol Prac. 2014;10(5):332-338.
20. Zafar SY, McNeil RB, Thomas CM, Lathan CS, Ayanian JZ, Provenzale D. Population-based assessment of cancer survivors’ financial burden and quality of life: a prospective cohort study. J Oncol Pract. 2015;11(2):145-150.
Note: Page numbers differ between the print issue and digital edition.
Health care costs are the fastest growing financial segment of the U.S. economy. The Centers for Medicare and Medicaid Services (CMS) estimates health care spending in the U.S. will increase from $3.0 trillion in 2014 to $5.4 trillion by 2024.1 About 19.3% of the U.S. gross domestic product is consumed by health care, which is twice that of any other country in the world. It is often stated that the increasing cost of health care is the most significant financial threat to the U.S. economy. The cost of medications, including those for treating cancer, is the leading cause of increased health care spending.2
The cost of cancer care is the most rapidly increasing component of U.S. health care spending and will increase from $125 billion in 2010 to an estimated $158 billion in 2020, a 27% increase.3 Most experts agree that the current escalation of costs is unsustainable and, if left unchecked, will have a devastating effect on the quality of health care and an increasing negative financial impact on individuals, businesses, and government. However, that discussion is outside the scope of this article.
The affordability of health care has become a major concern for most Americans. During the recent U.S. financial crisis, most of the focus was on the bursting of the housing bubble, plummeting real estate prices, the loss of jobs, and the failure of large financial institutions. However, medical bills were still the leading cause of personal bankruptcies during this period. In 2007, 62% of personal bankruptcies in the U.S. were due to medical costs, and 78% of those bankruptcies involved patients who had health insurance at the beginning of their illness.4
The cost of prescription medications is causing financial difficulties for many patients, especially elderly.
Americans who have multiple chronic medical conditions and live on fixed incomes. A recently released survey by the nonpartisan Kaiser Family Foundation found that the high cost of prescription medications, especially those to treat serious medical conditions such as cancer, is the top health concern of 77% of those Americans polled.5 In this environment, oncology providers face many challenges in their obligation to treat cancer patients in a cost-effective manner.
This article will appear in 2 parts. Part 1 will focus on the emerging discussion of the financial impact of high-cost drugs in the U.S. The drivers of increasing oncology drug costs will also be reviewed. Part 2 will focus on the challenges of high cost medications in the VA and the role the VA Pharmacy Benefits Management (PBM) Service has in evaluating new oncology agents. Clinical guidance tools designed to aid the clinician in the cost-effective use of these agents and results of a nationwide survey of VA oncology pharmacists regarding the use of cost-containment strategies will also be presented.
Background
When discussing the value of targeted therapies, it is useful to define both targeted therapy and value. A targeted therapy is a type of treatment using drugs or other substances to identify and attack cancer cells with less harm to normal cells, according to the National Cancer Institute. 6 Some targeted therapies block the action of certain enzymes, proteins, or other molecules involved in the growth and spread of cancer cells (the molecular target). Other types of targeted therapies help the immune system kill cancer cells or deliver toxic substances directly to cancer cells and kill them.
Targeted therapy may have fewer adverse effects (AEs) than do other types of cancer treatment. Most targeted therapies are either small molecules or monoclonal antibodies. Although imatinib, released in 2001, is the drug that coined the phrase targeted therapy, many drugs released earlier, such as rituximab, can be considered targeted therapies due to their specific, or targeted, mechanism of action.
Value is the price an object will bring in an open and competitive, or free, market as determined by the consumer. To put the definition of value in simpler terms, Warren Buffet has been quoted as saying, “Cost is what you pay, value is what you get.” The oncology market is not entirely free and open. Market price is determined by the manufacturer, entry into the market is regulated by the FDA, purchasers (like the VA and the Centers for Medicare and Medicaid Services) have only limited ability to negotiate prices, and refusing to pay for life-saving or life-prolonging medications often is not an option. As costs for oncology drugs rapidly increase, the cost-benefit ratio, or value, is being increasingly debated. When comparing the clinical benefits these agents provide with cost, the perception of value is highly subjective and can change significantly based on who is paying the bill.
Questioning High-Cost Drugs
Charles Moertel and colleagues published a landmark trial 25 years ago, which reported that treatment with fluorouracil and levamisole for 1 year decreased the death rate of patients with stage C (stage III) colon cancer by 33% following curative surgery.7 Although this trial was clinically significant, there was as much discussion about the high cost of levamisole (Ergamisol) tablets as there
was about its clinical benefit for patients.
In a 1991 letter to the New England Journal of Medicine, Rossof and colleagues questioned the high cost of the levamisole in the treatment regimen.8 Rossof and colleagues were surprised at the drug’s price on approval, about $5 for each tablet, and detailed their concerns on how this price was determined. “On the basis of the cost to a veterinarian, the calculated cost of a hypothetical 50-mg tablet should be in the range of 3 to 6 cents,” they argued. The total cost to the patient of 1 year of treament was nearly $1,200. Their conclusion was that “…the price chosen for the new American consumer is far too high and requires justification by the manufacturer.”
A reply from Janssen Pharmaceutica, the drug’s manufacturer, offered many justifications for the price.8 According to the company, Ergamisol was supplied free to 5,000 research patients prior to FDA approval. It was also given for free to indigent patients. The company also insisted that its pricing compared favorably with its competitors, such as zidovudine, octreotide, newer generation nonsteroidal anti-inflammatories, and antihypertension drugs. “Drug pricing includes additional expensive research, physician education, compassionate use programs, and ensuring high-quality control. Janssen scientists studied immunomodulating effect of Ergamisol for 25 years with no financial return. Drug development is high-risk, so companies must be able to derive a reasonable return on sales.”8
The cost of levamisole was $1,200 per year in 1991, and after adjustment for inflation would cost about $1,988 in 2015, or $166 per month. If these prices caused outrage in 1990, it is easy to see how current prices of well over $10,000 per month for therapies, which often render small clinical benefits, can seem outrageous by comparison.
Public Debate Over Cancer Drug Prices
In the U.S., about 1.66 million patients will be diagnosed with cancer in 2015.9 Although about 30% to 40% of these patients will be effectively cured, only 3% to 4% will be cured using pharmacotherapy (usually traditional chemotherapy) as a sole modality. Therefore, the use of oncology drugs by the vast majority of cancer patients is not to cure but to control or palliate patients with advanced cancer. It is important to note that the cost of most curative regimens is cheap compared with many medications used for advanced disease. Until a few years ago, discussion of the high costs of cancer treatment was rarely made public due to the devastating nature of cancer. However, with the rapid price increases and relatively disappointing clinical benefits of the many new drugs entering the market, the question of value can no longer be ignored. Many authors havepresented commentaries and strategies addressing the issues
surrounding the high cost of cancer drugs.10-15
It was a groundbreaking 2012 letter to the New York Times that brought the issue to public attention.16 Dr. Peter Bach and his colleagues at Memorial Sloan Kettering Cancer Center announced they would not purchase a “phenomenally expensive new cancer drug” for their patients, calling their decision a no-brainer. The drug, ziv-afilbercept (Zaltrap), was twice the price of a similar drug, bevacizumab (Avastin), but was no more efficacious in the treatment of metastatic colorectal cancer. Bach and colleagues went on to say how high drug prices are having a potentially devastating financial impact on patients and that laws protect drug manufacturers to set drug prices at what they feel the market will bear.
Considering the value of cancer treatments is now actively encouraged. To that point, the American Society of Clinical Oncology (ASCO) has recently published a groundbreaking paper entitled “A Conceptual Framework to Assess the Value of Cancer Treatment Options.”17 This tool, which is still in development, will allow oncologists to quantify clinical benefit, toxicity, and out-of-pocket drug costs so patients can compare treatment options with cost as a consideration.
The financial burden put on patients has become the driving force for drug cost reform. In an attempt to control their costs, third-party payers have increased the cost burden for patients by demanding larger copays and other out-of-pocket expenses for medications. It is felt that requiring patients to have more “skin in the game” would force them to make treatment decisions based on cost. Unfortunately, this approach may lead to devastating financial consequences for patients.18-20 The overwhelming emotions patients experience following the diagnosis of cancer make it difficult to focus on the financial impact of treatment recommendations. In addition, many oncologists are not comfortable, or even capable, of discussing costs so patients can make financially informed treatment decisions.14 Unfortunately for patients, “shopping for health care” has very little in common with shopping for a car, television sets, or any other commodity.
The VA Health Care System
The VA is government-sponsored health care and is therefore unique in the U.S. health care environment. The VA might be considered a form of “socialized medicine” that operates under a different economic model than do private health care systems. The treatment of VA patients for common diseases is based on nationally accepted evidence-based guidelines, which allow the best care in a cost-effective manner. For the treatment of cancer, the use of expensive therapies must be made in the context of the finite resources allocated for the treatment of all veterans within the system.
The VA provides lifelong free or minimal cost health care to eligible veterans. For veterans receiving care within the VA, out-of-pocket expenses are considerably less than for non-VA patients. Current medication copays range from free to $9 per month for all medications, regardless of acquisition cost. This is in stark contrast to the private sector, where patients must often pay large, percentage- based copays for oncology medications, which can reach several thousand dollars per month. VA patients are not subject to percentage-based copays; therefore, they are not a financial stakeholder in the treatment
decision process.
Prior to 1995, the VA was a much criticized and poorly performing health care system that had experienced significant budget cuts, forcing many veterans to lose their benefits and seek care outside the VA. Beginning in 1995 with the creation of PBM, a remarkable transformation occurred that modernized and transformed the VA into a system that consistently outperforms the private sector in quality of care, patient safety, and patient satisfaction while maintaining low overall costs. The role of the VA PBM was to develop and maintain the National Drug Formulary, create clinical guidance documents, and manage drug costs and use.
Part 2 of this article will more closely examine the high cost of cancer drugs. It will also discuss the role of VA PBM and other VA efforts to control cost
Author disclosures
The author reports no actual or potential conflicts of interest with regard to this article.
Disclaimer
The opinions expressed herein are those of the author and do not necessarily reflect those of Federal Practitioner, Frontline Medical Communications Inc., the U.S. Government, or any of its agencies. This article may discuss unlabeled or investigational use of certain drugs. Please review the complete prescribing information for specific drugs or drug combinations—including indications, contraindications, warnings, and adverse effects—before administering pharmacologic therapy to patients.
Click here for the digital edition.
1. Centers for Medicare and Medicaid. National health expenditure projections 2014-2024 Table 01. Centers for Medicare and Medicaid Website. https://www.cms.gov/research-statistics-data-and-systems/statistics-trends-and-reports/nationalhealthexpenddata/nationalhealthaccountsprojected.html. Updated July 30, 2015. Accessed January 11, 2016.
2. Bach PB. Limits of Medicare’s ability to control rising spending on cancer drugs. N Engl J Med. 2009;360(6):626-633.
3. Mariotto AB, Yabroff KR, Shao Y, Feuer EJ, Brown ML. Projections of the cost of cancer in the United States: 2010-2020. J Natl Cancer Inst. 2011;103(2):117-128.
4. Himmelstein DU, Thorne D, Warren E, Woolhandler S. Medical bankruptcy in the United States, 2007: results of a national study. Am J Med. 2009;122(8):741-746.
5. The Henry J. Kaiser Family Foundation. Prescription drug costs remain atop the public’s national health care agenda, well ahead of Affordable Care Act revisions and repeal [press release]. Kaiser Family Foundation Website. http://kff.org/health-costs/press-release/prescription-drug-costs-remain-atop-the-publics-national-health-care-agenda-well-ahead-of-affordable-care-act-revisions-and-repeal. Published October 28, 2015. Accessed January 11, 2016.
6. National Cancer Institute (NCI). NCI dictionary of cancer terms: targeted therapy. National Cancer Institute Website. http://www.cancer.gov/publications/dictionaries/cancer-terms?cdrid=270742. Accessed January 11, 2016.
7. Moertel CG, Fleming TR, Macdonald JS, et al. Levamisole and fluorouracil for adjuvant therapy resected colon carcinoma. N Engl J Med. 1990;322(6):352-358.
8. Rossof AH, Philpot TR, Bunch RS, Letcher J. The high cost of levamisole for humans. N Engl J Med. 1991;324(10):701-702.
9. Siegel RL, Miller KD, Jemal A. Cancer statistics, 2015. CA Cancer J Clin. 2015;65(1):5-29.
10. Nadler E, Eckert B, Neumann PJ. Do oncologists believe new cancer drugs offer good value? Oncologist. 2006;11(2):90-95.
11. Hillner BE, Smith TJ. Efficacy does not necessarily translate into cost effectiveness: a case study of the challenges associated with 21st century cancer drug pricing. J Clin Oncol. 2009;27(13):2111-2113.
12. Neumann PJ, Weinstein MC. Legislating against use of cost-effectiveness information. N Engl J Med. 2010;363(16):1495-1497.
13. Elkin EB, Bach PB. Cancer’s next frontier: addressing high and increasing costs. JAMA. 2010;303(11):1086-1087.
14. Smith TJ, Hillner BE. Bending the cost curve in cancer care. N Engl J Med. 2011;364(21):2060-2065.
15. Siddiqui M, Rajkumar SV. The high cost of cancer drugs and what we can do
about it. Mayo Clin Proc. 2012;87(10):935-943.
16. Bach PB, Saltz LB, Wittes RE. In cancer care, cost matters [op-ed]. New York Times. October 14, 2012.
17. Schnipper LE, Davidson NE, Wollins DS, et al; American Society of Clinical Oncology. American Society of Clinical Oncology statement: a conceptual framework to assess the value of cancer treatment options. J Clin Oncol. 2015;33(23): 2563-2577.
18. Zafar SY, Peppercorn JM, Schrag D, et al. The financial toxicity of cancer treatment: a pilot study assessing out-of-pocket expenses and the insured cancer patient’s experience. Oncologist. 2013;18(4):381-390.
19. Fenn KM, Evans SB, McCorkle R, et al. Impact of financial burden of cancer on
survivors’ quality of life. J Oncol Prac. 2014;10(5):332-338.
20. Zafar SY, McNeil RB, Thomas CM, Lathan CS, Ayanian JZ, Provenzale D. Population-based assessment of cancer survivors’ financial burden and quality of life: a prospective cohort study. J Oncol Pract. 2015;11(2):145-150.
Note: Page numbers differ between the print issue and digital edition.
Caring for Patients With Prostate Cancer Who Are BRCA Positive
There are several risk assessment tools and clinical practice guidelines used in the management of localized prostate cancer (PCa). These include the D’Amico classification, the Cancer of the Prostate Risk Assessment (CAPRA) score, the National Comprehensive Cancer Network (NCCN) risk criteria, and the American Urological Association (AUA) clinical practice guidelines.1-4 None of these tools incorporate the BRCA1 and BRCA2 genes in the risk assessment or treatment recommendations for localized PCa.5 The BRCA mutations are most strongly associated with breast and ovarian cancer risk. However, BRCA mutations also increase susceptibility and disease progression in PCa.6 This article illustrates the current knowledge gap in PCa treatment algorithms for the BRCA2-positive patient population.
Traditional risk assessment tools use clinical and pathologic features of PCa, including prostate-specific antigen (PSA) level, Gleason score, tumor stage, and disease burden to measure cancer aggressiveness.1,7,8 These criteria are the basis of the AUA and NCCN guidelines for management of clinically localized PCa, which recognize 3 categories of clinically localized disease (low, intermediate, and high risk).3,4 The NCCN guidelines (version 1.2016) include a fourth category (very low risk or pathologically insignificant PCa) among some stage T1c patients, based on additional criteria, including PSA density. Both the AUA and NCCN recommend active surveillance as a treatment option for men with low-risk PCa. The NCCN recently revised its guidelines to state that intermediate-risk patients with PCa with favorable features (Gleason grade 3 and < 50% of positive biopsy cores) may also be considered for active surveillance.3
BRCA Mutations in Prostate Cancer
Estimates of the relative risk of PCa for men with BRCA1 and BRCA2 mutations have varied, but recent data suggest that it is 3.75-fold for BRCA1 mutations and 8.6-fold for BRCA2 by age 65 years.9-11 Moreover, PCas associated with BRCA1/2 mutations, particularly those in the BRCA2 gene, are often more aggressive and characterized by poor outcomes.12,13 The presence of a BRCA2 mutation is a negative prognostic factor in PCa, independent of tumor grade, stage, and PSA levels.14 Both PCa-specific survival and metastasis-free survival rates following surgical or radiation therapy are significantly lower in the BRCA mutation carriers than in noncarriers.15 Preliminary results of the IMPACT study demonstrate that targeted PCa screening in men with BRCA1 or BRCA2 mutations may result in identification of tumors more likely to require treatment.16
As a result of these increased risks, it is recommended that men with BRCA2 mutations begin PCa screening at age 40 years; however, there are no clear guidelines for clinical management of PCa in this group of patients.5 The lack of guidelines presents a challenge for clinical management of BRCA1/2 mutation carriers with localized PCa who otherwise qualify for active surveillance. A recent editorial by Bratt and Loman specifically
calls for aggressive therapy for patients who are BRCA positive, particularly BRCA2 carriers, suggesting the need to combine early radical local treatment with adjuvant systemic therapy.17 However, data on the effectiveness of aggressive therapies in patients with PCa who carry BRCA2 mutations are sparse.5
Genomic Test for Risk
There is growing recognition of the need to include molecular testing to improve risk assessment in PCa. Using traditional risk assessment tools, about 8% of low-risk patients are found to have progressive disease postoperatively.3 Current AUA guidelines from 2007 are silent on the issue of molecular testing. The 2015 and 2016 NCCN guidelines include molecular testing for better risk stratification of patients with PCa, specifically naming Oncotype DX Prostate Cancer Assay (Genomic Health, Redwood City, CA) and Prolaris (Myriad Genetics, Salt Lake City, UT).3 However, they do not address molecular BRCA mutation testing.
There are several genomic tests aimed at improving PCa risk assessment. These include Oncotype DX PCa Assay; Prolaris; Decipher Prostate Cancer Classifier (GenomeDx Biosciences, San Diego, CA); and ProMark (Metamark Laboratories, Cambridge, MA). These assays are tissuebased and measure gene expression on the RNA or protein level to identify low- or intermediate-risk patients who may be candidates for active surveillance, as well as patients at higher risk who may benefit from closer monitoring or additional therapy after their initial treatment. By 2015, the Centers for Medicare and Medicaid Services had issued positive coverage decisions for several tests.18
The Oncotype DX test is a quantitative real-time polymerase chain reaction assay that measures the expression of 17 genes (12 cancer-related genes and 5 reference genes) representing 4 biologic pathways, including from the androgen signaling, stromal response, cellular organization, and cellular proliferation (Table). Prolaris focuses on a larger number of genes in the cell-cycle progression (CCP) pathway (31 cell-cycle-related genes and 15 reference genes). There is no overlap between the 2 gene sets. Both tests integrate genomic data with clinical and histopathologic characteristics of the tumor to arrive at prognostic information. The Oncotype DX test yields a specific Genomic Prostate Score (GPS; scaled 0-100) that is integrated with the patient’s NCCN clinical risk group to quantify the likelihood of favorable pathology, which is defined as low-grade organ-confined disease.19 The Prolaris test uses the patient’s AUA risk category and then evaluates the patient’s risk based on the cell-cycle progression
gene panel compared with that risk category. It also provides an estimate of disease-specific mortality as validated by 2 independent cohorts that were managed conservatively initially with watchful waiting.
In this article, the authors present a case report of a BRCA2-positive veteran with newly diagnosed lowrisk PCa and a history of breast cancer. In addition to evaluating clinical criteria, Oncotype DX and Prolaris gene expression tests were ordered for this patient. The authors obtained veteran and institutional review board permission. To protect the identity of the patient, minor changes were made to patient demographics.
Case Presentation
A 68-year-old white man with a history of coronary artery disease, dyslipidemia, and hypertension, was recently diagnosed with PCa. He presented to Genomic Medicine Service to discuss how his BRCA2 mutation status might impact management decisions for PCa. Priorto the PCa diagnosis, the veteran had a history of breast and skin cancer. He was diagnosed with invasive ductal carcinoma of the right breast (ER+/PR+/Her2+) at age 62 years and treated with mastectomy and tamoxifen. He had testing at that time, which revealed a BRCA2 mutation: 3773delTT. Squamous cell carcinoma was detected on his right leg and removed at age 64 years. Basal cell carcinoma was removed from his left forehead first at age 65 years, and then residual basal cell carcinoma was removed from the forehead 2 months later.
The veteran was diagnosed with PCa at age 67 years at a non-VA clinic. The urology consult note reported a sudden increase of his PSA level to 5.9. A prostate needle biopsy was performed. The Gleason score was 3 + 3 = 6 in 2 of 12, with < 1% PCa involvement and focal highgrade prostatic intraepithelial neoplasia. The patient was asymptomatic, and his cancer was identified by needle biopsy due to elevated PSA. His clinical stage was T1c. According to AUA and NCCN guidelines, the patient was categorized as low risk, defined as Gleason Score ≤ 6, PSA < 10 ng/mL, and clinical stage up to T2a.3,4 Additionally, the veteran met 3 criteria for the NCCN very low-risk category (stage T1c, < 3 positive biopsy cores and ≤ 50% cancer in any core). However, because he was initially diagnosed at a non-VA clinic, his PSA density (the remaining criterion) was not available to the VA urologist. Therefore, the low-risk category was assumed for molecular test interpretation.
The non-VA urologist recommended active surveillance. The VA urologist agreed that active surveillance was an appropriate treatment recommendation at this time. However, the veteran and his family members remained concerned that his PCa might be more aggressive due to his BRCA2 mutation, and they worried that active surveillance would result in a worse outcome. Their concern was exacerbated by the veteran’s comorbidities, which could have potential implications on the timing of surgical options. The patient expressed these concerns to his VA primary care physician, who then referred him to the VA Genomic Medicine Services.
Genetic Consult
The genetic counselor scheduled a telegenetics consult and conducted an assessment of the veteran, which included a review of his medical history, mutation status, and relevant family history. The family history was consistent with hereditary breast/ovarian cancer. However, the primary reason the veteran underwent genetic testing was the diagnosis of breast cancer in a male. The genetic counselor provided the patient with information relevant to his mutation carrier status, including that men with BRCA2 mutations are at increased risk of developing more aggressive PCa, have higher rates of lymph node involvement, and greater mortality compared with men without BRCA2 mutations. The veteran was informed that there were no published guidelines that suggest PCa in BRCA2 carriers should be treated differently from sporadic PCa.
Tumor Testing Strategy
Although the veteran was comfortable with active surveillance at the time of consultation, he was concerned that, given his comorbidities, it would be better to pursue surgery sooner. The veteran asked the genetic counselor for more information about his prognosis given his BRCA2 status. The genetic counselor discussed possible use of tumor gene expression profiling and informed him about 2 active studies within the VA that are evaluating the clinical utility of gene expression tests for PCa risk stratification (Oncotype DX at Genomic Health and Prolaris at Myriad Genetic Laboratories). The veteran expressed an interest in having his biopsy tissue tested by both assays. Tumor biopsy tissue was obtained and sent to both Genomic Health and Myriad Genetics for testing. Neither test incorporated the veteran’s other health conditions or his BRCA mutation status into risk stratification results or the patient report.
Test Results
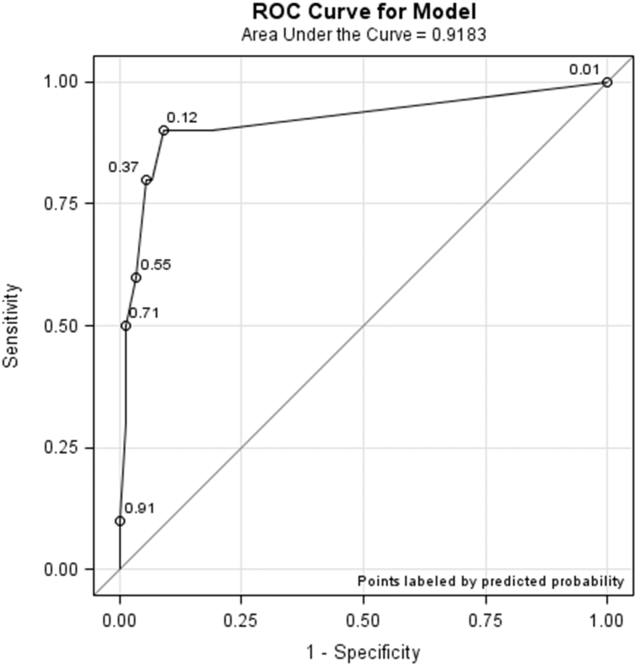
The Oncotype DX GPS result for this NCCN low-risk patient was 31 (Figure 1). This score corresponds to a likelihood of favorable pathology at radical prostatectomy of 71% (95% confidence interval [CI]: 63%-78%). Favorable pathology is defined as freedom from highgrade (Gleason score > 4+3) and/or nonorgan-confined (pT3) disease. This GPS result was consistent with the range of risk expected for NCCN low-risk patients based on the validation cohorts for the assay. The estimate of likelihood of favorable pathology would be modified if the PSA density result were available and if it placed the patient in the NCCN very low-risk category.
The Prolaris report demonstrated a score of 0.4 (Figure 2). This puts the veteran in the 94th percentile of contemporary U.S. men who are AUA low risk. The CCP score makes his cancer more aggressive than most AUA low-risk men, and the projected 10-year disease-specific mortality is 3%. In conjunction with the patient’s BRCA2 status, he may benefit from definitive intervention. If active surveillance is chosen, careful and regular follow-up for disease progression is mandated.
Interpretation of Genomic Testing in PCa
For both tests, the results are derived from 2-tiered calculations. For Oncotype DX, the gene expression measurement yields the GPS, which is then integrated with the patient’s clinical and pathologic information to yield the likelihood of favorable pathology. Although the Oncotype DX GPS is an independent measure of disease aggressiveness, on the patient report, the GPS is combined with the NCCN clinical risk group to provide a likelihood of favorable pathology. Therefore, 2 patients with the same GPS but different levels of clinical risk will have different likelihoods of favorable pathology.
The Prolaris test provides the Prolaris CCP score as well as the percentile group of patients with a lower score within the same risk category. Also, the Prolaris test yields a numerical 10-year PCa-specific mortality risk. The Prolaris score has been shown to impact therapeutic decisions in patients with newly diagnosed PCa.20
Recently, Myriad defined a threshold for active surveillance combining the CCP and CAPRA scores.21 Myriad validated this cutoff in 2 cohorts of men initially managed conservatively. Although the model predicts up to 3.2% disease-specific mortality, there were no observed deaths during a decade of follow-up. Myriad reports that by using this cutoff in contemporary patients tested commercially with Prolaris, a health care system could increase the percentage of men who would fit current criteria for active surveillance from 36% to 60% with no increase in risk of disease-specific mortality.
The results of these 2 tests are presented in 2 different formats and provide risk estimates for different clinical endpoints, making it challenging for a clinician to directly compare them. Moreover, each genomic test is based on a different set of genes and uses different clinical risk criteria (AUA vs NCCN), which may result in different test output. Finally, and most relevant to the case described here, there is no evidence-based consensus on how to interpret these test results in the context of a BRCA2 mutation.
Based on the published literature reporting that BRCA2 mutations are associated with more aggressive disease, one prediction would be that test scores from genomic assays such as Oncotype DX and Prolaris would tend to be higher in BRCA2 carriers than those of the overall population of PCa patients. This has, in fact, been reported for the Oncotype DX Breast Cancer Assay recurrence score in women who are BRCA carriers.22 Further research is required to ascertain whether this will be true for Oncotype DX GPS and Prolaris CCP score in PCa. The mechanism of action that predisposes BRCA2 mutation carriers to develop a more aggressive variant of PCa may not be detectable by the genomic markers included in the Oncotype DX PCa and Prolaris tests. The degree to which a mutated BRCA2 gene may interact with the genes comprising these assays and the reported tumor aggressiveness is not yet understood but deserving of future study.
Treatment Recommendation and Patient’s Decision
After considering his test results, the veteran chose active surveillance. The sum of clinical, pathologic, and molecular factors, combined with the patient’s preference, determined his course of treatment. Because prostatectomy was not performed, it has not been positively determined whether or not the patient harbors aggressive disease. As the molecular test results place the patient at the high end of the low-risk group, the VA urologist recommended close monitoring and suggested a follow-up biopsy with magnetic resonance-ultrasound fusion guidance.
Conclusions
Molecular testing found that the patient’s PCa stage and grade are consistent with NCCN low risk (Oncotype DX) and that the disease-specific mortality risk is slightly higher than predicted by clinical features alone (Prolaris). Previous studies have shown that molecular testing in men with PCa provides information that influences clinical decisions. The findings reported here suggest that molecular testing may also be a vital component in the medical management of patients with complex clinical phenotypes and common chronic conditions. Additional studies are necessary to evaluate whether the finding reported here is typical of individuals diagnosed with PCa who also have a BRCA2 mutation.
For any new genomic test to be clinically useful, its results must have clinical actionability. In this case, the clinical decision point was whether to recommend immediate definitive treatment or active surveillance. For this patient, the Oncotype DX assay provided a likelihood of favorable surgical pathology of 71% (or conversely a 29% risk of unfavorable pathology); by comparison, the Prolaris CCP score provided a 3% estimate of PCaspecific
mortality at 10 years. A key question is: How do clinicians perceive the actionability of risk estimates for these different endpoints?
The current case illustrates the challenges that rapidly developing genomic medicine pose for physicians trying to optimize care and communicate results to patients in a meaningful and consistent manner. For example, some urologists find the different 2-tiered calculations confusing. When laboratories use proprietary scalesbased on internally develop algorithms, differing interpretations are to be expected. The risk-assessment tests described here use different algorithms, and their interpretations are based on clinical categories from different sets of guidelines. This underscores the need for better standardization of PCa care.23
Oncology and urology professional associations should collaborate to develop consistent guidelines for use of new technologies in the management of PCa. A positive example is the evolution of testing recommendations in lung cancer, which initially varied between professional entities. In April 2013, the College of American Pathologists, the International Association for the Study of Lung Cancer, and the Association for Molecular Pathology jointly issued a unified clinical practice guideline on molecular testing in patients with lung cancer.24 In October 2014, the American Society of Clinical Oncology issued an endorsement of the CAP/IASLC/AMP guideline.25 As the number of complex tests being used in PCa increases, it will be important for professional associations such as AUA and NCCN to collaborate in evaluating utility of innovations to make consistent recommendations
Author disclosures
Myriad Genetics and Genomic Health provided funding for research on their tests within the VA. Dr. Dash and Dr. Lynch are principal investigators of the Genomic Health study. Dr. Lowrance is the principal investigator of the Myriad Genetics study.
Disclaimer
The opinions expressed herein are those of the authors and do not necessarily reflect those of Federal Practitioner, Frontline Medical Communications Inc., the U.S. Government, or any of its agencies. This article may discuss unlabeled or investigational use of certain drugs. Please review complete prescribing information for specific drugs or drug combinations—including indications, contraindications, warnings, and adverse effects—before administering pharmacologic therapy to patients.
Click here to continue reading.
1. D’Amico AV, Whittington R, Malkowicz SB, et al. Biochemical outcome after radical prostatectomy, external beam radiation therapy, or interstitial radiation therapy for clinically localized prostate cancer. JAMA. 1998;280(11):969-974.
2. Cooperberg MR, Pasta DJ, Elkin EP, et al. The University of California, San Francisco Cancer of the Prostate Risk Assessment score: a straightforward and reliable preoperative predictor of disease recurrence after radical prostatectomy. J Urol. 2005;173(6):1938-1942.
3. National Comprehensive Cancer Network. NCCN Clinical Practice Guidelines in Oncology: prostate cancer. National Comprehensive Cancer Network Website. http://www.nccn.org/professionals/physician_gls/pdf/prostate.pdf. Updated November 10, 2015. Accessed December 8, 2016.
4. Thompson I, Thrasher JB, Aus G, et al; AUA Prostate Cancer Clinical Guideline Update Panel. Guideline for the management of clinically localized prostate cancer: 2007 update. J Urol. 2007;177(6):2106-2131.
5. Alanee SR, Glogowski EA, Schrader KA, Eastham JA, Offit K. Clinical features and management of BRCA1 and BRCA2-associated prostate cancer. Front Biosci (Elite Ed). 2014;6:15-30.
6. Castro E, Eeles R. The role of BRCA1 and BRCA2 in prostate cancer. Asian J Androl. 2012;14(3):409-414.
7. Boorjian SA, Karnes RJ, Rangel LJ, Bergstralh EJ, Blute ML. Mayo Clinic validation of the D’amico risk group classification for predicting survival following radical prostatectomy. J Urol. 2008;179(4):1354-1360.
8. Lowrance WT, Scardino PT. Predictive models for newly diagnosed prostate cancer patients. Rev Urol. 2009;11(3):117-126.
9. Levy-Lahad E, Friedman E. Cancer risks among BRCA1 and BRCA2 mutation carriers. Br J Cancer. 2007;96(1):11-15.
10. Leongamornlert D, Mahmud N, Tymrakiewicz M, et al; UKGPCS Collaborators. Germline BRCA1 mutations increase prostate cancer risk. Br J Cancer. 2012;106(10):1697-1701.
11. Kote-Jarai Z, Leongamornlert D, Saunders E, et al; UKGPCS Collaborators. BRCA2 is a moderate penetrance gene contributing to young-onset prostate cancer: implications for genetic testing in prostate cancer patients. Br J Cancer. 2011;105(8):1230-1234.
12. Tryggvadóttir L, Vidarsdóttir L, Thorgeirsson T, et al. Prostate cancer progression and survival in BRCA2 mutation carriers. J Natl Cancer Inst. 2007;99(12):929-935.
13. Gallagher DJ, Gaudet MM, Pal P, et al. Germline BRCA mutations denote a clinicopathologic subset of prostate cancer. Clin Cancer Res. 2010;16(7):2115-2121.
14. Castro E, Goh C, Olmos D, et al. Germline BRCA mutations are associated with higher risk of nodal involvement, distant metastasis, and poor survival outcomes in prostate cancer. J Clin Oncol. 2013;31(14):1748-1757.
15. Castro E, Goh C, Leongamornlert D, et al. Effect of BRCA mutations on metastatic relapse and cause-specific survival after radical treatment for localised prostate cancer. Eur Urol. 2015;68(2):186-193.
16. Bancroft EK, Page EC, Castro E, et al; IMPACT Collaborators. Targeted prostate cancer screening in BRCA1 and BRCA2 mutation carriers: results from the initial screening round of the IMPACT study. Eur Urol. 2014;66(3):489-499.
17. Bratt O, Loman N. Clinical management of prostate cancer in men with BRCA mutations. Eur Urol. 2015;68(2):194-195.
18. Centers for Medicare & Medicaid Services (CMS). MCD archive site. CMS Website. http://localcoverage.cms.gov/mcd_archive/overview.aspx. Accessed January 8, 2016.
19. Klein EA, Cooperberg MR, Magi-Galluzzi C, et al. A 17-gene assay to predict prostate cancer aggressiveness in the context of Gleason grade heterogeneity, tumor multifocality, and biopsy undersampling. Eur Urol. 2014;66(3):550-560.
20. Shore ND, Kella N, Moran B, et al. Impact of the cell cycle progression test on physician and patient treatment selection for localized prostate cancer. J Urol. 2015;pii:S0022-5347(15)04811-9 [epub ahead of print].
21. Stone S, Cuzick JM, Fisher G, et al. Validation of an active surveillance threshold for the CCP score in conservatively managed men with localized prostate cancer. J Clin Oncol. 2015;33(suppl 15):e16040.
22. Lewin R, Rizel S, Hendler D, et al. Oncotype-DX recurrence score distribution among breast cancer patients harboring a germline mutation in the BRCA1/2 genes. J Clin Oncol. 2015;33(suppl; abstr 564).
23. Dahm P, Yeung LL, Chang SS, Cookson MS. A critical review of clinical practice guidelines for the management of clinically localized prostate cancer. J Urol. 2008;180(2):451-459.
24. Lindeman NI, Cagle PT, Beasley MB, et al. Molecular testing guideline for selection of lung cancer patients for EGFR and ALK tyrosine kinase inhibitors: guideline from the College of American Pathologists, International Association for the Study of Lung Cancer, and Association for Molecular Pathology. J Thorac Oncol. 2013;8(7):823-859.
25. Leighl NB, Rekhtman N, Biermann WA, et al. Molecular testing for selection of patients with lung cancer for epidermal growth factor receptor and anaplastic lymphoma kinase tyrosine kinase inhibitors: American Society of Clinical Oncology endorsement of the College of American Pathologists/International Association for the Study of Lung Cancer/Association for Molecular Pathology guideline. J Clin Oncol. 2014;32(32):3673-3679.
Note: Page numbers differ between the print issue and digital edition.
There are several risk assessment tools and clinical practice guidelines used in the management of localized prostate cancer (PCa). These include the D’Amico classification, the Cancer of the Prostate Risk Assessment (CAPRA) score, the National Comprehensive Cancer Network (NCCN) risk criteria, and the American Urological Association (AUA) clinical practice guidelines.1-4 None of these tools incorporate the BRCA1 and BRCA2 genes in the risk assessment or treatment recommendations for localized PCa.5 The BRCA mutations are most strongly associated with breast and ovarian cancer risk. However, BRCA mutations also increase susceptibility and disease progression in PCa.6 This article illustrates the current knowledge gap in PCa treatment algorithms for the BRCA2-positive patient population.
Traditional risk assessment tools use clinical and pathologic features of PCa, including prostate-specific antigen (PSA) level, Gleason score, tumor stage, and disease burden to measure cancer aggressiveness.1,7,8 These criteria are the basis of the AUA and NCCN guidelines for management of clinically localized PCa, which recognize 3 categories of clinically localized disease (low, intermediate, and high risk).3,4 The NCCN guidelines (version 1.2016) include a fourth category (very low risk or pathologically insignificant PCa) among some stage T1c patients, based on additional criteria, including PSA density. Both the AUA and NCCN recommend active surveillance as a treatment option for men with low-risk PCa. The NCCN recently revised its guidelines to state that intermediate-risk patients with PCa with favorable features (Gleason grade 3 and < 50% of positive biopsy cores) may also be considered for active surveillance.3
BRCA Mutations in Prostate Cancer
Estimates of the relative risk of PCa for men with BRCA1 and BRCA2 mutations have varied, but recent data suggest that it is 3.75-fold for BRCA1 mutations and 8.6-fold for BRCA2 by age 65 years.9-11 Moreover, PCas associated with BRCA1/2 mutations, particularly those in the BRCA2 gene, are often more aggressive and characterized by poor outcomes.12,13 The presence of a BRCA2 mutation is a negative prognostic factor in PCa, independent of tumor grade, stage, and PSA levels.14 Both PCa-specific survival and metastasis-free survival rates following surgical or radiation therapy are significantly lower in the BRCA mutation carriers than in noncarriers.15 Preliminary results of the IMPACT study demonstrate that targeted PCa screening in men with BRCA1 or BRCA2 mutations may result in identification of tumors more likely to require treatment.16
As a result of these increased risks, it is recommended that men with BRCA2 mutations begin PCa screening at age 40 years; however, there are no clear guidelines for clinical management of PCa in this group of patients.5 The lack of guidelines presents a challenge for clinical management of BRCA1/2 mutation carriers with localized PCa who otherwise qualify for active surveillance. A recent editorial by Bratt and Loman specifically
calls for aggressive therapy for patients who are BRCA positive, particularly BRCA2 carriers, suggesting the need to combine early radical local treatment with adjuvant systemic therapy.17 However, data on the effectiveness of aggressive therapies in patients with PCa who carry BRCA2 mutations are sparse.5
Genomic Test for Risk
There is growing recognition of the need to include molecular testing to improve risk assessment in PCa. Using traditional risk assessment tools, about 8% of low-risk patients are found to have progressive disease postoperatively.3 Current AUA guidelines from 2007 are silent on the issue of molecular testing. The 2015 and 2016 NCCN guidelines include molecular testing for better risk stratification of patients with PCa, specifically naming Oncotype DX Prostate Cancer Assay (Genomic Health, Redwood City, CA) and Prolaris (Myriad Genetics, Salt Lake City, UT).3 However, they do not address molecular BRCA mutation testing.
There are several genomic tests aimed at improving PCa risk assessment. These include Oncotype DX PCa Assay; Prolaris; Decipher Prostate Cancer Classifier (GenomeDx Biosciences, San Diego, CA); and ProMark (Metamark Laboratories, Cambridge, MA). These assays are tissuebased and measure gene expression on the RNA or protein level to identify low- or intermediate-risk patients who may be candidates for active surveillance, as well as patients at higher risk who may benefit from closer monitoring or additional therapy after their initial treatment. By 2015, the Centers for Medicare and Medicaid Services had issued positive coverage decisions for several tests.18
The Oncotype DX test is a quantitative real-time polymerase chain reaction assay that measures the expression of 17 genes (12 cancer-related genes and 5 reference genes) representing 4 biologic pathways, including from the androgen signaling, stromal response, cellular organization, and cellular proliferation (Table). Prolaris focuses on a larger number of genes in the cell-cycle progression (CCP) pathway (31 cell-cycle-related genes and 15 reference genes). There is no overlap between the 2 gene sets. Both tests integrate genomic data with clinical and histopathologic characteristics of the tumor to arrive at prognostic information. The Oncotype DX test yields a specific Genomic Prostate Score (GPS; scaled 0-100) that is integrated with the patient’s NCCN clinical risk group to quantify the likelihood of favorable pathology, which is defined as low-grade organ-confined disease.19 The Prolaris test uses the patient’s AUA risk category and then evaluates the patient’s risk based on the cell-cycle progression
gene panel compared with that risk category. It also provides an estimate of disease-specific mortality as validated by 2 independent cohorts that were managed conservatively initially with watchful waiting.
In this article, the authors present a case report of a BRCA2-positive veteran with newly diagnosed lowrisk PCa and a history of breast cancer. In addition to evaluating clinical criteria, Oncotype DX and Prolaris gene expression tests were ordered for this patient. The authors obtained veteran and institutional review board permission. To protect the identity of the patient, minor changes were made to patient demographics.
Case Presentation
A 68-year-old white man with a history of coronary artery disease, dyslipidemia, and hypertension, was recently diagnosed with PCa. He presented to Genomic Medicine Service to discuss how his BRCA2 mutation status might impact management decisions for PCa. Priorto the PCa diagnosis, the veteran had a history of breast and skin cancer. He was diagnosed with invasive ductal carcinoma of the right breast (ER+/PR+/Her2+) at age 62 years and treated with mastectomy and tamoxifen. He had testing at that time, which revealed a BRCA2 mutation: 3773delTT. Squamous cell carcinoma was detected on his right leg and removed at age 64 years. Basal cell carcinoma was removed from his left forehead first at age 65 years, and then residual basal cell carcinoma was removed from the forehead 2 months later.
The veteran was diagnosed with PCa at age 67 years at a non-VA clinic. The urology consult note reported a sudden increase of his PSA level to 5.9. A prostate needle biopsy was performed. The Gleason score was 3 + 3 = 6 in 2 of 12, with < 1% PCa involvement and focal highgrade prostatic intraepithelial neoplasia. The patient was asymptomatic, and his cancer was identified by needle biopsy due to elevated PSA. His clinical stage was T1c. According to AUA and NCCN guidelines, the patient was categorized as low risk, defined as Gleason Score ≤ 6, PSA < 10 ng/mL, and clinical stage up to T2a.3,4 Additionally, the veteran met 3 criteria for the NCCN very low-risk category (stage T1c, < 3 positive biopsy cores and ≤ 50% cancer in any core). However, because he was initially diagnosed at a non-VA clinic, his PSA density (the remaining criterion) was not available to the VA urologist. Therefore, the low-risk category was assumed for molecular test interpretation.
The non-VA urologist recommended active surveillance. The VA urologist agreed that active surveillance was an appropriate treatment recommendation at this time. However, the veteran and his family members remained concerned that his PCa might be more aggressive due to his BRCA2 mutation, and they worried that active surveillance would result in a worse outcome. Their concern was exacerbated by the veteran’s comorbidities, which could have potential implications on the timing of surgical options. The patient expressed these concerns to his VA primary care physician, who then referred him to the VA Genomic Medicine Services.
Genetic Consult
The genetic counselor scheduled a telegenetics consult and conducted an assessment of the veteran, which included a review of his medical history, mutation status, and relevant family history. The family history was consistent with hereditary breast/ovarian cancer. However, the primary reason the veteran underwent genetic testing was the diagnosis of breast cancer in a male. The genetic counselor provided the patient with information relevant to his mutation carrier status, including that men with BRCA2 mutations are at increased risk of developing more aggressive PCa, have higher rates of lymph node involvement, and greater mortality compared with men without BRCA2 mutations. The veteran was informed that there were no published guidelines that suggest PCa in BRCA2 carriers should be treated differently from sporadic PCa.
Tumor Testing Strategy
Although the veteran was comfortable with active surveillance at the time of consultation, he was concerned that, given his comorbidities, it would be better to pursue surgery sooner. The veteran asked the genetic counselor for more information about his prognosis given his BRCA2 status. The genetic counselor discussed possible use of tumor gene expression profiling and informed him about 2 active studies within the VA that are evaluating the clinical utility of gene expression tests for PCa risk stratification (Oncotype DX at Genomic Health and Prolaris at Myriad Genetic Laboratories). The veteran expressed an interest in having his biopsy tissue tested by both assays. Tumor biopsy tissue was obtained and sent to both Genomic Health and Myriad Genetics for testing. Neither test incorporated the veteran’s other health conditions or his BRCA mutation status into risk stratification results or the patient report.
Test Results
The Oncotype DX GPS result for this NCCN low-risk patient was 31 (Figure 1). This score corresponds to a likelihood of favorable pathology at radical prostatectomy of 71% (95% confidence interval [CI]: 63%-78%). Favorable pathology is defined as freedom from highgrade (Gleason score > 4+3) and/or nonorgan-confined (pT3) disease. This GPS result was consistent with the range of risk expected for NCCN low-risk patients based on the validation cohorts for the assay. The estimate of likelihood of favorable pathology would be modified if the PSA density result were available and if it placed the patient in the NCCN very low-risk category.
The Prolaris report demonstrated a score of 0.4 (Figure 2). This puts the veteran in the 94th percentile of contemporary U.S. men who are AUA low risk. The CCP score makes his cancer more aggressive than most AUA low-risk men, and the projected 10-year disease-specific mortality is 3%. In conjunction with the patient’s BRCA2 status, he may benefit from definitive intervention. If active surveillance is chosen, careful and regular follow-up for disease progression is mandated.
Interpretation of Genomic Testing in PCa
For both tests, the results are derived from 2-tiered calculations. For Oncotype DX, the gene expression measurement yields the GPS, which is then integrated with the patient’s clinical and pathologic information to yield the likelihood of favorable pathology. Although the Oncotype DX GPS is an independent measure of disease aggressiveness, on the patient report, the GPS is combined with the NCCN clinical risk group to provide a likelihood of favorable pathology. Therefore, 2 patients with the same GPS but different levels of clinical risk will have different likelihoods of favorable pathology.
The Prolaris test provides the Prolaris CCP score as well as the percentile group of patients with a lower score within the same risk category. Also, the Prolaris test yields a numerical 10-year PCa-specific mortality risk. The Prolaris score has been shown to impact therapeutic decisions in patients with newly diagnosed PCa.20
Recently, Myriad defined a threshold for active surveillance combining the CCP and CAPRA scores.21 Myriad validated this cutoff in 2 cohorts of men initially managed conservatively. Although the model predicts up to 3.2% disease-specific mortality, there were no observed deaths during a decade of follow-up. Myriad reports that by using this cutoff in contemporary patients tested commercially with Prolaris, a health care system could increase the percentage of men who would fit current criteria for active surveillance from 36% to 60% with no increase in risk of disease-specific mortality.
The results of these 2 tests are presented in 2 different formats and provide risk estimates for different clinical endpoints, making it challenging for a clinician to directly compare them. Moreover, each genomic test is based on a different set of genes and uses different clinical risk criteria (AUA vs NCCN), which may result in different test output. Finally, and most relevant to the case described here, there is no evidence-based consensus on how to interpret these test results in the context of a BRCA2 mutation.
Based on the published literature reporting that BRCA2 mutations are associated with more aggressive disease, one prediction would be that test scores from genomic assays such as Oncotype DX and Prolaris would tend to be higher in BRCA2 carriers than those of the overall population of PCa patients. This has, in fact, been reported for the Oncotype DX Breast Cancer Assay recurrence score in women who are BRCA carriers.22 Further research is required to ascertain whether this will be true for Oncotype DX GPS and Prolaris CCP score in PCa. The mechanism of action that predisposes BRCA2 mutation carriers to develop a more aggressive variant of PCa may not be detectable by the genomic markers included in the Oncotype DX PCa and Prolaris tests. The degree to which a mutated BRCA2 gene may interact with the genes comprising these assays and the reported tumor aggressiveness is not yet understood but deserving of future study.
Treatment Recommendation and Patient’s Decision
After considering his test results, the veteran chose active surveillance. The sum of clinical, pathologic, and molecular factors, combined with the patient’s preference, determined his course of treatment. Because prostatectomy was not performed, it has not been positively determined whether or not the patient harbors aggressive disease. As the molecular test results place the patient at the high end of the low-risk group, the VA urologist recommended close monitoring and suggested a follow-up biopsy with magnetic resonance-ultrasound fusion guidance.
Conclusions
Molecular testing found that the patient’s PCa stage and grade are consistent with NCCN low risk (Oncotype DX) and that the disease-specific mortality risk is slightly higher than predicted by clinical features alone (Prolaris). Previous studies have shown that molecular testing in men with PCa provides information that influences clinical decisions. The findings reported here suggest that molecular testing may also be a vital component in the medical management of patients with complex clinical phenotypes and common chronic conditions. Additional studies are necessary to evaluate whether the finding reported here is typical of individuals diagnosed with PCa who also have a BRCA2 mutation.
For any new genomic test to be clinically useful, its results must have clinical actionability. In this case, the clinical decision point was whether to recommend immediate definitive treatment or active surveillance. For this patient, the Oncotype DX assay provided a likelihood of favorable surgical pathology of 71% (or conversely a 29% risk of unfavorable pathology); by comparison, the Prolaris CCP score provided a 3% estimate of PCaspecific
mortality at 10 years. A key question is: How do clinicians perceive the actionability of risk estimates for these different endpoints?
The current case illustrates the challenges that rapidly developing genomic medicine pose for physicians trying to optimize care and communicate results to patients in a meaningful and consistent manner. For example, some urologists find the different 2-tiered calculations confusing. When laboratories use proprietary scalesbased on internally develop algorithms, differing interpretations are to be expected. The risk-assessment tests described here use different algorithms, and their interpretations are based on clinical categories from different sets of guidelines. This underscores the need for better standardization of PCa care.23
Oncology and urology professional associations should collaborate to develop consistent guidelines for use of new technologies in the management of PCa. A positive example is the evolution of testing recommendations in lung cancer, which initially varied between professional entities. In April 2013, the College of American Pathologists, the International Association for the Study of Lung Cancer, and the Association for Molecular Pathology jointly issued a unified clinical practice guideline on molecular testing in patients with lung cancer.24 In October 2014, the American Society of Clinical Oncology issued an endorsement of the CAP/IASLC/AMP guideline.25 As the number of complex tests being used in PCa increases, it will be important for professional associations such as AUA and NCCN to collaborate in evaluating utility of innovations to make consistent recommendations
Author disclosures
Myriad Genetics and Genomic Health provided funding for research on their tests within the VA. Dr. Dash and Dr. Lynch are principal investigators of the Genomic Health study. Dr. Lowrance is the principal investigator of the Myriad Genetics study.
Disclaimer
The opinions expressed herein are those of the authors and do not necessarily reflect those of Federal Practitioner, Frontline Medical Communications Inc., the U.S. Government, or any of its agencies. This article may discuss unlabeled or investigational use of certain drugs. Please review complete prescribing information for specific drugs or drug combinations—including indications, contraindications, warnings, and adverse effects—before administering pharmacologic therapy to patients.
Click here to continue reading.
1. D’Amico AV, Whittington R, Malkowicz SB, et al. Biochemical outcome after radical prostatectomy, external beam radiation therapy, or interstitial radiation therapy for clinically localized prostate cancer. JAMA. 1998;280(11):969-974.
2. Cooperberg MR, Pasta DJ, Elkin EP, et al. The University of California, San Francisco Cancer of the Prostate Risk Assessment score: a straightforward and reliable preoperative predictor of disease recurrence after radical prostatectomy. J Urol. 2005;173(6):1938-1942.
3. National Comprehensive Cancer Network. NCCN Clinical Practice Guidelines in Oncology: prostate cancer. National Comprehensive Cancer Network Website. http://www.nccn.org/professionals/physician_gls/pdf/prostate.pdf. Updated November 10, 2015. Accessed December 8, 2016.
4. Thompson I, Thrasher JB, Aus G, et al; AUA Prostate Cancer Clinical Guideline Update Panel. Guideline for the management of clinically localized prostate cancer: 2007 update. J Urol. 2007;177(6):2106-2131.
5. Alanee SR, Glogowski EA, Schrader KA, Eastham JA, Offit K. Clinical features and management of BRCA1 and BRCA2-associated prostate cancer. Front Biosci (Elite Ed). 2014;6:15-30.
6. Castro E, Eeles R. The role of BRCA1 and BRCA2 in prostate cancer. Asian J Androl. 2012;14(3):409-414.
7. Boorjian SA, Karnes RJ, Rangel LJ, Bergstralh EJ, Blute ML. Mayo Clinic validation of the D’amico risk group classification for predicting survival following radical prostatectomy. J Urol. 2008;179(4):1354-1360.
8. Lowrance WT, Scardino PT. Predictive models for newly diagnosed prostate cancer patients. Rev Urol. 2009;11(3):117-126.
9. Levy-Lahad E, Friedman E. Cancer risks among BRCA1 and BRCA2 mutation carriers. Br J Cancer. 2007;96(1):11-15.
10. Leongamornlert D, Mahmud N, Tymrakiewicz M, et al; UKGPCS Collaborators. Germline BRCA1 mutations increase prostate cancer risk. Br J Cancer. 2012;106(10):1697-1701.
11. Kote-Jarai Z, Leongamornlert D, Saunders E, et al; UKGPCS Collaborators. BRCA2 is a moderate penetrance gene contributing to young-onset prostate cancer: implications for genetic testing in prostate cancer patients. Br J Cancer. 2011;105(8):1230-1234.
12. Tryggvadóttir L, Vidarsdóttir L, Thorgeirsson T, et al. Prostate cancer progression and survival in BRCA2 mutation carriers. J Natl Cancer Inst. 2007;99(12):929-935.
13. Gallagher DJ, Gaudet MM, Pal P, et al. Germline BRCA mutations denote a clinicopathologic subset of prostate cancer. Clin Cancer Res. 2010;16(7):2115-2121.
14. Castro E, Goh C, Olmos D, et al. Germline BRCA mutations are associated with higher risk of nodal involvement, distant metastasis, and poor survival outcomes in prostate cancer. J Clin Oncol. 2013;31(14):1748-1757.
15. Castro E, Goh C, Leongamornlert D, et al. Effect of BRCA mutations on metastatic relapse and cause-specific survival after radical treatment for localised prostate cancer. Eur Urol. 2015;68(2):186-193.
16. Bancroft EK, Page EC, Castro E, et al; IMPACT Collaborators. Targeted prostate cancer screening in BRCA1 and BRCA2 mutation carriers: results from the initial screening round of the IMPACT study. Eur Urol. 2014;66(3):489-499.
17. Bratt O, Loman N. Clinical management of prostate cancer in men with BRCA mutations. Eur Urol. 2015;68(2):194-195.
18. Centers for Medicare & Medicaid Services (CMS). MCD archive site. CMS Website. http://localcoverage.cms.gov/mcd_archive/overview.aspx. Accessed January 8, 2016.
19. Klein EA, Cooperberg MR, Magi-Galluzzi C, et al. A 17-gene assay to predict prostate cancer aggressiveness in the context of Gleason grade heterogeneity, tumor multifocality, and biopsy undersampling. Eur Urol. 2014;66(3):550-560.
20. Shore ND, Kella N, Moran B, et al. Impact of the cell cycle progression test on physician and patient treatment selection for localized prostate cancer. J Urol. 2015;pii:S0022-5347(15)04811-9 [epub ahead of print].
21. Stone S, Cuzick JM, Fisher G, et al. Validation of an active surveillance threshold for the CCP score in conservatively managed men with localized prostate cancer. J Clin Oncol. 2015;33(suppl 15):e16040.
22. Lewin R, Rizel S, Hendler D, et al. Oncotype-DX recurrence score distribution among breast cancer patients harboring a germline mutation in the BRCA1/2 genes. J Clin Oncol. 2015;33(suppl; abstr 564).
23. Dahm P, Yeung LL, Chang SS, Cookson MS. A critical review of clinical practice guidelines for the management of clinically localized prostate cancer. J Urol. 2008;180(2):451-459.
24. Lindeman NI, Cagle PT, Beasley MB, et al. Molecular testing guideline for selection of lung cancer patients for EGFR and ALK tyrosine kinase inhibitors: guideline from the College of American Pathologists, International Association for the Study of Lung Cancer, and Association for Molecular Pathology. J Thorac Oncol. 2013;8(7):823-859.
25. Leighl NB, Rekhtman N, Biermann WA, et al. Molecular testing for selection of patients with lung cancer for epidermal growth factor receptor and anaplastic lymphoma kinase tyrosine kinase inhibitors: American Society of Clinical Oncology endorsement of the College of American Pathologists/International Association for the Study of Lung Cancer/Association for Molecular Pathology guideline. J Clin Oncol. 2014;32(32):3673-3679.
Note: Page numbers differ between the print issue and digital edition.
Implementation of a Precision Oncology Program as an Exemplar of a Learning Health Care System in the VA
Traditional research methods, well suited for scientific discovery and drug development, fall short of providing health care systems with pragmatic information in 2 important ways: Current funding and institutions cannot support comparative effectiveness studies in sufficient numbers to answer the plethora of important clinical questions that confront health care providers (HCPs). The resultant knowledge gap manifests in treatment variability based on clinician impression rather than on direct evidence. A second equally important deficiency is the inability to make full use of the knowledge acquired in treating past patients to determine the best treatment option for the current patient.
Digitization of medical records, creation of health care system corporate data warehouses, and state-of-the-art analytical tools already allow for this revolutionary approach to patient care. Obstructing progress, however, is a lack of understanding by health care system managers and HCPs of the capability of the approach, and unfamiliarity with the requisite informatics by traditional medical researchers. Furthermore the regulatory approach is tilted against the reuse of medical record data for learning and toward strict adherence to patient confidentiality.
Note: Page numbers differ between the print issue and digital edition.
Traditional research methods, well suited for scientific discovery and drug development, fall short of providing health care systems with pragmatic information in 2 important ways: Current funding and institutions cannot support comparative effectiveness studies in sufficient numbers to answer the plethora of important clinical questions that confront health care providers (HCPs). The resultant knowledge gap manifests in treatment variability based on clinician impression rather than on direct evidence. A second equally important deficiency is the inability to make full use of the knowledge acquired in treating past patients to determine the best treatment option for the current patient.
Digitization of medical records, creation of health care system corporate data warehouses, and state-of-the-art analytical tools already allow for this revolutionary approach to patient care. Obstructing progress, however, is a lack of understanding by health care system managers and HCPs of the capability of the approach, and unfamiliarity with the requisite informatics by traditional medical researchers. Furthermore the regulatory approach is tilted against the reuse of medical record data for learning and toward strict adherence to patient confidentiality.
Note: Page numbers differ between the print issue and digital edition.
Note: Page numbers differ between the print issue and digital edition.
A Patient Navigation Model for Veterans Traveling for Cancer Care
The VHA has a unique responsibility to provide excellent, patient-centered care to the veterans who have served the U.S. long after their active military service has ended. For veterans diagnosed with cancer, the physical, mental, and financial consequences can pose significant hardships and create barriers to obtaining timely and efficient health care. The need to travel for cancer care, sometimes for long distances over long periods, adds an additional disparity and puts veterans at higher risk for delays in care. Cancer care navigation teams (CCNTs) were established at the VA Puget Sound Health Care System (VAPSHCS) in Seattle, Washington, and throughout the Veterans Integrated Service Network, region 20 (VISN 20), which consists of a large geographical area that includes Alaska, Washington, Oregon, Idaho and one county in both Montana and California. These teams use an interdisciplinary approach to providing personalized assistance, support, and resources to veterans with cancer and their families who require travel for cancer care.
The CCNTs identify and minimize clinical and psychosocial barriers throughout the cancer care continuum. Although structured to address the unique needs and barriers of the veteran population within the VA, CCNT may also be used as a model for patients receiving cancer care within other complex and decentralized health care systems.
Patient Navigation in Cancer Care
The term navigation in the context of cancer care originated in 1990 at Harlem Hospital Center in New York City. The term described an intervention to address barriers to care experienced by a population of low income African American women with breast cancer. By applying patient navigation in addition to offering free and low-cost breast cancer screening and exams for high-risk patients, the 5-year survival rate in this disadvantaged population of women increased from 39% to 70%.1
Since then, navigation programs in cancer care have been adopted in health care settings around the world. Many different models have been described within the literature.2-5 Patient navigation is perhaps best recognized as a means to decrease health disparities by addressing barriers to health care, which may include lack of insurance, poverty, medical or psychiatric comorbidities, low health literacy, food insecurity, and homelessness. By identifying and addressing these barriers to care in high-risk populations, patient navigation programs have demonstrated positive outcomes, including improvement in cancer screening rates, timeliness of care, medication adherence, and patient satisfaction.6-10 Although there is a large amount of literature on navigation in cancer care, there is minimal literature that focuses on navigation in the veteran population and health care system.
Barriers to Cancer Care
The VA is a national health care system composed of community clinics, hospitals, and major referral centers that deliver comprehensive health care to veterans. For veterans diagnosed with cancer, the physical, mental, and financial consequences can pose significant hardships and create barriers to obtaining timely, efficient health care. Research studies have documented significant differences among veterans receiving health care through the VHA compared with veterans who receive health care from other sources. Veterans enrolled at the VA are more likely to be poorer, older, African American, less well educated, unemployed or underemployed, lack social support, and in poorer physical and mental health compared with the general population or with veterans who do not use VA health care.11-13 Such health disparities have been linked to delays in timely access to health care.11
In a study comparing an age-adjusted ambulatory care population with veterans receiving care at the VA, VA patients were also found to be 3 times more likely to have ever been diagnosed with cancer.12 Exposures to carcinogens during their military service, such as Agent Orange, may contribute to this difference.14 Veterans have higher rates of posttraumatic stress disorder (PTSD) and other mental health disorders from military combat experiences or other traumas; these conditions can be exacerbated by the distress of a cancer diagnosis.15-17
Veterans requiring specialty care, such as cancer-related care, are referred within the VISN and may need to travel long distances in to access these specialty providers. Continuity of care is challenged during cancer diagnosis, staging, treatment, and surveillance when some aspects of care may be completed at geographically distant sites or by community providers if unavailable through the local VA. Appointments for care occur within each specialty service, and staff and clinic availability limit scheduling. There are no formal mechanisms for coordinating visits for efficiency or minimizing travel burden. The electronic medical record (EMR) at the VA can be helpful in accessing information from remote locations but does not easily integrate medical information from different facilities. Clinical data, such as recommendations for follow-up care, may take time and patience to access.
These challenges to the delivery of timely, efficient, patient-centered cancer care were documented in a cancer needs assessment performed in 2012 across VISN 20 (Figure 1). In response, a 3-year pilot program was initiated to implement a network of CCNTs in 8 VA facilities across the region.
Planning and Implementation
The VAPSHCS is a major referral center for cancer care that serves veterans living in VISN 20. On average, about 1,000 new cancers are diagnosed, and VAPSHCS sees 2,000 unique veterans for cancer care annually (Figure 2).One-quarter of these veterans are from out of state. For veterans living in Washington, nearly half traveled 50 miles or more to access cancer services at VAPSHCS. VA Puget Sound implemented its CCNT in the fall of 2014 and consists of an advanced practice registered nurse practitioner (ARNP), registered nurse (RN), social worker (SW), and program support assistant (PSA).
Veterans in identified priority cohorts thought to be at highest risk for barriers to cancer care are enrolled in navigation services. These priority groups include those veterans referred from another regional VA facility, those living more than 100 miles from the VAPSHCS, those referred for multimodality care (eg, surgery with neoadjuvant chemoradiation), and those with significant psychosocial barriers to care. Veterans are identified by the CCNT through a formal consult, notification from the CCNT at another VA facility, a cancer conference, a review of pathology results, and in some cases by veteran self-referral.
As it develops further capacity, CCNT will add other high-risk groups. Ideally, CCNT will eventually be a resource all veterans referred to VAPSHCS for cancer care, so all veterans may be assessed for potential barriers to care and be provided with much needed support and resources.
The CCNT is proactive and systematic in its navigation processes. Where possible, CCNT members are cross-trained to provide role coverage. The team reviews medical records for veterans actively enrolled in CCNT services weekly, to identify new barriers to care and address them in a timely manner. A robust data tracking system (created using a relational database) allows for storage of updated patient information and assigns tasks within the team, tracks upcoming appointments to support coordination, identifies travel and lodging needs, and assures follow-up care is completed. It also generates lists used for routine rounding on patient groups, treatment summary reports, and survivorship care plans.
The CCNT uses standardized assessment tools, including a navigation intake form, the National Comprehensive Cancer Network (NCCN) Distress Thermometer, and a functional assessment. Communication is an essential part of the navigation team, which addresses veteran’s identified needs by conducting weekly rounds within the interdisciplinary team to share information and collaborate.
The team has weekly telephone calls with its CCNTs from referring facilities to discuss veterans at all stages of the cancer continuum and facilitate transfer of information between facilities and providers, including needed diagnostic services and follow-up recommendations. The CCNT also facilitates communication with PSHCS specialty services by actively participating in multidisciplinary rounds and cancer conference.
Finally, although the CCNT follows individual veterans, the team also recognizes its role in identifying and addressing system barriers to cancer care. Collaborating with its partners within the facility and across the network, the team has improved access to services, created teaching tools that can be shared across disciplines, and implemented new procedures and policies to meet the American College of Surgeons Commission on Cancer accreditation standards and improve the cancer care system as a whole.
VAPSHCS Cancer Navigation Model
The VAPSHCS cancer navigation model is divided into 4 main processes based on the cancer care continuum. To illustrate this navigation model, this paper follows the journey of a 57-year-old male veteran referred to PSHCS with newly diagnosed head and neck cancer. He is divorced, with very little social support and lives in a remote area about 60 miles from his primary VA facility and more than 400 miles from PSHCS. His case was presented at the PSHCS facility cancer conference, where concurrent chemotherapy and radiation was recommended. This particular treatment consists of daily radiation and weekly chemotherapy over 6 to 7 weeks. The CCNT staff recognized that this veteran met criteria for navigation, entered him in the tracking database, and notified his referring facility CCNT of the plan of care.
Preconsult
Prior to veterans traveling to VAPSHCS for a new diagnosis or suspicion of cancer, the first goal is to identify any potential barriers to travel. It is a financial burden for many veterans to travel, and in the past, travel has prevented veterans from attending their specialty consult appointments. It is the role of the CCNT PSA to contact the veteran by telephone, introduce their services, provide education about available travel and lodging benefits, and schedule a visit with the CCNT RN to coincide with the veteran’s scheduled other specialty appointments.
In this case, the CCNT PSA contacted the veteran with information about the VAPSHCS, placed a lodging consult to arrange hotel accommodations for the veteran while in Seattle, and provided information regarding transportation from the hotel to the VA. The CCNT also identified that the veteran required a radiation oncology consultation and dental evaluation to proceed with a treatment plan. To decrease travel burden with additional trips to Seattle, the PSA contacted these specialty services to schedule the appointments. The PSA then assembled and mailed a packet of information to the veteran, which included details about how to pack and prepare for the trip, a facility map, and a hotel shuttle schedule.
Consult Visit and Planning
When veterans arrive at VAPSHCS, the CCNT RN meets them and completes an intake form. This standardized questionnaire identifies potential barriers to cancer care and supports the need for referrals to services, such as a dietitian, chaplain, palliative care, social work, physical and occupational therapy, travel, or lodging.
During this visit, the CCNT RN also asks the veteran to complete a NCCN Distress Thermometer. This thermometer assessment tool screens for physical, emotional, and practical needs that are specific to cancer. In this particular veteran’s situation, the distress level was 7 out of 10 (a score of 4 or greater triggersan automatic consult to social work once the results are entered in the EMR). Based on the outcomes information obtained from the intake form and NCCN Distress Thermometer, the CCNT RN made referrals to SW, chaplain services, and the oncology dietitian.
During the CCNT RN visit, nurse identified that the veteran’s financial situation had changed significantly resulting in less income and causing financial distress. The veteran was encouraged to complete an updated benefit renewal form with the SW that would likely eliminate his required copays for medical visits and prescription medications during the 6 weeks of chemotherapy and radiation. This need was communicated to the CCNT SW. The RN provided the veteran with information about VA resources to support him during cancer treatment, including meal options and support groups for both veterans and caregivers. They discussed the likely plan of care, including disease progress, information on prescribed drugs, dental evaluation and extractions as needed, placement of a feeding tube and a central line, and gave the veteran written brochures to review at his convenience. The RN also reviewed the logistics of a prolonged stay for the recommended course of chemotherapy and radiation.
During the initial CCNT intake process, the RN identified that the veteran would be without a caregiver and would be staying alone in lodging throughout his cancer treatment. The RN then completed a functional assessment of safety risks while lodging alone during this extended time. This brief questionnaire identifies any deficits in a veteran’s activity of daily living that may influence safety while lodging alone. The assessment is documented in the EMR, and if any concerns are identified, these are discussed with the veteran and a team of medical providers. If necessary, interventions are put into place before the veteran’s return for treatment. Potential safeguards may include obtaining safety equipment (eg, walker and bath chair), identifying an appropriate caregiver, or referring the veteran to a skilled nursing facility for the duration of treatment.
Following the veteran’s consultation visits, he went home with a return date 2 weeks later to start treatment. The VAPSHCS CCNT discussed the plan of care with his local CCNT, which facilitated placement of his feeding tube and addressed other symptom management concerns. The local CCNT SW completed advanced directives with the veteran and coordinated his travel back to VAPSHCS to begin treatment.
During Treatment
Veterans traveling from other VA facilities are away from their primary care providers (PCPs) for a number of weeks. Other specialty providers see a veteran during cancer treatment; however, the CCNT ARNP supports primary care needs while the veteran is away from their home VA facility. The ARNP is able to address chronic or acute medical issues before the start of treatment to prevent delays in cancer care.
Once the veteran returned to VAPSHCS to initiate therapy, the CCNT ARNP completed a history and physical examination to identify and address any active medical problems and document past medical history and current medication list in the EMR. This provides easy access to a thorough and complete baseline to both the oncology and radiation oncology providers. The ARNP examination revealed a new neck wound on the veteran, likely related to his cancer, and an urgent consult was placed to wound care. The otolaryngology, oncology, and radiation oncology departments were alerted to this development so they could assess the patient and adjust treatment plans as necessary. The veteran also required a refill of his blood pressure medication and had a number of questions regarding his upcoming treatment, which were addressed during the visit.
Within the first 2 days of the veteran’s return, he was scheduled to meet with the CCNT SW who reviewed and documented his advanced directive within the system, assessed his distress, provided therapeutic counseling, and completed the health benefit renewal form. Given the veteran’s financial status, the SW was able to help him apply for financial hardship to cover the costs of the care he had already received and assisted him with securing an appointment with the Social Security Administration (SSA) for disability benefits. The CCNT SW then helped the veteran complete a phone interview with the SSA and complete the application process. The SW also helped him complete the application for VA service-connected compensation and pension disability benefits.
Throughout his treatment course, the CCNT continued to be a resource for the veteran. Because he had PTSD and was uncomfortable attending support groups, the CCNT SW met with him weekly to provide counseling and psychosocial support. He stopped by the CCNT office on several occasions to report how he was doing, and the team provided assistance in obtaining supplies for his feeding tube and managing a complication that arose with his lodging. In preparation for his treatment completion and return home, the VAPSHCS CCNT communicated with his local CCNT to describe follow-up needs and ensure appropriate medical visits were scheduled. His travel home was arranged by the VAPSHCS PSA.
Treatment Completion
Before leaving VAPSHCS, the veteran was scheduled and seen in the clinic by the ARNP, where he received a written comprehensive treatment summary. The summary documented his cancer diagnosis, treatment, complications, and recommendations for follow-up care. He had the opportunity to ask questions about his treatment, and a clinical assessment was made for adverse effects. Appropriate interventions also were identified and addressed. A comprehensive treatment summary note was documented in the EMR and sent to his PCP and other medical specialists at his home facility to assure continuity of care.
The VAPSHCS CCNT continued to communicate weekly with the veteran’s home CCNT following his return, to ensure he received appropriate follow-up care and addressed questions and needs that arose. The veteran’s home CCNT continued to monitor the veteran for 1 year post treatment and communicate with VAPSHCS CCNT.
Conclusion
The VA is in a unique position to meet the needs of veterans by providing comprehensive care with sensitivity to military culture, access to a range of complicated benefits awarded to veterans, particularly those with servicerelated exposures or injuries, and specialists in diagnosis and treatment of physical and mental consequences of their service. Patient navigation helps ensure veterans can access these services, maintain continuity of care despite referrals across large geographic regions, and receive support while receiving cancer treatment at the VA.
Use of an interdisciplinary team, including an ARNP, RN, SW, and PSA is vital to fully address the wide range of physical, psychosocial, and practical barriers to care that a veteran may experience. Since September 2014, PSHCS has enrolled more than 500 veterans with CCNT, and nearly 200 are actively being followed and provided with navigation services at any given time (Figure 3). By proactively identifying and addressing barriers to care, the advocacy provided by CCNT has averted patient safety risks, made better use of limited veteran and VA resources, and provided patient-centered care to veterans.
Evaluation is currently underway to measure the impact of the program and develop metrics for the CCNT. Given the needs of the patient population, the team hopes to see further expansion of CCNT in order to reach more risk groups. Institutional support and funding for patient navigation should be a high priority as the VA strives to provide excellent, patient-centered care.
Acknowledgements
The authors would like first and foremost to give a special thank-you to the veterans for their service to our country. In addition, the authors would like to thank champions for the cancer care navigation team, including Dr. Daniel Wu, chief of oncology; and Dr. Peter Wu, cancer committee chair and surgical oncologist, and Sandra Solomon, nurse manager of the Cancer Care Clinic and inpatient cancer unit at VA Puget Sound Health Care System; Dr. Carol Sprague, staff physician and clinical lead VISN 20 Cancer Care Platform, Judy McConnachie, MPH, administrative director, Clinical Business Intelligence Northwest Innovation Center, VA Portland Health Care System in Portland, Oregon; and Tracy Weistreich, PhD, RN, associate director Patient Care Services at VA Roseburg Healthcare System in Roseburg, Oregon; and the VISN 20 Executive Cancer Care Platform Advisory Board.
The authors would also like to acknowledge all the VISN 20 network cancer care navigation teams at the following sites: Anchorage, Alaska; Boise, Idaho; Portland, Oregon; Roseburg, Oregon; Spokane, Washington; Walla Walla, Washington; and White City, Oregon. Team members at each site have been an integral part of the development and success of the VAPSHCS CCNT.
The authors are also grateful to all of the nurse coordinators and providers within all the specialty services at Puget Sound Health Care Systems, including oncology, radiation oncology, cancer care, otolaryngology, general surgery, palliative care, dental and primary care, for their collaboration with veteran care.
Author disclosures
The authors report no actual or potential conflicts of interest with regard to this article.
Disclaimer
The opinions expressed herein are those of the authors and do not necessarily reflect those of Federal Practitioner, Frontline Medical Communications Inc., the U.S. Government, or any of its agencies. This article may discuss unlabeled or investigational use of certain drugs. Please review the complete prescribing information for specific drugs or drug combinations—including indications, contraindications, warnings, and adverse effects—before administering pharmacologic therapy to patients.
Click here to continue reading.
1. Freeman HP. Patient navigation as a targeted intervention: for patients at high risk
for delays in cancer care. Cancer. 2015;121(22):3930-3932.
2. Moy B, Chabner BA. Patient navigator programs, cancer disparities, and the patient protection and affordable care act. Oncologist. 2011;16(7):926-929.
3. Meade CD, Wells KJ, Arevalo M, et al. Lay navigator model for impacting cancer health disparities. J Cancer Educ. 2014;29(3):449-457.
4. Fillion L, Cook S, Veillette AM, et al. Professional navigation: a comparative study of two Canadian models. Can Oncol Nurs J. 2012;22(4):257-277.
5. Lairson DR, Huo J, Ricks KA, Savas L, Fernández ME. The cost of implementing a 2-1-1 call center-based cancer control navigator program. Eval Program Plann. 2013:39:51-56.
6. Percac-Lima S, Cronin PR, Ryan DP, Chabner BA, Daly E, Kimball AB. Patient navigation based on predictive modeling decreases no-show rates in cancer care. Cancer. 2015;121(10):1662-1670.
7. Percac-Lima S, Ashburner JM, McCarthy AM, Piawah S, Atlas SJ. Patient navigation
to improve follow-up of abnormal mammograms among disadvantaged women. J Womens Health (Larchmt). 2015;24(2):138-143.
8. Ladabaum U, Mannalithara A, Jandorf L, Itzkowitz SH. Cost-effectiveness of patient navigation to increase adherence with screening colonoscopy among minority
individuals. Cancer. 2015;121(7):1088-1097.
9. Baliski C, McGahan CE, Liberto CM, et al. Influence of nurse navigation on wait times for breast cancer care in a Canadian regional cancer center. Am J Surg. 2014;207(5):686-691.
10. Hoffman JH, LaVerda NL, Young HA, et al. Patient navigation significantly reduces delays in breast cancer diagnosis in the District of Columbia. Cancer Epidemiol Biomarkers Prev. 2012;1(10):1655-1663
11. Kazis LE, Miller DR, Clark J, et al. Health-related quality of life in patients served by the Department of Veterans Affairs: results from the Veterans Health Study. Arch Intern Med. 1998;158(6):626-632.
12. Rogers WH, Kazis LE, Miller DR, et al. Comparing the health status of VA and non-VA ambulatory patients: the veterans health and medical outcome studies. J Ambul Care Manage. 2004;27(3):249-262.
13. Agha Z, Lofgren RP, VanRuiswyk JV, Layde PM. Are patients at Veterans Affairs medical centers sicker? A comparative analysis of health status and medical resource use. Arch Intern Med. 2000;160(21):3252-3257.
14. Institute of Medicine (US) Committee to Review the Health Effects in Vietnam Veterans of Exposure to Herbicides. Veterans and Agent Orange: Health Effects of Herbicides Used in Vietnam. Washington, DC: National Academies Press; 1994.
15. Wachen JS, Patidar SM, Mulligan EA, Naik AD, Moye J. Cancer-related PTSD symptoms in a veteran sample: association with age, combat PTSD, and quality of life. Psychooncology. 2014;23(8):921-927.
16. Mulligan EA, Wachen JS, Naik AD, Gosian J, Moye J. Cancer as a criterion a traumatic stressor for veterans: prevalence and correlates. Psychol Trauma. 2014;6(suppl 1):S73-S81.
17. Dobie DJ, Kivlahan DR, Maynard C, Bush KR, Davis TM, Bradley KA. Posttraumatic stress disorder in female veterans: association with self-reported health problems and functional impairment. Arch Intern Med. 2004;164(4):394-400.
Note: Page numbers differ between the print issue and digital edition.
The VHA has a unique responsibility to provide excellent, patient-centered care to the veterans who have served the U.S. long after their active military service has ended. For veterans diagnosed with cancer, the physical, mental, and financial consequences can pose significant hardships and create barriers to obtaining timely and efficient health care. The need to travel for cancer care, sometimes for long distances over long periods, adds an additional disparity and puts veterans at higher risk for delays in care. Cancer care navigation teams (CCNTs) were established at the VA Puget Sound Health Care System (VAPSHCS) in Seattle, Washington, and throughout the Veterans Integrated Service Network, region 20 (VISN 20), which consists of a large geographical area that includes Alaska, Washington, Oregon, Idaho and one county in both Montana and California. These teams use an interdisciplinary approach to providing personalized assistance, support, and resources to veterans with cancer and their families who require travel for cancer care.
The CCNTs identify and minimize clinical and psychosocial barriers throughout the cancer care continuum. Although structured to address the unique needs and barriers of the veteran population within the VA, CCNT may also be used as a model for patients receiving cancer care within other complex and decentralized health care systems.
Patient Navigation in Cancer Care
The term navigation in the context of cancer care originated in 1990 at Harlem Hospital Center in New York City. The term described an intervention to address barriers to care experienced by a population of low income African American women with breast cancer. By applying patient navigation in addition to offering free and low-cost breast cancer screening and exams for high-risk patients, the 5-year survival rate in this disadvantaged population of women increased from 39% to 70%.1
Since then, navigation programs in cancer care have been adopted in health care settings around the world. Many different models have been described within the literature.2-5 Patient navigation is perhaps best recognized as a means to decrease health disparities by addressing barriers to health care, which may include lack of insurance, poverty, medical or psychiatric comorbidities, low health literacy, food insecurity, and homelessness. By identifying and addressing these barriers to care in high-risk populations, patient navigation programs have demonstrated positive outcomes, including improvement in cancer screening rates, timeliness of care, medication adherence, and patient satisfaction.6-10 Although there is a large amount of literature on navigation in cancer care, there is minimal literature that focuses on navigation in the veteran population and health care system.
Barriers to Cancer Care
The VA is a national health care system composed of community clinics, hospitals, and major referral centers that deliver comprehensive health care to veterans. For veterans diagnosed with cancer, the physical, mental, and financial consequences can pose significant hardships and create barriers to obtaining timely, efficient health care. Research studies have documented significant differences among veterans receiving health care through the VHA compared with veterans who receive health care from other sources. Veterans enrolled at the VA are more likely to be poorer, older, African American, less well educated, unemployed or underemployed, lack social support, and in poorer physical and mental health compared with the general population or with veterans who do not use VA health care.11-13 Such health disparities have been linked to delays in timely access to health care.11
In a study comparing an age-adjusted ambulatory care population with veterans receiving care at the VA, VA patients were also found to be 3 times more likely to have ever been diagnosed with cancer.12 Exposures to carcinogens during their military service, such as Agent Orange, may contribute to this difference.14 Veterans have higher rates of posttraumatic stress disorder (PTSD) and other mental health disorders from military combat experiences or other traumas; these conditions can be exacerbated by the distress of a cancer diagnosis.15-17
Veterans requiring specialty care, such as cancer-related care, are referred within the VISN and may need to travel long distances in to access these specialty providers. Continuity of care is challenged during cancer diagnosis, staging, treatment, and surveillance when some aspects of care may be completed at geographically distant sites or by community providers if unavailable through the local VA. Appointments for care occur within each specialty service, and staff and clinic availability limit scheduling. There are no formal mechanisms for coordinating visits for efficiency or minimizing travel burden. The electronic medical record (EMR) at the VA can be helpful in accessing information from remote locations but does not easily integrate medical information from different facilities. Clinical data, such as recommendations for follow-up care, may take time and patience to access.
These challenges to the delivery of timely, efficient, patient-centered cancer care were documented in a cancer needs assessment performed in 2012 across VISN 20 (Figure 1). In response, a 3-year pilot program was initiated to implement a network of CCNTs in 8 VA facilities across the region.
Planning and Implementation
The VAPSHCS is a major referral center for cancer care that serves veterans living in VISN 20. On average, about 1,000 new cancers are diagnosed, and VAPSHCS sees 2,000 unique veterans for cancer care annually (Figure 2).One-quarter of these veterans are from out of state. For veterans living in Washington, nearly half traveled 50 miles or more to access cancer services at VAPSHCS. VA Puget Sound implemented its CCNT in the fall of 2014 and consists of an advanced practice registered nurse practitioner (ARNP), registered nurse (RN), social worker (SW), and program support assistant (PSA).
Veterans in identified priority cohorts thought to be at highest risk for barriers to cancer care are enrolled in navigation services. These priority groups include those veterans referred from another regional VA facility, those living more than 100 miles from the VAPSHCS, those referred for multimodality care (eg, surgery with neoadjuvant chemoradiation), and those with significant psychosocial barriers to care. Veterans are identified by the CCNT through a formal consult, notification from the CCNT at another VA facility, a cancer conference, a review of pathology results, and in some cases by veteran self-referral.
As it develops further capacity, CCNT will add other high-risk groups. Ideally, CCNT will eventually be a resource all veterans referred to VAPSHCS for cancer care, so all veterans may be assessed for potential barriers to care and be provided with much needed support and resources.
The CCNT is proactive and systematic in its navigation processes. Where possible, CCNT members are cross-trained to provide role coverage. The team reviews medical records for veterans actively enrolled in CCNT services weekly, to identify new barriers to care and address them in a timely manner. A robust data tracking system (created using a relational database) allows for storage of updated patient information and assigns tasks within the team, tracks upcoming appointments to support coordination, identifies travel and lodging needs, and assures follow-up care is completed. It also generates lists used for routine rounding on patient groups, treatment summary reports, and survivorship care plans.
The CCNT uses standardized assessment tools, including a navigation intake form, the National Comprehensive Cancer Network (NCCN) Distress Thermometer, and a functional assessment. Communication is an essential part of the navigation team, which addresses veteran’s identified needs by conducting weekly rounds within the interdisciplinary team to share information and collaborate.
The team has weekly telephone calls with its CCNTs from referring facilities to discuss veterans at all stages of the cancer continuum and facilitate transfer of information between facilities and providers, including needed diagnostic services and follow-up recommendations. The CCNT also facilitates communication with PSHCS specialty services by actively participating in multidisciplinary rounds and cancer conference.
Finally, although the CCNT follows individual veterans, the team also recognizes its role in identifying and addressing system barriers to cancer care. Collaborating with its partners within the facility and across the network, the team has improved access to services, created teaching tools that can be shared across disciplines, and implemented new procedures and policies to meet the American College of Surgeons Commission on Cancer accreditation standards and improve the cancer care system as a whole.
VAPSHCS Cancer Navigation Model
The VAPSHCS cancer navigation model is divided into 4 main processes based on the cancer care continuum. To illustrate this navigation model, this paper follows the journey of a 57-year-old male veteran referred to PSHCS with newly diagnosed head and neck cancer. He is divorced, with very little social support and lives in a remote area about 60 miles from his primary VA facility and more than 400 miles from PSHCS. His case was presented at the PSHCS facility cancer conference, where concurrent chemotherapy and radiation was recommended. This particular treatment consists of daily radiation and weekly chemotherapy over 6 to 7 weeks. The CCNT staff recognized that this veteran met criteria for navigation, entered him in the tracking database, and notified his referring facility CCNT of the plan of care.
Preconsult
Prior to veterans traveling to VAPSHCS for a new diagnosis or suspicion of cancer, the first goal is to identify any potential barriers to travel. It is a financial burden for many veterans to travel, and in the past, travel has prevented veterans from attending their specialty consult appointments. It is the role of the CCNT PSA to contact the veteran by telephone, introduce their services, provide education about available travel and lodging benefits, and schedule a visit with the CCNT RN to coincide with the veteran’s scheduled other specialty appointments.
In this case, the CCNT PSA contacted the veteran with information about the VAPSHCS, placed a lodging consult to arrange hotel accommodations for the veteran while in Seattle, and provided information regarding transportation from the hotel to the VA. The CCNT also identified that the veteran required a radiation oncology consultation and dental evaluation to proceed with a treatment plan. To decrease travel burden with additional trips to Seattle, the PSA contacted these specialty services to schedule the appointments. The PSA then assembled and mailed a packet of information to the veteran, which included details about how to pack and prepare for the trip, a facility map, and a hotel shuttle schedule.
Consult Visit and Planning
When veterans arrive at VAPSHCS, the CCNT RN meets them and completes an intake form. This standardized questionnaire identifies potential barriers to cancer care and supports the need for referrals to services, such as a dietitian, chaplain, palliative care, social work, physical and occupational therapy, travel, or lodging.
During this visit, the CCNT RN also asks the veteran to complete a NCCN Distress Thermometer. This thermometer assessment tool screens for physical, emotional, and practical needs that are specific to cancer. In this particular veteran’s situation, the distress level was 7 out of 10 (a score of 4 or greater triggersan automatic consult to social work once the results are entered in the EMR). Based on the outcomes information obtained from the intake form and NCCN Distress Thermometer, the CCNT RN made referrals to SW, chaplain services, and the oncology dietitian.
During the CCNT RN visit, nurse identified that the veteran’s financial situation had changed significantly resulting in less income and causing financial distress. The veteran was encouraged to complete an updated benefit renewal form with the SW that would likely eliminate his required copays for medical visits and prescription medications during the 6 weeks of chemotherapy and radiation. This need was communicated to the CCNT SW. The RN provided the veteran with information about VA resources to support him during cancer treatment, including meal options and support groups for both veterans and caregivers. They discussed the likely plan of care, including disease progress, information on prescribed drugs, dental evaluation and extractions as needed, placement of a feeding tube and a central line, and gave the veteran written brochures to review at his convenience. The RN also reviewed the logistics of a prolonged stay for the recommended course of chemotherapy and radiation.
During the initial CCNT intake process, the RN identified that the veteran would be without a caregiver and would be staying alone in lodging throughout his cancer treatment. The RN then completed a functional assessment of safety risks while lodging alone during this extended time. This brief questionnaire identifies any deficits in a veteran’s activity of daily living that may influence safety while lodging alone. The assessment is documented in the EMR, and if any concerns are identified, these are discussed with the veteran and a team of medical providers. If necessary, interventions are put into place before the veteran’s return for treatment. Potential safeguards may include obtaining safety equipment (eg, walker and bath chair), identifying an appropriate caregiver, or referring the veteran to a skilled nursing facility for the duration of treatment.
Following the veteran’s consultation visits, he went home with a return date 2 weeks later to start treatment. The VAPSHCS CCNT discussed the plan of care with his local CCNT, which facilitated placement of his feeding tube and addressed other symptom management concerns. The local CCNT SW completed advanced directives with the veteran and coordinated his travel back to VAPSHCS to begin treatment.
During Treatment
Veterans traveling from other VA facilities are away from their primary care providers (PCPs) for a number of weeks. Other specialty providers see a veteran during cancer treatment; however, the CCNT ARNP supports primary care needs while the veteran is away from their home VA facility. The ARNP is able to address chronic or acute medical issues before the start of treatment to prevent delays in cancer care.
Once the veteran returned to VAPSHCS to initiate therapy, the CCNT ARNP completed a history and physical examination to identify and address any active medical problems and document past medical history and current medication list in the EMR. This provides easy access to a thorough and complete baseline to both the oncology and radiation oncology providers. The ARNP examination revealed a new neck wound on the veteran, likely related to his cancer, and an urgent consult was placed to wound care. The otolaryngology, oncology, and radiation oncology departments were alerted to this development so they could assess the patient and adjust treatment plans as necessary. The veteran also required a refill of his blood pressure medication and had a number of questions regarding his upcoming treatment, which were addressed during the visit.
Within the first 2 days of the veteran’s return, he was scheduled to meet with the CCNT SW who reviewed and documented his advanced directive within the system, assessed his distress, provided therapeutic counseling, and completed the health benefit renewal form. Given the veteran’s financial status, the SW was able to help him apply for financial hardship to cover the costs of the care he had already received and assisted him with securing an appointment with the Social Security Administration (SSA) for disability benefits. The CCNT SW then helped the veteran complete a phone interview with the SSA and complete the application process. The SW also helped him complete the application for VA service-connected compensation and pension disability benefits.
Throughout his treatment course, the CCNT continued to be a resource for the veteran. Because he had PTSD and was uncomfortable attending support groups, the CCNT SW met with him weekly to provide counseling and psychosocial support. He stopped by the CCNT office on several occasions to report how he was doing, and the team provided assistance in obtaining supplies for his feeding tube and managing a complication that arose with his lodging. In preparation for his treatment completion and return home, the VAPSHCS CCNT communicated with his local CCNT to describe follow-up needs and ensure appropriate medical visits were scheduled. His travel home was arranged by the VAPSHCS PSA.
Treatment Completion
Before leaving VAPSHCS, the veteran was scheduled and seen in the clinic by the ARNP, where he received a written comprehensive treatment summary. The summary documented his cancer diagnosis, treatment, complications, and recommendations for follow-up care. He had the opportunity to ask questions about his treatment, and a clinical assessment was made for adverse effects. Appropriate interventions also were identified and addressed. A comprehensive treatment summary note was documented in the EMR and sent to his PCP and other medical specialists at his home facility to assure continuity of care.
The VAPSHCS CCNT continued to communicate weekly with the veteran’s home CCNT following his return, to ensure he received appropriate follow-up care and addressed questions and needs that arose. The veteran’s home CCNT continued to monitor the veteran for 1 year post treatment and communicate with VAPSHCS CCNT.
Conclusion
The VA is in a unique position to meet the needs of veterans by providing comprehensive care with sensitivity to military culture, access to a range of complicated benefits awarded to veterans, particularly those with servicerelated exposures or injuries, and specialists in diagnosis and treatment of physical and mental consequences of their service. Patient navigation helps ensure veterans can access these services, maintain continuity of care despite referrals across large geographic regions, and receive support while receiving cancer treatment at the VA.
Use of an interdisciplinary team, including an ARNP, RN, SW, and PSA is vital to fully address the wide range of physical, psychosocial, and practical barriers to care that a veteran may experience. Since September 2014, PSHCS has enrolled more than 500 veterans with CCNT, and nearly 200 are actively being followed and provided with navigation services at any given time (Figure 3). By proactively identifying and addressing barriers to care, the advocacy provided by CCNT has averted patient safety risks, made better use of limited veteran and VA resources, and provided patient-centered care to veterans.
Evaluation is currently underway to measure the impact of the program and develop metrics for the CCNT. Given the needs of the patient population, the team hopes to see further expansion of CCNT in order to reach more risk groups. Institutional support and funding for patient navigation should be a high priority as the VA strives to provide excellent, patient-centered care.
Acknowledgements
The authors would like first and foremost to give a special thank-you to the veterans for their service to our country. In addition, the authors would like to thank champions for the cancer care navigation team, including Dr. Daniel Wu, chief of oncology; and Dr. Peter Wu, cancer committee chair and surgical oncologist, and Sandra Solomon, nurse manager of the Cancer Care Clinic and inpatient cancer unit at VA Puget Sound Health Care System; Dr. Carol Sprague, staff physician and clinical lead VISN 20 Cancer Care Platform, Judy McConnachie, MPH, administrative director, Clinical Business Intelligence Northwest Innovation Center, VA Portland Health Care System in Portland, Oregon; and Tracy Weistreich, PhD, RN, associate director Patient Care Services at VA Roseburg Healthcare System in Roseburg, Oregon; and the VISN 20 Executive Cancer Care Platform Advisory Board.
The authors would also like to acknowledge all the VISN 20 network cancer care navigation teams at the following sites: Anchorage, Alaska; Boise, Idaho; Portland, Oregon; Roseburg, Oregon; Spokane, Washington; Walla Walla, Washington; and White City, Oregon. Team members at each site have been an integral part of the development and success of the VAPSHCS CCNT.
The authors are also grateful to all of the nurse coordinators and providers within all the specialty services at Puget Sound Health Care Systems, including oncology, radiation oncology, cancer care, otolaryngology, general surgery, palliative care, dental and primary care, for their collaboration with veteran care.
Author disclosures
The authors report no actual or potential conflicts of interest with regard to this article.
Disclaimer
The opinions expressed herein are those of the authors and do not necessarily reflect those of Federal Practitioner, Frontline Medical Communications Inc., the U.S. Government, or any of its agencies. This article may discuss unlabeled or investigational use of certain drugs. Please review the complete prescribing information for specific drugs or drug combinations—including indications, contraindications, warnings, and adverse effects—before administering pharmacologic therapy to patients.
Click here to continue reading.
1. Freeman HP. Patient navigation as a targeted intervention: for patients at high risk
for delays in cancer care. Cancer. 2015;121(22):3930-3932.
2. Moy B, Chabner BA. Patient navigator programs, cancer disparities, and the patient protection and affordable care act. Oncologist. 2011;16(7):926-929.
3. Meade CD, Wells KJ, Arevalo M, et al. Lay navigator model for impacting cancer health disparities. J Cancer Educ. 2014;29(3):449-457.
4. Fillion L, Cook S, Veillette AM, et al. Professional navigation: a comparative study of two Canadian models. Can Oncol Nurs J. 2012;22(4):257-277.
5. Lairson DR, Huo J, Ricks KA, Savas L, Fernández ME. The cost of implementing a 2-1-1 call center-based cancer control navigator program. Eval Program Plann. 2013:39:51-56.
6. Percac-Lima S, Cronin PR, Ryan DP, Chabner BA, Daly E, Kimball AB. Patient navigation based on predictive modeling decreases no-show rates in cancer care. Cancer. 2015;121(10):1662-1670.
7. Percac-Lima S, Ashburner JM, McCarthy AM, Piawah S, Atlas SJ. Patient navigation
to improve follow-up of abnormal mammograms among disadvantaged women. J Womens Health (Larchmt). 2015;24(2):138-143.
8. Ladabaum U, Mannalithara A, Jandorf L, Itzkowitz SH. Cost-effectiveness of patient navigation to increase adherence with screening colonoscopy among minority
individuals. Cancer. 2015;121(7):1088-1097.
9. Baliski C, McGahan CE, Liberto CM, et al. Influence of nurse navigation on wait times for breast cancer care in a Canadian regional cancer center. Am J Surg. 2014;207(5):686-691.
10. Hoffman JH, LaVerda NL, Young HA, et al. Patient navigation significantly reduces delays in breast cancer diagnosis in the District of Columbia. Cancer Epidemiol Biomarkers Prev. 2012;1(10):1655-1663
11. Kazis LE, Miller DR, Clark J, et al. Health-related quality of life in patients served by the Department of Veterans Affairs: results from the Veterans Health Study. Arch Intern Med. 1998;158(6):626-632.
12. Rogers WH, Kazis LE, Miller DR, et al. Comparing the health status of VA and non-VA ambulatory patients: the veterans health and medical outcome studies. J Ambul Care Manage. 2004;27(3):249-262.
13. Agha Z, Lofgren RP, VanRuiswyk JV, Layde PM. Are patients at Veterans Affairs medical centers sicker? A comparative analysis of health status and medical resource use. Arch Intern Med. 2000;160(21):3252-3257.
14. Institute of Medicine (US) Committee to Review the Health Effects in Vietnam Veterans of Exposure to Herbicides. Veterans and Agent Orange: Health Effects of Herbicides Used in Vietnam. Washington, DC: National Academies Press; 1994.
15. Wachen JS, Patidar SM, Mulligan EA, Naik AD, Moye J. Cancer-related PTSD symptoms in a veteran sample: association with age, combat PTSD, and quality of life. Psychooncology. 2014;23(8):921-927.
16. Mulligan EA, Wachen JS, Naik AD, Gosian J, Moye J. Cancer as a criterion a traumatic stressor for veterans: prevalence and correlates. Psychol Trauma. 2014;6(suppl 1):S73-S81.
17. Dobie DJ, Kivlahan DR, Maynard C, Bush KR, Davis TM, Bradley KA. Posttraumatic stress disorder in female veterans: association with self-reported health problems and functional impairment. Arch Intern Med. 2004;164(4):394-400.
Note: Page numbers differ between the print issue and digital edition.
Study elucidates MYC’s role in T-ALL

Image by Juha Klefstrom
Research has revealed a relationship between the oncogene MYC and 2 cell-surface proteins that protect cancer cells from the immune system—CD47 and PD-L1.
Researchers discovered that MYC regulates the expression of CD47 and PD-L1 in T-cell acute lymphoblastic leukemia (T-ALL) and several solid tumor malignancies.
The team said this study is the first to link 2 critical steps in cancer development—uncontrolled cell growth (courtesy of mutated or misregulated MYC) and an ability to “outsmart” the immune molecules meant to stop it (via CD47 and PD-L1).
The study was published in Science.
“Our findings describe an intimate, causal connection between how oncogenes like MYC cause cancer and how those cancer cells manage to evade the immune system,” said study author Dean Felsher, MD, PhD, of the Stanford University School of Medicine in California.
Researchers in Dr Felsher’s lab have been studying MYC for more than a decade, focusing on oncogene addiction, in which tumor cells are completely dependent on the expression of the oncogene. Blocking the expression of MYC in these cases causes the complete regression of tumors in animals.
In 2010, Dr Felsher and his colleagues showed this regression could only occur in animals with an intact immune system, but it wasn’t clear why.
“Since then, I’ve had it in the back of my mind that there must be a relationship between MYC and the immune system,” Dr Felsher said.
So he and his colleagues decided to see if there was a link between MYC expression and the levels of CD47 and PD-L1 proteins on the surface of cancer cells. They investigated what would happen if they actively turned off MYC expression in tumor cells from mice or humans.
The researchers found that a reduction in MYC caused a similar reduction in the levels of CD47 and PD-L1 proteins on the surface of mouse and human T-ALL cells, mouse and human liver cancer cells, human skin cancer cells, and human non-small-cell lung cancer cells.
In contrast, levels of other immune regulatory molecules found on the surface of the cells were unaffected.
In gene expression data on tumor samples from hundreds of patients, the researchers found that levels of MYC expression correlated strongly with expression levels of CD47 and PD-L1 genes in liver, kidney, and colorectal tumors.
The team then looked directly at the regulatory regions in the CD47 and PD-L1 genes. They found high levels of the MYC protein bound directly to the promoter regions of CD47 and PD-L1 in mouse T-ALL cells and in a human osteosarcoma cell line.
The researchers were also able to verify that this binding increased the expression of CD47 in a human B cell line.
Finally, the team engineered mouse T-ALL cells to constantly express CD47 or PD-L1 regardless of MYC expression status.
These cells were better able than control cells to evade the detection of immune cells like macrophages and T cells. And, unlike in previous experiments, tumors arising from these cells did not regress when MYC expression was deactivated.
“What we’re learning is that if CD47 and PD-L1 are present on the surfaces of cancer cells, even if you shut down a cancer gene, the animal doesn’t mount an adequate immune response, and the tumors don’t regress,” Dr Felsher said.
Therefore, this work suggests a combination of therapies targeting the expression of both MYC and CD47 or PD-L1 could possibly have a synergistic effect by slowing or stopping tumor growth and waving a red flag at the immune system.
“There is a growing sense of tremendous excitement in the field of cancer immunotherapy,” Dr Felsher said. “In many cases, it’s working, but it’s not been clear why some cancers are more sensitive than others. Our work highlights a direct link between oncogene expression and immune regulation that could be exploited to help patients.” ![]()
Program can predict drug side effects

Photo by Darren Baker
Scientists say they have developed a computer program that can predict whether or not a given pharmaceutical agent will produce certain side effects.
The software takes an “ensemble approach” to assessing the chemical structure of a drug molecule and can determine whether key substructures are present in the molecule that are known to give rise to side effects in other drugs.
Md Jamiul Jahid and Jianhua Ruan, PhD, both of the University of Texas at San Antonio, developed the computer program and described it in the International Journal of Computational Biology and Drug Design.
The pair tested the software’s ability to predict 1385 side effects associated with 888 marketed drugs and found that the program outperformed earlier software.
The team also used their new software to test 2883 uncharacterized compounds in the DrugBank database. The program proved capable of predicting a wide variety of side effects, including some effects that were missed by other screening methods.
The scientists believe their software could be used to alert regulatory authorities and healthcare workers as to what side effects might occur when a new drug enters late-stage clinical trials and is ultimately brought to market.
But the program may have an additional benefit as well. By identifying substructures that are associated with particular side effects, the software could be used to help medicinal chemists understand the underlying mechanism by which a side effect arises.
The chemists could then eliminate the offending substructures from drug molecules in the future, thereby reducing the number of drugs that go through the research and development pipeline and then fail in clinical trials due to severe side effects. ![]()
Inpatient Hospital Pain Management
Pain management is an integral component of patient‐centered medical care and is a major concern for patients who are hospitalized.[1] Patient‐reported ratings of pain management are highly correlated with overall satisfaction with healthcare delivery.[2] Current research indicates that patient satisfaction with pain management may be improving[3]; however, there may be structural and county‐level disparities in these improvements in satisfaction. Although patient satisfaction with pain management increased from 2008 to 2012, a discrepancy in patient satisfaction with pain management has emerged between 3 different hospital systems (safety net, acute care, critical access hospitals)[3] Specifically, acute care hospitals provide less satisfactory pain management as compared to critical access hospitals.[3] Although patients' perception of pain management is an integral part of delivering patient‐centered care, prior research indicates that there may not be a simple inverse association between pain intensity score and patient satisfaction.[4] The management of pain in hospitals continues to be problematic, perhaps, for instance, due to discrepancies in understanding the relationship between patient satisfaction and pain management. Certainly for this reason and many others, satisfaction with pain management is now one of the dimensions assessed by the Hospital Consumer Assessment of Healthcare Providers and Systems (HCAHPS) survey, which is a global measure of patient satisfaction.
The HCAHPS survey is utilized by 85% of all US‐based hospitals and gathers patient satisfaction information pertaining to 10 dimensions, including pain management. Patient satisfaction scores (via HCAHPS) now constitute 30% of Hospital Value‐Based Purchasing (HVBP), which makes up 2% of at‐risk reimbursements by the Centers for Medicare and Medicaid Services (CMS) as put forth by the Affordable Care Act (ACA) of 2010.[5] The ACA mandates that payments to hospitals must partly depend on metrics that assess patient satisfaction, as broadly measured by the HCAHPS, which are completed by patients upon hospital discharge.[5, 6] Therefore, patient satisfaction, as measured by patients, now directly affects CMS payments for over 3000 hospitals across the United States. This constitutes a large amount of money for most hospitals that operate on high revenue but have low profit margins. As such, the 2% at‐risk reimbursement may place many hospitals at financial risk that could be ameliorated with effective inpatient pain management.
In addition to its critical role in reimbursement to hospitals, patient satisfaction with pain management is also integrally related to providing patient‐centered care. As such, patient satisfaction with pain management is considered a critical element of various models of the patient‐centered approach to providing medical care. Although a medical inpatient team can assess objective signs of pain, patient‐centric pain measurements are paramount in understanding the pain experience of patients and providing adequate pain management care. Moreover, patients, doctors, payers of medical services, and now CMS increasingly regard a patient‐centered approach to medical care as crucial for the delivery of high‐quality care.
HCAHPS survey sampling represents an excellent opportunity to help assess current gaps in patient‐centered clinical care. However, ecological factors, such as county‐level demographics and hospital size (eg, bed number), are known to influence health outcomes but have not been adequately studied in pain management patient satisfaction.[7] Hospital and county‐level factors may influence the degree to which patients experience patient‐centered pain management care. For instance, most patient satisfaction scores are worse in urban areas.[8, 9] These disparities in patient satisfaction scores could be associated with population density, greater ethnic diversity or nonEnglish‐speaking individuals, or number of hospital beds.
The US Census demographics and hospital‐bed number provide a concurrent measure that can be used across the country to estimate hospital ecology. This study evaluated the influence of county‐level demographic and structural factors (ie, hospital beds) on patient satisfaction with hospital pain management in all HCAHPS‐participating hospitals across the United States. We hypothesized that demographic diversity, higher population density, and higher numbers of hospital beds would predict lower levels of patient satisfaction with inpatient pain management.
METHODS
Data Collection: County‐Level Predictors
Publically available data were obtained from the American Hospital Directory[10] and United States Census Bureau[11] websites. Twenty US Census data categories were selected a priori by their clinical relevance to influence pain management perception out of the 50 publically reported US Census categories. Final variables utilized in regression modeling are listed under the Variable column in Table 1. Covariate correlation coefficients were all under 0.7, indicating a lack of significant colinearity.
| Variable | Median Value (SD) | Range | Regression Coefficient (SE) | t Value |
|---|---|---|---|---|
| ||||
| African American alone, % | 5.6% (13.8%) | 0%85.4% | 0.02 (00) | 3.609* |
| White alone, % | 86.2% (15.8%) | 5.3%99.0% | 0.06 (0.01) | 6.661* |
| Per capita income | $24,499 ($6,419) | $7,887$61,290 | 0.00 (0.00) | 7.561* |
| With bachelor's degree, % | 22.0% (10.1%) | 6.3%70.7% | 0.06 (0.01) | 7.348* |
| Population <18 years of age, % | 23.2% (3.1%) | 8.3%40.6% | 0.18 (0.05) | 3.498* |
| With a high school degree, % | 86.0% (6.4%) | 46.3%98.6% | 0.02 (0.01) | 1.424 |
| Population change over 1 year, % | 0.7% (2.2%) | 18.1%25.6% | 0.25 (0.04) | 5.645* |
| Same house over 1 year, % | 85.4% (4.2%) | 57.1%98.0% | 0.01 (0.02) | 0.493 |
| White alone (not Hispanic), % | 75.2% (21.8%) | 3.2%98.4% | 0.05(0.00) | 12.077* |
| Household size | 2.52 (0.3) | 1.924.77 | 2.266 (0.36) | 6.283* |
| Population county | 105,937 (1,524,223) | 1,1609,818,605 | 0.00 (0.00) | 13.117* |
| Average travel time to work, min | 23 (5.0) | 642.5 | 0.21 (0.02) | 11.071* |
| NonEnglish speaking, % | 8.6% (15.1%) | 0.2%95.9% | 0.08 (0.01) | 13.843* |
| Total female, % | 50.7% (1.6%) | 34.4%57.0% | 0.44 (0.06) | 7.489* |
| Population 65 years old, % | 14.7% (4.1%) | 5.8%49.3% | 0.06 (0.02) | 2.697 |
| Population in poverty, % | 14.7% (5.6%) | 5.8%49.3% | 0.02 (0.02) | 1.01 |
| Population density | 138.7 (4,534) | 0.369,467 | 0.73 (0.05) | 15.734* |
| Foreign born, % | 4.9% (9.3%) | 0%51.2% | 0.15 (0.01) | 16.775* |
| Median household income | $46,880 ($12,868) | $20,206$120,096 | 0.00 (0.00) | 6.052* |
| No. of hospital beds | 103 (193) | 22,259 | 0.01 (0.00) | 15.403* |
Data Collection: Patient Satisfaction With Pain Management
Pain management was measured using the HCAHPS survey pain management dimension by calculating the percentage of patient responders who said their pain was always controlled. HCAHPS data are publically available on the CMS Hospital Compare website.[6] It contains 32 questions that comprise 10 evaluative measures. It is provided to a random sample of patients across the United States throughout the year at 48 hours to 6 weeks after discharge from the hospital.
Analytic Plan
HCAHPS and US Census datasets were analyzed to assess their distribution curves. The population density variable was converted to a logarithmic scale to account for its skewed distribution and long tail in the area of low population density. Data were subsequently merged into an Excel (Microsoft Corp., Redmond, WA) spreadsheet using the VLOOKUP function such that relevant 2010 census county data were added to each hospital's HCAHPS data.
Bivariate analyses were conducted to determine which US Census categories were significant predictors for patient satisfaction with pain management. All significant predictors were then included in a multivariate model, which predicted for patient satisfaction with pain management. All analyses were 2‐tailed, and statistical significance was set at = 0.05.
RESULTS
Complete HCAHPS scores were obtained from 3907 hospitals out of a total of 4621 US hospitals (85%). The majority of hospitals (73.8%, n = 2884) collected over 300 surveys, fewer (n = 696) collected 100 to 299 surveys, and a small number of hospitals (n = 327) collected less than 100 surveys. Based on the most conservative estimate, results were available from at least 934,800 individual surveys. Missing HCAHPS hospital data averaged 13.4 (standard deviation [SD] = 12.2) hospitals per state. County‐level data were obtained from all 3144 county or county equivalents across the United States (100%).
Bivariate Analyses
Univariate regression indicated a significant association between pain management patient satisfaction and most county‐level demographic variables and number of hospital beds.
Multivariate Analyses
A multivariate linear regression model was run in which 20 county‐level demographic and hospital factors were examined as predictors of patient satisfaction with pain management. The model, which examined county‐level predictors of pain management, explained 12% of the variability in patients' ratings of pain management (R2 = 0.124, P < 0.0001). A total of 8 out of the 20 US Census variables were statistically significant predictors of pain management (Table 2). African American and white race were most strongly associated with higher ratings of patient satisfaction with pain management (ie, by partial coefficient and statistical significance). Number of hospital beds, percent foreign born, population density, and female gender were most strongly related to lower ratings of patient satisfaction with pain management.
| Variable | Median Value (SD) | Range | Regression Coefficient (SE) | t Value | |
|---|---|---|---|---|---|
| |||||
| African American alone, % | 5.6% (13.8%) | 0%85.4% | 0.07 (0.01) | 0.23 | 7.104* |
| White alone, % | 86.2% (15.8%) | 5.3%99.0% | 0.08 (0.01) | 0.23 | 6.953* |
| Per capita income | $24,499 ($6,419) | $7,887$61,290 | 0.00 (0.00) | 0.22 | 2.885 |
| With bachelor's degree, % | 22.0% (10.1%) | 6.3%70.7% | 0.03 (0.02) | 0.10 | 1.401 |
| Population <18 years old, % | 23.2% (3.1%) | 8.3%40.6% | 0.18 (0.05) | 0.08 | 3.498* |
| With a high school degree, % | 86.0% (6.4%) | 46.3%98.6% | 0.02 (0.01) | 0.02 | 1.424 |
| Population change over 1 year, % | 0.7% (2.2%) | 18.1%25.6% | 0.11 (0.06) | 0.01 | 1.986 |
| Same house over 1 year, % | 85.4% (4.2%) | 57.1%98.0% | 0.01 (0.02) | 0.01 | 0.493 |
| White alone (not Hispanic), % | 75.2% (21.8%) | 3.2%98.4% | 0.02(0.00) | 0.01 | 0.740 |
| Household size | 2.52 (0.3) | 1.924.77 | 0.92 (0.80) | 0.03 | 1.145 |
| Population county | 105,937 (1,524,223) | 1,1609,818,605 | 0.00 (0.00) | 0.03 | 1.495 |
| Average travel time to work, min | 23 (5.0) | 642.5 | 0.06 (0.02) | 0.06 | 3.054 |
| NonEnglish speaking, % | 8.6% (15.1%) | 0.2%95.9% | 0.00 (0.03) | 0.06 | 0.028 |
| Total female, % | 50.7% (1.6%) | 34.4%57.0% | 0.23 (0.07) | 0.06 | 3.158 |
| Population 65 years old, % | 14.7% (4.1%) | 5.8%49.3% | 0.10 (0.04) | 0.07 | 2.411 |
| Population in poverty, % | 14.7% (5.6%) | 5.8%49.3% | 0.02 (0.02) | 0.08 | 1.01 |
| Population density | 138.7 (4,534) | 0.369,467 | 0.24 (0.09) | 0.08 | 2.823 |
| Foreign born, % | 4.9% (9.3%) | 0%51.2% | 0.07 (0.02) | 0.12 | 4.906* |
| Median household income | $46,880 ($12,868) | $20,206‐$120,096 | 0.00 (0.00) | 0.16 | 2.599 |
| No. of hospital beds | 103 (193) | 22,259 | 0.00 (0.00) | 0.16 | 9.167* |
| Model statistics | F(1, 9) = 62.222, P < 0.001 | ||||
| Adjusted R2 | 0.124 | ||||
DISCUSSION
By utilizing county‐level demographic data and the HCAHPS survey measures from across the United States, this study provides a representative sample of US hospitals that can be used to define ecological trends in patient satisfaction with pain management. This statistical model demonstrates the nonrandom variability of pain management satisfaction across the United States, even after CMS patient‐mix adjustment. Although the quality of pain management may be increasing by some reports, our present results indicate that pain management satisfaction is not equitable with the rest of the country among select groups of patients (eg, foreign born, female gender, areas of long travel times to work) or in certain care settings (eg, larger hospitals, population dense areas). These data suggest that areas of pain management may lack in quality compared to pain management across the entire US as a whole. This is consistent with the increasingly recognized contribution of multiple nonmedical determinates to health outcomes.[12] These results demonstrate the overall magnitude of healthcare disparity in the United States, and are particularly concerning because African Americans and Hispanics tend to rate overall satisfaction higher than Caucasians in other studies.[13, 14] The same minority reporting bias may be reflected in HCAHPS results. These patients may be reporting higher pain management satisfaction that is not consistent with the level of care they received, as studies have consistently indicated worse pain management delivery for racial and ethnic minorities.[15]
The present findings reveal structural (eg, hospital beds) and demographic (eg, population density, foreign born) gaps in satisfaction with pain management. An effort to improve pain management for all people in the heterogeneous makeup of the United States is an enormous challenge. However, change may be forthcoming, as Hospital Value‐Based Purchasing draws attention pain practice inequities in real time. Although several of the significant explanatory variables cannot be modified (eg, size of hospital, urban setting, patients served), pain management delivery should receive extra attention in hospitals with those characteristics. Pain management delivery in large, urban hospitals that serve foreign‐born patients may be improved with focused multilevel interventions. Future research should examine these inequities further and develop multilevel interventions that target hospitals in at‐risk areas with the aim of lessening disparities in hospital‐based pain management.
Disclosure
Nothing to report.
- , , , et al. Interventions for providers to promote a patient‐centred approach in clinical consultations. Cochrane Database Syst Rev. 2012;12:CD003267.
- , , , . Patient perception of pain care in hospitals in the United States. J Pain Res. 2009;2:157–164.
- , , , , . Patient perception of pain care in the United States: a 5‐year comparative analysis of hospital consumer assessment of health care providers and systems. Pain Physician. 2014;17(5):369–377.
- , , , , . Assessing the relationship between the level of pain control and patient satisfaction. J Pain Res. 2013;6:683–689.
- H.R.3590—Patient Protection and Affordable Care Act 2010. Available at: https://www.congress.gov/bill/111th‐congress/house‐bill/3590. Accessed December 1, 2013.
- Centers for Medicare 55(1):125–139.
- , . Characteristics of hospitals receiving penalties under the Hospital Readmissions Reduction Program. JAMA. 2013;309(4):342–343.
- , , , . Patients' perception of hospital care in the United States. N Engl J Med. 2008;359(18):1921–1931.
- American Hospital Directory. Hospital statistics by state. Available at: http://www.ahd.com/state_statistics.html. Accessed December 1, 2013.
- United States Census Bureau. Download center. Available at: http://factfinder.census.gov/faces/nav/jsf/pages/download_center.xhtml. Accessed December 1, 2013.
- Health policy brief: the relative contribution of multiple determinants to health outcomes. Health Affairs website. Available at: http://www.healthaffairs.org/healthpolicybriefs/brief.php?brief_id=123. Accessed December 1, 2013.
- , , , , . Racial and ethnic differences in patient assessments of interactions with providers: disparities or measurement biases? Am J Med Qual. 2006;21(2):109–114.
- , , , , . Survey response style and differential use of CAHPS rating scales by Hispanics. Med Care. 2008;46(9):963–968.
- Institute of Medicine. Committee on Advancing Pain Research, Care, and Education. Relieving Pain in America: A Blueprint for Transforming Prevention, Care, Education, and Research. Washington, DC: National Academies Press; 2011.
Pain management is an integral component of patient‐centered medical care and is a major concern for patients who are hospitalized.[1] Patient‐reported ratings of pain management are highly correlated with overall satisfaction with healthcare delivery.[2] Current research indicates that patient satisfaction with pain management may be improving[3]; however, there may be structural and county‐level disparities in these improvements in satisfaction. Although patient satisfaction with pain management increased from 2008 to 2012, a discrepancy in patient satisfaction with pain management has emerged between 3 different hospital systems (safety net, acute care, critical access hospitals)[3] Specifically, acute care hospitals provide less satisfactory pain management as compared to critical access hospitals.[3] Although patients' perception of pain management is an integral part of delivering patient‐centered care, prior research indicates that there may not be a simple inverse association between pain intensity score and patient satisfaction.[4] The management of pain in hospitals continues to be problematic, perhaps, for instance, due to discrepancies in understanding the relationship between patient satisfaction and pain management. Certainly for this reason and many others, satisfaction with pain management is now one of the dimensions assessed by the Hospital Consumer Assessment of Healthcare Providers and Systems (HCAHPS) survey, which is a global measure of patient satisfaction.
The HCAHPS survey is utilized by 85% of all US‐based hospitals and gathers patient satisfaction information pertaining to 10 dimensions, including pain management. Patient satisfaction scores (via HCAHPS) now constitute 30% of Hospital Value‐Based Purchasing (HVBP), which makes up 2% of at‐risk reimbursements by the Centers for Medicare and Medicaid Services (CMS) as put forth by the Affordable Care Act (ACA) of 2010.[5] The ACA mandates that payments to hospitals must partly depend on metrics that assess patient satisfaction, as broadly measured by the HCAHPS, which are completed by patients upon hospital discharge.[5, 6] Therefore, patient satisfaction, as measured by patients, now directly affects CMS payments for over 3000 hospitals across the United States. This constitutes a large amount of money for most hospitals that operate on high revenue but have low profit margins. As such, the 2% at‐risk reimbursement may place many hospitals at financial risk that could be ameliorated with effective inpatient pain management.
In addition to its critical role in reimbursement to hospitals, patient satisfaction with pain management is also integrally related to providing patient‐centered care. As such, patient satisfaction with pain management is considered a critical element of various models of the patient‐centered approach to providing medical care. Although a medical inpatient team can assess objective signs of pain, patient‐centric pain measurements are paramount in understanding the pain experience of patients and providing adequate pain management care. Moreover, patients, doctors, payers of medical services, and now CMS increasingly regard a patient‐centered approach to medical care as crucial for the delivery of high‐quality care.
HCAHPS survey sampling represents an excellent opportunity to help assess current gaps in patient‐centered clinical care. However, ecological factors, such as county‐level demographics and hospital size (eg, bed number), are known to influence health outcomes but have not been adequately studied in pain management patient satisfaction.[7] Hospital and county‐level factors may influence the degree to which patients experience patient‐centered pain management care. For instance, most patient satisfaction scores are worse in urban areas.[8, 9] These disparities in patient satisfaction scores could be associated with population density, greater ethnic diversity or nonEnglish‐speaking individuals, or number of hospital beds.
The US Census demographics and hospital‐bed number provide a concurrent measure that can be used across the country to estimate hospital ecology. This study evaluated the influence of county‐level demographic and structural factors (ie, hospital beds) on patient satisfaction with hospital pain management in all HCAHPS‐participating hospitals across the United States. We hypothesized that demographic diversity, higher population density, and higher numbers of hospital beds would predict lower levels of patient satisfaction with inpatient pain management.
METHODS
Data Collection: County‐Level Predictors
Publically available data were obtained from the American Hospital Directory[10] and United States Census Bureau[11] websites. Twenty US Census data categories were selected a priori by their clinical relevance to influence pain management perception out of the 50 publically reported US Census categories. Final variables utilized in regression modeling are listed under the Variable column in Table 1. Covariate correlation coefficients were all under 0.7, indicating a lack of significant colinearity.
| Variable | Median Value (SD) | Range | Regression Coefficient (SE) | t Value |
|---|---|---|---|---|
| ||||
| African American alone, % | 5.6% (13.8%) | 0%85.4% | 0.02 (00) | 3.609* |
| White alone, % | 86.2% (15.8%) | 5.3%99.0% | 0.06 (0.01) | 6.661* |
| Per capita income | $24,499 ($6,419) | $7,887$61,290 | 0.00 (0.00) | 7.561* |
| With bachelor's degree, % | 22.0% (10.1%) | 6.3%70.7% | 0.06 (0.01) | 7.348* |
| Population <18 years of age, % | 23.2% (3.1%) | 8.3%40.6% | 0.18 (0.05) | 3.498* |
| With a high school degree, % | 86.0% (6.4%) | 46.3%98.6% | 0.02 (0.01) | 1.424 |
| Population change over 1 year, % | 0.7% (2.2%) | 18.1%25.6% | 0.25 (0.04) | 5.645* |
| Same house over 1 year, % | 85.4% (4.2%) | 57.1%98.0% | 0.01 (0.02) | 0.493 |
| White alone (not Hispanic), % | 75.2% (21.8%) | 3.2%98.4% | 0.05(0.00) | 12.077* |
| Household size | 2.52 (0.3) | 1.924.77 | 2.266 (0.36) | 6.283* |
| Population county | 105,937 (1,524,223) | 1,1609,818,605 | 0.00 (0.00) | 13.117* |
| Average travel time to work, min | 23 (5.0) | 642.5 | 0.21 (0.02) | 11.071* |
| NonEnglish speaking, % | 8.6% (15.1%) | 0.2%95.9% | 0.08 (0.01) | 13.843* |
| Total female, % | 50.7% (1.6%) | 34.4%57.0% | 0.44 (0.06) | 7.489* |
| Population 65 years old, % | 14.7% (4.1%) | 5.8%49.3% | 0.06 (0.02) | 2.697 |
| Population in poverty, % | 14.7% (5.6%) | 5.8%49.3% | 0.02 (0.02) | 1.01 |
| Population density | 138.7 (4,534) | 0.369,467 | 0.73 (0.05) | 15.734* |
| Foreign born, % | 4.9% (9.3%) | 0%51.2% | 0.15 (0.01) | 16.775* |
| Median household income | $46,880 ($12,868) | $20,206$120,096 | 0.00 (0.00) | 6.052* |
| No. of hospital beds | 103 (193) | 22,259 | 0.01 (0.00) | 15.403* |
Data Collection: Patient Satisfaction With Pain Management
Pain management was measured using the HCAHPS survey pain management dimension by calculating the percentage of patient responders who said their pain was always controlled. HCAHPS data are publically available on the CMS Hospital Compare website.[6] It contains 32 questions that comprise 10 evaluative measures. It is provided to a random sample of patients across the United States throughout the year at 48 hours to 6 weeks after discharge from the hospital.
Analytic Plan
HCAHPS and US Census datasets were analyzed to assess their distribution curves. The population density variable was converted to a logarithmic scale to account for its skewed distribution and long tail in the area of low population density. Data were subsequently merged into an Excel (Microsoft Corp., Redmond, WA) spreadsheet using the VLOOKUP function such that relevant 2010 census county data were added to each hospital's HCAHPS data.
Bivariate analyses were conducted to determine which US Census categories were significant predictors for patient satisfaction with pain management. All significant predictors were then included in a multivariate model, which predicted for patient satisfaction with pain management. All analyses were 2‐tailed, and statistical significance was set at = 0.05.
RESULTS
Complete HCAHPS scores were obtained from 3907 hospitals out of a total of 4621 US hospitals (85%). The majority of hospitals (73.8%, n = 2884) collected over 300 surveys, fewer (n = 696) collected 100 to 299 surveys, and a small number of hospitals (n = 327) collected less than 100 surveys. Based on the most conservative estimate, results were available from at least 934,800 individual surveys. Missing HCAHPS hospital data averaged 13.4 (standard deviation [SD] = 12.2) hospitals per state. County‐level data were obtained from all 3144 county or county equivalents across the United States (100%).
Bivariate Analyses
Univariate regression indicated a significant association between pain management patient satisfaction and most county‐level demographic variables and number of hospital beds.
Multivariate Analyses
A multivariate linear regression model was run in which 20 county‐level demographic and hospital factors were examined as predictors of patient satisfaction with pain management. The model, which examined county‐level predictors of pain management, explained 12% of the variability in patients' ratings of pain management (R2 = 0.124, P < 0.0001). A total of 8 out of the 20 US Census variables were statistically significant predictors of pain management (Table 2). African American and white race were most strongly associated with higher ratings of patient satisfaction with pain management (ie, by partial coefficient and statistical significance). Number of hospital beds, percent foreign born, population density, and female gender were most strongly related to lower ratings of patient satisfaction with pain management.
| Variable | Median Value (SD) | Range | Regression Coefficient (SE) | t Value | |
|---|---|---|---|---|---|
| |||||
| African American alone, % | 5.6% (13.8%) | 0%85.4% | 0.07 (0.01) | 0.23 | 7.104* |
| White alone, % | 86.2% (15.8%) | 5.3%99.0% | 0.08 (0.01) | 0.23 | 6.953* |
| Per capita income | $24,499 ($6,419) | $7,887$61,290 | 0.00 (0.00) | 0.22 | 2.885 |
| With bachelor's degree, % | 22.0% (10.1%) | 6.3%70.7% | 0.03 (0.02) | 0.10 | 1.401 |
| Population <18 years old, % | 23.2% (3.1%) | 8.3%40.6% | 0.18 (0.05) | 0.08 | 3.498* |
| With a high school degree, % | 86.0% (6.4%) | 46.3%98.6% | 0.02 (0.01) | 0.02 | 1.424 |
| Population change over 1 year, % | 0.7% (2.2%) | 18.1%25.6% | 0.11 (0.06) | 0.01 | 1.986 |
| Same house over 1 year, % | 85.4% (4.2%) | 57.1%98.0% | 0.01 (0.02) | 0.01 | 0.493 |
| White alone (not Hispanic), % | 75.2% (21.8%) | 3.2%98.4% | 0.02(0.00) | 0.01 | 0.740 |
| Household size | 2.52 (0.3) | 1.924.77 | 0.92 (0.80) | 0.03 | 1.145 |
| Population county | 105,937 (1,524,223) | 1,1609,818,605 | 0.00 (0.00) | 0.03 | 1.495 |
| Average travel time to work, min | 23 (5.0) | 642.5 | 0.06 (0.02) | 0.06 | 3.054 |
| NonEnglish speaking, % | 8.6% (15.1%) | 0.2%95.9% | 0.00 (0.03) | 0.06 | 0.028 |
| Total female, % | 50.7% (1.6%) | 34.4%57.0% | 0.23 (0.07) | 0.06 | 3.158 |
| Population 65 years old, % | 14.7% (4.1%) | 5.8%49.3% | 0.10 (0.04) | 0.07 | 2.411 |
| Population in poverty, % | 14.7% (5.6%) | 5.8%49.3% | 0.02 (0.02) | 0.08 | 1.01 |
| Population density | 138.7 (4,534) | 0.369,467 | 0.24 (0.09) | 0.08 | 2.823 |
| Foreign born, % | 4.9% (9.3%) | 0%51.2% | 0.07 (0.02) | 0.12 | 4.906* |
| Median household income | $46,880 ($12,868) | $20,206‐$120,096 | 0.00 (0.00) | 0.16 | 2.599 |
| No. of hospital beds | 103 (193) | 22,259 | 0.00 (0.00) | 0.16 | 9.167* |
| Model statistics | F(1, 9) = 62.222, P < 0.001 | ||||
| Adjusted R2 | 0.124 | ||||
DISCUSSION
By utilizing county‐level demographic data and the HCAHPS survey measures from across the United States, this study provides a representative sample of US hospitals that can be used to define ecological trends in patient satisfaction with pain management. This statistical model demonstrates the nonrandom variability of pain management satisfaction across the United States, even after CMS patient‐mix adjustment. Although the quality of pain management may be increasing by some reports, our present results indicate that pain management satisfaction is not equitable with the rest of the country among select groups of patients (eg, foreign born, female gender, areas of long travel times to work) or in certain care settings (eg, larger hospitals, population dense areas). These data suggest that areas of pain management may lack in quality compared to pain management across the entire US as a whole. This is consistent with the increasingly recognized contribution of multiple nonmedical determinates to health outcomes.[12] These results demonstrate the overall magnitude of healthcare disparity in the United States, and are particularly concerning because African Americans and Hispanics tend to rate overall satisfaction higher than Caucasians in other studies.[13, 14] The same minority reporting bias may be reflected in HCAHPS results. These patients may be reporting higher pain management satisfaction that is not consistent with the level of care they received, as studies have consistently indicated worse pain management delivery for racial and ethnic minorities.[15]
The present findings reveal structural (eg, hospital beds) and demographic (eg, population density, foreign born) gaps in satisfaction with pain management. An effort to improve pain management for all people in the heterogeneous makeup of the United States is an enormous challenge. However, change may be forthcoming, as Hospital Value‐Based Purchasing draws attention pain practice inequities in real time. Although several of the significant explanatory variables cannot be modified (eg, size of hospital, urban setting, patients served), pain management delivery should receive extra attention in hospitals with those characteristics. Pain management delivery in large, urban hospitals that serve foreign‐born patients may be improved with focused multilevel interventions. Future research should examine these inequities further and develop multilevel interventions that target hospitals in at‐risk areas with the aim of lessening disparities in hospital‐based pain management.
Disclosure
Nothing to report.
- , , , et al. Interventions for providers to promote a patient‐centred approach in clinical consultations. Cochrane Database Syst Rev. 2012;12:CD003267.
- , , , . Patient perception of pain care in hospitals in the United States. J Pain Res. 2009;2:157–164.
- , , , , . Patient perception of pain care in the United States: a 5‐year comparative analysis of hospital consumer assessment of health care providers and systems. Pain Physician. 2014;17(5):369–377.
- , , , , . Assessing the relationship between the level of pain control and patient satisfaction. J Pain Res. 2013;6:683–689.
- H.R.3590—Patient Protection and Affordable Care Act 2010. Available at: https://www.congress.gov/bill/111th‐congress/house‐bill/3590. Accessed December 1, 2013.
- Centers for Medicare 55(1):125–139.
- , . Characteristics of hospitals receiving penalties under the Hospital Readmissions Reduction Program. JAMA. 2013;309(4):342–343.
- , , , . Patients' perception of hospital care in the United States. N Engl J Med. 2008;359(18):1921–1931.
- American Hospital Directory. Hospital statistics by state. Available at: http://www.ahd.com/state_statistics.html. Accessed December 1, 2013.
- United States Census Bureau. Download center. Available at: http://factfinder.census.gov/faces/nav/jsf/pages/download_center.xhtml. Accessed December 1, 2013.
- Health policy brief: the relative contribution of multiple determinants to health outcomes. Health Affairs website. Available at: http://www.healthaffairs.org/healthpolicybriefs/brief.php?brief_id=123. Accessed December 1, 2013.
- , , , , . Racial and ethnic differences in patient assessments of interactions with providers: disparities or measurement biases? Am J Med Qual. 2006;21(2):109–114.
- , , , , . Survey response style and differential use of CAHPS rating scales by Hispanics. Med Care. 2008;46(9):963–968.
- Institute of Medicine. Committee on Advancing Pain Research, Care, and Education. Relieving Pain in America: A Blueprint for Transforming Prevention, Care, Education, and Research. Washington, DC: National Academies Press; 2011.
Delirium Screening in Older Patients
Delirium is a rapidly developing, fluctuating disturbance in consciousness, caused by a medical condition. The diagnosis of delirium is often missed, potentiating negative outcomes.[1, 2] Regular delirium screening by nurses results in increased recognition and treatment.[3] Although multiple screening tools exist, many are cumbersome to execute. Efforts have been made to shorten them, but although the screening tools may predict adverse outcomes, there are concerns about their specificity.[1, 2, 4, 5, 6] The Delirium Observation Screening Scale[7] (DOS) is a brief screening tool based on observation. It has been validated in several patient populations, but no published studies have taken place in the United States or have focused on an older, general medicine, inpatient population. Given the low numbers of patients in earlier validation studies, the effectiveness of the DOS for screening hospitalized, older patients is not yet fully established.
This study aimed to determine the ability of the DOS to screen hospitalized, older patients for delirium compared to a validated delirium diagnostic tool, the Delirium Rating Scale‐Revised‐98 (DRS‐R‐98).[8] In addition, DOS acceptability, ease of use, and benefit were explored by surveying nurses.
METHODS
Participants
After institutional review board approval, participants were selected by convenience sample from general medicine inpatients at a large, tertiary care, academic hospital. Eligible patients were age 65 years or older, admitted to a medicine inpatient unit, and spoke English. If participants were unable to consent, consent was obtained from the participant's legally authorized representative.
Delirium Observation Screening Scale
The DOS is a 13‐point screen for delirium, based on the Diagnostic and Statistical Manual of Mental Disorders IV delirium criteria, designed to be completed by a nurse (see Supporting Information, Appendix 1, in the online version of this article). Responses are dichotomous. Scores 3 were considered positive delirium screens.[7]
Nurses on medicine units attended educational in‐services on delirium recognition and use of the DOS. The DOS was embedded in the electronic medical record (EMR) and nurses are electronically prompted to chart DOS results every 12 hours for patients, age 65 years or older. Nursing staff utilized the DOS for 1 year prior to study start.
DRS‐R‐98
The DRS‐R‐98 was used as the study reference standard.[8] Scores 15 are indicative of delirium.[9] All assessments were performed by a medical student (K.G.) trained to administer the DRS‐R‐98.
Data Collection
After consent, hospitalized participants were evaluated daily (MondayFriday) using the DRS‐R‐98. Enrollment took place over a 10‐week period. Nurses and researchers were blinded to other delirium assessment results until after participant discharge. Following discharge, additional data were collected from the EMR: age, gender, cognitive comorbidities, and nurse‐charted DOS score. Cognitive comorbidities were classified as no impairment, dementia, or cognitive impairment based on the problem list and admission note. A psychiatrist (M.W.) confirmed questions of cognitive impairment.
The DOS score closest in time, within 24 hours of DRS‐R‐98 assessment, was used for comparison. If a DOS score was not charted within 24 hours of the DRS‐R‐98 evaluation, that assessment was excluded. Partial DRS‐R‐98 assessments were included only if there was enough information to classify a subject as delirious or not.
Nursing Survey
A 13‐question nursing survey was developed and consisted of demographic, Likert‐style, and multiple‐choice questions, with opportunities for open‐ended responses (see Supporting Information, Appendix 2, in the online version of this article). Survey design followed similar surveys investigating staff experiences and clinical functionality of other brief delirium screening tools, such as the Confusion Assessment Method for the Intensive Care Unit.[10, 11] The survey was distributed by e‐mail to 435 nurses on 16 units. Coffee gift cards were raffled as participation incentive.
Statistical Analysis
Statistical analysis was completed using SPSS (IBM, Armonk, NY) and SAS (SAS Institute, Inc., Cary, NC) software. DOS results were compared to the DRS‐R‐98, and validity statistics were calculated for delirium. Confidence intervals were calculated using the Clopper‐Pearson method for binomial data. The Spearman rank correlation coefficient between DOS and DRS‐98 score was calculated. PROC LOGISTIC (SAS Institute, Inc.) modeled the relationship between positive DOS screens and delirium and created a receiver operating characteristic (ROC) curve using continuous DOS score to predict delirium. Because these models did not control for multiple observations per individual, PROC GENMOD (SAS Institute, Inc.) was used to confirm the relationship between a positive DOS screen and delirium using a marginal logistic regression model accounting for repeated measures. In addition, we selected 10 random samples of 1 observation per person, and validity statistics were calculated for each sample.
The nursing survey results were analyzed using descriptive statistics. Open‐ended comments were reviewed in aggregate.
RESULTS
Participant Characteristics
Fifty‐four participants enrolled in the study. Fifty‐three were able to complete 1 DRS‐R‐98 and comprise the study sample (Table 1). Participants completed 1 to 5 daily DRS‐R‐98 assessments (mean, 1.94; standard deviation [SD], 0.90; mean length of admission, 6.06 days). Of the 105 DRS‐R‐98 assessments, 101 were classifiable for delirium. Of the 101 DRS‐R‐98 assessments classifiable for delirium, 100 had a corresponding DOS score within 24 hours. Participant characteristics are listed in Table 1. Eight of the 53 participants (15%) had at least 1 positive DRS‐R‐98. Overall, 10 of the 101 delirium assessments diagnosed delirium (DRS‐R‐98 score 15).
| Characteristic | No Delirium, n = 45 | Delirium, n = 8a |
|---|---|---|
| ||
| Age, y | ||
| 6574, n = 26 | 22 | 4 |
| 7584, n = 15 | 13 | 2 |
| 85+, n = 12 | 10 | 2 |
| Age, y, mean (SD) [range] | 77 (10) [6592] | 76 (8.6) [6592] |
| Gender | ||
| Female, n = 33 | 28 | 5 |
| Male, n = 20 | 17 | 3 |
| Cognitive status per chart | ||
| No impairment, n = 45 | 43 | 2 |
| Cognitive impairment without dementia, n = 5 | 1 | 4 |
| Dementia, n = 3 | 1 | 2 |
DOS Validity
The mean and standard deviation of delirium screening scores are as follows: DRS‐R‐98 (mean, 6.13; SD, 4.74; range, 020) and DOS (mean, 1.22; SD, 2.37; range, 09). The Spearman correlation coefficient between DOS and DRS‐R‐98 scores was 0.58. DOS had a sensitivity of 90% (95% confidence interval [CI]: 56%‐100%) and specificity of 91% (95% CI: 83%‐96%) compared to the DRS‐98‐R standard. There was only 1 false negative DOS screen out of 83 negative assessments (negative predictive value = 99%, 95% CI: 93%‐100%). Out of the 17 positive assessments, 9 were true positives (positive predictive value = 53%, 95% CI: 28%‐77%), and 7 scored in the subsyndromal range for delirium (DRS‐R‐98 score 814).
In analyses using 10 samples, with 1 randomly selected observation per person, the mean sensitivity was 84.6%, ranging from 80% (95% CI: 28%‐99%) to 87.5% (95% CI: 47%‐100%). The mean specificity in these samples was 92%, ranging from 87% (95% CI: 74%‐95%) to 96% (95% CI: 85%‐99%).
Logistic Regression Models
All models confirmed that positive DOS screens significantly predicted delirium. The traditional logistic regression model produced an odds ratio (OR) estimate of 92 (95% CI: 10‐824, P < 0.0001) for a positive DOS screen predicting delirium. The marginal logistic regression model accounting for repeated measures produced a consistent estimate (OR: 93, 95% CI: 11‐800, P < 0.0001). Continuous DOS scores predicted delirium (OR: 2.1, 95% CI: 1.5‐2.9, P < 0.0001), and the ROC curve supported the cutoff of DOS 3, corresponding to a predicted probability of 0.12 (Figure 1).

Nursing Survey
The nursing survey had a response rate of 23% (N = 98). The most robust results related to DOS administration were 87% (N = 83) of nurses were confident in DOS administration, 92% (N = 86) could complete the DOS in under 3 minutes, and 79% (N = 74) agreed that performing the DOS is easy. There was less agreement on the value of the DOS; 37% agreed that the DOS is worth the time to perform, 25% agreed that the DOS enhances patient care, and 36% agreed that the DOS provides valuable information for patient care. Over half the nurses (55%) reported that they perform the DOS 75% to 100% of the prompted times, and 62% stated if the DOS was no longer required, they would not use it. Open‐ended questions generated a wide range of responses, from supportive to critical of delirium screening and the DOS (see Supporting Information, Appendix 3, in the online version of this article).
DISCUSSION
This study demonstrated the effectiveness, efficiency, and ease of use of the DOS as a delirium screening tool. The DOS exhibited high sensitivity (90%) and specificity (91%). Similar to previous findings, the positive predictive value was only 53%, but the negative predictive value was 99%.[12] These results support that the DOS is consistently able to rule out delirium, with only 1 false negative in this study.
Nursing responses regarding user‐friendliness are consistent with other studies; however, there was a knowledge gap related to how positive delirium screens can inform and change care for patients.[7] Education is a known barrier to integrating delirium screening tools secondary to the need for regular and extensive education, frequent reminders to screen, and regular evaluations of assessment quality.[11, 13, 14, 15] Developing guidelines for responding to positive DOS screens and documenting its impact on care may incentivize use.
Study strengths include strong evaluator consistency, blinding of evaluator and nurses, and responses from a broad range of nurses (14 of 16 units represented). Additionally, this study demonstrated the efficacy and ease of use of an EMR‐prompted delirium screen. However, this study had several limitations, including a small sample size and a low incidence of delirium. The lower incidence is likely secondary to selection bias that resulted from difficulty consenting delirious subjects. The discordant time between DOS and DRS‐R‐98 assessments may have also influenced results; however, inclusion of data from the previous 8 to 24 hours in both tools makes the temporal separation of assessments less impactful.
The ability of the DOS to accurately identify patients at high risk of delirium is useful for healthcare staff. Future work will include nurse and physician education to emphasize delirium understanding, the importance of regular screening, and the use of nonpharmacological interventions. Additional studies will include examination of the interventions and outcomes of patients who screen positive for delirium to determine the long‐term impact of delirium screening.
Acknowledgements
The study authors would like to thank the University of Iowa Hospitals and Clinics, the Department of Family Medicine, and the University of Iowa Hospitals and Clinics nursing managers and nursing staff.
Disclosures
This study was funded by the Summer Research Fellowship program sponsored by the University of Iowa Carver College of Medicine. Drs. Weckmann and Carnahan were supported by the Health Resources and Services Administration, Iowa Geriatric Education Center (UB4 HP19054) as well as the US Department of Health and Human Services, Agency for Healthcare Research and Quality (AHRQ 1 R18 HS022666‐01).
- , , . An intervention to reduce delirium in care homes. Nurs Older People. 2010;22(4):16–21.
- , , , et al. Assessment of delirium in the intensive care unit: nursing practices and perceptions. Am J Crit Care. 2008;17(6):555–565.
- , , , et al. Delirium and sedation recognition using validated instruments: reliability of bedside intensive care unit nursing assessments from 2007 to 2010. J Am Geriatr Soc. 2011;59(suppl 2):S249–S255.
- , , , et al. Preliminary development of an ultrabrief two‐item bedside test for delirium. J Hosp Med. 2015;10(10):645–650.
- , , , et al. The association between an ultrabrief cognitive screening in older adults and hospital outcomes. J Hosp Med. 2015;10(10):651–657.
- , , , et al. Comparison of mental‐status scales for predicting mortality on the general wards. J Hosp Med. 2015;10(10):658–663.
- , , . The Delirium Observation Screening Scale: a screening instrument for delirium. Res Theory Nurs Pract. 2003;17(1):31–50.
- . Validation of the Delirium Rating Scale‐Revised‐98: comparison with the Delirium Rating Scale and the Cognitive Test for Delirium. J Neuropsychiatry Clin Neurosci. 2001;13(2):229–242.
- , , , et al. Factor analysis of the Colombian translation of the Delirium Rating Scale (DRS), Revised‐98. Psychosomatics. 2009;50(3):255–262.
- , , , et al. Implementation, reliability testing, and compliance monitoring of the Confusion Assessment Method for the Intensive Care Unit in trauma patients. Intensive Care Med. 2008;34(7):1263–1268.
- , , , et al. Limitations and practicalities of CAM‐ICU implementation, a delirium scoring system, in a Dutch intensive care unit. Intensive Crit Care Nurs. 2009;25(5):242–249.
- , . The Neecham Confusion Scale and the Delirium Observation Screening Scale: capacity to discriminate and ease of use in clinical practice. BMC Nurs. 2007;6:3.
- , , . Early recognition of delirium: review of the literature. J Clin Nurs. 2001;10(6):721–729.
- , , , et al. Impact of a delirium screening tool and multifaceted education on nurses' knowledge of delirium and ability to evaluate it correctly. Am J Crit Care. 2012;21(1):e1–e11.
- , , . Optimising the recognition of delirium in the intensive care unit. Best Pract Res Clin Anaesthesiol. 2012;26(3):385–393.
Delirium is a rapidly developing, fluctuating disturbance in consciousness, caused by a medical condition. The diagnosis of delirium is often missed, potentiating negative outcomes.[1, 2] Regular delirium screening by nurses results in increased recognition and treatment.[3] Although multiple screening tools exist, many are cumbersome to execute. Efforts have been made to shorten them, but although the screening tools may predict adverse outcomes, there are concerns about their specificity.[1, 2, 4, 5, 6] The Delirium Observation Screening Scale[7] (DOS) is a brief screening tool based on observation. It has been validated in several patient populations, but no published studies have taken place in the United States or have focused on an older, general medicine, inpatient population. Given the low numbers of patients in earlier validation studies, the effectiveness of the DOS for screening hospitalized, older patients is not yet fully established.
This study aimed to determine the ability of the DOS to screen hospitalized, older patients for delirium compared to a validated delirium diagnostic tool, the Delirium Rating Scale‐Revised‐98 (DRS‐R‐98).[8] In addition, DOS acceptability, ease of use, and benefit were explored by surveying nurses.
METHODS
Participants
After institutional review board approval, participants were selected by convenience sample from general medicine inpatients at a large, tertiary care, academic hospital. Eligible patients were age 65 years or older, admitted to a medicine inpatient unit, and spoke English. If participants were unable to consent, consent was obtained from the participant's legally authorized representative.
Delirium Observation Screening Scale
The DOS is a 13‐point screen for delirium, based on the Diagnostic and Statistical Manual of Mental Disorders IV delirium criteria, designed to be completed by a nurse (see Supporting Information, Appendix 1, in the online version of this article). Responses are dichotomous. Scores 3 were considered positive delirium screens.[7]
Nurses on medicine units attended educational in‐services on delirium recognition and use of the DOS. The DOS was embedded in the electronic medical record (EMR) and nurses are electronically prompted to chart DOS results every 12 hours for patients, age 65 years or older. Nursing staff utilized the DOS for 1 year prior to study start.
DRS‐R‐98
The DRS‐R‐98 was used as the study reference standard.[8] Scores 15 are indicative of delirium.[9] All assessments were performed by a medical student (K.G.) trained to administer the DRS‐R‐98.
Data Collection
After consent, hospitalized participants were evaluated daily (MondayFriday) using the DRS‐R‐98. Enrollment took place over a 10‐week period. Nurses and researchers were blinded to other delirium assessment results until after participant discharge. Following discharge, additional data were collected from the EMR: age, gender, cognitive comorbidities, and nurse‐charted DOS score. Cognitive comorbidities were classified as no impairment, dementia, or cognitive impairment based on the problem list and admission note. A psychiatrist (M.W.) confirmed questions of cognitive impairment.
The DOS score closest in time, within 24 hours of DRS‐R‐98 assessment, was used for comparison. If a DOS score was not charted within 24 hours of the DRS‐R‐98 evaluation, that assessment was excluded. Partial DRS‐R‐98 assessments were included only if there was enough information to classify a subject as delirious or not.
Nursing Survey
A 13‐question nursing survey was developed and consisted of demographic, Likert‐style, and multiple‐choice questions, with opportunities for open‐ended responses (see Supporting Information, Appendix 2, in the online version of this article). Survey design followed similar surveys investigating staff experiences and clinical functionality of other brief delirium screening tools, such as the Confusion Assessment Method for the Intensive Care Unit.[10, 11] The survey was distributed by e‐mail to 435 nurses on 16 units. Coffee gift cards were raffled as participation incentive.
Statistical Analysis
Statistical analysis was completed using SPSS (IBM, Armonk, NY) and SAS (SAS Institute, Inc., Cary, NC) software. DOS results were compared to the DRS‐R‐98, and validity statistics were calculated for delirium. Confidence intervals were calculated using the Clopper‐Pearson method for binomial data. The Spearman rank correlation coefficient between DOS and DRS‐98 score was calculated. PROC LOGISTIC (SAS Institute, Inc.) modeled the relationship between positive DOS screens and delirium and created a receiver operating characteristic (ROC) curve using continuous DOS score to predict delirium. Because these models did not control for multiple observations per individual, PROC GENMOD (SAS Institute, Inc.) was used to confirm the relationship between a positive DOS screen and delirium using a marginal logistic regression model accounting for repeated measures. In addition, we selected 10 random samples of 1 observation per person, and validity statistics were calculated for each sample.
The nursing survey results were analyzed using descriptive statistics. Open‐ended comments were reviewed in aggregate.
RESULTS
Participant Characteristics
Fifty‐four participants enrolled in the study. Fifty‐three were able to complete 1 DRS‐R‐98 and comprise the study sample (Table 1). Participants completed 1 to 5 daily DRS‐R‐98 assessments (mean, 1.94; standard deviation [SD], 0.90; mean length of admission, 6.06 days). Of the 105 DRS‐R‐98 assessments, 101 were classifiable for delirium. Of the 101 DRS‐R‐98 assessments classifiable for delirium, 100 had a corresponding DOS score within 24 hours. Participant characteristics are listed in Table 1. Eight of the 53 participants (15%) had at least 1 positive DRS‐R‐98. Overall, 10 of the 101 delirium assessments diagnosed delirium (DRS‐R‐98 score 15).
| Characteristic | No Delirium, n = 45 | Delirium, n = 8a |
|---|---|---|
| ||
| Age, y | ||
| 6574, n = 26 | 22 | 4 |
| 7584, n = 15 | 13 | 2 |
| 85+, n = 12 | 10 | 2 |
| Age, y, mean (SD) [range] | 77 (10) [6592] | 76 (8.6) [6592] |
| Gender | ||
| Female, n = 33 | 28 | 5 |
| Male, n = 20 | 17 | 3 |
| Cognitive status per chart | ||
| No impairment, n = 45 | 43 | 2 |
| Cognitive impairment without dementia, n = 5 | 1 | 4 |
| Dementia, n = 3 | 1 | 2 |
DOS Validity
The mean and standard deviation of delirium screening scores are as follows: DRS‐R‐98 (mean, 6.13; SD, 4.74; range, 020) and DOS (mean, 1.22; SD, 2.37; range, 09). The Spearman correlation coefficient between DOS and DRS‐R‐98 scores was 0.58. DOS had a sensitivity of 90% (95% confidence interval [CI]: 56%‐100%) and specificity of 91% (95% CI: 83%‐96%) compared to the DRS‐98‐R standard. There was only 1 false negative DOS screen out of 83 negative assessments (negative predictive value = 99%, 95% CI: 93%‐100%). Out of the 17 positive assessments, 9 were true positives (positive predictive value = 53%, 95% CI: 28%‐77%), and 7 scored in the subsyndromal range for delirium (DRS‐R‐98 score 814).
In analyses using 10 samples, with 1 randomly selected observation per person, the mean sensitivity was 84.6%, ranging from 80% (95% CI: 28%‐99%) to 87.5% (95% CI: 47%‐100%). The mean specificity in these samples was 92%, ranging from 87% (95% CI: 74%‐95%) to 96% (95% CI: 85%‐99%).
Logistic Regression Models
All models confirmed that positive DOS screens significantly predicted delirium. The traditional logistic regression model produced an odds ratio (OR) estimate of 92 (95% CI: 10‐824, P < 0.0001) for a positive DOS screen predicting delirium. The marginal logistic regression model accounting for repeated measures produced a consistent estimate (OR: 93, 95% CI: 11‐800, P < 0.0001). Continuous DOS scores predicted delirium (OR: 2.1, 95% CI: 1.5‐2.9, P < 0.0001), and the ROC curve supported the cutoff of DOS 3, corresponding to a predicted probability of 0.12 (Figure 1).
Nursing Survey
The nursing survey had a response rate of 23% (N = 98). The most robust results related to DOS administration were 87% (N = 83) of nurses were confident in DOS administration, 92% (N = 86) could complete the DOS in under 3 minutes, and 79% (N = 74) agreed that performing the DOS is easy. There was less agreement on the value of the DOS; 37% agreed that the DOS is worth the time to perform, 25% agreed that the DOS enhances patient care, and 36% agreed that the DOS provides valuable information for patient care. Over half the nurses (55%) reported that they perform the DOS 75% to 100% of the prompted times, and 62% stated if the DOS was no longer required, they would not use it. Open‐ended questions generated a wide range of responses, from supportive to critical of delirium screening and the DOS (see Supporting Information, Appendix 3, in the online version of this article).
DISCUSSION
This study demonstrated the effectiveness, efficiency, and ease of use of the DOS as a delirium screening tool. The DOS exhibited high sensitivity (90%) and specificity (91%). Similar to previous findings, the positive predictive value was only 53%, but the negative predictive value was 99%.[12] These results support that the DOS is consistently able to rule out delirium, with only 1 false negative in this study.
Nursing responses regarding user‐friendliness are consistent with other studies; however, there was a knowledge gap related to how positive delirium screens can inform and change care for patients.[7] Education is a known barrier to integrating delirium screening tools secondary to the need for regular and extensive education, frequent reminders to screen, and regular evaluations of assessment quality.[11, 13, 14, 15] Developing guidelines for responding to positive DOS screens and documenting its impact on care may incentivize use.
Study strengths include strong evaluator consistency, blinding of evaluator and nurses, and responses from a broad range of nurses (14 of 16 units represented). Additionally, this study demonstrated the efficacy and ease of use of an EMR‐prompted delirium screen. However, this study had several limitations, including a small sample size and a low incidence of delirium. The lower incidence is likely secondary to selection bias that resulted from difficulty consenting delirious subjects. The discordant time between DOS and DRS‐R‐98 assessments may have also influenced results; however, inclusion of data from the previous 8 to 24 hours in both tools makes the temporal separation of assessments less impactful.
The ability of the DOS to accurately identify patients at high risk of delirium is useful for healthcare staff. Future work will include nurse and physician education to emphasize delirium understanding, the importance of regular screening, and the use of nonpharmacological interventions. Additional studies will include examination of the interventions and outcomes of patients who screen positive for delirium to determine the long‐term impact of delirium screening.
Acknowledgements
The study authors would like to thank the University of Iowa Hospitals and Clinics, the Department of Family Medicine, and the University of Iowa Hospitals and Clinics nursing managers and nursing staff.
Disclosures
This study was funded by the Summer Research Fellowship program sponsored by the University of Iowa Carver College of Medicine. Drs. Weckmann and Carnahan were supported by the Health Resources and Services Administration, Iowa Geriatric Education Center (UB4 HP19054) as well as the US Department of Health and Human Services, Agency for Healthcare Research and Quality (AHRQ 1 R18 HS022666‐01).
- , , . An intervention to reduce delirium in care homes. Nurs Older People. 2010;22(4):16–21.
- , , , et al. Assessment of delirium in the intensive care unit: nursing practices and perceptions. Am J Crit Care. 2008;17(6):555–565.
- , , , et al. Delirium and sedation recognition using validated instruments: reliability of bedside intensive care unit nursing assessments from 2007 to 2010. J Am Geriatr Soc. 2011;59(suppl 2):S249–S255.
- , , , et al. Preliminary development of an ultrabrief two‐item bedside test for delirium. J Hosp Med. 2015;10(10):645–650.
- , , , et al. The association between an ultrabrief cognitive screening in older adults and hospital outcomes. J Hosp Med. 2015;10(10):651–657.
- , , , et al. Comparison of mental‐status scales for predicting mortality on the general wards. J Hosp Med. 2015;10(10):658–663.
- , , . The Delirium Observation Screening Scale: a screening instrument for delirium. Res Theory Nurs Pract. 2003;17(1):31–50.
- . Validation of the Delirium Rating Scale‐Revised‐98: comparison with the Delirium Rating Scale and the Cognitive Test for Delirium. J Neuropsychiatry Clin Neurosci. 2001;13(2):229–242.
- , , , et al. Factor analysis of the Colombian translation of the Delirium Rating Scale (DRS), Revised‐98. Psychosomatics. 2009;50(3):255–262.
- , , , et al. Implementation, reliability testing, and compliance monitoring of the Confusion Assessment Method for the Intensive Care Unit in trauma patients. Intensive Care Med. 2008;34(7):1263–1268.
- , , , et al. Limitations and practicalities of CAM‐ICU implementation, a delirium scoring system, in a Dutch intensive care unit. Intensive Crit Care Nurs. 2009;25(5):242–249.
- , . The Neecham Confusion Scale and the Delirium Observation Screening Scale: capacity to discriminate and ease of use in clinical practice. BMC Nurs. 2007;6:3.
- , , . Early recognition of delirium: review of the literature. J Clin Nurs. 2001;10(6):721–729.
- , , , et al. Impact of a delirium screening tool and multifaceted education on nurses' knowledge of delirium and ability to evaluate it correctly. Am J Crit Care. 2012;21(1):e1–e11.
- , , . Optimising the recognition of delirium in the intensive care unit. Best Pract Res Clin Anaesthesiol. 2012;26(3):385–393.