User login
VIDEO: Study links hair loss in black women with genetics
WASHINGTON – Almost 41% of black women surveyed described hair loss that was consistent with central centrifugal cicatricial alopecia (CCCA), but only about 9% said they had been diagnosed with the condition, Dr. Yolanda Lenzy reported at the annual meeting of the American Academy of Dermatology.
In a video interview at the meeting, Dr. Lenzy of the University of Connecticut, Farmington, discussed the results of a hair survey she conducted with the Black Women’s Health Study at Boston University’s Slone Epidemiology Center. Nearly 6,000 women have completed the survey to date.
“For many years, it was thought to be due to hair styling practices,” but there are new data showing that genetics can be an important cause, she said, referring to research from South Africa indicating that CCCA can be inherited in an autosomal dominant fashion.
Dr. Lenzy, who practices dermatology in Chicopee, Mass., used a central hair loss photographic scale in the study, which also can be helpful in the office to monitor hair loss and “to quantify how much hair loss a person has … in terms of: Are they getting worse? Do they go from stage 3 to stage 5 or stage 1 to stage 3?”
The video associated with this article is no longer available on this site. Please view all of our videos on the MDedge YouTube channel
AT AAD 16

Highlights From the SCNS Meeting
Click here to download the digital edition.

Click here to download the digital edition.
Click here to download the digital edition.
Recognition and Management of Children with Nonalcoholic Fatty Liver Disease
From the Albert Einstein College of Medicine, Division of Pediatric Gastroenterology and Nutrition, Children’s Hospital at Montefiore, Bronx, NY.
Abstract
- Objective: To review diagnostic challenges and management strategies in children with nonalcoholic fatty liver disease (NAFLD).
- Methods: Review of the literaure.
- Results: NAFLD is common in the United States and should be suspected in overweight or obese children with an elevated serum alanine aminotransferase level. The differential diagnosis for these patients is broad, however, and liver biopsy—the gold standard test—should be undertaken selectively after an appropriate workup. Patients should be counseled on lifestyle modifications, whereas vitamin E therapy can be initiated for those with biopsy-proven disease.
- Conclusion: Providers should have a high degree of suspicion for NAFLD, approaching the workup and diagnosis in an incremental, step-wise fashion. Further research is needed to standardize the diagnostic approach, identify reliable, noninvasive diagnostic measures, and develop novel treatment modalities.
Nonalcoholic fatty liver disease (NAFLD) is the most common liver disease in the Western world, affecting approximately 10% of children and a third of all adults in the United States [1–3]. It is a significant public health challenge and is estimated to soon be the number one indication for liver transplantation in adults.
NAFLD is a generic term encompassing 2 distinct conditions defined by their histopathology: simple steatosis and nonalcoholic steatohepatitis (NASH). Simple steatosis is characterized by predominantly macrovesicular—meaning large droplet—cytoplasmic lipid inclusions found in ≥ 5% of hepatocytes. NASH is defined as hepatic steatosis plus the additional features of inflammation, hepatocyte ballooning, and/or fibrosis. There are some adult data [4-6] and 1 retrospective pediatric study [7] demonstrating that over time, NAFLD may progress. That is, steatosis may progress to NASH and some patients with fibrosis will ultimately develop cirrhosis. If intervention is provided early in the histologic spectrum, NAFLD can be reversed [4,8] and late complications—such as cirrhosis, hepatocellular carcinoma, or liver transplantation—may be prevented.
It is important to highlight that the above definitions are based on histology and that a liver biopsy cannot be reasonably obtained in such a large percentage of the U.S. population. This case-based review will therefore focus primarily on the current diagnostic challenges facing health care providers as well as management strategies in children with presumed NAFLD.
Case Study
Initial Presentation
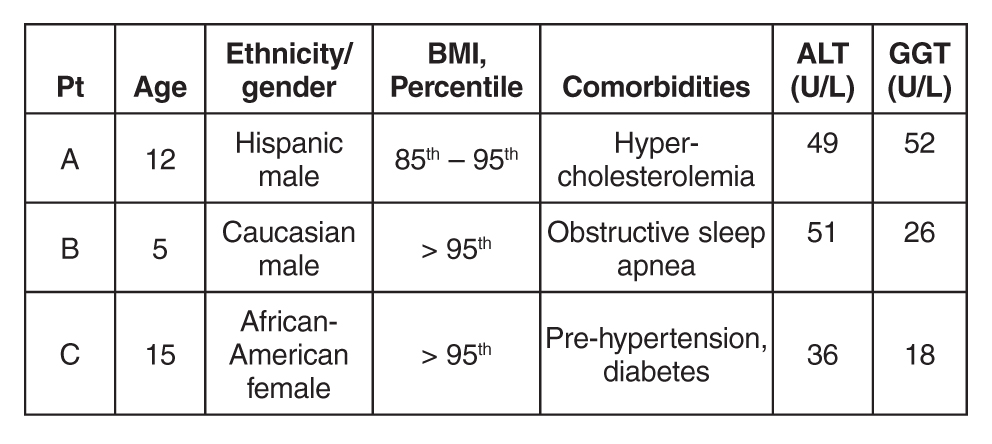
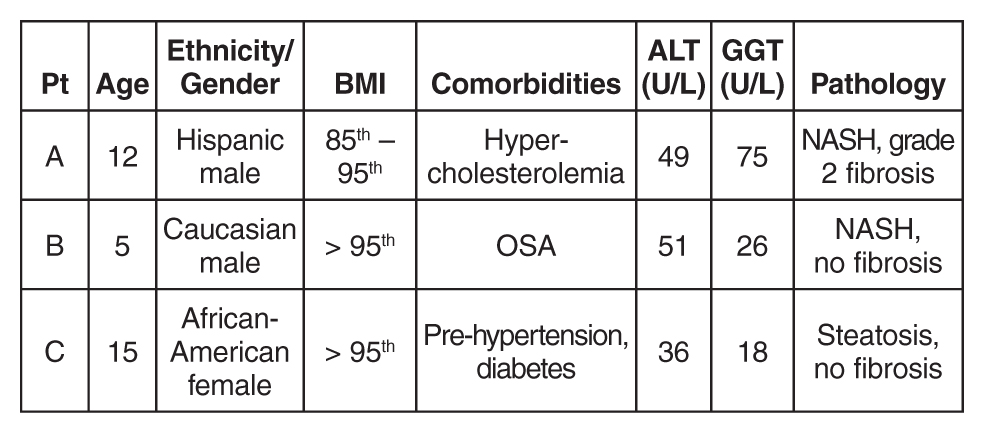
As you finish your charts at the end of a busy clinic day, you identify 3 patients who may have NAFLD:

History
All 3 patients presented to your office for a routine annual physical before the start of the school year and are asymptomatic. None of the patients has a family history of liver disease and their previously diagnosed comorbidities are listed in the table above. No patient is taking medications other than patient C, who is on metformin.
All 3 children have a smooth, velvety rash on their necks consistent with acanthosis nigricans with an otherwise normal physical exam. The liver and spleen are difficult to palpate but are seemingly normal.
What is the typical presentation for a child with NAFLD?
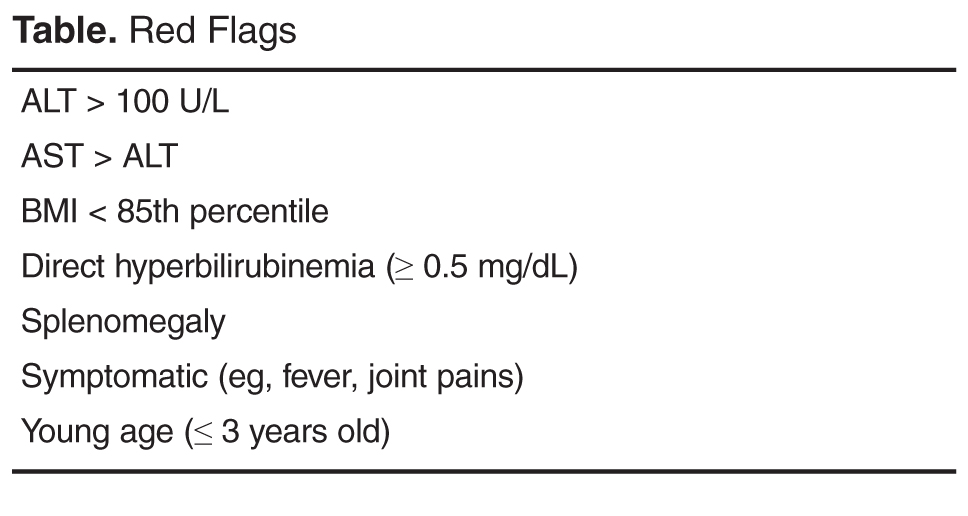
Most children with NAFLD are asymptomatic, though some may present with vague right upper quadrant abdominal pain. It is unclear, however, if the pain is caused by NAFLD or is rather an unrelated symptom that brings the child to the attention of a physician. In addition, hepatomegaly can be found in over 30% to 40% of patients [9]. For children without abdominal pain or hepatomegaly, most are recognized by an elevated serum alanine aminotransferase (ALT) or findings of increased liver echogenicity on ultrasonography.
Serum Alanine Aminotransferase
Serum aminotransferases are one of the more common screening tests for NAFLD. However, ALT is highly insensitive at commonly used thresholds and is also nonspecific. As documented in the SAFETY study, the upper limit of normal for ALT in healthy children should be set around 25 U/L in boys and 22 U/L in girls [10]. Yet even at these thresholds, the sensitivity of ALT to diagnose NAFLD is 80% in boys and 92% in girls, whereas specificity is 79% and 85%, respectively [10]. These findings are largely consistent with adult studies [11–14]. Furthermore, ALT does not correlate well with disease severity and children may still have NASH or significant fibrosis with normal values. In a well-characterized cohort of 91 children with biopsy-proven NAFLD, for example, early fibrosis was identified in 12% of children with a normal ALT (≤ 22 U/L for girls and ≤ 25 U/L in boys) [15]. Advanced fibrosis or cirrhosis was seen in 9% of children with an ALT up to 2 times this upper limit [15]. Thus, reliance on the serum ALT may significantly underestimate the prevalence and severity of liver injury.
Ultrasonography
Children with NAFLD typically have findings of increased hepatic echogenicity on abdominal ultrasonography. However, there are multiple limitations to sonography. First, ultrasound is insensitive for identifying mild steatosis if less than 30% of hepatocytes are affected [16,17]. Second, increased hepatic echogenicity is nonspecific and may be caused by inflammation, fibrosis, or intrahepatic accumulation of iron, copper, or glycogen. Third, there can be considerable inter- and intra-operator variability. And lastly, there is some evidence that ultrasounds do not add benefit to diagnosing children with NAFLD [18].
Which patients are at risk for developing hepatic steatosis and NASH?
Weight, Age, and Gender
There is a strong, direct correlation between body mass index (BMI) and NAFLD. The Study of Child and Adolescent Liver Epidemiology (SCALE)—a sentinel pediatric autopsy study of 742 children—found that 5% of normal weight children, 16% of overweight children, and 38% of obese children had NAFLD. The SCALE study also demonstrated an increasing prevalence with age, such that NAFLD was present in 17.3% of 15- to 19-year-olds but only in 0.2% of 2- to 4-year-olds [1]. With regards to gender, NAFLD is roughly twice as prevalent in males [18–20]. While the exact etiology of this difference is unclear, hormonal differences are a leading hypothesis.
Ethnicity
NAFLD is most common in Hispanics, followed by Asians, Caucasians, and African Americans. Research suggests that genetics may be largely responsible for these ethnic disparities. For example, the I148M allele of PNPLA3 (a single nucleotide polymorphism) is strongly associated with steatosis, NASH, and fibrosis [21] and is most common in Hispanics, with a 50% carrier frequency in some cohorts [22]. Conversely, African Americans are more likely to carry the S453I allele of PNPLA3, which is associated with decreased hepatic steatosis [22]. There is also considerable variability within ethnic groups. For example, Mexican-American children appear to be at the highest risk for steatosis or NASH among Hispanics, whereas Filipino-American children are believed to have higher disease prevalence than Cambodian or Vietnamese Americans [1].
Comorbidities
NAFLD is associated with obesity, insulin resistance and diabetes, cardiovascular disease, the metabolic syndrome [23], decreased quality of life [24,25], and obstructive sleep apnea (OSA). These associations generally hold even after controlling for the other confounders listed. It is important to note that these data come largely from cross-sectional studies and direct causation has yet to be determined.
Insulin resistance in particular is strongly associated with NAFLD—so much so, in fact, that some consider it to be the hepatic manifestation of the metabolic syndrome. Additionally, children with features of the metabolic syndrome are more likely to have advanced histologic features of NAFLD [23]. There are also intriguing data from small pediatric studies to suggest that OSA may contribute to the development of hepatic fibrosis. In one study of 25 children with biopsy-proven NAFLD, for example, the presence of OSA and hypoxemia correlated with the degree of hepatic fibrosis [26]. In a slightly larger study of 65 children, OSA was also strongly associated with significant hepatic fibrosis (odds ratio, 5.91; 95% confidence interval, 3.23–7.42; P < 0.001). The duration of hypoxemia also correlated with histologic findings of inflammation and circulating biomarkers of apoptosis and fibrogenesis [27].
Other Laboratory Tests
Several studies have documented an association between elevated gamma-glutamyl transferase (GGT) and hepatic fibrosis [28,29], though others have been conflicting [30,31]. Pediatric studies have also demonstrated an inverse correlation between NASH and total bilirubin [32], serum potassium [33], and serum ceruloplasmin [34]. In addition, there are a number of serum biomarkers or biomarker panels commercially available for use in adults. Because similar efficacy data are unavailable in children, however, serum biomarkers should be primarily used for research purposes only.
Who should be screened for NAFLD? And how?
Published professional society recommendations differ significantly with regards to screening. In 2007, the American Academy of Pediatrics suggested screening obese children over 10 years of age or overweight children with additional risk factors with biannual liver tests [35]. There were no management recommendations made for elevated aminotransferase levels other than for subspecialty referral. In 2012, the European Society of Pediatric Gastroenterology, Hepatology, and Nutrition (ESPGHAN) recommended obtaining an ultrasound and liver tests in every obese child [36]. One month later, however, the American Gastroenterological Association, American Association for the Study of Liver Disease, and the American College of Gastroenterology published joint guidelines without screening recommendations “due to a paucity of evidence” [37].
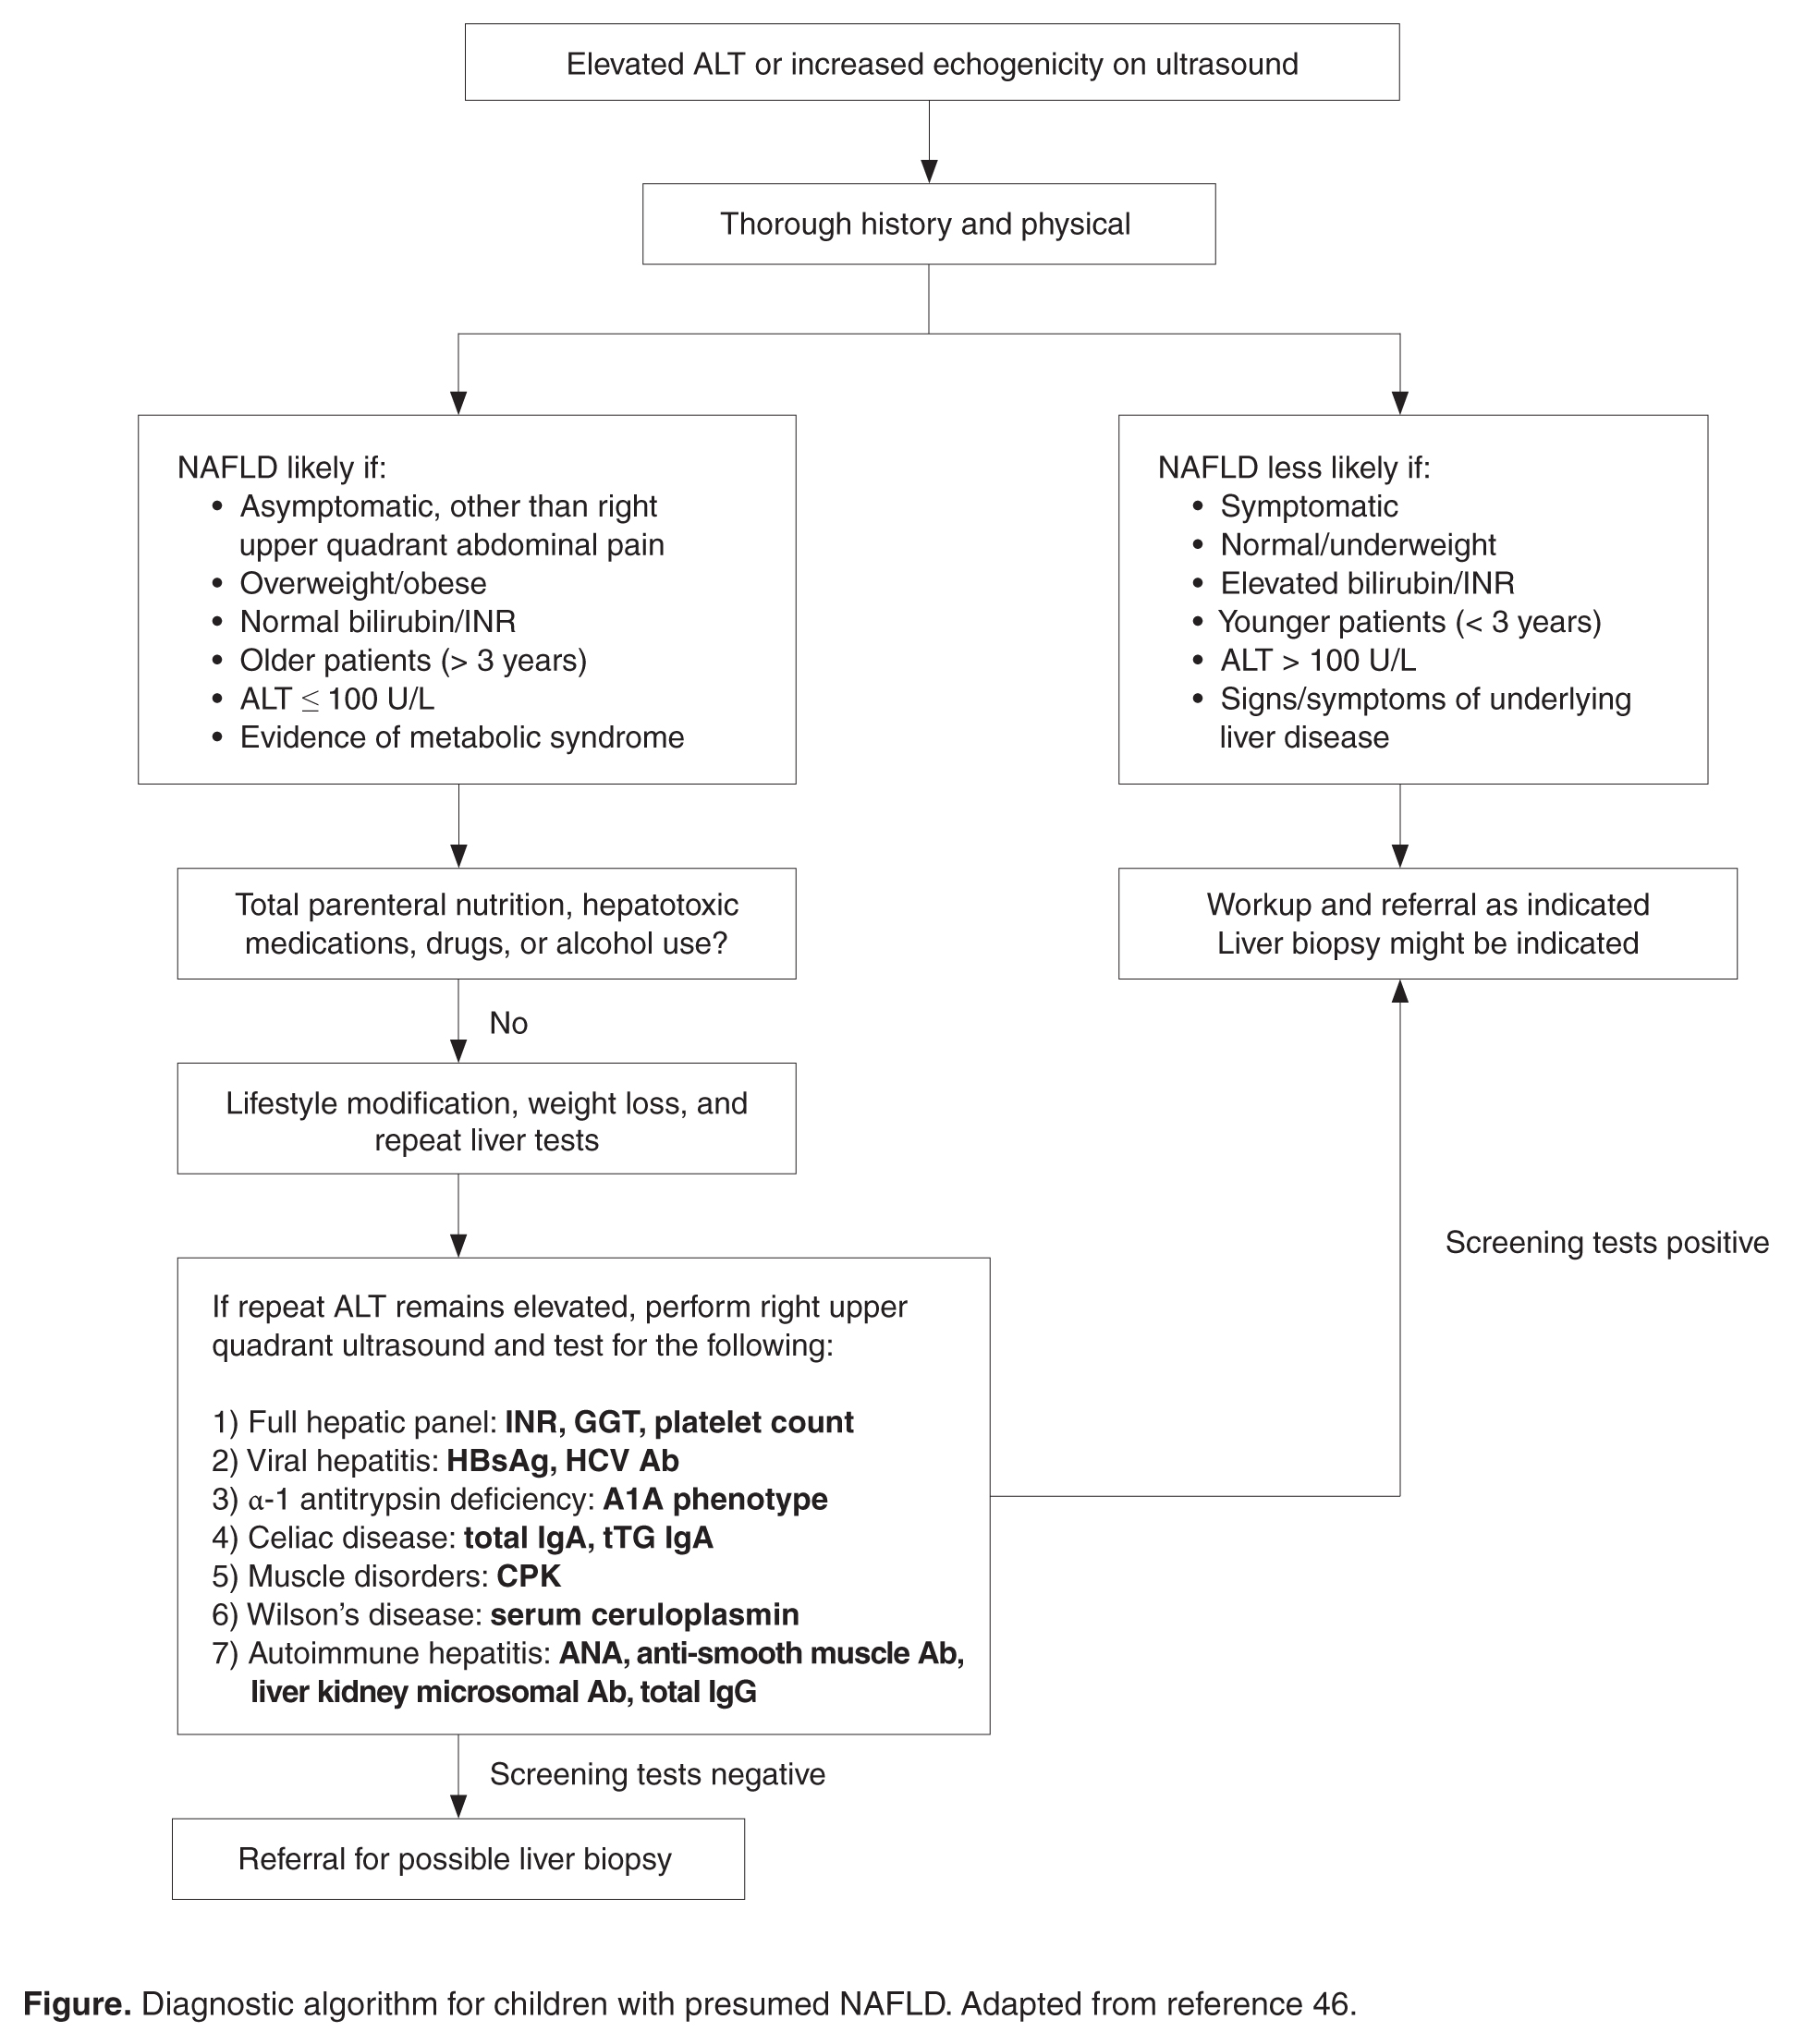
Because these statements conflict and are based heavily on expert opinion, one should consider the risks, benefits, and costs to screening large numbers of patients. Until additional research clarifies this controversy, we suggest that providers individualize their screening practices to their population and the risks of each individual patient. For example, we would consider screening children who are obese; Hispanic or Asian; have multiple features of the metabolic syndrome; and/or those who have a family history of NAFLD. Further, we recommend screening children for NAFLD with serum liver enzymes only and not with ultrasonography.
Case Continued: Laboratory Results
ALT and GGT tests are ordered and the results are as follows:
What is the differential for children with suspected NAFLD?
Autoimmune Hepatitis (AIH)
AIH is a progressive necro-inflammatory disorder of the liver characterized by elevated aminotransferases, positive autoantibodies, and distinctive histologic features. AIH is believed to occur in genetically predisposed patients in response to an environmental trigger. There is a female predominance and it can present in any age or ethnic group.
AIH is divided in 2 subtypes. Type 1 disease is characterized by a positive antinuclear (ANA) antibody and anti-smooth muscle antibody. More commonly, it presents in adolescence with an indolent course—many patients are asymptomatic until they develop features of cirrhosis and portal hypertension. Conversely, type 2 AIH is characterized by a positive liver kidney microsomal (LKM) antibody and tends to present acutely in young children. It is important to note that antibody titers can be falsely positive in a significant percentage of patients and, in such cases, are often mildly elevated [38]. We strongly suggest children with positive autoantibody titers be evaluated by a specialist.
Treatment should be started promptly to avoid progression to cirrhosis and should also done so in consultation with a pediatric gastroenterologist or hepatologist. The prognosis of AIH with immunosuppression is favorable, with long-term remission rates of approximately 80%. Transplantation is typically required in the remaining 10% to 20% [39].
Celiac Disease
Celiac disease is an autoimmune, inflammatory enteropathy caused by exposure to gluten in genetically susceptible individuals. Up to a third of all children presenting with celiac will have an elevated serum ALT [40]. Additional symptoms/features are both variable and nonspecific: abdominal pain, poor growth, diarrhea, or constipation, among others. Celiac is diagnosed by duodenal biopsy or a sufficiently elevated tissue transglutaminase antibody level [41]. Treatment with a strict gluten-free diet will resolve the enteropathy and normalize the serum aminotransferases.
Wilson’s Disease
Wilson’s disease is a metabolic disorder leading to copper deposition in the liver, brain, cornea, and kidneys. It is caused by an ATP7B gene mutation and inherited in an autosomal recessive fashion. Patients may present with asymptomatic liver disease, chronic hepatitis, acute liver failure, or with symptoms of portal hypertension. Neuropsychiatric symptoms may also be prominent. Screening tests include a serum ceruloplasmin and 24-hour urinary copper quantification. Because diagnosing Wilson’s disease can be challenging, however, further testing should occur in consultation with a pediatric gastroenterologist or hepatologist.
Viral Hepatitis
Chronic viral infections such as hepatitis B and C are still common etiologies of liver disease in the United States. However, universal vaccination and blood donor screening have reduced the risk of transmission; new antiviral agents will likely further decrease the prevalence and transmission risk over time. Acute viral hepatitis—cytomegalovirus, Epstein-Barr virus, hepatitis A, or hepatitis E—should also be considered in children who present with appropriate symptoms and an elevated ALT.
Drug-Induced
Drug-induced liver injury (DILI) can present with elevated serum aminotransferases (hepatocellular pattern), an elevated bilirubin (cholestatic pattern), or a mixed picture. Idiosyncratic DILI in children is commonly caused by antimicrobial or central nervous system agents and usually presents with a hepatocellular injury pattern. Substance abuse, including alcohol, is common and should also be investigated as the source of underlying liver disease.
Muscle Disease
Aspartate aminotransferase (AST) and ALT are present in hepatocytes, myocytes, and red blood cells, among other tissues. Thus, children with congenital myopathies or myositis can have elevated aminotransferases, typically with the AST higher than the ALT. In these patients, checking a creatine phosphokinase (CPK) level may lead to the correct diagnosis and limit unnecessary testing.
Other Metabolic Disorders
Myriad metabolic disorders present with liver disease and/or elevated serum aminotransferase levels. Individually, these conditions are rare but, collectively, are relatively common. Two of the more occult conditions—lysosomal acid lipase deficiency (LAL-D) and alpha-1 antitrypsin (A1A) deficiency—are discussed in further detail below.
LAL-D is an autosomal recessive disease resulting in the accumulation of cholesterol esters and triglycerides in lysosomes. Patients typically present with hepatomegaly and mildly elevated aminotransferases, an elevated LDL, low HDL cholesterol, and increased hepatic echogenicity on ultrasound. If a biopsy is obtained, microvesicular steatosis is predominant as opposed to macrovesicular steatosis found in NAFLD. The diagnosis of LAL-D can be made on a commercially available dry blood spot enzymatic assay or genetic testing and treatment has recently been FDA approved.
A1A deficiency is an autosomal recessive disease diagnosable by an alpha-1-antitrypsin phenotype. The clinical presentation is characterized by neonatal cholestasis in the infantile form and by hepatitis, cirrhosis and portal hypertension in older children. Classic symptoms of emphysema and chronic lung disease present in adulthood.
What further testing should be performed in children with suspected NAFLD?
For obese children with an elevated ALT or evidence of increased hepatic echogenicity, ESPGHAN recommends targeting the workup according to the child’s age [36]. According to their consensus statement, they recommend an upfront, thorough laboratory evaluation in children less than 10 years of age and consideration of a liver biopsy upon completion. For children over 10 years of age at low risk for NASH or fibrosis, additional laboratory evaluation is suggested 3 to 6 months after failed lifestyle interventions. In general, the recommended workup includes testing for conditions discussed in the section above such as viral hepatitis, AIH, Wilson’s disease, and others. If negative, ESPGHAN states that a liver biopsy should be “considered.”
The question of whether or not to obtain a liver biopsy is controversial, though there are several clear advantages to doing so. First, biopsy is the gold standard test for diagnosing NAFLD and there are no highly accurate, noninvasive tests currently approved for use in children. Second, biopsy is a more definitive means of ruling out competing diagnoses such as AIH. Third, biopsy may provide prognostic data. In a retrospective adult study of 136 patients, for example, those who presented with simple steatosis had a roughly 3% chance of progressing to cirrhosis within 10 years. If a patient within this cohort presented with NASH, however, the progression risk was approximately 30% within 5 years [42,43]. Fourth, due to potential side effects of medications, position papers recommend obtaining a liver biopsy prior to the initiation of pharmacotherapy [37]. Lastly, the risk for serious morbidity from a liver biopsy is low [44,45]. Alternatively, one must acknowledge the risks of liver biopsy: morbidity, sampling bias, invasiveness, cost, and sedation risks in children.
Case Continued: Biopsy Results
You refer your patients to a gastroenterologist. Tests for viral hepatitis, A1A deficiency, celiac disease, muscle disorders, Wilson’s disease, and AIH are negative. Ultimately, a liver biopsy is performed on all 3 children without complications. The results are presented below.
What is the treatment of NAFLD?
Lifestyle Modification
Lifestyle modifications are the mainstay of treatment for NAFLD. In adult studies, weight loss of more than 5% reduces hepatic steatosis whereas weight loss of more than 9% improves or eliminates NASH [47]. We recommend that children engage in age-appropriate, enjoyable, moderate- or vigorous-intensity aerobic activity for 60 minutes a day [48]. In addition, there should be a focus on reducing sedentary behavior by limiting screen time and a concerted effort to engage the family in lifestyle modifications.
Dietary interventions to treat NAFLD are less concrete but there is a growing body of literature to suggest that dietary fructose is particularly harmful. In adults, for example, fructose consumption is associated with the development of NAFLD [49] and hepatic fibrosis [50]. Recent data in adolescents has similarly documented an association between NAFLD incidence and energy-adjusted fructose intake [51]. It is worth highlighting that these clinical findings are also biologically plausible, as fructose is primarily metabolized within hepatocytes and has recently been shown to increase de novo lipogenesis [52,53]. In general, we suggest a well-balanced diet of unprocessed foods—that is, with limited added sugars—sufficient to induce gradual weight loss in older children or body weight maintenance in younger children.
Medications
Vitamin E is the only medication with proven efficacy in children, as demonstrated in the TONIC trial [20]. TONIC was a double-blind, multicenter, placebo-controlled study with 3 treatment arms: 800 IU of vitamin E daily, 1000 mg of metformin daily, or placebo. Metformin did not reduce the serum ALT or significantly improve liver histology and should therefore not be used for these indications. However, patients treated with vitamin E had a statistically significant improvement in the NAFLD activity score (a histologic grading system comprising steatosis, inflammation, and hepatocyte ballooning) and resolution of NASH when compared to placebo. For these reasons—as well as a paucity of other viable treatment options—vitamin E is routinely prescribed for children with biopsy-proven NASH. However, the long- term risks of high-dose vitamin E therapy in children are largely unknown.
Polyunsaturated fats such as docosahexaenoic acid (DHA) [54] and probiotics such as VSL #3 [55] have showed efficacy reducing hepatic steatosis in small, randomized clinical trials. Both medications need to be further validated before they can be recommended for use in children. Conversely, ursodeoxycholic acid has not been found to be efficacious in children with NAFLD [56], whereas phase IIb data on cysteamine is expected soon. There are currently insufficient data to recommend bariatric surgery as treatment for NAFLD in adolescence.
Case Continued: Follow-up
After their biopsies, both patients with NASH (patients A and B) are started on vitamin E therapy. All 3 patients continue to report for follow-up visits without short-term complications, though they have still been unable to significantly reduce their body mass index and have a persistently elevated serum ALT.
Summary
NAFLD is a common condition in the United States with serious personal and public health ramifications. This case-based review highlights the diagnostic and management challenges in children with NAFLD and the unique role primary care providers play in caring for these patients.
Corresponding author: Bryan Rudolph, MD, Albert Einstein College of Medicine, Division of Pediatric Gastroenterology and Nutrition, Children’s Hospital at Montefiore, 3415 Bainbridge Ave., Bronx, NY 10467, brudolph@montefiore.org.
Financial disclosures: None.
1. Schwimmer JB, Deutsch R, Kahen T, et al. Prevalence of fatty liver in children and adolescents. Pediatrics 2006;118:1388–93.
2. Welsh JA, Karpen S, Vos MB.Increasing prevalence of nonalcoholic fatty liver disease among United States adolescents, 1988-1994 to 2007-2010. J Pediatr 2013;162:496–500.
3. Vernon G, Baranova A, Younossi ZM. Systematic review: the epidemiology and natural history of non-alcoholic fatty liver disease and non-alcoholic steatohepatitis in adults. Aliment Pharmacol Ther 2011;34:274–85.
4. McPherson S, Hardy T, Henderson E, et al. Evidence of NAFLD progression from steatosis to fibrosing-steatohepatitis using paired biopsies: implications for prognosis and clinical management. J Hepatol 2015;62:1148–55.
5. Singh S, Allen AM, Wang Z, et al. Fibrosis progression in nonalcoholic fatty liver vs nonalcoholic steatohepatitis: a systematic review and meta-analysis of paired-biopsy studies. Clin Gastroenterol Hepatol 2015;13:643–54.
6. Pais R, Charlotte F, Fedchuk L, et al. A systematic review of follow-up biopsies reveals disease progression in patients with non-alcoholic fatty liver. J Hepatol 2013;59:550–6.
7. Feldstein AE, Charatcharoenwitthaya P, Treeprasertsuk S, et al. The natural history of non-alcoholic fatty liver disease in children: a follow-up study for up to 20 years. Gut 2009;58:1538–44.
8. Mummadi RR, Kasturi KS, Chennareddygari S, et al. Effect of bariatric surgery on nonalcoholic fatty liver disease: systematic review and meta-analysis. Clin Gastroenterol Hepatol 2008;6:1396–402.
9. Rashid M, Roberts EA. Nonalcoholic steatohepatitis in children. J Pediatr Gastroenterol Nutr 2000;30:48–53.
10. Schwimmer JB, Dunn W, Norman GJ, et al. SAFETY study: alanine aminotransferase cutoff values are set too high for reliable detection of pediatric chronic liver disease. Gastroenterology 2010;138:1357–64.
11. Prati D, Taioli E, Zanella A, et al. Updated definitions of healthy ranges for serum alanine aminotransferase levels. Ann Intern Med 2002;137:1–10.
12. Lee JK, Shim JH, Lee HC, et al. Estimation of the healthy upper limits for serum alanine aminotransferase in Asian populations with normal liver histology. Hepatology 2010;51:1577–83.
13. Kang HS, Um SH, Seo YS, et al. Healthy range for serum ALT and the clinical significance of "unhealthy" normal ALT levels in the Korean population. J Gastroenterol Hepatol 2011;26:292–9.
14. Zheng MH, Shi KQ, Fan YC, et al. Upper limits of normal for serum alanine aminotransferase levels in Chinese Han population. PLoS One 2012;7:e43736.
15. Molleston JP, Schwimmer JB, Yates KP, et al. Histological abnormalities in children with nonalcoholic fatty liver disease and normal or mildly elevated alanine aminotransferase levels. J Pediatr 2014;164:707–13.
16. Dasarathy S, Dasarathy J, Khiyami A, et al. Validity of real time ultrasound in the diagnosis of hepatic steatosis: a prospective study. J Hepatol 2009;51:1061–7.
17. Nobili V, M. Pinzani M. Paediatric non-alcoholic fatty liver disease. Gut 2010;59:561–4.
18. Rudolph B, Rivas Y, Kulak S, et al. Yield of diagnostic tests in obese children with an elevated alanine aminotransferase. Acta Paediatr 2015;104:e557–63.
19. Nobili V, Manco M, Ciampalini P, et al. Metformin use in children with nonalcoholic fatty liver disease: an open-label, 24-month, observational pilot study. Clin Ther 2008;30:1168–76.
20. Lavine JE, Schwimmer JB, Van Natta ML, et al. Effect of vitamin E or metformin for treatment of nonalcoholic fatty liver disease in children and adolescents: the TONIC randomized controlled trial. JAMA 2011;305:1659–68.
21. Krawczyk MP, Portincasa P, Lammert F. PNPLA3-associated steatohepatitis: toward a gene-based classification of fatty liver disease. Semin Liver Dis 2013;33:369–79.
22. Romeo S, Kozlitina J, Xing C, et al. Genetic variation in PNPLA3 confers susceptibility to nonalcoholic fatty liver disease. Nat Genet 2008;40:1461–5.
23. Patton HM, Yates K, Unalp-Arida A, et al. Association between metabolic syndrome and liver histology among children with nonalcoholic fatty liver disease. Am J Gastroenterol 2010;105:2093–102.
24. Kistler KD, Molleston J, Unalp A, et al., Symptoms and quality of life in obese children and adolescents with non-alcoholic fatty liver disease. Aliment Pharmacol Ther 2010;31:396–406.
25. Kerkar N, D'Urso C, Van Nostrand K, et al. Psychosocial outcomes for children with nonalcoholic fatty liver disease over time and compared with obese controls. J Pediatr Gastroenterol Nutr 2013;56:77–82.
26. Sundaram SS, Sokol RJ, Capocelli KE, et al. Obstructive sleep apnea and hypoxemia are associated with advanced liver histology in pediatric nonalcoholic fatty liver disease. J Pediatr 2014;164:699–706.
27. Nobili V, Cutrera R, Liccardo D, et al. Obstructive sleep apnea syndrome affects liver histology and inflammatory cell activation in pediatric nonalcoholic fatty liver disease, regardless of obesity/insulin resistance. Am J Respir Crit Care Med 2014;189:66–76.
28. Patton HM, Lavine JE, Van Natta ML, et al., Clinical correlates of histopathology in pediatric nonalcoholic steatohepatitis. Gastroenterology 2008;135:1961–71.
29. Schwimmer JB, Behling C, Newbury R, et al. Histopathology of pediatric nonalcoholic fatty liver disease. Hepatology 2005;42:641–9.
30. Nobili V, Parkes J, Bottazzo G, et al. Performance of ELF serum markers in predicting fibrosis stage in pediatric non-alcoholic fatty liver disease. Gastroenterology 2009;136:160–7.
31. Yang HR, Kim HR, Kim MJ, et al. Noninvasive parameters and hepatic fibrosis scores in children with nonalcoholic fatty liver disease. World J Gastroenterol 2012;18:1525–30.
32. Puri K, Nobili V, Melville K, et al. Serum bilirubin level is inversely associated with nonalcoholic steatohepatitis in children. J Pediatr Gastroenterol Nutr 2013;57:114–8.
33. Tabbaa A, Shaker M, Lopez R, et al. Low serum potassium levels associated with disease severity in children with nonalcoholic fatty liver disease. Pediatr Gastroenterol Hepatol Nutr 2015;18:168–74.
34. Nobili V, Siotto M, Bedogni G, et al. Levels of serum ceruloplasmin associate with pediatric nonalcoholic fatty liver disease. J Pediatr Gastroenterol Nutr 2013;56:370–5.
35. Barlow SE; Expert Committee. Expert committee recommendations regarding the prevention, assessment, and treatment of child and adolescent overweight and obesity: summary report. Pediatrics 2007;120 Suppl 4:S164–92.
36. Vajro P, Lenta S, Socha P, et al. Diagnosis of nonalcoholic fatty liver disease in children and adolescents: position paper of the ESPGHAN Hepatology Committee. J Pediatr Gastroenterol Nutr 2012;54:700–13.
37. Chalasani N, Younossi Z, Lavine JE, et al. The diagnosis and management of non-alcoholic fatty liver disease: practice guideline by the American Gastroenterological Association, American Association for the Study of Liver Diseases, and American College of Gastroenterology. Gastroenterology 2012;142:1592–609.
38. Vuppalanchi R, Gould RJ, Wilson LA, et al. Clinical significance of serum autoantibodies in patients with NAFLD: results from the nonalcoholic steatohepatitis clinical research network. Hepatol Int 2012;6:379–85.
39. Floreani A, Liberal R, Vergani D, et al. Autoimmune hepatitis: contrasts and comparisons in children and adults - a comprehensive review. J Autoimmun 2013;46:7–16.
40. Vajro P, Paolella G, Maggiore G, et al. Pediatric celiac disease, cryptogenic hypertransaminasemia, and autoimmune hepatitis. J Pediatr Gastroenterol Nutr 2013;56:663–70.
41. Husby S, Koletzko S, Korponay-Szabó IR, et al. European Society for Pediatric Gastroenterology, Hepatology, and Nutrition guidelines for the diagnosis of coeliac disease. J Pediatr Gastroenterol Nutr 2012;54:136–60.
42. Matteoni CA, Younossi ZM, Gramlich T, et al. Nonalcoholic fatty liver disease: a spectrum of clinical and pathological severity. Gastroenterology 1999;116:1413–9.
43. McCullough AJ. The clinical features, diagnosis and natural history of nonalcoholic fatty liver disease. Clin Liver Dis 2004;8:521–33.
44. Ovchinsky N, Moreira RK, Lefkowitch JH, Lavine JE. Liver biopsy in modern clinical practice: a pediatric point-of-view. Adv Anat Pathol 2012;19:250–62.
45. Dezsőfi A, Baumann U, Dhawan A, et al. Liver biopsy in children: position paper of the ESPGHAN Hepatology Committee. J Pediatr Gastroenterol Nutr 2015;60:408–20.
46. Fusillo S, Rudolph B. Nonalcoholic fatty liver disease. Pediatr Rev 2015;36:198–205.
47. Harrison SA, Fecht W, Brunt EM, Neuschwander-Tetri BA. Orlistat for overweight subjects with nonalcoholic steatohepatitis: A randomized, prospective trial. Hepatology 2009;49:80–6.
48. School health guidelines to promote healthy eating and physical activity. MMWR Recomm Rep 2011;60(Rr-5):1–76.
49. Ouyang X, Cirillo P, Sautin Y, et al. Fructose consumption as a risk factor for non-alcoholic fatty liver disease. J Hepatol 2008;48:993–9.
50. Abdelmalek MF, Suzuki A, Guy C, et al. Increased fructose consumption is associated with fibrosis severity in patients with nonalcoholic fatty liver disease. Hepatology 2010;51:1961–71.
51. O’Sullivan TA, Oddy WH, Bremner AP, et al. Lower fructose intake may help protect against development of nonalcoholic fatty liver in adolescents with obesity. J Pediatr Gastroenterol Nutr 2014;58:624–31.
52. Parks EJ, Skokan LE, Timlin MT, Dingfelder CS. Dietary sugars stimulate fatty acid synthesis in adults. J Nutr 2008;138:1039–46.
53. Stanhope KL, Schwarz JM, Keim NL, et al. Consuming fructose-sweetened, not glucose-sweetened, beverages increases visceral adiposity and lipids and decreases insulin sensitivity in overweight/obese humans. J Clin Invest 2009;119:1322–34.
54. Nobili V, Alisi A, Della Corte C, et al., Docosahexaenoic acid for the treatment of fatty liver: randomised controlled trial in children. Nutr Metab Cardiovasc Dis 2013;23:1066–70.
55. Alisi A, Bedogni G, Baviera G, et al. Randomised clinical trial: The beneficial effects of VSL#3 in obese children with non-alcoholic steatohepatitis. Aliment Pharmacol Ther 2014;39:1276–85.
56. Vajro P, Franzese A, Valerio G, et al. Lack of efficacy of ursodeoxycholic acid for the treatment of liver abnormalities in obese children. J Pediatr 2000;136:739–43.
From the Albert Einstein College of Medicine, Division of Pediatric Gastroenterology and Nutrition, Children’s Hospital at Montefiore, Bronx, NY.
Abstract
- Objective: To review diagnostic challenges and management strategies in children with nonalcoholic fatty liver disease (NAFLD).
- Methods: Review of the literaure.
- Results: NAFLD is common in the United States and should be suspected in overweight or obese children with an elevated serum alanine aminotransferase level. The differential diagnosis for these patients is broad, however, and liver biopsy—the gold standard test—should be undertaken selectively after an appropriate workup. Patients should be counseled on lifestyle modifications, whereas vitamin E therapy can be initiated for those with biopsy-proven disease.
- Conclusion: Providers should have a high degree of suspicion for NAFLD, approaching the workup and diagnosis in an incremental, step-wise fashion. Further research is needed to standardize the diagnostic approach, identify reliable, noninvasive diagnostic measures, and develop novel treatment modalities.
Nonalcoholic fatty liver disease (NAFLD) is the most common liver disease in the Western world, affecting approximately 10% of children and a third of all adults in the United States [1–3]. It is a significant public health challenge and is estimated to soon be the number one indication for liver transplantation in adults.
NAFLD is a generic term encompassing 2 distinct conditions defined by their histopathology: simple steatosis and nonalcoholic steatohepatitis (NASH). Simple steatosis is characterized by predominantly macrovesicular—meaning large droplet—cytoplasmic lipid inclusions found in ≥ 5% of hepatocytes. NASH is defined as hepatic steatosis plus the additional features of inflammation, hepatocyte ballooning, and/or fibrosis. There are some adult data [4-6] and 1 retrospective pediatric study [7] demonstrating that over time, NAFLD may progress. That is, steatosis may progress to NASH and some patients with fibrosis will ultimately develop cirrhosis. If intervention is provided early in the histologic spectrum, NAFLD can be reversed [4,8] and late complications—such as cirrhosis, hepatocellular carcinoma, or liver transplantation—may be prevented.
It is important to highlight that the above definitions are based on histology and that a liver biopsy cannot be reasonably obtained in such a large percentage of the U.S. population. This case-based review will therefore focus primarily on the current diagnostic challenges facing health care providers as well as management strategies in children with presumed NAFLD.
Case Study
Initial Presentation
As you finish your charts at the end of a busy clinic day, you identify 3 patients who may have NAFLD:
History
All 3 patients presented to your office for a routine annual physical before the start of the school year and are asymptomatic. None of the patients has a family history of liver disease and their previously diagnosed comorbidities are listed in the table above. No patient is taking medications other than patient C, who is on metformin.
All 3 children have a smooth, velvety rash on their necks consistent with acanthosis nigricans with an otherwise normal physical exam. The liver and spleen are difficult to palpate but are seemingly normal.
What is the typical presentation for a child with NAFLD?
Most children with NAFLD are asymptomatic, though some may present with vague right upper quadrant abdominal pain. It is unclear, however, if the pain is caused by NAFLD or is rather an unrelated symptom that brings the child to the attention of a physician. In addition, hepatomegaly can be found in over 30% to 40% of patients [9]. For children without abdominal pain or hepatomegaly, most are recognized by an elevated serum alanine aminotransferase (ALT) or findings of increased liver echogenicity on ultrasonography.
Serum Alanine Aminotransferase
Serum aminotransferases are one of the more common screening tests for NAFLD. However, ALT is highly insensitive at commonly used thresholds and is also nonspecific. As documented in the SAFETY study, the upper limit of normal for ALT in healthy children should be set around 25 U/L in boys and 22 U/L in girls [10]. Yet even at these thresholds, the sensitivity of ALT to diagnose NAFLD is 80% in boys and 92% in girls, whereas specificity is 79% and 85%, respectively [10]. These findings are largely consistent with adult studies [11–14]. Furthermore, ALT does not correlate well with disease severity and children may still have NASH or significant fibrosis with normal values. In a well-characterized cohort of 91 children with biopsy-proven NAFLD, for example, early fibrosis was identified in 12% of children with a normal ALT (≤ 22 U/L for girls and ≤ 25 U/L in boys) [15]. Advanced fibrosis or cirrhosis was seen in 9% of children with an ALT up to 2 times this upper limit [15]. Thus, reliance on the serum ALT may significantly underestimate the prevalence and severity of liver injury.
Ultrasonography
Children with NAFLD typically have findings of increased hepatic echogenicity on abdominal ultrasonography. However, there are multiple limitations to sonography. First, ultrasound is insensitive for identifying mild steatosis if less than 30% of hepatocytes are affected [16,17]. Second, increased hepatic echogenicity is nonspecific and may be caused by inflammation, fibrosis, or intrahepatic accumulation of iron, copper, or glycogen. Third, there can be considerable inter- and intra-operator variability. And lastly, there is some evidence that ultrasounds do not add benefit to diagnosing children with NAFLD [18].
Which patients are at risk for developing hepatic steatosis and NASH?
Weight, Age, and Gender
There is a strong, direct correlation between body mass index (BMI) and NAFLD. The Study of Child and Adolescent Liver Epidemiology (SCALE)—a sentinel pediatric autopsy study of 742 children—found that 5% of normal weight children, 16% of overweight children, and 38% of obese children had NAFLD. The SCALE study also demonstrated an increasing prevalence with age, such that NAFLD was present in 17.3% of 15- to 19-year-olds but only in 0.2% of 2- to 4-year-olds [1]. With regards to gender, NAFLD is roughly twice as prevalent in males [18–20]. While the exact etiology of this difference is unclear, hormonal differences are a leading hypothesis.
Ethnicity
NAFLD is most common in Hispanics, followed by Asians, Caucasians, and African Americans. Research suggests that genetics may be largely responsible for these ethnic disparities. For example, the I148M allele of PNPLA3 (a single nucleotide polymorphism) is strongly associated with steatosis, NASH, and fibrosis [21] and is most common in Hispanics, with a 50% carrier frequency in some cohorts [22]. Conversely, African Americans are more likely to carry the S453I allele of PNPLA3, which is associated with decreased hepatic steatosis [22]. There is also considerable variability within ethnic groups. For example, Mexican-American children appear to be at the highest risk for steatosis or NASH among Hispanics, whereas Filipino-American children are believed to have higher disease prevalence than Cambodian or Vietnamese Americans [1].
Comorbidities
NAFLD is associated with obesity, insulin resistance and diabetes, cardiovascular disease, the metabolic syndrome [23], decreased quality of life [24,25], and obstructive sleep apnea (OSA). These associations generally hold even after controlling for the other confounders listed. It is important to note that these data come largely from cross-sectional studies and direct causation has yet to be determined.
Insulin resistance in particular is strongly associated with NAFLD—so much so, in fact, that some consider it to be the hepatic manifestation of the metabolic syndrome. Additionally, children with features of the metabolic syndrome are more likely to have advanced histologic features of NAFLD [23]. There are also intriguing data from small pediatric studies to suggest that OSA may contribute to the development of hepatic fibrosis. In one study of 25 children with biopsy-proven NAFLD, for example, the presence of OSA and hypoxemia correlated with the degree of hepatic fibrosis [26]. In a slightly larger study of 65 children, OSA was also strongly associated with significant hepatic fibrosis (odds ratio, 5.91; 95% confidence interval, 3.23–7.42; P < 0.001). The duration of hypoxemia also correlated with histologic findings of inflammation and circulating biomarkers of apoptosis and fibrogenesis [27].
Other Laboratory Tests
Several studies have documented an association between elevated gamma-glutamyl transferase (GGT) and hepatic fibrosis [28,29], though others have been conflicting [30,31]. Pediatric studies have also demonstrated an inverse correlation between NASH and total bilirubin [32], serum potassium [33], and serum ceruloplasmin [34]. In addition, there are a number of serum biomarkers or biomarker panels commercially available for use in adults. Because similar efficacy data are unavailable in children, however, serum biomarkers should be primarily used for research purposes only.
Who should be screened for NAFLD? And how?
Published professional society recommendations differ significantly with regards to screening. In 2007, the American Academy of Pediatrics suggested screening obese children over 10 years of age or overweight children with additional risk factors with biannual liver tests [35]. There were no management recommendations made for elevated aminotransferase levels other than for subspecialty referral. In 2012, the European Society of Pediatric Gastroenterology, Hepatology, and Nutrition (ESPGHAN) recommended obtaining an ultrasound and liver tests in every obese child [36]. One month later, however, the American Gastroenterological Association, American Association for the Study of Liver Disease, and the American College of Gastroenterology published joint guidelines without screening recommendations “due to a paucity of evidence” [37].
Because these statements conflict and are based heavily on expert opinion, one should consider the risks, benefits, and costs to screening large numbers of patients. Until additional research clarifies this controversy, we suggest that providers individualize their screening practices to their population and the risks of each individual patient. For example, we would consider screening children who are obese; Hispanic or Asian; have multiple features of the metabolic syndrome; and/or those who have a family history of NAFLD. Further, we recommend screening children for NAFLD with serum liver enzymes only and not with ultrasonography.
Case Continued: Laboratory Results
ALT and GGT tests are ordered and the results are as follows:
What is the differential for children with suspected NAFLD?
Autoimmune Hepatitis (AIH)
AIH is a progressive necro-inflammatory disorder of the liver characterized by elevated aminotransferases, positive autoantibodies, and distinctive histologic features. AIH is believed to occur in genetically predisposed patients in response to an environmental trigger. There is a female predominance and it can present in any age or ethnic group.
AIH is divided in 2 subtypes. Type 1 disease is characterized by a positive antinuclear (ANA) antibody and anti-smooth muscle antibody. More commonly, it presents in adolescence with an indolent course—many patients are asymptomatic until they develop features of cirrhosis and portal hypertension. Conversely, type 2 AIH is characterized by a positive liver kidney microsomal (LKM) antibody and tends to present acutely in young children. It is important to note that antibody titers can be falsely positive in a significant percentage of patients and, in such cases, are often mildly elevated [38]. We strongly suggest children with positive autoantibody titers be evaluated by a specialist.
Treatment should be started promptly to avoid progression to cirrhosis and should also done so in consultation with a pediatric gastroenterologist or hepatologist. The prognosis of AIH with immunosuppression is favorable, with long-term remission rates of approximately 80%. Transplantation is typically required in the remaining 10% to 20% [39].
Celiac Disease
Celiac disease is an autoimmune, inflammatory enteropathy caused by exposure to gluten in genetically susceptible individuals. Up to a third of all children presenting with celiac will have an elevated serum ALT [40]. Additional symptoms/features are both variable and nonspecific: abdominal pain, poor growth, diarrhea, or constipation, among others. Celiac is diagnosed by duodenal biopsy or a sufficiently elevated tissue transglutaminase antibody level [41]. Treatment with a strict gluten-free diet will resolve the enteropathy and normalize the serum aminotransferases.
Wilson’s Disease
Wilson’s disease is a metabolic disorder leading to copper deposition in the liver, brain, cornea, and kidneys. It is caused by an ATP7B gene mutation and inherited in an autosomal recessive fashion. Patients may present with asymptomatic liver disease, chronic hepatitis, acute liver failure, or with symptoms of portal hypertension. Neuropsychiatric symptoms may also be prominent. Screening tests include a serum ceruloplasmin and 24-hour urinary copper quantification. Because diagnosing Wilson’s disease can be challenging, however, further testing should occur in consultation with a pediatric gastroenterologist or hepatologist.
Viral Hepatitis
Chronic viral infections such as hepatitis B and C are still common etiologies of liver disease in the United States. However, universal vaccination and blood donor screening have reduced the risk of transmission; new antiviral agents will likely further decrease the prevalence and transmission risk over time. Acute viral hepatitis—cytomegalovirus, Epstein-Barr virus, hepatitis A, or hepatitis E—should also be considered in children who present with appropriate symptoms and an elevated ALT.
Drug-Induced
Drug-induced liver injury (DILI) can present with elevated serum aminotransferases (hepatocellular pattern), an elevated bilirubin (cholestatic pattern), or a mixed picture. Idiosyncratic DILI in children is commonly caused by antimicrobial or central nervous system agents and usually presents with a hepatocellular injury pattern. Substance abuse, including alcohol, is common and should also be investigated as the source of underlying liver disease.
Muscle Disease
Aspartate aminotransferase (AST) and ALT are present in hepatocytes, myocytes, and red blood cells, among other tissues. Thus, children with congenital myopathies or myositis can have elevated aminotransferases, typically with the AST higher than the ALT. In these patients, checking a creatine phosphokinase (CPK) level may lead to the correct diagnosis and limit unnecessary testing.
Other Metabolic Disorders
Myriad metabolic disorders present with liver disease and/or elevated serum aminotransferase levels. Individually, these conditions are rare but, collectively, are relatively common. Two of the more occult conditions—lysosomal acid lipase deficiency (LAL-D) and alpha-1 antitrypsin (A1A) deficiency—are discussed in further detail below.
LAL-D is an autosomal recessive disease resulting in the accumulation of cholesterol esters and triglycerides in lysosomes. Patients typically present with hepatomegaly and mildly elevated aminotransferases, an elevated LDL, low HDL cholesterol, and increased hepatic echogenicity on ultrasound. If a biopsy is obtained, microvesicular steatosis is predominant as opposed to macrovesicular steatosis found in NAFLD. The diagnosis of LAL-D can be made on a commercially available dry blood spot enzymatic assay or genetic testing and treatment has recently been FDA approved.
A1A deficiency is an autosomal recessive disease diagnosable by an alpha-1-antitrypsin phenotype. The clinical presentation is characterized by neonatal cholestasis in the infantile form and by hepatitis, cirrhosis and portal hypertension in older children. Classic symptoms of emphysema and chronic lung disease present in adulthood.
What further testing should be performed in children with suspected NAFLD?
For obese children with an elevated ALT or evidence of increased hepatic echogenicity, ESPGHAN recommends targeting the workup according to the child’s age [36]. According to their consensus statement, they recommend an upfront, thorough laboratory evaluation in children less than 10 years of age and consideration of a liver biopsy upon completion. For children over 10 years of age at low risk for NASH or fibrosis, additional laboratory evaluation is suggested 3 to 6 months after failed lifestyle interventions. In general, the recommended workup includes testing for conditions discussed in the section above such as viral hepatitis, AIH, Wilson’s disease, and others. If negative, ESPGHAN states that a liver biopsy should be “considered.”
The question of whether or not to obtain a liver biopsy is controversial, though there are several clear advantages to doing so. First, biopsy is the gold standard test for diagnosing NAFLD and there are no highly accurate, noninvasive tests currently approved for use in children. Second, biopsy is a more definitive means of ruling out competing diagnoses such as AIH. Third, biopsy may provide prognostic data. In a retrospective adult study of 136 patients, for example, those who presented with simple steatosis had a roughly 3% chance of progressing to cirrhosis within 10 years. If a patient within this cohort presented with NASH, however, the progression risk was approximately 30% within 5 years [42,43]. Fourth, due to potential side effects of medications, position papers recommend obtaining a liver biopsy prior to the initiation of pharmacotherapy [37]. Lastly, the risk for serious morbidity from a liver biopsy is low [44,45]. Alternatively, one must acknowledge the risks of liver biopsy: morbidity, sampling bias, invasiveness, cost, and sedation risks in children.
Case Continued: Biopsy Results
You refer your patients to a gastroenterologist. Tests for viral hepatitis, A1A deficiency, celiac disease, muscle disorders, Wilson’s disease, and AIH are negative. Ultimately, a liver biopsy is performed on all 3 children without complications. The results are presented below.
What is the treatment of NAFLD?
Lifestyle Modification
Lifestyle modifications are the mainstay of treatment for NAFLD. In adult studies, weight loss of more than 5% reduces hepatic steatosis whereas weight loss of more than 9% improves or eliminates NASH [47]. We recommend that children engage in age-appropriate, enjoyable, moderate- or vigorous-intensity aerobic activity for 60 minutes a day [48]. In addition, there should be a focus on reducing sedentary behavior by limiting screen time and a concerted effort to engage the family in lifestyle modifications.
Dietary interventions to treat NAFLD are less concrete but there is a growing body of literature to suggest that dietary fructose is particularly harmful. In adults, for example, fructose consumption is associated with the development of NAFLD [49] and hepatic fibrosis [50]. Recent data in adolescents has similarly documented an association between NAFLD incidence and energy-adjusted fructose intake [51]. It is worth highlighting that these clinical findings are also biologically plausible, as fructose is primarily metabolized within hepatocytes and has recently been shown to increase de novo lipogenesis [52,53]. In general, we suggest a well-balanced diet of unprocessed foods—that is, with limited added sugars—sufficient to induce gradual weight loss in older children or body weight maintenance in younger children.
Medications
Vitamin E is the only medication with proven efficacy in children, as demonstrated in the TONIC trial [20]. TONIC was a double-blind, multicenter, placebo-controlled study with 3 treatment arms: 800 IU of vitamin E daily, 1000 mg of metformin daily, or placebo. Metformin did not reduce the serum ALT or significantly improve liver histology and should therefore not be used for these indications. However, patients treated with vitamin E had a statistically significant improvement in the NAFLD activity score (a histologic grading system comprising steatosis, inflammation, and hepatocyte ballooning) and resolution of NASH when compared to placebo. For these reasons—as well as a paucity of other viable treatment options—vitamin E is routinely prescribed for children with biopsy-proven NASH. However, the long- term risks of high-dose vitamin E therapy in children are largely unknown.
Polyunsaturated fats such as docosahexaenoic acid (DHA) [54] and probiotics such as VSL #3 [55] have showed efficacy reducing hepatic steatosis in small, randomized clinical trials. Both medications need to be further validated before they can be recommended for use in children. Conversely, ursodeoxycholic acid has not been found to be efficacious in children with NAFLD [56], whereas phase IIb data on cysteamine is expected soon. There are currently insufficient data to recommend bariatric surgery as treatment for NAFLD in adolescence.
Case Continued: Follow-up
After their biopsies, both patients with NASH (patients A and B) are started on vitamin E therapy. All 3 patients continue to report for follow-up visits without short-term complications, though they have still been unable to significantly reduce their body mass index and have a persistently elevated serum ALT.
Summary
NAFLD is a common condition in the United States with serious personal and public health ramifications. This case-based review highlights the diagnostic and management challenges in children with NAFLD and the unique role primary care providers play in caring for these patients.
Corresponding author: Bryan Rudolph, MD, Albert Einstein College of Medicine, Division of Pediatric Gastroenterology and Nutrition, Children’s Hospital at Montefiore, 3415 Bainbridge Ave., Bronx, NY 10467, brudolph@montefiore.org.
Financial disclosures: None.
1. Schwimmer JB, Deutsch R, Kahen T, et al. Prevalence of fatty liver in children and adolescents. Pediatrics 2006;118:1388–93.
2. Welsh JA, Karpen S, Vos MB.Increasing prevalence of nonalcoholic fatty liver disease among United States adolescents, 1988-1994 to 2007-2010. J Pediatr 2013;162:496–500.
3. Vernon G, Baranova A, Younossi ZM. Systematic review: the epidemiology and natural history of non-alcoholic fatty liver disease and non-alcoholic steatohepatitis in adults. Aliment Pharmacol Ther 2011;34:274–85.
4. McPherson S, Hardy T, Henderson E, et al. Evidence of NAFLD progression from steatosis to fibrosing-steatohepatitis using paired biopsies: implications for prognosis and clinical management. J Hepatol 2015;62:1148–55.
5. Singh S, Allen AM, Wang Z, et al. Fibrosis progression in nonalcoholic fatty liver vs nonalcoholic steatohepatitis: a systematic review and meta-analysis of paired-biopsy studies. Clin Gastroenterol Hepatol 2015;13:643–54.
6. Pais R, Charlotte F, Fedchuk L, et al. A systematic review of follow-up biopsies reveals disease progression in patients with non-alcoholic fatty liver. J Hepatol 2013;59:550–6.
7. Feldstein AE, Charatcharoenwitthaya P, Treeprasertsuk S, et al. The natural history of non-alcoholic fatty liver disease in children: a follow-up study for up to 20 years. Gut 2009;58:1538–44.
8. Mummadi RR, Kasturi KS, Chennareddygari S, et al. Effect of bariatric surgery on nonalcoholic fatty liver disease: systematic review and meta-analysis. Clin Gastroenterol Hepatol 2008;6:1396–402.
9. Rashid M, Roberts EA. Nonalcoholic steatohepatitis in children. J Pediatr Gastroenterol Nutr 2000;30:48–53.
10. Schwimmer JB, Dunn W, Norman GJ, et al. SAFETY study: alanine aminotransferase cutoff values are set too high for reliable detection of pediatric chronic liver disease. Gastroenterology 2010;138:1357–64.
11. Prati D, Taioli E, Zanella A, et al. Updated definitions of healthy ranges for serum alanine aminotransferase levels. Ann Intern Med 2002;137:1–10.
12. Lee JK, Shim JH, Lee HC, et al. Estimation of the healthy upper limits for serum alanine aminotransferase in Asian populations with normal liver histology. Hepatology 2010;51:1577–83.
13. Kang HS, Um SH, Seo YS, et al. Healthy range for serum ALT and the clinical significance of "unhealthy" normal ALT levels in the Korean population. J Gastroenterol Hepatol 2011;26:292–9.
14. Zheng MH, Shi KQ, Fan YC, et al. Upper limits of normal for serum alanine aminotransferase levels in Chinese Han population. PLoS One 2012;7:e43736.
15. Molleston JP, Schwimmer JB, Yates KP, et al. Histological abnormalities in children with nonalcoholic fatty liver disease and normal or mildly elevated alanine aminotransferase levels. J Pediatr 2014;164:707–13.
16. Dasarathy S, Dasarathy J, Khiyami A, et al. Validity of real time ultrasound in the diagnosis of hepatic steatosis: a prospective study. J Hepatol 2009;51:1061–7.
17. Nobili V, M. Pinzani M. Paediatric non-alcoholic fatty liver disease. Gut 2010;59:561–4.
18. Rudolph B, Rivas Y, Kulak S, et al. Yield of diagnostic tests in obese children with an elevated alanine aminotransferase. Acta Paediatr 2015;104:e557–63.
19. Nobili V, Manco M, Ciampalini P, et al. Metformin use in children with nonalcoholic fatty liver disease: an open-label, 24-month, observational pilot study. Clin Ther 2008;30:1168–76.
20. Lavine JE, Schwimmer JB, Van Natta ML, et al. Effect of vitamin E or metformin for treatment of nonalcoholic fatty liver disease in children and adolescents: the TONIC randomized controlled trial. JAMA 2011;305:1659–68.
21. Krawczyk MP, Portincasa P, Lammert F. PNPLA3-associated steatohepatitis: toward a gene-based classification of fatty liver disease. Semin Liver Dis 2013;33:369–79.
22. Romeo S, Kozlitina J, Xing C, et al. Genetic variation in PNPLA3 confers susceptibility to nonalcoholic fatty liver disease. Nat Genet 2008;40:1461–5.
23. Patton HM, Yates K, Unalp-Arida A, et al. Association between metabolic syndrome and liver histology among children with nonalcoholic fatty liver disease. Am J Gastroenterol 2010;105:2093–102.
24. Kistler KD, Molleston J, Unalp A, et al., Symptoms and quality of life in obese children and adolescents with non-alcoholic fatty liver disease. Aliment Pharmacol Ther 2010;31:396–406.
25. Kerkar N, D'Urso C, Van Nostrand K, et al. Psychosocial outcomes for children with nonalcoholic fatty liver disease over time and compared with obese controls. J Pediatr Gastroenterol Nutr 2013;56:77–82.
26. Sundaram SS, Sokol RJ, Capocelli KE, et al. Obstructive sleep apnea and hypoxemia are associated with advanced liver histology in pediatric nonalcoholic fatty liver disease. J Pediatr 2014;164:699–706.
27. Nobili V, Cutrera R, Liccardo D, et al. Obstructive sleep apnea syndrome affects liver histology and inflammatory cell activation in pediatric nonalcoholic fatty liver disease, regardless of obesity/insulin resistance. Am J Respir Crit Care Med 2014;189:66–76.
28. Patton HM, Lavine JE, Van Natta ML, et al., Clinical correlates of histopathology in pediatric nonalcoholic steatohepatitis. Gastroenterology 2008;135:1961–71.
29. Schwimmer JB, Behling C, Newbury R, et al. Histopathology of pediatric nonalcoholic fatty liver disease. Hepatology 2005;42:641–9.
30. Nobili V, Parkes J, Bottazzo G, et al. Performance of ELF serum markers in predicting fibrosis stage in pediatric non-alcoholic fatty liver disease. Gastroenterology 2009;136:160–7.
31. Yang HR, Kim HR, Kim MJ, et al. Noninvasive parameters and hepatic fibrosis scores in children with nonalcoholic fatty liver disease. World J Gastroenterol 2012;18:1525–30.
32. Puri K, Nobili V, Melville K, et al. Serum bilirubin level is inversely associated with nonalcoholic steatohepatitis in children. J Pediatr Gastroenterol Nutr 2013;57:114–8.
33. Tabbaa A, Shaker M, Lopez R, et al. Low serum potassium levels associated with disease severity in children with nonalcoholic fatty liver disease. Pediatr Gastroenterol Hepatol Nutr 2015;18:168–74.
34. Nobili V, Siotto M, Bedogni G, et al. Levels of serum ceruloplasmin associate with pediatric nonalcoholic fatty liver disease. J Pediatr Gastroenterol Nutr 2013;56:370–5.
35. Barlow SE; Expert Committee. Expert committee recommendations regarding the prevention, assessment, and treatment of child and adolescent overweight and obesity: summary report. Pediatrics 2007;120 Suppl 4:S164–92.
36. Vajro P, Lenta S, Socha P, et al. Diagnosis of nonalcoholic fatty liver disease in children and adolescents: position paper of the ESPGHAN Hepatology Committee. J Pediatr Gastroenterol Nutr 2012;54:700–13.
37. Chalasani N, Younossi Z, Lavine JE, et al. The diagnosis and management of non-alcoholic fatty liver disease: practice guideline by the American Gastroenterological Association, American Association for the Study of Liver Diseases, and American College of Gastroenterology. Gastroenterology 2012;142:1592–609.
38. Vuppalanchi R, Gould RJ, Wilson LA, et al. Clinical significance of serum autoantibodies in patients with NAFLD: results from the nonalcoholic steatohepatitis clinical research network. Hepatol Int 2012;6:379–85.
39. Floreani A, Liberal R, Vergani D, et al. Autoimmune hepatitis: contrasts and comparisons in children and adults - a comprehensive review. J Autoimmun 2013;46:7–16.
40. Vajro P, Paolella G, Maggiore G, et al. Pediatric celiac disease, cryptogenic hypertransaminasemia, and autoimmune hepatitis. J Pediatr Gastroenterol Nutr 2013;56:663–70.
41. Husby S, Koletzko S, Korponay-Szabó IR, et al. European Society for Pediatric Gastroenterology, Hepatology, and Nutrition guidelines for the diagnosis of coeliac disease. J Pediatr Gastroenterol Nutr 2012;54:136–60.
42. Matteoni CA, Younossi ZM, Gramlich T, et al. Nonalcoholic fatty liver disease: a spectrum of clinical and pathological severity. Gastroenterology 1999;116:1413–9.
43. McCullough AJ. The clinical features, diagnosis and natural history of nonalcoholic fatty liver disease. Clin Liver Dis 2004;8:521–33.
44. Ovchinsky N, Moreira RK, Lefkowitch JH, Lavine JE. Liver biopsy in modern clinical practice: a pediatric point-of-view. Adv Anat Pathol 2012;19:250–62.
45. Dezsőfi A, Baumann U, Dhawan A, et al. Liver biopsy in children: position paper of the ESPGHAN Hepatology Committee. J Pediatr Gastroenterol Nutr 2015;60:408–20.
46. Fusillo S, Rudolph B. Nonalcoholic fatty liver disease. Pediatr Rev 2015;36:198–205.
47. Harrison SA, Fecht W, Brunt EM, Neuschwander-Tetri BA. Orlistat for overweight subjects with nonalcoholic steatohepatitis: A randomized, prospective trial. Hepatology 2009;49:80–6.
48. School health guidelines to promote healthy eating and physical activity. MMWR Recomm Rep 2011;60(Rr-5):1–76.
49. Ouyang X, Cirillo P, Sautin Y, et al. Fructose consumption as a risk factor for non-alcoholic fatty liver disease. J Hepatol 2008;48:993–9.
50. Abdelmalek MF, Suzuki A, Guy C, et al. Increased fructose consumption is associated with fibrosis severity in patients with nonalcoholic fatty liver disease. Hepatology 2010;51:1961–71.
51. O’Sullivan TA, Oddy WH, Bremner AP, et al. Lower fructose intake may help protect against development of nonalcoholic fatty liver in adolescents with obesity. J Pediatr Gastroenterol Nutr 2014;58:624–31.
52. Parks EJ, Skokan LE, Timlin MT, Dingfelder CS. Dietary sugars stimulate fatty acid synthesis in adults. J Nutr 2008;138:1039–46.
53. Stanhope KL, Schwarz JM, Keim NL, et al. Consuming fructose-sweetened, not glucose-sweetened, beverages increases visceral adiposity and lipids and decreases insulin sensitivity in overweight/obese humans. J Clin Invest 2009;119:1322–34.
54. Nobili V, Alisi A, Della Corte C, et al., Docosahexaenoic acid for the treatment of fatty liver: randomised controlled trial in children. Nutr Metab Cardiovasc Dis 2013;23:1066–70.
55. Alisi A, Bedogni G, Baviera G, et al. Randomised clinical trial: The beneficial effects of VSL#3 in obese children with non-alcoholic steatohepatitis. Aliment Pharmacol Ther 2014;39:1276–85.
56. Vajro P, Franzese A, Valerio G, et al. Lack of efficacy of ursodeoxycholic acid for the treatment of liver abnormalities in obese children. J Pediatr 2000;136:739–43.
Attitudes Surrounding Continuous Telemetry Utilization by Providers at an Academic Tertiary Medical Center
From the Johns Hopkins Bayview Medical Center, Baltimore, MD (Drs. Johnson, Knight, Maygers, and Zakaria), and Duke University Hospital, Durham, NC (Dr. Mock).
Abstract
- Objective: To determine patterns of telemetry use at a tertiary academic institution and identify factors contributing to noncompliance with guidelines regarding telemetry use.
- Methods: Web-based survey of 180 providers, including internal medicine residents and cardiovascular disease fellows, hospitalists, non-hospitalist teaching attending physicians, nurse practitioners, and physician assistants.
- Results: Of the 180 providers surveyed, 67 (37%) replied. Most providers (76%) were unaware of guidelines regarding appropriate telemetry use and 85% selected inappropriate diagnoses as warranting telemetry. Only 21% routinely discontinued the telemetry order within 48 hours.
- Conclusions: Many providers at a tertiary academic institution utilize continuous telemetry inappropriately and are unaware of telemetry guidelines. These findings should guide interventions to improve telemetry utilization.
For many decades, telemetry has been widely used in the management and monitoring of patients with possible acute coronary syndromes (ACS), arrhythmias, cardiac events, and strokes [1]. In addition, telemetry has often been used in other clinical scenarios with less rigorous data supporting its use [2–4]. As a result, in 2004 the American Heart Association (AHA) issued guidelines providing recommendations for best practices in hospital ECG monitoring. Indications for telemetry were classified into 3 diagnosis-driven groups: class I (indicated in all patients), class II (indicated in most patients, may be of benefit) and class III (not indicated, no therapeutic benefit) [2]. However, these recommendations have not been widely followed and telemetry is inappropriately used for many inpatients [5,6].
There are several reasons why clinicians fail to adhere to guidelines, including knowledge deficits, attitudes regarding the current guidelines, and institution-specific factors influencing practitioner behaviors [7]. In response to reports of widespread telemetry overuse, the Choosing Wisely Campaign of the American Board of Internal Medicine Foundation has championed judicious telemetry use, advocating evidence-based, protocol-driven telemetry management for patients not in intensive care units who do not meet guideline-based criteria for continuous telemetry [8].
In order to understand patterns of telemetry use at our academic institution and identify factors associated with this practice, we systematically analyzed telemetry use perceptions through provider surveys. We hypothesized that providers have misperceptions about appropriate use of telemetry and that this knowledge gap results in overuse of telemetry at our institution.
Methods
Setting
Johns Hopkins Bayview Medical Center is a 400-bed academic medical center serving southeastern Baltimore. Providers included internal medicine residents and cardiovascular disease fellows who rotate to the medical center and Johns Hopkins Hospital, hospitalists, non-hospitalist teaching attending physicians, nurse practitioners (NPs), and physician assistants (PAs).
Current Telemetry Practice
Remote telemetric monitoring is available in all adult, non-intensive care units of the hospital except for the psychiatry unit. However, the number of monitors are limited and it is not possible to monitor every patient if the wards are at capacity. Obstetrics uses its own unique cardiac monitoring system and thus was not included in the survey. Each monitor (IntelliVue, Philips Healthcare, Amsterdam, Netherlands) is attached to the patient using 5 lead wires, with electrocardiographic data transmitted to a monitoring station based in the progressive care unit, a cardio-pulmonary step-down unit. Monitors can be ordered in one of 3 manners, as mandated by hospital policy:
- Continuous telemetry – Telemetry monitoring is uninterrupted until discontinued by a provider.
- Telemetry protocol – Within 12 hours of telemetry placement, a monitor technician generates a report, which is reviewed by the nurse caring for the patient. The nurse performs an electrocardiogram (ECG) if the patient meets pre-specified criteria for telemetry discontinuation, which includes the absence of arrhythmias, troponin elevations, chest pain, or hemodynamic instability. The repeat ECG is then read and signed by the provider. After these criteria are met, telemetry can be discontinued.
- Stroke telemetry protocol – Telemetry is applied for 48 hours, mainly for detection of paroxysmal atrial fibrillation. Monitoring can be temporarily discontinued if the patient requires magnetic resonance imaging, which interferes with the telemetric monitors.
When entering any of the 3 possible telemetry orders in our computerized provider order entry system (Meditech, Westwood, MA), the ordering provider is required to indicate baseline rhythm, pacemaker presence, and desired heart rate warning parameters. Once the order is electronically signed, a monitor technician notes the order in a logbook and assigns the patient a telemeter, which is applied by the patient’s nurse.
If a monitored patient develops any predefined abnormal rhythm, audible alerts notify monitor technicians and an alert is sent to a portable telephone carried by the patient’s assigned nurse. Either the monitoring technician or the nurse then has the discretion to silence the alarm, note it in the chart, and/or contact the patient’s provider. If alerts are recorded, then a sample telemetry monitoring strip is saved into the patient’s paper medical chart.
Survey Instrument
After approval from the Johns Hopkins institutional review board, we queried providers who worked on the medicine and cardiology wards to assess the context and culture in which telemetry monitoring is used (see Appendix). The study was exempt from requiring informed consent. All staff had the option to decline study participation. We administered the survey using an online survey software program (SurveyMonkey, Palo Alto, CA), sending survey links via email to all internal medicine residents, cardiovascular disease fellows, internal medicine and cardiology teaching attending physicians, hospitalists, NPs, and PAs. Respondents completed the survey anonymously. To increase response rates, providers were sent a monthly reminder email. The survey was open from March 2014 to May 2014 for a total of 3 months.
Analysis
The survey data were compiled and analyzed using Microsoft Excel (Mac version 14.4; Microsoft, Redmond, WA). Variables are displayed as numbers and percentages, as appropriate.
Results
All providers reported having ordered telemetry, but almost all were either unaware of (76%) or only somewhat familiar with (21%) the AHA guidelines for appropriate telemetry use. Notably, the vast majority of fellows and residents reported that they were not at all familiar with the guidelines (100% and 96%, respectively). When asked why providers do not adhere to telemetry guidelines, lack of awareness of and lack of familiarity with the guidelines were the top 2 choices among respondents (Figure 1). 
Additionally, most providers acknowledged experiencing adverse effects of telemetry: 86% (57/66) had experienced delayed patient transfers from the emergency department to inpatient floors due to telemetry unavailability and 97% (65/67) had experienced some delay in obtaining tests or studies for their telemetry-monitored patients. Despite acknowledging the potential consequences of telemetry use, only 21% (14/66) of providers routinely (ie, > 75% of the time) discontinued telemetry within 48 hours. Fifteen percent (10/65) routinely allowed telemetry to continue until the time of patient discharge. When discontinued, it was mainly due to the provider’s decision (57%); however, respondents noted that nurses prompted telemetry discontinuation 28% of the time.
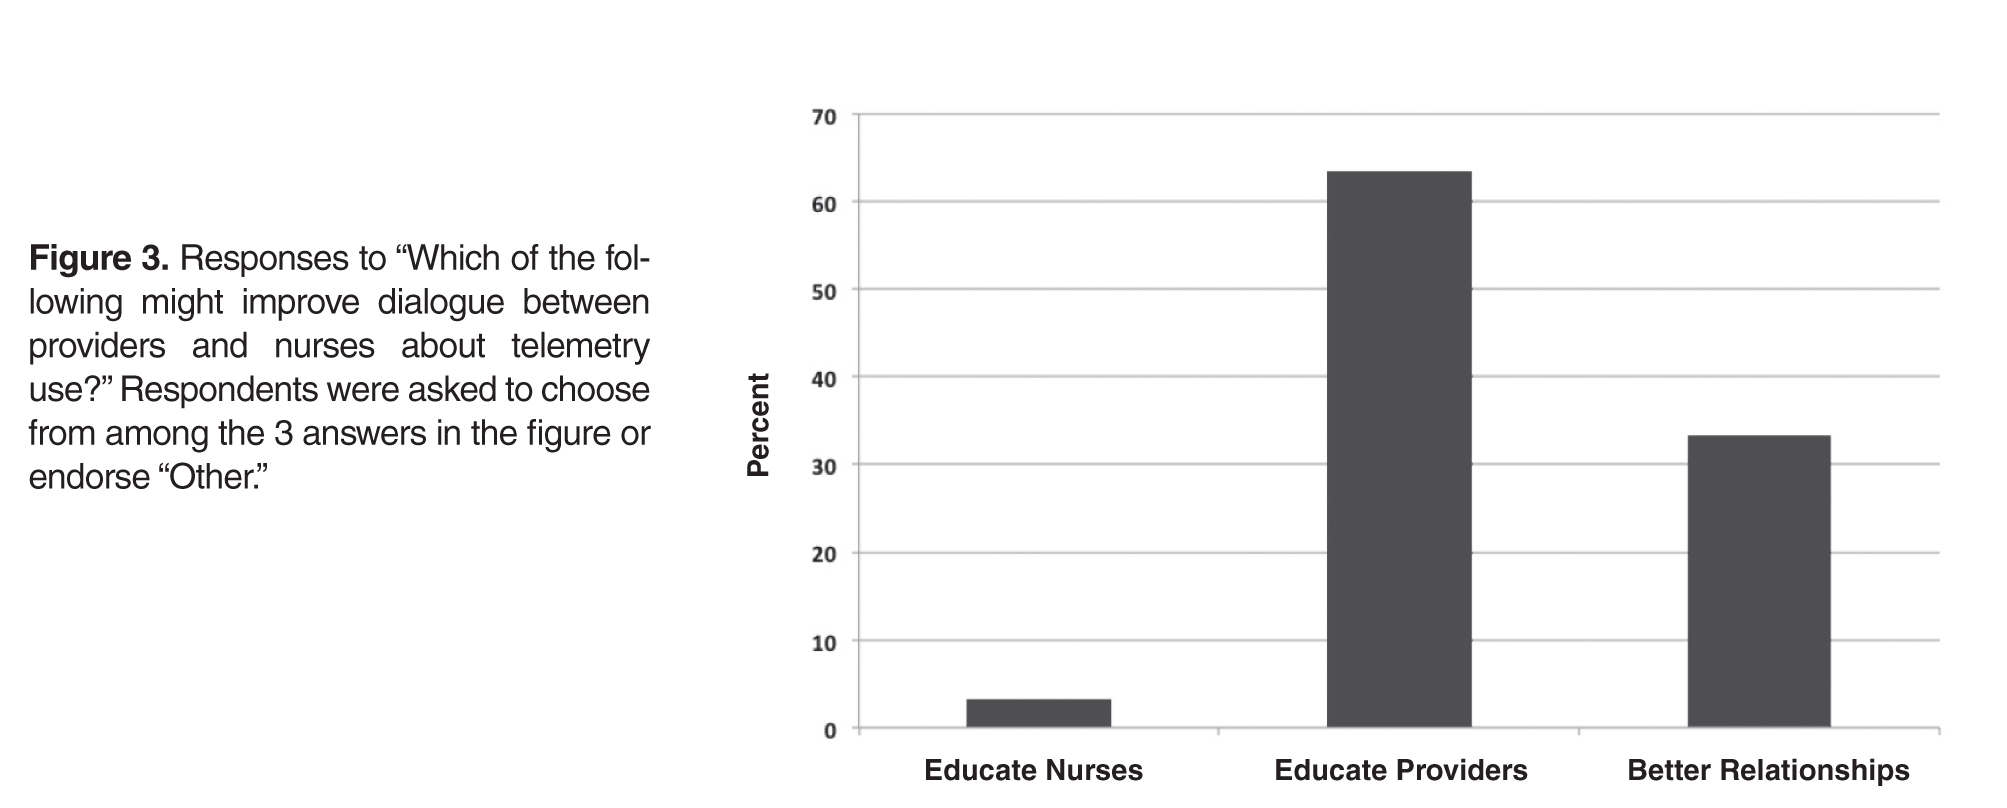
Discussion
Consistent with previous studies [3–5,9–15], the majority of providers at our institution do not think continuous telemetry is appropriately utilized. Most survey respondents acknowledged a lack of awareness surrounding current guideline recommendations, which could explain why providers often do not follow them. Despite conceding their knowledge deficits, providers assumed their practice patterns for ordering telemetry were “appropriate”(ie, guideline-supported). This assertion may be incorrect as the majority of providers in our survey chose at least 1 non–guideline-supported indication for telemetry. Other studies have suggested additional reasons for inappropriate telemetry utilization. Providers may disagree with guideline recommendations, may assign lesser importance to guidelines when caring for an individual patient, or may fall victim to inertia (ie, not ordering telemetry appropriately simply because changing one’s practice pattern is difficult) [7].
In addition, the majority of our providers perceived telemetry overuse, which has been well-recognized nationwide [4]. While we did not assess this directly, other studies suggest that providers may overuse telemetry to provide a sense of reassurance when caring for a sick patient, since continuous telemetry is perceived to provide a higher level of care [6,15–17]. Unfortunately, no study has shown a benefit for continuous telemetry when placed for non-guideline-based diagnoses—whether for cardiac or non-cardiac diagnoses [3,9–11,13,14]. Likewise, the guidelines suggest that telemetry use should be time-limited, since the majority of benefit is accrued in the first 48 hours. Beyond that time, no study has shown a clear benefit to continuous telemetry [2]. Therefore, telemetry overuse may lead to unnecessarily increased costs without added benefits [3,9–11,13–15,18].
Our conclusions are tempered by the nature of our survey data. We recognize that our survey has not been previously validated. In addition, our response rates were low. This low sample size may lead to under-representation of diverse ideas. Also, our survey results may not be generalizable, since our study was conducted at a single academic hospital. Our institution’s telemetry ordering culture may differ from others, therefore making our results less applicable to other centers.
Despite these limitations, our results aid in understanding attitudes that surround the use of continuous telemetry, which can shape formal educational interventions to encourage appropriate guideline-based telemetry use. Since our providers agree on the need for more education about the guidelines, components such as online modules or in-person lecture educational sessions, newsletters, email communications, and incorporation of AHA guidelines into the institution’s automated computer order entry system could be utilized [17]. Didactic interventions could be designed especially for trainees given their overall lack of familiarity with the guidelines. Another potential intervention could include supplying providers with publically shared personalized measures of their own practices, since providers benefit from reinforcement and individualized feedback on appropriate utilization practices [19]. Previous studies have suggested that a multidisciplinary approach to patient care leads to positive outcomes [20,21], and in our experience, nursing input is absolutely critical in outlining potential problems and in developing solutions. Our findings suggest that nurses could play an active role in alerting providers when patients have telemetry in use and identifying patients who may no longer need it.
In summary, we have shown that many providers at a tertiary academic institution utilized continuous telemetry inappropriately, and were unaware of guidelines surrounding telemetry use. Future interventions aimed at educating providers, encouraging dialogue between staff, and enabling guideline-supported utilization may increase appropriate telemetry use leading to lower cost and improved quality of patient care.
Acknowledgment: The authors wish to thank Dr. Colleen Christmas, Dr. Panagis Galiatsatos, Mrs. Barbara Brigade, Ms. Joetta Love, Ms. Terri Rigsby, and Mrs. Lisa Shirk for their invaluable technical and administrative support.
Corresponding author: Amber Johnson, MD, MBA, 200 Lothrop St., S-553 Scaife Hall, Pittsburgh, PA 15213, amberjohn@gmail.com.
Financial disclosures: None.
1. Day H. Preliminary studies of an acute coronary care area. J Lancet 1963;83:53–5.
2. Drew B, Califf R, Funk M, et al. Practice standards for electrocardiographic monitoring in hospital settings: an American Heart Association scientific statement from the Councils on Cardiovascular Nursing, Clinical Cardiology, and Cardiovascular Disease in the Young: Endorsed by the International Society of Computerized Electrocardiology and the American Association of Critical-Care Nurses. Circulation 2004;110:2721–46.
3. Estrada C, Battilana G, Alexander M, et al. Evaluation of guidelines for the use of telemetry in the non-intensive-care setting. J Gen Intern Med 2000;15:51–5.
4. Henriques-Forsythe M, Ivonye C, Jamched U, et al. Is telemetry overused? Is it as helpful as thought? Cleve Clin J Med 2009;76:368–72.
5. Chen E, Hollander, J. When do patients need admission to a telemetry bed? J Emerg Med 2007;33:53–60.
6. Najafi N, Auerbach A. Use and outcomes of telemetry monitoring on a medicine service. Arch Intern Med 2012;172:1349–50.
7. Cabana M, Rand C, Powe N, et al. Why don't physicians follow clinical practice guidelines?: A framework for improvement. JAMA 1999;282:1458–65.
8. Adult hospital medicine. Five things physicians and patients should question. 15 Aug 2013. Available at www.choosingwisely.org/doctor-patient-lists/society-of-hospital-medicine-adult-hospital-medicine/
9. Durairaj L, Reilly B, Das K, et al. Emergency department admissions to inpatient cardiac telemetry beds: A prospective cohort study of risk stratification and outcomes. Am J Med 2001;110:7–11.
10. Estrada C, Rosman H, Prasad N, et al. Role of telemetry monitoring in the non-intensive care unit. Am J Cardiol 1995;76:960–5.
11. Hollander J, Sites F, Pollack C, Shofer F. Lack of utility of telemetry monitoring for identification of cardiac death and life-threatening ventricular dysrhythmias in low-risk patients with chest pain. Ann Emerg Med 2004;43:71–6.
12. Ivonye C, Ohuabunwo C, Henriques-Forsythe M, et al. Evaluation of telemetry utilization, policy, and outcomes in an inner-city academic medical center. J Natl Med Assoc 2010;102:598–604.
13. Schull M, Redelmeier D. Continuous electrocardiographic monitoring and cardiac arrest outcomes in 8,932 telemetry ward patients. Acad Emerg Med 2000;7:647–52.
14. Sivaram C, Summers J, Ahmed N. Telemetry outside critical care units: patterns of utilization and influence on management decisions. Clin Cardiol 1998;21:503–5.
15. Snider A, Papaleo M, Beldner S, et al. Is telemetry monitoring necessary in low-risk suspected acute chest pain syndromes? Chest 2002;122:517–23.
16. Chen S, Zakaria S. Behind the monitor-The trouble with telemetry: a teachable moment. JAMA Intern Med 2015;175:894.
17. Dressler R, Dryer M, Coletti C, et al. Altering overuse of cardiac telemetry in non-intensive care unit settings by hardwiring the use of American Heart Association guidelines. JAMA Intern Med 2014;174:1852–4.
18. Benjamin E, Klugman R, Luckmann R, et al. Impact of cardiac telemetry on patient safety and cost. Am J Manag Care 2013;19:e225–32.
19. Solomon D, Hashimoto H, Daltroy L, Liang M. Techniques to improve physicians use of diagnostic tests: A new conceptual framework. JAMA 1998;280:2020–7.
20. Richeson J, Johnson J. The association between interdisciplinary collaboration and patient outcomes in a medical intensive care unit. Heart Lung 1992;21:18–24.
21. Curley C, McEachern J, Speroff T. A firm trial of interdisciplinary rounds on the inpatient medical wards: an intervention designed using continuous quality improvement. Med Care 1998;36:AS4–12.
From the Johns Hopkins Bayview Medical Center, Baltimore, MD (Drs. Johnson, Knight, Maygers, and Zakaria), and Duke University Hospital, Durham, NC (Dr. Mock).
Abstract
- Objective: To determine patterns of telemetry use at a tertiary academic institution and identify factors contributing to noncompliance with guidelines regarding telemetry use.
- Methods: Web-based survey of 180 providers, including internal medicine residents and cardiovascular disease fellows, hospitalists, non-hospitalist teaching attending physicians, nurse practitioners, and physician assistants.
- Results: Of the 180 providers surveyed, 67 (37%) replied. Most providers (76%) were unaware of guidelines regarding appropriate telemetry use and 85% selected inappropriate diagnoses as warranting telemetry. Only 21% routinely discontinued the telemetry order within 48 hours.
- Conclusions: Many providers at a tertiary academic institution utilize continuous telemetry inappropriately and are unaware of telemetry guidelines. These findings should guide interventions to improve telemetry utilization.
For many decades, telemetry has been widely used in the management and monitoring of patients with possible acute coronary syndromes (ACS), arrhythmias, cardiac events, and strokes [1]. In addition, telemetry has often been used in other clinical scenarios with less rigorous data supporting its use [2–4]. As a result, in 2004 the American Heart Association (AHA) issued guidelines providing recommendations for best practices in hospital ECG monitoring. Indications for telemetry were classified into 3 diagnosis-driven groups: class I (indicated in all patients), class II (indicated in most patients, may be of benefit) and class III (not indicated, no therapeutic benefit) [2]. However, these recommendations have not been widely followed and telemetry is inappropriately used for many inpatients [5,6].
There are several reasons why clinicians fail to adhere to guidelines, including knowledge deficits, attitudes regarding the current guidelines, and institution-specific factors influencing practitioner behaviors [7]. In response to reports of widespread telemetry overuse, the Choosing Wisely Campaign of the American Board of Internal Medicine Foundation has championed judicious telemetry use, advocating evidence-based, protocol-driven telemetry management for patients not in intensive care units who do not meet guideline-based criteria for continuous telemetry [8].
In order to understand patterns of telemetry use at our academic institution and identify factors associated with this practice, we systematically analyzed telemetry use perceptions through provider surveys. We hypothesized that providers have misperceptions about appropriate use of telemetry and that this knowledge gap results in overuse of telemetry at our institution.
Methods
Setting
Johns Hopkins Bayview Medical Center is a 400-bed academic medical center serving southeastern Baltimore. Providers included internal medicine residents and cardiovascular disease fellows who rotate to the medical center and Johns Hopkins Hospital, hospitalists, non-hospitalist teaching attending physicians, nurse practitioners (NPs), and physician assistants (PAs).
Current Telemetry Practice
Remote telemetric monitoring is available in all adult, non-intensive care units of the hospital except for the psychiatry unit. However, the number of monitors are limited and it is not possible to monitor every patient if the wards are at capacity. Obstetrics uses its own unique cardiac monitoring system and thus was not included in the survey. Each monitor (IntelliVue, Philips Healthcare, Amsterdam, Netherlands) is attached to the patient using 5 lead wires, with electrocardiographic data transmitted to a monitoring station based in the progressive care unit, a cardio-pulmonary step-down unit. Monitors can be ordered in one of 3 manners, as mandated by hospital policy:
- Continuous telemetry – Telemetry monitoring is uninterrupted until discontinued by a provider.
- Telemetry protocol – Within 12 hours of telemetry placement, a monitor technician generates a report, which is reviewed by the nurse caring for the patient. The nurse performs an electrocardiogram (ECG) if the patient meets pre-specified criteria for telemetry discontinuation, which includes the absence of arrhythmias, troponin elevations, chest pain, or hemodynamic instability. The repeat ECG is then read and signed by the provider. After these criteria are met, telemetry can be discontinued.
- Stroke telemetry protocol – Telemetry is applied for 48 hours, mainly for detection of paroxysmal atrial fibrillation. Monitoring can be temporarily discontinued if the patient requires magnetic resonance imaging, which interferes with the telemetric monitors.
When entering any of the 3 possible telemetry orders in our computerized provider order entry system (Meditech, Westwood, MA), the ordering provider is required to indicate baseline rhythm, pacemaker presence, and desired heart rate warning parameters. Once the order is electronically signed, a monitor technician notes the order in a logbook and assigns the patient a telemeter, which is applied by the patient’s nurse.
If a monitored patient develops any predefined abnormal rhythm, audible alerts notify monitor technicians and an alert is sent to a portable telephone carried by the patient’s assigned nurse. Either the monitoring technician or the nurse then has the discretion to silence the alarm, note it in the chart, and/or contact the patient’s provider. If alerts are recorded, then a sample telemetry monitoring strip is saved into the patient’s paper medical chart.
Survey Instrument
After approval from the Johns Hopkins institutional review board, we queried providers who worked on the medicine and cardiology wards to assess the context and culture in which telemetry monitoring is used (see Appendix). The study was exempt from requiring informed consent. All staff had the option to decline study participation. We administered the survey using an online survey software program (SurveyMonkey, Palo Alto, CA), sending survey links via email to all internal medicine residents, cardiovascular disease fellows, internal medicine and cardiology teaching attending physicians, hospitalists, NPs, and PAs. Respondents completed the survey anonymously. To increase response rates, providers were sent a monthly reminder email. The survey was open from March 2014 to May 2014 for a total of 3 months.
Analysis
The survey data were compiled and analyzed using Microsoft Excel (Mac version 14.4; Microsoft, Redmond, WA). Variables are displayed as numbers and percentages, as appropriate.
Results
All providers reported having ordered telemetry, but almost all were either unaware of (76%) or only somewhat familiar with (21%) the AHA guidelines for appropriate telemetry use. Notably, the vast majority of fellows and residents reported that they were not at all familiar with the guidelines (100% and 96%, respectively). When asked why providers do not adhere to telemetry guidelines, lack of awareness of and lack of familiarity with the guidelines were the top 2 choices among respondents (Figure 1).
Additionally, most providers acknowledged experiencing adverse effects of telemetry: 86% (57/66) had experienced delayed patient transfers from the emergency department to inpatient floors due to telemetry unavailability and 97% (65/67) had experienced some delay in obtaining tests or studies for their telemetry-monitored patients. Despite acknowledging the potential consequences of telemetry use, only 21% (14/66) of providers routinely (ie, > 75% of the time) discontinued telemetry within 48 hours. Fifteen percent (10/65) routinely allowed telemetry to continue until the time of patient discharge. When discontinued, it was mainly due to the provider’s decision (57%); however, respondents noted that nurses prompted telemetry discontinuation 28% of the time.
Discussion
Consistent with previous studies [3–5,9–15], the majority of providers at our institution do not think continuous telemetry is appropriately utilized. Most survey respondents acknowledged a lack of awareness surrounding current guideline recommendations, which could explain why providers often do not follow them. Despite conceding their knowledge deficits, providers assumed their practice patterns for ordering telemetry were “appropriate”(ie, guideline-supported). This assertion may be incorrect as the majority of providers in our survey chose at least 1 non–guideline-supported indication for telemetry. Other studies have suggested additional reasons for inappropriate telemetry utilization. Providers may disagree with guideline recommendations, may assign lesser importance to guidelines when caring for an individual patient, or may fall victim to inertia (ie, not ordering telemetry appropriately simply because changing one’s practice pattern is difficult) [7].
In addition, the majority of our providers perceived telemetry overuse, which has been well-recognized nationwide [4]. While we did not assess this directly, other studies suggest that providers may overuse telemetry to provide a sense of reassurance when caring for a sick patient, since continuous telemetry is perceived to provide a higher level of care [6,15–17]. Unfortunately, no study has shown a benefit for continuous telemetry when placed for non-guideline-based diagnoses—whether for cardiac or non-cardiac diagnoses [3,9–11,13,14]. Likewise, the guidelines suggest that telemetry use should be time-limited, since the majority of benefit is accrued in the first 48 hours. Beyond that time, no study has shown a clear benefit to continuous telemetry [2]. Therefore, telemetry overuse may lead to unnecessarily increased costs without added benefits [3,9–11,13–15,18].
Our conclusions are tempered by the nature of our survey data. We recognize that our survey has not been previously validated. In addition, our response rates were low. This low sample size may lead to under-representation of diverse ideas. Also, our survey results may not be generalizable, since our study was conducted at a single academic hospital. Our institution’s telemetry ordering culture may differ from others, therefore making our results less applicable to other centers.
Despite these limitations, our results aid in understanding attitudes that surround the use of continuous telemetry, which can shape formal educational interventions to encourage appropriate guideline-based telemetry use. Since our providers agree on the need for more education about the guidelines, components such as online modules or in-person lecture educational sessions, newsletters, email communications, and incorporation of AHA guidelines into the institution’s automated computer order entry system could be utilized [17]. Didactic interventions could be designed especially for trainees given their overall lack of familiarity with the guidelines. Another potential intervention could include supplying providers with publically shared personalized measures of their own practices, since providers benefit from reinforcement and individualized feedback on appropriate utilization practices [19]. Previous studies have suggested that a multidisciplinary approach to patient care leads to positive outcomes [20,21], and in our experience, nursing input is absolutely critical in outlining potential problems and in developing solutions. Our findings suggest that nurses could play an active role in alerting providers when patients have telemetry in use and identifying patients who may no longer need it.
In summary, we have shown that many providers at a tertiary academic institution utilized continuous telemetry inappropriately, and were unaware of guidelines surrounding telemetry use. Future interventions aimed at educating providers, encouraging dialogue between staff, and enabling guideline-supported utilization may increase appropriate telemetry use leading to lower cost and improved quality of patient care.
Acknowledgment: The authors wish to thank Dr. Colleen Christmas, Dr. Panagis Galiatsatos, Mrs. Barbara Brigade, Ms. Joetta Love, Ms. Terri Rigsby, and Mrs. Lisa Shirk for their invaluable technical and administrative support.
Corresponding author: Amber Johnson, MD, MBA, 200 Lothrop St., S-553 Scaife Hall, Pittsburgh, PA 15213, amberjohn@gmail.com.
Financial disclosures: None.
1. Day H. Preliminary studies of an acute coronary care area. J Lancet 1963;83:53–5.
2. Drew B, Califf R, Funk M, et al. Practice standards for electrocardiographic monitoring in hospital settings: an American Heart Association scientific statement from the Councils on Cardiovascular Nursing, Clinical Cardiology, and Cardiovascular Disease in the Young: Endorsed by the International Society of Computerized Electrocardiology and the American Association of Critical-Care Nurses. Circulation 2004;110:2721–46.
3. Estrada C, Battilana G, Alexander M, et al. Evaluation of guidelines for the use of telemetry in the non-intensive-care setting. J Gen Intern Med 2000;15:51–5.
4. Henriques-Forsythe M, Ivonye C, Jamched U, et al. Is telemetry overused? Is it as helpful as thought? Cleve Clin J Med 2009;76:368–72.
5. Chen E, Hollander, J. When do patients need admission to a telemetry bed? J Emerg Med 2007;33:53–60.
6. Najafi N, Auerbach A. Use and outcomes of telemetry monitoring on a medicine service. Arch Intern Med 2012;172:1349–50.
7. Cabana M, Rand C, Powe N, et al. Why don't physicians follow clinical practice guidelines?: A framework for improvement. JAMA 1999;282:1458–65.
8. Adult hospital medicine. Five things physicians and patients should question. 15 Aug 2013. Available at www.choosingwisely.org/doctor-patient-lists/society-of-hospital-medicine-adult-hospital-medicine/
9. Durairaj L, Reilly B, Das K, et al. Emergency department admissions to inpatient cardiac telemetry beds: A prospective cohort study of risk stratification and outcomes. Am J Med 2001;110:7–11.
10. Estrada C, Rosman H, Prasad N, et al. Role of telemetry monitoring in the non-intensive care unit. Am J Cardiol 1995;76:960–5.
11. Hollander J, Sites F, Pollack C, Shofer F. Lack of utility of telemetry monitoring for identification of cardiac death and life-threatening ventricular dysrhythmias in low-risk patients with chest pain. Ann Emerg Med 2004;43:71–6.
12. Ivonye C, Ohuabunwo C, Henriques-Forsythe M, et al. Evaluation of telemetry utilization, policy, and outcomes in an inner-city academic medical center. J Natl Med Assoc 2010;102:598–604.
13. Schull M, Redelmeier D. Continuous electrocardiographic monitoring and cardiac arrest outcomes in 8,932 telemetry ward patients. Acad Emerg Med 2000;7:647–52.
14. Sivaram C, Summers J, Ahmed N. Telemetry outside critical care units: patterns of utilization and influence on management decisions. Clin Cardiol 1998;21:503–5.
15. Snider A, Papaleo M, Beldner S, et al. Is telemetry monitoring necessary in low-risk suspected acute chest pain syndromes? Chest 2002;122:517–23.
16. Chen S, Zakaria S. Behind the monitor-The trouble with telemetry: a teachable moment. JAMA Intern Med 2015;175:894.
17. Dressler R, Dryer M, Coletti C, et al. Altering overuse of cardiac telemetry in non-intensive care unit settings by hardwiring the use of American Heart Association guidelines. JAMA Intern Med 2014;174:1852–4.
18. Benjamin E, Klugman R, Luckmann R, et al. Impact of cardiac telemetry on patient safety and cost. Am J Manag Care 2013;19:e225–32.
19. Solomon D, Hashimoto H, Daltroy L, Liang M. Techniques to improve physicians use of diagnostic tests: A new conceptual framework. JAMA 1998;280:2020–7.
20. Richeson J, Johnson J. The association between interdisciplinary collaboration and patient outcomes in a medical intensive care unit. Heart Lung 1992;21:18–24.
21. Curley C, McEachern J, Speroff T. A firm trial of interdisciplinary rounds on the inpatient medical wards: an intervention designed using continuous quality improvement. Med Care 1998;36:AS4–12.
Applying a Quality Improvement Framework to Operating Room Efficiency in an Academic-Practice Partnership
From the Case Western Reserve University School of Medicine, Cleveland, OH.
Abstract
- Objective: To improve operating room (OR) scheduling efficiency at a large academic institution through the use of an academic-practice partnership and quality improvement (QI) methods.
- Methods: The OR administrative team at a large academic hospital partnered with students in a graduate level QI course to apply QI tools to the problem of OR efficiency.
- Results: The team found wide variation in the way that surgeries were scheduled and other factors that contributed to inefficient OR utilization. A plan-do-study-act (PDSA) cycle was applied to the problem of discrepancy in surgeons’ interpretation of case length, resulting in poor case length accuracy. Our intervention, adding time on the schedule for cases, did not show consistent improvement in case length accuracy.
- Conclusion: Although our intervention did not lead to sustained improvements in OR scheduling efficiency, our project demonstrates how QI tools can be taught and applied in an academic course to address a management problem. Further research is needed to study the impact of student teams on health care improvement.
Operating rooms are one of the most costly departments of a hospital. At University Hospitals Case Medical Center (UHCMC), as at many hospitals, operating room utilization is a key area of focus for both operating room (OR) and hospital administrators. Efficient use of the OR is an important aspect of a hospital’s finances and patient-centeredness.
UHCMC uses block scheduling, a common OR scheduling design. Each surgical department is allotted a certain number of blocks (hours of reserved OR time) that they are responsible for filling with surgical cases and that the hospital is responsible for staffing. Block utilization rate is a metric commonly used to measure OR efficiency. It divides the time that the OR is in use by the total block time allocated to the department (while accounting for room turnaround time). An industry benchmark is 75% block utilization [1], which was adopted as an internal target at UHCMC. Achieving this metric is necessary because the hospital (rather than each individual surgical department) is responsible for ensuring that the appropriate amount of non-surgeon staff (eg, anesthesiologists, nurses, scrub techs, and facilities staff) is available. Poor utilization rates indicate that the staff and equipment are inefficiently used, which can impact the hospital’s financial well-being [2]. Block utilization is the result of a complex system, making it challenging to improve. Many people are involved in scheduling, and a large degree of inherent uncertainty exists in the system.
At UHCMC, block utilization rates by department ranged from 52% to 80%, with an overall utilization of 64% from February to July 2014. Given this wide variation, higher level management staff in the OR initiated a project in which OR administrators partnered with students in a graduate level QI course in an effort to improve overall block utilization. They believed that improving block utilization rate would improve the effectiveness, patient-centeredness, and efficiency of care, health care delivery goals described by the Institute of Medicine [3].
Methods
Setting
The OR at UHCMC contains 4 operating suites that serve over 25,000 patients per year and train over 900 residents each year. Nearly 250 surgeons in 23 departments use the OR. The OR schedule at our institution is coordinated by block scheduling, as described above. If a surgical department cannot fill the block, they must release the time to central scheduling for re-allocation of the time to another department.
Application of QI Process
This QI project was an academic-practice collaboration between UHCMC and a graduate level course at Case Western Reserve University called The Continual Improvement of Healthcare: an Interdisciplinary Course [4]. Faculty course instructors solicit applications of QI projects from departments at UHCMC. The project team consisted of 4 students (from medicine, social work, public health, and bioethics), 2 administrative staff from UHCMC, and a QI coach who is on the faculty at Case Western. Guidance was provided by 2 faculty facilitators. The students attended 15 weekly class sessions, 4 meetings with the project team, numerous data gathering sessions with other hospital staff, and held a handful of outside-class student team meetings. An early class session was devoted to team skills and the Seven-Step meeting process [5]. Each classroom session consisted of structured group activities to practice the tools of the QI process. 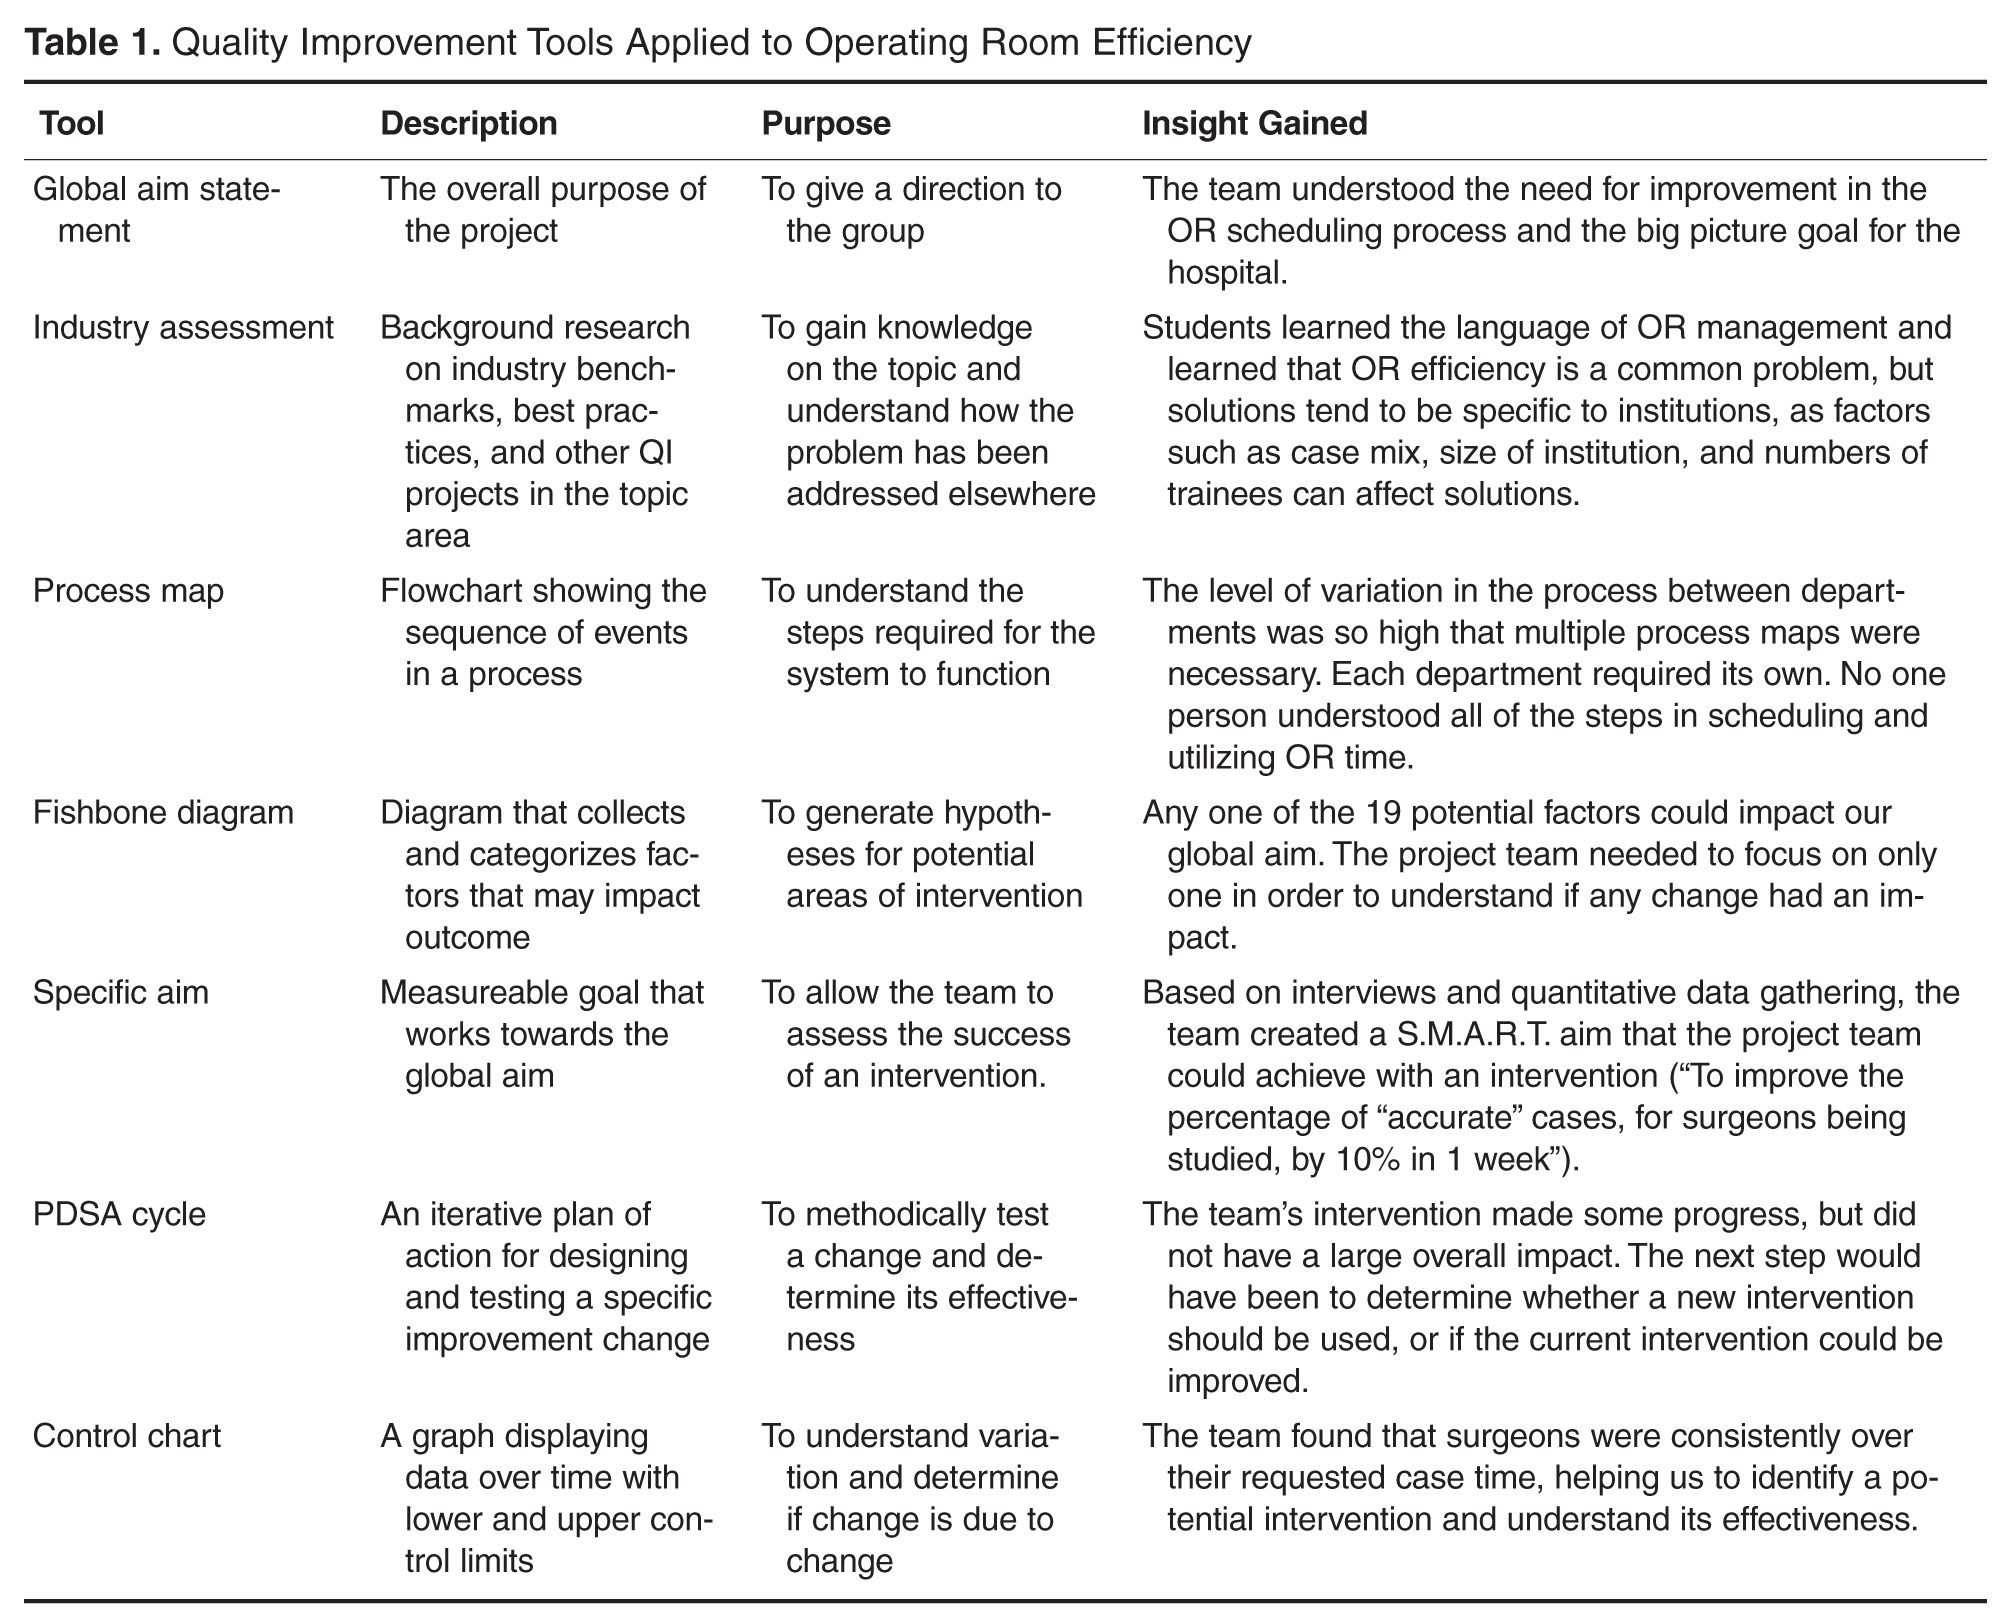
Tool 1: Global Aim
The team first established a global aim: to improve the OR block utilization rate at UHCMC. This aim was based on the initial project proposal from UHCMC. The global aim explains the reason that the project team was established, and frames all future work [7].
Tool 2: Industry Assessment
Based on the global aim, the student team performed an industry assessment in order to understand strategies for improving block utilization rate in use at other institutions. Peer-reviewed journal articles and case reports were reviewed and the student team was able to contact a team at another institution working on similar issues.
Overall, 2 broad categories of interventions to improve block utilization were identified. Some institutions addressed the way time in the OR was scheduled. They made improvements to how block time was allotted, timing of cases, and dealing with add-on cases [8]. Others focused on using time in the OR more efficiently by addressing room turnover, delays including waiting for surgeons, and waiting for hospital beds [9]. Because the specific case mix of each hospital is so distinct, hospitals that successfully made changes all used a variety of interventions [10–12]. After the industry assessment, the student team realized that there would be a large number of possible approaches to the problem of block utilization, and a better understanding of the actual process of scheduling at UHCMC was necessary to find an area of focus.
Tool 3: Process Map
As the project team began to address the global aim of improving OR block utilization at UHCMC, they needed to have a thorough understanding of how OR time was allotted and used. To do this, the student team created a process map by interviewing process stakeholders, including the OR managers and department schedulers in orthopedics, general surgery, and urology, as suggested by the OR managers. The perspective of these staff were critical to understanding the process of operating room scheduling.
Through the creation of the process map, the project team found that there was wide variation in the process and structure for scheduling surgeries. Some departments used one central scheduler while others used individual secretaries for each surgeon. Some surgeons maintained control over changing their schedule, while others did not. Further, the project team learned that the metric of block utilization rate was of varying importance to people working on the ground.
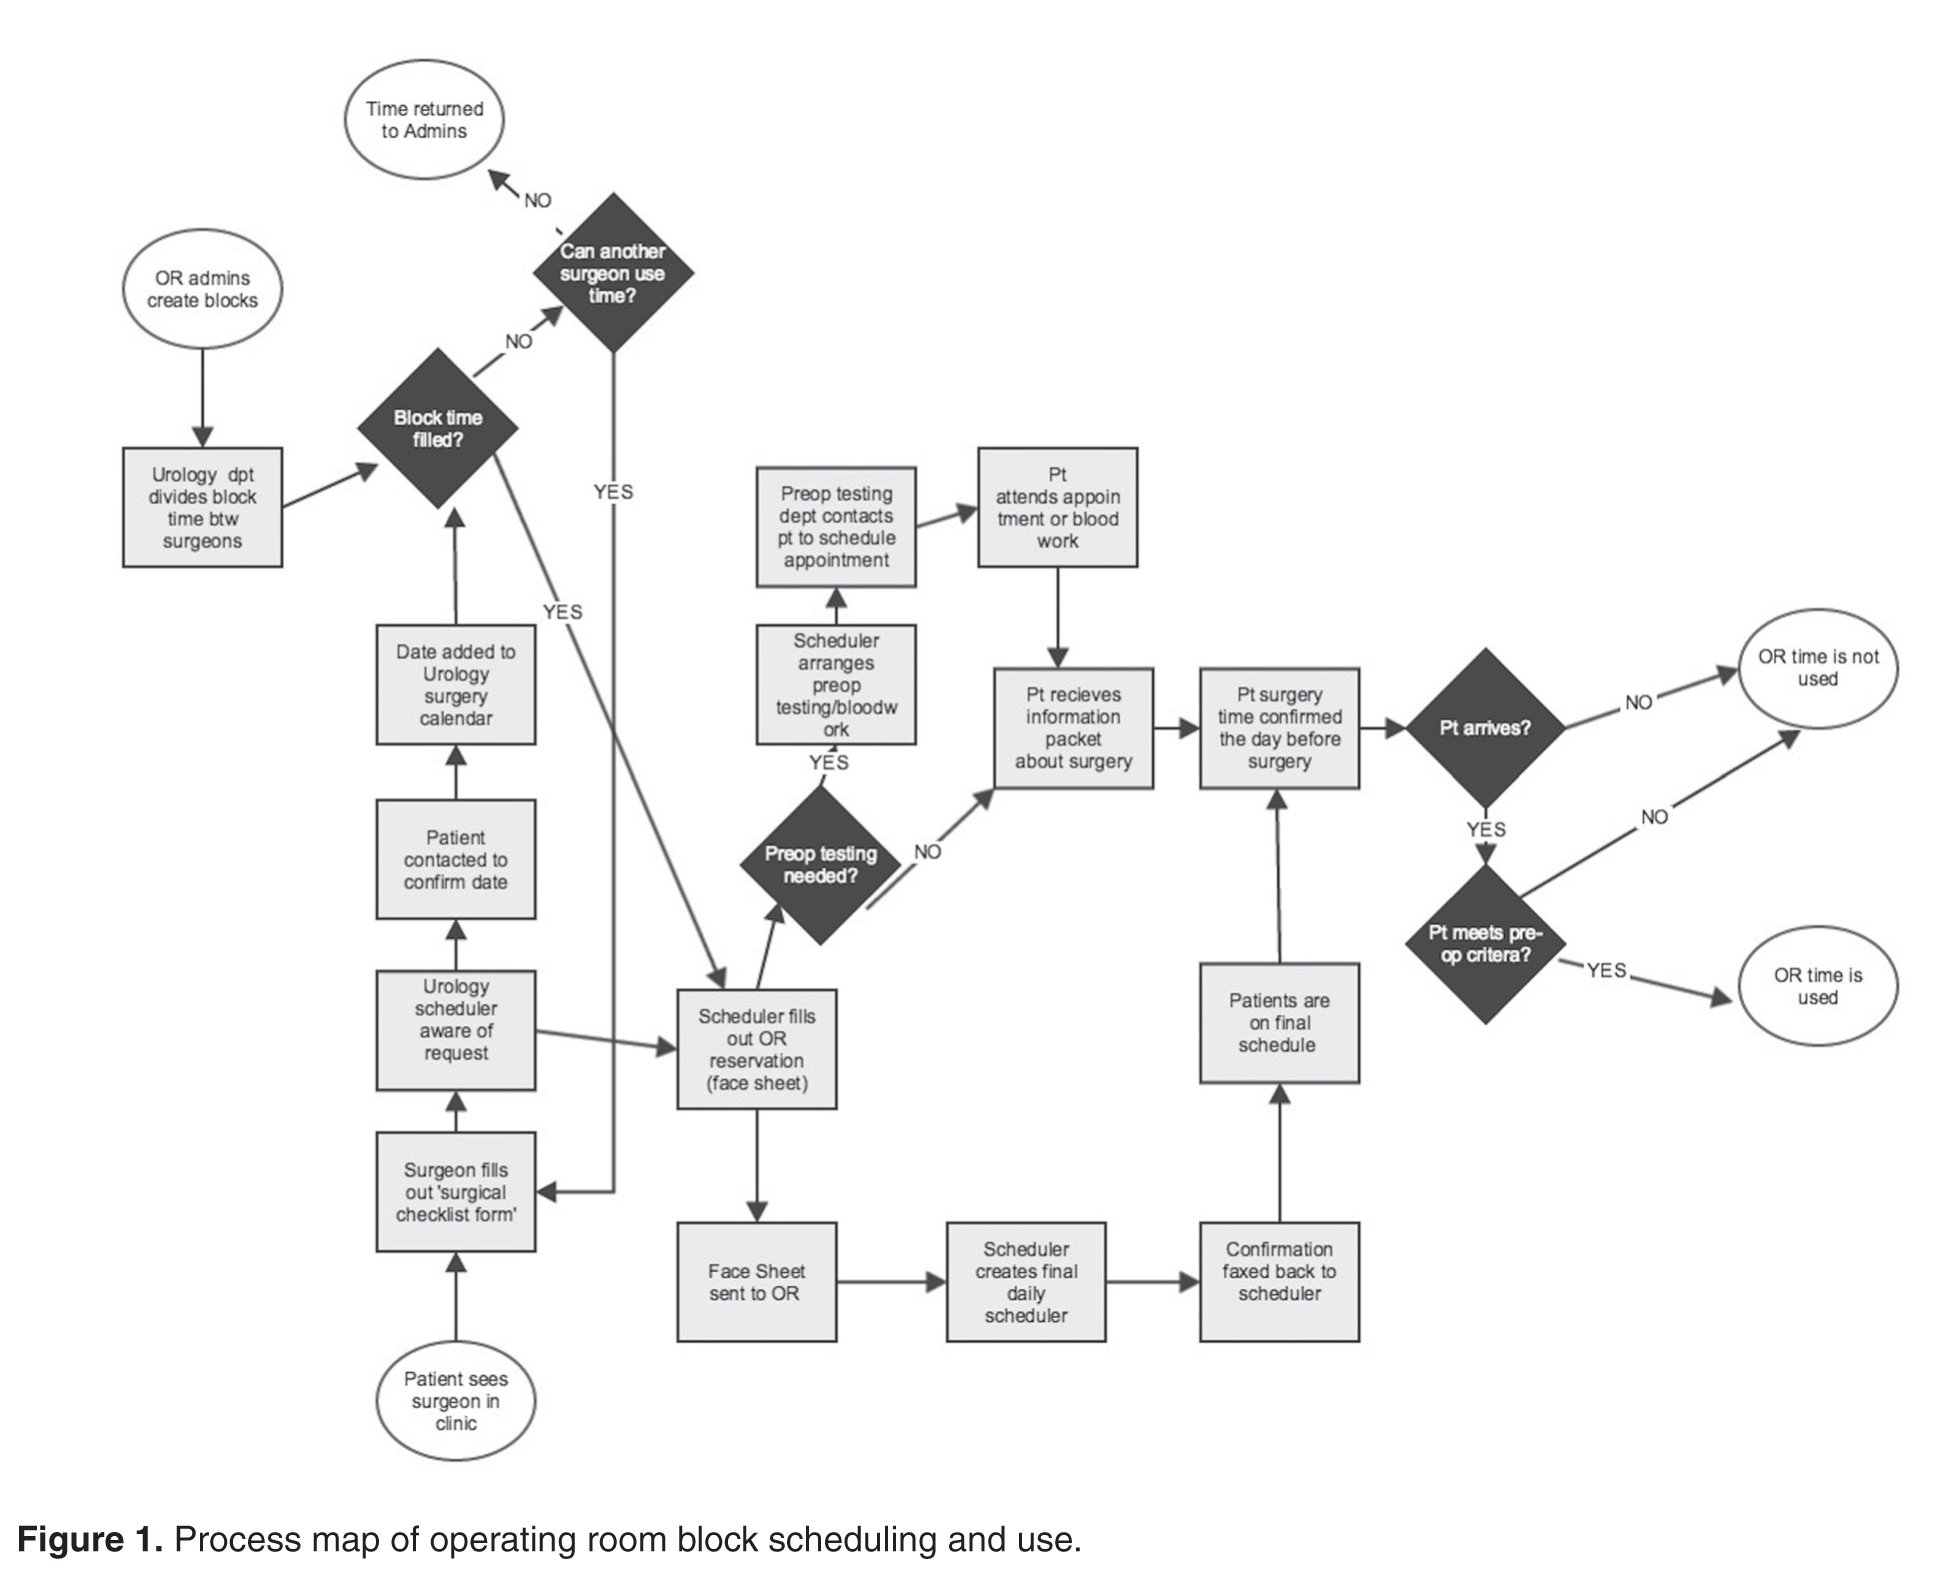
Tool 4: Fishbone Diagram
After understanding the process, the project team considered all of the factors that 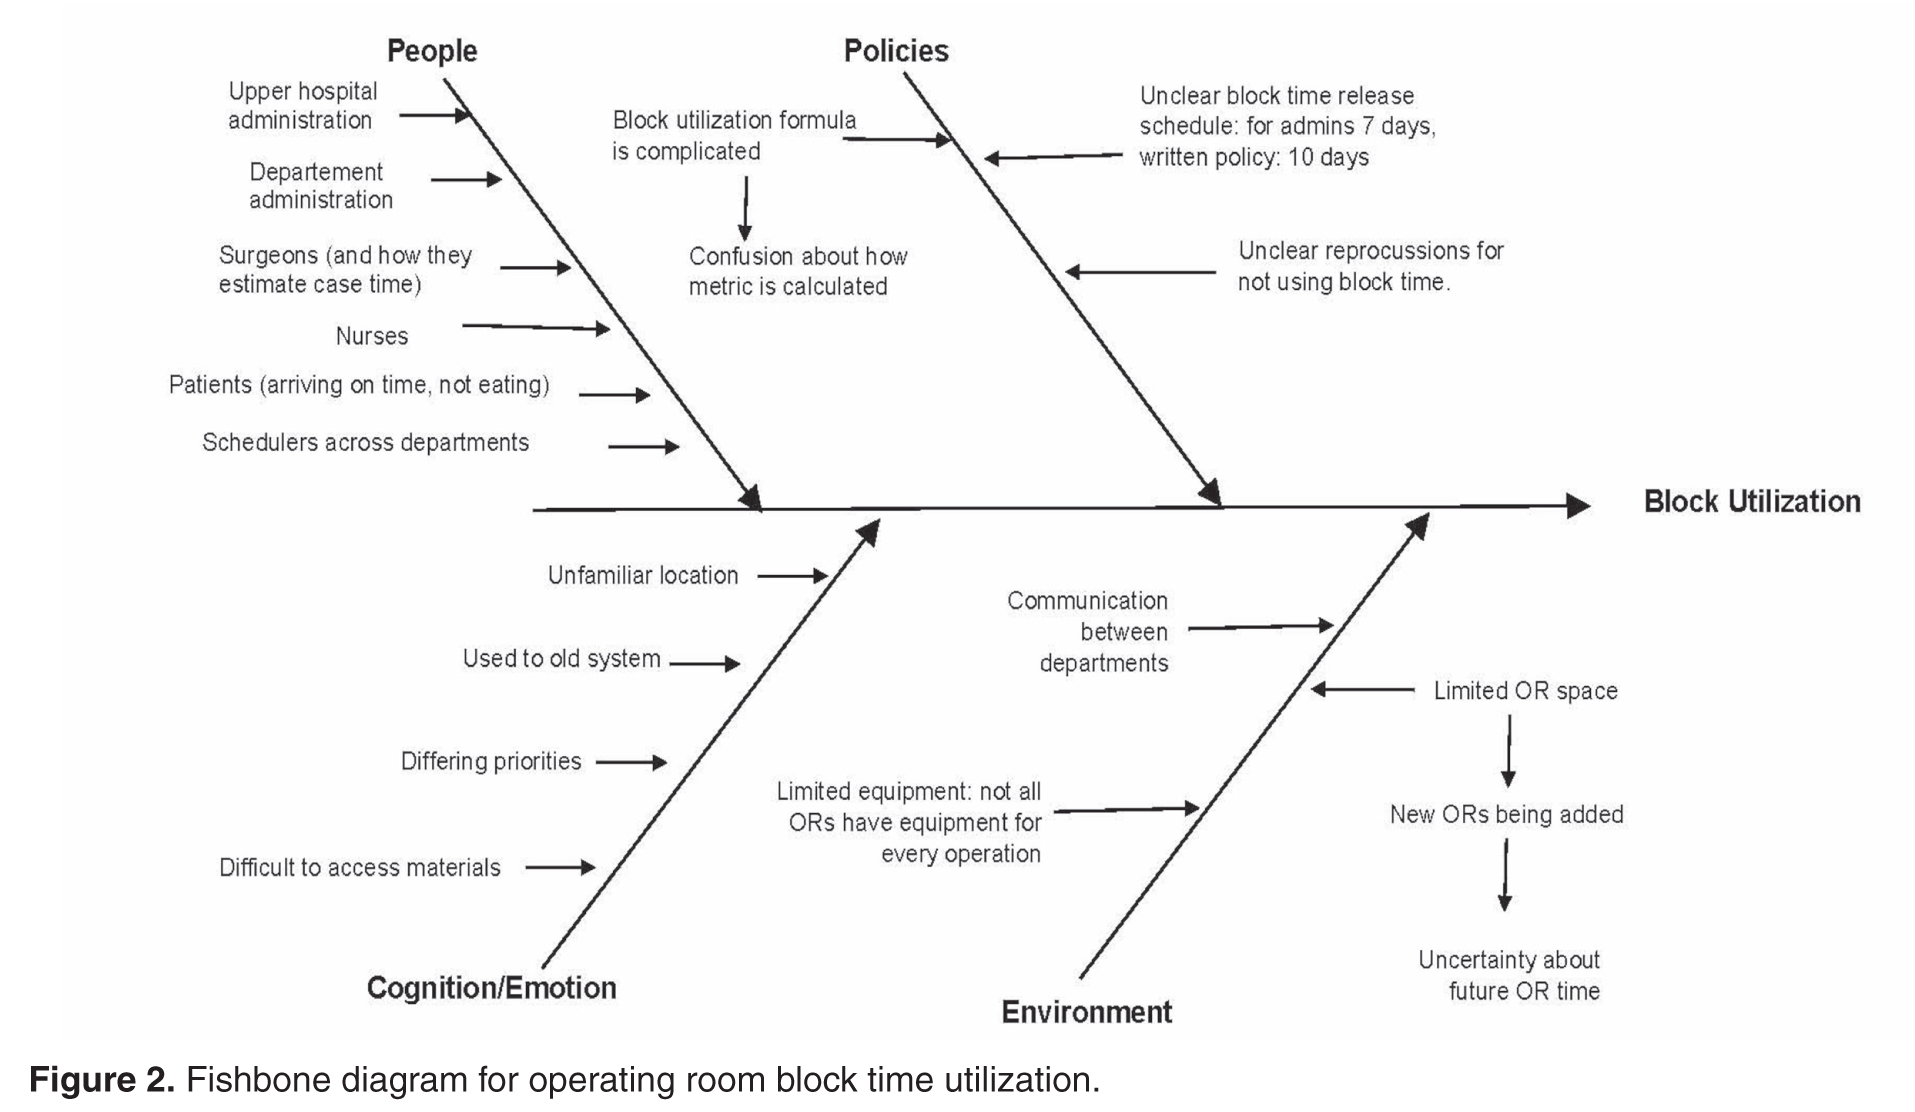
Tool 5: Specific Aim
Though the global aim was to improve block utilization, the project team needed to chose a specific aim that met S.M.A.R.T criteria: Specific, Measureable, Achievable, Results-focused, and Time-bound [7]. After considering multiple potential areas of initial focus, the OR staff suggested focusing on the issue of case length accuracy. In qualitative interviews, the student team had found that the surgery request forms ask for “case length,” and the schedulers were not sure how the surgeons defined it. When the OR is booked for an operation, the amount of time blocked out is the time from when the patient is brought into the operating room to the time that the patient leaves the room, or WIWO (Wheels In Wheels Out). This WIWO time includes anesthesia induction and preparations for surgery such as positioning. Some surgeons think about case length as only the time that the patient is operated on, or CTC (Cut to Close). Thus, the surgeon may be requesting less time than is really necessary for the case if he or she is only thinking about CTC time. The student team created a survey and found that 2 urology surgeons considered case length to be WIWO, and 4 considered case length to mean CTC.
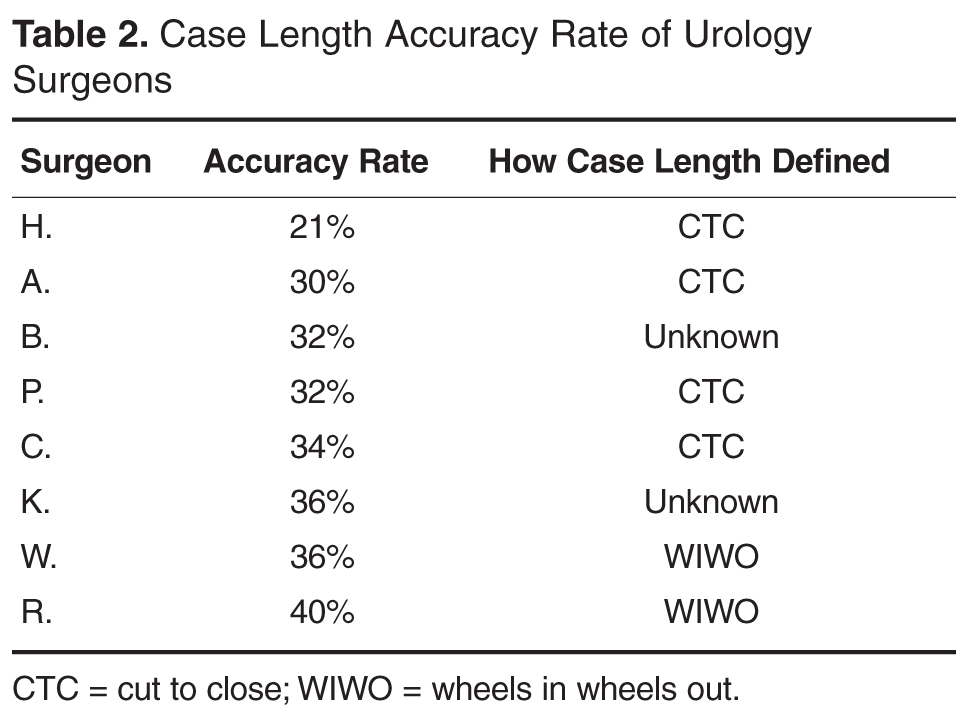
Tools 6 and 7: PDSA Cycle and Control Charts
The Plan-Do-Study-Act cycle is an iterative plan of action for designing and testing a specific change [7]. This part of the QI cycle involved implementing and testing a change to address our specific aim. As the first cycle of change, the team requested that the scheduler add 15 minutes to the surgeons’ requested case time over 1 week. Of the urologists scheduled that week, one had used CTC and the other had not completed the student team’s survey. In order to study the change, the project team used control charts for the 2 surgeons whose case times were adapted. Prior to the intervention, the surgeons averaged at least 20 minutes over their scheduled time, with wide variation. Surgeons were infrequently completing cases at or below their requested case time. Most of the inaccuracy came from going long. The team used control charts to understand the impact of the change. The control charts showed that after the change in scheduling time, the 2 surgeons still went over their allotted case time, but to a lesser degree.
After gaining new information, the next step in the PDSA cycle is to determine the next test of change. The student team recommended sharing these data with the surgeons to consider next steps in improving block utilization, though time constraints of the semester limited continued involvement of the student team in the next PDSA cycle.
Discussion
Through the application of QI tools, new insight was gained about OR efficiency and potential improvements. The student team talked to numerous staff involved in scheduling and each discussion increased understanding of the issues that lead to OR inefficiency. The process map and fishbone diagram provided a visual expression of how small issues could impact the overall OR system. Application of QI tools also led the team to the discovery that surgeons may be interpreting case length in disparate ways, contributing to problems with scheduling.
Though the intervention did not have significant impact over 1 week, more time for subsequent PDSA cycles may have resulted in clinical improvements. Despite the limitations, the student team uncovered an important aspect of the block scheduling process, providing valuable information and insight for the department around this scheduling issue. The student team’s work was shared between multiple surgical departments, and the QI work in the department is ongoing.
Implications for Health Care Institutions
Nontraditional Projects Can Work
The issue of OR utilization is perhaps not a “traditional” QI project given the macro nature of the problem. Once it was broken down into discrete processes, problems such as OR turnover, scheduling redundancies, and others look much more like traditional QI projects. It may be beneficial to institutions to broaden the scope of QI to problems that may, at first glance, seem out of the realm of process mapping, fishbone diagramming, and SMART aims. QI tools can turn management problems into projects that can be tackled by small teams, creating an culture of change in an organization [13].
Benefits of Student Teams
There are clear benefits to the institution working with students. Our hospital-based team members found it beneficial to have independent observers review the process and recommend improvements. Students were able to challenge the status quo and point out inefficiencies that have remained due to institutional complacency and lack of resources. The hospital employees were impressed and surprised that the students found the misunderstanding about case length, and noted that it suggests that there may be other places where there are miscommunications between various people involved in OR scheduling. The students’ energy and time was supported by the QI expertise of the course instructors, and the practical knowledge of the hospital-based team members. Similar benefits have been noted by others utilizing collaborative QI educational models [14,15].
Benefits for Students
For the students on the team, the opportunity to apply QI concepts to the real world was a unique learning opportunity. First, the project was truly interdisciplinary. The students were from varied fields and they worked with schedulers, surgeons, and office managers providing the students with insight into the meaning and perspectives of interprofessional collaboration. The students appreciated the complexity and tensions of the OR staff who were working to balance the schedules of nurses, anesthesiologists, and other OR support staff. Additionally, interdisciplinary collaboration in health care is of increasing importance in everyday practice [16,17]. A strong understanding of collaboration across professions will be a cornerstone of the students’ credentials as they move into the workforce.
There is also value in adding real work experience to academics. The students were able to appreciate not only the concepts of QI but the actual challenges of implementing QI methodology in an institution where people had varying levels of buy-in. Quality improvement is about more than sitting at a whiteboard coming up with charts—it is about enacting actual change and understanding specific real-world situations. The hospital collaboration allowed the students to gain experience that is impossible to replicate in the classroom.
Limitations and Barriers
As noted in other academic-practice collaborations, the limitation of completing the project in one semester presents a barrier to collaboration; the working world does not operate on an academic timeline [14]. Students were limited to only testing one cycle of change. This part of the semester was disappointing as the students would have liked to implement multiple PDSA cycles. The OR managers faced barriers as well; they invested time in educating students who would soon move on, and would have to repeat the process with a new group of students. The department has continued on with this work, but losing the students who they oriented was not ideal.
The course instructors were flexible in allowing the project team to spend the majority of time breaking down the problem of OR block utilization into testable changes, which was the bulk of our work. However, the skill that the team was able to dedicate the least amount time to, testing and implementing change, is useful for the students to learn and beneficial for the organization. Moving forward, allowing teams to build on the previous semester’s work, and even implementing a student handoff, might be tried.
Future Directions
Although our intervention did not lead to sustained improvements in OR scheduling efficiency, our project demonstrates how QI tools can be taught and applied in an academic course to address a management problem. Research to specifically understand institutional benefits of academic-practice collaborations would be helpful in recruiting partners and furthering best practices for participants in these partnerships. Research is also needed to understand the impact of QI collaborative models such as the one described in this paper on improving interprofessional teamwork and communication skills, as called for by health care professional educators [16].
Corresponding author: Danielle O’Rourke-Suchoff, BA, Case Western Reserve University School of Medicine, Office of Student Affairs, 10900 Euclid Ave., Cleveland, OH 44106, dko@case.edu.
Financial disclosures: none.
1. The right strategies can help increase OR utilization. OR Manager 2013;29:21–2.
2. Jackson RL. The business of surgery. Managing the OR as a profit center requires more than just IT. It requires a profit-making mindset, too. Health Manage Technol 2002;23:20–2.
3. Institute of Medicine. Crossing the quality chasm: A new health system for the 21st century. Washington (DC): National Academy Press; 2001.
4. Hand R, Dolansky MA, Hanahan E, Tinsley N. Quality comes alive: an interdisciplinary student team’s quality improvement experience in learning by doing—health care education case study. Qual Approaches Higher Educ 2014;5:26–32.
5. Scholtes PR, Joiner BL, Streibel BJ. The team handbook. Oriel; 2003.
6. Institute for Healthcare Improvement. Open School. 2015. Accessed 13 Apr 2015 at www.ihi.org/education/ihiopenschool/Pages/default.aspx.
7. Ogrinc GS, Headrick LA, Moore SM, et al. Fundamentals of health care improvement: A guide to improving your patients’ care. 2nd ed. Oakbrook Terrace, IL: Joint Commission Resources and the Institute for Healthcare Improvement; 2012.
8. Managing patient flow: Smoothing OR schedule can ease capacity crunches, researchers say. OR Manager 2003;19:1,9–10.
9. Harders M, Malangoni MA, Weight S, Sidhu T. Improving operating room efficiency through process redesign. Surgery 2006;140:509–16.
10. Paynter J, Horne W, Sizemore R. Realizing revenue opportunities in the operating room. 2015. Accessed 13 Apr 2015 at www.ihi.org/resources/Pages/ImprovementStories/RealizingRevenueOpportunitiesintheOperatingRoom.aspx.
11. Cima RR, Brown MJ, Hebl JR, et al. Use of Lean and Six Sigma methodology to improve operating room efficiency in a high-volume tertiary-care academic medical center. J Am Coll Surg 2011;213:83–92.
12. Day R, Garfinkel R, Thompson S. Integrated block sharing: a win–win strategy for hospitals and surgeons. Manufact Serv Op Manage 2012;14:567–83.
13. Pardini-Kiely K, Greenlee E, Hopkins J, et al. Improving and Sustaining core measure performance through effective accountability of clinical microsystems in an academic medical center. Jt Comm J Qual Improv Pt Safety 2010;36:387–98.
14. Hall LW, Headrick LA, Cox KR, et al. Linking health professional learners and health care workers on action-based improvement teams. Qual Manag Health Care 2009;18:194–201.
15. Ogrinc GS, Nierenberg DW, Batalden PB. Building experiential learning about quality improvement into a medical school curriculum: The Dartmouth Experience. Health Aff 2011;30:716–22.
16. Interprofessional Education Collaborative Expert Panel. Core competencies for interprofessional collaborative practice. Washington, DC: Interprofessional Education Collaborative; 2011.
17. World Health Organization. Framework for action on inerprofessional education and collaborative practice. Geneva: World Health Organization; 2010.
From the Case Western Reserve University School of Medicine, Cleveland, OH.
Abstract
- Objective: To improve operating room (OR) scheduling efficiency at a large academic institution through the use of an academic-practice partnership and quality improvement (QI) methods.
- Methods: The OR administrative team at a large academic hospital partnered with students in a graduate level QI course to apply QI tools to the problem of OR efficiency.
- Results: The team found wide variation in the way that surgeries were scheduled and other factors that contributed to inefficient OR utilization. A plan-do-study-act (PDSA) cycle was applied to the problem of discrepancy in surgeons’ interpretation of case length, resulting in poor case length accuracy. Our intervention, adding time on the schedule for cases, did not show consistent improvement in case length accuracy.
- Conclusion: Although our intervention did not lead to sustained improvements in OR scheduling efficiency, our project demonstrates how QI tools can be taught and applied in an academic course to address a management problem. Further research is needed to study the impact of student teams on health care improvement.
Operating rooms are one of the most costly departments of a hospital. At University Hospitals Case Medical Center (UHCMC), as at many hospitals, operating room utilization is a key area of focus for both operating room (OR) and hospital administrators. Efficient use of the OR is an important aspect of a hospital’s finances and patient-centeredness.
UHCMC uses block scheduling, a common OR scheduling design. Each surgical department is allotted a certain number of blocks (hours of reserved OR time) that they are responsible for filling with surgical cases and that the hospital is responsible for staffing. Block utilization rate is a metric commonly used to measure OR efficiency. It divides the time that the OR is in use by the total block time allocated to the department (while accounting for room turnaround time). An industry benchmark is 75% block utilization [1], which was adopted as an internal target at UHCMC. Achieving this metric is necessary because the hospital (rather than each individual surgical department) is responsible for ensuring that the appropriate amount of non-surgeon staff (eg, anesthesiologists, nurses, scrub techs, and facilities staff) is available. Poor utilization rates indicate that the staff and equipment are inefficiently used, which can impact the hospital’s financial well-being [2]. Block utilization is the result of a complex system, making it challenging to improve. Many people are involved in scheduling, and a large degree of inherent uncertainty exists in the system.
At UHCMC, block utilization rates by department ranged from 52% to 80%, with an overall utilization of 64% from February to July 2014. Given this wide variation, higher level management staff in the OR initiated a project in which OR administrators partnered with students in a graduate level QI course in an effort to improve overall block utilization. They believed that improving block utilization rate would improve the effectiveness, patient-centeredness, and efficiency of care, health care delivery goals described by the Institute of Medicine [3].
Methods
Setting
The OR at UHCMC contains 4 operating suites that serve over 25,000 patients per year and train over 900 residents each year. Nearly 250 surgeons in 23 departments use the OR. The OR schedule at our institution is coordinated by block scheduling, as described above. If a surgical department cannot fill the block, they must release the time to central scheduling for re-allocation of the time to another department.
Application of QI Process
This QI project was an academic-practice collaboration between UHCMC and a graduate level course at Case Western Reserve University called The Continual Improvement of Healthcare: an Interdisciplinary Course [4]. Faculty course instructors solicit applications of QI projects from departments at UHCMC. The project team consisted of 4 students (from medicine, social work, public health, and bioethics), 2 administrative staff from UHCMC, and a QI coach who is on the faculty at Case Western. Guidance was provided by 2 faculty facilitators. The students attended 15 weekly class sessions, 4 meetings with the project team, numerous data gathering sessions with other hospital staff, and held a handful of outside-class student team meetings. An early class session was devoted to team skills and the Seven-Step meeting process [5]. Each classroom session consisted of structured group activities to practice the tools of the QI process.
Tool 1: Global Aim
The team first established a global aim: to improve the OR block utilization rate at UHCMC. This aim was based on the initial project proposal from UHCMC. The global aim explains the reason that the project team was established, and frames all future work [7].
Tool 2: Industry Assessment
Based on the global aim, the student team performed an industry assessment in order to understand strategies for improving block utilization rate in use at other institutions. Peer-reviewed journal articles and case reports were reviewed and the student team was able to contact a team at another institution working on similar issues.
Overall, 2 broad categories of interventions to improve block utilization were identified. Some institutions addressed the way time in the OR was scheduled. They made improvements to how block time was allotted, timing of cases, and dealing with add-on cases [8]. Others focused on using time in the OR more efficiently by addressing room turnover, delays including waiting for surgeons, and waiting for hospital beds [9]. Because the specific case mix of each hospital is so distinct, hospitals that successfully made changes all used a variety of interventions [10–12]. After the industry assessment, the student team realized that there would be a large number of possible approaches to the problem of block utilization, and a better understanding of the actual process of scheduling at UHCMC was necessary to find an area of focus.
Tool 3: Process Map
As the project team began to address the global aim of improving OR block utilization at UHCMC, they needed to have a thorough understanding of how OR time was allotted and used. To do this, the student team created a process map by interviewing process stakeholders, including the OR managers and department schedulers in orthopedics, general surgery, and urology, as suggested by the OR managers. The perspective of these staff were critical to understanding the process of operating room scheduling.
Through the creation of the process map, the project team found that there was wide variation in the process and structure for scheduling surgeries. Some departments used one central scheduler while others used individual secretaries for each surgeon. Some surgeons maintained control over changing their schedule, while others did not. Further, the project team learned that the metric of block utilization rate was of varying importance to people working on the ground.
Tool 4: Fishbone Diagram
After understanding the process, the project team considered all of the factors that
Tool 5: Specific Aim
Though the global aim was to improve block utilization, the project team needed to chose a specific aim that met S.M.A.R.T criteria: Specific, Measureable, Achievable, Results-focused, and Time-bound [7]. After considering multiple potential areas of initial focus, the OR staff suggested focusing on the issue of case length accuracy. In qualitative interviews, the student team had found that the surgery request forms ask for “case length,” and the schedulers were not sure how the surgeons defined it. When the OR is booked for an operation, the amount of time blocked out is the time from when the patient is brought into the operating room to the time that the patient leaves the room, or WIWO (Wheels In Wheels Out). This WIWO time includes anesthesia induction and preparations for surgery such as positioning. Some surgeons think about case length as only the time that the patient is operated on, or CTC (Cut to Close). Thus, the surgeon may be requesting less time than is really necessary for the case if he or she is only thinking about CTC time. The student team created a survey and found that 2 urology surgeons considered case length to be WIWO, and 4 considered case length to mean CTC.
Tools 6 and 7: PDSA Cycle and Control Charts
The Plan-Do-Study-Act cycle is an iterative plan of action for designing and testing a specific change [7]. This part of the QI cycle involved implementing and testing a change to address our specific aim. As the first cycle of change, the team requested that the scheduler add 15 minutes to the surgeons’ requested case time over 1 week. Of the urologists scheduled that week, one had used CTC and the other had not completed the student team’s survey. In order to study the change, the project team used control charts for the 2 surgeons whose case times were adapted. Prior to the intervention, the surgeons averaged at least 20 minutes over their scheduled time, with wide variation. Surgeons were infrequently completing cases at or below their requested case time. Most of the inaccuracy came from going long. The team used control charts to understand the impact of the change. The control charts showed that after the change in scheduling time, the 2 surgeons still went over their allotted case time, but to a lesser degree.
After gaining new information, the next step in the PDSA cycle is to determine the next test of change. The student team recommended sharing these data with the surgeons to consider next steps in improving block utilization, though time constraints of the semester limited continued involvement of the student team in the next PDSA cycle.
Discussion
Through the application of QI tools, new insight was gained about OR efficiency and potential improvements. The student team talked to numerous staff involved in scheduling and each discussion increased understanding of the issues that lead to OR inefficiency. The process map and fishbone diagram provided a visual expression of how small issues could impact the overall OR system. Application of QI tools also led the team to the discovery that surgeons may be interpreting case length in disparate ways, contributing to problems with scheduling.
Though the intervention did not have significant impact over 1 week, more time for subsequent PDSA cycles may have resulted in clinical improvements. Despite the limitations, the student team uncovered an important aspect of the block scheduling process, providing valuable information and insight for the department around this scheduling issue. The student team’s work was shared between multiple surgical departments, and the QI work in the department is ongoing.
Implications for Health Care Institutions
Nontraditional Projects Can Work
The issue of OR utilization is perhaps not a “traditional” QI project given the macro nature of the problem. Once it was broken down into discrete processes, problems such as OR turnover, scheduling redundancies, and others look much more like traditional QI projects. It may be beneficial to institutions to broaden the scope of QI to problems that may, at first glance, seem out of the realm of process mapping, fishbone diagramming, and SMART aims. QI tools can turn management problems into projects that can be tackled by small teams, creating an culture of change in an organization [13].
Benefits of Student Teams
There are clear benefits to the institution working with students. Our hospital-based team members found it beneficial to have independent observers review the process and recommend improvements. Students were able to challenge the status quo and point out inefficiencies that have remained due to institutional complacency and lack of resources. The hospital employees were impressed and surprised that the students found the misunderstanding about case length, and noted that it suggests that there may be other places where there are miscommunications between various people involved in OR scheduling. The students’ energy and time was supported by the QI expertise of the course instructors, and the practical knowledge of the hospital-based team members. Similar benefits have been noted by others utilizing collaborative QI educational models [14,15].
Benefits for Students
For the students on the team, the opportunity to apply QI concepts to the real world was a unique learning opportunity. First, the project was truly interdisciplinary. The students were from varied fields and they worked with schedulers, surgeons, and office managers providing the students with insight into the meaning and perspectives of interprofessional collaboration. The students appreciated the complexity and tensions of the OR staff who were working to balance the schedules of nurses, anesthesiologists, and other OR support staff. Additionally, interdisciplinary collaboration in health care is of increasing importance in everyday practice [16,17]. A strong understanding of collaboration across professions will be a cornerstone of the students’ credentials as they move into the workforce.
There is also value in adding real work experience to academics. The students were able to appreciate not only the concepts of QI but the actual challenges of implementing QI methodology in an institution where people had varying levels of buy-in. Quality improvement is about more than sitting at a whiteboard coming up with charts—it is about enacting actual change and understanding specific real-world situations. The hospital collaboration allowed the students to gain experience that is impossible to replicate in the classroom.
Limitations and Barriers
As noted in other academic-practice collaborations, the limitation of completing the project in one semester presents a barrier to collaboration; the working world does not operate on an academic timeline [14]. Students were limited to only testing one cycle of change. This part of the semester was disappointing as the students would have liked to implement multiple PDSA cycles. The OR managers faced barriers as well; they invested time in educating students who would soon move on, and would have to repeat the process with a new group of students. The department has continued on with this work, but losing the students who they oriented was not ideal.
The course instructors were flexible in allowing the project team to spend the majority of time breaking down the problem of OR block utilization into testable changes, which was the bulk of our work. However, the skill that the team was able to dedicate the least amount time to, testing and implementing change, is useful for the students to learn and beneficial for the organization. Moving forward, allowing teams to build on the previous semester’s work, and even implementing a student handoff, might be tried.
Future Directions
Although our intervention did not lead to sustained improvements in OR scheduling efficiency, our project demonstrates how QI tools can be taught and applied in an academic course to address a management problem. Research to specifically understand institutional benefits of academic-practice collaborations would be helpful in recruiting partners and furthering best practices for participants in these partnerships. Research is also needed to understand the impact of QI collaborative models such as the one described in this paper on improving interprofessional teamwork and communication skills, as called for by health care professional educators [16].
Corresponding author: Danielle O’Rourke-Suchoff, BA, Case Western Reserve University School of Medicine, Office of Student Affairs, 10900 Euclid Ave., Cleveland, OH 44106, dko@case.edu.
Financial disclosures: none.
1. The right strategies can help increase OR utilization. OR Manager 2013;29:21–2.
2. Jackson RL. The business of surgery. Managing the OR as a profit center requires more than just IT. It requires a profit-making mindset, too. Health Manage Technol 2002;23:20–2.
3. Institute of Medicine. Crossing the quality chasm: A new health system for the 21st century. Washington (DC): National Academy Press; 2001.
4. Hand R, Dolansky MA, Hanahan E, Tinsley N. Quality comes alive: an interdisciplinary student team’s quality improvement experience in learning by doing—health care education case study. Qual Approaches Higher Educ 2014;5:26–32.
5. Scholtes PR, Joiner BL, Streibel BJ. The team handbook. Oriel; 2003.
6. Institute for Healthcare Improvement. Open School. 2015. Accessed 13 Apr 2015 at www.ihi.org/education/ihiopenschool/Pages/default.aspx.
7. Ogrinc GS, Headrick LA, Moore SM, et al. Fundamentals of health care improvement: A guide to improving your patients’ care. 2nd ed. Oakbrook Terrace, IL: Joint Commission Resources and the Institute for Healthcare Improvement; 2012.
8. Managing patient flow: Smoothing OR schedule can ease capacity crunches, researchers say. OR Manager 2003;19:1,9–10.
9. Harders M, Malangoni MA, Weight S, Sidhu T. Improving operating room efficiency through process redesign. Surgery 2006;140:509–16.
10. Paynter J, Horne W, Sizemore R. Realizing revenue opportunities in the operating room. 2015. Accessed 13 Apr 2015 at www.ihi.org/resources/Pages/ImprovementStories/RealizingRevenueOpportunitiesintheOperatingRoom.aspx.
11. Cima RR, Brown MJ, Hebl JR, et al. Use of Lean and Six Sigma methodology to improve operating room efficiency in a high-volume tertiary-care academic medical center. J Am Coll Surg 2011;213:83–92.
12. Day R, Garfinkel R, Thompson S. Integrated block sharing: a win–win strategy for hospitals and surgeons. Manufact Serv Op Manage 2012;14:567–83.
13. Pardini-Kiely K, Greenlee E, Hopkins J, et al. Improving and Sustaining core measure performance through effective accountability of clinical microsystems in an academic medical center. Jt Comm J Qual Improv Pt Safety 2010;36:387–98.
14. Hall LW, Headrick LA, Cox KR, et al. Linking health professional learners and health care workers on action-based improvement teams. Qual Manag Health Care 2009;18:194–201.
15. Ogrinc GS, Nierenberg DW, Batalden PB. Building experiential learning about quality improvement into a medical school curriculum: The Dartmouth Experience. Health Aff 2011;30:716–22.
16. Interprofessional Education Collaborative Expert Panel. Core competencies for interprofessional collaborative practice. Washington, DC: Interprofessional Education Collaborative; 2011.
17. World Health Organization. Framework for action on inerprofessional education and collaborative practice. Geneva: World Health Organization; 2010.
Interdisciplinary Geriatric Difficult Case Conference: Innovative Education Across the Continuum
From Wheaton Franciscan Healthcare (Ms. Fedel), Aspirus (Ms. Hackbarth), and Aurora Health Care (Mr. Malsch and Ms. Pagel).
Abstract
- Background: There is a nationwide shortage of geriatric prepared providers. Caring for complex older adults is challenging.
- Objective: To develop an efficient and affordable way to educate members of the interdisciplinary team involved in the care of geriatric patients.
- Methods: A team from 3 area health systems developed a plan to present monthly case studies via teleconference. Cases are presented by a direct caregiver using the Wisconsin Star Method to facilitate analysis of the case. A geriatric expert and another member of the team presents teaching points, and questions are elicited and discussed.
- Results: The team has completed 18 consecutive monthly teleconferences. Participant satisfaction has been favorable. Participation on the call has increased approximately 300% since the initiation of the program.
- Conclusion: The case teleconference provides an accessible and affordable educational forum that provides learners an opportunity to improve their knowledge in care of older adults.
The number of older adults in the United States will nearly double between 2005 and 2030 [1] as the baby boom generation begins turning 65 and as life expectancy for older Americans increases. The Institute of Medicine’s (IOM) landmark report Retooling for an Aging America: Building the Health Care Workforce states that “unless action is taken immediately, the health care workforce will lack the capacity (in both size and ability) to meet the needs of older patients in the future [1].” One of their recommendations is to explore ways to widen the duties and responsibilities of workers at various levels of training. More health care providers need to be trained in the basics of geriatric care and should be capable of caring for older patients.
Team-based care is becoming more prevalent. Care delivered by interdisciplinary teams have been shown to improve patient outcomes [2]. A team led by one of the authors (PF) developed an intervention to increase the geriatric and teamwork competencies of interdisciplinary teams who serve patients throughout Wisconsin. The Interdisciplinary Geriatric Difficult Case Conference Call (IGDCC) is sponsored monthly by 3 Wisconsin health systems. The purpose is to provide opportunities to discuss clinical cases, to learn from one another and from experts, and to elevate the level of geriatric care in the states of Wisconsin, Michigan, and beyond. Each month a difficult case is presented by a clinician involved in that patient’s care. Time is allotted for participants to ask questions, and teaching points are shared by a clinical expert to highlight concepts and provide additional context. The IGDCC is meant to be a joint learning exercise to explore a specific difficult patient situation and learn skills and knowledge to improve care and transitions for older adults. The conference call is not a critique of the care, but rather an opportunity to jointly learn from the challenging situations all experience.
Background
The IGDCC was created by four members of 3 health systems in Wisconsin: Wheaton Franciscan Healthcare, Aspirus, and Aurora Health Care. The health systems serve and partially overlap on a broad geographic and demographic area of Wisconsin. The 4 members collaborated on numerous projects in the past, including Nurses Improving Case for Health System Elders (NICHE) implementation [3]. A common concern among the team is the management of challenging geriatric clinical patients and having a prepared workforce to meet those challenges.
Problem/Issue
As mentioned above, the older adult population is increasing, and these statistics are reflected in our service area [4]. Exacerbating these demographic changes is a shortage of health care workers in all disciplines, inadequate geriatric training, and the increased prevalence of multiple chronic conditions. Older adults also have higher rates of 30-day readmissions as well as higher rates of functional decline and medical errors during hospital stays [5,6]. Effective interprofessional teamwork is essential for the delivery of high-quality patient care in an increasingly complex health environment [7]. The IOM’s Future of Nursing report recommends that nurses, who represent the largest segment of the US health workforce, should achieve higher levels of training and be full partners in redesigning health care [8]. Unfortunately, effective care is hampered by poor coordination, limited communication, boundary infringement, and lack of understanding of roles [9]. Meta-analyses have demonstrated that there is a positive relationship between team training interventions and outcomes [10,11].
Objectives
The objective of the IGDCC is to elevate the level of geriatric care in the region by providing an accessible and affordable forum for the education of health care workers involved in the care of our most vulnerable population. To meet this challenge, the 4 founding members of IGDCC utilized the Aurora Health Care Geriatric Fellow’s Most Difficult Case (GFMCC) conference format as a model [12,13]. All disciplines are encouraged to participate, with announcements sent out via the leadership at the participating hospital systems. Participants have the option to call into the conference and teleconference via their own personal telephone and computer; in addition, each participating hospital system frequently hosts an open forum teleconference room where participants also may join a group.
Conference Components
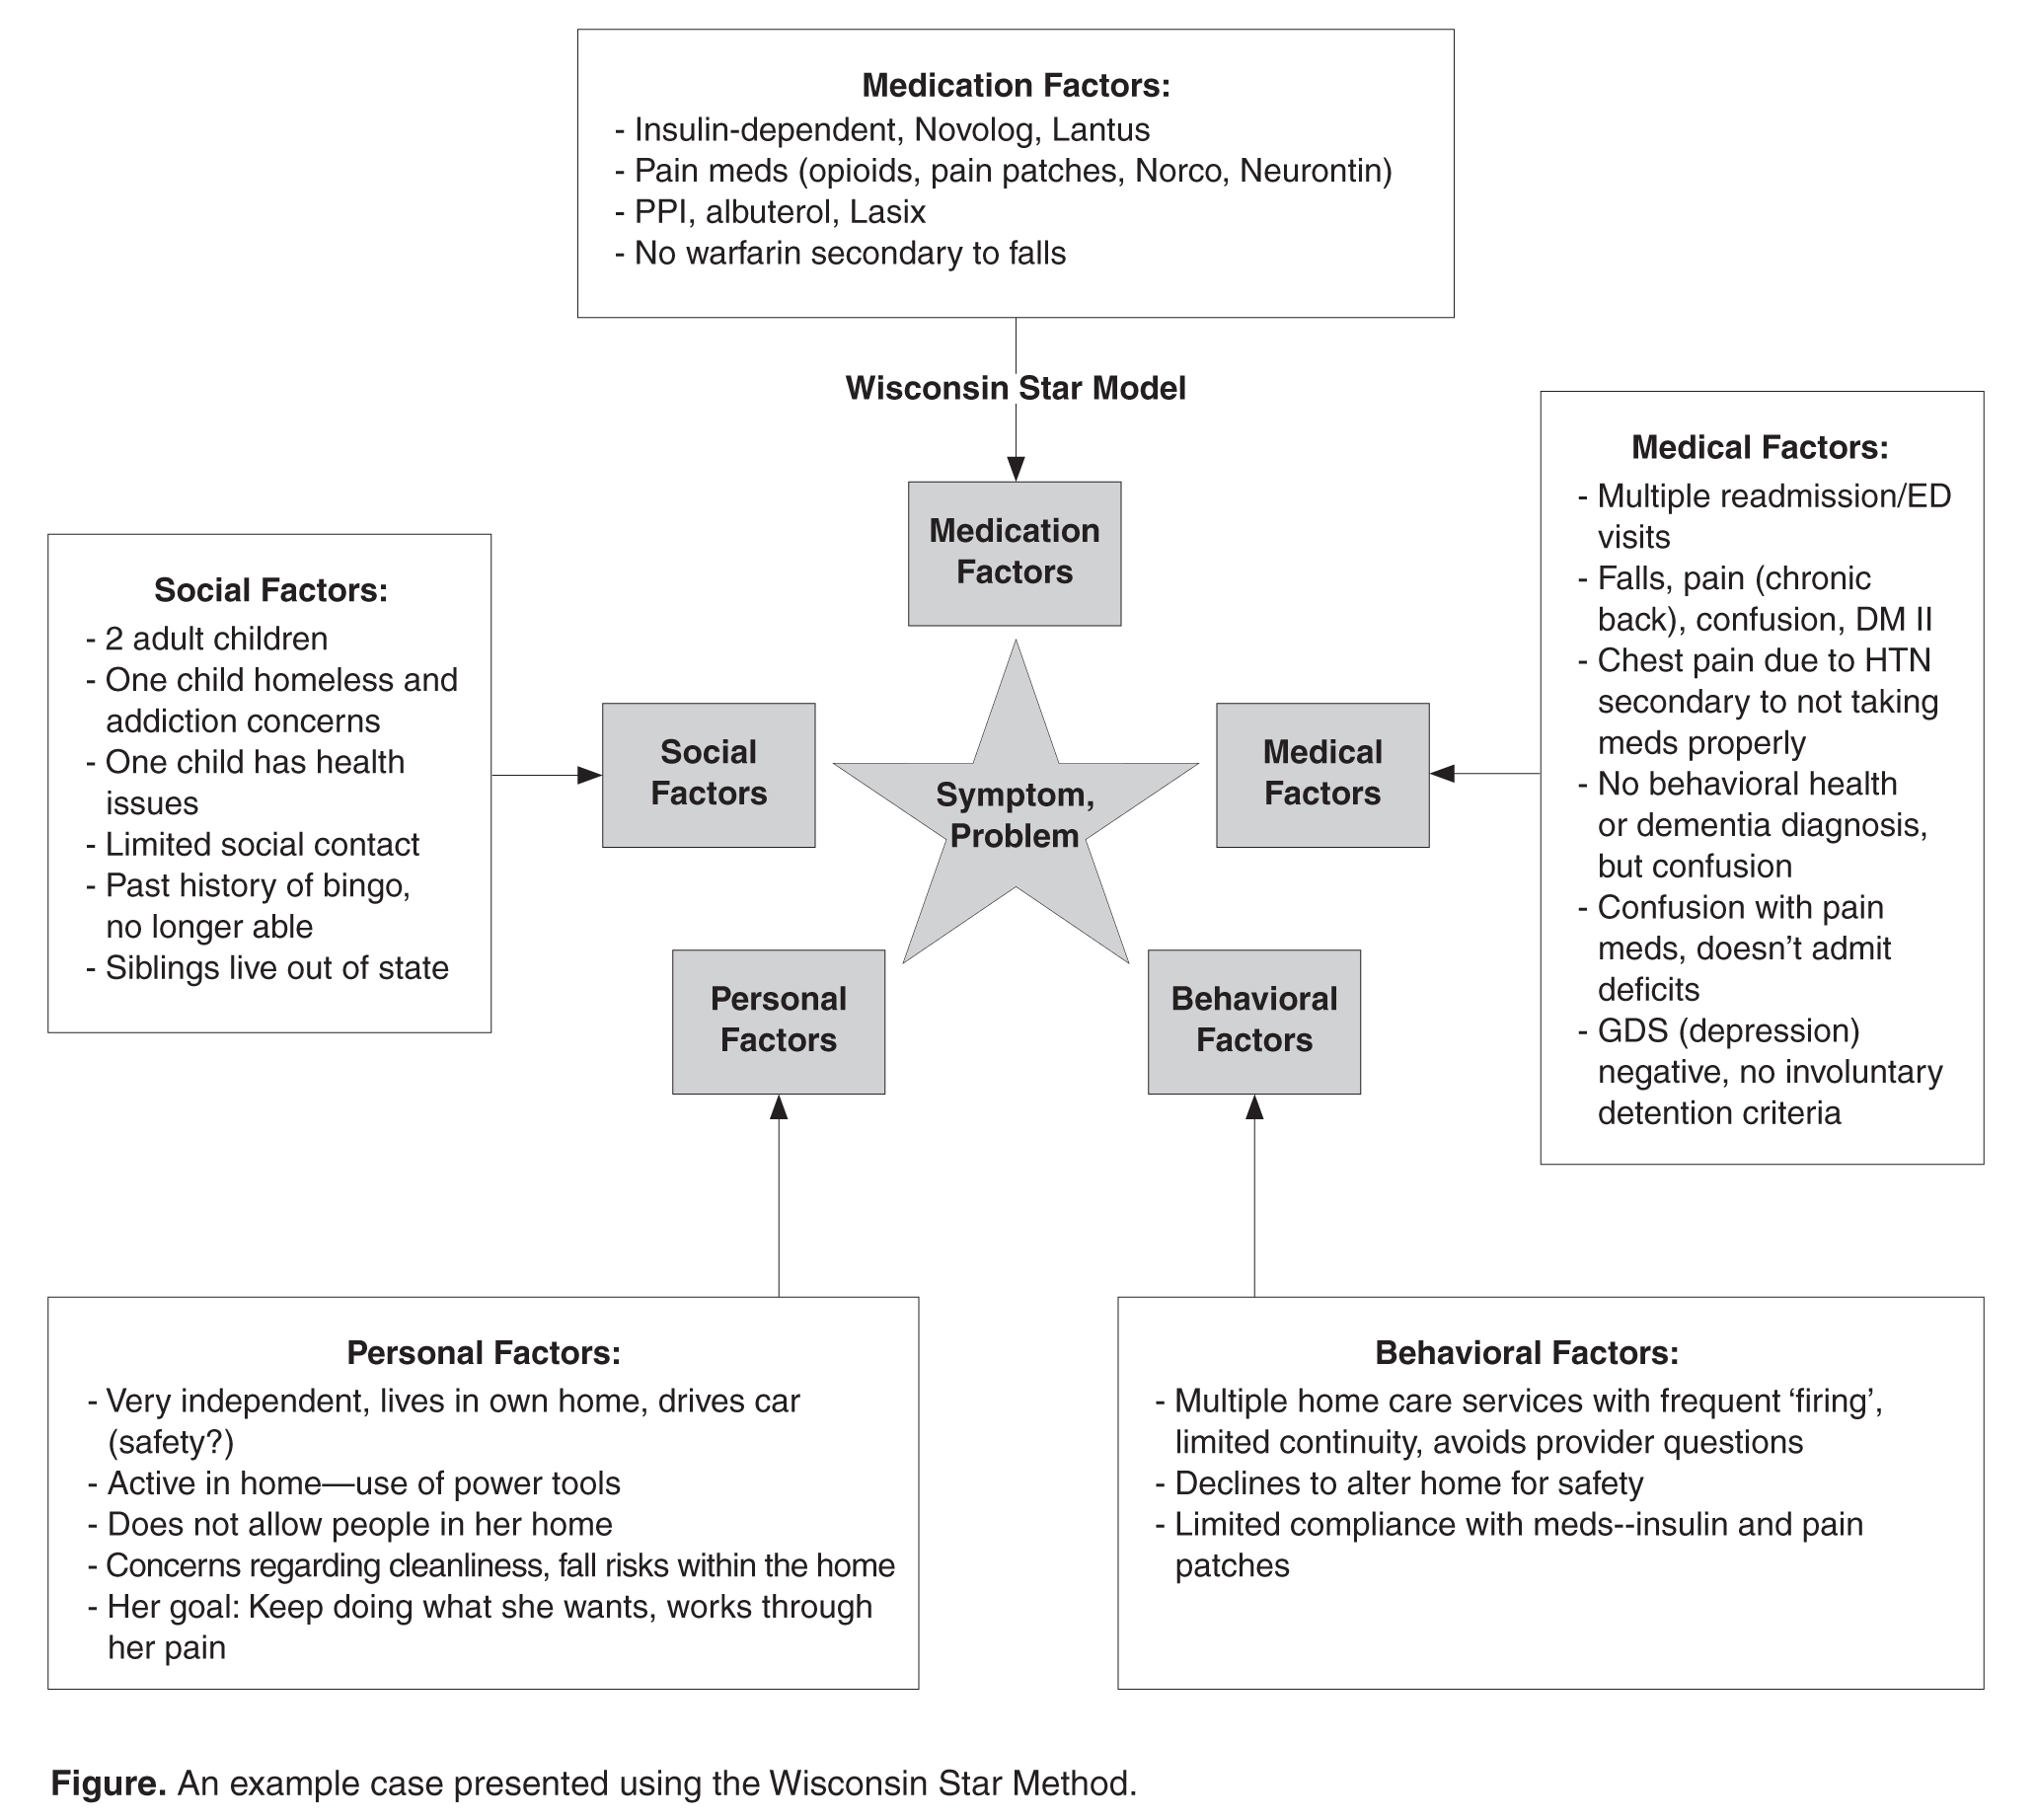
The team uses the Wisconsin Star Method framework for presentation and discussion of the case. The Star Method, developed by Timothy Howell, enables clinical data about a person to be mapped out onto a single field with 5 domains: medications, medical, behavioral, personal, and social [14], creating a visual representation of the complicated and interacting physical, emotional, and social issues of older adults (Figure). By becoming comfortable using this method, the learner can use a similar approach in their clinical practice to address the needs of the patient in a holistic manner.
The case call concludes with expert teaching points from both a geriatric expert and a member of the interdisciplinary team. The interdisciplinary team member is chosen based on the key issues raised by the case. For example, cases that are made complex due to polypharmacy and adverse drug reactions might have a pharmacist presenting pertinent take-home message for the learner. In addition, geriatric teaching experts (ie, a geriatrician or advanced practice geriatric nursing specialist) provide the learner with insights that they can apply to their future practice. Often times the teaching points consist of an analysis of the various geriatric syndromes and how they can be managed in the complex older adult.
Implementation
Implementation of the IGDCC is coordinated by an oversight team with representation from each of the 3 sponsoring health systems. The oversight team currently includes 4 members: 3 geriatric clinical nurse specialists and a geriatric service line administrator. The team is responsible for:
- Planning the conference call schedule
- Making arrangements for case presenters and experts to contribute teaching points
- Registering participants and sharing written materials with participants
- Publicizing and encouraging attendance
- Soliciting feedback for continual improvement
- Exploring and implementing new ways to maximize learning.
Team members share duties and rotate case presentations. The Aurora and Wheaton Franciscan systems provide the geriatric specialists who provide the expert teaching points. The Aspirus system provides the conference line and webinar application and supports publicity and evaluations. All 3 systems are supported by a geriatric clinical nurse specialist who identifies and helps prepare presenters, case presentations, and call participants. Over time, the conference call format has evolved into a webinar format, allowing participants to either phone into the call for audio only or participate via both audio and visual. The visual allows participants to watch on their computer screens while the case is presented using the Star Method. During the call, a member of the oversight team adds clinical details by typing into a Word template of a blank star, adding information for each of the 5 domains in real-time as the case is discussed. Another member of the team facilitates the call, introducing presenters and experts, describing the Star Method, and offering “housekeeping” announcements. The facilitator also watches the timing to make certain the agenda is followed and the call begins and ends on time. During the call, another member of the team updates the attendance spreadsheet and makes a recording of each session.
Some participating facilities reserve a meeting room and project the webinar onto a screen for shared viewing. One of the participating sites has done this quite successfully with a growing group of participants coming together to watch the case during their lunch hour. This allows an opportunity for group discussion—when the conference call is on “mute” so as not to disrupt learners at other locations.
Measurement/Analysis
Attendance has steadily increased. In CY2015 from January to September, the mean attendance per month was 29.1 (mode, 17). The maximum per month was 62 (September 2015). The program enjoyed a boost in attendance beginning in July 2015 when Nurses Improving Care of Healthsystem Elders (NICHE) [3] began promoting the call-in opportunity to its NICHE Coordinators at member health systems. In June 2015, the technology was improved to allow for recorded sessions, and the recordings are growing in popularity from 2 listeners per month in July 2014 to 23 listeners per month in September 2015.
Lessons Learned
In comparing the IGDCC with similar conference call educational offerings, the team found that the program was unique in 2 areas. First, in addition to having a rich discussion in the care of frail older adults with experts in the field, the team also sought to help our staff learn how to present a difficult case to their peers. Three of our 4 committee members are geriatric clinical nurse specialists (a fourth is a clinical nurse specialist from Aspirus who assists periodically) who have been able to mentor, guide, and encourage interdisciplinary team members to present a challenging case. Many presenters had never presented a difficult case in this format. Presenters found the process fun and rewarding and have offered to present cases again in the future.
A second unique feature was utilizing the Wisconsin Star Method rather than focusing on a typical medical model framework for discussing a challenging case. The Star Method allows participants to increase their proficiency in providing comprehensive care while being more confident and mindful in addressing the complicated interacting physical, emotional and social issues of older adults [13].
A monthly post-call debriefing with committee members to review the strengths and weakness of the call was key to growing the program. The committee was able to critically review the process of the call, review participant surveys and discuss next steps. Adding a webinar approach, automatic email notification of calls, participant electronic survey, recording the call, and the addition of offering contact hours were some of the action items that were a result of monthly debriefing calls.
The team also found the 3-system collaboration to be beneficial. Aspirus has a large rural population, and Wheaton and Aurora have a diverse population, and each adds to the participant’s experience. Each IGDCC was rotated between the systems, which did not put the burden on any one health system. An annual call assignment listing was maintained for noting which system was responsible for the case each month and whether the geriatric expert was assigned/confirmed. Identifying the committee’s individual and collective group expertise was helpful in the overall project planning. The committee also developed a standard presenter guide and template and an expert teaching guide so the monthly IGDCC were consistent.
Challenges
The committee did not have a budget. Participation on the committee was in-kind funding from each system. Aspirus used its electronic system in place at the time to support the project. Interactive conference call education platform can be challenging with multiple participants on an open line who may not mute their phone. Often times, when a group of participants are calling in from one phone line it is difficult to know how many people are attending the IGDCC. It can be challenging at times to facilitate the call during the discussion component as participants occasionally talk over each other.
Current Status/Future Directions
The team has completed 18 consecutive monthly IGDCCs. Our participation rate has tripled. Participant satisfaction remains favorable. The team is now offering 1 contact hour to participants, and our invitations to participate have been extended to national health care groups. Challenging cases will be presented from community sources outside the hospital. Focusing attention on elevating the level of geriatric care in our region using a community educational approach will give us new opportunities for collaborating on best practice in multiple settings across the care continuum.
Acknowledgment: The planning team acknowledges Evalyn Michira, MSN, RN, PHN, AGCNS-BC, for her assistance in call presentations.
Corresponding author: Margie Hackbarth, MBA, margie.hackbarth@aspirus.org.
Financial disclosures: none.
1. Institute of Medicine. Retooling for an aging America: Building the health care workforce. Washington, DC: National Academies Press; 2008.
2. Mitchell P, Wynia M, Golden R, et al. Core principles and values of effective team-based health care. Discussion paper. Washington, DC; Institute of Medicine; 2012.
3. Nurses Improving Care for Healthsystem Elders. Accessed 1 Dec 2015 at www.nicheprogram.org/.
4. Wisconsin Department of Health Services. Southeastern region population report: 1 Jul 2013. Accessed 16 Feb 2015 at www.dhs.wisconsin.gov/sites/default/files/legacy/population/13data/southeastern.pdf.
5. From the Centers for Disease Control and Prevention. Public health and aging: trends in aging--United States and worldwide. JAMA 2003;289:1371–3.
6. Hall MJ, DeFrances CJ, Williams SN, et al. National Hospital Discharge Survey: 2007 summary. Natl Health Stat Report 2010;(29):1–20, 24.
7. Nembhard IM, Edmondson AC. Making it safe: The effects of leader inclusiveness and professional status on psychological safety and improvement efforts in health care teams. J Organiz Behav 2006; 27:941–66.
8. Institute of Medicine. The future of nursing: leading change, advancing health. National Academies Press; 2011.
9. Reeves S, Zwarenstein M, Goldman et al. Interprofessional education: effects on professional practice and health care outcomes. Cochrane Database Syst Rev 2013;3:CD002213.
10. Salas E, Diaz Granados D, Klein C, et al. Does team training improve team performance? A meta-analysis. Hum Factors 2008;50:903–33.
11. Strasser DD, Burridge AB, Falconer JA, et al. Toward spanning the quality chasm: an examination of team functioning measures. Arch Phys Med Rehabil 2014;95:2220–3.
12. Roche VM, Torregosa H, Howell T, Malone ML. Establishing a treatment plan for an elder with a complex and incomplete medical history and multiple medical providers, diagnoses, and medications. Ann Long-Term Care 2012;20(9).
13. Roche VM, Arnouville J, Danto-Nocton ES, et al. Optimal management of an older patient with multiple comorbidities and a complex psychosocial history. Ann Long-Term Care 2011;19(9).
14. Wisconsin Geriatric Psychiatry Initiative. The Wisconsin Star Method. Accessed 19 Jan 2015 at wgpi.wisc.edu/wisconsin-star-method/.
From Wheaton Franciscan Healthcare (Ms. Fedel), Aspirus (Ms. Hackbarth), and Aurora Health Care (Mr. Malsch and Ms. Pagel).
Abstract
- Background: There is a nationwide shortage of geriatric prepared providers. Caring for complex older adults is challenging.
- Objective: To develop an efficient and affordable way to educate members of the interdisciplinary team involved in the care of geriatric patients.
- Methods: A team from 3 area health systems developed a plan to present monthly case studies via teleconference. Cases are presented by a direct caregiver using the Wisconsin Star Method to facilitate analysis of the case. A geriatric expert and another member of the team presents teaching points, and questions are elicited and discussed.
- Results: The team has completed 18 consecutive monthly teleconferences. Participant satisfaction has been favorable. Participation on the call has increased approximately 300% since the initiation of the program.
- Conclusion: The case teleconference provides an accessible and affordable educational forum that provides learners an opportunity to improve their knowledge in care of older adults.
The number of older adults in the United States will nearly double between 2005 and 2030 [1] as the baby boom generation begins turning 65 and as life expectancy for older Americans increases. The Institute of Medicine’s (IOM) landmark report Retooling for an Aging America: Building the Health Care Workforce states that “unless action is taken immediately, the health care workforce will lack the capacity (in both size and ability) to meet the needs of older patients in the future [1].” One of their recommendations is to explore ways to widen the duties and responsibilities of workers at various levels of training. More health care providers need to be trained in the basics of geriatric care and should be capable of caring for older patients.
Team-based care is becoming more prevalent. Care delivered by interdisciplinary teams have been shown to improve patient outcomes [2]. A team led by one of the authors (PF) developed an intervention to increase the geriatric and teamwork competencies of interdisciplinary teams who serve patients throughout Wisconsin. The Interdisciplinary Geriatric Difficult Case Conference Call (IGDCC) is sponsored monthly by 3 Wisconsin health systems. The purpose is to provide opportunities to discuss clinical cases, to learn from one another and from experts, and to elevate the level of geriatric care in the states of Wisconsin, Michigan, and beyond. Each month a difficult case is presented by a clinician involved in that patient’s care. Time is allotted for participants to ask questions, and teaching points are shared by a clinical expert to highlight concepts and provide additional context. The IGDCC is meant to be a joint learning exercise to explore a specific difficult patient situation and learn skills and knowledge to improve care and transitions for older adults. The conference call is not a critique of the care, but rather an opportunity to jointly learn from the challenging situations all experience.
Background
The IGDCC was created by four members of 3 health systems in Wisconsin: Wheaton Franciscan Healthcare, Aspirus, and Aurora Health Care. The health systems serve and partially overlap on a broad geographic and demographic area of Wisconsin. The 4 members collaborated on numerous projects in the past, including Nurses Improving Case for Health System Elders (NICHE) implementation [3]. A common concern among the team is the management of challenging geriatric clinical patients and having a prepared workforce to meet those challenges.
Problem/Issue
As mentioned above, the older adult population is increasing, and these statistics are reflected in our service area [4]. Exacerbating these demographic changes is a shortage of health care workers in all disciplines, inadequate geriatric training, and the increased prevalence of multiple chronic conditions. Older adults also have higher rates of 30-day readmissions as well as higher rates of functional decline and medical errors during hospital stays [5,6]. Effective interprofessional teamwork is essential for the delivery of high-quality patient care in an increasingly complex health environment [7]. The IOM’s Future of Nursing report recommends that nurses, who represent the largest segment of the US health workforce, should achieve higher levels of training and be full partners in redesigning health care [8]. Unfortunately, effective care is hampered by poor coordination, limited communication, boundary infringement, and lack of understanding of roles [9]. Meta-analyses have demonstrated that there is a positive relationship between team training interventions and outcomes [10,11].
Objectives
The objective of the IGDCC is to elevate the level of geriatric care in the region by providing an accessible and affordable forum for the education of health care workers involved in the care of our most vulnerable population. To meet this challenge, the 4 founding members of IGDCC utilized the Aurora Health Care Geriatric Fellow’s Most Difficult Case (GFMCC) conference format as a model [12,13]. All disciplines are encouraged to participate, with announcements sent out via the leadership at the participating hospital systems. Participants have the option to call into the conference and teleconference via their own personal telephone and computer; in addition, each participating hospital system frequently hosts an open forum teleconference room where participants also may join a group.
Conference Components
The team uses the Wisconsin Star Method framework for presentation and discussion of the case. The Star Method, developed by Timothy Howell, enables clinical data about a person to be mapped out onto a single field with 5 domains: medications, medical, behavioral, personal, and social [14], creating a visual representation of the complicated and interacting physical, emotional, and social issues of older adults (Figure). By becoming comfortable using this method, the learner can use a similar approach in their clinical practice to address the needs of the patient in a holistic manner.
The case call concludes with expert teaching points from both a geriatric expert and a member of the interdisciplinary team. The interdisciplinary team member is chosen based on the key issues raised by the case. For example, cases that are made complex due to polypharmacy and adverse drug reactions might have a pharmacist presenting pertinent take-home message for the learner. In addition, geriatric teaching experts (ie, a geriatrician or advanced practice geriatric nursing specialist) provide the learner with insights that they can apply to their future practice. Often times the teaching points consist of an analysis of the various geriatric syndromes and how they can be managed in the complex older adult.
Implementation
Implementation of the IGDCC is coordinated by an oversight team with representation from each of the 3 sponsoring health systems. The oversight team currently includes 4 members: 3 geriatric clinical nurse specialists and a geriatric service line administrator. The team is responsible for:
- Planning the conference call schedule
- Making arrangements for case presenters and experts to contribute teaching points
- Registering participants and sharing written materials with participants
- Publicizing and encouraging attendance
- Soliciting feedback for continual improvement
- Exploring and implementing new ways to maximize learning.
Team members share duties and rotate case presentations. The Aurora and Wheaton Franciscan systems provide the geriatric specialists who provide the expert teaching points. The Aspirus system provides the conference line and webinar application and supports publicity and evaluations. All 3 systems are supported by a geriatric clinical nurse specialist who identifies and helps prepare presenters, case presentations, and call participants. Over time, the conference call format has evolved into a webinar format, allowing participants to either phone into the call for audio only or participate via both audio and visual. The visual allows participants to watch on their computer screens while the case is presented using the Star Method. During the call, a member of the oversight team adds clinical details by typing into a Word template of a blank star, adding information for each of the 5 domains in real-time as the case is discussed. Another member of the team facilitates the call, introducing presenters and experts, describing the Star Method, and offering “housekeeping” announcements. The facilitator also watches the timing to make certain the agenda is followed and the call begins and ends on time. During the call, another member of the team updates the attendance spreadsheet and makes a recording of each session.
Some participating facilities reserve a meeting room and project the webinar onto a screen for shared viewing. One of the participating sites has done this quite successfully with a growing group of participants coming together to watch the case during their lunch hour. This allows an opportunity for group discussion—when the conference call is on “mute” so as not to disrupt learners at other locations.
Measurement/Analysis
Attendance has steadily increased. In CY2015 from January to September, the mean attendance per month was 29.1 (mode, 17). The maximum per month was 62 (September 2015). The program enjoyed a boost in attendance beginning in July 2015 when Nurses Improving Care of Healthsystem Elders (NICHE) [3] began promoting the call-in opportunity to its NICHE Coordinators at member health systems. In June 2015, the technology was improved to allow for recorded sessions, and the recordings are growing in popularity from 2 listeners per month in July 2014 to 23 listeners per month in September 2015.
Lessons Learned
In comparing the IGDCC with similar conference call educational offerings, the team found that the program was unique in 2 areas. First, in addition to having a rich discussion in the care of frail older adults with experts in the field, the team also sought to help our staff learn how to present a difficult case to their peers. Three of our 4 committee members are geriatric clinical nurse specialists (a fourth is a clinical nurse specialist from Aspirus who assists periodically) who have been able to mentor, guide, and encourage interdisciplinary team members to present a challenging case. Many presenters had never presented a difficult case in this format. Presenters found the process fun and rewarding and have offered to present cases again in the future.
A second unique feature was utilizing the Wisconsin Star Method rather than focusing on a typical medical model framework for discussing a challenging case. The Star Method allows participants to increase their proficiency in providing comprehensive care while being more confident and mindful in addressing the complicated interacting physical, emotional and social issues of older adults [13].
A monthly post-call debriefing with committee members to review the strengths and weakness of the call was key to growing the program. The committee was able to critically review the process of the call, review participant surveys and discuss next steps. Adding a webinar approach, automatic email notification of calls, participant electronic survey, recording the call, and the addition of offering contact hours were some of the action items that were a result of monthly debriefing calls.
The team also found the 3-system collaboration to be beneficial. Aspirus has a large rural population, and Wheaton and Aurora have a diverse population, and each adds to the participant’s experience. Each IGDCC was rotated between the systems, which did not put the burden on any one health system. An annual call assignment listing was maintained for noting which system was responsible for the case each month and whether the geriatric expert was assigned/confirmed. Identifying the committee’s individual and collective group expertise was helpful in the overall project planning. The committee also developed a standard presenter guide and template and an expert teaching guide so the monthly IGDCC were consistent.
Challenges
The committee did not have a budget. Participation on the committee was in-kind funding from each system. Aspirus used its electronic system in place at the time to support the project. Interactive conference call education platform can be challenging with multiple participants on an open line who may not mute their phone. Often times, when a group of participants are calling in from one phone line it is difficult to know how many people are attending the IGDCC. It can be challenging at times to facilitate the call during the discussion component as participants occasionally talk over each other.
Current Status/Future Directions
The team has completed 18 consecutive monthly IGDCCs. Our participation rate has tripled. Participant satisfaction remains favorable. The team is now offering 1 contact hour to participants, and our invitations to participate have been extended to national health care groups. Challenging cases will be presented from community sources outside the hospital. Focusing attention on elevating the level of geriatric care in our region using a community educational approach will give us new opportunities for collaborating on best practice in multiple settings across the care continuum.
Acknowledgment: The planning team acknowledges Evalyn Michira, MSN, RN, PHN, AGCNS-BC, for her assistance in call presentations.
Corresponding author: Margie Hackbarth, MBA, margie.hackbarth@aspirus.org.
Financial disclosures: none.
1. Institute of Medicine. Retooling for an aging America: Building the health care workforce. Washington, DC: National Academies Press; 2008.
2. Mitchell P, Wynia M, Golden R, et al. Core principles and values of effective team-based health care. Discussion paper. Washington, DC; Institute of Medicine; 2012.
3. Nurses Improving Care for Healthsystem Elders. Accessed 1 Dec 2015 at www.nicheprogram.org/.
4. Wisconsin Department of Health Services. Southeastern region population report: 1 Jul 2013. Accessed 16 Feb 2015 at www.dhs.wisconsin.gov/sites/default/files/legacy/population/13data/southeastern.pdf.
5. From the Centers for Disease Control and Prevention. Public health and aging: trends in aging--United States and worldwide. JAMA 2003;289:1371–3.
6. Hall MJ, DeFrances CJ, Williams SN, et al. National Hospital Discharge Survey: 2007 summary. Natl Health Stat Report 2010;(29):1–20, 24.
7. Nembhard IM, Edmondson AC. Making it safe: The effects of leader inclusiveness and professional status on psychological safety and improvement efforts in health care teams. J Organiz Behav 2006; 27:941–66.
8. Institute of Medicine. The future of nursing: leading change, advancing health. National Academies Press; 2011.
9. Reeves S, Zwarenstein M, Goldman et al. Interprofessional education: effects on professional practice and health care outcomes. Cochrane Database Syst Rev 2013;3:CD002213.
10. Salas E, Diaz Granados D, Klein C, et al. Does team training improve team performance? A meta-analysis. Hum Factors 2008;50:903–33.
11. Strasser DD, Burridge AB, Falconer JA, et al. Toward spanning the quality chasm: an examination of team functioning measures. Arch Phys Med Rehabil 2014;95:2220–3.
12. Roche VM, Torregosa H, Howell T, Malone ML. Establishing a treatment plan for an elder with a complex and incomplete medical history and multiple medical providers, diagnoses, and medications. Ann Long-Term Care 2012;20(9).
13. Roche VM, Arnouville J, Danto-Nocton ES, et al. Optimal management of an older patient with multiple comorbidities and a complex psychosocial history. Ann Long-Term Care 2011;19(9).
14. Wisconsin Geriatric Psychiatry Initiative. The Wisconsin Star Method. Accessed 19 Jan 2015 at wgpi.wisc.edu/wisconsin-star-method/.
Longer-Term Evidence Supporting Bariatric Surgery in Adolescents
Study Overview
Objective. To examine the efficacy and safety of weight-loss surgery in adolescents.
Design. Prospective observational study.
Setting and participants. Adolescents (aged 13–19 years) with severe obesity undergoing bariatric surgery at 5 U.S. hospitals and medical centers from March 2007 through February 2012. Participants were enrolled in the Teen-Longitudinal Assessment of Bariatric Surgery (Teen-LABS) study, a longitudinal prospective study that investigated the risks and benefits of adolescent bariatric surgery.
Main outcome measures. Data was collected on weight, comorbidities, cardiometabolic risk factors, nutritional status, and weight-related quality of life at research visits scheduled at 6 months, 1 year, 2 years, and 3 years post bariatric surgery. Researchers measured height and weight and blood pressure directly and calculated BMI. They assessed for comorbidities and cardiometabolic risk factors through urine and serum laboratory tests of lipids, glomerular filtration rate, albumin, glycated hemoglobin, fasting glucose level, and insulin. They assessed nutritional status with laboratory values for serum albumin, folate, vitamin B12, 25-hydroxyvitamin D, parathyroid hormone, ferritin, transferrin, vitamin A, and vitamin B1 erythrocyte transketolase. Researchers conducted interviews with the participants to collect information about subsequent medical or surgical procedures or, if participants missed a research visit, they obtained information through chart reviews. Finally, weight-related quality of life was assessed with the Impact of Weight on Quality of Life-Kids instrument, a validated self-report measure with 27 items divided into 4 subscales: physical comfort, body esteem, social life, and family relations.
Main results. Analysis was conducted on results for 228 of 242 participants who received Roux-en-Y gastric bypass (n = 161) and sleeve gastrectomy (n = 67). Results for 14 participants who received adjustable gastric banding were not included due to the small size of that group. Mean weight loss was 41 kg while mean height increased by only 0.51 cm. The mean percentage of weight loss was 27% overall and was similar in both groups, 28% in participants who underwent gastric bypass and 26% in those who underwent sleeve gastrectomy. At the 3-year visit, there were statistically significant improvements in comorbidities: 74% of the 96 participants with elevated blood pressure, 66% of the 171 participants with dyslipidemia, and 86% of the 36 participants with abnormal kidney function at baseline had values within the normal range. None of 3 participants with type 1 diabetes at baseline had resolution. However, 29 participants had type 2 diabetes (median glycolated hemoglobin 6.3% at baseline) and 19 of 20 of them for whom data were available at 3 years were in remission, with a median glycolated hemoglobin of 5.3%. There was an increase in the number of participants with micronutrient deficiencies at the 3-year mark: the percentage of participants with low ferritin levels increased from 5% at baseline to 57%, those with low vitamin B12 increased from < 1% to 8%, and those with low vitamin A increased from 6% to 16%. During the 3-year follow-up period, 30 participants underwent 44 intrabdominal procedures related to the bariatric procedure and 29 participants underwent 48 endoscopic procedures, including stricture dilatation (n = 11). Total scores on the Impact of Weight on Quality of Life-Kids instrument improved from a mean of 63 at baseline to 83 at 3 years.
Conclusion. Overall there were significant improvements in weight, comorbidities, cardiometabolic health, and weight-related quality of life. However, there were also risks, including increased micronutrient deficiencies and the need for subsequent invasive abdominal procedures.
Commentary
Pediatric obesity is one of the most significant health problems facing children and adolescents. According to the most recent estimates, 34.5% of all adolescents aged 12 to 19 years are overweight or obese [1]. Pediatric obesity has serious short- and long-term psychosocial and physical implications. Obese adolescents suffer from social marginalization, poor self-concept, and lower health-related quality of life [2,3]. They are at greater risk for metabolic syndrome, diabetes, obstructive sleep apnea, and conditions associated with coronary artery disease such as hyperlipidemia and hypertension [4,5]. Additionally, obesity in adolescence is strongly associated with early mortality and years of life lost [6].
Despite extensive research and public health campaigns, rates of adolescent obesity have not decreased since 2003 [1]. Diet and behavioral approaches have had limited success and are rarely sustained over time. Bariatric surgery is an approach that has been used safely and effectively in severely obese adults and is increasingly being used for adolescents as well [7]. The results of this study are encouraging in that they suggest that bariatric surgery is effective in adolescents, leading to significant and sustained weight loss over 3 years and improved cardiometabolic health and weight-related quality of life.
The procedures are not without risks as demonstrated by the findings of micronutrient deficiencies and the need for follow-up intraabdominal and endoscopic procedures. The number of follow-up procedures and the fact that they continued into the third year is concerning. More details about this finding, such as characteristics of participants who required them, would be helpful. Further research to determine risk factors associated with complications that require subsequent invasive procedures is important for developing criteria for selection of candidates for bariatric surgery. Additionally, there was no information on impact of the follow-up procedures on participants or the conditions that precipitated them. In addition, there was no information on physical sequelae that can cause ongoing distress for patients, eg, chronic abdominal cramping and pain. The authors measured weight-related quality of life but measuring overall quality of life post-procedure would have captured the impact of post-procedure dietary restrictions and any medical problems. Such data could be helpful in decision-making about the use of bariatric procedures in this population versus noninvasive approaches to management.
As the authors note, treating severe obesity in adolescence rather than waiting until adulthood may have significant implications for improved health in adulthood, particularly in preventing or reversing cardiovascular damage related to obesity-related cardiometabolic risk factors. However, what is not known yet is whether the positive outcomes, beginning with weight loss, are sustained through adulthood. This 3-year longitudinal study was the first to examine factors over an extended time period, however, considering the average life expectancy of an adolescent, it provides only a relatively short-term outlook. A longitudinal study that follows a cohort of adolescents from the time of the bariatric procedure into middle age or beyond is needed. Such a study would also provide needed information about the long-term consequences of repeated intraabdominal procedures and the persistence or resolution of micronutrient deficiencies and their effects on health.
The strengths of this study are its prospective longitudinal design and its high rate of cohort completion (99% of participants remained actively involved, completing 88% of follow-up visits). As the authors note, the lack of a control group of adolescents treated with diet and behavioral approaches prevents any definitive statement about the benefits and risks compared to nonsurgical approaches. However, previous research indicates that weight loss is not as great nor sustained when nonsurgical approaches are used.
Applications for Clinical Practice
The use of bariatric surgery in adolescents is a promising approach to a major health problem that has proven resistant to concerted medical and public health efforts and the use of nonsurgical treatments. Ongoing longitudinal research is needed but the positive outcomes seen here—sustained significant weight loss, improvement in cardiometabolic risk factors and comorbidities, and improved weight-related quality of life—indicate that bariatric surgery is an effective treatment for adolescent obesity when diet and behavioral approaches have failed. However, the occurrence of post-procedure complications also highlights the need for caution. Clinicians must carefully weigh the risk-benefit ratio for each individual, taking into consideration the long-term implications of severe obesity, any potential for significant weight loss with diet and behavioral changes, and the positive outcomes of bariatric surgery demonstrated here.
—Karen Roush, PhD, RN
1. Ogden CL, Carroll MD, Kit BK, Flegal KM. Prevalence of childhood and adult obesity in the United States, 2011–2012. JAMA 2014;311:806–14.
2. Schwimmer JB, Burwinkle TM, Varni JW. Health-related quality of life of severely obese children and adolescents. JAMA 2003;289:1813–9.
3. Strauss RS, Pollack HA. Social marginalization of overweight children. Arch Pediatr Adolesc Med 2003;157:746–52.
4. Inge TH, Zeller MH, Lawson ML, Daniels SR. A critical appraisal of evidence supporting a bariatric surgical approach to weight management for adolescents. J Pediatr 2005;147:10–9.
5. Weiss R, Dziura J, Burgert TS, et al. Obesity and the metabolic syndrome in children and adolescents. N Engl J Med 2004;350:2362–74.
6. Fontaine KR, Redden DT, Wang C, et al. Years of life lost due to obesity. JAMA 2003;289:187–93.
7. Zwintscher NP, Azarow KS, Horton JD, et al. The increasing incidence of adolescent bariatric surgery. J Pediatr Surg 2013;48:2401–7.
Study Overview
Objective. To examine the efficacy and safety of weight-loss surgery in adolescents.
Design. Prospective observational study.
Setting and participants. Adolescents (aged 13–19 years) with severe obesity undergoing bariatric surgery at 5 U.S. hospitals and medical centers from March 2007 through February 2012. Participants were enrolled in the Teen-Longitudinal Assessment of Bariatric Surgery (Teen-LABS) study, a longitudinal prospective study that investigated the risks and benefits of adolescent bariatric surgery.
Main outcome measures. Data was collected on weight, comorbidities, cardiometabolic risk factors, nutritional status, and weight-related quality of life at research visits scheduled at 6 months, 1 year, 2 years, and 3 years post bariatric surgery. Researchers measured height and weight and blood pressure directly and calculated BMI. They assessed for comorbidities and cardiometabolic risk factors through urine and serum laboratory tests of lipids, glomerular filtration rate, albumin, glycated hemoglobin, fasting glucose level, and insulin. They assessed nutritional status with laboratory values for serum albumin, folate, vitamin B12, 25-hydroxyvitamin D, parathyroid hormone, ferritin, transferrin, vitamin A, and vitamin B1 erythrocyte transketolase. Researchers conducted interviews with the participants to collect information about subsequent medical or surgical procedures or, if participants missed a research visit, they obtained information through chart reviews. Finally, weight-related quality of life was assessed with the Impact of Weight on Quality of Life-Kids instrument, a validated self-report measure with 27 items divided into 4 subscales: physical comfort, body esteem, social life, and family relations.
Main results. Analysis was conducted on results for 228 of 242 participants who received Roux-en-Y gastric bypass (n = 161) and sleeve gastrectomy (n = 67). Results for 14 participants who received adjustable gastric banding were not included due to the small size of that group. Mean weight loss was 41 kg while mean height increased by only 0.51 cm. The mean percentage of weight loss was 27% overall and was similar in both groups, 28% in participants who underwent gastric bypass and 26% in those who underwent sleeve gastrectomy. At the 3-year visit, there were statistically significant improvements in comorbidities: 74% of the 96 participants with elevated blood pressure, 66% of the 171 participants with dyslipidemia, and 86% of the 36 participants with abnormal kidney function at baseline had values within the normal range. None of 3 participants with type 1 diabetes at baseline had resolution. However, 29 participants had type 2 diabetes (median glycolated hemoglobin 6.3% at baseline) and 19 of 20 of them for whom data were available at 3 years were in remission, with a median glycolated hemoglobin of 5.3%. There was an increase in the number of participants with micronutrient deficiencies at the 3-year mark: the percentage of participants with low ferritin levels increased from 5% at baseline to 57%, those with low vitamin B12 increased from < 1% to 8%, and those with low vitamin A increased from 6% to 16%. During the 3-year follow-up period, 30 participants underwent 44 intrabdominal procedures related to the bariatric procedure and 29 participants underwent 48 endoscopic procedures, including stricture dilatation (n = 11). Total scores on the Impact of Weight on Quality of Life-Kids instrument improved from a mean of 63 at baseline to 83 at 3 years.
Conclusion. Overall there were significant improvements in weight, comorbidities, cardiometabolic health, and weight-related quality of life. However, there were also risks, including increased micronutrient deficiencies and the need for subsequent invasive abdominal procedures.
Commentary
Pediatric obesity is one of the most significant health problems facing children and adolescents. According to the most recent estimates, 34.5% of all adolescents aged 12 to 19 years are overweight or obese [1]. Pediatric obesity has serious short- and long-term psychosocial and physical implications. Obese adolescents suffer from social marginalization, poor self-concept, and lower health-related quality of life [2,3]. They are at greater risk for metabolic syndrome, diabetes, obstructive sleep apnea, and conditions associated with coronary artery disease such as hyperlipidemia and hypertension [4,5]. Additionally, obesity in adolescence is strongly associated with early mortality and years of life lost [6].
Despite extensive research and public health campaigns, rates of adolescent obesity have not decreased since 2003 [1]. Diet and behavioral approaches have had limited success and are rarely sustained over time. Bariatric surgery is an approach that has been used safely and effectively in severely obese adults and is increasingly being used for adolescents as well [7]. The results of this study are encouraging in that they suggest that bariatric surgery is effective in adolescents, leading to significant and sustained weight loss over 3 years and improved cardiometabolic health and weight-related quality of life.
The procedures are not without risks as demonstrated by the findings of micronutrient deficiencies and the need for follow-up intraabdominal and endoscopic procedures. The number of follow-up procedures and the fact that they continued into the third year is concerning. More details about this finding, such as characteristics of participants who required them, would be helpful. Further research to determine risk factors associated with complications that require subsequent invasive procedures is important for developing criteria for selection of candidates for bariatric surgery. Additionally, there was no information on impact of the follow-up procedures on participants or the conditions that precipitated them. In addition, there was no information on physical sequelae that can cause ongoing distress for patients, eg, chronic abdominal cramping and pain. The authors measured weight-related quality of life but measuring overall quality of life post-procedure would have captured the impact of post-procedure dietary restrictions and any medical problems. Such data could be helpful in decision-making about the use of bariatric procedures in this population versus noninvasive approaches to management.
As the authors note, treating severe obesity in adolescence rather than waiting until adulthood may have significant implications for improved health in adulthood, particularly in preventing or reversing cardiovascular damage related to obesity-related cardiometabolic risk factors. However, what is not known yet is whether the positive outcomes, beginning with weight loss, are sustained through adulthood. This 3-year longitudinal study was the first to examine factors over an extended time period, however, considering the average life expectancy of an adolescent, it provides only a relatively short-term outlook. A longitudinal study that follows a cohort of adolescents from the time of the bariatric procedure into middle age or beyond is needed. Such a study would also provide needed information about the long-term consequences of repeated intraabdominal procedures and the persistence or resolution of micronutrient deficiencies and their effects on health.
The strengths of this study are its prospective longitudinal design and its high rate of cohort completion (99% of participants remained actively involved, completing 88% of follow-up visits). As the authors note, the lack of a control group of adolescents treated with diet and behavioral approaches prevents any definitive statement about the benefits and risks compared to nonsurgical approaches. However, previous research indicates that weight loss is not as great nor sustained when nonsurgical approaches are used.
Applications for Clinical Practice
The use of bariatric surgery in adolescents is a promising approach to a major health problem that has proven resistant to concerted medical and public health efforts and the use of nonsurgical treatments. Ongoing longitudinal research is needed but the positive outcomes seen here—sustained significant weight loss, improvement in cardiometabolic risk factors and comorbidities, and improved weight-related quality of life—indicate that bariatric surgery is an effective treatment for adolescent obesity when diet and behavioral approaches have failed. However, the occurrence of post-procedure complications also highlights the need for caution. Clinicians must carefully weigh the risk-benefit ratio for each individual, taking into consideration the long-term implications of severe obesity, any potential for significant weight loss with diet and behavioral changes, and the positive outcomes of bariatric surgery demonstrated here.
—Karen Roush, PhD, RN
1. Ogden CL, Carroll MD, Kit BK, Flegal KM. Prevalence of childhood and adult obesity in the United States, 2011–2012. JAMA 2014;311:806–14.
2. Schwimmer JB, Burwinkle TM, Varni JW. Health-related quality of life of severely obese children and adolescents. JAMA 2003;289:1813–9.
3. Strauss RS, Pollack HA. Social marginalization of overweight children. Arch Pediatr Adolesc Med 2003;157:746–52.
4. Inge TH, Zeller MH, Lawson ML, Daniels SR. A critical appraisal of evidence supporting a bariatric surgical approach to weight management for adolescents. J Pediatr 2005;147:10–9.
5. Weiss R, Dziura J, Burgert TS, et al. Obesity and the metabolic syndrome in children and adolescents. N Engl J Med 2004;350:2362–74.
6. Fontaine KR, Redden DT, Wang C, et al. Years of life lost due to obesity. JAMA 2003;289:187–93.
7. Zwintscher NP, Azarow KS, Horton JD, et al. The increasing incidence of adolescent bariatric surgery. J Pediatr Surg 2013;48:2401–7.
Fruits But Not Vegetables Associated with Lower Risk of Developing Hypertension
Study Overview
Objective. To examine the association of individual fruit and vegetable intake with the risk of developing hypertension.
Design. Meta-analysis.
Setting and participants. Subjects were derived from the Nurses’ Health Study (n = 121,700 women, aged 30–55 years in 1976), the Nurses’ Health Study II (n = 116,430 women, aged 25–42 years in 1989), and the Health Professionals Follow-up Study (n = 51,529 men, aged 40–75 years in 1986). Participants returned a questionnaire every 2 years reporting a diagnosis of hypertension by a health care provider. Participants also answered qualitative–quantitative food frequency questionnaires (FFQs) every 4 years, reporting an intake of > 130 foods and beverages. Participants who reported a diagnosis of hypertension at the baseline questionnaire were excluded from the analysis.
Main outcome measures. Self-reported incident hypertension.
Results. Compared to participants whose consumption of fruits and vegetables was ≤ 4 servings/week, those whose intake was ≥ 4 servings/day had multivariable pooled hazard ratios for incident hypertension of 0.92 (95% confidence interval [CI], 0.87–0.97) for total whole fruit intake and 0.95 (CI, 0.86–1.04) for total vegetable intake. Similarly, compared to participants who did not increase their fruit or vegetable consumption, the pooled hazard ratios for those whose intake increased by ≥ 7 servings/week were 0.94 (0.90–0.97) for total whole fruit intake and 0.98 (0.94–1.01) for total vegetable intake. When individual fruit and vegetable consumption was analyzed, consumption levels of ≥ 4 servings/week (as opposed to < 1 serving/month) of broccoli, carrots, tofu or soybeans, raisins, and apples were associated with lower hypertension risk. String beans, brussel sprouts, and cantaloupe were associated with increased risk of hypertension.
Conclusion. The study findings suggested that greater long-term intake and increased consumption of whole fruits may reduce the risk of developing hypertension.
Commentary
Hypertension is a major risk factor for cardiovascular disease and a growing public health concern. Effective public health interventions that will lead to population-wide reductions in blood pressure are needed. The adoption of a healthy diet and low sodium intake is recommended by the American Heart Association in order to prevent hypertension in adults [1]. However, specific information about the benefits of long-term intake and individual foods is limited.
This study aimed to examine the association of individual fruit and vegetable intake with the risk of developing hypertension in 3 large prospective cohort studies in the United States. It was found that greater long-term intake and increased consumption of whole fruits may reduce risk of developing hypertension. Participants with higher fruit and vegetable intakes were more physically active, older, had higher daily caloric intakes, and were less likely to be smokers.
This study was novel in that it examined individual fruit and vegetable consumption. All 3 studies provided a large sample, which increased precision and power in the statistical analysis. Researchers were focused on establishing an association between the risk of hypertension and fruit and vegetable consumption; therefore, hazard ratios were presented and Cox regression and multivariate analysis were used, which are appropriate statistical methods for this type of study.
Some limitations should be mentioned. Blood pressure was not directly measured. Food intake was measured using a dietary questionnaire and may not have accurately represented actual intake. Also, participants were mostly non-Hispanic white men and women and other population groups were not well represented.
Applications for Clinical Practice
Reducing the risk for hypertension by increasing fruit consumption needs to be examined in other population groups and studies. In the meantime, clinicians can continue to recommend an eating plan that is rich in fruits, vegetables, and low-fat dairy products and reduced in saturated fat, total fat, and cholesterol.
—Paloma Cesar de Sales, BS, RN, MS
1. American Heart Association. Prevention of high blood pressure. Available at www.heart.org/HEARTORG/Conditions/HighBloodPressure/PreventionTreatmentofHighBloodPressure/Shaking-the-Salt-Habit_UCM_303241_Article.jsp#.VsNZ8eZab-Y.
Study Overview
Objective. To examine the association of individual fruit and vegetable intake with the risk of developing hypertension.
Design. Meta-analysis.
Setting and participants. Subjects were derived from the Nurses’ Health Study (n = 121,700 women, aged 30–55 years in 1976), the Nurses’ Health Study II (n = 116,430 women, aged 25–42 years in 1989), and the Health Professionals Follow-up Study (n = 51,529 men, aged 40–75 years in 1986). Participants returned a questionnaire every 2 years reporting a diagnosis of hypertension by a health care provider. Participants also answered qualitative–quantitative food frequency questionnaires (FFQs) every 4 years, reporting an intake of > 130 foods and beverages. Participants who reported a diagnosis of hypertension at the baseline questionnaire were excluded from the analysis.
Main outcome measures. Self-reported incident hypertension.
Results. Compared to participants whose consumption of fruits and vegetables was ≤ 4 servings/week, those whose intake was ≥ 4 servings/day had multivariable pooled hazard ratios for incident hypertension of 0.92 (95% confidence interval [CI], 0.87–0.97) for total whole fruit intake and 0.95 (CI, 0.86–1.04) for total vegetable intake. Similarly, compared to participants who did not increase their fruit or vegetable consumption, the pooled hazard ratios for those whose intake increased by ≥ 7 servings/week were 0.94 (0.90–0.97) for total whole fruit intake and 0.98 (0.94–1.01) for total vegetable intake. When individual fruit and vegetable consumption was analyzed, consumption levels of ≥ 4 servings/week (as opposed to < 1 serving/month) of broccoli, carrots, tofu or soybeans, raisins, and apples were associated with lower hypertension risk. String beans, brussel sprouts, and cantaloupe were associated with increased risk of hypertension.
Conclusion. The study findings suggested that greater long-term intake and increased consumption of whole fruits may reduce the risk of developing hypertension.
Commentary
Hypertension is a major risk factor for cardiovascular disease and a growing public health concern. Effective public health interventions that will lead to population-wide reductions in blood pressure are needed. The adoption of a healthy diet and low sodium intake is recommended by the American Heart Association in order to prevent hypertension in adults [1]. However, specific information about the benefits of long-term intake and individual foods is limited.
This study aimed to examine the association of individual fruit and vegetable intake with the risk of developing hypertension in 3 large prospective cohort studies in the United States. It was found that greater long-term intake and increased consumption of whole fruits may reduce risk of developing hypertension. Participants with higher fruit and vegetable intakes were more physically active, older, had higher daily caloric intakes, and were less likely to be smokers.
This study was novel in that it examined individual fruit and vegetable consumption. All 3 studies provided a large sample, which increased precision and power in the statistical analysis. Researchers were focused on establishing an association between the risk of hypertension and fruit and vegetable consumption; therefore, hazard ratios were presented and Cox regression and multivariate analysis were used, which are appropriate statistical methods for this type of study.
Some limitations should be mentioned. Blood pressure was not directly measured. Food intake was measured using a dietary questionnaire and may not have accurately represented actual intake. Also, participants were mostly non-Hispanic white men and women and other population groups were not well represented.
Applications for Clinical Practice
Reducing the risk for hypertension by increasing fruit consumption needs to be examined in other population groups and studies. In the meantime, clinicians can continue to recommend an eating plan that is rich in fruits, vegetables, and low-fat dairy products and reduced in saturated fat, total fat, and cholesterol.
—Paloma Cesar de Sales, BS, RN, MS
1. American Heart Association. Prevention of high blood pressure. Available at www.heart.org/HEARTORG/Conditions/HighBloodPressure/PreventionTreatmentofHighBloodPressure/Shaking-the-Salt-Habit_UCM_303241_Article.jsp#.VsNZ8eZab-Y.
1. American Heart Association. Prevention of high blood pressure. Available at www.heart.org/HEARTORG/Conditions/HighBloodPressure/PreventionTreatmentofHighBloodPressure/Shaking-the-Salt-Habit_UCM_303241_Article.jsp#.VsNZ8eZab-Y.
Slow and Steady May Not Win the Race for Weight Loss Maintenance
Study Overview
Objective. To compare weight regain after rapid versus slower loss of an equivalent amount of weight.
Study design. Randomized clinical trial.
Setting and participants. This study took place in a single medical center in the Netherlands. Investigators recruited 61 adults (no age range provided) with body mass index (BMI) between 28–35 kg/m2 and at a stable weight (no change of > 3 kg for the past 2 months) to participate in a weight loss study. Individuals with type 2 diabetes, dyslipidemia, uncontrolled hypertension, or liver, heart or kidney disease were excluded, as were those who were currently pregnant or reported consuming more than moderate amounts of alcohol.
Once consented, participants were randomized into one of 2 study arms. The rapid weight loss arm was prescribed a very-low-calorie diet (VLCD) with just 500 kcal/day (43% protein/43% carb/14% fat) for 5 weeks, after which they transitioned to a 4-week “weight stable” period, and then a 9-month follow-up period (overall follow-up time of ~11 months; 10 months after weight loss). In contrast, the slower weight loss arm was prescribed a low-calorie diet (LCD) with 1250 kcal/day (29% protein/48% carb/23% fat) for 12 weeks, after which they also transitioned to a 4-week weight stable period and 9 months of follow-up (overall follow-up time of ~13 months; 10 months after weight loss). VLCD (rapid weight loss) participants received 3 meal replacement shakes per day (totaling 500 kcal) during the weight loss period and were also told they could consume unlimited amounts of low-calorie vegetables. The LCD (slower weight loss) participants received 1 meal replacement shake per day during their 12 weeks of weight loss and were responsible for providing the remainder of their own meals and snacks according to guidelines from a study dietitian. Following active weight loss, both groups then shifted to higher-calorie, food-based diets during a “weight stable” 4-week period and were responsible during this time for providing all of their own food. The researchers do not specify the details of the diet composition for this weight stable period. Exposure to the registered dietitian was the same in both groups, with 5 consultations during weight loss (weekly for VLCD, presumably more spaced out for LCD) and 4 during weight stable period. No further diet advice or meal replacement support was given during the 9-month follow-up period, but participants came in for monthly weigh-ins.
Main outcome measure. The primary outcome measure was change in weight (ie, amount of weight regained) during the 9-month follow-up period, compared between groups using an independent samples t test. Additional biometric measures included change in waist circumference and changes in body composition. For the latter, the researchers used a “Bod Pod” to conduct air-displacement plethysmography and determine what percentage of an individual’s weight was fat mass (FM) versus lean mass/water (FFM [fat-free mass]). They then compared the amount of FFM lost between groups, again using the independent samples t test.
The researchers also collected information on self-reported physical activity (questionnaire) and self-reported history of weight cycling (number of times a participant had previously lost and regained at least 5 kg) prior to this study. These were not outcomes per-se, but were collected so that they could be examined as correlates of the biometric outcomes above, using Pearson and Spearman’s correlation coefficients.
Results. The LCD (n = 29) and VLCD (n = 28) groups were similar at baseline with no significant differences reported. Of the 61 individuals initially enrolled, 57 (93%) completed the study. Summary statistics are reported only for these 57 individuals. No imputation or other methods for handling missing data were used. There were slightly more women than men in the study (53% women); the average (SD) age was 51.8 (1.9) years in the LCD group and 50.7 (1.5) years in the VLCD group. Mean starting BMI was 31 kg/m2 (31.3 [0.5] in LCD, 31.0 [0.4] in VLCD) and both groups had just under 40% body fat at baseline (39.9% [1.8] in LCD, 39.7% [1.5] in VLCD).
After 12 weeks of weight loss for LCD, or 5 weeks of weight loss for VLCD, both groups lost a similar amount of total weight (8.2 [0.5] kg in LCD vs. 9.0 [0.4] kg in VLCD), then had no significant changes in weight during the subsequent 4-week “weight stable” period. However, during the weight stable period VLCD patients had an average 0.8 (0.6) cm increase in waist circumference (a rebounding after a decrease of 7.7 cm during weight loss), while LCD patients on average had a continued decrease of 1.0 (0.5 cm) in waist circumference (P = 0.003).
There was no significant difference between groups for the primary outcome of weight regain during 9-months of follow-up (4.2 [0.6] kg regained for LCD, 4.5 [0.7] for VLCD; P = 0.73). The only significant correlates of weight regain were amount of FFM lost (more lean mass lost predicted more weight regain), and amount of physical activity reported during follow-up (more activity predicted less regain). Participant sex, age, starting BMI, history of weight cycling, and amount of weight lost did not correlate with rate of re-gain.
One area where there was a significant between-group difference, both after initial weight loss and persisting after the weight stable period, was in the amount of FFM lost (a rough approximation of lost lean mass, eg, muscle mass). VLCD participants had more FFM loss (1.6 [0.2] kg) than LCD participants (0.6 [0.2] kg) (P < 0.01) after active weight loss, and continued to have significantly more FFM loss (0.8 [0.2] kg vs. 0.2 [0.2] kg) after the 4-week weight stable period.
There were no between-group differences at the end of weight loss or at the end of follow-up for hip or waist circumference or for blood pressure.
Conclusion. The authors conclude that rate of weight loss does not affect one’s risk of weight regain after a diet, after a similar amount of weight has been lost.
Commentary
The failure of most diets to produce durable weight loss is a frustration for patients, clinicians, and researchers. In general, regardless of the composition of a diet, the majority of patients will regain some or all of their lost weight within several years after completing the diet. The reasons for weight regain are complex, and include reversion to old eating or physical activity behaviors but also a strong physiologic drive by the body to reverse weight loss that it perceives as a threat to health [1].
One area in diet research that has recently generated some controversy is whether or not rate of initial weight loss might impact a patient’s ability to maintain that weight loss, with the conventional wisdom (and national guidelines, in some cases), suggesting that slower weight loss is preferable to rapid weight loss for this reason [2]. A handful of studies have challenged this notion, however, and suggested that rapid weight loss does not necessarily lead to greater weight regain [3,4]. Previous such studies, however, have not generally been designed to compare regain after equal amounts of weight loss, which may make their results more difficult to interpret.
The present study contributes another piece of evidence to the argument that rapid initial weight loss may not increase a patient’s risk of regain. This small randomized trial is timely and has several features that make it a unique contribution. First, the design of the study allowed for both groups, despite losing weight at very different rates, to reach the same amount of total weight loss before being followed forward in time. This made weight regain much easier to compare between groups during follow-up. Second, the study included measurement of changing body composition—ie, what kind of weight was being lost (fat vs. fat-free mass)—rather than just the total amount of weight. This allowed the researchers to present data for an outcome that is mechanistically related to metabolic rate (and therefore weight regain), and one that might have implications for longer-term health after rapid versus more moderate-pace weight loss.
Several aspects of the study design, however, may limit the impact of the findings. For example, in both arms, while a certain type of diet was “prescribed,” there is no comment about assessment of participant fidelity to the prescribed diet, and there is potential for very different levels of adherence between groups, especially in active weight loss, when basically all meals were provided to the VLCD arm, but LCD subjects were responsible for about 90% of their own meals. This could have led to larger discrepancies between prescribed and actual diet in the LCD arm relative to VLCD. Granted, the rate of weight loss was the exposure of interest, and that clearly varied between groups as expected, implying at least moderate fidelity to prescribed caloric content of each diet, but how much protein vs. fat vs. carb was actually consumed by each group is not clear. Additionally, while 9 months of post weight-loss follow-up is certainly a good start in terms of follow-up duration, it may not have been sufficient to observe differences that would later emerge between the groups for weight regain. Other long-term weight loss maintenance studies have followed patients for several years or longer after initial weight loss [5].
Using data from all participants, the researchers reported that the amount of FFM an individual lost was a predictor of weight regain during follow-up. This finding is in keeping with the idea that more lean mass loss leads to lower metabolic rate and predisposes to weight regain (hence the conventional wisdom to avoid rapid weight loss with low-protein diets). In keeping with this theme, VLCD patients, whose protein intakes and activity levels were lower, did lose more FFM (ie, lean mass) than LCD patients. It was therefore surprising that in between-group analyses there was no statistical difference in weight regain. On some level, this raises concerns about the robustness of the overall finding. Perhaps with a larger sample, more precise measures of FFM lost (eg, with DEXA scanning instead of the “bod pod” or longer follow-up, this difference in lost lean mass between groups actually would have predicted greater weight regain for VLCD patients. The researchers attribute some of the FFM loss after the caloric restriction phase to decreased water and glycogen stores, rather than muscle mass, and speculate that this is why no impact on weight regain was seen between groups.
From a generalizability standpoint, there are important safety concerns with the use of VLCDs, aside from subsequent risk of weight regain, that are not addressed with this study. Many patients simply cannot tolerate a 500 kcal per day diet, including those with more severe obesity (who have higher daily energy requirements) or those with complicated chronic medical conditions who might be at higher risk of complications from such low energy intake. Accordingly, these kinds of patients were not included in this study, so it is not clear whether results might generalize to them.
Applications for Clinical Practice
Despite the conventional wisdom that slower weight loss may be more sustainable over time, several recent trials have suggested otherwise. Nonetheless, rapid weight loss produced with the use of VLCDs is not appropriate for every patient and must be carefully overseen by a weight management professional. Furthermore, rapid weight loss may place patients at increased risk of preferentially losing lean mass, which does correlate with risk of weight regain and could set them up for other health problems in the long-term. More studies are needed in this area before a definitive judgment can be made regarding the long term risks and benefits of rapid versus moderate-pace weight loss.
—Kristina Lewis, MD, MPH
1. Anastasiou CA, Karfopoulou E, Yannakoulia M. Weight regaining: From statistics and behaviors to physiology and metabolism. Metabolism 2015;64:1395–407.
2. Casazza K, Brown A, Astrup A, et al. Weighing the evidence of common beliefs in obesity research. Crit Rev Food Sci Nutr 2015;55:2014–53.
3. Purcell K, Sumithran P, Prendergast LA, et al. The effect of rate of weight loss on long-term weight management: a randomised controlled trial. Lancet Diabetes Endocrinol 2014;2:954–62.
4. Toubro S, Astrup A. Randomised comparison of diets for maintaining obese subjects’ weight after major weight loss: ad lib, low fat, high carbohydrate diet v fixed energy intake. BMJ 1997;314:29–34.
5. Wing RR, Phelan S. Long-term weight loss maintenance. Am J Clin Nutr 2005;82(1 Suppl):222S–225S.
Study Overview
Objective. To compare weight regain after rapid versus slower loss of an equivalent amount of weight.
Study design. Randomized clinical trial.
Setting and participants. This study took place in a single medical center in the Netherlands. Investigators recruited 61 adults (no age range provided) with body mass index (BMI) between 28–35 kg/m2 and at a stable weight (no change of > 3 kg for the past 2 months) to participate in a weight loss study. Individuals with type 2 diabetes, dyslipidemia, uncontrolled hypertension, or liver, heart or kidney disease were excluded, as were those who were currently pregnant or reported consuming more than moderate amounts of alcohol.
Once consented, participants were randomized into one of 2 study arms. The rapid weight loss arm was prescribed a very-low-calorie diet (VLCD) with just 500 kcal/day (43% protein/43% carb/14% fat) for 5 weeks, after which they transitioned to a 4-week “weight stable” period, and then a 9-month follow-up period (overall follow-up time of ~11 months; 10 months after weight loss). In contrast, the slower weight loss arm was prescribed a low-calorie diet (LCD) with 1250 kcal/day (29% protein/48% carb/23% fat) for 12 weeks, after which they also transitioned to a 4-week weight stable period and 9 months of follow-up (overall follow-up time of ~13 months; 10 months after weight loss). VLCD (rapid weight loss) participants received 3 meal replacement shakes per day (totaling 500 kcal) during the weight loss period and were also told they could consume unlimited amounts of low-calorie vegetables. The LCD (slower weight loss) participants received 1 meal replacement shake per day during their 12 weeks of weight loss and were responsible for providing the remainder of their own meals and snacks according to guidelines from a study dietitian. Following active weight loss, both groups then shifted to higher-calorie, food-based diets during a “weight stable” 4-week period and were responsible during this time for providing all of their own food. The researchers do not specify the details of the diet composition for this weight stable period. Exposure to the registered dietitian was the same in both groups, with 5 consultations during weight loss (weekly for VLCD, presumably more spaced out for LCD) and 4 during weight stable period. No further diet advice or meal replacement support was given during the 9-month follow-up period, but participants came in for monthly weigh-ins.
Main outcome measure. The primary outcome measure was change in weight (ie, amount of weight regained) during the 9-month follow-up period, compared between groups using an independent samples t test. Additional biometric measures included change in waist circumference and changes in body composition. For the latter, the researchers used a “Bod Pod” to conduct air-displacement plethysmography and determine what percentage of an individual’s weight was fat mass (FM) versus lean mass/water (FFM [fat-free mass]). They then compared the amount of FFM lost between groups, again using the independent samples t test.
The researchers also collected information on self-reported physical activity (questionnaire) and self-reported history of weight cycling (number of times a participant had previously lost and regained at least 5 kg) prior to this study. These were not outcomes per-se, but were collected so that they could be examined as correlates of the biometric outcomes above, using Pearson and Spearman’s correlation coefficients.
Results. The LCD (n = 29) and VLCD (n = 28) groups were similar at baseline with no significant differences reported. Of the 61 individuals initially enrolled, 57 (93%) completed the study. Summary statistics are reported only for these 57 individuals. No imputation or other methods for handling missing data were used. There were slightly more women than men in the study (53% women); the average (SD) age was 51.8 (1.9) years in the LCD group and 50.7 (1.5) years in the VLCD group. Mean starting BMI was 31 kg/m2 (31.3 [0.5] in LCD, 31.0 [0.4] in VLCD) and both groups had just under 40% body fat at baseline (39.9% [1.8] in LCD, 39.7% [1.5] in VLCD).
After 12 weeks of weight loss for LCD, or 5 weeks of weight loss for VLCD, both groups lost a similar amount of total weight (8.2 [0.5] kg in LCD vs. 9.0 [0.4] kg in VLCD), then had no significant changes in weight during the subsequent 4-week “weight stable” period. However, during the weight stable period VLCD patients had an average 0.8 (0.6) cm increase in waist circumference (a rebounding after a decrease of 7.7 cm during weight loss), while LCD patients on average had a continued decrease of 1.0 (0.5 cm) in waist circumference (P = 0.003).
There was no significant difference between groups for the primary outcome of weight regain during 9-months of follow-up (4.2 [0.6] kg regained for LCD, 4.5 [0.7] for VLCD; P = 0.73). The only significant correlates of weight regain were amount of FFM lost (more lean mass lost predicted more weight regain), and amount of physical activity reported during follow-up (more activity predicted less regain). Participant sex, age, starting BMI, history of weight cycling, and amount of weight lost did not correlate with rate of re-gain.
One area where there was a significant between-group difference, both after initial weight loss and persisting after the weight stable period, was in the amount of FFM lost (a rough approximation of lost lean mass, eg, muscle mass). VLCD participants had more FFM loss (1.6 [0.2] kg) than LCD participants (0.6 [0.2] kg) (P < 0.01) after active weight loss, and continued to have significantly more FFM loss (0.8 [0.2] kg vs. 0.2 [0.2] kg) after the 4-week weight stable period.
There were no between-group differences at the end of weight loss or at the end of follow-up for hip or waist circumference or for blood pressure.
Conclusion. The authors conclude that rate of weight loss does not affect one’s risk of weight regain after a diet, after a similar amount of weight has been lost.
Commentary
The failure of most diets to produce durable weight loss is a frustration for patients, clinicians, and researchers. In general, regardless of the composition of a diet, the majority of patients will regain some or all of their lost weight within several years after completing the diet. The reasons for weight regain are complex, and include reversion to old eating or physical activity behaviors but also a strong physiologic drive by the body to reverse weight loss that it perceives as a threat to health [1].
One area in diet research that has recently generated some controversy is whether or not rate of initial weight loss might impact a patient’s ability to maintain that weight loss, with the conventional wisdom (and national guidelines, in some cases), suggesting that slower weight loss is preferable to rapid weight loss for this reason [2]. A handful of studies have challenged this notion, however, and suggested that rapid weight loss does not necessarily lead to greater weight regain [3,4]. Previous such studies, however, have not generally been designed to compare regain after equal amounts of weight loss, which may make their results more difficult to interpret.
The present study contributes another piece of evidence to the argument that rapid initial weight loss may not increase a patient’s risk of regain. This small randomized trial is timely and has several features that make it a unique contribution. First, the design of the study allowed for both groups, despite losing weight at very different rates, to reach the same amount of total weight loss before being followed forward in time. This made weight regain much easier to compare between groups during follow-up. Second, the study included measurement of changing body composition—ie, what kind of weight was being lost (fat vs. fat-free mass)—rather than just the total amount of weight. This allowed the researchers to present data for an outcome that is mechanistically related to metabolic rate (and therefore weight regain), and one that might have implications for longer-term health after rapid versus more moderate-pace weight loss.
Several aspects of the study design, however, may limit the impact of the findings. For example, in both arms, while a certain type of diet was “prescribed,” there is no comment about assessment of participant fidelity to the prescribed diet, and there is potential for very different levels of adherence between groups, especially in active weight loss, when basically all meals were provided to the VLCD arm, but LCD subjects were responsible for about 90% of their own meals. This could have led to larger discrepancies between prescribed and actual diet in the LCD arm relative to VLCD. Granted, the rate of weight loss was the exposure of interest, and that clearly varied between groups as expected, implying at least moderate fidelity to prescribed caloric content of each diet, but how much protein vs. fat vs. carb was actually consumed by each group is not clear. Additionally, while 9 months of post weight-loss follow-up is certainly a good start in terms of follow-up duration, it may not have been sufficient to observe differences that would later emerge between the groups for weight regain. Other long-term weight loss maintenance studies have followed patients for several years or longer after initial weight loss [5].
Using data from all participants, the researchers reported that the amount of FFM an individual lost was a predictor of weight regain during follow-up. This finding is in keeping with the idea that more lean mass loss leads to lower metabolic rate and predisposes to weight regain (hence the conventional wisdom to avoid rapid weight loss with low-protein diets). In keeping with this theme, VLCD patients, whose protein intakes and activity levels were lower, did lose more FFM (ie, lean mass) than LCD patients. It was therefore surprising that in between-group analyses there was no statistical difference in weight regain. On some level, this raises concerns about the robustness of the overall finding. Perhaps with a larger sample, more precise measures of FFM lost (eg, with DEXA scanning instead of the “bod pod” or longer follow-up, this difference in lost lean mass between groups actually would have predicted greater weight regain for VLCD patients. The researchers attribute some of the FFM loss after the caloric restriction phase to decreased water and glycogen stores, rather than muscle mass, and speculate that this is why no impact on weight regain was seen between groups.
From a generalizability standpoint, there are important safety concerns with the use of VLCDs, aside from subsequent risk of weight regain, that are not addressed with this study. Many patients simply cannot tolerate a 500 kcal per day diet, including those with more severe obesity (who have higher daily energy requirements) or those with complicated chronic medical conditions who might be at higher risk of complications from such low energy intake. Accordingly, these kinds of patients were not included in this study, so it is not clear whether results might generalize to them.
Applications for Clinical Practice
Despite the conventional wisdom that slower weight loss may be more sustainable over time, several recent trials have suggested otherwise. Nonetheless, rapid weight loss produced with the use of VLCDs is not appropriate for every patient and must be carefully overseen by a weight management professional. Furthermore, rapid weight loss may place patients at increased risk of preferentially losing lean mass, which does correlate with risk of weight regain and could set them up for other health problems in the long-term. More studies are needed in this area before a definitive judgment can be made regarding the long term risks and benefits of rapid versus moderate-pace weight loss.
—Kristina Lewis, MD, MPH
1. Anastasiou CA, Karfopoulou E, Yannakoulia M. Weight regaining: From statistics and behaviors to physiology and metabolism. Metabolism 2015;64:1395–407.
2. Casazza K, Brown A, Astrup A, et al. Weighing the evidence of common beliefs in obesity research. Crit Rev Food Sci Nutr 2015;55:2014–53.
3. Purcell K, Sumithran P, Prendergast LA, et al. The effect of rate of weight loss on long-term weight management: a randomised controlled trial. Lancet Diabetes Endocrinol 2014;2:954–62.
4. Toubro S, Astrup A. Randomised comparison of diets for maintaining obese subjects’ weight after major weight loss: ad lib, low fat, high carbohydrate diet v fixed energy intake. BMJ 1997;314:29–34.
5. Wing RR, Phelan S. Long-term weight loss maintenance. Am J Clin Nutr 2005;82(1 Suppl):222S–225S.
Delayed Prescriptions for Reducing Antibiotic Use
Study Overview
Objective. To determine the efficacy and safety of delayed antibiotic prescribing strategies in acute uncomplicated respiratory infections.
Design. Randomized, multicenter, open-label clinical trial.
Setting and participants. The setting was 23 primary care centers in Spain. The study recruited patients who were 18 years of age or older with an acute uncomplicated respiratory infection (acute pharyngitis, rhinosinusitis, acute bronchitis, exacerbations of chronic bronchitis or mild to moderate chronic obstructive pulmonary disease). Patients with these infections were included by the physicians as long as they were unsure of whether to use antibiotics or not. The study protocol has been published elsewhere [1].
Intervention. Patients were randomized to 1 of 4 potential prescription strategies: (1) a delayed patient-led prescription strategy where patients were given an antibiotic prescription at first consultation but instructed to fill the prescription only if they felt substantially worse or saw no improvement in symptoms in the first few days after initial consultation; (2) a delayed prescription collection strategy requiring patients to collect their prescription from the primary care center reception desk 3 days after the first consultation; (3) an immediate prescription strategy; or (4) no antibiotic strategy. The patient-led and delayed collection strategies were considered delayed prescription strategies.
Main outcome measures. Duration of symptoms and severity of symptoms. Patients filled out a daily questionnaire for a maximum of 30 days, which listed common symptoms such as fever, discomfort or general pain, cough, difficulty sleeping, and changes in everyday life, and specific symptoms according to condition. Patients assessed severity of their symptoms using 6-point Likert scale, with scores of 1-2 considered mild, 3-4 moderate, and 5-6 severe. Secondary outcomes included antibiotic use, patient satisfaction, patients’ beliefs in the effectiveness of antibiotics, and absenteeism (absence from work or doing their daily activities).
Main results. A total of 405 patients were recruited, 398 of whom were included in the analysis. 136 patients (34.2%) were men. The mean (SD) age was 45 (17) years and 265 patients (72%) had at least a secondary education level. The most common infection was pharyngitis (n = 184; 46.2%), followed by acute bronchitis (n = 128; 32.2%). The mean severity of symptoms ranged from 1.8 to 3.5 points on the Likert scale, and mean (SD) duration of symptoms described on first visit was 6 (6) days. The mean (SD) general health status on first visit was 54 (20) based on a scale with 0 indicating worst health status and 100 indicating best health status. 314 patients (80.1%) were nonsmokers, and 372 patients (93.5%) did not have a respiratory comorbidity. The presence of symptoms on first visit was similar among the 4 groups.
The duration of the common symptoms of fever, discomfort or general pain, and cough was shorter in the immediate prescription group versus the no prescription group (P < 0.05 for all). In the immediate prescription group, the duration of patient symptoms after first visit was significantly different from that of the prescription collection and patient-led prescription groups only for discomfort or general pain. The mean (SD) duration of severe symptoms was 3.6 (3.3) days for the immediate prescription group, 4.0 (4.2) days for the prescription collection group, 5.1 (6.3) days for the patient-led prescription group, and 4.7 (3.6) days for the no prescription group. The median (interquartile range [IQR]) of severe symptoms was 3 (1–4) days for the prescription collection group and 3 (2–6) days for the patient-led prescription group. The median (IQR) of the maximum severity for any symptom was 5 (3–5) for the immediate prescription group and the prescription collection group; 5 (4–5) for the patient-led prescription group; and 5 (4–6) for the no prescription group. Patients randomized to the no prescription strategy or to either of the delayed strategies used fewer antibiotics and less frequently believed in antibiotic effectiveness. Among patients in the immediate prescription group, 91.1% used antibiotics; in the delayed patient-led, delayed collection, and no prescription groups, the rates of antibiotic use were 32.6%, 23.0%, and 12.1%, respectively. There were very few adverse events across groups, although the no prescription group had 3 adverse events compared with 0-1 in the other groups. Satisfaction was similar across groups.
Conclusion. Delayed strategies were associated with slightly greater but clinically similar symptom burden and duration and also with substantially reduced antibiotic use when compared with an immediate strategy.
Commentary
Acute respiratory infections are a common reasons for physician visits. These infections tend to be self-limiting and overuse of antibiotics for these infections is widespread. Approximately 60% of patients with a sore throat and ~70% of patients with acute uncomplicated bronchitis receive antibiotic prescriptions despite the literature suggesting no or limited benefit [2,3].Antibiotic resistance is a growing problem and the main cause of this problem is misuse of antibiotics.
Often physicians feel pressured into prescribing anti-biotics due to patient expectation and patient satisfaction metrics. In the face of the critical need to reduce overuse, delayed antibiotic prescribing strategies offers a compromise between immediate and no prescription [4]. Delayed prescribing strategies have been evaluated previously [5–8], with findings suggesting they do reduce antibiotic use. This study strengthens the evidence base supporting the delayed strategy.
This study has a few limitations. The sample size was small, and symptom data was obtained via patient self-report. In addition, the randomization procedure was not described. However, the investigators were able to achieve good patient retention, with very few patients lost to follow-up. The investigators used an intention to treat analysis; thus, the estimate of treatment effect size can be considered conservative.
In terms of baseline characteristics of the study participants, there was a lower overall education level, fewer smokers, and less respiratory comorbidity (defined as only cardiovascular comorbidity [P = 0.12] and diabetes [P = 0.19]) in the patient-led group. Otherwise, groups were very well-matched. Most patients in the study had pharyngitis and bronchitis, limiting the inferences for patients with rhinosinusitis or exacerbation of mild-to-moderate COPD.
Applications for Clinical Practice
Delayed antibiotic prescribing for acute uncomplicated respiratory infections appears to be an acceptable strategy for reducing the overuse of antibiotics. As patients may lack knowledge of this prescribing strategy [9], clinicians may need to spend time explaining the concept. Using the term “back-up antibiotics” instead of “delayed prescription” [10] may help to increase patients’ understanding and acceptance.
—Ajay Dharod, MD
1. de la Poza Abad M, Mas Dalmau G, Moreno Bakedano M, Get al; Delayed Antibiotic Prescription (DAP) Working Group. Rationale, design and organization of the delayed antibiotic prescription (DAP) trial: a randomized controlled trial of the efficacy and safety of delayed antibiotic prescribing strategies in the non-complicated acute respiratory tract infections in general practice. BMC Fam Pract 2013;14:63.
2. Barnett ML, Linder JA. Antibiotic prescribing to adults with sore throat in the United States, 1997-2010. JAMA Intern Med 2014;174:138–40.
3. Barnett ML, Linder JA. Antibiotic prescribing for adults with acute bronchitis in the United States, 1996–2010. JAMA 2014;311:2020–2.
4. McCullough AR, Glasziou PP. Delayed antibiotic prescribing strategies-time to implement? JAMA Intern Med 2016;176:29–30.
5. National Institute for Health and Clinical Excellence. Prescribing of antibiotics for self-limiting respiratory tract infections in adults and children in primary care. Clinical guideline 69. London: NICE; 2008.
6. Arnold SR, Straus SE. Interventions to improve antibiotic prescribing practices in ambulatory care. Cochrane Database Syst Rev 2005;(4):CD003539.
7. Arroll B, Kenealy T, Kerse N. Do delayed prescriptions reduce antibiotic use in respiratory tract infections? A systematic review. Br J Gen Pract 2003;53:871–7.
8. Spurling GKP, Del Mar CB, Dooley L, et al. Delayed antibiotics for respiratory infections. Cochrane Database Syst Rev 2013;4:CD004417.
9. McNulty CAM, Lecky DM, Hawking MKD, et al. Delayed/back up antibiotic prescriptions: what do the public think? BMJ Open 2015;5:e009748.
10. Bunten AK, Hawking MKD, McNulty CAM. Patient information can improve appropriate antibiotic prescribing. Nurs Pract 2015;82:61–3.
Study Overview
Objective. To determine the efficacy and safety of delayed antibiotic prescribing strategies in acute uncomplicated respiratory infections.
Design. Randomized, multicenter, open-label clinical trial.
Setting and participants. The setting was 23 primary care centers in Spain. The study recruited patients who were 18 years of age or older with an acute uncomplicated respiratory infection (acute pharyngitis, rhinosinusitis, acute bronchitis, exacerbations of chronic bronchitis or mild to moderate chronic obstructive pulmonary disease). Patients with these infections were included by the physicians as long as they were unsure of whether to use antibiotics or not. The study protocol has been published elsewhere [1].
Intervention. Patients were randomized to 1 of 4 potential prescription strategies: (1) a delayed patient-led prescription strategy where patients were given an antibiotic prescription at first consultation but instructed to fill the prescription only if they felt substantially worse or saw no improvement in symptoms in the first few days after initial consultation; (2) a delayed prescription collection strategy requiring patients to collect their prescription from the primary care center reception desk 3 days after the first consultation; (3) an immediate prescription strategy; or (4) no antibiotic strategy. The patient-led and delayed collection strategies were considered delayed prescription strategies.
Main outcome measures. Duration of symptoms and severity of symptoms. Patients filled out a daily questionnaire for a maximum of 30 days, which listed common symptoms such as fever, discomfort or general pain, cough, difficulty sleeping, and changes in everyday life, and specific symptoms according to condition. Patients assessed severity of their symptoms using 6-point Likert scale, with scores of 1-2 considered mild, 3-4 moderate, and 5-6 severe. Secondary outcomes included antibiotic use, patient satisfaction, patients’ beliefs in the effectiveness of antibiotics, and absenteeism (absence from work or doing their daily activities).
Main results. A total of 405 patients were recruited, 398 of whom were included in the analysis. 136 patients (34.2%) were men. The mean (SD) age was 45 (17) years and 265 patients (72%) had at least a secondary education level. The most common infection was pharyngitis (n = 184; 46.2%), followed by acute bronchitis (n = 128; 32.2%). The mean severity of symptoms ranged from 1.8 to 3.5 points on the Likert scale, and mean (SD) duration of symptoms described on first visit was 6 (6) days. The mean (SD) general health status on first visit was 54 (20) based on a scale with 0 indicating worst health status and 100 indicating best health status. 314 patients (80.1%) were nonsmokers, and 372 patients (93.5%) did not have a respiratory comorbidity. The presence of symptoms on first visit was similar among the 4 groups.
The duration of the common symptoms of fever, discomfort or general pain, and cough was shorter in the immediate prescription group versus the no prescription group (P < 0.05 for all). In the immediate prescription group, the duration of patient symptoms after first visit was significantly different from that of the prescription collection and patient-led prescription groups only for discomfort or general pain. The mean (SD) duration of severe symptoms was 3.6 (3.3) days for the immediate prescription group, 4.0 (4.2) days for the prescription collection group, 5.1 (6.3) days for the patient-led prescription group, and 4.7 (3.6) days for the no prescription group. The median (interquartile range [IQR]) of severe symptoms was 3 (1–4) days for the prescription collection group and 3 (2–6) days for the patient-led prescription group. The median (IQR) of the maximum severity for any symptom was 5 (3–5) for the immediate prescription group and the prescription collection group; 5 (4–5) for the patient-led prescription group; and 5 (4–6) for the no prescription group. Patients randomized to the no prescription strategy or to either of the delayed strategies used fewer antibiotics and less frequently believed in antibiotic effectiveness. Among patients in the immediate prescription group, 91.1% used antibiotics; in the delayed patient-led, delayed collection, and no prescription groups, the rates of antibiotic use were 32.6%, 23.0%, and 12.1%, respectively. There were very few adverse events across groups, although the no prescription group had 3 adverse events compared with 0-1 in the other groups. Satisfaction was similar across groups.
Conclusion. Delayed strategies were associated with slightly greater but clinically similar symptom burden and duration and also with substantially reduced antibiotic use when compared with an immediate strategy.
Commentary
Acute respiratory infections are a common reasons for physician visits. These infections tend to be self-limiting and overuse of antibiotics for these infections is widespread. Approximately 60% of patients with a sore throat and ~70% of patients with acute uncomplicated bronchitis receive antibiotic prescriptions despite the literature suggesting no or limited benefit [2,3].Antibiotic resistance is a growing problem and the main cause of this problem is misuse of antibiotics.
Often physicians feel pressured into prescribing anti-biotics due to patient expectation and patient satisfaction metrics. In the face of the critical need to reduce overuse, delayed antibiotic prescribing strategies offers a compromise between immediate and no prescription [4]. Delayed prescribing strategies have been evaluated previously [5–8], with findings suggesting they do reduce antibiotic use. This study strengthens the evidence base supporting the delayed strategy.
This study has a few limitations. The sample size was small, and symptom data was obtained via patient self-report. In addition, the randomization procedure was not described. However, the investigators were able to achieve good patient retention, with very few patients lost to follow-up. The investigators used an intention to treat analysis; thus, the estimate of treatment effect size can be considered conservative.
In terms of baseline characteristics of the study participants, there was a lower overall education level, fewer smokers, and less respiratory comorbidity (defined as only cardiovascular comorbidity [P = 0.12] and diabetes [P = 0.19]) in the patient-led group. Otherwise, groups were very well-matched. Most patients in the study had pharyngitis and bronchitis, limiting the inferences for patients with rhinosinusitis or exacerbation of mild-to-moderate COPD.
Applications for Clinical Practice
Delayed antibiotic prescribing for acute uncomplicated respiratory infections appears to be an acceptable strategy for reducing the overuse of antibiotics. As patients may lack knowledge of this prescribing strategy [9], clinicians may need to spend time explaining the concept. Using the term “back-up antibiotics” instead of “delayed prescription” [10] may help to increase patients’ understanding and acceptance.
—Ajay Dharod, MD
1. de la Poza Abad M, Mas Dalmau G, Moreno Bakedano M, Get al; Delayed Antibiotic Prescription (DAP) Working Group. Rationale, design and organization of the delayed antibiotic prescription (DAP) trial: a randomized controlled trial of the efficacy and safety of delayed antibiotic prescribing strategies in the non-complicated acute respiratory tract infections in general practice. BMC Fam Pract 2013;14:63.
2. Barnett ML, Linder JA. Antibiotic prescribing to adults with sore throat in the United States, 1997-2010. JAMA Intern Med 2014;174:138–40.
3. Barnett ML, Linder JA. Antibiotic prescribing for adults with acute bronchitis in the United States, 1996–2010. JAMA 2014;311:2020–2.
4. McCullough AR, Glasziou PP. Delayed antibiotic prescribing strategies-time to implement? JAMA Intern Med 2016;176:29–30.
5. National Institute for Health and Clinical Excellence. Prescribing of antibiotics for self-limiting respiratory tract infections in adults and children in primary care. Clinical guideline 69. London: NICE; 2008.
6. Arnold SR, Straus SE. Interventions to improve antibiotic prescribing practices in ambulatory care. Cochrane Database Syst Rev 2005;(4):CD003539.
7. Arroll B, Kenealy T, Kerse N. Do delayed prescriptions reduce antibiotic use in respiratory tract infections? A systematic review. Br J Gen Pract 2003;53:871–7.
8. Spurling GKP, Del Mar CB, Dooley L, et al. Delayed antibiotics for respiratory infections. Cochrane Database Syst Rev 2013;4:CD004417.
9. McNulty CAM, Lecky DM, Hawking MKD, et al. Delayed/back up antibiotic prescriptions: what do the public think? BMJ Open 2015;5:e009748.
10. Bunten AK, Hawking MKD, McNulty CAM. Patient information can improve appropriate antibiotic prescribing. Nurs Pract 2015;82:61–3.