User login
Study characterizes intracerebral hemorrhage with new oral anticoagulants
Intracerebral hemorrhage related to non–vitamin-K antagonist oral anticoagulants carries a high mortality and frequently involves hematoma expansion, according to a report published online Dec. 14 in JAMA Neurology.
The characteristics and natural history of acute-phase non–vitamin-K antagonist oral anticoagulant (NOAC)-associated intracerebral hemorrhage (ICH) “are largely unknown,” and there are no prospective data concerning hematoma expansion or the effectiveness of prothrombin complex concentrate in limiting that expansion by reversing anticoagulation. Nevertheless, current recommendations suggest that clinicians consider administering prothrombin complex concentrate in this patient population, said Dr. Jan C. Purrucker of the department of neurology at Heidelberg (Germany) University and his associates (JAMA Neurol. 2015 Dec 14. doi: 10.1001/jamaneurol.2015.3682).
To characterize the clinical and radiologic course, management, and outcome of NOAC-associated intracerebral hemorrhage in routine clinical practice, Dr. Purrucker and his associates performed the ICH substudy of the Registry of Acute Stroke Under New Oral Anticoagulants (RASUNOA). This is a prospective registry involving 38 neurology departments with certified stroke units across Germany. For their substudy, the investigators focused on 61 adults with a mean age of 76 years (range, 46-97 years) who were taking NOACs (apixaban [Eliquis], dabigatran etexilate [Pradaxa], or rivaroxaban [Xarelto]) and had moderate to severe neurologic deficit and a median hematoma volume of 10.8 mL at presentation. Thirty-five of these patients (57%) were treated with prothrombin complex concentrate.
Mortality was high, at 16% (10 patients) during the acute inpatient stay and 28% (17 patients) at 3 months; 65% of the survivors had an unfavorable outcome. Substantial hematoma expansion – defined as a 33% or greater relative increase or 6 mL or greater absolute increase in ICH volume – was common, affecting 38% of patients. “This proportion was within the range reported for vitamin-K antagonist–associated intracerebral hemorrhage (36%-56%) and is higher, compared with that related to intracerebral hemorrhage in patients not receiving anticoagulation (12%-26%),” the investigators wrote.
Both larger hematoma volume at baseline (odds ratio, 2.37) and intraventricular extension at baseline (OR, 8.13) strongly correlated with adverse outcomes. In contrast, prothrombin complex concentrate failed to limit lesion expansion or avert adverse outcomes. This might be because patients given the treatment tended to have more severe initial neurologic deficits and more unfavorable hematoma location than did those who weren’t given prothrombin complex concentrate. In any case, “our study design, the limited sample size, and the potential for confounding by indication do not allow any [firm] conclusions regarding a potential association between prothrombin complex concentrate treatment and outcome,” they noted.
The RASUNOA registry was supported by the University Hospital Heidelberg. Dr. Purrucker reported receiving support from Pfizer unrelated to this study, and his associates reported ties to numerous industry sources.
It’s important to note that in the study by Dr. Purrucker and his colleagues, the median time from symptom onset to the first brain imaging was 14 hours and that fully 25% of patients presented for treatment more than 22 hours after noticing their initial symptoms.
 |
Dr. Stephan A. Mayer |
In contrast, patients with spontaneous hypertensive intracerebral hemorrhage present much earlier, usually within 6 hours. This indicates that the bleeding in NOAC-associated hemorrhagic stroke often is gradual and prolonged, an “oozing” process rather than the explosive type of process seen in spontaneous hemorrhagic stroke.
It is almost certain that if this cohort had undergone imaging at 3 hours rather than at 14 hours after symptom onset, the frequency of hematoma expansion would have approached 100% rather than 38%.
Dr. Stephan A. Mayer is at Mount Sinai University, New York. He reported having no relevant financial disclosures. Dr. Mayer made these remarks in an editorial accompanying Dr. Purrucker’s report (JAMA Neurol. 2015 Dec 14. doi:10.1001/jamaneurol.2015.3884).
It’s important to note that in the study by Dr. Purrucker and his colleagues, the median time from symptom onset to the first brain imaging was 14 hours and that fully 25% of patients presented for treatment more than 22 hours after noticing their initial symptoms.
|
Dr. Stephan A. Mayer |
In contrast, patients with spontaneous hypertensive intracerebral hemorrhage present much earlier, usually within 6 hours. This indicates that the bleeding in NOAC-associated hemorrhagic stroke often is gradual and prolonged, an “oozing” process rather than the explosive type of process seen in spontaneous hemorrhagic stroke.
It is almost certain that if this cohort had undergone imaging at 3 hours rather than at 14 hours after symptom onset, the frequency of hematoma expansion would have approached 100% rather than 38%.
Dr. Stephan A. Mayer is at Mount Sinai University, New York. He reported having no relevant financial disclosures. Dr. Mayer made these remarks in an editorial accompanying Dr. Purrucker’s report (JAMA Neurol. 2015 Dec 14. doi:10.1001/jamaneurol.2015.3884).
Intracerebral hemorrhage related to non–vitamin-K antagonist oral anticoagulants carries a high mortality and frequently involves hematoma expansion, according to a report published online Dec. 14 in JAMA Neurology.
The characteristics and natural history of acute-phase non–vitamin-K antagonist oral anticoagulant (NOAC)-associated intracerebral hemorrhage (ICH) “are largely unknown,” and there are no prospective data concerning hematoma expansion or the effectiveness of prothrombin complex concentrate in limiting that expansion by reversing anticoagulation. Nevertheless, current recommendations suggest that clinicians consider administering prothrombin complex concentrate in this patient population, said Dr. Jan C. Purrucker of the department of neurology at Heidelberg (Germany) University and his associates (JAMA Neurol. 2015 Dec 14. doi: 10.1001/jamaneurol.2015.3682).
To characterize the clinical and radiologic course, management, and outcome of NOAC-associated intracerebral hemorrhage in routine clinical practice, Dr. Purrucker and his associates performed the ICH substudy of the Registry of Acute Stroke Under New Oral Anticoagulants (RASUNOA). This is a prospective registry involving 38 neurology departments with certified stroke units across Germany. For their substudy, the investigators focused on 61 adults with a mean age of 76 years (range, 46-97 years) who were taking NOACs (apixaban [Eliquis], dabigatran etexilate [Pradaxa], or rivaroxaban [Xarelto]) and had moderate to severe neurologic deficit and a median hematoma volume of 10.8 mL at presentation. Thirty-five of these patients (57%) were treated with prothrombin complex concentrate.
Mortality was high, at 16% (10 patients) during the acute inpatient stay and 28% (17 patients) at 3 months; 65% of the survivors had an unfavorable outcome. Substantial hematoma expansion – defined as a 33% or greater relative increase or 6 mL or greater absolute increase in ICH volume – was common, affecting 38% of patients. “This proportion was within the range reported for vitamin-K antagonist–associated intracerebral hemorrhage (36%-56%) and is higher, compared with that related to intracerebral hemorrhage in patients not receiving anticoagulation (12%-26%),” the investigators wrote.
Both larger hematoma volume at baseline (odds ratio, 2.37) and intraventricular extension at baseline (OR, 8.13) strongly correlated with adverse outcomes. In contrast, prothrombin complex concentrate failed to limit lesion expansion or avert adverse outcomes. This might be because patients given the treatment tended to have more severe initial neurologic deficits and more unfavorable hematoma location than did those who weren’t given prothrombin complex concentrate. In any case, “our study design, the limited sample size, and the potential for confounding by indication do not allow any [firm] conclusions regarding a potential association between prothrombin complex concentrate treatment and outcome,” they noted.
The RASUNOA registry was supported by the University Hospital Heidelberg. Dr. Purrucker reported receiving support from Pfizer unrelated to this study, and his associates reported ties to numerous industry sources.
FROM JAMA NEUROLOGY
Key clinical point: Intracerebral hemorrhage related to new oral anticoagulants frequently involves hematoma expansion and doesn’t appear to respond to prothrombin complex concentrate.
Major finding: Mortality was 28%, 65% of survivors had unfavorable outcomes, and substantial hematoma expansion occurred in 38% of patients.
Data source: A prospective, multicenter, observational study involving 61 patients treated during a 3-year period in Germany.
Disclosures: The RASUNOA registry was supported by the University Hospital Heidelberg. Dr. Purrucker reported receiving support from Pfizer unrelated to this study, and his associates reported ties to numerous industry sources.

Make the Diagnosis - January 2016
Diagnosis: Urticaria pigmentosa
Urticaria pigmentosa (UP), also known as cutaneous mastocytosis, is characterized by the presence of pigmented macular and/or papular lesions associated with severe pruritis that can appear on any part of the body. With increased scratching and/or exposure to heat, the lesions become elevated. This phenomenon is known as Darier’s sign. The urticarial lesions can progress to become fluid-filled blisters. UP can rarely progress to systemic mastocytosis and present with systemic symptoms that are more common in adults, including headache, fatigue, abdominal pain, diarrhea, and tachycardia.
UP has been associated with increased inflammatory mast cells that abnormally collect in the skin. Mast cells specialize in producing histamine. In UP, the overproliferation of mast cells, secondary to point mutations in proto-oncogene c-kit binding to mast cell growth factor (MCGF), leads to an abundance of inflammatory chemicals, which produces the characteristic itching and presenting symptoms.
Although the pathophysiology of UP is known, the exact etiology is unclear. Certain medications that can cause mast-cell degranulation have been implicated, such as aspirin, NSAIDs, narcotics, alcohol, and anticholinergics. Children with allergies such as asthma are known to have an increased predisposition to UP, which typically presents in the first year of life and is self-limited by adolescence. Some cases sporadically appear, but others may be secondary to genetic inheritance as an autosomal dominant trait.
Diagnosis of UP is made by the presence of the characteristic skin lesions but can be confirmed by microscopic evaluation. A positive Darier’s sign on physical exam and lab testing for elevated histamine can aid in the diagnosis. UP is often mistaken for moles or insect bites on initial presentation; however, the persistence of the lesions for months to years is a distinguishing factor.
Given the self-limiting nature of UP, the treatment is symptomatic and supportive. Topical steroids and antihistamines can be useful to treat severe pruritis. In addition, PUVA has been shown to be an effective treatment for UP in adults.
This case and photo were submitted by Dr. Parteek Singla and Dr. Damon McClain of Naval Hospital Camp Lejeune, N.C.
Dr. Bilu Martin is in private practice at Premier Dermatology, MD, in Aventura, Fla. More diagnostic cases are available at edermatologynews.com. To submit your case for possible publication, send an email to dermnews@frontlinemedcom.com.

Otherwise healthy 11-month-old female twins presented with a mildly pruritic rash that had been present since birth. There was no history of prolonged nausea, diarrhea, or vomiting. There was no family history of mast cell diseases. The girls were not taking any medications. On exam, there were hyperpigmented macules, patches, and papules mostly on the trunk but also on the extremities. A Darier’s sign was noted when firmly scratching with a tongue depressor

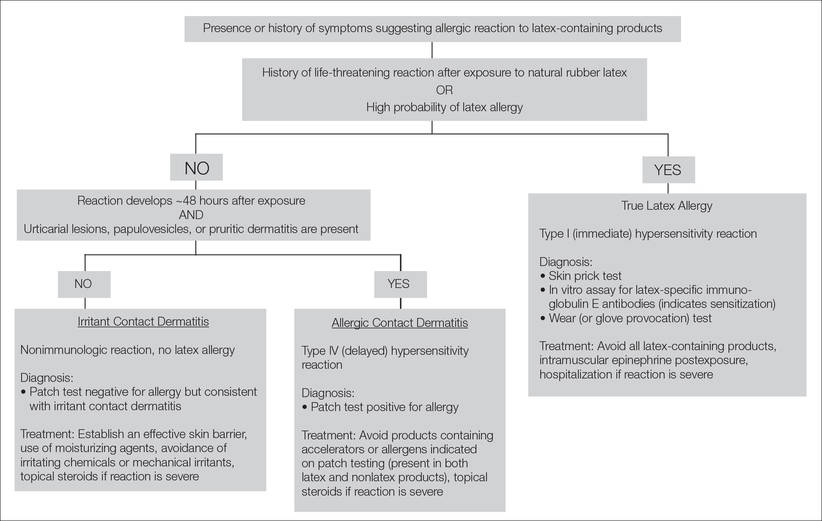
Differentiation of Latex Allergy From Irritant Contact Dermatitis
Latex allergy is an all-encompassing term used to describe hypersensitivity reactions to products containing natural rubber latex from the Hevea brasiliensis tree and affects approximately 1% to 2% of the general population.1 Although latex gloves are the most widely known culprits, several other commonly used products can contain natural rubber latex, including adhesive tape, balloons, condoms, rubber bands, paint, tourniquets, electrode pads, and Foley catheters.2 The term latex allergy often is used as a general diagnosis, but there are in fact 3 distinct mechanisms by which individuals may develop an adverse reaction to latex-containing products: irritant contact dermatitis, allergic contact dermatitis (type IV hypersensitivity) and true latex allergy (type I hypersensitivity).
Irritant Contact Dermatitis
Irritant contact dermatitis, a nonimmunologic reaction, occurs due to mechanical factors (eg, friction) or contact with chemicals, which can have irritating and dehydrating effects. Individuals with irritant contact dermatitis do not have true latex allergy and will not necessarily develop a reaction to products containing natural rubber latex. Incorrectly attributing these irritant contact dermatitis reactions to latex allergy and simply advising patients to avoid all latex products (eg, use nitrile gloves rather than latex gloves) will not address the underlying problem. Rather, these patients must be informed that the dermatitis is a result of a disruption to the natural, protective skin barrier and not an allergic reaction.
Allergic Contact Dermatitis
Allergic contact dermatitis to rubber is caused by a type IV (delayed) hypersensitivity reaction and is the result of exposure to the accelerators present in rubber products in sensitive individuals. Individuals experiencing this type of reaction typically develop localized erythema, pruritus, and urticarial lesions 48 hours after exposure.3 Incorrectly labeling this problem as latex allergy and recommending nonlatex rubber substitutes (eg, hypoallergenic gloves) likely will not be effective, as these nonlatex replacement products contain the same accelerators as do latex gloves.
True Latex Allergy
The most severe form of latex allergy, often referred to as true latex allergy, is caused by a type I (immediate) hypersensitivity reaction mediated by immunoglobulin E (IgE) antibodies. Individuals experiencing this type of reaction have a systemic response to latex proteins that may result in fulminant anaphylaxis. Individuals with true latex allergy must absolutely avoid latex products, and substituting nonlatex products is the most effective approach.
Latex Reactions in Medical Practice
The varying propensity of certain populations to develop latex allergy has been well documented; for example, the prevalence of hypersensitivity in patients with spina bifida ranges from 20% to 65%, figures that are much higher than those reported in the general population.3 This hypersensitivity in patients with spina bifida most likely results from repeated exposure to latex products during corrective surgeries and diagnostic procedures early in life. Atopic individuals, such as those with allergic rhinitis, eczema, and asthma, have a 4-fold increased risk for developing latex allergy compared to nonatopic individuals.4 The risk of latex allergy among health care workers is increased due to increased exposure to rubber products. One study found that the risk of latex sensitization among health care workers exposed to products containing latex was 4.3%, while the risk in the general population was only 1.37%.1 Those at highest risk for sensitization include dental assistants, operating room personnel, hospital housekeeping staff, and paramedics or emergency medical technicians.3 However, sensitization documented on laboratory assessment does not reliably correlate with symptomatic allergy, as many patients with a positive IgE test do not show clinical symptoms. Schmid et al4 demonstrated that a 1.3% prevalence of clinically symptomatic latex allergy among health care workers may approximate the prevalence of latex allergy in the general population. In a study by Brown et al,5 although 12.5% of anesthesiologists were found to be sensitized to latex, only 2.4% had clinically symptomatic allergic reactions.
Testing for Latex Allergy
Several diagnostic tests are available to establish a diagnosis of type I sensitization or true latex allergy. Skin prick testing is an in vivo assay and is the gold standard for diagnosing IgE-mediated type I hypersensitivity to latex. The test involves pricking the skin of the forearm and applying a commercial extract of nonammoniated latex to monitor for development of a wheal within several minutes. The skin prick test should be performed in a health care setting equipped with oxygen, epinephrine, and latex-free resuscitation equipment in case of anaphylaxis following exposure. Although latex skin prick testing is the gold standard, it is rarely performed in the United States because there is no US Food and Drug Administration–approved natural rubber latex reagent.3 Consequently, physicians who wish to perform skin prick testing for latex allergy are forced to develop improvised reagents from the H brasiliensis tree itself or from highly allergenic latex gloves. Standardized latex allergens are commercially available in Europe.
The most noninvasive method of latex allergy testing is an in vitro assay for latex-specific IgE antibodies, which can be detected by either a radioallergosorbent test (RAST) or enzyme-linked immunosorbent assay (ELISA). The presence of antilatex IgE antibodies confirms sensitization but does not necessarily mean the patient will develop a symptomatic reaction following exposure. Due to the unavailability of a standardized reagent for the skin prick test in the United States, evaluation of latex-specific serum IgE levels may be the best alternative. While the skin prick test has the highest sensitivity, the sensitivity and specificity of latex-specific serum IgE testing are 50% to 90% and 80% to 87%, respectively.6
The wear test (also known as the use or glove provocation test), can be used to diagnose clinically symptomatic latex allergy when there is a discrepancy between the patient’s clinical history and results from skin prick or serum IgE antibody testing. To perform the wear test, place a natural rubber latex glove on one of the patient’s fingers for 15 minutes and monitor the area for development of urticaria. If there is no evidence of allergic reaction within 15 minutes, place the glove on the whole hand for an additional 15 minutes. The patient is said to be nonreactive if a latex glove can be placed on the entire hand for 15 minutes without evidence of reaction.3
Lastly, patch testing can differentiate between irritant contact and allergic contact (type IV hypersensitivity) dermatitis. Apply a small amount of each substance of interest onto a separate disc and place the discs in direct contact with the skin using hypoallergenic tape. With type IV latex hypersensitivity, the skin underneath the disc will become erythematous with developing papulovesicles, starting between 2 and 5 days after exposure. The Figure outlines the differentiation of true latex allergy from irritant and allergic contact dermatitis and identifies methods for making these diagnoses.
General Medical Protocol With Latex Reactions
To reduce the incidence of latex allergic reactions among health care workers and patients, Kumar2 recommends putting a protocol in place to document steps in preventing, diagnosing, and treating latex allergy. This protocol includes employee and patient education about the risks for developing latex allergy and the signs and symptoms of a reaction; available diagnostic testing; and alternative products (eg, hypoallergenic gloves) that are available to individuals with a known or suspected allergy. At-risk health care workers who have not been sensitized should be advised to avoid latex-containing products.3 Routine questioning and diagnostic testing may be necessary as part of every preoperative assessment, as there have been reported cases of anaphylaxis in patients with undocumented allergies.7 Anaphylaxis caused by latex allergy is the second leading cause of perioperative anaphylaxis, accounting for as many as 20% of cases.8 With the use of preventative measures and early identification of at-risk patients, the incidence of latex-related anaphylaxis is decreasing.8 Ascertaining valuable information about the patient’s medical history, such as known allergies to foods that have cross-reactivity to latex (eg, bananas, mango, kiwi, avocado), is one simple way of identifying a patient who should be tested for possible underlying latex allergy.8 Total avoidance of latex-containing products (eg, in the workplace) can further reduce the incidence of allergic reactions by decreasing primary sensitization and risk of exposure.
Conclusion
Patients claiming to be allergic to latex without documentation should be tested. The diagnostic testing available in the United States includes patch testing, wear (or glove provocation) testing, or assessment of IgE antibody titer. Accurate differentiation among irritant contact dermatitis, allergic contact dermatitis, and true latex allergy is paramount for properly educating patients and effectively treating these conditions. Additionally, distinguishing patients with true latex allergy from those who have been misdiagnosed can save resources and reduce health care costs.
- Bousquet J, Flahault A, Vandenplas O, et al. Natural rubber latex allergy among health care workers: a systematic review of the evidence. J Allergy Clin Immunol. 2006;118:447-454.
- Kumar RP. Latex allergy in clinical practice. Indian J Dermatol. 2012;57:66-70.
- Taylor JS, Erkek E. Latex allergy: diagnosis and management. Dermatol Ther. 2004;17:289-301.
- Schmid K, Christoph Broding H, Niklas D, et al. Latex sensitization in dental students using powder-free gloves low in latex protein: a cross-sectional study. Contact Dermatitis. 2002;47:103-108.
- Brown RH, Schauble JF, Hamilton RG. Prevalence of latex allergy among anesthesiologists: identification of sensitized but asymptomatic individuals. Anesthesiology. 1998;89:292-299.
- Pollart SM, Warniment C, Mori T. Latex allergy. Am Fam Physician. 2009;80:1413-1418.
- Duger C, Kol IO, Kaygusuz K, et al. A perioperative anaphylactic reaction caused by latex in a patient with no history of allergy. Anaesth Pain Intensive Care. 2012;16:71-73.
- Hepner DL, Castells MC. Anaphylaxis during the perioperative period. Anesth Analg. 2003;97:1381-1395.
Latex allergy is an all-encompassing term used to describe hypersensitivity reactions to products containing natural rubber latex from the Hevea brasiliensis tree and affects approximately 1% to 2% of the general population.1 Although latex gloves are the most widely known culprits, several other commonly used products can contain natural rubber latex, including adhesive tape, balloons, condoms, rubber bands, paint, tourniquets, electrode pads, and Foley catheters.2 The term latex allergy often is used as a general diagnosis, but there are in fact 3 distinct mechanisms by which individuals may develop an adverse reaction to latex-containing products: irritant contact dermatitis, allergic contact dermatitis (type IV hypersensitivity) and true latex allergy (type I hypersensitivity).
Irritant Contact Dermatitis
Irritant contact dermatitis, a nonimmunologic reaction, occurs due to mechanical factors (eg, friction) or contact with chemicals, which can have irritating and dehydrating effects. Individuals with irritant contact dermatitis do not have true latex allergy and will not necessarily develop a reaction to products containing natural rubber latex. Incorrectly attributing these irritant contact dermatitis reactions to latex allergy and simply advising patients to avoid all latex products (eg, use nitrile gloves rather than latex gloves) will not address the underlying problem. Rather, these patients must be informed that the dermatitis is a result of a disruption to the natural, protective skin barrier and not an allergic reaction.
Allergic Contact Dermatitis
Allergic contact dermatitis to rubber is caused by a type IV (delayed) hypersensitivity reaction and is the result of exposure to the accelerators present in rubber products in sensitive individuals. Individuals experiencing this type of reaction typically develop localized erythema, pruritus, and urticarial lesions 48 hours after exposure.3 Incorrectly labeling this problem as latex allergy and recommending nonlatex rubber substitutes (eg, hypoallergenic gloves) likely will not be effective, as these nonlatex replacement products contain the same accelerators as do latex gloves.
True Latex Allergy
The most severe form of latex allergy, often referred to as true latex allergy, is caused by a type I (immediate) hypersensitivity reaction mediated by immunoglobulin E (IgE) antibodies. Individuals experiencing this type of reaction have a systemic response to latex proteins that may result in fulminant anaphylaxis. Individuals with true latex allergy must absolutely avoid latex products, and substituting nonlatex products is the most effective approach.
Latex Reactions in Medical Practice
The varying propensity of certain populations to develop latex allergy has been well documented; for example, the prevalence of hypersensitivity in patients with spina bifida ranges from 20% to 65%, figures that are much higher than those reported in the general population.3 This hypersensitivity in patients with spina bifida most likely results from repeated exposure to latex products during corrective surgeries and diagnostic procedures early in life. Atopic individuals, such as those with allergic rhinitis, eczema, and asthma, have a 4-fold increased risk for developing latex allergy compared to nonatopic individuals.4 The risk of latex allergy among health care workers is increased due to increased exposure to rubber products. One study found that the risk of latex sensitization among health care workers exposed to products containing latex was 4.3%, while the risk in the general population was only 1.37%.1 Those at highest risk for sensitization include dental assistants, operating room personnel, hospital housekeeping staff, and paramedics or emergency medical technicians.3 However, sensitization documented on laboratory assessment does not reliably correlate with symptomatic allergy, as many patients with a positive IgE test do not show clinical symptoms. Schmid et al4 demonstrated that a 1.3% prevalence of clinically symptomatic latex allergy among health care workers may approximate the prevalence of latex allergy in the general population. In a study by Brown et al,5 although 12.5% of anesthesiologists were found to be sensitized to latex, only 2.4% had clinically symptomatic allergic reactions.
Testing for Latex Allergy
Several diagnostic tests are available to establish a diagnosis of type I sensitization or true latex allergy. Skin prick testing is an in vivo assay and is the gold standard for diagnosing IgE-mediated type I hypersensitivity to latex. The test involves pricking the skin of the forearm and applying a commercial extract of nonammoniated latex to monitor for development of a wheal within several minutes. The skin prick test should be performed in a health care setting equipped with oxygen, epinephrine, and latex-free resuscitation equipment in case of anaphylaxis following exposure. Although latex skin prick testing is the gold standard, it is rarely performed in the United States because there is no US Food and Drug Administration–approved natural rubber latex reagent.3 Consequently, physicians who wish to perform skin prick testing for latex allergy are forced to develop improvised reagents from the H brasiliensis tree itself or from highly allergenic latex gloves. Standardized latex allergens are commercially available in Europe.
The most noninvasive method of latex allergy testing is an in vitro assay for latex-specific IgE antibodies, which can be detected by either a radioallergosorbent test (RAST) or enzyme-linked immunosorbent assay (ELISA). The presence of antilatex IgE antibodies confirms sensitization but does not necessarily mean the patient will develop a symptomatic reaction following exposure. Due to the unavailability of a standardized reagent for the skin prick test in the United States, evaluation of latex-specific serum IgE levels may be the best alternative. While the skin prick test has the highest sensitivity, the sensitivity and specificity of latex-specific serum IgE testing are 50% to 90% and 80% to 87%, respectively.6
The wear test (also known as the use or glove provocation test), can be used to diagnose clinically symptomatic latex allergy when there is a discrepancy between the patient’s clinical history and results from skin prick or serum IgE antibody testing. To perform the wear test, place a natural rubber latex glove on one of the patient’s fingers for 15 minutes and monitor the area for development of urticaria. If there is no evidence of allergic reaction within 15 minutes, place the glove on the whole hand for an additional 15 minutes. The patient is said to be nonreactive if a latex glove can be placed on the entire hand for 15 minutes without evidence of reaction.3
Lastly, patch testing can differentiate between irritant contact and allergic contact (type IV hypersensitivity) dermatitis. Apply a small amount of each substance of interest onto a separate disc and place the discs in direct contact with the skin using hypoallergenic tape. With type IV latex hypersensitivity, the skin underneath the disc will become erythematous with developing papulovesicles, starting between 2 and 5 days after exposure. The Figure outlines the differentiation of true latex allergy from irritant and allergic contact dermatitis and identifies methods for making these diagnoses.
General Medical Protocol With Latex Reactions
To reduce the incidence of latex allergic reactions among health care workers and patients, Kumar2 recommends putting a protocol in place to document steps in preventing, diagnosing, and treating latex allergy. This protocol includes employee and patient education about the risks for developing latex allergy and the signs and symptoms of a reaction; available diagnostic testing; and alternative products (eg, hypoallergenic gloves) that are available to individuals with a known or suspected allergy. At-risk health care workers who have not been sensitized should be advised to avoid latex-containing products.3 Routine questioning and diagnostic testing may be necessary as part of every preoperative assessment, as there have been reported cases of anaphylaxis in patients with undocumented allergies.7 Anaphylaxis caused by latex allergy is the second leading cause of perioperative anaphylaxis, accounting for as many as 20% of cases.8 With the use of preventative measures and early identification of at-risk patients, the incidence of latex-related anaphylaxis is decreasing.8 Ascertaining valuable information about the patient’s medical history, such as known allergies to foods that have cross-reactivity to latex (eg, bananas, mango, kiwi, avocado), is one simple way of identifying a patient who should be tested for possible underlying latex allergy.8 Total avoidance of latex-containing products (eg, in the workplace) can further reduce the incidence of allergic reactions by decreasing primary sensitization and risk of exposure.
Conclusion
Patients claiming to be allergic to latex without documentation should be tested. The diagnostic testing available in the United States includes patch testing, wear (or glove provocation) testing, or assessment of IgE antibody titer. Accurate differentiation among irritant contact dermatitis, allergic contact dermatitis, and true latex allergy is paramount for properly educating patients and effectively treating these conditions. Additionally, distinguishing patients with true latex allergy from those who have been misdiagnosed can save resources and reduce health care costs.
- Bousquet J, Flahault A, Vandenplas O, et al. Natural rubber latex allergy among health care workers: a systematic review of the evidence. J Allergy Clin Immunol. 2006;118:447-454.
- Kumar RP. Latex allergy in clinical practice. Indian J Dermatol. 2012;57:66-70.
- Taylor JS, Erkek E. Latex allergy: diagnosis and management. Dermatol Ther. 2004;17:289-301.
- Schmid K, Christoph Broding H, Niklas D, et al. Latex sensitization in dental students using powder-free gloves low in latex protein: a cross-sectional study. Contact Dermatitis. 2002;47:103-108.
- Brown RH, Schauble JF, Hamilton RG. Prevalence of latex allergy among anesthesiologists: identification of sensitized but asymptomatic individuals. Anesthesiology. 1998;89:292-299.
- Pollart SM, Warniment C, Mori T. Latex allergy. Am Fam Physician. 2009;80:1413-1418.
- Duger C, Kol IO, Kaygusuz K, et al. A perioperative anaphylactic reaction caused by latex in a patient with no history of allergy. Anaesth Pain Intensive Care. 2012;16:71-73.
- Hepner DL, Castells MC. Anaphylaxis during the perioperative period. Anesth Analg. 2003;97:1381-1395.
Practice Points
- The term latex allergy often is used as a general diagnosis to describe 3 types of reactions to natural rubber latex, including irritant contact dermatitis, allergic contact dermatitis (type IV hypersensitivity reaction), and true latex allergy (type I hypersensitivity reaction).
- The latex skin prick test is considered the gold standard for diagnosis of true latex allergy, but this method is not available in the United States. In vitro assay for latex-specific immunoglobulin E antibodies is the best alternative.

The “Impossible” Diagnosis
I was taught—and still believe—that obtaining a thorough history can direct you to a good working diagnosis. About 20 years ago, while in the Navy, I had a patient who showed me that I should not be fooled by a history that does not fit the current presentation.
The patient was a 34-year-old sailor with right-side knee pain, occurring intermittently for a long time but worsening in recent months. The pain did not prevent him from running, performing in the Navy’s semi-annual fitness test, or participating in departmental physical fitness activities.
However, his pain worsened after he was assigned to a ship, which required him to ascend and descend the steep shipboard stairs or ladders. He also complained of some intermittent buckling or “giving out.” But he was quite clear when he stated that he had sustained no recent injury to explain his condition.
His history was notable for an injury he sustained six years earlier, while running. Although he could not remember the exact mechanism of injury, he recalled that his knee hurt and was swollen the next day. He was seen in medical, where he was given crutches, modified duty, and ibuprofen for a few days. After a relatively short time, his activity returned to normal.
I had seen a lot of knee pain on board ship, mostly of the patellar tendonitis or patellofemoral syndrome types, that could often be treated conservatively with temporary duty modification to avoid aggravating activity. More serious injuries—such as meniscal, collateral, or cruciate ligament tears—were associated with recent or acute injuries and a history including a suspicious mechanism of injury.
This patient’s complete knee exam was largely unremarkable, except his anterior drawer test seemed to have no distinct endpoint. When I compared the results with his asymptomatic left knee, I could not appreciate any difference.
So I relayed to him my thought process: If he had done something serious to his knee six years ago, it probably would have manifested sooner. As other clinicians did previously, I treated him conservatively with duty limitations and advised him that if he failed to improve soon, I would refer him to an orthopedist for a second opinion.
Well, he did not improve soon. Since he was still concerned, I provided the referral, without obtaining an MRI.
To perhaps everyone’s surprise—but most definitely mine—the patient was diagnosed with a complete ACL tear by the orthopedist (again, without MRI). He was scheduled for surgery at a later date.
What surprised me most was that someone could perform the way he was required to perform in the Navy for six years with a torn ACL. As a result of this case, I have not let a remote history of injury cloud my judgment since!
HU noninferior to transfusion for stroke prevention in SCD

Photo courtesy of ASH
ORLANDO, FL—Hydroxyurea (HU) is noninferior to chronic blood transfusions for reducing the risk of stroke in children with sickle cell disease (SCD), results of the TWiTCH trial suggest.
The trial showed that daily doses of HU lower the transcranial Doppler (TCD) blood velocity in children with SCD to a similar degree as blood transfusions, thereby decreasing the risk of stroke.
Because of these findings, the trial was terminated early, in November of last year.
Last week, results from TWiTCH were presented at the 2015 ASH Annual Meeting (abstract 3*) and published in The Lancet. The study was funded by the National Heart Lung and Blood Institute.
“Stroke . . . is one of the most severe and catastrophic clinical events that occurs in children with sickle cell, with serious motor and cognitive sequelae,” said study investigator and ASH presenter Russell E. Ware, MD, of Cincinnati Children’s Hospital Medical Center in Ohio.
“With the advent of TCD, we now have the ability to identify high-risk children and use chronic transfusion therapy to prevent primary stroke.”
Dr Ware noted that results of the STOP trial showed that chronic transfusion reduced the risk of stroke in high-risk children with SCD, but the transfusions could not be stopped. The STOP 2 trial confirmed this, showing that stopping transfusions led to an increase in TCD blood velocity and stroke risk.
Because transfusions must be continued indefinitely and are associated with morbidity, an alternative stroke prevention strategy is needed, Dr Ware said. He and his colleagues conducted the TWiTCH trial to determine if HU would fit the bill.
Study design
For this phase 3 study, the researchers compared 24 months of transfusions to HU in children with SCD and abnormal TCD velocities. Study enrollment began in September 2011 and ended in April 2013.
All eligible children had received at least 12 months of transfusions prior to enrollment. They were randomized 1:1 to continue receiving transfusions or to receive the maximum-tolerated dose (MTD) of HU.
In the transfusion arm, the goal was to keep hemoglobin S levels below 30%, and iron overload was managed with daily oral chelation.
In the HU arm, the drug was escalated to the MTD, and children continued receiving transfusions until the MTD was achieved. Iron overload was managed with monthly phlebotomy.
The study had a noninferiority design, and the primary endpoint was the 24-month TCD velocity (with a noninferiority margin of 15 cm/sec). TCD velocities were obtained every 12 weeks and reviewed centrally. Local researchers were masked to the results.
Results
In all, 121 children were randomized—61 to transfusions and 60 to HU. Patient characteristics—baseline TCD velocities, age, duration of transfusion, etc.—were well balanced between the treatment arms.
“The average age of the patients was 9 or 10 years old, with about 3 or 4 years of transfusions coming in to the study,” Dr Ware noted.
In the transfusion arm, the children maintained a hemoglobin level of about 9 g/dL and hemoglobin S levels of less than 30%. Most patients received chelation with deferasirox at 26 ±6 mg/kg/day.
In the HU arm, 57 of 60 patients reached the MTD, which was 27 ± 4 mg/kg/day, on average. The median transfusion overlap was 6 months, the average absolute neutrophil count was 3.5 ± 1.6 x 10⁹/L, the average hemoglobin was about 9 g/dL, and fetal hemoglobin rose to about 25%. There were 756 phlebotomy procedures performed in 54 children.
“[In the HU arm,] very quickly after enrollment, the sickle hemoglobin rises, as the transfusions are weaned,” Dr Ware noted.
“Commensurately, the hemoglobin F rises as a protection. The neutrophil count and reticulocyte count drops, and those curves [counts in the HU and transfusion arms] diverge fairly quickly. The serum ferritin [curves] diverged as well.”
Early termination and noninferiority
Interim data analyses were scheduled to take place after one-third of the patients had exited the study and after two-thirds had exited. The first interim analysis demonstrated noninferiority, and the trial was closed early. An analysis was repeated after half of the patients had exited the study, and the trial was terminated.
At that point, 42 children had completed 24 months of treatment in the transfusion arm, 11 patients had truncated treatment, and 8 had early exits. Forty-one patients had completed 24 months of therapy in the HU arm, 13 had truncated treatment, and 6 had early exits.
The final TCD velocity (mean ± standard error) was 143 ± 1.6 cm/sec in the transfusion arm and 138 ± 1.6 cm/sec in the HU arm. The P value for noninferiority (in the intent-to-treat population) was 8.82 x 10⁻¹⁶. By post-hoc analysis, the P value for superiority was 0.023.
Secondary endpoints
There were 29 new neurological events during the trial—12 in the transfusion arm and 17 in the HU arm. There were no new strokes, but there were 6 new transient ischemic attacks—3 in each arm.
There were no new cerebral infarcts in either arm. But there was 1 new progressive vasculopathy in the transfusion arm. And 1 child in the transfusion arm was withdrawn from the study for increasing TCD (>240 cm/sec).
Iron overload improved more in the HU arm than the transfusion arm, with a greater average change in both serum ferritin (P<0.001) and liver iron concentration (P=0.001).
Serious adverse events were more common in the HU arm than the transfusion arm—23 events in 9 patients and 10 events in 6 patients, respectively. But none of these events were thought to be related to study treatment or procedures.
The most common serious adverse event in both groups was vaso-occlusive pain—11 events in 5 HU-treated patients and 3 events in 1 transfusion-treated patient.
Dr Ware noted that there were no secondary leukemias associated with HU in this trial, and there is “a cumulative body of evidence” spanning 20 years that suggests the drug is not carcinogenic in this patient population. ![]()
*Data in the abstract differ from data presented at the meeting.
Approach can help reduce VTE after surgery

Photo by Piotr Bodzek
New research suggests that individualized feedback is more effective than group instructions for helping general surgery residents prevent venous thromboembolism (VTE) in their patients.
The single-center study showed that regular, one-on-one feedback and written report cards helped ensure the use of correct VTE prophylaxis more effectively than the usual group lectures that newly minted surgeons receive as part of their training.
These results were published in Annals of Surgery.
The study, conducted between July 2013 and March 2014, involved 49 general surgery residents in their first through fifth year of training at Johns Hopkins Hospital in Baltimore, Maryland.
For the first 3 months, residents received no personalized feedback. For the following 3 months, they received an electronic score card via email detailing their individual performance, including how many times they prescribed the appropriate VTE prophylaxis, how many times they failed to do so, and how they fared compared with others.
For the next 3 months, all residents continued to receive monthly scores, but subpar performers—those who failed to prescribe appropriate treatment to every single patient they cared for—also received one-on-one coaching from a senior resident.
In the span of 6 months, this approach decreased—from 3 to 0—the number of preventable complications among surgery patients (complications occurring in patients who didn’t receive appropriate VTE prophylaxis).
In the 3-month period prior to deploying the personalized feedback strategy, 7 out of 865 surgical patients developed complications. Three of the 7 cases were subsequently identified as preventable. In comparison, there were no such preventable complications after residents received individualized feedback.
As a result of the feedback, the number of patients getting appropriate treatment increased from 89% to 96%.
The number of residents who performed at 100% (prescribing the correct treatment to every patient all the time) went up from 22 (45%) to 38 (78%). Most of the prescription failures—19 out of 28 such cases—were clustered in a group of 4 residents.
“Our results show that personalized, concrete feedback can be a form of forced introspection that improves self-awareness and decision-making on clotting prophylaxis,” said Elliott Haut, MD, PhD, of the Johns Hopkins University School of Medicine.
Beyond that, Dr Haut and his colleagues believe these results illustrate the notion that simple interventions can be harnessed to foster learning and improve performance among any frontline clinician.
“Speaking more broadly, why stop with residents? Why stop with anticlotting prophylaxis?” Dr Haut asked. “If our findings are borne out by larger studies, this approach could be harnessed to improve training and outcomes for anyone who touches a patient, from nurses to physicians to physical therapists.” ![]()
Acquired Port-wine Stain With Superimposed Eczema Following Penetrating Abdominal Trauma
Port-wine stains (PWSs) are common congenital capillary vascular malformations with an incidence of 3 per 1000 neonates.1 Rarely, acquired PWSs are seen, sometimes appearing following trauma.2-5 Port-wine stains are diagnosed clinically and present as painless, partially or entirely blanchable pink patches that respect the median (midline) plane.6 Although histopathologic examination is not necessary for diagnosis of PWS, typical findings include dilated, ectatic capillaries.7,8 Since it was first reported by Traub9 in 1939, more than 60 cases of acquired PWSs have been reported.10 A PubMed search of articles indexed for MEDLINE using the search terms acquired port-wine stain and port-wine stain and eczema yielded no cases of acquired PWS with associated eczematous changes and only 30 cases of congenital PWS with superimposed eczema.11-18 We report the case of an acquired PWS with superimposed eczema in an 18-year-old man following penetrating abdominal trauma.
Case Report
An otherwise healthy 18-year-old man presented to our dermatology office for evaluation of an eruption that had developed at the site of an abdominal stab wound he sustained 2 to 3 years prior. One year after he was stabbed, the patient developed a nonpruritic, painless red patch located 1 cm anterior to the healed wound on the left abdomen. The patch gradually grew larger to involve the entire left abdomen, extending to the left lower back. The site of the healed stab wound also became raised and pruritic, and the patient noted another pruritic plaque that formed within the larger patch. The patient reported no other skin conditions prior to the current eruption. His medical history was notable for seasonal allergies and asthma, but no childhood eczema.
Physical examination revealed a healthy, well-nourished man with Fitzpatrick skin type IV. A red, purpuric, coalescent patch with slightly arcuate borders extending from the mid abdomen to the left posterior flank was noted. The left lateral aspect of the patch blanched with pressure and respected the median plane. Within the larger patch, a 4-cm×2-cm lichenified, slightly macerated, hyperpigmented plaque was noted at the site of the stab wound (Figure 1). Based on these clinical findings, a presumptive diagnosis of an acquired PWS with superimposed eczema was made.

Punch biopsy specimens were taken from the large vascular patch and the smaller lichenified plaque. Histopathologic examination of the vascular patch showed an increased number of small vessels in the superficial dermis with thickened vessel walls, ectatic lumens, and no vasculopathy, consistent with a vascular malformation or a reactive vascular proliferation (Figure 2). On histopathology, the plaque showed epidermal spongiosis and hyperplasia with serum crust and a papillary dermis containing a mixed inflammatory infiltrate with occasional eosinophils, consistent with an eczematous dermatitis (Figure 3). The histologic findings confirmed the clinical diagnosis.


The pruritic, lichenified plaque improved with application of triamcinolone ointment 0.1% twice daily for 2 weeks. Magnetic resonance imaging to rule out an underlying arteriovenous malformation was recommended, but the patient declined.
Comment
The exact cause of PWS is unknown. There have been a multitude of genomic suspects for congenital lesions, including a somatic activating mutation (ie, a mutation acquired during fetal development) of the GNAQ (guanine nucleotide binding protein [G protein], q polypeptide) gene, which may contribute to abnormal cell proliferation including the regulation of blood vessels, and inactivating mutations in the RASA1 (RAS p21 protein activator [GTPase activating protein] 1) gene, which controls endothelial cell organization.19-22 Later mutations (ie, those occurring after the first trimester) may be more likely to result in isolated PWSs as opposed to syndromic PWSs.19 Whatever the source of genetic misinformation, it is thought that the diminished neuronal control of blood flow and the resulting alterations in dermal structure contribute to the pathogenesis of PWS and its associated histologic features.7,23
The clinical and histopathologic features of acquired PWSs are indistinguishable from those of congenital lesions, indicating that different processes may lead to the same presentation.4 Abnormal innervation and decreased supportive stroma have both been identified as contributing factors in the development of congenital and acquired PWSs.7,23-25 Rosen and Smoller23 found that diminished nerve density affects vascular tone and caliber in PWSs and had hypothesized in a prior report that decreased perivascular Schwann cells may indicate abnormal sympathetic innervation.7 Since then, PWS has been shown to lack both somatic and sensory innervation.24 Tsuji and Sawabe25 indicated that alterations to the perivascular stroma, whether congenital or as a result of trauma, decrease support for vessels, leading to ectasia.
In addition to an acquired PWS, our patient also had associated eczema within the PWS. Eczematous lesions were absent elsewhere, and he did not have a history of childhood eczema. Our review of the literature yielded 8 studies since 1996 that collectively described 30 cases of eczema within PWSs.11-18 Only 2 of these reports described adult patients with concomitant eczema and PWS and none described acquired PWS.13,18
Few studies have addressed the relationship between PWSs and eczema. It is unclear if concomitant PWS and localized eczema are collision dermatoses or if a PWS may predispose the affected skin to eczema.11-13 It has been hypothesized that the increased dermal vasculature in PWSs predisposes the skin to the development of eczema—more specifically, that ectasia may lead to increased inflammation.12,17 The concept of the “immunocompromised district” proposed by Ruocco et al26 is a unifying theory that may underlie the association noted between cases of trauma and later development of a PWS and superimposed eczematous dermatitis, such as in our case. Trauma is noted as one of a number of possible disruptive forces affecting both immunomodulation and neuromodulation within a local area of skin, leading to increased susceptibility of that district to various cutaneous diseases.26
Although our patient’s eczema responded to conservative treatment with a topical steroid, several case series have reported success with laser therapy in the treatment of PWS while preventing recurrence of associated eczematous dermatitis.12,17 Following the cessation of eczema treatment with topical steroid, which causes vasoconstriction, we suggest postponing laser therapy several weeks to allow resolution of vasoconstriction, thus providing enhanced therapeutic targeting with a vascular laser. Of particular relevance to our case, a recent study showed efficacy of the pulsed dye laser in treating PWSs in Fitzpatrick skin types IV and V.27
Conclusion
Although acquired PWS is rare, it can present later in life as an acquired lesion at a site of previous trauma.1-5 Congenital capillary malformations also can be associated with superimposed, localized eczema.11-18 We present a rarely reported case of an acquired PWS with superimposed, localized eczema. As in cases of congenital PWS with concomitant eczema, the associated eczema in our case was responsive to topical corticosteroid therapy. Additionally, pulsed dye laser has been shown to treat PWSs while preventing the recurrence of eczema, and it has been deemed effective for individuals with darker skin types.12,17, 27 Further studies are needed to explore the relationship between PWS and eczema.
- Jacobs AH, Walton RG. The incidence of birthmarks in the neonate. Pediatrics. 1976;58:218-222.
- Fegeler F. Naevus flammeus im trigeminusgebiet nach trauma im rahmen eines posttraumatisch-vegetativen syndroms. Arch Dermatol Syphilol. 1949;188:416-422.
- Kirkland CR, Mutasim DF. Acquired port-wine stain following repetitive trauma. J Am Acad Dermatol. 2011;65:462-463.
- Adams BB, Lucky AW. Acquired port-wine stains and antecedent trauma: case report and review of the literature. Arch Dermatol. 2000;136:897-899.
- Colver GB, Ryan TJ. Acquired port-wine stain. Arch Dermatol. 1986;122:1415-1416.
- Nigro J, Swerlick RA, Sepp NT, et al. Angiogenesis, vascular malformations and proliferations. In: Arndt KA, LeBoit PE, Robinson JK, Wintroub BU, eds. Cutaneous Medicine and Surgery: An Integrated Program in Dermatology. Philadelphia, PA: WB Saunders Co; 1996:1492-1521.
- Smoller BR, Rosen S. Port-wine stains. a disease of altered neural modulation of blood vessels? Arch Dermatol. 1986;122:177-179.
- Chang CJ, Yu JS, Nelson JS. Confocal microscopy study of neurovascular distribution in facial port wine stains(capillary malformation). J Formos Med Assoc. 2008;107:559-666.
- Traub EF. Naevus flammeus appearing at the age of twenty three. Arch Dermatol. 1939;39:752.
- Freysz M, Cribier B, Lipsker, D. Fegelers syndrome, acquired port-wine stain or acquired capillary malformation: three cases and a literature review [article in French]. Ann Dermatol Venereol. 2013;140:341-346.
- Tay YK, Morelli J, Weston WL. Inflammatory nuchal-occipital port-wine stains. J Am Acad Dermatol. 1996;35:811-813.
- Sidwell RU, Syed S, Harper JI. Port-wine stains and eczema. Br J Dermatol. 2001;144:1269-1270.
- Hofer T. Meyerson phenomenon within a nevus flammeus. Dermatology. 2002;205:180-183.
- Raff K, Landthaler M, Hoheleutner U. Port-wine stains with eczema. Phlebologie. 2003;32:15-17.
- Tsuboi H, Miyata T, Katsuoka K. Eczema in a port-wine stain. Clin Exp Dermatol. 2003;28:322-323.
- Rajan N, Natarahan S. Impetiginized eczema arising within a port-wine stain of the arm. J Eur Acad Dermatol Venereol. 2006;20:1009-1010.
- Fonder MA, Mamelak AJ, Kazin RA, et al. Port-wine-stain-associated dermatitis: implications for cutaneous vascular laser therapy. Pediatr Dermatol. 2007;24:376-379.
- Simon V, Wolfgan H, Katharina F. Meyerson-Phenomenon hides a nevus flammeus. J Dtsch Dermatol Ges. 2011;9:305-307.
- Shirley MD, Tang H, Gallione CJ, et al. Sturge-Weber syndrome and port-wine stains caused by somatic mutation in GNAQ. N Engl J Med. 2013;368:1971-1979.
- Hershkovitz D, Bercovich D, Sprecher E, et al. RASA1 mutations may cause hereditary capillary malformations without arteriovenous malformations. Br J Dermatol. 2008;158:1035-1040.
- Eerola I, Boon LM, Mulliken JB, et al. Capillary malformation-arteriovenous malformation, a new clinical and genetic disorder caused by RASA1 mutations. Am J Hum Genet. 2003;73:1240-1249.
- Henkemeyer M, Rossi DJ, Holmyard DP, et al. Vascular system defects and neuronal apoptosis in mice lacking ras GTPase-activating protein. Nature. 1995;377:695-701.
- Rosen S, Smoller BR. Port-wine stains: a new hypothesis. J Am Acad Dermatol. 1987;17:164-166.
- Rydh M, Malm BM, Jernmeck J, et al. Ectatic blood vessels in port-wine stains lack innervation: possible role in pathogenesis. Plast Reconstr Surg. 1991;87:419-422.
- Tsuji T, Sawabe M. A new type of telangiectasia following trauma. J Cutan Pathol. 1988;15:22-26.
- Ruocco V, Ruocco E, Brunnetti G, et al. Opportunistic localization of skin lesions on vulnerable areas. Clin Dermatol. 2011;29:483-488.
- Thajudeheen CP, Jyothy K, Pryadarshi A. Treatment of port-wine stains with flash lamp pumped pulsed dye laser on Indian skin: a six year study. J Cutan Aesthet Surg. 2014;7:32-36.
Port-wine stains (PWSs) are common congenital capillary vascular malformations with an incidence of 3 per 1000 neonates.1 Rarely, acquired PWSs are seen, sometimes appearing following trauma.2-5 Port-wine stains are diagnosed clinically and present as painless, partially or entirely blanchable pink patches that respect the median (midline) plane.6 Although histopathologic examination is not necessary for diagnosis of PWS, typical findings include dilated, ectatic capillaries.7,8 Since it was first reported by Traub9 in 1939, more than 60 cases of acquired PWSs have been reported.10 A PubMed search of articles indexed for MEDLINE using the search terms acquired port-wine stain and port-wine stain and eczema yielded no cases of acquired PWS with associated eczematous changes and only 30 cases of congenital PWS with superimposed eczema.11-18 We report the case of an acquired PWS with superimposed eczema in an 18-year-old man following penetrating abdominal trauma.
Case Report
An otherwise healthy 18-year-old man presented to our dermatology office for evaluation of an eruption that had developed at the site of an abdominal stab wound he sustained 2 to 3 years prior. One year after he was stabbed, the patient developed a nonpruritic, painless red patch located 1 cm anterior to the healed wound on the left abdomen. The patch gradually grew larger to involve the entire left abdomen, extending to the left lower back. The site of the healed stab wound also became raised and pruritic, and the patient noted another pruritic plaque that formed within the larger patch. The patient reported no other skin conditions prior to the current eruption. His medical history was notable for seasonal allergies and asthma, but no childhood eczema.
Physical examination revealed a healthy, well-nourished man with Fitzpatrick skin type IV. A red, purpuric, coalescent patch with slightly arcuate borders extending from the mid abdomen to the left posterior flank was noted. The left lateral aspect of the patch blanched with pressure and respected the median plane. Within the larger patch, a 4-cm×2-cm lichenified, slightly macerated, hyperpigmented plaque was noted at the site of the stab wound (Figure 1). Based on these clinical findings, a presumptive diagnosis of an acquired PWS with superimposed eczema was made.
Punch biopsy specimens were taken from the large vascular patch and the smaller lichenified plaque. Histopathologic examination of the vascular patch showed an increased number of small vessels in the superficial dermis with thickened vessel walls, ectatic lumens, and no vasculopathy, consistent with a vascular malformation or a reactive vascular proliferation (Figure 2). On histopathology, the plaque showed epidermal spongiosis and hyperplasia with serum crust and a papillary dermis containing a mixed inflammatory infiltrate with occasional eosinophils, consistent with an eczematous dermatitis (Figure 3). The histologic findings confirmed the clinical diagnosis.
The pruritic, lichenified plaque improved with application of triamcinolone ointment 0.1% twice daily for 2 weeks. Magnetic resonance imaging to rule out an underlying arteriovenous malformation was recommended, but the patient declined.
Comment
The exact cause of PWS is unknown. There have been a multitude of genomic suspects for congenital lesions, including a somatic activating mutation (ie, a mutation acquired during fetal development) of the GNAQ (guanine nucleotide binding protein [G protein], q polypeptide) gene, which may contribute to abnormal cell proliferation including the regulation of blood vessels, and inactivating mutations in the RASA1 (RAS p21 protein activator [GTPase activating protein] 1) gene, which controls endothelial cell organization.19-22 Later mutations (ie, those occurring after the first trimester) may be more likely to result in isolated PWSs as opposed to syndromic PWSs.19 Whatever the source of genetic misinformation, it is thought that the diminished neuronal control of blood flow and the resulting alterations in dermal structure contribute to the pathogenesis of PWS and its associated histologic features.7,23
The clinical and histopathologic features of acquired PWSs are indistinguishable from those of congenital lesions, indicating that different processes may lead to the same presentation.4 Abnormal innervation and decreased supportive stroma have both been identified as contributing factors in the development of congenital and acquired PWSs.7,23-25 Rosen and Smoller23 found that diminished nerve density affects vascular tone and caliber in PWSs and had hypothesized in a prior report that decreased perivascular Schwann cells may indicate abnormal sympathetic innervation.7 Since then, PWS has been shown to lack both somatic and sensory innervation.24 Tsuji and Sawabe25 indicated that alterations to the perivascular stroma, whether congenital or as a result of trauma, decrease support for vessels, leading to ectasia.
In addition to an acquired PWS, our patient also had associated eczema within the PWS. Eczematous lesions were absent elsewhere, and he did not have a history of childhood eczema. Our review of the literature yielded 8 studies since 1996 that collectively described 30 cases of eczema within PWSs.11-18 Only 2 of these reports described adult patients with concomitant eczema and PWS and none described acquired PWS.13,18
Few studies have addressed the relationship between PWSs and eczema. It is unclear if concomitant PWS and localized eczema are collision dermatoses or if a PWS may predispose the affected skin to eczema.11-13 It has been hypothesized that the increased dermal vasculature in PWSs predisposes the skin to the development of eczema—more specifically, that ectasia may lead to increased inflammation.12,17 The concept of the “immunocompromised district” proposed by Ruocco et al26 is a unifying theory that may underlie the association noted between cases of trauma and later development of a PWS and superimposed eczematous dermatitis, such as in our case. Trauma is noted as one of a number of possible disruptive forces affecting both immunomodulation and neuromodulation within a local area of skin, leading to increased susceptibility of that district to various cutaneous diseases.26
Although our patient’s eczema responded to conservative treatment with a topical steroid, several case series have reported success with laser therapy in the treatment of PWS while preventing recurrence of associated eczematous dermatitis.12,17 Following the cessation of eczema treatment with topical steroid, which causes vasoconstriction, we suggest postponing laser therapy several weeks to allow resolution of vasoconstriction, thus providing enhanced therapeutic targeting with a vascular laser. Of particular relevance to our case, a recent study showed efficacy of the pulsed dye laser in treating PWSs in Fitzpatrick skin types IV and V.27
Conclusion
Although acquired PWS is rare, it can present later in life as an acquired lesion at a site of previous trauma.1-5 Congenital capillary malformations also can be associated with superimposed, localized eczema.11-18 We present a rarely reported case of an acquired PWS with superimposed, localized eczema. As in cases of congenital PWS with concomitant eczema, the associated eczema in our case was responsive to topical corticosteroid therapy. Additionally, pulsed dye laser has been shown to treat PWSs while preventing the recurrence of eczema, and it has been deemed effective for individuals with darker skin types.12,17, 27 Further studies are needed to explore the relationship between PWS and eczema.
- Jacobs AH, Walton RG. The incidence of birthmarks in the neonate. Pediatrics. 1976;58:218-222.
- Fegeler F. Naevus flammeus im trigeminusgebiet nach trauma im rahmen eines posttraumatisch-vegetativen syndroms. Arch Dermatol Syphilol. 1949;188:416-422.
- Kirkland CR, Mutasim DF. Acquired port-wine stain following repetitive trauma. J Am Acad Dermatol. 2011;65:462-463.
- Adams BB, Lucky AW. Acquired port-wine stains and antecedent trauma: case report and review of the literature. Arch Dermatol. 2000;136:897-899.
- Colver GB, Ryan TJ. Acquired port-wine stain. Arch Dermatol. 1986;122:1415-1416.
- Nigro J, Swerlick RA, Sepp NT, et al. Angiogenesis, vascular malformations and proliferations. In: Arndt KA, LeBoit PE, Robinson JK, Wintroub BU, eds. Cutaneous Medicine and Surgery: An Integrated Program in Dermatology. Philadelphia, PA: WB Saunders Co; 1996:1492-1521.
- Smoller BR, Rosen S. Port-wine stains. a disease of altered neural modulation of blood vessels? Arch Dermatol. 1986;122:177-179.
- Chang CJ, Yu JS, Nelson JS. Confocal microscopy study of neurovascular distribution in facial port wine stains(capillary malformation). J Formos Med Assoc. 2008;107:559-666.
- Traub EF. Naevus flammeus appearing at the age of twenty three. Arch Dermatol. 1939;39:752.
- Freysz M, Cribier B, Lipsker, D. Fegelers syndrome, acquired port-wine stain or acquired capillary malformation: three cases and a literature review [article in French]. Ann Dermatol Venereol. 2013;140:341-346.
- Tay YK, Morelli J, Weston WL. Inflammatory nuchal-occipital port-wine stains. J Am Acad Dermatol. 1996;35:811-813.
- Sidwell RU, Syed S, Harper JI. Port-wine stains and eczema. Br J Dermatol. 2001;144:1269-1270.
- Hofer T. Meyerson phenomenon within a nevus flammeus. Dermatology. 2002;205:180-183.
- Raff K, Landthaler M, Hoheleutner U. Port-wine stains with eczema. Phlebologie. 2003;32:15-17.
- Tsuboi H, Miyata T, Katsuoka K. Eczema in a port-wine stain. Clin Exp Dermatol. 2003;28:322-323.
- Rajan N, Natarahan S. Impetiginized eczema arising within a port-wine stain of the arm. J Eur Acad Dermatol Venereol. 2006;20:1009-1010.
- Fonder MA, Mamelak AJ, Kazin RA, et al. Port-wine-stain-associated dermatitis: implications for cutaneous vascular laser therapy. Pediatr Dermatol. 2007;24:376-379.
- Simon V, Wolfgan H, Katharina F. Meyerson-Phenomenon hides a nevus flammeus. J Dtsch Dermatol Ges. 2011;9:305-307.
- Shirley MD, Tang H, Gallione CJ, et al. Sturge-Weber syndrome and port-wine stains caused by somatic mutation in GNAQ. N Engl J Med. 2013;368:1971-1979.
- Hershkovitz D, Bercovich D, Sprecher E, et al. RASA1 mutations may cause hereditary capillary malformations without arteriovenous malformations. Br J Dermatol. 2008;158:1035-1040.
- Eerola I, Boon LM, Mulliken JB, et al. Capillary malformation-arteriovenous malformation, a new clinical and genetic disorder caused by RASA1 mutations. Am J Hum Genet. 2003;73:1240-1249.
- Henkemeyer M, Rossi DJ, Holmyard DP, et al. Vascular system defects and neuronal apoptosis in mice lacking ras GTPase-activating protein. Nature. 1995;377:695-701.
- Rosen S, Smoller BR. Port-wine stains: a new hypothesis. J Am Acad Dermatol. 1987;17:164-166.
- Rydh M, Malm BM, Jernmeck J, et al. Ectatic blood vessels in port-wine stains lack innervation: possible role in pathogenesis. Plast Reconstr Surg. 1991;87:419-422.
- Tsuji T, Sawabe M. A new type of telangiectasia following trauma. J Cutan Pathol. 1988;15:22-26.
- Ruocco V, Ruocco E, Brunnetti G, et al. Opportunistic localization of skin lesions on vulnerable areas. Clin Dermatol. 2011;29:483-488.
- Thajudeheen CP, Jyothy K, Pryadarshi A. Treatment of port-wine stains with flash lamp pumped pulsed dye laser on Indian skin: a six year study. J Cutan Aesthet Surg. 2014;7:32-36.
Practice Points
- Port-wine stains (PWSs) most often are congenital lesions but can present later in life as acquired lesions with the same clinical and histologic findings.
- Magnetic resonance imaging of acquired PWSs should be considered to rule out underlying vascular anomalies (eg, deeper arteriovenous malformations).
- Pulsed dye laser therapy is safe for darker skin types and is the treatment of choice for acquired PWSs.

Alarm Fatigue
Alarm fatigue is not a new issue for hospitals. In a commentary written over 3 decades ago, Kerr and Hayes described what they saw as an alarming issue developing in intensive care units.[1] Recently multiple organizations, including The Joint Commission and the Emergency Care Research Institute have called out alarm fatigue as a patient safety problem,[2, 3, 4] and organizations such as the American Academy of Pediatrics and the American Heart Association are backing away from recommendations for continuous monitoring.[5, 6] Hospitals are in a scramble to set up alarm committees and address alarms locally as recommended by The Joint Commission.[2] In this issue of the Journal of Hospital Medicine, Paine and colleagues set out to review the small but growing body of literature addressing physiologic monitor alarms and interventions that have tried to address alarm fatigue.[7]
After searching through 4629 titles, the authors found 32 articles addressing their key questions: What proportion of alarms are actionable? What is the relationship between clinicians' alarm exposure and response time? Which interventions are effective for reducing alarm rates? The majority of studies identified were observational, with only 8 studies addressing interventions to reduce alarms. Many of the identified studies occurred in units taking care of adults, though 10 descriptive studies and 1 intervention study occurred in pediatric settings. Perhaps the most concerning finding of all, though not surprising to those who work in the hospital setting, was that somewhere between <1% and 26% of alarms across all studies were considered actionable. Although only specifically addressed in 2 studies, the issue of alarm fatigue (i.e., more alarms leading to slower and sometimes absent clinician response) was supported in both, with nurses having slower responses when exposed to a higher numbers of alarms.[8, 9]
The authors note several limitations of their work, one of which is the modest body of literature on the topic. Although several interventions, including widening alarm parameters, increasing alarm delays, and using disposable leads or daily lead changes, have early evidence of success in safely reducing unnecessary alarms, the heterogeneity of this literature precluded a meta‐analysis. Further, the lack of standard definitions and the variety of methods of determining alarm validity make comparison across studies challenging. For this reason, the authors note that they did not distinguish nuisance alarms (i.e., alarms that accurately reflect the patient condition but do not require any intervention) from invalid alarms (i.e., alarms that do not correctly reflect the patient condition). This is relevant because it is likely that interventions to reduce invalid alarms (e.g., frequent lead changes) may be distinct from those that will successfully address nuisance alarms (e.g., widening alarm limits). It is also important to note that although patient safety is of paramount importance, there were other negative consequences of alarms that the authors did not address in this systemic review. Moreover, although avoiding unrecognized deterioration should be a primary goal of any program to reduce alarm fatigue, death remains uncommon compared to the number of patients, families, and healthcare workers exposed to high numbers of alarms during hospitalization. The high number of nonactionable alarms suggests that part of the burden of this problem may lie in more difficult to quantify outcomes such as sleep quality,[10, 11, 12] patient and parent quality of life during hospitalization,[13, 14] and interrupted tasks and cognitive work of healthcare providers.[15]
Paine and colleagues' review has some certain and some less certain implications for the future of alarm research. First, there is an imminent need for researchers and improvers to develop a consensus around terminology and metrics. We need to agree on what is and is not an actionable alarm, and we need valid and sensitive metrics to better understand the consequences of not monitoring a patient who should be on monitors. Second, hospitals addressing alarm fatigue need benchmarks. As hospitals rush to comply with The Joint Commission National Patient Safety Goals for alarm management,[2] it is safe to say that our goal should not be zero alarms, but how low do you go? What can we consider a safe number of alarms in our hospitals? Smart alarms hold tremendous potential to improve the sensitivity and positive predictive value of alarms. However, their ultimate success is dependent on engineers in industry to develop the technology as well as researchers in the hospital setting to validate the technology's performance in clinical care. Additionally, hospitals need to know which interventions are most effective to implement and how to reliably implement these in daily practice. What seems less certain is what type of research is best suited to address this need. The authors recommend randomized trials as an immediate next step, and certainly trials are the gold standard in determining efficacy. However, trials may overstate effectiveness as complex bundled interventions play out in complex and dynamic hospital systems. Quasiexperimental study designs, including time series and step‐wedge designs, would allow for further scientific discovery, such as which interventions are most effective in certain patient populations, while describing reliable implementation of effective methods that lead to lower alarms rates. In both classical randomized controlled trials and quasiexperiments, factorial designs[16, 17] could give us a better understanding of both the comparative effect and any interaction between interventions.
Alarm fatigue is a widespread problem that has negative effects for patients, families, nurses, and physicians. This review demonstrates that the great majority of alarms do not help clinicians and likely contribute to alarm fatigue. The opportunity to improve care is unquestionably vast, and attention from The Joint Commission and the lay press ensures change will occur. What is critical now is for hospitalists, intensivists, nurses, researchers, and hospital administrators to find the right combination of scientific discovery, thoughtful collaboration with industry, and quality improvement that will inform the literature on which interventions worked, how, and in what setting, and ultimately lead to safer (and quieter) hospitals.
Disclosures
Dr. Brady is supported by the Agency for Healthcare Research and Quality under award number K08HS023827. The content is solely the responsibility of the authors and does not necessarily represent the official views of the Agency for Healthcare Research and Quality. Dr. Landrigan is supported in part by the Children's Hospital Association for his work as an executive council member of the Pediatric Research in Inpatient Settings network. Dr. Landrigan serves as a consultant to Virgin Pulse regarding sleep, safety, and health. In addition, Dr. Landrigan has received monetary awards, honoraria, and travel reimbursement from multiple academic and professional organizations for delivering lectures on sleep deprivation, physician performance, handoffs, and patient safety, and has served as an expert witness in cases regarding patient safety. The authors report no other funding, financial relationships, or conflicts of interest.
- , . An “alarming” situation in the intensive therapy unit. Intensive Care Med. 1983;9(3):103–104.
- The Joint Commission. National Patient Safety Goal on Alarm Management. Available at: http://www.jointcommission.org/assets/1/18/JCP0713_Announce_New_NSPG.pdf. Accessed October 23, 2015.
- Joint Commission. Medical device alarm safety in hospitals. Sentinel Event Alert. 2013;(50):1–3.
- Top 10 health technology hazards for 2014. Health Devices. 2013;42(11):354–380.
- , , , et al. Clinical practice guideline: the diagnosis, management, and prevention of bronchiolitis. Pediatrics. 2014;134(5):e1474–e1502.
- , , , et al. Practice standards for electrocardiographic monitoring in hospital settings: an American Heart Association scientific statement from the Councils on Cardiovascular Nursing, Clinical Cardiology, and Cardiovascular Disease in the Young: endorsed by the International Society of Computerized Electrocardiology and the American Association of Critical‐Care Nurses. Circulation. 2004;110(17):2721–2746.
- , , , , , , . Systematic review of physiologic monitor alarm characteristics and pragmatic interventions to reduce alarm frequency. J Hosp Med. 2016;11(2):136–144.
- , , , et al. Pulse oximetry desaturation alarms on a general postoperative adult unit: a prospective observational study of nurse response time. Int J Nurs Stud. 2013;50(10):1351–1358.
- , , , et al. Association between exposure to nonactionable physiologic monitor alarms and response time in a children's hospital. J Hosp Med. 2015;10(6):345–351.
- . Sleep deprivation is an additional stress for parents staying in hospital. J Spec Pediatr Nurs. 2008;13(2):111–122.
- , , , , . The sound intensity and characteristics of variable‐pitch pulse oximeters. J Clin Monit Comput. 2008;22(3):199–207.
- , , , . Factors influencing sleep for parents of critically ill hospitalised children: a qualitative analysis. Intensive Crit Care Nurs. 2011;27(1):37–45.
- , , , , . Perceptions of stress, worry, and support in Black and White mothers of hospitalized, medically fragile infants. J Pediatr Nurs. 2002;17(2):82–88.
- , , , . Parents' responses to stress in the neonatal intensive care unit. Crit Care Nurs. 2013;33(4):52–59; quiz 60.
- , . Alarm fatigue and its influence on staff performance. IIE Trans Healthc Syst Eng. 2015;5(3):183–196.
- , , . Quality Improvement Through Planned Experimentation. 3rd ed. New York, NY: McGraw‐Hill; 1991.
- , . The Health Care Data Guide: Learning From Data for Improvement. San Francisco, CA: Jossey‐Bass; 2011.
Alarm fatigue is not a new issue for hospitals. In a commentary written over 3 decades ago, Kerr and Hayes described what they saw as an alarming issue developing in intensive care units.[1] Recently multiple organizations, including The Joint Commission and the Emergency Care Research Institute have called out alarm fatigue as a patient safety problem,[2, 3, 4] and organizations such as the American Academy of Pediatrics and the American Heart Association are backing away from recommendations for continuous monitoring.[5, 6] Hospitals are in a scramble to set up alarm committees and address alarms locally as recommended by The Joint Commission.[2] In this issue of the Journal of Hospital Medicine, Paine and colleagues set out to review the small but growing body of literature addressing physiologic monitor alarms and interventions that have tried to address alarm fatigue.[7]
After searching through 4629 titles, the authors found 32 articles addressing their key questions: What proportion of alarms are actionable? What is the relationship between clinicians' alarm exposure and response time? Which interventions are effective for reducing alarm rates? The majority of studies identified were observational, with only 8 studies addressing interventions to reduce alarms. Many of the identified studies occurred in units taking care of adults, though 10 descriptive studies and 1 intervention study occurred in pediatric settings. Perhaps the most concerning finding of all, though not surprising to those who work in the hospital setting, was that somewhere between <1% and 26% of alarms across all studies were considered actionable. Although only specifically addressed in 2 studies, the issue of alarm fatigue (i.e., more alarms leading to slower and sometimes absent clinician response) was supported in both, with nurses having slower responses when exposed to a higher numbers of alarms.[8, 9]
The authors note several limitations of their work, one of which is the modest body of literature on the topic. Although several interventions, including widening alarm parameters, increasing alarm delays, and using disposable leads or daily lead changes, have early evidence of success in safely reducing unnecessary alarms, the heterogeneity of this literature precluded a meta‐analysis. Further, the lack of standard definitions and the variety of methods of determining alarm validity make comparison across studies challenging. For this reason, the authors note that they did not distinguish nuisance alarms (i.e., alarms that accurately reflect the patient condition but do not require any intervention) from invalid alarms (i.e., alarms that do not correctly reflect the patient condition). This is relevant because it is likely that interventions to reduce invalid alarms (e.g., frequent lead changes) may be distinct from those that will successfully address nuisance alarms (e.g., widening alarm limits). It is also important to note that although patient safety is of paramount importance, there were other negative consequences of alarms that the authors did not address in this systemic review. Moreover, although avoiding unrecognized deterioration should be a primary goal of any program to reduce alarm fatigue, death remains uncommon compared to the number of patients, families, and healthcare workers exposed to high numbers of alarms during hospitalization. The high number of nonactionable alarms suggests that part of the burden of this problem may lie in more difficult to quantify outcomes such as sleep quality,[10, 11, 12] patient and parent quality of life during hospitalization,[13, 14] and interrupted tasks and cognitive work of healthcare providers.[15]
Paine and colleagues' review has some certain and some less certain implications for the future of alarm research. First, there is an imminent need for researchers and improvers to develop a consensus around terminology and metrics. We need to agree on what is and is not an actionable alarm, and we need valid and sensitive metrics to better understand the consequences of not monitoring a patient who should be on monitors. Second, hospitals addressing alarm fatigue need benchmarks. As hospitals rush to comply with The Joint Commission National Patient Safety Goals for alarm management,[2] it is safe to say that our goal should not be zero alarms, but how low do you go? What can we consider a safe number of alarms in our hospitals? Smart alarms hold tremendous potential to improve the sensitivity and positive predictive value of alarms. However, their ultimate success is dependent on engineers in industry to develop the technology as well as researchers in the hospital setting to validate the technology's performance in clinical care. Additionally, hospitals need to know which interventions are most effective to implement and how to reliably implement these in daily practice. What seems less certain is what type of research is best suited to address this need. The authors recommend randomized trials as an immediate next step, and certainly trials are the gold standard in determining efficacy. However, trials may overstate effectiveness as complex bundled interventions play out in complex and dynamic hospital systems. Quasiexperimental study designs, including time series and step‐wedge designs, would allow for further scientific discovery, such as which interventions are most effective in certain patient populations, while describing reliable implementation of effective methods that lead to lower alarms rates. In both classical randomized controlled trials and quasiexperiments, factorial designs[16, 17] could give us a better understanding of both the comparative effect and any interaction between interventions.
Alarm fatigue is a widespread problem that has negative effects for patients, families, nurses, and physicians. This review demonstrates that the great majority of alarms do not help clinicians and likely contribute to alarm fatigue. The opportunity to improve care is unquestionably vast, and attention from The Joint Commission and the lay press ensures change will occur. What is critical now is for hospitalists, intensivists, nurses, researchers, and hospital administrators to find the right combination of scientific discovery, thoughtful collaboration with industry, and quality improvement that will inform the literature on which interventions worked, how, and in what setting, and ultimately lead to safer (and quieter) hospitals.
Disclosures
Dr. Brady is supported by the Agency for Healthcare Research and Quality under award number K08HS023827. The content is solely the responsibility of the authors and does not necessarily represent the official views of the Agency for Healthcare Research and Quality. Dr. Landrigan is supported in part by the Children's Hospital Association for his work as an executive council member of the Pediatric Research in Inpatient Settings network. Dr. Landrigan serves as a consultant to Virgin Pulse regarding sleep, safety, and health. In addition, Dr. Landrigan has received monetary awards, honoraria, and travel reimbursement from multiple academic and professional organizations for delivering lectures on sleep deprivation, physician performance, handoffs, and patient safety, and has served as an expert witness in cases regarding patient safety. The authors report no other funding, financial relationships, or conflicts of interest.
- , . An “alarming” situation in the intensive therapy unit. Intensive Care Med. 1983;9(3):103–104.
- The Joint Commission. National Patient Safety Goal on Alarm Management. Available at: http://www.jointcommission.org/assets/1/18/JCP0713_Announce_New_NSPG.pdf. Accessed October 23, 2015.
- Joint Commission. Medical device alarm safety in hospitals. Sentinel Event Alert. 2013;(50):1–3.
- Top 10 health technology hazards for 2014. Health Devices. 2013;42(11):354–380.
- , , , et al. Clinical practice guideline: the diagnosis, management, and prevention of bronchiolitis. Pediatrics. 2014;134(5):e1474–e1502.
- , , , et al. Practice standards for electrocardiographic monitoring in hospital settings: an American Heart Association scientific statement from the Councils on Cardiovascular Nursing, Clinical Cardiology, and Cardiovascular Disease in the Young: endorsed by the International Society of Computerized Electrocardiology and the American Association of Critical‐Care Nurses. Circulation. 2004;110(17):2721–2746.
- , , , , , , . Systematic review of physiologic monitor alarm characteristics and pragmatic interventions to reduce alarm frequency. J Hosp Med. 2016;11(2):136–144.
- , , , et al. Pulse oximetry desaturation alarms on a general postoperative adult unit: a prospective observational study of nurse response time. Int J Nurs Stud. 2013;50(10):1351–1358.
- , , , et al. Association between exposure to nonactionable physiologic monitor alarms and response time in a children's hospital. J Hosp Med. 2015;10(6):345–351.
- . Sleep deprivation is an additional stress for parents staying in hospital. J Spec Pediatr Nurs. 2008;13(2):111–122.
- , , , , . The sound intensity and characteristics of variable‐pitch pulse oximeters. J Clin Monit Comput. 2008;22(3):199–207.
- , , , . Factors influencing sleep for parents of critically ill hospitalised children: a qualitative analysis. Intensive Crit Care Nurs. 2011;27(1):37–45.
- , , , , . Perceptions of stress, worry, and support in Black and White mothers of hospitalized, medically fragile infants. J Pediatr Nurs. 2002;17(2):82–88.
- , , , . Parents' responses to stress in the neonatal intensive care unit. Crit Care Nurs. 2013;33(4):52–59; quiz 60.
- , . Alarm fatigue and its influence on staff performance. IIE Trans Healthc Syst Eng. 2015;5(3):183–196.
- , , . Quality Improvement Through Planned Experimentation. 3rd ed. New York, NY: McGraw‐Hill; 1991.
- , . The Health Care Data Guide: Learning From Data for Improvement. San Francisco, CA: Jossey‐Bass; 2011.
Review of Physiologic Monitor Alarms
Clinical alarm safety has become a recent target for improvement in many hospitals. In 2013, The Joint Commission released a National Patient Safety Goal prompting accredited hospitals to establish alarm safety as a hospital priority, identify the most important alarm signals to manage, and, by 2016, develop policies and procedures that address alarm management.[1] In addition, the Emergency Care Research Institute has named alarm hazards the top health technology hazard each year since 2012.[2]
The primary arguments supporting the elevation of alarm management to a national hospital priority in the United States include the following: (1) clinicians rely on alarms to notify them of important physiologic changes, (2) alarms occur frequently and usually do not warrant clinical intervention, and (3) alarm overload renders clinicians unable to respond to all alarms, resulting in alarm fatigue: responding more slowly or ignoring alarms that may represent actual clinical deterioration.[3, 4] These arguments are built largely on anecdotal data, reported safety event databases, and small studies that have not previously been systematically analyzed.
Despite the national focus on alarms, we still know very little about fundamental questions key to improving alarm safety. In this systematic review, we aimed to answer 3 key questions about physiologic monitor alarms: (1) What proportion of alarms warrant attention or clinical intervention (ie, actionable alarms), and how does this proportion vary between adult and pediatric populations and between intensive care unit (ICU) and ward settings? (2) What is the relationship between alarm exposure and clinician response time? (3) What interventions are effective in reducing the frequency of alarms?
We limited our scope to monitor alarms because few studies have evaluated the characteristics of alarms from other medical devices, and because missing relevant monitor alarms could adversely impact patient safety.
METHODS
We performed a systematic review of the literature in accordance with the Meta‐Analysis of Observational Studies in Epidemiology guidelines[5] and developed this manuscript using the Preferred Reporting Items for Systematic Reviews and Meta‐Analyses (PRISMA) statement.[6]
Eligibility Criteria
With help from an experienced biomedical librarian (C.D.S.), we searched PubMed, the Cumulative Index to Nursing and Allied Health Literature, Scopus, Cochrane Library,
We included peer‐reviewed, original research studies published in English, Spanish, or French that addressed the questions outlined above. Eligible patient populations were children and adults admitted to hospital inpatient units and emergency departments (EDs). We excluded alarms in procedural suites or operating rooms (typically responded to by anesthesiologists already with the patient) because of the differences in environment of care, staff‐to‐patient ratio, and equipment. We included observational studies reporting the actionability of physiologic monitor alarms (ie, alarms warranting special attention or clinical intervention), as well as nurse responses to these alarms. We excluded studies focused on the effects of alarms unrelated to patient safety, such as families' and patients' stress, noise, or sleep disturbance. We included only intervention studies evaluating pragmatic interventions ready for clinical implementation (ie, not experimental devices or software algorithms).
Selection Process and Data Extraction
First, 2 authors screened the titles and abstracts of articles for eligibility. To maximize sensitivity, if at least 1 author considered the article relevant, the article proceeded to full‐text review. Second, the full texts of articles screened were independently reviewed by 2 authors in an unblinded fashion to determine their eligibility. Any disagreements concerning eligibility were resolved by team consensus. To assure consistency in eligibility determinations across the team, a core group of the authors (C.W.P, C.P.B., E.E., and V.V.G.) held a series of meetings to review and discuss each potentially eligible article and reach consensus on the final list of included articles. Two authors independently extracted the following characteristics from included studies: alarm review methods, analytic design, fidelity measurement, consideration of unintended adverse safety consequences, and key results. Reviewers were not blinded to journal, authors, or affiliations.
Synthesis of Results and Risk Assessment
Given the high degree of heterogeneity in methodology, we were unable to generate summary proportions of the observational studies or perform a meta‐analysis of the intervention studies. Thus, we organized the studies into clinically relevant categories and presented key aspects in tables. Due to the heterogeneity of the studies and the controversy surrounding quality scores,[5] we did not generate summary scores of study quality. Instead, we evaluated and reported key design elements that had the potential to bias the results. To recognize the more comprehensive studies in the field, we developed by consensus a set of characteristics that distinguished studies with lower risk of bias. These characteristics are shown and defined in Table 1.
| First Author and Publication Year | Alarm Review Method | Indicators of Potential Bias for Observational Studies | Indicators of Potential Bias for Intervention Studies | |||||||||||||
|---|---|---|---|---|---|---|---|---|---|---|---|---|---|---|---|---|
| Monitor System | Direct Observation | Medical Record Review | Rhythm Annotation | Video Observation | Remote Monitoring Staff | Medical Device Industry Involved | Two Independent Reviewers | At Least 1 Reviewer Is a Clinical Expert | Reviewer Not Simultaneously in Patient Care | Clear Definition of Alarm Actionability | Census Included | Statistical Testing or QI SPC Methods | Fidelity Assessed | Safety Assessed | Lower Risk of Bias | |
| ||||||||||||||||
| Adult Observational | ||||||||||||||||
| Atzema 2006[7] | ✓* | ✓ | ✓ | |||||||||||||
| Billinghurst 2003[8] | ✓ | ✓ | ✓ | ✓ | ||||||||||||
| Biot 2000[9] | ✓ | ✓ | ✓ | ✓ | ||||||||||||
| Chambrin 1999[10] | ✓ | ✓ | ✓ | ✓ | ||||||||||||
| Drew 2014[11] | ✓ | ✓ | ✓ | ✓ | ✓ | ✓ | ✓ | ✓ | ||||||||
| Gazarian 2014[12] | ✓ | ✓ | ✓ | ✓ | ✓ | |||||||||||
| Grges 2009[13] | ✓ | ✓ | ✓ | ✓ | ||||||||||||
| Gross 2011[15] | ✓ | ✓ | ✓ | ✓ | ✓ | ✓ | ✓ | |||||||||
| Inokuchi 2013[14] | ✓ | ✓ | ✓ | ✓ | ✓ | ✓ | ✓ | |||||||||
| Koski 1990[16] | ✓ | ✓ | ✓ | ✓ | ||||||||||||
| Morales Snchez 2014[17] | ✓ | ✓ | ✓ | ✓ | ||||||||||||
| Pergher 2014[18] | ✓ | ✓ | ||||||||||||||
| Siebig 2010[19] | ✓ | ✓ | ✓ | ✓ | ✓ | ✓ | ||||||||||
| Voepel‐Lewis 2013[20] | ✓ | ✓ | ✓ | ✓ | ||||||||||||
| Way 2014[21] | ✓ | ✓ | ✓ | |||||||||||||
| Pediatric Observational | ||||||||||||||||
| Bonafide 2015[22] | ✓ | ✓ | ✓ | ✓ | ✓ | ✓ | ✓ | |||||||||
| Lawless 1994[23] | ✓ | ✓ | ||||||||||||||
| Rosman 2013[24] | ✓ | ✓ | ✓ | ✓ | ✓ | |||||||||||
| Talley 2011[25] | ✓ | ✓ | ✓ | ✓ | ✓ | |||||||||||
| Tsien 1997[26] | ✓ | ✓ | ✓ | ✓ | ||||||||||||
| van Pul 2015[27] | ✓ | |||||||||||||||
| Varpio 2012[28] | ✓ | ✓ | ✓ | ✓ | ||||||||||||
| Mixed Adult and Pediatric Observational | ||||||||||||||||
| O'Carroll 1986[29] | ✓ | |||||||||||||||
| Wiklund 1994[30] | ✓ | ✓ | ✓ | ✓ | ||||||||||||
| Adult Intervention | ||||||||||||||||
| Albert 2015[32] | ✓ | ✓ | ✓ | ✓ | ✓ | ✓ | ✓ | |||||||||
| Cvach 2013[33] | ✓ | ✓ | ||||||||||||||
| Cvach 2014[34] | ✓ | ✓ | ||||||||||||||
| Graham 2010[35] | ✓ | |||||||||||||||
| Rheineck‐Leyssius 1997[36] | ✓ | ✓ | ✓ | ✓ | ✓ | ✓ | ||||||||||
| Taenzer 2010[31] | ✓ | ✓ | ✓ | ✓ | ✓ | ✓ | ||||||||||
| Whalen 2014[37] | ✓ | ✓ | ✓ | |||||||||||||
| Pediatric Intervention | ||||||||||||||||
| Dandoy 2014[38] | ✓ | ✓ | ✓ | ✓ | ✓ | ✓ | ||||||||||
For the purposes of this review, we defined nonactionable alarms as including both invalid (false) alarms that do not that accurately represent the physiologic status of the patient and alarms that are valid but do not warrant special attention or clinical intervention (nuisance alarms). We did not separate out invalid alarms due to the tremendous variation between studies in how validity was measured.
RESULTS
Study Selection
Search results produced 4629 articles (see the flow diagram in the Supporting Information in the online version of this article), of which 32 articles were eligible: 24 observational studies describing alarm characteristics and 8 studies describing interventions to reduce alarm frequency.
Observational Study Characteristics
Characteristics of included studies are shown in Table 1. Of the 24 observational studies,[7, 8, 9, 10, 11, 12, 13, 14, 15, 16, 17, 18, 19, 20, 21, 22, 23, 24, 25, 26, 27, 28, 29, 30] 15 included adult patients,[7, 8, 9, 10, 11, 12, 13, 14, 15, 16, 17, 18, 19, 20, 21] 7 included pediatric patients,[22, 23, 24, 25, 26, 27, 28] and 2 included both adult and pediatric patients.[29, 30] All were single‐hospital studies, except for 1 study by Chambrin and colleagues[10] that included 5 sites. The number of patient‐hours examined in each study ranged from 60 to 113,880.[7, 8, 9, 10, 11, 13, 14, 15, 16, 18, 19, 20, 21, 22, 23, 24, 25, 26, 27, 29, 30] Hospital settings included ICUs (n = 16),[9, 10, 11, 13, 14, 16, 17, 18, 19, 22, 23, 24, 25, 26, 27, 29] general wards (n = 5),[12, 15, 20, 22, 28] EDs (n = 2),[7, 21] postanesthesia care unit (PACU) (n = 1),[30] and cardiac care unit (CCU) (n = 1).[8] Studies varied in the type of physiologic signals recorded and data collection methods, ranging from direct observation by a nurse who was simultaneously caring for patients[29] to video recording with expert review.[14, 19, 22] Four observational studies met the criteria for lower risk of bias.[11, 14, 15, 22]
Intervention Study Characteristics
Of the 8 intervention studies, 7 included adult patients,[31, 32, 33, 34, 35, 36, 37] and 1 included pediatric patients.[38] All were single‐hospital studies; 6 were quasi‐experimental[31, 33, 34, 35, 37, 38] and 2 were experimental.[32, 36] Settings included progressive care units (n = 3),[33, 34, 35] CCUs (n = 3),[32, 33, 37] wards (n = 2),[31, 38] PACU (n = 1),[36] and a step‐down unit (n = 1).[32] All except 1 study[32] used the monitoring system to record alarm data. Several studies evaluated multicomponent interventions that included combinations of the following: widening alarm parameters,[31, 35, 36, 37, 38] instituting alarm delays,[31, 34, 36, 38] reconfiguring alarm acuity,[35, 37] use of secondary notifications,[34] daily change of electrocardiographic electrodes or use of disposable electrocardiographic wires,[32, 33, 38] universal monitoring in high‐risk populations,[31] and timely discontinuation of monitoring in low‐risk populations.[38] Four intervention studies met our prespecified lower risk of bias criteria.[31, 32, 36, 38]
Proportion of Alarms Considered Actionable
Results of the observational studies are provided in Table 2. The proportion of alarms that were actionable was <1% to 26% in adult ICU settings,[9, 10, 11, 13, 14, 16, 17, 19] 20% to 36% in adult ward settings,[12, 15, 20] 17% in a mixed adult and pediatric PACU setting,[30] 3% to 13% in pediatric ICU settings,[22, 23, 24, 25, 26] and 1% in a pediatric ward setting.[22]
| Signals Included | ||||||||||
|---|---|---|---|---|---|---|---|---|---|---|
| First Author and Publication Year | Setting | Monitored Patient‐Hours | SpO2 | ECG Arrhythmia | ECG Parametersa | Blood Pressure | Total Alarms | Actionable Alarms | Alarm Response | Lower Risk of Bias |
| ||||||||||
| Adult | ||||||||||
| Atzema 2006[7] | ED | 371 | ✓ | 1,762 | 0.20% | |||||
| Billinghurst 2003[8] | CCU | 420 | ✓ | 751 | Not reported; 17% were valid | Nurses with higher acuity patients and smaller % of valid alarms had slower response rates | ||||
| Biot 2000[9] | ICU | 250 | ✓ | ✓ | ✓ | ✓ | 3,665 | 3% | ||
| Chambrin 1999[10] | ICU | 1,971 | ✓ | ✓ | ✓ | ✓ | 3,188 | 26% | ||
| Drew 2014[11] | ICU | 48,173 | ✓ | ✓ | ✓ | ✓ | 2,558,760 | 0.3% of 3,861 VT alarms | ✓ | |
| Gazarian 2014[12] | Ward | 54 nurse‐hours | ✓ | ✓ | ✓ | 205 | 22% | Response to 47% of alarms | ||
| Grges 2009[13] | ICU | 200 | ✓ | ✓ | ✓ | ✓ | 1,214 | 5% | ||
| Gross 2011[15] | Ward | 530 | ✓ | ✓ | ✓ | ✓ | 4,393 | 20% | ✓ | |
| Inokuchi 2013[14] | ICU | 2,697 | ✓ | ✓ | ✓ | ✓ | 11,591 | 6% | ✓ | |
| Koski 1990[16] | ICU | 400 | ✓ | ✓ | 2,322 | 12% | ||||
| Morales Snchez 2014[17] | ICU | 434 sessions | ✓ | ✓ | ✓ | 215 | 25% | Response to 93% of alarms, of which 50% were within 10 seconds | ||
| Pergher 2014[18] | ICU | 60 | ✓ | 76 | Not reported | 72% of alarms stopped before nurse response or had >10 minutes response time | ||||
| Siebig 2010[19] | ICU | 982 | ✓ | ✓ | ✓ | ✓ | 5,934 | 15% | ||
| Voepel‐Lewis 2013[20] | Ward | 1,616 | ✓ | 710 | 36% | Response time was longer for patients in highest quartile of total alarms | ||||
| Way 2014[21] | ED | 93 | ✓ | ✓ | ✓ | ✓ | 572 | Not reported; 75% were valid | Nurses responded to more alarms in resuscitation room vs acute care area, but response time was longer | |
| Pediatric | ||||||||||
| Bonafide 2015[22] | Ward + ICU | 210 | ✓ | ✓ | ✓ | ✓ | 5,070 | 13% PICU, 1% ward | Incremental increases in response time as number of nonactionable alarms in preceding 120 minutes increased | ✓ |
| Lawless 1994[23] | ICU | 928 | ✓ | ✓ | ✓ | 2,176 | 6% | |||
| Rosman 2013[24] | ICU | 8,232 | ✓ | ✓ | ✓ | ✓ | 54,656 | 4% of rhythm alarms true critical" | ||
| Talley 2011[25] | ICU | 1,470∥ | ✓ | ✓ | ✓ | ✓ | 2,245 | 3% | ||
| Tsien 1997[26] | ICU | 298 | ✓ | ✓ | ✓ | 2,942 | 8% | |||
| van Pul 2015[27] | ICU | 113,880∥ | ✓ | ✓ | ✓ | ✓ | 222,751 | Not reported | Assigned nurse did not respond to 6% of alarms within 45 seconds | |
| Varpio 2012[28] | Ward | 49 unit‐hours | ✓ | ✓ | ✓ | ✓ | 446 | Not reported | 70% of all alarms and 41% of crisis alarms were not responded to within 1 minute | |
| Both | ||||||||||
| O'Carroll 1986[29] | ICU | 2,258∥ | ✓ | 284 | 2% | |||||
| Wiklund 1994[30] | PACU | 207 | ✓ | ✓ | ✓ | 1,891 | 17% | |||
Relationship Between Alarm Exposure and Response Time
Whereas 9 studies addressed response time,[8, 12, 17, 18, 20, 21, 22, 27, 28] only 2 evaluated the relationship between alarm burden and nurse response time.[20, 22] Voepel‐Lewis and colleagues found that nurse responses were slower to patients with the highest quartile of alarms (57.6 seconds) compared to those with the lowest (45.4 seconds) or medium (42.3 seconds) quartiles of alarms on an adult ward (P = 0.046). They did not find an association between false alarm exposure and response time.[20] Bonafide and colleagues found incremental increases in response time as the number of nonactionable alarms in the preceding 120 minutes increased (P < 0.001 in the pediatric ICU, P = 0.009 on the pediatric ward).[22]
Interventions Effective in Reducing Alarms
Results of the 8 intervention studies are provided in Table 3. Three studies evaluated single interventions;[32, 33, 36] the remainder of the studies tested interventions with multiple components such that it was impossible to separate the effect of each component. Below, we have summarized study results, arranged by component. Because only 1 study focused on pediatric patients,[38] results from pediatric and adult settings are combined.
| First Author and Publication Year | Design | Setting | Main Intervention Components | Other/ Comments | Key Results | Results Statistically Significant? | Lower Risk of Bias | ||||
|---|---|---|---|---|---|---|---|---|---|---|---|
| Widen Default Settings | Alarm Delays | Reconfigure Alarm Acuity | Secondary Notification | ECG Changes | |||||||
| |||||||||||
| Adult | |||||||||||
| Albert 2015[32] | Experimental (cluster‐randomized) | CCU | ✓ | Disposable vs reusable wires | Disposable leads had 29% fewer no‐telemetry, leads‐fail, and leads‐off alarms and similar artifact alarms | ✓ | ✓ | ||||
| Cvach 2013[33] | Quasi‐experimental (before and after) | CCU and PCU | ✓ | Daily change of electrodes | 46% fewer alarms/bed/day | ||||||
| Cvach 2014[34] | Quasi‐experimental (ITS) | PCU | ✓* | ✓ | Slope of regression line suggests decrease of 0.75 alarms/bed/day | ||||||
| Graham 2010[35] | Quasi‐experimental (before and after) | PCU | ✓ | ✓ | 43% fewer crisis, warning, and system warning alarms on unit | ||||||
| Rheineck‐Leyssius 1997[36] | Experimental (RCT) | PACU | ✓ | ✓ | Alarm limit of 85% had fewer alarms/patient but higher incidence of true hypoxemia for >1 minute (6% vs 2%) | ✓ | ✓ | ||||
| Taenzer 2010[31] | Quasi‐experimental (before and after with concurrent controls) | Ward | ✓ | ✓ | Universal SpO2 monitoring | Rescue events decreased from 3.4 to 1.2 per 1,000 discharges; transfers to ICU decreased from 5.6 to 2.9 per 1,000 patient‐days, only 4 alarms/patient‐day | ✓ | ✓ | |||
| Whalen 2014[37] | Quasi‐experimental (before and after) | CCU | ✓ | ✓ | 89% fewer audible alarms on unit | ✓ | |||||
| Pediatric | |||||||||||
| Dandoy 2014[38] | Quasi‐experimental (ITS) | Ward | ✓ | ✓ | ✓ | Timely monitor discontinuation; daily change of ECG electrodes | Decrease in alarms/patient‐days from 180 to 40 | ✓ | |||
Widening alarm parameter default settings was evaluated in 5 studies:[31, 35, 36, 37, 38] 1 single intervention randomized controlled trial (RCT),[36] and 4 multiple‐intervention, quasi‐experimental studies.[31, 35, 37, 38] In the RCT, using a lower SpO2 limit of 85% instead of the standard 90% resulted in 61% fewer alarms. In the 4 multiple intervention studies, 1 study reported significant reductions in alarm rates (P < 0.001),[37] 1 study did not report preintervention alarm rates but reported a postintervention alarm rate of 4 alarms per patient‐day,[31] and 2 studies reported reductions in alarm rates but did not report any statistical testing.[35, 38] Of the 3 studies examining patient safety, 1 study with universal monitoring reported fewer rescue events and transfers to the ICU postimplementation,[31] 1 study reported no missed acute decompensations,[38] and 1 study (the RCT) reported significantly more true hypoxemia events (P = 0.001).[36]
Alarm delays were evaluated in 4 studies:[31, 34, 36, 38] 3 multiple‐intervention, quasi‐experimental studies[31, 34, 38] and 1 retrospective analysis of data from an RCT.[36] One study combined alarm delays with widening defaults in a universal monitoring strategy and reported a postintervention alarm rate of 4 alarms per patient.[31] Another study evaluated delays as part of a secondary notification pager system and found a negatively sloping regression line that suggested a decreasing alarm rate, but did not report statistical testing.[34] The third study reported a reduction in alarm rates but did not report statistical testing.[38] The RCT compared the impact of a hypothetical 15‐second alarm delay to that of a lower SpO2 limit reduction and reported a similar reduction in alarms.[36] Of the 4 studies examining patient safety, 1 study with universal monitoring reported improvements,[31] 2 studies reported no adverse outcomes,[35, 38] and the retrospective analysis of data from the RCT reported the theoretical adverse outcome of delayed detection of sudden, severe desaturations.[36]
Reconfiguring alarm acuity was evaluated in 2 studies, both of which were multiple‐intervention quasi‐experimental studies.[35, 37] Both showed reductions in alarm rates: 1 was significant without increasing adverse events (P < 0.001),[37] and the other did not report statistical testing or safety outcomes.[35]
Secondary notification of nurses using pagers was the main intervention component of 1 study incorporating delays between the alarms and the alarm pages.[34] As mentioned above, a negatively sloping regression line was displayed, but no statistical testing or safety outcomes were reported.
Disposable electrocardiographic lead wires or daily electrode changes were evaluated in 3 studies:[32, 33, 38] 1 single intervention cluster‐randomized trial[32] and 2 quasi‐experimental studies.[33, 38] In the cluster‐randomized trial, disposable lead wires were compared to reusable lead wires, with disposable lead wires having significantly fewer technical alarms for lead signal failures (P = 0.03) but a similar number of monitoring artifact alarms (P = 0.44).[32] In a single‐intervention, quasi‐experimental study, daily electrode change showed a reduction in alarms, but no statistical testing was reported.[33] One multiple‐intervention, quasi‐experimental study incorporating daily electrode change showed fewer alarms without statistical testing.[38] Of the 2 studies examining patient safety, both reported no adverse outcomes.[32, 38]
DISCUSSION
This systematic review of physiologic monitor alarms in the hospital yielded the following main findings: (1) between 74% and 99% of physiologic monitor alarms were not actionable, (2) a significant relationship between alarm exposure and nurse response time was demonstrated in 2 small observational studies, and (3) although interventions were most often studied in combination, results from the studies with lower risk of bias suggest that widening alarm parameters, implementing alarm delays, and using disposable electrocardiographic lead wires and/or changing electrodes daily are the most promising interventions for reducing alarms. Only 5 of 8 intervention studies measured intervention safety and found that widening alarm parameters and implementing alarm delays had mixed safety outcomes, whereas disposable electrocardiographic lead wires and daily electrode changes had no adverse safety outcomes.[29, 30, 34, 35, 36] Safety measures are crucial to ensuring the highest level of patient safety is met; interventions are rendered useless without ensuring actionable alarms are not disabled. The variation in results across studies likely reflects the wide range of care settings as well as differences in design and quality.
This field is still in its infancy, with 18 of the 32 articles published in the past 5 years. We anticipate improvements in quality and rigor as the field matures, as well as clinically tested interventions that incorporate smart alarms. Smart alarms integrate data from multiple physiologic signals and the patient's history to better detect physiologic changes in the patient and improve the positive predictive value of alarms. Academicindustry partnerships will be required to implement and rigorously test smart alarms and other emerging technologies in the hospital.
To our knowledge, this is the first systematic review focused on monitor alarms with specific review questions relevant to alarm fatigue. Cvach recently published an integrative review of alarm fatigue using research published through 2011.[39] Our review builds upon her work by contributing a more extensive and systematic search strategy with databases spanning nursing, medicine, and engineering, including additional languages, and including newer studies published through April 2015. In addition, we included multiple cross‐team checks in our eligibility review to ensure high sensitivity and specificity of the resulting set of studies.
Although we focused on interventions aiming to reduce alarms, there has also been important recent work focused on reducing telemetry utilization in adult hospital populations as well as work focused on reducing pulse oximetry utilization in children admitted with respiratory conditions. Dressler and colleagues reported an immediate and sustained reduction in telemetry utilization in hospitalized adults upon redesign of cardiac telemetry order sets to include the clinical indication, which defaulted to the American Heart Association guideline‐recommended telemetry duration.[40] Instructions for bedside nurses were also included in the order set to facilitate appropriate telemetry discontinuation. Schondelmeyer and colleagues reported reductions in continuous pulse oximetry utilization in hospitalized children with asthma and bronchiolitis upon introduction of a multifaceted quality improvement program that included provider education, a nurse handoff checklist, and discontinuation criteria incorporated into order sets.[41]
Limitations of This Review and the Underlying Body of Work
There are limitations to this systematic review and its underlying body of work. With respect to our approach to this systematic review, we focused only on monitor alarms. Numerous other medical devices generate alarms in the patient‐care environment that also can contribute to alarm fatigue and deserve equally rigorous evaluation. With respect to the underlying body of work, the quality of individual studies was generally low. For example, determinations of alarm actionability were often made by a single rater without evaluation of the reliability or validity of these determinations, and statistical testing was often missing. There were also limitations specific to intervention studies, including evaluation of nongeneralizable patient populations, failure to measure the fidelity of the interventions, inadequate measures of intervention safety, and failure to statistically evaluate alarm reductions. Finally, though not necessarily a limitation, several studies were conducted by authors involved in or funded by the medical device industry.[11, 15, 19, 31, 32] This has the potential to introduce bias, although we have no indication that the quality of the science was adversely impacted.
Moving forward, the research agenda for physiologic monitor alarms should include the following: (1) more intensive focus on evaluating the relationship between alarm exposure and response time with analysis of important mediating factors that may promote or prevent alarm fatigue, (2) emphasis on studying interventions aimed at improving alarm management using rigorous designs such as cluster‐randomized trials and trials randomized by individual participant, (3) monitoring and reporting clinically meaningful balancing measures that represent unintended consequences of disabling or delaying potentially important alarms and possibly reducing the clinicians' ability to detect true patient deterioration and intervene in a timely manner, and (4) support for transparent academicindustry partnerships to evaluate new alarm technology in real‐world settings. As evidence‐based interventions emerge, there will be new opportunities to study different implementation strategies of these interventions to optimize effectiveness.
CONCLUSIONS
The body of literature relevant to physiologic monitor alarm characteristics and alarm fatigue is limited but growing rapidly. Although we know that most alarms are not actionable and that there appears to be a relationship between alarm exposure and response time that could be caused by alarm fatigue, we cannot yet say with certainty that we know which interventions are most effective in safely reducing unnecessary alarms. Interventions that appear most promising and should be prioritized for intensive evaluation include widening alarm parameters, implementing alarm delays, and using disposable electrocardiographic lead wires and changing electrodes daily. Careful evaluation of these interventions must include systematically examining adverse patient safety consequences.
Acknowledgements
The authors thank Amogh Karnik and Micheal Sellars for their technical assistance during the review and extraction process.
Disclosures: Ms. Zander is supported by the Society of Hospital Medicine Student Hospitalist Scholar Grant. Dr. Bonafide and Ms. Stemler are supported by the National Heart, Lung, and Blood Institute of the National Institutes of Health under award number K23HL116427. The content is solely the responsibility of the authors and does not necessarily represent the official views of the National Institutes of Health. The authors report no conflicts of interest.
- National Patient Safety Goals Effective January 1, 2015. The Joint Commission Web site. http://www.jointcommission.org/assets/1/6/2015_NPSG_HAP.pdf. Accessed July 17, 2015.
- ECRI Institute. 2015 Top 10 Health Technology Hazards. Available at: https://www.ecri.org/Pages/2015‐Hazards.aspx. Accessed June 23, 2015.
- , . Alarm fatigue: a patient safety concern. AACN Adv Crit Care. 2013;24(4):378–386.
- , . Redesigning hospital alarms for patient safety: alarmed and potentially dangerous. JAMA. 2014;311(12):1199–1200.
- , , , et al. Meta‐analysis of observational studies in epidemiology: a proposal for reporting. Meta‐analysis Of Observational Studies in Epidemiology (MOOSE) Group. JAMA. 2000;283(15):2008–2012.
- , , , ; PRISMA Group. Preferred reporting items for systematic reviews and meta‐analyses: the PRISMA statement. Ann Intern Med. 2009;151(4):264–269, W64.
- , , , , . ALARMED: adverse events in low‐risk patients with chest pain receiving continuous electrocardiographic monitoring in the emergency department. A pilot study. Am J Emerg Med. 2006;24:62–67.
- , , . Patient and nurse‐related implications of remote cardiac telemetry. Clin Nurs Res. 2003;12(4):356–370.
- , , , , . Clinical evaluation of alarm efficiency in intensive care [in French]. Ann Fr Anesth Reanim. 2000;19:459–466.
- , , , , , . Multicentric study of monitoring alarms in the adult intensive care unit (ICU): a descriptive analysis. Intensive Care Med. 1999;25:1360–1366.
- , , , et al. Insights into the problem of alarm fatigue with physiologic monitor devices: a comprehensive observational study of consecutive intensive care unit patients. PloS One. 2014;9(10):e110274.
- . Nurses' response to frequency and types of electrocardiography alarms in a non‐ critical care setting: a descriptive study. Int J Nurs Stud. 2014;51(2):190–197.
- , , . Improving alarm performance in the medical intensive care unit using delays and clinical context. Anesth Analg. 2009;108:1546–1552.
- , , , et al. The proportion of clinically relevant alarms decreases as patient clinical severity decreases in intensive care units: a pilot study. BMJ Open. 2013;3(9):e003354–e003354.
- , , . Physiologic monitoring alarm load on medical/surgical floors of a community hospital. Biomed Instrum Technol. 2011;45:29–36.
- , , , . Frequency and reliability of alarms in the monitoring of cardiac postoperative patients. Int J Clin Monit Comput. 1990;7(2):129–133.
- , , , et al. Audit of the bedside monitor alarms in a critical care unit [in Spanish]. Enferm Intensiva. 2014;25(3):83–90.
- , . Stimulus‐response time to invasive blood pressure alarms: implications for the safety of critical‐care patients. Rev Gaúcha Enferm. 2014;35(2):135–141.
- , , , , , . Intensive care unit alarms— how many do we need? Crit Care Med. 2010;38:451–456.
- , , , et al. Pulse oximetry desaturation alarms on a general postoperative adult unit: a prospective observational study of nurse response time. Int J Nurs Stud. 2013;50(10):1351–1358.
- , , . Whats that noise? Bedside monitoring in the Emergency Department. Int Emerg Nurs. 2014;22(4):197–201.
- , , , et al. Association between exposure to nonactionable physiologic monitor alarms and response time in a children's hospital. J Hosp Med. 2015;10(6):345–351.
- . Crying wolf: false alarms in a pediatric intensive care unit. Crit Care Med. 1994;22(6):981–985.
- , , , , . What are we missing? Arrhythmia detection in the pediatric intensive care unit. J Pediatr. 2013;163(2):511–514.
- , , , et al. Cardiopulmonary monitors and clinically significant events in critically ill children. Biomed Instrum Technol. 2011;45(s1):38–45.
- , . Poor prognosis for existing monitors in the intensive care unit. Crit Care Med. 1997;25:614–619.
- , , , , . Safe patient monitoring is challenging but still feasible in a neonatal intensive care unit with single family rooms. Acta Paediatr Oslo Nor 1992. 2015;104(6):e247–e254.
- , , , . The helpful or hindering effects of in‐hospital patient monitor alarms on nurses: a qualitative analysis. CIN Comput Inform Nurs. 2012;30(4):210–217.
- . Survey of alarms in an intensive therapy unit. Anaesthesia. 1986;41(7):742–744.
- , , , . Postanesthesia monitoring revisited: frequency of true and false alarms from different monitoring devices. J Clin Anesth. 1994;6(3):182–188.
- , , , . Impact of pulse oximetry surveillance on rescue events and intensive care unit transfers: a before‐and‐after concurrence study. Anesthesiology. 2010;112(2):282–287.
- , , , et al. Differences in alarm events between disposable and reusable electrocardiography lead wires. Am J Crit Care. 2015;24(1):67–74.
- , , , . Daily electrode change and effect on cardiac monitor alarms: an evidence‐based practice approach. J Nurs Care Qual. 2013;28:265–271.
- , , , . Use of pagers with an alarm escalation system to reduce cardiac monitor alarm signals. J Nurs Care Qual. 2014;29(1):9–18.
- , . Monitor alarm fatigue: standardizing use of physiological monitors and decreasing nuisance alarms. Am J Crit Care. 2010;19:28–34.
- , . Influence of pulse oximeter lower alarm limit on the incidence of hypoxaemia in the recovery room. Br J Anaesth. 1997;79(4):460–464.
- , , , , , . Novel approach to cardiac alarm management on telemetry units. J Cardiovasc Nurs. 2014;29(5):E13–E22.
- , , , et al. A team‐based approach to reducing cardiac monitor alarms. Pediatrics. 2014;134(6):e1686–e1694.
- . Monitor alarm fatigue: an integrative review. Biomed Instrum Technol. 2012;46(4):268–277.
- , , , , . Altering overuse of cardiac telemetry in non‐intensive care unit settings by hardwiring the use of American Heart Association guidelines. JAMA Intern Med. 2014;174(11):1852–1854.
- , , , et al. Using quality improvement to reduce continuous pulse oximetry use in children with wheezing. Pediatrics. 2015;135(4):e1044–e1051.
- , . The feasibility of creating a checklist for the assessment of the methodological quality both of randomised and non‐randomised studies of health care interventions. J Epidemiol Community Health. 1998;52(6):377–384.
Clinical alarm safety has become a recent target for improvement in many hospitals. In 2013, The Joint Commission released a National Patient Safety Goal prompting accredited hospitals to establish alarm safety as a hospital priority, identify the most important alarm signals to manage, and, by 2016, develop policies and procedures that address alarm management.[1] In addition, the Emergency Care Research Institute has named alarm hazards the top health technology hazard each year since 2012.[2]
The primary arguments supporting the elevation of alarm management to a national hospital priority in the United States include the following: (1) clinicians rely on alarms to notify them of important physiologic changes, (2) alarms occur frequently and usually do not warrant clinical intervention, and (3) alarm overload renders clinicians unable to respond to all alarms, resulting in alarm fatigue: responding more slowly or ignoring alarms that may represent actual clinical deterioration.[3, 4] These arguments are built largely on anecdotal data, reported safety event databases, and small studies that have not previously been systematically analyzed.
Despite the national focus on alarms, we still know very little about fundamental questions key to improving alarm safety. In this systematic review, we aimed to answer 3 key questions about physiologic monitor alarms: (1) What proportion of alarms warrant attention or clinical intervention (ie, actionable alarms), and how does this proportion vary between adult and pediatric populations and between intensive care unit (ICU) and ward settings? (2) What is the relationship between alarm exposure and clinician response time? (3) What interventions are effective in reducing the frequency of alarms?
We limited our scope to monitor alarms because few studies have evaluated the characteristics of alarms from other medical devices, and because missing relevant monitor alarms could adversely impact patient safety.
METHODS
We performed a systematic review of the literature in accordance with the Meta‐Analysis of Observational Studies in Epidemiology guidelines[5] and developed this manuscript using the Preferred Reporting Items for Systematic Reviews and Meta‐Analyses (PRISMA) statement.[6]
Eligibility Criteria
With help from an experienced biomedical librarian (C.D.S.), we searched PubMed, the Cumulative Index to Nursing and Allied Health Literature, Scopus, Cochrane Library,
We included peer‐reviewed, original research studies published in English, Spanish, or French that addressed the questions outlined above. Eligible patient populations were children and adults admitted to hospital inpatient units and emergency departments (EDs). We excluded alarms in procedural suites or operating rooms (typically responded to by anesthesiologists already with the patient) because of the differences in environment of care, staff‐to‐patient ratio, and equipment. We included observational studies reporting the actionability of physiologic monitor alarms (ie, alarms warranting special attention or clinical intervention), as well as nurse responses to these alarms. We excluded studies focused on the effects of alarms unrelated to patient safety, such as families' and patients' stress, noise, or sleep disturbance. We included only intervention studies evaluating pragmatic interventions ready for clinical implementation (ie, not experimental devices or software algorithms).
Selection Process and Data Extraction
First, 2 authors screened the titles and abstracts of articles for eligibility. To maximize sensitivity, if at least 1 author considered the article relevant, the article proceeded to full‐text review. Second, the full texts of articles screened were independently reviewed by 2 authors in an unblinded fashion to determine their eligibility. Any disagreements concerning eligibility were resolved by team consensus. To assure consistency in eligibility determinations across the team, a core group of the authors (C.W.P, C.P.B., E.E., and V.V.G.) held a series of meetings to review and discuss each potentially eligible article and reach consensus on the final list of included articles. Two authors independently extracted the following characteristics from included studies: alarm review methods, analytic design, fidelity measurement, consideration of unintended adverse safety consequences, and key results. Reviewers were not blinded to journal, authors, or affiliations.
Synthesis of Results and Risk Assessment
Given the high degree of heterogeneity in methodology, we were unable to generate summary proportions of the observational studies or perform a meta‐analysis of the intervention studies. Thus, we organized the studies into clinically relevant categories and presented key aspects in tables. Due to the heterogeneity of the studies and the controversy surrounding quality scores,[5] we did not generate summary scores of study quality. Instead, we evaluated and reported key design elements that had the potential to bias the results. To recognize the more comprehensive studies in the field, we developed by consensus a set of characteristics that distinguished studies with lower risk of bias. These characteristics are shown and defined in Table 1.
| First Author and Publication Year | Alarm Review Method | Indicators of Potential Bias for Observational Studies | Indicators of Potential Bias for Intervention Studies | |||||||||||||
|---|---|---|---|---|---|---|---|---|---|---|---|---|---|---|---|---|
| Monitor System | Direct Observation | Medical Record Review | Rhythm Annotation | Video Observation | Remote Monitoring Staff | Medical Device Industry Involved | Two Independent Reviewers | At Least 1 Reviewer Is a Clinical Expert | Reviewer Not Simultaneously in Patient Care | Clear Definition of Alarm Actionability | Census Included | Statistical Testing or QI SPC Methods | Fidelity Assessed | Safety Assessed | Lower Risk of Bias | |
| ||||||||||||||||
| Adult Observational | ||||||||||||||||
| Atzema 2006[7] | ✓* | ✓ | ✓ | |||||||||||||
| Billinghurst 2003[8] | ✓ | ✓ | ✓ | ✓ | ||||||||||||
| Biot 2000[9] | ✓ | ✓ | ✓ | ✓ | ||||||||||||
| Chambrin 1999[10] | ✓ | ✓ | ✓ | ✓ | ||||||||||||
| Drew 2014[11] | ✓ | ✓ | ✓ | ✓ | ✓ | ✓ | ✓ | ✓ | ||||||||
| Gazarian 2014[12] | ✓ | ✓ | ✓ | ✓ | ✓ | |||||||||||
| Grges 2009[13] | ✓ | ✓ | ✓ | ✓ | ||||||||||||
| Gross 2011[15] | ✓ | ✓ | ✓ | ✓ | ✓ | ✓ | ✓ | |||||||||
| Inokuchi 2013[14] | ✓ | ✓ | ✓ | ✓ | ✓ | ✓ | ✓ | |||||||||
| Koski 1990[16] | ✓ | ✓ | ✓ | ✓ | ||||||||||||
| Morales Snchez 2014[17] | ✓ | ✓ | ✓ | ✓ | ||||||||||||
| Pergher 2014[18] | ✓ | ✓ | ||||||||||||||
| Siebig 2010[19] | ✓ | ✓ | ✓ | ✓ | ✓ | ✓ | ||||||||||
| Voepel‐Lewis 2013[20] | ✓ | ✓ | ✓ | ✓ | ||||||||||||
| Way 2014[21] | ✓ | ✓ | ✓ | |||||||||||||
| Pediatric Observational | ||||||||||||||||
| Bonafide 2015[22] | ✓ | ✓ | ✓ | ✓ | ✓ | ✓ | ✓ | |||||||||
| Lawless 1994[23] | ✓ | ✓ | ||||||||||||||
| Rosman 2013[24] | ✓ | ✓ | ✓ | ✓ | ✓ | |||||||||||
| Talley 2011[25] | ✓ | ✓ | ✓ | ✓ | ✓ | |||||||||||
| Tsien 1997[26] | ✓ | ✓ | ✓ | ✓ | ||||||||||||
| van Pul 2015[27] | ✓ | |||||||||||||||
| Varpio 2012[28] | ✓ | ✓ | ✓ | ✓ | ||||||||||||
| Mixed Adult and Pediatric Observational | ||||||||||||||||
| O'Carroll 1986[29] | ✓ | |||||||||||||||
| Wiklund 1994[30] | ✓ | ✓ | ✓ | ✓ | ||||||||||||
| Adult Intervention | ||||||||||||||||
| Albert 2015[32] | ✓ | ✓ | ✓ | ✓ | ✓ | ✓ | ✓ | |||||||||
| Cvach 2013[33] | ✓ | ✓ | ||||||||||||||
| Cvach 2014[34] | ✓ | ✓ | ||||||||||||||
| Graham 2010[35] | ✓ | |||||||||||||||
| Rheineck‐Leyssius 1997[36] | ✓ | ✓ | ✓ | ✓ | ✓ | ✓ | ||||||||||
| Taenzer 2010[31] | ✓ | ✓ | ✓ | ✓ | ✓ | ✓ | ||||||||||
| Whalen 2014[37] | ✓ | ✓ | ✓ | |||||||||||||
| Pediatric Intervention | ||||||||||||||||
| Dandoy 2014[38] | ✓ | ✓ | ✓ | ✓ | ✓ | ✓ | ||||||||||
For the purposes of this review, we defined nonactionable alarms as including both invalid (false) alarms that do not that accurately represent the physiologic status of the patient and alarms that are valid but do not warrant special attention or clinical intervention (nuisance alarms). We did not separate out invalid alarms due to the tremendous variation between studies in how validity was measured.
RESULTS
Study Selection
Search results produced 4629 articles (see the flow diagram in the Supporting Information in the online version of this article), of which 32 articles were eligible: 24 observational studies describing alarm characteristics and 8 studies describing interventions to reduce alarm frequency.
Observational Study Characteristics
Characteristics of included studies are shown in Table 1. Of the 24 observational studies,[7, 8, 9, 10, 11, 12, 13, 14, 15, 16, 17, 18, 19, 20, 21, 22, 23, 24, 25, 26, 27, 28, 29, 30] 15 included adult patients,[7, 8, 9, 10, 11, 12, 13, 14, 15, 16, 17, 18, 19, 20, 21] 7 included pediatric patients,[22, 23, 24, 25, 26, 27, 28] and 2 included both adult and pediatric patients.[29, 30] All were single‐hospital studies, except for 1 study by Chambrin and colleagues[10] that included 5 sites. The number of patient‐hours examined in each study ranged from 60 to 113,880.[7, 8, 9, 10, 11, 13, 14, 15, 16, 18, 19, 20, 21, 22, 23, 24, 25, 26, 27, 29, 30] Hospital settings included ICUs (n = 16),[9, 10, 11, 13, 14, 16, 17, 18, 19, 22, 23, 24, 25, 26, 27, 29] general wards (n = 5),[12, 15, 20, 22, 28] EDs (n = 2),[7, 21] postanesthesia care unit (PACU) (n = 1),[30] and cardiac care unit (CCU) (n = 1).[8] Studies varied in the type of physiologic signals recorded and data collection methods, ranging from direct observation by a nurse who was simultaneously caring for patients[29] to video recording with expert review.[14, 19, 22] Four observational studies met the criteria for lower risk of bias.[11, 14, 15, 22]
Intervention Study Characteristics
Of the 8 intervention studies, 7 included adult patients,[31, 32, 33, 34, 35, 36, 37] and 1 included pediatric patients.[38] All were single‐hospital studies; 6 were quasi‐experimental[31, 33, 34, 35, 37, 38] and 2 were experimental.[32, 36] Settings included progressive care units (n = 3),[33, 34, 35] CCUs (n = 3),[32, 33, 37] wards (n = 2),[31, 38] PACU (n = 1),[36] and a step‐down unit (n = 1).[32] All except 1 study[32] used the monitoring system to record alarm data. Several studies evaluated multicomponent interventions that included combinations of the following: widening alarm parameters,[31, 35, 36, 37, 38] instituting alarm delays,[31, 34, 36, 38] reconfiguring alarm acuity,[35, 37] use of secondary notifications,[34] daily change of electrocardiographic electrodes or use of disposable electrocardiographic wires,[32, 33, 38] universal monitoring in high‐risk populations,[31] and timely discontinuation of monitoring in low‐risk populations.[38] Four intervention studies met our prespecified lower risk of bias criteria.[31, 32, 36, 38]
Proportion of Alarms Considered Actionable
Results of the observational studies are provided in Table 2. The proportion of alarms that were actionable was <1% to 26% in adult ICU settings,[9, 10, 11, 13, 14, 16, 17, 19] 20% to 36% in adult ward settings,[12, 15, 20] 17% in a mixed adult and pediatric PACU setting,[30] 3% to 13% in pediatric ICU settings,[22, 23, 24, 25, 26] and 1% in a pediatric ward setting.[22]
| Signals Included | ||||||||||
|---|---|---|---|---|---|---|---|---|---|---|
| First Author and Publication Year | Setting | Monitored Patient‐Hours | SpO2 | ECG Arrhythmia | ECG Parametersa | Blood Pressure | Total Alarms | Actionable Alarms | Alarm Response | Lower Risk of Bias |
| ||||||||||
| Adult | ||||||||||
| Atzema 2006[7] | ED | 371 | ✓ | 1,762 | 0.20% | |||||
| Billinghurst 2003[8] | CCU | 420 | ✓ | 751 | Not reported; 17% were valid | Nurses with higher acuity patients and smaller % of valid alarms had slower response rates | ||||
| Biot 2000[9] | ICU | 250 | ✓ | ✓ | ✓ | ✓ | 3,665 | 3% | ||
| Chambrin 1999[10] | ICU | 1,971 | ✓ | ✓ | ✓ | ✓ | 3,188 | 26% | ||
| Drew 2014[11] | ICU | 48,173 | ✓ | ✓ | ✓ | ✓ | 2,558,760 | 0.3% of 3,861 VT alarms | ✓ | |
| Gazarian 2014[12] | Ward | 54 nurse‐hours | ✓ | ✓ | ✓ | 205 | 22% | Response to 47% of alarms | ||
| Grges 2009[13] | ICU | 200 | ✓ | ✓ | ✓ | ✓ | 1,214 | 5% | ||
| Gross 2011[15] | Ward | 530 | ✓ | ✓ | ✓ | ✓ | 4,393 | 20% | ✓ | |
| Inokuchi 2013[14] | ICU | 2,697 | ✓ | ✓ | ✓ | ✓ | 11,591 | 6% | ✓ | |
| Koski 1990[16] | ICU | 400 | ✓ | ✓ | 2,322 | 12% | ||||
| Morales Snchez 2014[17] | ICU | 434 sessions | ✓ | ✓ | ✓ | 215 | 25% | Response to 93% of alarms, of which 50% were within 10 seconds | ||
| Pergher 2014[18] | ICU | 60 | ✓ | 76 | Not reported | 72% of alarms stopped before nurse response or had >10 minutes response time | ||||
| Siebig 2010[19] | ICU | 982 | ✓ | ✓ | ✓ | ✓ | 5,934 | 15% | ||
| Voepel‐Lewis 2013[20] | Ward | 1,616 | ✓ | 710 | 36% | Response time was longer for patients in highest quartile of total alarms | ||||
| Way 2014[21] | ED | 93 | ✓ | ✓ | ✓ | ✓ | 572 | Not reported; 75% were valid | Nurses responded to more alarms in resuscitation room vs acute care area, but response time was longer | |
| Pediatric | ||||||||||
| Bonafide 2015[22] | Ward + ICU | 210 | ✓ | ✓ | ✓ | ✓ | 5,070 | 13% PICU, 1% ward | Incremental increases in response time as number of nonactionable alarms in preceding 120 minutes increased | ✓ |
| Lawless 1994[23] | ICU | 928 | ✓ | ✓ | ✓ | 2,176 | 6% | |||
| Rosman 2013[24] | ICU | 8,232 | ✓ | ✓ | ✓ | ✓ | 54,656 | 4% of rhythm alarms true critical" | ||
| Talley 2011[25] | ICU | 1,470∥ | ✓ | ✓ | ✓ | ✓ | 2,245 | 3% | ||
| Tsien 1997[26] | ICU | 298 | ✓ | ✓ | ✓ | 2,942 | 8% | |||
| van Pul 2015[27] | ICU | 113,880∥ | ✓ | ✓ | ✓ | ✓ | 222,751 | Not reported | Assigned nurse did not respond to 6% of alarms within 45 seconds | |
| Varpio 2012[28] | Ward | 49 unit‐hours | ✓ | ✓ | ✓ | ✓ | 446 | Not reported | 70% of all alarms and 41% of crisis alarms were not responded to within 1 minute | |
| Both | ||||||||||
| O'Carroll 1986[29] | ICU | 2,258∥ | ✓ | 284 | 2% | |||||
| Wiklund 1994[30] | PACU | 207 | ✓ | ✓ | ✓ | 1,891 | 17% | |||
Relationship Between Alarm Exposure and Response Time
Whereas 9 studies addressed response time,[8, 12, 17, 18, 20, 21, 22, 27, 28] only 2 evaluated the relationship between alarm burden and nurse response time.[20, 22] Voepel‐Lewis and colleagues found that nurse responses were slower to patients with the highest quartile of alarms (57.6 seconds) compared to those with the lowest (45.4 seconds) or medium (42.3 seconds) quartiles of alarms on an adult ward (P = 0.046). They did not find an association between false alarm exposure and response time.[20] Bonafide and colleagues found incremental increases in response time as the number of nonactionable alarms in the preceding 120 minutes increased (P < 0.001 in the pediatric ICU, P = 0.009 on the pediatric ward).[22]
Interventions Effective in Reducing Alarms
Results of the 8 intervention studies are provided in Table 3. Three studies evaluated single interventions;[32, 33, 36] the remainder of the studies tested interventions with multiple components such that it was impossible to separate the effect of each component. Below, we have summarized study results, arranged by component. Because only 1 study focused on pediatric patients,[38] results from pediatric and adult settings are combined.
| First Author and Publication Year | Design | Setting | Main Intervention Components | Other/ Comments | Key Results | Results Statistically Significant? | Lower Risk of Bias | ||||
|---|---|---|---|---|---|---|---|---|---|---|---|
| Widen Default Settings | Alarm Delays | Reconfigure Alarm Acuity | Secondary Notification | ECG Changes | |||||||
| |||||||||||
| Adult | |||||||||||
| Albert 2015[32] | Experimental (cluster‐randomized) | CCU | ✓ | Disposable vs reusable wires | Disposable leads had 29% fewer no‐telemetry, leads‐fail, and leads‐off alarms and similar artifact alarms | ✓ | ✓ | ||||
| Cvach 2013[33] | Quasi‐experimental (before and after) | CCU and PCU | ✓ | Daily change of electrodes | 46% fewer alarms/bed/day | ||||||
| Cvach 2014[34] | Quasi‐experimental (ITS) | PCU | ✓* | ✓ | Slope of regression line suggests decrease of 0.75 alarms/bed/day | ||||||
| Graham 2010[35] | Quasi‐experimental (before and after) | PCU | ✓ | ✓ | 43% fewer crisis, warning, and system warning alarms on unit | ||||||
| Rheineck‐Leyssius 1997[36] | Experimental (RCT) | PACU | ✓ | ✓ | Alarm limit of 85% had fewer alarms/patient but higher incidence of true hypoxemia for >1 minute (6% vs 2%) | ✓ | ✓ | ||||
| Taenzer 2010[31] | Quasi‐experimental (before and after with concurrent controls) | Ward | ✓ | ✓ | Universal SpO2 monitoring | Rescue events decreased from 3.4 to 1.2 per 1,000 discharges; transfers to ICU decreased from 5.6 to 2.9 per 1,000 patient‐days, only 4 alarms/patient‐day | ✓ | ✓ | |||
| Whalen 2014[37] | Quasi‐experimental (before and after) | CCU | ✓ | ✓ | 89% fewer audible alarms on unit | ✓ | |||||
| Pediatric | |||||||||||
| Dandoy 2014[38] | Quasi‐experimental (ITS) | Ward | ✓ | ✓ | ✓ | Timely monitor discontinuation; daily change of ECG electrodes | Decrease in alarms/patient‐days from 180 to 40 | ✓ | |||
Widening alarm parameter default settings was evaluated in 5 studies:[31, 35, 36, 37, 38] 1 single intervention randomized controlled trial (RCT),[36] and 4 multiple‐intervention, quasi‐experimental studies.[31, 35, 37, 38] In the RCT, using a lower SpO2 limit of 85% instead of the standard 90% resulted in 61% fewer alarms. In the 4 multiple intervention studies, 1 study reported significant reductions in alarm rates (P < 0.001),[37] 1 study did not report preintervention alarm rates but reported a postintervention alarm rate of 4 alarms per patient‐day,[31] and 2 studies reported reductions in alarm rates but did not report any statistical testing.[35, 38] Of the 3 studies examining patient safety, 1 study with universal monitoring reported fewer rescue events and transfers to the ICU postimplementation,[31] 1 study reported no missed acute decompensations,[38] and 1 study (the RCT) reported significantly more true hypoxemia events (P = 0.001).[36]
Alarm delays were evaluated in 4 studies:[31, 34, 36, 38] 3 multiple‐intervention, quasi‐experimental studies[31, 34, 38] and 1 retrospective analysis of data from an RCT.[36] One study combined alarm delays with widening defaults in a universal monitoring strategy and reported a postintervention alarm rate of 4 alarms per patient.[31] Another study evaluated delays as part of a secondary notification pager system and found a negatively sloping regression line that suggested a decreasing alarm rate, but did not report statistical testing.[34] The third study reported a reduction in alarm rates but did not report statistical testing.[38] The RCT compared the impact of a hypothetical 15‐second alarm delay to that of a lower SpO2 limit reduction and reported a similar reduction in alarms.[36] Of the 4 studies examining patient safety, 1 study with universal monitoring reported improvements,[31] 2 studies reported no adverse outcomes,[35, 38] and the retrospective analysis of data from the RCT reported the theoretical adverse outcome of delayed detection of sudden, severe desaturations.[36]
Reconfiguring alarm acuity was evaluated in 2 studies, both of which were multiple‐intervention quasi‐experimental studies.[35, 37] Both showed reductions in alarm rates: 1 was significant without increasing adverse events (P < 0.001),[37] and the other did not report statistical testing or safety outcomes.[35]
Secondary notification of nurses using pagers was the main intervention component of 1 study incorporating delays between the alarms and the alarm pages.[34] As mentioned above, a negatively sloping regression line was displayed, but no statistical testing or safety outcomes were reported.
Disposable electrocardiographic lead wires or daily electrode changes were evaluated in 3 studies:[32, 33, 38] 1 single intervention cluster‐randomized trial[32] and 2 quasi‐experimental studies.[33, 38] In the cluster‐randomized trial, disposable lead wires were compared to reusable lead wires, with disposable lead wires having significantly fewer technical alarms for lead signal failures (P = 0.03) but a similar number of monitoring artifact alarms (P = 0.44).[32] In a single‐intervention, quasi‐experimental study, daily electrode change showed a reduction in alarms, but no statistical testing was reported.[33] One multiple‐intervention, quasi‐experimental study incorporating daily electrode change showed fewer alarms without statistical testing.[38] Of the 2 studies examining patient safety, both reported no adverse outcomes.[32, 38]
DISCUSSION
This systematic review of physiologic monitor alarms in the hospital yielded the following main findings: (1) between 74% and 99% of physiologic monitor alarms were not actionable, (2) a significant relationship between alarm exposure and nurse response time was demonstrated in 2 small observational studies, and (3) although interventions were most often studied in combination, results from the studies with lower risk of bias suggest that widening alarm parameters, implementing alarm delays, and using disposable electrocardiographic lead wires and/or changing electrodes daily are the most promising interventions for reducing alarms. Only 5 of 8 intervention studies measured intervention safety and found that widening alarm parameters and implementing alarm delays had mixed safety outcomes, whereas disposable electrocardiographic lead wires and daily electrode changes had no adverse safety outcomes.[29, 30, 34, 35, 36] Safety measures are crucial to ensuring the highest level of patient safety is met; interventions are rendered useless without ensuring actionable alarms are not disabled. The variation in results across studies likely reflects the wide range of care settings as well as differences in design and quality.
This field is still in its infancy, with 18 of the 32 articles published in the past 5 years. We anticipate improvements in quality and rigor as the field matures, as well as clinically tested interventions that incorporate smart alarms. Smart alarms integrate data from multiple physiologic signals and the patient's history to better detect physiologic changes in the patient and improve the positive predictive value of alarms. Academicindustry partnerships will be required to implement and rigorously test smart alarms and other emerging technologies in the hospital.
To our knowledge, this is the first systematic review focused on monitor alarms with specific review questions relevant to alarm fatigue. Cvach recently published an integrative review of alarm fatigue using research published through 2011.[39] Our review builds upon her work by contributing a more extensive and systematic search strategy with databases spanning nursing, medicine, and engineering, including additional languages, and including newer studies published through April 2015. In addition, we included multiple cross‐team checks in our eligibility review to ensure high sensitivity and specificity of the resulting set of studies.
Although we focused on interventions aiming to reduce alarms, there has also been important recent work focused on reducing telemetry utilization in adult hospital populations as well as work focused on reducing pulse oximetry utilization in children admitted with respiratory conditions. Dressler and colleagues reported an immediate and sustained reduction in telemetry utilization in hospitalized adults upon redesign of cardiac telemetry order sets to include the clinical indication, which defaulted to the American Heart Association guideline‐recommended telemetry duration.[40] Instructions for bedside nurses were also included in the order set to facilitate appropriate telemetry discontinuation. Schondelmeyer and colleagues reported reductions in continuous pulse oximetry utilization in hospitalized children with asthma and bronchiolitis upon introduction of a multifaceted quality improvement program that included provider education, a nurse handoff checklist, and discontinuation criteria incorporated into order sets.[41]
Limitations of This Review and the Underlying Body of Work
There are limitations to this systematic review and its underlying body of work. With respect to our approach to this systematic review, we focused only on monitor alarms. Numerous other medical devices generate alarms in the patient‐care environment that also can contribute to alarm fatigue and deserve equally rigorous evaluation. With respect to the underlying body of work, the quality of individual studies was generally low. For example, determinations of alarm actionability were often made by a single rater without evaluation of the reliability or validity of these determinations, and statistical testing was often missing. There were also limitations specific to intervention studies, including evaluation of nongeneralizable patient populations, failure to measure the fidelity of the interventions, inadequate measures of intervention safety, and failure to statistically evaluate alarm reductions. Finally, though not necessarily a limitation, several studies were conducted by authors involved in or funded by the medical device industry.[11, 15, 19, 31, 32] This has the potential to introduce bias, although we have no indication that the quality of the science was adversely impacted.
Moving forward, the research agenda for physiologic monitor alarms should include the following: (1) more intensive focus on evaluating the relationship between alarm exposure and response time with analysis of important mediating factors that may promote or prevent alarm fatigue, (2) emphasis on studying interventions aimed at improving alarm management using rigorous designs such as cluster‐randomized trials and trials randomized by individual participant, (3) monitoring and reporting clinically meaningful balancing measures that represent unintended consequences of disabling or delaying potentially important alarms and possibly reducing the clinicians' ability to detect true patient deterioration and intervene in a timely manner, and (4) support for transparent academicindustry partnerships to evaluate new alarm technology in real‐world settings. As evidence‐based interventions emerge, there will be new opportunities to study different implementation strategies of these interventions to optimize effectiveness.
CONCLUSIONS
The body of literature relevant to physiologic monitor alarm characteristics and alarm fatigue is limited but growing rapidly. Although we know that most alarms are not actionable and that there appears to be a relationship between alarm exposure and response time that could be caused by alarm fatigue, we cannot yet say with certainty that we know which interventions are most effective in safely reducing unnecessary alarms. Interventions that appear most promising and should be prioritized for intensive evaluation include widening alarm parameters, implementing alarm delays, and using disposable electrocardiographic lead wires and changing electrodes daily. Careful evaluation of these interventions must include systematically examining adverse patient safety consequences.
Acknowledgements
The authors thank Amogh Karnik and Micheal Sellars for their technical assistance during the review and extraction process.
Disclosures: Ms. Zander is supported by the Society of Hospital Medicine Student Hospitalist Scholar Grant. Dr. Bonafide and Ms. Stemler are supported by the National Heart, Lung, and Blood Institute of the National Institutes of Health under award number K23HL116427. The content is solely the responsibility of the authors and does not necessarily represent the official views of the National Institutes of Health. The authors report no conflicts of interest.
- National Patient Safety Goals Effective January 1, 2015. The Joint Commission Web site. http://www.jointcommission.org/assets/1/6/2015_NPSG_HAP.pdf. Accessed July 17, 2015.
- ECRI Institute. 2015 Top 10 Health Technology Hazards. Available at: https://www.ecri.org/Pages/2015‐Hazards.aspx. Accessed June 23, 2015.
- , . Alarm fatigue: a patient safety concern. AACN Adv Crit Care. 2013;24(4):378–386.
- , . Redesigning hospital alarms for patient safety: alarmed and potentially dangerous. JAMA. 2014;311(12):1199–1200.
- , , , et al. Meta‐analysis of observational studies in epidemiology: a proposal for reporting. Meta‐analysis Of Observational Studies in Epidemiology (MOOSE) Group. JAMA. 2000;283(15):2008–2012.
- , , , ; PRISMA Group. Preferred reporting items for systematic reviews and meta‐analyses: the PRISMA statement. Ann Intern Med. 2009;151(4):264–269, W64.
- , , , , . ALARMED: adverse events in low‐risk patients with chest pain receiving continuous electrocardiographic monitoring in the emergency department. A pilot study. Am J Emerg Med. 2006;24:62–67.
- , , . Patient and nurse‐related implications of remote cardiac telemetry. Clin Nurs Res. 2003;12(4):356–370.
- , , , , . Clinical evaluation of alarm efficiency in intensive care [in French]. Ann Fr Anesth Reanim. 2000;19:459–466.
- , , , , , . Multicentric study of monitoring alarms in the adult intensive care unit (ICU): a descriptive analysis. Intensive Care Med. 1999;25:1360–1366.
- , , , et al. Insights into the problem of alarm fatigue with physiologic monitor devices: a comprehensive observational study of consecutive intensive care unit patients. PloS One. 2014;9(10):e110274.
- . Nurses' response to frequency and types of electrocardiography alarms in a non‐ critical care setting: a descriptive study. Int J Nurs Stud. 2014;51(2):190–197.
- , , . Improving alarm performance in the medical intensive care unit using delays and clinical context. Anesth Analg. 2009;108:1546–1552.
- , , , et al. The proportion of clinically relevant alarms decreases as patient clinical severity decreases in intensive care units: a pilot study. BMJ Open. 2013;3(9):e003354–e003354.
- , , . Physiologic monitoring alarm load on medical/surgical floors of a community hospital. Biomed Instrum Technol. 2011;45:29–36.
- , , , . Frequency and reliability of alarms in the monitoring of cardiac postoperative patients. Int J Clin Monit Comput. 1990;7(2):129–133.
- , , , et al. Audit of the bedside monitor alarms in a critical care unit [in Spanish]. Enferm Intensiva. 2014;25(3):83–90.
- , . Stimulus‐response time to invasive blood pressure alarms: implications for the safety of critical‐care patients. Rev Gaúcha Enferm. 2014;35(2):135–141.
- , , , , , . Intensive care unit alarms— how many do we need? Crit Care Med. 2010;38:451–456.
- , , , et al. Pulse oximetry desaturation alarms on a general postoperative adult unit: a prospective observational study of nurse response time. Int J Nurs Stud. 2013;50(10):1351–1358.
- , , . Whats that noise? Bedside monitoring in the Emergency Department. Int Emerg Nurs. 2014;22(4):197–201.
- , , , et al. Association between exposure to nonactionable physiologic monitor alarms and response time in a children's hospital. J Hosp Med. 2015;10(6):345–351.
- . Crying wolf: false alarms in a pediatric intensive care unit. Crit Care Med. 1994;22(6):981–985.
- , , , , . What are we missing? Arrhythmia detection in the pediatric intensive care unit. J Pediatr. 2013;163(2):511–514.
- , , , et al. Cardiopulmonary monitors and clinically significant events in critically ill children. Biomed Instrum Technol. 2011;45(s1):38–45.
- , . Poor prognosis for existing monitors in the intensive care unit. Crit Care Med. 1997;25:614–619.
- , , , , . Safe patient monitoring is challenging but still feasible in a neonatal intensive care unit with single family rooms. Acta Paediatr Oslo Nor 1992. 2015;104(6):e247–e254.
- , , , . The helpful or hindering effects of in‐hospital patient monitor alarms on nurses: a qualitative analysis. CIN Comput Inform Nurs. 2012;30(4):210–217.
- . Survey of alarms in an intensive therapy unit. Anaesthesia. 1986;41(7):742–744.
- , , , . Postanesthesia monitoring revisited: frequency of true and false alarms from different monitoring devices. J Clin Anesth. 1994;6(3):182–188.
- , , , . Impact of pulse oximetry surveillance on rescue events and intensive care unit transfers: a before‐and‐after concurrence study. Anesthesiology. 2010;112(2):282–287.
- , , , et al. Differences in alarm events between disposable and reusable electrocardiography lead wires. Am J Crit Care. 2015;24(1):67–74.
- , , , . Daily electrode change and effect on cardiac monitor alarms: an evidence‐based practice approach. J Nurs Care Qual. 2013;28:265–271.
- , , , . Use of pagers with an alarm escalation system to reduce cardiac monitor alarm signals. J Nurs Care Qual. 2014;29(1):9–18.
- , . Monitor alarm fatigue: standardizing use of physiological monitors and decreasing nuisance alarms. Am J Crit Care. 2010;19:28–34.
- , . Influence of pulse oximeter lower alarm limit on the incidence of hypoxaemia in the recovery room. Br J Anaesth. 1997;79(4):460–464.
- , , , , , . Novel approach to cardiac alarm management on telemetry units. J Cardiovasc Nurs. 2014;29(5):E13–E22.
- , , , et al. A team‐based approach to reducing cardiac monitor alarms. Pediatrics. 2014;134(6):e1686–e1694.
- . Monitor alarm fatigue: an integrative review. Biomed Instrum Technol. 2012;46(4):268–277.
- , , , , . Altering overuse of cardiac telemetry in non‐intensive care unit settings by hardwiring the use of American Heart Association guidelines. JAMA Intern Med. 2014;174(11):1852–1854.
- , , , et al. Using quality improvement to reduce continuous pulse oximetry use in children with wheezing. Pediatrics. 2015;135(4):e1044–e1051.
- , . The feasibility of creating a checklist for the assessment of the methodological quality both of randomised and non‐randomised studies of health care interventions. J Epidemiol Community Health. 1998;52(6):377–384.
Pharmacotherapy for Tobacco Use and COPD
Up to one‐third of the 700,000 patients admitted annually for an exacerbation of chronic obstructive pulmonary disease (COPD) continue to smoke tobacco.[1, 2] Smokers with COPD are at high risk for poor health outcomes directly attributable to tobacco‐related conditions, including progression of lung disease and cardiovascular diseases.[3, 4, 5] Treatment for tobacco addiction is the most essential intervention for these patients.
Hospital admission has been suggested as an opportune time for the initiation of smoking cessation.[6] Hospitalized patients are already in a smoke‐free environment, and have access to physicians, nurses, and pharmacists who can prescribe medications for support.[7] Documenting smoking status and offering smoking cessation treatment during and after discharge are quality metrics required by the Joint Commission, and recommended by the National Quality Forum.[8, 9] Hospitals have made significant efforts to comply with these requirements.[10]
Limited data exist regarding the effectiveness and utilization of treatments known to reduce cigarette use among COPD patients in nontrial environments. Prescribing patterns of medications for smoking cessation in the real world following admission for COPD are not well studied. We sought to examine the utilization of inpatient brief tobacco counseling and postdischarge pharmacotherapy following discharge for exacerbation of COPD, as well as to (1) examine the association of postdischarge pharmacotherapy with self‐reported smoking cessation at 6 to 12 months and (2) assess differences in effectiveness between cessation medications prescribed.
METHODS
We conducted a cohort study of current smokers discharged following a COPD exacerbation within the Veterans Affairs (VA) Veterans Integrated Service Network (VISN)‐20. This study was approved by the VA Puget Sound Health Care System Institutional Review Board (#00461).
We utilized clinical information from the VISN‐20 data warehouse that collects data using the VA electronic medical record, including demographics, prescription medications, hospital admissions, hospital and outpatient diagnoses, and dates of death, and is commonly used for research. In addition, we utilized health factors, coded electronic entries describing patient health behaviors that are entered by nursing staff at the time of a patient encounter, and the text of chart notes that were available for electronic query.
Study Cohort
We identified all smokers aged 40 years hospitalized between 2005 and 2012 with either a primary discharge diagnosis of COPD based on International Classification of Diseases, 9th Revision codes (491, 492, 493.2, and 496) or an admission diagnosis from the text of the admit notes indicating an exacerbation of COPD. We limited to patients aged 40 years to improve the specificity of the diagnosis of COPD, and we selected the first hospitalization that met inclusion criteria. We excluded subjects who died within 6 months of discharge (Figure 1).
To establish tobacco status, we built on previously developed and validated methodology,[11] and performed truncated natural language processing using phrases in the medical record that reflected patients' tobacco status, querying all notes from the day of admission up to 6 months prior. If no tobacco status was indicated in the notes, we identified the status encoded by the most recent health factor. We manually examined the results of the natural language processing and the determination of health factors to confirm the tobacco status. Manual review was undertaken by 1 of 2 trained study personnel. In the case of an ambiguous or contradictory status, an additional team member reviewed the information to attempt to make a determination. If no determination could be made, the record was coded to unknown. This method allowed us to identify a baseline status for all but 77 of the 3580 patients admitted for COPD.
Outcome and Exposure
The outcome was tobacco status at 6 to 12 months after discharge. Using the same methods developed for identification of baseline smoking status, we obtained smoking status for each subject up to 12 months postdischarge. If multiple notes and encounters were available indicating smoking status, we chose the latest within 12 months of discharge. Subjects lacking a follow‐up status were presumed to be smokers, a common assumption.[12] The 6 to 12month time horizon was chosen as these are the most common time points used to examine a sustained change in tobacco status,[13, 14, 15] and allowed for adequate time for treatment and clinical follow‐up.
Our primary exposure was any smoking cessation medication or combination dispensed within 90 days of discharge. This time horizon for treatment was chosen due to recent studies indicating this is a meaningful period for postdischarge treatment.[14] We assessed the use of nicotine patch, short‐acting nicotine, varenicline, buproprion, or any combination. Accurate data on the prescription and dispensing of these medications were available from the VA pharmacy record. Secondary exposure was the choice of medication dispensed among treated patients. We assessed additional exposures including receipt of cessation medications within 48 hours of discharge, treatment in the year prior to admission, and predischarge counseling. Predischarge counseling was determined as having occurred if nurses documented that they completed a discharge process focused on smoking cessation. Referral to a quit line is part of this process; however, due to the confidential nature of these interactions, generally low use of this service, and lack of linkage to the VA electronic health record, it was not considered in the analysis.
Confounders
Potential confounders were assessed in the year prior to admission up to discharge from the index hospitalization, with the use of mechanical or noninvasive ventilation assessed during the hospitalization. We adjusted for variables chosen a priori for their known or expected association with smoking cessation including demographics, Charlson Comorbidity Index,[16] markers of COPD severity (need for invasive or noninvasive mechanical ventilation during index hospitalization, use of oral steroids, long‐acting inhaled bronchodilators, and/or canister count of short‐acting bronchodilators in the year prior to admission), history of drug or alcohol abuse, homelessness, depression, psychosis, post‐traumatic stress disorder, lung cancer, coronary artery disease, and under‐ or overweight status. Nurse‐based counseling prior to discharge was included as a variable for adjustment for our primary and secondary predictors to assess the influence of pharmacotherapy specifically. Due to 3.1% missingness in body mass index, multiple imputation with chained equations was used to impute missing values, with 10 imputations performed. The imputation was performed using a linear regression model containing all variables included in the final model, grouped by facility.
Statistical Analysis
All analyses were performed using Stata 13 (StataCorp, College Station, TX) software. 2 tests and t tests were used to assess for unadjusted bivariate associations. Using the pooled imputed datasets, we performed multivariable logistic regression to compare odds ratios for a change in smoking status, adjusting the estimates of coefficients and standard errors by applying combination rules to the 10 completed‐data estimates.[17] We analyzed our primary and secondary predictors, adjusting for the confounders chosen a priori, clustered by facility with robust standard errors. An level of <0.05 was considered significant.
Sensitivity Analysis
We assumed that subjects missing a follow‐up status were ongoing smokers. However, given the high mortality rate observed in our cohort, we were concerned that some subjects lacking a follow‐up status may have died, missing the opportunity to have a quit attempt recorded. Therefore, we performed sensitivity analysis excluding subjects who died during the 6 to 12 months of follow‐up, repeating the imputation and analysis as described above. In addition, due to concern for indication bias in the choice of medication used for our secondary analysis, we performed propensity score matching for treatment with each medication in comparison to nicotine patch, using the teffects command, with 3 nearest neighbor matches. We included additional comorbidities in the propensity score matching.[18]
RESULTS
Among these 1334 subjects at 6 to 12 months of follow‐up, 63.7% reported ongoing smoking, 19.8% of patients reported quitting, and 17.5% of patients had no reported status and were presumed to be smokers. Four hundred fifty (33.7%) patients were dispensed a smoking cessation medication within 90 days of discharge. Patients who were dispensed medications were younger and more likely to be female. Nearly all patients who received medications also received documented predischarge counseling (94.6%), as did the majority of patients who did not receive medications (83.8%) (Table 1).
| Variable | No Medication Dispensed, n = 884, No. (%) | Medication Dispensed, n = 450, No. (%) | P Value |
|---|---|---|---|
| |||
| Not smoking at 612 months | 179 (20.2) | 85 (18.9) | 0.56 |
| Brief counseling at discharge | 742 (83.8%) | 424 (94.6%) | <0.001* |
| Age | 64.49.13 (4094) | 61.07.97 (4185) | <0.001* |
| Male | 852 (96.3) | 423 (94.0) | 0.05* |
| Race | 0.12 | ||
| White | 744 (84.2) | 377 (83.8) | |
| Black | 41 (4.6) | 12 (2.7) | |
| Other/unknown | 99 (11.1) | 61 (13.6) | |
| BMI | 28.09.5 (12.669.0) | 28.910.8 (14.860.0) | 0.15 |
| Homeless | 68 (7.7) | 36 (8.0) | 0.84 |
| Psychiatric conditions/substance abuse | |||
| History of alcohol abuse | 205 (23.2) | 106 (23.6) | 0.88 |
| History of drug abuse | 110 (12.4) | 72 (16.0) | 0.07 |
| Depression | 39 (4.4) | 29 (6.4) | 0.11 |
| Psychosis | 201 (22.7) | 88 (19.6) | 0.18 |
| PTSD | 146 (16.5) | 88 (19.6) | 0.17 |
| Comorbidities | |||
| Coronary artery disease | 254 (28.7) | 110 (24.4) | 0.10 |
| Cerebrovascular accident | 80 (9.0) | 28 (2.2) | 0.86 |
| Obstructive sleep apnea | 42 (4.8) | 23 (5.1) | 0.77 |
| Lung cancer | 21 (2.4) | 10 (2.2) | 0.86 |
| Charlson Comorbidity Index | 2.251.93 (014) | 2.111.76 (010) | 0.49 |
| Markers of COPD severity | |||
| Mechanical ventilation during admission | 28 (3.2) | 14 (3.1) | 0.96 |
| NIPPV during admission | 97 (11.0) | 51 (11.3) | 0.84 |
| Oral steroids prescribed in the past year | 334 (37.8) | 154 (34.2) | 0.20 |
| Treatment with tiotropium in the past year | 97 (11.0) | 55 (12.2) | 0.50 |
| Treatment with LABA in the past year | 264 (29.9) | 155 (34.4) | 0.09 |
| Canisters of SABA used in past year | 6.639.8, (084) | 7.469.63 (045) | 0.14 |
| Canisters of ipratropium used in past year | 6.458.81 (054) | 6.869.08 (064) | 0.42 |
| Died during 612 months of follow‐up | 78 (8.8) | 28 (6.6) | 0.10 |
Of patients dispensed a study medication, 246 (18.4% of patients, 54.7% of all medications dispensed) were dispensed medications within 48 hours of discharge (Table 2). Of the patients dispensed medication, the majority received nicotine patches alone (Table 3), and 18.9% of patients received combination therapy, with the majority receiving nicotine patch and short‐acting nicotine replacement therapy (NRT) or patch and buproprion. A significant number of patients were prescribed medications within 90 days of discharge, but did not have them dispensed within that timeframe (n = 224, 16.8%).
| Medication Dispensed | No. (%) | % Quit (Unadjusted) | OR (95% CI) | P Value |
|---|---|---|---|---|
| ||||
| No medications dispensed | 884 (66.3) | 20.2 | Referent | |
| Any medication from | ||||
| Discharge to 90 days | 450 (33.7) | 18.9 | 0.88 (0.741.04) | 0.137 |
| Within 48 hours of discharge | 246 (18.4) | 18.3 | 0.87 (0.661.14) | 0.317 |
| Treated in the year prior to admission | 221 (16.6) | 19.6 | Referent | |
| Treated in the year prior to admission + 090 days postdischarge | 152 (11.4) | 18.4 | 0.95 (0.791.13) | 0.534 |
| No nurse‐provided counseling prior to discharge | 169 (12.7) | 20.5 | Referent | |
| Nurse‐provided counseling prior to discharge | 1,165 (87.3) | 19.5 | 0.95 (0.661.36) | 0.774 |
| Medication Dispensed | No. (%) | % Quit (Unadjusted) | OR (95% CI) | P Value |
|---|---|---|---|---|
| ||||
| Nicotine patch | 242 (53.8) | 18.6 | Referent | |
| Monotherapy with | ||||
| Varenicline | 36 (8.0) | 30.6 | 2.44 (1.484.05) | 0.001 |
| Short‐acting NRT | 34 (7.6) | 11.8 | 0.66 (0.510.85) | 0.001 |
| Buproprion | 55 (12.2) | 21.8 | 1.05 (0.671.62) | 0.843 |
| Combination therapy | 85 (18.9) | 15.7 | 0.94 (0.711.24) | 0.645 |
Association of Treatment With Study Medications and Quitting Smoking
In adjusted analyses, the odds of quitting smoking at 6 to 12 months were not greater among patients who were dispensed a study medication within 90 days of discharge (odds ratio [OR]: 0.88, 95% confidence interval [CI]: 0.74‐1.04). We found no association between counseling provided at discharge and smoking cessation (OR: 0.95, 95% CI: 0.0.66‐1.), adjusted for the receipt of medications. There was no difference in quit rate between patients dispensed medication within 48 hours of discharge, or between patients treated in the year prior to admission and again postdischarge (Table 2).
We then assessed differences in effectiveness between specific medications among the 450 patients who were dispensed medications. Using nicotine patch alone as the referent group, patients treated with varenicline demonstrated greater odds of smoking cessation (OR: 2.44, 95% CI: 1.48‐4.05). Patients treated with short‐acting NRT alone were less likely to report smoking cessation (OR: 0.66, 95% CI: 0.51‐0.85). Patients treated with buproprion or combination therapy were no more likely to report cessation (Table 3). When sensitivity analysis was performed using propensity score matching with additional variables included, there were no significant differences in the observed associations.
Our overall mortality rate observed at 1 year was 19.5%, nearly identical to previous cohort studies of patients admitted for COPD.[19, 20] Because of the possibility of behavioral differences on the part of patients and physicians regarding subjects with a limited life expectancy, we performed sensitivity analysis limited to the patients who survived to at least 12 months of follow‐up. One hundred six patients (7.9%) died during 6 to 12 months of follow‐up. There was no change in inference for our primary exposure (OR: 0.95, 95% CI: 0.79‐1.14) or any of the secondary exposures examined.
DISCUSSION
In this observational study, postdischarge pharmacotherapy within 90 days of discharge was provided to a minority of high‐risk smokers admitted for COPD, and was not associated with smoking cessation at 6 to 12 months. In comparison to nicotine patch alone, varenicline was associated with a higher odds of cessation, with decreased odds of cessation among patients treated with short‐acting NRT alone. The overall quit rate was significant at 19.8%, and is consistent with annual quit rates observed among patients with COPD in other settings,[21, 22] but is far lower than quit rates observed after admission for acute myocardial infarction.[23, 24, 25] Although the proportion of patients treated at the time of discharge or within 90 days was low, our findings are in keeping with previous studies, which demonstrated low rates of pharmacologic treatment following hospitalization, averaging 14%.[26] Treatment for tobacco use is likely underutilized for this group of high‐risk smokers. However, a significant proportion of patients who were prescribed medications in the postdischarge period did not have medications filled. This likely reflects both the rapid changes in motivation that characterize quit attempts,[27] as well as efforts on the part of primary care physicians to make these medications available to facilitate future quit attempts.
There are several possible explanations for the findings in our study. Pharmaceutical therapies were not provided at random. The provision of pharmacotherapy and the ultimate success of a quit attempt reflects a complex interaction of patient beliefs concerning medications, level of addiction and motivation, physician behavior and knowledge, and organizational factors. Organizational factors such as the structure of electronic discharge orders and the availability of decision support materials may influence a physician's likelihood of prescribing medications, the choice of medication prescribed, and therefore the adequacy of control of withdrawal symptoms. NRT is often under dosed to control ongoing symptoms,[28] and needs to be adjusted until relief is obtained, providing an additional barrier to effectiveness during the transition out of the hospital. Because most smokers with COPD are highly addicted to nicotine,[29] high‐dose NRT, combination therapy, or varenicline would be necessary to adequately control symptoms.[30] However, a significant minority of patients received short‐acting NRT alone.
Despite a high observed efficacy in recent trials,[31, 32] few subjects in our study received varenicline. This may be related to both secular trends and administrative barriers to the use of varenicline in the VA system. Use of this medication was limited among patients with psychiatric disorders due to safety concerns. These concerns have since been largely disproven, but may have limited access to this medication.[33, 34, 35] Although we adjusted for a history of mental illness, patients who received varenicline may have had more past quit attempts and less active mental illness, which may be associated with improved cessation rates. Despite the high prevalence of mental illness we observed, this is typical of the population of smokers, with studies indicating nearly one‐third of smokers overall suffer from mental illness.[36]
Although the majority of our patients received a brief, nurse‐based counseling intervention, there is considerable concern about the overall effectiveness of a single predischarge interaction to produce sustained smoking cessation among highly addicted smokers.[37, 38, 39, 40] The Joint Commission has recently restructured the requirements for smoking cessation treatment for hospitalized patients, and it is now up to hospitals to implement treatment mechanisms that not only meet the national requirements, but also provide a meaningful clinical effect. Though the optimum treatment for hospitalized smokers with COPD is unknown, previous positive studies of smoking cessation among hospitalized patients underscore the need for a higher‐intensity counseling intervention that begins during hospitalization and continues after discharge.[13, 41] Cessation counseling services including tobacco cessation groups and quit lines are available through the VA; however, the use of these services is typically low and requires the patient to enroll independently after discharge, an additional barrier. The lack of association between medications and smoking cessation found in our study could reflect poor effectiveness of medications in the absence of a systematic counseling intervention. Alternatively, the association may be explained that patients who were more highly addicted and perhaps less motivated to quit received tobacco cessation medications more often, but were also less likely to stop tobacco use, a form of indication bias.
Our study has several limitations. We do not have addiction or motivation levels for a cessation attempt, a potential unmeasured confounder. Although predictive of quit attempts, motivation factors are less predictive of cessation maintenance, and may therefore have an unclear effect on our outcome.[42, 43] Our outcome was gathered as part of routine clinical care, which may have introduced bias if patients over‐reported cessation because of social desirability. In healthcare settings, however, this form of assessing smoking status is generally valid.[44] Exposure to counseling or medications obtained outside of the VA system would not have been captured. Given the financial incentive, we believe it is unlikely that many patients admitted to a VA medical center obtained medications elsewhere.[45] The diagnosis of COPD was made administratively. However, all subjects were admitted for an exacerbation, which is associated with more severe COPD by Global Initiative for Obstructive Lung Disease (GOLD) stage.[46] Patients with more severe COPD are often excluded from studies of smoking cessation due to concerns of high dropout and lower prevalence of smoking among patients with GOLD stage IV disease,[47, 48] making this a strength of our study. Subjects who died may have quit only in extremis, or failed to document their quit attempts. However, our sensitivity analysis limited to survivors did not change the study results. There may have been some misclassification in the use of buproprion, which may also be prescribed as an antidepressant. Finally, although representative of the veterans who seek care within the VISN‐20, our patients were primarily white and male, limiting the ability to generalize outside of this group.
Our study had several strengths. We examined a large cohort of patients admitted to a complete care organization, including patients from a diverse group of VA settings comprising academically and nonacademically affiliated centers. We performed an unbiased collection of patients, including all smokers discharged for COPD. We had access to excellent completeness of medications prescribed and filled as collected within the VA system, enabling us to observe medications dispensed and prescribed at several time points. We also had near complete ascertainment of outcomes including by using natural language processing with manual confirmation of smoking status.
In summary, we found that provision of medications to treat ongoing tobacco use among patients discharged for COPD was low, and receipt of medications was not associated with a reduction in smoking tobacco at 6 to 12 months postdischarge. However, among those treated, varenicline appears to be superior to the nicotine patch, with short‐acting nicotine replacement potentially less effective, a biologically plausible finding. The motivation to quit smoking changes rapidly over time. Providing these medications in the hospital and during the time after discharge is a potential means to improve quit rates, but medications need to be paired with counseling to be most effective. Collectively, these data suggest that systems‐based interventions are needed to increase the availability of intense counseling and the use of tailored pharmacotherapy to these patients.
Acknowledgements
The authors acknowledge Mr. Robert Plumley, who performed the data extraction and natural language processing necessary to complete this project.
Disclosures: Dr. Melzer conceived of the research question and performed background reading, analyses, primary drafting, and final revision of the manuscript. Drs. Collins and Feemster participated in finalizing the research question, developing the cohort, performing data collection, and revising the manuscript. Dr. Au provided the database for analysis, helped finalize the research question, and assisted in interpretation of the data and revision of the manuscript. Dr. Au has personally reviewed the data, understands the statistical methods employed, and confirms an understanding of this analysis, that the methods are clearly described, and that they are a fair way to report the results. This material is based upon work supported in part by the Department of Veterans Affairs, Veterans Health Administration, Office of Research and Development, who provided access to data, office space, and programming and data management. The views expressed in this article are those of the authors and do not necessarily reflect the position or policy of the Department of Veterans Affairs, the United States government, or the National Institutes of Health. Dr. Au is an unpaid research consultant for Analysis Group. None of the other authors have any conflicts of interest to disclose. Dr. Melzer is supported by an institutional F‐32 (HL007287‐36) through the University of Washington Department of Pulmonary and Critical Care. Dr. Feemster is supported by an National Institutes of Health, National Heart, Lung, and Blood Institute, K23 Mentored Career Development Award (HL111116). Partial support of this project was provided by Gilead Sciences with research funding to the Seattle Institute for Biomedical and Clinical Research. Additional support was received through the VA Health Services Research and Development. A portion of this work was presented in abstract form at the American Thoracic Society International Meeting, May 2015, in Denver, Colorado.
- , , , , , . Patients hospitalized for COPD have a high prevalence of modifiable risk factors for exacerbation (EFRAM study). Eur Respir J. 2000;16(6):1037–1042.
- , , , et al. Analysis of hospitalizations for COPD exacerbation: opportunities for improving care. COPD. 2010;7(2):85–92.
- , , , . Mortality in COPD: role of comorbidities. Eur Respir J. 2006;28(6):1245–1257.
- , , , . Cardiovascular comorbidity in COPD: systematic literature review. Chest. 2013;144(4):1163–1178.
- . Engaging patients and clinicians in treating tobacco addiction. JAMA Intern Med. 2014;174(8):1299–1300.
- , . Smokers who are hospitalized: a window of opportunity for cessation interventions. Prev Med. 1992;21(2):262–269.
- , , , . Interventions for smoking cessation in hospitalised patients. Cochrane Database Syst Rev. 2012;5:CD001837.
- Specifications Manual for National Hospital Inpatient Quality Measures. Available at: http://www.jointcommission.org/specifications_manual_for_national_hospital_inpatient_quality_measures.aspx. Accessed January 15, 2015.
- Treating Tobacco Use and Dependence. April 2013. Agency for Healthcare Research and Quality, Rockford, MD. Available at: http://www.ahrq.gov/professionals/clinicians‐providers/guidelines‐recommendations/tobacco/clinicians/update/index.html. Accessed January 15, 2015.
- , , , . Smoking cessation advice rates in US hospitals. Arch Intern Med. 2011;171(18):1682–1684.
- , , , et al. Validating smoking data from the Veteran's Affairs Health Factors dataset, an electronic data source. Nicotine Tob Res. 2011;13(12):1233–1239.
- , , , et al. Do u smoke after txt? Results of a randomised trial of smoking cessation using mobile phone text messaging. Tob Control. 2005;14(4):255–261.
- , , , . The effectiveness of smoking cessation groups offered to hospitalised patients with symptoms of exacerbations of chronic obstructive pulmonary disease (COPD). Clin Respir J. 2008;2(3):158–165.
- , , , et al. Sustained care intervention and postdischarge smoking cessation among hospitalized adults: a randomized clinical trial. JAMA. 2014;312(7):719–728.
- , , , et al. Bupropion for smokers hospitalized with acute cardiovascular disease. Am J Med. 2006;119(12):1080–1087.
- , , . Adapting a clinical comorbidity index for use with ICD‐9‐CM administrative databases. J Clin Epidemiol. 1992;45(6):613–619.
- . Multiple Imputation for Nonresponse in Surveys. New York, NY: Wiley; 1987.
- , , , et al. Methods for constructing and assessing propensity scores. Health Serv Res. 2014;49(5):1701–1720.
- , , . Mortality and mortality‐related factors after hospitalization for acute exacerbation of COPD. Chest. 2003;124(2):459–467.
- , , , et al. Mortality after hospitalization for COPD. Chest. 2002;121(5):1441–1448.
- , , , , , . State quitlines and cessation patterns among adults with selected chronic diseases in 15 states, 2005–2008. Prev Chronic Dis. 2012;9(10):120105.
- , , . The effects of counseling on smoking cessation among patients hospitalized with chronic obstructive pulmonary disease: a randomized clinical trial. Int J Addict. 1991;26(1):107–119.
- , , , et al. Predictors of smoking cessation after a myocardial infarction: the role of institutional smoking cessation programs in improving success. Arch Intern Med. 2008;168(18):1961–1967.
- , , , , , . Post‐myocardial infarction smoking cessation counseling: associations with immediate and late mortality in older Medicare patients. Am J Med. 2005;118(3):269–275.
- , , , . Smoking cessation after acute myocardial infarction: effects of a nurse‐‐managed intervention. Ann Intern Med. 1990;113(2):118–123.
- , , , et al. Smoking care provision in hospitals: a review of prevalence. Nicotine Tob Res. 2008;10(5):757–774.
- , , , . Intentions to quit smoking change over short periods of time. Addict Behav. 2005;30(4):653–662.
- , , , , . Association of amount and duration of NRT use in smokers with cigarette consumption and motivation to stop smoking: a national survey of smokers in England. Addict Behav. 2015;40(0):33–38.
- , . Smoking prevalence, behaviours, and cessation among individuals with COPD or asthma. Respir Med. 2011;105(3):477–484.
- , , , et al. American College of Chest Physicians. Tobacco Dependence Treatment ToolKit. 3rd ed. Available at: http://tobaccodependence.chestnet.org. Accessed January 29, 2015.
- , , , , , . Effects of varenicline on smoking cessation in patients with mild to moderate COPD: a randomized controlled trial. Chest. 2011;139(3):591–599.
- , , , et al. Varenicline versus transdermal nicotine patch for smoking cessation: results from a randomised open‐label trial. Thorax. 2008;63(8):717–724.
- , , , , . Psychiatric adverse events in randomized, double‐blind, placebo‐controlled clinical trials of varenicline. Drug Saf. 2010;33(4):289–301.
- . Studies linking smoking‐cessation drug with suicide risk spark concerns. JAMA. 2009;301(10):1007–1008.
- , , , et al. A randomized, double‐blind, placebo‐controlled study evaluating the safety and efficacy of varenicline for smoking cessation in patients with schizophrenia or schizoaffective disorder. J Clin Psychiatry. 2012;73(5):654–660.
- , , . Smoking and mental illness: results from population surveys in Australia and the United States. BMC Public Health. 2009;9(1):285.
- , , , . Implementation and effectiveness of a brief smoking‐cessation intervention for hospital patients. Med Care. 2000;38(5):451–459.
- , , , et al. Clinical trial comparing nicotine replacement therapy (NRT) plus brief counselling, brief counselling alone, and minimal intervention on smoking cessation in hospital inpatients. Thorax. 2003;58(6):484–488.
- , , , et al. Dissociation between hospital performance of the smoking cessation counseling quality metric and cessation outcomes after myocardial infarction. Arch Intern Med. 2008;168(19):2111–2117.
- , , , , . Smoking cessation in hospitalized patients: Results of a randomized trial. Arch Intern Med. 1997;157(4):409–415.
- , , , , . Intensive smoking cessation counseling versus minimal counseling among hospitalized smokers treated with transdermal nicotine replacement: a randomized trial. Am J Med. 2003;114(7):555–562.
- , , , et al. Motivational factors predict quit attempts but not maintenance of smoking cessation: findings from the International Tobacco Control Four country project. Nicotine Tob Res. 2010;12(suppl):S4–S11.
- , , , , . Predictors of attempts to stop smoking and their success in adult general population samples: a systematic review. Addiction. 2011;106(12):2110–2121.
- , , , et al. Validity of self‐reported smoking status among participants in a lung cancer screening trial. Cancer Epidemiol Biomarkers Prev. 2006;15(10):1825–1828.
- , , , . VHA enrollees' health care coverage and use of care. Med Care Res Rev. 2003;60(2):253–67.
- , , , , . Association between lung function and exacerbation frequency in patients with COPD. Int J Chron Obstruct Pulmon Dis. 2010;5:435–444.
- , , , et al. Smoking cessation in patients with chronic obstructive pulmonary disease: a double‐blind, placebo‐controlled, randomised trial. Lancet. 2001;357(9268):1571–1575.
- , , . Nurse‐conducted smoking cessation in patients with COPD using nicotine sublingual tablets and behavioral support. Chest. 2006;130(2):334–342.
Up to one‐third of the 700,000 patients admitted annually for an exacerbation of chronic obstructive pulmonary disease (COPD) continue to smoke tobacco.[1, 2] Smokers with COPD are at high risk for poor health outcomes directly attributable to tobacco‐related conditions, including progression of lung disease and cardiovascular diseases.[3, 4, 5] Treatment for tobacco addiction is the most essential intervention for these patients.
Hospital admission has been suggested as an opportune time for the initiation of smoking cessation.[6] Hospitalized patients are already in a smoke‐free environment, and have access to physicians, nurses, and pharmacists who can prescribe medications for support.[7] Documenting smoking status and offering smoking cessation treatment during and after discharge are quality metrics required by the Joint Commission, and recommended by the National Quality Forum.[8, 9] Hospitals have made significant efforts to comply with these requirements.[10]
Limited data exist regarding the effectiveness and utilization of treatments known to reduce cigarette use among COPD patients in nontrial environments. Prescribing patterns of medications for smoking cessation in the real world following admission for COPD are not well studied. We sought to examine the utilization of inpatient brief tobacco counseling and postdischarge pharmacotherapy following discharge for exacerbation of COPD, as well as to (1) examine the association of postdischarge pharmacotherapy with self‐reported smoking cessation at 6 to 12 months and (2) assess differences in effectiveness between cessation medications prescribed.
METHODS
We conducted a cohort study of current smokers discharged following a COPD exacerbation within the Veterans Affairs (VA) Veterans Integrated Service Network (VISN)‐20. This study was approved by the VA Puget Sound Health Care System Institutional Review Board (#00461).
We utilized clinical information from the VISN‐20 data warehouse that collects data using the VA electronic medical record, including demographics, prescription medications, hospital admissions, hospital and outpatient diagnoses, and dates of death, and is commonly used for research. In addition, we utilized health factors, coded electronic entries describing patient health behaviors that are entered by nursing staff at the time of a patient encounter, and the text of chart notes that were available for electronic query.
Study Cohort
We identified all smokers aged 40 years hospitalized between 2005 and 2012 with either a primary discharge diagnosis of COPD based on International Classification of Diseases, 9th Revision codes (491, 492, 493.2, and 496) or an admission diagnosis from the text of the admit notes indicating an exacerbation of COPD. We limited to patients aged 40 years to improve the specificity of the diagnosis of COPD, and we selected the first hospitalization that met inclusion criteria. We excluded subjects who died within 6 months of discharge (Figure 1).
To establish tobacco status, we built on previously developed and validated methodology,[11] and performed truncated natural language processing using phrases in the medical record that reflected patients' tobacco status, querying all notes from the day of admission up to 6 months prior. If no tobacco status was indicated in the notes, we identified the status encoded by the most recent health factor. We manually examined the results of the natural language processing and the determination of health factors to confirm the tobacco status. Manual review was undertaken by 1 of 2 trained study personnel. In the case of an ambiguous or contradictory status, an additional team member reviewed the information to attempt to make a determination. If no determination could be made, the record was coded to unknown. This method allowed us to identify a baseline status for all but 77 of the 3580 patients admitted for COPD.
Outcome and Exposure
The outcome was tobacco status at 6 to 12 months after discharge. Using the same methods developed for identification of baseline smoking status, we obtained smoking status for each subject up to 12 months postdischarge. If multiple notes and encounters were available indicating smoking status, we chose the latest within 12 months of discharge. Subjects lacking a follow‐up status were presumed to be smokers, a common assumption.[12] The 6 to 12month time horizon was chosen as these are the most common time points used to examine a sustained change in tobacco status,[13, 14, 15] and allowed for adequate time for treatment and clinical follow‐up.
Our primary exposure was any smoking cessation medication or combination dispensed within 90 days of discharge. This time horizon for treatment was chosen due to recent studies indicating this is a meaningful period for postdischarge treatment.[14] We assessed the use of nicotine patch, short‐acting nicotine, varenicline, buproprion, or any combination. Accurate data on the prescription and dispensing of these medications were available from the VA pharmacy record. Secondary exposure was the choice of medication dispensed among treated patients. We assessed additional exposures including receipt of cessation medications within 48 hours of discharge, treatment in the year prior to admission, and predischarge counseling. Predischarge counseling was determined as having occurred if nurses documented that they completed a discharge process focused on smoking cessation. Referral to a quit line is part of this process; however, due to the confidential nature of these interactions, generally low use of this service, and lack of linkage to the VA electronic health record, it was not considered in the analysis.
Confounders
Potential confounders were assessed in the year prior to admission up to discharge from the index hospitalization, with the use of mechanical or noninvasive ventilation assessed during the hospitalization. We adjusted for variables chosen a priori for their known or expected association with smoking cessation including demographics, Charlson Comorbidity Index,[16] markers of COPD severity (need for invasive or noninvasive mechanical ventilation during index hospitalization, use of oral steroids, long‐acting inhaled bronchodilators, and/or canister count of short‐acting bronchodilators in the year prior to admission), history of drug or alcohol abuse, homelessness, depression, psychosis, post‐traumatic stress disorder, lung cancer, coronary artery disease, and under‐ or overweight status. Nurse‐based counseling prior to discharge was included as a variable for adjustment for our primary and secondary predictors to assess the influence of pharmacotherapy specifically. Due to 3.1% missingness in body mass index, multiple imputation with chained equations was used to impute missing values, with 10 imputations performed. The imputation was performed using a linear regression model containing all variables included in the final model, grouped by facility.
Statistical Analysis
All analyses were performed using Stata 13 (StataCorp, College Station, TX) software. 2 tests and t tests were used to assess for unadjusted bivariate associations. Using the pooled imputed datasets, we performed multivariable logistic regression to compare odds ratios for a change in smoking status, adjusting the estimates of coefficients and standard errors by applying combination rules to the 10 completed‐data estimates.[17] We analyzed our primary and secondary predictors, adjusting for the confounders chosen a priori, clustered by facility with robust standard errors. An level of <0.05 was considered significant.
Sensitivity Analysis
We assumed that subjects missing a follow‐up status were ongoing smokers. However, given the high mortality rate observed in our cohort, we were concerned that some subjects lacking a follow‐up status may have died, missing the opportunity to have a quit attempt recorded. Therefore, we performed sensitivity analysis excluding subjects who died during the 6 to 12 months of follow‐up, repeating the imputation and analysis as described above. In addition, due to concern for indication bias in the choice of medication used for our secondary analysis, we performed propensity score matching for treatment with each medication in comparison to nicotine patch, using the teffects command, with 3 nearest neighbor matches. We included additional comorbidities in the propensity score matching.[18]
RESULTS
Among these 1334 subjects at 6 to 12 months of follow‐up, 63.7% reported ongoing smoking, 19.8% of patients reported quitting, and 17.5% of patients had no reported status and were presumed to be smokers. Four hundred fifty (33.7%) patients were dispensed a smoking cessation medication within 90 days of discharge. Patients who were dispensed medications were younger and more likely to be female. Nearly all patients who received medications also received documented predischarge counseling (94.6%), as did the majority of patients who did not receive medications (83.8%) (Table 1).
| Variable | No Medication Dispensed, n = 884, No. (%) | Medication Dispensed, n = 450, No. (%) | P Value |
|---|---|---|---|
| |||
| Not smoking at 612 months | 179 (20.2) | 85 (18.9) | 0.56 |
| Brief counseling at discharge | 742 (83.8%) | 424 (94.6%) | <0.001* |
| Age | 64.49.13 (4094) | 61.07.97 (4185) | <0.001* |
| Male | 852 (96.3) | 423 (94.0) | 0.05* |
| Race | 0.12 | ||
| White | 744 (84.2) | 377 (83.8) | |
| Black | 41 (4.6) | 12 (2.7) | |
| Other/unknown | 99 (11.1) | 61 (13.6) | |
| BMI | 28.09.5 (12.669.0) | 28.910.8 (14.860.0) | 0.15 |
| Homeless | 68 (7.7) | 36 (8.0) | 0.84 |
| Psychiatric conditions/substance abuse | |||
| History of alcohol abuse | 205 (23.2) | 106 (23.6) | 0.88 |
| History of drug abuse | 110 (12.4) | 72 (16.0) | 0.07 |
| Depression | 39 (4.4) | 29 (6.4) | 0.11 |
| Psychosis | 201 (22.7) | 88 (19.6) | 0.18 |
| PTSD | 146 (16.5) | 88 (19.6) | 0.17 |
| Comorbidities | |||
| Coronary artery disease | 254 (28.7) | 110 (24.4) | 0.10 |
| Cerebrovascular accident | 80 (9.0) | 28 (2.2) | 0.86 |
| Obstructive sleep apnea | 42 (4.8) | 23 (5.1) | 0.77 |
| Lung cancer | 21 (2.4) | 10 (2.2) | 0.86 |
| Charlson Comorbidity Index | 2.251.93 (014) | 2.111.76 (010) | 0.49 |
| Markers of COPD severity | |||
| Mechanical ventilation during admission | 28 (3.2) | 14 (3.1) | 0.96 |
| NIPPV during admission | 97 (11.0) | 51 (11.3) | 0.84 |
| Oral steroids prescribed in the past year | 334 (37.8) | 154 (34.2) | 0.20 |
| Treatment with tiotropium in the past year | 97 (11.0) | 55 (12.2) | 0.50 |
| Treatment with LABA in the past year | 264 (29.9) | 155 (34.4) | 0.09 |
| Canisters of SABA used in past year | 6.639.8, (084) | 7.469.63 (045) | 0.14 |
| Canisters of ipratropium used in past year | 6.458.81 (054) | 6.869.08 (064) | 0.42 |
| Died during 612 months of follow‐up | 78 (8.8) | 28 (6.6) | 0.10 |
Of patients dispensed a study medication, 246 (18.4% of patients, 54.7% of all medications dispensed) were dispensed medications within 48 hours of discharge (Table 2). Of the patients dispensed medication, the majority received nicotine patches alone (Table 3), and 18.9% of patients received combination therapy, with the majority receiving nicotine patch and short‐acting nicotine replacement therapy (NRT) or patch and buproprion. A significant number of patients were prescribed medications within 90 days of discharge, but did not have them dispensed within that timeframe (n = 224, 16.8%).
| Medication Dispensed | No. (%) | % Quit (Unadjusted) | OR (95% CI) | P Value |
|---|---|---|---|---|
| ||||
| No medications dispensed | 884 (66.3) | 20.2 | Referent | |
| Any medication from | ||||
| Discharge to 90 days | 450 (33.7) | 18.9 | 0.88 (0.741.04) | 0.137 |
| Within 48 hours of discharge | 246 (18.4) | 18.3 | 0.87 (0.661.14) | 0.317 |
| Treated in the year prior to admission | 221 (16.6) | 19.6 | Referent | |
| Treated in the year prior to admission + 090 days postdischarge | 152 (11.4) | 18.4 | 0.95 (0.791.13) | 0.534 |
| No nurse‐provided counseling prior to discharge | 169 (12.7) | 20.5 | Referent | |
| Nurse‐provided counseling prior to discharge | 1,165 (87.3) | 19.5 | 0.95 (0.661.36) | 0.774 |
| Medication Dispensed | No. (%) | % Quit (Unadjusted) | OR (95% CI) | P Value |
|---|---|---|---|---|
| ||||
| Nicotine patch | 242 (53.8) | 18.6 | Referent | |
| Monotherapy with | ||||
| Varenicline | 36 (8.0) | 30.6 | 2.44 (1.484.05) | 0.001 |
| Short‐acting NRT | 34 (7.6) | 11.8 | 0.66 (0.510.85) | 0.001 |
| Buproprion | 55 (12.2) | 21.8 | 1.05 (0.671.62) | 0.843 |
| Combination therapy | 85 (18.9) | 15.7 | 0.94 (0.711.24) | 0.645 |
Association of Treatment With Study Medications and Quitting Smoking
In adjusted analyses, the odds of quitting smoking at 6 to 12 months were not greater among patients who were dispensed a study medication within 90 days of discharge (odds ratio [OR]: 0.88, 95% confidence interval [CI]: 0.74‐1.04). We found no association between counseling provided at discharge and smoking cessation (OR: 0.95, 95% CI: 0.0.66‐1.), adjusted for the receipt of medications. There was no difference in quit rate between patients dispensed medication within 48 hours of discharge, or between patients treated in the year prior to admission and again postdischarge (Table 2).
We then assessed differences in effectiveness between specific medications among the 450 patients who were dispensed medications. Using nicotine patch alone as the referent group, patients treated with varenicline demonstrated greater odds of smoking cessation (OR: 2.44, 95% CI: 1.48‐4.05). Patients treated with short‐acting NRT alone were less likely to report smoking cessation (OR: 0.66, 95% CI: 0.51‐0.85). Patients treated with buproprion or combination therapy were no more likely to report cessation (Table 3). When sensitivity analysis was performed using propensity score matching with additional variables included, there were no significant differences in the observed associations.
Our overall mortality rate observed at 1 year was 19.5%, nearly identical to previous cohort studies of patients admitted for COPD.[19, 20] Because of the possibility of behavioral differences on the part of patients and physicians regarding subjects with a limited life expectancy, we performed sensitivity analysis limited to the patients who survived to at least 12 months of follow‐up. One hundred six patients (7.9%) died during 6 to 12 months of follow‐up. There was no change in inference for our primary exposure (OR: 0.95, 95% CI: 0.79‐1.14) or any of the secondary exposures examined.
DISCUSSION
In this observational study, postdischarge pharmacotherapy within 90 days of discharge was provided to a minority of high‐risk smokers admitted for COPD, and was not associated with smoking cessation at 6 to 12 months. In comparison to nicotine patch alone, varenicline was associated with a higher odds of cessation, with decreased odds of cessation among patients treated with short‐acting NRT alone. The overall quit rate was significant at 19.8%, and is consistent with annual quit rates observed among patients with COPD in other settings,[21, 22] but is far lower than quit rates observed after admission for acute myocardial infarction.[23, 24, 25] Although the proportion of patients treated at the time of discharge or within 90 days was low, our findings are in keeping with previous studies, which demonstrated low rates of pharmacologic treatment following hospitalization, averaging 14%.[26] Treatment for tobacco use is likely underutilized for this group of high‐risk smokers. However, a significant proportion of patients who were prescribed medications in the postdischarge period did not have medications filled. This likely reflects both the rapid changes in motivation that characterize quit attempts,[27] as well as efforts on the part of primary care physicians to make these medications available to facilitate future quit attempts.
There are several possible explanations for the findings in our study. Pharmaceutical therapies were not provided at random. The provision of pharmacotherapy and the ultimate success of a quit attempt reflects a complex interaction of patient beliefs concerning medications, level of addiction and motivation, physician behavior and knowledge, and organizational factors. Organizational factors such as the structure of electronic discharge orders and the availability of decision support materials may influence a physician's likelihood of prescribing medications, the choice of medication prescribed, and therefore the adequacy of control of withdrawal symptoms. NRT is often under dosed to control ongoing symptoms,[28] and needs to be adjusted until relief is obtained, providing an additional barrier to effectiveness during the transition out of the hospital. Because most smokers with COPD are highly addicted to nicotine,[29] high‐dose NRT, combination therapy, or varenicline would be necessary to adequately control symptoms.[30] However, a significant minority of patients received short‐acting NRT alone.
Despite a high observed efficacy in recent trials,[31, 32] few subjects in our study received varenicline. This may be related to both secular trends and administrative barriers to the use of varenicline in the VA system. Use of this medication was limited among patients with psychiatric disorders due to safety concerns. These concerns have since been largely disproven, but may have limited access to this medication.[33, 34, 35] Although we adjusted for a history of mental illness, patients who received varenicline may have had more past quit attempts and less active mental illness, which may be associated with improved cessation rates. Despite the high prevalence of mental illness we observed, this is typical of the population of smokers, with studies indicating nearly one‐third of smokers overall suffer from mental illness.[36]
Although the majority of our patients received a brief, nurse‐based counseling intervention, there is considerable concern about the overall effectiveness of a single predischarge interaction to produce sustained smoking cessation among highly addicted smokers.[37, 38, 39, 40] The Joint Commission has recently restructured the requirements for smoking cessation treatment for hospitalized patients, and it is now up to hospitals to implement treatment mechanisms that not only meet the national requirements, but also provide a meaningful clinical effect. Though the optimum treatment for hospitalized smokers with COPD is unknown, previous positive studies of smoking cessation among hospitalized patients underscore the need for a higher‐intensity counseling intervention that begins during hospitalization and continues after discharge.[13, 41] Cessation counseling services including tobacco cessation groups and quit lines are available through the VA; however, the use of these services is typically low and requires the patient to enroll independently after discharge, an additional barrier. The lack of association between medications and smoking cessation found in our study could reflect poor effectiveness of medications in the absence of a systematic counseling intervention. Alternatively, the association may be explained that patients who were more highly addicted and perhaps less motivated to quit received tobacco cessation medications more often, but were also less likely to stop tobacco use, a form of indication bias.
Our study has several limitations. We do not have addiction or motivation levels for a cessation attempt, a potential unmeasured confounder. Although predictive of quit attempts, motivation factors are less predictive of cessation maintenance, and may therefore have an unclear effect on our outcome.[42, 43] Our outcome was gathered as part of routine clinical care, which may have introduced bias if patients over‐reported cessation because of social desirability. In healthcare settings, however, this form of assessing smoking status is generally valid.[44] Exposure to counseling or medications obtained outside of the VA system would not have been captured. Given the financial incentive, we believe it is unlikely that many patients admitted to a VA medical center obtained medications elsewhere.[45] The diagnosis of COPD was made administratively. However, all subjects were admitted for an exacerbation, which is associated with more severe COPD by Global Initiative for Obstructive Lung Disease (GOLD) stage.[46] Patients with more severe COPD are often excluded from studies of smoking cessation due to concerns of high dropout and lower prevalence of smoking among patients with GOLD stage IV disease,[47, 48] making this a strength of our study. Subjects who died may have quit only in extremis, or failed to document their quit attempts. However, our sensitivity analysis limited to survivors did not change the study results. There may have been some misclassification in the use of buproprion, which may also be prescribed as an antidepressant. Finally, although representative of the veterans who seek care within the VISN‐20, our patients were primarily white and male, limiting the ability to generalize outside of this group.
Our study had several strengths. We examined a large cohort of patients admitted to a complete care organization, including patients from a diverse group of VA settings comprising academically and nonacademically affiliated centers. We performed an unbiased collection of patients, including all smokers discharged for COPD. We had access to excellent completeness of medications prescribed and filled as collected within the VA system, enabling us to observe medications dispensed and prescribed at several time points. We also had near complete ascertainment of outcomes including by using natural language processing with manual confirmation of smoking status.
In summary, we found that provision of medications to treat ongoing tobacco use among patients discharged for COPD was low, and receipt of medications was not associated with a reduction in smoking tobacco at 6 to 12 months postdischarge. However, among those treated, varenicline appears to be superior to the nicotine patch, with short‐acting nicotine replacement potentially less effective, a biologically plausible finding. The motivation to quit smoking changes rapidly over time. Providing these medications in the hospital and during the time after discharge is a potential means to improve quit rates, but medications need to be paired with counseling to be most effective. Collectively, these data suggest that systems‐based interventions are needed to increase the availability of intense counseling and the use of tailored pharmacotherapy to these patients.
Acknowledgements
The authors acknowledge Mr. Robert Plumley, who performed the data extraction and natural language processing necessary to complete this project.
Disclosures: Dr. Melzer conceived of the research question and performed background reading, analyses, primary drafting, and final revision of the manuscript. Drs. Collins and Feemster participated in finalizing the research question, developing the cohort, performing data collection, and revising the manuscript. Dr. Au provided the database for analysis, helped finalize the research question, and assisted in interpretation of the data and revision of the manuscript. Dr. Au has personally reviewed the data, understands the statistical methods employed, and confirms an understanding of this analysis, that the methods are clearly described, and that they are a fair way to report the results. This material is based upon work supported in part by the Department of Veterans Affairs, Veterans Health Administration, Office of Research and Development, who provided access to data, office space, and programming and data management. The views expressed in this article are those of the authors and do not necessarily reflect the position or policy of the Department of Veterans Affairs, the United States government, or the National Institutes of Health. Dr. Au is an unpaid research consultant for Analysis Group. None of the other authors have any conflicts of interest to disclose. Dr. Melzer is supported by an institutional F‐32 (HL007287‐36) through the University of Washington Department of Pulmonary and Critical Care. Dr. Feemster is supported by an National Institutes of Health, National Heart, Lung, and Blood Institute, K23 Mentored Career Development Award (HL111116). Partial support of this project was provided by Gilead Sciences with research funding to the Seattle Institute for Biomedical and Clinical Research. Additional support was received through the VA Health Services Research and Development. A portion of this work was presented in abstract form at the American Thoracic Society International Meeting, May 2015, in Denver, Colorado.
- , , , , , . Patients hospitalized for COPD have a high prevalence of modifiable risk factors for exacerbation (EFRAM study). Eur Respir J. 2000;16(6):1037–1042.
- , , , et al. Analysis of hospitalizations for COPD exacerbation: opportunities for improving care. COPD. 2010;7(2):85–92.
- , , , . Mortality in COPD: role of comorbidities. Eur Respir J. 2006;28(6):1245–1257.
- , , , . Cardiovascular comorbidity in COPD: systematic literature review. Chest. 2013;144(4):1163–1178.
- . Engaging patients and clinicians in treating tobacco addiction. JAMA Intern Med. 2014;174(8):1299–1300.
- , . Smokers who are hospitalized: a window of opportunity for cessation interventions. Prev Med. 1992;21(2):262–269.
- , , , . Interventions for smoking cessation in hospitalised patients. Cochrane Database Syst Rev. 2012;5:CD001837.
- Specifications Manual for National Hospital Inpatient Quality Measures. Available at: http://www.jointcommission.org/specifications_manual_for_national_hospital_inpatient_quality_measures.aspx. Accessed January 15, 2015.
- Treating Tobacco Use and Dependence. April 2013. Agency for Healthcare Research and Quality, Rockford, MD. Available at: http://www.ahrq.gov/professionals/clinicians‐providers/guidelines‐recommendations/tobacco/clinicians/update/index.html. Accessed January 15, 2015.
- , , , . Smoking cessation advice rates in US hospitals. Arch Intern Med. 2011;171(18):1682–1684.
- , , , et al. Validating smoking data from the Veteran's Affairs Health Factors dataset, an electronic data source. Nicotine Tob Res. 2011;13(12):1233–1239.
- , , , et al. Do u smoke after txt? Results of a randomised trial of smoking cessation using mobile phone text messaging. Tob Control. 2005;14(4):255–261.
- , , , . The effectiveness of smoking cessation groups offered to hospitalised patients with symptoms of exacerbations of chronic obstructive pulmonary disease (COPD). Clin Respir J. 2008;2(3):158–165.
- , , , et al. Sustained care intervention and postdischarge smoking cessation among hospitalized adults: a randomized clinical trial. JAMA. 2014;312(7):719–728.
- , , , et al. Bupropion for smokers hospitalized with acute cardiovascular disease. Am J Med. 2006;119(12):1080–1087.
- , , . Adapting a clinical comorbidity index for use with ICD‐9‐CM administrative databases. J Clin Epidemiol. 1992;45(6):613–619.
- . Multiple Imputation for Nonresponse in Surveys. New York, NY: Wiley; 1987.
- , , , et al. Methods for constructing and assessing propensity scores. Health Serv Res. 2014;49(5):1701–1720.
- , , . Mortality and mortality‐related factors after hospitalization for acute exacerbation of COPD. Chest. 2003;124(2):459–467.
- , , , et al. Mortality after hospitalization for COPD. Chest. 2002;121(5):1441–1448.
- , , , , , . State quitlines and cessation patterns among adults with selected chronic diseases in 15 states, 2005–2008. Prev Chronic Dis. 2012;9(10):120105.
- , , . The effects of counseling on smoking cessation among patients hospitalized with chronic obstructive pulmonary disease: a randomized clinical trial. Int J Addict. 1991;26(1):107–119.
- , , , et al. Predictors of smoking cessation after a myocardial infarction: the role of institutional smoking cessation programs in improving success. Arch Intern Med. 2008;168(18):1961–1967.
- , , , , , . Post‐myocardial infarction smoking cessation counseling: associations with immediate and late mortality in older Medicare patients. Am J Med. 2005;118(3):269–275.
- , , , . Smoking cessation after acute myocardial infarction: effects of a nurse‐‐managed intervention. Ann Intern Med. 1990;113(2):118–123.
- , , , et al. Smoking care provision in hospitals: a review of prevalence. Nicotine Tob Res. 2008;10(5):757–774.
- , , , . Intentions to quit smoking change over short periods of time. Addict Behav. 2005;30(4):653–662.
- , , , , . Association of amount and duration of NRT use in smokers with cigarette consumption and motivation to stop smoking: a national survey of smokers in England. Addict Behav. 2015;40(0):33–38.
- , . Smoking prevalence, behaviours, and cessation among individuals with COPD or asthma. Respir Med. 2011;105(3):477–484.
- , , , et al. American College of Chest Physicians. Tobacco Dependence Treatment ToolKit. 3rd ed. Available at: http://tobaccodependence.chestnet.org. Accessed January 29, 2015.
- , , , , , . Effects of varenicline on smoking cessation in patients with mild to moderate COPD: a randomized controlled trial. Chest. 2011;139(3):591–599.
- , , , et al. Varenicline versus transdermal nicotine patch for smoking cessation: results from a randomised open‐label trial. Thorax. 2008;63(8):717–724.
- , , , , . Psychiatric adverse events in randomized, double‐blind, placebo‐controlled clinical trials of varenicline. Drug Saf. 2010;33(4):289–301.
- . Studies linking smoking‐cessation drug with suicide risk spark concerns. JAMA. 2009;301(10):1007–1008.
- , , , et al. A randomized, double‐blind, placebo‐controlled study evaluating the safety and efficacy of varenicline for smoking cessation in patients with schizophrenia or schizoaffective disorder. J Clin Psychiatry. 2012;73(5):654–660.
- , , . Smoking and mental illness: results from population surveys in Australia and the United States. BMC Public Health. 2009;9(1):285.
- , , , . Implementation and effectiveness of a brief smoking‐cessation intervention for hospital patients. Med Care. 2000;38(5):451–459.
- , , , et al. Clinical trial comparing nicotine replacement therapy (NRT) plus brief counselling, brief counselling alone, and minimal intervention on smoking cessation in hospital inpatients. Thorax. 2003;58(6):484–488.
- , , , et al. Dissociation between hospital performance of the smoking cessation counseling quality metric and cessation outcomes after myocardial infarction. Arch Intern Med. 2008;168(19):2111–2117.
- , , , , . Smoking cessation in hospitalized patients: Results of a randomized trial. Arch Intern Med. 1997;157(4):409–415.
- , , , , . Intensive smoking cessation counseling versus minimal counseling among hospitalized smokers treated with transdermal nicotine replacement: a randomized trial. Am J Med. 2003;114(7):555–562.
- , , , et al. Motivational factors predict quit attempts but not maintenance of smoking cessation: findings from the International Tobacco Control Four country project. Nicotine Tob Res. 2010;12(suppl):S4–S11.
- , , , , . Predictors of attempts to stop smoking and their success in adult general population samples: a systematic review. Addiction. 2011;106(12):2110–2121.
- , , , et al. Validity of self‐reported smoking status among participants in a lung cancer screening trial. Cancer Epidemiol Biomarkers Prev. 2006;15(10):1825–1828.
- , , , . VHA enrollees' health care coverage and use of care. Med Care Res Rev. 2003;60(2):253–67.
- , , , , . Association between lung function and exacerbation frequency in patients with COPD. Int J Chron Obstruct Pulmon Dis. 2010;5:435–444.
- , , , et al. Smoking cessation in patients with chronic obstructive pulmonary disease: a double‐blind, placebo‐controlled, randomised trial. Lancet. 2001;357(9268):1571–1575.
- , , . Nurse‐conducted smoking cessation in patients with COPD using nicotine sublingual tablets and behavioral support. Chest. 2006;130(2):334–342.
© 2015 Society of Hospital Medicine
