User login
Causes and Rates of Unplanned Readmissions After Elective Primary Total Joint Arthroplasty: A Systematic Review and Meta-Analysis
Total joint arthroplasty (TJA) is a clinically effective, cost-effective treatment for symptomatic arthritis.1,2 After TJA, patients report reduced pain, restored range of motion, high satisfaction, and ability to return to a more active lifestyle.3-7 The number of total hip arthroplasties (THAs) performed in the United States is expected to reach 572,000 by 2030, a 174% increase, and the number of total knee arthroplasties (TKAs) 3.5 million, nearly a 7-fold increase.8,9 Since 2005, the cost of THA has risen more than 4 times, to $13.43 billion, and the cost of TKA has risen more than 5 times, to $40.8 billion.8,9 Given the demand and price tag, TJA is the single largest cost in the Medicare budget.10
Given its potential to improve care and reduce costs, reducing readmission rates in the surgical setting is a priority for physicians and policymakers.11 Readmissions for TJA are highly scrutinized as a performance indicator—the Centers for Medicare & Medicaid Services (CMS) started including them in its readmissions penalty program in 2013—and were recently validated as a measure of surgical quality.12-14 Accurate assessments of readmissions after TJA are unclear, with rates ranging from 1% to 8.5% between 7 and 90 days after surgery.2,15-17 The early success of TJA as an elective (and more frequently outpatient) procedure has paradoxically translated to less tolerance for readmissions. Post-TJA complications resulting in readmission are subject to financial penalties, and there is an implicit judgment of inadequate surgical management.12
Not only is the readmission rate poorly characterized, but there is no consensus on the leading reasons for readmissions after primary elective unilateral TJAs. The range of rates, reasons, and follow-up periods reported in the literature is wide.18,19 CMS plans to monitor readmissions over 7 to 90 days after surgery (the period depends on the complication), whereas a significant portion of the orthopedic literature documents 90-day rates.19 In 2012, the Yale New Haven Health Services Corporation/Center for Outcomes Research and Evaluation prepared for CMS a comprehensive report identifying rates of post-TJA complications and readmissions.20 The report, however, is limited to US hospitals and Medicare patients and therefore may overstate the rates, given this population’s documented comorbidities and the reimbursement variations between Medicare and commercial insurance.21 Lack of consensus on readmissions after primary elective unilateral TJAs requires that we synthesize available data to answer several questions: What is the overall readmission rate 30 and 90 days after TJA? What are the primary reasons for readmission 30 and 90 days after TJA? What are the cause-specific readmission rates? We performed a systematic review and a meta-analysis to answer these questions and to add clarity to the literature in order to help guide policy.
Materials and Methods
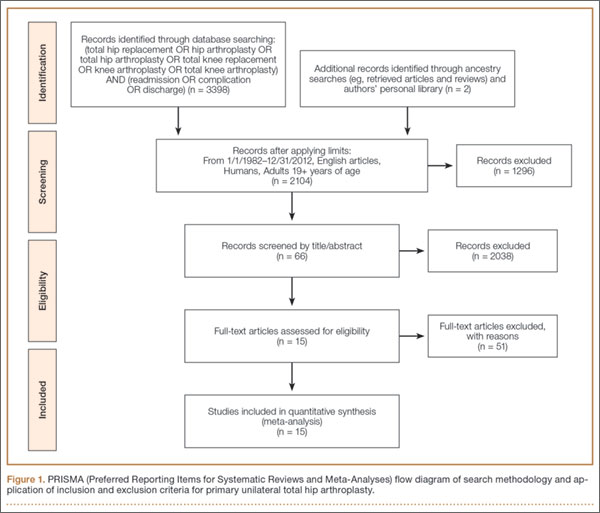
We performed a systematic review in accordance with PRISMA (Preferred Reporting Items for Systematic Reviews and Meta-Analyses) guidelines.22 Two reviewers independently completed structured searches of the Medline and Cochrane Central Register of Controlled Trials databases. Search terms were: (total hip replacement OR hip arthroplasty OR total hip arthroplasty OR total knee replacement OR knee arthroplasty OR total knee arthroplasty) AND (readmission OR complication OR discharge). They updated the search June 1, 2013. Four limits were applied: publication between January 1, 1982 and December 12, 2012; human subjects only; age 19+ years; and English-language articles. Study eligibility was determined by using standardized criteria as defined by the inclusion and exclusion criteria described in 3 stages: title review, abstract review, and full-article review. The reviewers also performed ancestry searches, including searches for major review articles and bibliographies of all retrieved studies, to identify additional studies not identified in the keyword searches. Discrepancies were resolved by author consensus.
Inclusion criteria were original studies that presented level I to III evidence and that were identified in structured online searches; published in English between January 1, 1982 and December 31, 2012; involved patients older than 19 years; and reported both readmission rates and reasons at follow-up 30 or 90 days after elective primary unilateral TJA, regardless of indication. Exclusion criteria were studies that reported data from hip fracture, knee fracture, and pelvis fracture cases; those that reported data from hemiarthroplasty, Birmingham hip resurfacing procedures, other resurfacing procedures, simultaneous bilateral hip or knee arthroplasties, unicompartmental knee arthroplasty, patellofemoral arthroplasty, metastatic or bone cancer, or revision hip or knee arthroplasty; those that did not report extractable reasons for readmission; those that reported complications but did not specify readmission rates; and those that reported readmission data only from after the 90-day follow-up window. In cases in which multiple studies reported data from the same patient population, only the largest or most recent report was used.
Two reviewers extracted the quantitative data from eligible studies. The 2 primary outcomes of interests were all-cause readmission rates, and reasons for readmission 30 and 90 days after TJA. Other extracted data were evidence level; publication journal, year, and country; data source (academic institution, Medicare); study design; number of patients; patient characteristics; surgical approach; follow-up period; overall readmission rate; anticoagulant use; tourniquet use; and compression stocking use. In addition, all post-TJA readmissions were assumed to be unplanned, except for staged sequential bilateral arthroplasty for osteoarthritis (excluded from analysis).
Readmission reasons were divided into 4 major categories as defined by the literature and the authors: thromboembolic disease, joint-specific reasons, surgical site infection, and surgical sequelae. The diagnoses in these categories are listed in Table 1. Other extracted reasons were cardiac dysrhythmia and pneumonia.
![]()
In cases in which there were at least 2 comparable studies, a meta-analysis was performed to obtain pooled estimates of the proportion of patients readmitted at 30 or 90 days. We calculated a Higgins I2 measure for between-study heterogeneity and random-effects analysis, using the method of DerSimonian and Laird23 if I2 was greater than 0.5. Pooled estimates were obtained for both overall and cause-specific reasons for readmission for all reasons reported in at least 3 studies. Small-study or publication bias was assessed using funnel plot asymmetry when at least 5 studies were analyzed as recommended.24 The meta-analytic findings for both overall and cause-specific readmission are presented as pooled proportions with 95% confidence intervals (CIs). All meta-analyses were performed using Stata 10.0.
Results
Fifteen unique TJA studies (12 THA, 10 TKA) met the criteria for the meta-analysis.20,25-38Figure 1 depicts the PRISMA flowchart for study identification.22
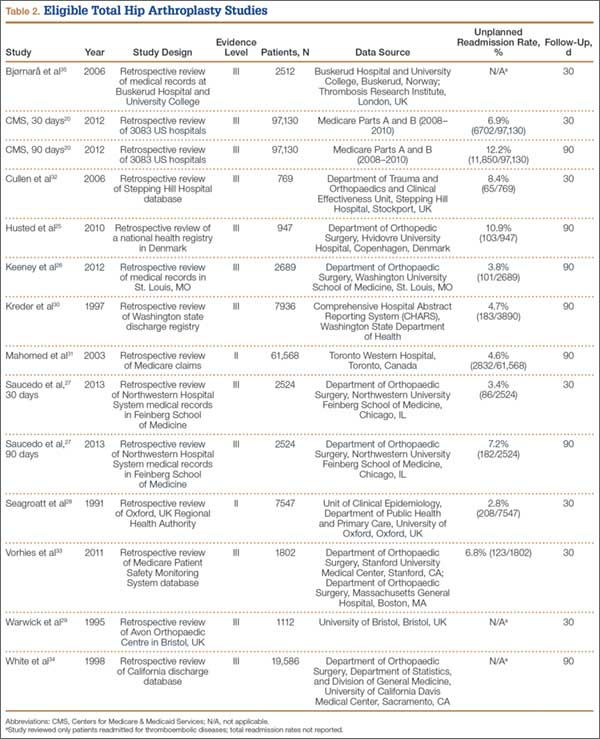
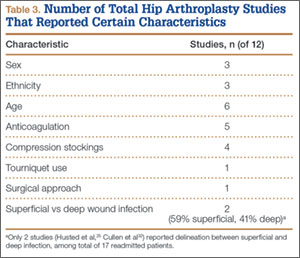
Of the 12 studies eligible for the THA analysis (Table 2), 6 were conducted in the United States,20,26,27,30,33,34 5 in Europe,25,28,29,32,35 and 1 in Canada.31 Seven of the 12 studies reported readmission rates at 30 days, and 7 reported rates at 90 days (2 reported rates at both follow-ups). We analyzed a total of 113,396 patients at the 30-day window and 192,380 patients at the 90-day window. Mean age was 74.2 years. The included studies were variable and sparse in their reporting of specific characteristics (Table 3).
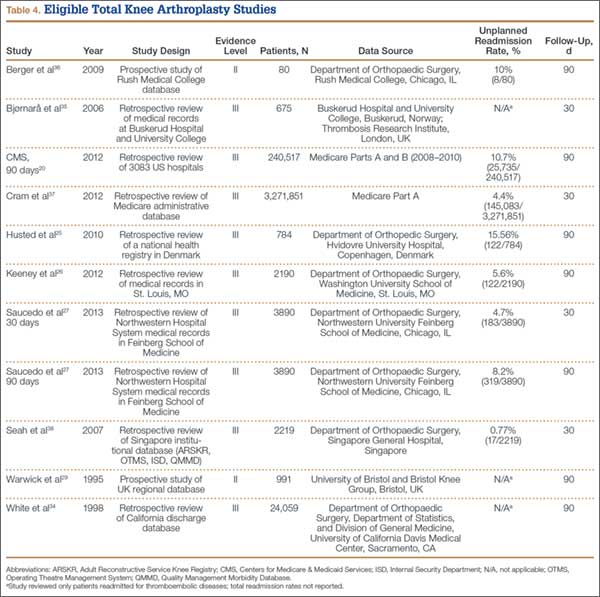
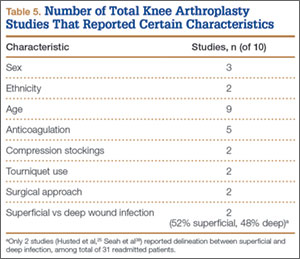
Of the 10 studies (2 prospective, 8 retrospective) eligible for the TKA analysis (Table 4), 6 were conducted in the United States,20,26,27,34,36,37 3 in Europe,25,29,35 and 1 in Asia.38 Four of the 10 studies reported readmission rates at 30 days, and 7 reported rates at 90 days (1 reported rates at both follow-ups).27 We analyzed a total of 3,278,635 patients at the 30-day window and 272,419 patients at the 90-day window. Mean age was 74.3 years. The included studies were quite variable and sparse in their reporting of specific characteristics (Table 5).
We performed random-effects meta-analyses of all unplanned readmissions at both 30 and 90 days (all I2s > 0.5). Among 5 THA studies that reported overall rates at 30 days,20,27,28,32,33 the estimated overall unplanned rate among the 120,272 index surgeries was 5.6% (95% CI, 3.2%-8.0%). Among 5 THA studies that reported overall rates at 90 days,20,25-27,31 the estimated overall unplanned rate among the 192,380 index surgeries was 7.7% (95% CI, 3.2%-12.2%) (I2 = 1.00). Among 3 TKA studies that reported overall rates at 30 days,27,37,38 the estimated overall unplanned rate among the 3,278,635 index surgeries was 3.3% (95% CI, 0.7%-5.9%). Among 5 TKA studies that reported overall rates at 90 days,20,25-27,36 the estimated overall unplanned rate among the 272,419 index surgeries was 9.7% (95% CI, 7.1%-12.4%) (I2 = 0.97).
30-Day Readmission Rates
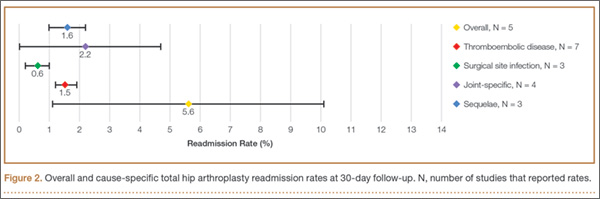
The most common reason for readmission 30 days after THA discharge was joint-specific. This reason accounted for 39.3% of all unplanned readmissions among studies that reported joint-specific causes, with an estimated pooled rate of 2.2% (95% CI, 0.0%-4.6%; P < .001; I2 = 1.00) among 4 studies. The second and third most common reasons were surgical sequelae (1.6%; 95% CI, 0.8%-2.5%; P < .001; I2 = 0.95) and thromboembolic disease (1.5%; 95% CI, 1.0%-1.9%; P < .001; I2 = 0.95). See Figure 2 for 30-day THA readmission rates. The fourth most common readmission reason was surgical site infection (0.6%; 95% CI, 0.2%-1.1%; P < .001; I2 = 0.94). Only these 4 reasons could be pooled, as cardiac dysrhythmia, pneumonia, and bleeding were reported in only 1 study each.
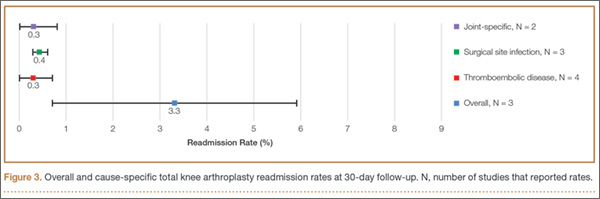
The most common reason for readmission 30 days after TKA discharge was surgical site infection. This reason accounted for 12.1% of all unplanned readmissions among studies that reported surgical site infections, with an estimated pooled rate of 0.4% (95% CI, 0.3%-0.6%; P < .001; I2 = 0.61) among 3 studies. The second and third most common reasons were joint-specific and thromboembolic disease, both occurring 0.3% of the time. Joint-specific reasons were reported in 2 studies (95% CI, 0.0%-0.8%; P = .259; I2 = 0.94). Thromboembolic disease was reported in 4 studies (95% CI, 0.0%-0.7%; P = .067; I2 = 0.98) (Figure 3). Only these 3 reasons could be pooled, as cardiac dysrhythmia, pneumonia, and “sequelae” were reported in only 1 study each.
90-Day Readmission Rates
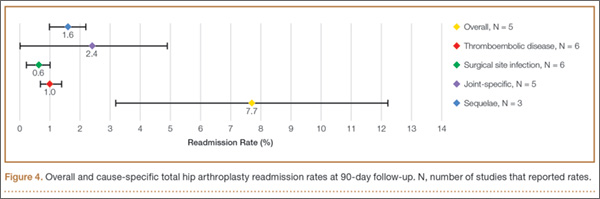
Consistent with the 30-day THA results, the most common reason for readmission 90 days after THA discharge was joint-specific. This reason accounted for 31.2% of all unplanned readmissions among studies that reported joint-specific causes, with an estimated pooled rate of 2.4% (95% CI, 0.0%-4.9%; P < .001; I2 = 1.00) among 5 studies. The second and third most common reasons were surgical sequelae (1.6%; 95% CI, 1.0%-2.2%; P < .003; I2 = 0.83) and thromboembolic disease (1.0%; 95% CI, 0.7%-1.4%; P < .001; I2 = 0.97). See Figure 4 for 90-day THA readmission rates. The fourth most common readmission reason was surgical site infection (0.6%; 95% CI, 0.2%-1.0%; P < .001; I2 = 0.99). Only these 4 reasons could be pooled, as cardiac dysrhythmia, pneumonia, and bleeding were reported by only 1 study each.
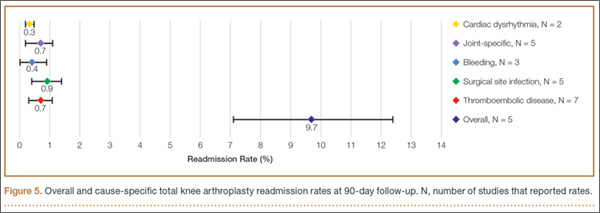
Consistent with the 30-day TKA results, the most common reason for readmission 90 days after TKA discharge was surgical site infection. This reason accounted for 9.3% of all unplanned readmissions among studies that reported surgical site infections, with an estimated pooled rate of 0.9% (95% CI, 0.4%-1.4%; P < .001; I2 = 0.93) among 5 studies. The second and third most common reasons were joint-specific and thromboembolic disease, both occurring 0.7% of the time. Joint-specific reasons were reported in 5 studies (95% CI, 0.2%-1.1%; P =.003; I2 = 0.94). Thromboembolic disease was reported in 7 studies (95% CI, 0.3%-1.1%; P < .001; I2 = 0.97) (Figure 5). Bleeding was reported in 3 studies, with a pooled rate of 0.4% (95% CI, 0.0%-0.9%; P = .128; I2 = 0.83). Cardiac dysrhythmia was reported in 2 studies, with an estimated pooled rate of 0.3% (95% CI, 0.2%-0.5%; P < .001). Only these 5 reasons could be pooled, as pneumonia and “sequelae” were reported in only 1 study each.
Discussion
This study is the first systematic review and meta-analysis of the literature to identify overall and cause-specific readmission rates after TJA.
For THA, 30- and 90-day readmission rates were 5.6% and 7.7%, respectively. Joint-specific causes were the most common reason for readmission at both 30 and 90 days after THA. For TKA, 30- and 90-day rates were 3.3% and 9.7%, respectively. Surgical site infection was the most common reason for readmission at both 30 and 90 days after TKA.
Hospital readmissions are an important area of scrutiny for Medicare and the health care systems broadly. Readmissions after surgery are deemed quality indicators potentially suggesting incomplete management of active issues and inadequate preparation for discharge.39 Unplanned readmissions also place a significant economic burden on Medicare: $17.5 billion in 2010.40 Given their association with quality of overall surgical care, improved readmission rates have the potential to improve the standard of care and reduce costs.
Higher readmission rates will significantly affect hospitals as CMS shifts to bundling payments for acute-care episodes, such as TJA.41-43 Further, private and public health care payers are increasingly using unplanned 30- and 90-day readmission rates as a marker of quality of care. However, there is little agreement about readmission rates and reasons, let alone what follow-up window should be used to define orthopedic readmissions. One study involving the MEDPAR (Medicare Provider Analysis and Review) database found that a common reason for readmission after major hip or knee surgery was “aftercare” for surgical sequelae (10.3%)15; another study found a 15% increase in post-THA hospitalizations, most commonly for a mechanical complication (joint-related).44 There are no prior complete systematic reviews or meta-analyses of overall rates of readmissions after primary unilateral TJAs, or of the reasons for these readmissions. The closest such report, the Yale report to CMS, was skewed to a proportion of US hospitals treating a population prone to significant comorbidities.20
Although the strength of this study lies in its rigorous identification and extraction of data, notable clarifications must be made when synthesizing the information. First, the definitions of various thromboembolic events varied greatly. Some studies reported deep vein thrombosis (DVT) and pulmonary embolism (PE) separately, whereas others reported only DVT or only PE. Some studies reported rates of readmission for “thromboembolic disorder,” and one25 reported rates for DVT, PE, and thromboembolic disorder. To pool these related events, we created a composite definition that included DVT, PE, and thromboembolic disorders, which we termed thromboembolic disease. We also created a composite measure for joint-specific reasons for readmission. This category included joint infection that definitely required reentry into the joint, but using this category may have led to underestimation of surgical site infection rates, which were defined separately. Third, there was significant variation in documentation of surgical site infection among the studies included in this review. Some studies specified superficial wounds, whereas others did not categorize complications as superficial, deep, or intracapsular, which would qualify as a “joint-specific” cause. Despite this variation, surgical site infection after TJA was found to be the most common reason for readmission.
Our systematic review and meta-analysis were limited, as any others are, by the quality of studies investigated. Few studies reported cause-specific rates and reasons for readmission. Given the small sample, formal tests for small-study or publication bias could not be performed. Some studies included tremendous amounts of data, and International Classification of Diseases, Ninth Revision (ICD-9) codes were used without physician review of readmission diagnoses. In the absence of oversight, many readmissions could have been misinterpreted and incorrectly logged, or simply miscoded. Saucedo and colleagues27,45 found that readmission diagnostic codes were often unverified. Numerous other studies corroborated this lack of correlation with physician-derived readmission diagnoses in just 25% of cases.46-54 Another study limitation is the unknown number of patients who had TJA but presented and were subsequently readmitted to a different hospital. Last, as this review included patients who had surgery performed within a 30-year period, it could not address the shifts in postoperative management that occurred in that time, particularly with respect to anticoagulation. This limitation was partially addressed in THA by dividing final studies into 3 decades. Of these studies, only 1 was from the first decade, 3 were from the second, and the rest were from the third. Of the 3 from the second decade, only the study by Warwick and colleagues29 (1995) explicitly did not use anticoagulation, but compression stockings were used, and consequently there was a 4.0% rate of readmission for thromboembolic disease alone, compared with the study by White and colleagues34 (1998), which explicitly used anticoagulation and boasted a 1.7% rate of readmission for thromboembolic disease. This isolated comparison illustrates the effect of routine anticoagulation and the changes in surgical standards over the 3 decades.
The numbers from this systematic review and meta-analysis represent an international benchmark for TJA as a procedure. Knowing the top reasons for readmission will lead to more focus on joint-related and medical issues (surgical site infection, thromboembolic disease) before discharge to avoid readmission after elective unilateral primary TJA. Although readmission rates have received attention in the United States as a primary means of combating soaring health care costs, knowing the rates for a common procedure applies broadly as an indicator for standard of care worldwide, according to the World Health Organization.55 This study is the first systematic review and meta-analysis of documented readmission rates and reasons for readmission to identify overall and cause-specific rates after TJA. The hope is that our findings will add clarity to the literature and help guide the decisions of physicians and policymakers.
Conclusion
Readmission rates are an increasingly important metric in the United States and around the world, yet there is no consensus regarding overall readmission rates and reasons for readmission after primary unilateral TJAs. Our systematic review and meta-analysis of the literature found overall unplanned readmission rates of 5.6% (30 days) and 7.7% (90 days) for THA and 3.3% (30 days) and 9.7% (90 days) for TKA. At both 30 and 90 days, the most common readmission reasons were joint-specific (THA) and surgical site infection (TKA). New investigations should be directed toward developing countermeasures to lower the rates of readmission.
1. Bozic KJ, Maselli J, Pekow PS, Lindenauer PK, Vail TP, Auerbach AD. The influence of procedure volumes and standardization of care on quality and efficiency in total joint replacement surgery. J Bone Joint Surg Am. 2010;92(16):2643-2652.
2. Cram P, Lu X, Kaboli PJ, et al. Clinical characteristics and outcomes of Medicare patients undergoing total hip arthroplasty, 1991–2001. JAMA. 2011;305(15):1560-1567.
3. de Vries LM, Sturkenboom MC, Verhaar JA, Kingma JH, Stricker BH. Complications after hip arthroplasty and the association with hospital procedure volume. Acta Orthop. 2011;82(5):545-552.
4. Mariconda M, Galasso O, Costa GG, Recano P, Cerbasi S. Quality of life and functionality after total hip arthroplasty: a long-term follow-up study. BMC Musculoskelet Disord. 2011;12:222.
5. Zmistowski B, Restrepo C, Hess J, Adibi D, Cangoz S, Parvizi J. Unplanned readmission after total joint arthroplasty: rates, reasons, and risk factors. J Bone Joint Surg Am. 2013;95(20):1869-1876.
6. Zhan C, Kaczmarek R, Loyo-Berrios N, Sangl J, Bright RA. Incidence and short-term outcomes of primary and revision hip replacement in the United States. J Bone Joint Surg Am. 2007;89(3):526-533.
7. Mancuso CA, Salvati EA, Johanson NA, Peterson MG, Charlson ME. Patients’ expectations and satisfaction with total hip arthroplasty. J Arthroplasty. 1997;12(4):387-396.
8. Kurtz SM, Ong KL, Schmier J, et al. Future clinical and economic impact of revision total hip and knee arthroplasty. J Bone Joint Surg Am. 2007;89(suppl 3):144-151.
9. Kurtz SM, Ong KL, Lau E, Mowat F, Halpern M. Projections of primary and revision hip and knee arthroplasty in the United States from 2005 to 2030. J Bone Joint Surg Am. 2007;89(4):780-785.
10. Bozic KJ, Rubash HE, Sculco TP, Berry DJ. An analysis of Medicare payment policy for total joint arthroplasty. J Arthroplasty. 2008;23(6 suppl 1):133-138.
11. Li LT, Mills WL, White DL, et al. Causes and prevalence of unplanned readmissions after colorectal surgery: a systematic review and meta-analysis. J Am Geriatr Soc. 2013;61(7):1175-1181.
12. Readmissions Reduction Program. Centers for Medicare & Medicaid Services website. http://www.cms.gov/Medicare/Medicare-Fee-for-Service-Payment/AcuteInpatientPPS/Readmissions-Reduction-Program.html. Accessed July 27, 2015.
13. Tsai TC, Joynt KE, Orav J, Gawande AA, Jha AK. Variation in surgical readmission rates and quality of hospital care. N Engl J Med. 2013;369(12):1134-1142.
14. Jencks SF, Williams MV, Coleman EA. Rehospitalizations among patients in the Medicare fee-for-service program [published correction appears in N Engl J Med. 2011;364(16):1582]. N Engl J Med. 2009;360(14):1418-1428.
15. Zmistowski B, Hozack WJ, Parvizi J. Readmission rates after total hip arthroplasty. JAMA. 2011;306(8):825.
16. Bini SA, Fithian DC, Paxton LW, Khatod MX, Inacio MC, Namba RS. Does discharge disposition after primary total joint arthroplasty affect readmission rates? J Arthroplasty. 2010;25(1):114-117.
17. Singh JA, Jensen MR, Harmsen WS, Gabriel SE, Lewallen DG. Cardiac and thromboembolic complications and mortality in patients undergoing total hip and total knee arthroplasty. Ann Rheum Dis. 2011;70(12):2082-2088.
18. Joynt KE, Jha AK. Thirty-day readmissions—truth and consequences. N Engl J Med. 2012;366(15):1366-1369.
19. Atkinson JG. Flaws in the Medicare readmission penalty. N Engl J Med. 2012;367(21):2056-2057.
20. Grosso LM, Curtis JP, Lin Z, et al. Hospital-level Risk-Standardized Complication Rate Following Elective Primary Total Hip Arthroplasty (THA) And/Or Total Knee Arthroplasty (TKA): Measure Methodology Report. Report prepared for Centers for Medicare & Medicaid Services. QualityNet website. https://www.qualitynet.org/dcs/ContentServer?c=Page&pagename=QnetPublic%2FPage%2FQnetTier4&cid=1228772504368. Submitted June 25, 2012. Accessed August 4, 2015.
21. Robinson JC. Analysis of Medicare and commercial insurer–paid total knee replacement reveals opportunities for cost reduction. Health Care Incentives Improvement Institute website. http://www.hci3.org/sites/default/files/files/HCI-2012-IssueBrief-L6-2.pdf. Published 2012. Accessed July 27, 2015.
22. Moher D, Liberati A, Tetzlaff J, Altman DG; PRISMA Group. Preferred reporting items for systematic reviews and meta-analyses: the PRISMA statement. PLoS Med. 2009;6(7):e1000097.
23. DerSimonian R, Laird N. Meta-analysis in clinical trials. Control Clin Trials. 1986;7(3):177-188.
24. Higgins JP, Thompson SG. Quantifying heterogeniety in a meta-analysis. Stat Med. 2002;21(11):1539-1558.
25. Husted H, Otte KS, Kristensen BB, Orsnes T, Kehlet H. Readmissions after fast-track hip and knee arthroplasty. Arch Orthop Trauma Surg. 2010;130(9):1185-1191.
26. Keeney JA, Adelani MA, Nunley RM, Clohisy JC, Barrack RL. Assessing readmission databases: how reliable is the information? J Arthroplasty. 2012;27(8 suppl):72-76.e1-e2.
27. Saucedo JM, Marecek GS, Wanke TR, Lee J, Stulberg SD, Puri L. Understanding readmissions after primary total hip and knee arthroplasty: who’s at risk? J Arthroplasty. 2014;29(2):256-260.
28. Seagroatt V, Tan HS, Goldacre M, Bulstrode C, Nugent I, Gill L. Elective total hip replacement: incidence, emergency readmission rate, and postoperative mortality. BMJ. 1991;303(6815):1431-1435.
29. Warwick D, Williams MH, Bannister GC. Death and thromboembolic disease after total hip replacement. A series of 1162 cases with no routine chemical prophylaxis. J Bone Joint Surg Br. 1995;77(1):6-10.
30. Kreder HJ, Deyo RA, Koepsell T, Swiontkowski MF, Kreuter W. Relationship between the volume of total hip replacements performed by providers and the rates of postoperative complications in the state of Washington. J Bone Joint Surg Am. 1997;79(4):485-494.
31. Mahomed NN, Barrett JA, Katz JN, et al. Rates and outcomes of primary and revision total hip replacement in the United States Medicare population. J Bone Joint Surg Am. 2003;85(1):27-32.
32. Cullen C, Johnson DS, Cook G. Re-admission rates within 28 days of total hip replacement. Ann R Coll Surg Engl. 2006;88(5):475-478.
33. Vorhies JS, Wang Y, Herndon J, Maloney WJ, Huddleston JI. Readmission and length of stay after total hip arthroplasty in a national Medicare sample. J Arthroplasty. 2011;26(6 suppl):119-123.
34. White RH, Romano PS, Zhou H, Rodrigo J, Bargar W. Incidence and time course of thromboembolic outcomes following total hip or knee arthroplasty. Arch Intern Med. 1998;158(14):1525-1531.
35. Bjørnarå BT, Gudmundsen TE, Dahl OE. Frequency and timing of clinical venous thromboembolism after major joint surgery. J Bone Joint Surg Br. 2006;88(3):386-391.
36. Berger RA, Kusuma SK, Sanders SA, Thill ES, Sporer SM. The feasibility and perioperative complications of outpatient knee arthroplasty. Clin Orthop Relat Res. 2009;467(6):1443-1449.
37. Cram P, Lu X, Kates SL, Singh JA, Li Y, Wolf BR. Total knee arthroplasty volume, utilization, and outcomes among Medicare beneficiaries, 1991–2010. JAMA. 2012;308(12):1227-1236.
38. Seah VW, Singh G, Yang KY, Yeo SJ, Lo NN, Seow KH. Thirty-day mortality and morbidity after total knee arthroplasty. Ann Acad Med Singapore. 2007;36(12):1010-1012.
39. Learmonth ID, Young C, Rorabeck C. The operation of the century: total hip replacement. Lancet. 2007;370(9597):1508-1519.
40. The Revolving Door: A Report on U.S. Hospital Readmissions. An Analysis of Medicare Data by the Dartmouth Atlas Project. Stories From Patients and Health Care Providers by PerryUndem Research & Communication. Robert Wood Johnson Foundation. http://www.rwjf.org/content/dam/farm/reports/reports/2013/rwjf404178. Published February 2013. Accessed July 27, 2015.
41. Riggs RV, Roberts PS, Aronow H, Younan T. Joint replacement and hip fracture readmission rates: impact of discharge destination. PM R. 2010;2(9):806-810.
42. Bosco JA 3rd, Karkenny AJ, Hutzler LH, Slover JD, Iorio R. Cost burden of 30-day readmissions following Medicare total hip and knee arthroplasty. J Arthroplasty. 2014;29(5):903-905.
43. McCormack R, Michels R, Ramos N, Hutzler L, Slover JD, Bosco JA. Thirty-day readmission rates as a measure of quality: causes of readmission after orthopedic surgeries and accuracy of administrative data. J Healthc Manag. 2013;58(1):64-76.
44. Bohm ER, Dunbar MJ, Frood JJ, Johnson TM, Morris KA. Rehospitalizations, early revisions, infections, and hospital resource use in the first year after hip and knee arthroplasties. J Arthroplasty. 2012;27(2)232-237.
45. Saucedo J, Marecek GS, Lee J, Huminiak L, Stulberg SD, Puri L. How accurately are we coding readmission diagnoses after total joint arthroplasty? J Arthroplasty. 2013;28(7):1076-1079.
46. Schairer WW, Sing DC, Vail TP, Bozic KJ. Causes and frequency of unplanned hospital readmission after total hip arthroplasty. Clin Orthop Relat Res. 2014;472(2):464-470.
47. Bozic KJ, Chiu VW, Takemoto SK, et al. The validity of using administrative claims data in total joint arthroplasty outcomes research. J Arthroplasty. 2010;25(6 suppl):58-61.
48. Cram P, Ibrahim SA, Lu X, Wolf BR. Impact of alternative coding schemes on incidence rates of key complications after total hip arthroplasty: a risk-adjusted analysis of a national data set. Geriatr Orthop Surg Rehabil. 2012;3(1):17-26.
49. Lawson EH, Louie R, Zingmond DS, et al. A comparison of clinical registry versus administrative claims data for reporting of 30-day surgical complications. Ann Surg. 2012;256(6):973-981.
50. Cima RR, Lackore KA, Nehring SA, et al. How best to measure surgical quality? Comparison of the Agency for Healthcare Research and Quality Patient Safety Indicators (AHRQ-PSI) and the American College of Surgeons National Surgical Quality Improvement Program (ACS-NSQIP) postoperative adverse events at a single institution. Surgery. 2011;150(5):943-949.
51. Steinberg SM, Popa MR, Michalek JA, Bethel MJ, Ellison EC. Comparison of risk adjustment methodologies in surgical quality improvement. Surgery. 2008;144(4):662-667.
52. Baron JA, Barrett J, Katz JN, Liang MH. Total hip arthroplasty: use and select complications in the US Medicare population. Am J Public Health. 1996;86(1):70-72.
53. HCUPnet. Healthcare Cost and Utilization Project. Agency for Healthcare Research and Quality website. http://hcupnet.ahrq.gov. Accessed July 27, 2015.
54. Singh JA. Epidemiology of knee and hip arthroplasty: a systematic review. Open Orthop J. 2011;5:80-85.
55. Parker SG. Do Current Discharge Arrangements From Inpatient Hospital Care for the Elderly Reduce Readmission Rates, the Length of Inpatient Stay or Mortality, or Improve Health Status? Health Evidence Network report. Copenhagen, Denmark: World Health Organization Regional Office for Europe; 2005. http://www.euro.who.int/__data/assets/pdf_file/0006/74670/E87542.pdf. Accessed July 27, 2015.
Total joint arthroplasty (TJA) is a clinically effective, cost-effective treatment for symptomatic arthritis.1,2 After TJA, patients report reduced pain, restored range of motion, high satisfaction, and ability to return to a more active lifestyle.3-7 The number of total hip arthroplasties (THAs) performed in the United States is expected to reach 572,000 by 2030, a 174% increase, and the number of total knee arthroplasties (TKAs) 3.5 million, nearly a 7-fold increase.8,9 Since 2005, the cost of THA has risen more than 4 times, to $13.43 billion, and the cost of TKA has risen more than 5 times, to $40.8 billion.8,9 Given the demand and price tag, TJA is the single largest cost in the Medicare budget.10
Given its potential to improve care and reduce costs, reducing readmission rates in the surgical setting is a priority for physicians and policymakers.11 Readmissions for TJA are highly scrutinized as a performance indicator—the Centers for Medicare & Medicaid Services (CMS) started including them in its readmissions penalty program in 2013—and were recently validated as a measure of surgical quality.12-14 Accurate assessments of readmissions after TJA are unclear, with rates ranging from 1% to 8.5% between 7 and 90 days after surgery.2,15-17 The early success of TJA as an elective (and more frequently outpatient) procedure has paradoxically translated to less tolerance for readmissions. Post-TJA complications resulting in readmission are subject to financial penalties, and there is an implicit judgment of inadequate surgical management.12
Not only is the readmission rate poorly characterized, but there is no consensus on the leading reasons for readmissions after primary elective unilateral TJAs. The range of rates, reasons, and follow-up periods reported in the literature is wide.18,19 CMS plans to monitor readmissions over 7 to 90 days after surgery (the period depends on the complication), whereas a significant portion of the orthopedic literature documents 90-day rates.19 In 2012, the Yale New Haven Health Services Corporation/Center for Outcomes Research and Evaluation prepared for CMS a comprehensive report identifying rates of post-TJA complications and readmissions.20 The report, however, is limited to US hospitals and Medicare patients and therefore may overstate the rates, given this population’s documented comorbidities and the reimbursement variations between Medicare and commercial insurance.21 Lack of consensus on readmissions after primary elective unilateral TJAs requires that we synthesize available data to answer several questions: What is the overall readmission rate 30 and 90 days after TJA? What are the primary reasons for readmission 30 and 90 days after TJA? What are the cause-specific readmission rates? We performed a systematic review and a meta-analysis to answer these questions and to add clarity to the literature in order to help guide policy.
Materials and Methods
We performed a systematic review in accordance with PRISMA (Preferred Reporting Items for Systematic Reviews and Meta-Analyses) guidelines.22 Two reviewers independently completed structured searches of the Medline and Cochrane Central Register of Controlled Trials databases. Search terms were: (total hip replacement OR hip arthroplasty OR total hip arthroplasty OR total knee replacement OR knee arthroplasty OR total knee arthroplasty) AND (readmission OR complication OR discharge). They updated the search June 1, 2013. Four limits were applied: publication between January 1, 1982 and December 12, 2012; human subjects only; age 19+ years; and English-language articles. Study eligibility was determined by using standardized criteria as defined by the inclusion and exclusion criteria described in 3 stages: title review, abstract review, and full-article review. The reviewers also performed ancestry searches, including searches for major review articles and bibliographies of all retrieved studies, to identify additional studies not identified in the keyword searches. Discrepancies were resolved by author consensus.
Inclusion criteria were original studies that presented level I to III evidence and that were identified in structured online searches; published in English between January 1, 1982 and December 31, 2012; involved patients older than 19 years; and reported both readmission rates and reasons at follow-up 30 or 90 days after elective primary unilateral TJA, regardless of indication. Exclusion criteria were studies that reported data from hip fracture, knee fracture, and pelvis fracture cases; those that reported data from hemiarthroplasty, Birmingham hip resurfacing procedures, other resurfacing procedures, simultaneous bilateral hip or knee arthroplasties, unicompartmental knee arthroplasty, patellofemoral arthroplasty, metastatic or bone cancer, or revision hip or knee arthroplasty; those that did not report extractable reasons for readmission; those that reported complications but did not specify readmission rates; and those that reported readmission data only from after the 90-day follow-up window. In cases in which multiple studies reported data from the same patient population, only the largest or most recent report was used.
Two reviewers extracted the quantitative data from eligible studies. The 2 primary outcomes of interests were all-cause readmission rates, and reasons for readmission 30 and 90 days after TJA. Other extracted data were evidence level; publication journal, year, and country; data source (academic institution, Medicare); study design; number of patients; patient characteristics; surgical approach; follow-up period; overall readmission rate; anticoagulant use; tourniquet use; and compression stocking use. In addition, all post-TJA readmissions were assumed to be unplanned, except for staged sequential bilateral arthroplasty for osteoarthritis (excluded from analysis).
Readmission reasons were divided into 4 major categories as defined by the literature and the authors: thromboembolic disease, joint-specific reasons, surgical site infection, and surgical sequelae. The diagnoses in these categories are listed in Table 1. Other extracted reasons were cardiac dysrhythmia and pneumonia.
![]()
In cases in which there were at least 2 comparable studies, a meta-analysis was performed to obtain pooled estimates of the proportion of patients readmitted at 30 or 90 days. We calculated a Higgins I2 measure for between-study heterogeneity and random-effects analysis, using the method of DerSimonian and Laird23 if I2 was greater than 0.5. Pooled estimates were obtained for both overall and cause-specific reasons for readmission for all reasons reported in at least 3 studies. Small-study or publication bias was assessed using funnel plot asymmetry when at least 5 studies were analyzed as recommended.24 The meta-analytic findings for both overall and cause-specific readmission are presented as pooled proportions with 95% confidence intervals (CIs). All meta-analyses were performed using Stata 10.0.
Results
Fifteen unique TJA studies (12 THA, 10 TKA) met the criteria for the meta-analysis.20,25-38Figure 1 depicts the PRISMA flowchart for study identification.22
Of the 12 studies eligible for the THA analysis (Table 2), 6 were conducted in the United States,20,26,27,30,33,34 5 in Europe,25,28,29,32,35 and 1 in Canada.31 Seven of the 12 studies reported readmission rates at 30 days, and 7 reported rates at 90 days (2 reported rates at both follow-ups). We analyzed a total of 113,396 patients at the 30-day window and 192,380 patients at the 90-day window. Mean age was 74.2 years. The included studies were variable and sparse in their reporting of specific characteristics (Table 3).
Of the 10 studies (2 prospective, 8 retrospective) eligible for the TKA analysis (Table 4), 6 were conducted in the United States,20,26,27,34,36,37 3 in Europe,25,29,35 and 1 in Asia.38 Four of the 10 studies reported readmission rates at 30 days, and 7 reported rates at 90 days (1 reported rates at both follow-ups).27 We analyzed a total of 3,278,635 patients at the 30-day window and 272,419 patients at the 90-day window. Mean age was 74.3 years. The included studies were quite variable and sparse in their reporting of specific characteristics (Table 5).
We performed random-effects meta-analyses of all unplanned readmissions at both 30 and 90 days (all I2s > 0.5). Among 5 THA studies that reported overall rates at 30 days,20,27,28,32,33 the estimated overall unplanned rate among the 120,272 index surgeries was 5.6% (95% CI, 3.2%-8.0%). Among 5 THA studies that reported overall rates at 90 days,20,25-27,31 the estimated overall unplanned rate among the 192,380 index surgeries was 7.7% (95% CI, 3.2%-12.2%) (I2 = 1.00). Among 3 TKA studies that reported overall rates at 30 days,27,37,38 the estimated overall unplanned rate among the 3,278,635 index surgeries was 3.3% (95% CI, 0.7%-5.9%). Among 5 TKA studies that reported overall rates at 90 days,20,25-27,36 the estimated overall unplanned rate among the 272,419 index surgeries was 9.7% (95% CI, 7.1%-12.4%) (I2 = 0.97).
30-Day Readmission Rates
The most common reason for readmission 30 days after THA discharge was joint-specific. This reason accounted for 39.3% of all unplanned readmissions among studies that reported joint-specific causes, with an estimated pooled rate of 2.2% (95% CI, 0.0%-4.6%; P < .001; I2 = 1.00) among 4 studies. The second and third most common reasons were surgical sequelae (1.6%; 95% CI, 0.8%-2.5%; P < .001; I2 = 0.95) and thromboembolic disease (1.5%; 95% CI, 1.0%-1.9%; P < .001; I2 = 0.95). See Figure 2 for 30-day THA readmission rates. The fourth most common readmission reason was surgical site infection (0.6%; 95% CI, 0.2%-1.1%; P < .001; I2 = 0.94). Only these 4 reasons could be pooled, as cardiac dysrhythmia, pneumonia, and bleeding were reported in only 1 study each.
The most common reason for readmission 30 days after TKA discharge was surgical site infection. This reason accounted for 12.1% of all unplanned readmissions among studies that reported surgical site infections, with an estimated pooled rate of 0.4% (95% CI, 0.3%-0.6%; P < .001; I2 = 0.61) among 3 studies. The second and third most common reasons were joint-specific and thromboembolic disease, both occurring 0.3% of the time. Joint-specific reasons were reported in 2 studies (95% CI, 0.0%-0.8%; P = .259; I2 = 0.94). Thromboembolic disease was reported in 4 studies (95% CI, 0.0%-0.7%; P = .067; I2 = 0.98) (Figure 3). Only these 3 reasons could be pooled, as cardiac dysrhythmia, pneumonia, and “sequelae” were reported in only 1 study each.
90-Day Readmission Rates
Consistent with the 30-day THA results, the most common reason for readmission 90 days after THA discharge was joint-specific. This reason accounted for 31.2% of all unplanned readmissions among studies that reported joint-specific causes, with an estimated pooled rate of 2.4% (95% CI, 0.0%-4.9%; P < .001; I2 = 1.00) among 5 studies. The second and third most common reasons were surgical sequelae (1.6%; 95% CI, 1.0%-2.2%; P < .003; I2 = 0.83) and thromboembolic disease (1.0%; 95% CI, 0.7%-1.4%; P < .001; I2 = 0.97). See Figure 4 for 90-day THA readmission rates. The fourth most common readmission reason was surgical site infection (0.6%; 95% CI, 0.2%-1.0%; P < .001; I2 = 0.99). Only these 4 reasons could be pooled, as cardiac dysrhythmia, pneumonia, and bleeding were reported by only 1 study each.
Consistent with the 30-day TKA results, the most common reason for readmission 90 days after TKA discharge was surgical site infection. This reason accounted for 9.3% of all unplanned readmissions among studies that reported surgical site infections, with an estimated pooled rate of 0.9% (95% CI, 0.4%-1.4%; P < .001; I2 = 0.93) among 5 studies. The second and third most common reasons were joint-specific and thromboembolic disease, both occurring 0.7% of the time. Joint-specific reasons were reported in 5 studies (95% CI, 0.2%-1.1%; P =.003; I2 = 0.94). Thromboembolic disease was reported in 7 studies (95% CI, 0.3%-1.1%; P < .001; I2 = 0.97) (Figure 5). Bleeding was reported in 3 studies, with a pooled rate of 0.4% (95% CI, 0.0%-0.9%; P = .128; I2 = 0.83). Cardiac dysrhythmia was reported in 2 studies, with an estimated pooled rate of 0.3% (95% CI, 0.2%-0.5%; P < .001). Only these 5 reasons could be pooled, as pneumonia and “sequelae” were reported in only 1 study each.
Discussion
This study is the first systematic review and meta-analysis of the literature to identify overall and cause-specific readmission rates after TJA.
For THA, 30- and 90-day readmission rates were 5.6% and 7.7%, respectively. Joint-specific causes were the most common reason for readmission at both 30 and 90 days after THA. For TKA, 30- and 90-day rates were 3.3% and 9.7%, respectively. Surgical site infection was the most common reason for readmission at both 30 and 90 days after TKA.
Hospital readmissions are an important area of scrutiny for Medicare and the health care systems broadly. Readmissions after surgery are deemed quality indicators potentially suggesting incomplete management of active issues and inadequate preparation for discharge.39 Unplanned readmissions also place a significant economic burden on Medicare: $17.5 billion in 2010.40 Given their association with quality of overall surgical care, improved readmission rates have the potential to improve the standard of care and reduce costs.
Higher readmission rates will significantly affect hospitals as CMS shifts to bundling payments for acute-care episodes, such as TJA.41-43 Further, private and public health care payers are increasingly using unplanned 30- and 90-day readmission rates as a marker of quality of care. However, there is little agreement about readmission rates and reasons, let alone what follow-up window should be used to define orthopedic readmissions. One study involving the MEDPAR (Medicare Provider Analysis and Review) database found that a common reason for readmission after major hip or knee surgery was “aftercare” for surgical sequelae (10.3%)15; another study found a 15% increase in post-THA hospitalizations, most commonly for a mechanical complication (joint-related).44 There are no prior complete systematic reviews or meta-analyses of overall rates of readmissions after primary unilateral TJAs, or of the reasons for these readmissions. The closest such report, the Yale report to CMS, was skewed to a proportion of US hospitals treating a population prone to significant comorbidities.20
Although the strength of this study lies in its rigorous identification and extraction of data, notable clarifications must be made when synthesizing the information. First, the definitions of various thromboembolic events varied greatly. Some studies reported deep vein thrombosis (DVT) and pulmonary embolism (PE) separately, whereas others reported only DVT or only PE. Some studies reported rates of readmission for “thromboembolic disorder,” and one25 reported rates for DVT, PE, and thromboembolic disorder. To pool these related events, we created a composite definition that included DVT, PE, and thromboembolic disorders, which we termed thromboembolic disease. We also created a composite measure for joint-specific reasons for readmission. This category included joint infection that definitely required reentry into the joint, but using this category may have led to underestimation of surgical site infection rates, which were defined separately. Third, there was significant variation in documentation of surgical site infection among the studies included in this review. Some studies specified superficial wounds, whereas others did not categorize complications as superficial, deep, or intracapsular, which would qualify as a “joint-specific” cause. Despite this variation, surgical site infection after TJA was found to be the most common reason for readmission.
Our systematic review and meta-analysis were limited, as any others are, by the quality of studies investigated. Few studies reported cause-specific rates and reasons for readmission. Given the small sample, formal tests for small-study or publication bias could not be performed. Some studies included tremendous amounts of data, and International Classification of Diseases, Ninth Revision (ICD-9) codes were used without physician review of readmission diagnoses. In the absence of oversight, many readmissions could have been misinterpreted and incorrectly logged, or simply miscoded. Saucedo and colleagues27,45 found that readmission diagnostic codes were often unverified. Numerous other studies corroborated this lack of correlation with physician-derived readmission diagnoses in just 25% of cases.46-54 Another study limitation is the unknown number of patients who had TJA but presented and were subsequently readmitted to a different hospital. Last, as this review included patients who had surgery performed within a 30-year period, it could not address the shifts in postoperative management that occurred in that time, particularly with respect to anticoagulation. This limitation was partially addressed in THA by dividing final studies into 3 decades. Of these studies, only 1 was from the first decade, 3 were from the second, and the rest were from the third. Of the 3 from the second decade, only the study by Warwick and colleagues29 (1995) explicitly did not use anticoagulation, but compression stockings were used, and consequently there was a 4.0% rate of readmission for thromboembolic disease alone, compared with the study by White and colleagues34 (1998), which explicitly used anticoagulation and boasted a 1.7% rate of readmission for thromboembolic disease. This isolated comparison illustrates the effect of routine anticoagulation and the changes in surgical standards over the 3 decades.
The numbers from this systematic review and meta-analysis represent an international benchmark for TJA as a procedure. Knowing the top reasons for readmission will lead to more focus on joint-related and medical issues (surgical site infection, thromboembolic disease) before discharge to avoid readmission after elective unilateral primary TJA. Although readmission rates have received attention in the United States as a primary means of combating soaring health care costs, knowing the rates for a common procedure applies broadly as an indicator for standard of care worldwide, according to the World Health Organization.55 This study is the first systematic review and meta-analysis of documented readmission rates and reasons for readmission to identify overall and cause-specific rates after TJA. The hope is that our findings will add clarity to the literature and help guide the decisions of physicians and policymakers.
Conclusion
Readmission rates are an increasingly important metric in the United States and around the world, yet there is no consensus regarding overall readmission rates and reasons for readmission after primary unilateral TJAs. Our systematic review and meta-analysis of the literature found overall unplanned readmission rates of 5.6% (30 days) and 7.7% (90 days) for THA and 3.3% (30 days) and 9.7% (90 days) for TKA. At both 30 and 90 days, the most common readmission reasons were joint-specific (THA) and surgical site infection (TKA). New investigations should be directed toward developing countermeasures to lower the rates of readmission.
1. Bozic KJ, Maselli J, Pekow PS, Lindenauer PK, Vail TP, Auerbach AD. The influence of procedure volumes and standardization of care on quality and efficiency in total joint replacement surgery. J Bone Joint Surg Am. 2010;92(16):2643-2652.
2. Cram P, Lu X, Kaboli PJ, et al. Clinical characteristics and outcomes of Medicare patients undergoing total hip arthroplasty, 1991–2001. JAMA. 2011;305(15):1560-1567.
3. de Vries LM, Sturkenboom MC, Verhaar JA, Kingma JH, Stricker BH. Complications after hip arthroplasty and the association with hospital procedure volume. Acta Orthop. 2011;82(5):545-552.
4. Mariconda M, Galasso O, Costa GG, Recano P, Cerbasi S. Quality of life and functionality after total hip arthroplasty: a long-term follow-up study. BMC Musculoskelet Disord. 2011;12:222.
5. Zmistowski B, Restrepo C, Hess J, Adibi D, Cangoz S, Parvizi J. Unplanned readmission after total joint arthroplasty: rates, reasons, and risk factors. J Bone Joint Surg Am. 2013;95(20):1869-1876.
6. Zhan C, Kaczmarek R, Loyo-Berrios N, Sangl J, Bright RA. Incidence and short-term outcomes of primary and revision hip replacement in the United States. J Bone Joint Surg Am. 2007;89(3):526-533.
7. Mancuso CA, Salvati EA, Johanson NA, Peterson MG, Charlson ME. Patients’ expectations and satisfaction with total hip arthroplasty. J Arthroplasty. 1997;12(4):387-396.
8. Kurtz SM, Ong KL, Schmier J, et al. Future clinical and economic impact of revision total hip and knee arthroplasty. J Bone Joint Surg Am. 2007;89(suppl 3):144-151.
9. Kurtz SM, Ong KL, Lau E, Mowat F, Halpern M. Projections of primary and revision hip and knee arthroplasty in the United States from 2005 to 2030. J Bone Joint Surg Am. 2007;89(4):780-785.
10. Bozic KJ, Rubash HE, Sculco TP, Berry DJ. An analysis of Medicare payment policy for total joint arthroplasty. J Arthroplasty. 2008;23(6 suppl 1):133-138.
11. Li LT, Mills WL, White DL, et al. Causes and prevalence of unplanned readmissions after colorectal surgery: a systematic review and meta-analysis. J Am Geriatr Soc. 2013;61(7):1175-1181.
12. Readmissions Reduction Program. Centers for Medicare & Medicaid Services website. http://www.cms.gov/Medicare/Medicare-Fee-for-Service-Payment/AcuteInpatientPPS/Readmissions-Reduction-Program.html. Accessed July 27, 2015.
13. Tsai TC, Joynt KE, Orav J, Gawande AA, Jha AK. Variation in surgical readmission rates and quality of hospital care. N Engl J Med. 2013;369(12):1134-1142.
14. Jencks SF, Williams MV, Coleman EA. Rehospitalizations among patients in the Medicare fee-for-service program [published correction appears in N Engl J Med. 2011;364(16):1582]. N Engl J Med. 2009;360(14):1418-1428.
15. Zmistowski B, Hozack WJ, Parvizi J. Readmission rates after total hip arthroplasty. JAMA. 2011;306(8):825.
16. Bini SA, Fithian DC, Paxton LW, Khatod MX, Inacio MC, Namba RS. Does discharge disposition after primary total joint arthroplasty affect readmission rates? J Arthroplasty. 2010;25(1):114-117.
17. Singh JA, Jensen MR, Harmsen WS, Gabriel SE, Lewallen DG. Cardiac and thromboembolic complications and mortality in patients undergoing total hip and total knee arthroplasty. Ann Rheum Dis. 2011;70(12):2082-2088.
18. Joynt KE, Jha AK. Thirty-day readmissions—truth and consequences. N Engl J Med. 2012;366(15):1366-1369.
19. Atkinson JG. Flaws in the Medicare readmission penalty. N Engl J Med. 2012;367(21):2056-2057.
20. Grosso LM, Curtis JP, Lin Z, et al. Hospital-level Risk-Standardized Complication Rate Following Elective Primary Total Hip Arthroplasty (THA) And/Or Total Knee Arthroplasty (TKA): Measure Methodology Report. Report prepared for Centers for Medicare & Medicaid Services. QualityNet website. https://www.qualitynet.org/dcs/ContentServer?c=Page&pagename=QnetPublic%2FPage%2FQnetTier4&cid=1228772504368. Submitted June 25, 2012. Accessed August 4, 2015.
21. Robinson JC. Analysis of Medicare and commercial insurer–paid total knee replacement reveals opportunities for cost reduction. Health Care Incentives Improvement Institute website. http://www.hci3.org/sites/default/files/files/HCI-2012-IssueBrief-L6-2.pdf. Published 2012. Accessed July 27, 2015.
22. Moher D, Liberati A, Tetzlaff J, Altman DG; PRISMA Group. Preferred reporting items for systematic reviews and meta-analyses: the PRISMA statement. PLoS Med. 2009;6(7):e1000097.
23. DerSimonian R, Laird N. Meta-analysis in clinical trials. Control Clin Trials. 1986;7(3):177-188.
24. Higgins JP, Thompson SG. Quantifying heterogeniety in a meta-analysis. Stat Med. 2002;21(11):1539-1558.
25. Husted H, Otte KS, Kristensen BB, Orsnes T, Kehlet H. Readmissions after fast-track hip and knee arthroplasty. Arch Orthop Trauma Surg. 2010;130(9):1185-1191.
26. Keeney JA, Adelani MA, Nunley RM, Clohisy JC, Barrack RL. Assessing readmission databases: how reliable is the information? J Arthroplasty. 2012;27(8 suppl):72-76.e1-e2.
27. Saucedo JM, Marecek GS, Wanke TR, Lee J, Stulberg SD, Puri L. Understanding readmissions after primary total hip and knee arthroplasty: who’s at risk? J Arthroplasty. 2014;29(2):256-260.
28. Seagroatt V, Tan HS, Goldacre M, Bulstrode C, Nugent I, Gill L. Elective total hip replacement: incidence, emergency readmission rate, and postoperative mortality. BMJ. 1991;303(6815):1431-1435.
29. Warwick D, Williams MH, Bannister GC. Death and thromboembolic disease after total hip replacement. A series of 1162 cases with no routine chemical prophylaxis. J Bone Joint Surg Br. 1995;77(1):6-10.
30. Kreder HJ, Deyo RA, Koepsell T, Swiontkowski MF, Kreuter W. Relationship between the volume of total hip replacements performed by providers and the rates of postoperative complications in the state of Washington. J Bone Joint Surg Am. 1997;79(4):485-494.
31. Mahomed NN, Barrett JA, Katz JN, et al. Rates and outcomes of primary and revision total hip replacement in the United States Medicare population. J Bone Joint Surg Am. 2003;85(1):27-32.
32. Cullen C, Johnson DS, Cook G. Re-admission rates within 28 days of total hip replacement. Ann R Coll Surg Engl. 2006;88(5):475-478.
33. Vorhies JS, Wang Y, Herndon J, Maloney WJ, Huddleston JI. Readmission and length of stay after total hip arthroplasty in a national Medicare sample. J Arthroplasty. 2011;26(6 suppl):119-123.
34. White RH, Romano PS, Zhou H, Rodrigo J, Bargar W. Incidence and time course of thromboembolic outcomes following total hip or knee arthroplasty. Arch Intern Med. 1998;158(14):1525-1531.
35. Bjørnarå BT, Gudmundsen TE, Dahl OE. Frequency and timing of clinical venous thromboembolism after major joint surgery. J Bone Joint Surg Br. 2006;88(3):386-391.
36. Berger RA, Kusuma SK, Sanders SA, Thill ES, Sporer SM. The feasibility and perioperative complications of outpatient knee arthroplasty. Clin Orthop Relat Res. 2009;467(6):1443-1449.
37. Cram P, Lu X, Kates SL, Singh JA, Li Y, Wolf BR. Total knee arthroplasty volume, utilization, and outcomes among Medicare beneficiaries, 1991–2010. JAMA. 2012;308(12):1227-1236.
38. Seah VW, Singh G, Yang KY, Yeo SJ, Lo NN, Seow KH. Thirty-day mortality and morbidity after total knee arthroplasty. Ann Acad Med Singapore. 2007;36(12):1010-1012.
39. Learmonth ID, Young C, Rorabeck C. The operation of the century: total hip replacement. Lancet. 2007;370(9597):1508-1519.
40. The Revolving Door: A Report on U.S. Hospital Readmissions. An Analysis of Medicare Data by the Dartmouth Atlas Project. Stories From Patients and Health Care Providers by PerryUndem Research & Communication. Robert Wood Johnson Foundation. http://www.rwjf.org/content/dam/farm/reports/reports/2013/rwjf404178. Published February 2013. Accessed July 27, 2015.
41. Riggs RV, Roberts PS, Aronow H, Younan T. Joint replacement and hip fracture readmission rates: impact of discharge destination. PM R. 2010;2(9):806-810.
42. Bosco JA 3rd, Karkenny AJ, Hutzler LH, Slover JD, Iorio R. Cost burden of 30-day readmissions following Medicare total hip and knee arthroplasty. J Arthroplasty. 2014;29(5):903-905.
43. McCormack R, Michels R, Ramos N, Hutzler L, Slover JD, Bosco JA. Thirty-day readmission rates as a measure of quality: causes of readmission after orthopedic surgeries and accuracy of administrative data. J Healthc Manag. 2013;58(1):64-76.
44. Bohm ER, Dunbar MJ, Frood JJ, Johnson TM, Morris KA. Rehospitalizations, early revisions, infections, and hospital resource use in the first year after hip and knee arthroplasties. J Arthroplasty. 2012;27(2)232-237.
45. Saucedo J, Marecek GS, Lee J, Huminiak L, Stulberg SD, Puri L. How accurately are we coding readmission diagnoses after total joint arthroplasty? J Arthroplasty. 2013;28(7):1076-1079.
46. Schairer WW, Sing DC, Vail TP, Bozic KJ. Causes and frequency of unplanned hospital readmission after total hip arthroplasty. Clin Orthop Relat Res. 2014;472(2):464-470.
47. Bozic KJ, Chiu VW, Takemoto SK, et al. The validity of using administrative claims data in total joint arthroplasty outcomes research. J Arthroplasty. 2010;25(6 suppl):58-61.
48. Cram P, Ibrahim SA, Lu X, Wolf BR. Impact of alternative coding schemes on incidence rates of key complications after total hip arthroplasty: a risk-adjusted analysis of a national data set. Geriatr Orthop Surg Rehabil. 2012;3(1):17-26.
49. Lawson EH, Louie R, Zingmond DS, et al. A comparison of clinical registry versus administrative claims data for reporting of 30-day surgical complications. Ann Surg. 2012;256(6):973-981.
50. Cima RR, Lackore KA, Nehring SA, et al. How best to measure surgical quality? Comparison of the Agency for Healthcare Research and Quality Patient Safety Indicators (AHRQ-PSI) and the American College of Surgeons National Surgical Quality Improvement Program (ACS-NSQIP) postoperative adverse events at a single institution. Surgery. 2011;150(5):943-949.
51. Steinberg SM, Popa MR, Michalek JA, Bethel MJ, Ellison EC. Comparison of risk adjustment methodologies in surgical quality improvement. Surgery. 2008;144(4):662-667.
52. Baron JA, Barrett J, Katz JN, Liang MH. Total hip arthroplasty: use and select complications in the US Medicare population. Am J Public Health. 1996;86(1):70-72.
53. HCUPnet. Healthcare Cost and Utilization Project. Agency for Healthcare Research and Quality website. http://hcupnet.ahrq.gov. Accessed July 27, 2015.
54. Singh JA. Epidemiology of knee and hip arthroplasty: a systematic review. Open Orthop J. 2011;5:80-85.
55. Parker SG. Do Current Discharge Arrangements From Inpatient Hospital Care for the Elderly Reduce Readmission Rates, the Length of Inpatient Stay or Mortality, or Improve Health Status? Health Evidence Network report. Copenhagen, Denmark: World Health Organization Regional Office for Europe; 2005. http://www.euro.who.int/__data/assets/pdf_file/0006/74670/E87542.pdf. Accessed July 27, 2015.
Managing borderline personality disorder

Assessing head pain

Hepatitis C: How to fine-tune your approach
› Screen at-risk patients and all those born between 1945 and 1965 for hepatitis C virus (HCV) infection. B
› Screen HCV-positive patients for level of fibrosis and for conditions that may accelerate liver disease, including alcohol use, hepatitis B virus, and human immunodeficiency virus. B
› Continuously monitor patients with chronic HCV for the development of cirrhosis and hepatocellular carcinoma. A
› Refer patients to specialty care for HCV treatment and, if they have cirrhosis, for potential transplant evaluation. C
› Counsel HCV-positive patients about how to avoid transmission to others. C
Strength of recommendation (SOR)
A Good-quality patient-oriented evidence
B Inconsistent or limited-quality patient-oriented evidence
C Consensus, usual practice, opinion, disease-oriented evidence, case series
Hepatitis C virus (HCV) infection is a leading cause of chronic liver disease. Over the next few decades, the number of deaths per year due to complications of HCV such as liver failure and hepatocellular carcinoma (HCC) is predicted to more than triple to 36,000 by 2032.1
Fortunately, major advances in drug therapy have made it possible to cure patients of HCV, and treatment is now less complex, of shorter duration, and better tolerated than it once was. To help family physicians maximize the care they provide to these patients, we’ve summarized screening recommendations from the Centers for Disease Control and Prevention (CDC), innovative alternatives to biopsy for staging liver disease, and counseling points to cover with patients.
A common, usually silent infection with potentially fatal complications
According to the National Health and Nutrition Examination Survey (NHANES), an estimated 2.7 to 3.9 million people in the United States are chronically infected with HCV, about threefourths of whom were born between 1945 and 1965 (the “baby boomer” generation).2 However, by adding “unaccounted groups” (eg, incarcerated, homeless, and active duty military) to these estimates, the number of people with HCV is likely more than 5.2 million.3
HCV is a ribonucleic acid (RNA) virus capable of mutating at a high rate to escape detection and clearance by the host’s immune system.4 Most patients with HCV are asymptomatic during the acute and chronic phases of infection, and may have a silent infection for decades. In fact, 65% to 75% of patients with HCV are unaware of their infection.5
Approximately 20% of chronically infected patients develop cirrhosis after 20 years and, once they do, the annual rate of HCC and liver decompensation is about 5%.6-8 Risk factors for advancement to cirrhosis includes male sex, alcohol consumption, co-infection with human immunodeficiency virus (HIV) or hepatitis B virus (HBV), immunosuppression, having had HCV infection for a long time, becoming infected with HCV after age 40, and not having responded to previous treatment.9
Chronic HCV infection can lead to extrahepatic manifestations such as essential mixed cryoglobulinemia, porphyria cutanea tarda, membranoproliferative glomerulonephritis, lymphoma, and glucose intolerance.10 There is also growing evidence that HCV infection affects cognitive function in the absence of fibrosis and hepatic encephalopathy. Several studies show that HCV-infected patients score poorly on neuropsychological testing for verbal learning, attention, memory, and executive function.11 This may be related to the expression of receptors for HCV by the brain’s microvascular endothelial cells.12
Screening recommendations. Given the high prevalence of HCV infection among baby boomers, the CDC decided in 2012 to recommend one-time HCV screening for all patients born between 1945 and 1965.13 This is in addition to risk-based screening for all patients who have a history of injection drug use, those on long-term hemodialysis or with tattoos obtained in unregulated settings, offspring of HCV-infected mothers, and those with health-care associated exposures (TABLE13). In 2013, the US Preventive Services Task Force upgraded its recommendation to match those of the CDC.14
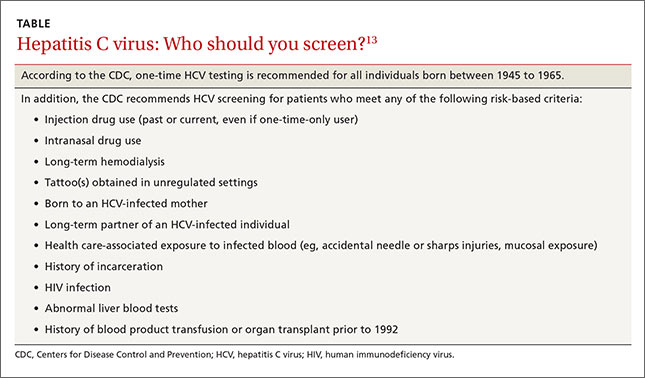
Despite these recommendations, which are expected to increase detection of HCV among asymptomatic persons who do not know they are infected, there remain significant barriers to HCV testing. These include poor access to primary care and preventive services, lack of knowledge and awareness of the disease among patients and providers, and a lack of studies that support a universal screening approach for HCV.5,15,16 One tool that might help overcome some of these barriers and aid family physicians in the screening process is automatic reminders or standing lab orders for HCV testing in electronic medical records systems.
Screening for HCV can be done using any of the US Food and Drug Administration (FDA)-approved tests for the anti-HCV antibody, which have sensitivities and specificities greater than 99%.17 A positive screening result should be confirmed with an HCV RNA test. However, for practical purposes, ordering the anti-HCV test with reflex to the HCV RNA test decreases the number of blood draws and office visits required of the patient. The reflex confirmation allows the physician to deliver the patient’s full diagnosis and reduces the psychological distress associated with waiting for confirmatory results. The HCV RNA test (alone) should be used, however, in immunocompromised patients, those who may have had exposure to HCV in the past 6 months, and those suspected of having an HCV re-infection after having cleared the virus.18
Look for the evidence of liver disease
Family physicians should order several additional tests for patients found to have chronic HCV infection before referring such patients to a specialist (ALGORITHM). Work-up should include the complete blood count, HCV genotype (which will help guide treatment), liver function tests, international normalized ratio test, and ultrasound of the liver.18 In addition, all HCV-positive patients should be tested for HIV and HBV, because these co-infections may accelerate liver fibrosis.19,20
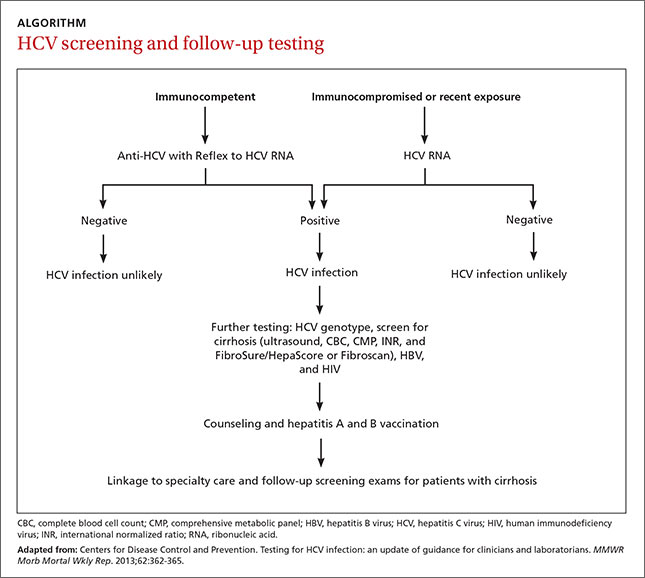
All patients with chronic HCV infection should also be screened for the presence of fibrosis and cirrhosis, as this will influence treatment choice and duration. Signs of cirrhosis that may be evident on physical exam include jaundice, spider angiomata, palmar erythema, encephalopathy with asterixis, and fluid overload, especially ascites. Cirrhosis can be classified clinically as compensated (stage 1 with no varices present and stage 2 with varices present) and decompensated (stages 3 and 4), which is defined as cirrhosis with signs of severe portal hypertension (bleeding varices, ascites, hepatic encephalopathy) or liver insufficiency (jaundice).21 Patients with decompensated cirrhosis should be managed by a liver transplant center. For more on cirrhosis, see “Cirrhosis complications: Keeping them under control” (J Fam Pract. 2015;64:338-342).
Several noninvasive alternatives to liver biopsy
Historically, liver biopsy has been the gold standard for staging liver disease. The Metavir scoring system is a histological assessment of the degree of inflammatory activity and the stage of fibrosis.22 The degree of inflammation activity, which is a precursor of fibrosis, is scored from A0 (no activity) to A3 (severe activity). The staging of fibrosis involves a 5-stage scoring system: F0 (chronic hepatitis without fibrosis); F1 (portal fibrosis without septae); F2 (portal fibrosis with rare septae); F3 (many septae without cirrhosis); or F4 (cirrhosis).
That said, noninvasive tests have largely supplanted liver biopsy for fibrosis screening.
For example, the FibroSure test uses the patient’s age, gender, and a combination of 6 serum markers of liver function in a computational algorithm to generate a quantitative indicator of liver fibrosis, with a score of 0.0 to 1.0 that corresponds to the Metavir fibrosis score (F0-F4), and an inflammatory activity score (A0-A3).23 Similarly, HepaScore uses several noninvasive markers to calculate a score from 0.00 to 1.00. A score ≤0.2 accurately excludes significant fibrosis. However, a score of ≥0.55 or higher corresponds to a Metavir score of at least F2, and in such cases further testing would be needed to evaluate for cirrhosis.24
FDA-approved in 2013, transient elastography (FibroScan) is another noninvasive alternative to liver biopsy for determining the stage of liver disease. This bedside test uses ultrasound technology to measure liver stiffness and provides a score ranging from 0 to 75 kPA that correlates with the Metavir score. Although not yet widely available in the United States, FibroScan is becoming increasingly popular as a rapid and noninvasive screening tool for cirrhosis.25
Identifying cirrhosis in patients who have HCV is crucial because such patients need prompt care from a specialist. In addition to receiving HCV treatment, patients with cirrhosis also need regular liver ultrasound exams to screen for HCC (every 6 months) and esophagogastroduodenoscopy to screen for esophageal and gastric varices.26
Advise patients to avoid alcohol, lose weight
Counsel patients who test positive for HCV infection about making lifestyle changes to avoid further liver damage and transmission of HCV to others. Infectious diseases and hepatology society guidelines recommend vaccination against hepatitis A and B for all HCV-infected patients who are not immune to these viruses because acute co-infection could lead to severe acute liver injury.18,27 Urge all HCV-infected patients to completely abstain from alcohol and, if necessary, refer them to an addiction specialist, because excess alcohol consumption is strongly associated with the development of cirrhosis and HCC.28,29
Comorbid conditions such as metabolic syndrome, obesity, and hyperlipidemia can worsen the prognosis for HCV-infected patients; therefore, intense counseling on weight loss is recommended.30 Statins are safe and beneficial for HCV patients with hypercholesterolemia and compensated cirrhosis.31
Teach patients that the primary mode of transmission of HCV is through infected blood. Sexual transmission of HCV has been well documented in HIV-positive men who have sex with men.32 Although the risk of transmission of HCV among heterosexual couples is extremely low, it is possible, and patients should be counseled accordingly.33 Transmission of HCV from mother to the baby occurs in up to 6% of births and most commonly occurs during delivery.34
Newer treatments are highly effective and well tolderated
HCV treatment has changed dramatically over the past few years. Previous treatments for HCV, particularly those containing interferon, were known for their poor tolerability due to adverse effects and low cure rates. Compared to previous therapies, the new interferon-free direct-acting antiviral (DAA) regimens are not only less complex but also shorter in duration, ranging from 8 to 24 weeks depending on the patient’s viral load, stage of liver disease, and previous treatment experience.18 The specific agents and dosages used in DAA regimens aren’t described here because these regimens are rapidly changing. However, continuously updated treatment recommendations from the American Association for the Study of Liver Diseases and the Infectious Diseases Society of America are available at http://www.hcvguidelines.org.
The goal of HCV treatment is cure as evidenced by a sustained virologic response (SVR), which is defined as the absence of HCV RNA 12 weeks or more after completing treatment.35,36 In general, for the most common genotypes of HCV, treatment with a DAA regimen results in a SVR in ≥95% of patients.18 Achieving SVR is associated with a 50% reduction in all-cause mortality, a 90% reduction in liver-associated mortality, and a >70% reduction in the risk of developing HCC.27,37,38 SVR also has been shown to have a significant effect on reducing extrahepatic manifestations of HCV infection, such as cryoglobulinemia and lymphoma.39-41
Current barriers to the newer, highly effective hepatitis C virus (HCV) infection treatments are largely financial. Although insurance companies have been able to negotiate substantial discounts from the high wholesale price of treatment, many insurance programs require prior authorizations and will approve treatment only for patients with advanced liver fibrosis. In our experience, many patients are left to wait for their liver disease to progress before their insurance company will agree to cover treatment.
In addition, many insurance companies have mandated that only subspecialists prescribe these medications. However, infectious diseases and hepatology specialists and their support staffs are often overburdened with paperwork and phone calls related to prior authorizations and justification of treatment, which can add to delays in treatment.
There is already evidence that treatment of all patients with HCV is cost-effective and leads to better healthcare outcomes42 and there are indications that these barriers will decrease over time, with prices already dropping significantly due to increasing competition between drug companies.
The DAAs are well tolerated and have good safety profiles. In phase III clinical trials of today’s most commonly used DAA regimens, the discontinuation rate was <1% in non-cirrhotic patients and 2% in those with cirrhosis.18 The most commonly reported adverse effects were nausea, fatigue, and headache. DAAs may have drug-drug interactions; therefore, careful medication reconciliation should be performed before initiating treatment.18
Prioritizing treatment. Current evidence supports treatment for all patients with HCV except those with a life expectancy of <12 months.18 Evidence indicates that treatment becomes less effective as a patient’s liver injury progresses to cirrhosis. Due to the high cost of available treatments, however, many insurers have imposed strict criteria for coverage. (See “Barriers to HCV Treatment,” above.42)
The highest priority for treatment has been given to patients with advanced liver fibrosis, compensated cirrhosis, those who have received a liver transplant, and those with severe extrahepatic manifestations (eg, mixed cryoglobulinemia and end-organ disease such as nephropathy). Treatment is also prioritized for high-risk populations (eg, patients with HBV and HIV co-infection, diabetes mellitus) and patients who are at high risk of transmitting the virus (eg, individuals who inject drugs or are incarcerated, men who have sex with men, women of childbearing age, hemodialysis patients, and health care professionals who perform exposure-prone procedures).18
While it may eventually become feasible for family physicians to treat HCV-infected patients, the rapid evolution and significant cost of treatment, as well as the challenges in obtaining insurance coverage, have kept HCV treatment largely in the domain of specialists, at least for now. In the interim, family physicians play a crucial role by screening, diagnosing, and counseling patients with this infection, referring them to specialty care, and providing ongoing monitoring for signs of HCC and esophageal and gastric varices.
CORRESPONDENCE
Laura Wangensteen, MD, Department of Family Medicine, Drexel University, 3401 South Market Street #105 A, Philadelphia, PA 19104; laura.wangensteen@drexelmed.edu
1. Rein DB, Wittenborn JS, Weinbaum CM, et al. Forecasting the morbidity and mortality associated with prevalent cases of precirrhotic chronic hepatitis C in the United States. Dig Liver Dis. 2011;43:66-72.
2. Armstrong GL, Wasley A, Simard EP, et al. The prevalence of hepatitis C virus infection in the United States, 1999 through 2002. Ann Intern Med. 2006;144:705-714.
3. Chak E, Talal AH, Sherman KE, et al. Hepatitis C virus infection in USA: an estimate of true prevalence. Liver Int. 2011;31:1090-1101.
4. Neumann AU, Lam NP, Dahari H, et al. Hepatitis C viral dynamics in vivo and the antiviral efficacy of interferon-alpha therapy. Science. 1998;282:103-107.
5. Mitchell AE, Colvin HM, Palmer Beasley R. Institute of Medicine recommendations for the prevention and control of hepatitis B and C. Hepatology. 2010;51:729-733.
6. Alter HJ, Seeff LB. Recovery, persistence, and sequelae in hepatitis C virus infection: a perspective on long-term outcome. Semin Liver Dis. 2000;20:17-35.
7. El-Serag HB. Hepatocellular carcinoma and hepatitis C in the United States. Hepatology. 2002;36:S74-S83.
8. Westbrook RH, Dusheiko G. Natural history of hepatitis C. J Hepatol. 2014;61:S58-S68.
9. McCaughan GW, George J. Fibrosis progression in chronic hepatitis C virus infection. Gut. 2004;53:318-321.
10. El-Serag HB, Hampel H, Yeh C, et al. Extrahepatic manifestations of hepatitis C among United States male veterans. Hepatology. 2002;36:1439-1445.
11. Solinas A, Piras MR, Deplano A. Cognitive dysfunction and hepatitis C virus infection. World J Hepatol. 2015;7:922-925.
12. Fletcher NF, Wilson GK, Murray J, et al. Hepatitis C virus infects the endothelial cells of the blood-brain barrier. Gastroenterology. 2012;142:634-643.e6.
13. Smith BD, Morgan RL, Beckett GA, et al; Centers for Disease Control and Prevention. Recommendations for the identification of chronic hepatitis C virus infection among persons born during 1945-1965. MMWR Recomm Rep. 2012;61:1-32.
14. US Preventive Services Task Force. Final recommendation statement on hepatitis C screening, June 2013. US Preventive Services Task Force Web site. Available at: http://www.uspreventiveservicestaskforce.org/Page/Document/RecommendationStatementFinal/hepatitis-c-screening. Accessed on December 28, 2014.
15. Arora S, Thornton K, Murata G, et al. Outcomes of treatment for hepatitis C virus infection by primary care providers. N Engl J Med. 2011;364:2199-2207.
16. Morrill JA, Shrestha M, Grant RW. Barriers to the treatment of hepatitis C. Patient, provider, and system factors. J Gen Intern Med. 2005;20:754-758.
17. Shivkumar S, Peeling R, Jafari Y, et al. Accuracy of rapid and pointof- care screening tests for hepatitis C: a systematic review and meta-analysis. Ann Intern Med. 2012;157:558-566.
18. American Association for the Study of Liver Diseases; Infectious Diseases Society of America; International Antiviral Society—USA. HCV guidance: Recommendations for testing, managing, and treating hepatitis C. HCV guidelines Web site. Available at: http://www.hcvguidelines.org. Accessed May 25, 2015.
19. Zarski JP, Bohn B, Bastie A, et al. Characteristics of patients with dual infection by hepatitis B and C viruses. J Hepatol. 1998;28:27-33.
20. Graham CS, Baden LR, Yu E, et al. Influence of human immunodeficiency virus infection on the course of hepatitis C virus infection: a meta-analysis. Clin Infect Dis. 2001;33:562-569.
21. Garcia-Tsao G, Friedman S, Iredale J, et al. Now there are many (stages) where before there was one: In search of a pathophysiological classification of cirrhosis. Hepatology. 2010;51:1445-1449.
22. Bedossa P, Poynard T. An algorithm for the grading of activity in chronic hepatitis C. The METAVIR Cooperative Study Group. Hepatology. 1996;24:289-293.
23. Ngo Y, Munteanu M, Messous D, et al. A prospective analysis of the prognostic value of biomarkers (FibroTest) in patients with chronic hepatitis C. Clin Chem. 2006;52:1887-1896.
24. Becker L, Salameh W, Sferruzza A, et al. Validation of hepascore, compared with simple indices of fibrosis, in patients with chronic hepatitis C virus infection in United States. Clin Gastroenterol Hepatol. 2009;7:696-701.
25. Bonder A, Afdhal N. Utilization of FibroScan in clinical practice. Curr Gastroenterol Rep. 2014;16:372.
26. Garcia-Tsao G, Sanyal AJ, Grace ND, et al; Practice Guidelines Committee of the American Association for the Study of Liver Diseases; Practice Parameters Committee of the American College of Gastroenterology. Prevention and management of gastroesophageal varices and variceal hemorrhage in cirrhosis. Hepatology. 2007;46:922-938.
27. Ghany MG, Strader DB, Thomas DL, et al; American Association for the Study of Liver Diseases. Diagnosis, management, and treatment of hepatitis C: an update. Hepatology. 2009;49:1335-1374.
28. Pessione F, Degos F, Marcellin P, et al. Effect of alcohol consumption on serum hepatitis C virus RNA and histological lesions in chronic hepatitis C. Hepatology. 1998;27:1717-1722.
29. Mueller S, Millonig G, Seitz HK. Alcoholic liver disease and hepatitis C: a frequently underestimated combination. World J Gastroenterol. 2009;15:3462-3471.
30. Ortiz V, Berenguer M, Rayón JM, et al. Contribution of obesity to hepatitis C-related fibrosis progression. Am J Gastroenterol. 2002;97:2408-2414.
31. Lewis JH, Mortensen ME, Zweig S, et al; Pravastatin in Chronic Liver Disease Study Investigators. Efficacy and safety of high-dose pravastatin in hypercholesterolemic patients with well-compensated chronic liver disease: Results of a prospective, randomized, double-blind, placebo-controlled, multicenter trial. Hepatology. 2007;46:1453-1463.
32. Gamage DG, Read TR, Bradshaw CS, et al. Incidence of hepatitis-C among HIV infected men who have sex with men (MSM) attending a sexual health service: a cohort study. BMC Infect Dis. 2011;11:39.
33. Terrault NA, Dodge JL, Murphy EL, et al. Sexual transmission of hepatitis C virus among monogamous heterosexual couples: the HCV partners study. Hepatology. 2013;57:881-889.
34. Yeung LT, King SM, Roberts EA. Mother-to-infant transmission of hepatitis C virus. Hepatology. 2001;34:223-229.
35. Swain MG, Lai MY, Shiffman ML, et al. A sustained virologic response is durable in patients with chronic hepatitis C treated with peginterferon alfa-2a and ribavirin. Gastroenterology. 2010;139:1593-1601.
36. Thomas AM, Kattakuzhy S, Jones S, et al. SVR durability: HCV patients treated with IFN-free DAA regimens. Presented at: Conference on Retroviruses and Opportunistic Infections (CROI); February, 2015; Seattle, Washington. Abstract 653.
37. Backus LI, Boothroyd DB, Phillips BR, et al. A sustained virologic response reduces risk of all-cause mortality in patients with hepatitis C. Clin Gastroenterol Hepatol. 2011;9:509-516.e1.
38. Russo MW. Antiviral therapy for hepatitis C is associated with improved clinical outcomes in patients with advanced fibrosis. Expert Rev Gastroenterol Hepatol. 2010;4:535-539.
39. Fabrizi F, Dixit V, Messa P. Antiviral therapy of symptomatic HCVassociated mixed cryoglobulinemia: meta-analysis of clinical studies. J Med Virol. 2013;85:1019-1027.
40. Takahashi K, Nishida N, Kawabata H, et al. Regression of Hodgkin lymphoma in response to antiviral therapy for hepatitis C virus infection. Intern Med. 2012;51:2745-2747.
41. Gisbert JP, García-Buey L, Pajares JM, et al. Systematic review: regression of lymphoproliferative disorders after treatment for hepatitis C infection. Aliment Pharmacol Ther. 2005;21:653-662.
42. Najafzadeh M, Andersson K, Shrank WH, et al. Cost-effectiveness of novel regimens for the treatment of hepatitis C virus. Ann Intern Med. 2015;162:407-419.
› Screen at-risk patients and all those born between 1945 and 1965 for hepatitis C virus (HCV) infection. B
› Screen HCV-positive patients for level of fibrosis and for conditions that may accelerate liver disease, including alcohol use, hepatitis B virus, and human immunodeficiency virus. B
› Continuously monitor patients with chronic HCV for the development of cirrhosis and hepatocellular carcinoma. A
› Refer patients to specialty care for HCV treatment and, if they have cirrhosis, for potential transplant evaluation. C
› Counsel HCV-positive patients about how to avoid transmission to others. C
Strength of recommendation (SOR)
A Good-quality patient-oriented evidence
B Inconsistent or limited-quality patient-oriented evidence
C Consensus, usual practice, opinion, disease-oriented evidence, case series
Hepatitis C virus (HCV) infection is a leading cause of chronic liver disease. Over the next few decades, the number of deaths per year due to complications of HCV such as liver failure and hepatocellular carcinoma (HCC) is predicted to more than triple to 36,000 by 2032.1
Fortunately, major advances in drug therapy have made it possible to cure patients of HCV, and treatment is now less complex, of shorter duration, and better tolerated than it once was. To help family physicians maximize the care they provide to these patients, we’ve summarized screening recommendations from the Centers for Disease Control and Prevention (CDC), innovative alternatives to biopsy for staging liver disease, and counseling points to cover with patients.
A common, usually silent infection with potentially fatal complications
According to the National Health and Nutrition Examination Survey (NHANES), an estimated 2.7 to 3.9 million people in the United States are chronically infected with HCV, about threefourths of whom were born between 1945 and 1965 (the “baby boomer” generation).2 However, by adding “unaccounted groups” (eg, incarcerated, homeless, and active duty military) to these estimates, the number of people with HCV is likely more than 5.2 million.3
HCV is a ribonucleic acid (RNA) virus capable of mutating at a high rate to escape detection and clearance by the host’s immune system.4 Most patients with HCV are asymptomatic during the acute and chronic phases of infection, and may have a silent infection for decades. In fact, 65% to 75% of patients with HCV are unaware of their infection.5
Approximately 20% of chronically infected patients develop cirrhosis after 20 years and, once they do, the annual rate of HCC and liver decompensation is about 5%.6-8 Risk factors for advancement to cirrhosis includes male sex, alcohol consumption, co-infection with human immunodeficiency virus (HIV) or hepatitis B virus (HBV), immunosuppression, having had HCV infection for a long time, becoming infected with HCV after age 40, and not having responded to previous treatment.9
Chronic HCV infection can lead to extrahepatic manifestations such as essential mixed cryoglobulinemia, porphyria cutanea tarda, membranoproliferative glomerulonephritis, lymphoma, and glucose intolerance.10 There is also growing evidence that HCV infection affects cognitive function in the absence of fibrosis and hepatic encephalopathy. Several studies show that HCV-infected patients score poorly on neuropsychological testing for verbal learning, attention, memory, and executive function.11 This may be related to the expression of receptors for HCV by the brain’s microvascular endothelial cells.12
Screening recommendations. Given the high prevalence of HCV infection among baby boomers, the CDC decided in 2012 to recommend one-time HCV screening for all patients born between 1945 and 1965.13 This is in addition to risk-based screening for all patients who have a history of injection drug use, those on long-term hemodialysis or with tattoos obtained in unregulated settings, offspring of HCV-infected mothers, and those with health-care associated exposures (TABLE13). In 2013, the US Preventive Services Task Force upgraded its recommendation to match those of the CDC.14
Despite these recommendations, which are expected to increase detection of HCV among asymptomatic persons who do not know they are infected, there remain significant barriers to HCV testing. These include poor access to primary care and preventive services, lack of knowledge and awareness of the disease among patients and providers, and a lack of studies that support a universal screening approach for HCV.5,15,16 One tool that might help overcome some of these barriers and aid family physicians in the screening process is automatic reminders or standing lab orders for HCV testing in electronic medical records systems.
Screening for HCV can be done using any of the US Food and Drug Administration (FDA)-approved tests for the anti-HCV antibody, which have sensitivities and specificities greater than 99%.17 A positive screening result should be confirmed with an HCV RNA test. However, for practical purposes, ordering the anti-HCV test with reflex to the HCV RNA test decreases the number of blood draws and office visits required of the patient. The reflex confirmation allows the physician to deliver the patient’s full diagnosis and reduces the psychological distress associated with waiting for confirmatory results. The HCV RNA test (alone) should be used, however, in immunocompromised patients, those who may have had exposure to HCV in the past 6 months, and those suspected of having an HCV re-infection after having cleared the virus.18
Look for the evidence of liver disease
Family physicians should order several additional tests for patients found to have chronic HCV infection before referring such patients to a specialist (ALGORITHM). Work-up should include the complete blood count, HCV genotype (which will help guide treatment), liver function tests, international normalized ratio test, and ultrasound of the liver.18 In addition, all HCV-positive patients should be tested for HIV and HBV, because these co-infections may accelerate liver fibrosis.19,20
All patients with chronic HCV infection should also be screened for the presence of fibrosis and cirrhosis, as this will influence treatment choice and duration. Signs of cirrhosis that may be evident on physical exam include jaundice, spider angiomata, palmar erythema, encephalopathy with asterixis, and fluid overload, especially ascites. Cirrhosis can be classified clinically as compensated (stage 1 with no varices present and stage 2 with varices present) and decompensated (stages 3 and 4), which is defined as cirrhosis with signs of severe portal hypertension (bleeding varices, ascites, hepatic encephalopathy) or liver insufficiency (jaundice).21 Patients with decompensated cirrhosis should be managed by a liver transplant center. For more on cirrhosis, see “Cirrhosis complications: Keeping them under control” (J Fam Pract. 2015;64:338-342).
Several noninvasive alternatives to liver biopsy
Historically, liver biopsy has been the gold standard for staging liver disease. The Metavir scoring system is a histological assessment of the degree of inflammatory activity and the stage of fibrosis.22 The degree of inflammation activity, which is a precursor of fibrosis, is scored from A0 (no activity) to A3 (severe activity). The staging of fibrosis involves a 5-stage scoring system: F0 (chronic hepatitis without fibrosis); F1 (portal fibrosis without septae); F2 (portal fibrosis with rare septae); F3 (many septae without cirrhosis); or F4 (cirrhosis).
That said, noninvasive tests have largely supplanted liver biopsy for fibrosis screening.
For example, the FibroSure test uses the patient’s age, gender, and a combination of 6 serum markers of liver function in a computational algorithm to generate a quantitative indicator of liver fibrosis, with a score of 0.0 to 1.0 that corresponds to the Metavir fibrosis score (F0-F4), and an inflammatory activity score (A0-A3).23 Similarly, HepaScore uses several noninvasive markers to calculate a score from 0.00 to 1.00. A score ≤0.2 accurately excludes significant fibrosis. However, a score of ≥0.55 or higher corresponds to a Metavir score of at least F2, and in such cases further testing would be needed to evaluate for cirrhosis.24
FDA-approved in 2013, transient elastography (FibroScan) is another noninvasive alternative to liver biopsy for determining the stage of liver disease. This bedside test uses ultrasound technology to measure liver stiffness and provides a score ranging from 0 to 75 kPA that correlates with the Metavir score. Although not yet widely available in the United States, FibroScan is becoming increasingly popular as a rapid and noninvasive screening tool for cirrhosis.25
Identifying cirrhosis in patients who have HCV is crucial because such patients need prompt care from a specialist. In addition to receiving HCV treatment, patients with cirrhosis also need regular liver ultrasound exams to screen for HCC (every 6 months) and esophagogastroduodenoscopy to screen for esophageal and gastric varices.26
Advise patients to avoid alcohol, lose weight
Counsel patients who test positive for HCV infection about making lifestyle changes to avoid further liver damage and transmission of HCV to others. Infectious diseases and hepatology society guidelines recommend vaccination against hepatitis A and B for all HCV-infected patients who are not immune to these viruses because acute co-infection could lead to severe acute liver injury.18,27 Urge all HCV-infected patients to completely abstain from alcohol and, if necessary, refer them to an addiction specialist, because excess alcohol consumption is strongly associated with the development of cirrhosis and HCC.28,29
Comorbid conditions such as metabolic syndrome, obesity, and hyperlipidemia can worsen the prognosis for HCV-infected patients; therefore, intense counseling on weight loss is recommended.30 Statins are safe and beneficial for HCV patients with hypercholesterolemia and compensated cirrhosis.31
Teach patients that the primary mode of transmission of HCV is through infected blood. Sexual transmission of HCV has been well documented in HIV-positive men who have sex with men.32 Although the risk of transmission of HCV among heterosexual couples is extremely low, it is possible, and patients should be counseled accordingly.33 Transmission of HCV from mother to the baby occurs in up to 6% of births and most commonly occurs during delivery.34
Newer treatments are highly effective and well tolderated
HCV treatment has changed dramatically over the past few years. Previous treatments for HCV, particularly those containing interferon, were known for their poor tolerability due to adverse effects and low cure rates. Compared to previous therapies, the new interferon-free direct-acting antiviral (DAA) regimens are not only less complex but also shorter in duration, ranging from 8 to 24 weeks depending on the patient’s viral load, stage of liver disease, and previous treatment experience.18 The specific agents and dosages used in DAA regimens aren’t described here because these regimens are rapidly changing. However, continuously updated treatment recommendations from the American Association for the Study of Liver Diseases and the Infectious Diseases Society of America are available at http://www.hcvguidelines.org.
The goal of HCV treatment is cure as evidenced by a sustained virologic response (SVR), which is defined as the absence of HCV RNA 12 weeks or more after completing treatment.35,36 In general, for the most common genotypes of HCV, treatment with a DAA regimen results in a SVR in ≥95% of patients.18 Achieving SVR is associated with a 50% reduction in all-cause mortality, a 90% reduction in liver-associated mortality, and a >70% reduction in the risk of developing HCC.27,37,38 SVR also has been shown to have a significant effect on reducing extrahepatic manifestations of HCV infection, such as cryoglobulinemia and lymphoma.39-41
Current barriers to the newer, highly effective hepatitis C virus (HCV) infection treatments are largely financial. Although insurance companies have been able to negotiate substantial discounts from the high wholesale price of treatment, many insurance programs require prior authorizations and will approve treatment only for patients with advanced liver fibrosis. In our experience, many patients are left to wait for their liver disease to progress before their insurance company will agree to cover treatment.
In addition, many insurance companies have mandated that only subspecialists prescribe these medications. However, infectious diseases and hepatology specialists and their support staffs are often overburdened with paperwork and phone calls related to prior authorizations and justification of treatment, which can add to delays in treatment.
There is already evidence that treatment of all patients with HCV is cost-effective and leads to better healthcare outcomes42 and there are indications that these barriers will decrease over time, with prices already dropping significantly due to increasing competition between drug companies.
The DAAs are well tolerated and have good safety profiles. In phase III clinical trials of today’s most commonly used DAA regimens, the discontinuation rate was <1% in non-cirrhotic patients and 2% in those with cirrhosis.18 The most commonly reported adverse effects were nausea, fatigue, and headache. DAAs may have drug-drug interactions; therefore, careful medication reconciliation should be performed before initiating treatment.18
Prioritizing treatment. Current evidence supports treatment for all patients with HCV except those with a life expectancy of <12 months.18 Evidence indicates that treatment becomes less effective as a patient’s liver injury progresses to cirrhosis. Due to the high cost of available treatments, however, many insurers have imposed strict criteria for coverage. (See “Barriers to HCV Treatment,” above.42)
The highest priority for treatment has been given to patients with advanced liver fibrosis, compensated cirrhosis, those who have received a liver transplant, and those with severe extrahepatic manifestations (eg, mixed cryoglobulinemia and end-organ disease such as nephropathy). Treatment is also prioritized for high-risk populations (eg, patients with HBV and HIV co-infection, diabetes mellitus) and patients who are at high risk of transmitting the virus (eg, individuals who inject drugs or are incarcerated, men who have sex with men, women of childbearing age, hemodialysis patients, and health care professionals who perform exposure-prone procedures).18
While it may eventually become feasible for family physicians to treat HCV-infected patients, the rapid evolution and significant cost of treatment, as well as the challenges in obtaining insurance coverage, have kept HCV treatment largely in the domain of specialists, at least for now. In the interim, family physicians play a crucial role by screening, diagnosing, and counseling patients with this infection, referring them to specialty care, and providing ongoing monitoring for signs of HCC and esophageal and gastric varices.
CORRESPONDENCE
Laura Wangensteen, MD, Department of Family Medicine, Drexel University, 3401 South Market Street #105 A, Philadelphia, PA 19104; laura.wangensteen@drexelmed.edu
1. Rein DB, Wittenborn JS, Weinbaum CM, et al. Forecasting the morbidity and mortality associated with prevalent cases of precirrhotic chronic hepatitis C in the United States. Dig Liver Dis. 2011;43:66-72.
2. Armstrong GL, Wasley A, Simard EP, et al. The prevalence of hepatitis C virus infection in the United States, 1999 through 2002. Ann Intern Med. 2006;144:705-714.
3. Chak E, Talal AH, Sherman KE, et al. Hepatitis C virus infection in USA: an estimate of true prevalence. Liver Int. 2011;31:1090-1101.
4. Neumann AU, Lam NP, Dahari H, et al. Hepatitis C viral dynamics in vivo and the antiviral efficacy of interferon-alpha therapy. Science. 1998;282:103-107.
5. Mitchell AE, Colvin HM, Palmer Beasley R. Institute of Medicine recommendations for the prevention and control of hepatitis B and C. Hepatology. 2010;51:729-733.
6. Alter HJ, Seeff LB. Recovery, persistence, and sequelae in hepatitis C virus infection: a perspective on long-term outcome. Semin Liver Dis. 2000;20:17-35.
7. El-Serag HB. Hepatocellular carcinoma and hepatitis C in the United States. Hepatology. 2002;36:S74-S83.
8. Westbrook RH, Dusheiko G. Natural history of hepatitis C. J Hepatol. 2014;61:S58-S68.
9. McCaughan GW, George J. Fibrosis progression in chronic hepatitis C virus infection. Gut. 2004;53:318-321.
10. El-Serag HB, Hampel H, Yeh C, et al. Extrahepatic manifestations of hepatitis C among United States male veterans. Hepatology. 2002;36:1439-1445.
11. Solinas A, Piras MR, Deplano A. Cognitive dysfunction and hepatitis C virus infection. World J Hepatol. 2015;7:922-925.
12. Fletcher NF, Wilson GK, Murray J, et al. Hepatitis C virus infects the endothelial cells of the blood-brain barrier. Gastroenterology. 2012;142:634-643.e6.
13. Smith BD, Morgan RL, Beckett GA, et al; Centers for Disease Control and Prevention. Recommendations for the identification of chronic hepatitis C virus infection among persons born during 1945-1965. MMWR Recomm Rep. 2012;61:1-32.
14. US Preventive Services Task Force. Final recommendation statement on hepatitis C screening, June 2013. US Preventive Services Task Force Web site. Available at: http://www.uspreventiveservicestaskforce.org/Page/Document/RecommendationStatementFinal/hepatitis-c-screening. Accessed on December 28, 2014.
15. Arora S, Thornton K, Murata G, et al. Outcomes of treatment for hepatitis C virus infection by primary care providers. N Engl J Med. 2011;364:2199-2207.
16. Morrill JA, Shrestha M, Grant RW. Barriers to the treatment of hepatitis C. Patient, provider, and system factors. J Gen Intern Med. 2005;20:754-758.
17. Shivkumar S, Peeling R, Jafari Y, et al. Accuracy of rapid and pointof- care screening tests for hepatitis C: a systematic review and meta-analysis. Ann Intern Med. 2012;157:558-566.
18. American Association for the Study of Liver Diseases; Infectious Diseases Society of America; International Antiviral Society—USA. HCV guidance: Recommendations for testing, managing, and treating hepatitis C. HCV guidelines Web site. Available at: http://www.hcvguidelines.org. Accessed May 25, 2015.
19. Zarski JP, Bohn B, Bastie A, et al. Characteristics of patients with dual infection by hepatitis B and C viruses. J Hepatol. 1998;28:27-33.
20. Graham CS, Baden LR, Yu E, et al. Influence of human immunodeficiency virus infection on the course of hepatitis C virus infection: a meta-analysis. Clin Infect Dis. 2001;33:562-569.
21. Garcia-Tsao G, Friedman S, Iredale J, et al. Now there are many (stages) where before there was one: In search of a pathophysiological classification of cirrhosis. Hepatology. 2010;51:1445-1449.
22. Bedossa P, Poynard T. An algorithm for the grading of activity in chronic hepatitis C. The METAVIR Cooperative Study Group. Hepatology. 1996;24:289-293.
23. Ngo Y, Munteanu M, Messous D, et al. A prospective analysis of the prognostic value of biomarkers (FibroTest) in patients with chronic hepatitis C. Clin Chem. 2006;52:1887-1896.
24. Becker L, Salameh W, Sferruzza A, et al. Validation of hepascore, compared with simple indices of fibrosis, in patients with chronic hepatitis C virus infection in United States. Clin Gastroenterol Hepatol. 2009;7:696-701.
25. Bonder A, Afdhal N. Utilization of FibroScan in clinical practice. Curr Gastroenterol Rep. 2014;16:372.
26. Garcia-Tsao G, Sanyal AJ, Grace ND, et al; Practice Guidelines Committee of the American Association for the Study of Liver Diseases; Practice Parameters Committee of the American College of Gastroenterology. Prevention and management of gastroesophageal varices and variceal hemorrhage in cirrhosis. Hepatology. 2007;46:922-938.
27. Ghany MG, Strader DB, Thomas DL, et al; American Association for the Study of Liver Diseases. Diagnosis, management, and treatment of hepatitis C: an update. Hepatology. 2009;49:1335-1374.
28. Pessione F, Degos F, Marcellin P, et al. Effect of alcohol consumption on serum hepatitis C virus RNA and histological lesions in chronic hepatitis C. Hepatology. 1998;27:1717-1722.
29. Mueller S, Millonig G, Seitz HK. Alcoholic liver disease and hepatitis C: a frequently underestimated combination. World J Gastroenterol. 2009;15:3462-3471.
30. Ortiz V, Berenguer M, Rayón JM, et al. Contribution of obesity to hepatitis C-related fibrosis progression. Am J Gastroenterol. 2002;97:2408-2414.
31. Lewis JH, Mortensen ME, Zweig S, et al; Pravastatin in Chronic Liver Disease Study Investigators. Efficacy and safety of high-dose pravastatin in hypercholesterolemic patients with well-compensated chronic liver disease: Results of a prospective, randomized, double-blind, placebo-controlled, multicenter trial. Hepatology. 2007;46:1453-1463.
32. Gamage DG, Read TR, Bradshaw CS, et al. Incidence of hepatitis-C among HIV infected men who have sex with men (MSM) attending a sexual health service: a cohort study. BMC Infect Dis. 2011;11:39.
33. Terrault NA, Dodge JL, Murphy EL, et al. Sexual transmission of hepatitis C virus among monogamous heterosexual couples: the HCV partners study. Hepatology. 2013;57:881-889.
34. Yeung LT, King SM, Roberts EA. Mother-to-infant transmission of hepatitis C virus. Hepatology. 2001;34:223-229.
35. Swain MG, Lai MY, Shiffman ML, et al. A sustained virologic response is durable in patients with chronic hepatitis C treated with peginterferon alfa-2a and ribavirin. Gastroenterology. 2010;139:1593-1601.
36. Thomas AM, Kattakuzhy S, Jones S, et al. SVR durability: HCV patients treated with IFN-free DAA regimens. Presented at: Conference on Retroviruses and Opportunistic Infections (CROI); February, 2015; Seattle, Washington. Abstract 653.
37. Backus LI, Boothroyd DB, Phillips BR, et al. A sustained virologic response reduces risk of all-cause mortality in patients with hepatitis C. Clin Gastroenterol Hepatol. 2011;9:509-516.e1.
38. Russo MW. Antiviral therapy for hepatitis C is associated with improved clinical outcomes in patients with advanced fibrosis. Expert Rev Gastroenterol Hepatol. 2010;4:535-539.
39. Fabrizi F, Dixit V, Messa P. Antiviral therapy of symptomatic HCVassociated mixed cryoglobulinemia: meta-analysis of clinical studies. J Med Virol. 2013;85:1019-1027.
40. Takahashi K, Nishida N, Kawabata H, et al. Regression of Hodgkin lymphoma in response to antiviral therapy for hepatitis C virus infection. Intern Med. 2012;51:2745-2747.
41. Gisbert JP, García-Buey L, Pajares JM, et al. Systematic review: regression of lymphoproliferative disorders after treatment for hepatitis C infection. Aliment Pharmacol Ther. 2005;21:653-662.
42. Najafzadeh M, Andersson K, Shrank WH, et al. Cost-effectiveness of novel regimens for the treatment of hepatitis C virus. Ann Intern Med. 2015;162:407-419.

Legal matters – not just child’s play
Social media platforms are by far the most common form of communication among our teens. A 2015 study by the Pew Research Center stated that 71% of teens between the ages of 12 and 18 years use more than one form of social media. But little education and awareness of the legal implications of the information exchanged is provided to these teens, which has landed some of them in significant legal trouble.
Gone are the days when rivals could just pass mean comments to each other in the hallway or leave obnoxious comments on a bathroom wall. Today, within minutes malicious comments are quickly posted on social media to be shared by all. This makes the impact of the impulsive, mindless, and usually immature sentiments much more damaging, and unfortunately can result in severe, sometimes unforeseen consequences.
Cyberbullying is bullying or intimidating through electronic technology. This has become all too commonplace among teenagers because it takes so little to post unflattering pictures, or quotes, or threating messages from the privacy of your home. Much of what would never be spoken face to face is posted without regard. Two teen girls in Florida were charged with a felony for the suicide of a classmate they unrelentingly bullied. This was just one of many stories of a child being brought to despair by immature and cowardly teens misusing social media. Surely they never realized that their immature act would land them in jail. It is a crime to threaten to kill or seriously harm, menace, or harass a person for any reason, regardless of one’s age.
Defamation is a social tort that protects the reputation of a person from untrue comments or innuendos. In the past this was considered to be gossip or rumor-mongering, but now, given the advent of new technology, publishing these same comments makes one the author and, therefore, may be liable for defamation of character. This may not mean jail time for a person, but can certainly land that person in court, requiring his or her parents to incur significant legal fees.
Probably the most important legal issue that teens – as well as adults – should know about are the laws regarding sexual texting or “sexting.” For those of us born in the era before social media, sexting is the distribution of nude pictures of themselves or anyone else. When the image is that of a person under the age of 18 years, it is considered child pornography and subject to punishment by law. Because child pornography is taken very seriously, dosomething.org is a website for young people that promotes social awareness in hopes of changing behavior. This site presents the alarming percentages of teens who send and or receive nude or sexually explicit photos. Many have no idea they are committing a felony.
The unfortunate reality is that many photos or videos that were exchanged between trusted friends end up in the hands of ill-intended teens and get widely disseminated on social media. Anyone caught having or disseminating child pornography, regardless of who started it, is at risk of criminal repercussions. There have been several so-called “THOT” pages (That Ho Over There) started at high schools where students published nude pictures of classmates. These pages go viral within minutes, and although they are taken down quickly, the damage usually is already done. These actions can result in expulsion and suspension of students and significant emotional distress to the victim.
Another legal concern is the issue of privacy. Many users don’t realize that personal information displayed on social media can be easily obtained and misused. Identity theft is on the rise, not just because criminals are more savvy, but because so many people are careless with their information. Disclosure of email, birth date, and cell phone number are all desirable pieces of information that drive marketing, but more importantly, allows information to be used and misconstrued by anyone to create a phony identity, gain access to accounts, stalk, harass, or even resort to blackmail. The unauthorized use of personal information is illegal and punishable by law.
Another legal issue associated with social media are copyright laws. Many teens, as well as adults, have no idea of the laws that protect the music, videos, pictures, and images thoughtlessly placed on social media. Most don’t realize that just because it is commonly done doesn’t mean that it’s legal. Once a picture is posted, it can be shared, altered, and downloaded all over the world by anyone.
There have been reports of lawsuits brought by parents who found pictures of their children were used in advertisements by major companies without their knowledge or permission. Companies, likewise, have brought suit against individuals who have unknowingly misused their product in a post to entertain their friends. In fact, many of the apps that people download have a check box to acknowledge that the owners are free to use material posted at their discretion, which most folks check without reading the fine print. Because the laws on the books lag behind the changing times, there is often a lot of room for interpretation that puts everyone at risk. So teenagers must understand that just because material is published doesn’t mean it is free to be used for personal distribution.
Primary care physicians play a critical role in educating families. Dosomething.org and stopbullying.gov are two great resources for parents and children alike. Educating teens to the legal and social repercussions is key in protecting them. Schools and parents have to be aware themselves and continually stress the importance of Internet safety and appropriate use of social media.
Dr. Pearce is a pediatrician in Frankfort, Ill. This article is meant to be educational and does not constitute medical, ethical, or legal advice. Email her at pdnews@frontlinemedcom.com

Genomic oncology: moving beyond the tip of the iceberg
In the 15 years since the first map of the human genome emerged, genetics has become an integral part of medical practice worldwide.1 Oncology is no exception; the genetic origins of cancer were suspected more than a century ago and it is now well understood that most cancers are driven by genetic alterations that disrupt key cellular pathways involved in tumor survival and progression.2
In the 15 years since the first map of the human genome emerged, genetics has become an integral part of medical practice worldwide.1 Oncology is no exception; the genetic origins of cancer were suspected more than a century ago and it is now well understood that most cancers are driven by genetic alterations that disrupt key cellular pathways involved in tumor survival and progression.2
In the 15 years since the first map of the human genome emerged, genetics has become an integral part of medical practice worldwide.1 Oncology is no exception; the genetic origins of cancer were suspected more than a century ago and it is now well understood that most cancers are driven by genetic alterations that disrupt key cellular pathways involved in tumor survival and progression.2
Persistent mutations linked to poorer outcomes in AML
Persistent leukemia-associated mutations that can be detected in at least 5% of bone marrow cells at 30 days after remission were associated with a significantly increased risk of relapse and reduced overall survival in patients with acute myeloid leukemia (AML), in a study published Aug. 25 in JAMA.
About 20% of adult patients with AML fail to achieve remission following standard initial induction chemotherapy, and approximately half of them will subsequently experience a relapse after achieving complete remission. Currently, tests that predict outcomes for these patients are imprecise, especially for those with intermediate-risk disease.

“The data presented in this report begin to define a genomic method for the risk stratification of patients with AML that places greater emphasis on the clearance of somatic mutations after chemotherapy than the identification of specific mutations at the time of presentation,” wrote Dr. Jeffery M. Klco, Washington University, St Louis, and his colleagues. (JAMA. 2015;314[8]:811-22).
Whole-genome or exome sequencing was performed on samples that were obtained at disease presentation from 71 patients with AML who were treated with standard induction chemotherapy in March 2002, with follow-up through January 2015. A subsequent re-analysis was conducted in a cohort of 50 patients, who had available samples from both presentation and documented remission.
Of this group, 24 (48%) had persistent leukemia-associated mutations in at least 5% of bone marrow cells at remission, while 26 patients had cleared all mutations.
The investigators noted that patients with at least one persistent mutation on day 30 had significantly reduced event-free survival compared with those who had cleared all mutations (median, 6.0 months [95% CI, 3.7-9.6] vs 17.9 months [95% CI, 11.3-40.4], hazard ratio [HR], 3.67 [95%CI, 1.93-7.11], P less than .001).
Findings were similar for overall survival. Median survival was 10.5 months [95% CI, 7.5-22.2] for those with persistent mutations vs 42.2 months [95% CI, 20.6-not estimable] for those without them (HR, 2.86 [95% CI, 1.39-5.88], P = .004).
The results were similar for the 32 patients with intermediate-risk AML, in that persistent mutations were associated with reduced event-free survival as well as overall survival.
As well as providing critical insights into the role of molecular monitoring in AML and the dynamics of genetic mutations during AML treatment, the findings of this study suggest that the clearance of all leukemia-associated mutations was associated with favorable overall survival. Thus, clearance of all leukemia cells and of preleukemic cells with founder mutations is necessary to achieve a cure in this disease.
But to cure patients with AML, it may be important to direct therapy after remission toward the eradication of disease-initiating mutations, including epigenetic modifiers, given these mutations are often present at clinical remission and can initiate relapse through the acquisition of additional mutations.
Since this was a small, single-institution cohort, high-quality studies in larger AML cohorts are needed, to ascertain if whole-genome or whole-exome sequencing or other state-of-the-art genomic approaches used at the time of diagnosis can better predict prognosis than currently used methodologies.
Although subsequent studies will be needed to validate these findings and to credential clinical-grade assays for dynamic molecular studies, these data illustrate that the depth of remission after initial therapy represents an important parameter that is not sufficiently interrogated in the clinical context.
Dr. Friederike Pastore, of the human oncology and pathogenesis program, Memorial Sloan Kettering Cancer Center, New York, is receiving a grant from the German Research Foundation. Dr. Ross L Levine, of the leukemia service, department of medicine, Memorial Sloan Kettering Cancer Center, New York, has no disclosures. These remarks were taken from their editorial accompanying Dr. KLco’s report (JAMA. 2015;314[8]:778-80.).
Persistent leukemia-associated mutations that can be detected in at least 5% of bone marrow cells at 30 days after remission were associated with a significantly increased risk of relapse and reduced overall survival in patients with acute myeloid leukemia (AML), in a study published Aug. 25 in JAMA.
About 20% of adult patients with AML fail to achieve remission following standard initial induction chemotherapy, and approximately half of them will subsequently experience a relapse after achieving complete remission. Currently, tests that predict outcomes for these patients are imprecise, especially for those with intermediate-risk disease.
“The data presented in this report begin to define a genomic method for the risk stratification of patients with AML that places greater emphasis on the clearance of somatic mutations after chemotherapy than the identification of specific mutations at the time of presentation,” wrote Dr. Jeffery M. Klco, Washington University, St Louis, and his colleagues. (JAMA. 2015;314[8]:811-22).
Whole-genome or exome sequencing was performed on samples that were obtained at disease presentation from 71 patients with AML who were treated with standard induction chemotherapy in March 2002, with follow-up through January 2015. A subsequent re-analysis was conducted in a cohort of 50 patients, who had available samples from both presentation and documented remission.
Of this group, 24 (48%) had persistent leukemia-associated mutations in at least 5% of bone marrow cells at remission, while 26 patients had cleared all mutations.
The investigators noted that patients with at least one persistent mutation on day 30 had significantly reduced event-free survival compared with those who had cleared all mutations (median, 6.0 months [95% CI, 3.7-9.6] vs 17.9 months [95% CI, 11.3-40.4], hazard ratio [HR], 3.67 [95%CI, 1.93-7.11], P less than .001).
Findings were similar for overall survival. Median survival was 10.5 months [95% CI, 7.5-22.2] for those with persistent mutations vs 42.2 months [95% CI, 20.6-not estimable] for those without them (HR, 2.86 [95% CI, 1.39-5.88], P = .004).
The results were similar for the 32 patients with intermediate-risk AML, in that persistent mutations were associated with reduced event-free survival as well as overall survival.
FROM JAMA
Key clinical point: Leukemia-associated mutations that persisted 30 days after chemotherapy initiation were associated with a significantly increased risk of relapse and reduced overall survival in patients with AML.
Major finding: Patients with one persistent mutation at day 30 had an overall median survival of 10.5 months compared to 42.2 months for those who cleared all mutations (P = .003; HR, 2.86 [95% CI, 1.39-5.88]).
Data source: Whole-genome or exome sequencing was performed on specimens from 71 AML patients treated at a single center with standard induction chemotherapy.
Disclosures: The study was supported by grants from the National Institutes of Health and from the Barnes–Jewish Hospital Foundation. Dr. Spencer reports receiving personal fees from Cofactor Genomics, Dr Duncavage reports receiving personal fees from Cofactor Genomics and nonfinancial support from Agilent Technologies, and Dr Ozenberger reports receiving grant funding from the National Cancer Institute. There were no other disclosures.

Zeroing in on the cause of your patient's facial pain
› Advise patients who have a temporomandibular disorder that in addition to taking their medication as prescribed, they should limit activities that require moving their jaw, modify their diet, and minimize stress; they may require physical therapy and therapeutic exercises. C
› Consider prescribing a tricyclic antidepressant for patients with persistent idiopathic facial pain. C
Strength of recommendation (SOR)
A Good-quality patient-oriented evidence
B Inconsistent or limited-quality patient-oriented evidence
C Consensus, usual practice, opinion, disease-oriented evidence, case series
Facial pain is a common complaint: Up to 22% of adults in the United States experience orofacial pain during any 6-month period.1 Yet this type of pain can be difficult to diagnose due to the many structures of the face and mouth, pain referral patterns, and insufficient diagnostic tools.
Specifically, extraoral facial pain can be the result of temporomandibular disorders, neuropathic disorders, vascular disorders, or atypical causes, whereas facial pain stemming from inside the mouth can have a dental or nondental cause (FIGURE). Overlapping characteristics can make it difficult to distinguish these disorders. To help you to better diagnose and manage facial pain, we describe the most common causes and underlying pathological processes.
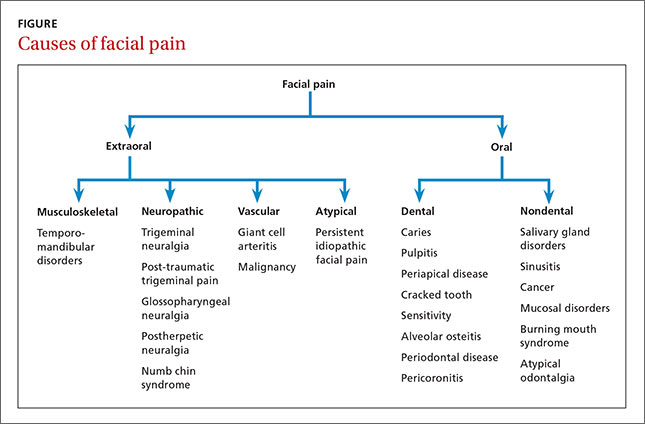
Extraoral facial pain
Extraoral pain refers to the pain that occurs on the face outside of the oral cavity. The TABLE2-15 summarizes the site, timing and severity, aggravating factors, history and exam findings, and management of several common causes of extraoral facial pain.
Musculoskeletal pain
Temporomandibular disorders (TMD) are a broad group of problems that affect the temporomandibular joint (TMJ), muscles of mastication, and/or associated bony and soft tissue structures.6 They may occur secondary to malocclusion, traumatic injuries, oral parafunctional habits (eg, bruxism), hormonal influences, or psychogenic factors.6 TMD is more prevalent in women, with a peak occurrence between ages 20 and 40 years.6,8
TMD can be articular (intracapsular) or nonarticular (extracapsular). Nonarticular disorders (>50% of TMD) usually affect the muscles of mastication and include chronic conditions such as fibromyalgia, muscle strain, and myopathies.8 Muscle-related pain and dysfunction are believed to arise from parafunctional habits such as bruxism or clenching. Articular disorders include synovitis/capsulitis, joint effusion, trauma/fracture, internal derangement (disturbance in the normal anatomic relationship between the disc and condyle), arthritis, and neoplasm.16
What you’ll see. Orofacial pain (usually dull and located in the preauricular region), joint noise, and restricted jaw function are key signs and symptoms of TMD. Exacerbation of pain with mandibular functions (eg, chewing, yawning, or swallowing) is a pathognomonic sign. Joint sounds such as clicking or crepitus are common. In most cases, crepitus correlates with osteoarthritis.6 Nonspecific TMD symptoms include headache, earache, insomnia, tinnitus, and neck and shoulder pain.6
The gold standard of diagnosis of TMD consists of taking a detailed history, evaluating the patient’s head and neck, and conducting a general physical examination and behavioral/psychological assessment.17 Imaging of the TMJ and associated structures is essential.17
Treatment. Nonsteroidal anti-inflammatory drugs, opioids, muscle relaxants, antidepressants, anticonvulsants, anxiolytics, and corticosteroids are options for treating TMD.6,8 Isometric jaw exercises, maxillomandibular appliances, and physical therapy are valuable adjuncts for pain relief. Advise patients to establish a self-care routine to reduce TMJ pain that might include changing their head posture or sleeping position, and limiting activities that require using their jaw, such as clenching, bruxism, and excessive gum chewing. Some patients may need to adopt a non-chewing diet that consists of liquid or pureed food. Massage and moist heat can help relax muscles of mastication and improve range of motion.
Approximately 5% of patients with TMD undergo surgery, typically simple arthrocentesis, arthroscopy, arthrotomy, or modified condylotomy.6 Total joint replacement is indicated only for patients with severely damaged joints with end-stage disease when all other conservative treatments have failed. Joint replacement primarily restores form and function; pain relief is a secondary benefit.8
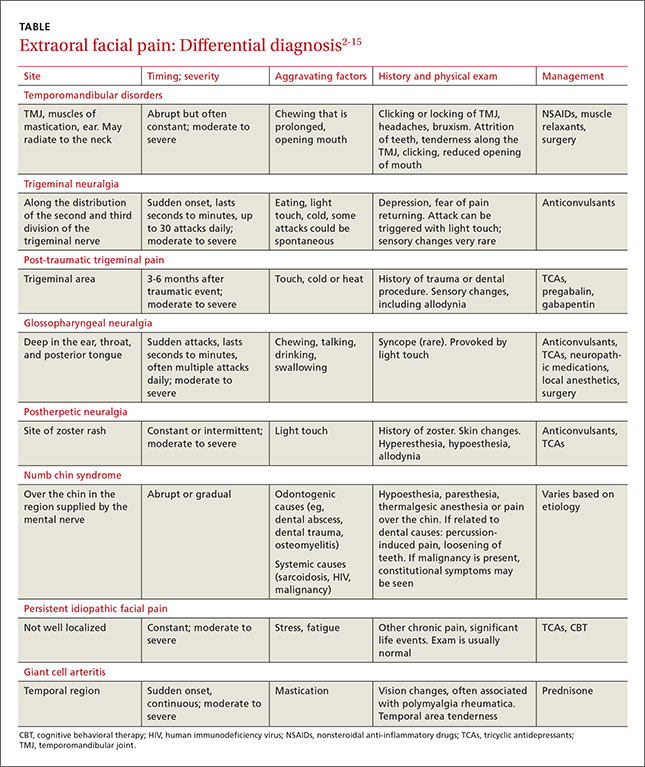
Neuropathic pain
Trigeminal neuralgia (TN) is sudden, usually unilateral, severe, brief, stabbing, recurrent episodes of pain in the distribution of one or more branches of the trigeminal nerve.9 It most commonly presents in the lower 2 branches of the trigeminal nerve and usually is caused by compression of the trigeminal nerve root by vascular or nonvascular causes.4 The pain is severe and can profoundly impact a patient’s quality of life.
TN attacks typically last from a few seconds to up to 2 minutes. As many as 30 attacks can occur daily, with refractory periods between attacks. After the initial attack, individuals are left with a residual dull or burning pain. TN can be triggered by face washing, teeth brushing, speaking, eating, shaving, or cold wind.4
Diagnosis can be tricky because more than half of patients with TN experience less severe pain after the main sharp attack; this presentation is called TN type II.7 A detailed patient history and careful evaluation can help identify patients with TN type II. TN can be misdiagnosed as TMD, especially if it presents unilaterally.15
Treatment. Anticonvulsants are the primary medications used to treat TN.
Post-traumatic trigeminal pain is usually the result of an injury or dental procedure, such as facial trauma, tooth extraction, root canal, or dental implants.12,18,19 Nerve injury is assumed to be the cause. This type of pain can start within 3 to 6 months of a trauma. It is located in the trigeminal area and patients describe it as burning, tingling and, at times, sharp.15 Patients who have sustained injury to the lingual or inferior alveolar nerves have reported feeling “pins and needles.”12
Common triggers include temperature changes or simple touch. Not all injuries result in pain; some patients may have only sensory impairment15 or sensory deficits such as allodynia or hypoesthesia.
Treatment. The first line of treatment for post-traumatic trigeminal pain is tricyclic antidepressants (TCAs) followed by pregabalin or gabapentin.14
Glossopharyngeal neuralgia (GN) is similar in presentation to TN but is much rarer.15 GN pain occurs deep in the throat, ear, or posterior tongue.15 When the pain occurs in the inner ear, GN can be misdiagnosed as TMD. In most cases, no cause of GN can be determined.
Patients describe GN pain as shooting, sharp, and electrical shock-like, lasting from seconds to minutes, with recurrent attacks throughout the day. Like TN, GN can present as episodes of attacks that last weeks to months. Triggers include chewing, drinking, swallowing, and talking, as well as light touch.13,15 Some patients with GN experience syncope due to the anatomical proximity of the vagus nerve.14
Treatment. Anticonvulsants are the first-line treatment for GN. Local anesthetics or surgery can be considered for patients who don’t improve after medical therapy.15
Postherpetic neuralgia (PHN) can cause facial pain when the characteristic vesicular rash of the varicella zoster virus (shingles) occurs on the face. PHN usually affects the first division of trigeminal nerve, but the second and third divisions can be affected as well.13
What you’ll see. The acute phase of PHN begins a few days before the initial rash has resolved and can last up to a month after. A new pain may begin one to 6 months after the initial rash has healed.20 This pain, which patients often describe as sharp, stabbing, or burning, can be constant or intermittent. Dysesthesia, hypoesthesia, and allodynia may also occur within the affected dermatome.
PHN is usually diagnosed based on the patient’s history and clinical presentation. However, direct fluorescent antibody stain, viral culture, or polymerase chain reaction performed on vesicular fluid from a herpetic lesion during the initial rash are the laboratory tests of choice if confirmation is needed.
Treatment. PHN is managed with anticonvulsants and TCAs.
Numb chin syndrome (NCS) is characterized by hypoesthesia, paresthesia, thermalgesic anesthesia, or pain over the chin in the region supplied by the mental nerve, a terminal branch of the mandibular division of the trigeminal nerve.5,21,22
NCS can be caused by odontogenic conditions, such as dental abscess, dental anesthesia, dental trauma, or osteomyelitis; systemic conditions such as amyloidosis, sickle cell disease, sarcoidosis, multiple sclerosis, human immunodeficiency virus, or diabetes; or malignancies such as lymphoma, leukemia, breast cancer, lung cancer, prostate cancer, or head and neck cancers.21 In one study of patients with NCS, cancer was the cause of the condition in 89% of patients.22
What you’ll see. NCS is characterized by numbness of the skin in the lower lip, chin and mucous membrane inside the lip that extends to the midline.5 Depending upon the etiology, patients may present with percussion-induced pain, loosening of teeth, sequestra, and mobility of fractured segments. Patients with metastatic malignancy may develop constitutional symptoms.
Making the diagnosis. Panoramic radiography is a useful starting point. If possible, a computerized tomography scan of the head and neck should also be done. Nuclear bone scintigraphy (bone scanning) may help identify bone disease such as osteomyelitis. A biopsy may be needed if a mass lesion is present.
Treatment. In NCS that is the result of a dental etiology, the prognosis usually is good. For example, NCS that is the result of an abscess usually resolves after the abscess is drained. However, if NCS is caused by metastasis, the prognosis is grim; the average length of survival after diagnosis is approximately 5 months if NCS is caused by mandibular metastasis and 12 months if leptomeningeal metastasis is present. Treatment does little to affect the outcome in these cases.21,22
Atypical pain
Persistent idiopathic facial pain (PIFP), previously known as atypical facial pain, is a persistent facial pain that does not have the classical characteristics of cranial neuralgias and for which there is no obvious cause.2,10,23 PIFP is not triggered by any of the factors that typically precipitate neuralgias.2 The onset may be spontaneous or associated with dental intervention or facial injury, but it usually does not have a demonstrable local cause.24,25
Neuropathic mechanisms that might be at work in PIFP include nociceptor sensitization, phenotypic changes and ectopic activity from the nociceptors, central sensitization possibly maintained by ongoing activity from initially damaged peripheral tissues, sympathetic abnormal activity, alteration of segmental inhibitory control, or hyperactivity or hypoactivity of descending controls.2
PIFP is most frequently reported in women in their 40s and 50s.25 The history of a patient with PIFP often include mood disorders, chronic pain, or poor coping skills.14 Patients complain of a steady, unilateral, poorly localized pain that is deep, constant, aching, pulling, or crushing. It is usually present all day, every day. The constancy of the pain is its distinguishing feature. In the beginning, this pain may be in a limited area on one side of the face, usually the nasolabial folds or the angle of the mandible. Later, it may affect both sides of the face and extend to the neck and upper limbs.23,24 Most patients with PIFP report other symptoms, including headache, neck and backache, dermatitis, pruritus, irritable bowel, and dysfunctional uterine bleeding.26
Making the diagnosis. A targeted history and accurate clinical examination are essential.2,10 Although there are no formal diagnostic criteria, a patient can be assumed to have PIFP if:2,10
• There is pain in the face for most of the day or all day, every day.
• Initially, the pain may be confined to a portion of the face, but it is poorly localized and deep.
• The pain is not associated with other physical signs or loss of sensation.
• Imaging does not reveal an obvious anatomic or structural cause.
Treatment. Treatment of PIFP can be difficult and unsatisfactory.23 Counseling to educate patients about the chronic and nonmalignant nature of the illness is the mainstay of treatment, followed by pharmacotherapy.23 TCAs have shown a moderate effect in several trials. Gabapentin, topiramate, carbamazepine, and pregabalin also have shown limited to modest benefit in some patients. Surgical therapies appear to be of little or no use.23 Experimental treatments such as pulsed radiofrequency, low-energy level diode laser have shown success in small studies.10,23
Vascular pain
Giant cell arteritis (GCA) is a systemic, chronic vasculitis involving the large and medium-sized vessels, mainly the extracranial branches of the carotid artery.6,11 It predominantly affects people older than age 50 and is more common among women and those of Scandinavian ethnicity.27
The cause of GCA is unclear. Genetic predisposition linked to humoral and cellmediated immunity is believed to play a role.28 Familial aggregation and predominance of the HLA-DR4 allele has been reported in patients with GCA.6
What you’ll see. The most common signs and symptoms of GCA are temporal headache (seen in two-thirds of patients), jaw claudication and tenderness, and swelling of the temporal artery.6,11 The headache of GCA usually is unilateral, severe, boring or lancinating, and localized to the temporal or occipital regions of the scalp.6 Other orofacial manifestations include trismus, throat pain that develops while chewing, changes in tongue sensation and tongue claudication, tooth pain, dysphagia, dysarthria, submandibular mass, lip and chin numbness, macroglossia, glossitis, lip and tongue necrosis, and facial swelling.11
Visual symptoms include diplopia, ptosis, and possibly blindness if treatment is not instituted at first suspicion. Ocular symptoms result from anterior ischemic optic neuropathy, posterior ischemic optic neuropathy, or central retinal or cilioretinal artery occlusion.6,28 Patients have also reported low-grade fever, asthenia, anorexia, weight loss, and generalized aches.11,28
Making the diagnosis. Arterial biopsy is the gold standard for diagnosis of GCA. It is usually performed on the temporal artery and is positive in 80% to 95% of people with the condition.28 Other useful lab tests include erythrocyte sedimentation rate (ESR; elevated), white blood cell count (mildly elevated), and C-reactive protein (elevated).
Treatment. Prednisone is used to treat GCA, in initial doses ranging from 30 to 80 mg. A maintenance dose may be required for up to 2 years, with close follow-up and periodic ESR measurements.28
Malignancy is a rare cause of facial pain. The pain may be due to metastasis of extracranial bony or soft tissue as it compresses cervical and cranial nerves.3 Lung cancer can cause referred pain in the periauricular region by compressing the vagus nerve, and this pain can be misdiagnosed as dental pain, atypical facial pain, TMD, or TN.3,29 The facial pain of lung cancer is unilateral and on the same side as the lung neoplasm, and commonly is referred to the jaw, ear, or temporal region. While many patients have continuous pain, some report intermittent pain or pain that lasts for hours.3 Facial pain caused by a malignancy is differentiated from other sources of facial pain by the presence of associated symptoms such as weight loss, cough, and hemoptysis.
Treatment. Treatment can include radiation or chemotherapy.29
The mouth is often the source of lower facial pain
Pain in the oral cavity is the most common cause of pain in the lower face.15 Intraoral pain usually is caused by disease in the following structures:
1. Dentition (eg, caries, dentin sensitivity, pulpal disease)
2. Periodontium (eg, gingivitis, acute or chronic periodontal disease, sensitivity related to gum recession, alveolar bone pathology)
3. Other soft and hard tissues, such as the palate, floor of mouth, buccal mucosa, non-tooth supporting bone, and tongue (eg, mucosal diseases, neoplasms, pain related to parafunction or trauma).
Rarely, intraoral pain may be referred. For example, myofascial pain might cause diffuse tooth pain.30
See TABLE W131-35 at the end of this article for a summary of the etiology, signs/symptoms, diagnosis, and management of these and other dental causes of oral facial pain.
Nondental causes of oral facial pain can be associated with oral mucosal disorders, malignant disease and its therapy, salivary gland disorders, maxillary sinusitis, burning mouth syndrome, or atypical odontalgia. See TABLE W236-41 for a more detailed description of these conditions.
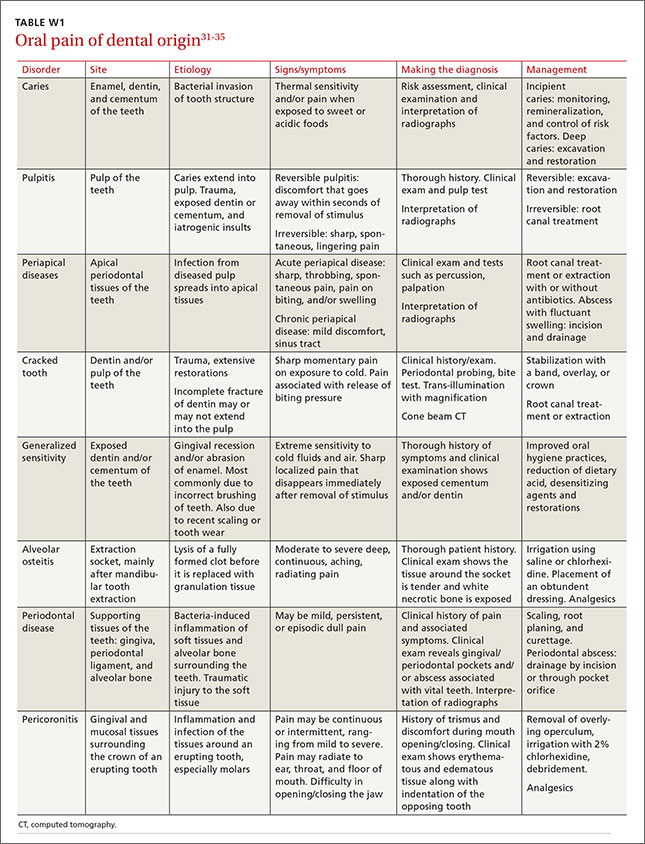
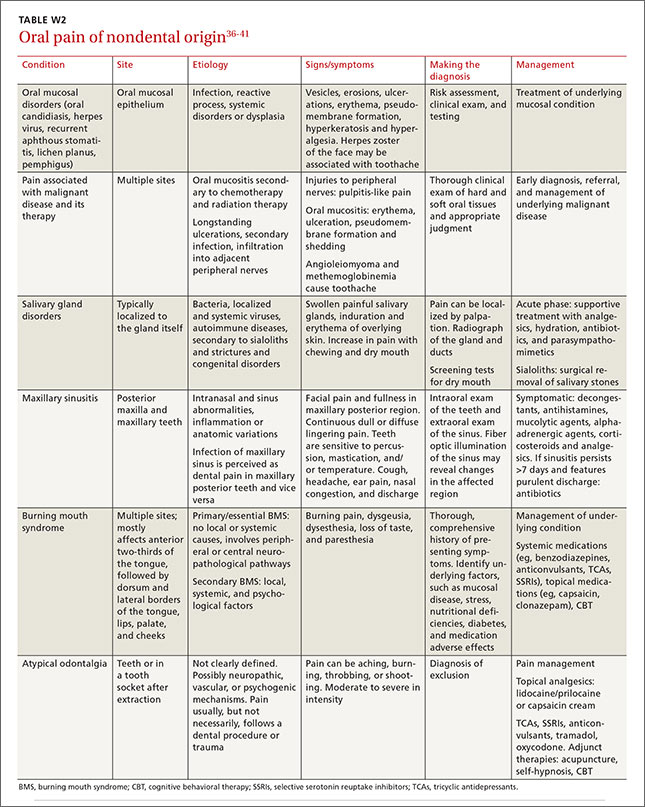
CORRESPONDENCE
Tamer H. Said, MD, MetroHealth Medical Center, 2500 MetroHealth Drive, Cleveland, Ohio 44109; tsaid@metrohealth.org
1. Lipton JA, Ship JA, Larach-Robinson D. Estimated prevalence and distribution of reported orofacial pain in the United States. J Am Dent Assoc. 1993;124:115-1121.
2. Agostoni E, Frigerio R, Santoro P. Atypical facial pain: clinical considerations and differential diagnosis. Neurol Sci. 2005;26:S71-S74.
3. Bajwa Z, Ho C, Khan S, et al. Overview of craniofacial pain. UpTo-Date Web site. Available at: http://www.uptodate.com/contents/overview-of-craniofacial-pain. Accessed January 28, 2015.
4. Bendtsen L, Birk S, Kasch H, et al. Reference programme: Diagnosis and treatment of headache disorders and facial pain. Danish Headache Society, 2nd Edition, 2012. J Headache Pain. 2012;13:S1-S29.
5. Divya KS, Moran NA, Atkin PA. Numb chin syndrome: a case series and discussion. Br Dent J. 2010;208:157-160.
6. Kapur N, Kamel IR, Herlich A. Oral and craniofacial pain: diagnosis, pathophysiology, and treatment. Int Anesthesiol Clin. 2003;41:115-150.
7. Limonadi FM, McCartney S, Burchiel KJ. Design of an artificial neural network for diagnosis of facial pain syndromes. Stereotact Funct Neurosurg. 2006;84:212-220.
8. Liu F, Steinkeler A. Epidemiology, diagnosis, and treatment of temporomandibular disorders. Dent Clin North Am. 2013;57:465-479.
9. Merskey H, Bogduk N (eds). Classification of Chronic Pain. Descriptors of Chronic Pain Syndromes and Definition of Pain Terms, 2nd ed. Seattle, WA: International Association for the Study of Pain Press; 1994.
10. Nguyen CT, Wang MB. Complementary and integrative treatments: atypical facial pain. Otolaryngol Clin North Am. 2013;46:367-382.
11. Reiter S, Winocur E, Goldsmith C, et al. Giant cell arteritis misdiagnosed as temporomandibular disorder: a case report and review of the literature. J Orofac Pain. 2009;23:360-365.
12. Renton T, Adey-Viscuso D, Meechan JG, et al. Trigeminal nerve injuries in relation to local anaesthesia in mandibular injections. Br Dent J. 2010;209:E15.
13. Shephard MK, Macgregor EA, Zakrzewska JM. Orofacial pain: a guide for the headache physician. Headache. 2014;54:22-39.
14. Zakrzewska JM. Differential diagnosis of facial pain and guidelines for management. Br J Anaesth. 2013;111:95-104.
15. Zakrzewska JM. Multi-dimensionality of chronic pain of the oral cavity and face. J Headache Pain. 2013;14:37.
16. Herb K, Cho S, Stiles MA. Temporomandibular joint pain and dysfunction. Curr Pain Headache Rep. 2006;10:408-414.
17. American Society of Temporomandibular Joint Surgeons. Guidelines for diagnosis and management of disorders involving the temporomandibular joint and related musculoskeletal structures. Cranio. 2003;21:68-76.
18. Benoliel R, Zadik Y, Eliav E, et al. Peripheral painful traumatic trigeminal neuropathy: clinical features in 91 cases and proposal of novel diagnostic criteria. J Orofac Pain. 2012;26:49-58.
19. Brooke RI. Atypical odontalgia. A report of twenty-two cases. Oral Surg Oral Med Oral Pathol. 1980;49:196-199.
20. Bouhassira D, Chassany O, Gaillat J, et al. Patient perspective on herpes zoster and its complications: an observational prospective study in patients aged over 50 years in general practice. Pain. 2012;153:342-349.
21. Baskaran RK, Krishnamoorthy, Smith M. Numb chin syndrome—a reflection of systemic malignancy. World J Surg Oncol. 2006;4:52.
22. Lata J, Kumar P. Numb chin syndrome: a case report and review of the literature. Indian J Dent Res. 2010;21:135-137.
23. Cornelissen P, van Kleef M, Mekhail N, et al. Evidence-based interventional pain medicine according to clinical diagnoses. 3. Persistent idiopathic facial pain. Pain Pract. 2009;9:443-448.
24. Didier H, Marchetti C, Borromeo G, et al. Persistent idiopathic facial pain: multidisciplinary approach and assumption of comorbidity. Neurol Sci. 2010;31:S189-S195.
25. Klasser G. Management of persistent idiopathic facial pain. J Can Dent Assoc. 2013;79:d71.
26. Abiko Y, Matsuoka H, Chiba I, et al. Current evidence on atypical odontalgia: diagnosis and clinical management. Int J Dent. 2012;2012:518548.
27. Sheldon CA, White VA, Holland SP. Giant cell arteritis presenting with bilateral loss of vision and jaw pain: reminder of a potentially devastating condition. J Can Dent Assoc. 2011;77:b55.
28. Rockey JG, Anand R. Tongue necrosis secondary to temporal arteritis: a case report and literature review. Oral Surg Oral Med Oral Pathol Oral Radiol Endod. 2002;94:471-473.
29. Sarlani E, Schwartz AH, Greenspan JD, et al. Facial pain as first manifestation of lung cancer: a case of lung cancer-related cluster headache and a review of the literature. J Orofac Pain. 2003;17:262-267.
30. Kumar A, Brennan MT. Differential diagnosis of orofacial pain and temporomandibular disorder. Dent Clin North Am. 2013;57:419-428.
31. Laudenbach JM, Simon Z. Common dental and periodontal diseases: evaluation and management. Med Clin North Am. 2014;98:1239-1260.
32. Napeñas JJ. Intraoral pain disorders. Dent Clin North Am. 2013;57:429-447.
33. Vickers ER, Zakrzewska JM. Dental causes of orofacial pain. In: Orofacial Pain. Zakrzewska JM, ed. Oxford, UK: Oxford University Press; 2009:69-81.
34. Pierse JE, Dym H, Clarkson E. Diagnosis and management of common postextraction complications. Dent Clin North Am. 2012;56:75-93.
35. Renton T. Dental (odontogenic) pain. Br J Pain. 2011;5:2-7.
36. Yatani H, Komiyama O, Matsuka Y, et al. Systematic review and recommendations for nonodontogenic toothache. J Oral Rehabil. 2014;41:843-852.
37. Klasser GD, Fischer DJ, Epstein JB. Burning mouth syndrome: recognition, understanding, and management. Oral Maxillofac Surg Clin North Am. 2008;20:255-271.
38. Balasubramaniam R, Turner LN, Fischer D, et al. Non-odontogenic toothache revisited. Open Journal of Stomatology. 2011;1:92-102.
39. Patton LL, Siegel MA, Benoliel R, et al. Management of burning mouth syndrome: systematic review and management recommendations. Oral Surg Oral Med Oral Pathol Oral Radiol Endod. 2007;103:S39.e1-e13.
40. Cascarini L, McGurk M. Epidemiology of salivary gland infections. Oral Maxillofac Surg Clin North Am. 2009;21:353-357.
41. Hegarty AM, Zakrzewska JM. Differential diagnosis for orofacial pain, including sinusitis, TMD, trigeminal neuralgia. Dent Update. 2011;38:396-400,402-403,405-406.
› Advise patients who have a temporomandibular disorder that in addition to taking their medication as prescribed, they should limit activities that require moving their jaw, modify their diet, and minimize stress; they may require physical therapy and therapeutic exercises. C
› Consider prescribing a tricyclic antidepressant for patients with persistent idiopathic facial pain. C
Strength of recommendation (SOR)
A Good-quality patient-oriented evidence
B Inconsistent or limited-quality patient-oriented evidence
C Consensus, usual practice, opinion, disease-oriented evidence, case series
Facial pain is a common complaint: Up to 22% of adults in the United States experience orofacial pain during any 6-month period.1 Yet this type of pain can be difficult to diagnose due to the many structures of the face and mouth, pain referral patterns, and insufficient diagnostic tools.
Specifically, extraoral facial pain can be the result of temporomandibular disorders, neuropathic disorders, vascular disorders, or atypical causes, whereas facial pain stemming from inside the mouth can have a dental or nondental cause (FIGURE). Overlapping characteristics can make it difficult to distinguish these disorders. To help you to better diagnose and manage facial pain, we describe the most common causes and underlying pathological processes.
Extraoral facial pain
Extraoral pain refers to the pain that occurs on the face outside of the oral cavity. The TABLE2-15 summarizes the site, timing and severity, aggravating factors, history and exam findings, and management of several common causes of extraoral facial pain.
Musculoskeletal pain
Temporomandibular disorders (TMD) are a broad group of problems that affect the temporomandibular joint (TMJ), muscles of mastication, and/or associated bony and soft tissue structures.6 They may occur secondary to malocclusion, traumatic injuries, oral parafunctional habits (eg, bruxism), hormonal influences, or psychogenic factors.6 TMD is more prevalent in women, with a peak occurrence between ages 20 and 40 years.6,8
TMD can be articular (intracapsular) or nonarticular (extracapsular). Nonarticular disorders (>50% of TMD) usually affect the muscles of mastication and include chronic conditions such as fibromyalgia, muscle strain, and myopathies.8 Muscle-related pain and dysfunction are believed to arise from parafunctional habits such as bruxism or clenching. Articular disorders include synovitis/capsulitis, joint effusion, trauma/fracture, internal derangement (disturbance in the normal anatomic relationship between the disc and condyle), arthritis, and neoplasm.16
What you’ll see. Orofacial pain (usually dull and located in the preauricular region), joint noise, and restricted jaw function are key signs and symptoms of TMD. Exacerbation of pain with mandibular functions (eg, chewing, yawning, or swallowing) is a pathognomonic sign. Joint sounds such as clicking or crepitus are common. In most cases, crepitus correlates with osteoarthritis.6 Nonspecific TMD symptoms include headache, earache, insomnia, tinnitus, and neck and shoulder pain.6
The gold standard of diagnosis of TMD consists of taking a detailed history, evaluating the patient’s head and neck, and conducting a general physical examination and behavioral/psychological assessment.17 Imaging of the TMJ and associated structures is essential.17
Treatment. Nonsteroidal anti-inflammatory drugs, opioids, muscle relaxants, antidepressants, anticonvulsants, anxiolytics, and corticosteroids are options for treating TMD.6,8 Isometric jaw exercises, maxillomandibular appliances, and physical therapy are valuable adjuncts for pain relief. Advise patients to establish a self-care routine to reduce TMJ pain that might include changing their head posture or sleeping position, and limiting activities that require using their jaw, such as clenching, bruxism, and excessive gum chewing. Some patients may need to adopt a non-chewing diet that consists of liquid or pureed food. Massage and moist heat can help relax muscles of mastication and improve range of motion.
Approximately 5% of patients with TMD undergo surgery, typically simple arthrocentesis, arthroscopy, arthrotomy, or modified condylotomy.6 Total joint replacement is indicated only for patients with severely damaged joints with end-stage disease when all other conservative treatments have failed. Joint replacement primarily restores form and function; pain relief is a secondary benefit.8
Neuropathic pain
Trigeminal neuralgia (TN) is sudden, usually unilateral, severe, brief, stabbing, recurrent episodes of pain in the distribution of one or more branches of the trigeminal nerve.9 It most commonly presents in the lower 2 branches of the trigeminal nerve and usually is caused by compression of the trigeminal nerve root by vascular or nonvascular causes.4 The pain is severe and can profoundly impact a patient’s quality of life.
TN attacks typically last from a few seconds to up to 2 minutes. As many as 30 attacks can occur daily, with refractory periods between attacks. After the initial attack, individuals are left with a residual dull or burning pain. TN can be triggered by face washing, teeth brushing, speaking, eating, shaving, or cold wind.4
Diagnosis can be tricky because more than half of patients with TN experience less severe pain after the main sharp attack; this presentation is called TN type II.7 A detailed patient history and careful evaluation can help identify patients with TN type II. TN can be misdiagnosed as TMD, especially if it presents unilaterally.15
Treatment. Anticonvulsants are the primary medications used to treat TN.
Post-traumatic trigeminal pain is usually the result of an injury or dental procedure, such as facial trauma, tooth extraction, root canal, or dental implants.12,18,19 Nerve injury is assumed to be the cause. This type of pain can start within 3 to 6 months of a trauma. It is located in the trigeminal area and patients describe it as burning, tingling and, at times, sharp.15 Patients who have sustained injury to the lingual or inferior alveolar nerves have reported feeling “pins and needles.”12
Common triggers include temperature changes or simple touch. Not all injuries result in pain; some patients may have only sensory impairment15 or sensory deficits such as allodynia or hypoesthesia.
Treatment. The first line of treatment for post-traumatic trigeminal pain is tricyclic antidepressants (TCAs) followed by pregabalin or gabapentin.14
Glossopharyngeal neuralgia (GN) is similar in presentation to TN but is much rarer.15 GN pain occurs deep in the throat, ear, or posterior tongue.15 When the pain occurs in the inner ear, GN can be misdiagnosed as TMD. In most cases, no cause of GN can be determined.
Patients describe GN pain as shooting, sharp, and electrical shock-like, lasting from seconds to minutes, with recurrent attacks throughout the day. Like TN, GN can present as episodes of attacks that last weeks to months. Triggers include chewing, drinking, swallowing, and talking, as well as light touch.13,15 Some patients with GN experience syncope due to the anatomical proximity of the vagus nerve.14
Treatment. Anticonvulsants are the first-line treatment for GN. Local anesthetics or surgery can be considered for patients who don’t improve after medical therapy.15
Postherpetic neuralgia (PHN) can cause facial pain when the characteristic vesicular rash of the varicella zoster virus (shingles) occurs on the face. PHN usually affects the first division of trigeminal nerve, but the second and third divisions can be affected as well.13
What you’ll see. The acute phase of PHN begins a few days before the initial rash has resolved and can last up to a month after. A new pain may begin one to 6 months after the initial rash has healed.20 This pain, which patients often describe as sharp, stabbing, or burning, can be constant or intermittent. Dysesthesia, hypoesthesia, and allodynia may also occur within the affected dermatome.
PHN is usually diagnosed based on the patient’s history and clinical presentation. However, direct fluorescent antibody stain, viral culture, or polymerase chain reaction performed on vesicular fluid from a herpetic lesion during the initial rash are the laboratory tests of choice if confirmation is needed.
Treatment. PHN is managed with anticonvulsants and TCAs.
Numb chin syndrome (NCS) is characterized by hypoesthesia, paresthesia, thermalgesic anesthesia, or pain over the chin in the region supplied by the mental nerve, a terminal branch of the mandibular division of the trigeminal nerve.5,21,22
NCS can be caused by odontogenic conditions, such as dental abscess, dental anesthesia, dental trauma, or osteomyelitis; systemic conditions such as amyloidosis, sickle cell disease, sarcoidosis, multiple sclerosis, human immunodeficiency virus, or diabetes; or malignancies such as lymphoma, leukemia, breast cancer, lung cancer, prostate cancer, or head and neck cancers.21 In one study of patients with NCS, cancer was the cause of the condition in 89% of patients.22
What you’ll see. NCS is characterized by numbness of the skin in the lower lip, chin and mucous membrane inside the lip that extends to the midline.5 Depending upon the etiology, patients may present with percussion-induced pain, loosening of teeth, sequestra, and mobility of fractured segments. Patients with metastatic malignancy may develop constitutional symptoms.
Making the diagnosis. Panoramic radiography is a useful starting point. If possible, a computerized tomography scan of the head and neck should also be done. Nuclear bone scintigraphy (bone scanning) may help identify bone disease such as osteomyelitis. A biopsy may be needed if a mass lesion is present.
Treatment. In NCS that is the result of a dental etiology, the prognosis usually is good. For example, NCS that is the result of an abscess usually resolves after the abscess is drained. However, if NCS is caused by metastasis, the prognosis is grim; the average length of survival after diagnosis is approximately 5 months if NCS is caused by mandibular metastasis and 12 months if leptomeningeal metastasis is present. Treatment does little to affect the outcome in these cases.21,22
Atypical pain
Persistent idiopathic facial pain (PIFP), previously known as atypical facial pain, is a persistent facial pain that does not have the classical characteristics of cranial neuralgias and for which there is no obvious cause.2,10,23 PIFP is not triggered by any of the factors that typically precipitate neuralgias.2 The onset may be spontaneous or associated with dental intervention or facial injury, but it usually does not have a demonstrable local cause.24,25
Neuropathic mechanisms that might be at work in PIFP include nociceptor sensitization, phenotypic changes and ectopic activity from the nociceptors, central sensitization possibly maintained by ongoing activity from initially damaged peripheral tissues, sympathetic abnormal activity, alteration of segmental inhibitory control, or hyperactivity or hypoactivity of descending controls.2
PIFP is most frequently reported in women in their 40s and 50s.25 The history of a patient with PIFP often include mood disorders, chronic pain, or poor coping skills.14 Patients complain of a steady, unilateral, poorly localized pain that is deep, constant, aching, pulling, or crushing. It is usually present all day, every day. The constancy of the pain is its distinguishing feature. In the beginning, this pain may be in a limited area on one side of the face, usually the nasolabial folds or the angle of the mandible. Later, it may affect both sides of the face and extend to the neck and upper limbs.23,24 Most patients with PIFP report other symptoms, including headache, neck and backache, dermatitis, pruritus, irritable bowel, and dysfunctional uterine bleeding.26
Making the diagnosis. A targeted history and accurate clinical examination are essential.2,10 Although there are no formal diagnostic criteria, a patient can be assumed to have PIFP if:2,10
• There is pain in the face for most of the day or all day, every day.
• Initially, the pain may be confined to a portion of the face, but it is poorly localized and deep.
• The pain is not associated with other physical signs or loss of sensation.
• Imaging does not reveal an obvious anatomic or structural cause.
Treatment. Treatment of PIFP can be difficult and unsatisfactory.23 Counseling to educate patients about the chronic and nonmalignant nature of the illness is the mainstay of treatment, followed by pharmacotherapy.23 TCAs have shown a moderate effect in several trials. Gabapentin, topiramate, carbamazepine, and pregabalin also have shown limited to modest benefit in some patients. Surgical therapies appear to be of little or no use.23 Experimental treatments such as pulsed radiofrequency, low-energy level diode laser have shown success in small studies.10,23
Vascular pain
Giant cell arteritis (GCA) is a systemic, chronic vasculitis involving the large and medium-sized vessels, mainly the extracranial branches of the carotid artery.6,11 It predominantly affects people older than age 50 and is more common among women and those of Scandinavian ethnicity.27
The cause of GCA is unclear. Genetic predisposition linked to humoral and cellmediated immunity is believed to play a role.28 Familial aggregation and predominance of the HLA-DR4 allele has been reported in patients with GCA.6
What you’ll see. The most common signs and symptoms of GCA are temporal headache (seen in two-thirds of patients), jaw claudication and tenderness, and swelling of the temporal artery.6,11 The headache of GCA usually is unilateral, severe, boring or lancinating, and localized to the temporal or occipital regions of the scalp.6 Other orofacial manifestations include trismus, throat pain that develops while chewing, changes in tongue sensation and tongue claudication, tooth pain, dysphagia, dysarthria, submandibular mass, lip and chin numbness, macroglossia, glossitis, lip and tongue necrosis, and facial swelling.11
Visual symptoms include diplopia, ptosis, and possibly blindness if treatment is not instituted at first suspicion. Ocular symptoms result from anterior ischemic optic neuropathy, posterior ischemic optic neuropathy, or central retinal or cilioretinal artery occlusion.6,28 Patients have also reported low-grade fever, asthenia, anorexia, weight loss, and generalized aches.11,28
Making the diagnosis. Arterial biopsy is the gold standard for diagnosis of GCA. It is usually performed on the temporal artery and is positive in 80% to 95% of people with the condition.28 Other useful lab tests include erythrocyte sedimentation rate (ESR; elevated), white blood cell count (mildly elevated), and C-reactive protein (elevated).
Treatment. Prednisone is used to treat GCA, in initial doses ranging from 30 to 80 mg. A maintenance dose may be required for up to 2 years, with close follow-up and periodic ESR measurements.28
Malignancy is a rare cause of facial pain. The pain may be due to metastasis of extracranial bony or soft tissue as it compresses cervical and cranial nerves.3 Lung cancer can cause referred pain in the periauricular region by compressing the vagus nerve, and this pain can be misdiagnosed as dental pain, atypical facial pain, TMD, or TN.3,29 The facial pain of lung cancer is unilateral and on the same side as the lung neoplasm, and commonly is referred to the jaw, ear, or temporal region. While many patients have continuous pain, some report intermittent pain or pain that lasts for hours.3 Facial pain caused by a malignancy is differentiated from other sources of facial pain by the presence of associated symptoms such as weight loss, cough, and hemoptysis.
Treatment. Treatment can include radiation or chemotherapy.29
The mouth is often the source of lower facial pain
Pain in the oral cavity is the most common cause of pain in the lower face.15 Intraoral pain usually is caused by disease in the following structures:
1. Dentition (eg, caries, dentin sensitivity, pulpal disease)
2. Periodontium (eg, gingivitis, acute or chronic periodontal disease, sensitivity related to gum recession, alveolar bone pathology)
3. Other soft and hard tissues, such as the palate, floor of mouth, buccal mucosa, non-tooth supporting bone, and tongue (eg, mucosal diseases, neoplasms, pain related to parafunction or trauma).
Rarely, intraoral pain may be referred. For example, myofascial pain might cause diffuse tooth pain.30
See TABLE W131-35 at the end of this article for a summary of the etiology, signs/symptoms, diagnosis, and management of these and other dental causes of oral facial pain.
Nondental causes of oral facial pain can be associated with oral mucosal disorders, malignant disease and its therapy, salivary gland disorders, maxillary sinusitis, burning mouth syndrome, or atypical odontalgia. See TABLE W236-41 for a more detailed description of these conditions.
CORRESPONDENCE
Tamer H. Said, MD, MetroHealth Medical Center, 2500 MetroHealth Drive, Cleveland, Ohio 44109; tsaid@metrohealth.org
1. Lipton JA, Ship JA, Larach-Robinson D. Estimated prevalence and distribution of reported orofacial pain in the United States. J Am Dent Assoc. 1993;124:115-1121.
2. Agostoni E, Frigerio R, Santoro P. Atypical facial pain: clinical considerations and differential diagnosis. Neurol Sci. 2005;26:S71-S74.
3. Bajwa Z, Ho C, Khan S, et al. Overview of craniofacial pain. UpTo-Date Web site. Available at: http://www.uptodate.com/contents/overview-of-craniofacial-pain. Accessed January 28, 2015.
4. Bendtsen L, Birk S, Kasch H, et al. Reference programme: Diagnosis and treatment of headache disorders and facial pain. Danish Headache Society, 2nd Edition, 2012. J Headache Pain. 2012;13:S1-S29.
5. Divya KS, Moran NA, Atkin PA. Numb chin syndrome: a case series and discussion. Br Dent J. 2010;208:157-160.
6. Kapur N, Kamel IR, Herlich A. Oral and craniofacial pain: diagnosis, pathophysiology, and treatment. Int Anesthesiol Clin. 2003;41:115-150.
7. Limonadi FM, McCartney S, Burchiel KJ. Design of an artificial neural network for diagnosis of facial pain syndromes. Stereotact Funct Neurosurg. 2006;84:212-220.
8. Liu F, Steinkeler A. Epidemiology, diagnosis, and treatment of temporomandibular disorders. Dent Clin North Am. 2013;57:465-479.
9. Merskey H, Bogduk N (eds). Classification of Chronic Pain. Descriptors of Chronic Pain Syndromes and Definition of Pain Terms, 2nd ed. Seattle, WA: International Association for the Study of Pain Press; 1994.
10. Nguyen CT, Wang MB. Complementary and integrative treatments: atypical facial pain. Otolaryngol Clin North Am. 2013;46:367-382.
11. Reiter S, Winocur E, Goldsmith C, et al. Giant cell arteritis misdiagnosed as temporomandibular disorder: a case report and review of the literature. J Orofac Pain. 2009;23:360-365.
12. Renton T, Adey-Viscuso D, Meechan JG, et al. Trigeminal nerve injuries in relation to local anaesthesia in mandibular injections. Br Dent J. 2010;209:E15.
13. Shephard MK, Macgregor EA, Zakrzewska JM. Orofacial pain: a guide for the headache physician. Headache. 2014;54:22-39.
14. Zakrzewska JM. Differential diagnosis of facial pain and guidelines for management. Br J Anaesth. 2013;111:95-104.
15. Zakrzewska JM. Multi-dimensionality of chronic pain of the oral cavity and face. J Headache Pain. 2013;14:37.
16. Herb K, Cho S, Stiles MA. Temporomandibular joint pain and dysfunction. Curr Pain Headache Rep. 2006;10:408-414.
17. American Society of Temporomandibular Joint Surgeons. Guidelines for diagnosis and management of disorders involving the temporomandibular joint and related musculoskeletal structures. Cranio. 2003;21:68-76.
18. Benoliel R, Zadik Y, Eliav E, et al. Peripheral painful traumatic trigeminal neuropathy: clinical features in 91 cases and proposal of novel diagnostic criteria. J Orofac Pain. 2012;26:49-58.
19. Brooke RI. Atypical odontalgia. A report of twenty-two cases. Oral Surg Oral Med Oral Pathol. 1980;49:196-199.
20. Bouhassira D, Chassany O, Gaillat J, et al. Patient perspective on herpes zoster and its complications: an observational prospective study in patients aged over 50 years in general practice. Pain. 2012;153:342-349.
21. Baskaran RK, Krishnamoorthy, Smith M. Numb chin syndrome—a reflection of systemic malignancy. World J Surg Oncol. 2006;4:52.
22. Lata J, Kumar P. Numb chin syndrome: a case report and review of the literature. Indian J Dent Res. 2010;21:135-137.
23. Cornelissen P, van Kleef M, Mekhail N, et al. Evidence-based interventional pain medicine according to clinical diagnoses. 3. Persistent idiopathic facial pain. Pain Pract. 2009;9:443-448.
24. Didier H, Marchetti C, Borromeo G, et al. Persistent idiopathic facial pain: multidisciplinary approach and assumption of comorbidity. Neurol Sci. 2010;31:S189-S195.
25. Klasser G. Management of persistent idiopathic facial pain. J Can Dent Assoc. 2013;79:d71.
26. Abiko Y, Matsuoka H, Chiba I, et al. Current evidence on atypical odontalgia: diagnosis and clinical management. Int J Dent. 2012;2012:518548.
27. Sheldon CA, White VA, Holland SP. Giant cell arteritis presenting with bilateral loss of vision and jaw pain: reminder of a potentially devastating condition. J Can Dent Assoc. 2011;77:b55.
28. Rockey JG, Anand R. Tongue necrosis secondary to temporal arteritis: a case report and literature review. Oral Surg Oral Med Oral Pathol Oral Radiol Endod. 2002;94:471-473.
29. Sarlani E, Schwartz AH, Greenspan JD, et al. Facial pain as first manifestation of lung cancer: a case of lung cancer-related cluster headache and a review of the literature. J Orofac Pain. 2003;17:262-267.
30. Kumar A, Brennan MT. Differential diagnosis of orofacial pain and temporomandibular disorder. Dent Clin North Am. 2013;57:419-428.
31. Laudenbach JM, Simon Z. Common dental and periodontal diseases: evaluation and management. Med Clin North Am. 2014;98:1239-1260.
32. Napeñas JJ. Intraoral pain disorders. Dent Clin North Am. 2013;57:429-447.
33. Vickers ER, Zakrzewska JM. Dental causes of orofacial pain. In: Orofacial Pain. Zakrzewska JM, ed. Oxford, UK: Oxford University Press; 2009:69-81.
34. Pierse JE, Dym H, Clarkson E. Diagnosis and management of common postextraction complications. Dent Clin North Am. 2012;56:75-93.
35. Renton T. Dental (odontogenic) pain. Br J Pain. 2011;5:2-7.
36. Yatani H, Komiyama O, Matsuka Y, et al. Systematic review and recommendations for nonodontogenic toothache. J Oral Rehabil. 2014;41:843-852.
37. Klasser GD, Fischer DJ, Epstein JB. Burning mouth syndrome: recognition, understanding, and management. Oral Maxillofac Surg Clin North Am. 2008;20:255-271.
38. Balasubramaniam R, Turner LN, Fischer D, et al. Non-odontogenic toothache revisited. Open Journal of Stomatology. 2011;1:92-102.
39. Patton LL, Siegel MA, Benoliel R, et al. Management of burning mouth syndrome: systematic review and management recommendations. Oral Surg Oral Med Oral Pathol Oral Radiol Endod. 2007;103:S39.e1-e13.
40. Cascarini L, McGurk M. Epidemiology of salivary gland infections. Oral Maxillofac Surg Clin North Am. 2009;21:353-357.
41. Hegarty AM, Zakrzewska JM. Differential diagnosis for orofacial pain, including sinusitis, TMD, trigeminal neuralgia. Dent Update. 2011;38:396-400,402-403,405-406.

Treatment outcomes in stage IIIA non–small-cell lung cancer in a community cancer center
Objective To analyze demographics and treatment outcomes in patients with stage IIIA NSCLC at a community cancer center.
Methods We reviewed charts of 226 patients diagnosed with stage IIIA NSCLC from January 2003 to December 2008 treated at our community cancer center. Results Median overall survival for all patients and sequentially and concurrently treated chemoradiation patients were 18 months, and 18 months, and 20 months, respectively. Median overall survival for women and men was 24 months and 16 months, respectively.
Limitations Study design was retrospective and some medical records were not available. However, this population is likely representative of patients treated in similar settings.
Conclusions In our population, advanced age and male gender were associated with lower median survival. Responses to concurrent and sequential chemoradiation seemed to differ based on age group, which may be useful as a prognostic guideline for similar populations.
Funding Helen F Graham Cancer Center and Research Institute
Click on the PDF icon at the top of this introduction to read the full article.
Migraine May Increase Smokers’ Risk of Stroke
Among current smokers, migraine may increase the risk of stroke and combined vascular events, according to research published online ahead of print July 22 in Neurology. Migraine may not be associated with these outcomes among nonsmokers, however.
Teshamae S. Monteith, MD, Assistant Professor of Clinical Neurology at University of Miami School of Medicine, and colleagues found that study participants with migraine had twice the risk of silent brain infarctions, but they considered the findings to be consistent with previous data that suggest that migraine is not a significant risk factor for stroke among older subjects. “We thought that factors associated with a greater migraine burden, such as obesity, might put migraineurs more at risk of vascular events, but this was not the case,” said Dr. Monteith.
Cohort Was Ethnically Diverse
Data have suggested that migraine with aura is an independent risk factor for ischemic stroke in women younger than 45. Migraine also has been associated with an unfavorable cardiovascular risk profile. Dr. Monteith and colleagues initiated their study to assess the association between migraine with and without aura and stroke. They examined data from the prospective Northern Manhattan Study, which enrolled an ethnically diverse, older, community-based cohort.
Eligible participants were stroke-free, older than 40, and had lived in northern Manhattan for three months or longer. Dr. Monteith’s group excluded participants with a history of meningitis, head trauma, or radiation to rule out individuals with the potential for secondary headache. They also excluded people with a myocardial infarction before baseline.
Bilingual research assistants collected data through interviews in English or Spanish. Baseline data included demographics, socioeconomic factors, medical history and medication use, vascular risk factors, family history, and migraine history. The investigators adapted standard questions regarding hypertension, diabetes, cigarette smoking, and cardiac conditions using the Centers for Disease Control and Prevention’s Behavioral Risk Factor Surveillance System. Self-reported migraine was assessed with a questionnaire, and additional questions closely adhered to the International Classification of Headache Disorders, second edition criteria for migraine.
Study participants were screened annually by phone for changes in clinical status, and patients who screened positive were invited for an interview and examination by a neurologist. The primary outcome was adjudicated stroke. The secondary outcomes were confirmed combined vascular events (ie, stroke, myocardial infarction, or vascular death), myocardial infarction, and vascular death.
Migraine Tripled Smokers’ Stroke Risk
The researchers had information on migraine status for 1,292 participants. Among this population, 262 participants had migraine (75 with aura, 187 without aura). People with migraine were younger and more likely to be women and have Medicaid or no insurance and several vascular risk factors. Over a mean follow-up of 11 years, the researchers observed 294 combined vascular events, including 114 strokes, 94 myocardial infarctions, and 178 vascular deaths.
Migraine was not associated with risk of combined vascular events including stroke or stroke-only outcomes. When they examined migraine with aura and migraine without aura separately, the investigators found no associations in relation to combined vascular events including stroke or to stroke alone. Age at baseline, sex, race or ethnicity, smoking, moderate alcohol use, moderate to heavy physical activity, BMI, hypertension, hypercholesterolemia, or diabetes did not modify the effect.
The researchers did, however, observe an interaction between current smoking and stroke. They also found an interaction between current smoking and combined vascular events. A stratified analysis yielded a hazard ratio of stroke for migraine versus no migraine among current smokers of 3.17. Among former smokers, the hazard ratio was 0.87, and among participants who had never smoked, the hazard ratio was 0.49 when controlling for socioeconomic and vascular risk factors.
Mechanism of Increased Risk Is Unclear
Previous research has indicated that migraine with aura is an independent risk factor of recurrent ischemic stroke and other vascular events in young patients with ischemic stroke. In addition, stroke risk associated with migraine with aura was greater in younger than in older women in the Women’s Health Study. “Perhaps our participants were too old to display such a relationship between migraine with aura and stroke in both men and women of postmenopausal age,” said Dr. Monteith.
Oxidative stress may be the mechanism by which migraine increases stroke risk among smokers. Oxidative stress may have a role in migraine and may increase susceptibility to vascular events among active smokers. Furthermore, prothrombotic states, decreased platelet hemostasis time, and endothelial dysfunction, which are associated with migraine, are plausible mechanisms that may enhance stroke risk in active smokers. “We suspect that a synergic action may occur between vascular changes of migraine and smoking as an effect modifier, although further work is necessary to elucidate this association,” said Dr. Monteith.
The data appear to suggest that vascular changes in migraine are an important subclinical vascular marker for stroke and combined vascular events among active smokers. Because smoking may be common among migraineurs, the authors recommended that smoking cessation counseling be encouraged as a part of routine migraine care throughout the patient’s lifetime. “The identification of modifiable vascular risk factors and treatments may have beneficial outcomes for stroke reduction in the elderly population with migraine,” they concluded.
—Erik Greb
Suggested Reading
Monteith TS, Gardener H, Rundek T, et al. Migraine and risk of stroke in older adults: Northern Manhattan Study. Neurology. 2015 Jul 22 [Epub ahead of print].
Among current smokers, migraine may increase the risk of stroke and combined vascular events, according to research published online ahead of print July 22 in Neurology. Migraine may not be associated with these outcomes among nonsmokers, however.
Teshamae S. Monteith, MD, Assistant Professor of Clinical Neurology at University of Miami School of Medicine, and colleagues found that study participants with migraine had twice the risk of silent brain infarctions, but they considered the findings to be consistent with previous data that suggest that migraine is not a significant risk factor for stroke among older subjects. “We thought that factors associated with a greater migraine burden, such as obesity, might put migraineurs more at risk of vascular events, but this was not the case,” said Dr. Monteith.
Cohort Was Ethnically Diverse
Data have suggested that migraine with aura is an independent risk factor for ischemic stroke in women younger than 45. Migraine also has been associated with an unfavorable cardiovascular risk profile. Dr. Monteith and colleagues initiated their study to assess the association between migraine with and without aura and stroke. They examined data from the prospective Northern Manhattan Study, which enrolled an ethnically diverse, older, community-based cohort.
Eligible participants were stroke-free, older than 40, and had lived in northern Manhattan for three months or longer. Dr. Monteith’s group excluded participants with a history of meningitis, head trauma, or radiation to rule out individuals with the potential for secondary headache. They also excluded people with a myocardial infarction before baseline.
Bilingual research assistants collected data through interviews in English or Spanish. Baseline data included demographics, socioeconomic factors, medical history and medication use, vascular risk factors, family history, and migraine history. The investigators adapted standard questions regarding hypertension, diabetes, cigarette smoking, and cardiac conditions using the Centers for Disease Control and Prevention’s Behavioral Risk Factor Surveillance System. Self-reported migraine was assessed with a questionnaire, and additional questions closely adhered to the International Classification of Headache Disorders, second edition criteria for migraine.
Study participants were screened annually by phone for changes in clinical status, and patients who screened positive were invited for an interview and examination by a neurologist. The primary outcome was adjudicated stroke. The secondary outcomes were confirmed combined vascular events (ie, stroke, myocardial infarction, or vascular death), myocardial infarction, and vascular death.
Migraine Tripled Smokers’ Stroke Risk
The researchers had information on migraine status for 1,292 participants. Among this population, 262 participants had migraine (75 with aura, 187 without aura). People with migraine were younger and more likely to be women and have Medicaid or no insurance and several vascular risk factors. Over a mean follow-up of 11 years, the researchers observed 294 combined vascular events, including 114 strokes, 94 myocardial infarctions, and 178 vascular deaths.
Migraine was not associated with risk of combined vascular events including stroke or stroke-only outcomes. When they examined migraine with aura and migraine without aura separately, the investigators found no associations in relation to combined vascular events including stroke or to stroke alone. Age at baseline, sex, race or ethnicity, smoking, moderate alcohol use, moderate to heavy physical activity, BMI, hypertension, hypercholesterolemia, or diabetes did not modify the effect.
The researchers did, however, observe an interaction between current smoking and stroke. They also found an interaction between current smoking and combined vascular events. A stratified analysis yielded a hazard ratio of stroke for migraine versus no migraine among current smokers of 3.17. Among former smokers, the hazard ratio was 0.87, and among participants who had never smoked, the hazard ratio was 0.49 when controlling for socioeconomic and vascular risk factors.
Mechanism of Increased Risk Is Unclear
Previous research has indicated that migraine with aura is an independent risk factor of recurrent ischemic stroke and other vascular events in young patients with ischemic stroke. In addition, stroke risk associated with migraine with aura was greater in younger than in older women in the Women’s Health Study. “Perhaps our participants were too old to display such a relationship between migraine with aura and stroke in both men and women of postmenopausal age,” said Dr. Monteith.
Oxidative stress may be the mechanism by which migraine increases stroke risk among smokers. Oxidative stress may have a role in migraine and may increase susceptibility to vascular events among active smokers. Furthermore, prothrombotic states, decreased platelet hemostasis time, and endothelial dysfunction, which are associated with migraine, are plausible mechanisms that may enhance stroke risk in active smokers. “We suspect that a synergic action may occur between vascular changes of migraine and smoking as an effect modifier, although further work is necessary to elucidate this association,” said Dr. Monteith.
The data appear to suggest that vascular changes in migraine are an important subclinical vascular marker for stroke and combined vascular events among active smokers. Because smoking may be common among migraineurs, the authors recommended that smoking cessation counseling be encouraged as a part of routine migraine care throughout the patient’s lifetime. “The identification of modifiable vascular risk factors and treatments may have beneficial outcomes for stroke reduction in the elderly population with migraine,” they concluded.
—Erik Greb
Suggested Reading
Monteith TS, Gardener H, Rundek T, et al. Migraine and risk of stroke in older adults: Northern Manhattan Study. Neurology. 2015 Jul 22 [Epub ahead of print].
Suggested Reading
Monteith TS, Gardener H, Rundek T, et al. Migraine and risk of stroke in older adults: Northern Manhattan Study. Neurology. 2015 Jul 22 [Epub ahead of print].