User login
Perceptions of Current Note Quality
The electronic health record (EHR) has revolutionized the practice of medicine. As part of the economic stimulus package in 2009, Congress enacted the Health Information Technology for Economic and Clinical Health Act, which included incentives for physicians and hospitals to adopt an EHR by 2015. In the setting of more limited duty hours and demands for increased clinical productivity, EHRs have functions that may improve the quality and efficiency of clinical documentation.[1, 2, 3, 4, 5]
The process of note writing and the use of notes for clinical care have changed substantially with EHR implementation. Use of efficiency tools (ie, copy forward functions and autopopulation of data) may increase the speed of documentation.[5] Notes in an EHR are more legible and accessible and may be able to organize data to improve clinical care.[6]
Yet, many have commented on the negative consequences of documentation in an EHR. In a New England Journal of Medicine Perspective article, Drs. Hartzband and Groopman wrote, we have observed the electronic medical record become a powerful vehicle for perpetuating erroneous information, leading to diagnostic errors that gain momentum when passed on electronically.[7] As a result, the copy forward and autopopulation functions have come under significant scrutiny.[8, 9, 10] A survey conducted at 2 academic institutions found that 71% of residents and attendings believed that the copy forward function led to inconsistencies and outdated information.[11] Autopopulation has been criticized for creating lengthy notes full of trivial or redundant data, a phenomenon termed note bloat. Bloated notes may be less effective as a communication tool.[12] Additionally, the process of composing a note often stimulates critical thinking and may lead to changes in care. The act of copying forward a previous note and autopopulating data bypasses that process and in effect may suppress critical thinking.[13] Previous studies have raised numerous concerns regarding copy forward and autopopulation functionality in the EHR. Many have described the duplication of outdated data and the possibility of the introduction and perpetuation of errors.[14, 15, 16] The Veterans Affairs (VA) Puget Sound Health system evaluated 6322 copy events and found that 1 in 10 electronic patient charts contained an instance of high‐risk copying.[17] In a survey of faculty and residents at a single academic medical center, the majority of users of copy and paste functionality recognized the hazards; they responded that their notes may contain more outdated (66%) and more inconsistent information (69%). Yet, most felt copy forwarding improved the documentation of the entire hospital course (87%), overall physician documentation (69%), and should definitely be continued (91%).[11] Others have complained about the impact of copy forward on the expression of clinical reasoning.[7, 9, 18]
Previous discussions on the topic of overall note quality following EHR implementation have been limited to perspectives or opinion pieces of individual attending providers.[18] We conducted a survey across 4 academic institutions to analyze both housestaff and attendings perceptions of the quality of notes since the implementation of an EHR to better inform the discussion of the impact of an EHR on note quality.
METHODS
Participants
Surveys were administered via email to interns, residents (second‐, third‐, or fourth‐year residents, hereafter referred to as residents) and attendings at 4 academic hospitals that use the Epic EHR (Epic Corp., Madison, WI). The 4 institutions each adopted the Epic EHR, with mandatory faculty and resident training, between 1 and 5 years prior to the survey. Three of the institutions previously used systems with electronic notes, whereas the fourth institution previously used a system with handwritten notes. The study participation emails included a link to an online survey in REDCap.[19] We included interns and residents from the following types of residency programs: internal medicine categorical or primary care, medicine‐pediatrics, or medicine‐psychiatry. For housestaff (the combination of both interns and residents), exclusion criteria included preliminary or transitional year interns, or any interns or residents from other specialties who rotate on the medicine service. For attendings, participants included hospitalists, general internal medicine attendings, chief residents, and subspecialty medicine attendings, each of whom had worked for any amount of time on the inpatient medicine teaching service in the prior 12 months.
Design
We developed 3 unique surveys for interns, residents, and attendings to assess their perception of inpatient progress notes (see Supporting Information, Appendix, in the online version of this article). The surveys incorporated questions from 2 previously published sources, the 9‐item Physician Documentation Quality Instrument (PDQI‐9) (see online Appendix), a validated note‐scoring tool, and the Accreditation Council for Graduate Medical Education note‐writing competency checklists.[20] Additionally, faculty at the participating institutions developed questions to address practices and attitudes toward autopopulation, copy forward, and the purposes of a progress note. Responses were based on a 5‐point Likert scale. The intern and resident surveys asked for self‐evaluation of their own progress notes and those of their peers, whereas the attending surveys asked for assessment of housestaff notes.
The survey was left open for a total of 55 days and participants were sent reminder emails. The study received a waiver from the institutional review board at all 4 institutions.
Data Analysis
Study data were collected and managed using REDCap electronic data capture tools hosted at the University of California, San Francisco (UCSF).[19] The survey data were analyzed and the figures were created using Microsoft Excel 2008 (Microsoft Corp., Redmond, WA). Mean values for each survey question were calculated. Differences between the means among the groups were assessed using 2‐sample t tests. P values <0.05 were considered statistically significant.
RESULTS
Demographics
We received 99 completed surveys from interns, 155 completed surveys from residents, and 153 completed surveys from attendings across the 4 institutions. The overall response rate for interns was 68%, ranging from 59% at the University of California, San Diego (UCSD) to 74% at the University of Iowa. The overall response rate for residents was 49%, ranging from 38% at UCSF to 66% at the University of California, Los Angeles. The overall response rate for attendings was 70%, ranging from 53% at UCSD to 74% at UCSF.
A total of 78% of interns and 72% of residents had used an EHR at a prior institution. Of the residents, 90 were second‐year residents, 64 were third‐year residents, and 2 were fourth‐year residents. A total of 76% of attendings self‐identified as hospitalists.
Overall Assessment of Note Quality
Participants were asked to rate the quality of progress notes on a 5‐point scale (poor, fair, good, very good, excellent). Half of interns and residents rated their own progress notes as very good or excellent. A total of 44% percent of interns and 24% of residents rated their peers notes as very good or excellent, whereas only 15% of attending physicians rated housestaff notes as very good or excellent.
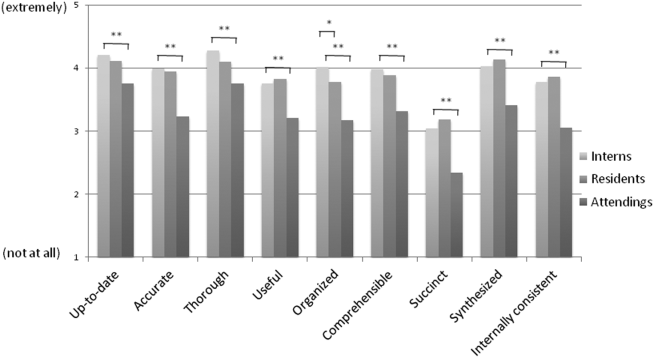
When asked to rate the change in progress note quality since their hospital had adopted the EHR, the majority of residents answered unchanged or better, and the majority of attendings answered unchanged or worse (Figure 1).

PDQI‐9 Framework
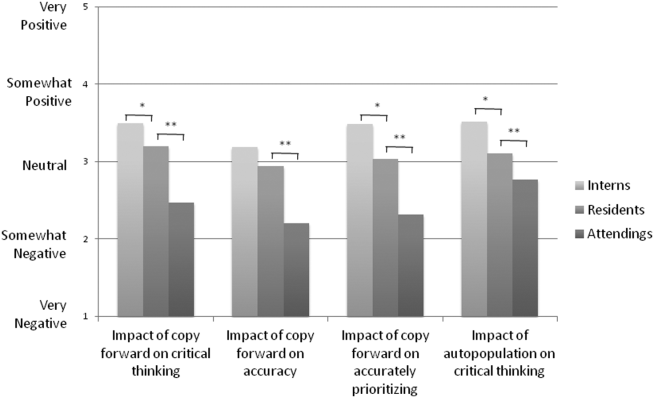
Participants answered each PDQI‐9 question on a 5‐point Likert scale ranging from not at all (1) to extremely (5). In 8 of the 9 PDQI‐9 domains, there were no significant differences between interns and residents. Across each domain, attending perceptions of housestaff notes were significantly lower than housestaff perceptions of their own notes (P<0.001) (Figure 2). Both housestaff and attendings gave the highest ratings to thorough, up to date, and synthesized and the lowest rating to succinct.
Copy Forward and Autopopulation
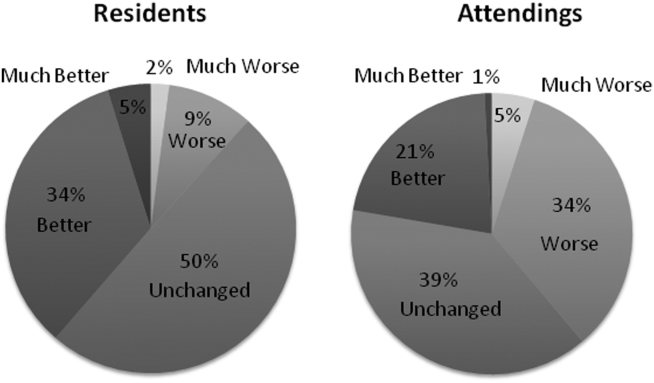
Overall, the effect of copy forward and autopopulation on critical thinking, note accuracy, and prioritizing the problem list was thought to be neutral or somewhat positive by interns, neutral by residents, and neutral or somewhat negative by attendings (P<0.001) (Figure 3). In all, 16% of interns, 22% of residents, and 55% of attendings reported that copy forward had a somewhat negative or very negative impact on critical thinking (P<0.001). In all, 16% of interns, 29% of residents and 39% of attendings thought that autopopulation had a somewhat negative or very negative impact on critical thinking (P<0.001).
Purpose of Progress Notes
Participants were provided with 7 possible purposes of a progress note and asked to rate the importance of each stated purpose. There was nearly perfect agreement between interns, residents, and attendings in the rank order of the importance of each purpose of a progress note (Table 1). Attendings and housestaff ranked communication with other providers and documenting important events and the plan for the day as the 2 most important purposes of a progress note, and billing and quality improvement as less important.
| Interns | Residents | Attendings | |
|---|---|---|---|
| Communication with other providers | 1 | 1 | 2 |
| Documenting important events and the plan for the day | 2 | 2 | 1 |
| Prioritizing issues going forward in the patient's care | 3 | 3 | 3 |
| Medicolegal | 4 | 4 | 4 |
| Stimulate critical thinking | 5 | 5 | 5 |
| Billing | 6 | 6 | 6 |
| Quality improvement | 7 | 7 | 7 |
DISCUSSION
This is the first large multicenter analysis of both attendings and housestaff perceptions of note quality in the EHR era. The findings provide insight into important differences and similarities in the perceptions of the 2 groups. Most striking is the difference in opinion of overall note quality, with only a small minority of faculty rating current housestaff notes as very good or excellent, whereas a much larger proportion of housestaff rated their own notes and those of their peers to be of high quality. Though participants were not specifically asked why note quality in general was suboptimal, housestaff and faculty rankings of specific domains from the PDQI‐9 may yield an important clue. Specifically, all groups expressed that the weakest attribute of current progress notes is succinct. This finding is consistent with the note bloat phenomenon, which has been maligned as a consequence of EHR implementation.[7, 14, 18, 21, 22]
One interesting finding was that only 5% of interns rated the notes of other housestaff as fair or poor. One possible explanation for this may be the tendency for an individual to enhance or augment the status or performance of the group to which he or she belongs as a mechanism to increase self‐image, known as the social identity theory.[23] Thus, housestaff may not criticize their peers to allow for identification with a group that is not deficient in note writing.
The more positive assessment of overall note quality among housestaff could be related to the different roles of housestaff and attendings on a teaching service. On a teaching service, housestaff are typically the writer, whereas attendings are almost exclusively the reader of progress notes. Housestaff may reap benefits, including efficiency, beyond the finished product. A perception of higher quality may reflect the process of note writing, data gathering, and critical thinking required to build an assessment and plan. The scores on the PDQI‐9 support this notion, as housestaff rated all 9 domains significantly higher than attendings.
Housestaff and attendings held greater differences of opinion with respect to the EHR's impact on note quality. Generally, housestaff perceived the EHR to have improved progress note quality, whereas attendings perceived the opposite. One explanation could be that these results reflect changing stages of development of physicians well described through the RIME framework (reporter, interpreter, manager, educator). Attendings may expect notes to reflect synthesis and analysis, whereas trainees may be satisfied with the data gathering that an EHR facilitates. In our survey, the trend of answers from intern to resident to attending suggests an evolving process of attitudes toward note quality.
The above reasons may also explain why housestaff were generally more positive than attendings about the effect of copy forward and autopopulation functions on critical thinking. Perhaps, as these functions can potentially increase efficiency and decrease time spent at the computer, although data are mixed on this finding, housestaff may have more time to spend with patients or develop a thorough plan and thus rate these functions positively.
Notably, housestaff and attendings had excellent agreement on the purposes of a progress note. They agreed that the 2 most important purposes were communication with other providers and documenting important events and the plan for the day. These are the 2 listed purposes that are most directly related to patient care. If future interventions to improve note quality require housestaff and attendings to significantly change their behavior, a focus on the impact on patient care might yield the best results.
There were several limitations in our study. Any study based on self‐assessment is subject to bias. A previous meta‐analysis and review described poor to moderate correlations between self‐assessed and external measures of performance.[24, 25] The survey data were aggregated from 4 institutions despite somewhat different, though relatively high, response rates between the institutions. There could be a response bias; those who did not respond may have systematically different perceptions of note quality. It should be noted that the general demographics of the respondents reflected those of the housestaff and attendings at 4 academic centers. All 4 of the participating institutions adopted the Epic EHR within the last several years of the survey being administered, and perceptions of note quality may be biased depending on the prior system used (ie, change from handwritten to electronic vs electronic to other electronic system). In addition, the survey results reflect experience with only 1 EHR, and our results may not apply to other EHR vendors or institutions like the VA, which have a long‐standing system in place. Last, we did not explore the impact of perceived note quality on the measured or perceived quality of care. One previous study found no direct correlation between note quality and clinical quality.[26]
There are several future directions for research based on our findings. First, potential differences between housestaff and attending perceptions of note quality could be further teased apart by studying the perceptions of attendings on a nonteaching service who write their own daily progress notes. Second, housestaff perceptions on why copy forward and autopopulation may increase critical thinking could be explored further with more direct questioning. Finally, although our study captured only perceptions of note quality, validated tools could be used to objectively measure note quality; these measurements could then be compared to perception of note quality as well as clinical outcomes.
Given the prevalence and the apparent belief that the benefits of an EHR outweigh the hazards, institutions should embrace these innovations but take steps to mitigate the potential errors and problems associated with copy forward and autopopulation. The results of our study should help inform future interventions.
Acknowledgements
The authors acknowledge the contributions of Russell Leslie from the University of Iowa.
Disclosure: Nothing to report.
- , , , et al. Systematic review: impact of health information technology on quality, efficiency, and costs of medical care. Ann Intern Med. 2006;144(10):742–752.
- , , , , . Clinical information technologies and inpatient outcomes: a multiple hospital study. Arch Intern Med. 2009;169(2):108–114.
- , , , et al. Effect of computerized physician order entry and a team intervention on prevention of serious medication errors. JAMA. 1998;280(15):1311–1316.
- , , , . Electronic health records and quality of diabetes care. N Engl J Med. 2011;365(9):825–833.
- , , , et al. The impact of a clinical information system in an intensive care unit. J Clin Monit Comput. 2008;22(1):31–36.
- , . Can electronic clinical documentation help prevent diagnostic errors? N Engl J Med. 2010;362(12):1066–1069.
- , . Off the record—avoiding the pitfalls of going electronic. N Eng J Med. 2008;358(16):1656–1658.
- , , . Copying and pasting of examinations within the electronic medical record. Int J Med Inform. 2007;76(suppl 1):S122–S128.
- , . Copy and paste: a remediable hazard of electronic health records. Am J Med. 2009;122(6):495–496.
- , , . The role of copy‐and‐paste in the hospital electronic health record. JAMA Intern Med. 2014;174(8):1217–1218.
- , , , , , . Physicians’ attitudes towards copy and pasting in electronic note writing. J Gen Intern Med. 2009;24(1):63–68.
- , , , , . Medical education in the electronic medical record (EMR) era: benefits, challenges, and future directions. Acad Med. 2013;88(6):748–752.
- , . Educational impact of the electronic medical record. J Surg Educ. 2012;69(1):105–112.
- , , , , , . Direct text entry in electronic progress notes. An evaluation of input errors. Methods Inf Med. 2003;42(1):61–67.
- . The clinical record: a 200‐year‐old 21st‐century challenge. Ann Intern Med. 2010;153(10):682–683.
- . Sloppy and paste. Morbidity and Mortality Rounds on the Web. Available at: http://www.webmm.ahrq.gov/case.aspx?caseID=274. Published July 2012. Accessed September 26, 2014.
- , , , . Are electronic medical records trustworthy? Observations on copying, pasting and duplication. AMIA Annu Symp Proc. 2003:269–273.
- . A piece of my mind. John Lennon's elbow. JAMA. 2012;308(5):463–464.
- , , , , , . Research electronic data capture (REDCap)—a metadata‐driven methodology and workflow process for providing translational research informatics support. J Biomed Inform. 2009;42(2):377–381.
- , , . ACGME competency note checklist. Available at: http://www.im.org/p/cm/ld/fid=831. Accessed August 8, 2013.
- , , , . Assessing electronic note quality using the Physician Documentation Quality Instrument (PDQI‐9). Appl Clin Inform. 2012;3(2):164–174.
- , , , . Quantifying clinical narrative redundancy in an electronic health record. J Am Med Inform Assoc. 2010;17(1):49–53.
- , . The social identity theory of intergroup behavior. In: Psychology of Intergroup Relations. 2nd ed. Chicago, IL: Nelson‐Hall Publishers; 1986:7–24.
- , . Student self‐assessment in higher education: a meta‐analysis. Rev Educ Res. 1989;59:395–430.
- . A review of the validity and accuracy of self‐assessments in health professions training. Acad Med. 1991;66:762–769.
- , , , , . Association of note quality and quality of care: a cross‐sectional study. BMJ Qual Saf. 2014;23(5):406–413.
The electronic health record (EHR) has revolutionized the practice of medicine. As part of the economic stimulus package in 2009, Congress enacted the Health Information Technology for Economic and Clinical Health Act, which included incentives for physicians and hospitals to adopt an EHR by 2015. In the setting of more limited duty hours and demands for increased clinical productivity, EHRs have functions that may improve the quality and efficiency of clinical documentation.[1, 2, 3, 4, 5]
The process of note writing and the use of notes for clinical care have changed substantially with EHR implementation. Use of efficiency tools (ie, copy forward functions and autopopulation of data) may increase the speed of documentation.[5] Notes in an EHR are more legible and accessible and may be able to organize data to improve clinical care.[6]
Yet, many have commented on the negative consequences of documentation in an EHR. In a New England Journal of Medicine Perspective article, Drs. Hartzband and Groopman wrote, we have observed the electronic medical record become a powerful vehicle for perpetuating erroneous information, leading to diagnostic errors that gain momentum when passed on electronically.[7] As a result, the copy forward and autopopulation functions have come under significant scrutiny.[8, 9, 10] A survey conducted at 2 academic institutions found that 71% of residents and attendings believed that the copy forward function led to inconsistencies and outdated information.[11] Autopopulation has been criticized for creating lengthy notes full of trivial or redundant data, a phenomenon termed note bloat. Bloated notes may be less effective as a communication tool.[12] Additionally, the process of composing a note often stimulates critical thinking and may lead to changes in care. The act of copying forward a previous note and autopopulating data bypasses that process and in effect may suppress critical thinking.[13] Previous studies have raised numerous concerns regarding copy forward and autopopulation functionality in the EHR. Many have described the duplication of outdated data and the possibility of the introduction and perpetuation of errors.[14, 15, 16] The Veterans Affairs (VA) Puget Sound Health system evaluated 6322 copy events and found that 1 in 10 electronic patient charts contained an instance of high‐risk copying.[17] In a survey of faculty and residents at a single academic medical center, the majority of users of copy and paste functionality recognized the hazards; they responded that their notes may contain more outdated (66%) and more inconsistent information (69%). Yet, most felt copy forwarding improved the documentation of the entire hospital course (87%), overall physician documentation (69%), and should definitely be continued (91%).[11] Others have complained about the impact of copy forward on the expression of clinical reasoning.[7, 9, 18]
Previous discussions on the topic of overall note quality following EHR implementation have been limited to perspectives or opinion pieces of individual attending providers.[18] We conducted a survey across 4 academic institutions to analyze both housestaff and attendings perceptions of the quality of notes since the implementation of an EHR to better inform the discussion of the impact of an EHR on note quality.
METHODS
Participants
Surveys were administered via email to interns, residents (second‐, third‐, or fourth‐year residents, hereafter referred to as residents) and attendings at 4 academic hospitals that use the Epic EHR (Epic Corp., Madison, WI). The 4 institutions each adopted the Epic EHR, with mandatory faculty and resident training, between 1 and 5 years prior to the survey. Three of the institutions previously used systems with electronic notes, whereas the fourth institution previously used a system with handwritten notes. The study participation emails included a link to an online survey in REDCap.[19] We included interns and residents from the following types of residency programs: internal medicine categorical or primary care, medicine‐pediatrics, or medicine‐psychiatry. For housestaff (the combination of both interns and residents), exclusion criteria included preliminary or transitional year interns, or any interns or residents from other specialties who rotate on the medicine service. For attendings, participants included hospitalists, general internal medicine attendings, chief residents, and subspecialty medicine attendings, each of whom had worked for any amount of time on the inpatient medicine teaching service in the prior 12 months.
Design
We developed 3 unique surveys for interns, residents, and attendings to assess their perception of inpatient progress notes (see Supporting Information, Appendix, in the online version of this article). The surveys incorporated questions from 2 previously published sources, the 9‐item Physician Documentation Quality Instrument (PDQI‐9) (see online Appendix), a validated note‐scoring tool, and the Accreditation Council for Graduate Medical Education note‐writing competency checklists.[20] Additionally, faculty at the participating institutions developed questions to address practices and attitudes toward autopopulation, copy forward, and the purposes of a progress note. Responses were based on a 5‐point Likert scale. The intern and resident surveys asked for self‐evaluation of their own progress notes and those of their peers, whereas the attending surveys asked for assessment of housestaff notes.
The survey was left open for a total of 55 days and participants were sent reminder emails. The study received a waiver from the institutional review board at all 4 institutions.
Data Analysis
Study data were collected and managed using REDCap electronic data capture tools hosted at the University of California, San Francisco (UCSF).[19] The survey data were analyzed and the figures were created using Microsoft Excel 2008 (Microsoft Corp., Redmond, WA). Mean values for each survey question were calculated. Differences between the means among the groups were assessed using 2‐sample t tests. P values <0.05 were considered statistically significant.
RESULTS
Demographics
We received 99 completed surveys from interns, 155 completed surveys from residents, and 153 completed surveys from attendings across the 4 institutions. The overall response rate for interns was 68%, ranging from 59% at the University of California, San Diego (UCSD) to 74% at the University of Iowa. The overall response rate for residents was 49%, ranging from 38% at UCSF to 66% at the University of California, Los Angeles. The overall response rate for attendings was 70%, ranging from 53% at UCSD to 74% at UCSF.
A total of 78% of interns and 72% of residents had used an EHR at a prior institution. Of the residents, 90 were second‐year residents, 64 were third‐year residents, and 2 were fourth‐year residents. A total of 76% of attendings self‐identified as hospitalists.
Overall Assessment of Note Quality
Participants were asked to rate the quality of progress notes on a 5‐point scale (poor, fair, good, very good, excellent). Half of interns and residents rated their own progress notes as very good or excellent. A total of 44% percent of interns and 24% of residents rated their peers notes as very good or excellent, whereas only 15% of attending physicians rated housestaff notes as very good or excellent.
When asked to rate the change in progress note quality since their hospital had adopted the EHR, the majority of residents answered unchanged or better, and the majority of attendings answered unchanged or worse (Figure 1).
PDQI‐9 Framework
Participants answered each PDQI‐9 question on a 5‐point Likert scale ranging from not at all (1) to extremely (5). In 8 of the 9 PDQI‐9 domains, there were no significant differences between interns and residents. Across each domain, attending perceptions of housestaff notes were significantly lower than housestaff perceptions of their own notes (P<0.001) (Figure 2). Both housestaff and attendings gave the highest ratings to thorough, up to date, and synthesized and the lowest rating to succinct.
Copy Forward and Autopopulation
Overall, the effect of copy forward and autopopulation on critical thinking, note accuracy, and prioritizing the problem list was thought to be neutral or somewhat positive by interns, neutral by residents, and neutral or somewhat negative by attendings (P<0.001) (Figure 3). In all, 16% of interns, 22% of residents, and 55% of attendings reported that copy forward had a somewhat negative or very negative impact on critical thinking (P<0.001). In all, 16% of interns, 29% of residents and 39% of attendings thought that autopopulation had a somewhat negative or very negative impact on critical thinking (P<0.001).
Purpose of Progress Notes
Participants were provided with 7 possible purposes of a progress note and asked to rate the importance of each stated purpose. There was nearly perfect agreement between interns, residents, and attendings in the rank order of the importance of each purpose of a progress note (Table 1). Attendings and housestaff ranked communication with other providers and documenting important events and the plan for the day as the 2 most important purposes of a progress note, and billing and quality improvement as less important.
| Interns | Residents | Attendings | |
|---|---|---|---|
| Communication with other providers | 1 | 1 | 2 |
| Documenting important events and the plan for the day | 2 | 2 | 1 |
| Prioritizing issues going forward in the patient's care | 3 | 3 | 3 |
| Medicolegal | 4 | 4 | 4 |
| Stimulate critical thinking | 5 | 5 | 5 |
| Billing | 6 | 6 | 6 |
| Quality improvement | 7 | 7 | 7 |
DISCUSSION
This is the first large multicenter analysis of both attendings and housestaff perceptions of note quality in the EHR era. The findings provide insight into important differences and similarities in the perceptions of the 2 groups. Most striking is the difference in opinion of overall note quality, with only a small minority of faculty rating current housestaff notes as very good or excellent, whereas a much larger proportion of housestaff rated their own notes and those of their peers to be of high quality. Though participants were not specifically asked why note quality in general was suboptimal, housestaff and faculty rankings of specific domains from the PDQI‐9 may yield an important clue. Specifically, all groups expressed that the weakest attribute of current progress notes is succinct. This finding is consistent with the note bloat phenomenon, which has been maligned as a consequence of EHR implementation.[7, 14, 18, 21, 22]
One interesting finding was that only 5% of interns rated the notes of other housestaff as fair or poor. One possible explanation for this may be the tendency for an individual to enhance or augment the status or performance of the group to which he or she belongs as a mechanism to increase self‐image, known as the social identity theory.[23] Thus, housestaff may not criticize their peers to allow for identification with a group that is not deficient in note writing.
The more positive assessment of overall note quality among housestaff could be related to the different roles of housestaff and attendings on a teaching service. On a teaching service, housestaff are typically the writer, whereas attendings are almost exclusively the reader of progress notes. Housestaff may reap benefits, including efficiency, beyond the finished product. A perception of higher quality may reflect the process of note writing, data gathering, and critical thinking required to build an assessment and plan. The scores on the PDQI‐9 support this notion, as housestaff rated all 9 domains significantly higher than attendings.
Housestaff and attendings held greater differences of opinion with respect to the EHR's impact on note quality. Generally, housestaff perceived the EHR to have improved progress note quality, whereas attendings perceived the opposite. One explanation could be that these results reflect changing stages of development of physicians well described through the RIME framework (reporter, interpreter, manager, educator). Attendings may expect notes to reflect synthesis and analysis, whereas trainees may be satisfied with the data gathering that an EHR facilitates. In our survey, the trend of answers from intern to resident to attending suggests an evolving process of attitudes toward note quality.
The above reasons may also explain why housestaff were generally more positive than attendings about the effect of copy forward and autopopulation functions on critical thinking. Perhaps, as these functions can potentially increase efficiency and decrease time spent at the computer, although data are mixed on this finding, housestaff may have more time to spend with patients or develop a thorough plan and thus rate these functions positively.
Notably, housestaff and attendings had excellent agreement on the purposes of a progress note. They agreed that the 2 most important purposes were communication with other providers and documenting important events and the plan for the day. These are the 2 listed purposes that are most directly related to patient care. If future interventions to improve note quality require housestaff and attendings to significantly change their behavior, a focus on the impact on patient care might yield the best results.
There were several limitations in our study. Any study based on self‐assessment is subject to bias. A previous meta‐analysis and review described poor to moderate correlations between self‐assessed and external measures of performance.[24, 25] The survey data were aggregated from 4 institutions despite somewhat different, though relatively high, response rates between the institutions. There could be a response bias; those who did not respond may have systematically different perceptions of note quality. It should be noted that the general demographics of the respondents reflected those of the housestaff and attendings at 4 academic centers. All 4 of the participating institutions adopted the Epic EHR within the last several years of the survey being administered, and perceptions of note quality may be biased depending on the prior system used (ie, change from handwritten to electronic vs electronic to other electronic system). In addition, the survey results reflect experience with only 1 EHR, and our results may not apply to other EHR vendors or institutions like the VA, which have a long‐standing system in place. Last, we did not explore the impact of perceived note quality on the measured or perceived quality of care. One previous study found no direct correlation between note quality and clinical quality.[26]
There are several future directions for research based on our findings. First, potential differences between housestaff and attending perceptions of note quality could be further teased apart by studying the perceptions of attendings on a nonteaching service who write their own daily progress notes. Second, housestaff perceptions on why copy forward and autopopulation may increase critical thinking could be explored further with more direct questioning. Finally, although our study captured only perceptions of note quality, validated tools could be used to objectively measure note quality; these measurements could then be compared to perception of note quality as well as clinical outcomes.
Given the prevalence and the apparent belief that the benefits of an EHR outweigh the hazards, institutions should embrace these innovations but take steps to mitigate the potential errors and problems associated with copy forward and autopopulation. The results of our study should help inform future interventions.
Acknowledgements
The authors acknowledge the contributions of Russell Leslie from the University of Iowa.
Disclosure: Nothing to report.
- , , , et al. Systematic review: impact of health information technology on quality, efficiency, and costs of medical care. Ann Intern Med. 2006;144(10):742–752.
- , , , , . Clinical information technologies and inpatient outcomes: a multiple hospital study. Arch Intern Med. 2009;169(2):108–114.
- , , , et al. Effect of computerized physician order entry and a team intervention on prevention of serious medication errors. JAMA. 1998;280(15):1311–1316.
- , , , . Electronic health records and quality of diabetes care. N Engl J Med. 2011;365(9):825–833.
- , , , et al. The impact of a clinical information system in an intensive care unit. J Clin Monit Comput. 2008;22(1):31–36.
- , . Can electronic clinical documentation help prevent diagnostic errors? N Engl J Med. 2010;362(12):1066–1069.
- , . Off the record—avoiding the pitfalls of going electronic. N Eng J Med. 2008;358(16):1656–1658.
- , , . Copying and pasting of examinations within the electronic medical record. Int J Med Inform. 2007;76(suppl 1):S122–S128.
- , . Copy and paste: a remediable hazard of electronic health records. Am J Med. 2009;122(6):495–496.
- , , . The role of copy‐and‐paste in the hospital electronic health record. JAMA Intern Med. 2014;174(8):1217–1218.
- , , , , , . Physicians’ attitudes towards copy and pasting in electronic note writing. J Gen Intern Med. 2009;24(1):63–68.
- , , , , . Medical education in the electronic medical record (EMR) era: benefits, challenges, and future directions. Acad Med. 2013;88(6):748–752.
- , . Educational impact of the electronic medical record. J Surg Educ. 2012;69(1):105–112.
- , , , , , . Direct text entry in electronic progress notes. An evaluation of input errors. Methods Inf Med. 2003;42(1):61–67.
- . The clinical record: a 200‐year‐old 21st‐century challenge. Ann Intern Med. 2010;153(10):682–683.
- . Sloppy and paste. Morbidity and Mortality Rounds on the Web. Available at: http://www.webmm.ahrq.gov/case.aspx?caseID=274. Published July 2012. Accessed September 26, 2014.
- , , , . Are electronic medical records trustworthy? Observations on copying, pasting and duplication. AMIA Annu Symp Proc. 2003:269–273.
- . A piece of my mind. John Lennon's elbow. JAMA. 2012;308(5):463–464.
- , , , , , . Research electronic data capture (REDCap)—a metadata‐driven methodology and workflow process for providing translational research informatics support. J Biomed Inform. 2009;42(2):377–381.
- , , . ACGME competency note checklist. Available at: http://www.im.org/p/cm/ld/fid=831. Accessed August 8, 2013.
- , , , . Assessing electronic note quality using the Physician Documentation Quality Instrument (PDQI‐9). Appl Clin Inform. 2012;3(2):164–174.
- , , , . Quantifying clinical narrative redundancy in an electronic health record. J Am Med Inform Assoc. 2010;17(1):49–53.
- , . The social identity theory of intergroup behavior. In: Psychology of Intergroup Relations. 2nd ed. Chicago, IL: Nelson‐Hall Publishers; 1986:7–24.
- , . Student self‐assessment in higher education: a meta‐analysis. Rev Educ Res. 1989;59:395–430.
- . A review of the validity and accuracy of self‐assessments in health professions training. Acad Med. 1991;66:762–769.
- , , , , . Association of note quality and quality of care: a cross‐sectional study. BMJ Qual Saf. 2014;23(5):406–413.
© 2015 Society of Hospital Medicine
Clonal hematopoiesis explored in aplastic anemia
Clonal hematopoiesis was detected in DNA samples from approximately half of 439 patients with aplastic anemia, and a third of the study population carried mutations in candidate genes that correlated with clinical outcomes, according to a report published online July 2 in the New England Journal of Medicine.
Most patients with aplastic anemia respond to immunosuppressive therapy or bone marrow transplantation, but about 15% later develop myelodysplastic syndromes, acute myeloid leukemia (AML), or both. Historically, this has been attributed to “clonal evolution,” but a more accurate term is clonal hematopoiesis. However, not all patients with clonal hematopoiesis go on to develop late myelodysplastic syndromes or AML, said Dr. Tetsuichi Yoshizato of the department of pathology and tumor biology at Kyoto (Japan) University and associates.
To clarify the role of clonal hematopoiesis in aplastic anemia, the investigators analyzed DNA in blood, bone marrow, and buccal samples from 439 patients with bone marrow failure who were treated at three specialized centers in the United States and Japan.
Targeted sequencing of a panel of genes that are recurrently mutated in myeloid cancers was performed; 249 mutations were detected in candidate genes for myelodysplastic syndromes/AML in 36% of the study population. And about one-third of patients whose DNA harbored mutations had multiple (as many as 7) mutations. The most frequently mutated genes were BCOR and BCORL1 (in 9.3% of patients), PIGA (7.5%), DNMT3A (8.4%), and ASXL1 (6.2%), which together accounted for 77% of all mutation-positive patients, the investigators reported.
In addition, 47% of patients had expanded hematopoietic cell clones. Clones carrying certain mutations were associated with a better response to immunosuppressive treatment, while clones carrying several other mutations were associated with a poor treatment response, lower survival, and progression to myelodysplastic syndromes/AML. Mutations in PIGA and BCOR and BCORL1 correlated with a better response to immunosuppressive therapy and better overall and progression-free survival; mutations in a subgroup of genes that included DNMT3A and ASXL1 were associated with worse outcomes.
The pattern of mutations in individual patients, however, varied markedly over time and was often unpredictable. “It should be underscored that the complex dynamics of clonal hematopoiesis are highly variable and not necessarily determinative,” Dr. Yoshizato and associates said (N. Engl. J. Med. 2015 July 2 [doi:10.1056/NEJMoa1414799]).
Although further genetic research is needed before these findings can be applied clinically to guide prognosis and treatment, they already “have implications for bone marrow failure, for early events in leukemogenesis, and for normal aging,” the investigators added.
FROM THE NEW ENGLAND JOURNAL OF MEDICINE
Key clinical point: Clonal hematopoiesis was detected in 47% of 439 patients with aplastic anemia, and some of the mutations were related to clinical outcomes.
Major finding: The most frequently mutated genes were BCOR and BCORL1 (in 9.3% of patients), PIGA (7.5%), DNMT3A (8.4%), and ASXL1 (6.2%), which together accounted for 77% of all mutation-positive patients.
Data source: DNA analysis of blood, bone marrow, and buccal samples from 439 patients with aplastic anemia treated at three medical centers in the United States and Japan.
Disclosures: This work was supported by the Ministry of Health, Labor, and Welfare of Japan; the Japan Society for the Promotion of Science; the National Heart, Lung, and Blood Institute; the Aplastic Anemia and MDS International Foundation; and the Scott Hamilton Cancer Alliance for Research, Education, and Survivorship Foundation. Dr. Yoshizato reported having no relevant financial disclosures; an associate reported receiving a grant from Daiichi-Sankyo unrelated to this work.
It’s time to reconsider early-morning testosterone tests
Early-morning testosterone tests are necessary only for men younger than age 45. Because the natural diurnal variation in testosterone levels tends to diminish with age, it is acceptable to test men ages 45 and older before 2 pm.1
Strength of recommendation
B: Based on a retrospective cohort study.
Welliver RC Jr, Wiser HJ, Brannigan RE, et al. Validity of midday total testosterone levels in older men with erectile dysfunction. J Urol. 2014;192:165-169.
Illustrative case
It’s noon, you are finishing up a visit with a 62-year-old man with erectile dysfunction (ED), and you want to evaluate for androgen deficiency. Should you ask him to return for an early-morning visit so you can test his testosterone level?
Increasing public awareness of androgen deficiency has led to more men being tested for testosterone levels. Current Endocrine Society guidelines recommend against routine screening for androgen deficiency in men who do not have symptoms.2 However, for men with classic symptoms of androgen deficiency—such as decreased libido, ED, infertility, depression, osteoporosis, loss of secondary sexual characteristics, or reduced muscle bulk or strength—measurement of total testosterone level is recommended.2
Due to the natural diurnal variation in serum testosterone levels, the guidelines recommend collecting the sample in the early morning.2 This recommendation is based on small observational studies that included men mostly younger than 45 years of age that found a significant difference in testosterone levels between samples drawn early in the morning and in the afternoon.3-5
In recent years, several studies have indicated that this variation declines as men age.4-6 Recently, researchers evaluated the effects of age and time of testing on men’s total testosterone levels.
STUDY SUMMARY: Differences in testosterone levels are significant only in younger men
Welliver et al1 performed a retrospective chart review of 2569 men seen at a Minneapolis Veterans Affairs hospital for ED who had total testosterone levels measured between 7 am and 2 pm over a 15-year period. Men whose total testosterone levels were outside the normal range (>1000 or <50 ng/dL) or who had total testosterone drawn after 2 pm were excluded. The authors analyzed the results based on age, creating one group for men ages <40 years and 5-year age groups for all other men. Using scatterplot techniques, they separated each age group into 2 subgroups based on draw times—7 am to 9 am, or 9 am to 2 pm—and compared the mean total testosterone level for each age and time.
The participants’ mean age was 63 years. Younger men (<45 years) had the largest variation in serum total testosterone, with a large and significant decrease after 9 am. Only the youngest 2 groups (ages <40 and 40-44 years) showed a large decrease in total testosterone in specimens collected after 9 am compared to those drawn between 7 am and 9 am (mean difference 207 and 149 ng/dL, respectively). This variation was not observed in patients over age 45. Although there was a statistically significant difference between early and later testosterone levels in men ages 70 to 74 years, the absolute difference—34 ng/dL (452 vs 418 ng/dL)—was unlikely to be clinically significant.
WHAT'S NEW: For older men, later testing will not affect results
This study confirms previous research showing that the diurnal effect on testosterone levels becomes blunted with increasing age, at least in this group of men with ED. Allowing older men to have total testosterone levels drawn until 2 pm would allow for greater patient flexibility in draw times with little change in results.
CAVEATS: Study's methodology cannot account for several potential confounders
This retrospective study analyzed only a single random testosterone level measurement from each participant, rather than repeat testosterone levels over the course of a day. However, the study was large (2569 men) and it used mean values, which should at least partially mitigate the effect of having only a single level from each participant.
The study measured total testosterone and did not account for potential confounding factors—such as obesity or use of testosterone replacement therapy or androgen deprivation therapy—that could affect sexhormone binding globulin, thus potentially altering total testosterone level. However, the authors estimated that less than 2% of the entire cohort were likely to have unrecognized hormonal manipulation with exogenous gonadotropins.
All of the men in the study were seen for ED, and it could be that men with ED have more flattening of the diurnal variation than men without ED; however, we are unaware of other data that support this.
Up to 30% of men who have an early-morning testosterone level that is low may have a normal result when testing is repeated.2,5 Therefore, for all men who have low testosterone level test results, draw a repeat total testosterone level before 9 am to confirm the diagnosis. Also, this study did not evaluate the course of testosterone levels throughout the later afternoon and evening, and it remains unclear whether levels can be drawn even later in the day.
CHALLENGES TO IMPLEMENTATION: Your lab's policies might require early-morning draws
There will probably be few barriers to implementing this change, unless local laboratory policies are inflexible regarding the timing of testosterone draws.
ACKNOWLEDGEMENT
The PURLs Surveillance System was supported in part by Grant Number UL1RR024999 from the National Center For Research Resources, a Clinical Translational Science Award to the University of Chicago. The content is solely the responsibility of the authors and does not necessarily represent the official views of the National Center For Research Resources or the National Institutes of Health.
1. Welliver RC Jr, Wiser HJ, Brannigan RE, et al. Validity of midday total testosterone levels in older men with erectile dysfunction. J Urol. 2014;192:165-169.
2. Bhasin S, Cunningham GR, Hayes FJ, et al. Testosterone therapy in men with androgen deficiency syndromes: an Endocrine Society clinical practice guideline. J Clin Endocrinol Metab. 2010;95:2536-2559.
3. Cooke RR, McIntosh JE, McIntosh RP. Circadian variation in serum free and non-SHBG-bound testosterone in normal men: measurements, and simulation using a mass action model. Clin Endocrinol (Oxf). 1993;39:163-171.
4. Bremner WJ, Vitiello MV, Prinz PN. Loss of circadian rhythmicity in blood testosterone levels with aging in normal men. J Clin Endocrinol Metab. 1983;56:1278-1281.
5. Brambilla DJ, Matsumoto AM, Araujo AB, et al. The effect of diurnal variation on clinical measurement of serum testosterone and other sex hormone levels in men. J Clin Endocrinol Metab. 2009;94:907-913.
6. Crawford ED, Barqawi AB, O’Donnell C, et al. The association of time of day and serum testosterone concentration in a large screening population. BJU Int. 2007;100:509-513.
Early-morning testosterone tests are necessary only for men younger than age 45. Because the natural diurnal variation in testosterone levels tends to diminish with age, it is acceptable to test men ages 45 and older before 2 pm.1
Strength of recommendation
B: Based on a retrospective cohort study.
Welliver RC Jr, Wiser HJ, Brannigan RE, et al. Validity of midday total testosterone levels in older men with erectile dysfunction. J Urol. 2014;192:165-169.
Illustrative case
It’s noon, you are finishing up a visit with a 62-year-old man with erectile dysfunction (ED), and you want to evaluate for androgen deficiency. Should you ask him to return for an early-morning visit so you can test his testosterone level?
Increasing public awareness of androgen deficiency has led to more men being tested for testosterone levels. Current Endocrine Society guidelines recommend against routine screening for androgen deficiency in men who do not have symptoms.2 However, for men with classic symptoms of androgen deficiency—such as decreased libido, ED, infertility, depression, osteoporosis, loss of secondary sexual characteristics, or reduced muscle bulk or strength—measurement of total testosterone level is recommended.2
Due to the natural diurnal variation in serum testosterone levels, the guidelines recommend collecting the sample in the early morning.2 This recommendation is based on small observational studies that included men mostly younger than 45 years of age that found a significant difference in testosterone levels between samples drawn early in the morning and in the afternoon.3-5
In recent years, several studies have indicated that this variation declines as men age.4-6 Recently, researchers evaluated the effects of age and time of testing on men’s total testosterone levels.
STUDY SUMMARY: Differences in testosterone levels are significant only in younger men
Welliver et al1 performed a retrospective chart review of 2569 men seen at a Minneapolis Veterans Affairs hospital for ED who had total testosterone levels measured between 7 am and 2 pm over a 15-year period. Men whose total testosterone levels were outside the normal range (>1000 or <50 ng/dL) or who had total testosterone drawn after 2 pm were excluded. The authors analyzed the results based on age, creating one group for men ages <40 years and 5-year age groups for all other men. Using scatterplot techniques, they separated each age group into 2 subgroups based on draw times—7 am to 9 am, or 9 am to 2 pm—and compared the mean total testosterone level for each age and time.
The participants’ mean age was 63 years. Younger men (<45 years) had the largest variation in serum total testosterone, with a large and significant decrease after 9 am. Only the youngest 2 groups (ages <40 and 40-44 years) showed a large decrease in total testosterone in specimens collected after 9 am compared to those drawn between 7 am and 9 am (mean difference 207 and 149 ng/dL, respectively). This variation was not observed in patients over age 45. Although there was a statistically significant difference between early and later testosterone levels in men ages 70 to 74 years, the absolute difference—34 ng/dL (452 vs 418 ng/dL)—was unlikely to be clinically significant.
WHAT'S NEW: For older men, later testing will not affect results
This study confirms previous research showing that the diurnal effect on testosterone levels becomes blunted with increasing age, at least in this group of men with ED. Allowing older men to have total testosterone levels drawn until 2 pm would allow for greater patient flexibility in draw times with little change in results.
CAVEATS: Study's methodology cannot account for several potential confounders
This retrospective study analyzed only a single random testosterone level measurement from each participant, rather than repeat testosterone levels over the course of a day. However, the study was large (2569 men) and it used mean values, which should at least partially mitigate the effect of having only a single level from each participant.
The study measured total testosterone and did not account for potential confounding factors—such as obesity or use of testosterone replacement therapy or androgen deprivation therapy—that could affect sexhormone binding globulin, thus potentially altering total testosterone level. However, the authors estimated that less than 2% of the entire cohort were likely to have unrecognized hormonal manipulation with exogenous gonadotropins.
All of the men in the study were seen for ED, and it could be that men with ED have more flattening of the diurnal variation than men without ED; however, we are unaware of other data that support this.
Up to 30% of men who have an early-morning testosterone level that is low may have a normal result when testing is repeated.2,5 Therefore, for all men who have low testosterone level test results, draw a repeat total testosterone level before 9 am to confirm the diagnosis. Also, this study did not evaluate the course of testosterone levels throughout the later afternoon and evening, and it remains unclear whether levels can be drawn even later in the day.
CHALLENGES TO IMPLEMENTATION: Your lab's policies might require early-morning draws
There will probably be few barriers to implementing this change, unless local laboratory policies are inflexible regarding the timing of testosterone draws.
ACKNOWLEDGEMENT
The PURLs Surveillance System was supported in part by Grant Number UL1RR024999 from the National Center For Research Resources, a Clinical Translational Science Award to the University of Chicago. The content is solely the responsibility of the authors and does not necessarily represent the official views of the National Center For Research Resources or the National Institutes of Health.
1. Welliver RC Jr, Wiser HJ, Brannigan RE, et al. Validity of midday total testosterone levels in older men with erectile dysfunction. J Urol. 2014;192:165-169.
2. Bhasin S, Cunningham GR, Hayes FJ, et al. Testosterone therapy in men with androgen deficiency syndromes: an Endocrine Society clinical practice guideline. J Clin Endocrinol Metab. 2010;95:2536-2559.
3. Cooke RR, McIntosh JE, McIntosh RP. Circadian variation in serum free and non-SHBG-bound testosterone in normal men: measurements, and simulation using a mass action model. Clin Endocrinol (Oxf). 1993;39:163-171.
4. Bremner WJ, Vitiello MV, Prinz PN. Loss of circadian rhythmicity in blood testosterone levels with aging in normal men. J Clin Endocrinol Metab. 1983;56:1278-1281.
5. Brambilla DJ, Matsumoto AM, Araujo AB, et al. The effect of diurnal variation on clinical measurement of serum testosterone and other sex hormone levels in men. J Clin Endocrinol Metab. 2009;94:907-913.
6. Crawford ED, Barqawi AB, O’Donnell C, et al. The association of time of day and serum testosterone concentration in a large screening population. BJU Int. 2007;100:509-513.
Copyright © 2015 Family Physicians Inquiries Network. All rights reserved.
Breast cancer screening: The latest from the USPSTF
The United States Preventive Services Task Force (USPSTF) recently released draft recommendations on breast cancer screening, which could be finalized within the next few months.1 The last time the Task Force (TF) weighed in on this topic was in 2009, just as the Affordable Care Act (ACA) was being debated. At that time, the TF recommendations were so controversial that Congress specified in the ACA that they should not be used to determine insurance coverage (more on this later).
The draft recommendations (TABLE 1)1 carry a C grade for women ages 40 to 49 years (ie, offer or provide screening mammography for selected patients depending on individual circumstances) and a B grade for biennial screening of women ages 50 to 74. The proposed recommendations are basically the same as the ones made in 2009, with more detailed wording to explain the rationale for the C recommendation, and to address 2 new issues: tomosynthesis (3-D mammography) and adjunctive screening for women with dense breasts. The previous D recommendation against self breast examination was left unchanged.
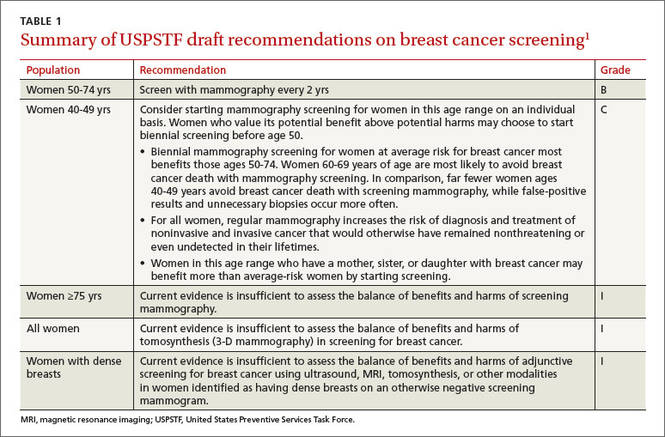
Benefit of mammography screening varies by decade of life
Breast cancer is the leading cause of non-skin cancers in women and, after lung cancer, the second leading cause of cancer deaths in women. In 2014 there were 233,000 new cases diagnosed and 40,000 breast cancer deaths.1,2 While the TF found that mammography reduces deaths from breast cancer in women between the ages of 40 and 74, women ages 40 to 49 benefit the least; those ages 60 to 69 benefit the most.1,3
If 10,000 women are screened routinely for 10 years, 4 breast cancer deaths will be prevented in those ages 40 to 49, 8 in those 50 to 59, and 21 in those 60 to 69.1 And harms appear to be higher in the younger age group. TABLE 21,3 shows some of the harms resulting from one-time mammography screening of 10,000 women in each age group. Notice the benefits listed previously are from repeated screenings over a 10-year period and the harms in TABLE 21,3 are from a single mammogram.
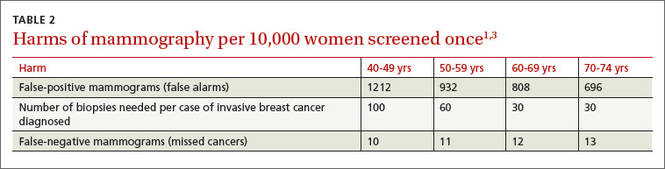
The total benefits and harms of biennial screening in 1000 women starting at age 40 (vs age 50) include 8 cancer deaths prevented (vs 7) with a cost of 1529 false positive tests (vs 953); 204 unnecessary breast biopsies (vs 146); and 20 overdiagnoses (vs 18). However, the confidence intervals on these estimates are wide, and in each case, they overlap between the 2 groups.1
The TF recommended biennial screening for women between the ages of 50 and 74 because observational studies and modeling show no clear benefit with annual screening vs every 2 years, while annual screening results in more false positives and biopsies.
Overdiagnosis may occur in nearly 20% of cases
The potential for overdiagnosis and overtreatment is increasingly recognized as a harm of cancer screening. Overdiagnosis results from detecting a tumor during screening that would not have been detected otherwise and that would not have caused death or disease but is treated anyway. This sometimes occurs with the detection of early tumors that would not have progressed or would have progressed slowly, not causing health problems before the woman dies of other causes.
The TF is one of the only organizations that considers the potential harmful effects of this problem. While it is not possible to know for certain the rate of overdiagnosis that occurs with cancer screening, high-quality studies indicate it is close to 20% for breast cancer.3
Guidance regarding women ages 40 to 49
The new draft recommendations carefully point out that, while the overall benefit of screening women ages 40 to 49 is small, the decision to begin screening before age 50 should be an individual one, and an informed one. They state that women who value the small potential benefit over the potential for harm may choose to be screened, as might women who have a family history of breast cancer. And the recommendations do not apply to women who have a genotype that places them at increased risk for breast cancer.
Tomosynthesis: Evidence of benefit is insufficient
Tomosynthesis as a primary breast cancer screening tool was studied in a separate evidence report commissioned by the TF.4 While tomosynthesis, compared with routine mammography, appears to have increased sensitivity and specificity in detecting breast cancer, no studies looked at this technology as a primary screening tool and its effect on breast cancer mortality, overall mortality, and quality of life. Sticking to its nationally-recognized methodological rigor, the TF states that information at this time is insufficient to make a recommendation on the use of tomosynthesis.
Dense breasts: Usefulness of adjunctive screening modalities
Breast density is categorized into 4 groups, from category a (breasts are almost all fatty with little fibro nodular tissue) to category d (breasts are extremely dense).1 About 43% of women ages 40 to 74 are in categories c and d.1 Dense breasts adversely affect the accuracy of mammography, decreasing sensitivity and specificity. In one study, sensitivity was 87% in category a and 63% in category d; specificities were 97% and 89%, respectively.5
Tomosynthesis, magnetic resonance imaging, and ultrasound, when used in addition to mammography, all appear to detect more cancers, but they also yield more false-positive results.6 The long-term outcome of detecting more tumors is not known. For an individual, there are 3 possibilities when a tumor is detected earlier: a better outcome, no difference in outcome, or a worse outcome resulting from overdiagnosis and overtreatment. The TF felt that the available data are insufficient to judge benefits and harms of an increased frequency of screening or the use of adjunctive screening methods in women with dense breasts.
Benefit for women ≥75 years is inconclusive
There are limited data on the impact of mammography on outcomes for women older than 70. The TF feels that, since women ages 60 to 69 benefit the most from mammography, this benefit is likely to carry over into the next decade. Modeling also predicts this.
However, women ages 70 to 74 who have chronic illnesses are unlikely to benefit from mammography. The conditions specifically mentioned are cardiovascular disease, diabetes, lung disease, liver disease, renal failure, acquired immunodeficiency syndrome, and dementia.
For all women ages 75 and older, the TF feels the evidence is insufficient to make a recommendation.
Insurance coverage
The ACA mandates that 4 sets of preventive services be included in commercial health insurance plans with no out-of-pocket expenses to the patient: immunizations recommended by the Advisory Committee on Immunization Practices; children’s preventive services recommended by the Health Resources and Services Administration (HRSA); women’s preventive services recommended by HRSA; and recommendations with an A or B rating from the USPSTF.7
For children, HRSA opted to use those preventive services listed by the American Academy of Pediatrics in Bright Futures, the society’s national initiative providing recommendations on prevention screenings and well-child visits.8 For women, HRSA asked the Institute of Medicine to form a panel to construct a list of recommended preventive services.
At the time the ACA was passed, the TF had just made new recommendations on breast cancer screening, which were very similar to the current draft recommendations. Due to the resulting controversy, Congress mandated that the new recommendations not be used to determine first-dollar insurance coverage, and it cited the TF’s pre-2009 recommendations as the applicable standard.
Those earlier recommendations included annual mammography starting at age 40. The wording of the law, however, was not clear as to future mammography recommendations. One interpretation is that the TF recommendations in place before 2009 are the basis for first-dollar coverage until changed by Congress. Another interpretation is that the ACA special provision trumped only the 2009 recommendations and the 2015 recommendations will become the standard. If the latter turns out to be true, it is not clear if commercial insurance plans will begin to charge co-payments for mammography before age 50 or for mammograms ordered more frequently than every 2 years for women ages 50 to 74.
The issue of insurance coverage is important because of the lack of uniformity in recommendations regarding mammography. The American Congress of Obstetricians and Gynecologists,9 the American Cancer Society,10 and the American College of Radiology11 all recommend annual mammography starting at age 40. The American Academy of Family Physicians recommendations12 mirror those of the USPSTF, and the Canadian Task Force on Preventive Health Care recommends against routine screening for women ages 40 to 49 and recommends mammography every 2 to 3 years for women ages 50 to 74.13
USPSTF rationale is informed and accessible for review
Breast cancer screening remains a highly controversial and emotional topic. The USPSTF has made a set of recommendations based on extensive and rigorous evidence reports that consider both benefits and harms. There will be those who vigorously disagree. The evidence reports, recommendations, and rationale behind them are easily accessible on the TF Web site (www.uspreventiveservicestaskforce.org) for those who want to read them.1
1. USPSTF. Draft recommendation statement. Breast cancer: screening. Available at: http://www.uspreventiveservicestaskforce.org/Page/Document/RecommendationStatementDraft/breast-cancer-screening1#tab1. Accessed May 25, 2015.
2. National Cancer Institute. SEER Stat Fact Sheets: Breast Cancer. Available at: http://seer.cancer.gov/statfacts/html/breast.html. Accessed June 11, 2015.
3. Nelson HD, Cantor A, Humphrey L, et al. Screening for breast cancer; a systematic review to update the 2009 U.S. Preventive Services Task Force recommendation. Available at: http://www.uspreventiveservicestaskforce.org/Page/Document/draftevidence-review-screening-for-breast-cancer/breast-cancerscreening1. Accessed May 25, 2015.
4. Melnikow J, Fenton JJ, Miglioretti D, et al. Screening for Breast Cancer with Digital Tomosynthesis. Available at: http://www.uspreventiveservicestaskforce.org/Page/Document/draft-evidence-review-screening-for-breast-cancer-with-digit/breastcancer-screening1. Accessed May 25, 2015.
5. Carney PA, Miglioretti D, Yaankaskas BC, et al. Individual and combined effects of age, breast density, and hormone replacement therapy use on the accuracy of screening mammography. Ann Intern Med. 2003;138:168-175.
6. Melnikow J, Fenton JJ, Whitlock EP, et al. Adjunctive screening for breast cancer in women with dense breasts: a systematic review for the U.S. Preventive Services Task Force. AHRQ Publication No. 14-05201-EF-2.
7. 111th Congress Public Law 111-148, section 2713. Available at: http://www.gpo.gov/fdsys/pkg/PLAW-111publ148/html/PLAW-111publ148.htm. Accessed May 25, 2015.
8. American Academy of Pediatrics. Bright Futures. Available at: https://brightfutures.aap.org/Pages/default.aspx. Accessed May 25, 2015.
9. American Congress of Obstetricians and Gynecologists. ACOG statement on breast cancer screening. Available at: http://www.acog.org/About-ACOG/News-Room/Statements/2015/ACOGStatement-on-Breast-Cancer-Screening. Accessed May 25, 2015.
10. Smith RA, Manassaram-Baptiste D, Brooks D, et al. Cancer screening in the United States, 2015: a review of current American Cancer Society guidelines and current issues in cancer screening. CA Cancer J Clin. 2015;65:30-54.
11. Lee CH, Dershaw DD, Kopans D, et al. Breast cancer screening with imaging: recommendations from the Society of Breast Imaging and the ACR on the use of mammography, breast MRI, breast ultrasound, and other technologies for the detection of clinically occult breast cancer. J Am Coll Radiol. 2010;7:18-27.
12. American Academy of Family Physicians. Breast cancer. Available at: http://www.aafp.org/patient-care/clinical-recommendations/all/breast-cancer.html. Accessed May 25, 2015.
13. Canadian Task Force on Preventive Health Care. Screening for breast cancer. Available at: http://canadiantaskforce.ca/ctfphcguidelines/2011-breast-cancer. Accessed May 25, 2015.
The United States Preventive Services Task Force (USPSTF) recently released draft recommendations on breast cancer screening, which could be finalized within the next few months.1 The last time the Task Force (TF) weighed in on this topic was in 2009, just as the Affordable Care Act (ACA) was being debated. At that time, the TF recommendations were so controversial that Congress specified in the ACA that they should not be used to determine insurance coverage (more on this later).
The draft recommendations (TABLE 1)1 carry a C grade for women ages 40 to 49 years (ie, offer or provide screening mammography for selected patients depending on individual circumstances) and a B grade for biennial screening of women ages 50 to 74. The proposed recommendations are basically the same as the ones made in 2009, with more detailed wording to explain the rationale for the C recommendation, and to address 2 new issues: tomosynthesis (3-D mammography) and adjunctive screening for women with dense breasts. The previous D recommendation against self breast examination was left unchanged.
Benefit of mammography screening varies by decade of life
Breast cancer is the leading cause of non-skin cancers in women and, after lung cancer, the second leading cause of cancer deaths in women. In 2014 there were 233,000 new cases diagnosed and 40,000 breast cancer deaths.1,2 While the TF found that mammography reduces deaths from breast cancer in women between the ages of 40 and 74, women ages 40 to 49 benefit the least; those ages 60 to 69 benefit the most.1,3
If 10,000 women are screened routinely for 10 years, 4 breast cancer deaths will be prevented in those ages 40 to 49, 8 in those 50 to 59, and 21 in those 60 to 69.1 And harms appear to be higher in the younger age group. TABLE 21,3 shows some of the harms resulting from one-time mammography screening of 10,000 women in each age group. Notice the benefits listed previously are from repeated screenings over a 10-year period and the harms in TABLE 21,3 are from a single mammogram.
The total benefits and harms of biennial screening in 1000 women starting at age 40 (vs age 50) include 8 cancer deaths prevented (vs 7) with a cost of 1529 false positive tests (vs 953); 204 unnecessary breast biopsies (vs 146); and 20 overdiagnoses (vs 18). However, the confidence intervals on these estimates are wide, and in each case, they overlap between the 2 groups.1
The TF recommended biennial screening for women between the ages of 50 and 74 because observational studies and modeling show no clear benefit with annual screening vs every 2 years, while annual screening results in more false positives and biopsies.
Overdiagnosis may occur in nearly 20% of cases
The potential for overdiagnosis and overtreatment is increasingly recognized as a harm of cancer screening. Overdiagnosis results from detecting a tumor during screening that would not have been detected otherwise and that would not have caused death or disease but is treated anyway. This sometimes occurs with the detection of early tumors that would not have progressed or would have progressed slowly, not causing health problems before the woman dies of other causes.
The TF is one of the only organizations that considers the potential harmful effects of this problem. While it is not possible to know for certain the rate of overdiagnosis that occurs with cancer screening, high-quality studies indicate it is close to 20% for breast cancer.3
Guidance regarding women ages 40 to 49
The new draft recommendations carefully point out that, while the overall benefit of screening women ages 40 to 49 is small, the decision to begin screening before age 50 should be an individual one, and an informed one. They state that women who value the small potential benefit over the potential for harm may choose to be screened, as might women who have a family history of breast cancer. And the recommendations do not apply to women who have a genotype that places them at increased risk for breast cancer.
Tomosynthesis: Evidence of benefit is insufficient
Tomosynthesis as a primary breast cancer screening tool was studied in a separate evidence report commissioned by the TF.4 While tomosynthesis, compared with routine mammography, appears to have increased sensitivity and specificity in detecting breast cancer, no studies looked at this technology as a primary screening tool and its effect on breast cancer mortality, overall mortality, and quality of life. Sticking to its nationally-recognized methodological rigor, the TF states that information at this time is insufficient to make a recommendation on the use of tomosynthesis.
Dense breasts: Usefulness of adjunctive screening modalities
Breast density is categorized into 4 groups, from category a (breasts are almost all fatty with little fibro nodular tissue) to category d (breasts are extremely dense).1 About 43% of women ages 40 to 74 are in categories c and d.1 Dense breasts adversely affect the accuracy of mammography, decreasing sensitivity and specificity. In one study, sensitivity was 87% in category a and 63% in category d; specificities were 97% and 89%, respectively.5
Tomosynthesis, magnetic resonance imaging, and ultrasound, when used in addition to mammography, all appear to detect more cancers, but they also yield more false-positive results.6 The long-term outcome of detecting more tumors is not known. For an individual, there are 3 possibilities when a tumor is detected earlier: a better outcome, no difference in outcome, or a worse outcome resulting from overdiagnosis and overtreatment. The TF felt that the available data are insufficient to judge benefits and harms of an increased frequency of screening or the use of adjunctive screening methods in women with dense breasts.
Benefit for women ≥75 years is inconclusive
There are limited data on the impact of mammography on outcomes for women older than 70. The TF feels that, since women ages 60 to 69 benefit the most from mammography, this benefit is likely to carry over into the next decade. Modeling also predicts this.
However, women ages 70 to 74 who have chronic illnesses are unlikely to benefit from mammography. The conditions specifically mentioned are cardiovascular disease, diabetes, lung disease, liver disease, renal failure, acquired immunodeficiency syndrome, and dementia.
For all women ages 75 and older, the TF feels the evidence is insufficient to make a recommendation.
Insurance coverage
The ACA mandates that 4 sets of preventive services be included in commercial health insurance plans with no out-of-pocket expenses to the patient: immunizations recommended by the Advisory Committee on Immunization Practices; children’s preventive services recommended by the Health Resources and Services Administration (HRSA); women’s preventive services recommended by HRSA; and recommendations with an A or B rating from the USPSTF.7
For children, HRSA opted to use those preventive services listed by the American Academy of Pediatrics in Bright Futures, the society’s national initiative providing recommendations on prevention screenings and well-child visits.8 For women, HRSA asked the Institute of Medicine to form a panel to construct a list of recommended preventive services.
At the time the ACA was passed, the TF had just made new recommendations on breast cancer screening, which were very similar to the current draft recommendations. Due to the resulting controversy, Congress mandated that the new recommendations not be used to determine first-dollar insurance coverage, and it cited the TF’s pre-2009 recommendations as the applicable standard.
Those earlier recommendations included annual mammography starting at age 40. The wording of the law, however, was not clear as to future mammography recommendations. One interpretation is that the TF recommendations in place before 2009 are the basis for first-dollar coverage until changed by Congress. Another interpretation is that the ACA special provision trumped only the 2009 recommendations and the 2015 recommendations will become the standard. If the latter turns out to be true, it is not clear if commercial insurance plans will begin to charge co-payments for mammography before age 50 or for mammograms ordered more frequently than every 2 years for women ages 50 to 74.
The issue of insurance coverage is important because of the lack of uniformity in recommendations regarding mammography. The American Congress of Obstetricians and Gynecologists,9 the American Cancer Society,10 and the American College of Radiology11 all recommend annual mammography starting at age 40. The American Academy of Family Physicians recommendations12 mirror those of the USPSTF, and the Canadian Task Force on Preventive Health Care recommends against routine screening for women ages 40 to 49 and recommends mammography every 2 to 3 years for women ages 50 to 74.13
USPSTF rationale is informed and accessible for review
Breast cancer screening remains a highly controversial and emotional topic. The USPSTF has made a set of recommendations based on extensive and rigorous evidence reports that consider both benefits and harms. There will be those who vigorously disagree. The evidence reports, recommendations, and rationale behind them are easily accessible on the TF Web site (www.uspreventiveservicestaskforce.org) for those who want to read them.1
1. USPSTF. Draft recommendation statement. Breast cancer: screening. Available at: http://www.uspreventiveservicestaskforce.org/Page/Document/RecommendationStatementDraft/breast-cancer-screening1#tab1. Accessed May 25, 2015.
2. National Cancer Institute. SEER Stat Fact Sheets: Breast Cancer. Available at: http://seer.cancer.gov/statfacts/html/breast.html. Accessed June 11, 2015.
3. Nelson HD, Cantor A, Humphrey L, et al. Screening for breast cancer; a systematic review to update the 2009 U.S. Preventive Services Task Force recommendation. Available at: http://www.uspreventiveservicestaskforce.org/Page/Document/draftevidence-review-screening-for-breast-cancer/breast-cancerscreening1. Accessed May 25, 2015.
4. Melnikow J, Fenton JJ, Miglioretti D, et al. Screening for Breast Cancer with Digital Tomosynthesis. Available at: http://www.uspreventiveservicestaskforce.org/Page/Document/draft-evidence-review-screening-for-breast-cancer-with-digit/breastcancer-screening1. Accessed May 25, 2015.
5. Carney PA, Miglioretti D, Yaankaskas BC, et al. Individual and combined effects of age, breast density, and hormone replacement therapy use on the accuracy of screening mammography. Ann Intern Med. 2003;138:168-175.
6. Melnikow J, Fenton JJ, Whitlock EP, et al. Adjunctive screening for breast cancer in women with dense breasts: a systematic review for the U.S. Preventive Services Task Force. AHRQ Publication No. 14-05201-EF-2.
7. 111th Congress Public Law 111-148, section 2713. Available at: http://www.gpo.gov/fdsys/pkg/PLAW-111publ148/html/PLAW-111publ148.htm. Accessed May 25, 2015.
8. American Academy of Pediatrics. Bright Futures. Available at: https://brightfutures.aap.org/Pages/default.aspx. Accessed May 25, 2015.
9. American Congress of Obstetricians and Gynecologists. ACOG statement on breast cancer screening. Available at: http://www.acog.org/About-ACOG/News-Room/Statements/2015/ACOGStatement-on-Breast-Cancer-Screening. Accessed May 25, 2015.
10. Smith RA, Manassaram-Baptiste D, Brooks D, et al. Cancer screening in the United States, 2015: a review of current American Cancer Society guidelines and current issues in cancer screening. CA Cancer J Clin. 2015;65:30-54.
11. Lee CH, Dershaw DD, Kopans D, et al. Breast cancer screening with imaging: recommendations from the Society of Breast Imaging and the ACR on the use of mammography, breast MRI, breast ultrasound, and other technologies for the detection of clinically occult breast cancer. J Am Coll Radiol. 2010;7:18-27.
12. American Academy of Family Physicians. Breast cancer. Available at: http://www.aafp.org/patient-care/clinical-recommendations/all/breast-cancer.html. Accessed May 25, 2015.
13. Canadian Task Force on Preventive Health Care. Screening for breast cancer. Available at: http://canadiantaskforce.ca/ctfphcguidelines/2011-breast-cancer. Accessed May 25, 2015.

Monoclonal gammopathy of undetermined significance: Using risk stratification to guide follow-up
› For monoclonal gammopathy of undetermined significance (MGUS) patients at low risk, repeat serum protein electrophoresis (SPE) in 6 months. If no significant elevation of M-protein is found, repeat SPE every 2 to 3 years. A
› For patients with smoldering multiple myeloma, order SPE every 2 to 3 months in the first year following diagnosis; repeat every 4 to 6 months in the following year and every 6 to 12 months thereafter. B
Strength of recommendation (SOR)
A Good-quality patient-oriented evidence
B Inconsistent or limited-quality patient-oriented evidence
C Consensus, usual practice, opinion, disease-oriented evidence, case series
CASE › A 54-year-old man’s lab results following a routine annual examination reveal a level of IgM M-protein just under 1.5 g/dL. All other lab values, including free light chain (FLC) ratio and bone marrow exam, are normal. No clinical evidence of a related disorder is found. What is the risk that this patient’s condition could progress toward multiple myeloma, and how would you follow up?
The patient with a monoclonal gammopathy has an abnormal proliferation of monoclonal plasma cells that secrete an immunoglobulin, M-protein. This proliferation occurs most often in the bone marrow but can also be found in extra-medullary body tissue. The condition can begin insidiously, remain stable, or progress to frank malignancy causing bone and end-organ destruction. The major challenge is to separate stable, asymptomatic patients who require no treatment from patients with progressive, symptomatic myeloma who require immediate treatment.
An increased, measurable level of serum monoclonal immunoglobulins or FLCs is called monoclonal gammopathy of undetermined significance (MGUS) when there is <3 g/dL monoclonal protein in the serum, <10% monoclonal plasma cells in the bone marrow, and an absence of beta-cell proliferative disorders, lytic bone lesions, anemia, hypercalcemia, or renal insufficiency (TABLE 1).1,2 Serum and marrow measurements exceeding these values indicate progression of disease to a premalignancy stage. Continued proliferation of plasma cells in the bone marrow results in anemia and bone destruction, while the increase in M-protein leads to end-organ destruction. This final malignant state is multiple myeloma (MM).
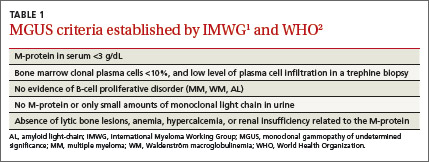
Detailed classification of MGUS: A roadmap for monitoring patients
Extensive epidemiologic and clinical studies have refined the classification of MGUS3-5 and related disorders (TABLES 2-4),3 providing physicians with guidance on how to monitor patients. There are 3 kinds of monoclonal gammopathies, each reflecting a particular type of immunoglobulin involvement—non-IgM, IgM, or light chain. Additionally, within each type of gammopathy, patient-specific characteristics determine 3 categories of clinical significance: premalignancy with low risk of progression (1%-2% per year3); premalignancy with high risk of progression (10% per year3); and malignancy.
Non-IgM MGUS with a high risk of progression is designated smoldering multiple myeloma (SMM) (TABLE 2).3 IgM MGUS with a high risk of progression is defined as smoldering Waldenström macroglobulinemia (SWM), with a predisposition to progress to Waldenström macroglobulinemia (WM) and, rarely, to IgM MM (TABLE 3).3
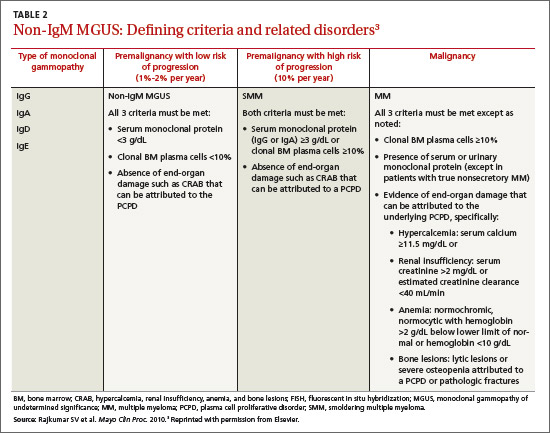
More recently, it has been reported that approximately 20% of the cases of MM belong to a new entity called light-chain MM that features an absence of heavy chain (IgG, IgA, IgM, IgD, or IgE) secretion in serum.6 The premalignant precursor is light-chain MGUS (LC-MGUS). The criteria for LC-MGUS and idiopathic Bence Jones proteinuria are found in TABLE 4.3 Idiopathic Bence Jones proteinuria is equivalent to SMM and SWM due to its higher risk of progression (10%/year)3 to light-chain MM.
Prevalence of MGUS
In general, the prevalence of all types of MGUS increases with age and is affected by race, sex, family history, immunosuppression, and pesticide exposure. The Caucasian American population >50 years exhibits a prevalence of MGUS of approximately 3.2%;7 the African American population exhibits a significantly higher prevalence of 5.9% to 8.4%.7 Native Asians have a lower rate of MM, and, as expected, a lower MGUS prevalence than is seen in the Western population (Thailand ≈2.3%;8 Korea ≈3.3%;9 Japan ≈2.1%;10 China ≈0.8%11). The overall prevalence of the 3 types of MGUS is 4.2% in Caucasians.6
Distinguishing stable from progressive disease
The Mayo Clinic’s risk stratification model12 further specifies risk of disease progression based on 3 indicators: serum M-protein concentration, Ig isotype of M-protein, and serum FLC ratio.
MGUS. A marked increase in risk for disease progression is associated with a serum M-protein concentration ≥1.5 g/dL, a non-IgG isotype, or an abnormal serum FLC ratio (<0.26 or >1.65, reflecting an increase in either the kappa or lambda light chain).12 An MGUS patient exhibiting all 3 of these features has a 58% absolute risk of developing MM after 20 years of follow-up. A patient with 2 of the 3 abnormalities has a 37% risk of progressing to MM, and one who has just one abnormality has a 21% risk. In contrast, an MGUS patient who has an M-protein level <1.5 g/dL, an IgG isotype, and normal FLC range has only a 5% risk of progression to MM in the same 20 years.12
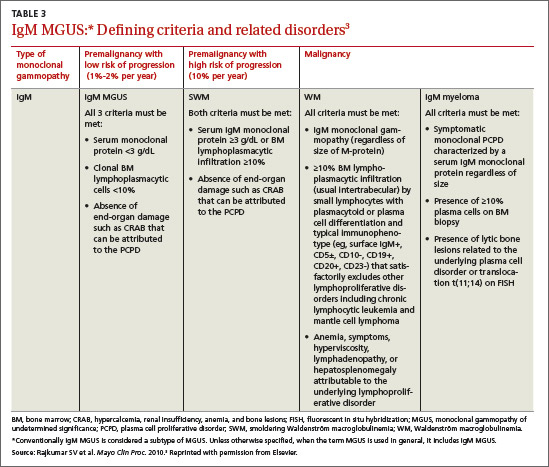
The Spanish Group risk stratification model13 is based on 2 risk factors: a high proportion of abnormal plasma cells (aPC) within the bone marrow plasma cell (BMPC) compartment (ie, ≥95% CD56+/CD19-); and an evolving subtype of the disease (defined as an increase in the level of serum M-protein by at least 10% during the first 6 months of follow-up, or a progressive and constant increase of the M-protein until overt MM develops). The 7-year cumulative probability of progression of MGUS to MM: 2% for patients with neither risk factor, 16% with one risk factor, and 72% with both risk factors.13
SMM. Classification of this progressive state is defined by a serum level of monoclonal protein (IgG, IgA, IgD, or IgE) ≥3 g/dL or a concentration of clonal bone marrow plasma cells ≥10%; and by an absence of end-organ damage such as hypercalcemia, renal insufficiency, anemia, and bone lesions (CRAB) that can be attributed to a plasma cell proliferative disorder (TABLE 2).3 Both laboratory and clinical criteria must be met.
According to the Mayo Clinic risk stratification model, likelihood of progression reflects combinations of 3 factors: bone marrow plasmacytosis ≥10%, a serum M-protein level ≥3 g/dL, and a serum FLC ratio ≤0.125 or ≥8.14 Using this stratification scheme, the risk over 10 years of progressing from SMM to MM is 84% for those with all 3 risk factors, 65% with 2 factors, and 52% with one factor.14 As SMM is defined, there is no upper limit of bone marrow involvement. However, Rajkumar et al15 found that progression time was significantly shorter (P<.001) among patients with ≥60% bone marrow involvement, compared with those having <60% involvement.
The Spanish Group risk stratification model13 uses the same model applied to MGUS: a proportion of abnormal plasma cells in the BMPC compartment ≥95% CD56+/CD19-; and an evolving subtype of disease. The 3-year cumulative probability of progression of SMM to MM is 46% for those with both risk factors, 12% for those with one factor, and <1% for those with no risk factors.13

LC-MGUS. The classification of LC-MGUS (TABLE 4)3 is primarily from a Mayo Clinic study6 and research on risk stratification is underway at 2 other institutions. False-positive results are possible in patients with renal16 and inflammatory17 disorders.
Applying risk stratification to patient management
The current approach to a patient with clearly defined MGUS is a prudent “watch and wait” strategy that specifies monitoring details based on risk category (ALGORITHM).1,18
MGUS. In the low-risk MGUS group (IgG subtype, M-protein <1.5 g/dL, and normal FLC ratio)3 there is no need for bone marrow examination or skeletal radiography. Repeat the serum protein electrophoresis (SPE) in 6 months, and if there is no significant elevation of M-protein, repeat the SPE every 2 to 3 years.1,19,20 However, if other findings are suggestive of plasma cell malignancy (anemia, renal insufficiency, hypercalcemia, or bone lesions), bone marrow examination and computed tomographic (CT) scan are advised. Further evaluation of an incidental detection of MGUS is also important since it is occasionally associated with bone diseases,21 arterial and venous thrombosis,22 and an increased risk (P<.05) of developing bacterial (pneumonia, osteomyelitis, septicemia, pyelonephritis, cellulitis, endocarditis, and meningitis) and viral (influenza and herpes zoster) infections.23
Patients in the intermediate- and high-risk MGUS groups with serum monoclonal protein ≥1.5 g/dL, IgA or IgM subtype or an abnormal FLC ratio should undergo tests for CRAB and have bone marrow aspirate and biopsy with cytogenetics, flow cytometry, and fluorescence in situ hybridization (FISH). Patients with IgM MGUS should also undergo a CT scan of the abdomen to rule out the presence of asymptomatic retroperitoneal lymph nodes.1,19 If the BM examination and CT scan yield negative results, repeat SPE and complete blood count (CBC) after 6 months and annually thereafter for life. IgD or IgE MGUS is rare, and patients exhibit a progression similar to the 20-year risk seen with MGUS generally.
SMM. Given the increased risk of progression from SMM to MM compared with MGUS (all risk groups), the 2010 International Myeloma Working Group (IMWG) has suggested monitoring SMM patients more frequently—ie, SPE every 2 to 3 months in the first year following diagnosis.1 Repeat SPE in the second year every 4 to 6 months, and, if results are clinically stable, every 6 to 12 months thereafter. In addition to a baseline bone marrow examination (including cytogenetics, flow cytometry, and FISH studies), consider ordering magnetic resonance imaging of the spine and pelvis to detect occult lesions, as their presence predicts a more rapid progression to MM.24 During the course of the follow-up, evaluate any unexplained anemia or renal function impairment for its origin. A report of MGUS progression over more than a decade to SMM and then to MM illustrates prudent monitoring of a patient.25
LC-MGUS. Once LC-MGUS is detected, first rule out AL-amyloidosis, light-chain deposition disease, or cast nephropathy. If no malignant state is present, repeat the FLC serum assay every 6 months with renal function tests. Idiopathic Bence Jones proteinuria and LC-MGUS have some overlap and both entities put patients at risk for developing MM or amyloidosis. It is not uncommon for MGUS to be accompanied by Bence Jones proteinuria.
In addition to a thorough history and physical examination, recommended followup for both of these entities includes CBC, creatinine, serum FLC, and 24-hour urine protein electrophoresis.6 With idiopathic Bence Jones proteinuria, a monoclonal protein evident on urine protein electrophoresis at >500 mg/24 hr must be followed up with tests for other signs of malignancy (CRAB) and BM examination to exclude the possibility of MM.6
Treatment of MGUS to prevent progression
Multiple myeloma is still an incurable disease. Since MGUS is a precursor of MM, attempts have been made to either slow its progression or eradicate it. Several independent intervention studies26 for the precursor diseases MGUS and SMM have been conducted or are ongoing. Thus far, no conclusive preventive treatment has been found and the 2010 IMWG guidelines do not recommend preventive therapy for MGUS and SMM patients by means of any drug, unless it is a part of a clinical trial.1
CASE › The patient profiled at the start of this article has one abnormal risk factor (IgM isotype) and has a low risk of progression to MM. Management should follow the steps outlined in the ALGORITHM1,18 for low-risk IgM MGUS: repeat SPE, CBC, and CT scan in 6 months and annually thereafter. If any abnormality is observed, rule out the possibilities of IgM SWM, IgM WM, or rapid progression to MM, and consider referral to an oncologist.
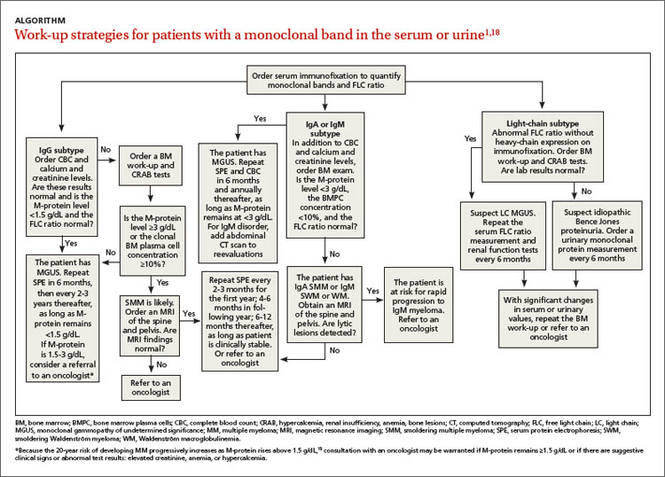
CORRESPONDENCE
John M. Boltri, MD, Department of Family and Community Medicine, Northeast Ohio Medical University, College of Medicine, 4209 St. Rt. 44, PO Box 95, Rootstown, Ohio 44272; jboltri@neomed.edu.
ACKNOWLEDGEMENTS
The authors thank Kenneth F. Tucker, MD (Webber Cancer Center, St John Macomb-Oakland Hospital, Warren, Mich) and Elizabeth Sykes, MD (Professor, Oakland University, William Beaumont School of Medicine, Rochester, Mich) for their review of this article.
1. Kyle RA, Durie BG, Rajkumar SV, et al; International Myeloma Working Group. Monoclonal gammopathy of undetermined significance (MGUS) and smoldering (asymptomatic) multiple myeloma: IMWG consensus perspectives risk factors for progression and guidelines for monitoring and management. Leukemia. 2010;24:1121-1127.
2. Swerdlow SH, Campro E, Harris NL, et al. World Health Organization Classification of Tumours of Haematopoietic and Lymphoid Tissues. 4th ed. Lyon, France: IRAC Press; 2008.
3. Rajkumar SV, Kyle RA, Buadi FK. Advances in the diagnosis, classification, risk stratification, and management of monoclonal gammopathy of undetermined significance: implications for recategorizing disease entities in the presence of evolving scientific evidence. Mayo Clin Proc. 2010;85:945-948.
4. Korde N, Kristinsson SY, Landgren O. Monoclonal gammopathy of undetermined significance (MGUS) and smoldering multiple myeloma (SMM): novel biological insights and development of early treatment strategies. Blood. 2011;117:5573-5581.
5. Landgren O, Kyle RA, Rajkumar SV. From myeloma precursor disease to multiple myeloma: new diagnostic concepts and opportunities for early intervention. Clin Cancer Res. 2011;17:1243-1252.
6. Dispenzieri A, Katzmann JA, Kyle RA, et al. Prevalence and risk of progression of light-chain monoclonal gammopathy of undetermined significance: a retrospective population-based cohort study. Lancet. 2010;375:1721-1728.
7. Wadhera RK, Rajkumar SV. Prevalence of monoclonal gammopathy of undetermined significance: a systematic review. Mayo Clin Proc. 2010;85:933-942.
8. Watanaboonyongcharoen P, Nakorn TN, Rojnuckarin P. Prevalence of monoclonal gammopathy of undetermined significance in Thailand. Int J Hematol. 2012;95:176-181.
9. Park HK, Lee KR, Kim YJ, et al. Prevalence of monoclonal gammopathy of undetermined significance in an elderly urban Korean population. Am J Hematol. 2011;86:752-755.
10. Iwanaga M, Tagawa M, Tsukasaki K, et al. Prevalence of monoclonal gammopathy of undetermined significance: study of 52,802 persons in Nagasaki City, Japan. Mayo Clin Proc. 2007;82:1474-1479.
11. Wu SP, Minter A, Costello R, et al. MGUS prevalence in an ethnically Chinese population in Hong Kong. Blood. 2013;121:2363-2364.
12. Rajkumar SV, Kyle RA, Therneau TM, et al. Serum free light chain ratio is an independent risk factor for progression in monoclonal gammopathy of undetermined significance. Blood. 2005;106:812-817.
13. Pérez-Persona E, Mateo G, García-Sanz R, et al. Risk of progression in smouldering myeloma and monoclonal gammopathies of unknown significance: comparative analysis of the evolution of monoclonal component and multiparameter flow cytometry of bone marrow plasma cells. Br J Haematol. 2010;148:110-114.
14. Dispenzieri A, Kyle RA, Katzmann JA, et al. Immunoglobulin free light chain ratio is an independent risk factor for progression of smoldering (asymptomatic) multiple myeloma. Blood. 2008;111:785-789.
15. Rajkumar SV, Larson D, Kyle RA. Diagnosis of smoldering multiple myeloma. N Engl J Med. 2011;365:474-475.
16. Hutchison CA, Harding S, Hewins P, et al. Quantitative assessment of serum and urinary polyclonal free light chains in patients with chronic kidney disease. Clin J Am Soc Nephrol. 2008;3:1684-1690.
17. Gottenberg JE, Aucouturier F, Goetz J, et al. Serum immunoglobulin free light chain assessment in rheumatoid arthritis and primary Sjögren’s syndrome. Ann Rheum Dis. 2007;66:23-27.
18. Kyle RA, Buadi F, Rajkumar SV. Management of monoclonal gammopathy of undetermined significance (MGUS) and smoldering multiple myeloma (SMM). Oncology. 2011;25:578-586.
19. Landgren O, Waxman AJ. Multiple myeloma precursor disease. JAMA. 2010;304:2397-2404.
20. Bianchi G, Kyle RA, Colby CL, et al. Impact of optimal follow-up of monoclonal gammopathy of undetermined significance on early diagnosis and prevention of myeloma-related complications. Blood. 2010;116:2019-2025.
21. Minter AR, Simpson H, Weiss BM, et al. Bone disease from monoclonal gammopathy of undetermined significance to multiple myeloma: pathogenesis, interventions, and future opportunities. Semin Hematol. 2011;48:55-65.
22. Za T, De Stefano V, Rossi E, et al; Multiple Myeloma GIMEMALatium Region Working Group. Arterial and venous thrombosis in patients with monoclonal gammopathy of undetermined significance: incidence and risk factors in a cohort of 1491 patients. Br J Haematol. 2013;160:673-679.
23. Kristinsson SY, Tang M, Pfeiffer RM, et al. Monoclonal gammopathy of undetermined significance and risk of infections: a population based study. Haematologica. 2012;97:854-858.
24. Hillengass J, Fechtner K, Weber MA, et al. Prognostic significance of focal lesions in whole-body magnetic resonance imaging in patients with asymptomatic multiple myeloma. J Clin Oncol. 2010;28:1606-1610.
25. Yancey MA, Waxman AJ, Landgren O. A case study progression to multiple myeloma. Clin J Oncol Nurs. 2010;14:419-422.
26. ClinicalTrials.gov. Available at: http://www.clinicaltrials.gov/ct2/results?term=MGUS and http://www.clinicaltrials.gov/ct2/results?term=SMM. Accessed June 23, 2015.
› For monoclonal gammopathy of undetermined significance (MGUS) patients at low risk, repeat serum protein electrophoresis (SPE) in 6 months. If no significant elevation of M-protein is found, repeat SPE every 2 to 3 years. A
› For patients with smoldering multiple myeloma, order SPE every 2 to 3 months in the first year following diagnosis; repeat every 4 to 6 months in the following year and every 6 to 12 months thereafter. B
Strength of recommendation (SOR)
A Good-quality patient-oriented evidence
B Inconsistent or limited-quality patient-oriented evidence
C Consensus, usual practice, opinion, disease-oriented evidence, case series
CASE › A 54-year-old man’s lab results following a routine annual examination reveal a level of IgM M-protein just under 1.5 g/dL. All other lab values, including free light chain (FLC) ratio and bone marrow exam, are normal. No clinical evidence of a related disorder is found. What is the risk that this patient’s condition could progress toward multiple myeloma, and how would you follow up?
The patient with a monoclonal gammopathy has an abnormal proliferation of monoclonal plasma cells that secrete an immunoglobulin, M-protein. This proliferation occurs most often in the bone marrow but can also be found in extra-medullary body tissue. The condition can begin insidiously, remain stable, or progress to frank malignancy causing bone and end-organ destruction. The major challenge is to separate stable, asymptomatic patients who require no treatment from patients with progressive, symptomatic myeloma who require immediate treatment.
An increased, measurable level of serum monoclonal immunoglobulins or FLCs is called monoclonal gammopathy of undetermined significance (MGUS) when there is <3 g/dL monoclonal protein in the serum, <10% monoclonal plasma cells in the bone marrow, and an absence of beta-cell proliferative disorders, lytic bone lesions, anemia, hypercalcemia, or renal insufficiency (TABLE 1).1,2 Serum and marrow measurements exceeding these values indicate progression of disease to a premalignancy stage. Continued proliferation of plasma cells in the bone marrow results in anemia and bone destruction, while the increase in M-protein leads to end-organ destruction. This final malignant state is multiple myeloma (MM).
Detailed classification of MGUS: A roadmap for monitoring patients
Extensive epidemiologic and clinical studies have refined the classification of MGUS3-5 and related disorders (TABLES 2-4),3 providing physicians with guidance on how to monitor patients. There are 3 kinds of monoclonal gammopathies, each reflecting a particular type of immunoglobulin involvement—non-IgM, IgM, or light chain. Additionally, within each type of gammopathy, patient-specific characteristics determine 3 categories of clinical significance: premalignancy with low risk of progression (1%-2% per year3); premalignancy with high risk of progression (10% per year3); and malignancy.
Non-IgM MGUS with a high risk of progression is designated smoldering multiple myeloma (SMM) (TABLE 2).3 IgM MGUS with a high risk of progression is defined as smoldering Waldenström macroglobulinemia (SWM), with a predisposition to progress to Waldenström macroglobulinemia (WM) and, rarely, to IgM MM (TABLE 3).3
More recently, it has been reported that approximately 20% of the cases of MM belong to a new entity called light-chain MM that features an absence of heavy chain (IgG, IgA, IgM, IgD, or IgE) secretion in serum.6 The premalignant precursor is light-chain MGUS (LC-MGUS). The criteria for LC-MGUS and idiopathic Bence Jones proteinuria are found in TABLE 4.3 Idiopathic Bence Jones proteinuria is equivalent to SMM and SWM due to its higher risk of progression (10%/year)3 to light-chain MM.
Prevalence of MGUS
In general, the prevalence of all types of MGUS increases with age and is affected by race, sex, family history, immunosuppression, and pesticide exposure. The Caucasian American population >50 years exhibits a prevalence of MGUS of approximately 3.2%;7 the African American population exhibits a significantly higher prevalence of 5.9% to 8.4%.7 Native Asians have a lower rate of MM, and, as expected, a lower MGUS prevalence than is seen in the Western population (Thailand ≈2.3%;8 Korea ≈3.3%;9 Japan ≈2.1%;10 China ≈0.8%11). The overall prevalence of the 3 types of MGUS is 4.2% in Caucasians.6
Distinguishing stable from progressive disease
The Mayo Clinic’s risk stratification model12 further specifies risk of disease progression based on 3 indicators: serum M-protein concentration, Ig isotype of M-protein, and serum FLC ratio.
MGUS. A marked increase in risk for disease progression is associated with a serum M-protein concentration ≥1.5 g/dL, a non-IgG isotype, or an abnormal serum FLC ratio (<0.26 or >1.65, reflecting an increase in either the kappa or lambda light chain).12 An MGUS patient exhibiting all 3 of these features has a 58% absolute risk of developing MM after 20 years of follow-up. A patient with 2 of the 3 abnormalities has a 37% risk of progressing to MM, and one who has just one abnormality has a 21% risk. In contrast, an MGUS patient who has an M-protein level <1.5 g/dL, an IgG isotype, and normal FLC range has only a 5% risk of progression to MM in the same 20 years.12
The Spanish Group risk stratification model13 is based on 2 risk factors: a high proportion of abnormal plasma cells (aPC) within the bone marrow plasma cell (BMPC) compartment (ie, ≥95% CD56+/CD19-); and an evolving subtype of the disease (defined as an increase in the level of serum M-protein by at least 10% during the first 6 months of follow-up, or a progressive and constant increase of the M-protein until overt MM develops). The 7-year cumulative probability of progression of MGUS to MM: 2% for patients with neither risk factor, 16% with one risk factor, and 72% with both risk factors.13
SMM. Classification of this progressive state is defined by a serum level of monoclonal protein (IgG, IgA, IgD, or IgE) ≥3 g/dL or a concentration of clonal bone marrow plasma cells ≥10%; and by an absence of end-organ damage such as hypercalcemia, renal insufficiency, anemia, and bone lesions (CRAB) that can be attributed to a plasma cell proliferative disorder (TABLE 2).3 Both laboratory and clinical criteria must be met.
According to the Mayo Clinic risk stratification model, likelihood of progression reflects combinations of 3 factors: bone marrow plasmacytosis ≥10%, a serum M-protein level ≥3 g/dL, and a serum FLC ratio ≤0.125 or ≥8.14 Using this stratification scheme, the risk over 10 years of progressing from SMM to MM is 84% for those with all 3 risk factors, 65% with 2 factors, and 52% with one factor.14 As SMM is defined, there is no upper limit of bone marrow involvement. However, Rajkumar et al15 found that progression time was significantly shorter (P<.001) among patients with ≥60% bone marrow involvement, compared with those having <60% involvement.
The Spanish Group risk stratification model13 uses the same model applied to MGUS: a proportion of abnormal plasma cells in the BMPC compartment ≥95% CD56+/CD19-; and an evolving subtype of disease. The 3-year cumulative probability of progression of SMM to MM is 46% for those with both risk factors, 12% for those with one factor, and <1% for those with no risk factors.13
LC-MGUS. The classification of LC-MGUS (TABLE 4)3 is primarily from a Mayo Clinic study6 and research on risk stratification is underway at 2 other institutions. False-positive results are possible in patients with renal16 and inflammatory17 disorders.
Applying risk stratification to patient management
The current approach to a patient with clearly defined MGUS is a prudent “watch and wait” strategy that specifies monitoring details based on risk category (ALGORITHM).1,18
MGUS. In the low-risk MGUS group (IgG subtype, M-protein <1.5 g/dL, and normal FLC ratio)3 there is no need for bone marrow examination or skeletal radiography. Repeat the serum protein electrophoresis (SPE) in 6 months, and if there is no significant elevation of M-protein, repeat the SPE every 2 to 3 years.1,19,20 However, if other findings are suggestive of plasma cell malignancy (anemia, renal insufficiency, hypercalcemia, or bone lesions), bone marrow examination and computed tomographic (CT) scan are advised. Further evaluation of an incidental detection of MGUS is also important since it is occasionally associated with bone diseases,21 arterial and venous thrombosis,22 and an increased risk (P<.05) of developing bacterial (pneumonia, osteomyelitis, septicemia, pyelonephritis, cellulitis, endocarditis, and meningitis) and viral (influenza and herpes zoster) infections.23
Patients in the intermediate- and high-risk MGUS groups with serum monoclonal protein ≥1.5 g/dL, IgA or IgM subtype or an abnormal FLC ratio should undergo tests for CRAB and have bone marrow aspirate and biopsy with cytogenetics, flow cytometry, and fluorescence in situ hybridization (FISH). Patients with IgM MGUS should also undergo a CT scan of the abdomen to rule out the presence of asymptomatic retroperitoneal lymph nodes.1,19 If the BM examination and CT scan yield negative results, repeat SPE and complete blood count (CBC) after 6 months and annually thereafter for life. IgD or IgE MGUS is rare, and patients exhibit a progression similar to the 20-year risk seen with MGUS generally.
SMM. Given the increased risk of progression from SMM to MM compared with MGUS (all risk groups), the 2010 International Myeloma Working Group (IMWG) has suggested monitoring SMM patients more frequently—ie, SPE every 2 to 3 months in the first year following diagnosis.1 Repeat SPE in the second year every 4 to 6 months, and, if results are clinically stable, every 6 to 12 months thereafter. In addition to a baseline bone marrow examination (including cytogenetics, flow cytometry, and FISH studies), consider ordering magnetic resonance imaging of the spine and pelvis to detect occult lesions, as their presence predicts a more rapid progression to MM.24 During the course of the follow-up, evaluate any unexplained anemia or renal function impairment for its origin. A report of MGUS progression over more than a decade to SMM and then to MM illustrates prudent monitoring of a patient.25
LC-MGUS. Once LC-MGUS is detected, first rule out AL-amyloidosis, light-chain deposition disease, or cast nephropathy. If no malignant state is present, repeat the FLC serum assay every 6 months with renal function tests. Idiopathic Bence Jones proteinuria and LC-MGUS have some overlap and both entities put patients at risk for developing MM or amyloidosis. It is not uncommon for MGUS to be accompanied by Bence Jones proteinuria.
In addition to a thorough history and physical examination, recommended followup for both of these entities includes CBC, creatinine, serum FLC, and 24-hour urine protein electrophoresis.6 With idiopathic Bence Jones proteinuria, a monoclonal protein evident on urine protein electrophoresis at >500 mg/24 hr must be followed up with tests for other signs of malignancy (CRAB) and BM examination to exclude the possibility of MM.6
Treatment of MGUS to prevent progression
Multiple myeloma is still an incurable disease. Since MGUS is a precursor of MM, attempts have been made to either slow its progression or eradicate it. Several independent intervention studies26 for the precursor diseases MGUS and SMM have been conducted or are ongoing. Thus far, no conclusive preventive treatment has been found and the 2010 IMWG guidelines do not recommend preventive therapy for MGUS and SMM patients by means of any drug, unless it is a part of a clinical trial.1
CASE › The patient profiled at the start of this article has one abnormal risk factor (IgM isotype) and has a low risk of progression to MM. Management should follow the steps outlined in the ALGORITHM1,18 for low-risk IgM MGUS: repeat SPE, CBC, and CT scan in 6 months and annually thereafter. If any abnormality is observed, rule out the possibilities of IgM SWM, IgM WM, or rapid progression to MM, and consider referral to an oncologist.
CORRESPONDENCE
John M. Boltri, MD, Department of Family and Community Medicine, Northeast Ohio Medical University, College of Medicine, 4209 St. Rt. 44, PO Box 95, Rootstown, Ohio 44272; jboltri@neomed.edu.
ACKNOWLEDGEMENTS
The authors thank Kenneth F. Tucker, MD (Webber Cancer Center, St John Macomb-Oakland Hospital, Warren, Mich) and Elizabeth Sykes, MD (Professor, Oakland University, William Beaumont School of Medicine, Rochester, Mich) for their review of this article.
1. Kyle RA, Durie BG, Rajkumar SV, et al; International Myeloma Working Group. Monoclonal gammopathy of undetermined significance (MGUS) and smoldering (asymptomatic) multiple myeloma: IMWG consensus perspectives risk factors for progression and guidelines for monitoring and management. Leukemia. 2010;24:1121-1127.
2. Swerdlow SH, Campro E, Harris NL, et al. World Health Organization Classification of Tumours of Haematopoietic and Lymphoid Tissues. 4th ed. Lyon, France: IRAC Press; 2008.
3. Rajkumar SV, Kyle RA, Buadi FK. Advances in the diagnosis, classification, risk stratification, and management of monoclonal gammopathy of undetermined significance: implications for recategorizing disease entities in the presence of evolving scientific evidence. Mayo Clin Proc. 2010;85:945-948.
4. Korde N, Kristinsson SY, Landgren O. Monoclonal gammopathy of undetermined significance (MGUS) and smoldering multiple myeloma (SMM): novel biological insights and development of early treatment strategies. Blood. 2011;117:5573-5581.
5. Landgren O, Kyle RA, Rajkumar SV. From myeloma precursor disease to multiple myeloma: new diagnostic concepts and opportunities for early intervention. Clin Cancer Res. 2011;17:1243-1252.
6. Dispenzieri A, Katzmann JA, Kyle RA, et al. Prevalence and risk of progression of light-chain monoclonal gammopathy of undetermined significance: a retrospective population-based cohort study. Lancet. 2010;375:1721-1728.
7. Wadhera RK, Rajkumar SV. Prevalence of monoclonal gammopathy of undetermined significance: a systematic review. Mayo Clin Proc. 2010;85:933-942.
8. Watanaboonyongcharoen P, Nakorn TN, Rojnuckarin P. Prevalence of monoclonal gammopathy of undetermined significance in Thailand. Int J Hematol. 2012;95:176-181.
9. Park HK, Lee KR, Kim YJ, et al. Prevalence of monoclonal gammopathy of undetermined significance in an elderly urban Korean population. Am J Hematol. 2011;86:752-755.
10. Iwanaga M, Tagawa M, Tsukasaki K, et al. Prevalence of monoclonal gammopathy of undetermined significance: study of 52,802 persons in Nagasaki City, Japan. Mayo Clin Proc. 2007;82:1474-1479.
11. Wu SP, Minter A, Costello R, et al. MGUS prevalence in an ethnically Chinese population in Hong Kong. Blood. 2013;121:2363-2364.
12. Rajkumar SV, Kyle RA, Therneau TM, et al. Serum free light chain ratio is an independent risk factor for progression in monoclonal gammopathy of undetermined significance. Blood. 2005;106:812-817.
13. Pérez-Persona E, Mateo G, García-Sanz R, et al. Risk of progression in smouldering myeloma and monoclonal gammopathies of unknown significance: comparative analysis of the evolution of monoclonal component and multiparameter flow cytometry of bone marrow plasma cells. Br J Haematol. 2010;148:110-114.
14. Dispenzieri A, Kyle RA, Katzmann JA, et al. Immunoglobulin free light chain ratio is an independent risk factor for progression of smoldering (asymptomatic) multiple myeloma. Blood. 2008;111:785-789.
15. Rajkumar SV, Larson D, Kyle RA. Diagnosis of smoldering multiple myeloma. N Engl J Med. 2011;365:474-475.
16. Hutchison CA, Harding S, Hewins P, et al. Quantitative assessment of serum and urinary polyclonal free light chains in patients with chronic kidney disease. Clin J Am Soc Nephrol. 2008;3:1684-1690.
17. Gottenberg JE, Aucouturier F, Goetz J, et al. Serum immunoglobulin free light chain assessment in rheumatoid arthritis and primary Sjögren’s syndrome. Ann Rheum Dis. 2007;66:23-27.
18. Kyle RA, Buadi F, Rajkumar SV. Management of monoclonal gammopathy of undetermined significance (MGUS) and smoldering multiple myeloma (SMM). Oncology. 2011;25:578-586.
19. Landgren O, Waxman AJ. Multiple myeloma precursor disease. JAMA. 2010;304:2397-2404.
20. Bianchi G, Kyle RA, Colby CL, et al. Impact of optimal follow-up of monoclonal gammopathy of undetermined significance on early diagnosis and prevention of myeloma-related complications. Blood. 2010;116:2019-2025.
21. Minter AR, Simpson H, Weiss BM, et al. Bone disease from monoclonal gammopathy of undetermined significance to multiple myeloma: pathogenesis, interventions, and future opportunities. Semin Hematol. 2011;48:55-65.
22. Za T, De Stefano V, Rossi E, et al; Multiple Myeloma GIMEMALatium Region Working Group. Arterial and venous thrombosis in patients with monoclonal gammopathy of undetermined significance: incidence and risk factors in a cohort of 1491 patients. Br J Haematol. 2013;160:673-679.
23. Kristinsson SY, Tang M, Pfeiffer RM, et al. Monoclonal gammopathy of undetermined significance and risk of infections: a population based study. Haematologica. 2012;97:854-858.
24. Hillengass J, Fechtner K, Weber MA, et al. Prognostic significance of focal lesions in whole-body magnetic resonance imaging in patients with asymptomatic multiple myeloma. J Clin Oncol. 2010;28:1606-1610.
25. Yancey MA, Waxman AJ, Landgren O. A case study progression to multiple myeloma. Clin J Oncol Nurs. 2010;14:419-422.
26. ClinicalTrials.gov. Available at: http://www.clinicaltrials.gov/ct2/results?term=MGUS and http://www.clinicaltrials.gov/ct2/results?term=SMM. Accessed June 23, 2015.
Do trigger point injections effectively treat fibromyalgia?
Possibly. Trigger point injections appear effective in reducing pain and increasing pressure thresholds in patients with fibromyalgia and myofascial trigger points (strength of recommendation [SOR]: B, small randomized controlled trials [RCTs]).
Consensus guidelines suggest that trigger point injections may have a role in the treatment of fibromyalgia (SOR: C, expert opinion).
Active injections produce sustained improvement
A 2011 double-blind RCT randomized 68 female patients with both fibromyalgia and myofascial trigger points to either active trigger point injections with 1 mL 0.5% bupivacaine or placebo-like needle penetration with no medication to an area near the trigger point.1 Patients were evaluated for both local and generalized fibromyalgia symptoms at 4 and 8 days (trial period) and after 30 days (follow-up). Injections occurred on Days 1 and 4, with an option of additional injections on Days 8 and 11.
Compared to baseline (7 days before the injection), patients receiving active trigger point injections had decreased myofascial pain episodes 7 days after the injection (5.6 vs 0.97 episodes; P<.001), decreased pain intensity (62 vs 19/100 mm Visual Analog Scale score; P<.001), and increased pressure threshold at the trigger point (1.5 vs 2.9 kg/cm2; P<.0001), whereas the control group showed no differences.
During Days 1 to 8, patients receiving active trigger point injections required less acetaminophen (0.2 vs 2.7 tablets/d; P<.0001). At Day 8, no patients in the active trigger point injection group requested additional injections, whereas all the patients in the control group requested an injection (P<.0001).
At Day 8, patients also had significantly decreased intensity of fibromyalgia pain, fewer tender points, and higher tender point pressure thresholds; none of these differences were statistically significant in the placebo injection group (data presented graphically). The improvements persisted at 30 days of follow-up (data presented graphically).
Small study shows improvement with injections after 2 weeks
An uncontrolled prospective before-after study in 1996 evaluated the effectiveness of 0.5% lidocaine trigger point injections in 9 patients with myofascial trigger points plus fibromyalgia compared with 9 patients with myofascial trigger points alone.2
Immediately after injection, patients with fibromyalgia had a nonsignificant worsening in pain intensity (pain scale 8.1 to 8.4/10; P>.1), but there was a significant improvement at 2 weeks (5.9; P<.01). The pressure threshold also decreased initially (1.7 to 1.4 kg/cm2; P>.1), but significantly increased at 2 weeks (2.4 kg/cm2; P<.01). In comparison, patients without fibromyalgia showed immediate improvement in all domains, which persisted at 2 weeks (P<.01).
What the guidelines say
Recent Canadian Fibromyalgia Guidelines discuss trigger point injections in the section on “off-label” medications, stating that they “may have some place in treatment of fibromyalgia.”3
1. Affaitati G, Costantini R, Fabrizio A, et al. Effects of treatment of peripheral pain generators in fibromyalgia patients. Eur J Pain. 2011;15:61-69.
2. Hong CZ, Hsueh TC. Difference in pain relief after trigger point injections in myofascial pain patients with and without fibromyalgia. Arch Phys Med Rehabil. 1996;77:1161-1166.
3. Fitzcharles MA, Ste-Marie PA, Goldenberg DL, et al. 2012. Canadian Guidelines for the diagnosis and management of fibromyalgia syndrome: executive summary. Pain Res Manag. 2013;18:119-126.
Possibly. Trigger point injections appear effective in reducing pain and increasing pressure thresholds in patients with fibromyalgia and myofascial trigger points (strength of recommendation [SOR]: B, small randomized controlled trials [RCTs]).
Consensus guidelines suggest that trigger point injections may have a role in the treatment of fibromyalgia (SOR: C, expert opinion).
Active injections produce sustained improvement
A 2011 double-blind RCT randomized 68 female patients with both fibromyalgia and myofascial trigger points to either active trigger point injections with 1 mL 0.5% bupivacaine or placebo-like needle penetration with no medication to an area near the trigger point.1 Patients were evaluated for both local and generalized fibromyalgia symptoms at 4 and 8 days (trial period) and after 30 days (follow-up). Injections occurred on Days 1 and 4, with an option of additional injections on Days 8 and 11.
Compared to baseline (7 days before the injection), patients receiving active trigger point injections had decreased myofascial pain episodes 7 days after the injection (5.6 vs 0.97 episodes; P<.001), decreased pain intensity (62 vs 19/100 mm Visual Analog Scale score; P<.001), and increased pressure threshold at the trigger point (1.5 vs 2.9 kg/cm2; P<.0001), whereas the control group showed no differences.
During Days 1 to 8, patients receiving active trigger point injections required less acetaminophen (0.2 vs 2.7 tablets/d; P<.0001). At Day 8, no patients in the active trigger point injection group requested additional injections, whereas all the patients in the control group requested an injection (P<.0001).
At Day 8, patients also had significantly decreased intensity of fibromyalgia pain, fewer tender points, and higher tender point pressure thresholds; none of these differences were statistically significant in the placebo injection group (data presented graphically). The improvements persisted at 30 days of follow-up (data presented graphically).
Small study shows improvement with injections after 2 weeks
An uncontrolled prospective before-after study in 1996 evaluated the effectiveness of 0.5% lidocaine trigger point injections in 9 patients with myofascial trigger points plus fibromyalgia compared with 9 patients with myofascial trigger points alone.2
Immediately after injection, patients with fibromyalgia had a nonsignificant worsening in pain intensity (pain scale 8.1 to 8.4/10; P>.1), but there was a significant improvement at 2 weeks (5.9; P<.01). The pressure threshold also decreased initially (1.7 to 1.4 kg/cm2; P>.1), but significantly increased at 2 weeks (2.4 kg/cm2; P<.01). In comparison, patients without fibromyalgia showed immediate improvement in all domains, which persisted at 2 weeks (P<.01).
What the guidelines say
Recent Canadian Fibromyalgia Guidelines discuss trigger point injections in the section on “off-label” medications, stating that they “may have some place in treatment of fibromyalgia.”3
1. Affaitati G, Costantini R, Fabrizio A, et al. Effects of treatment of peripheral pain generators in fibromyalgia patients. Eur J Pain. 2011;15:61-69.
2. Hong CZ, Hsueh TC. Difference in pain relief after trigger point injections in myofascial pain patients with and without fibromyalgia. Arch Phys Med Rehabil. 1996;77:1161-1166.
3. Fitzcharles MA, Ste-Marie PA, Goldenberg DL, et al. 2012. Canadian Guidelines for the diagnosis and management of fibromyalgia syndrome: executive summary. Pain Res Manag. 2013;18:119-126.
Evidence-based answers from the Family Physicians Inquiries Network
AHS: Insomnia in migraineurs indicates anxiety, depression risk
WASHINGTON – Individuals suffering from migraine who also regularly experience insomnia are highly predisposed to developing anxiety and depression, according to a population-based study presented at the annual meeting of the American Headache Society.
“Treating comorbid conditions, such as anxiety and depression, is an essential part of optimal treatment of migraine,” explained Dr. Min Chu of Hallym University in Anyang, South Korea. “However, anxiety and depression, even in migraineurs, are usually underdiagnosed and undertreated, [and] the association between insomnia and anxiety and depression among migraineurs in a population-based setting is still unknown.”

Dr. Chu and his coinvestigators selected a sample of 2,762 participants aged 19-69 years who underwent screening with the Insomnia Severity Index (ISI), Goldberg Anxiety Scale, and Patient Health Questionnaire–9 to determine each patient’s severity for each symptom. ISI scores equal to or greater than 15 were considered indicative of insomnia severe enough to potentially cause anxiety or depression. Evaluations for each subject were administered via a face-to-face, 60-item, semistructured interview.
Of 147 subjects found to have migraine in the previous year, 57 (38.8%) had insomnia, 45 (30.6%) had anxiety, and 26 (17.7%) had depression. Of the 57 migraineurs who also had insomnia, 50.9% had anxiety and 31.6% had depression. Logistic regression models ultimately showed that migraine and insomnia together create heightened odds for anxiety (odds ratio, 4.8; 95% confidence interval, 2.3-10.1) and depression (OR, 4.7; 95% CI, 1.9-11.8) (P < .001 for all). Out of the total population, 274 subjects (10.0%) had anxiety, 124 (4.5%) had depression, and 120 (4.3%) had insomnia.
“Insomnia, anxiety, and depression showed a close association in a population-based sample,” Dr. Chu said. “This association persisted among migraineurs, and more than two-thirds of migraineurs with insomnia have anxiety or depression.”
He added that it is critical for health care providers to assess insomnia in migraineurs to accurately treat anxiety and depression as well.
Dr. Chu did not report any relevant financial disclosures.
WASHINGTON – Individuals suffering from migraine who also regularly experience insomnia are highly predisposed to developing anxiety and depression, according to a population-based study presented at the annual meeting of the American Headache Society.
“Treating comorbid conditions, such as anxiety and depression, is an essential part of optimal treatment of migraine,” explained Dr. Min Chu of Hallym University in Anyang, South Korea. “However, anxiety and depression, even in migraineurs, are usually underdiagnosed and undertreated, [and] the association between insomnia and anxiety and depression among migraineurs in a population-based setting is still unknown.”
Dr. Chu and his coinvestigators selected a sample of 2,762 participants aged 19-69 years who underwent screening with the Insomnia Severity Index (ISI), Goldberg Anxiety Scale, and Patient Health Questionnaire–9 to determine each patient’s severity for each symptom. ISI scores equal to or greater than 15 were considered indicative of insomnia severe enough to potentially cause anxiety or depression. Evaluations for each subject were administered via a face-to-face, 60-item, semistructured interview.
Of 147 subjects found to have migraine in the previous year, 57 (38.8%) had insomnia, 45 (30.6%) had anxiety, and 26 (17.7%) had depression. Of the 57 migraineurs who also had insomnia, 50.9% had anxiety and 31.6% had depression. Logistic regression models ultimately showed that migraine and insomnia together create heightened odds for anxiety (odds ratio, 4.8; 95% confidence interval, 2.3-10.1) and depression (OR, 4.7; 95% CI, 1.9-11.8) (P < .001 for all). Out of the total population, 274 subjects (10.0%) had anxiety, 124 (4.5%) had depression, and 120 (4.3%) had insomnia.
“Insomnia, anxiety, and depression showed a close association in a population-based sample,” Dr. Chu said. “This association persisted among migraineurs, and more than two-thirds of migraineurs with insomnia have anxiety or depression.”
He added that it is critical for health care providers to assess insomnia in migraineurs to accurately treat anxiety and depression as well.
Dr. Chu did not report any relevant financial disclosures.
AT THE AHS ANNUAL MEETING
Key clinical point: Individuals suffering from migraines who also experience insomnia are at higher risk for develop anxiety and depression.
Major finding: A total of 66% of individuals who had both migraines and insomnia also experienced either anxiety or depression.
Data source: A population-based study of 2,762 South Koreans, aged 19-69 years.
Disclosures: Dr. Chu did not report any relevant financial disclosures.

Is colonoscopy indicated if only one of 3 stool samples is positive for occult blood?
Yes. Any occult blood on a fecal occult blood test (FOBT) should be investigated further because colorectal cancer mortality decreases when positive FOBT screenings are evaluated (strength of recommendation: A, systematic review, evidence-based guidelines).
Follow-up of positive screening results lowers colorectal cancer mortality
No studies directly compare the need for colonoscopy when various numbers of stool samples are positive for occult blood on an FOBT. However, a Cochrane review of 4 randomized controlled trials (RCTs) with more than 300,000 patients examined the effectiveness of the FOBT for colorectal cancer screening.1 Each study varied in its follow-up approach to a positive FOBT.
Two RCTs offered screening with FOBT or standard care (no screening) and immediately followed up any positive results with a colonoscopy. The screened group had lower colorectal cancer mortality (N=46,551; risk ratio [RR]=0.75; 95% confidence interval [CI], 0.62-0.91) than the unscreened group (N=61,933; RR=0.84; 95% CI, 0.73-0.96).
Another trial screened with FOBT or standard care and offered colonoscopy if 5 or more samples were positive on initial testing or one or more were positive on repeat testing. The screened group showed reduced colorectal cancer mortality (N=152,850; RR=0.87; 95% CI, 0.78-0.97).
The final trial examined screening with FOBT compared with standard care and inconsistently offered repeat FOBT or sigmoidoscopy with double-contrast barium enema if any samples were positive on initial testing, which resulted in decreased colorectal cancer mortality for the screened group (N=68,308; RR=0.84; 95% CI, 0.71-0.99).
Evidence-based guidelines recommend follow-up colonoscopy
Evidence-based guidelines from the United States Preventive Services Task Force, the European Commission, and the Canadian Task Force on Preventive Health Care state that FOBT should be used for colorectal cancer screening and that any positive screening test should be followed up with colonoscopy to further evaluate for neoplasm.2-4
An evidence- and expert opinion-based guideline from the American Cancer Society, the US Multi-Society Task Force on Colorectal Cancer, and the American College of Radiology clarifies the issue further by emphasizing that any positive FOBT necessitates a colonoscopy and stating that repeat FOBT or other test is inappropriate as follow-up.5
1. Hewitson P, Glasziou P, Watson E, et al. Cochrane systematic review of colorectal cancer screening using the fecal occult blood test (hemoccult): an update. Am J Gastroenterol. 2008;103:1541-1549.
2. United States Preventive Services Task Force. Screening for colorectal cancer: US Preventive Services Task Force recommendation statement. Ann Intern Med. 2008;149:627-638.
3. vonKarsa L, Patnick J, Segnan N, eds. European Guidelines for Quality Assurance in Colorectal Cancer Screening and Diagnosis. Luxembourg: Publications Office of the European Union; 2010.
4. McLeod RS; Canadian Task Force on Preventive Health Care. Screening strategies for colorectal cancer: a systematic review of the evidence. Can J Gastroenterol. 2001;15:647-660.
5. Levin B, Lieberman DA, McFarland B, et al. Screening and surveillance for the early detection of colorectal cancer and adenomatous polyps, 2008: a joint guideline from the American Cancer Society, the US Multi-Society Task Force on Colorectal Cancer, and the American College of Radiology. Gastroenterology. 2008;134:1570-1595.
Yes. Any occult blood on a fecal occult blood test (FOBT) should be investigated further because colorectal cancer mortality decreases when positive FOBT screenings are evaluated (strength of recommendation: A, systematic review, evidence-based guidelines).
Follow-up of positive screening results lowers colorectal cancer mortality
No studies directly compare the need for colonoscopy when various numbers of stool samples are positive for occult blood on an FOBT. However, a Cochrane review of 4 randomized controlled trials (RCTs) with more than 300,000 patients examined the effectiveness of the FOBT for colorectal cancer screening.1 Each study varied in its follow-up approach to a positive FOBT.
Two RCTs offered screening with FOBT or standard care (no screening) and immediately followed up any positive results with a colonoscopy. The screened group had lower colorectal cancer mortality (N=46,551; risk ratio [RR]=0.75; 95% confidence interval [CI], 0.62-0.91) than the unscreened group (N=61,933; RR=0.84; 95% CI, 0.73-0.96).
Another trial screened with FOBT or standard care and offered colonoscopy if 5 or more samples were positive on initial testing or one or more were positive on repeat testing. The screened group showed reduced colorectal cancer mortality (N=152,850; RR=0.87; 95% CI, 0.78-0.97).
The final trial examined screening with FOBT compared with standard care and inconsistently offered repeat FOBT or sigmoidoscopy with double-contrast barium enema if any samples were positive on initial testing, which resulted in decreased colorectal cancer mortality for the screened group (N=68,308; RR=0.84; 95% CI, 0.71-0.99).
Evidence-based guidelines recommend follow-up colonoscopy
Evidence-based guidelines from the United States Preventive Services Task Force, the European Commission, and the Canadian Task Force on Preventive Health Care state that FOBT should be used for colorectal cancer screening and that any positive screening test should be followed up with colonoscopy to further evaluate for neoplasm.2-4
An evidence- and expert opinion-based guideline from the American Cancer Society, the US Multi-Society Task Force on Colorectal Cancer, and the American College of Radiology clarifies the issue further by emphasizing that any positive FOBT necessitates a colonoscopy and stating that repeat FOBT or other test is inappropriate as follow-up.5
1. Hewitson P, Glasziou P, Watson E, et al. Cochrane systematic review of colorectal cancer screening using the fecal occult blood test (hemoccult): an update. Am J Gastroenterol. 2008;103:1541-1549.
2. United States Preventive Services Task Force. Screening for colorectal cancer: US Preventive Services Task Force recommendation statement. Ann Intern Med. 2008;149:627-638.
3. vonKarsa L, Patnick J, Segnan N, eds. European Guidelines for Quality Assurance in Colorectal Cancer Screening and Diagnosis. Luxembourg: Publications Office of the European Union; 2010.
4. McLeod RS; Canadian Task Force on Preventive Health Care. Screening strategies for colorectal cancer: a systematic review of the evidence. Can J Gastroenterol. 2001;15:647-660.
5. Levin B, Lieberman DA, McFarland B, et al. Screening and surveillance for the early detection of colorectal cancer and adenomatous polyps, 2008: a joint guideline from the American Cancer Society, the US Multi-Society Task Force on Colorectal Cancer, and the American College of Radiology. Gastroenterology. 2008;134:1570-1595.
Evidence-based answers from the Family Physicians Inquiries Network
Abdominal distention • loss of appetite • elevated creatinine • Dx?
THE CASE
A 21-year-old male college student sought care at our urology clinic for a 2-year history of progressive abdominal distention and loss of appetite due to abdominal pressure. On physical examination, his abdomen was distended and tense, but without any tenderness on palpation or any costovertebral angle tenderness. He had no abdominal or flank pain, and wasn’t in acute distress. His blood pressure was normal.
Initial lab test results were significant for elevated creatinine at 2.7 mg/dL (normal: 0.7-1.3 mg/dL) and blood urea nitrogen (BUN) at 31.1 mg/dL (normal: 6-20 mg/dL). Results of a complete blood count (CBC) were within normal ranges, including a white blood cell (WBC) count of 7900, hemoglobin level of 15.1 g/dL, and platelet count of 217,000/mcL. A urinalysis showed only a mild increase in the WBC count.
THE DIAGNOSIS
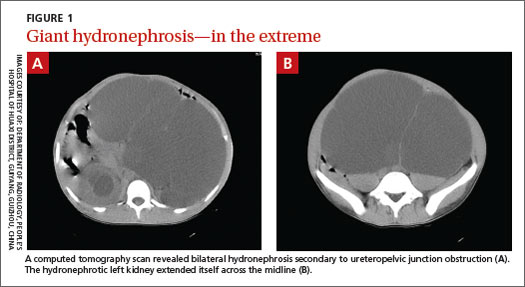
We performed a computed tomography (CT) scan of the patient’s abdomen, which revealed bilateral hydronephrosis secondary to ureteropelvic junction obstruction (UPJO). The patient’s right kidney was mildly to moderately enlarged, but the left kidney was massive (FIGURE 1A). The hydronephrotic left kidney had extended itself across the midline (FIGURE 1B), pushed the ipsilateral diaphragm upward, and displaced the bladder downward.
The patient underwent right-sided ureteral stent placement for temporary drainage and a complete left-sided nephrectomy. During the surgery, the left kidney was first aspirated, and more than 11,000 cc of clear urine was drained. (Aspiration reduced the kidney size, allowing the surgeon to make a smaller incision.) The removed kidney contained an additional 1200 cc of cloudy residual fluid (FIGURE 2). UPJO was confirmed by the pathological examination of the excised organ.
DISCUSSION
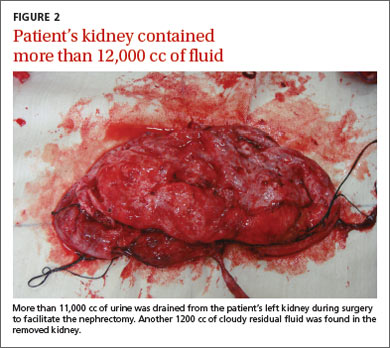
UPJO is the most common etiology for congenital hydronephrosis.1 Because it can cause little to no pain, hydronephrosis secondary to UPJO can be asymptomatic and may not present until later in life. Frequently, an abdominal mass is the initial clinical presentation.
When the hydronephrotic fluid exceeds 1000 cc, the condition is referred to as giant hydronephrosis.2 Although several cases of giant hydronephrosis secondary to UPJO have been reported in the medical literature,3-5 the volume of the hydronephrotic fluid in these cases rarely exceeded 10,000 cc. We believe our patient may be the most severe case of hydronephrosis secondary to bilateral UPJO, with 12,200 cc of fluid. His condition reached this late stage only because his right kidney retained adequate function.
Diagnosis of hydronephrosis is straightforward with an abdominal ultrasound and/or CT scan. Widespread use of abdominal ultrasound as a screening tool has significantly increased the diagnosis of asymptomatic hydronephrosis, and many cases are secondary to UPJO.6 The true incidence of UPJO is unknown, but it is more prevalent in males than in females, and in 10% to 40% of cases, the condition is bilateral.7 Congenital UPJO typically results from intrinsic pathology of the ureter. The diseased segment is often fibrotic, strictured, and aperistaltic.8
Treatment choice depends on whether renal function can be preserved
Treatment of hydronephrosis is straightforward; when there is little or no salvageable renal function (<10%), a simple nephrectomy is indicated, as was the case for our patient. Nephrectomy can be accomplished by either an open or laparoscopic approach.
When there is salvageable renal function, treatment options include pyeloplasty and pyelotomy. Traditionally, open dismembered pyeloplasty has been the gold standard. However, with advances in endoscopic and laparoscopic techniques, there has been a shift toward minimally invasive procedures. Laparoscopic pyeloplasty—with or without robotic assistance—and endoscopic pyelotomy—with either a percutaneous or retrograde approach—are now typically performed. Ureteral stenting should only be used as a temporary measure.
Our patient. Four weeks after the nephrectomy, our patient underwent a right side pyeloplasty, which was successful. He had an uneventful recovery from both procedures. His renal function stabilized and other than routine follow-up, he required no additional treatment.
THE TAKEAWAY
Most cases of hydronephrosis in young people are due to congenital abnormalities, and UPJO is the leading cause. However, the condition can be asymptomatic and may not present until later in life. Whenever a patient presents with an asymptomatic abdominal mass, hydronephrosis should be part of the differential diagnosis. Treatment options include nephrectomy when there is no salvageable kidney function or pyeloplasty and pyelotomy when some kidney function can be preserved.
1. Brown T, Mandell J, Lebowitz RL. Neonatal hydronephrosis in the era ultrasonography. AJR Am J Roentgenol. 1987;148:959-963.
2. Stirling WC. Massive hydronephrosis complicated by hydroureter: Report of 3 cases. J Urol. 1939;42:520.
3. Chiang PH, Chen MT, Chou YH, et al. Giant hydronephrosis: report of 4 cases with review of the literature. J Formos Med Assoc. 1990;89:811-817.
4. Aguiar MFM, Oliveira APS, Silva SC, et al. Giant hydronephrosis secondary to ureteropelvic junction obstruction. Gazzetta Medica Italiana-Archivio per le Scienze Mediche. 2009;168:207.
5. Sepulveda L, Rodriguesa F. Giant hydronephrosis - a late diagnosis of ureteropelvic junction obstruction. World J Nephrol Urol. 2013;2:33.
6. Bernstein GT, Mandell J, Lebowitz RL, et al. Ureteropelvic junction obstruction in neonate. J Urol. 1988;140:1216-1221.
7. Johnston JH, Evans JP, Glassberg KI, et al. Pelvic hydronephrosis in children: a review of 219 personal cases. J Urol. 1977;117:97-101.
8. Gosling JA, Dixon JS. Functional obstruction of the ureter and renal pelvis. A histological and electron microscopic study. Br J Urol. 1978;50:145-152.
THE CASE
A 21-year-old male college student sought care at our urology clinic for a 2-year history of progressive abdominal distention and loss of appetite due to abdominal pressure. On physical examination, his abdomen was distended and tense, but without any tenderness on palpation or any costovertebral angle tenderness. He had no abdominal or flank pain, and wasn’t in acute distress. His blood pressure was normal.
Initial lab test results were significant for elevated creatinine at 2.7 mg/dL (normal: 0.7-1.3 mg/dL) and blood urea nitrogen (BUN) at 31.1 mg/dL (normal: 6-20 mg/dL). Results of a complete blood count (CBC) were within normal ranges, including a white blood cell (WBC) count of 7900, hemoglobin level of 15.1 g/dL, and platelet count of 217,000/mcL. A urinalysis showed only a mild increase in the WBC count.
THE DIAGNOSIS
We performed a computed tomography (CT) scan of the patient’s abdomen, which revealed bilateral hydronephrosis secondary to ureteropelvic junction obstruction (UPJO). The patient’s right kidney was mildly to moderately enlarged, but the left kidney was massive (FIGURE 1A). The hydronephrotic left kidney had extended itself across the midline (FIGURE 1B), pushed the ipsilateral diaphragm upward, and displaced the bladder downward.
The patient underwent right-sided ureteral stent placement for temporary drainage and a complete left-sided nephrectomy. During the surgery, the left kidney was first aspirated, and more than 11,000 cc of clear urine was drained. (Aspiration reduced the kidney size, allowing the surgeon to make a smaller incision.) The removed kidney contained an additional 1200 cc of cloudy residual fluid (FIGURE 2). UPJO was confirmed by the pathological examination of the excised organ.
DISCUSSION
UPJO is the most common etiology for congenital hydronephrosis.1 Because it can cause little to no pain, hydronephrosis secondary to UPJO can be asymptomatic and may not present until later in life. Frequently, an abdominal mass is the initial clinical presentation.
When the hydronephrotic fluid exceeds 1000 cc, the condition is referred to as giant hydronephrosis.2 Although several cases of giant hydronephrosis secondary to UPJO have been reported in the medical literature,3-5 the volume of the hydronephrotic fluid in these cases rarely exceeded 10,000 cc. We believe our patient may be the most severe case of hydronephrosis secondary to bilateral UPJO, with 12,200 cc of fluid. His condition reached this late stage only because his right kidney retained adequate function.
Diagnosis of hydronephrosis is straightforward with an abdominal ultrasound and/or CT scan. Widespread use of abdominal ultrasound as a screening tool has significantly increased the diagnosis of asymptomatic hydronephrosis, and many cases are secondary to UPJO.6 The true incidence of UPJO is unknown, but it is more prevalent in males than in females, and in 10% to 40% of cases, the condition is bilateral.7 Congenital UPJO typically results from intrinsic pathology of the ureter. The diseased segment is often fibrotic, strictured, and aperistaltic.8
Treatment choice depends on whether renal function can be preserved
Treatment of hydronephrosis is straightforward; when there is little or no salvageable renal function (<10%), a simple nephrectomy is indicated, as was the case for our patient. Nephrectomy can be accomplished by either an open or laparoscopic approach.
When there is salvageable renal function, treatment options include pyeloplasty and pyelotomy. Traditionally, open dismembered pyeloplasty has been the gold standard. However, with advances in endoscopic and laparoscopic techniques, there has been a shift toward minimally invasive procedures. Laparoscopic pyeloplasty—with or without robotic assistance—and endoscopic pyelotomy—with either a percutaneous or retrograde approach—are now typically performed. Ureteral stenting should only be used as a temporary measure.
Our patient. Four weeks after the nephrectomy, our patient underwent a right side pyeloplasty, which was successful. He had an uneventful recovery from both procedures. His renal function stabilized and other than routine follow-up, he required no additional treatment.
THE TAKEAWAY
Most cases of hydronephrosis in young people are due to congenital abnormalities, and UPJO is the leading cause. However, the condition can be asymptomatic and may not present until later in life. Whenever a patient presents with an asymptomatic abdominal mass, hydronephrosis should be part of the differential diagnosis. Treatment options include nephrectomy when there is no salvageable kidney function or pyeloplasty and pyelotomy when some kidney function can be preserved.
1. Brown T, Mandell J, Lebowitz RL. Neonatal hydronephrosis in the era ultrasonography. AJR Am J Roentgenol. 1987;148:959-963.
2. Stirling WC. Massive hydronephrosis complicated by hydroureter: Report of 3 cases. J Urol. 1939;42:520.
3. Chiang PH, Chen MT, Chou YH, et al. Giant hydronephrosis: report of 4 cases with review of the literature. J Formos Med Assoc. 1990;89:811-817.
4. Aguiar MFM, Oliveira APS, Silva SC, et al. Giant hydronephrosis secondary to ureteropelvic junction obstruction. Gazzetta Medica Italiana-Archivio per le Scienze Mediche. 2009;168:207.
5. Sepulveda L, Rodriguesa F. Giant hydronephrosis - a late diagnosis of ureteropelvic junction obstruction. World J Nephrol Urol. 2013;2:33.
6. Bernstein GT, Mandell J, Lebowitz RL, et al. Ureteropelvic junction obstruction in neonate. J Urol. 1988;140:1216-1221.
7. Johnston JH, Evans JP, Glassberg KI, et al. Pelvic hydronephrosis in children: a review of 219 personal cases. J Urol. 1977;117:97-101.
8. Gosling JA, Dixon JS. Functional obstruction of the ureter and renal pelvis. A histological and electron microscopic study. Br J Urol. 1978;50:145-152.

Novel Rapid Response Team Can Decrease Non-ICU Cardiopulmonary Arrests, Mortality
Clinical question: Can novel configured rapid response teams (RRTs) improve non-ICU cardiopulmonary arrest (CPA) and overall hospital mortality rate?
Background: RRTs are primarily executed in hospital settings to avert non-ICU CPA through early detection and intervention. Prevailing evidence has not shown consistent clear benefit of RRTs in this regard.
Study design: A parallel-controlled, before-after design.
Setting: Two urban university hospitals with approximately 500 medical/surgical beds.
Synopsis: Researchers compared annual non-ICU CPA rates from two university hospitals with newly configured RRTs (implemented in November 2007) from July 2005 through June 2011 and found a decline in the incidence of non-ICU CPA to 1.1 from 2.7 per 1000 discharges (P<0.0001) while comparing pre- (2005/2006 to 2006/2007) to post- RRT implementation (2007-2011), respectively. Post-implementation, the overall hospital mortality dropped to 1.74% from 2.12% (P<0.001). With year-over-year, the RRT activation was found to be inversely related to Code Blue activations (r=-0.68, P<0.001), while the case mix index coefficients were still high.
The study lacks internal validation and may carry bias by including just one pre-implementation year (2006) data. It demonstrates that the rounding of unit manager (charge nurse) on “at risk” patients might avert decompensation; however, there was no determination of their decision-making process, with regard to RRT activation. No comparison was done with other RRT configurations.
Bottom line: Novel configured RRTs may improve non-ICU CPA and overall hospital mortality rate.
Citation: Davis DP, Aguilar SA, Graham PG, et al. A novel configuration of a traditional rapid response team decreases non-intensive care unit arrests and overall hospital mortality. J Hosp Med. 2015;10(6):352-357.