User login
Weekend Discharge and Readmission
Hospital readmission, defined as an admission to a hospital within 30 days of discharge from an acute‐care hospitalization, is associated with short‐term morbidity, mortality, and medical costs.[1] In 2013, the Patient Protection and Affordable Care Act began assigning financial penalties to hospitals based on performance against benchmarks on readmission for acute myocardial infarction (AMI), pneumonia (PNA), and congestive heart failure (CHF) through its Hospital Readmission Reduction Program (HRRP).[2] In its third year, the program recently announced penalties for 2,610 hospitals that will total over $428 million.[3] Despite increased attention to this issue, few interventions have been identified that effectively reduce hospital readmissions.[4, 5]
Hospital discharge is a complex process that aims to achieve the safe transfer of care of a hospitalized patient to another setting (eg, home, skilled nursing facility [SNF]). Success depends on adequate staffing of physicians, nurses, case managers, social workers, and pharmacists; clear communication among patients and providers; and integrated coordination of care. Although much focus has been placed on the association between weekend hospital admission and increased mortality,[6, 7, 8] very little is known about the impact of weekend hospital discharge on outcomes, specifically hospital readmission rates. Furthermore, previous studies on this topic, based on Canadian data, have produced conflicting results.[9, 10, 11]
Staffing of physicians, physician extenders (eg, physician assistants or nurse practitioners), nurses, case managers, social workers, and ancillary staff (eg, physical and occupational therapists) are all typically reduced on the weekend. Patients may be cared for by covering healthcare providers. These factors may have important implications on the timeliness of discharge, accuracy of discharge instructions, safety of discharge (eg, clearance by physical therapy), and medication reconciliation, among others. Clinic offices are more likely to be closed, and therefore, some follow‐up appointments may inadvertently not be scheduled, and lack of timely postdischarge follow‐up may be associated with higher rates of readmission.[12] Reduced outpatient pharmacy availability may also cause delays in patients receiving their medications,[13] which may exacerbate failed transition to the outpatient setting due to medication noncompliance.[14]
Based on this rationale, the current study was designed to investigate the association between weekend discharge and 30‐ and 90‐ day readmissions in patients hospitalized for medical diagnoses included in Centers for Medicare and Medicaid Services' HRRP.[15] To do so, a large‐state, all‐payer discharge database with individual patient record linkage numbers (RLN) was selected to capture all readmissions, even those to a different hospital. We hypothesized that patients who are discharged on a weekend would have higher hospital readmission rates compared to those discharged on a weekday.
METHODS
Approval was obtained from both the California Committee for the Protection of Human Subjects and the Stanford University Institutional Review Board. The California Office of State Health Planning and Development (OSHPD) 2012 Patient Discharge Data (PDD) was utilized for this study. The OSHPD‐PDD contains records for all patients admitted and eventually discharged from every general, acute, nonfederal hospital within the state. Demographic variables contained in the dataset include age, gender, race, and a unique RLN (an individually assigned number based on the patient's social security number and other demographics) to associate discharged patients with subsequent hospitalizations. Clinical information collected included principal diagnosis (indication for admission), 24 additional diagnoses with an indicator as to whether or not the condition was present on admission (POA) to differentiate comorbidities from complications, and principle procedure codes. Details about the admission included date of admission and discharge, admission type (scheduled or unscheduled), expected payer/emnsurance and disposition (home, acute rehabilitation, skilled nursing facility, residential facility, other). Details about the hospital included a unique identification number to indicate the location of care for both index/discharge and subsequent readmission.
International Classification of Disease, Ninth Edition, Clinical Modification (ICD‐9‐CM) coding schema were used to identify all patients admitted with the principal diagnosis of AMI (ICD‐9‐CM code 410.xx), CHF (428.xx), or PNA (480.xx‐486.xx). We excluded patients who were coded as having in‐hospital mortality, as these patients would not be eligible for readmission, those who were transferred to a different inpatient acute‐care facility, and those with invalid RLNs. Patients were separated into 2 groups based on the day of discharge. Weekday was defined as Monday through Friday, whereas weekend was defined as Saturday and Sunday. The Charlson Comorbidity Index was calculated based on POA comorbidities.
Demographic data, hospital variables, and readmission rates were directly compared for patients discharged on a weekend compared to weekday after admission for AMI, CHF, or PNA. Hospital readmission was defined as the first inpatient hospitalization for any reason at either 30 or 90 days following discharge from an index acute‐care hospitalization. Hospital identification codes were used to determine whether the readmission occurred at the index (discharging) hospital or to a different facility. The principal diagnosis for the subsequent admission was assessed to identify the most common reasons for readmission.
The [2] test and Student t test were used to compare mean values between the 2 groups when appropriate, with statistical significance set as P<0.05. Univariate and multivariable logistic regression models were built to estimate the odds of hospital readmission based on weekend versus weekday discharge after controlling for age, gender, race, Charlson Comorbidity Index, discharge disposition, payer status, length of stay, presence of complication, and admission type. All statistical analyses were 2‐tailed and performed using SAS 9.3 for windows (SAS Institute Inc., Cary, NC). The odds ratio (OR) was considered significant when it was not equal to 1, the 95% confidence interval (CI) did not include 1, and the P value was less than 0.05.
RESULTS
Patient Characteristics
There were 266,519 patients hospitalized with a principal diagnosis of AMI, CHF, or PNA in California during 2012 and met all inclusion criteria. The cohort consisted of 77,853 (29.2%) with AMI, 91,327 (34.3%) with CHF, and 97,339 (36.5%) with PNA. A total of 60,097 (22.5%) patients were discharged on the weekend compared to 206,422 (77.5%) on a weekday, which was similar across diagnosis groups. Differences in gender, age, race, Charlson comorbidity score, insurance status, type of admission, or occurrence of complications between patients who were discharged on the weekend versus weekday are listed in Table 1. Patients discharged on a weekend had a shorter average length of stay (LOS) (AMI: 4.05.6 days vs 4.67.7 days; CHF: 5.19.3 vs 6.034.1; PNA: 5.011.7 vs 5.710.7). A higher proportion of these patients were discharged to home (AMI: 67.1% vs 63.8%; CHF: 53.3% vs 49.4%; PNA: 57.0% vs 52.9%), whereas a smaller proportion were discharged to an SNF (AMI: 7.0% vs 9.6%; CHF: 11.2% vs 15.9%; PNA: 12.8% vs 17.8%).
| AMI | CHF | PNA | ||||
|---|---|---|---|---|---|---|
| Weekend | Weekday | Weekend | Weekday | Weekend | Weekday | |
| ||||||
| No. (%) | 18,061 (23.2) | 59,792 (76.8) | 20,487 (22.4) | 70,840 (77.6) | 21,549 (22.1) | 75,790 (77.9) |
| Age, y | ||||||
| 044 | 4.7 | 4.5 | 4.5 | 4.1 | 9.4 | 8.6 |
| 4554 | 13.1 | 13.0 | 8.5 | 8.3 | 9.8 | 9.9 |
| 5564 | 22.6 | 22.4 | 14.3 | 14.6 | 14.9 | 14.9 |
| 6574 | 22.5 | 22.7 | 19.2 | 18.7 | 18.3 | 18.0 |
| 7584 | 21.4 | 21.4 | 26.4 | 26.3 | 24.1 | 24.0 |
| 85+ | 15.6 | 16.0 | 27.2 | 28.0 | 23.5 | 24.5 |
| Mean (SD) | 68.5 (14.3) | 68.7 (14.3) | 73.3 (15.1) | 3.6 (15.0) | 70.0 (17.6) | 70.5 (17.4) |
| Sex | ||||||
| Male | 62.0 | 61.7 | 51.7 | 51.4 | 47.9 | 47.0 |
| Female | 38.0 | 38.3 | 48.3 | 48.6 | 52.1 | 52.1 |
| Race | ||||||
| White | 63.5 | 62.9 | 58.7 | 58.5 | 63.0 | 62.4 |
| Black | 6.9 | 7.3 | 12.0 | 12.1 | 7.7 | 8.0 |
| Hispanic | 19.5 | 20.0 | 20.3 | 20.6 | 20.4 | 20.7 |
| API | 10.0 | 9.7 | 9.0 | 8.8 | 8.8 | 8.9 |
| Charlson Comorbidity Index | ||||||
| 0 | 30.7 | 30.1 | 9.4 | 9.5 | 23.0 | 22.2 |
| 1 | 25.1 | 24.9 | 19.5 | 19.8 | 25.7 | 26.4 |
| 2 | 14.9 | 15.2 | 20.4 | 20.3 | 17.3 | 17.4 |
| 3 | 29.2 | 29.8 | 50.8 | 50.4 | 34.0 | 34.1 |
| Mean (SD) | 2.1 (2.2) | 2.1 (2.2) | 3.0 (2.3) | 3.0 (2.3) | 2.4 (2.6) | 2.4 (2.5) |
| Payer status | ||||||
| Private | 25.4 | 25.1 | 11.3 | 10.7 | 15.7 | 14.4 |
| Medicare | 57.6 | 57.9 | 72.7 | 73.1 | 67.1 | 68.1 |
| Medicaid | 8.0 | 8.0 | 10.0 | 10.6 | 11.5 | 11.8 |
| No insurance | 4.2 | 4.0 | 2.7 | 2.3 | 2.6 | 2.5 |
| Unknown | 4.8 | 4.9 | 3.3 | 3.3 | 3.2 | 3.2 |
| Complication | ||||||
| Urinary tract infection | 6.0 | 6.8 | 10.3 | 10.8 | 10.2 | 11.0 |
| Acute MI | 6.7 | 6.9 | 2.7 | 2.6 | 1.2 | 1.2 |
| DVT/PE | 0.02 | 0.02 | 0.01 | 0.01 | 0.03 | 0.03 |
| Pneumonia | 0.06 | 0.05 | 0.09 | 0.08 | 0.1 | 0.1 |
| Hemorrhage | 1.7 | 1.7 | 1.5 | 1.5 | 1.2 | 1.1 |
| Sepsis | 3.5 | 3.6 | 6.2 | 6.0 | 7.4 | 7.6 |
| Mean length of stay (SD) | 4.0 (5.6) | 4.6 (7.7) | 5.1 (9.3) | 6.0 (34.1) | 5.0 (11.7) | 5.7 (10.7) |
| Disposition | ||||||
| Home | 67.1 | 63.8 | 53.3 | 49.4 | 57.0 | 52.9 |
| Acute rehabilitation | 1.9 | 3.2 | 0.7 | 0.9 | 0.5 | 0.7 |
| Skilled nursing facility | 7.0 | 9.6 | 11.2 | 15.9 | 12.8 | 17.8 |
| Residential facility | 0.4 | 0.5 | 0.9 | 1.0 | 1.1 | 1.4 |
| Other | 23.6 | 23.0 | 33.9 | 32.8 | 28.6 | 27.2 |
| Admission type | ||||||
| Elective | 8.9 | 10.1 | 7.9 | 9.1 | 7.1 | 7.6 |
| Unplanned | 91.0 | 89.9 | 92.1 | 90.9 | 92.9 | 92.3 |
Rate, Reason, and Location of Readmission
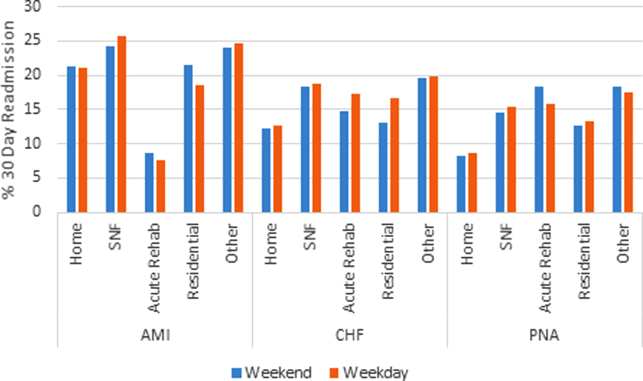
Table 2 shows overall rates of readmission. Among all patients, there were no significant differences in the unadjusted readmission rates for patients being discharged on a weekend versus weekday at either 30 days (16.7% vs 17.0%, P=0.14) or 90 days (26.9% vs 27.5%, P=0.05) (Table 2). Unadjusted 30‐day readmission rates were similar between the 2 groups for AMI (21.9% vs 21.9%, P=0.94) and PNA (12.1% vs 12.4%, P=0.28), whereas they were higher for weekday discharges in CHF (15.4% vs 16.0%, P=0.04). Similar results were seen for 90‐day readmission rates. To elucidate the impact of discharge disposition, a subset analysis was performed based on day of discharge and disposition (Figure 1). There was no difference in rates of readmission among patients discharged home on a weekend versus weekday (AMI: 21.3% vs 21.1%, P=0.78; CHF: 12.2% vs 12.6%, P=0.29; PNA: 8.3% vs 8.6%, P=0.29).
Abbreviations: AMI, acute myocardial infarction; CHF, congestive heart failure; PNA, pneumonia; SNF, skilled nursing facility.
| AMI | CHF | PNA | |||||||
|---|---|---|---|---|---|---|---|---|---|
| Weekend | Weekday | P Value | Weekend | Weekday | P Value | Weekend | Weekday | P Value | |
| |||||||||
| 30‐day readmission (%) | 3,954 (21.9) | 13,106 (21.9) | 0.94 | 3,162 (15.4) | 11,366 (16.0) | 0.04 | 2,608 (12.1) | 9,380 (12.4) | 0.28 |
| 90‐day readmission (%) | 5,253 (29.1) | 17,344 (29.0) | 0.84 | 5,994 (29.3) | 21,355 (30.2) | 0.008 | 4,698 (21.8) | 16,910 (22.3) | 0.11 |
The reason for hospital readmission was most frequently related to the principal diagnosis. Among patients discharged after hospitalization for AMI, 45.3% of readmissions had a principal diagnosis of AMI, whereas 13.9% listed readmission for angina or coronary artery disease. Of CHF discharges, at least 26.7% of readmissions were for CHF. PNA was the principal diagnosis in 19.8% of readmissions after admission for PNA. A significant proportion of patients (AMI: 64.8%, CHF: 35.0%, PNA: 32.9%) were readmitted to a different hospital than the discharging hospital.
Predictors of Readmission
On univariate logistic regression, discharge on a weekend was not associated with hospital readmission for patients admitted with AMI (OR: 1.0, 95% CI: 0.96‐1.04) or PNA (OR: 0.97, 95% CI: 0.93‐1.02) but was inversely associated for CHF (OR: 0.96, 95% CI: 0.91‐1.0). In multivariable models, weekend discharge was not associated with increased risk of readmission for any diagnosis (AMI [OR: 1.02, 95% CI: 0.98‐1.07], CHF [OR: 0.99, 95% CI: 0.95‐1.03], or PNA [OR: 1.02, 95% CI: 0.98‐1.07]; Table 3).
| AMI | CHF | PNA | ||||
|---|---|---|---|---|---|---|
| Univariate OR (95% CI) | Multivariable OR (95% CI) | Univariate OR (95% CI) | Multivariate OR (95% CI) | Univariate OR (95% CI) | Multivariate OR (95% CI) | |
| ||||||
| Weekend discharge | 1 (0.96‐1.04) | 1.02 (0.98‐1.06) | 0.96 (0.91‐1) | 0.99 (0.94‐1.03) | 0.97 (0.93‐1.02) | 1.02 (0.98‐1.07) |
| Age, y | ||||||
| 044 | ||||||
| 4554 | 1.02 (0.92‐1.12) | 0.96 (0.87‐1.07) | 1.04 (0.93‐1.16) | 1.00 (0.89‐1.11) | 1.08 (0.98‐1.19) | 0.93 (0.84‐1.03) |
| 5564 | 1.11 (1.02‐1.22) | 1.00 (0.91‐1.10) | 1.11 (1.01‐1.23) | 0.97 (0.88‐1.08) | 1.23 (1.13‐1.34) | 0.94 (0.86‐1.03) |
| 6574 | 1.31 (1.19‐1.43) | 1.04 (0.94‐1.15) | 1.1 (1‐1.22) | 0.90 (0.81‐1.01) | 1.29 (1.19‐1.41) | 0.87 (0.79‐0.96) |
| 7584 | 1.29 (1.18‐1.41) | 0.94 (0.85‐1.05) | 1.06 (0.97‐1.17) | 0.84 (0.75‐0.93) | 1.37 (1.27‐1.49) | 0.87 (0.79‐0.95) |
| 85+ | 1.03 (0.94‐1.13) | 0.72 (0.64‐0.81) | 0.98 (0.89‐1.08) | 0.76 (0.68‐0.84) | 1.31 (1.2‐1.41) | 0.78 (0.71‐0.86) |
| Gender | ||||||
| Female | ||||||
| Male | 1 (0.97‐1.04) | 1.1 (1.05‐1.14) | 1.06 (1.02‐1.1) | 1.08 (1.04‐1.12) | 1.13 (1.09‐1.18) | 1.15 (1.10‐1.19) |
| Race | ||||||
| White | ||||||
| Black | 1.17 (1.1‐1.25) | 1.12 (1.05‐1.20) | 1.06 (1‐1.12) | 1.03 (0.97‐1.09) | 1.11 (1.04‐1.19) | 1.07 (0.99‐1.15) |
| Hispanic | 1.11 (1.06‐1.16) | 1.12 (1.06‐1.17) | 1.05 (1‐1.1) | 1.04 (1.00‐1.10) | 0.93 (0.89‐0.98) | 0.95 (0.90‐1.00) |
| API | 1.14 (1.07‐1.2) | 1.09 (1.03‐1.16) | 1.01 (0.95‐1.08) | 1.00 (0.94‐1.07) | 0.97 (0.91‐1.04) | 0.93 (0.86‐0.99) |
| Charlson Comorbidity Index | ||||||
| 0 | ||||||
| 1 | 1.54 (1.46‐1.62) | 1.40 (1.32‐1.48) | 1.02 (0.95‐1.1) | 1.0 (0.92‐1.08) | 1.19 (1.12‐1.26) | 1.11 (1.04‐1.19) |
| 2 | 1.78 (1.69‐1.89) | 1.60 (1.51‐1.70) | 1.16 (1.08‐1.25) | 1.11 (1.03‐1.20) | 1.43 (1.34‐1.53) | 1.22 (1.14‐1.31) |
| 3 | 2.07 (1.97‐2.17) | 1.83 (1.73‐1.93) | 1.41 (1.32‐1.51) | 1.24 (1.15‐1.32) | 1.79 (1.69‐1.89) | 1.40 (1.31‐1.48) |
| Payer status | ||||||
| Private | ||||||
| Medicare | 1.02 (0.98‐1.06) | 0.89 (0.84‐0.95) | 1.04 (0.98‐1.11) | 1.04 (0.98‐1.12) | 1.29 (1.22‐1.37) | 1.06 (0.98‐1.13) |
| Medicaid | 0.89 (0.83‐0.96) | 0.83 (0.77‐0.89) | 1.2 (1.12‐1.3) | 1.23 (1.13‐1.33) | 1.28 (1.18‐1.38) | 1.18 (1.09‐1.28) |
| No insurance | 0.52 (0.46‐0.58) | 0.60 (0.53‐0.67) | 0.66 (0.57‐0.76) | 0.79 (0.68‐0.91) | 0.64 (0.54‐0.75) | 0.73 (0.61‐0.87) |
| Unknown | 0.71 (0.65‐0.78) | 0.77 (0.70‐0.84) | 0.91 (0.81‐1.03) | 1.02 (0.9‐1.15) | 0.9 (0.79‐1.03) | 0.93 (0.81‐1.06) |
| Disposition | ||||||
| Home | ||||||
| Acute care | 0.32 (0.27‐0.37) | 0.35 (0.29‐0.41) | 1.42 (1.18‐1.71) | 1.2 (1.05‐1.55) | 2.08 (1.69‐2.56) | 1.64 (1.32‐2.03) |
| SNF | 1.27 (1.2‐1.34) | 1.18 (1.10‐1.26) | 1.61 (1.53‐1.7) | 1.54 (1.46‐1.63) | 1.9 (1.81‐2.01) | 1.61 (1.52‐1.71) |
| Residential facility | 0.89 (0.68‐1.15) | 0.94 (0.72‐1.24) | 1.31 (1.1‐1.58) | 1.40 (1.16‐1.69) | 1.61 (1.37‐1.89) | 1.52 (1.29‐1.80) |
| Other | 1.21 (1.16‐1.26) | 1.10 (1.05‐1.15) | 1.72 (1.66‐1.79) | 1.59 (1.52‐1.66) | 2.31 (2.21‐2.41) | 1.88 (1.79‐1.98) |
| Length of stay* | 1.04 (1.02‐1.05) | 0.89 (0.87‐0.90) | 1.20 (1.19‐1.22) | 1.09 (1.08‐1.11) | 1.31 (1.29‐1.32) | 1.13 (1.1‐1.14) |
| Any complication | 3.14 (3.02‐3.26) | 2.61 (2.50‐2.73) | 1.52 (1.46‐1.59) | 1.35 (1.29‐1.41) | 1.70 (1.62‐1.78) | 1.39 (1.32‐1.45) |
| Admission type | ||||||
| Elective | ||||||
| Unplanned | 0.28 (0.27‐0.29) | 0.33 (0.31‐0.34) | 0.56 (0.54‐0.59) | 0.57 (0.53‐0.6) | 0.39 (0.37‐0.42) | 0.45 (0.42‐0.48) |
Increasing age, male gender, black race, greater Charlson Comorbidity Index, occurrence of any complication, and increased LOS were all associated with need for readmission on univariate analysis, though many of these associations weakened on multivariable analysis (Table 3). The effect of payer status on readmission was complex. Compared to private insurance, Medicare was associated with readmissions for patients with PNA (OR: 1.29, 95% CI: 1.22‐1.37) but not AMI (OR: 1.02, 95% CI: 0.98‐1.06) or CHF (OR: 1.04, 95% CI: 0.98‐1.11). Medicaid insurance was associated with readmission for CHF (OR: 1.20, 95% CI: 1.12‐1.30) and PNA (OR: 1.28, 95% CI: 1.18‐1.38) but appeared to be protective from readmission for AMI (OR: 0.89, 95% CI: 0.83‐0.96). Lack of insurance was associated with decreased odds of readmission for all diagnoses (P<0.05 for all models).
Models predicting 90‐day readmission rates showed similar results in all categories; therefore, the data are not shown.
DISCUSSION
We used a California statewide discharge database that linked individual patient records from all nonfederal hospitals to examine 30‐ and 90‐day hospital readmissions for CHF, AMI, and PNA. We hypothesized, but did not find, that weekend hospital discharge would be associated with higher hospital readmission rates. We did find other factors that were associated with hospital readmissions, including race, age, greater comorbidities, male gender, and discharge to an SNF. Nearly half of patients were readmitted for the same diagnosis as the initial discharge diagnosis, and nearly two‐thirds of the patients were readmitted to a hospital different from the discharging hospital.
Our study found some findings similar to prior investigations. First, the factors that predicted hospital readmission were complex and included age, race, gender, comorbidities, payer status, length of hospital stay, and the occurrence of a complication; most of these factors persisted after multivariable analysis but were not necessarily consistent across all admission diagnoses.[16, 17, 18] One finding of particular interest was the impact of insurance status. Specifically, lack of insurance was inversely associated with hospital readmission; this finding warrants further investigation. Our study is also similar to others in that we found that the most common reasons for readmission are typically related to the reason for the principal admission. Dharmarajan et al. previously studied the reason for readmission among hospitalized Medicare patients with AMI, CHF, and PNA, and found similarly high rates of identical admission diagnoses.[19] Furthermore, in our study, between 32% and 65% of 30‐day readmissions were to a hospital different than the discharging facility. Although few prior studies have had the ability to assess readmission to alternative hospitals, those who have done so in the past have found similar rates of divergence from the index facility.[20, 21]
Despite the apparent similarities to other studies, the current research question was specifically designed to investigate the weekend effect of hospital discharge. The term weekend effect refers to a phenomenon of worse clinical outcomes (eg, morbidity,[22] mortality,[6, 7] intensive care unit [ICU] readmission,[23] delays in appropriate diagnostic imaging[24, 25] and intervention,[26, 27] LOS,[28] and hospital costs[29]) for care delivered on a weekend. In a landmark study, Bell and Redelmeier demonstrated increased in‐house mortality for patients with ruptured abdominal aortic aneurysm, pulmonary embolism, or acute epiglottitis admitted through the emergency department on a weekend compared to weekday.[6] After controlling for patient variables, the association persisted, suggesting system‐related factors were contributory. Similarly, Kostis et al. showed that patients admitted to the hospital on a weekend with AMI had higher 30‐day mortality rates compared to those with weekday admission.[7] Finally, Aylin et al. demonstrated that mortality was 44% higher for patients undergoing elective surgery on a Friday and 82% higher for surgery on a weekend compared to a Monday.[30]
Despite this robust literature, fewer studies have evaluated the relationship between timing of discharge and outcomes. Much of the initial research has been focused on timing of discharge from the ICU. For example, transfer out of the ICU at night has been associated with higher in‐hospital mortality[31, 32, 33, 34, 35] as well as ICU readmission.[36, 37] Discharge from the ICU on a weekend has been associated with increased mortality in some studies[23] but not in others.[35, 38] Van Walraven and Bell were the first to investigate the impact of weekend hospital discharge on outcomes. In their analysis of all discharges from Ontario hospitals between 1990 and 2000, patients discharged on a Friday were at increased risk of death and 30‐day readmission compared to discharge on a Wednesday.[9] Beck et al. performed a similar study in pediatric patients but did not find a statistically significant effect of Friday discharge on readmission rates.[39] McAlister et al. specifically studied the effect of weekend (Saturday or Sunday) discharge on patients with CHF by analyzing discharges from Alberta, Canada hospitals between 1999 and 2009. Despite being comprised of lower‐risk patients, weekend discharge was associated with greater rates of 30‐ and 90‐day death and hospital readmission.[10] Conversely, McAlister et al. evaluated general medicine discharges from teaching hospitals in Alberta, Canada between 2009 and 2011 and found no difference in hospital readmission rates among those discharged on a weekend versus weekday.[11] The current investigation is the first to study hospitals in the United States to address this topic, an important consideration given differences in American and Canadian healthcare systems. Nevertheless, our results are similar to those of McAlister et al.,[11] who found no difference in hospital readmission rates based on day of discharge among patients with AMI, CHF, or PNA.
One potential explanation for finding a lack of correlation between weekend discharge and readmissions is that patients at higher risk for readmission are already selected toward weekday discharge. Our study found that patients discharged to an SNF, a group with higher odds of readmission, were less often discharged on a weekend. There may be other unmeasurable factors that differ between patients discharged on weekends versus weekdays. Also, factors that bias healthcare providers' decision making on timing of discharge are difficult to quantify and may differ between the 2 groups. Although our study hypothesis was driven by the perception that weekend discharges may fare poorly because of inadequate resources on the weekend, an alternative explanation for finding no association may be that current systems in place already do an effective job of discharge coordination on the weekend. Despite fears that staffing and equipment are significantly reduced during the weekend, perhaps weekend discharge resources are not the limiting factor in efforts to reduce readmissions.
Our results challenge the idea that weekend discharges predict hospital readmissions in California and argue for the relative safety of weekend discharges. Based on these findings, the routine delay in discharge of the complex medical patient until Monday for fear of discharge on a weekend does not seem warranted. Avoiding unnecessary delays in discharge should have positive effects on healthcare costs by reducing LOS. Two additional implications of our work are that single institution studies may underestimate readmission rates,[40] and that discharge to an SNF should receive special consideration in calculation of hospital‐level penalties for subsequent readmissions, as this group is associated with particularly higher risk.
There are some limitations to our study that should be acknowledged. The use of administrative data has well known limitations and the possibility of coding inaccuracy cannot be excluded.[41] Certain factors that could potentially differ between groups, such as illness severity, as well as details on the discharge process, were not available in this administrative database. In addition, elective readmissions were not excluded from the study. Also, because of the way the data were coded, a significant percentage of discharge dispositions were unknown. Finally, although morbidity and mortality have been studied in previous reports,[9, 10, 39] these data were not available for the current study, limiting the applicability of its conclusions.
CONCLUSIONS
In conclusion, among patients admitted with AMI, CHF, or PNA in California, discharge on a weekend is not associated with hospital readmission. Future studies on hospital readmissions should use a population‐based approach to accurately capture all readmissions following discharge.
Acknowledgments
Disclosure: Nothing to report.
- , Hospital readmissions as a measure of quality of health care: advantages and limitations. Arch Intern Med. 2000;160(8):1074–1081.
- , Hospital readmissions and the Affordable Care Act: paying for coordinated quality care. JAMA. 2011;306(16):1794–1795.
- Medicare fines 2,610 hospitals in third round of readmission penalties. Kaiser Health News. Available at: http://www.kaiserhealthnews.org/Stories/2014/October/02/Medicare‐readmissions‐penalties‐2015.aspx. Published October 2, 2014. Accessed October 2, 2014.
- , Interventions to decrease hospital readmissions: keys for cost‐effectiveness. JAMA Intern Med. 2013;173(8):695–698.
- , , , , Interventions to reduce 30‐day rehospitalization: a systematic review. Ann Intern Med. 2011;155(8):520–528.
- , Mortality among patients admitted to hospitals on weekends as compared with weekdays. N Engl J Med. 2001;345(9):663–668.
- , , , et al. Weekend versus weekday admission and mortality from myocardial infarction. N Engl J Med. 2007;356(11):1099–1109.
- , , , , , Mortality rate after nonelective hospital admission. Arch Surg 2011;146(5):545–551.
- , Risk of death or readmission among people discharged from hospital on Fridays. CMAJ. 2002;166(13):1672–1673.
- , , , , Postdischarge outcomes in heart failure are better for teaching hospitals and weekday discharges. Circ Heart Fail. 2013;6(5):922–929.
- , , , Similar outcomes among general medicine patients discharged on weekends. J Hosp Med. 2015;10(2):69–74.
- , , Post‐hospitalization transitions: examining the effects of timing of primary care provider follow‐up. J Hosp Med. 2010;5(7):392–397.
- , , , , The incidence and severity of adverse events affecting patients after discharge from the hospital. Ann Intern Med. 2003;138(3):161–167.
- , , , et al. Unintended medication discrepancies at the time of hospital admission. Arch Intern Med. 2005;165(4):424–429.
- Readmissions Reduction Program. August 2014. Available at: http://www.cms.gov/Medicare/Medicare‐Fee‐for‐Service‐Payment/AcuteInpatientPPS/Readmissions‐Reduction‐Program.html. Accessed October 2, 2014.
- , , Thirty‐day readmission rates for Medicare beneficiaries by race and site of care. JAMA. 2011;305(7):675–681.
- , , , et al. Hospital readmission in general medicine patients: a prediction model. J Gen Intern Med. 2009;25(3):211–219.
- , , Rehospitalizations among patients in the Medicare fee‐for‐service program. N Engl J Med. 2009;360(14):1418–1428.
- , , , et al. Diagnoses and timing of 30‐day readmissions after hospitalization for heart failure, acute myocardial infarction, or pneumonia. JAMA. 2013;309(4):355–363.
- , , , et al. Readmissions following pancreaticoduodenectomy for pancreas cancer: a population‐based appraisal. Ann Surg Oncol. 2009;16(3):554–561.
- , , , et al. Is same‐hospital readmission rate a good surrogate for all‐hospital readmission rate? Med Care. 2010;48(5):477–481.
- , , , et al. Worse outcomes in patients undergoing urgent surgery for left‐sided diverticulitis admitted on weekends vs weekdays: a population‐based study of 31 832 patients. Arch Surg. 2012;147(7):649–655.
- , , , et al. Mortality after discharge from the intensive care unit during the early weekend period: a population‐based cohort study in Denmark. Acta Anaesthesiol Scand. 2007;51(9):1225–1230.
- , , , Something for the weekend? JAMA Neurol. 2013;70(1):130.
- , , , , Dying for the weekend: a retrospective cohort study on the association between day of hospital presentation and the quality and safety of stroke care. Arch Neurol. 2012;69(10):1296–1302.
- , , , Effects of weekend admission on the outcomes and management of ruptured aortic aneurysms. J Vasc Surg. 2014;60(2):318–324
- , , , et al. Treatment delay in patients undergoing primary percutaneous coronary intervention for ST‐elevation myocardial infarction: a key process analysis of patient and program factors. Am Heart J. 2008;155(2):290–297.
- , , , et al. Weekend hospital admission and discharge for heart failure: association with quality of care and clinical outcomes. Am Heart J. 2009;158(3):451–458.
- , , , , Comparison of perioperative outcomes and cost of spinal fusion for cervical trauma: weekday versus weekend admissions. Spine. 2013;38(25):2178–2183.
- , , , , Day of week of procedure and 30 day mortality for elective surgery: retrospective analysis of hospital episode statistics. BMJ. 2013;346:f2424.
- , Consequences of discharges from intensive care at night. Lancet. 2000;355(9210):1138–1142.
- , , Waiting for the break of dawn? The effects of discharge time, discharge TISS scores and discharge facility on hospital mortality after intensive care. Intensive Care Med. 2002;28(9):1287–1293.
- , After‐hours discharges from intensive care are associated with increased mortality. Med J Aust. 2006;184(7):334–337.
- , Impact of intensive care unit discharge time on patient outcome. Crit Care Med. 2006;34(12):2946–2951.
- , , , Hospital mortality among adults admitted to and discharged from intensive care on weekends and evenings. J Crit Care. 2008;23(3):317–324.
- , , , et al. Factors associated with increased risk of readmission to intensive care in Australia. Intensive Care Med. 2011;37(11):1800–1808.
- , , , , After‐hours discharge from intensive care increases the risk of readmission and death. Anaesth Intensive Care. 2007;35(4):477–485.
- , , The effects of ICU admission and discharge times on mortality in Finland. Intensive Care Med. 2003;29(12):2144–2148.
- , , , , Day of discharge and hospital readmission rates within 30 days in children: a population‐based study. Paediatr Child Health. 2006;11(7):409–412.
- , , , Using same‐hospital readmission rates to estimate all‐hospital readmission rates. J Am Coll Surg. 2014;219(4):656–663.
- , , , et al. Evaluation of hospital readmissions in surgical patients: do administrative data tell the real story? JAMA Surg. 2014;149(8):759–764.
Hospital readmission, defined as an admission to a hospital within 30 days of discharge from an acute‐care hospitalization, is associated with short‐term morbidity, mortality, and medical costs.[1] In 2013, the Patient Protection and Affordable Care Act began assigning financial penalties to hospitals based on performance against benchmarks on readmission for acute myocardial infarction (AMI), pneumonia (PNA), and congestive heart failure (CHF) through its Hospital Readmission Reduction Program (HRRP).[2] In its third year, the program recently announced penalties for 2,610 hospitals that will total over $428 million.[3] Despite increased attention to this issue, few interventions have been identified that effectively reduce hospital readmissions.[4, 5]
Hospital discharge is a complex process that aims to achieve the safe transfer of care of a hospitalized patient to another setting (eg, home, skilled nursing facility [SNF]). Success depends on adequate staffing of physicians, nurses, case managers, social workers, and pharmacists; clear communication among patients and providers; and integrated coordination of care. Although much focus has been placed on the association between weekend hospital admission and increased mortality,[6, 7, 8] very little is known about the impact of weekend hospital discharge on outcomes, specifically hospital readmission rates. Furthermore, previous studies on this topic, based on Canadian data, have produced conflicting results.[9, 10, 11]
Staffing of physicians, physician extenders (eg, physician assistants or nurse practitioners), nurses, case managers, social workers, and ancillary staff (eg, physical and occupational therapists) are all typically reduced on the weekend. Patients may be cared for by covering healthcare providers. These factors may have important implications on the timeliness of discharge, accuracy of discharge instructions, safety of discharge (eg, clearance by physical therapy), and medication reconciliation, among others. Clinic offices are more likely to be closed, and therefore, some follow‐up appointments may inadvertently not be scheduled, and lack of timely postdischarge follow‐up may be associated with higher rates of readmission.[12] Reduced outpatient pharmacy availability may also cause delays in patients receiving their medications,[13] which may exacerbate failed transition to the outpatient setting due to medication noncompliance.[14]
Based on this rationale, the current study was designed to investigate the association between weekend discharge and 30‐ and 90‐ day readmissions in patients hospitalized for medical diagnoses included in Centers for Medicare and Medicaid Services' HRRP.[15] To do so, a large‐state, all‐payer discharge database with individual patient record linkage numbers (RLN) was selected to capture all readmissions, even those to a different hospital. We hypothesized that patients who are discharged on a weekend would have higher hospital readmission rates compared to those discharged on a weekday.
METHODS
Approval was obtained from both the California Committee for the Protection of Human Subjects and the Stanford University Institutional Review Board. The California Office of State Health Planning and Development (OSHPD) 2012 Patient Discharge Data (PDD) was utilized for this study. The OSHPD‐PDD contains records for all patients admitted and eventually discharged from every general, acute, nonfederal hospital within the state. Demographic variables contained in the dataset include age, gender, race, and a unique RLN (an individually assigned number based on the patient's social security number and other demographics) to associate discharged patients with subsequent hospitalizations. Clinical information collected included principal diagnosis (indication for admission), 24 additional diagnoses with an indicator as to whether or not the condition was present on admission (POA) to differentiate comorbidities from complications, and principle procedure codes. Details about the admission included date of admission and discharge, admission type (scheduled or unscheduled), expected payer/emnsurance and disposition (home, acute rehabilitation, skilled nursing facility, residential facility, other). Details about the hospital included a unique identification number to indicate the location of care for both index/discharge and subsequent readmission.
International Classification of Disease, Ninth Edition, Clinical Modification (ICD‐9‐CM) coding schema were used to identify all patients admitted with the principal diagnosis of AMI (ICD‐9‐CM code 410.xx), CHF (428.xx), or PNA (480.xx‐486.xx). We excluded patients who were coded as having in‐hospital mortality, as these patients would not be eligible for readmission, those who were transferred to a different inpatient acute‐care facility, and those with invalid RLNs. Patients were separated into 2 groups based on the day of discharge. Weekday was defined as Monday through Friday, whereas weekend was defined as Saturday and Sunday. The Charlson Comorbidity Index was calculated based on POA comorbidities.
Demographic data, hospital variables, and readmission rates were directly compared for patients discharged on a weekend compared to weekday after admission for AMI, CHF, or PNA. Hospital readmission was defined as the first inpatient hospitalization for any reason at either 30 or 90 days following discharge from an index acute‐care hospitalization. Hospital identification codes were used to determine whether the readmission occurred at the index (discharging) hospital or to a different facility. The principal diagnosis for the subsequent admission was assessed to identify the most common reasons for readmission.
The [2] test and Student t test were used to compare mean values between the 2 groups when appropriate, with statistical significance set as P<0.05. Univariate and multivariable logistic regression models were built to estimate the odds of hospital readmission based on weekend versus weekday discharge after controlling for age, gender, race, Charlson Comorbidity Index, discharge disposition, payer status, length of stay, presence of complication, and admission type. All statistical analyses were 2‐tailed and performed using SAS 9.3 for windows (SAS Institute Inc., Cary, NC). The odds ratio (OR) was considered significant when it was not equal to 1, the 95% confidence interval (CI) did not include 1, and the P value was less than 0.05.
RESULTS
Patient Characteristics
There were 266,519 patients hospitalized with a principal diagnosis of AMI, CHF, or PNA in California during 2012 and met all inclusion criteria. The cohort consisted of 77,853 (29.2%) with AMI, 91,327 (34.3%) with CHF, and 97,339 (36.5%) with PNA. A total of 60,097 (22.5%) patients were discharged on the weekend compared to 206,422 (77.5%) on a weekday, which was similar across diagnosis groups. Differences in gender, age, race, Charlson comorbidity score, insurance status, type of admission, or occurrence of complications between patients who were discharged on the weekend versus weekday are listed in Table 1. Patients discharged on a weekend had a shorter average length of stay (LOS) (AMI: 4.05.6 days vs 4.67.7 days; CHF: 5.19.3 vs 6.034.1; PNA: 5.011.7 vs 5.710.7). A higher proportion of these patients were discharged to home (AMI: 67.1% vs 63.8%; CHF: 53.3% vs 49.4%; PNA: 57.0% vs 52.9%), whereas a smaller proportion were discharged to an SNF (AMI: 7.0% vs 9.6%; CHF: 11.2% vs 15.9%; PNA: 12.8% vs 17.8%).
| AMI | CHF | PNA | ||||
|---|---|---|---|---|---|---|
| Weekend | Weekday | Weekend | Weekday | Weekend | Weekday | |
| ||||||
| No. (%) | 18,061 (23.2) | 59,792 (76.8) | 20,487 (22.4) | 70,840 (77.6) | 21,549 (22.1) | 75,790 (77.9) |
| Age, y | ||||||
| 044 | 4.7 | 4.5 | 4.5 | 4.1 | 9.4 | 8.6 |
| 4554 | 13.1 | 13.0 | 8.5 | 8.3 | 9.8 | 9.9 |
| 5564 | 22.6 | 22.4 | 14.3 | 14.6 | 14.9 | 14.9 |
| 6574 | 22.5 | 22.7 | 19.2 | 18.7 | 18.3 | 18.0 |
| 7584 | 21.4 | 21.4 | 26.4 | 26.3 | 24.1 | 24.0 |
| 85+ | 15.6 | 16.0 | 27.2 | 28.0 | 23.5 | 24.5 |
| Mean (SD) | 68.5 (14.3) | 68.7 (14.3) | 73.3 (15.1) | 3.6 (15.0) | 70.0 (17.6) | 70.5 (17.4) |
| Sex | ||||||
| Male | 62.0 | 61.7 | 51.7 | 51.4 | 47.9 | 47.0 |
| Female | 38.0 | 38.3 | 48.3 | 48.6 | 52.1 | 52.1 |
| Race | ||||||
| White | 63.5 | 62.9 | 58.7 | 58.5 | 63.0 | 62.4 |
| Black | 6.9 | 7.3 | 12.0 | 12.1 | 7.7 | 8.0 |
| Hispanic | 19.5 | 20.0 | 20.3 | 20.6 | 20.4 | 20.7 |
| API | 10.0 | 9.7 | 9.0 | 8.8 | 8.8 | 8.9 |
| Charlson Comorbidity Index | ||||||
| 0 | 30.7 | 30.1 | 9.4 | 9.5 | 23.0 | 22.2 |
| 1 | 25.1 | 24.9 | 19.5 | 19.8 | 25.7 | 26.4 |
| 2 | 14.9 | 15.2 | 20.4 | 20.3 | 17.3 | 17.4 |
| 3 | 29.2 | 29.8 | 50.8 | 50.4 | 34.0 | 34.1 |
| Mean (SD) | 2.1 (2.2) | 2.1 (2.2) | 3.0 (2.3) | 3.0 (2.3) | 2.4 (2.6) | 2.4 (2.5) |
| Payer status | ||||||
| Private | 25.4 | 25.1 | 11.3 | 10.7 | 15.7 | 14.4 |
| Medicare | 57.6 | 57.9 | 72.7 | 73.1 | 67.1 | 68.1 |
| Medicaid | 8.0 | 8.0 | 10.0 | 10.6 | 11.5 | 11.8 |
| No insurance | 4.2 | 4.0 | 2.7 | 2.3 | 2.6 | 2.5 |
| Unknown | 4.8 | 4.9 | 3.3 | 3.3 | 3.2 | 3.2 |
| Complication | ||||||
| Urinary tract infection | 6.0 | 6.8 | 10.3 | 10.8 | 10.2 | 11.0 |
| Acute MI | 6.7 | 6.9 | 2.7 | 2.6 | 1.2 | 1.2 |
| DVT/PE | 0.02 | 0.02 | 0.01 | 0.01 | 0.03 | 0.03 |
| Pneumonia | 0.06 | 0.05 | 0.09 | 0.08 | 0.1 | 0.1 |
| Hemorrhage | 1.7 | 1.7 | 1.5 | 1.5 | 1.2 | 1.1 |
| Sepsis | 3.5 | 3.6 | 6.2 | 6.0 | 7.4 | 7.6 |
| Mean length of stay (SD) | 4.0 (5.6) | 4.6 (7.7) | 5.1 (9.3) | 6.0 (34.1) | 5.0 (11.7) | 5.7 (10.7) |
| Disposition | ||||||
| Home | 67.1 | 63.8 | 53.3 | 49.4 | 57.0 | 52.9 |
| Acute rehabilitation | 1.9 | 3.2 | 0.7 | 0.9 | 0.5 | 0.7 |
| Skilled nursing facility | 7.0 | 9.6 | 11.2 | 15.9 | 12.8 | 17.8 |
| Residential facility | 0.4 | 0.5 | 0.9 | 1.0 | 1.1 | 1.4 |
| Other | 23.6 | 23.0 | 33.9 | 32.8 | 28.6 | 27.2 |
| Admission type | ||||||
| Elective | 8.9 | 10.1 | 7.9 | 9.1 | 7.1 | 7.6 |
| Unplanned | 91.0 | 89.9 | 92.1 | 90.9 | 92.9 | 92.3 |
Rate, Reason, and Location of Readmission
Table 2 shows overall rates of readmission. Among all patients, there were no significant differences in the unadjusted readmission rates for patients being discharged on a weekend versus weekday at either 30 days (16.7% vs 17.0%, P=0.14) or 90 days (26.9% vs 27.5%, P=0.05) (Table 2). Unadjusted 30‐day readmission rates were similar between the 2 groups for AMI (21.9% vs 21.9%, P=0.94) and PNA (12.1% vs 12.4%, P=0.28), whereas they were higher for weekday discharges in CHF (15.4% vs 16.0%, P=0.04). Similar results were seen for 90‐day readmission rates. To elucidate the impact of discharge disposition, a subset analysis was performed based on day of discharge and disposition (Figure 1). There was no difference in rates of readmission among patients discharged home on a weekend versus weekday (AMI: 21.3% vs 21.1%, P=0.78; CHF: 12.2% vs 12.6%, P=0.29; PNA: 8.3% vs 8.6%, P=0.29).
Abbreviations: AMI, acute myocardial infarction; CHF, congestive heart failure; PNA, pneumonia; SNF, skilled nursing facility.
| AMI | CHF | PNA | |||||||
|---|---|---|---|---|---|---|---|---|---|
| Weekend | Weekday | P Value | Weekend | Weekday | P Value | Weekend | Weekday | P Value | |
| |||||||||
| 30‐day readmission (%) | 3,954 (21.9) | 13,106 (21.9) | 0.94 | 3,162 (15.4) | 11,366 (16.0) | 0.04 | 2,608 (12.1) | 9,380 (12.4) | 0.28 |
| 90‐day readmission (%) | 5,253 (29.1) | 17,344 (29.0) | 0.84 | 5,994 (29.3) | 21,355 (30.2) | 0.008 | 4,698 (21.8) | 16,910 (22.3) | 0.11 |
The reason for hospital readmission was most frequently related to the principal diagnosis. Among patients discharged after hospitalization for AMI, 45.3% of readmissions had a principal diagnosis of AMI, whereas 13.9% listed readmission for angina or coronary artery disease. Of CHF discharges, at least 26.7% of readmissions were for CHF. PNA was the principal diagnosis in 19.8% of readmissions after admission for PNA. A significant proportion of patients (AMI: 64.8%, CHF: 35.0%, PNA: 32.9%) were readmitted to a different hospital than the discharging hospital.
Predictors of Readmission
On univariate logistic regression, discharge on a weekend was not associated with hospital readmission for patients admitted with AMI (OR: 1.0, 95% CI: 0.96‐1.04) or PNA (OR: 0.97, 95% CI: 0.93‐1.02) but was inversely associated for CHF (OR: 0.96, 95% CI: 0.91‐1.0). In multivariable models, weekend discharge was not associated with increased risk of readmission for any diagnosis (AMI [OR: 1.02, 95% CI: 0.98‐1.07], CHF [OR: 0.99, 95% CI: 0.95‐1.03], or PNA [OR: 1.02, 95% CI: 0.98‐1.07]; Table 3).
| AMI | CHF | PNA | ||||
|---|---|---|---|---|---|---|
| Univariate OR (95% CI) | Multivariable OR (95% CI) | Univariate OR (95% CI) | Multivariate OR (95% CI) | Univariate OR (95% CI) | Multivariate OR (95% CI) | |
| ||||||
| Weekend discharge | 1 (0.96‐1.04) | 1.02 (0.98‐1.06) | 0.96 (0.91‐1) | 0.99 (0.94‐1.03) | 0.97 (0.93‐1.02) | 1.02 (0.98‐1.07) |
| Age, y | ||||||
| 044 | ||||||
| 4554 | 1.02 (0.92‐1.12) | 0.96 (0.87‐1.07) | 1.04 (0.93‐1.16) | 1.00 (0.89‐1.11) | 1.08 (0.98‐1.19) | 0.93 (0.84‐1.03) |
| 5564 | 1.11 (1.02‐1.22) | 1.00 (0.91‐1.10) | 1.11 (1.01‐1.23) | 0.97 (0.88‐1.08) | 1.23 (1.13‐1.34) | 0.94 (0.86‐1.03) |
| 6574 | 1.31 (1.19‐1.43) | 1.04 (0.94‐1.15) | 1.1 (1‐1.22) | 0.90 (0.81‐1.01) | 1.29 (1.19‐1.41) | 0.87 (0.79‐0.96) |
| 7584 | 1.29 (1.18‐1.41) | 0.94 (0.85‐1.05) | 1.06 (0.97‐1.17) | 0.84 (0.75‐0.93) | 1.37 (1.27‐1.49) | 0.87 (0.79‐0.95) |
| 85+ | 1.03 (0.94‐1.13) | 0.72 (0.64‐0.81) | 0.98 (0.89‐1.08) | 0.76 (0.68‐0.84) | 1.31 (1.2‐1.41) | 0.78 (0.71‐0.86) |
| Gender | ||||||
| Female | ||||||
| Male | 1 (0.97‐1.04) | 1.1 (1.05‐1.14) | 1.06 (1.02‐1.1) | 1.08 (1.04‐1.12) | 1.13 (1.09‐1.18) | 1.15 (1.10‐1.19) |
| Race | ||||||
| White | ||||||
| Black | 1.17 (1.1‐1.25) | 1.12 (1.05‐1.20) | 1.06 (1‐1.12) | 1.03 (0.97‐1.09) | 1.11 (1.04‐1.19) | 1.07 (0.99‐1.15) |
| Hispanic | 1.11 (1.06‐1.16) | 1.12 (1.06‐1.17) | 1.05 (1‐1.1) | 1.04 (1.00‐1.10) | 0.93 (0.89‐0.98) | 0.95 (0.90‐1.00) |
| API | 1.14 (1.07‐1.2) | 1.09 (1.03‐1.16) | 1.01 (0.95‐1.08) | 1.00 (0.94‐1.07) | 0.97 (0.91‐1.04) | 0.93 (0.86‐0.99) |
| Charlson Comorbidity Index | ||||||
| 0 | ||||||
| 1 | 1.54 (1.46‐1.62) | 1.40 (1.32‐1.48) | 1.02 (0.95‐1.1) | 1.0 (0.92‐1.08) | 1.19 (1.12‐1.26) | 1.11 (1.04‐1.19) |
| 2 | 1.78 (1.69‐1.89) | 1.60 (1.51‐1.70) | 1.16 (1.08‐1.25) | 1.11 (1.03‐1.20) | 1.43 (1.34‐1.53) | 1.22 (1.14‐1.31) |
| 3 | 2.07 (1.97‐2.17) | 1.83 (1.73‐1.93) | 1.41 (1.32‐1.51) | 1.24 (1.15‐1.32) | 1.79 (1.69‐1.89) | 1.40 (1.31‐1.48) |
| Payer status | ||||||
| Private | ||||||
| Medicare | 1.02 (0.98‐1.06) | 0.89 (0.84‐0.95) | 1.04 (0.98‐1.11) | 1.04 (0.98‐1.12) | 1.29 (1.22‐1.37) | 1.06 (0.98‐1.13) |
| Medicaid | 0.89 (0.83‐0.96) | 0.83 (0.77‐0.89) | 1.2 (1.12‐1.3) | 1.23 (1.13‐1.33) | 1.28 (1.18‐1.38) | 1.18 (1.09‐1.28) |
| No insurance | 0.52 (0.46‐0.58) | 0.60 (0.53‐0.67) | 0.66 (0.57‐0.76) | 0.79 (0.68‐0.91) | 0.64 (0.54‐0.75) | 0.73 (0.61‐0.87) |
| Unknown | 0.71 (0.65‐0.78) | 0.77 (0.70‐0.84) | 0.91 (0.81‐1.03) | 1.02 (0.9‐1.15) | 0.9 (0.79‐1.03) | 0.93 (0.81‐1.06) |
| Disposition | ||||||
| Home | ||||||
| Acute care | 0.32 (0.27‐0.37) | 0.35 (0.29‐0.41) | 1.42 (1.18‐1.71) | 1.2 (1.05‐1.55) | 2.08 (1.69‐2.56) | 1.64 (1.32‐2.03) |
| SNF | 1.27 (1.2‐1.34) | 1.18 (1.10‐1.26) | 1.61 (1.53‐1.7) | 1.54 (1.46‐1.63) | 1.9 (1.81‐2.01) | 1.61 (1.52‐1.71) |
| Residential facility | 0.89 (0.68‐1.15) | 0.94 (0.72‐1.24) | 1.31 (1.1‐1.58) | 1.40 (1.16‐1.69) | 1.61 (1.37‐1.89) | 1.52 (1.29‐1.80) |
| Other | 1.21 (1.16‐1.26) | 1.10 (1.05‐1.15) | 1.72 (1.66‐1.79) | 1.59 (1.52‐1.66) | 2.31 (2.21‐2.41) | 1.88 (1.79‐1.98) |
| Length of stay* | 1.04 (1.02‐1.05) | 0.89 (0.87‐0.90) | 1.20 (1.19‐1.22) | 1.09 (1.08‐1.11) | 1.31 (1.29‐1.32) | 1.13 (1.1‐1.14) |
| Any complication | 3.14 (3.02‐3.26) | 2.61 (2.50‐2.73) | 1.52 (1.46‐1.59) | 1.35 (1.29‐1.41) | 1.70 (1.62‐1.78) | 1.39 (1.32‐1.45) |
| Admission type | ||||||
| Elective | ||||||
| Unplanned | 0.28 (0.27‐0.29) | 0.33 (0.31‐0.34) | 0.56 (0.54‐0.59) | 0.57 (0.53‐0.6) | 0.39 (0.37‐0.42) | 0.45 (0.42‐0.48) |
Increasing age, male gender, black race, greater Charlson Comorbidity Index, occurrence of any complication, and increased LOS were all associated with need for readmission on univariate analysis, though many of these associations weakened on multivariable analysis (Table 3). The effect of payer status on readmission was complex. Compared to private insurance, Medicare was associated with readmissions for patients with PNA (OR: 1.29, 95% CI: 1.22‐1.37) but not AMI (OR: 1.02, 95% CI: 0.98‐1.06) or CHF (OR: 1.04, 95% CI: 0.98‐1.11). Medicaid insurance was associated with readmission for CHF (OR: 1.20, 95% CI: 1.12‐1.30) and PNA (OR: 1.28, 95% CI: 1.18‐1.38) but appeared to be protective from readmission for AMI (OR: 0.89, 95% CI: 0.83‐0.96). Lack of insurance was associated with decreased odds of readmission for all diagnoses (P<0.05 for all models).
Models predicting 90‐day readmission rates showed similar results in all categories; therefore, the data are not shown.
DISCUSSION
We used a California statewide discharge database that linked individual patient records from all nonfederal hospitals to examine 30‐ and 90‐day hospital readmissions for CHF, AMI, and PNA. We hypothesized, but did not find, that weekend hospital discharge would be associated with higher hospital readmission rates. We did find other factors that were associated with hospital readmissions, including race, age, greater comorbidities, male gender, and discharge to an SNF. Nearly half of patients were readmitted for the same diagnosis as the initial discharge diagnosis, and nearly two‐thirds of the patients were readmitted to a hospital different from the discharging hospital.
Our study found some findings similar to prior investigations. First, the factors that predicted hospital readmission were complex and included age, race, gender, comorbidities, payer status, length of hospital stay, and the occurrence of a complication; most of these factors persisted after multivariable analysis but were not necessarily consistent across all admission diagnoses.[16, 17, 18] One finding of particular interest was the impact of insurance status. Specifically, lack of insurance was inversely associated with hospital readmission; this finding warrants further investigation. Our study is also similar to others in that we found that the most common reasons for readmission are typically related to the reason for the principal admission. Dharmarajan et al. previously studied the reason for readmission among hospitalized Medicare patients with AMI, CHF, and PNA, and found similarly high rates of identical admission diagnoses.[19] Furthermore, in our study, between 32% and 65% of 30‐day readmissions were to a hospital different than the discharging facility. Although few prior studies have had the ability to assess readmission to alternative hospitals, those who have done so in the past have found similar rates of divergence from the index facility.[20, 21]
Despite the apparent similarities to other studies, the current research question was specifically designed to investigate the weekend effect of hospital discharge. The term weekend effect refers to a phenomenon of worse clinical outcomes (eg, morbidity,[22] mortality,[6, 7] intensive care unit [ICU] readmission,[23] delays in appropriate diagnostic imaging[24, 25] and intervention,[26, 27] LOS,[28] and hospital costs[29]) for care delivered on a weekend. In a landmark study, Bell and Redelmeier demonstrated increased in‐house mortality for patients with ruptured abdominal aortic aneurysm, pulmonary embolism, or acute epiglottitis admitted through the emergency department on a weekend compared to weekday.[6] After controlling for patient variables, the association persisted, suggesting system‐related factors were contributory. Similarly, Kostis et al. showed that patients admitted to the hospital on a weekend with AMI had higher 30‐day mortality rates compared to those with weekday admission.[7] Finally, Aylin et al. demonstrated that mortality was 44% higher for patients undergoing elective surgery on a Friday and 82% higher for surgery on a weekend compared to a Monday.[30]
Despite this robust literature, fewer studies have evaluated the relationship between timing of discharge and outcomes. Much of the initial research has been focused on timing of discharge from the ICU. For example, transfer out of the ICU at night has been associated with higher in‐hospital mortality[31, 32, 33, 34, 35] as well as ICU readmission.[36, 37] Discharge from the ICU on a weekend has been associated with increased mortality in some studies[23] but not in others.[35, 38] Van Walraven and Bell were the first to investigate the impact of weekend hospital discharge on outcomes. In their analysis of all discharges from Ontario hospitals between 1990 and 2000, patients discharged on a Friday were at increased risk of death and 30‐day readmission compared to discharge on a Wednesday.[9] Beck et al. performed a similar study in pediatric patients but did not find a statistically significant effect of Friday discharge on readmission rates.[39] McAlister et al. specifically studied the effect of weekend (Saturday or Sunday) discharge on patients with CHF by analyzing discharges from Alberta, Canada hospitals between 1999 and 2009. Despite being comprised of lower‐risk patients, weekend discharge was associated with greater rates of 30‐ and 90‐day death and hospital readmission.[10] Conversely, McAlister et al. evaluated general medicine discharges from teaching hospitals in Alberta, Canada between 2009 and 2011 and found no difference in hospital readmission rates among those discharged on a weekend versus weekday.[11] The current investigation is the first to study hospitals in the United States to address this topic, an important consideration given differences in American and Canadian healthcare systems. Nevertheless, our results are similar to those of McAlister et al.,[11] who found no difference in hospital readmission rates based on day of discharge among patients with AMI, CHF, or PNA.
One potential explanation for finding a lack of correlation between weekend discharge and readmissions is that patients at higher risk for readmission are already selected toward weekday discharge. Our study found that patients discharged to an SNF, a group with higher odds of readmission, were less often discharged on a weekend. There may be other unmeasurable factors that differ between patients discharged on weekends versus weekdays. Also, factors that bias healthcare providers' decision making on timing of discharge are difficult to quantify and may differ between the 2 groups. Although our study hypothesis was driven by the perception that weekend discharges may fare poorly because of inadequate resources on the weekend, an alternative explanation for finding no association may be that current systems in place already do an effective job of discharge coordination on the weekend. Despite fears that staffing and equipment are significantly reduced during the weekend, perhaps weekend discharge resources are not the limiting factor in efforts to reduce readmissions.
Our results challenge the idea that weekend discharges predict hospital readmissions in California and argue for the relative safety of weekend discharges. Based on these findings, the routine delay in discharge of the complex medical patient until Monday for fear of discharge on a weekend does not seem warranted. Avoiding unnecessary delays in discharge should have positive effects on healthcare costs by reducing LOS. Two additional implications of our work are that single institution studies may underestimate readmission rates,[40] and that discharge to an SNF should receive special consideration in calculation of hospital‐level penalties for subsequent readmissions, as this group is associated with particularly higher risk.
There are some limitations to our study that should be acknowledged. The use of administrative data has well known limitations and the possibility of coding inaccuracy cannot be excluded.[41] Certain factors that could potentially differ between groups, such as illness severity, as well as details on the discharge process, were not available in this administrative database. In addition, elective readmissions were not excluded from the study. Also, because of the way the data were coded, a significant percentage of discharge dispositions were unknown. Finally, although morbidity and mortality have been studied in previous reports,[9, 10, 39] these data were not available for the current study, limiting the applicability of its conclusions.
CONCLUSIONS
In conclusion, among patients admitted with AMI, CHF, or PNA in California, discharge on a weekend is not associated with hospital readmission. Future studies on hospital readmissions should use a population‐based approach to accurately capture all readmissions following discharge.
Acknowledgments
Disclosure: Nothing to report.
- , Hospital readmissions as a measure of quality of health care: advantages and limitations. Arch Intern Med. 2000;160(8):1074–1081.
- , Hospital readmissions and the Affordable Care Act: paying for coordinated quality care. JAMA. 2011;306(16):1794–1795.
- Medicare fines 2,610 hospitals in third round of readmission penalties. Kaiser Health News. Available at: http://www.kaiserhealthnews.org/Stories/2014/October/02/Medicare‐readmissions‐penalties‐2015.aspx. Published October 2, 2014. Accessed October 2, 2014.
- , Interventions to decrease hospital readmissions: keys for cost‐effectiveness. JAMA Intern Med. 2013;173(8):695–698.
- , , , , Interventions to reduce 30‐day rehospitalization: a systematic review. Ann Intern Med. 2011;155(8):520–528.
- , Mortality among patients admitted to hospitals on weekends as compared with weekdays. N Engl J Med. 2001;345(9):663–668.
- , , , et al. Weekend versus weekday admission and mortality from myocardial infarction. N Engl J Med. 2007;356(11):1099–1109.
- , , , , , Mortality rate after nonelective hospital admission. Arch Surg 2011;146(5):545–551.
- , Risk of death or readmission among people discharged from hospital on Fridays. CMAJ. 2002;166(13):1672–1673.
- , , , , Postdischarge outcomes in heart failure are better for teaching hospitals and weekday discharges. Circ Heart Fail. 2013;6(5):922–929.
- , , , Similar outcomes among general medicine patients discharged on weekends. J Hosp Med. 2015;10(2):69–74.
- , , Post‐hospitalization transitions: examining the effects of timing of primary care provider follow‐up. J Hosp Med. 2010;5(7):392–397.
- , , , , The incidence and severity of adverse events affecting patients after discharge from the hospital. Ann Intern Med. 2003;138(3):161–167.
- , , , et al. Unintended medication discrepancies at the time of hospital admission. Arch Intern Med. 2005;165(4):424–429.
- Readmissions Reduction Program. August 2014. Available at: http://www.cms.gov/Medicare/Medicare‐Fee‐for‐Service‐Payment/AcuteInpatientPPS/Readmissions‐Reduction‐Program.html. Accessed October 2, 2014.
- , , Thirty‐day readmission rates for Medicare beneficiaries by race and site of care. JAMA. 2011;305(7):675–681.
- , , , et al. Hospital readmission in general medicine patients: a prediction model. J Gen Intern Med. 2009;25(3):211–219.
- , , Rehospitalizations among patients in the Medicare fee‐for‐service program. N Engl J Med. 2009;360(14):1418–1428.
- , , , et al. Diagnoses and timing of 30‐day readmissions after hospitalization for heart failure, acute myocardial infarction, or pneumonia. JAMA. 2013;309(4):355–363.
- , , , et al. Readmissions following pancreaticoduodenectomy for pancreas cancer: a population‐based appraisal. Ann Surg Oncol. 2009;16(3):554–561.
- , , , et al. Is same‐hospital readmission rate a good surrogate for all‐hospital readmission rate? Med Care. 2010;48(5):477–481.
- , , , et al. Worse outcomes in patients undergoing urgent surgery for left‐sided diverticulitis admitted on weekends vs weekdays: a population‐based study of 31 832 patients. Arch Surg. 2012;147(7):649–655.
- , , , et al. Mortality after discharge from the intensive care unit during the early weekend period: a population‐based cohort study in Denmark. Acta Anaesthesiol Scand. 2007;51(9):1225–1230.
- , , , Something for the weekend? JAMA Neurol. 2013;70(1):130.
- , , , , Dying for the weekend: a retrospective cohort study on the association between day of hospital presentation and the quality and safety of stroke care. Arch Neurol. 2012;69(10):1296–1302.
- , , , Effects of weekend admission on the outcomes and management of ruptured aortic aneurysms. J Vasc Surg. 2014;60(2):318–324
- , , , et al. Treatment delay in patients undergoing primary percutaneous coronary intervention for ST‐elevation myocardial infarction: a key process analysis of patient and program factors. Am Heart J. 2008;155(2):290–297.
- , , , et al. Weekend hospital admission and discharge for heart failure: association with quality of care and clinical outcomes. Am Heart J. 2009;158(3):451–458.
- , , , , Comparison of perioperative outcomes and cost of spinal fusion for cervical trauma: weekday versus weekend admissions. Spine. 2013;38(25):2178–2183.
- , , , , Day of week of procedure and 30 day mortality for elective surgery: retrospective analysis of hospital episode statistics. BMJ. 2013;346:f2424.
- , Consequences of discharges from intensive care at night. Lancet. 2000;355(9210):1138–1142.
- , , Waiting for the break of dawn? The effects of discharge time, discharge TISS scores and discharge facility on hospital mortality after intensive care. Intensive Care Med. 2002;28(9):1287–1293.
- , After‐hours discharges from intensive care are associated with increased mortality. Med J Aust. 2006;184(7):334–337.
- , Impact of intensive care unit discharge time on patient outcome. Crit Care Med. 2006;34(12):2946–2951.
- , , , Hospital mortality among adults admitted to and discharged from intensive care on weekends and evenings. J Crit Care. 2008;23(3):317–324.
- , , , et al. Factors associated with increased risk of readmission to intensive care in Australia. Intensive Care Med. 2011;37(11):1800–1808.
- , , , , After‐hours discharge from intensive care increases the risk of readmission and death. Anaesth Intensive Care. 2007;35(4):477–485.
- , , The effects of ICU admission and discharge times on mortality in Finland. Intensive Care Med. 2003;29(12):2144–2148.
- , , , , Day of discharge and hospital readmission rates within 30 days in children: a population‐based study. Paediatr Child Health. 2006;11(7):409–412.
- , , , Using same‐hospital readmission rates to estimate all‐hospital readmission rates. J Am Coll Surg. 2014;219(4):656–663.
- , , , et al. Evaluation of hospital readmissions in surgical patients: do administrative data tell the real story? JAMA Surg. 2014;149(8):759–764.
© 2015 Society of Hospital Medicine

David Henry's JCSO podcast, June 2015
This month, Dr David Henry of The Journal of Community and Supportive Oncology examines the use olaparib, which was recently approved for the treatment of BRCA-mutated advanced ovarian cancer, as well as four Original Research articles that focus on patient care, support, and quality of life. There’s a comparison of the antiemetic efficacy and safety of palonosetron and ondansetron in the prevention of chemotherapy-induced nausea and vomiting in children; a study that looks at the rationale, dosimetric parameters, and preliminary clinical outcomes in patients who undergo postoperative stereotactic radiosurgery with simultaneous integrated boost for brain metastases; an examination of the impact of nurse navigation on the timeliness of diagnostic medical services in patients with newly diagnosed lung cancer; and a study that draws on a novel approach to improving end-of-life care by measuring patterns of care among recently deceased patients. The podcast concludes with a round-up of some recent studies on cardiovascular disease in oncology, including the toxicity of cancer therapy and treatment guidelines from the American Society of Clinical Oncology.
This month, Dr David Henry of The Journal of Community and Supportive Oncology examines the use olaparib, which was recently approved for the treatment of BRCA-mutated advanced ovarian cancer, as well as four Original Research articles that focus on patient care, support, and quality of life. There’s a comparison of the antiemetic efficacy and safety of palonosetron and ondansetron in the prevention of chemotherapy-induced nausea and vomiting in children; a study that looks at the rationale, dosimetric parameters, and preliminary clinical outcomes in patients who undergo postoperative stereotactic radiosurgery with simultaneous integrated boost for brain metastases; an examination of the impact of nurse navigation on the timeliness of diagnostic medical services in patients with newly diagnosed lung cancer; and a study that draws on a novel approach to improving end-of-life care by measuring patterns of care among recently deceased patients. The podcast concludes with a round-up of some recent studies on cardiovascular disease in oncology, including the toxicity of cancer therapy and treatment guidelines from the American Society of Clinical Oncology.
This month, Dr David Henry of The Journal of Community and Supportive Oncology examines the use olaparib, which was recently approved for the treatment of BRCA-mutated advanced ovarian cancer, as well as four Original Research articles that focus on patient care, support, and quality of life. There’s a comparison of the antiemetic efficacy and safety of palonosetron and ondansetron in the prevention of chemotherapy-induced nausea and vomiting in children; a study that looks at the rationale, dosimetric parameters, and preliminary clinical outcomes in patients who undergo postoperative stereotactic radiosurgery with simultaneous integrated boost for brain metastases; an examination of the impact of nurse navigation on the timeliness of diagnostic medical services in patients with newly diagnosed lung cancer; and a study that draws on a novel approach to improving end-of-life care by measuring patterns of care among recently deceased patients. The podcast concludes with a round-up of some recent studies on cardiovascular disease in oncology, including the toxicity of cancer therapy and treatment guidelines from the American Society of Clinical Oncology.
VIDEO: Anticipatory guidance can reduce chronic postconcussion syndrome
WASHINGTON – Regardless of the number of tests and tools for helping to diagnose pediatric sports concussions, Dr. Christopher Giza, professor of pediatric neurology and neurosurgery at the University of California, Los Angeles, says it’s important for clinicians to remember that “concussion is a clinical diagnosis.”
In this video interview recorded at Summit in Neurology & Psychiatry, Dr. Giza offers pearls and insights into the latest in sports concussion management. He describes the four “Rs” of treating sports concussions and urges primary care personnel to offer anticipatory guidance to patients and their families. Such guidance can lead to a 20% decrease in chronic postconcussion syndrome in children and adolescents, he said at the meeting held by Global Academy for Medical Education. Global Academy and this news organization are owned by the same company.
The video associated with this article is no longer available on this site. Please view all of our videos on the MDedge YouTube channel
On Twitter @whitneymcknight
AT SUMMIT IN NEUROLOGY & PSYCHIATRY

DDW: Antibiotic rifaximin eases functional dyspepsia
WASHINGTON – Two weeks of antibiotic therapy with rifaximin provided relief from functional dyspepsia symptoms in a phase III double-blind, randomized trial.
“This is the first study that demonstrates that rifaximin is efficacious in the treatment of functional dyspepsia, particularly for global dyspeptic symptoms, bloating, and possibly belching. Our finding may suggest a role for the gut microbiota in the pathogenesis of functional dyspepsia,” Dr. Victoria Tan said at the annual Digestive Disease Week.

Rifaximin (Xifaxan) works by reducing or altering bacteria in the gut and has been shown to be efficacious in the treatment of diarrhea-predominant irritable bowel syndrome. It is approved to treat traveler’s diarrhea caused by Escherichia coli and to prevent hepatic encephalopathy.
The study randomly assigned 95 consecutive adults with functional dyspepsia as per ROME III criteria who had a normal gastroscopy within the last 2 years, had active symptoms in the month prior to enrollment, and were Helicobacter pylori negative, to rifaximin 400 mg or placebo three times a day for 2 weeks. In all, 33 rifaximin and 39 placebo patients were evaluable for the primary efficacy outcome of adequate relief of global dyspeptic symptoms (either no or mild dyspeptic symptoms) at any of the follow-up time points.
At baseline, 77% of patients had moderate to severe global dyspepsia symptoms, 74% of the placebo group and 55%% of the rifaximin group had moderate to severe belching, and roughly half of all patients were not on any GI medications. Mean age of the patients was 52 years.
Global dyspepsia symptoms improved with rifaximin beginning at week 2 and significantly favored rifaximin by week 8, with 23.5% of rifaximin patients reporting moderate to severe symptoms compared with 47.4% given placebo (P value = .04), said Dr. Tan of the University of Hong Kong.
Rates of moderate to severe belching were significantly improved with rifaximin at week 4 compared with placebo (14.3% vs. 35.7%; P = .03), but this difference was no longer significant at week 8 (26.5% vs. 29%).
The story was similar for moderate to severe bloating: Rates declined significantly with rifaximin at week 4 (20% vs. 43%; P = .03), but were no longer significant at week 8 (26.5% vs. 34.2%), she said.
A subgroup analysis of female patients showed significant improvements in moderate to severe global dyspeptic symptoms with rifaximin compared with placebo at week 4 (20.8% vs. 59.4%; P = .006) and week 8 (20% vs. 48.4%; P = .048).
Treatment response was not reflected in change in hydrogen breath response, Dr. Tan said. Results of a 3-hour hydrogen breath test performed after a 12-hour overnight fast showed no differences between the rifaximin and placebo groups for H2 peak above baseline (2.94 ppm vs. 0.11 ppm; P = .29), H2 area under the curve (+43.64 ppm vs. –49.71 ppm; P = .76), and oro-cecal transit time (24.23 minutes vs. 16.5 minutes; P = .68).
Adverse events were very similar between the two groups at both 4 and 8 weeks, Dr. Tan said. Only one major event occurred, a severe case of acute hepatitis in a woman in the placebo arm who also took traditional Chinese herbs.
On Twitter @pwendl
WASHINGTON – Two weeks of antibiotic therapy with rifaximin provided relief from functional dyspepsia symptoms in a phase III double-blind, randomized trial.
“This is the first study that demonstrates that rifaximin is efficacious in the treatment of functional dyspepsia, particularly for global dyspeptic symptoms, bloating, and possibly belching. Our finding may suggest a role for the gut microbiota in the pathogenesis of functional dyspepsia,” Dr. Victoria Tan said at the annual Digestive Disease Week.
Rifaximin (Xifaxan) works by reducing or altering bacteria in the gut and has been shown to be efficacious in the treatment of diarrhea-predominant irritable bowel syndrome. It is approved to treat traveler’s diarrhea caused by Escherichia coli and to prevent hepatic encephalopathy.
The study randomly assigned 95 consecutive adults with functional dyspepsia as per ROME III criteria who had a normal gastroscopy within the last 2 years, had active symptoms in the month prior to enrollment, and were Helicobacter pylori negative, to rifaximin 400 mg or placebo three times a day for 2 weeks. In all, 33 rifaximin and 39 placebo patients were evaluable for the primary efficacy outcome of adequate relief of global dyspeptic symptoms (either no or mild dyspeptic symptoms) at any of the follow-up time points.
At baseline, 77% of patients had moderate to severe global dyspepsia symptoms, 74% of the placebo group and 55%% of the rifaximin group had moderate to severe belching, and roughly half of all patients were not on any GI medications. Mean age of the patients was 52 years.
Global dyspepsia symptoms improved with rifaximin beginning at week 2 and significantly favored rifaximin by week 8, with 23.5% of rifaximin patients reporting moderate to severe symptoms compared with 47.4% given placebo (P value = .04), said Dr. Tan of the University of Hong Kong.
Rates of moderate to severe belching were significantly improved with rifaximin at week 4 compared with placebo (14.3% vs. 35.7%; P = .03), but this difference was no longer significant at week 8 (26.5% vs. 29%).
The story was similar for moderate to severe bloating: Rates declined significantly with rifaximin at week 4 (20% vs. 43%; P = .03), but were no longer significant at week 8 (26.5% vs. 34.2%), she said.
A subgroup analysis of female patients showed significant improvements in moderate to severe global dyspeptic symptoms with rifaximin compared with placebo at week 4 (20.8% vs. 59.4%; P = .006) and week 8 (20% vs. 48.4%; P = .048).
Treatment response was not reflected in change in hydrogen breath response, Dr. Tan said. Results of a 3-hour hydrogen breath test performed after a 12-hour overnight fast showed no differences between the rifaximin and placebo groups for H2 peak above baseline (2.94 ppm vs. 0.11 ppm; P = .29), H2 area under the curve (+43.64 ppm vs. –49.71 ppm; P = .76), and oro-cecal transit time (24.23 minutes vs. 16.5 minutes; P = .68).
Adverse events were very similar between the two groups at both 4 and 8 weeks, Dr. Tan said. Only one major event occurred, a severe case of acute hepatitis in a woman in the placebo arm who also took traditional Chinese herbs.
On Twitter @pwendl
AT DDW® 2015

Updated acute stroke guideline boosts thrombectomy
Pivotal new high-quality evidence from randomized clinical trials and other sources published since 2013 has prompted the American Heart Association and the American Stroke Association to update their joint clinical practice guideline on endovascular treatment of acute ischemic stroke.
The revisions were published online June 29 in Stroke.
Unchanged is the key recommendation that intravenous recombinant tissue-type plasminogen activator (r-tPA) remain the mainstay of initial therapy, even if endovascular treatment is being considered. But a new recommendation adds that a period of observation to assess patients’ clinical response to r-tPA before proceeding with endovascular therapy is not necessary and is not advisable, said Dr. William J. Powers, chair of the guideline writing committee and professor and chairman of the department of neurology, University of North Carolina, Durham, and his associates.
Most of the updates pertain to the use of a stent retriever, which is now recommended for all patients with acute ischemic stroke who meet these seven criteria:
1. A prestroke modified Rankin scale (mRS) score of 0-1.
2. Receipt of r-tPA within 4.5 hours of symptom onset.
3. Causative occlusion of the internal carotid artery or proximal middle cerebral artery.
4. Age of 18 years or older.
5. A National Institutes of Health Stroke Scale (NIHSS) score of 6 or greater.
6. An Alberta Stroke Program Early CT Score (ASPECTS) of 6 or greater.
7. Initiation of the procedure within 6 hours of symptom onset.
Use of stent retrievers also is now considered “reasonable” in carefully selected patients with occlusion of the anterior circulation who have contraindications to r-tPA, such as current use of anticoagulants, prior stroke, serious head trauma, or hemorrhagic coagulopathy. It also may be reasonable in selected patients who have causative occlusion of the M2 or M3 portion of the middle cerebral arteries, anterior cerebral arteries, vertebral arteries, basilar artery, or posterior cerebral arteries, although the benefits are “uncertain” in this patient population.
Similarly, endovascular therapy using stent retrievers may be reasonable for some patients younger than age 18 who otherwise meet the seven criteria, even though the benefits of treatment haven’t been established in this age group. And it likewise may be reasonable in patients with prestroke mRS scores greater than 1, an ASPECTS of less than 6, or NIHSS scores of less than 6 if there is causative occlusion of the internal carotid artery or the proximal middle cerebral artery.
The updated guideline also says that stent retrievers are preferable to the Merci device, but that other mechanical thrombectomy devices may be reasonable to use in some circumstances. And adjunctive use of a proximal balloon guide catheter or a large-bore distal access catheter rather than a cervical guide catheter along with stent retrievers also may be beneficial.
In addition, “the technical goal of the thrombectomy procedure should be a TICI [Thrombolysis in Cerebral Infarction] 2b/3 angiographic result to maximize the probability of a good functional outcome. Use of salvage technical adjuncts including intra-arterial fibrinolysis may be reasonable to achieve these angiographic results, if completed within 6 hours of symptom onset,” the guideline states (Stroke 2015 June 29 [doi:10.1161/STR.0000000000000074]).
Also with regard to intra-arterial rather than intravenous fibrinolysis, stent retrievers are now preferable to intra-arterial fibrinolysis as first-line therapy.
The updated guideline also has added the recommendation that conscious sedation may be preferable to general anesthesia during endovascular therapy, depending on patient risk factors, tolerance of the procedure, and other clinical characteristics. It also revised recommendations addressing imaging studies and systems of stroke care.
Five prospective, randomized controlled trials have come out in the past few months, and triggered a revolution in acute stroke therapy. All five studies – MR CLEAN, ESCAPE, EXTENT IA, SWIFT PRIME, and REVASCAT – were halted early because of the significant advantage mechanical endovascular therapy with stents or thrombus retrieval devices demonstrated over standard therapy featuring clot thrombolysis with r-tPA.
Collectively, the five trials showed a 60% greater chance for good functional recovery from stroke with endovascular interventions. The rate of a favorable neurologic outcome as reflected in a modified Rankin score of 0-2 was 48% with the use of stent/retriever devices, compared with 30% with thrombolysis alone, said Dr. Petr Widimsky, professor and chair of the cardiology department at Charles University in Prague, at the annual congress of the European Association of Percutaneous Cardiovascular Interventions (EuroPCR) held in Paris in May.
The American Academy of Neurology “affirms the value of this guideline as an educational tool for neurologists.” The revised guideline is endorsed by the American Association of Neurological Surgeons, the Congress of Neurological Surgeons, the American Society of Neuroradiology, and the Society of Vascular and Interventional Neurology. A copy of the document is available at http://myamericanheart.org/statements.
FROM STROKE
Key clinical point: Pivotal new evidence prompted several changes in the 2013 AHA/ASA clinical practice guideline for early endovascular treatment of acute ischemic stroke.
Major finding: Most of the updates pertain to use of stent retrievers, which is now recommended for all patients with acute ischemic stroke who meet seven criteria.
Data source: A detailed review of eight randomized clinical trials and other relevant data published since 2013.
Disclosures: This work was supported by the American Heart Association and the American Stroke Association; Medtronic/Covidien, maker of the stent retriever newly recommended in this guideline, is a corporate sponsor of both the AHA and the ASA. Dr. Powers reported having no relevant financial disclosures; his associates on the writing committee reported ties to Microvention, Penumbra, Silk Road, Pulse Therapeutics, Covidien, Genentech, Stryker, Roche, Sequent, Lazarus, Codman, and Aldagn/Cytomedix.

VIDEO: Sometimes, comfort care is best for ruptured AAAs
CHICAGO – Four preoperative variables predict whether or not patients will survive ruptured abdominal aortic aneurysm repairs, according to investigators from Harborview Medical Center in Seattle.
It’s an important finding because until now, it’s been hard to know how they’ll do. Previous risk scores also rely on intraoperative variables, or haven’t been validated for endovascular repair.
Investigator Dr. Ty Garland, chief vascular surgery resident at the University of Washington, explained in a video interview what the four variables are at a meeting hosted by the Society for Vascular Surgery, and why it was so important for a level 1 trauma center like Harborview to identify them.
The video associated with this article is no longer available on this site. Please view all of our videos on the MDedge YouTube channel
AT THE 2015 VASCULAR ANNUAL MEETING

DDW: Novel acid blocker holds its own against PPIs
WASHINGTON – An experimental acid suppressant was effective for prevention of peptic ulcer recurrence during NSAID therapy, with a safety profile similar to that of a currently marketed proton pump inhibitor, investigators reported.
At 2 years of follow-up, rates of recurrent peptic ulcers or hemorrhagic lesions in the stomach or duodenum among patients who took vonoprazan (marketed in Japan as Takecab) at a 10-mg or 20-mg daily oral dose were numerically but not statistically significantly lower than those for patients who took a 15-mg once daily dose of lansoprazole (Prevacid), said Dr. Yuji Mizokami of University of Tsukuba Hospital in Ibaraki, Japan.

“The long-term safety profile of vonoprazan was similar to lansoprazole, and no safety issues were identified,” he said at the annual Digestive Disease Week.
Proton pump inhibitors (PPIs) such as lansoprazole are frequently prescribed as concomitant gastroprotective agents in patients on long-term therapy with a nonsteroidal anti-inflammatory drug (NSAID) such as aspirin or ibuprofen.
PIs have relatively short half-lives, however, which may limit their effectiveness as gastroprotectives. In addition, polymorphisms in the gene encoding for cytochrome P2C19 (CYP2C19) can affect PPI metabolism, Dr. Mizokami said.
Vonoprazan belongs to a new class of acid-suppressing drugs called potassium-competitive acid blockers (PCABs), which, unlike PPIs, do not need to be activated by acid to become effective and are not affected by genetic variations. Vonoprazan migrates from blood into the secretory canaliculus of acid-secreting parietal cells, and because of its longer elimination half-life and stability in acidic environments, provides a strong acid-inhibiting effect from the first dose, and remains effective for 24 hours, Dr. Mizokami explained.
He presented data from a 2-year extension of a phase III, 24-week noninferiority study comparing vonoprazan with lansoprazole for prevention of peptic ulcer recurrence. In that study, 5.5% of patients on lansoprazole had recurrent gastric or duodenal ulcers by week 24, compared with 3.3% of patients on 10 mg vonoprazan, and 3.4% of those on 20 mg vonoprazan.
A total of 357 patients completed the extension study: 108 initially assigned to lansoprazole, 131 to vonoprazan 10 mg, and 118 to vonoprazan 20 mg.
At 1 year, the rates of recurrent ulcers were 7% for patients on lansoprazole, 3.6% for those on vonoprazan 10 mg, and 5.4% for those on vonoprazan 20 mg. The respective rates at 2 years were 7.5%. 3.8%, and 5.9%. In a safety analysis (intention-to-treat), treatment-emergent adverse events were mild, did not appear to be dose dependent with vonoprazan, and did not increase over time.
Serious treatment-emergent events occurred in 8.6% among the patients on lansoprazole, 8.3% among patients on 10 mg vonoprazan, and 14.2% among those on 20 mg. Events leading to drug discontinuation occurred in 7.6%, 4.1%, and 12.2% of patients, respectively.
In all three study arms, but especially in the vonoprazan arms, there was an increase in serum gastrin seen at week 4, which increased moderately until week 52. After that, it began to decline among patients on vonoprazan, while plateauing among patients on lansoprazole.
There were also increases in pepsinogen I and II at week 4 in all three treatment groups; the levels remained stable thereafter, as did the ratio of pepsinogen I to pepsinogen II.
Vonoprazan is currently approved only in Japan. The manufacturer, Takeda, has not said if or when it intends to file for a New Drug Application in the United States. The study was supported by Takeda Pharmaceuticals. Dr. Mizokami disclosed serving as a consultant on the study. Four of the coauthors are company employees.
WASHINGTON – An experimental acid suppressant was effective for prevention of peptic ulcer recurrence during NSAID therapy, with a safety profile similar to that of a currently marketed proton pump inhibitor, investigators reported.
At 2 years of follow-up, rates of recurrent peptic ulcers or hemorrhagic lesions in the stomach or duodenum among patients who took vonoprazan (marketed in Japan as Takecab) at a 10-mg or 20-mg daily oral dose were numerically but not statistically significantly lower than those for patients who took a 15-mg once daily dose of lansoprazole (Prevacid), said Dr. Yuji Mizokami of University of Tsukuba Hospital in Ibaraki, Japan.
“The long-term safety profile of vonoprazan was similar to lansoprazole, and no safety issues were identified,” he said at the annual Digestive Disease Week.
Proton pump inhibitors (PPIs) such as lansoprazole are frequently prescribed as concomitant gastroprotective agents in patients on long-term therapy with a nonsteroidal anti-inflammatory drug (NSAID) such as aspirin or ibuprofen.
PIs have relatively short half-lives, however, which may limit their effectiveness as gastroprotectives. In addition, polymorphisms in the gene encoding for cytochrome P2C19 (CYP2C19) can affect PPI metabolism, Dr. Mizokami said.
Vonoprazan belongs to a new class of acid-suppressing drugs called potassium-competitive acid blockers (PCABs), which, unlike PPIs, do not need to be activated by acid to become effective and are not affected by genetic variations. Vonoprazan migrates from blood into the secretory canaliculus of acid-secreting parietal cells, and because of its longer elimination half-life and stability in acidic environments, provides a strong acid-inhibiting effect from the first dose, and remains effective for 24 hours, Dr. Mizokami explained.
He presented data from a 2-year extension of a phase III, 24-week noninferiority study comparing vonoprazan with lansoprazole for prevention of peptic ulcer recurrence. In that study, 5.5% of patients on lansoprazole had recurrent gastric or duodenal ulcers by week 24, compared with 3.3% of patients on 10 mg vonoprazan, and 3.4% of those on 20 mg vonoprazan.
A total of 357 patients completed the extension study: 108 initially assigned to lansoprazole, 131 to vonoprazan 10 mg, and 118 to vonoprazan 20 mg.
At 1 year, the rates of recurrent ulcers were 7% for patients on lansoprazole, 3.6% for those on vonoprazan 10 mg, and 5.4% for those on vonoprazan 20 mg. The respective rates at 2 years were 7.5%. 3.8%, and 5.9%. In a safety analysis (intention-to-treat), treatment-emergent adverse events were mild, did not appear to be dose dependent with vonoprazan, and did not increase over time.
Serious treatment-emergent events occurred in 8.6% among the patients on lansoprazole, 8.3% among patients on 10 mg vonoprazan, and 14.2% among those on 20 mg. Events leading to drug discontinuation occurred in 7.6%, 4.1%, and 12.2% of patients, respectively.
In all three study arms, but especially in the vonoprazan arms, there was an increase in serum gastrin seen at week 4, which increased moderately until week 52. After that, it began to decline among patients on vonoprazan, while plateauing among patients on lansoprazole.
There were also increases in pepsinogen I and II at week 4 in all three treatment groups; the levels remained stable thereafter, as did the ratio of pepsinogen I to pepsinogen II.
Vonoprazan is currently approved only in Japan. The manufacturer, Takeda, has not said if or when it intends to file for a New Drug Application in the United States. The study was supported by Takeda Pharmaceuticals. Dr. Mizokami disclosed serving as a consultant on the study. Four of the coauthors are company employees.
AT DDW® 2015

Restarting anticoagulants, antiplatelets after major GI bleeding event raises rebleeding risk
WASHINGTON – Early resumption of antiplatelet agents or anticoagulants after a major gastrointestinal bleeding event is clearly associated with an increased risk of rebleeding, but a decreased risk of death, results from an observational study show.
Furthermore, anticoagulant treatment “is associated with a higher risk of rebleeding and death compared with antiplatelet treatment after a previous GI event,” Dr. Angel Lanas said to an overflow crowd at the annual Digestive Disease Week.

In a separate case-control study, Dr. Lanas and his associates recently reported that the risk of GI bleeding was twofold higher for anticoagulants than for low-dose aspirin in patients hospitalized for GI bleeding (Clin. Gastroenterol. Hepatol. 2015 May;13:906-12.e2. [doi:10.1016/j.cgh.2014.11.007])
The current study examined adverse events in a cohort of 160 patients who developed a major gastrointestinal bleed (GIB) while using anticoagulants and/or antiplatelet therapy between March 2008 and July 2013. Long-term interruption or short-term resumption of these treatments has important clinical implications and differences in the intrinsic risks between antiplatelet or anticoagulant users after drug resumption are not well established, said Dr. Lanas of the University of Zaragoza (Spain).

Drug use information was prospectively collected during the GIB event, with data during the follow-up period obtained from two different Spanish databases.
Treatment during the index bleeding event was continued without interruption in 11 patients and interrupted in 149 patients (93%). Among those whose therapy was interrupted, 21 (14%) never resumed therapy and 128 (86%) resumed therapy (118 patients within 15 days and 10 patients after 15 days). The 86% treatment resumption rate is much higher than the 40%-66% rates reported in previous studies, indicating that Spanish physicians restarted treatment quite early, Dr. Lanas observed.
The mean age at baseline was 76.6 years, 61.3% of patients were men, and half had a Charlson index score > 4. Median follow-up was 21.5 months (range 1-63 months).
Ischemic events did not differ between patients who did or did not restart anticoagulants or antiplatelets (16.4% vs. 14.3%; P value = .806). However, rebleeding occurred in 32% of patients who resumed therapy versus none who did not (P = .002), but deaths were higher in those who did not restart therapy (38.1% vs. 12.5%; P = .003), Dr. Lanas said.
These differences remain significant in Kaplan-Meier survival curves for death (P = .021) and rebleeding (P = .004).
A comparison of early therapy resumption (≤ 15 days) vs. delayed (mean delay 62 days) or no resumption revealed similar results. Early resumption was associated with a higher rate of rebleeding (32.2% vs. 9.7%; P = .012), but a lower rate of death (11% vs. 35.5%; P = .001), with no difference in ischemic events (17% vs. 13%; P = .586), Dr. Lanas said.
Again, the differences remain significant in Kaplan-Meier survival curves for death (P = .011) and rebleeding (P = .013).
When the investigators looked at rebleeding according to drug use, patients receiving anticoagulants vs. antiplatelets had significantly higher rates of rebleeding (34.7% vs. 20.5%; P = .043), death (22.2% vs. 10.2%; P = .038), and any event (68.1% vs. 52.3%; P = .043).
After adjustment for gender, age, Charlson index, diabetes, and arterial hypertension, the risk of rebleeding was more than threefold higher for dual antiplatelet and anticoagulant users than for antiplatelet-alone users (odds ratio, 3.45; P = .025) and was twofold higher for anticoagulant vs. antiplatelet users (OR, 2.07; P = .045), Dr. Lanas said.
Finally, an analysis of the cause of bleeding suggests the cause of rebleeding may be different from the original event and that there is a shift toward the lower GI tract, he added.
The index bleeding event was caused largely by an upper GI peptic ulcer in 48% of all 160 patients, with 43.7% of events due to lower GI diverticulosis, vascular lesions, ischemic, or other lesions. In contrast, peptic ulcers accounted for only 7% of rebleeding events, while lower GI events accounted for 72%. Proton pump inhibition use was evenly distributed in upper and lower GI bleeding, although effective endoscopic treatment may have influenced upper GI bleeds, Dr. Lanas said.
“The importance of this is that we may have very good therapy tools for the upper GI, but still we have problems controlling the bleeding from the lower GI,” he added.
During a discussion of the study, an audience member asked how many days clinicians should wait to restart anticoagulants or antiplatelets.
“In those patients with peptic ulcer bleeding, it’s better to just give the antiplatelet therapy soon after the bleeding event or just to not interrupt the aspirin because the morality at 30 days was higher in those who were interrupted,” Dr. Lanas advised. “...I think for the cutoff point to show differences for patients with a worse outcome versus those with a better outcome, you shouldn’t restart anticoagulant therapy before day 15 after the bleeding event.”
Dr. Lanas received consulting fees, speaking and teaching fees, other financial support, and grant and research support from Bayer.
On Twitter @pwendl
WASHINGTON – Early resumption of antiplatelet agents or anticoagulants after a major gastrointestinal bleeding event is clearly associated with an increased risk of rebleeding, but a decreased risk of death, results from an observational study show.
Furthermore, anticoagulant treatment “is associated with a higher risk of rebleeding and death compared with antiplatelet treatment after a previous GI event,” Dr. Angel Lanas said to an overflow crowd at the annual Digestive Disease Week.
In a separate case-control study, Dr. Lanas and his associates recently reported that the risk of GI bleeding was twofold higher for anticoagulants than for low-dose aspirin in patients hospitalized for GI bleeding (Clin. Gastroenterol. Hepatol. 2015 May;13:906-12.e2. [doi:10.1016/j.cgh.2014.11.007])
The current study examined adverse events in a cohort of 160 patients who developed a major gastrointestinal bleed (GIB) while using anticoagulants and/or antiplatelet therapy between March 2008 and July 2013. Long-term interruption or short-term resumption of these treatments has important clinical implications and differences in the intrinsic risks between antiplatelet or anticoagulant users after drug resumption are not well established, said Dr. Lanas of the University of Zaragoza (Spain).
Drug use information was prospectively collected during the GIB event, with data during the follow-up period obtained from two different Spanish databases.
Treatment during the index bleeding event was continued without interruption in 11 patients and interrupted in 149 patients (93%). Among those whose therapy was interrupted, 21 (14%) never resumed therapy and 128 (86%) resumed therapy (118 patients within 15 days and 10 patients after 15 days). The 86% treatment resumption rate is much higher than the 40%-66% rates reported in previous studies, indicating that Spanish physicians restarted treatment quite early, Dr. Lanas observed.
The mean age at baseline was 76.6 years, 61.3% of patients were men, and half had a Charlson index score > 4. Median follow-up was 21.5 months (range 1-63 months).
Ischemic events did not differ between patients who did or did not restart anticoagulants or antiplatelets (16.4% vs. 14.3%; P value = .806). However, rebleeding occurred in 32% of patients who resumed therapy versus none who did not (P = .002), but deaths were higher in those who did not restart therapy (38.1% vs. 12.5%; P = .003), Dr. Lanas said.
These differences remain significant in Kaplan-Meier survival curves for death (P = .021) and rebleeding (P = .004).
A comparison of early therapy resumption (≤ 15 days) vs. delayed (mean delay 62 days) or no resumption revealed similar results. Early resumption was associated with a higher rate of rebleeding (32.2% vs. 9.7%; P = .012), but a lower rate of death (11% vs. 35.5%; P = .001), with no difference in ischemic events (17% vs. 13%; P = .586), Dr. Lanas said.
Again, the differences remain significant in Kaplan-Meier survival curves for death (P = .011) and rebleeding (P = .013).
When the investigators looked at rebleeding according to drug use, patients receiving anticoagulants vs. antiplatelets had significantly higher rates of rebleeding (34.7% vs. 20.5%; P = .043), death (22.2% vs. 10.2%; P = .038), and any event (68.1% vs. 52.3%; P = .043).
After adjustment for gender, age, Charlson index, diabetes, and arterial hypertension, the risk of rebleeding was more than threefold higher for dual antiplatelet and anticoagulant users than for antiplatelet-alone users (odds ratio, 3.45; P = .025) and was twofold higher for anticoagulant vs. antiplatelet users (OR, 2.07; P = .045), Dr. Lanas said.
Finally, an analysis of the cause of bleeding suggests the cause of rebleeding may be different from the original event and that there is a shift toward the lower GI tract, he added.
The index bleeding event was caused largely by an upper GI peptic ulcer in 48% of all 160 patients, with 43.7% of events due to lower GI diverticulosis, vascular lesions, ischemic, or other lesions. In contrast, peptic ulcers accounted for only 7% of rebleeding events, while lower GI events accounted for 72%. Proton pump inhibition use was evenly distributed in upper and lower GI bleeding, although effective endoscopic treatment may have influenced upper GI bleeds, Dr. Lanas said.
“The importance of this is that we may have very good therapy tools for the upper GI, but still we have problems controlling the bleeding from the lower GI,” he added.
During a discussion of the study, an audience member asked how many days clinicians should wait to restart anticoagulants or antiplatelets.
“In those patients with peptic ulcer bleeding, it’s better to just give the antiplatelet therapy soon after the bleeding event or just to not interrupt the aspirin because the morality at 30 days was higher in those who were interrupted,” Dr. Lanas advised. “...I think for the cutoff point to show differences for patients with a worse outcome versus those with a better outcome, you shouldn’t restart anticoagulant therapy before day 15 after the bleeding event.”
Dr. Lanas received consulting fees, speaking and teaching fees, other financial support, and grant and research support from Bayer.
On Twitter @pwendl
EXPERT ANALYSIS FROM DDW® 2015

Guideline adherence reduces biliary pancreatitis
WASHINGTON – Performed when recommended, cholecystecomy significantly decreases the risk of near-term rehospitalization for acute biliary pancreatitis, results of a retrospective study indicate.
Among more than 23,000 patients with mild to moderate acute biliary pancreatitis, less than 2% of those who underwent cholecystectomy within 30 days, as recommended under American Gastroenterological Association (AGA) guidelines, were rehospitalized for pancreatitis within 6 months.
In contrast, nearly 17% of patients who had cholecystectomy after 1 month or never had it were back in the hospital within half a year, said Dr. Ayesha Kamal, a postdoctoral research fellow at the Johns Hopkins Hospital in Baltimore.
“Cholecystectomy prevents future hospitalization for biliary pancreatitis,” she said at the annual Digestive Disease Week.
The study, based on claims data, also showed that adherence to AGA guidelines is fairly high, on the order of 75%, she said.
Acute pancreatitis is one of the most common gastrointestinal diseases in the United States, accounting for about 300,000 hospitalizations in 2009, at a total cost of about $2.6 billion.
Gallstone disease is the most common cause of acute pancreatitis, responsible for an estimated 40% of all cases, she said.
Guidelines from the AGA and other organizations recommend cholecystectomy either during the same hospitalization for acute biliary pancreatitis, or within 4 weeks.
To see whether clinicians were adhering to the AGA guidelines and whether the guideline-recommended timing of cholecystectomy made a difference, Dr. Kamal and colleagues analyzed data from the MarketScan Commercial Claims & Encounters database, which includes individual-level clinical utilization data for both inpatient and outpatient visits paid for by employer-sponsored health plans.
They looked at data both on patients who were treated in accordance with guidelines (first hospitalization for mild to moderate acute biliary pancreatitis, with cholecystectomy performed either on the day of hospitalization or within 30 days), and outside of the guidelines (no cholecystectomy, or cholecystectomy performed later than 30 days after the index hospitalization).
They assessed recurrences within 30 days of follow-up by International Classification of Diseases, 9th Revision (ICD-9) codes for acute pancreatitis and gallstone disease.
Combing through 8.8 million adult inpatient encounters for acute biliary pancreatitis, they excluded those patients with a diagnosis of severe or chronic pancreatitis, alcohol abuse, less than 30 days of follow-up, deaths during hospitalization, discharge to hospice, and those with a length of stay longer than 30 days.
This left them with a final cohort of 23,515 patients with mild to moderate acute biliary pancreatitis.
They found that 61% of patients had cholecystectomy during their initial hospitalizations, and an additional 14% had the surgery during a subsequent hospitalization within 30 days. Of the remaining patients, 7% had cholecystectomies after 30 days, and 18% never had one.
Among patients treated under the guidelines, 1.3% who had their gallbladders removed during the initial hospitalization had a pancreatitis recurrence within 6 months, and 0.2% had a recurrence more than 6 months later.
In contrast, 36.7% of patients who had a cholecystectomy more than a month after their first hospitalization for pancreatitis had a recurrence within 6 months, and 4.5% had a recurrence after 6 months.
Among patients who never underwent cholecystectomy, the respective recurrence rates were 5.4% and 1.1%.
“One in six patients who did not receive a cholecystectomy within 30 days will be hospitalized again within 6 months,” Dr. Kamal said.
She acknowledged that the study was limited by the authors’ inability to confirm acute biliary pancreatitis with chart review, and by the limitations of the database, which is confined to adults younger than 65 with employer-sponsored medical plans.
In the question and answer portion of the presentation, Dr. Nirav Thosani, a gastroenterologist at Memorial Hermann Hospital in Houston, noted that ICD-9 codes do not distinguish between different types of pancreatitis.
“It might be possible that those patients who never had cholecystectomy never had acute biliary pancreatitis, or some other reason for acute pancreatitis, and that’s the reason for the rehospitalization,” he said.
Dr. Kamal replied that they tried to control for other causes of pancreatitis by including ICD-9 codes for gallstone disease and by excluding patients with diagnoses of alcohol abuse.
AT DDW® 2015
Key clinical point: Cholecystectomy within 30 days of acute biliary pancreatitis protects against recurrence.
Major finding: Among patients treated under AGA guidelines, only 1.3% who had their gallbladders removed during the initial hospitalization had a pancreatitis recurrence within 6 months, and 0.2% had a recurrence more than 6 months later.
Data source: Retrospective cohort study of 23,515 patients with acute biliary pancreatitis in claims database.
Disclosures: The study funding source was not disclosed. Dr. Kamal and Dr. Thosani reported having no relevant disclosures.
Transgender patients at greater risk for mental health conditions
Transgender youth and young adults suffer a significantly greater burden of mental health conditions and poor mental health outcomes than do nontransgender individuals, known as cisgender individuals, according to a recent study.
“Findings point to the need for gender-affirming mental health services and interventions to support transgender youth,” reported Sari L. Reisner, Sc.D., of Harvard T.H. Chan School of Public Health, Boston (J. Adolesc. Health 2015;56:274-9). “Community-based clinics should be prepared to provide mental health services or referrals for transgender patients.”
Dr. Reisner and his colleagues retrospectively analyzed medical records to compare the mental health outcomes of 106 female-to-male and 74 male-to-female transgender patients, aged 12-29 years, to 180 cisgender controls matched by gender identity, age, race/ethnicity, and visit date at a community health center in Boston between 2002 and 2011.
Cisgender refers to an individual whose self-identified gender identity matches his or her biological sex assigned at birth.
The transgender patients had four times the risk for depression, compared with the matched control patients (50.6% vs. 20.6%; relative risk = 3.95) and more than three times the risk for anxiety (26.7% vs. 10.0%; RR = 3.27), suicide ideation (31.1% vs. 11.1%; RR = 3.61) and suicide attempts (17.2% vs. 6.1%; RR = 3.20). Transgender individuals were more than four times more likely than were cisgender patients to self-harm without suicidal intent (16.7% vs. 4.4%; RR = 4.30).
Overall, 22.8% of transgender patients, compared with 11.1% of cisgender patients, used inpatient mental health care services (RR = 2.36), and 45.6% of transgender patients, compared with 16.1% of cisgender ones, accessed outpatient mental health services (RR = 4.36).
“The elevated mental health burden among transgender youth is hypothesized to result from experiences of social stress such as family rejection, bullying, violence, victimization, and discrimination, which occur due to disadvantaged social status,” all confounders not accounted for if present for these patients, the authors noted. On the other hand, the study’s lack of reliance on a gender identity disorder diagnosis “offers unique comparative data that directly compare the health and well-being of transgender and cisgender youth using a nonpathological perspective of gender variation,” they added.
Other potential limitations of the study were that transgender patients’ greater use of mental health services could have inflated prevalence estimates and that the findings, for an urban population, may not generalize to other geographic or clinical settings.
“Future research is needed to contextualize the mental health concerns of transgender adolescent and emerging adult patients in community-based clinic settings, including prospective assessment of social stressors and mental health symptoms and diagnoses over time,” the authors wrote.
The research was supported by the National Institute of Mental Health and the Eunice Kennedy Shriver National Institute of Child Health and Human Development. The authors reported no relevant financial disclosures.
FROM THE JOURNAL OF ADOLESCENT HEALTH
Key clinical point: Transgender individuals have greater risk for poor mental health outcomes than do nontransgender individuals.
Major finding: Transgender patients are at 3.27 and 3.95 times greater risk for anxiety and depression, respectively, and 3.2 times greater risk for suicide attempts than are nontransgender patients.
Data source: A retrospective cohort study of electronic medical records for 360 transgender patients and matched controls, aged 12-29 years, seen at a community health center in Boston between 2002 and 2011.
Disclosures: The National Institute of Mental Health and the Eunice Kennedy Shriver National Institute of Child Health and Human Development supported the research. The authors reported no relevant financial disclosures.