User login
Win Whitcomb: Hospital Readmissions Penalties Start Now

The uproar and confusion over readmissions penalties has consumed umpteen hours of senior leaders’ time (especially that of CFOs), not to mention that of front-line nurses, case managers, quality-improvement (QI) coordinators, hospitalists, and others involved in discharge planning and ensuring a safe transition for patients out of the hospital. For many, the math is fuzzy, and for most, the return on investment is even fuzzier. After all, avoided readmissions are lost revenue to those who are running a business known as an acute-care hospital.
Let me start with the conclusion: Eliminating avoidable readmissions is the right thing to do, period. But the financial downside to doing so is probably greater than any upside realized through avoidance of the penalties that began affecting hospital payments on Oct. 1—at least in the fee-for-service world we live in. At some point in the future, when most patients are under a global payment, the math might be clearer, but today, penalties probably won’t offset lost revenue from reduced readmissions added to the cost of paying lots of people to work in meetings (and at the bedside) to devise better care transitions. (Caveat: If your hospital is bursting at the seams with full occupancy, reducing readmissions and replacing them with higher-reimbursing patients, such as those undergoing elective major surgery, likely will be a net financial gain for your hospital.)
Part of the Affordable Care Act (ACA), the Hospital Readmissions Reduction Program (HRRP) will reduce total Medicare DRG reimbursement for hospitals beginning in fiscal-year 2013 based on actual 30-day readmission rates for myocardial infarction (MI), heart failure (HF), and pneumonia that are in excess of risk-adjusted expected rates. The reduction is capped at 1% in 2013, 2% in 2014, and 3% in 2015 and beyond. Hospital readmission rates are based on calculated baseline rates using Medicare data from July 1, 2008, to June 30, 2011.
Cost of a Readmissions-Reduction Program
How much does it cost for a hospital to implement a care-transitions program—such as SHM’s Project BOOST—to reduce readmissions? Last year, I interviewed a dozen hospitals that successfully implemented SHM’s formal mentored implementation program. The result? In the first year of the program, hospitals spent about $170,000 on training and staff time devoted to the project.
Lost Revenue
Let’s look at a sample penalty calculation, then examine a scenario sizing up how revenue is lost when a hospital is successful in reducing readmissions. The ACA defines the payments for excess readmissions as:
The number of patients with the applicable condition (HF, MI, or pneumonia) multiplied by the base DRG payment made for those patients multiplied by the percentage of readmissions beyond the expected.
As an example, let’s take a hospital that treats 500 pneumonia patients (# with the applicable condition), has a base DRG payment for pneumonia of $5,000, and a readmission rate that is 4% higher than expected (in this example, the actual rate is 25% and the expected rate is 24%; 1/25=4%). The penalty is 500 X $5,000 X .04, or $100,000. We’ll assume that the readmission rate for myocardial infarction and heart failure are less than expected, so the total penalty is $100,000.
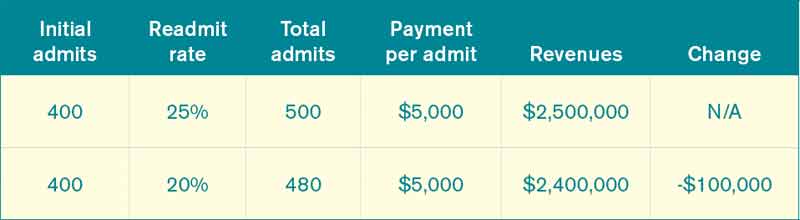
Let’s say the hospital works hard to decrease pneumonia readmissions from 25% to 20% and avoids the penalty. As outlined in Table 1, the hospital will lose $100,000 in revenue (admittedly, reducing readmissions to 20% from 25% represents a big jump, but this is for illustration purposes—we haven’t added in lost revenue from reduced readmissions for other conditions). What’s the final cost of avoiding the $100,000 readmission penalty? Lost revenue of $100,000 plus the cost of implementing the readmission reduction program of $170,000=$270,000.
Why Are We Doing This?
I see the value in care transitions and readmissions-reduction programs, such as Project BOOST, first and foremost as a way to improve patient safety; as such, if implemented effectively, they are likely worth the investment. Second, their value lies in the preparation all hospitals and health systems should be undergoing to remain market-competitive and solvent under global payment systems. Because the penalties in the HRRP might come with lost revenues and the costs of program implementation, be clear about your team’s motivation for reducing readmissions. Your CFO will see to it if I don’t.
Dr. Whitcomb is medical director of healthcare quality at Baystate Medical Center in Springfield, Mass. He is a co-founder and past president of SHM. Email him at wfwhit@comcast.net.
The View From

SHM is an advocate for the move toward more global payment systems, as well as payment methodologies that reward good outcomes and processes over volume. System improvements require leadership and front-line physicians who are able to implement and evaluate new care-delivery models. SHM offers resources and tools to support the HM community in this era of change through leadership training (www.hospitalmedicine.com/leadership), professional development and mentoring in QI programs (www.hospitalmedicine.org/QI), and other practical tools, such as the value-based purchasing toolkit (www.hospitalmedicine.org/HVBP).
Additionally, the Project BOOST toolkit (www.hospitalmedicine.org/BOOST) includes a return-on-investment calculator to use in your institution’s efforts in reducing readmissions. The calculator is built both for fee-for-service and accountable-care-organization payment models, and it can serve as an adjunct to estimates provided to your hospital of penalties for excess readmissions under HRRP.
The uproar and confusion over readmissions penalties has consumed umpteen hours of senior leaders’ time (especially that of CFOs), not to mention that of front-line nurses, case managers, quality-improvement (QI) coordinators, hospitalists, and others involved in discharge planning and ensuring a safe transition for patients out of the hospital. For many, the math is fuzzy, and for most, the return on investment is even fuzzier. After all, avoided readmissions are lost revenue to those who are running a business known as an acute-care hospital.
Let me start with the conclusion: Eliminating avoidable readmissions is the right thing to do, period. But the financial downside to doing so is probably greater than any upside realized through avoidance of the penalties that began affecting hospital payments on Oct. 1—at least in the fee-for-service world we live in. At some point in the future, when most patients are under a global payment, the math might be clearer, but today, penalties probably won’t offset lost revenue from reduced readmissions added to the cost of paying lots of people to work in meetings (and at the bedside) to devise better care transitions. (Caveat: If your hospital is bursting at the seams with full occupancy, reducing readmissions and replacing them with higher-reimbursing patients, such as those undergoing elective major surgery, likely will be a net financial gain for your hospital.)
Part of the Affordable Care Act (ACA), the Hospital Readmissions Reduction Program (HRRP) will reduce total Medicare DRG reimbursement for hospitals beginning in fiscal-year 2013 based on actual 30-day readmission rates for myocardial infarction (MI), heart failure (HF), and pneumonia that are in excess of risk-adjusted expected rates. The reduction is capped at 1% in 2013, 2% in 2014, and 3% in 2015 and beyond. Hospital readmission rates are based on calculated baseline rates using Medicare data from July 1, 2008, to June 30, 2011.
Cost of a Readmissions-Reduction Program
How much does it cost for a hospital to implement a care-transitions program—such as SHM’s Project BOOST—to reduce readmissions? Last year, I interviewed a dozen hospitals that successfully implemented SHM’s formal mentored implementation program. The result? In the first year of the program, hospitals spent about $170,000 on training and staff time devoted to the project.
Lost Revenue
Let’s look at a sample penalty calculation, then examine a scenario sizing up how revenue is lost when a hospital is successful in reducing readmissions. The ACA defines the payments for excess readmissions as:
The number of patients with the applicable condition (HF, MI, or pneumonia) multiplied by the base DRG payment made for those patients multiplied by the percentage of readmissions beyond the expected.
As an example, let’s take a hospital that treats 500 pneumonia patients (# with the applicable condition), has a base DRG payment for pneumonia of $5,000, and a readmission rate that is 4% higher than expected (in this example, the actual rate is 25% and the expected rate is 24%; 1/25=4%). The penalty is 500 X $5,000 X .04, or $100,000. We’ll assume that the readmission rate for myocardial infarction and heart failure are less than expected, so the total penalty is $100,000.
Let’s say the hospital works hard to decrease pneumonia readmissions from 25% to 20% and avoids the penalty. As outlined in Table 1, the hospital will lose $100,000 in revenue (admittedly, reducing readmissions to 20% from 25% represents a big jump, but this is for illustration purposes—we haven’t added in lost revenue from reduced readmissions for other conditions). What’s the final cost of avoiding the $100,000 readmission penalty? Lost revenue of $100,000 plus the cost of implementing the readmission reduction program of $170,000=$270,000.
Why Are We Doing This?
I see the value in care transitions and readmissions-reduction programs, such as Project BOOST, first and foremost as a way to improve patient safety; as such, if implemented effectively, they are likely worth the investment. Second, their value lies in the preparation all hospitals and health systems should be undergoing to remain market-competitive and solvent under global payment systems. Because the penalties in the HRRP might come with lost revenues and the costs of program implementation, be clear about your team’s motivation for reducing readmissions. Your CFO will see to it if I don’t.
Dr. Whitcomb is medical director of healthcare quality at Baystate Medical Center in Springfield, Mass. He is a co-founder and past president of SHM. Email him at wfwhit@comcast.net.
The View From
SHM is an advocate for the move toward more global payment systems, as well as payment methodologies that reward good outcomes and processes over volume. System improvements require leadership and front-line physicians who are able to implement and evaluate new care-delivery models. SHM offers resources and tools to support the HM community in this era of change through leadership training (www.hospitalmedicine.com/leadership), professional development and mentoring in QI programs (www.hospitalmedicine.org/QI), and other practical tools, such as the value-based purchasing toolkit (www.hospitalmedicine.org/HVBP).
Additionally, the Project BOOST toolkit (www.hospitalmedicine.org/BOOST) includes a return-on-investment calculator to use in your institution’s efforts in reducing readmissions. The calculator is built both for fee-for-service and accountable-care-organization payment models, and it can serve as an adjunct to estimates provided to your hospital of penalties for excess readmissions under HRRP.
Guidelines Drive Optimal Care for Heart Failure Patients
Cardiologists aren’t shy about repeating it: guidelines, guidelines, guidelines. That is, follow them.
“Evidence-based, guideline-driven optimal care for heart failure truly is beneficial,” Dr. Yancy says. “Every effort should be made to strive to achieve ideal thresholds and meeting best practices.”
There is now compelling evidence that, for patients with heart failure, the higher the degree of adherence to Class I-recommended therapies, the greater the reduction in 24-month mortality risk.5
“It would seem as if practicing best quality is almost a perfunctory statement, but consistently, when we look at surveys of quality improvement and adherence to evidence-based strategies, persistent gaps remain in the broader community,” Dr. Yancy says. “We know what we need to do. We’re still striving to get closer and closer to optimal care.”
Dr. Harold says the guidelines are there to make things simpler. So take advantage of them.
“If anything, hospitalists tend to be ahead of most other groups in terms of knowing evidence-based pathways and really tracking very specific protocols,” he says. “I think one of the advantages of hospitalist care is very often, it is guideline-driven. You have less variation in terms of care and quality outcomes.”
VA's Continued Effort to Reduce Health Care Gender Disparities; Obama Administration Invests in Public Health; Sleep Deprivation and PTSD Risk; and more
Hospital Volume Not Equal to Quality?
SAN FRANCISCO - Hospital procedure volume, which is commonly used as a proxy measure for hospital quality, is not significantly associated with in-hospital mortality for four common surgical procedures, based on a rigorous statistical analysis of data from the Nationwide Inpatient Sample.
Furthermore, "no identifiable threshold values exist for hospital procedure volume at which mortality risk significantly increased. Mortality risk was primarily attributable to patient-level risk factors," said Dr. Damian J. LaPar of the University of Virginia, Charlottesville.

He and his colleagues examined the relative strength of association between hospital volume and mortality vs. other modeled variables by comparing model covariate likelihood ratios for four high-risk procedures: pancreatic resection, abdominal aortic aneurysm (AAA) repair, esophageal resection, and coronary artery bypass graft (CABG).
Using data from the Nationwide Inpatient Sample in 2008, they obtained weighted discharge records for 261,142 patients: 19,194 patients who had pancreatic resection, 15,266 who had AAA repair, 4,764 who had esophageal resection, and 222,122 who had CABG. The primary outcome of interest was the estimated risk-adjusted effect of hospital procedure volume on mortality (in-hospital death). Comorbid disease was assessed based on Agency for Healthcare Research and Quality (AHRQ) comorbidity categories.
"In all four models, hospital volume was associated with the lowest statistical strength of association with mortality," compared with all other factors, Dr. LaPar said at the annual meeting of the American Surgical Association. Alternatively, other operation and patient-related risk factors -- including elective vs. nonelective status, age, sex, hypertension, weight loss, heart failure, chronic obstructive pulmonary disease, liver disease, and renal failure -- had higher strengths of association with mortality.
Dr. LaPar noted that procedure volume is an attractive metric for regulatory bodies to use as a predictor of outcomes; it is easy to measure and intuitive in nature. In addition, higher-volume hospitals are more likely to have established system-based processes and the infrastructure in place to improve patient outcomes.
The Leapfrog Group and the AHRQ both have adopted procedure volume as a quality indicator for the four high-risk surgical procedures. Arbitrarily defined volume thresholds have been adopted as a metric of quality for these procedures. However, many previous statistical methods that are used to define these thresholds have drawn criticism in the recent surgical literature. In many former series, volume is represented as arbitrarily defined categories, rather than as a continuous variable. Furthermore, there has been little attempt to rigorously assess and compare statistical model performance; to assess the relative strength of the association of procedure volume with other outcome predictors; and to utilize hierarchical, multilevel, statistical modeling techniques for complex, multicenter patient samples.
Dr. LaPar and his colleagues used hierarchical general linear modeling and created separate models for each procedure, which were adjusted for patient and operative factors as potential confounders. Patient factors included age, sex, and comorbid disease. Operative factors included procedure volume and elective/nonelective status. All model covariates were selected a priori.
The researchers used hospital volume as a continuous variable with restricted cubic spline regression, which uses all data points to estimate the shape of the association between hospital volume and mortality, and is considered to be the best way to visually identify threshold values. They also assessed the relative strength of association between hospital volume and mortality, compared with other factors (likelihood ratio). Model performance was assessed by looking at discrimination, calibration, and predictive capacity.
AAA repair was associated with the greatest in-hospital death. Patients having AAA repair had the greatest burden of comorbid disease, including peripheral vascular disease, chronic obstructive pulmonary disease, and renal failure.
Patient age was 60 years or greater. Most procedures were elective.
Dr. LaPar noted that the study did not investigate the impact of surgeon volume, nor did it adjust for surgical risk factors such as tumor type/stage, pulmonary function, performance status, surgical technique, preoperative medications, and neoadjuvant therapy. They were also unable to assess the effects of hospital volume on long-term survival, resource utilization, and readmission.
The findings have several implications. Previous reports using conventional modeling techniques may have overestimated the significance of hospital volume as a predictor of mortality. "However, these data do not intend to declare that hospital volume is irrelevant, but rather that hospital procedure volume may be a surrogate for other unidentified institutional factors that influence quality," said Dr. LaPar. "Most importantly, these data do not support the current policy of using hospital procedure volume as a proxy measure for quality."
Invited discussant Dr. Edward Livingston praised the group's rigorous statistical analysis of the association between hospital procedure volume and quality of care (mortality). He noted that earlier papers showed a statistical association between procedure volume and mortality. "Where the volume outcome research efforts took a left turn is that, instead of trying to understand what it was about volume that's associated with outcomes, there have been 2 decades of papers published looking at and reconfirming a statistical association between procedure volume and outcomes. Procedure volume itself does not translate into better outcomes. It is the things associated with procedure volume, such as surgeon experience, better functioning [operating room teams, and the like]. We really haven't looked into those causative factors."
If the causative factors could be identified, "then we could take the experience of high-volume centers and translate that to everybody else, so everybody could have good outcomes," he said.
According to Dr. Livingston, of the University of Texas, Dallas, previous studies relied on statistical modeling of the mortality relationship. "Those models are only as good as the model can represent the data," he said, and very few have been rigorously assessed to see how well they describe the phenomenon that they're trying to describe. This paper "should serve as the template for what everyone should do when they're performing volume outcome studies or any kind of regression analysis," he added.
The authors reported that they have no financial disclosures.
Procedural volume and its relationship to outcome has enormous implications, not just for patients undergoing surgical treatments, but in planning future surgical services. This study is important in respect of the large data set analysed and the finding that volume was only weakly associated with mortality compared to other factors such as patient co-morbidity. This raises questions about the current trend across the developed world to move towards high volume surgical units.
As impressive as the study initially appears there are some weaknesses that need to be considered. We of course only know about patients who were operated on and know nothing about patients declined surgery. There are studies that indicate patients are more likely to be declined appropriate surgery in units with less experience and lower volumes. Also of course many low volume units will refer high risk or complex cases to larger more experienced centres. It may be expected that some of this effect would be picked up in the Agency for Health Care Research and Quality comorbidities category (AHRQ) but the most usual reason for transfer to a regional unit is because of surgical complexity rather than patient co-morbidity.
This study also does not allow for any clinical governance measures that may be in force. Most if not all units with outcomes worse than average will take measures to address the problem ranging from ceasing undertaking the procedure to better case selection or improved team structure. At the time this study was conducted it is inconceivable to assume that no such measures were in action. It is incorrect then to conclude that this is an unselected study of the effects of volume. In the United Kingdom following concerns raised about outcomes from aortic surgery prospectively collected national data showed a very strong association with volume and outcome. The highest volume units had mortality 2.5 times lower than the lowest volume units (Outcomes after elective repair of infra-renal abdominal aortic aneurysm, March 2012; www.vascularsociety.org).
The authors conclude that volume is a poor indicator of quality of health care. This may be correct, but it is hard to suggest that based on this study as the authors did not measure factors such as length of hospital stay, re-admission rates, costs or patient experience of their care. In a review of cardiovascular services in London, not only did unit volume for AAA repair influence mortality it had a strong effect on efficiency. While patient outcome must be the main factor in planning service configurations, other issues such as cost and manpower need also to be considered.
Finally there are some practical issues. Small volume units can get good results. A unit that does 5 aortic aneurysm repairs in a year with no mortality will look very good. However, if they have a single mortality they will become one of the worst performing units overnight. Performance of units can only be assessed on large numbers. If a small volume unit is underperforming it may take a long time to identify that. There cannot be a surgical team in the world that is not aware that the more they work together to undertake complex surgical interventions the better they function across the board. So while the results of the study need to be considered carefully they do fly in the face of what most surgeons know in their hearts.
Dr. C. P. Shearman is Professor of Vascular Surgery, University of Southampton, United Kingdom, and an associate medical editor of Vascular Specialist.
SAN FRANCISCO - Hospital procedure volume, which is commonly used as a proxy measure for hospital quality, is not significantly associated with in-hospital mortality for four common surgical procedures, based on a rigorous statistical analysis of data from the Nationwide Inpatient Sample.
Furthermore, "no identifiable threshold values exist for hospital procedure volume at which mortality risk significantly increased. Mortality risk was primarily attributable to patient-level risk factors," said Dr. Damian J. LaPar of the University of Virginia, Charlottesville.
He and his colleagues examined the relative strength of association between hospital volume and mortality vs. other modeled variables by comparing model covariate likelihood ratios for four high-risk procedures: pancreatic resection, abdominal aortic aneurysm (AAA) repair, esophageal resection, and coronary artery bypass graft (CABG).
Using data from the Nationwide Inpatient Sample in 2008, they obtained weighted discharge records for 261,142 patients: 19,194 patients who had pancreatic resection, 15,266 who had AAA repair, 4,764 who had esophageal resection, and 222,122 who had CABG. The primary outcome of interest was the estimated risk-adjusted effect of hospital procedure volume on mortality (in-hospital death). Comorbid disease was assessed based on Agency for Healthcare Research and Quality (AHRQ) comorbidity categories.
"In all four models, hospital volume was associated with the lowest statistical strength of association with mortality," compared with all other factors, Dr. LaPar said at the annual meeting of the American Surgical Association. Alternatively, other operation and patient-related risk factors -- including elective vs. nonelective status, age, sex, hypertension, weight loss, heart failure, chronic obstructive pulmonary disease, liver disease, and renal failure -- had higher strengths of association with mortality.
Dr. LaPar noted that procedure volume is an attractive metric for regulatory bodies to use as a predictor of outcomes; it is easy to measure and intuitive in nature. In addition, higher-volume hospitals are more likely to have established system-based processes and the infrastructure in place to improve patient outcomes.
The Leapfrog Group and the AHRQ both have adopted procedure volume as a quality indicator for the four high-risk surgical procedures. Arbitrarily defined volume thresholds have been adopted as a metric of quality for these procedures. However, many previous statistical methods that are used to define these thresholds have drawn criticism in the recent surgical literature. In many former series, volume is represented as arbitrarily defined categories, rather than as a continuous variable. Furthermore, there has been little attempt to rigorously assess and compare statistical model performance; to assess the relative strength of the association of procedure volume with other outcome predictors; and to utilize hierarchical, multilevel, statistical modeling techniques for complex, multicenter patient samples.
Dr. LaPar and his colleagues used hierarchical general linear modeling and created separate models for each procedure, which were adjusted for patient and operative factors as potential confounders. Patient factors included age, sex, and comorbid disease. Operative factors included procedure volume and elective/nonelective status. All model covariates were selected a priori.
The researchers used hospital volume as a continuous variable with restricted cubic spline regression, which uses all data points to estimate the shape of the association between hospital volume and mortality, and is considered to be the best way to visually identify threshold values. They also assessed the relative strength of association between hospital volume and mortality, compared with other factors (likelihood ratio). Model performance was assessed by looking at discrimination, calibration, and predictive capacity.
AAA repair was associated with the greatest in-hospital death. Patients having AAA repair had the greatest burden of comorbid disease, including peripheral vascular disease, chronic obstructive pulmonary disease, and renal failure.
Patient age was 60 years or greater. Most procedures were elective.
Dr. LaPar noted that the study did not investigate the impact of surgeon volume, nor did it adjust for surgical risk factors such as tumor type/stage, pulmonary function, performance status, surgical technique, preoperative medications, and neoadjuvant therapy. They were also unable to assess the effects of hospital volume on long-term survival, resource utilization, and readmission.
The findings have several implications. Previous reports using conventional modeling techniques may have overestimated the significance of hospital volume as a predictor of mortality. "However, these data do not intend to declare that hospital volume is irrelevant, but rather that hospital procedure volume may be a surrogate for other unidentified institutional factors that influence quality," said Dr. LaPar. "Most importantly, these data do not support the current policy of using hospital procedure volume as a proxy measure for quality."
Invited discussant Dr. Edward Livingston praised the group's rigorous statistical analysis of the association between hospital procedure volume and quality of care (mortality). He noted that earlier papers showed a statistical association between procedure volume and mortality. "Where the volume outcome research efforts took a left turn is that, instead of trying to understand what it was about volume that's associated with outcomes, there have been 2 decades of papers published looking at and reconfirming a statistical association between procedure volume and outcomes. Procedure volume itself does not translate into better outcomes. It is the things associated with procedure volume, such as surgeon experience, better functioning [operating room teams, and the like]. We really haven't looked into those causative factors."
If the causative factors could be identified, "then we could take the experience of high-volume centers and translate that to everybody else, so everybody could have good outcomes," he said.
According to Dr. Livingston, of the University of Texas, Dallas, previous studies relied on statistical modeling of the mortality relationship. "Those models are only as good as the model can represent the data," he said, and very few have been rigorously assessed to see how well they describe the phenomenon that they're trying to describe. This paper "should serve as the template for what everyone should do when they're performing volume outcome studies or any kind of regression analysis," he added.
The authors reported that they have no financial disclosures.
Major Finding: Hospital procedure volume is not significantly associated with in-hospital mortality for four common surgical procedures.
Data Source: The researchers used data from the NIS in 2008. They obtained weighted-discharge records for 19,194 patients who had pancreatic resection, 15,266 who had AAA repair, 4,764 who had esophageal resection, and 222,122 who had CABG. The primary outcome of interest was the estimated risk-adjusted effect of hospital procedure volume on mortality (in-hospital death).
Disclosures: The authors reported that they have no financial disclosures.

CMS Rule on Use of Electronic Health Records Gets Mixed Reviews
The Centers for Medicare & Medicaid Services' (CMS) recently announced final rule [PDF] on Stage 2 compliance for "meaningful use" of electronic health records (EHR) has been met with mixed reactions among most providers and trade groups, including SHM which voiced its concerns back in July.
"It's the classic government mixed bag," says Brenda Pawlak, director of Manatt Health Solutions, a division of New York City law firm Manatt, Phelps & Phillips.
Physician groups, including SHM and the Medical Group Management Association (MGMA), have lauded CMS for pushing back the implementation of Stage 2 meaningful-use requirements to 2014 from 2013. They also praised the agency for halving to 5% the percentage of a practice's patients who interact with an online portal. But for some providers, even the 5% threshold will be difficult to meet. And because physicians have to meet all requirements to qualify for incentive bonuses, the issue could loom large for specific groups.
"I don't think the 10% to 5% is a substantive change," Pawlak says.
Although most hospitalists are not directly subject to "meaningful use" requirements, many are heavily involved with assisting their institutions with implementation. SHM, which voiced its concerns in a July letter to CMS, is following this topic closely.
Some physician groups also lamented that the deadline for Stage 1 compliance remains unchanged at 2015. As physicians and provider groups attempt to comply with myriad rules, Pawlak says, meeting the 5% threshold will emerge as more burdensome as the deadline approaches. Still, CMS and federal officials say, the final rule will help nudge the healthcare system further into the digital age.
"The big message here is the push on standards-based interoperability of information," says Farzad Mostashari, MD, ScM, of the U.S. Department of Health and Human Services' Office of the National Coordinator for Health Information Technology. "We are staying on course with the road map that we set in Stage 1."
Medicare OKs Small 2013 Increase for Hospitals
Medicare payments are set to increase 2.8% in fiscal year 2013 to general acute care hospitals that successfully participate in Medicare’s Inpatient Quality Reporting Program. Hospitals that don’t participate will get just a 0.8% increase, though Medicare officials estimate that almost all hospitals will participate.
Medicare payments to long-term care facilities will increase by 1.7% in the coming fiscal years, which starts Oct. 1, according to the Centers for Medicare and Medicaid Services.
The new payment rates were announced Aug. 1 as part of the final rule for the Inpatient Prospective Payment System and the Long-Term Care Hospital Prospective Payment System.
In its original pay proposal published in May, the CMS said it would increase payments to general acute care hospitals by 2.3% because of cuts the agency was making to account for hospital coding that was too high. Based on public comments in opposition to the coding adjustments, the CMS backed off the cuts for now. The American Hospital Association estimates that the initial proposal would have cost hospitals nationwide a total of $850 million.
The final rule, to be published in the Federal Register August 31, also lays out a new quality program that debut in October. Under the Hospital Readmissions Reduction Program, hospitals’ base operating diagnosis-related-group (DRG) payment will be cut by 1% if their readmission rate for three conditions – acute myocardial infarction, heart failure, and pneumonia – is deemed too high. The agency estimates the program will reduce overall payments to hospitals by about $280 million in FY 2013.
For the Hospital Value-Based Purchasing (VBP) Program, which also begins on Oct. 1, the final rule specifies hospitals will receive their total performance scores, indicates how the 1% penalty will be applied to base operating charges, and provides the timeline for making incentive payments. New measures were added to the program for FY 2015: a central line – associated bloodstream infection measure, a patient safety indicator composite measure, and an efficiency measure that looks at Medicare spending per beneficiary.
The CMS is revising its list of hospital-acquired conditions for which it will not pay. Starting this fall, surgical site infection following cardiac implantable electronic device procedures will make the do-not-pay list, along with iatrogenic pneumothorax with venous catheterization.
The agency is adding two new codes to the list of hospital-acquired conditions: bloodstream infection due to central catheter (999.32) and local infection due to central venous catheter (999.33).
States in Medicaid Limbo After Court's Ruling
Questions and uncertainty abound as state governments begin deciding whether they will participate in the expansion of Medicaid called for by the Affordable Care Act. In light of the Supreme Court’s decision that the federal government cannot penalize states that don’t participate, the governors of Texas, South Carolina, Nebraska, Iowa, Louisiana, Mississippi, and Florida have said that their states will opt out.
Leaders in other states say they need more information.
"The original act was very punitive for states that didn’t expand Medicaid. [The Supreme Court decision] now gives some options which, honestly, I don’t think a lot of us expected," Gov. Bob McDonnell (R-Va.) said at a press conference held at the National Governors Association annual meeting. "I don’t think it’s responsible fully for my state to make a decision now, because there’s still more information I need."
Gov. Jack Markell (D-Del.) said he sees the expansion as a "good deal for Delaware taxpayers," but agreed that most states will need more guidance from the federal government before making a decision.
As the ruling allows states to opt out of Medicaid expansion without losing existing federal monies, health care reform likely will look very different from state to state, said Sheila Burke of Harvard University, Cambridge, Mass.
"These states are going to respond to this very differently, and they are very different in terms of their preparation and their capacity to take on these changes. Governors, state legislators, exchange directors, and insurance commissioners all may have a different view," Ms. Burke said at a briefing held by the Alliance for Health Reform. She pointed out that many states legislatures won’t meet again until next year, so meaningful decision making may be on hold until then.
Prior to passage of the ACA, Medicaid provided health care coverage for the indigent, especially those who were dependent children, pregnant women, disabled, or elderly. Under the expansion, Medicaid would also cover anyone younger than age 65 years with an annual income less than 133% of the federal poverty level. The law also provides tax credits for people with incomes between 100% and 400% of the federal poverty level to purchase insurance.
If a state decides to opt out of Medicaid expansion, people whose income is above the federal poverty level, those who are single, childless, or don’t live with their children would not be covered. In addition, those who qualify for premium subsidies under the law but can’t find affordable coverage (that is, mostly low-wage workers) would not be covered.
States that opt out of the expansion also could have a harder time balancing impending cuts to providers and hospitals, according to Chris Jennings, president of Jennings Policy Strategies and former top health aide to President Clinton.
Physicians face a 27% Medicare pay cut in January according to the Sustainable Growth Rate (SGR) formula; hospitals, too, face cuts to their Disproportionate Share Hospital (DSH) payments.
Although there may be other ways to balance the cuts, the easiest is expanding Medicaid to get the extra funding, said Mr. Jennings. "It’s a harder road to go than just taking the money."
While added federal funding would help states offset other cuts, it’s unlikely that it would be enough for physicians to rebound from a huge SGR cut, said Dr. Glen R. Stream, president of the American Academy of Family Physicians.
"If the SGR-indicated payment cut was to go into place, there’s no way that the expansion of Medicaid is going to offset the devastating financial impact that that’s going to have for practices," he said in an interview. But he added that expanding Medicaid is currently the best option for providing much-needed care for low-income Americans.
"I don’t think anyone necessarily envisions expansion of Medicaid as the ideal means to expand coverage, but it is the one that’s on the table. My hope would be that if states chose to opt out of the Medicaid expansion, they would do so with some other plan to meet the needs of their citizens. The challenge would be that the plan wouldn’t be coming with any federal dollars," Dr. Stream said.
Officials with the American College of Physicians said states should move forward with expansion as soon as possible.
The "ACP also strongly urges states to move forward on expanding Medicaid to all persons with incomes up to 133% of the federal poverty level, notwithstanding the court’s ruling that states may not be denied existing Medicaid dollars for failing to do so," ACP president David L. Bronson said in a statement following the court’s ruling.
Mr. Jennings speculated that more will participate in the Medicaid expansion than most people currently think.
Dr. Stream agreed. "I suspect, at the end of the day, that we’ll have a lot more states coming in than we currently are hearing, primarily because I have some confidence in stakeholders’ abilities to encourage legislatures and governors to move ahead," he said.
Maryland is one of those states. Dr. Joshua Sharfstein, the state Secretary of Health and Mental Hygiene, said that implementing the law will give states an edge over those that opt out.
"I’ve heard [Gov. Martin O’Malley (D-Md.)] say that he ultimately sees successful implementation of the law as a competitive advantage for Maryland [and] for businesses to locate in the state if there’s real investment in the workforce," Dr. Sharfstein said at the briefing.
Medicare to Cut Payment For Cancer Radiotherapies
Radiation oncologists could see a nearly 15% cut to their payments under the proposed 2013 Medicare Physician Fee Schedule.
About half of the planned cut is as a result of changes in the way Medicare calculates the time involved in performing intensity-modulated radiation treatment (IMRT) delivery and stereotactic body radiation therapy (SBRT) delivery. Using patient education materials published by leading medical societies, officials at the Centers for Medicare and Medicaid Services determined that they were paying too much for IMRT and SBRT because these services don’t take as long to perform as had previously been calculated.
For example, the current CPT code for IMRT treatment delivery (77418) is based on an assumption that the procedure will take 60 minutes to perform. However, information from patient fact sheets showed a significantly faster procedure time. As a result, the CMS is proposing to base payment on a procedure time of 30 minutes.
For SBRT treatment delivery (CPT code 77373), the current procedure time assumption is 90 minutes. The proposed procedure time assumption is 60 minutes, based on publicly available patient education materials.
The CMS reviewed the procedure time assumptions associated with IMRT and SBRT as part of an overall review of potentially "misvalued" codes.
Officials at ASTRO (American Society for Radiation Oncology), which represents radiation oncologists, criticized the proposal, saying that it would curb patient access to treatment, particularly in rural communities. They pointed to the preliminary results of a member survey that showed that some radiation oncology practices may be forced to close, while others would delay the purchase of new equipment, lay off staff, or limit the new Medicare patients they treat.
The organization also took issue with the process the CMS used in evaluating the procedures.
"ASTRO believes that [the CMS] should utilize the rigorous processes and methodologies already in place and utilized for the past 20 years to set reimbursement rates," Dr. Leonard L. Gunderson, chairman of ASTRO’s Board of Directors, said in a statement.
Dr. Gunderson said that ASTRO would like to see a comprehensive review of treatment costs through the American Medical Association’s Specialty Society Relative Value Scale Update Committee (RUC), a panel of 31 physicians who offer advice to the CMS on how to value physician services.
Women Have More Control Over Own Health Care, Next Chapter of Let's Move!, and More
Win Whitcomb: Inflexible, Big-Box EHRs Endanger the QI Movement

In “The Lean Startup,” author Eric Ries notes that in its early stages, his gaming company would routinely issue new versions of their software application several times each day. Continuous deployment—the process Ries’ company used—leveraged such Lean principles as reduced batch size and continuous learning based on end-user feedback to achieve rapid improvements in their product.
Ries says companies that learn the quickest about what the customer wants, and can incorporate that information into products more efficiently, stand the greatest chance of succeeding. A software engineer by trade, Ries uses many examples of companies that have succeeded with this approach, none of which are from healthcare.
In stark relief, the chief technology hospitalists interface with daily is the electronic health record (EHR), widely recognized as a system that fails to consider the end-user experience, that is unable to interoperate with other software, and is incapable of using data for quality improvement (QI). The PDSA (“plan, do, study, act”) cycle is the foundation of QI activities and relies on rapidly incorporating observations made by those performing the work to create novel workflows and processes based on learning. EHRs, by digitizing health information, theoretically provide the ideal tool for supporting QI.
The reality is that EHRs have been a colossal disappointment with regard to QI efforts. The space in and around EHR effectively represents “dead zones” for innovation and improvement. Mandl and Kohane note:
EHR companies have followed a business model whereby they control all data, rather than liberating the data for use in innovative applications in clinical care.
Conducting a Google-style search of an EHR database usually requires involvement of a clinician’s information services department and often the specialized knowledge and cooperation of the vendor’s technical teams.
Greg Maynard, MD, MSc, SFHM, senior vice president of SHM’s Center for Hospital Innovation and Improvement, recently provided testimony to the Office of the National Coordinator for Health Information Technology about the challenges current EHRs present to QI efforts and what features EHRs need to incorporate to better serve the needs of patients and clinicians. Dr. Maynard answered a few questions for The Hospitalist:
Q: What is it about current EHRs that make continuous improvement so difficult?
A: EHRs were built for fiscal and administrative purposes, not for quality improvement and safety. The administrative/fiscal roots of today’s IT systems lead to poor availability of clinical, quality, and safety data. In many medical centers and practices, the great majority of information available is months-old administrative data, which does not lend itself to rapid cycle improvement.
Q: Why is the PDSA cycle endangered in most systems?
A: EHRs often do not facilitate rapid-cycle, PDSA-style improvements on a small pilot scale. Most improvement teams get one shot to get the clinical decision support and data-capture tools correct after months of waiting in queue and development time. Any request for revisions and refinements is treated as a failure of the improvement team, and it is often difficult or impossible to pilot new tools in a limited setting.
Q: What features would you like to see in EHRs that would facilitate QI?
A: We need a user-friendly interface for clinicians and for data analysts/reporters. Other industries have common data formats to allow for sharing of information across disparate systems. We need the same capability for clinical information in healthcare. Also, a change in architecture of EHRs and other health IT tools that allows for not just interoperability but substitutable options is required. In the more “app”-like environment, innovation and flexibility would be the rule. An underlying architecture could have different plug-and-play modules for different functions. Some companies are overcoming the current barriers to provide wonderful, easy-to-generate and useful reports, but most are stymied by proprietary systems.
Reference
Dr. Whitcomb is medical director of healthcare quality at Baystate Medical Center in Springfield, Mass. He is a co-founder and past president of SHM. Email him at wfwhit@comcast.net.