User login
Historical Patterns and Variation in Treatment of Injuries in NFL (National Football League) Players and NCAA (National Collegiate Athletic Association) Division I Football Players
Among National Football League (NFL) and National Collegiate Athletic Association (NCAA) team physicians, there is no consensus on the management of various injuries. At national and regional meetings, the management of football injuries often is debated.
Given the high level of interest in the treatment of elite football players, we wanted to determine treatment patterns by surveying orthopedic team physicians. We conducted a study to determine the demographics of NFL and NCAA team physicians and to identify patterns and variations in the management of common injuries in these groups of elite football players.
Materials and Methods
The study was reviewed by an Institutional Review Board before data collection and was classified as exempt. The study population consisted of head orthopedic team physicians for NFL teams and NCAA Division I universities. The survey (Appendix), 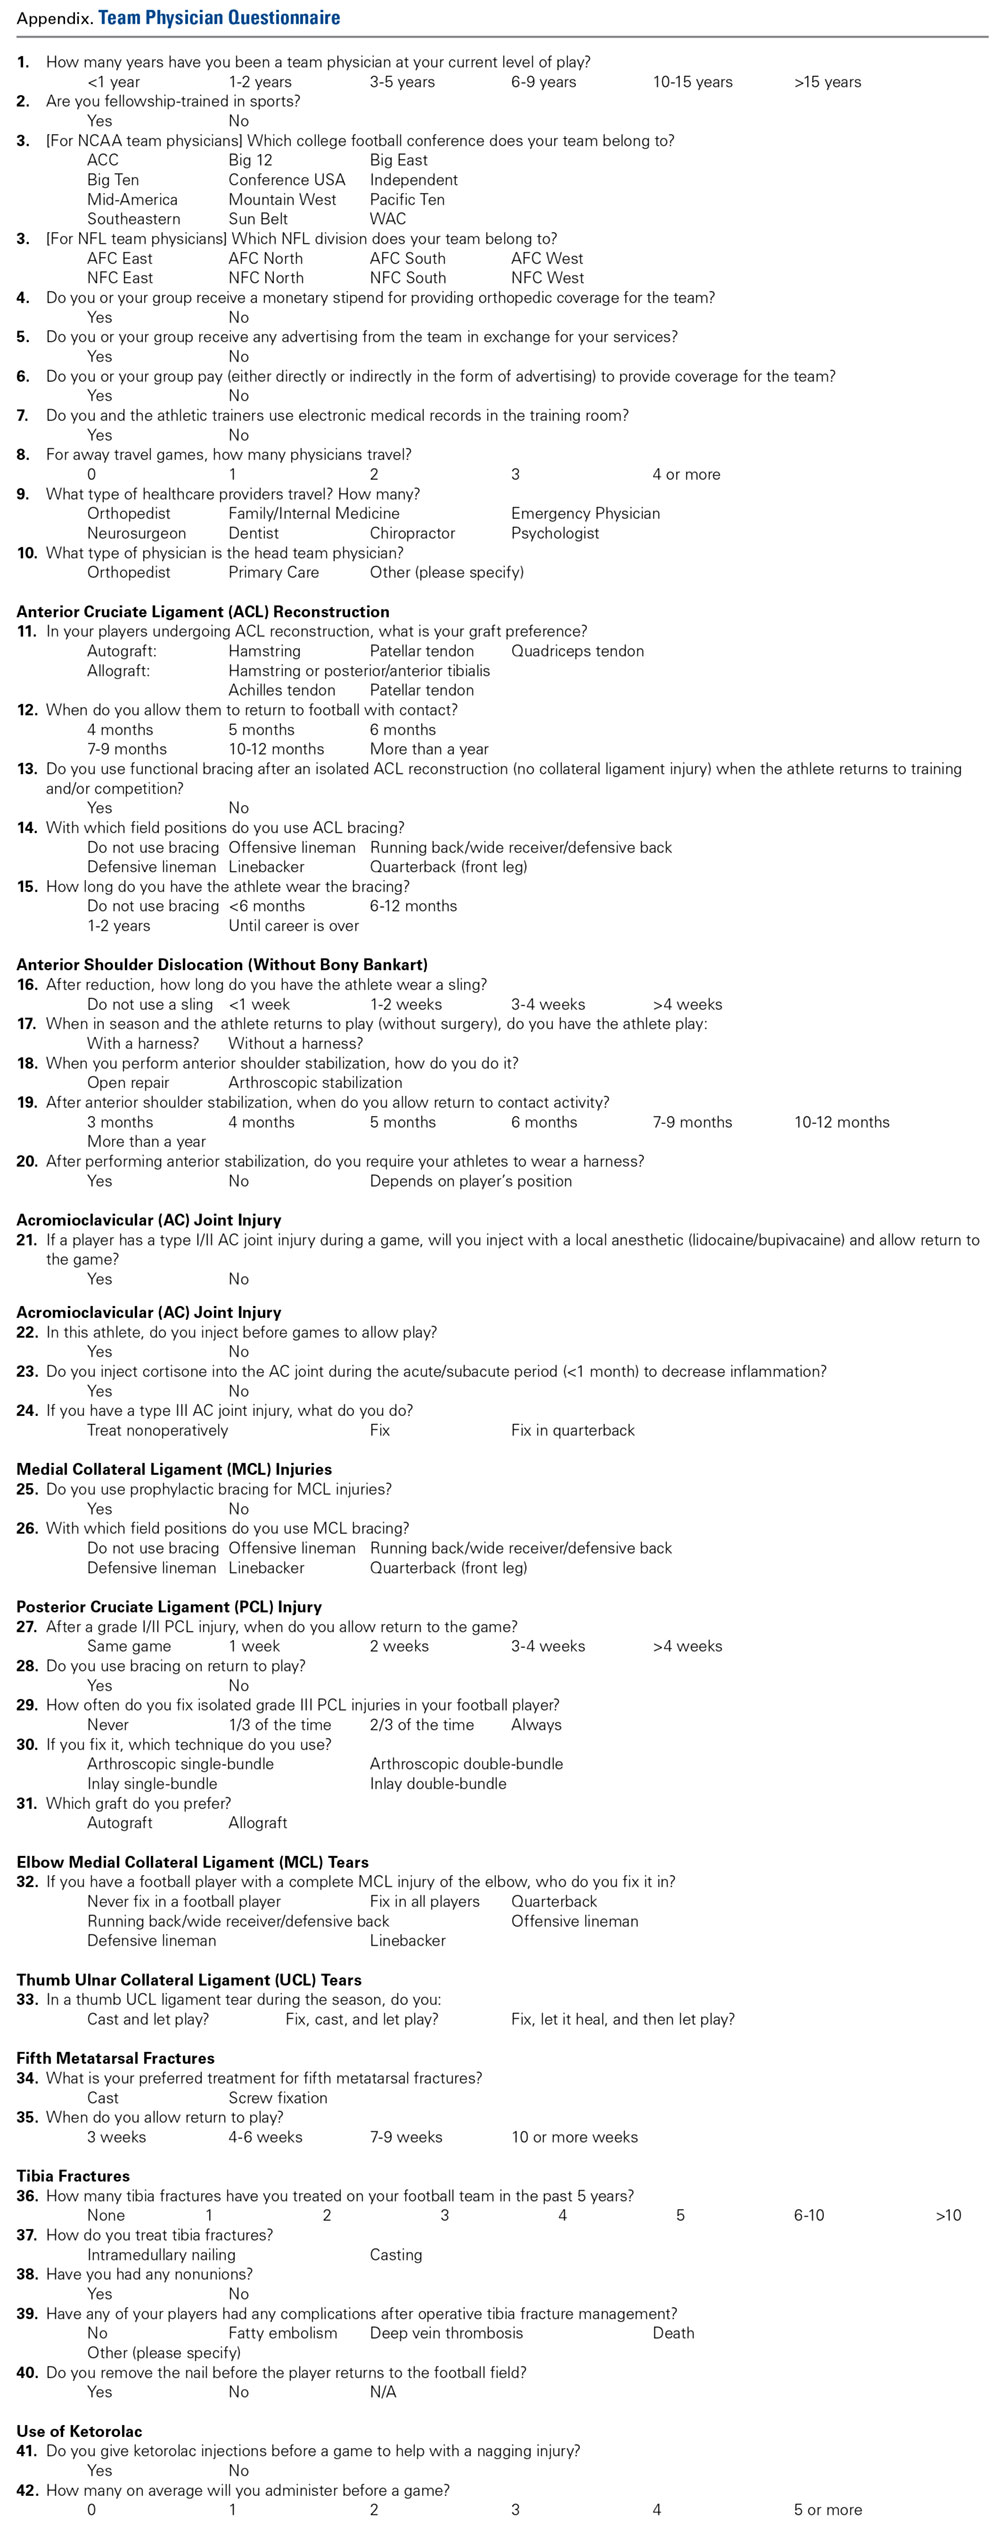
Chi-square tests were used to determine significant differences between groups. P < .05 was considered statistically significant.
Results
Responses were received from 31 (97%) of the 32 NFL and 111 (93%) of the 119 NCAA team physicians. The 2 groups’ surveys were identical with the exception of question 3, regarding NFL division or NCAA conference.
Team Physician Demographics
All survey respondents were the head orthopedic physicians for their teams. Seventy-one percent were the head team physicians as well; another 25% named a primary care physician as the head team physician. Thirty-nine percent of the NFL team physicians had been a team physician at the NFL level for more than 15 years, and 58% of the NCAA team physicians had been a team physician at the Division I level for more than 15 years. Eighty-one percent of NFL and 66% of NCAA team physicians had fellowship training in sports medicine. For away games, 10% of NFL vs 65% of NCAA teams traveled with 2 physicians; 90% of NFL and 28% of NCAA teams traveled with 3 or more physicians.
Only a small percentage of respondents (NFL, 10%; NCAA, 14%) indicated they had received advertising in exchange for services. Most respondents (NFL, 93%; NCAA, 89%) did not pay to provide team coverage. In contrast, 97% of NFL vs only 31% of NCAA physicians indicated they received a monetary stipend for providing orthopedic coverage.
Anterior Cruciate Ligament Reconstructions
Eighty-seven percent of NFL and 67% of NCAA respondents indicated that patellar tendon autograft was their preferred graft choice (Table 1). 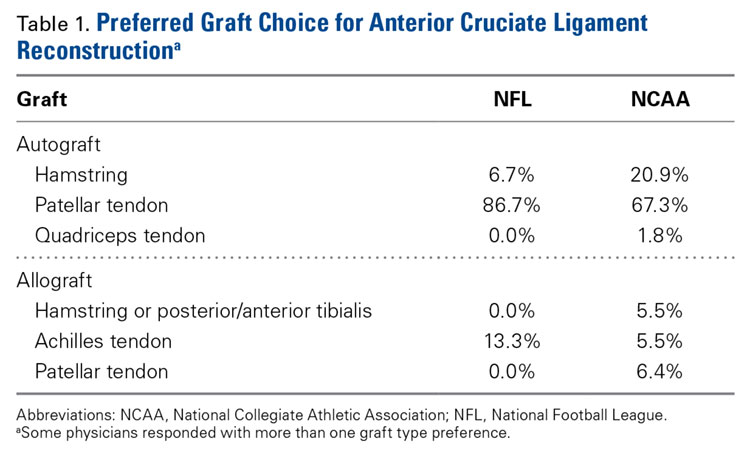
Anterior Shoulder Dislocations (Without Bony Bankart)
Sling use after reduction of anterior shoulder dislocation was varied, with most physicians using a sling 2 weeks or less (Table 2). 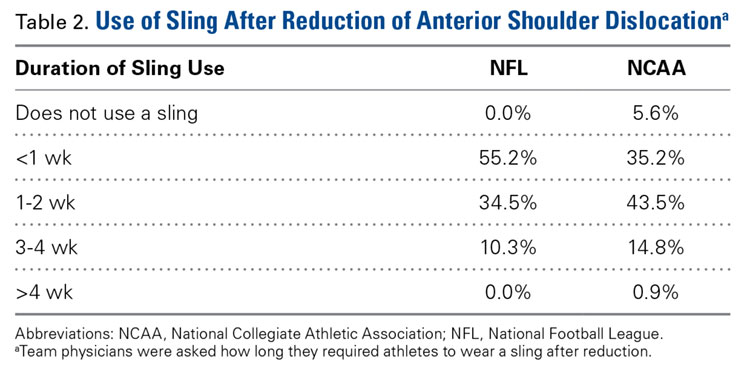
Acromioclavicular Joint Injuries
Roughly two-thirds of respondents (NFL, 60%; NCAA, 69%) indicated that, during a game, they managed acute acromioclavicular (AC) joint injuries (type I/II) with injection of a local anesthetic that allowed return to play. In addition, a majority (NFL, 90%; NCAA, 87%) indicated they gave such athletes pregame injections that allowed them to play. About half the physicians (NFL, 57%; NCAA, 52%) injected the AC joint with cortisone during the acute/subacute period (<1 month) to decrease inflammation.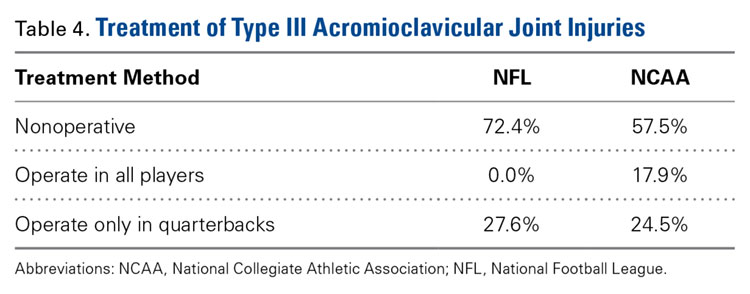
No significant difference was found between the 2 groups in terms of proportion of surgeons electing to treat type III AC joint injuries operatively versus nonoperatively (Table 4).
Medial Collateral Ligament Injuries
There was a significant (P < .0001) difference in use of prophylactic bracing for medial collateral ligament (MCL) injuries (NFL, 28%; NCAA, 89%).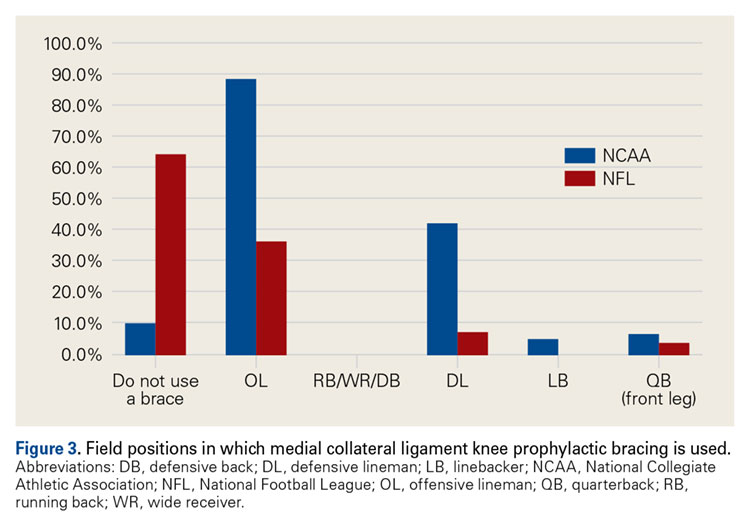
Posterior Cruciate Ligament Injuries
The percentage of physicians who allowed athletes to return to play after a grade I/II posterior cruciate ligament (PCL) injury was significantly (P = .01) higher in NFL physicians (22%) than in NCAA physicians (7%). The amount of time varied up to more than 4 weeks (Figure 4). 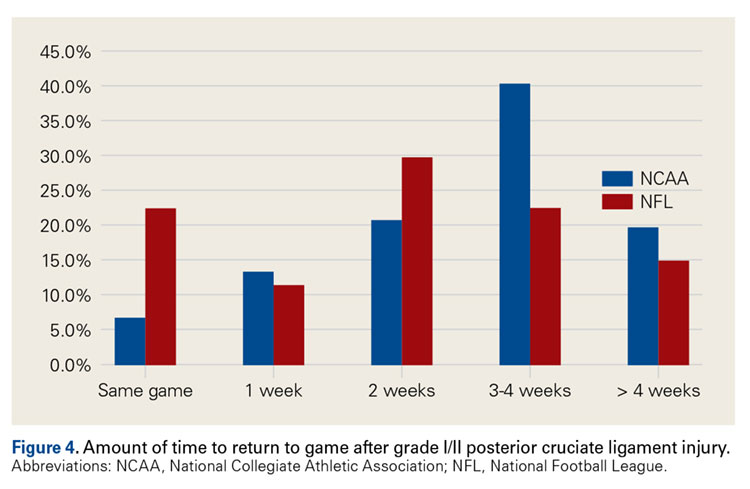
Elbow Ulnar Collateral Ligament Tears
A majority of respondents indicated they would treat a complete elbow ulnar collateral ligament (UCL) tear in a quarterback; a much smaller percentage preferred operative repair in athletes playing other positions (Table 6).
Thumb Ulnar Collateral Ligament Tears
For athletes with in-season thumb UCL tears, 63% of NFL and 54% of NCAA physicians indicated they cast the thumb and allowed return to play. Others recommended operative repair and either cast the thumb and allowed return to play (NFL, 30%; NCAA, 41%) or let the thumb heal before allowing return to play (NFL, 7%; NCAA, 5%).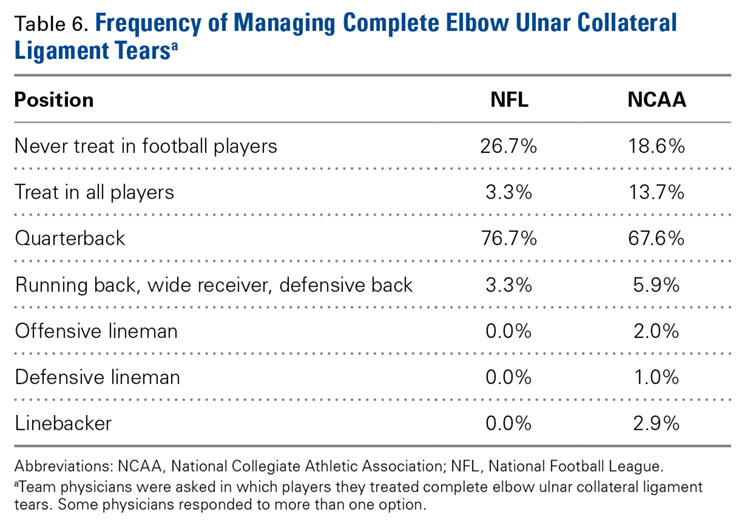
Fifth Metatarsal Fractures
For a large majority of physicians (NFL, 100%; NCAA, 94%), the preferred treatment for fifth metatarsal fractures was screw fixation. 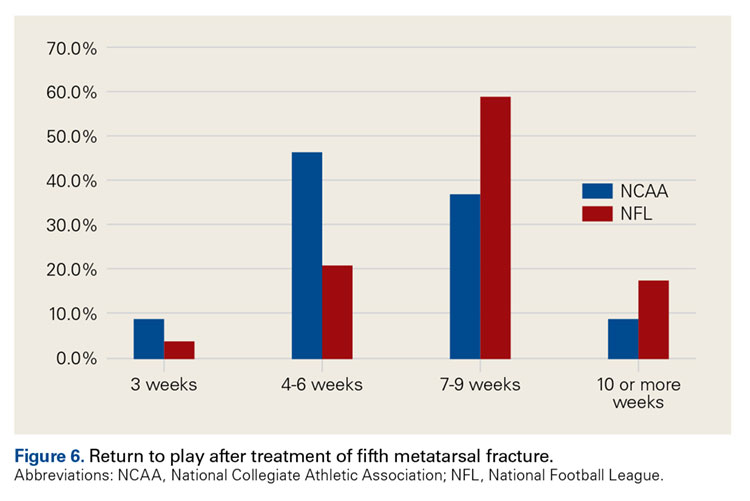
Tibia Fractures
In the 5-year period before the survey, 43% of NFL and 75% of NCAA physicians managed at least one tibia fracture (P < .001) (Figure 7). 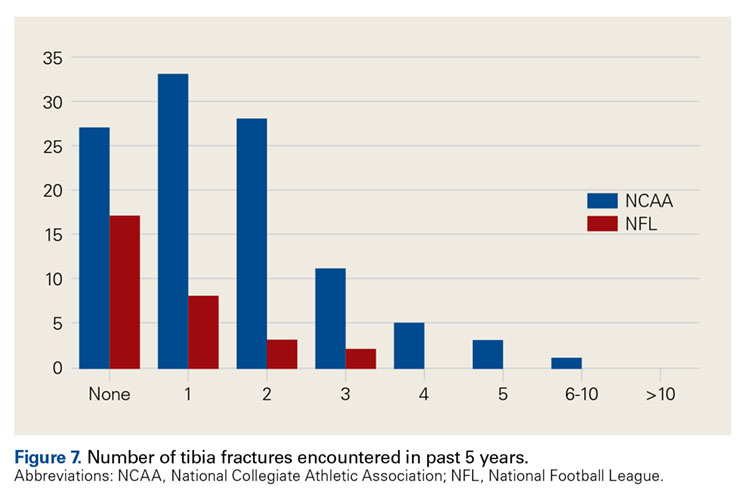
Ketorolac Injections
Intramuscular ketorolac injections were frequently given to elite football players, significantly (P < .01) more so in the NFL (93%) than in the NCAA (62%). The average number of injections varied among physicians, though a significantly (P < .0001) higher percentage of NFL (79%) than NCAA (13%) physicians gave 5 or more injections per game.
Discussion
This survey on managing common injuries in elite football players had an overall response rate of 94%. All NFL divisions and NCAA conferences were represented in physicians’ responses. Ninety percent of NFL and 65% of NCAA head team physicians were orthopedists. These findings differ from those of Stockard1 (1997), who surveyed athletic directors at Division I schools and reported 45% of head team physicians were family medicine-trained and 41% were orthopedists.
Given the high visibility of team coverage and the economics of college football’s highest division, one might expect team physicians to receive financial remuneration. This was not the case, according to our survey: Only 30% of physicians received a monetary stipend for team coverage, and only 14% received advertising in exchange for their services. Twelve NCAA team physicians indicated they pay to be allowed to provide team coverage.
Injury Management
Anterior Cruciate Ligament Injuries. For NFL and NCAA team physicians, the preferred graft choice for ACL reconstruction was patellar tendon autograft. This finding is similar to what Erickson and colleagues2 reported from a survey of NFL and NCAA team physicians: 86% of surgeons preferred bone–patellar tendon–bone (BPTB) autograft. However, only 1 surgeon (0.7%) in that study, vs 16% in ours, preferred allograft. Allograft use may be somewhat controversial, as relevant data on competitive athletes are lacking, and it has been shown that the graft rupture rate3 is higher for BPTB allograft than for BPTB autograft in young patients. However, much of the data on higher failure rates with use of allograft in young patients4,5 has appeared since our data were collected.
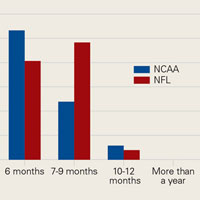
Our return-to-play data are similar to data from other studies.2,6 According to our survey, the most common length of time from ACL reconstruction to return to football was 6 months, and 94% of team physicians allowed return to football by 9 months. In the survey by Erickson and colleagues,2 55% of surgeons waited a minimum of 6 months before returning athletes to play, and only 12% waited at least 9 months. In the study by Bradley and colleagues6 (2002), 84% of surgeons waited at least 6 months before returning athletes to play. Of note, we found a significantly higher percentage of NCAA football players than NFL players returning within 6 months after surgery. The difference may be attributable to a more cautious approach being taken with NFL players, whereas most NCAA players are limited in the time remaining in their football careers and want to return to the playing field as soon as possible.
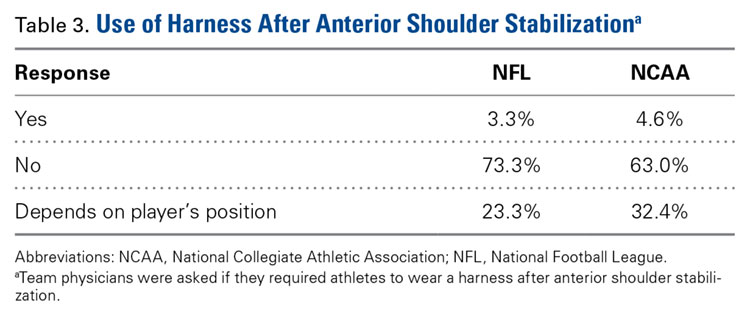
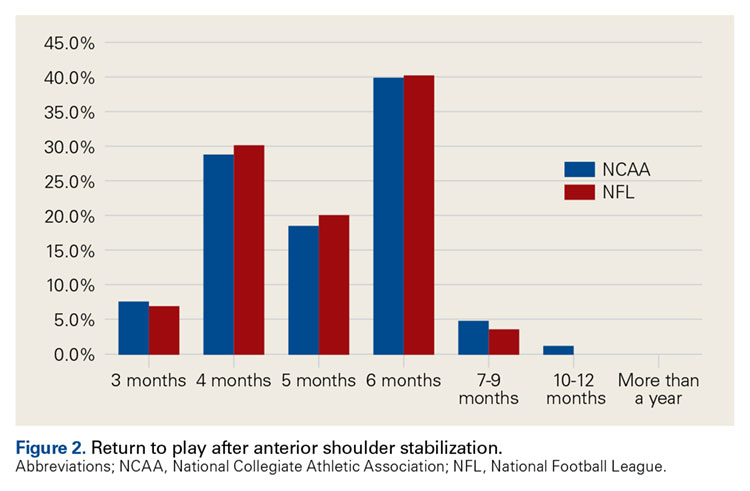
Shoulder Dislocations. Responses to the 5 survey questions on anterior shoulder dislocation showed little consensus with respect to management. The exception pertained to use of a harness for in-season return to play with a dislocation—92% of physicians preferred management with a harness. Of note, 7 of 10 team surgeons performed anterior stabilization through an arthroscopic approach. Despite historical recommendations to perform open anterior stabilization in collision athletes, NFL and NCAA physicians’ practice patterns have evolved.7 Although return to contact activity was varied among responses, 94% of physicians allowed return to contact within 6 months.
Acromioclavicular Joint Injuries. For college football players, AC joint injuries are the most common shoulder injuries.8 In the NFL Combine, the incidence of AC joint injuries was 15.7 per 100 players.8 Several studies have cited favorable results with nonoperative management of type III AC joint injuries.9-12 Nonoperative management was the preferred treatment in our study as well, yet 26% of surgeons still preferred operative treatment in quarterbacks. Opinions about operative repair of type III injuries in overhead athletes vary,13 but nonoperative management clearly is the preferred method for elite football players. A 2013 study by Lynch and colleagues14 found that only 2 of 40 NFL players with type III AC joint injuries underwent surgery.
For type I and II AC joint injuries that occur during a game, more than two-thirds of the NCAA team physicians in our study favored injecting a local anesthetic to reduce pain and allow return to play in the same game. An even larger majority indicated they gave a pregame injection of an anesthetic to allow play. Similar use of injections for AC joint injuries has been reported in Australian-rules football and rugby.15Medial Collateral Ligament Injuries. Whether bracing is prophylactic against MCL injuries is controversial.16 Some studies have found it effective.17,18 According to our survey, 89% of Division I football teams used prophylactic knee bracing, mainly in offensive linemen but frequently in defensive linemen, too. No schools used bracing in athletes who played skill positions, except quarterbacks. Six schools used bracing on a quarterback’s front leg.
The percentage of teams that used prophylactic MCL bracing was significantly higher in the NCAA than in the NFL. NCAA team physicians generally have more control over players and therefore can implement widespread use of this bracing.
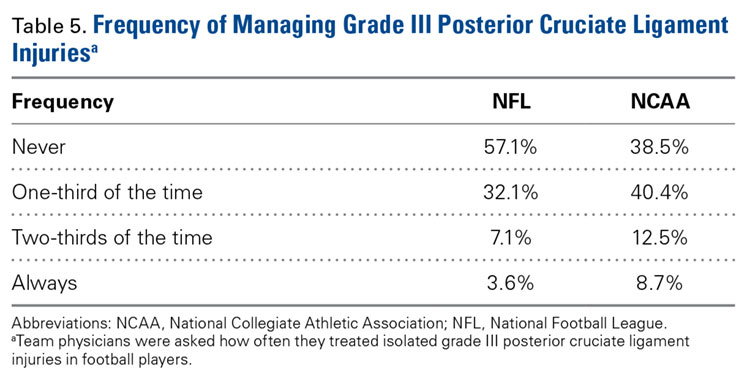
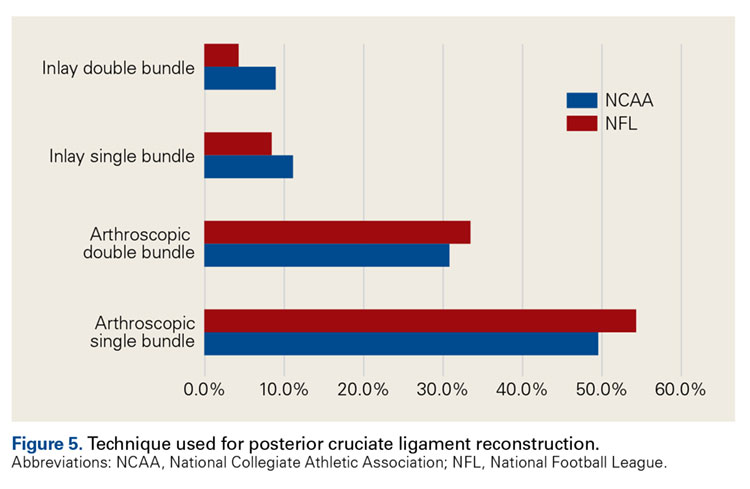
Posterior Cruciate Ligament Injuries. These injuries are infrequent. According to Parolie and Bergfeld,19 only 2% of college football players at the NFL Combine had a PCL injury. Treatment in athletes remains controversial. Our survey showed physicians’ willingness to return players to competition within 4 weeks after grade I/II PCL injuries. There is no consensus on management or on postinjury bracing. In operative cases, however, the preferred graft is allograft, and the preferred repair method is the arthroscopic single-bundle technique. These findings mirror those of a 2004 survey of the Herodicus Society by Dennis and colleagues.20 Elbow Ulnar Collateral Ligament Tears. In throwing athletes with UCL tears, operative treatment has been recommended.21,22 A majority of our survey respondents preferred operative treatment for quarterbacks. However, operative treatment is still controversial, and quarterbacks differ from baseball players in their throwing motions and in the stresses acting on the UCLs during throwing. Two systematic reviews of UCL reconstruction have affirmed the positive outcomes of operative treatment in throwing athletes.21,22 However, most of the studies covered by these reviews focused on baseball players. In athletes playing positions other than quarterback, these injuries were typically treated nonoperatively.
Thumb Ulnar Collateral Ligament Tears. Our survey respondents differed in their opinions on treating thumb UCL tears. About half recommended cast treatment, and the other half recommended operative treatment. Previous data suggest that delaying surgical treatment may be deleterious to the eventual outcome.23,24Fifth Metatarsal Fractures. For fifth metatarsal fractures, screw fixation was preferred by 90% of our survey respondents—vs 73% of NFL team physicians in a 2004 study by Low and colleagues.25 What remains controversial is the length of time before return to play. Our most frequent response was 4 to 6 weeks, and 46% of our respondents indicated they would wait 7 weeks or longer. These times differ significantly from what Low and colleagues25 reported: 86% of their physicians allowed return to competition after 6 to 12 weeks.
Tibia Fractures. Management of tibia fractures in US football players has not been reported. Chang and colleagues26 described 24 tibial shaft fractures in UK soccer players. Eleven fractures (~50%) were treated with intramedullary nails, 2 with plating, and 11 with conservative management. All players returned to activity, the operative group at 23.3 weeks and the nonoperative group at 27.6 weeks. Our respondents reported treating at least 150 tibial shaft fractures in the 5-year period before our survey, demonstrating the incidence and importance of this type of injury. A vast majority of team surgeons (96%) opted for treatment with intramedullary nailing. This choice may reflect an ability to return to play earlier—the ability to move the knee and maintain strength in the legs. Some have suggested it is important to remove the nail before the player returns to the football field, but this was not common practice among our groups of team surgeons. Other studies have not found any advantage to tibial nail removal.27Ketorolac Injections. Authors have described using ketorolac for the treatment of acute or pregame pain in professional football players.28-30 According to a 2000 survey, 93% of NFL teams used intramuscular ketorolac, and on average 15 players per team were treated, primarily on game day. Our survey found frequent use of ketorolac, with almost two-thirds of team orthopedists indicating pregame use. Ketorolac use was popular, particularly because of its effect in reducing postoperative pain and its potent effect in reducing pain on game day. However, injections by football team physicians have declined significantly in recent years, ever since an NFL Physician Society task force published recommendations on ketorolac use.31
Conclusion
There is a wide variety of patterns in treating athletes who play football at the highest levels of competition. Our findings can initiate further discussion on these topics and assist orthopedists providing game coverage at all levels of play in their decision-making process by helping to define the standard of care for their injured players.
Am J Orthop. 2016;45(6):E319-E327. Copyright Frontline Medical Communications Inc. 2016. All rights reserved.
1. Stockard AR. Team physician preferences at National Collegiate Athletic Association Division I universities. J Am Osteopath Assoc. 1997;97(2):89-95.
2. Erickson BJ, Harris JD, Fillingham YA, et al. Anterior cruciate ligament reconstruction practice patterns by NFL and NCAA football team physicians. Arthroscopy. 2014;30(6):731-738.
3. Kraeutler MJ, Bravman JT, McCarty EC. Bone-patellar tendon-bone autograft versus allograft in outcomes of anterior cruciate ligament reconstruction: a meta-analysis of 5182 patients. Am J Sports Med. 2013;41(10):2439-2448.
4. Bottoni CR, Smith EL, Shaha J, et al. Autograft versus allograft anterior cruciate ligament reconstruction: a prospective, randomized clinical study with a minimum 10-year follow-up. Am J Sports Med. 2015;43(10):2501-2509.
5. Sun K, Tian S, Zhang J, Xia C, Zhang C, Yu T. Anterior cruciate ligament reconstruction with BPTB autograft, irradiated versus non-irradiated allograft: a prospective randomized clinical study. Knee Surg Sports Traumatol Arthrosc. 2009;17(5):464-474.
6. Bradley JP, Klimkiewicz JJ, Rytel MJ, Powell JW. Anterior cruciate ligament injuries in the National Football League: epidemiology and current treatment trends among team physicians. Arthroscopy. 2002;18(5):502-509.
7. Rhee YG, Ha JH, Cho NS. Anterior shoulder stabilization in collision athletes: arthroscopic versus open Bankart repair. Am J Sports Med. 2006;34(6):979-985.
8. Brophy RH, Barnes R, Rodeo SA, Warren RF. Prevalence of musculoskeletal disorders at the NFL Combine—trends from 1987 to 2000. Med Sci Sports Exerc. 2007;39(1):22-27.
9. Bishop JY, Kaeding C. Treatment of the acute traumatic acromioclavicular separation. Sports Med Arthrosc. 2006;14(4):237-245.
10. Mazzocca AD, Arciero RA, Bicos J. Evaluation and treatment of acromioclavicular joint injuries. Am J Sports Med. 2007;35(2):316-329.
11. Schlegel TF, Burks RT, Marcus RL, Dunn HK. A prospective evaluation of untreated acute grade III acromioclavicular separations. Am J Sports Med. 2001;29(6):699-703.
12. Spencer EE Jr. Treatment of grade III acromioclavicular joint injuries: a systematic review. Clin Orthop Relat Res. 2007;(455):38-44.
13. Kraeutler MJ, Williams GR Jr, Cohen SB, et al. Inter- and intraobserver reliability of the radiographic diagnosis and treatment of acromioclavicular joint separations. Orthopedics. 2012;35(10):e1483-e1487.
14. Lynch TS, Saltzman MD, Ghodasra JH, Bilimoria KY, Bowen MK, Nuber GW. Acromioclavicular joint injuries in the National Football League: epidemiology and management. Am J Sports Med. 2013;41(12):2904-2908.
15. Orchard JW. Benefits and risks of using local anaesthetic for pain relief to allow early return to play in professional football. Br J Sports Med. 2002;36(3):209-213.
16. Salata MJ, Gibbs AE, Sekiya JK. The effectiveness of prophylactic knee bracing in American football: a systematic review. Sports Health. 2010;2(5):375-379.
17. Albright JP, Powell JW, Smith W, et al. Medial collateral ligament knee sprains in college football. Effectiveness of preventive braces. Am J Sports Med. 1994;22(1):12-18.
18. Sitler M, Ryan J, Hopkinson W, et al. The efficacy of a prophylactic knee brace to reduce knee injuries in football. A prospective, randomized study at West Point. Am J Sports Med. 1990;18(3):310-315.
19. Parolie JM, Bergfeld JA. Long-term results of nonoperative treatment of isolated posterior cruciate ligament injuries in the athlete. Am J Sports Med. 1986;14(1):35-38.
20. Dennis MG, Fox JA, Alford JW, Hayden JK, Bach BR Jr. Posterior cruciate ligament reconstruction: current trends. J Knee Surg. 2004;17(3):133-139.
21. Purcell DB, Matava MJ, Wright RW. Ulnar collateral ligament reconstruction: a systematic review. Clin Orthop Relat Res. 2007;(455):72-77.
22. Vitale MA, Ahmad CS. The outcome of elbow ulnar collateral ligament reconstruction in overhead athletes: a systematic review. Am J Sports Med. 2008;36(6):1193-1205.
23. Fricker R, Hintermann B. Skier’s thumb. Treatment, prevention and recommendations. Sports Med. 1995;19(1):73-79.
24. Smith RJ. Post-traumatic instability of the metacarpophalangeal joint of the thumb. J Bone Joint Surg Am. 1977;59(1):14-21.
25. Low K, Noblin JD, Browne JE, Barnthouse CD, Scott AR. Jones fractures in the elite football player. J Surg Orthop Adv. 2004;13(3):156-160.
26. Chang WR, Kapasi Z, Daisley S, Leach WJ. Tibial shaft fractures in football players. J Orthop Surg Res. 2007;2:11.
27. Karladani AH, Ericsson PA, Granhed H, Karlsson L, Nyberg P. Tibial intramedullary nails—should they be removed? A retrospective study of 71 patients. Acta Orthop. 2007;78(5):668-671.
28. Eichner ER. Intramuscular ketorolac injections: the pregame Toradol parade. Curr Sports Med Rep. 2012;11(4):169-170.
29. Nepple JJ, Matava MJ. Soft tissue injections in the athlete. Sports Health. 2009;1(5):396-404.
30. Powell ET, Tokish JM, Hawkins RJ. Toradol use in the athletic population. Curr Sports Med Rep. 2002;1(4):191.
31. Matava M, Brater DC, Gritter N, et al. Recommendations of the National Football League physician society task force on the use of toradol® ketorolac in the National Football League. Sports Health. 2012;4(5):377-383.
Among National Football League (NFL) and National Collegiate Athletic Association (NCAA) team physicians, there is no consensus on the management of various injuries. At national and regional meetings, the management of football injuries often is debated.
Given the high level of interest in the treatment of elite football players, we wanted to determine treatment patterns by surveying orthopedic team physicians. We conducted a study to determine the demographics of NFL and NCAA team physicians and to identify patterns and variations in the management of common injuries in these groups of elite football players.
Materials and Methods
The study was reviewed by an Institutional Review Board before data collection and was classified as exempt. The study population consisted of head orthopedic team physicians for NFL teams and NCAA Division I universities. The survey (Appendix),
Chi-square tests were used to determine significant differences between groups. P < .05 was considered statistically significant.
Results
Responses were received from 31 (97%) of the 32 NFL and 111 (93%) of the 119 NCAA team physicians. The 2 groups’ surveys were identical with the exception of question 3, regarding NFL division or NCAA conference.
Team Physician Demographics
All survey respondents were the head orthopedic physicians for their teams. Seventy-one percent were the head team physicians as well; another 25% named a primary care physician as the head team physician. Thirty-nine percent of the NFL team physicians had been a team physician at the NFL level for more than 15 years, and 58% of the NCAA team physicians had been a team physician at the Division I level for more than 15 years. Eighty-one percent of NFL and 66% of NCAA team physicians had fellowship training in sports medicine. For away games, 10% of NFL vs 65% of NCAA teams traveled with 2 physicians; 90% of NFL and 28% of NCAA teams traveled with 3 or more physicians.
Only a small percentage of respondents (NFL, 10%; NCAA, 14%) indicated they had received advertising in exchange for services. Most respondents (NFL, 93%; NCAA, 89%) did not pay to provide team coverage. In contrast, 97% of NFL vs only 31% of NCAA physicians indicated they received a monetary stipend for providing orthopedic coverage.
Anterior Cruciate Ligament Reconstructions
Eighty-seven percent of NFL and 67% of NCAA respondents indicated that patellar tendon autograft was their preferred graft choice (Table 1).
Anterior Shoulder Dislocations (Without Bony Bankart)
Sling use after reduction of anterior shoulder dislocation was varied, with most physicians using a sling 2 weeks or less (Table 2).
Acromioclavicular Joint Injuries
Roughly two-thirds of respondents (NFL, 60%; NCAA, 69%) indicated that, during a game, they managed acute acromioclavicular (AC) joint injuries (type I/II) with injection of a local anesthetic that allowed return to play. In addition, a majority (NFL, 90%; NCAA, 87%) indicated they gave such athletes pregame injections that allowed them to play. About half the physicians (NFL, 57%; NCAA, 52%) injected the AC joint with cortisone during the acute/subacute period (<1 month) to decrease inflammation.
No significant difference was found between the 2 groups in terms of proportion of surgeons electing to treat type III AC joint injuries operatively versus nonoperatively (Table 4).
Medial Collateral Ligament Injuries
There was a significant (P < .0001) difference in use of prophylactic bracing for medial collateral ligament (MCL) injuries (NFL, 28%; NCAA, 89%).
Posterior Cruciate Ligament Injuries
The percentage of physicians who allowed athletes to return to play after a grade I/II posterior cruciate ligament (PCL) injury was significantly (P = .01) higher in NFL physicians (22%) than in NCAA physicians (7%). The amount of time varied up to more than 4 weeks (Figure 4).
Elbow Ulnar Collateral Ligament Tears
A majority of respondents indicated they would treat a complete elbow ulnar collateral ligament (UCL) tear in a quarterback; a much smaller percentage preferred operative repair in athletes playing other positions (Table 6).
Thumb Ulnar Collateral Ligament Tears
For athletes with in-season thumb UCL tears, 63% of NFL and 54% of NCAA physicians indicated they cast the thumb and allowed return to play. Others recommended operative repair and either cast the thumb and allowed return to play (NFL, 30%; NCAA, 41%) or let the thumb heal before allowing return to play (NFL, 7%; NCAA, 5%).
Fifth Metatarsal Fractures
For a large majority of physicians (NFL, 100%; NCAA, 94%), the preferred treatment for fifth metatarsal fractures was screw fixation.
Tibia Fractures
In the 5-year period before the survey, 43% of NFL and 75% of NCAA physicians managed at least one tibia fracture (P < .001) (Figure 7).
Ketorolac Injections
Intramuscular ketorolac injections were frequently given to elite football players, significantly (P < .01) more so in the NFL (93%) than in the NCAA (62%). The average number of injections varied among physicians, though a significantly (P < .0001) higher percentage of NFL (79%) than NCAA (13%) physicians gave 5 or more injections per game.
Discussion
This survey on managing common injuries in elite football players had an overall response rate of 94%. All NFL divisions and NCAA conferences were represented in physicians’ responses. Ninety percent of NFL and 65% of NCAA head team physicians were orthopedists. These findings differ from those of Stockard1 (1997), who surveyed athletic directors at Division I schools and reported 45% of head team physicians were family medicine-trained and 41% were orthopedists.
Given the high visibility of team coverage and the economics of college football’s highest division, one might expect team physicians to receive financial remuneration. This was not the case, according to our survey: Only 30% of physicians received a monetary stipend for team coverage, and only 14% received advertising in exchange for their services. Twelve NCAA team physicians indicated they pay to be allowed to provide team coverage.
Injury Management
Anterior Cruciate Ligament Injuries. For NFL and NCAA team physicians, the preferred graft choice for ACL reconstruction was patellar tendon autograft. This finding is similar to what Erickson and colleagues2 reported from a survey of NFL and NCAA team physicians: 86% of surgeons preferred bone–patellar tendon–bone (BPTB) autograft. However, only 1 surgeon (0.7%) in that study, vs 16% in ours, preferred allograft. Allograft use may be somewhat controversial, as relevant data on competitive athletes are lacking, and it has been shown that the graft rupture rate3 is higher for BPTB allograft than for BPTB autograft in young patients. However, much of the data on higher failure rates with use of allograft in young patients4,5 has appeared since our data were collected.
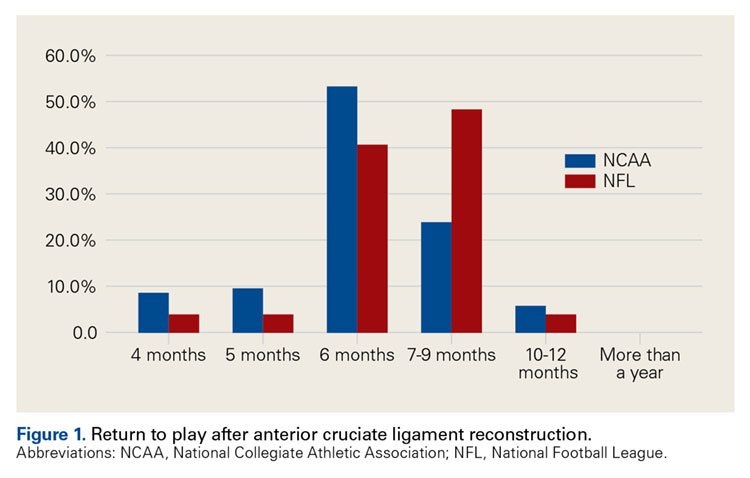
Our return-to-play data are similar to data from other studies.2,6 According to our survey, the most common length of time from ACL reconstruction to return to football was 6 months, and 94% of team physicians allowed return to football by 9 months. In the survey by Erickson and colleagues,2 55% of surgeons waited a minimum of 6 months before returning athletes to play, and only 12% waited at least 9 months. In the study by Bradley and colleagues6 (2002), 84% of surgeons waited at least 6 months before returning athletes to play. Of note, we found a significantly higher percentage of NCAA football players than NFL players returning within 6 months after surgery. The difference may be attributable to a more cautious approach being taken with NFL players, whereas most NCAA players are limited in the time remaining in their football careers and want to return to the playing field as soon as possible.
Shoulder Dislocations. Responses to the 5 survey questions on anterior shoulder dislocation showed little consensus with respect to management. The exception pertained to use of a harness for in-season return to play with a dislocation—92% of physicians preferred management with a harness. Of note, 7 of 10 team surgeons performed anterior stabilization through an arthroscopic approach. Despite historical recommendations to perform open anterior stabilization in collision athletes, NFL and NCAA physicians’ practice patterns have evolved.7 Although return to contact activity was varied among responses, 94% of physicians allowed return to contact within 6 months.
Acromioclavicular Joint Injuries. For college football players, AC joint injuries are the most common shoulder injuries.8 In the NFL Combine, the incidence of AC joint injuries was 15.7 per 100 players.8 Several studies have cited favorable results with nonoperative management of type III AC joint injuries.9-12 Nonoperative management was the preferred treatment in our study as well, yet 26% of surgeons still preferred operative treatment in quarterbacks. Opinions about operative repair of type III injuries in overhead athletes vary,13 but nonoperative management clearly is the preferred method for elite football players. A 2013 study by Lynch and colleagues14 found that only 2 of 40 NFL players with type III AC joint injuries underwent surgery.
For type I and II AC joint injuries that occur during a game, more than two-thirds of the NCAA team physicians in our study favored injecting a local anesthetic to reduce pain and allow return to play in the same game. An even larger majority indicated they gave a pregame injection of an anesthetic to allow play. Similar use of injections for AC joint injuries has been reported in Australian-rules football and rugby.15Medial Collateral Ligament Injuries. Whether bracing is prophylactic against MCL injuries is controversial.16 Some studies have found it effective.17,18 According to our survey, 89% of Division I football teams used prophylactic knee bracing, mainly in offensive linemen but frequently in defensive linemen, too. No schools used bracing in athletes who played skill positions, except quarterbacks. Six schools used bracing on a quarterback’s front leg.
The percentage of teams that used prophylactic MCL bracing was significantly higher in the NCAA than in the NFL. NCAA team physicians generally have more control over players and therefore can implement widespread use of this bracing.
Posterior Cruciate Ligament Injuries. These injuries are infrequent. According to Parolie and Bergfeld,19 only 2% of college football players at the NFL Combine had a PCL injury. Treatment in athletes remains controversial. Our survey showed physicians’ willingness to return players to competition within 4 weeks after grade I/II PCL injuries. There is no consensus on management or on postinjury bracing. In operative cases, however, the preferred graft is allograft, and the preferred repair method is the arthroscopic single-bundle technique. These findings mirror those of a 2004 survey of the Herodicus Society by Dennis and colleagues.20 Elbow Ulnar Collateral Ligament Tears. In throwing athletes with UCL tears, operative treatment has been recommended.21,22 A majority of our survey respondents preferred operative treatment for quarterbacks. However, operative treatment is still controversial, and quarterbacks differ from baseball players in their throwing motions and in the stresses acting on the UCLs during throwing. Two systematic reviews of UCL reconstruction have affirmed the positive outcomes of operative treatment in throwing athletes.21,22 However, most of the studies covered by these reviews focused on baseball players. In athletes playing positions other than quarterback, these injuries were typically treated nonoperatively.
Thumb Ulnar Collateral Ligament Tears. Our survey respondents differed in their opinions on treating thumb UCL tears. About half recommended cast treatment, and the other half recommended operative treatment. Previous data suggest that delaying surgical treatment may be deleterious to the eventual outcome.23,24Fifth Metatarsal Fractures. For fifth metatarsal fractures, screw fixation was preferred by 90% of our survey respondents—vs 73% of NFL team physicians in a 2004 study by Low and colleagues.25 What remains controversial is the length of time before return to play. Our most frequent response was 4 to 6 weeks, and 46% of our respondents indicated they would wait 7 weeks or longer. These times differ significantly from what Low and colleagues25 reported: 86% of their physicians allowed return to competition after 6 to 12 weeks.
Tibia Fractures. Management of tibia fractures in US football players has not been reported. Chang and colleagues26 described 24 tibial shaft fractures in UK soccer players. Eleven fractures (~50%) were treated with intramedullary nails, 2 with plating, and 11 with conservative management. All players returned to activity, the operative group at 23.3 weeks and the nonoperative group at 27.6 weeks. Our respondents reported treating at least 150 tibial shaft fractures in the 5-year period before our survey, demonstrating the incidence and importance of this type of injury. A vast majority of team surgeons (96%) opted for treatment with intramedullary nailing. This choice may reflect an ability to return to play earlier—the ability to move the knee and maintain strength in the legs. Some have suggested it is important to remove the nail before the player returns to the football field, but this was not common practice among our groups of team surgeons. Other studies have not found any advantage to tibial nail removal.27Ketorolac Injections. Authors have described using ketorolac for the treatment of acute or pregame pain in professional football players.28-30 According to a 2000 survey, 93% of NFL teams used intramuscular ketorolac, and on average 15 players per team were treated, primarily on game day. Our survey found frequent use of ketorolac, with almost two-thirds of team orthopedists indicating pregame use. Ketorolac use was popular, particularly because of its effect in reducing postoperative pain and its potent effect in reducing pain on game day. However, injections by football team physicians have declined significantly in recent years, ever since an NFL Physician Society task force published recommendations on ketorolac use.31
Conclusion
There is a wide variety of patterns in treating athletes who play football at the highest levels of competition. Our findings can initiate further discussion on these topics and assist orthopedists providing game coverage at all levels of play in their decision-making process by helping to define the standard of care for their injured players.
Am J Orthop. 2016;45(6):E319-E327. Copyright Frontline Medical Communications Inc. 2016. All rights reserved.
Among National Football League (NFL) and National Collegiate Athletic Association (NCAA) team physicians, there is no consensus on the management of various injuries. At national and regional meetings, the management of football injuries often is debated.
Given the high level of interest in the treatment of elite football players, we wanted to determine treatment patterns by surveying orthopedic team physicians. We conducted a study to determine the demographics of NFL and NCAA team physicians and to identify patterns and variations in the management of common injuries in these groups of elite football players.
Materials and Methods
The study was reviewed by an Institutional Review Board before data collection and was classified as exempt. The study population consisted of head orthopedic team physicians for NFL teams and NCAA Division I universities. The survey (Appendix),
Chi-square tests were used to determine significant differences between groups. P < .05 was considered statistically significant.
Results
Responses were received from 31 (97%) of the 32 NFL and 111 (93%) of the 119 NCAA team physicians. The 2 groups’ surveys were identical with the exception of question 3, regarding NFL division or NCAA conference.
Team Physician Demographics
All survey respondents were the head orthopedic physicians for their teams. Seventy-one percent were the head team physicians as well; another 25% named a primary care physician as the head team physician. Thirty-nine percent of the NFL team physicians had been a team physician at the NFL level for more than 15 years, and 58% of the NCAA team physicians had been a team physician at the Division I level for more than 15 years. Eighty-one percent of NFL and 66% of NCAA team physicians had fellowship training in sports medicine. For away games, 10% of NFL vs 65% of NCAA teams traveled with 2 physicians; 90% of NFL and 28% of NCAA teams traveled with 3 or more physicians.
Only a small percentage of respondents (NFL, 10%; NCAA, 14%) indicated they had received advertising in exchange for services. Most respondents (NFL, 93%; NCAA, 89%) did not pay to provide team coverage. In contrast, 97% of NFL vs only 31% of NCAA physicians indicated they received a monetary stipend for providing orthopedic coverage.
Anterior Cruciate Ligament Reconstructions
Eighty-seven percent of NFL and 67% of NCAA respondents indicated that patellar tendon autograft was their preferred graft choice (Table 1).
Anterior Shoulder Dislocations (Without Bony Bankart)
Sling use after reduction of anterior shoulder dislocation was varied, with most physicians using a sling 2 weeks or less (Table 2).
Acromioclavicular Joint Injuries
Roughly two-thirds of respondents (NFL, 60%; NCAA, 69%) indicated that, during a game, they managed acute acromioclavicular (AC) joint injuries (type I/II) with injection of a local anesthetic that allowed return to play. In addition, a majority (NFL, 90%; NCAA, 87%) indicated they gave such athletes pregame injections that allowed them to play. About half the physicians (NFL, 57%; NCAA, 52%) injected the AC joint with cortisone during the acute/subacute period (<1 month) to decrease inflammation.
No significant difference was found between the 2 groups in terms of proportion of surgeons electing to treat type III AC joint injuries operatively versus nonoperatively (Table 4).
Medial Collateral Ligament Injuries
There was a significant (P < .0001) difference in use of prophylactic bracing for medial collateral ligament (MCL) injuries (NFL, 28%; NCAA, 89%).
Posterior Cruciate Ligament Injuries
The percentage of physicians who allowed athletes to return to play after a grade I/II posterior cruciate ligament (PCL) injury was significantly (P = .01) higher in NFL physicians (22%) than in NCAA physicians (7%). The amount of time varied up to more than 4 weeks (Figure 4).
Elbow Ulnar Collateral Ligament Tears
A majority of respondents indicated they would treat a complete elbow ulnar collateral ligament (UCL) tear in a quarterback; a much smaller percentage preferred operative repair in athletes playing other positions (Table 6).
Thumb Ulnar Collateral Ligament Tears
For athletes with in-season thumb UCL tears, 63% of NFL and 54% of NCAA physicians indicated they cast the thumb and allowed return to play. Others recommended operative repair and either cast the thumb and allowed return to play (NFL, 30%; NCAA, 41%) or let the thumb heal before allowing return to play (NFL, 7%; NCAA, 5%).
Fifth Metatarsal Fractures
For a large majority of physicians (NFL, 100%; NCAA, 94%), the preferred treatment for fifth metatarsal fractures was screw fixation.
Tibia Fractures
In the 5-year period before the survey, 43% of NFL and 75% of NCAA physicians managed at least one tibia fracture (P < .001) (Figure 7).
Ketorolac Injections
Intramuscular ketorolac injections were frequently given to elite football players, significantly (P < .01) more so in the NFL (93%) than in the NCAA (62%). The average number of injections varied among physicians, though a significantly (P < .0001) higher percentage of NFL (79%) than NCAA (13%) physicians gave 5 or more injections per game.
Discussion
This survey on managing common injuries in elite football players had an overall response rate of 94%. All NFL divisions and NCAA conferences were represented in physicians’ responses. Ninety percent of NFL and 65% of NCAA head team physicians were orthopedists. These findings differ from those of Stockard1 (1997), who surveyed athletic directors at Division I schools and reported 45% of head team physicians were family medicine-trained and 41% were orthopedists.
Given the high visibility of team coverage and the economics of college football’s highest division, one might expect team physicians to receive financial remuneration. This was not the case, according to our survey: Only 30% of physicians received a monetary stipend for team coverage, and only 14% received advertising in exchange for their services. Twelve NCAA team physicians indicated they pay to be allowed to provide team coverage.
Injury Management
Anterior Cruciate Ligament Injuries. For NFL and NCAA team physicians, the preferred graft choice for ACL reconstruction was patellar tendon autograft. This finding is similar to what Erickson and colleagues2 reported from a survey of NFL and NCAA team physicians: 86% of surgeons preferred bone–patellar tendon–bone (BPTB) autograft. However, only 1 surgeon (0.7%) in that study, vs 16% in ours, preferred allograft. Allograft use may be somewhat controversial, as relevant data on competitive athletes are lacking, and it has been shown that the graft rupture rate3 is higher for BPTB allograft than for BPTB autograft in young patients. However, much of the data on higher failure rates with use of allograft in young patients4,5 has appeared since our data were collected.
Our return-to-play data are similar to data from other studies.2,6 According to our survey, the most common length of time from ACL reconstruction to return to football was 6 months, and 94% of team physicians allowed return to football by 9 months. In the survey by Erickson and colleagues,2 55% of surgeons waited a minimum of 6 months before returning athletes to play, and only 12% waited at least 9 months. In the study by Bradley and colleagues6 (2002), 84% of surgeons waited at least 6 months before returning athletes to play. Of note, we found a significantly higher percentage of NCAA football players than NFL players returning within 6 months after surgery. The difference may be attributable to a more cautious approach being taken with NFL players, whereas most NCAA players are limited in the time remaining in their football careers and want to return to the playing field as soon as possible.
Shoulder Dislocations. Responses to the 5 survey questions on anterior shoulder dislocation showed little consensus with respect to management. The exception pertained to use of a harness for in-season return to play with a dislocation—92% of physicians preferred management with a harness. Of note, 7 of 10 team surgeons performed anterior stabilization through an arthroscopic approach. Despite historical recommendations to perform open anterior stabilization in collision athletes, NFL and NCAA physicians’ practice patterns have evolved.7 Although return to contact activity was varied among responses, 94% of physicians allowed return to contact within 6 months.
Acromioclavicular Joint Injuries. For college football players, AC joint injuries are the most common shoulder injuries.8 In the NFL Combine, the incidence of AC joint injuries was 15.7 per 100 players.8 Several studies have cited favorable results with nonoperative management of type III AC joint injuries.9-12 Nonoperative management was the preferred treatment in our study as well, yet 26% of surgeons still preferred operative treatment in quarterbacks. Opinions about operative repair of type III injuries in overhead athletes vary,13 but nonoperative management clearly is the preferred method for elite football players. A 2013 study by Lynch and colleagues14 found that only 2 of 40 NFL players with type III AC joint injuries underwent surgery.
For type I and II AC joint injuries that occur during a game, more than two-thirds of the NCAA team physicians in our study favored injecting a local anesthetic to reduce pain and allow return to play in the same game. An even larger majority indicated they gave a pregame injection of an anesthetic to allow play. Similar use of injections for AC joint injuries has been reported in Australian-rules football and rugby.15Medial Collateral Ligament Injuries. Whether bracing is prophylactic against MCL injuries is controversial.16 Some studies have found it effective.17,18 According to our survey, 89% of Division I football teams used prophylactic knee bracing, mainly in offensive linemen but frequently in defensive linemen, too. No schools used bracing in athletes who played skill positions, except quarterbacks. Six schools used bracing on a quarterback’s front leg.
The percentage of teams that used prophylactic MCL bracing was significantly higher in the NCAA than in the NFL. NCAA team physicians generally have more control over players and therefore can implement widespread use of this bracing.
Posterior Cruciate Ligament Injuries. These injuries are infrequent. According to Parolie and Bergfeld,19 only 2% of college football players at the NFL Combine had a PCL injury. Treatment in athletes remains controversial. Our survey showed physicians’ willingness to return players to competition within 4 weeks after grade I/II PCL injuries. There is no consensus on management or on postinjury bracing. In operative cases, however, the preferred graft is allograft, and the preferred repair method is the arthroscopic single-bundle technique. These findings mirror those of a 2004 survey of the Herodicus Society by Dennis and colleagues.20 Elbow Ulnar Collateral Ligament Tears. In throwing athletes with UCL tears, operative treatment has been recommended.21,22 A majority of our survey respondents preferred operative treatment for quarterbacks. However, operative treatment is still controversial, and quarterbacks differ from baseball players in their throwing motions and in the stresses acting on the UCLs during throwing. Two systematic reviews of UCL reconstruction have affirmed the positive outcomes of operative treatment in throwing athletes.21,22 However, most of the studies covered by these reviews focused on baseball players. In athletes playing positions other than quarterback, these injuries were typically treated nonoperatively.
Thumb Ulnar Collateral Ligament Tears. Our survey respondents differed in their opinions on treating thumb UCL tears. About half recommended cast treatment, and the other half recommended operative treatment. Previous data suggest that delaying surgical treatment may be deleterious to the eventual outcome.23,24Fifth Metatarsal Fractures. For fifth metatarsal fractures, screw fixation was preferred by 90% of our survey respondents—vs 73% of NFL team physicians in a 2004 study by Low and colleagues.25 What remains controversial is the length of time before return to play. Our most frequent response was 4 to 6 weeks, and 46% of our respondents indicated they would wait 7 weeks or longer. These times differ significantly from what Low and colleagues25 reported: 86% of their physicians allowed return to competition after 6 to 12 weeks.
Tibia Fractures. Management of tibia fractures in US football players has not been reported. Chang and colleagues26 described 24 tibial shaft fractures in UK soccer players. Eleven fractures (~50%) were treated with intramedullary nails, 2 with plating, and 11 with conservative management. All players returned to activity, the operative group at 23.3 weeks and the nonoperative group at 27.6 weeks. Our respondents reported treating at least 150 tibial shaft fractures in the 5-year period before our survey, demonstrating the incidence and importance of this type of injury. A vast majority of team surgeons (96%) opted for treatment with intramedullary nailing. This choice may reflect an ability to return to play earlier—the ability to move the knee and maintain strength in the legs. Some have suggested it is important to remove the nail before the player returns to the football field, but this was not common practice among our groups of team surgeons. Other studies have not found any advantage to tibial nail removal.27Ketorolac Injections. Authors have described using ketorolac for the treatment of acute or pregame pain in professional football players.28-30 According to a 2000 survey, 93% of NFL teams used intramuscular ketorolac, and on average 15 players per team were treated, primarily on game day. Our survey found frequent use of ketorolac, with almost two-thirds of team orthopedists indicating pregame use. Ketorolac use was popular, particularly because of its effect in reducing postoperative pain and its potent effect in reducing pain on game day. However, injections by football team physicians have declined significantly in recent years, ever since an NFL Physician Society task force published recommendations on ketorolac use.31
Conclusion
There is a wide variety of patterns in treating athletes who play football at the highest levels of competition. Our findings can initiate further discussion on these topics and assist orthopedists providing game coverage at all levels of play in their decision-making process by helping to define the standard of care for their injured players.
Am J Orthop. 2016;45(6):E319-E327. Copyright Frontline Medical Communications Inc. 2016. All rights reserved.
1. Stockard AR. Team physician preferences at National Collegiate Athletic Association Division I universities. J Am Osteopath Assoc. 1997;97(2):89-95.
2. Erickson BJ, Harris JD, Fillingham YA, et al. Anterior cruciate ligament reconstruction practice patterns by NFL and NCAA football team physicians. Arthroscopy. 2014;30(6):731-738.
3. Kraeutler MJ, Bravman JT, McCarty EC. Bone-patellar tendon-bone autograft versus allograft in outcomes of anterior cruciate ligament reconstruction: a meta-analysis of 5182 patients. Am J Sports Med. 2013;41(10):2439-2448.
4. Bottoni CR, Smith EL, Shaha J, et al. Autograft versus allograft anterior cruciate ligament reconstruction: a prospective, randomized clinical study with a minimum 10-year follow-up. Am J Sports Med. 2015;43(10):2501-2509.
5. Sun K, Tian S, Zhang J, Xia C, Zhang C, Yu T. Anterior cruciate ligament reconstruction with BPTB autograft, irradiated versus non-irradiated allograft: a prospective randomized clinical study. Knee Surg Sports Traumatol Arthrosc. 2009;17(5):464-474.
6. Bradley JP, Klimkiewicz JJ, Rytel MJ, Powell JW. Anterior cruciate ligament injuries in the National Football League: epidemiology and current treatment trends among team physicians. Arthroscopy. 2002;18(5):502-509.
7. Rhee YG, Ha JH, Cho NS. Anterior shoulder stabilization in collision athletes: arthroscopic versus open Bankart repair. Am J Sports Med. 2006;34(6):979-985.
8. Brophy RH, Barnes R, Rodeo SA, Warren RF. Prevalence of musculoskeletal disorders at the NFL Combine—trends from 1987 to 2000. Med Sci Sports Exerc. 2007;39(1):22-27.
9. Bishop JY, Kaeding C. Treatment of the acute traumatic acromioclavicular separation. Sports Med Arthrosc. 2006;14(4):237-245.
10. Mazzocca AD, Arciero RA, Bicos J. Evaluation and treatment of acromioclavicular joint injuries. Am J Sports Med. 2007;35(2):316-329.
11. Schlegel TF, Burks RT, Marcus RL, Dunn HK. A prospective evaluation of untreated acute grade III acromioclavicular separations. Am J Sports Med. 2001;29(6):699-703.
12. Spencer EE Jr. Treatment of grade III acromioclavicular joint injuries: a systematic review. Clin Orthop Relat Res. 2007;(455):38-44.
13. Kraeutler MJ, Williams GR Jr, Cohen SB, et al. Inter- and intraobserver reliability of the radiographic diagnosis and treatment of acromioclavicular joint separations. Orthopedics. 2012;35(10):e1483-e1487.
14. Lynch TS, Saltzman MD, Ghodasra JH, Bilimoria KY, Bowen MK, Nuber GW. Acromioclavicular joint injuries in the National Football League: epidemiology and management. Am J Sports Med. 2013;41(12):2904-2908.
15. Orchard JW. Benefits and risks of using local anaesthetic for pain relief to allow early return to play in professional football. Br J Sports Med. 2002;36(3):209-213.
16. Salata MJ, Gibbs AE, Sekiya JK. The effectiveness of prophylactic knee bracing in American football: a systematic review. Sports Health. 2010;2(5):375-379.
17. Albright JP, Powell JW, Smith W, et al. Medial collateral ligament knee sprains in college football. Effectiveness of preventive braces. Am J Sports Med. 1994;22(1):12-18.
18. Sitler M, Ryan J, Hopkinson W, et al. The efficacy of a prophylactic knee brace to reduce knee injuries in football. A prospective, randomized study at West Point. Am J Sports Med. 1990;18(3):310-315.
19. Parolie JM, Bergfeld JA. Long-term results of nonoperative treatment of isolated posterior cruciate ligament injuries in the athlete. Am J Sports Med. 1986;14(1):35-38.
20. Dennis MG, Fox JA, Alford JW, Hayden JK, Bach BR Jr. Posterior cruciate ligament reconstruction: current trends. J Knee Surg. 2004;17(3):133-139.
21. Purcell DB, Matava MJ, Wright RW. Ulnar collateral ligament reconstruction: a systematic review. Clin Orthop Relat Res. 2007;(455):72-77.
22. Vitale MA, Ahmad CS. The outcome of elbow ulnar collateral ligament reconstruction in overhead athletes: a systematic review. Am J Sports Med. 2008;36(6):1193-1205.
23. Fricker R, Hintermann B. Skier’s thumb. Treatment, prevention and recommendations. Sports Med. 1995;19(1):73-79.
24. Smith RJ. Post-traumatic instability of the metacarpophalangeal joint of the thumb. J Bone Joint Surg Am. 1977;59(1):14-21.
25. Low K, Noblin JD, Browne JE, Barnthouse CD, Scott AR. Jones fractures in the elite football player. J Surg Orthop Adv. 2004;13(3):156-160.
26. Chang WR, Kapasi Z, Daisley S, Leach WJ. Tibial shaft fractures in football players. J Orthop Surg Res. 2007;2:11.
27. Karladani AH, Ericsson PA, Granhed H, Karlsson L, Nyberg P. Tibial intramedullary nails—should they be removed? A retrospective study of 71 patients. Acta Orthop. 2007;78(5):668-671.
28. Eichner ER. Intramuscular ketorolac injections: the pregame Toradol parade. Curr Sports Med Rep. 2012;11(4):169-170.
29. Nepple JJ, Matava MJ. Soft tissue injections in the athlete. Sports Health. 2009;1(5):396-404.
30. Powell ET, Tokish JM, Hawkins RJ. Toradol use in the athletic population. Curr Sports Med Rep. 2002;1(4):191.
31. Matava M, Brater DC, Gritter N, et al. Recommendations of the National Football League physician society task force on the use of toradol® ketorolac in the National Football League. Sports Health. 2012;4(5):377-383.
Quality Measure Attainment After Add-on Therapy of Both Saxagliptin and Dapagliflozin to Metformin Versus Single Add-On of Saxagliptin or Dapagliflozin
From the Ochsner Diabetes Clinical Research Unit, Frank Riddick Diabetes Institute, Department of Endocrinology, Ochsner Medical Center, New Orleans, LA (Dr. Blonde), and AstraZeneca, Gaithersburg, MD (Drs. Sheehan, Barrett, and Garcia-Sanchez).
Abstract
- Objective: To evaluate diabetes care quality measure attainment, specifically, blood glucose and blood pressure (BP) control, with saxagliptin, a dipeptidyl peptidase-4 inhibitor, and dapagliflozin, a sodium-glucose cotransporter-2 inhibitor, added singly or as dual add-on therapy in patients with type 2 diabetes inadequately controlled with metformin alone.
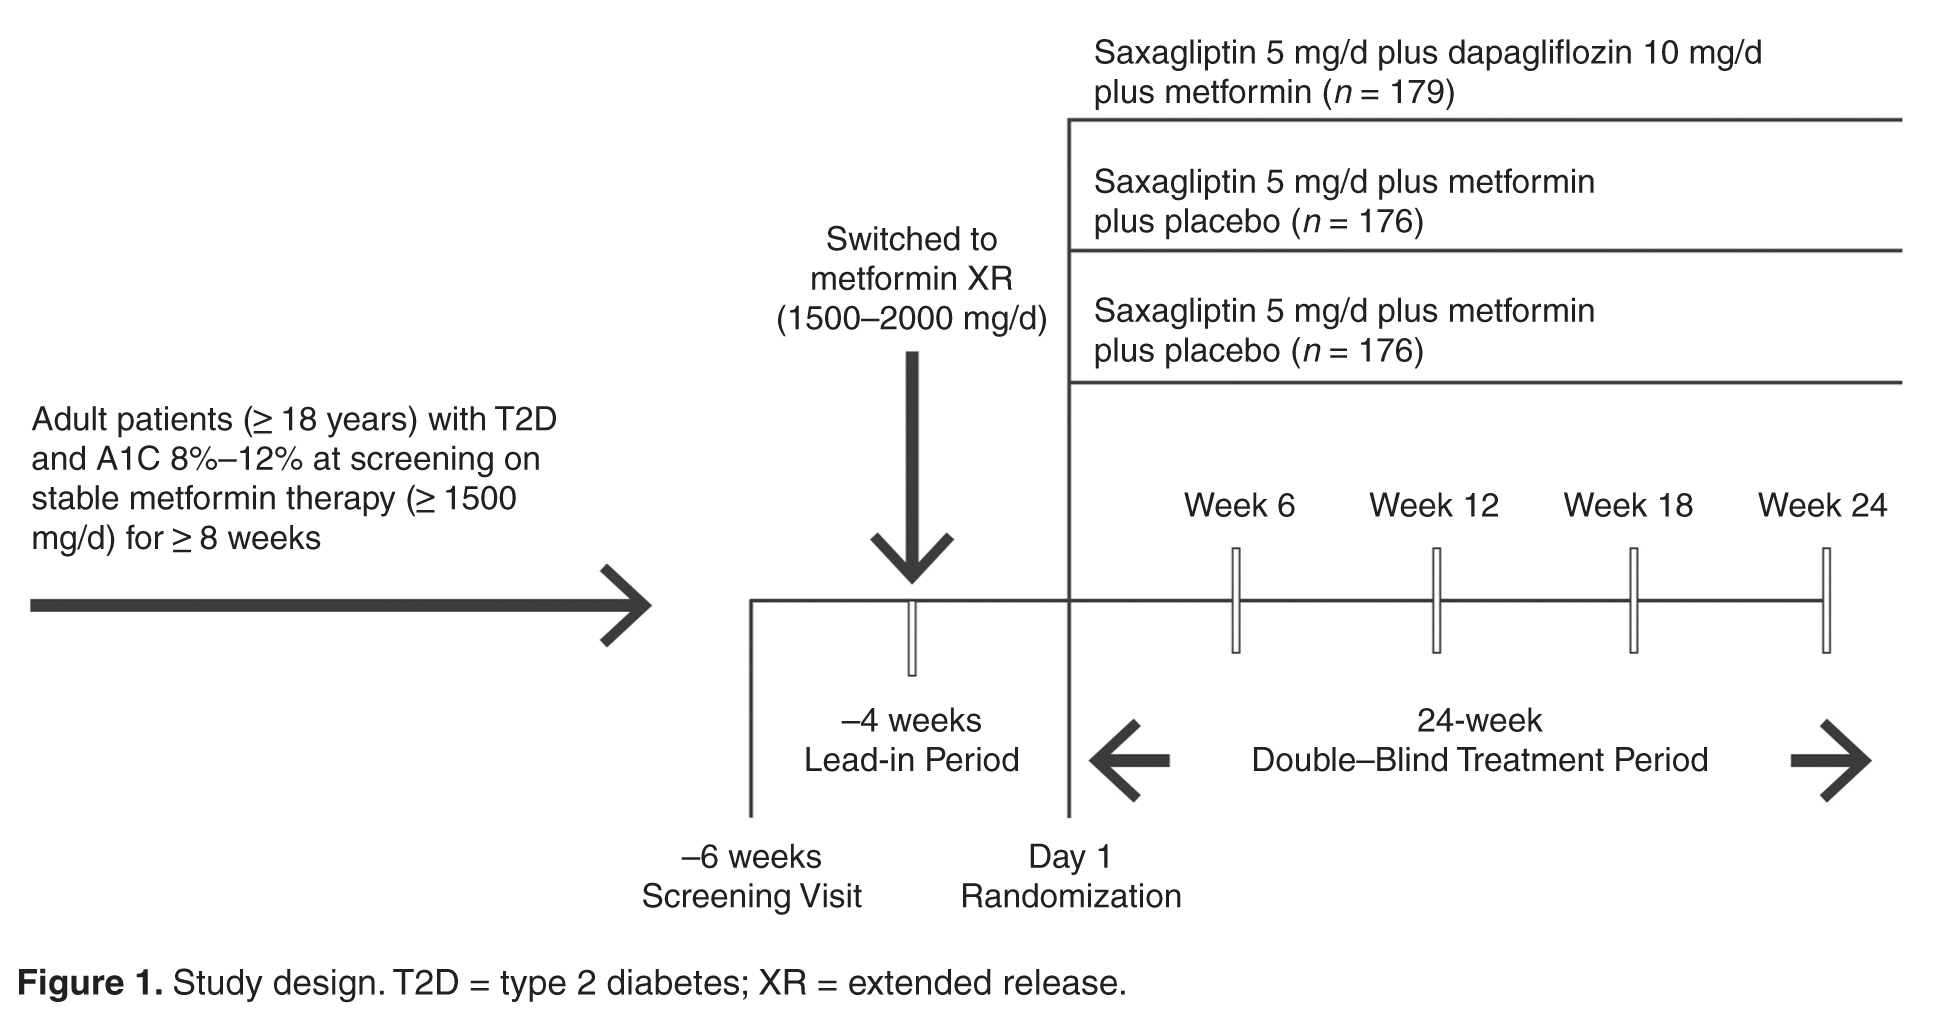
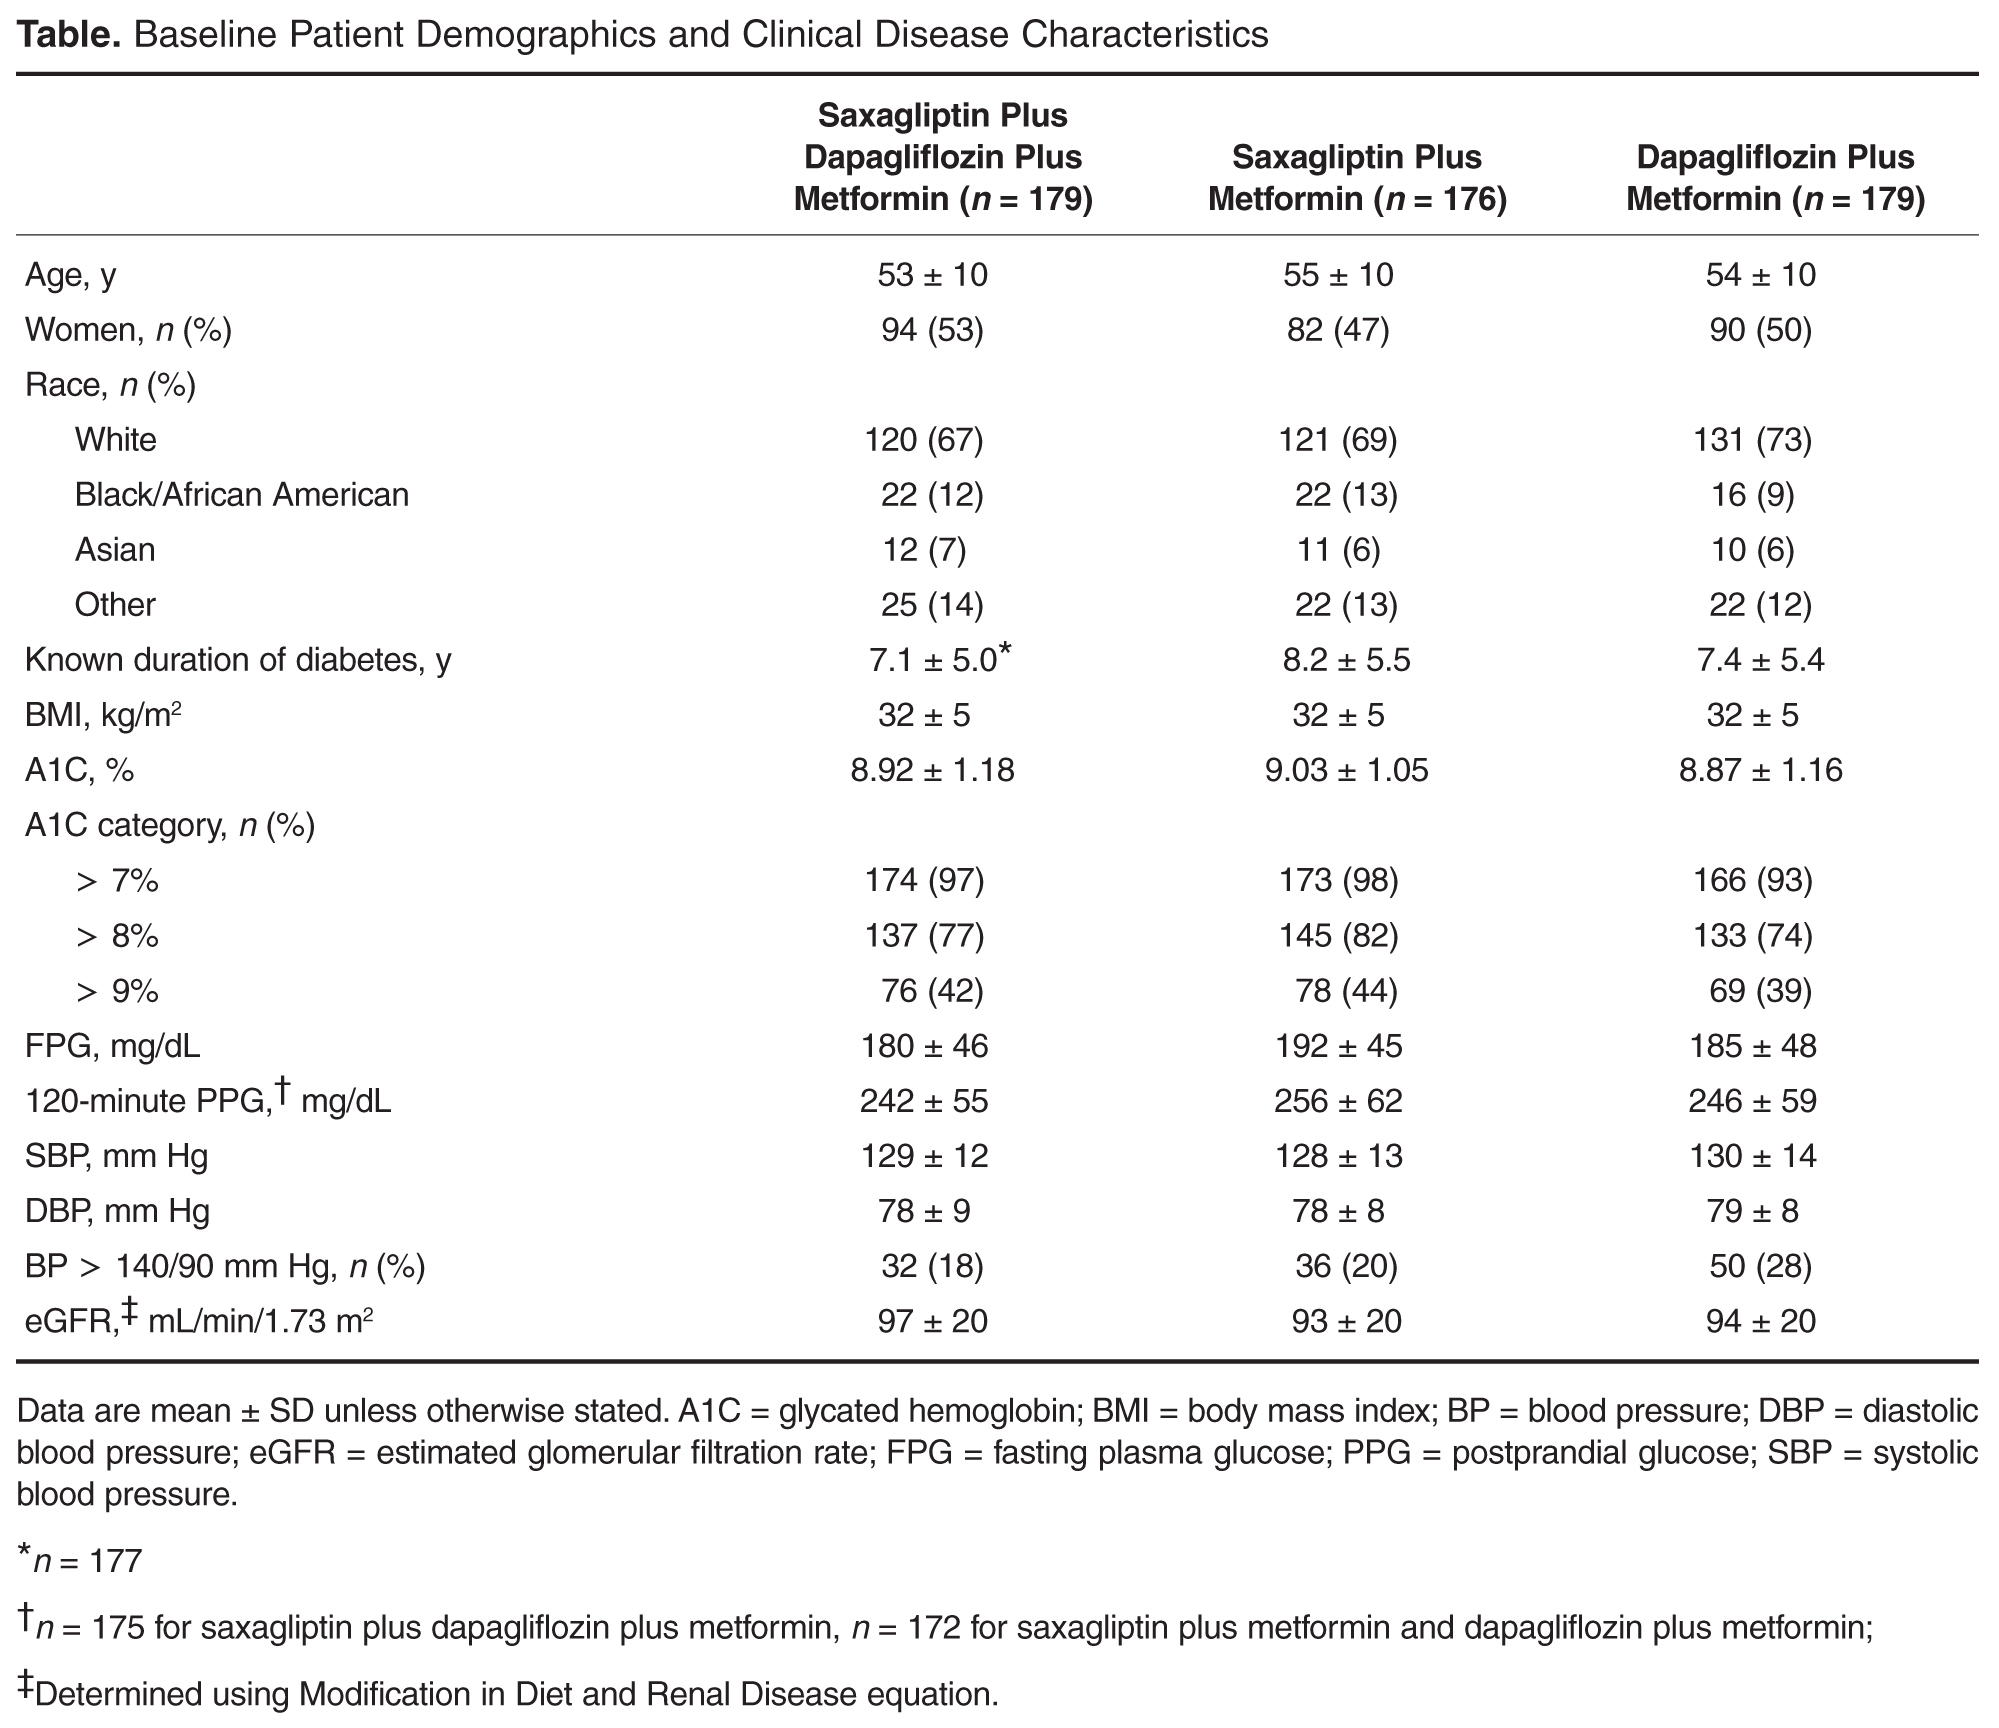
- Methods: Analysis of a phase 3, randomized, double-blind, active-controlled, parallel-group trial was conducted. Patients were randomized 1:1:1 to receive saxagliptin 5 mg/d plus dapagliflozin 10 mg/d, saxagliptin 5 mg/d, or dapagliflozin 10 mg/d as add-on to metformin 1500 to 2000 mg/d. Assessments included attainment of individual and composite glycated hemoglobin (A1C) and BP measures at 24 weeks of treatment.
- Results: Compared with single add-on saxagliptin or dapagliflozin, dual add-on saxagliptin plus dapagliflozin to metformin was associated with significantly more patients attaining the individual quality measures of A1C < 7% and A1C < 8%. Similarly, dual add-on saxagliptin plus dapagliflozin was associated with significantly more patients attaining the composite quality measures A1C < 7% and BP < 140/90 mm Hg and A1C < 8% and BP < 140/90 mmHg (vs saxagliptin plus metformin).
- Conclusion: Dual add-on saxagliptin plus dapagliflozin to metformin was associated with a higher proportion of patients achieving glycemic and BP quality measures compared with single add-on saxagliptin or dapagliflozin.
Assessment of performance is a focus of many health care organizations as a means to evaluate and improve the quality of health care. Standardized performance measures have been developed to improve quality of care as well as to allow for comparative assessment of health plans and to support pay for performance models [1]. A widely used set of performance measures is the Healthcare Effectiveness Data and Information Set or HEDIS [2,3], measures that are maintained by the National Committee for Quality Assurance [4,5] and used by most US health plans [6].
Type 2 diabetes (T2D) is a focus of quality measure assessment and performance improvement because of its high prevalence, substantial personal and economic impact on society, high morbidity and mortality, and because it is a condition that requires coordinated care. Important outcome measures for diabetes include blood glucose control and blood pressure (BP) control. HEDIS measures for T2D include a glycated hemoglobin (A1C) > 9%, indicating poor glucose control, < 8%, indicating good control, and < 7%, a more stringent measure of good glycemic control. The HEDIS measure for BP in T2D is < 140/90 mm Hg, which is considered good BP control. All of these HEDIS measures are currently or were previously (A1C < 7%) endorsed by the National Quality Forum [1,7–10]. Endorsement of a quality measure by the NQF indicates that the measure has been thoroughly evaluated, meets specific criteria, and is based on recognized standards of care grounded in evidence-based medicine [1].
A number of oral agents are utilized in the treatment of diabetes. Saxagliptin, an oral dipeptidyl peptidase-4 (DPP-4) inhibitor, and dapagliflozin, an oral sodium-glucose cotransporter-2 (SGLT-2) inhibitor, are indicated as adjuncts to diet and exercise in adults with T2D [11,12]. Saxagliptin inhibits DPP-4, and thereby reduces fasting and postprandial glucose concentrations by preventing degradation of the incretin hormones, glucagon-like peptide-1 and glucose-dependent insulinotropic polypeptide [13]. Dapagliflozin reduces blood glucose concentrations by inhibiting glucose reabsorption in the proximal tubule of the kidney, which results in enhanced urinary glucose excretion [14]. Because their mechanisms of action are glucose-dependent, both saxagliptin and dapagliflozin have a low intrinsic potential to cause hypoglycemia [13,14]. In a randomized, double-blind study of patients with T2D inadequately controlled with metformin, Rosenstock et al assessed the efficacy and safety of dual add-on of saxagliptin plus dapagliflozin versus saxagliptin and dapagliflozin added on alone (ClinicalTrials.gov identifier, NCT01606007) [15]. The dual add-on therapy resulted in a greater adjusted mean reduction from baseline in A1C at week 24 (–1.47%) compared with either saxagliptin (–0.88%) or dapagliflozin (–1.20%) alone added to metformin; the difference for dual add-on saxagliptin plus dapagliflozin to metformin vs. single add-on saxagliptin and single add-on dapagliflozin was –0.59% (P < 0.001) and –0.27% (P = 0.0166), respectively. The incidence of adverse events was similar across the 3 treatment groups, and hypo-glycemia was infrequent (1%), with no reports of severe hypoglycemia events (symptomatic events with glucose ≤ 54 mg/dL requiring assistance).
In this paper, we assess the attainment of diabetes quality measures among patients in this study, specifically, measures of glycemic and BP control.
Methods
Study Design and Patients
Quality Measure Assessment
Individual measures assessed included the proportion of patients with A1C < 7%, A1C < 8%, A1C > 9%, and BP < 140/90 mm Hg. Composite measures assessed includedthe proportion of patients with A1C < 7% and BP < 140/90 mm Hg and the proportion of patients with A1C < 8% and BP < 140/90 mm Hg.
Antihypertensive or cholesterol-lowering medication use was not controlled for in this study. Patients were maintained on their prescribed dosing regimen for antihypertensive and cholesterol-lowering medications, with adjustments as needed per the standard of care for their diagnosis. Treatment outcomes for A1C < 7%, < 8%, or > 9% were prespecified. The BP treatment outcome was also prespecified per the statistical analysis plan; however, a change to the HEDIS quality measure treatment outcome for BP during the clinical study resulted in this analysis being no longer relevant. Therefore, analyses of the currently endorsed quality measures for BP were conducted post hoc. Quality measure assessments for A1C and BP treatment outcomes were conducted using data from the 24-week, double-blind treatment period.
Statistical Analysis
P values for the differences in proportion of patients with individual treatment outcomes and composite treatment outcomes with saxagliptin plus dapagliflozin plus metformin versus saxagliptin plus metformin or dapagliflozin plus metformin were calculated using Fisher’s exact test. The numerator and denominator for each percentage are the number of responders and the number of patients with non-missing values in the treatment group at the corresponding baseline category, respectively, and are not corrected for baseline A1C. Because some patients experienced improvement in A1C during the lead-in period and could have already been at treatment goal at baseline, a sensitivity analysis excluding these patients was completed. Results are presented for the total number of patients with non-missing values in the treatment group, as well as patients with non-missing values in the treatment group who did not meet quality measure criteria at baseline. The number needed to treat (NNT) was calculated for all comparisons reaching statistical significance.
Results
Patients
Individual Quality Measures
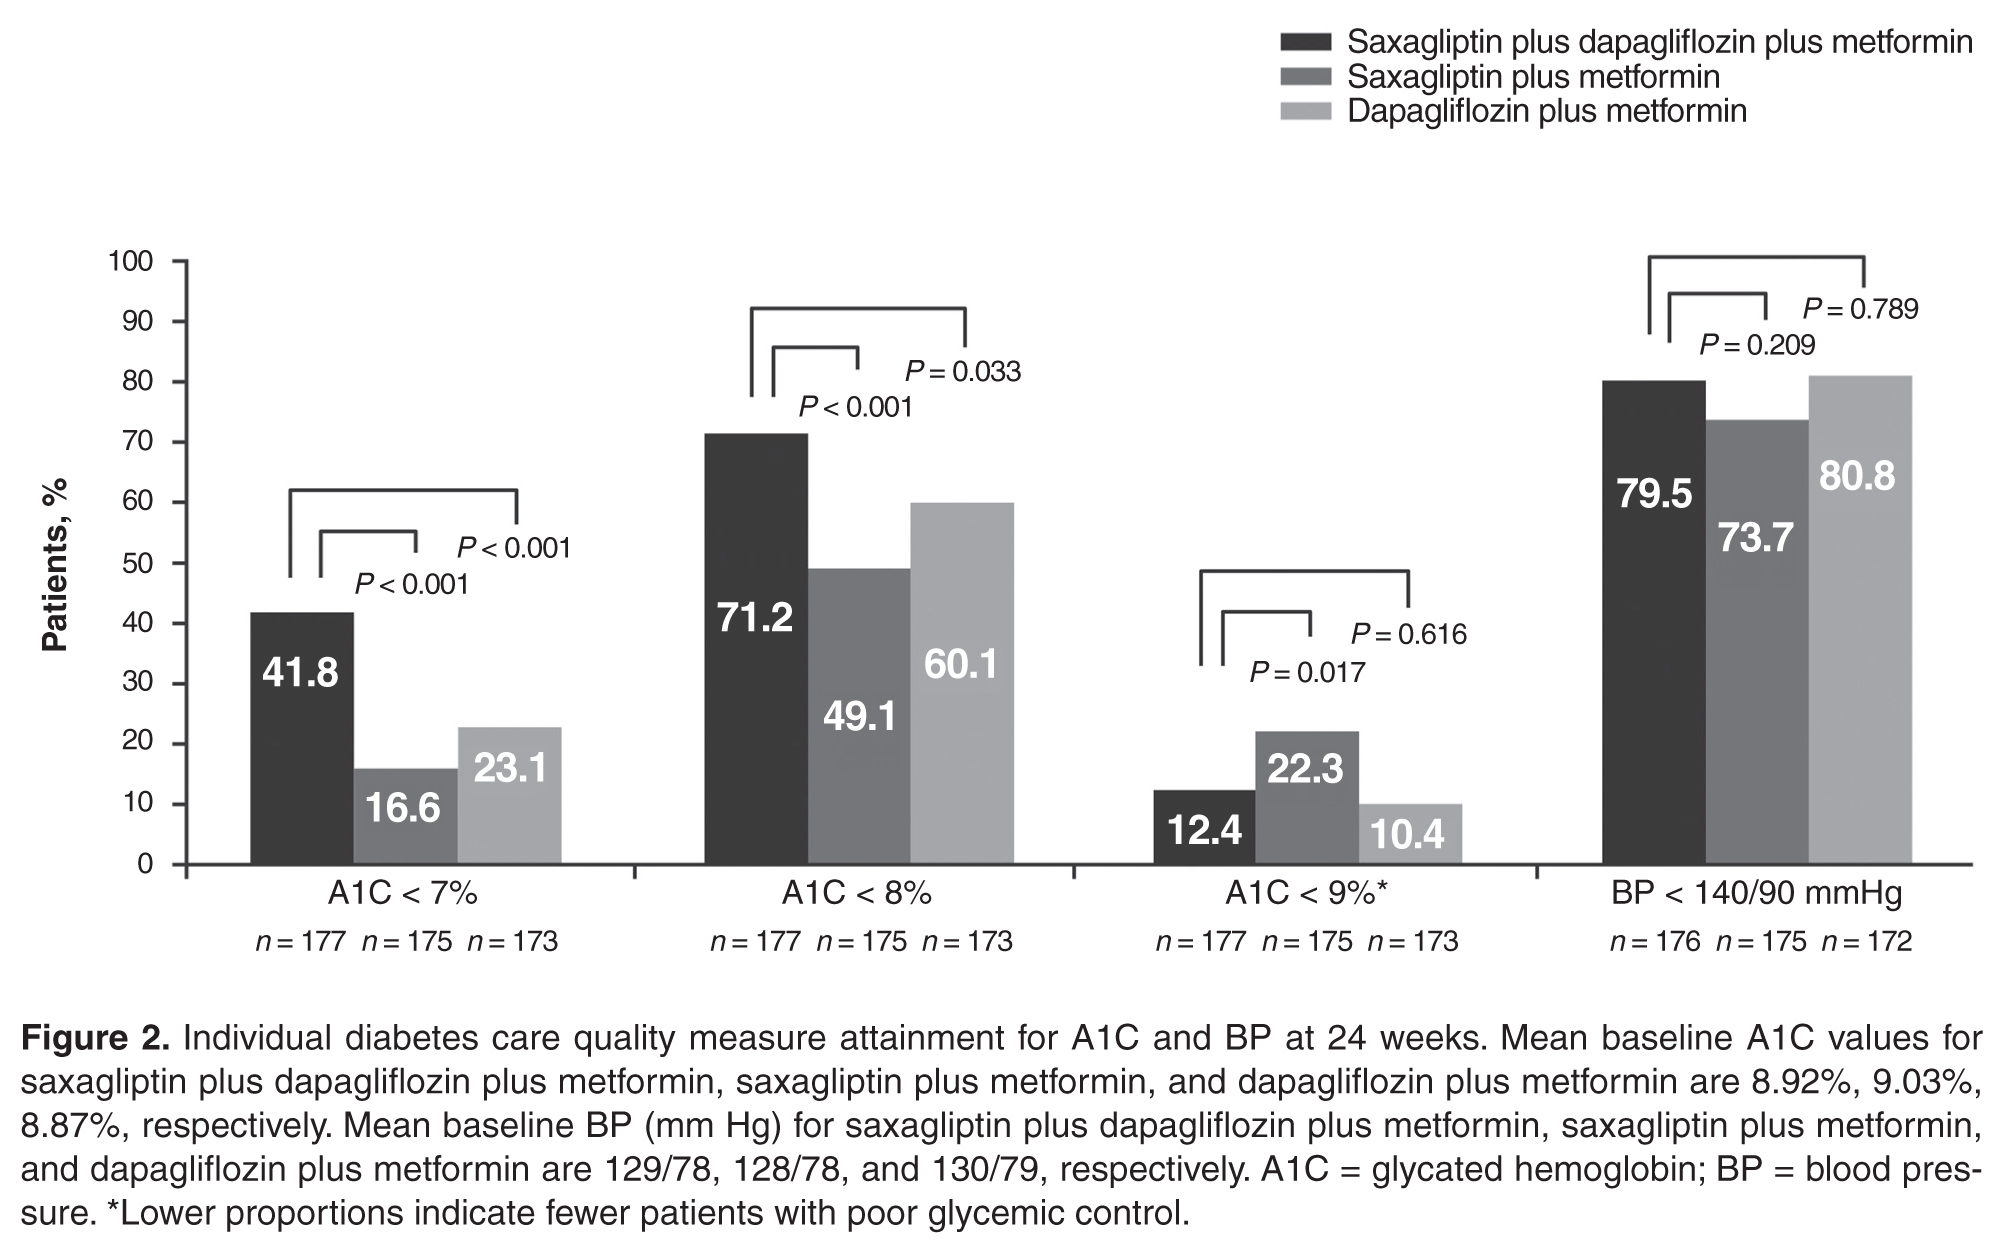
The dual addition of saxagliptin plus dapagliflozin to metformin resulted in a significantly greater proportion of patients achieving A1C < 8.0% compared with saxagliptin plus metformin (71.2% vs 49.1%; P < 0.001; NNT 5 [95% CI 3–8]) or dapagliflozin plus metformin (60.1%; P = 0.033; NNT 9 [95% CI 5–85]; Figure 2). Similar results (proportions of patients: 66.4% vs 40.0% vs 51.9%; P ≤ 0.02; NNTs 4 [95% CI 3–7]) and 7 [95% CI 4–34]) were attained when the analysis excluded patients with baseline A1C < 8.0%.
Significantly fewer patients had A1C > 9% (a measure of poor glycemic control) with saxagliptin plus dapagliflozin plus metformin (12.4%) compared with saxagliptin plus metformin (22.3%; P = 0.017; NNT –10 [95% CI –50 to –6]; Figure 2). The proportion of patients with A1C > 9% was similar for both regimens that included dapagliflozin (12.4% vs 10.4%; P = 0.616).
No significant difference was observed among treatment groups in the proportion of patients with BP < 140/90 mm Hg (Figure 2). However, most patients had BP < 140/90 mm Hg (72%–82%) at baseline, which was generally maintained at week 24.
Composite Quality Measures
Discussion
This post hoc analysis evaluated attainment of glycemic and BP quality measures for diabetes. A significantly greater proportion of patients achieved the individual quality measures of A1C < 7% and A1C < 8% with dual add-on saxagliptin plus dapagliflozin to metformin compared with single add-on saxagliptin or dapagliflozin to metformin after 24 weeks. Similar results were seen when the analysis excluded patients with A1C < 7% and < 8% at baseline. All measures of good glycemic control had clinically relevant NNTs ≤ 10 after 24 weeks with saxagliptin plus dapagliflozin plus metformin compared with saxagliptin or dapagliflozin plus metformin, regardless of baseline status. Very few patients experienced lackof improvement in glycemic control, evidenced by small proportions of patients with A1C > 9%.
There was little difference in BP between dual add-on saxagliptin plus dapagliflozin or single add-on saxagliptin or dapagliflozin to metformin. The proportion of patients who attained the BP quality measure of BP < 140/90 mm Hg was similar across the 3 treatments, as might be expected because most patients already met this target at baseline. However, as might be expected based on the mild diuretic effect and weight loss associated with SGLT-2 inhibitors [16,17], trends in BP favored groups treated with dapagliflozin.
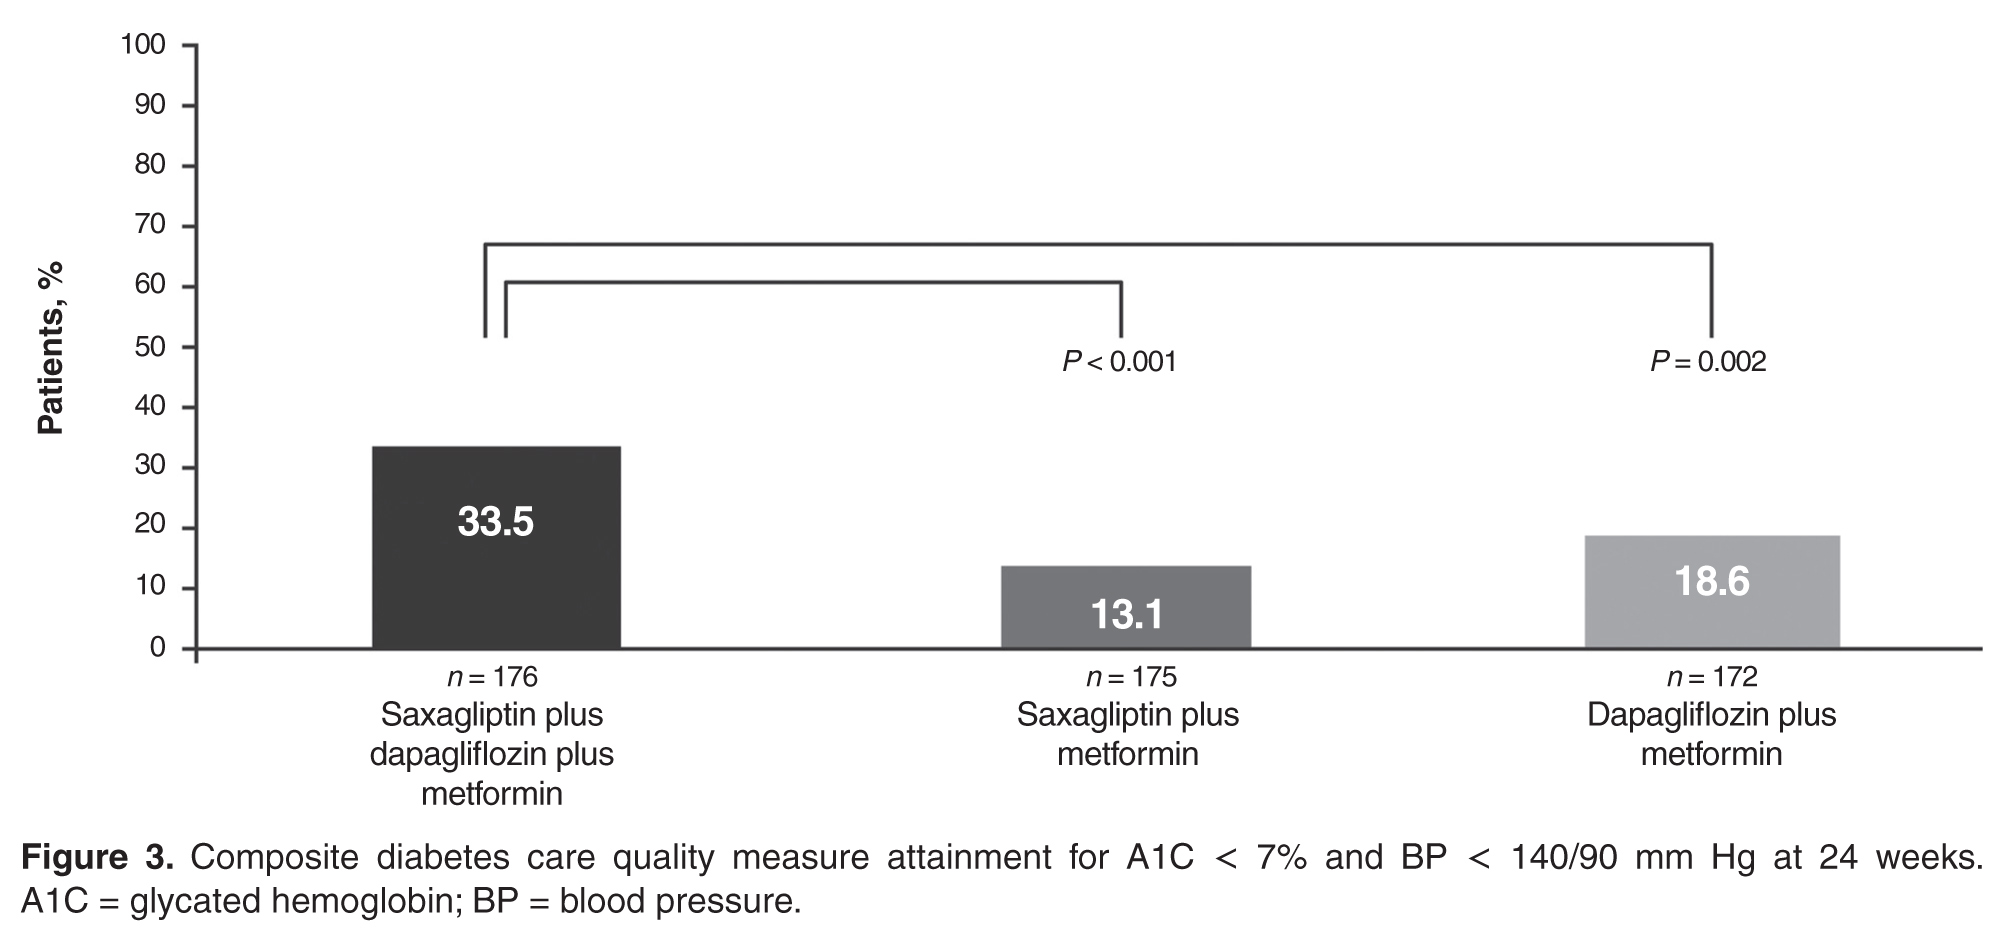
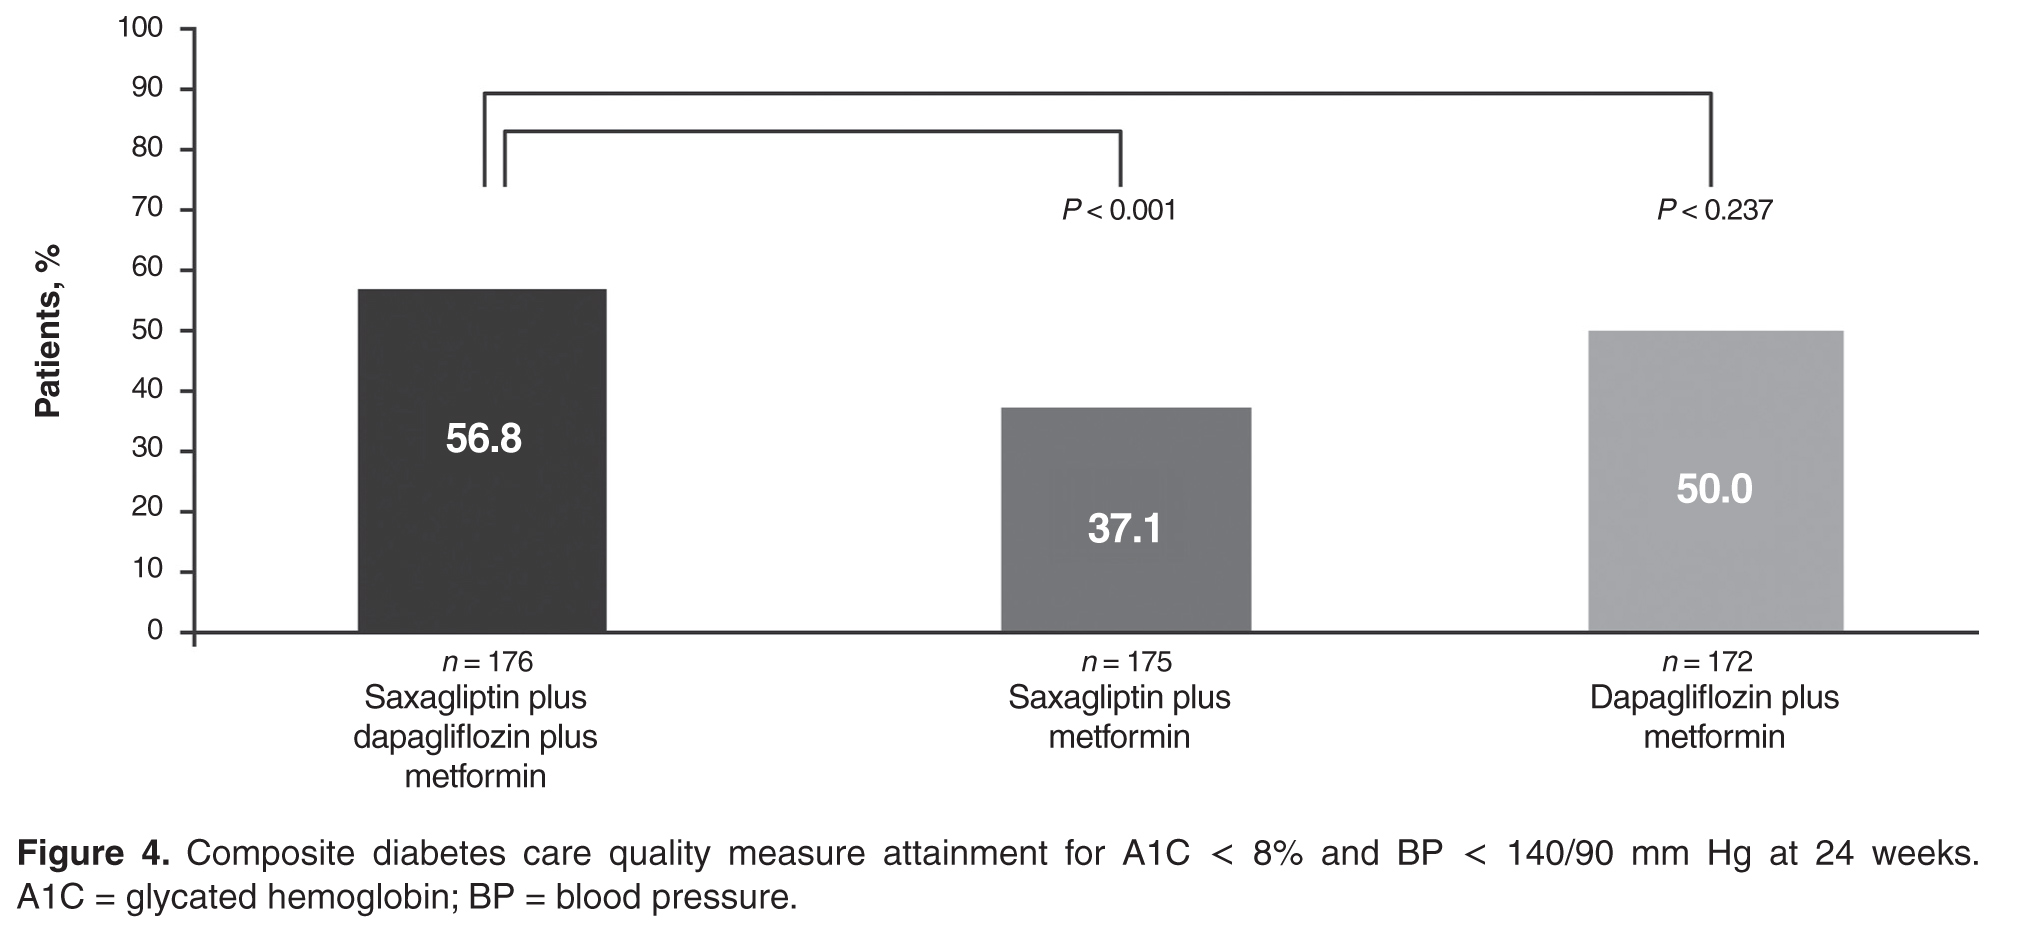
Attainment of multiple treatment targets is desirable in reducing complications of diabetes. A significantly greater proportion of patients achieved both A1C < 7% and BP < 140/90 mm Hg when both saxagliptin and dapagliflozin were added to metformin compared with single-agent addition of either saxagliptin or dapagliflozin plus metformin. Similarly, a significantly greater proportion of patients achieved both A1C < 8% and BP < 140/90 mm Hg with dual addition of saxagliptin and dapagliflozin plus metformin compared with saxagliptin plus metformin. There was also a numerically greater number of patients who achieved both of these goals with triple therapy compared with dapagliflozin plus metformin, but this finding did not reach statistical significance. Clinically relevant NNT values ≤ 10 were observed for both composite outcomes for saxagliptin plus dapagliflozin plus metformin compared with saxagliptin plus metformin or dapagliflozin plus metformin after 24 weeks.
Despite advances in the medical management of T2D, a report published in 2013 showed that between 2007 and 2010, only 53% of patients achieved an A1C < 7.0% and only 19% simultaneously achieved all 3 American Diabetes Association (ADA) goals recommended for most patients at that time: A1C < 7.0%, BP < 130/80 mm Hg, and low-density lipoprotein cholesterol LDL-C < 100 mg/dL [18]. These data highlight a need for new approaches to help patients attain glycemic, BP, and cholesterol goals. Our results demonstrated that a higher proportion of patients attained glycemic and BP quality measures with dual add-on saxagliptin plus dapagliflozin compared with single add-on saxagliptin or dapagliflozin to metformin. As a result of recent updates for cholesterol management from the American College of Cardiology and the American Heart Association [19], attainment of a cholesterol level was retired as a diabetes quality measure and replaced with a recommendation for statin therapy use [20,21]. Although the current analysis did not include assessment of LDL, DPP-4 inhibitors have demonstrated neutral effects on lipids [22,23], and SGLT-2 inhibitors have demonstrated generally modest increases in LDL-C (placebo-adjusted change from baseline: 4.5%–8.0% for canagliflozin 100 and 300 mg/d, 3.9% for dapagliflozin 10 mg, and 2.3%–4.2% for empagliflozin 10 and 25 mg/d) [12,24,25], as well as increases in high-density lipoprotein cholesterol and reductions in triglycerides [26].
Current ADA guidelines recommend an individualized, stepwise approach to treatment with sequential addition of single oral antihyperglycemic agents for patients who do not achieve their glycemic goal in 3 months [27]. Although T2D may progress at different rates in different patients, T2D does generally progress over time [28], and the ADA and American Association of Clinical Endocrinologists treatment guidelines recommend initial dual add-on therapy for individuals with higher A1C, which is suggestive of more advanced disease [27,29]. For individuals requiring initial combination therapy, guidelines note that antihyperglycemic agents that have a low risk of hypoglycemia and low potential for weight gain should be preferentially selected [29]. Attainment of A1C ≤ 7%, the guideline recommendation considered appropriate for many patients, is associated with reductions in microvascular disease and, if attained soon after diagnosis of diabetes, studies have shown reductions in macrovascular disease with long-term follow-up [27,30,31]. However, it may be challenging to achieve A1C < 7% with the addition of single oral antihyperglycemic agents, especially in patients with higher A1C [32]. Less stringent A1C goals (eg, A1C < 8%) may be appropriate in individuals with a long duration of diabetes that is difficult to control, history of severe hypoglycemia, limited life expectancy, numerous comorbidities, and extensive complications or comorbidities, especially cardiovascular disease [27]. Given the shift toward individualized treatment plans with patient-specific treatment goals, it is valuable to understand how different treatment strategies effect attainment of guideline-recommended less stringent and more stringent glycemic targets that may be appropriate for certain patients.
In addition to quality measures that assess glucose lowering with pharmacotherapy, it is important to consider measures that assess other aspects of diabetes care. For example, quality measures related to hypoglycemia and hyperglycemia may help avoid potentially adverse glucose levels, and quality measures related to weight may provide insight on treatment and lifestyle efforts directed at weight loss and management. NQF-endorsed measures of hypoglycemia and hyperglycemia are currently moving through annual review and are paired measures, intended to be interpreted with respect to one another to ensure balanced outcomes [33,34]. This underscores the value of efficacious antihyperglycemic agents with low intrinsic potential for hypoglycemia. Although this analysis did not include quality measures related to hypoglycemia or weight, future studies evaluating these aspects of diabetes care will likely further contribute to a more comprehensive and holistic treatment approach.
In addition to assessing a broad range of quality measures, an important aspect of care to consider is patient affordability. Affordability for an individual patient will depend on access in the patient’s individual plan, the financial resources of the patient, and the potential for medical cost offsets from improved control of the patient’s disease. For example, fixed-dose combination products are associated with increased patient adherence and may increase pharmacy costs but decrease medical costs [35].
Limitations of this study include the post hoc design and that quality measure attainment was assessed over a shorter duration of time (24 weeks) than is commonly assessed in the real-world/community setting (~12 months).
Dual add-on therapy with oral antihyperglycemic agents that have complementary mechanisms of action should lead to enhanced reductions in A1C. The results reported here and from the primary study, in which saxagliptin and dapagliflozin added to metformin significantly reduced mean A1C from baseline to week 24 compared with single add-on saxagliptin or dapagliflozin [15], showed that greater reductions in A1C were attained with the coadministration of saxagliptin and dapagliflozin. The glucuretic effect of SGLT-2 inhibitors has been associated with increased plasma glucagon concentrations and increased endogenous glucose production, which may impair the full glucose-lowering potential of SGLT-2 inhibitors [36,37]. Administering saxagliptin with dapagliflozin as dual therapy was shown to blunt the rise in plasma glucagon caused by dapagliflozin [38], and this may have contributed to the greater glucose control achieved with dual add-on of these 2 antihyperglycemic drugs [15].
By targeting multiple aspects of the underlying pathophysiology in T2D, greater improvements in A1C can be achieved. Dual add-on saxagliptin plus dapagliflozin to metformin resulted in a greater proportion of patients achieving NQF-endorsed HEDIS quality measures, as well as A1C < 7% (no longer an NQF-endorsed measure). As health care shifts to a more value-based payment structure, measuring quality outcomes will assume a greater role in guiding decision making and influence the care that patients receive. Understanding how antihyperglycemic medication regimens affect quality measures can help clinicians make informed decisions.
Corresponding author: Lawrence Blonde, MD, Ochsner Diabetes Clinical Research Unit, Frank Riddick Diabetes Institute, Department of Endocrinology, Ochsner Medical Center, New Orleans, LA.
Funding/support: This study was supported by AstraZeneca. Medical writing support for the preparation of this manuscript was provided by Lauren D’Angelo, PhD, and Janet Matsuura, PhD, from Complete Healthcare Communications, LLC (Chadds Ford, PA), with funding from AstraZeneca.
Financial disclosures: Dr. Blonde has received grant and research support from AstraZeneca, Jansen Pharmaceuticals, Lexicon Pharmaceuticals, Merck, Novo Nordisk, and Sanofi-Aventis and has received honoraria for participating as a speaker from AstraZeneca, Janssen Pharmaceuticals, Merck, Novo Nordisk, and Sanofi-Aventis as well as honoraria for consultant work from AstraZeneca, GlaxoSmithKline, Intarcia Therapeutics, Janssen Pharmaceuticals, Merck, Novo Nordisk, and Sanofi-Aventis. R. Garcia-Sanchez is an employee of AstraZeneca. J. Sheehan and Y. C. Barrett were employees of AstraZeneca at the time of this research.
1. National Quality Forum. ABCs of measurement. Accessed 11 Mar 2016 at www.qualityforum.org/Measuring_Performance/ABCs_of_Measurement.aspx.
2. National Committee for Quality Assurance. HEDIS measure development process. Accessed 14 Mar 2016 at www.ncqa.org/tabid/414/Default.aspx.
3. National Committee for Quality Assurance. HEDIS measures. Accessed 11 Mar 2016 at www.ncqa.org/HEDISQualityMeasurement/HEDISMeasures.aspx.
4. National Committee for Quality Assurance. About NCQA: overview. Accessed 14 Mar 2016 at www.ncqa.org/AboutNCQA.aspx.
5. National Committee for Quality Assurance. Health care program evaluations. Accessed 11 Mar 2016 at www.ncqa.org/Programs.aspx.
6. National Committee for Quality Assurance. HEDIS and Performance Measurement. Accessed 14 Mar 2016 at www.ncqa.org/HEDISQualityMeasurement.aspx.
7. National Committee for Quality Assurance. HEDIS 2015 technical specifications for ACO measurement. Washington, DC: National Committee for Quality Assurance; 2014.
8. National Quality Forum. Comprehensive diabetes care: hemoglobin A1c (HbA1c) poor control (> 9.0%). NQF identifier: 0059. Accessed 14 Mar 2016 at www.qualityforum.org/ProjectMeasures.aspx?projectID=73652.
9. National Quality Forum. Comprehensive diabetes care: hemoglobin A1c (HbA1c) control (< 8.0%). NQF identifier: 0575. Accessed 14 Mar 2016 at www.qualityforum.org/ProjectMeasures.aspx?projectID=73652.
10. National Quality Forum. Comprehensive diabetes care: blood pressure control (< 140/90 mm Hg). NQF identifier: 0061. Accessed 14 Mar 2016 at www.qualityforum.org/ProjectMeasures.aspx?projectID=73652.
11. Onglyza(saxagliptin). Full prescribing information. AstraZeneca, Wilmington, DE; 2014.
12. Farxiga (dapagliflozin). Full prescribing information. AstraZeneca, Wilmington, DE; March 2015.
13. Deacon CF, Holst JJ. Saxagliptin: a new dipeptidyl peptidase-4 inhibitor for the treatment of type 2 diabetes. Adv Ther 2009;26:488–99.
14. Kasichayanula S, Liu X, Lacreta F, et al. Clinical pharmacokinetics and pharmacodynamics of dapagliflozin, a selective inhibitor of sodium-glucose co-transporter type 2. Clin Pharmacokinet 2014;53:17–27.
15. Rosenstock J, Hansen L, Zee P, et al. Dual add-on therapy in type 2 diabetes poorly controlled with metformin monotherapy: a randomized double-blind trial of saxagliptin plus dapagliflozin addition versus single addition of saxagliptin or dapagliflozin to metformin. Diabetes Care 2014;38:376–83.
16. Bailey CJ. SGLT2 inhibitors: glucuretic treatment for type 2 diabetes. British Journal of Diabetes & Vascular Disease 2010;10:193-9.
17. Maliha G, Townsend RR. SGLT2 inhibitors: their potential reduction in blood pressure. J Am Soc Hypertens 2015;9:48–53.
18. Stark Casagrande S, Fradkin JE, Saydah SH, et al. The prevalence of meeting A1C, blood pressure, and LDL goals among people with diabetes, 1988-2010. Diabetes Care 2013;36:2271–9.
19. Stone NJ, Robinson JG, Lichtenstein AH, et al. 2013 ACC/AHA guideline on the treatment of blood cholesterol to reduce atherosclerotic cardiovascular risk in adults: a report of the American College of Cardiology/American Heart Association Task Force on Practice Guidelines. Circulation 2014;129:S1–45.
20. National Quality Forum. Comprehensive diabetes care (composite). NQF identifier: #0731. Accessed 11 Mar 2016 at www.qualityforum.org/QPS/QPSTool.aspx.
21. National Quality Forum. Optimal diabetes care (composite measure). NQF identifier: 0729. Accessed 14 Mar 2016 at www.qualityforum.org/ProjectMeasures.aspx?projectID=73652.
22. Amori RE, Lau J, Pittas AG. Efficacy and safety of incretin therapy in type 2 diabetes: systematic review and meta-analysis. JAMA 2007;298:194–206.
23. Monami M, Lamanna C, Desideri CM, Mannucci E. DPP-4 inhibitors and lipids: systematic review and meta-analysis. Adv Ther 2012;29:14–25.
24. Invokana(canagliflzoin). Full prescribing information. Janssen Pharmaceuticals, Titusville, NJ; 2013.
25. Jardiance(empagliflozin). Full prescribing information. Boehringer Ingelheim Pharmaceuticals and Eli Lilly, Ingelheim, Germany and Indianapolis, IN; 2014.
26. Inzucchi SE, Zinman B, Wanner C, et al. SGLT-2 inhibitors and cardiovascular risk: Proposed pathways and review of ongoing outcome trials. Diab Vasc Dis Res 2015;12:90–100.
27. American Diabetes Association. Standards of medical care in diabetes-2016. Diabetes Care 2016;39:S1–S119.
28. Fonseca VA. Defining and characterizing the progression of type 2 diabetes. Diabetes Care 2009;32:S151–S6.
29. Garber AJ, Abrahamson MJ, Barzilay JI, et al. Consensus statement by the American Association of Clinical Endocrinologists and American College of Endocrinology on the comprehensive type 2 diabetes management algorithm -- 2016 executive summary. Endocr Pract 2016;22:84–113.
30. Holman RR, Paul SK, Bethel MA, et al. 10-year follow-up of intensive glucose control in type 2 diabetes. N Engl J Med 2008;359:1577–89.
31. Nathan DM, Cleary PA, Backlund JY, et al. Intensive diabetes treatment and cardiovascular disease in patients with type 1 diabetes. N Engl J Med 2005;353:2643–53.
32. Bosi E, Camisasca RP, Collober C, et al. Effects of vildagliptin on glucose control over 24 weeks in patients with type 2 diabetes inadequately controlled with metformin. Diabetes Care 2007;30:890–5.
33. National Quality Forum. Glycemic control: hypoglycemia. NQF identifier: 2363. Accessed 29 Oct 2015 at www.qualityforum.org/QPS/QPSTool.aspx.
34. National Quality Forum. Glycemic control: hyperglycemia. NQF identifier: 2362. Accessed 11 Mar 2016 at www.qualityforum.org/QPS/QPSTool.aspx.
35. Bailey CJ, Day C. Fixed-dose single tablet antidiabetic combinations. Diabetes Obes Metab 2009;11:527–33.
36. Ferrannini E, Muscelli E, Frascerra S, et al. Metabolic response to sodium-glucose cotransporter 2 inhibition in type 2 diabetic patients. J Clin Invest 2014;124:499–508.
37. Merovci A, Solis-Herrera C, Daniele G, et al. Dapagliflozin improves muscle insulin sensitivity but enhances endogenous glucose production. J Clin Invest 2014;124:509–14.
38. Hansen L, Iqbal N, Ekholm E, et al. Postprandial dynamics of plasma glucose, insulin, and glucagon in patients with type 2 diabetes treated with saxagliptin plus dapagliflozin add-on to metformin therapy. Endocr Pract 2014;20:1187–97.
From the Ochsner Diabetes Clinical Research Unit, Frank Riddick Diabetes Institute, Department of Endocrinology, Ochsner Medical Center, New Orleans, LA (Dr. Blonde), and AstraZeneca, Gaithersburg, MD (Drs. Sheehan, Barrett, and Garcia-Sanchez).
Abstract
- Objective: To evaluate diabetes care quality measure attainment, specifically, blood glucose and blood pressure (BP) control, with saxagliptin, a dipeptidyl peptidase-4 inhibitor, and dapagliflozin, a sodium-glucose cotransporter-2 inhibitor, added singly or as dual add-on therapy in patients with type 2 diabetes inadequately controlled with metformin alone.
- Methods: Analysis of a phase 3, randomized, double-blind, active-controlled, parallel-group trial was conducted. Patients were randomized 1:1:1 to receive saxagliptin 5 mg/d plus dapagliflozin 10 mg/d, saxagliptin 5 mg/d, or dapagliflozin 10 mg/d as add-on to metformin 1500 to 2000 mg/d. Assessments included attainment of individual and composite glycated hemoglobin (A1C) and BP measures at 24 weeks of treatment.
- Results: Compared with single add-on saxagliptin or dapagliflozin, dual add-on saxagliptin plus dapagliflozin to metformin was associated with significantly more patients attaining the individual quality measures of A1C < 7% and A1C < 8%. Similarly, dual add-on saxagliptin plus dapagliflozin was associated with significantly more patients attaining the composite quality measures A1C < 7% and BP < 140/90 mm Hg and A1C < 8% and BP < 140/90 mmHg (vs saxagliptin plus metformin).
- Conclusion: Dual add-on saxagliptin plus dapagliflozin to metformin was associated with a higher proportion of patients achieving glycemic and BP quality measures compared with single add-on saxagliptin or dapagliflozin.
Assessment of performance is a focus of many health care organizations as a means to evaluate and improve the quality of health care. Standardized performance measures have been developed to improve quality of care as well as to allow for comparative assessment of health plans and to support pay for performance models [1]. A widely used set of performance measures is the Healthcare Effectiveness Data and Information Set or HEDIS [2,3], measures that are maintained by the National Committee for Quality Assurance [4,5] and used by most US health plans [6].
Type 2 diabetes (T2D) is a focus of quality measure assessment and performance improvement because of its high prevalence, substantial personal and economic impact on society, high morbidity and mortality, and because it is a condition that requires coordinated care. Important outcome measures for diabetes include blood glucose control and blood pressure (BP) control. HEDIS measures for T2D include a glycated hemoglobin (A1C) > 9%, indicating poor glucose control, < 8%, indicating good control, and < 7%, a more stringent measure of good glycemic control. The HEDIS measure for BP in T2D is < 140/90 mm Hg, which is considered good BP control. All of these HEDIS measures are currently or were previously (A1C < 7%) endorsed by the National Quality Forum [1,7–10]. Endorsement of a quality measure by the NQF indicates that the measure has been thoroughly evaluated, meets specific criteria, and is based on recognized standards of care grounded in evidence-based medicine [1].
A number of oral agents are utilized in the treatment of diabetes. Saxagliptin, an oral dipeptidyl peptidase-4 (DPP-4) inhibitor, and dapagliflozin, an oral sodium-glucose cotransporter-2 (SGLT-2) inhibitor, are indicated as adjuncts to diet and exercise in adults with T2D [11,12]. Saxagliptin inhibits DPP-4, and thereby reduces fasting and postprandial glucose concentrations by preventing degradation of the incretin hormones, glucagon-like peptide-1 and glucose-dependent insulinotropic polypeptide [13]. Dapagliflozin reduces blood glucose concentrations by inhibiting glucose reabsorption in the proximal tubule of the kidney, which results in enhanced urinary glucose excretion [14]. Because their mechanisms of action are glucose-dependent, both saxagliptin and dapagliflozin have a low intrinsic potential to cause hypoglycemia [13,14]. In a randomized, double-blind study of patients with T2D inadequately controlled with metformin, Rosenstock et al assessed the efficacy and safety of dual add-on of saxagliptin plus dapagliflozin versus saxagliptin and dapagliflozin added on alone (ClinicalTrials.gov identifier, NCT01606007) [15]. The dual add-on therapy resulted in a greater adjusted mean reduction from baseline in A1C at week 24 (–1.47%) compared with either saxagliptin (–0.88%) or dapagliflozin (–1.20%) alone added to metformin; the difference for dual add-on saxagliptin plus dapagliflozin to metformin vs. single add-on saxagliptin and single add-on dapagliflozin was –0.59% (P < 0.001) and –0.27% (P = 0.0166), respectively. The incidence of adverse events was similar across the 3 treatment groups, and hypo-glycemia was infrequent (1%), with no reports of severe hypoglycemia events (symptomatic events with glucose ≤ 54 mg/dL requiring assistance).
In this paper, we assess the attainment of diabetes quality measures among patients in this study, specifically, measures of glycemic and BP control.
Methods
Study Design and Patients
Quality Measure Assessment
Individual measures assessed included the proportion of patients with A1C < 7%, A1C < 8%, A1C > 9%, and BP < 140/90 mm Hg. Composite measures assessed includedthe proportion of patients with A1C < 7% and BP < 140/90 mm Hg and the proportion of patients with A1C < 8% and BP < 140/90 mm Hg.
Antihypertensive or cholesterol-lowering medication use was not controlled for in this study. Patients were maintained on their prescribed dosing regimen for antihypertensive and cholesterol-lowering medications, with adjustments as needed per the standard of care for their diagnosis. Treatment outcomes for A1C < 7%, < 8%, or > 9% were prespecified. The BP treatment outcome was also prespecified per the statistical analysis plan; however, a change to the HEDIS quality measure treatment outcome for BP during the clinical study resulted in this analysis being no longer relevant. Therefore, analyses of the currently endorsed quality measures for BP were conducted post hoc. Quality measure assessments for A1C and BP treatment outcomes were conducted using data from the 24-week, double-blind treatment period.
Statistical Analysis
P values for the differences in proportion of patients with individual treatment outcomes and composite treatment outcomes with saxagliptin plus dapagliflozin plus metformin versus saxagliptin plus metformin or dapagliflozin plus metformin were calculated using Fisher’s exact test. The numerator and denominator for each percentage are the number of responders and the number of patients with non-missing values in the treatment group at the corresponding baseline category, respectively, and are not corrected for baseline A1C. Because some patients experienced improvement in A1C during the lead-in period and could have already been at treatment goal at baseline, a sensitivity analysis excluding these patients was completed. Results are presented for the total number of patients with non-missing values in the treatment group, as well as patients with non-missing values in the treatment group who did not meet quality measure criteria at baseline. The number needed to treat (NNT) was calculated for all comparisons reaching statistical significance.
Results
Patients
Individual Quality Measures
The dual addition of saxagliptin plus dapagliflozin to metformin resulted in a significantly greater proportion of patients achieving A1C < 8.0% compared with saxagliptin plus metformin (71.2% vs 49.1%; P < 0.001; NNT 5 [95% CI 3–8]) or dapagliflozin plus metformin (60.1%; P = 0.033; NNT 9 [95% CI 5–85]; Figure 2). Similar results (proportions of patients: 66.4% vs 40.0% vs 51.9%; P ≤ 0.02; NNTs 4 [95% CI 3–7]) and 7 [95% CI 4–34]) were attained when the analysis excluded patients with baseline A1C < 8.0%.
Significantly fewer patients had A1C > 9% (a measure of poor glycemic control) with saxagliptin plus dapagliflozin plus metformin (12.4%) compared with saxagliptin plus metformin (22.3%; P = 0.017; NNT –10 [95% CI –50 to –6]; Figure 2). The proportion of patients with A1C > 9% was similar for both regimens that included dapagliflozin (12.4% vs 10.4%; P = 0.616).
No significant difference was observed among treatment groups in the proportion of patients with BP < 140/90 mm Hg (Figure 2). However, most patients had BP < 140/90 mm Hg (72%–82%) at baseline, which was generally maintained at week 24.
Composite Quality Measures
Discussion
This post hoc analysis evaluated attainment of glycemic and BP quality measures for diabetes. A significantly greater proportion of patients achieved the individual quality measures of A1C < 7% and A1C < 8% with dual add-on saxagliptin plus dapagliflozin to metformin compared with single add-on saxagliptin or dapagliflozin to metformin after 24 weeks. Similar results were seen when the analysis excluded patients with A1C < 7% and < 8% at baseline. All measures of good glycemic control had clinically relevant NNTs ≤ 10 after 24 weeks with saxagliptin plus dapagliflozin plus metformin compared with saxagliptin or dapagliflozin plus metformin, regardless of baseline status. Very few patients experienced lackof improvement in glycemic control, evidenced by small proportions of patients with A1C > 9%.
There was little difference in BP between dual add-on saxagliptin plus dapagliflozin or single add-on saxagliptin or dapagliflozin to metformin. The proportion of patients who attained the BP quality measure of BP < 140/90 mm Hg was similar across the 3 treatments, as might be expected because most patients already met this target at baseline. However, as might be expected based on the mild diuretic effect and weight loss associated with SGLT-2 inhibitors [16,17], trends in BP favored groups treated with dapagliflozin.
Attainment of multiple treatment targets is desirable in reducing complications of diabetes. A significantly greater proportion of patients achieved both A1C < 7% and BP < 140/90 mm Hg when both saxagliptin and dapagliflozin were added to metformin compared with single-agent addition of either saxagliptin or dapagliflozin plus metformin. Similarly, a significantly greater proportion of patients achieved both A1C < 8% and BP < 140/90 mm Hg with dual addition of saxagliptin and dapagliflozin plus metformin compared with saxagliptin plus metformin. There was also a numerically greater number of patients who achieved both of these goals with triple therapy compared with dapagliflozin plus metformin, but this finding did not reach statistical significance. Clinically relevant NNT values ≤ 10 were observed for both composite outcomes for saxagliptin plus dapagliflozin plus metformin compared with saxagliptin plus metformin or dapagliflozin plus metformin after 24 weeks.
Despite advances in the medical management of T2D, a report published in 2013 showed that between 2007 and 2010, only 53% of patients achieved an A1C < 7.0% and only 19% simultaneously achieved all 3 American Diabetes Association (ADA) goals recommended for most patients at that time: A1C < 7.0%, BP < 130/80 mm Hg, and low-density lipoprotein cholesterol LDL-C < 100 mg/dL [18]. These data highlight a need for new approaches to help patients attain glycemic, BP, and cholesterol goals. Our results demonstrated that a higher proportion of patients attained glycemic and BP quality measures with dual add-on saxagliptin plus dapagliflozin compared with single add-on saxagliptin or dapagliflozin to metformin. As a result of recent updates for cholesterol management from the American College of Cardiology and the American Heart Association [19], attainment of a cholesterol level was retired as a diabetes quality measure and replaced with a recommendation for statin therapy use [20,21]. Although the current analysis did not include assessment of LDL, DPP-4 inhibitors have demonstrated neutral effects on lipids [22,23], and SGLT-2 inhibitors have demonstrated generally modest increases in LDL-C (placebo-adjusted change from baseline: 4.5%–8.0% for canagliflozin 100 and 300 mg/d, 3.9% for dapagliflozin 10 mg, and 2.3%–4.2% for empagliflozin 10 and 25 mg/d) [12,24,25], as well as increases in high-density lipoprotein cholesterol and reductions in triglycerides [26].
Current ADA guidelines recommend an individualized, stepwise approach to treatment with sequential addition of single oral antihyperglycemic agents for patients who do not achieve their glycemic goal in 3 months [27]. Although T2D may progress at different rates in different patients, T2D does generally progress over time [28], and the ADA and American Association of Clinical Endocrinologists treatment guidelines recommend initial dual add-on therapy for individuals with higher A1C, which is suggestive of more advanced disease [27,29]. For individuals requiring initial combination therapy, guidelines note that antihyperglycemic agents that have a low risk of hypoglycemia and low potential for weight gain should be preferentially selected [29]. Attainment of A1C ≤ 7%, the guideline recommendation considered appropriate for many patients, is associated with reductions in microvascular disease and, if attained soon after diagnosis of diabetes, studies have shown reductions in macrovascular disease with long-term follow-up [27,30,31]. However, it may be challenging to achieve A1C < 7% with the addition of single oral antihyperglycemic agents, especially in patients with higher A1C [32]. Less stringent A1C goals (eg, A1C < 8%) may be appropriate in individuals with a long duration of diabetes that is difficult to control, history of severe hypoglycemia, limited life expectancy, numerous comorbidities, and extensive complications or comorbidities, especially cardiovascular disease [27]. Given the shift toward individualized treatment plans with patient-specific treatment goals, it is valuable to understand how different treatment strategies effect attainment of guideline-recommended less stringent and more stringent glycemic targets that may be appropriate for certain patients.
In addition to quality measures that assess glucose lowering with pharmacotherapy, it is important to consider measures that assess other aspects of diabetes care. For example, quality measures related to hypoglycemia and hyperglycemia may help avoid potentially adverse glucose levels, and quality measures related to weight may provide insight on treatment and lifestyle efforts directed at weight loss and management. NQF-endorsed measures of hypoglycemia and hyperglycemia are currently moving through annual review and are paired measures, intended to be interpreted with respect to one another to ensure balanced outcomes [33,34]. This underscores the value of efficacious antihyperglycemic agents with low intrinsic potential for hypoglycemia. Although this analysis did not include quality measures related to hypoglycemia or weight, future studies evaluating these aspects of diabetes care will likely further contribute to a more comprehensive and holistic treatment approach.
In addition to assessing a broad range of quality measures, an important aspect of care to consider is patient affordability. Affordability for an individual patient will depend on access in the patient’s individual plan, the financial resources of the patient, and the potential for medical cost offsets from improved control of the patient’s disease. For example, fixed-dose combination products are associated with increased patient adherence and may increase pharmacy costs but decrease medical costs [35].
Limitations of this study include the post hoc design and that quality measure attainment was assessed over a shorter duration of time (24 weeks) than is commonly assessed in the real-world/community setting (~12 months).
Dual add-on therapy with oral antihyperglycemic agents that have complementary mechanisms of action should lead to enhanced reductions in A1C. The results reported here and from the primary study, in which saxagliptin and dapagliflozin added to metformin significantly reduced mean A1C from baseline to week 24 compared with single add-on saxagliptin or dapagliflozin [15], showed that greater reductions in A1C were attained with the coadministration of saxagliptin and dapagliflozin. The glucuretic effect of SGLT-2 inhibitors has been associated with increased plasma glucagon concentrations and increased endogenous glucose production, which may impair the full glucose-lowering potential of SGLT-2 inhibitors [36,37]. Administering saxagliptin with dapagliflozin as dual therapy was shown to blunt the rise in plasma glucagon caused by dapagliflozin [38], and this may have contributed to the greater glucose control achieved with dual add-on of these 2 antihyperglycemic drugs [15].
By targeting multiple aspects of the underlying pathophysiology in T2D, greater improvements in A1C can be achieved. Dual add-on saxagliptin plus dapagliflozin to metformin resulted in a greater proportion of patients achieving NQF-endorsed HEDIS quality measures, as well as A1C < 7% (no longer an NQF-endorsed measure). As health care shifts to a more value-based payment structure, measuring quality outcomes will assume a greater role in guiding decision making and influence the care that patients receive. Understanding how antihyperglycemic medication regimens affect quality measures can help clinicians make informed decisions.
Corresponding author: Lawrence Blonde, MD, Ochsner Diabetes Clinical Research Unit, Frank Riddick Diabetes Institute, Department of Endocrinology, Ochsner Medical Center, New Orleans, LA.
Funding/support: This study was supported by AstraZeneca. Medical writing support for the preparation of this manuscript was provided by Lauren D’Angelo, PhD, and Janet Matsuura, PhD, from Complete Healthcare Communications, LLC (Chadds Ford, PA), with funding from AstraZeneca.
Financial disclosures: Dr. Blonde has received grant and research support from AstraZeneca, Jansen Pharmaceuticals, Lexicon Pharmaceuticals, Merck, Novo Nordisk, and Sanofi-Aventis and has received honoraria for participating as a speaker from AstraZeneca, Janssen Pharmaceuticals, Merck, Novo Nordisk, and Sanofi-Aventis as well as honoraria for consultant work from AstraZeneca, GlaxoSmithKline, Intarcia Therapeutics, Janssen Pharmaceuticals, Merck, Novo Nordisk, and Sanofi-Aventis. R. Garcia-Sanchez is an employee of AstraZeneca. J. Sheehan and Y. C. Barrett were employees of AstraZeneca at the time of this research.
1. National Quality Forum. ABCs of measurement. Accessed 11 Mar 2016 at www.qualityforum.org/Measuring_Performance/ABCs_of_Measurement.aspx.
2. National Committee for Quality Assurance. HEDIS measure development process. Accessed 14 Mar 2016 at www.ncqa.org/tabid/414/Default.aspx.
3. National Committee for Quality Assurance. HEDIS measures. Accessed 11 Mar 2016 at www.ncqa.org/HEDISQualityMeasurement/HEDISMeasures.aspx.
4. National Committee for Quality Assurance. About NCQA: overview. Accessed 14 Mar 2016 at www.ncqa.org/AboutNCQA.aspx.
5. National Committee for Quality Assurance. Health care program evaluations. Accessed 11 Mar 2016 at www.ncqa.org/Programs.aspx.
6. National Committee for Quality Assurance. HEDIS and Performance Measurement. Accessed 14 Mar 2016 at www.ncqa.org/HEDISQualityMeasurement.aspx.
7. National Committee for Quality Assurance. HEDIS 2015 technical specifications for ACO measurement. Washington, DC: National Committee for Quality Assurance; 2014.
8. National Quality Forum. Comprehensive diabetes care: hemoglobin A1c (HbA1c) poor control (> 9.0%). NQF identifier: 0059. Accessed 14 Mar 2016 at www.qualityforum.org/ProjectMeasures.aspx?projectID=73652.
9. National Quality Forum. Comprehensive diabetes care: hemoglobin A1c (HbA1c) control (< 8.0%). NQF identifier: 0575. Accessed 14 Mar 2016 at www.qualityforum.org/ProjectMeasures.aspx?projectID=73652.
10. National Quality Forum. Comprehensive diabetes care: blood pressure control (< 140/90 mm Hg). NQF identifier: 0061. Accessed 14 Mar 2016 at www.qualityforum.org/ProjectMeasures.aspx?projectID=73652.
11. Onglyza(saxagliptin). Full prescribing information. AstraZeneca, Wilmington, DE; 2014.
12. Farxiga (dapagliflozin). Full prescribing information. AstraZeneca, Wilmington, DE; March 2015.
13. Deacon CF, Holst JJ. Saxagliptin: a new dipeptidyl peptidase-4 inhibitor for the treatment of type 2 diabetes. Adv Ther 2009;26:488–99.
14. Kasichayanula S, Liu X, Lacreta F, et al. Clinical pharmacokinetics and pharmacodynamics of dapagliflozin, a selective inhibitor of sodium-glucose co-transporter type 2. Clin Pharmacokinet 2014;53:17–27.
15. Rosenstock J, Hansen L, Zee P, et al. Dual add-on therapy in type 2 diabetes poorly controlled with metformin monotherapy: a randomized double-blind trial of saxagliptin plus dapagliflozin addition versus single addition of saxagliptin or dapagliflozin to metformin. Diabetes Care 2014;38:376–83.
16. Bailey CJ. SGLT2 inhibitors: glucuretic treatment for type 2 diabetes. British Journal of Diabetes & Vascular Disease 2010;10:193-9.
17. Maliha G, Townsend RR. SGLT2 inhibitors: their potential reduction in blood pressure. J Am Soc Hypertens 2015;9:48–53.
18. Stark Casagrande S, Fradkin JE, Saydah SH, et al. The prevalence of meeting A1C, blood pressure, and LDL goals among people with diabetes, 1988-2010. Diabetes Care 2013;36:2271–9.
19. Stone NJ, Robinson JG, Lichtenstein AH, et al. 2013 ACC/AHA guideline on the treatment of blood cholesterol to reduce atherosclerotic cardiovascular risk in adults: a report of the American College of Cardiology/American Heart Association Task Force on Practice Guidelines. Circulation 2014;129:S1–45.
20. National Quality Forum. Comprehensive diabetes care (composite). NQF identifier: #0731. Accessed 11 Mar 2016 at www.qualityforum.org/QPS/QPSTool.aspx.
21. National Quality Forum. Optimal diabetes care (composite measure). NQF identifier: 0729. Accessed 14 Mar 2016 at www.qualityforum.org/ProjectMeasures.aspx?projectID=73652.
22. Amori RE, Lau J, Pittas AG. Efficacy and safety of incretin therapy in type 2 diabetes: systematic review and meta-analysis. JAMA 2007;298:194–206.
23. Monami M, Lamanna C, Desideri CM, Mannucci E. DPP-4 inhibitors and lipids: systematic review and meta-analysis. Adv Ther 2012;29:14–25.
24. Invokana(canagliflzoin). Full prescribing information. Janssen Pharmaceuticals, Titusville, NJ; 2013.
25. Jardiance(empagliflozin). Full prescribing information. Boehringer Ingelheim Pharmaceuticals and Eli Lilly, Ingelheim, Germany and Indianapolis, IN; 2014.
26. Inzucchi SE, Zinman B, Wanner C, et al. SGLT-2 inhibitors and cardiovascular risk: Proposed pathways and review of ongoing outcome trials. Diab Vasc Dis Res 2015;12:90–100.
27. American Diabetes Association. Standards of medical care in diabetes-2016. Diabetes Care 2016;39:S1–S119.
28. Fonseca VA. Defining and characterizing the progression of type 2 diabetes. Diabetes Care 2009;32:S151–S6.
29. Garber AJ, Abrahamson MJ, Barzilay JI, et al. Consensus statement by the American Association of Clinical Endocrinologists and American College of Endocrinology on the comprehensive type 2 diabetes management algorithm -- 2016 executive summary. Endocr Pract 2016;22:84–113.
30. Holman RR, Paul SK, Bethel MA, et al. 10-year follow-up of intensive glucose control in type 2 diabetes. N Engl J Med 2008;359:1577–89.
31. Nathan DM, Cleary PA, Backlund JY, et al. Intensive diabetes treatment and cardiovascular disease in patients with type 1 diabetes. N Engl J Med 2005;353:2643–53.
32. Bosi E, Camisasca RP, Collober C, et al. Effects of vildagliptin on glucose control over 24 weeks in patients with type 2 diabetes inadequately controlled with metformin. Diabetes Care 2007;30:890–5.
33. National Quality Forum. Glycemic control: hypoglycemia. NQF identifier: 2363. Accessed 29 Oct 2015 at www.qualityforum.org/QPS/QPSTool.aspx.
34. National Quality Forum. Glycemic control: hyperglycemia. NQF identifier: 2362. Accessed 11 Mar 2016 at www.qualityforum.org/QPS/QPSTool.aspx.
35. Bailey CJ, Day C. Fixed-dose single tablet antidiabetic combinations. Diabetes Obes Metab 2009;11:527–33.
36. Ferrannini E, Muscelli E, Frascerra S, et al. Metabolic response to sodium-glucose cotransporter 2 inhibition in type 2 diabetic patients. J Clin Invest 2014;124:499–508.
37. Merovci A, Solis-Herrera C, Daniele G, et al. Dapagliflozin improves muscle insulin sensitivity but enhances endogenous glucose production. J Clin Invest 2014;124:509–14.
38. Hansen L, Iqbal N, Ekholm E, et al. Postprandial dynamics of plasma glucose, insulin, and glucagon in patients with type 2 diabetes treated with saxagliptin plus dapagliflozin add-on to metformin therapy. Endocr Pract 2014;20:1187–97.
Efficacy and Safety Outcomes for Patients Taking Warfarin Who Were Switched From Face-to-Face to Telephone Anticoagulation Clinic
Nearly 4 million patients in the U.S. take warfarin.1 Between 1998 and 2004, the number of prescriptions for warfarin increased from 21.1 million to 30.6 million.2 However, with the approval of new oral anticoagulants, between 2007 and 2011, warfarin treatment visits decreased from 2.1 million to 1.6 million per quarter.3 Despite the declining number of patients on warfarin, there are still significant monetary and time costs associated with warfarin therapy. One study estimated that patients spend 2.5 hours per clinic visit, accounting for travel time and time spent in clinic, with an average of 1 hour in the clinic, including waiting time.1 Another study estimated the cost of warfarin therapy per patient, per month to be $62.30 in 2004 dollars based on 1.1 clinic visits per patient per month.4
Warfarin Monitoring
Warfarin requires close monitoring. The relationship between the dose of warfarin and the response is widely variable and can be influenced by many genetic and environmental factors, making dosing difficult. Genetic variations in the CYP2C9 and vitamin K epoxide reductase genes can lead to different warfarin dosing requirements.
Some environmental factors that can affect warfarin therapy include dietary vitamin K, alcohol intake, nutritional supplements, or herbal products. Concomitant diseases such as hepatic dysfunction, thyroid dysfunction, hypermetabolic states, age, and acute decompensated heart failure can also influence warfarin therapy. Additionally, there are numerous drug interactions that may affect warfarin therapy. Many of these factors may vary not only between patients, but also within the same patient over time.5-7
Warfarin has a narrow therapeutic range, which presents the possibility of serious adverse events (AEs) if warfarin is not dosed properly. According to The Institute for Safe Medication Practices, warfarin was the second most commonly reported drug causing serious AEs in 2011, with 1,106 cases, including 72 deaths reported to the FDA.8 Bescause of the large number of patients on warfarin and the risk for serious AEs, careful monitoring is required.
Monitoring of warfarin therapy is done using the prothrombin time (PT) test, which reflects the level of activity of factors I, II, V, VII, and X (of these warfarin affects factors II, VII, and X). However, PT tests can vary greatly, so a standardized model known as the international normalized ratio (INR) is used. The INR goals require the lowest effective dose in order to minimize bleeding. Dosing should be individualized for patients based on indications and patient-specific factors, such as history of bleeds or clots. Although it has been suggested that stable patients should undergo INR monitoring every 12 weeks, most patients are monitored every 4 to 6 weeks or more frequently.5,9
Standard of Care
Previously, the standard of care was for primary care providers to monitor warfarin therapy. Recently, there has been a shift to monitoring patients in anticoagulation clinics. One study that compared a pharmacist-managed anticoagulation service vs usual medical care concluded that the pharmacist-managed anticoagulation service resulted in a higher percentage of INR values in the therapeutic range, statistically significantly fewer anticoagulation-related AEs, and lower costs.10
There also have been studies conducted to evaluate the safety and efficacy of anticoagulation therapy when monitored by telephone-based anticoagulation clinics. A study by Witt and colleagues compared patients being managed in a telephone-based, pharmacist-managed anticoagulation clinic with a physician-managed clinic over a 6-month period. The study found that patients in the pharmacist-managed group spent more time in the therapeutic INR range (TTR) compared with the physician-managed group. However, although thromboembolic complications or major bleeds occurred less frequently in the pharmacist-managed group, the difference was not statistically significant.11
In a different study by Wittkowsky and colleagues, patients who were managed by a telephone vs a face-to-face clinic had a similar number of INR values in the therapeutic range, rates of major hemorrhage, and recurrent thromboembolism.12
In a study by Staresinic and colleagues an anticoagulation management service (AMS) was compared with an interim telephone model (IT). There was no statistically significant difference in the time both groups spent in the TTR, rates of thromboembolism, or rates of major bleeding. The IT group had a higher rate of minor bleeding events compared with that of the AMS group.13 To date, there have not been any published studies evaluating individual patients who were switched from face-to-face to telephone-based management of anticoagulation.
Methods
This retrospective electronic chart review of 156 patients was approved by both the institutional review board and research and development committee at the Jesse Brown VAMC (JBVAMC) in Chicago, Illinois. The patient list was generated from patients enrolled in an anticoagulation telephone clinic as of September 1, 2013. Patients were included if they were aged ≥ 18 years, received warfarin therapy between May 1, 2008, and September 1, 2013, had at least 70% of their anticoagulation visits with the face-to-face anticoagulation clinic for a continuous 1-year period and were then switched to the telephone anticoagulation clinic, and had at least 70% of their anticoagulation visits with the telephone anticoagulation clinic in a continuous 1-year period after the switch. Patients were excluded if they did not meet all the inclusion criteria. Of the 156 patients reviewed, 61 patients met enrollment requirements.
Study Endpoints
The primary endpoints of the study included TTR, defined as the percentage of anticoagulation visits at which the INR values were in the patient-specific therapeutic range ± 0.2 (excluding any subtherapeutic INR values within 2 weeks after planned short-term discontinuation of warfarin), event rate of cerebral vascular accidents (CVA)/transient ischemic attacks (TIA) and venous thromboembolism (VTE), and event rate of major bleeds. Major bleeds were defined as any fatal bleed, a symptomatic bleed in a critical area or organ (intracranial, intraspinal, intraocular, retroperitoneal, intraarticular or pericardial or intramuscular with compartment syndrome), a fall in hemoglobin (Hg) ≥ 2 g/dL, or requiring transfusion of ≥ 2 units of whole blood or packed red blood cells.
Secondary endpoints of the study included event rate of minor bleeds (defined as any bleed not defined as a major bleed); time between follow-up appointments; number of acute care visits, emergency department (ED) visits, or hospitalizations due to anticoagulation; time to follow-up after hospital discharge, ED visit or acute care visit due to anticoagulation (if applicable); number of critical INRs as defined by local policy (INRs ≥ 5); number of canceled or no-show appointments; and compliance with monitoring of liver function test (LFT) and complete blood count (CBC) every 6 months per local policy.
Data Collection
To arrive at study endpoints, data collection included (1) demographics: age, ethnicity, and gender; (2) laboratory values: albumin, CBC, INR, LFT, and thyroid-stimulating hormone (TSH); (3) warfarin information: chart-documented adherence, dose and schedule, fill history, indication, INR goal per chart documentation, and reason for sub- or supratherapeutic INR; (4) safety: CVA/TIA, VTE, major bleeds, minor bleeds, and hospitalization/ED visits/acute care visits; (5) comorbid conditions: alcohol use, anemia, atrial fibrillation (AF), atrial flutter, cancer, coagulation deficiencies, congestive heart failure (CHF), diabetes mellitus (DM), hemodialysis, history of bleed, hypertension, liver cirrhosis, peptic ulcer disease, peripheral vascular disease, previous VTE, previous CVA/TIA, and valve replacement; (6) concomitant medications: aspirin, aspirin/extended-release dipyridamole, clopidogrel, dalteparin, enoxaparin, fondaparinux, nonsteroidal anti-inflammatory drugs (NSAIDs), unfractionated heparin, and warfarin; and (7) appointment data: time between appointments; time to follow-up after hospital discharge, ED visit or acute care visit (if applicable); and number of canceled or no-show appointments. Patient data were collected for 24 months total: the 12 months immediately before switching to telephone anticoagulation clinic (while the patient was followed in the face-to-face anticoagulation clinic) and the 12 months immediately after switching to telephone anticoagulation clinic.
Statistical tests used in this study included paired t test and Fisher exact test. P < .05 was determined to be statistically significant.
Results
A total of 156 patient charts were reviewed. Ninety-five patients were excluded, and 61 patients were included (Figure 1). Patients were excluded because they were either not enrolled in a face-to-face clinic for 1 continuous year prior to the switch or not enrolled in a telephone clinic for 1 continuous year after the switch. Patients also were excluded if they alternated between a face-to-face and telephone clinic and did not have at least 70% of their anticoagulation visits at the face-to-face clinic before the switch or at least 70% of their anticoagulation visits with the telephone clinic after the switch.
Baseline Characteristics
The study population was predominantly male with a mean age of 67 years. Most of the patients were African American. The most common indications for anticoagulation included AF, atrial flutter, previous VTE, or multiple indications. The most common INR goal range for patients was 2 to 3. The most common comorbid conditions were hypertension, alcohol use, CHF, and DM. Concomitant medications were noted if they were used anytime during the observation period; the most common were aspirin, NSAIDs, enoxaparin and dalteparin (Table 1).
Endpoints
There was not a statistically significant difference between the average TTR for patients for the face-to-face and telephone groups (Table 2). More than 85% of patients had a similar TTR between the groups or were in TTR more often during telephone clinic vs face-to-face clinic (Figure 2). One patient had a CVA during the face-to-face clinic period, and another patient had a TIA during the telephone anticoagulation clinic period. No VTE events were reported in either group. Further, there was 1 major bleed in the face-to-face clinic period (asymptomatic Hg drop ≥ 2 g/dL) and 3 major bleeds (asymptomatic Hg drop ≥ 2 g/dL, intraocular bleed, and gastrointestinal bleed) in the telephone clinic period, but this difference also was not statistically significant.
There were no statistically significant differences for any of the secondary endpoints except for compliance with LFT monitoring, which was higher in the telephone clinic. There were 22 minor bleeds found during face-to-face anticoagulation clinic and 19 minor bleeds found during telephone anticoagulation clinic. The most common types of minor bleed for both clinic settings were bruising at injection site (while using low molecular-weight heparin) and epistaxis.
There were 2 additional endpoints in the study for telephone clinic patients to assess time spent on telephone visits and ability to reach the patient by phone if they had laboratory tests drawn. In the telephone clinic, patients with completed labs were unreachable 2.1% of the time. The average amount of time spent on telephone visits was 8.0 (± 0.89) minutes.
Discussion
This study showed no statistically significant differences in TTR for patients switched to the telephone anticoagulation clinic from the face-to-face anticoagulation clinic. There also were no statistically significant differences in event rates for CVA/TIA, VTE, or major bleeds. The only statistically significant difference in secondary endpoints was better compliance with LFT monitoring in the telephone clinic period. Additionally, patients served as their own control in this study, which helped eliminate confounding factors that may have been present when comparing 2 different patient groups.
The telephone clinic offered patients multiple advantages, including decreased wait time, as patients did not have to wait for their laboratory results to return or wait to be seen in clinic, increased volume of patients managed due to shorter appointment times, better coordination of other appointments on the same day, and improved medication reconciliation when patients have their medications in front of them. The disadvantages of telephone anticoagulation clinic included the inability of the providers to see any nonverbal cues, difficulty evaluating other issues for patients already at home and unwilling to return to the clinic, and the inability to provide written information (eg, changes in warfarin dosing or appointment scheduling) to the patient during the visit.
Limitations
In addition to the sample size and retrospective design of the study, there were several other study limitations. When the telephone anticoagulation clinic first started, patients with more stable INRs were chosen to enroll, which may have led to selection bias. Other limitations included the lack of documentation, patient reporting, or outside medical records documenting bleeds, VTE, or CVA/TIA. In addition, power was not calculated prior to beginning the study, because only, a small patient pool was available, and all patients that met inclusion criteria were to be included. Therefore, the sample size may have been too small to detect a difference.
Conclusion
In this retrospective chart review, the JBVAMC patients using the face-to-face and telephone anticoagulation clinics had similar outcomes. Telephone anticoagulation clinic was shown to be a viable alternative for some patients.
1. Jonas DE, Bryant Shilliday B, Laundon WR, Pignone M. Patient time requirements for anticoagulation therapy with warfarin. Med Decis Making. 2010;30(2):206-216.
2. Wysowski DK, Nourjah P, Swartz L. Bleeding complications with warfarin use: a prevalent adverse effect resulting in regulatory action. Arch Intern Med. 2007;167(13):1414-1419.
3. Kirley K, Qato DM, Kornfield R, Stafford RS, Alexander GC. National trends in oral anticoagulant use in the United States, 2007 to 2011. Circ Cadiovasc Qual Outcomes. 2012;5(5):615-621.
4. Anderson RJ. Cost analysis of a managed care decentralized outpatient pharmacy anticoagulation service. J Manag Care Pharm. 2004;10(2):159-165.
5. Ageno W, Gallus AS, Wittkowsky A, Crowther M, Hylek EM, Palareti G; American College of Chest Physicians. Oral anticoagulant therapy: Antithrombotic Therapy and Prevention of Thrombosis, 9th ed: American College of Chest Physicians Evidence-Based Clinical Practice Guidelines. Chest. 2012;141(2)(suppl):e44S-e88S.
6. Choonara IA, Malia RG, Haynes BP, et al. The relationship between inhibition of vitamin K1 2,3-epoxide reductase and reduction of clotting factor activity with warfarin. Br J Clin Pharmacol. 1988;25(1):1-7.
7. Scordo MG, Pengo V, Spina E, Dahl ML, Gusella M, Padrini R. Influence of CYP2C9 and CYP2C19 genetic polymorphisms on warfarin maintenance dose and metabolic clearance. Clin Pharmacol Ther. 2002;72(6):702-710.
8. Institute for Safe Medication Practices. Quarter watch: anticoagulants the leading reported drug risk in 2011. Institute for Safe Medication Practices website. http://www.ismp.org/quarterwatch/pdfs/2011Q4.pdf. Published Fourth Quarter 2011. Accessed June 6, 2016.
9. Holbrook A, Schulman S, Witt DM, et al; American College of Chest Physicians. Evidence-based management of anticoagulant therapy: Antithrombotic Therapy and Prevention of Thrombosis, 9th ed: American College of Chest Physicians Evidence-Based Clinical Practice Guidelines. Chest. 2012;141(2)( suppl):e152S-e184S.
10. Hall D, Buchanan J, Helms B, et al. Health care expenditures and therapeutic outcomes of a pharmacist-managed anticoagulation service versus usual medical care. Pharmacotherapy. 2011;31(7):686-694.
11. Witt DM, Sadler MA, Shanahan RL, Mazzoli G, Tillman DJ. Effect of a centralized clinical pharmacy anticoagulation service on the outcomes of anticoagulation therapy. Chest. 2005;127(5):1515-1522.
12. Wittkowsky AK, Nutescu EA, Blackburn J, et al. Outcomes of oral anticoagulant therapy managed by telephone vs in-office visits in an anticoagulation clinic setting. Chest. 2006;130(5):1385-1389.
13. Staresinic AG, Sorkness CA, Goodman BM, Pigarelli DW. Comparison of outcomes using 2 delivery models of anticoagulation care. Arch Intern Med. 2006;166(9):997-1002.
Nearly 4 million patients in the U.S. take warfarin.1 Between 1998 and 2004, the number of prescriptions for warfarin increased from 21.1 million to 30.6 million.2 However, with the approval of new oral anticoagulants, between 2007 and 2011, warfarin treatment visits decreased from 2.1 million to 1.6 million per quarter.3 Despite the declining number of patients on warfarin, there are still significant monetary and time costs associated with warfarin therapy. One study estimated that patients spend 2.5 hours per clinic visit, accounting for travel time and time spent in clinic, with an average of 1 hour in the clinic, including waiting time.1 Another study estimated the cost of warfarin therapy per patient, per month to be $62.30 in 2004 dollars based on 1.1 clinic visits per patient per month.4
Warfarin Monitoring
Warfarin requires close monitoring. The relationship between the dose of warfarin and the response is widely variable and can be influenced by many genetic and environmental factors, making dosing difficult. Genetic variations in the CYP2C9 and vitamin K epoxide reductase genes can lead to different warfarin dosing requirements.
Some environmental factors that can affect warfarin therapy include dietary vitamin K, alcohol intake, nutritional supplements, or herbal products. Concomitant diseases such as hepatic dysfunction, thyroid dysfunction, hypermetabolic states, age, and acute decompensated heart failure can also influence warfarin therapy. Additionally, there are numerous drug interactions that may affect warfarin therapy. Many of these factors may vary not only between patients, but also within the same patient over time.5-7
Warfarin has a narrow therapeutic range, which presents the possibility of serious adverse events (AEs) if warfarin is not dosed properly. According to The Institute for Safe Medication Practices, warfarin was the second most commonly reported drug causing serious AEs in 2011, with 1,106 cases, including 72 deaths reported to the FDA.8 Bescause of the large number of patients on warfarin and the risk for serious AEs, careful monitoring is required.
Monitoring of warfarin therapy is done using the prothrombin time (PT) test, which reflects the level of activity of factors I, II, V, VII, and X (of these warfarin affects factors II, VII, and X). However, PT tests can vary greatly, so a standardized model known as the international normalized ratio (INR) is used. The INR goals require the lowest effective dose in order to minimize bleeding. Dosing should be individualized for patients based on indications and patient-specific factors, such as history of bleeds or clots. Although it has been suggested that stable patients should undergo INR monitoring every 12 weeks, most patients are monitored every 4 to 6 weeks or more frequently.5,9
Standard of Care
Previously, the standard of care was for primary care providers to monitor warfarin therapy. Recently, there has been a shift to monitoring patients in anticoagulation clinics. One study that compared a pharmacist-managed anticoagulation service vs usual medical care concluded that the pharmacist-managed anticoagulation service resulted in a higher percentage of INR values in the therapeutic range, statistically significantly fewer anticoagulation-related AEs, and lower costs.10
There also have been studies conducted to evaluate the safety and efficacy of anticoagulation therapy when monitored by telephone-based anticoagulation clinics. A study by Witt and colleagues compared patients being managed in a telephone-based, pharmacist-managed anticoagulation clinic with a physician-managed clinic over a 6-month period. The study found that patients in the pharmacist-managed group spent more time in the therapeutic INR range (TTR) compared with the physician-managed group. However, although thromboembolic complications or major bleeds occurred less frequently in the pharmacist-managed group, the difference was not statistically significant.11
In a different study by Wittkowsky and colleagues, patients who were managed by a telephone vs a face-to-face clinic had a similar number of INR values in the therapeutic range, rates of major hemorrhage, and recurrent thromboembolism.12
In a study by Staresinic and colleagues an anticoagulation management service (AMS) was compared with an interim telephone model (IT). There was no statistically significant difference in the time both groups spent in the TTR, rates of thromboembolism, or rates of major bleeding. The IT group had a higher rate of minor bleeding events compared with that of the AMS group.13 To date, there have not been any published studies evaluating individual patients who were switched from face-to-face to telephone-based management of anticoagulation.
Methods
This retrospective electronic chart review of 156 patients was approved by both the institutional review board and research and development committee at the Jesse Brown VAMC (JBVAMC) in Chicago, Illinois. The patient list was generated from patients enrolled in an anticoagulation telephone clinic as of September 1, 2013. Patients were included if they were aged ≥ 18 years, received warfarin therapy between May 1, 2008, and September 1, 2013, had at least 70% of their anticoagulation visits with the face-to-face anticoagulation clinic for a continuous 1-year period and were then switched to the telephone anticoagulation clinic, and had at least 70% of their anticoagulation visits with the telephone anticoagulation clinic in a continuous 1-year period after the switch. Patients were excluded if they did not meet all the inclusion criteria. Of the 156 patients reviewed, 61 patients met enrollment requirements.
Study Endpoints
The primary endpoints of the study included TTR, defined as the percentage of anticoagulation visits at which the INR values were in the patient-specific therapeutic range ± 0.2 (excluding any subtherapeutic INR values within 2 weeks after planned short-term discontinuation of warfarin), event rate of cerebral vascular accidents (CVA)/transient ischemic attacks (TIA) and venous thromboembolism (VTE), and event rate of major bleeds. Major bleeds were defined as any fatal bleed, a symptomatic bleed in a critical area or organ (intracranial, intraspinal, intraocular, retroperitoneal, intraarticular or pericardial or intramuscular with compartment syndrome), a fall in hemoglobin (Hg) ≥ 2 g/dL, or requiring transfusion of ≥ 2 units of whole blood or packed red blood cells.
Secondary endpoints of the study included event rate of minor bleeds (defined as any bleed not defined as a major bleed); time between follow-up appointments; number of acute care visits, emergency department (ED) visits, or hospitalizations due to anticoagulation; time to follow-up after hospital discharge, ED visit or acute care visit due to anticoagulation (if applicable); number of critical INRs as defined by local policy (INRs ≥ 5); number of canceled or no-show appointments; and compliance with monitoring of liver function test (LFT) and complete blood count (CBC) every 6 months per local policy.
Data Collection
To arrive at study endpoints, data collection included (1) demographics: age, ethnicity, and gender; (2) laboratory values: albumin, CBC, INR, LFT, and thyroid-stimulating hormone (TSH); (3) warfarin information: chart-documented adherence, dose and schedule, fill history, indication, INR goal per chart documentation, and reason for sub- or supratherapeutic INR; (4) safety: CVA/TIA, VTE, major bleeds, minor bleeds, and hospitalization/ED visits/acute care visits; (5) comorbid conditions: alcohol use, anemia, atrial fibrillation (AF), atrial flutter, cancer, coagulation deficiencies, congestive heart failure (CHF), diabetes mellitus (DM), hemodialysis, history of bleed, hypertension, liver cirrhosis, peptic ulcer disease, peripheral vascular disease, previous VTE, previous CVA/TIA, and valve replacement; (6) concomitant medications: aspirin, aspirin/extended-release dipyridamole, clopidogrel, dalteparin, enoxaparin, fondaparinux, nonsteroidal anti-inflammatory drugs (NSAIDs), unfractionated heparin, and warfarin; and (7) appointment data: time between appointments; time to follow-up after hospital discharge, ED visit or acute care visit (if applicable); and number of canceled or no-show appointments. Patient data were collected for 24 months total: the 12 months immediately before switching to telephone anticoagulation clinic (while the patient was followed in the face-to-face anticoagulation clinic) and the 12 months immediately after switching to telephone anticoagulation clinic.
Statistical tests used in this study included paired t test and Fisher exact test. P < .05 was determined to be statistically significant.
Results
A total of 156 patient charts were reviewed. Ninety-five patients were excluded, and 61 patients were included (Figure 1). Patients were excluded because they were either not enrolled in a face-to-face clinic for 1 continuous year prior to the switch or not enrolled in a telephone clinic for 1 continuous year after the switch. Patients also were excluded if they alternated between a face-to-face and telephone clinic and did not have at least 70% of their anticoagulation visits at the face-to-face clinic before the switch or at least 70% of their anticoagulation visits with the telephone clinic after the switch.
Baseline Characteristics
The study population was predominantly male with a mean age of 67 years. Most of the patients were African American. The most common indications for anticoagulation included AF, atrial flutter, previous VTE, or multiple indications. The most common INR goal range for patients was 2 to 3. The most common comorbid conditions were hypertension, alcohol use, CHF, and DM. Concomitant medications were noted if they were used anytime during the observation period; the most common were aspirin, NSAIDs, enoxaparin and dalteparin (Table 1).
Endpoints
There was not a statistically significant difference between the average TTR for patients for the face-to-face and telephone groups (Table 2). More than 85% of patients had a similar TTR between the groups or were in TTR more often during telephone clinic vs face-to-face clinic (Figure 2). One patient had a CVA during the face-to-face clinic period, and another patient had a TIA during the telephone anticoagulation clinic period. No VTE events were reported in either group. Further, there was 1 major bleed in the face-to-face clinic period (asymptomatic Hg drop ≥ 2 g/dL) and 3 major bleeds (asymptomatic Hg drop ≥ 2 g/dL, intraocular bleed, and gastrointestinal bleed) in the telephone clinic period, but this difference also was not statistically significant.
There were no statistically significant differences for any of the secondary endpoints except for compliance with LFT monitoring, which was higher in the telephone clinic. There were 22 minor bleeds found during face-to-face anticoagulation clinic and 19 minor bleeds found during telephone anticoagulation clinic. The most common types of minor bleed for both clinic settings were bruising at injection site (while using low molecular-weight heparin) and epistaxis.
There were 2 additional endpoints in the study for telephone clinic patients to assess time spent on telephone visits and ability to reach the patient by phone if they had laboratory tests drawn. In the telephone clinic, patients with completed labs were unreachable 2.1% of the time. The average amount of time spent on telephone visits was 8.0 (± 0.89) minutes.
Discussion
This study showed no statistically significant differences in TTR for patients switched to the telephone anticoagulation clinic from the face-to-face anticoagulation clinic. There also were no statistically significant differences in event rates for CVA/TIA, VTE, or major bleeds. The only statistically significant difference in secondary endpoints was better compliance with LFT monitoring in the telephone clinic period. Additionally, patients served as their own control in this study, which helped eliminate confounding factors that may have been present when comparing 2 different patient groups.
The telephone clinic offered patients multiple advantages, including decreased wait time, as patients did not have to wait for their laboratory results to return or wait to be seen in clinic, increased volume of patients managed due to shorter appointment times, better coordination of other appointments on the same day, and improved medication reconciliation when patients have their medications in front of them. The disadvantages of telephone anticoagulation clinic included the inability of the providers to see any nonverbal cues, difficulty evaluating other issues for patients already at home and unwilling to return to the clinic, and the inability to provide written information (eg, changes in warfarin dosing or appointment scheduling) to the patient during the visit.
Limitations
In addition to the sample size and retrospective design of the study, there were several other study limitations. When the telephone anticoagulation clinic first started, patients with more stable INRs were chosen to enroll, which may have led to selection bias. Other limitations included the lack of documentation, patient reporting, or outside medical records documenting bleeds, VTE, or CVA/TIA. In addition, power was not calculated prior to beginning the study, because only, a small patient pool was available, and all patients that met inclusion criteria were to be included. Therefore, the sample size may have been too small to detect a difference.
Conclusion
In this retrospective chart review, the JBVAMC patients using the face-to-face and telephone anticoagulation clinics had similar outcomes. Telephone anticoagulation clinic was shown to be a viable alternative for some patients.
1. Jonas DE, Bryant Shilliday B, Laundon WR, Pignone M. Patient time requirements for anticoagulation therapy with warfarin. Med Decis Making. 2010;30(2):206-216.
2. Wysowski DK, Nourjah P, Swartz L. Bleeding complications with warfarin use: a prevalent adverse effect resulting in regulatory action. Arch Intern Med. 2007;167(13):1414-1419.
3. Kirley K, Qato DM, Kornfield R, Stafford RS, Alexander GC. National trends in oral anticoagulant use in the United States, 2007 to 2011. Circ Cadiovasc Qual Outcomes. 2012;5(5):615-621.
4. Anderson RJ. Cost analysis of a managed care decentralized outpatient pharmacy anticoagulation service. J Manag Care Pharm. 2004;10(2):159-165.
5. Ageno W, Gallus AS, Wittkowsky A, Crowther M, Hylek EM, Palareti G; American College of Chest Physicians. Oral anticoagulant therapy: Antithrombotic Therapy and Prevention of Thrombosis, 9th ed: American College of Chest Physicians Evidence-Based Clinical Practice Guidelines. Chest. 2012;141(2)(suppl):e44S-e88S.
6. Choonara IA, Malia RG, Haynes BP, et al. The relationship between inhibition of vitamin K1 2,3-epoxide reductase and reduction of clotting factor activity with warfarin. Br J Clin Pharmacol. 1988;25(1):1-7.
7. Scordo MG, Pengo V, Spina E, Dahl ML, Gusella M, Padrini R. Influence of CYP2C9 and CYP2C19 genetic polymorphisms on warfarin maintenance dose and metabolic clearance. Clin Pharmacol Ther. 2002;72(6):702-710.
8. Institute for Safe Medication Practices. Quarter watch: anticoagulants the leading reported drug risk in 2011. Institute for Safe Medication Practices website. http://www.ismp.org/quarterwatch/pdfs/2011Q4.pdf. Published Fourth Quarter 2011. Accessed June 6, 2016.
9. Holbrook A, Schulman S, Witt DM, et al; American College of Chest Physicians. Evidence-based management of anticoagulant therapy: Antithrombotic Therapy and Prevention of Thrombosis, 9th ed: American College of Chest Physicians Evidence-Based Clinical Practice Guidelines. Chest. 2012;141(2)( suppl):e152S-e184S.
10. Hall D, Buchanan J, Helms B, et al. Health care expenditures and therapeutic outcomes of a pharmacist-managed anticoagulation service versus usual medical care. Pharmacotherapy. 2011;31(7):686-694.
11. Witt DM, Sadler MA, Shanahan RL, Mazzoli G, Tillman DJ. Effect of a centralized clinical pharmacy anticoagulation service on the outcomes of anticoagulation therapy. Chest. 2005;127(5):1515-1522.
12. Wittkowsky AK, Nutescu EA, Blackburn J, et al. Outcomes of oral anticoagulant therapy managed by telephone vs in-office visits in an anticoagulation clinic setting. Chest. 2006;130(5):1385-1389.
13. Staresinic AG, Sorkness CA, Goodman BM, Pigarelli DW. Comparison of outcomes using 2 delivery models of anticoagulation care. Arch Intern Med. 2006;166(9):997-1002.
Investigator-Reported Efficacy of Azelaic Acid Foam 15% in Patients With Papulopustular Rosacea: Secondary Efficacy Outcomes From a Randomized, Controlled, Double-blind, Phase 3 Trial
Papulopustular rosacea (PPR) is characterized by centrofacial papules, pustules, erythema, and occasionally telangiectasia.1,2 A myriad of factors, including genetic predisposition3 and environmental triggers,4 have been associated with dysregulated inflammatory responses,5 contributing to the disease pathogenesis and symptoms. Inflammation associated with PPR may decrease skin barrier function, increase transepidermal water loss, and reduce stratum corneum hydration,6,7 resulting in heightened skin sensitivity, pain, burning, and/or stinging.5,8
Azelaic acid (AzA), which historically has only been available in gel or cream formulations, is well established for the treatment of rosacea9; however, these formulations have been associated with application-site adverse events (AEs)(eg, burning, erythema, irritation), limited cosmetic acceptability, and reduced compliance or efficacy.10
For select skin conditions, active agents delivered in foam vehicles may offer superior tolerability with improved outcomes.11 An AzA foam 15% formulation was approved for the treatment of mild to moderate PPR. Primary outcomes from a phase 3 trial demonstrated the efficacy and safety of AzA foam in improving inflammatory lesion counts (ILCs) and disease severity in participants with PPR. The trial also evaluated additional secondary end points, including the effect of AzA foam on erythema, inflammatory lesions, treatment response, and other manifestations of PPR.12 The current study evaluated investigator-reported efficacy outcomes for these secondary end points for AzA foam 15% versus vehicle foam.
Methods
Study Design
This phase 3 multicenter, randomized, double-blind, vehicle-controlled, parallel-group clinical trial was conducted from September 2012 to January 2014 at 48 US study centers comparing the efficacy of AzA foam versus vehicle foam in patients with PPR. Eligible participants were 18 years and older with PPR rated as moderate or severe according to investigator global assessment (IGA), plus 12 to 50 inflammatory lesions and persistent erythema with or without telangiectasia. Exclusion criteria included known nonresponse to AzA, current or prior use (within 6 weeks of randomization) of noninvestigational products to treat rosacea, and presence of other dermatoses that could interfere with rosacea evaluation.
Participants were randomized into the AzA foam or vehicle group (1:1 ratio). The study medication was applied in 0.5-g doses twice daily until the end of treatment (EoT) at 12 weeks. Efficacy and safety parameters were evaluated at baseline and at 4, 8, and 12 weeks of treatment, and at a follow-up visit 4 weeks after EoT (week 16).
Results for the coprimary efficacy end points—therapeutic success rate according to IGA and nominal change in ILC—were previously reported.12
Investigator-Reported Secondary Efficacy Outcomes
The secondary efficacy end points were grouped change in erythema rating, grouped change in telangiectasia rating, grouped change in IGA score, therapeutic response rate according to IGA, percentage change in ILC from baseline, and facial skin color rating at EoT.
Grouped change for all secondary end points was measured as improved, no change, or worsened relative to baseline. For grouped change in erythema and telangiectasia ratings, a participant was considered improved if the rating at the postbaseline visit was lower than the baseline rating, no change if the postbaseline and baseline ratings were identical, and worsened if the postbaseline rating was higher than at baseline. For grouped change in IGA score, a participant was considered improved if a responder showed at least a 1-step improvement postbaseline compared to baseline, no change if postbaseline and baseline ratings were identical, and worsened if the postbaseline rating was higher than at baseline.
For the therapeutic response rate, a participant was considered a treatment responder if the IGA score improved from baseline and resulted in clear, minimal, or mild disease severity at EoT.
Safety
Adverse events also were assessed.
Statistical Analyses
Secondary efficacy and safety end points were assessed for all randomized participants who were dispensed the study medication. Missing data were imputed using last observation carried forward.
For the percentage change in ILC from baseline, therapeutic response rate, and grouped change in erythema rating, confirmatory analyses were conducted in a hierarchical manner (in the order listed), with testing stopped as soon as a null hypothesis of superior treatment effect could not be rejected. Analyses without significance level were exploratory. The Cochran-Mantel-Haenszel van Elteren test stratified by study center was used for grouped change in erythema rating (1-tailed, 2.5%) and IGA score (2-tailed, 5%); Wilcoxon rank sum tests also were performed. Percentage change in ILC from baseline was evaluated using the Student t test and F test of analysis of covariance (1-tailed, 2.5%). Therapeutic response rate was evaluated using the Cochran-Mantel-Haenszel van Elteren test stratified by study center and the Pearson χ2 test. Facial skin color and grouped change in telangiectasia rating were evaluated using the Wilcoxon rank sum test.
Adverse events beginning or worsening after the first dose of the study drug were considered treatment emergent and were coded using the Medical Dictionary for Regulatory Activities (MedDRA) Version 16.1. Statistical analyses were performed using SAS software version 9.2.
Results
Study Participants
The study included 961 total participants; 483 were randomized to the AzA foam group and 478 to the vehicle group (Figure 1). Overall, 803 participants completed follow-up; however, week 16 results for the efficacy outcomes include data for 4 additional patients (2 per study arm) who did not formally meet all requirements for follow-up completion. The mean age was 51.5 years, and the majority of the participants were white and female (Table 1). Most participants (86.8%) had moderate PPR at baseline, with the remaining rated as having severe disease (13.2%). The majority (76.4%) had more than 14 inflammatory lesions with moderate (76.4%) or severe (15.1%) erythema at baseline.
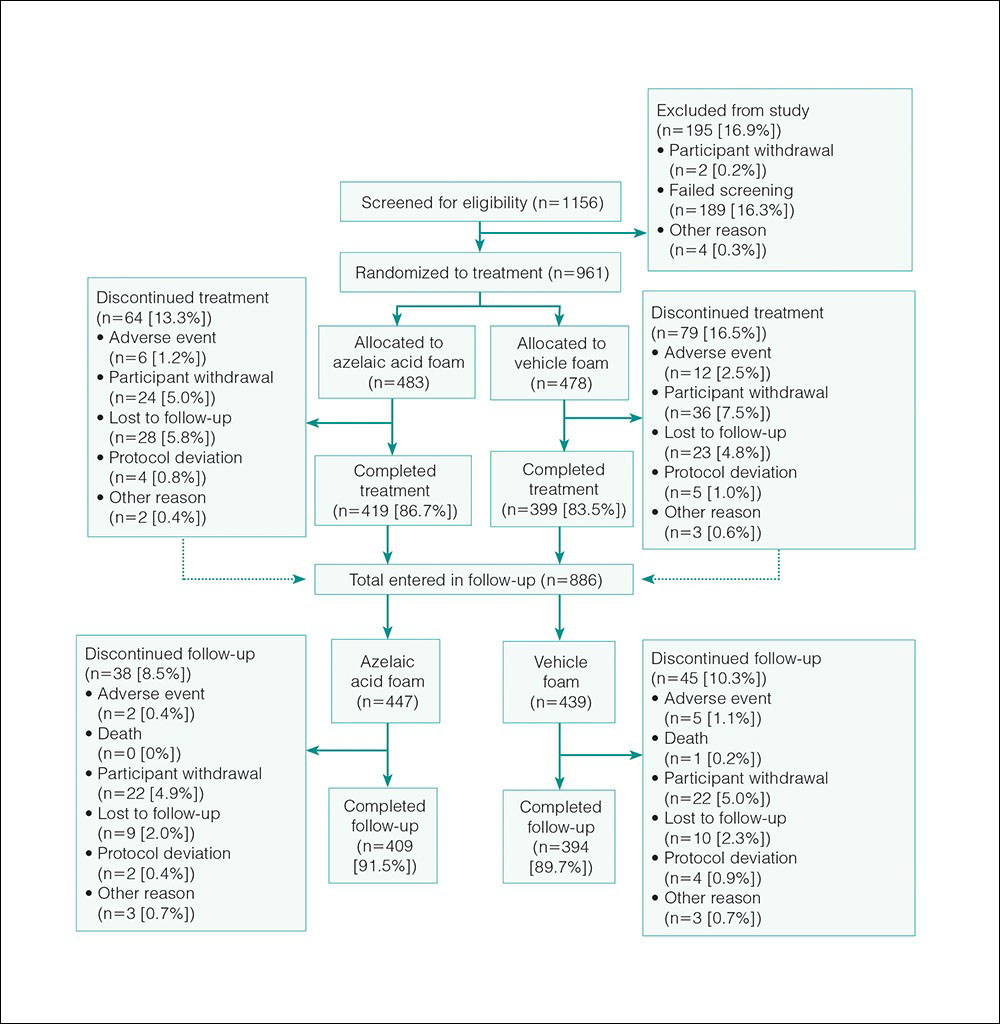
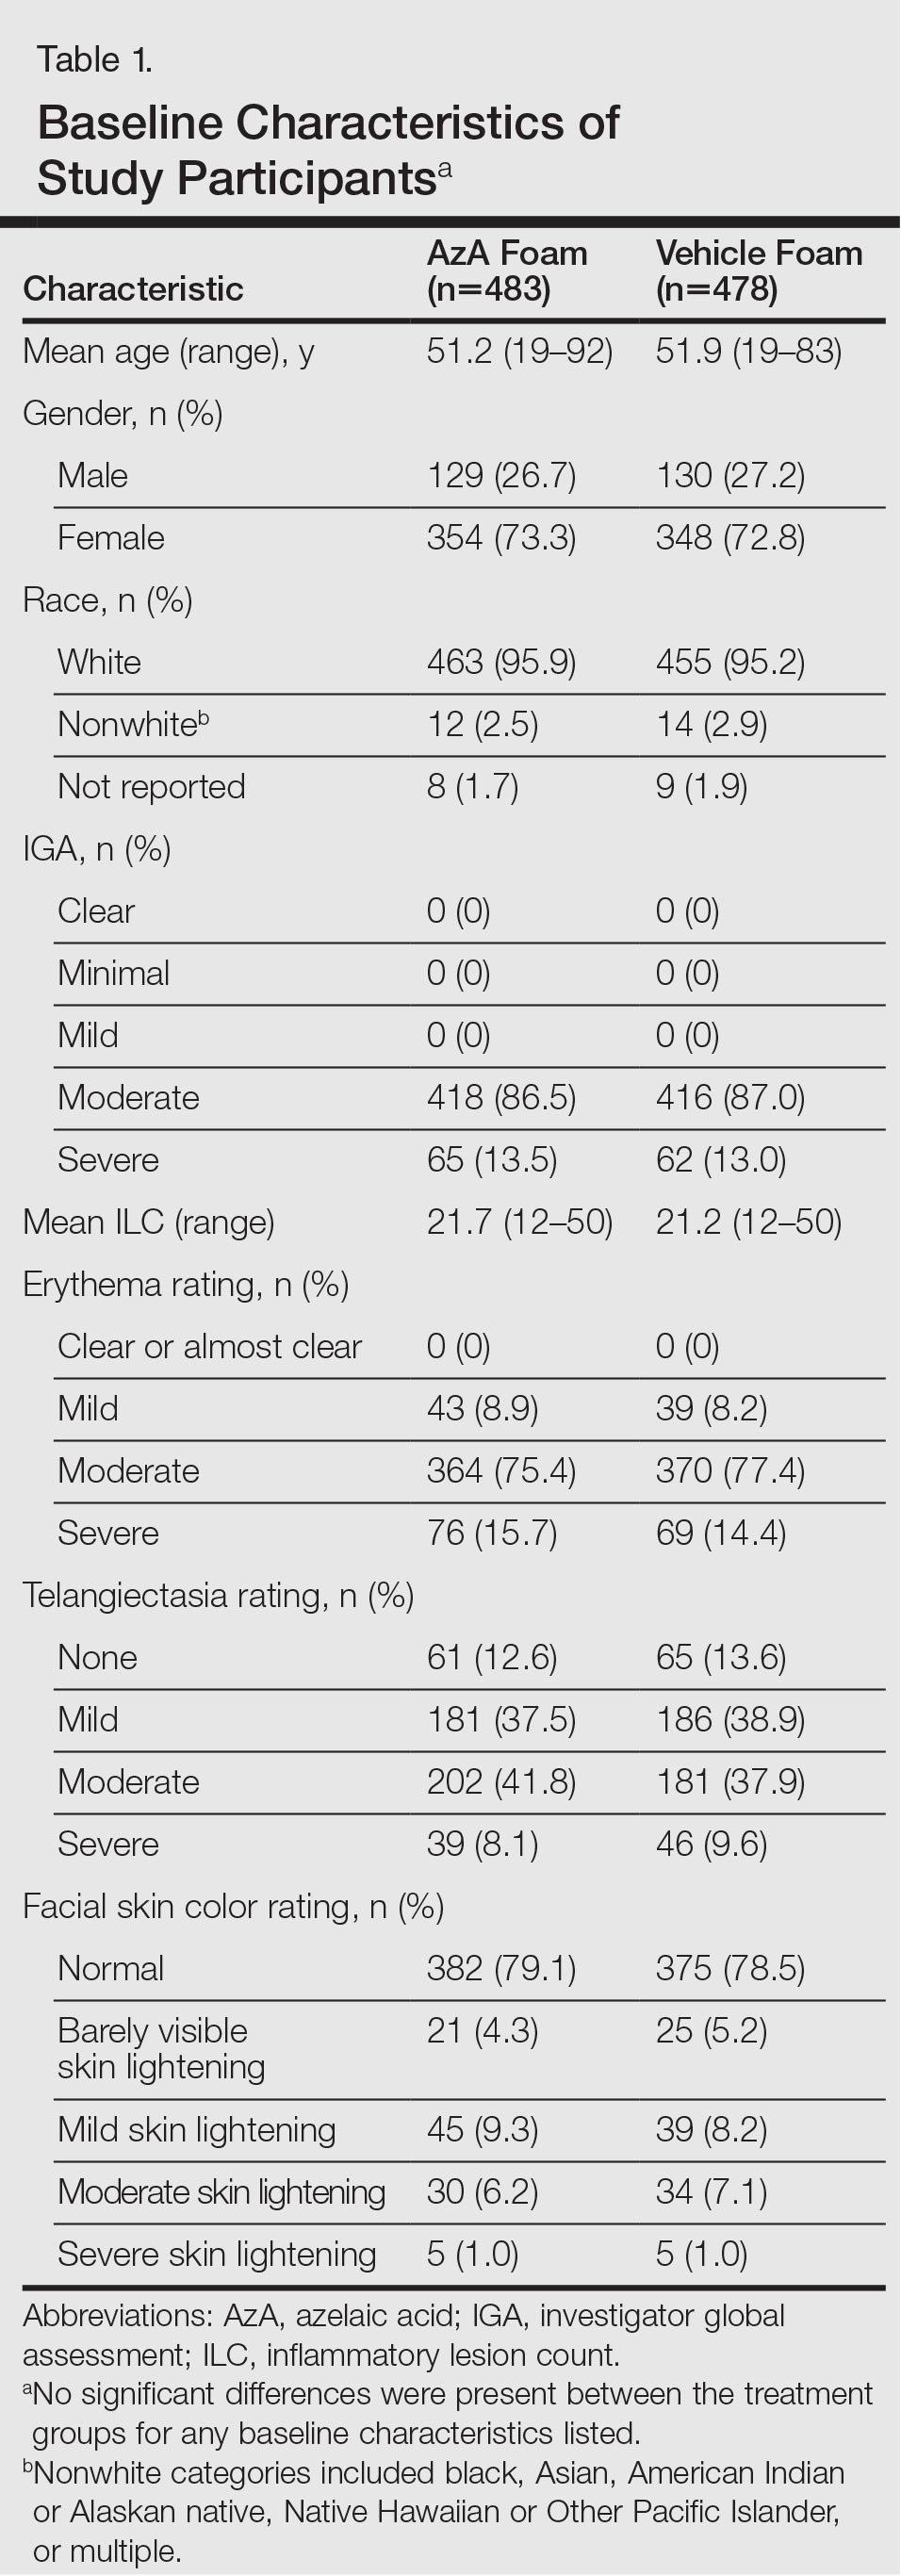
Efficacy
Significantly more participants in the AzA group than in the vehicle group showed an improved erythema rating at EoT (61.5% vs 51.3%; P<.001)(Figure 2), with more participants in the AzA group showing improvement at weeks 4 (P=.022) and 8 (P=.002).
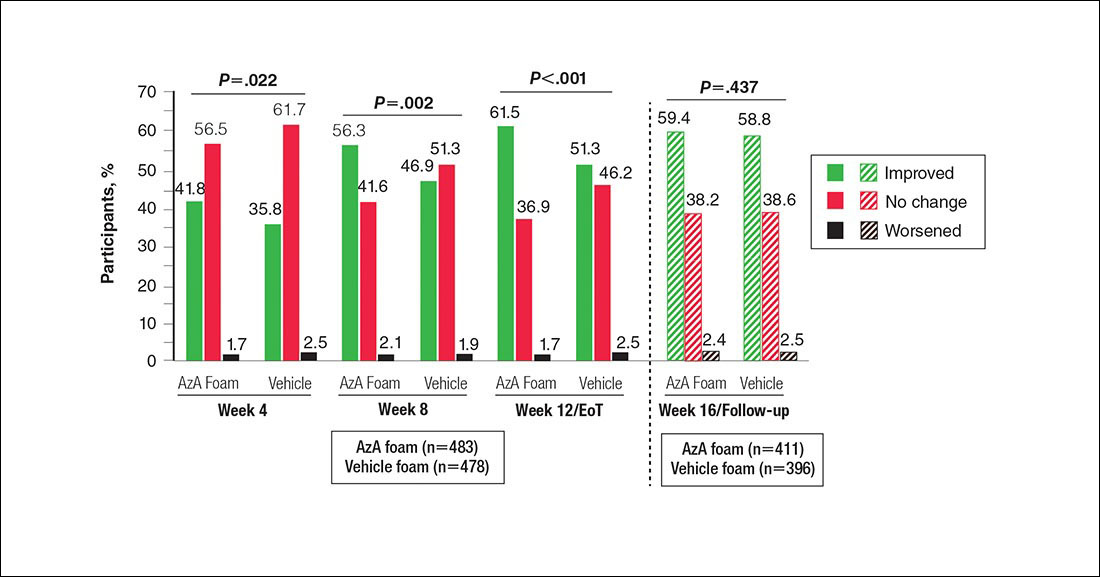
A significantly greater mean percentage reduction in ILC from baseline to EoT was observed in the AzA group versus the vehicle group (61.6% vs 50.8%; P<.001)(Figure 3), and between-group differences were observed at week 4 (P<.001), week 8 (P=.003), and week 16 (end of study/follow-up)(P=.002).
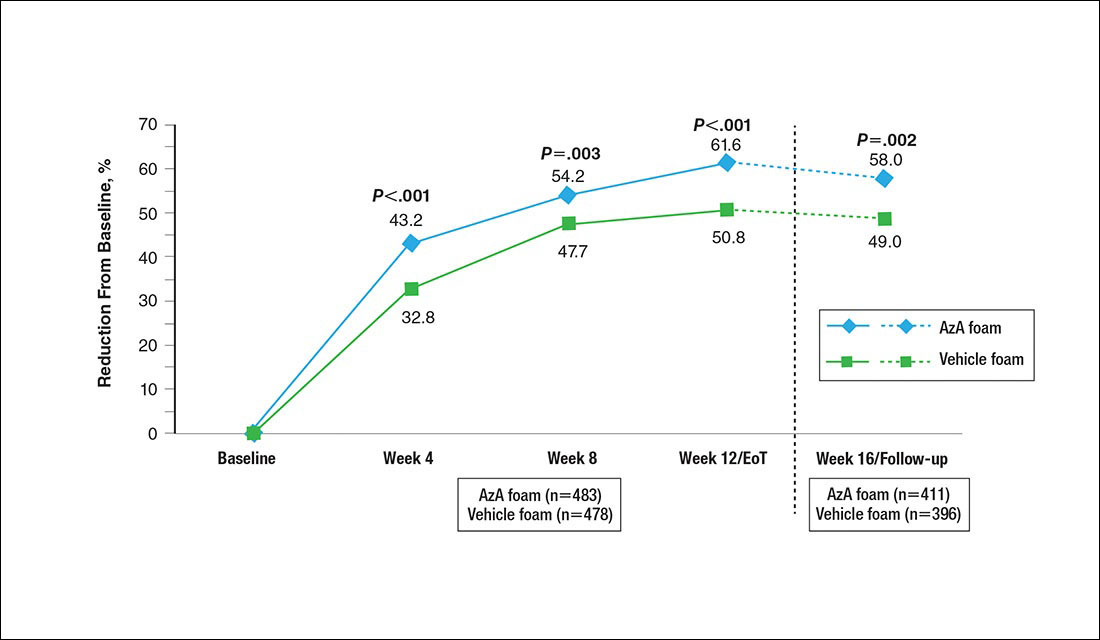
A significantly higher proportion of participants treated with AzA foam versus vehicle were considered responders at week 12/EoT (66.3% vs 54.4%; P<.001)(Figure 4). Differences in responder rate also were observed at week 4 (P=.026) and week 8 (P=.026).
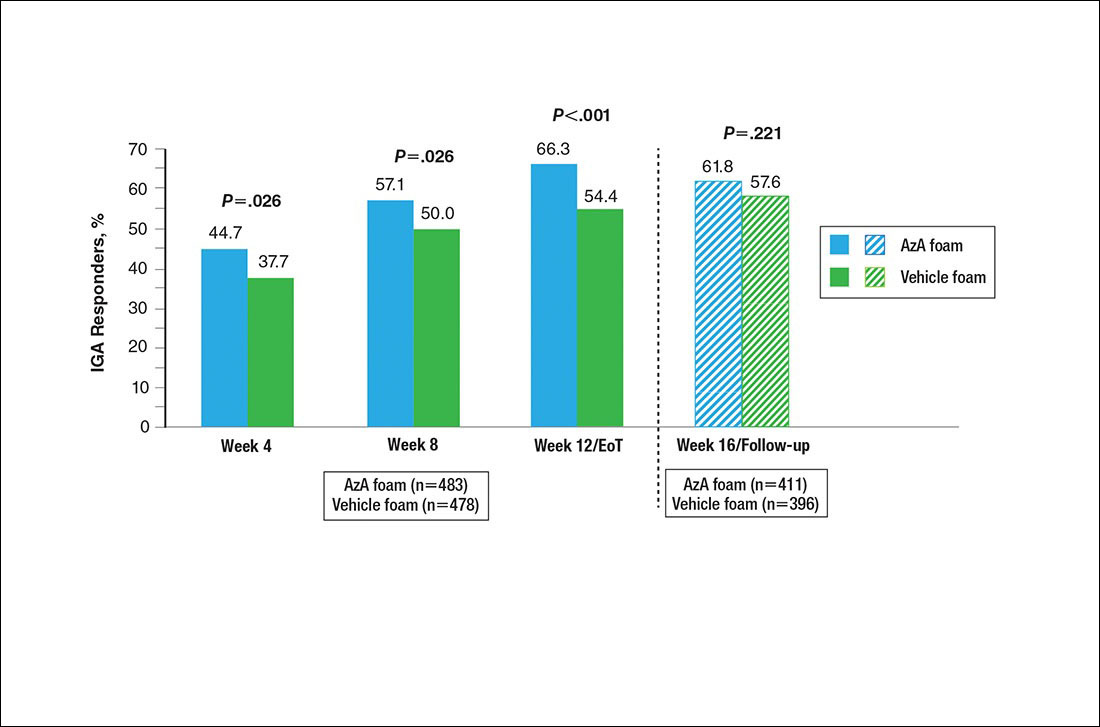
No study drug was administered between week 12/EoT and week 16/follow-up; last observation carried forward was not applied to week 16/follow-up analysis. AzA indicates azelaic acid; IGA, investigator global assessment.
Differences in grouped change in IGA score were observed between groups at every evaluation during the treatment phase (Figure 5). Specifically, IGA score was improved at week 12/EoT relative to baseline in 71.2% of participants in the AzA group versus 58.8% in the vehicle group (P<.001).
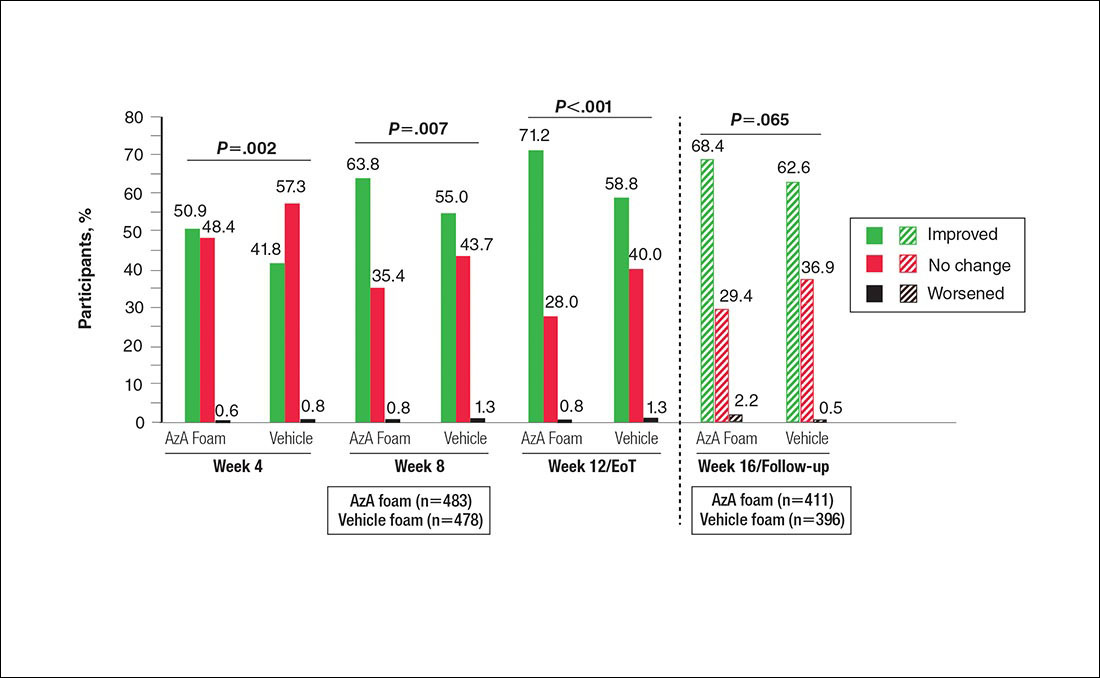
For grouped change in telangiectasia rating at EoT, the majority of participants in both treatment groups showed no change (Table 2). Regarding facial skin color, the majority of participants in both the AzA and vehicle treatment groups (80.1% and 78.7%, respectively) showed normal skin color compared to nontreated skin EoT; no between-group differences were detected for facial skin color rating (P=.315, Wilcoxon rank sum test).
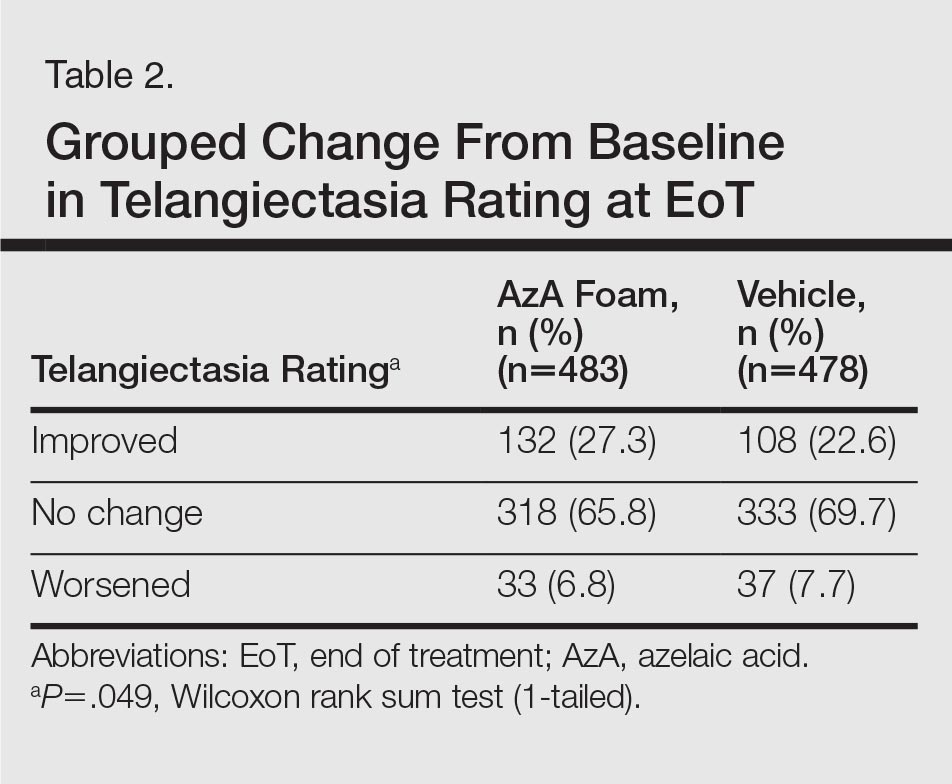
Safety
The incidence of drug-related AEs was greater in the AzA group than the vehicle group (7.7% vs 4.8%)(Table 3). Drug-related AEs occurring in at least 1% of the AzA group were pain at application site (eg, tenderness, stinging, burning)(AzA group, 3.5%; vehicle group, 1.3%), application-site pruritus (1.4% vs 0.4%), and application-site dryness (1.0% vs 0.6%). A single drug-related AE of severe intensity (ie, application-site dermatitis) was observed in the vehicle group; all other drug-related AEs were mild or moderate. The incidence of withdrawals due to AEs was lower in the AzA group than the vehicle group (1.2% vs 2.5%). This AE profile correlated with a treatment compliance (the percentage of expected doses that were actually administered) of 97.0% in the AzA group and 95.9% in the vehicle group. One participant in the vehicle group died due to head trauma unrelated to administration of the study drug.
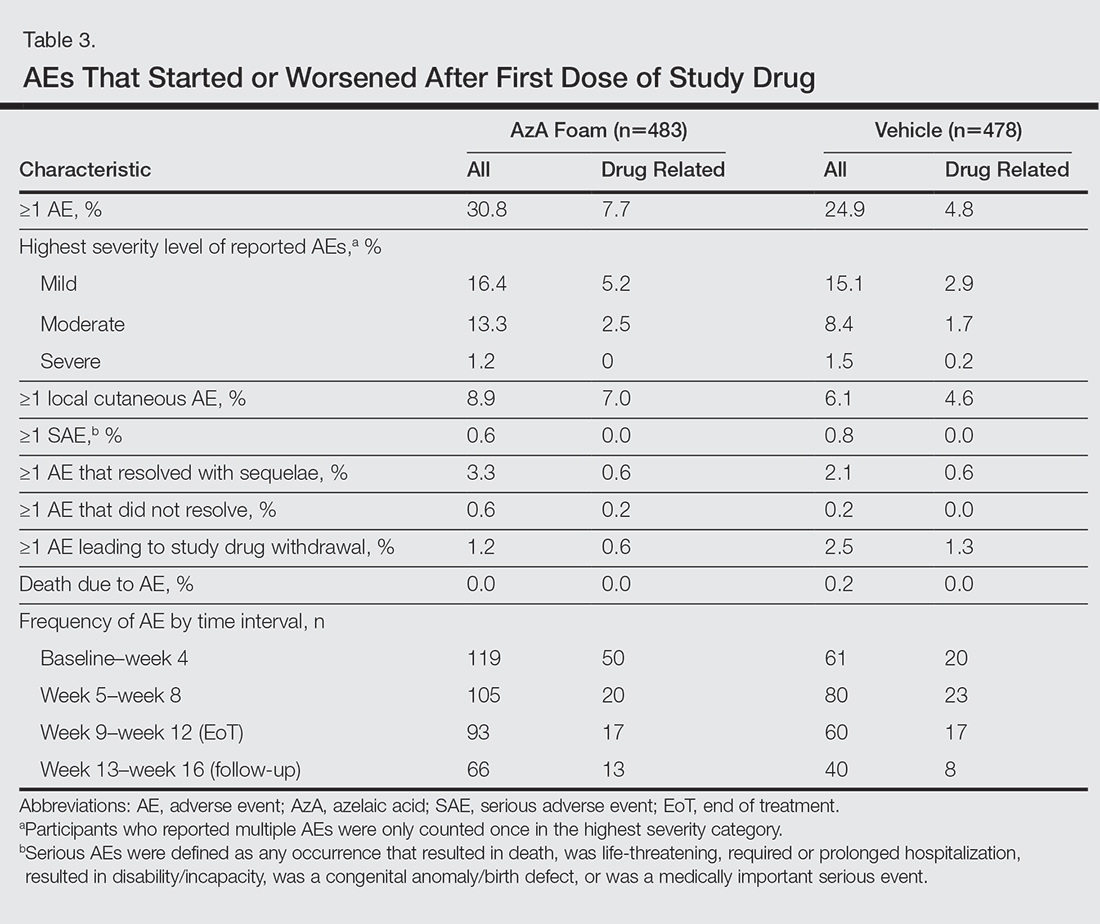
Comment
The results of this study further support the efficacy of AzA foam for the treatment of PPR. The percentage reduction in ILC was consistent with nominal decreases in ILC, a coprimary efficacy end point of this study.12 Almost two-thirds of participants treated with AzA foam achieved a therapeutic response, indicating that many participants who did not strictly achieve the primary outcome of therapeutic success nevertheless attained notable reductions in disease severity. The number of participants who showed any improvement on the IGA scale increased throughout the course of treatment (63.8% AzA foam vs 55.0% vehicle at week 8) up to EoT (71.2% vs 58.8%)(Figure 5). In addition, the number of participants showing any improvement at week 8 (63.8% AzA foam vs 55.0% vehicle)(Figure 5) was comparable to the number of participants achieving therapeutic response at week 12/EoT (66.3% vs 54.4%)(Figure 4). These data suggest that increasing time of treatment increases the likelihood of achieving better results.
Erythema also appeared to respond to AzA foam, with 10.2% more participants in the AzA group demonstrating improvement at week 12/EoT compared to vehicle. The difference in grouped change in erythema rating also was statistically significant and favored AzA foam, sustained up to 4 weeks after EoT.
The outcomes for percentage change in ILC, therapeutic response rate, and grouped change in erythema rating consequently led to the rejection of all 3 null hypotheses in hierarchical confirmatory analyses, underscoring the benefits of AzA foam treatment.
The therapeutic effects of AzA foam were apparent at the first postbaseline evaluation and persisted throughout treatment. Differences favoring AzA foam were observed at every on-treatment evaluation for grouped change in erythema rating, percentage change in ILC, therapeutic response rate, and grouped change in IGA score. Symptoms showed minimal resurgence after treatment cessation, and there were no signs of disease flare-up within the 4 weeks of observational follow-up. In addition, the percentage reduction in ILC remained higher in the AzA foam group during follow-up.
These results also show that AzA foam was well tolerated with a low incidence of discontinuation because of drug-related AEs. No serious drug-related AEs were reported for this study or in the preceding phase 2 trial.12,13 Although not directly evaluated, the low incidence of cutaneous AEs suggests that AzA foam may be better tolerated than prior formulations of AzA14,15 and correlates with high compliance observed during the study.12 Azelaic acid foam appeared to have minimal to no effect on skin color, with more than 88% of participants reporting barely visible or no skin lightening.
Interestingly, the vehicle foam showed appreciable efficacy independent of AzA. Improvements in erythema were recorded in approximately half of the vehicle group at week 12/EoT. A similar proportion attained a therapeutic response, and ILC was reduced by 50.8% at week 12/EoT. Comparable results also were evident in the vehicle group for the primary end points of this study.12 Vehicles in dermatologic trials frequently exert effects on diseased skin16,17 via a skin care regimen effect (eg, moisturization and other vehicle-related effects that may improve skin barrier integrity and function) and thus should not be regarded as placebo controls. The mechanism underlying this efficacy may be due to the impact of vehicle composition on skin barrier integrity and transepidermal water loss.18 The hydrophilic emulsion or other constituents of AzA foam (eg, fatty alcohols) may play a role.
A notable strength of our study is detailed clinical characterization using carefully chosen parameters and preplanned analyses that complement the primary end points. As the latter are often driven by regulatory requirements, opportunities to characterize other outcomes of interest to clinicians may be missed. The additional analyses reported here hopefully will aid dermatologists in both assessing the role of AzA foam in the treatment armamentarium for PPR and counseling patients.
Because participants with lighter skin pigmentation dominated our study population, the impact of AzA foam among patients with darker skin complexions is unknown. Although AzA is unlikely to cause hypopigmentation in normal undiseased skin, patients should be monitored for early signs of hypopigmentation.19,20 Our data also do not allow assessment of the differential effect, if any, of AzA foam on erythema of different etiologies in PPR, as corresponding information was not collected in the trial.
Conclusion
Azelaic acid foam 15% combines a well-established treatment of PPR with new vehicle technology to deliver effective therapy across multiple disease dimensions. In addition, the vehicle foam appears to demonstrate inherent therapeutic properties independent of AzA. The availability of this novel, efficacious, and well-tolerated option for PPR has the potential to improve patient care, reduce disease burden, and minimize unnecessary costs through increased tolerability and compliance.21
Acknowledgment
Editorial support through inVentiv Medical Communications (New York, New York) was provided by Bayer Pharmaceuticals.
- Tan J, Berg M. Rosacea: current state of epidemiology. J Am Acad Dermatol. 2013;69(6, suppl 1):S27-S35.
- Wilkin J, Dahl M, Detmar M, et al. Standard classification of rosacea: report of the National Rosacea Society Expert Committee on the classification and staging of rosacea. J Am Acad Dermatol. 2002;46:584-587.
- Chang AL, Raber I, Xu J, et al. Assessment of the genetic basis of rosacea by genome-wide association study. J Invest Dermatol. 2015;135:1548-1555.
- Abram K, Silm H, Maaroos HI, et al. Risk factors associated with rosacea. J Eur Acad Dermatol Venereol. 2010;24:565-571.
- Yamasaki K, Di Nardo A, Bardan A, et al. Increased serine protease activity and cathelicidin promotes skin inflammation in rosacea. Nat Med. 2007;13:975-980.
- Yamasaki K, Kanada K, Macleod DT, et al. TLR2 expression is increased in rosacea and stimulates enhanced serine protease production by keratinocytes. J Invest Dermatol. 2011;131:688-697.
- Darlenski R, Kazandjieva J, Tsankov N, et al. Acute irritant threshold correlates with barrier function, skin hydration and contact hypersensitivity in atopic dermatitis and rosacea. Exp Dermatol. 2013;22:752-753.
- Del Rosso JQ, Levin J. The clinical relevance of maintaining the functional integrity of the stratum corneum in both healthy and disease-affected skin. J Clin Aesthet Dermatol. 2011;4:22-42.
- van Zuuren EJ, Kramer SF, Carter BR, et al. Effective and evidence-based management strategies for rosacea: summary of a Cochrane systematic review. Br J Dermatol. 2011;165:760-781.
- Tan X, Feldman SR, Chang J, et al. Topical drug delivery systems in dermatology: a review of patient adherence issues. Expert Opin Drug Deliv. 2012;9:1263-1271.
- Stein L. Clinical studies of a new vehicle formulation for topical corticosteroids in the treatment of psoriasis. J Am Acad Dermatol. 2005;53(1, suppl 1):S39-S49.
- Draelos ZD, Elewski BE, Harper JC, et al. A phase 3 randomized, double-blind, vehicle-controlled trial of azelaic acid foam 15% in the treatment of papulopustular rosacea. Cutis. 2015;96:54-61.
- Draelos ZD, Elewski B, Staedtler G, et al. Azelaic acid foam 15% in the treatment of papulopustular rosacea: a randomized, double-blind, vehicle-controlled study. Cutis. 2013;92:306-317.
- Finacea gel [package insert]. Whippany, NJ: Bayer HealthCare Pharmaceuticals Inc; 2016.
- Elewski BE, Fleischer AB Jr, Pariser DM. A comparison of 15% azelaic acid gel and 0.75% metronidazole gel in the topical treatment of papulopustular rosacea: results of a randomized trial. Arch Dermatol. 2003;139:1444-1450.
- Daniels R, Knie U. Galenics of dermal products—vehicles, properties and drug release. J Dtsch Dermatol Ges. 2007;5:367-383.
- Shamsudin N, Fleischer AB Jr. Vehicle or placebo? Investigators use incorrect terminology in randomized controlled trials half of the time: a systematic review of randomized controlled trials published in three major dermatology journals. J Drugs Dermatol. 2010;9:1221-1226.
- Del Rosso JQ, Thiboutot D, Gallo R, et al. Consensus recommendations from the American Acne & Rosacea Society on the management of rosacea, part 2: a status report on topical agents. Cutis. 2013;92:277-284.
- Finacea foam [package insert]. Whippany, NJ: Bayer HealthCare Pharmaceuticals Inc; 2015.
- Solano F, Briganti S, Picardo M, et al. Hypopigmenting agents: an updated review on biological, chemical and clinical aspects. Pigment Cell Res. 2006;19:550-571.
- Hammarstrom B, Wessling A, Nilsson JL. Pharmaceutical care for patients with skin diseases: a campaign year at Swedish pharmacies. J Clin Pharm Ther. 1995;20:327-334.
Papulopustular rosacea (PPR) is characterized by centrofacial papules, pustules, erythema, and occasionally telangiectasia.1,2 A myriad of factors, including genetic predisposition3 and environmental triggers,4 have been associated with dysregulated inflammatory responses,5 contributing to the disease pathogenesis and symptoms. Inflammation associated with PPR may decrease skin barrier function, increase transepidermal water loss, and reduce stratum corneum hydration,6,7 resulting in heightened skin sensitivity, pain, burning, and/or stinging.5,8
Azelaic acid (AzA), which historically has only been available in gel or cream formulations, is well established for the treatment of rosacea9; however, these formulations have been associated with application-site adverse events (AEs)(eg, burning, erythema, irritation), limited cosmetic acceptability, and reduced compliance or efficacy.10
For select skin conditions, active agents delivered in foam vehicles may offer superior tolerability with improved outcomes.11 An AzA foam 15% formulation was approved for the treatment of mild to moderate PPR. Primary outcomes from a phase 3 trial demonstrated the efficacy and safety of AzA foam in improving inflammatory lesion counts (ILCs) and disease severity in participants with PPR. The trial also evaluated additional secondary end points, including the effect of AzA foam on erythema, inflammatory lesions, treatment response, and other manifestations of PPR.12 The current study evaluated investigator-reported efficacy outcomes for these secondary end points for AzA foam 15% versus vehicle foam.
Methods
Study Design
This phase 3 multicenter, randomized, double-blind, vehicle-controlled, parallel-group clinical trial was conducted from September 2012 to January 2014 at 48 US study centers comparing the efficacy of AzA foam versus vehicle foam in patients with PPR. Eligible participants were 18 years and older with PPR rated as moderate or severe according to investigator global assessment (IGA), plus 12 to 50 inflammatory lesions and persistent erythema with or without telangiectasia. Exclusion criteria included known nonresponse to AzA, current or prior use (within 6 weeks of randomization) of noninvestigational products to treat rosacea, and presence of other dermatoses that could interfere with rosacea evaluation.
Participants were randomized into the AzA foam or vehicle group (1:1 ratio). The study medication was applied in 0.5-g doses twice daily until the end of treatment (EoT) at 12 weeks. Efficacy and safety parameters were evaluated at baseline and at 4, 8, and 12 weeks of treatment, and at a follow-up visit 4 weeks after EoT (week 16).
Results for the coprimary efficacy end points—therapeutic success rate according to IGA and nominal change in ILC—were previously reported.12
Investigator-Reported Secondary Efficacy Outcomes
The secondary efficacy end points were grouped change in erythema rating, grouped change in telangiectasia rating, grouped change in IGA score, therapeutic response rate according to IGA, percentage change in ILC from baseline, and facial skin color rating at EoT.
Grouped change for all secondary end points was measured as improved, no change, or worsened relative to baseline. For grouped change in erythema and telangiectasia ratings, a participant was considered improved if the rating at the postbaseline visit was lower than the baseline rating, no change if the postbaseline and baseline ratings were identical, and worsened if the postbaseline rating was higher than at baseline. For grouped change in IGA score, a participant was considered improved if a responder showed at least a 1-step improvement postbaseline compared to baseline, no change if postbaseline and baseline ratings were identical, and worsened if the postbaseline rating was higher than at baseline.
For the therapeutic response rate, a participant was considered a treatment responder if the IGA score improved from baseline and resulted in clear, minimal, or mild disease severity at EoT.
Safety
Adverse events also were assessed.
Statistical Analyses
Secondary efficacy and safety end points were assessed for all randomized participants who were dispensed the study medication. Missing data were imputed using last observation carried forward.
For the percentage change in ILC from baseline, therapeutic response rate, and grouped change in erythema rating, confirmatory analyses were conducted in a hierarchical manner (in the order listed), with testing stopped as soon as a null hypothesis of superior treatment effect could not be rejected. Analyses without significance level were exploratory. The Cochran-Mantel-Haenszel van Elteren test stratified by study center was used for grouped change in erythema rating (1-tailed, 2.5%) and IGA score (2-tailed, 5%); Wilcoxon rank sum tests also were performed. Percentage change in ILC from baseline was evaluated using the Student t test and F test of analysis of covariance (1-tailed, 2.5%). Therapeutic response rate was evaluated using the Cochran-Mantel-Haenszel van Elteren test stratified by study center and the Pearson χ2 test. Facial skin color and grouped change in telangiectasia rating were evaluated using the Wilcoxon rank sum test.
Adverse events beginning or worsening after the first dose of the study drug were considered treatment emergent and were coded using the Medical Dictionary for Regulatory Activities (MedDRA) Version 16.1. Statistical analyses were performed using SAS software version 9.2.
Results
Study Participants
The study included 961 total participants; 483 were randomized to the AzA foam group and 478 to the vehicle group (Figure 1). Overall, 803 participants completed follow-up; however, week 16 results for the efficacy outcomes include data for 4 additional patients (2 per study arm) who did not formally meet all requirements for follow-up completion. The mean age was 51.5 years, and the majority of the participants were white and female (Table 1). Most participants (86.8%) had moderate PPR at baseline, with the remaining rated as having severe disease (13.2%). The majority (76.4%) had more than 14 inflammatory lesions with moderate (76.4%) or severe (15.1%) erythema at baseline.
Efficacy
Significantly more participants in the AzA group than in the vehicle group showed an improved erythema rating at EoT (61.5% vs 51.3%; P<.001)(Figure 2), with more participants in the AzA group showing improvement at weeks 4 (P=.022) and 8 (P=.002).
A significantly greater mean percentage reduction in ILC from baseline to EoT was observed in the AzA group versus the vehicle group (61.6% vs 50.8%; P<.001)(Figure 3), and between-group differences were observed at week 4 (P<.001), week 8 (P=.003), and week 16 (end of study/follow-up)(P=.002).
A significantly higher proportion of participants treated with AzA foam versus vehicle were considered responders at week 12/EoT (66.3% vs 54.4%; P<.001)(Figure 4). Differences in responder rate also were observed at week 4 (P=.026) and week 8 (P=.026).
No study drug was administered between week 12/EoT and week 16/follow-up; last observation carried forward was not applied to week 16/follow-up analysis. AzA indicates azelaic acid; IGA, investigator global assessment.
Differences in grouped change in IGA score were observed between groups at every evaluation during the treatment phase (Figure 5). Specifically, IGA score was improved at week 12/EoT relative to baseline in 71.2% of participants in the AzA group versus 58.8% in the vehicle group (P<.001).
For grouped change in telangiectasia rating at EoT, the majority of participants in both treatment groups showed no change (Table 2). Regarding facial skin color, the majority of participants in both the AzA and vehicle treatment groups (80.1% and 78.7%, respectively) showed normal skin color compared to nontreated skin EoT; no between-group differences were detected for facial skin color rating (P=.315, Wilcoxon rank sum test).
Safety
The incidence of drug-related AEs was greater in the AzA group than the vehicle group (7.7% vs 4.8%)(Table 3). Drug-related AEs occurring in at least 1% of the AzA group were pain at application site (eg, tenderness, stinging, burning)(AzA group, 3.5%; vehicle group, 1.3%), application-site pruritus (1.4% vs 0.4%), and application-site dryness (1.0% vs 0.6%). A single drug-related AE of severe intensity (ie, application-site dermatitis) was observed in the vehicle group; all other drug-related AEs were mild or moderate. The incidence of withdrawals due to AEs was lower in the AzA group than the vehicle group (1.2% vs 2.5%). This AE profile correlated with a treatment compliance (the percentage of expected doses that were actually administered) of 97.0% in the AzA group and 95.9% in the vehicle group. One participant in the vehicle group died due to head trauma unrelated to administration of the study drug.
Comment
The results of this study further support the efficacy of AzA foam for the treatment of PPR. The percentage reduction in ILC was consistent with nominal decreases in ILC, a coprimary efficacy end point of this study.12 Almost two-thirds of participants treated with AzA foam achieved a therapeutic response, indicating that many participants who did not strictly achieve the primary outcome of therapeutic success nevertheless attained notable reductions in disease severity. The number of participants who showed any improvement on the IGA scale increased throughout the course of treatment (63.8% AzA foam vs 55.0% vehicle at week 8) up to EoT (71.2% vs 58.8%)(Figure 5). In addition, the number of participants showing any improvement at week 8 (63.8% AzA foam vs 55.0% vehicle)(Figure 5) was comparable to the number of participants achieving therapeutic response at week 12/EoT (66.3% vs 54.4%)(Figure 4). These data suggest that increasing time of treatment increases the likelihood of achieving better results.
Erythema also appeared to respond to AzA foam, with 10.2% more participants in the AzA group demonstrating improvement at week 12/EoT compared to vehicle. The difference in grouped change in erythema rating also was statistically significant and favored AzA foam, sustained up to 4 weeks after EoT.
The outcomes for percentage change in ILC, therapeutic response rate, and grouped change in erythema rating consequently led to the rejection of all 3 null hypotheses in hierarchical confirmatory analyses, underscoring the benefits of AzA foam treatment.
The therapeutic effects of AzA foam were apparent at the first postbaseline evaluation and persisted throughout treatment. Differences favoring AzA foam were observed at every on-treatment evaluation for grouped change in erythema rating, percentage change in ILC, therapeutic response rate, and grouped change in IGA score. Symptoms showed minimal resurgence after treatment cessation, and there were no signs of disease flare-up within the 4 weeks of observational follow-up. In addition, the percentage reduction in ILC remained higher in the AzA foam group during follow-up.
These results also show that AzA foam was well tolerated with a low incidence of discontinuation because of drug-related AEs. No serious drug-related AEs were reported for this study or in the preceding phase 2 trial.12,13 Although not directly evaluated, the low incidence of cutaneous AEs suggests that AzA foam may be better tolerated than prior formulations of AzA14,15 and correlates with high compliance observed during the study.12 Azelaic acid foam appeared to have minimal to no effect on skin color, with more than 88% of participants reporting barely visible or no skin lightening.
Interestingly, the vehicle foam showed appreciable efficacy independent of AzA. Improvements in erythema were recorded in approximately half of the vehicle group at week 12/EoT. A similar proportion attained a therapeutic response, and ILC was reduced by 50.8% at week 12/EoT. Comparable results also were evident in the vehicle group for the primary end points of this study.12 Vehicles in dermatologic trials frequently exert effects on diseased skin16,17 via a skin care regimen effect (eg, moisturization and other vehicle-related effects that may improve skin barrier integrity and function) and thus should not be regarded as placebo controls. The mechanism underlying this efficacy may be due to the impact of vehicle composition on skin barrier integrity and transepidermal water loss.18 The hydrophilic emulsion or other constituents of AzA foam (eg, fatty alcohols) may play a role.
A notable strength of our study is detailed clinical characterization using carefully chosen parameters and preplanned analyses that complement the primary end points. As the latter are often driven by regulatory requirements, opportunities to characterize other outcomes of interest to clinicians may be missed. The additional analyses reported here hopefully will aid dermatologists in both assessing the role of AzA foam in the treatment armamentarium for PPR and counseling patients.
Because participants with lighter skin pigmentation dominated our study population, the impact of AzA foam among patients with darker skin complexions is unknown. Although AzA is unlikely to cause hypopigmentation in normal undiseased skin, patients should be monitored for early signs of hypopigmentation.19,20 Our data also do not allow assessment of the differential effect, if any, of AzA foam on erythema of different etiologies in PPR, as corresponding information was not collected in the trial.
Conclusion
Azelaic acid foam 15% combines a well-established treatment of PPR with new vehicle technology to deliver effective therapy across multiple disease dimensions. In addition, the vehicle foam appears to demonstrate inherent therapeutic properties independent of AzA. The availability of this novel, efficacious, and well-tolerated option for PPR has the potential to improve patient care, reduce disease burden, and minimize unnecessary costs through increased tolerability and compliance.21
Acknowledgment
Editorial support through inVentiv Medical Communications (New York, New York) was provided by Bayer Pharmaceuticals.
- Tan J, Berg M. Rosacea: current state of epidemiology. J Am Acad Dermatol. 2013;69(6, suppl 1):S27-S35.
- Wilkin J, Dahl M, Detmar M, et al. Standard classification of rosacea: report of the National Rosacea Society Expert Committee on the classification and staging of rosacea. J Am Acad Dermatol. 2002;46:584-587.
- Chang AL, Raber I, Xu J, et al. Assessment of the genetic basis of rosacea by genome-wide association study. J Invest Dermatol. 2015;135:1548-1555.
- Abram K, Silm H, Maaroos HI, et al. Risk factors associated with rosacea. J Eur Acad Dermatol Venereol. 2010;24:565-571.
- Yamasaki K, Di Nardo A, Bardan A, et al. Increased serine protease activity and cathelicidin promotes skin inflammation in rosacea. Nat Med. 2007;13:975-980.
- Yamasaki K, Kanada K, Macleod DT, et al. TLR2 expression is increased in rosacea and stimulates enhanced serine protease production by keratinocytes. J Invest Dermatol. 2011;131:688-697.
- Darlenski R, Kazandjieva J, Tsankov N, et al. Acute irritant threshold correlates with barrier function, skin hydration and contact hypersensitivity in atopic dermatitis and rosacea. Exp Dermatol. 2013;22:752-753.
- Del Rosso JQ, Levin J. The clinical relevance of maintaining the functional integrity of the stratum corneum in both healthy and disease-affected skin. J Clin Aesthet Dermatol. 2011;4:22-42.
- van Zuuren EJ, Kramer SF, Carter BR, et al. Effective and evidence-based management strategies for rosacea: summary of a Cochrane systematic review. Br J Dermatol. 2011;165:760-781.
- Tan X, Feldman SR, Chang J, et al. Topical drug delivery systems in dermatology: a review of patient adherence issues. Expert Opin Drug Deliv. 2012;9:1263-1271.
- Stein L. Clinical studies of a new vehicle formulation for topical corticosteroids in the treatment of psoriasis. J Am Acad Dermatol. 2005;53(1, suppl 1):S39-S49.
- Draelos ZD, Elewski BE, Harper JC, et al. A phase 3 randomized, double-blind, vehicle-controlled trial of azelaic acid foam 15% in the treatment of papulopustular rosacea. Cutis. 2015;96:54-61.
- Draelos ZD, Elewski B, Staedtler G, et al. Azelaic acid foam 15% in the treatment of papulopustular rosacea: a randomized, double-blind, vehicle-controlled study. Cutis. 2013;92:306-317.
- Finacea gel [package insert]. Whippany, NJ: Bayer HealthCare Pharmaceuticals Inc; 2016.
- Elewski BE, Fleischer AB Jr, Pariser DM. A comparison of 15% azelaic acid gel and 0.75% metronidazole gel in the topical treatment of papulopustular rosacea: results of a randomized trial. Arch Dermatol. 2003;139:1444-1450.
- Daniels R, Knie U. Galenics of dermal products—vehicles, properties and drug release. J Dtsch Dermatol Ges. 2007;5:367-383.
- Shamsudin N, Fleischer AB Jr. Vehicle or placebo? Investigators use incorrect terminology in randomized controlled trials half of the time: a systematic review of randomized controlled trials published in three major dermatology journals. J Drugs Dermatol. 2010;9:1221-1226.
- Del Rosso JQ, Thiboutot D, Gallo R, et al. Consensus recommendations from the American Acne & Rosacea Society on the management of rosacea, part 2: a status report on topical agents. Cutis. 2013;92:277-284.
- Finacea foam [package insert]. Whippany, NJ: Bayer HealthCare Pharmaceuticals Inc; 2015.
- Solano F, Briganti S, Picardo M, et al. Hypopigmenting agents: an updated review on biological, chemical and clinical aspects. Pigment Cell Res. 2006;19:550-571.
- Hammarstrom B, Wessling A, Nilsson JL. Pharmaceutical care for patients with skin diseases: a campaign year at Swedish pharmacies. J Clin Pharm Ther. 1995;20:327-334.
Practice Points
- Papulopustular rosacea (PPR) is a common chronic inflammatory dermatosis.
- A novel hydrophilic foam formulation of azelaic acid (AzA) was approved for the treatment of PPR.
- In addition to effectively treating papules and pustules, AzA foam also may reduce rosacea-associated erythema.
- The unique AzA foam vehicle may improve epidermal barrier integrity and function, thereby offering patients a distinct topical approach to rosacea management.
Metastatic Small Cell Carcinoma of the Lung: An Unusual Cause of Acute Fulminant Hepatic Failure
For patients with acute fulminant liver failure, imaging and histopathologic studies are indicated to reveal the underlying etiology, and metastatic small cell carcinoma should be included in the clinical differential diagnosis when appropriate.
Acute fulminant hepatic failure (FHF) is an uncommon but highly fatal condition that results from the massive destruction of liver tissue. Viral hepatitis and drug-induced liver damage predominate in North America and Europe, but the underlying precipitating factors differ around the world.1 In children, indeterminate causes account for more than 50% of cases.2 Other conditions associated with FHF are Budd-Chiari syndrome, vascular hypoperfusion, mushroom poisoning, Wilson disease, autoimmune hepatitis, and fatty liver of pregnancy.3
Neoplastic lesions of the liver, mostly metastatic carcinomas, present with ductular obstruction with occasional mild elevations in aminotransferases. Rarely do space-occupying lesions lead to acute liver failure (ALF) with massive hepatocyte necrosis.
The authors report a case of rapidly progressing ALF due to metastatic small cell carcinoma to the liver. Small cell lung carcinoma (SCLC) is an aggressive tumor that often presents at an advanced stage. Although liver metastasis is common in this disease, development of FHF is extremely uncommon.
Case Presentation
A 90-year-old African American man presented to the emergency department (ED) of the Brooklyn Campus of the VA New York Harbor Health Care System (VANYHHS), with a persistent cough, worsening of shortness of breath, increasing right upper quadrant abdominal pain, and chronic constipation. He noted that he had smoked 1 pack per day for 40 years but quit 30 years ago. He had a medical history of chronic obstructive pulmonary disease (COPD), hypertension, prostate cancer treated 20 years earlier with external beam radiation therapy and with intramuscular leuprolide every 6 months for the previous 6.5 years, and gout. He was taking no hepatotoxic prescription medications and never used over-the-counter analgesics or abused alcohol. Five days before admission, he was treated for COPD exacerbation in the ED.
Blood chemistry at the time revealed significantly elevated liver function enzymes, including aspartate aminotransferase, alanine aminotransferase (ALT), alkaline phosphatase (AST), and total bilirubin compared with baseline levels taken 3 months earlier (Table). Primary care follow-up was recommended. Physical examination on the day of admission was remarkable for normal blood pressure (137/74), emaciated appearance, and a large liver with right upper quadrant tenderness.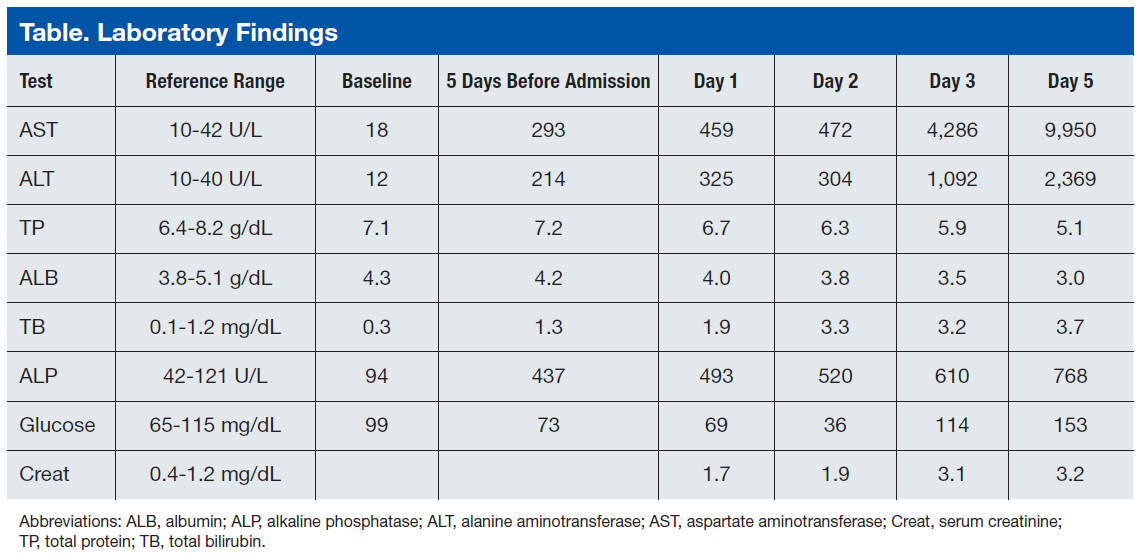
Repeat blood chemistries showed a further rise in liver function tests. Acetaminophen level was < 1.0 μg/mL (therapeutic range 10-20 μg/mL). Hepatitis A, B, and C serologic testing was negative. Serum creatinine was elevated at 1.7 mg/dL and steadily increased to 3.2 mg/dL at the end of the hospital course. A chest X-ray and a noncontrast computed tomography (CT) scan of the chest showed left upper lobe ill-defined infiltrates/opacities. Noncontrast abdominal and pelvic CT revealed hepatomegaly and ascites. Hepatic ultrasound showed that the liver was enlarged, diffusely heterogeneous, and nodular in appearance. The patient was admitted for evaluation.
On day 2 of admission, the patient reported “numbness of digits.” Serum glucose was measured and found to be low (36 mg/dL) (reference range: 70-110 mg/dL). He was subsequently managed for refractory hypoglycemia, which was presumed to be a result of liver disease. On day 3, he was transferred to the intensive care unit for close monitoring and management. On day 4, the patient was still experiencing episodes of hypoglycemia despite glucagon and dextrose administration. He developed altered mental status and metabolic acidosis and was intubated. Repeat laboratory tests showed a significant increase in AST and ALT with an AST:ALT ratio of about 4. Serum ammonia levels also were increased at 198.6 μg/dL (reference range: 17-80 μg/dL). The platelet count decreased to as low as 86 x 103/μL (reference range:150-450 x 103/μL). The prothrombin time (PT) increased continuously to as high as 21.4 sec (reference range: 9.6-12.4 sec) as did the activated partial thromboplastin time (aPTT) to 65.1 sec (reference range: 28-36.3 sec). Afterward, the patient developed multiple organ failure, including hemodynamic instability requiring fluid resuscitation. On day 5, the patient died.
At autopsy, the left upper lobe of the patient’s lung was found to have a tan-white, firm, irregularly shaped 4.8-cm mass. The liver weighed 2,980 g (reference range: 1,400-1,600 g) and was diffusely infiltrated by tan-white masses comprising about 70% of the liver (Figure 1).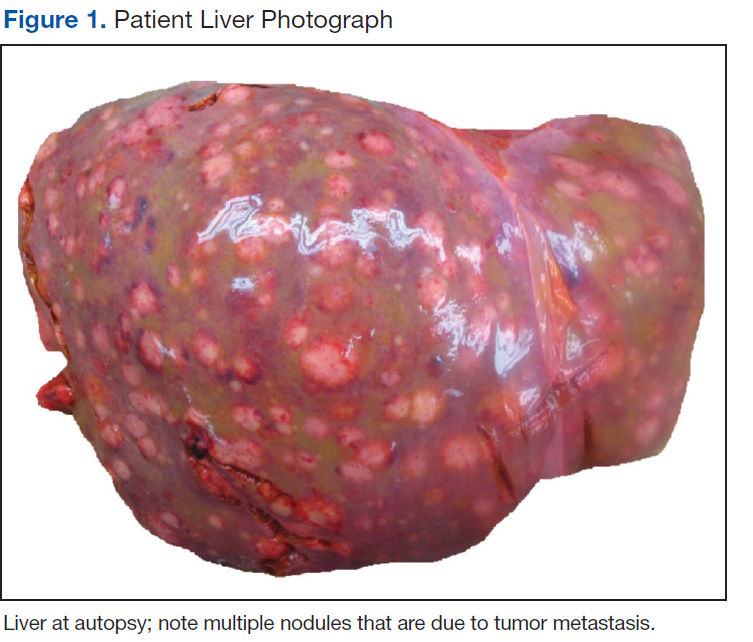
Histologic examination of the lung (Figure 2) and liver (Figure 3) masses revealed small, round, blue cells with high nucleocytoplasmic ratios, nuclear molding, and crushing artifact. The tumor cells were found to be positive for chromogranin and synaptophysin. The liver showed diffuse hepatocyte necrosis with few viable hepatocytes present. The autopsy case was signed out as SCLC with diffuse liver metastasis. 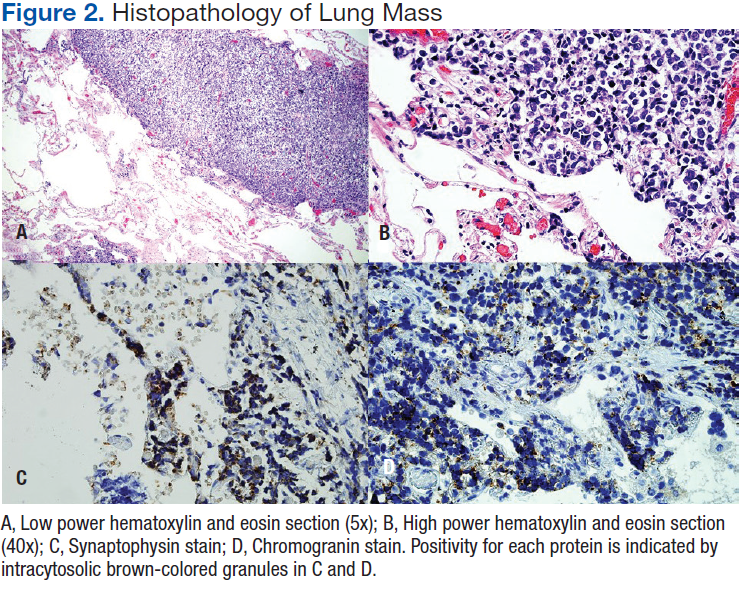

Discussion
Acute FHF is a rare condition that often presents with sudden onset in which patients become encephalopathic due to hyperammonemia and exhibit marked elevations in the 2 aminotransferases, AST and ALT. A prior study of this condition reported on 6 patients, 5 of whom succumbed to the condition and 3 of whom were autopsied.4 The study found that both AST and ALT became rapidly elevated markedly such that the AST to ALT ratio was significantly greater than 1 and often exceeding 2, a pattern suggesting mitochondrial damage in hepatocytes resulting in release of intramitochondrial AST in addition to extramitochondrial AST.4
In addition, total protein and albumin were significantly decreased, and serum ammonia levels were markedly increased. All patients were encepaholopathic and were found to have disseminated intravascular coagulopathy. Five of the 6 patients had renal failure, including 2 with acute tubular necrosis, and electrolyte abnormalities, including hypernatremia, in one case due to circulating elevated levels of aldosterone. Two of the 6 patients were found to be consistently hypoglycemic, possibly caused by impaired glycogenolysis. Three of these patients were found to have had lactic acidosis. In this study, liver biopsy was unrevealing and showed only minimal changes even during the earlier noted changes in laboratory values. Total hepatocyte necrosis was found only at postmortem examination.
Causes of FHF
Previous studies have identified possible causes of FHF that include alcohol abuse and IV drug abuse giving rise to pan-hepatic hepatitis—both conditions giving rise to cirrhosis; multiple abdominal surgeries; drug (acetaminophen) overdose; fatty liver of pregnancy resulting in microvesicular steatosis of hepatocytes; hypotension (shock liver); and Reye syndrome, mainly in children but also reported in adults, in which there is a viral prodrome with fever followed by treatment with aspirin that progresses to acute FHF.
Metastatic cancer is not generally listed as a potential cause of FHF. Although cancer is a less common cause of this condition, metastasis-induced FHF that has been documented in the literature includes tumors of the breast, gastrointestinal tract, lung, nasopharynx, melanoma, and hematolymphoid malignancies, including leukemia, Hodgkin disease, non-Hodgkin lymphomas, and malignant histiocytosis.5-12
Small Cell Carcinoma as a Cause of FHF
Small cell carcinoma of the lung is a highly malignant neoplasm that often presents at an advanced stage. Most often, metastatic disease to the liver may result in some mild increase in ALT and obstructive symptoms. However, diffuse sinusoidal infiltration of the tumor is most likely to present with hyperacute liver failure.13 A literature review of all small cell carcinomas in the liver presenting with acute FHF shows a consistent morphologic pattern of diffuse parenchymal infiltration,some that initially present with acute hepatic failure with no known history of liver disease.13-25 Imaging studies sometimes are difficult to interpret and may fail to detect infiltration of the tumor because of diffuse involvement of the liver parenchyma. Malignant infiltration of the liver should be one of the considerations in cases of unexplained hepatomegaly.
As found in the authors’ prior study, coagulopathy, renal failure (final creatinine was 3.2 mg/dL) as well as hypoglycemia are oftentimes seen, all of which were found in the patient in this study.4 (Coagulopathy was indicated by the low platelet count and elevated PT and aPTT.) Laboratory findings for FHF include rapid increases in serum ALTs such that the AST:ALT ratio is significantly greater than 1 and in which total protein and albumin are significantly decreased. Often there is hyperammonemia as was present in the current case.
A study has been performed to develop serodiagnostic markers to distinguish malignant from nonmalignant causes of FHF on 4 patients with tumor-induced FHF and 12 patients with FHF due to other causes. It was found that that there was an increase in the lactate dehydrogenase (LDH) to ALT ratio as well as elevated uric acid levels in the 4 patients with FHF not found in any of the 12 patients with nonmalignant causes of this condition.19 Although LDH was not measured in this case, in view of the patient’s history of gout, the LDH/uric acid ratio may not have been discriminating.
Conclusion
Although rare, metastatic small cell carcinoma should be included in the clinical differential diagnosis of patients presenting with acute FHF with no other obvious medical etiology. Accurate and timely diagnosis is important to better guide management of these patients.
Author disclosures
The authors report no actual or potential conflicts of interest with regard to this article.
Disclaimer
The opinions expressed herein are those of the authors and do not necessarily reflect those of Federal Practitioner, Frontline Medical Communications Inc., the U.S. Government, or any of its agencies. This article may discuss unlabeled or investigational use of certain drugs. Please review complete prescribing information for specific drugs or drug combinations—including indications, contraindications, warnings, and adverse effects—before administering pharmacologic therapy to patients.
Click here to read the digital edition.
1. Hoofnagle JH, Carithers RL Jr, Shapiro C, Ascher N. Fulminant hepatic failure: summary of workshop. Hepatology. 1995;21(1):240-252.
2. D’Agata ID, Balister WF. Pediatric aspects of acute liver failure. In: Lee WM, Williams R, eds. Acute Liver Failure. Cambridge, UK: Cambridge University Press, 1997:53-66.
3. Lee WM, Stravitz RT, Larson AM. Introduction to the revised American Association for the Study of Liver Diseases position paper on acute liver failure 2011. Hepatology. 2012;55(3):965-967.
4. Sunheimer R, Capaldo G, Kashanian F, et al. Serum analyte pattern characteristic of fulminant hepatic failure. Ann Clin Lab Sci. 1994;24(2):101-109.
5. Athanasakis E, Mouloudi E, Prinianakis G, Kostaki M, Tzardi M, Georgopoulos D. Metastatic liver disease and fulminant hepatic failure: presentation of a case and review of the literature. Eur J Gastroenterol Hepatol. 2003;15(11):1235-1240.
6. Preissler G, Graeb C, Steib C, et al. Acute liver failure, rupture and hemorrhagic shock as primary manifestation of advanced metastatic disease. Anticancer Res. 2012;32(8):3449-3454.
7. Alexopoulou A, Koskinas J, Deutsch M, Delladetsima J, Kountouras D, Dourakis SP. Acute liver failure as the initial manifestation of hepatic infiltration by a solid tumor: report of 5 cases and review of the literature. Tumori. 2006;92(4):354-357.
8. Shah KG, Modi PR, Rizvi J. Breast carcinoma metastasizing to the urinary bladder and retroperitoneum presenting as acute renal failure. Indian J Urol. 2011;27(1):135-136.
9. Nazario HE, Lepe R, Trotter JF. Metastatic breast cancer presenting as acute liver failure. Gastroenterol Hepatol (NY). 2011;7(1):65-66.
10. Rajvanshi P, Kowdley KV, Hirota WK, Meyers JB, Keeffe EB. Fulminant hepatic failure secondary to neoplastic infiltration of the liver. J Clin Gastroenterol. 2005;39(4):339-343.
11. Fairbank WH. Three atypical cases of Hodgkin’s Disease, presenting with liver failure. Can Med Assoc J. 1953;69(3):315-317.
12. Braude S, Portmann B, Gimson AE, Williams R. Fulminant hepatic failure in non-Hodgkin’s lymphoma. Postgrad Med J. 1982;58(679):301-304.
13. Lo AA, Lo EC, Li H, et al. Unique morphologic and clinical features of liver predominant/primary small cell carcinoma—autopsy and biopsy case series. Ann Diagn Pathol. 2014;18(3):151-156.
14. Hwang YT, Shin JW, Lee JH, et al. A case of fulminant hepatic failure secondary to hepatic metastasis of small cell lung carcinoma [in Korean]. Korean J Hepatol. 2007;13(4):565-570.
15. Miyaaki H, Ichikawa T, Taura N, et al. Diffuse liver metastasis of small cell lung cancer causing marked hepatomegaly and fulminant hepatic failure. Intern Med. 2010;49(14):1383-1386.
16. Sato K, Takeyama Y, Tanaka T, Fukui Y, Gonda H, Suzuki R. Fulminant hepatic failure and hepatomegaly caused by diffuse liver metastases from small cell lung carcinoma: 2 autopsy cases. Respir Investig. 2013;51(2):98-102.
17. Galus M. Liver failure due to metastatic small-cell carcinoma of the lung. Mayo Clin Proc. 1997;72(8):791.
18. Kovalev Y, Lurie M, Naschitz JE, Yeshurun D, Zuckerman E. Metastatic small cell carcinoma presenting as acute hepatic failure. Am J Gastroenterol. 2001;96(12):3471-3473.
19. McGuire BM, Cherwitz DL, Rabe KM, Ho SB. Small-cell carcinoma of the lung manifesting as acute hepatic failure. Mayo Clin Proc. 1997;72(2):133-139.
20. Richecoeur M, Massoure MP, Le Coadou G, Lipovac AS, Bronstein JA, Delluc C. Acute hepatic failure as the presenting manifestation of a metastatic lung carcinoma to liver [in French]. Rev Med Interne. 2009;30(10):911-913.
21. Valladares Ayerbes MJ, Canadas Garcia de Leon M, Reina Zoilo JJ, Valenzuela Claros JC, Ruiz Borrego M, Barea Bejarano JL. Acute liver failure as presentation form of small cell carcinoma of the lung [in Spanish]. An Med Interna. 1997;14(3):128-130.
22. Gilbert J, Rutledge H, Koch A. Diffuse malignant infiltration of the liver manifesting as a case of acute liver failure. Nat Clin Pract Gastroenterol Hepatol. 2008;5(7):405-408.
23. Vaideeswar P, Munot S, Rojekar A, Deodhar K. Hepatic diffuse intra-sinusoidal metastases of pulmonary small-cell carcinoma. J Postgrad Med. 2012;58(3):230-231.
24. Krauss EA, Ludwig PW, Sumner HW. Metastatic carcinoma presenting as fulminant hepatic failure. Am J Gastroenterol. 1979;72(6):651-654.
25. Ke E, Gomez JD, Tang K, Sriram KB. Metastatic small-cell lung cancer presenting
as fulminant hepatic failure. BMJ Case Rep. 2013;2013.
For patients with acute fulminant liver failure, imaging and histopathologic studies are indicated to reveal the underlying etiology, and metastatic small cell carcinoma should be included in the clinical differential diagnosis when appropriate.
Acute fulminant hepatic failure (FHF) is an uncommon but highly fatal condition that results from the massive destruction of liver tissue. Viral hepatitis and drug-induced liver damage predominate in North America and Europe, but the underlying precipitating factors differ around the world.1 In children, indeterminate causes account for more than 50% of cases.2 Other conditions associated with FHF are Budd-Chiari syndrome, vascular hypoperfusion, mushroom poisoning, Wilson disease, autoimmune hepatitis, and fatty liver of pregnancy.3
Neoplastic lesions of the liver, mostly metastatic carcinomas, present with ductular obstruction with occasional mild elevations in aminotransferases. Rarely do space-occupying lesions lead to acute liver failure (ALF) with massive hepatocyte necrosis.
The authors report a case of rapidly progressing ALF due to metastatic small cell carcinoma to the liver. Small cell lung carcinoma (SCLC) is an aggressive tumor that often presents at an advanced stage. Although liver metastasis is common in this disease, development of FHF is extremely uncommon.
Case Presentation
A 90-year-old African American man presented to the emergency department (ED) of the Brooklyn Campus of the VA New York Harbor Health Care System (VANYHHS), with a persistent cough, worsening of shortness of breath, increasing right upper quadrant abdominal pain, and chronic constipation. He noted that he had smoked 1 pack per day for 40 years but quit 30 years ago. He had a medical history of chronic obstructive pulmonary disease (COPD), hypertension, prostate cancer treated 20 years earlier with external beam radiation therapy and with intramuscular leuprolide every 6 months for the previous 6.5 years, and gout. He was taking no hepatotoxic prescription medications and never used over-the-counter analgesics or abused alcohol. Five days before admission, he was treated for COPD exacerbation in the ED.
Blood chemistry at the time revealed significantly elevated liver function enzymes, including aspartate aminotransferase, alanine aminotransferase (ALT), alkaline phosphatase (AST), and total bilirubin compared with baseline levels taken 3 months earlier (Table). Primary care follow-up was recommended. Physical examination on the day of admission was remarkable for normal blood pressure (137/74), emaciated appearance, and a large liver with right upper quadrant tenderness.
Repeat blood chemistries showed a further rise in liver function tests. Acetaminophen level was < 1.0 μg/mL (therapeutic range 10-20 μg/mL). Hepatitis A, B, and C serologic testing was negative. Serum creatinine was elevated at 1.7 mg/dL and steadily increased to 3.2 mg/dL at the end of the hospital course. A chest X-ray and a noncontrast computed tomography (CT) scan of the chest showed left upper lobe ill-defined infiltrates/opacities. Noncontrast abdominal and pelvic CT revealed hepatomegaly and ascites. Hepatic ultrasound showed that the liver was enlarged, diffusely heterogeneous, and nodular in appearance. The patient was admitted for evaluation.
On day 2 of admission, the patient reported “numbness of digits.” Serum glucose was measured and found to be low (36 mg/dL) (reference range: 70-110 mg/dL). He was subsequently managed for refractory hypoglycemia, which was presumed to be a result of liver disease. On day 3, he was transferred to the intensive care unit for close monitoring and management. On day 4, the patient was still experiencing episodes of hypoglycemia despite glucagon and dextrose administration. He developed altered mental status and metabolic acidosis and was intubated. Repeat laboratory tests showed a significant increase in AST and ALT with an AST:ALT ratio of about 4. Serum ammonia levels also were increased at 198.6 μg/dL (reference range: 17-80 μg/dL). The platelet count decreased to as low as 86 x 103/μL (reference range:150-450 x 103/μL). The prothrombin time (PT) increased continuously to as high as 21.4 sec (reference range: 9.6-12.4 sec) as did the activated partial thromboplastin time (aPTT) to 65.1 sec (reference range: 28-36.3 sec). Afterward, the patient developed multiple organ failure, including hemodynamic instability requiring fluid resuscitation. On day 5, the patient died.
At autopsy, the left upper lobe of the patient’s lung was found to have a tan-white, firm, irregularly shaped 4.8-cm mass. The liver weighed 2,980 g (reference range: 1,400-1,600 g) and was diffusely infiltrated by tan-white masses comprising about 70% of the liver (Figure 1).
Histologic examination of the lung (Figure 2) and liver (Figure 3) masses revealed small, round, blue cells with high nucleocytoplasmic ratios, nuclear molding, and crushing artifact. The tumor cells were found to be positive for chromogranin and synaptophysin. The liver showed diffuse hepatocyte necrosis with few viable hepatocytes present. The autopsy case was signed out as SCLC with diffuse liver metastasis.
Discussion
Acute FHF is a rare condition that often presents with sudden onset in which patients become encephalopathic due to hyperammonemia and exhibit marked elevations in the 2 aminotransferases, AST and ALT. A prior study of this condition reported on 6 patients, 5 of whom succumbed to the condition and 3 of whom were autopsied.4 The study found that both AST and ALT became rapidly elevated markedly such that the AST to ALT ratio was significantly greater than 1 and often exceeding 2, a pattern suggesting mitochondrial damage in hepatocytes resulting in release of intramitochondrial AST in addition to extramitochondrial AST.4
In addition, total protein and albumin were significantly decreased, and serum ammonia levels were markedly increased. All patients were encepaholopathic and were found to have disseminated intravascular coagulopathy. Five of the 6 patients had renal failure, including 2 with acute tubular necrosis, and electrolyte abnormalities, including hypernatremia, in one case due to circulating elevated levels of aldosterone. Two of the 6 patients were found to be consistently hypoglycemic, possibly caused by impaired glycogenolysis. Three of these patients were found to have had lactic acidosis. In this study, liver biopsy was unrevealing and showed only minimal changes even during the earlier noted changes in laboratory values. Total hepatocyte necrosis was found only at postmortem examination.
Causes of FHF
Previous studies have identified possible causes of FHF that include alcohol abuse and IV drug abuse giving rise to pan-hepatic hepatitis—both conditions giving rise to cirrhosis; multiple abdominal surgeries; drug (acetaminophen) overdose; fatty liver of pregnancy resulting in microvesicular steatosis of hepatocytes; hypotension (shock liver); and Reye syndrome, mainly in children but also reported in adults, in which there is a viral prodrome with fever followed by treatment with aspirin that progresses to acute FHF.
Metastatic cancer is not generally listed as a potential cause of FHF. Although cancer is a less common cause of this condition, metastasis-induced FHF that has been documented in the literature includes tumors of the breast, gastrointestinal tract, lung, nasopharynx, melanoma, and hematolymphoid malignancies, including leukemia, Hodgkin disease, non-Hodgkin lymphomas, and malignant histiocytosis.5-12
Small Cell Carcinoma as a Cause of FHF
Small cell carcinoma of the lung is a highly malignant neoplasm that often presents at an advanced stage. Most often, metastatic disease to the liver may result in some mild increase in ALT and obstructive symptoms. However, diffuse sinusoidal infiltration of the tumor is most likely to present with hyperacute liver failure.13 A literature review of all small cell carcinomas in the liver presenting with acute FHF shows a consistent morphologic pattern of diffuse parenchymal infiltration,some that initially present with acute hepatic failure with no known history of liver disease.13-25 Imaging studies sometimes are difficult to interpret and may fail to detect infiltration of the tumor because of diffuse involvement of the liver parenchyma. Malignant infiltration of the liver should be one of the considerations in cases of unexplained hepatomegaly.
As found in the authors’ prior study, coagulopathy, renal failure (final creatinine was 3.2 mg/dL) as well as hypoglycemia are oftentimes seen, all of which were found in the patient in this study.4 (Coagulopathy was indicated by the low platelet count and elevated PT and aPTT.) Laboratory findings for FHF include rapid increases in serum ALTs such that the AST:ALT ratio is significantly greater than 1 and in which total protein and albumin are significantly decreased. Often there is hyperammonemia as was present in the current case.
A study has been performed to develop serodiagnostic markers to distinguish malignant from nonmalignant causes of FHF on 4 patients with tumor-induced FHF and 12 patients with FHF due to other causes. It was found that that there was an increase in the lactate dehydrogenase (LDH) to ALT ratio as well as elevated uric acid levels in the 4 patients with FHF not found in any of the 12 patients with nonmalignant causes of this condition.19 Although LDH was not measured in this case, in view of the patient’s history of gout, the LDH/uric acid ratio may not have been discriminating.
Conclusion
Although rare, metastatic small cell carcinoma should be included in the clinical differential diagnosis of patients presenting with acute FHF with no other obvious medical etiology. Accurate and timely diagnosis is important to better guide management of these patients.
Author disclosures
The authors report no actual or potential conflicts of interest with regard to this article.
Disclaimer
The opinions expressed herein are those of the authors and do not necessarily reflect those of Federal Practitioner, Frontline Medical Communications Inc., the U.S. Government, or any of its agencies. This article may discuss unlabeled or investigational use of certain drugs. Please review complete prescribing information for specific drugs or drug combinations—including indications, contraindications, warnings, and adverse effects—before administering pharmacologic therapy to patients.
Click here to read the digital edition.
1. Hoofnagle JH, Carithers RL Jr, Shapiro C, Ascher N. Fulminant hepatic failure: summary of workshop. Hepatology. 1995;21(1):240-252.
2. D’Agata ID, Balister WF. Pediatric aspects of acute liver failure. In: Lee WM, Williams R, eds. Acute Liver Failure. Cambridge, UK: Cambridge University Press, 1997:53-66.
3. Lee WM, Stravitz RT, Larson AM. Introduction to the revised American Association for the Study of Liver Diseases position paper on acute liver failure 2011. Hepatology. 2012;55(3):965-967.
4. Sunheimer R, Capaldo G, Kashanian F, et al. Serum analyte pattern characteristic of fulminant hepatic failure. Ann Clin Lab Sci. 1994;24(2):101-109.
5. Athanasakis E, Mouloudi E, Prinianakis G, Kostaki M, Tzardi M, Georgopoulos D. Metastatic liver disease and fulminant hepatic failure: presentation of a case and review of the literature. Eur J Gastroenterol Hepatol. 2003;15(11):1235-1240.
6. Preissler G, Graeb C, Steib C, et al. Acute liver failure, rupture and hemorrhagic shock as primary manifestation of advanced metastatic disease. Anticancer Res. 2012;32(8):3449-3454.
7. Alexopoulou A, Koskinas J, Deutsch M, Delladetsima J, Kountouras D, Dourakis SP. Acute liver failure as the initial manifestation of hepatic infiltration by a solid tumor: report of 5 cases and review of the literature. Tumori. 2006;92(4):354-357.
8. Shah KG, Modi PR, Rizvi J. Breast carcinoma metastasizing to the urinary bladder and retroperitoneum presenting as acute renal failure. Indian J Urol. 2011;27(1):135-136.
9. Nazario HE, Lepe R, Trotter JF. Metastatic breast cancer presenting as acute liver failure. Gastroenterol Hepatol (NY). 2011;7(1):65-66.
10. Rajvanshi P, Kowdley KV, Hirota WK, Meyers JB, Keeffe EB. Fulminant hepatic failure secondary to neoplastic infiltration of the liver. J Clin Gastroenterol. 2005;39(4):339-343.
11. Fairbank WH. Three atypical cases of Hodgkin’s Disease, presenting with liver failure. Can Med Assoc J. 1953;69(3):315-317.
12. Braude S, Portmann B, Gimson AE, Williams R. Fulminant hepatic failure in non-Hodgkin’s lymphoma. Postgrad Med J. 1982;58(679):301-304.
13. Lo AA, Lo EC, Li H, et al. Unique morphologic and clinical features of liver predominant/primary small cell carcinoma—autopsy and biopsy case series. Ann Diagn Pathol. 2014;18(3):151-156.
14. Hwang YT, Shin JW, Lee JH, et al. A case of fulminant hepatic failure secondary to hepatic metastasis of small cell lung carcinoma [in Korean]. Korean J Hepatol. 2007;13(4):565-570.
15. Miyaaki H, Ichikawa T, Taura N, et al. Diffuse liver metastasis of small cell lung cancer causing marked hepatomegaly and fulminant hepatic failure. Intern Med. 2010;49(14):1383-1386.
16. Sato K, Takeyama Y, Tanaka T, Fukui Y, Gonda H, Suzuki R. Fulminant hepatic failure and hepatomegaly caused by diffuse liver metastases from small cell lung carcinoma: 2 autopsy cases. Respir Investig. 2013;51(2):98-102.
17. Galus M. Liver failure due to metastatic small-cell carcinoma of the lung. Mayo Clin Proc. 1997;72(8):791.
18. Kovalev Y, Lurie M, Naschitz JE, Yeshurun D, Zuckerman E. Metastatic small cell carcinoma presenting as acute hepatic failure. Am J Gastroenterol. 2001;96(12):3471-3473.
19. McGuire BM, Cherwitz DL, Rabe KM, Ho SB. Small-cell carcinoma of the lung manifesting as acute hepatic failure. Mayo Clin Proc. 1997;72(2):133-139.
20. Richecoeur M, Massoure MP, Le Coadou G, Lipovac AS, Bronstein JA, Delluc C. Acute hepatic failure as the presenting manifestation of a metastatic lung carcinoma to liver [in French]. Rev Med Interne. 2009;30(10):911-913.
21. Valladares Ayerbes MJ, Canadas Garcia de Leon M, Reina Zoilo JJ, Valenzuela Claros JC, Ruiz Borrego M, Barea Bejarano JL. Acute liver failure as presentation form of small cell carcinoma of the lung [in Spanish]. An Med Interna. 1997;14(3):128-130.
22. Gilbert J, Rutledge H, Koch A. Diffuse malignant infiltration of the liver manifesting as a case of acute liver failure. Nat Clin Pract Gastroenterol Hepatol. 2008;5(7):405-408.
23. Vaideeswar P, Munot S, Rojekar A, Deodhar K. Hepatic diffuse intra-sinusoidal metastases of pulmonary small-cell carcinoma. J Postgrad Med. 2012;58(3):230-231.
24. Krauss EA, Ludwig PW, Sumner HW. Metastatic carcinoma presenting as fulminant hepatic failure. Am J Gastroenterol. 1979;72(6):651-654.
25. Ke E, Gomez JD, Tang K, Sriram KB. Metastatic small-cell lung cancer presenting
as fulminant hepatic failure. BMJ Case Rep. 2013;2013.
Open Clinical Trials for Patients With Prostate Cancer
Providing access to clinical trials for veteran and active-duty military patients can be a challenge, but a significant number of trials are now recruiting patients from those patient populations. More than 63,000 open trials currently are listed on the ClinicalTrials.gov website. Many explicitly recruit patients from the VA (461 studies), the military (437 studies), and IHS (2 studies). The VA Health Services Research and Development department alone sponsors > 250 research initiatives, and many more are sponsored by Walter Reed National Medical Center and other major defense and VA facilities.
The clinical trials listed below are all open as of July 25, 2016; have at least 1 VA, DoD, or IHS location recruiting patients; and are focused on treatment for prostate cancer. For additional information and full inclusion/exclusion criteria, please consult https://clinicaltrials.gov.
Optimizing Veteran-Centered Prostate Cancer Survivorship Care
This study will provide much needed information about how to optimize the quality of care and quality of life of veterans who are survivors of prostate cancer.
ID: NCT01900561
Sponsor: VA Office of Research and Development
Location (contact): VA Ann Arbor Health Care System, Michigan (Tabitha Metreger); St. Louis VAMC, Missouri; John Cochran Division (Robert L. Grubb); VA Pittsburgh Healthcare System, University Drive Division, Pennslyvania (Bruce S. Ling)
Vitamin D3 Supplementation for Low-Risk Prostate Cancer: A Randomized Trial
Vitamin D promotes the differentiation of prostate cancer cells and maintains the differentiated phenotype of prostate epithelial cells. The results of the investigators’ clinical studies indicate that vitamin D3 supplementation results in a decrease of positive cancer cores at repeat biopsy in subjects with low-risk prostate cancer. The investigators hypothesize that veterans who have early-stage prostate cancer and who take vitamin D3 at 4,000 international units per day (intervention group) will show an improvement in the number of positive cores and in Gleason score at repeat biopsy, and a decreased likelihood of undergoing definitive treatment (prostatectomy or radiation therapy), compared to veteran subjects taking placebo (control group).
ID: NCT01759771
Sponsor: VA Office of Research and Development
Location (contact): Ralph H. Johnson VAMC, South Carolina (M. Rita I. Young)
An Epidemiological Study of Genetic Risk Factors for Prostate Cancer in African American and Caucasian Males
This study will examine the association of genetic variants and gene expression patterns with the risk of prostate cancer. It will include genotype analysis of blood DNA from 600 patients with the disease and from 600 healthy people, and there will be a gene expression analysis of prostate tumors.
ID: NCT00342771
Sponsor: National Cancer Institute
Location (contact): Baltimore VAMC, Maryland (Alexander Richard)
MRI-Based Active Surveillance to Avoid the Risks of Serial Biopsies in Men With Low-Risk Prostate Cancer
Phase II non-inferiority randomized trial of annual systematic biopsies versus mpMRI and targeted biopsies for men with low-risk prostate cancer on active surveillance with any volume Gleason Score 6, but no prior MRI imaging of the prostate.
ID: NCT02564549
Sponsor: Virginia Commonwealth University
Location (contact): Hunter Holmes McGuire VAMC, Virginia (Drew Moghanaki)
Enzalutamide With or Without Abiraterone and Prednisone in Treating Patients With Castration-Resistant Metastatic Prostate Cancer
This randomized phase III trial studies enzalutamide to see how well it works compared to enzalutamide, abiraterone, and prednisone in treating patients with castration-resistant metastatic prostate cancer. Androgens can cause the growth of prostate cancer cells. Drugs, such as enzalutamide, abiraterone acetate, and prednisone, may lessen the amount of androgens made by the body.
ID: NCT01949337
Sponsor: Alliance for Clinical Trials in Oncology
Location (contact): Naval Medical Center, California (Preston Gable); San Francisco VAMC, California (Terence Friedlander); VA Connecticut Healthcare System-West Haven Campus (Herta Chao); Washington DC VAMC (Anthony Arcenas); Edward Hines, Jr. VA Hospital, Illinois (Elizabeth Henry); Minneapolis VA Health Care System, Minnesota (Sharon Luikart); Kansas City VAMC, Missouri (Peter Van Veldhuizen); VA New Jersey Health Care System (Victor Chang); Bronx VAMC, New York (Yeun-Hee Park); VA Western New York Healthcare System-Buffalo (Lynn Steinbrenner); Syracus VAMC, New York (Namita Chittoria); Durham VAMC, North Carolina (Daphne Friedman); White River Junction VAMC, Vermont (Alexander Fuld); Clement J. Zablocki VAMC, Wisconsin (Elizabeth Gore)
S1216, Phase III ADT+TAK-700 vs ADT+ Bicalutamide for Metastatic Prostate Cancer
The purpose of this study is to compare overall survival in newly diagnosed metastatic prostate cancer patients randomly assigned to androgen deprivation therapy + TAK-700 vs ADT + bicalutamide.
ID: NCT01809691
Sponsor: Southwest Oncology Group
Location (contact): Washington DC VAMC (Anthony Arcenas); Edward Hines, Jr. Hines VA Hospital, Illinois (Elizabeth Henry); Kansas City VAMC, Missouri (Peter Van Veldhuizen); VA New Jersey Health Care System (Victor Chang); VA New York Harbor Healthcare System-Brooklyn Campus (Andrea N. Leaf); VA Western New York Health Care System-Buffalo (Lynn Steinbrenner); Portland VAMC, Oregon (Julie N. Graff); Michael E. DeBakey VAMC, Texas; Tripler Army Medical Center, Hawaii (Jeffrey L. Berenberg)
Stereotactic Body Radiation Therapy in Treating Patients With Metastatic Breast Cancer, Non-small Cell Lung Cancer, or Prostate Cancer
This phase I trial studies the side effects and the best dose of stereotactic body radiation therapy in treating patients with breast cancer, non-small cell lung cancer, or prostate cancer that has spread to other parts of the body. Stereotactic body radiation therapy delivers fewer, tightly-focused, high doses of radiation therapy to all known sites of cancer in the body while minimizing radiation exposure of surrounding normal tissue.
ID: NCT02206334
Sponsor: NRG Oncology, National Cancer Institute
Location (contact): Clement J. Zablocki VAMC, Wisconsin (Elizabeth Gore)
Ciprofloxacin Compared to Placebo in Diagnosing Prostate Cancer in Patients Undergoing Prostate Biopsy
This phase II trial studies ciprofloxacin compared to an inactive treatment (placebo) in diagnosing prostate cancer in patients undergoing removal of prostate cells or tissues for examination (biopsy). Ciprofloxacin is an antibiotic, a type of drug used to treat infections caused by bacteria. Giving ciprofloxacin to patients undergoing a prostate biopsy may help to lower abnormal prostate-specific antigen levels caused by bacterial infection of the prostate gland and may or may not affect the detection rate of prostate cancer.
ID: NCT02252978
Sponsor: Comprehensive Cancer Center of Wake Forest University
Location not yet recruiting (contact): W.G. (Bill) Hefner VAMC, North Carolina (Kethandapatti C. Balaji)
Prostate Active Surveillance Study
The Prostate Active Surveillance Study (PASS) is a research study for men who have chosen active surveillance as a management plan for their prostate cancer. Active surveillance is defined as close monitoring of prostate cancer with the offer of treatment if there are changes in test results. This study seeks to discover markers that will identify cancers that are more aggressive from those tumors that grow slowly.
ID: NCT00756665
Sponsor: University of Washington
Location (contact): VA Puget Sound Health Care System, Washington (Branda Levchak
Androgen-Deprivation Therapy and Radiation Therapy in Treating Patients With Prostate Cancer
Androgens can cause the growth of prostate cancer cells. Androgen deprivation therapy may stop the adrenal glands from making androgens. Radiation therapy uses high-energy X-rays to kill tumor cells. This randomized phase III trial studies androgen-deprivation therapy and radiation therapy in treating patients with prostate cancer.
ID: NCT01368588
Sponsor: Radiation Therapy Oncology Group
Location (contact): VA Long Beach Healthcare System, California (Samar H. Azawi); Clement J. Zablocki VAMC, Wisconsin (Elizabeth Gore)
Effect of Quercetin on Green Tea Polyphenol Uptake in Prostate Tissue From Patients With Prostate Cancer Undergoing Surgery
This randomized pilot phase I trial will evaluate if quercetin enhances the uptake of green tea polyphenols in the prostate tissue of men taking green tea extract and undergoing radical prostatectomy. Side effects of green tea extract and quercetin in combination with green tea extract will also be evaluated. In preclinical studies, green tea polyphenols have anticancer and cancer preventative effects in a number of malignancies. Likewise, in preclinical studies quercetin was found to enhance the anticancer effects of green tea. This trial is designed to translate these findings forward in a short-term human intervention trial.
ID: NCT01912820
Sponsor: Jonsson Comprehensive Cancer Center
Location (contact): VA Greater Los Angeles Healthcare System, California (William Aronson)
A Study to Evaluate Characteristics Predictive of a Positive Imaging Study for Distant Metastases in Patients With Castration-Resistant Prostate Cancer (PREDICT)
The primary purpose of this research is to describe patient characteristics predictive of an imaging study positive for distant metastases in patients with castration-resistant prostate cancer and no known distant metastases.
ID: NCT01981109
Sponsor: Dendreon
Location (contact): VA Greater Los Angeles Healthcare System, California (Amy Smallcomb)
Click here to read the digital edition.
Note: Page numbers differ between the print issue and digital edition.
Providing access to clinical trials for veteran and active-duty military patients can be a challenge, but a significant number of trials are now recruiting patients from those patient populations. More than 63,000 open trials currently are listed on the ClinicalTrials.gov website. Many explicitly recruit patients from the VA (461 studies), the military (437 studies), and IHS (2 studies). The VA Health Services Research and Development department alone sponsors > 250 research initiatives, and many more are sponsored by Walter Reed National Medical Center and other major defense and VA facilities.
The clinical trials listed below are all open as of July 25, 2016; have at least 1 VA, DoD, or IHS location recruiting patients; and are focused on treatment for prostate cancer. For additional information and full inclusion/exclusion criteria, please consult https://clinicaltrials.gov.
Optimizing Veteran-Centered Prostate Cancer Survivorship Care
This study will provide much needed information about how to optimize the quality of care and quality of life of veterans who are survivors of prostate cancer.
ID: NCT01900561
Sponsor: VA Office of Research and Development
Location (contact): VA Ann Arbor Health Care System, Michigan (Tabitha Metreger); St. Louis VAMC, Missouri; John Cochran Division (Robert L. Grubb); VA Pittsburgh Healthcare System, University Drive Division, Pennslyvania (Bruce S. Ling)
Vitamin D3 Supplementation for Low-Risk Prostate Cancer: A Randomized Trial
Vitamin D promotes the differentiation of prostate cancer cells and maintains the differentiated phenotype of prostate epithelial cells. The results of the investigators’ clinical studies indicate that vitamin D3 supplementation results in a decrease of positive cancer cores at repeat biopsy in subjects with low-risk prostate cancer. The investigators hypothesize that veterans who have early-stage prostate cancer and who take vitamin D3 at 4,000 international units per day (intervention group) will show an improvement in the number of positive cores and in Gleason score at repeat biopsy, and a decreased likelihood of undergoing definitive treatment (prostatectomy or radiation therapy), compared to veteran subjects taking placebo (control group).
ID: NCT01759771
Sponsor: VA Office of Research and Development
Location (contact): Ralph H. Johnson VAMC, South Carolina (M. Rita I. Young)
An Epidemiological Study of Genetic Risk Factors for Prostate Cancer in African American and Caucasian Males
This study will examine the association of genetic variants and gene expression patterns with the risk of prostate cancer. It will include genotype analysis of blood DNA from 600 patients with the disease and from 600 healthy people, and there will be a gene expression analysis of prostate tumors.
ID: NCT00342771
Sponsor: National Cancer Institute
Location (contact): Baltimore VAMC, Maryland (Alexander Richard)
MRI-Based Active Surveillance to Avoid the Risks of Serial Biopsies in Men With Low-Risk Prostate Cancer
Phase II non-inferiority randomized trial of annual systematic biopsies versus mpMRI and targeted biopsies for men with low-risk prostate cancer on active surveillance with any volume Gleason Score 6, but no prior MRI imaging of the prostate.
ID: NCT02564549
Sponsor: Virginia Commonwealth University
Location (contact): Hunter Holmes McGuire VAMC, Virginia (Drew Moghanaki)
Enzalutamide With or Without Abiraterone and Prednisone in Treating Patients With Castration-Resistant Metastatic Prostate Cancer
This randomized phase III trial studies enzalutamide to see how well it works compared to enzalutamide, abiraterone, and prednisone in treating patients with castration-resistant metastatic prostate cancer. Androgens can cause the growth of prostate cancer cells. Drugs, such as enzalutamide, abiraterone acetate, and prednisone, may lessen the amount of androgens made by the body.
ID: NCT01949337
Sponsor: Alliance for Clinical Trials in Oncology
Location (contact): Naval Medical Center, California (Preston Gable); San Francisco VAMC, California (Terence Friedlander); VA Connecticut Healthcare System-West Haven Campus (Herta Chao); Washington DC VAMC (Anthony Arcenas); Edward Hines, Jr. VA Hospital, Illinois (Elizabeth Henry); Minneapolis VA Health Care System, Minnesota (Sharon Luikart); Kansas City VAMC, Missouri (Peter Van Veldhuizen); VA New Jersey Health Care System (Victor Chang); Bronx VAMC, New York (Yeun-Hee Park); VA Western New York Healthcare System-Buffalo (Lynn Steinbrenner); Syracus VAMC, New York (Namita Chittoria); Durham VAMC, North Carolina (Daphne Friedman); White River Junction VAMC, Vermont (Alexander Fuld); Clement J. Zablocki VAMC, Wisconsin (Elizabeth Gore)
S1216, Phase III ADT+TAK-700 vs ADT+ Bicalutamide for Metastatic Prostate Cancer
The purpose of this study is to compare overall survival in newly diagnosed metastatic prostate cancer patients randomly assigned to androgen deprivation therapy + TAK-700 vs ADT + bicalutamide.
ID: NCT01809691
Sponsor: Southwest Oncology Group
Location (contact): Washington DC VAMC (Anthony Arcenas); Edward Hines, Jr. Hines VA Hospital, Illinois (Elizabeth Henry); Kansas City VAMC, Missouri (Peter Van Veldhuizen); VA New Jersey Health Care System (Victor Chang); VA New York Harbor Healthcare System-Brooklyn Campus (Andrea N. Leaf); VA Western New York Health Care System-Buffalo (Lynn Steinbrenner); Portland VAMC, Oregon (Julie N. Graff); Michael E. DeBakey VAMC, Texas; Tripler Army Medical Center, Hawaii (Jeffrey L. Berenberg)
Stereotactic Body Radiation Therapy in Treating Patients With Metastatic Breast Cancer, Non-small Cell Lung Cancer, or Prostate Cancer
This phase I trial studies the side effects and the best dose of stereotactic body radiation therapy in treating patients with breast cancer, non-small cell lung cancer, or prostate cancer that has spread to other parts of the body. Stereotactic body radiation therapy delivers fewer, tightly-focused, high doses of radiation therapy to all known sites of cancer in the body while minimizing radiation exposure of surrounding normal tissue.
ID: NCT02206334
Sponsor: NRG Oncology, National Cancer Institute
Location (contact): Clement J. Zablocki VAMC, Wisconsin (Elizabeth Gore)
Ciprofloxacin Compared to Placebo in Diagnosing Prostate Cancer in Patients Undergoing Prostate Biopsy
This phase II trial studies ciprofloxacin compared to an inactive treatment (placebo) in diagnosing prostate cancer in patients undergoing removal of prostate cells or tissues for examination (biopsy). Ciprofloxacin is an antibiotic, a type of drug used to treat infections caused by bacteria. Giving ciprofloxacin to patients undergoing a prostate biopsy may help to lower abnormal prostate-specific antigen levels caused by bacterial infection of the prostate gland and may or may not affect the detection rate of prostate cancer.
ID: NCT02252978
Sponsor: Comprehensive Cancer Center of Wake Forest University
Location not yet recruiting (contact): W.G. (Bill) Hefner VAMC, North Carolina (Kethandapatti C. Balaji)
Prostate Active Surveillance Study
The Prostate Active Surveillance Study (PASS) is a research study for men who have chosen active surveillance as a management plan for their prostate cancer. Active surveillance is defined as close monitoring of prostate cancer with the offer of treatment if there are changes in test results. This study seeks to discover markers that will identify cancers that are more aggressive from those tumors that grow slowly.
ID: NCT00756665
Sponsor: University of Washington
Location (contact): VA Puget Sound Health Care System, Washington (Branda Levchak
Androgen-Deprivation Therapy and Radiation Therapy in Treating Patients With Prostate Cancer
Androgens can cause the growth of prostate cancer cells. Androgen deprivation therapy may stop the adrenal glands from making androgens. Radiation therapy uses high-energy X-rays to kill tumor cells. This randomized phase III trial studies androgen-deprivation therapy and radiation therapy in treating patients with prostate cancer.
ID: NCT01368588
Sponsor: Radiation Therapy Oncology Group
Location (contact): VA Long Beach Healthcare System, California (Samar H. Azawi); Clement J. Zablocki VAMC, Wisconsin (Elizabeth Gore)
Effect of Quercetin on Green Tea Polyphenol Uptake in Prostate Tissue From Patients With Prostate Cancer Undergoing Surgery
This randomized pilot phase I trial will evaluate if quercetin enhances the uptake of green tea polyphenols in the prostate tissue of men taking green tea extract and undergoing radical prostatectomy. Side effects of green tea extract and quercetin in combination with green tea extract will also be evaluated. In preclinical studies, green tea polyphenols have anticancer and cancer preventative effects in a number of malignancies. Likewise, in preclinical studies quercetin was found to enhance the anticancer effects of green tea. This trial is designed to translate these findings forward in a short-term human intervention trial.
ID: NCT01912820
Sponsor: Jonsson Comprehensive Cancer Center
Location (contact): VA Greater Los Angeles Healthcare System, California (William Aronson)
A Study to Evaluate Characteristics Predictive of a Positive Imaging Study for Distant Metastases in Patients With Castration-Resistant Prostate Cancer (PREDICT)
The primary purpose of this research is to describe patient characteristics predictive of an imaging study positive for distant metastases in patients with castration-resistant prostate cancer and no known distant metastases.
ID: NCT01981109
Sponsor: Dendreon
Location (contact): VA Greater Los Angeles Healthcare System, California (Amy Smallcomb)
Click here to read the digital edition.
Note: Page numbers differ between the print issue and digital edition.
Note: Page numbers differ between the print issue and digital edition.
Hat-Wearing Patterns in Spectators Attending Baseball Games: A 10-Year Retrospective Comparison
Spectators at baseball games may be exposed to excess solar UV radiation (UVR), which has been linked to the development of both melanoma and nonmelanoma skin cancers.1,2 Although baseball hats traditionally are worn to demonstrate team support, they also may provide some sun protection for the head and face where skin cancers are commonly found.
The importance of protecting the skin from solar UVR has led to sun-protection programs and community education as well as efforts to evaluate the impact of these programs. Major League Baseball (MLB) has partnered with the American Academy of Dermatology since 1999 to promote the importance of sun protection and raise skin cancer awareness through its Play Sun Smart program.3 A study conducted 10 years ago (N=2030) evaluated hat use in spectators at MLB games and noted that less than half of all spectators in seating sections exposed to direct sunlight wore hats.4 The purpose of the current study was to evaluate how public education about sun protection has impacted the use of hats by spectators at MLB games in 2015 compared to the prior study in 2006.
Methods
Data were collected during a 3-game series (2 day games, 1 night game) in August 2015 in New York, New York. During one of the day games, 18,000 fans received a free wide-brimmed hat. High-resolution digital photographs of seating sections were obtained using a camera with a 300-mm lens. Using the same methodology as the prior study,4 sunny and shaded seating sections were photographed during all 3 games (Figure). Photographs of each section were analyzed by an independent reviewer using a high-resolution computer screen. Spectators wearing head coverings—baseball hats, visors, or hats with circumferential brims—were defined as using hats. The number of spectators wearing hats versus not wearing hats was recorded for all identical sections of interest. Bleacher seating was analyzed separately, as spectators presumably knew in advance of the continuous direct sun exposure during day games, and a subset of young children in the bleachers (<10 years of age) also was assessed. A continuously sunny section also was evaluated at the second and sixth innings to see if hats were presumably purchased during exposure. Statistical significance was determined using χ2 tests with P<.05 indicating statistical significance.

Results
This analysis consisted of 3539 spectators. In both the sunny and shaded sections of a day game, there were more spectators wearing hats (49% and 37%, respectively)(P<.001) than in the same sections at night games (35% and 29%, respectively)(Table 1). During the day game, more spectators wore hats in the sunny section than in the adjacent shaded section (49% vs 37%; P<.001). Analysis of the same 2 sections during the night game revealed no significant differences.
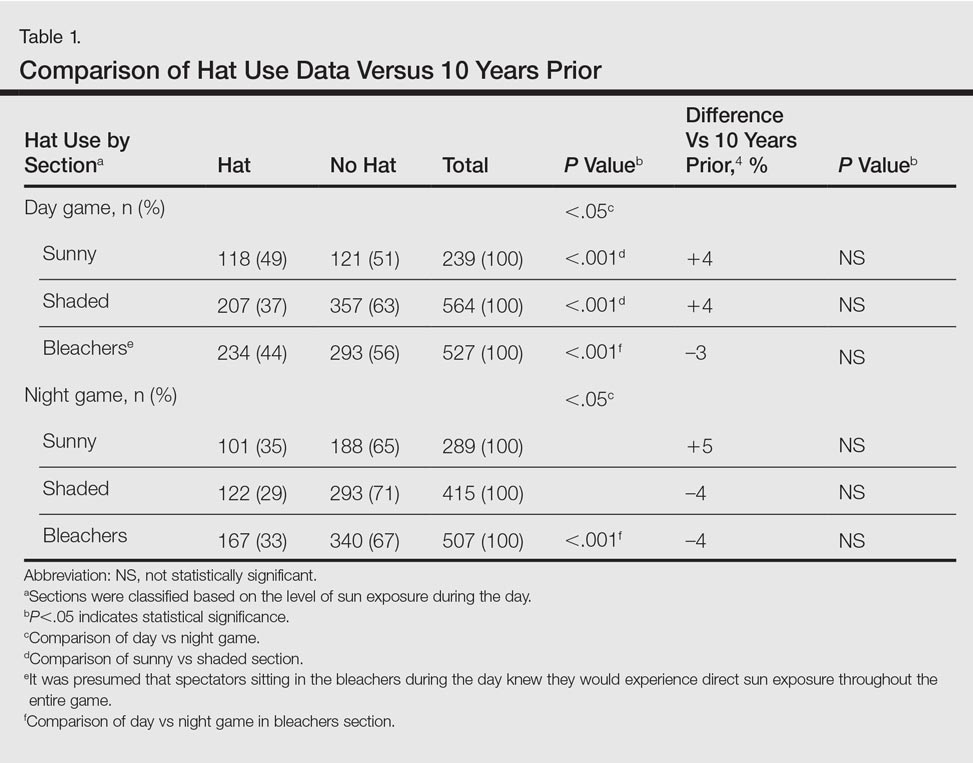
Spectators sitting in the bleachers during a day game who presumably knew to anticipate direct sun exposure showed no significant differences in hat-wearing patterns versus the sunny section (44% vs 49%) but were more likely to wear hats compared to those sitting in the bleachers at the night game (44% vs 33%)(P<.001)(Table 1). There was no significant difference in the number of hats worn by spectators in the sunny section in the second inning (43%) versus the same section after continuous sun exposure at the sixth inning (44%)(Table 2). Significantly more children seated in the bleachers during the day game wore hats compared to adults in the same section (64% vs 42%; P<.001)(Table 3). During the hat giveaway day, significantly more spectators wore hats (the majority of which were the free giveaway hats) across all sections studied (P<.001)(Table 4).
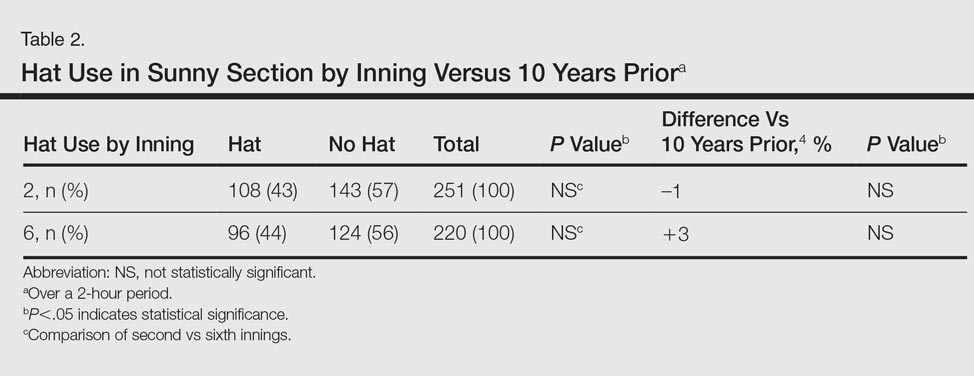
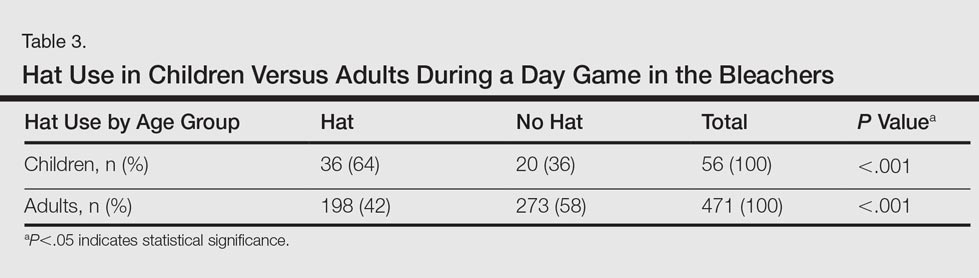

Comment
More than 23 million spectators attended daytime MLB games in 2015, with millions more attending minor league and amateur events.5Although sun-protection messages tend to be well understood and received by society, many choose to ignore them.6
In partnership with the American Academy of Dermatology, the MLB’s Play Sun Smart program has promoted UVR risk awareness at sporting events since 1999.3 Those affiliated with MLB teams also receive annual skin cancer screenings in conjunction with a public education effort in May of each season. However, despite the years of sun-protection education, our study found that less than half of attendees wore hats for UVR protection. In fact, there were no significant differences noted across all of the hat-wearing parameters studied (day vs night game, sunny vs shaded section, sunny section over course of game) between the current study compared to the results from 10 years prior4 (Tables 1 and 2). For spectators in the bleacher section, even presumably knowing in advance that seating would be in the sun did not significantly increase hat-wearing behavior. Although skin cancer rates continue to rise, hat-wearing trends remain stable, revealing a concerning trend.
Increased availability of sunscreen has led to improved sun-protective behaviors in many populations.7 In our study, the free hat giveaway had the greatest impact on hat wearing, which suggests that improved availability and access to hats can lead to an important opportunity for sun-protection programs to partner with hat manufacturers to augment their use and protective impact.
Sun avoidance during childhood and adolescence has been shown to decrease the risk for melanoma.1 Young children had the highest rate of hat usage in the current study, possibly due to parental example or dictates. Research has shown the importance of role models in promoting sun safety to young children,8,9 so perhaps use of hats by parents or MLB players contributed to the hat-wearing behavior observed in this subpopulation.
Given the limited change observed in hat-wearing behaviors over the last decade, a knowledge and behavioral gap appears to exist that may be able to be exploited to enhance future sun protection. Also, based on our findings, the MLB and other sun-protection education campaigns may wish to augment their UVR protective messages by offering hat giveaways, which appear to have a notable impact.
Acknowledgment
The authors thank Jessie Skapik, BS (New York, New York), for her independent review of the spectator photographs.
References
1. Rigel DS. Cutaneous ultraviolet exposure and its relationship to the development of skin cancer. J Am Acad Dermatol. 2008;58(5, suppl 2):S129-S132.
2. Lim HW, James WD, Rigel DS, et al. Adverse effects of ultraviolet radiation from the use of indoor tanning equipment: time to ban the tan. J Am Acad Dermatol. 2011;64:893-902.
3. Play Sun Smart. American Academy of Dermatology website. https://www.aad.org/public/spot-skin-cancer/programs/play-sun-smart. Accessed August 25, 2016.
4. Rigel AS, Lebwohl MG. Hat-wearing patterns in persons attending baseball games. J Am Acad Dermatol. 2006;54:918-919.
5. MLB attendance report - 2016. ESPN website. www.espn.go.com/mlb/attendance. Accessed May 20, 2016.
6. Turner D, Harrison SL, Buettner P, et al. Does being a “SunSmart School” influence hat-wearing compliance? an ecological study of hat-wearing rates at Australian primary schools in a region of high sun exposure [published online December 29, 2013]. Prev Med. 2014;60:107-114.
7. Dubas LE, Adams BB. Sunscreen use and availability among female collegiate athletes [published online February 3, 2012]. J Am Acad Dermatol. 2012;67:876.e1-876.e6.
8. O’Riodran DL, Geller AC, Brooks DR, et al. Sunburn reduction through parental role modeling and sunscreen vigilance. J Pediatr. 2003;142:67-72.
9. Turrisi R, Hillhouse J, Heavin S, et al. Examination of the short-term efficacy of a parent-based intervention to prevent skin cancer. J Behav Med. 2004;27:393-412.
Spectators at baseball games may be exposed to excess solar UV radiation (UVR), which has been linked to the development of both melanoma and nonmelanoma skin cancers.1,2 Although baseball hats traditionally are worn to demonstrate team support, they also may provide some sun protection for the head and face where skin cancers are commonly found.
The importance of protecting the skin from solar UVR has led to sun-protection programs and community education as well as efforts to evaluate the impact of these programs. Major League Baseball (MLB) has partnered with the American Academy of Dermatology since 1999 to promote the importance of sun protection and raise skin cancer awareness through its Play Sun Smart program.3 A study conducted 10 years ago (N=2030) evaluated hat use in spectators at MLB games and noted that less than half of all spectators in seating sections exposed to direct sunlight wore hats.4 The purpose of the current study was to evaluate how public education about sun protection has impacted the use of hats by spectators at MLB games in 2015 compared to the prior study in 2006.
Methods
Data were collected during a 3-game series (2 day games, 1 night game) in August 2015 in New York, New York. During one of the day games, 18,000 fans received a free wide-brimmed hat. High-resolution digital photographs of seating sections were obtained using a camera with a 300-mm lens. Using the same methodology as the prior study,4 sunny and shaded seating sections were photographed during all 3 games (Figure). Photographs of each section were analyzed by an independent reviewer using a high-resolution computer screen. Spectators wearing head coverings—baseball hats, visors, or hats with circumferential brims—were defined as using hats. The number of spectators wearing hats versus not wearing hats was recorded for all identical sections of interest. Bleacher seating was analyzed separately, as spectators presumably knew in advance of the continuous direct sun exposure during day games, and a subset of young children in the bleachers (<10 years of age) also was assessed. A continuously sunny section also was evaluated at the second and sixth innings to see if hats were presumably purchased during exposure. Statistical significance was determined using χ2 tests with P<.05 indicating statistical significance.
Results
This analysis consisted of 3539 spectators. In both the sunny and shaded sections of a day game, there were more spectators wearing hats (49% and 37%, respectively)(P<.001) than in the same sections at night games (35% and 29%, respectively)(Table 1). During the day game, more spectators wore hats in the sunny section than in the adjacent shaded section (49% vs 37%; P<.001). Analysis of the same 2 sections during the night game revealed no significant differences.
Spectators sitting in the bleachers during a day game who presumably knew to anticipate direct sun exposure showed no significant differences in hat-wearing patterns versus the sunny section (44% vs 49%) but were more likely to wear hats compared to those sitting in the bleachers at the night game (44% vs 33%)(P<.001)(Table 1). There was no significant difference in the number of hats worn by spectators in the sunny section in the second inning (43%) versus the same section after continuous sun exposure at the sixth inning (44%)(Table 2). Significantly more children seated in the bleachers during the day game wore hats compared to adults in the same section (64% vs 42%; P<.001)(Table 3). During the hat giveaway day, significantly more spectators wore hats (the majority of which were the free giveaway hats) across all sections studied (P<.001)(Table 4).
Comment
More than 23 million spectators attended daytime MLB games in 2015, with millions more attending minor league and amateur events.5Although sun-protection messages tend to be well understood and received by society, many choose to ignore them.6
In partnership with the American Academy of Dermatology, the MLB’s Play Sun Smart program has promoted UVR risk awareness at sporting events since 1999.3 Those affiliated with MLB teams also receive annual skin cancer screenings in conjunction with a public education effort in May of each season. However, despite the years of sun-protection education, our study found that less than half of attendees wore hats for UVR protection. In fact, there were no significant differences noted across all of the hat-wearing parameters studied (day vs night game, sunny vs shaded section, sunny section over course of game) between the current study compared to the results from 10 years prior4 (Tables 1 and 2). For spectators in the bleacher section, even presumably knowing in advance that seating would be in the sun did not significantly increase hat-wearing behavior. Although skin cancer rates continue to rise, hat-wearing trends remain stable, revealing a concerning trend.
Increased availability of sunscreen has led to improved sun-protective behaviors in many populations.7 In our study, the free hat giveaway had the greatest impact on hat wearing, which suggests that improved availability and access to hats can lead to an important opportunity for sun-protection programs to partner with hat manufacturers to augment their use and protective impact.
Sun avoidance during childhood and adolescence has been shown to decrease the risk for melanoma.1 Young children had the highest rate of hat usage in the current study, possibly due to parental example or dictates. Research has shown the importance of role models in promoting sun safety to young children,8,9 so perhaps use of hats by parents or MLB players contributed to the hat-wearing behavior observed in this subpopulation.
Given the limited change observed in hat-wearing behaviors over the last decade, a knowledge and behavioral gap appears to exist that may be able to be exploited to enhance future sun protection. Also, based on our findings, the MLB and other sun-protection education campaigns may wish to augment their UVR protective messages by offering hat giveaways, which appear to have a notable impact.
Acknowledgment
The authors thank Jessie Skapik, BS (New York, New York), for her independent review of the spectator photographs.
References
1. Rigel DS. Cutaneous ultraviolet exposure and its relationship to the development of skin cancer. J Am Acad Dermatol. 2008;58(5, suppl 2):S129-S132.
2. Lim HW, James WD, Rigel DS, et al. Adverse effects of ultraviolet radiation from the use of indoor tanning equipment: time to ban the tan. J Am Acad Dermatol. 2011;64:893-902.
3. Play Sun Smart. American Academy of Dermatology website. https://www.aad.org/public/spot-skin-cancer/programs/play-sun-smart. Accessed August 25, 2016.
4. Rigel AS, Lebwohl MG. Hat-wearing patterns in persons attending baseball games. J Am Acad Dermatol. 2006;54:918-919.
5. MLB attendance report - 2016. ESPN website. www.espn.go.com/mlb/attendance. Accessed May 20, 2016.
6. Turner D, Harrison SL, Buettner P, et al. Does being a “SunSmart School” influence hat-wearing compliance? an ecological study of hat-wearing rates at Australian primary schools in a region of high sun exposure [published online December 29, 2013]. Prev Med. 2014;60:107-114.
7. Dubas LE, Adams BB. Sunscreen use and availability among female collegiate athletes [published online February 3, 2012]. J Am Acad Dermatol. 2012;67:876.e1-876.e6.
8. O’Riodran DL, Geller AC, Brooks DR, et al. Sunburn reduction through parental role modeling and sunscreen vigilance. J Pediatr. 2003;142:67-72.
9. Turrisi R, Hillhouse J, Heavin S, et al. Examination of the short-term efficacy of a parent-based intervention to prevent skin cancer. J Behav Med. 2004;27:393-412.
Practice Points
- With less than half of attendees wearing hats to Major League Baseball games, there has been limited change in hat-wearing behavior over the last decade, possibly due to a knowledge or behavioral gap.
- Improved availability and access to hats can lead to improved sun-protective behaviors.

Medication List Discrepancies and Therapeutic Duplications Among Dual Use Veterans
In the U.S., 4.5 million ambulatory care visits occur annually due to adverse drug reactions (ADRs) of prescription medications.1 Many ADRs are severe, and they result in more than 100,000 death per year.2 A significant number of these ADRs are preventable and are a result of inappropriate prescribing.3 It is well-documented that inappropriate prescribing is exacerbated by the number of patients who see multiple prescribers and use many different prescription medications.4 This situation results in many versions of a patient’s medication list and in discrepancies across data sources.5
Medication list discrepancies have been researched in the context of care transitions between the hospital and home.6,7 However, less attention has been given to community-dwelling adults who use multiple outpatient prescribers, a practice common among older adults with chronic conditions who see a primary care provider and several specialists.4 Also, veterans are a growing patient population who use providers from multiple health care systems.8 Up to 70% of veterans enrolled in VA health care use both VA and non-VA providers. These patients are referred to as dual users.9,10
There has been an increasing push for patients to be more actively engaged in their own health care, including maintenance of their medication list and other personal health information.11-13 Providers have realized that patients have important experiences and preferences to share about how they use medications at home.14,15 Research suggests that patient interest and ability to use patient portals is variable and dependent on age, technical abilities, health literacy, and endorsement by their providers.16 Greater patient engagement in the medication management process is potentially advantageous, especially because providers from different health care systems often lack the capability to share medication list information.12,17
My HealtheVet, the VA’s patient portal, offers veterans several features. For example, users can securely message providers, refill prescriptions, check appointments, self-enter information, and download their VA health record (including medication history) using the Blue Button (BB) feature. The BB is managed by the HHS to provide consistency across electronic health record platforms.18,19
This BB medication list gives VA patients the tool they need to inform their providers about the medications they take, particularly dual users. VA patients that use multiple prescribers are subject to medication list discrepancies because of the fragmentation of information.4,20
Objectives
The objectives of this study were to (1) describe discrepancies between VA medication lists and non-VA provider medication lists for a group of veteran dual users; (2) identify therapeutic duplications in these lists; and (3) contextualize discrepancies by interviewing non-VA providers about their medication reconciliation processes and management of dual use patients.
Methods
This analysis is based on data collected as part of a pilot randomized controlled trial by Turvey and colleagues.21 Veterans with a diagnosis of ≥ 1 chronic health condition (eg, diabetes, hypertension) were invited by letter to participate in a study about using online management of their health information. Interested patients were screened to meet additional inclusion criteria, such as taking ≥ 5 medications, receiving care from a non-VA provider, an appointment with a non-VA provider within the study time frame, and access to a computer, online access, and printer.
Eligible veterans were randomized to receive either (1) BB training (intervention group) instructing patients to download the Continuity of Care Document and bring it to their non-VA provider visit; or (2) a training evaluating medical information online (control group). Training information was mailed, including written materials and phone support, to both groups. The intervention group could also access an online training link.
One of the objectives was to test whether downloading and bringing the health information to a non-VA appointment decreased medication list discrepancies. The sample was small, and differences in discrepancy rates between groups were not significant. Therefore, groups were combined for the present analysis. Visits occurred between December 2013 and December 2014. Greater detail about study design and primary results are available in the study by Turvey and colleagues.21
Study procedures were approved by the University of Iowa Institutional Review Board and the Iowa City VA Health Care System Research and Development Committee. All participants provided consent.
Identifying Discrepancies
A 4-phase process was used to address medication discrepancies.22,23 The first phase defined medication discrepancy categories. The mutually exclusive categories were dose, frequency, and missing discrepancies. In cases where a medication was both dose and frequency discrepant, only dose discrepancy was applied. For missing medications, entities on only the VA list were marked as “non-VA missing” and medications appearing on only the non-VA list would be denoted as “VA missing.” Medications with no discrepancy were marked as such.
Phase 2 involved collecting medication data. Medication lists from the VA medical record were printed at the time of the non-VA provider appointment. Non-VA medication lists were obtained by sending a medical record request for the visit note, medication list, and any associated visit test results to the non-VA provider office within 2 to 3 weeks of the appointment. Patient names from both lists were replaced with unique patient identifiers.
In phase 3, a research assistant abstracted the hard copy medication lists into a database and identified discrepancies. Variables included medication name, dose, frequency, and administration route. Although administration routes were collected, discrepancies were not assessed because this information commonly was not specified. Medications also were coded as prescription or over-the-counter (OTC). Durable medical equipment often was present on VA lists (eg, syringes, test strips) and was excluded from all analyses. Medications also were not coded as discrepant if they were referenced in a visit note as being changed by the non-VA provider. These combined lists were evaluated by the research assistant based on the discrepancy categories specified in phase 1 and were verified by a pharmacist.
Phase 4 involved counting medication discrepancies. Medication discrepancy rates were calculated at the patient level, both descriptively (mean number of discrepancies per patient) and as a proportion of medications discrepant (number of discrepancies divided by total medications).
Identifying Duplications and High-Risk Medications
A pharmacist examined each combined medication list to identify therapeutic duplications, defined as a patient using ≥ 2 medications from the same medication class (eg, patient taking 2 statin drugs) but not 2 drugs for the same condition (eg, fish oil and atorvastatin for dyslipidemia). High-risk medications also were noted, including anticoagulants, certain nonsteroidal anti-inflammatory drugs, oral and injectable hypoglycemics, opioids, sedatives, and hypnotics.24-26 These medications received special focus because of their link to a high risk for ADRs.27
Descriptive statistics were calculated for patient characteristics and for each discrepancy type, both overall and according to prescription OTC, and high-risk medications. The proportion of discrepant medications was calculated for each category. Bivariate correlations were calculated for select variables to understand potential relationships.
Interviews With Non-VA Providers
All patients were instructed to bring a consent letter and the 1-page questionnaire to their non-VA provider appointment. The questionnaire contained an item asking whether non-VA providers could be contacted for a 15- to 30-minute follow-up interview. The semistructured, qualitative interviews assessed their experiences working with VA providers and VA patients, experiences with VA documents or records, preferences for receiving information from the VA, experience with personal health records, and sharing information with the VA. Eight interviews were conducted, audio-recorded, and transcribed. The goal of the interviews was to explore and understand provider perspectives on managing dual use veterans, including medication reconciliation processes to add context to the interpretation of medication list analysis. Because the data set was relatively small, summaries of each interview were created to highlight main points. These main points were sorted into topics, summarized, and representative quotes were selected.
Results
Fifty veterans were included in the analysis (Table 1). The mean age was 68.5 (SD 6.2); 90% were men. On average, they reported having 6 chronic health conditions and a fair-to-good health status. Based on the combined medication lists from VA and non-VA providers, veterans took an average of 15.8 (SD 7.0) unique medications (combined prescription and OTC/vitamins) and had an average of 10.0 (SD 6.1) all-type discrepancies (Table 2).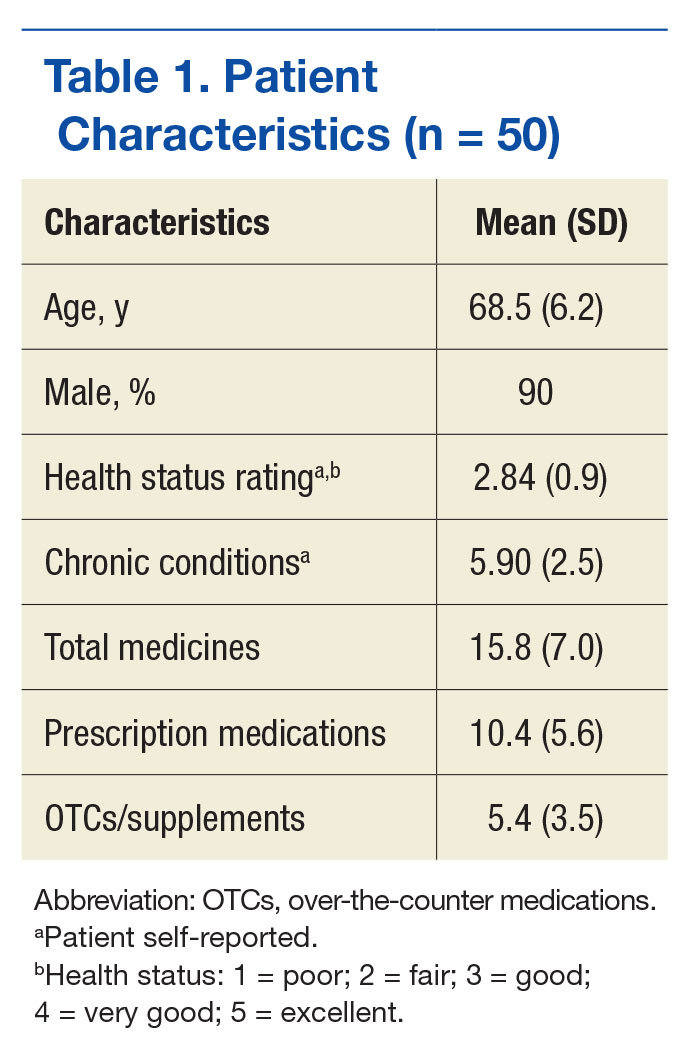
Overall, 58% of the prescription medications were discrepant: The most common discrepancy between the 2 lists was medication missing on one of the lists, which occurred 3.9 times per patient on average for prescription medications and 2.8 times per patient for OTCs. Frequency or dose discrepancies also were common between the lists at a rate of 1.9 discrepancies per patient for prescription medications and 1.2 discrepancies per patient for OTCs.
For high-risk medications, opiates and sedative medications had the most discrepancies between the lists because the VA practitioner may not have known that the patient was taking an opiate, although other discrepancies were present (Table 3). Anticoagulant discrepancies were the most consistent, most of these occurring with aspirin. Last, insulin commonly was dose discrepant between the 2 lists, although it also was missing from one list for a number of patients. Overall, high-risk medications shared a discrepancy rate (46.9%) similar to the overall rate.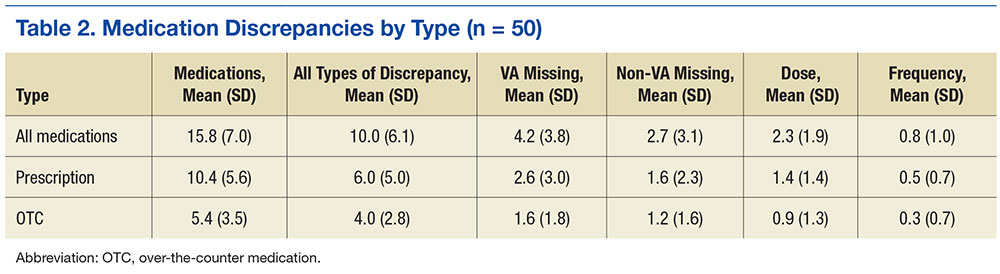
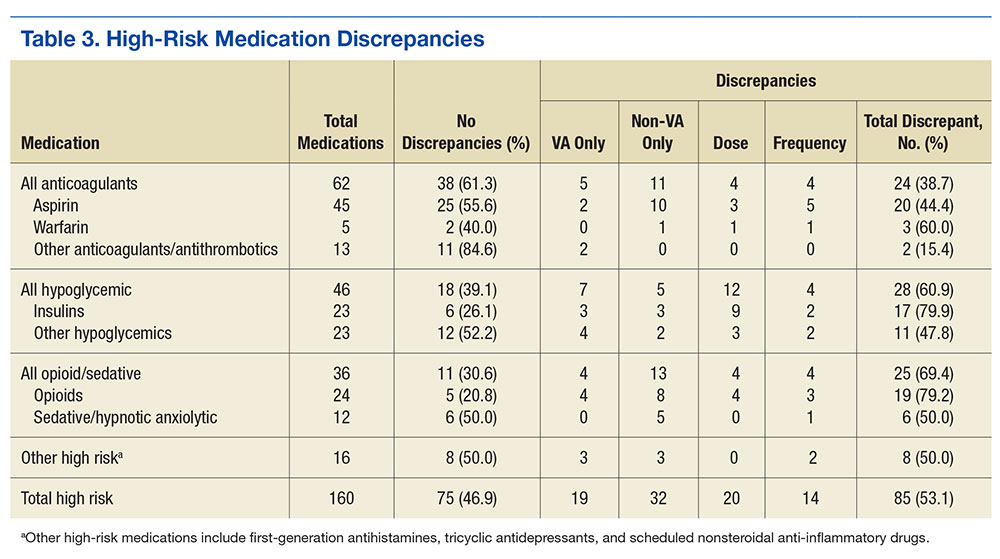
Twelve therapeutic duplications were identified in the sample.Ten were between-list duplications, that is, “provider A” thought the patient was on a particular medication and “provider B” thought that the patient was on a different medication (Table 4). In 6 instances, within-list duplications were identified (ie, a provider had 2 medications on the list that should not be taken together because they were in the same drug class). In 4 cases, both between- and within-list duplications were present.
Interview Summaries
Veterans and medication. Multiple non-VA providers said that the primary reason veteran patients were going to a VA provider was to obtain discounted medications. The use of the VA for medications also was a way for the non-VA provider to discover that the patient was a veteran. One non-VA provider was particularly concerned about the impact of new or different medications from VA prescribers on efforts to stabilize the patient’s chronic condition.
Several non-VA providers reported that veterans often brought a medication list to the appointment, and several providers recommended the practice to their patients. Non-VA providers preferred to have patients transfer information from VA, sometimes requesting that veterans bring in their records from recent appointments rather than the non-VA provider obtain the information directly from the VA.
Information sharing. Non-VA providers generally preferred hard copies of medication lists and other documents rather than scans because they were more likely to be included in decision making if the documents were presented during the visit. Also, document scans may be buried in the electronic medical record. Some providers mentioned their interest in electronic transfer of medical information like medication lists if the technology were more developed and better integrated.
“I think the long-term vision would be that it should be electronic… it wouldn’t necessarily be feasible at this time. Our system scans paper documents in to an e-version. … but when the patient comes to their encounter 10 days later, you don’t realize the stuff’s there… Having the patient bring them in is probably a more certain way to make sure that it’s actually included in your decision making as a provider.”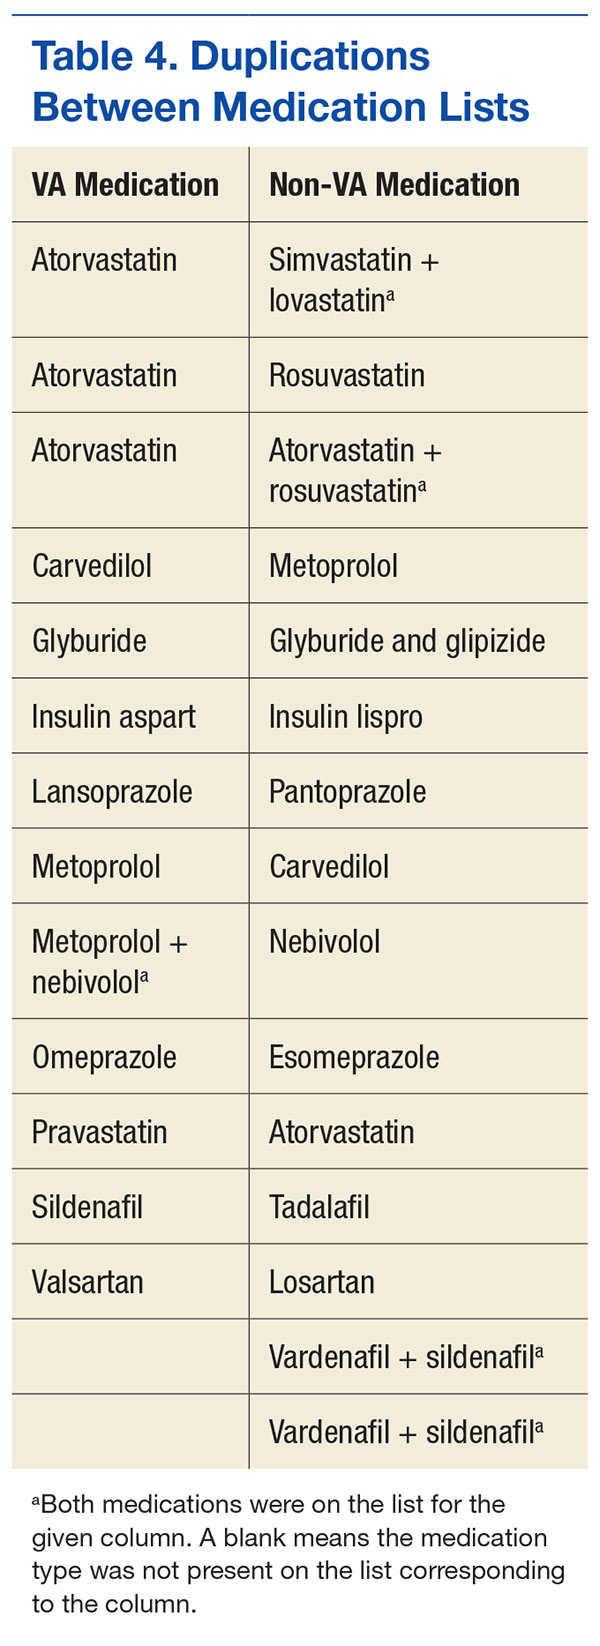
Most non-VA providers welcomed more information such as imaging studies because they reported rarely receiving this information from the VA system. Two mentioned the potential for too much information and wanted concise reports should the flow of information increase. Providers had little interest in logging in to a patient’s online health record portal as a delegate for reasons related to complexity, time, privacy, and lack of mechanism to document the information accessed.
Medication reconciliation. Non-VA providers generally reported that patients bringing their own or an outside medication list would prompt a process of medication reconciliation. The providers were interested in making changes to their records based on other lists, but outside data were verified against a patient self-report of actual use before adopting changes.
“I print out my med list of what I have in the computer and then I just check off my list against their list. And then whatever’s remaining, we talk about what the differences are, when they were changed, what they were changed for, if they were taken off of something, and if I don’t agree, then I’ll tell the patient, ‘look, there’s a disagreement here, they’ve told you not to be on this. I want you on this.”
Should a discrepancy arise, non-VA providers generally had a negative view of attempting to contact VA providers. Other mechanisms such as calling a local pharmacy would be done first.
Discussion
This study provided initial evidence that medication list discrepancies exist for dual use veterans. Other studies of medication list discrepancies have linked such inconsistencies to medication-related problems and negative outcomes for patients.27 Although efforts to increase access to care for veterans have advantages related to expediency, consequences to fragmenting care exist. More robust mechanisms for establishing and maintaining medication list consistency are needed, especially given the lack of a universally accepted medical record format or repository. A multifaceted approach, including patient engagement, seems necessary.
This study also showed that discrepancies of high-risk medications are common for veteran participants, placing them at risk for medication-related problems and harm. These risks included dose and frequency discrepancies that could result in over- or underdosing of medications and in medication omissions, which could cause duplicative therapies and unnecessary risks. For example, aspirin frequently was listed on non-VA lists but was omitted from VA medication lists. This could be problematic for patients who present to the VA for a procedure in which no information about aspirin could jeopardize their safety. Insulin doses also were commonly discrepant, which could impact glycemic control.
Many providers also had incomplete prescribing information for opiates. Those prescriptions are particularly relevant given the link between veterans, posttraumatic stress disorder, depression, and substance abuse.28-30 However, it was beyond the scope of this pilot study to link these discrepancies to ADRs, such as emergency department visits or hospital admissions. Other studies have demonstrated that discrepancies at hospital discharge can result in these types of negative outcomes.27,31 Subsequent research should determine the clinical significance of discrepancies that occur when veterans are dual users.
The qualitative interviews provided some initial context on prescriber perspectives about the role of veterans participating in the medication list sharing process and personal health records. It seemed that for the portion of patients who brought a list to their non-VA provider appointment, the information was welcomed but fell outside the usual visit workflow. Many provider visits are dominated by current patient symptoms, and issues of reconciling medications may be a lower priority.32 Also, some providers may delegate medication reconciliation functions to a nurse or other support staff. One physician offered that he delegated logging in to a patient’s online medication information to a health coach on staff. These findings were consistent with perspectives shared by non-VA family practice physicians about personal health records.33
The most common way to integrate outside medication lists into the non-VA provider’s medical record seemed to be scanning the document. Scanning had its limitations because the provider might be unaware of the scanned document, and there were no mechanisms to import medication names and doses. However, the process may improve only the non-VA providers’ records, as they reported that they had no easy or consistent way to transmit medication changes to notes to the VA.
In general, communicating with VA providers was seen as not feasible and not worth their time or effort. It may be beneficial to address this non-VA provider concern because it seems to inhibit the transfer of important health information and the maintenance of a concordant medication record. Information transfer is particularly relevant for veterans who are primarily cared for by non-VA providers and use the VA only to get prescription medications.
In the current approach, non-VA providers have no simple, direct way to update the VA medication list. Transmitting updates carries the risk of inappropriate changes and is concerning if neither or both prescribers consider themselves to be responsible for the patient’s medications. Also, the potential exists for all medication lists to be inaccurate if the lists do not reflect the medications patients take when left on their own. Patient nonadherence rates can exceed 50%, depending on the medication.34,35 Several interviewed non-VA physicians stressed the importance of asking patients to list the medications they were using during the medication reconciliation process.
This study offers several areas for additional inquiry, including understanding how providers make sense of medication lists from other sources and what technologies can be applied to increase list consistency without increasing the burden on providers.
Practice Implications
Although patient involvement in medication list sharing has the potential to improve information consistency, health systems, providers, and other stakeholders should be cautious in assuming that other prescribers will work to combat medication list entropy, especially if no systems exist to seamlessly incorporate this information into clinic workflow. Devising standardized procedures when patients bring in their records from other providers increases the likelihood that this information will be incorporated into clinical decision making and maintaining up-to-date medication information for patients who use multiple prescribers.
Limitations
These analyses are based on a small sample size (n = 50 for chart review) and (n = 8 for the semistructured interviews) from a single Midwestern state. These findings should be used as evidence for further inquiry.
Conclusion
This study illuminates the level of discrepancies between the medication lists of veteran dual users, including high rates of discrepancies for high-risk medications, such as anticoagulants and opiates. This study also provides evidence of deficiencies in the health care system to decrease medication list entropy that may place veterans at an elevated risk for adverse medication events.
1. Sarkar U, López A, Maselli JH, Gonzales R. Adverse drug events in US adult ambulatory medical care. Health Serv Res. 2011;46(5):1517-1533.
2. Kohn LT, Corrigan JM, Donaldson MS. To Err Is Human:Building a Safer Health System. Washington, DC: Institute of Medicine, National Academy Press; 1999.
3. Gandhi TK, Weingart SN, Borus J, et al. Adverse drug events in ambulatory care. N Eng J Med. 2003;348(16):1556-1564.
4. Tamblyn RM, McLeod PJ, Abrahamowicz M, Laprise R. Do too many cooks spoil the broth? Multiple physician involvement in medical management of elderly patients and potentially inappropriate drug combinations. CMAJ. 1996;154(8):1177-1184.
5. Wong JD, Bajcar JM, Wong GG, et al. Medication reconciliation at hospital discharge: evaluating discrepancies. Ann Pharmacother. 2008;42(10):1373-1379.
6. Kripalani S, LeFevre F, Phillips CO, Williams MV, Basaviah P, Baker DW. Deficits in communication and information transfer between hospital-based and primary care physicians: implications for patient safety and continuity of care. JAMA. 2007;297(8):831-841.
7. McMillan A, Trompeter J, Havrda D, Fox J. Continuity of care between family practice physicians and hospitalist services. J Healthare Qual. 2013;35(1):41-49.
8. Liu CF, Manning WG, Burgess JF Jr, et al. Reliance on Veterans Affairs outpatient care by Medicare-eligible veterans. Med Care. 2011;49(10):911-917.
9. U.S. Department of Veterans Affairs, Veterans Health Administration. VHA Office of the ADUSH for Policy and Planning. 2011 survey of veteran enrollees’ health and reliance upon VA. http://www.va.gov/healthpolicyplanning/soe2011/soe2011_report.pdf. Published March 2012. Accessed August 2, 2016.
10. Nayar P, Apenteng B, Yu F, Woodbridge P, Fetrick A. Rural veterans’ perspectives of dual care. J Community Health. 2013;38(1):70-77.
11. Chae SY, Chae MH, Isaacson N, James TS. The patient medication list: can we get patients more involved in their medical care? J Am Board Fam Med. 2009;22(6):677-685.
12. Tang PC, Ash JS, Bates DW, Overhage JM, Sands DZ. Personal health records: definitions, benefits, and strategies for overcoming barriers to adoption. J Am Med Informatics Assoc. 2006;13(2):121-126.
13. Stroupe KT, Smith BM, Hogan TP, et al. Medication acquisition across systems of care and patient–provider communication among older veterans. Am J Health Syst Pharm. 2013;70(9):804-813.
14. Shoemaker SJ, Ramalho de Oliveira D, Alves M, Ekstrand M. The medication experience: preliminary evidence of its value for patient education and counseling on chronic medications. Patient Educ Couns. 2011;83(3):443-450.
15. Chewning B, Boh L, Wiederholt J, et al. Does the concordance concept serve patient medication management? Int J Pharm Pract. 2001;9(2):71-79.
16. Irizarry T, DeVito Dabbs A, Curran CR. Patient portals and patient engagement: a state of the science review. J Med Internet Res. 2015;17(6):e148.
17. Schnipper JL, Gandhi TK, Wald JS, et al. Effects of an online personal health record on medication accuracy and safety: a cluster-randomized trial. J Am Med Inform Assoc. 2012;19(5):728-734.
18. Turvey C, Klein D, Fix G, et al. Blue Button use by patients to access and share health record information using the Department of Veterans Affairs’ online patient portal. J Am Med Inform Assoc. 2014;21(4):657-663.
19. Hogan TP, Nazi KM, Luger TM, et al. Technology-assisted patient access to clinical information: an evaluation framework for Blue Button. JMIR Res Protoc. 2014;3(1):e18.
20. Steinman MA, Handler SM, Gurwitz JH, Schiff GD, Covinsky KE. Beyond the prescription: medication monitoring and adverse drug events in older adults. J Am Geriatr Soc. 2011;59(8):1520-1530.
21. Turvey CL, Klein DM, Witry M, et al. Patient education for consumer-mediated HIE. A pilot randomized controlled trial of the Department of Veterans Affairs Blue Button. Appl Clin Inform. 2016;7(3):765-776.
22. Polnaszek B, Gilmore-Bykovskyi A, Hovanes M, et al. Overcoming the challenges of unstructured data in multisite, electronic medical record-based abstraction [published online ahead of print June 25, 2014]. Med Care. doi: 10.1097/MLR.0000000000000108.
23. Kennelty K, Witry MJ, Gehring M, M D, Pulia N. A four-phase approach for systematically collecting data and measuring medication discrepancies when patients transition between health care settings. Res Social Adm Pharm. 2016;12(4):548-558.
24. American Geriatrics Society 2012 Beers Criteria Update Expert Panel. American Geriatrics Society updated Beers criteria for potentially inappropriate medication use in older adults. J Am Geriatr Soc. 2012;60(4):616-631.
25. Gurwitz JH, Field TS, Harrold LR, et al. Incidence and preventability of adverse drug events among older persons in the ambulatory setting. JAMA. 2003;289(9):1107-1116.
26. Gurwitz JH, Field TS, Avorn J, et al. Incidence and preventability of adverse drug events in nursing homes. Am J Med. 2000;109(2):87-94.
27. Boockvar KS, Liu S, Goldstein N, Nebeker J, Siu A, Fried T. Prescribing discrepancies likely to cause adverse drug events after patient transfer. Qual Saf Health Care. 2009;18(1):32-36.
28. Shipherd JC, Stafford J, Tanner LR. Predicting alcohol and drug abuse in Persian Gulf War veterans: what role do PTSD symptoms play? Addict Behav. 2005;30(3):595-599.
29. Markou A, Kosten TR, Koob GF. Neurobiological similarities in depression and drug dependence: a self-medication hypothesis. Neuropsychopharmacology. 1998;18(3):135-174.
30. McFall ME, Mackay PW, Donovan DM. Combat-related posttraumatic stress disorder and severity of substance abuse in Vietnam veterans. J Stud Alcohol. 1992;53(4):357-363.
31. Kwan JL, Lo L, Sampson M, Shojania KG. Medication reconciliation during transitions of care as a patient safety strategy: a systematic review. Ann Intern Med. 2013;158(5, pt 2):397-403.
32. Richard C, Lussier MT. Nature and frequency of exchanges on medications during primary care encounters. Patient Educ Couns. 2006;64(1-3):207-216.
33. Witry MJ, Doucette WR, Daly JM, Levy BT, Chrischilles EA. Family physician perceptions of personal health records. Perspect Health Inf Manag. 2010;7.
34. Horne R, Weinman J. Patients’ beliefs about prescribed medicines and their role in adherence to treatment in chronic physical illness. J Psychosom Res. 1999;47(6):555-567.
35. Osterberg L, Blaschke T. Adherence to medication. N Eng J Med. 2005;353(5):487-497.
In the U.S., 4.5 million ambulatory care visits occur annually due to adverse drug reactions (ADRs) of prescription medications.1 Many ADRs are severe, and they result in more than 100,000 death per year.2 A significant number of these ADRs are preventable and are a result of inappropriate prescribing.3 It is well-documented that inappropriate prescribing is exacerbated by the number of patients who see multiple prescribers and use many different prescription medications.4 This situation results in many versions of a patient’s medication list and in discrepancies across data sources.5
Medication list discrepancies have been researched in the context of care transitions between the hospital and home.6,7 However, less attention has been given to community-dwelling adults who use multiple outpatient prescribers, a practice common among older adults with chronic conditions who see a primary care provider and several specialists.4 Also, veterans are a growing patient population who use providers from multiple health care systems.8 Up to 70% of veterans enrolled in VA health care use both VA and non-VA providers. These patients are referred to as dual users.9,10
There has been an increasing push for patients to be more actively engaged in their own health care, including maintenance of their medication list and other personal health information.11-13 Providers have realized that patients have important experiences and preferences to share about how they use medications at home.14,15 Research suggests that patient interest and ability to use patient portals is variable and dependent on age, technical abilities, health literacy, and endorsement by their providers.16 Greater patient engagement in the medication management process is potentially advantageous, especially because providers from different health care systems often lack the capability to share medication list information.12,17
My HealtheVet, the VA’s patient portal, offers veterans several features. For example, users can securely message providers, refill prescriptions, check appointments, self-enter information, and download their VA health record (including medication history) using the Blue Button (BB) feature. The BB is managed by the HHS to provide consistency across electronic health record platforms.18,19
This BB medication list gives VA patients the tool they need to inform their providers about the medications they take, particularly dual users. VA patients that use multiple prescribers are subject to medication list discrepancies because of the fragmentation of information.4,20
Objectives
The objectives of this study were to (1) describe discrepancies between VA medication lists and non-VA provider medication lists for a group of veteran dual users; (2) identify therapeutic duplications in these lists; and (3) contextualize discrepancies by interviewing non-VA providers about their medication reconciliation processes and management of dual use patients.
Methods
This analysis is based on data collected as part of a pilot randomized controlled trial by Turvey and colleagues.21 Veterans with a diagnosis of ≥ 1 chronic health condition (eg, diabetes, hypertension) were invited by letter to participate in a study about using online management of their health information. Interested patients were screened to meet additional inclusion criteria, such as taking ≥ 5 medications, receiving care from a non-VA provider, an appointment with a non-VA provider within the study time frame, and access to a computer, online access, and printer.
Eligible veterans were randomized to receive either (1) BB training (intervention group) instructing patients to download the Continuity of Care Document and bring it to their non-VA provider visit; or (2) a training evaluating medical information online (control group). Training information was mailed, including written materials and phone support, to both groups. The intervention group could also access an online training link.
One of the objectives was to test whether downloading and bringing the health information to a non-VA appointment decreased medication list discrepancies. The sample was small, and differences in discrepancy rates between groups were not significant. Therefore, groups were combined for the present analysis. Visits occurred between December 2013 and December 2014. Greater detail about study design and primary results are available in the study by Turvey and colleagues.21
Study procedures were approved by the University of Iowa Institutional Review Board and the Iowa City VA Health Care System Research and Development Committee. All participants provided consent.
Identifying Discrepancies
A 4-phase process was used to address medication discrepancies.22,23 The first phase defined medication discrepancy categories. The mutually exclusive categories were dose, frequency, and missing discrepancies. In cases where a medication was both dose and frequency discrepant, only dose discrepancy was applied. For missing medications, entities on only the VA list were marked as “non-VA missing” and medications appearing on only the non-VA list would be denoted as “VA missing.” Medications with no discrepancy were marked as such.
Phase 2 involved collecting medication data. Medication lists from the VA medical record were printed at the time of the non-VA provider appointment. Non-VA medication lists were obtained by sending a medical record request for the visit note, medication list, and any associated visit test results to the non-VA provider office within 2 to 3 weeks of the appointment. Patient names from both lists were replaced with unique patient identifiers.
In phase 3, a research assistant abstracted the hard copy medication lists into a database and identified discrepancies. Variables included medication name, dose, frequency, and administration route. Although administration routes were collected, discrepancies were not assessed because this information commonly was not specified. Medications also were coded as prescription or over-the-counter (OTC). Durable medical equipment often was present on VA lists (eg, syringes, test strips) and was excluded from all analyses. Medications also were not coded as discrepant if they were referenced in a visit note as being changed by the non-VA provider. These combined lists were evaluated by the research assistant based on the discrepancy categories specified in phase 1 and were verified by a pharmacist.
Phase 4 involved counting medication discrepancies. Medication discrepancy rates were calculated at the patient level, both descriptively (mean number of discrepancies per patient) and as a proportion of medications discrepant (number of discrepancies divided by total medications).
Identifying Duplications and High-Risk Medications
A pharmacist examined each combined medication list to identify therapeutic duplications, defined as a patient using ≥ 2 medications from the same medication class (eg, patient taking 2 statin drugs) but not 2 drugs for the same condition (eg, fish oil and atorvastatin for dyslipidemia). High-risk medications also were noted, including anticoagulants, certain nonsteroidal anti-inflammatory drugs, oral and injectable hypoglycemics, opioids, sedatives, and hypnotics.24-26 These medications received special focus because of their link to a high risk for ADRs.27
Descriptive statistics were calculated for patient characteristics and for each discrepancy type, both overall and according to prescription OTC, and high-risk medications. The proportion of discrepant medications was calculated for each category. Bivariate correlations were calculated for select variables to understand potential relationships.
Interviews With Non-VA Providers
All patients were instructed to bring a consent letter and the 1-page questionnaire to their non-VA provider appointment. The questionnaire contained an item asking whether non-VA providers could be contacted for a 15- to 30-minute follow-up interview. The semistructured, qualitative interviews assessed their experiences working with VA providers and VA patients, experiences with VA documents or records, preferences for receiving information from the VA, experience with personal health records, and sharing information with the VA. Eight interviews were conducted, audio-recorded, and transcribed. The goal of the interviews was to explore and understand provider perspectives on managing dual use veterans, including medication reconciliation processes to add context to the interpretation of medication list analysis. Because the data set was relatively small, summaries of each interview were created to highlight main points. These main points were sorted into topics, summarized, and representative quotes were selected.
Results
Fifty veterans were included in the analysis (Table 1). The mean age was 68.5 (SD 6.2); 90% were men. On average, they reported having 6 chronic health conditions and a fair-to-good health status. Based on the combined medication lists from VA and non-VA providers, veterans took an average of 15.8 (SD 7.0) unique medications (combined prescription and OTC/vitamins) and had an average of 10.0 (SD 6.1) all-type discrepancies (Table 2).
Overall, 58% of the prescription medications were discrepant: The most common discrepancy between the 2 lists was medication missing on one of the lists, which occurred 3.9 times per patient on average for prescription medications and 2.8 times per patient for OTCs. Frequency or dose discrepancies also were common between the lists at a rate of 1.9 discrepancies per patient for prescription medications and 1.2 discrepancies per patient for OTCs.
For high-risk medications, opiates and sedative medications had the most discrepancies between the lists because the VA practitioner may not have known that the patient was taking an opiate, although other discrepancies were present (Table 3). Anticoagulant discrepancies were the most consistent, most of these occurring with aspirin. Last, insulin commonly was dose discrepant between the 2 lists, although it also was missing from one list for a number of patients. Overall, high-risk medications shared a discrepancy rate (46.9%) similar to the overall rate.
Twelve therapeutic duplications were identified in the sample.Ten were between-list duplications, that is, “provider A” thought the patient was on a particular medication and “provider B” thought that the patient was on a different medication (Table 4). In 6 instances, within-list duplications were identified (ie, a provider had 2 medications on the list that should not be taken together because they were in the same drug class). In 4 cases, both between- and within-list duplications were present.
Interview Summaries
Veterans and medication. Multiple non-VA providers said that the primary reason veteran patients were going to a VA provider was to obtain discounted medications. The use of the VA for medications also was a way for the non-VA provider to discover that the patient was a veteran. One non-VA provider was particularly concerned about the impact of new or different medications from VA prescribers on efforts to stabilize the patient’s chronic condition.
Several non-VA providers reported that veterans often brought a medication list to the appointment, and several providers recommended the practice to their patients. Non-VA providers preferred to have patients transfer information from VA, sometimes requesting that veterans bring in their records from recent appointments rather than the non-VA provider obtain the information directly from the VA.
Information sharing. Non-VA providers generally preferred hard copies of medication lists and other documents rather than scans because they were more likely to be included in decision making if the documents were presented during the visit. Also, document scans may be buried in the electronic medical record. Some providers mentioned their interest in electronic transfer of medical information like medication lists if the technology were more developed and better integrated.
“I think the long-term vision would be that it should be electronic… it wouldn’t necessarily be feasible at this time. Our system scans paper documents in to an e-version. … but when the patient comes to their encounter 10 days later, you don’t realize the stuff’s there… Having the patient bring them in is probably a more certain way to make sure that it’s actually included in your decision making as a provider.”
Most non-VA providers welcomed more information such as imaging studies because they reported rarely receiving this information from the VA system. Two mentioned the potential for too much information and wanted concise reports should the flow of information increase. Providers had little interest in logging in to a patient’s online health record portal as a delegate for reasons related to complexity, time, privacy, and lack of mechanism to document the information accessed.
Medication reconciliation. Non-VA providers generally reported that patients bringing their own or an outside medication list would prompt a process of medication reconciliation. The providers were interested in making changes to their records based on other lists, but outside data were verified against a patient self-report of actual use before adopting changes.
“I print out my med list of what I have in the computer and then I just check off my list against their list. And then whatever’s remaining, we talk about what the differences are, when they were changed, what they were changed for, if they were taken off of something, and if I don’t agree, then I’ll tell the patient, ‘look, there’s a disagreement here, they’ve told you not to be on this. I want you on this.”
Should a discrepancy arise, non-VA providers generally had a negative view of attempting to contact VA providers. Other mechanisms such as calling a local pharmacy would be done first.
Discussion
This study provided initial evidence that medication list discrepancies exist for dual use veterans. Other studies of medication list discrepancies have linked such inconsistencies to medication-related problems and negative outcomes for patients.27 Although efforts to increase access to care for veterans have advantages related to expediency, consequences to fragmenting care exist. More robust mechanisms for establishing and maintaining medication list consistency are needed, especially given the lack of a universally accepted medical record format or repository. A multifaceted approach, including patient engagement, seems necessary.
This study also showed that discrepancies of high-risk medications are common for veteran participants, placing them at risk for medication-related problems and harm. These risks included dose and frequency discrepancies that could result in over- or underdosing of medications and in medication omissions, which could cause duplicative therapies and unnecessary risks. For example, aspirin frequently was listed on non-VA lists but was omitted from VA medication lists. This could be problematic for patients who present to the VA for a procedure in which no information about aspirin could jeopardize their safety. Insulin doses also were commonly discrepant, which could impact glycemic control.
Many providers also had incomplete prescribing information for opiates. Those prescriptions are particularly relevant given the link between veterans, posttraumatic stress disorder, depression, and substance abuse.28-30 However, it was beyond the scope of this pilot study to link these discrepancies to ADRs, such as emergency department visits or hospital admissions. Other studies have demonstrated that discrepancies at hospital discharge can result in these types of negative outcomes.27,31 Subsequent research should determine the clinical significance of discrepancies that occur when veterans are dual users.
The qualitative interviews provided some initial context on prescriber perspectives about the role of veterans participating in the medication list sharing process and personal health records. It seemed that for the portion of patients who brought a list to their non-VA provider appointment, the information was welcomed but fell outside the usual visit workflow. Many provider visits are dominated by current patient symptoms, and issues of reconciling medications may be a lower priority.32 Also, some providers may delegate medication reconciliation functions to a nurse or other support staff. One physician offered that he delegated logging in to a patient’s online medication information to a health coach on staff. These findings were consistent with perspectives shared by non-VA family practice physicians about personal health records.33
The most common way to integrate outside medication lists into the non-VA provider’s medical record seemed to be scanning the document. Scanning had its limitations because the provider might be unaware of the scanned document, and there were no mechanisms to import medication names and doses. However, the process may improve only the non-VA providers’ records, as they reported that they had no easy or consistent way to transmit medication changes to notes to the VA.
In general, communicating with VA providers was seen as not feasible and not worth their time or effort. It may be beneficial to address this non-VA provider concern because it seems to inhibit the transfer of important health information and the maintenance of a concordant medication record. Information transfer is particularly relevant for veterans who are primarily cared for by non-VA providers and use the VA only to get prescription medications.
In the current approach, non-VA providers have no simple, direct way to update the VA medication list. Transmitting updates carries the risk of inappropriate changes and is concerning if neither or both prescribers consider themselves to be responsible for the patient’s medications. Also, the potential exists for all medication lists to be inaccurate if the lists do not reflect the medications patients take when left on their own. Patient nonadherence rates can exceed 50%, depending on the medication.34,35 Several interviewed non-VA physicians stressed the importance of asking patients to list the medications they were using during the medication reconciliation process.
This study offers several areas for additional inquiry, including understanding how providers make sense of medication lists from other sources and what technologies can be applied to increase list consistency without increasing the burden on providers.
Practice Implications
Although patient involvement in medication list sharing has the potential to improve information consistency, health systems, providers, and other stakeholders should be cautious in assuming that other prescribers will work to combat medication list entropy, especially if no systems exist to seamlessly incorporate this information into clinic workflow. Devising standardized procedures when patients bring in their records from other providers increases the likelihood that this information will be incorporated into clinical decision making and maintaining up-to-date medication information for patients who use multiple prescribers.
Limitations
These analyses are based on a small sample size (n = 50 for chart review) and (n = 8 for the semistructured interviews) from a single Midwestern state. These findings should be used as evidence for further inquiry.
Conclusion
This study illuminates the level of discrepancies between the medication lists of veteran dual users, including high rates of discrepancies for high-risk medications, such as anticoagulants and opiates. This study also provides evidence of deficiencies in the health care system to decrease medication list entropy that may place veterans at an elevated risk for adverse medication events.
1. Sarkar U, López A, Maselli JH, Gonzales R. Adverse drug events in US adult ambulatory medical care. Health Serv Res. 2011;46(5):1517-1533.
2. Kohn LT, Corrigan JM, Donaldson MS. To Err Is Human:Building a Safer Health System. Washington, DC: Institute of Medicine, National Academy Press; 1999.
3. Gandhi TK, Weingart SN, Borus J, et al. Adverse drug events in ambulatory care. N Eng J Med. 2003;348(16):1556-1564.
4. Tamblyn RM, McLeod PJ, Abrahamowicz M, Laprise R. Do too many cooks spoil the broth? Multiple physician involvement in medical management of elderly patients and potentially inappropriate drug combinations. CMAJ. 1996;154(8):1177-1184.
5. Wong JD, Bajcar JM, Wong GG, et al. Medication reconciliation at hospital discharge: evaluating discrepancies. Ann Pharmacother. 2008;42(10):1373-1379.
6. Kripalani S, LeFevre F, Phillips CO, Williams MV, Basaviah P, Baker DW. Deficits in communication and information transfer between hospital-based and primary care physicians: implications for patient safety and continuity of care. JAMA. 2007;297(8):831-841.
7. McMillan A, Trompeter J, Havrda D, Fox J. Continuity of care between family practice physicians and hospitalist services. J Healthare Qual. 2013;35(1):41-49.
8. Liu CF, Manning WG, Burgess JF Jr, et al. Reliance on Veterans Affairs outpatient care by Medicare-eligible veterans. Med Care. 2011;49(10):911-917.
9. U.S. Department of Veterans Affairs, Veterans Health Administration. VHA Office of the ADUSH for Policy and Planning. 2011 survey of veteran enrollees’ health and reliance upon VA. http://www.va.gov/healthpolicyplanning/soe2011/soe2011_report.pdf. Published March 2012. Accessed August 2, 2016.
10. Nayar P, Apenteng B, Yu F, Woodbridge P, Fetrick A. Rural veterans’ perspectives of dual care. J Community Health. 2013;38(1):70-77.
11. Chae SY, Chae MH, Isaacson N, James TS. The patient medication list: can we get patients more involved in their medical care? J Am Board Fam Med. 2009;22(6):677-685.
12. Tang PC, Ash JS, Bates DW, Overhage JM, Sands DZ. Personal health records: definitions, benefits, and strategies for overcoming barriers to adoption. J Am Med Informatics Assoc. 2006;13(2):121-126.
13. Stroupe KT, Smith BM, Hogan TP, et al. Medication acquisition across systems of care and patient–provider communication among older veterans. Am J Health Syst Pharm. 2013;70(9):804-813.
14. Shoemaker SJ, Ramalho de Oliveira D, Alves M, Ekstrand M. The medication experience: preliminary evidence of its value for patient education and counseling on chronic medications. Patient Educ Couns. 2011;83(3):443-450.
15. Chewning B, Boh L, Wiederholt J, et al. Does the concordance concept serve patient medication management? Int J Pharm Pract. 2001;9(2):71-79.
16. Irizarry T, DeVito Dabbs A, Curran CR. Patient portals and patient engagement: a state of the science review. J Med Internet Res. 2015;17(6):e148.
17. Schnipper JL, Gandhi TK, Wald JS, et al. Effects of an online personal health record on medication accuracy and safety: a cluster-randomized trial. J Am Med Inform Assoc. 2012;19(5):728-734.
18. Turvey C, Klein D, Fix G, et al. Blue Button use by patients to access and share health record information using the Department of Veterans Affairs’ online patient portal. J Am Med Inform Assoc. 2014;21(4):657-663.
19. Hogan TP, Nazi KM, Luger TM, et al. Technology-assisted patient access to clinical information: an evaluation framework for Blue Button. JMIR Res Protoc. 2014;3(1):e18.
20. Steinman MA, Handler SM, Gurwitz JH, Schiff GD, Covinsky KE. Beyond the prescription: medication monitoring and adverse drug events in older adults. J Am Geriatr Soc. 2011;59(8):1520-1530.
21. Turvey CL, Klein DM, Witry M, et al. Patient education for consumer-mediated HIE. A pilot randomized controlled trial of the Department of Veterans Affairs Blue Button. Appl Clin Inform. 2016;7(3):765-776.
22. Polnaszek B, Gilmore-Bykovskyi A, Hovanes M, et al. Overcoming the challenges of unstructured data in multisite, electronic medical record-based abstraction [published online ahead of print June 25, 2014]. Med Care. doi: 10.1097/MLR.0000000000000108.
23. Kennelty K, Witry MJ, Gehring M, M D, Pulia N. A four-phase approach for systematically collecting data and measuring medication discrepancies when patients transition between health care settings. Res Social Adm Pharm. 2016;12(4):548-558.
24. American Geriatrics Society 2012 Beers Criteria Update Expert Panel. American Geriatrics Society updated Beers criteria for potentially inappropriate medication use in older adults. J Am Geriatr Soc. 2012;60(4):616-631.
25. Gurwitz JH, Field TS, Harrold LR, et al. Incidence and preventability of adverse drug events among older persons in the ambulatory setting. JAMA. 2003;289(9):1107-1116.
26. Gurwitz JH, Field TS, Avorn J, et al. Incidence and preventability of adverse drug events in nursing homes. Am J Med. 2000;109(2):87-94.
27. Boockvar KS, Liu S, Goldstein N, Nebeker J, Siu A, Fried T. Prescribing discrepancies likely to cause adverse drug events after patient transfer. Qual Saf Health Care. 2009;18(1):32-36.
28. Shipherd JC, Stafford J, Tanner LR. Predicting alcohol and drug abuse in Persian Gulf War veterans: what role do PTSD symptoms play? Addict Behav. 2005;30(3):595-599.
29. Markou A, Kosten TR, Koob GF. Neurobiological similarities in depression and drug dependence: a self-medication hypothesis. Neuropsychopharmacology. 1998;18(3):135-174.
30. McFall ME, Mackay PW, Donovan DM. Combat-related posttraumatic stress disorder and severity of substance abuse in Vietnam veterans. J Stud Alcohol. 1992;53(4):357-363.
31. Kwan JL, Lo L, Sampson M, Shojania KG. Medication reconciliation during transitions of care as a patient safety strategy: a systematic review. Ann Intern Med. 2013;158(5, pt 2):397-403.
32. Richard C, Lussier MT. Nature and frequency of exchanges on medications during primary care encounters. Patient Educ Couns. 2006;64(1-3):207-216.
33. Witry MJ, Doucette WR, Daly JM, Levy BT, Chrischilles EA. Family physician perceptions of personal health records. Perspect Health Inf Manag. 2010;7.
34. Horne R, Weinman J. Patients’ beliefs about prescribed medicines and their role in adherence to treatment in chronic physical illness. J Psychosom Res. 1999;47(6):555-567.
35. Osterberg L, Blaschke T. Adherence to medication. N Eng J Med. 2005;353(5):487-497.
Impact of Acne Vulgaris on Quality of Life and Self-esteem
Acne vulgaris predominantly occurs during puberty and can persist beyond 25 years of age, most commonly in women.1,2 Although acne does not cause physical impairment, it can be associated with a considerable psychosocial burden including increased levels of anxiety, anger, depression, and frustration, which in turn can affect vocational and academic performance, quality of life (QOL), and self-esteem.3
Quality of life measures provide valuable insight into the debilitating effects of acne.1 It has been suggested that acne patients may experience poor body image and low self-esteem as well as social isolation and constriction of activities.4 Self-esteem is a favorable and unfavorable attitude toward oneself.5 A marked emphasis has been placed on body image in society, fueled by external cues such as the media.3,6 This study was carried out to assess QOL and self-esteem in acne patients.
Methods
This prospective, hospital-based, cross-sectional, case-control study was conducted at The Oxford Medical College, Hospital & Research Center (Bangalore, India), over a period of 3 months. One hundred consecutive acne cases (age range, 12–45 years) and 100 age- and gender-matched controls who did not have any skin disease provided consent and were included in the analysis. Guardians gave consent for individuals who were younger than 18 years. Exclusion criteria for cases included a medical disorder (eg, epilepsy, diabetes mellitus, hypertension) or medications that would likely interfere with acne assessment.
The cases and controls were administered a semistructured questionnaire to collect sociodemographic details. Acne was graded for the predominant lesions, QOL was assessed using the Cardiff Acne Disability Index (CADI) and World Health Organization Quality of Life–BREF (WHOQOL-BREF) scale, and self-esteem was measured using the Rosenberg self-esteem scale (RSES). The study was approved by the institutional review board.
Acne Grading
Acne was graded according to the predominant lesions using the following criteria: grade 1=comedones and occasional papules; grade 2=papules, comedones, and few pustules; grade 3=predominant pustules, nodules, and abscesses; and grade 4=mainly cysts, abscesses, and widespread scarring.1
Quality of Life Assessment
The CADI questionnaire was used to assess the level of disability caused by acne.6 It is a 5-item questionnaire with scores ranging from 0 to 3 for a total maximum score of 15 and minimum score of 0. Total scores were classified as low (0–4), medium (5–9), and high (10–15).7
The WHOQOL-BREF is a self-reported questionnaire containing 26 items that make up the 4 domains of physical health (7 items), psychological health (6 items), social relationships (3 items), and environment (8 items); there also are 2 single questions regarding the overall perception of QOL and health. Questions were scored on aseries of 5-point scales with higher scores denoting better QOL.8
Self-esteem Assessment
The RSES uses a 5-point Likert scale from strongly agree to strongly disagree to rate a series of 10 statements. The total score ranges from 0 to 30. Scores less than 15 suggest low self-esteem, while scores of 15 and greater indicate high self-esteem.5
Statistical Analysis
Results were analyzed using descriptive and inferential statistical methods. A χ2 test was used for categorical data, and a Student t test and an analysis of variance were used for continuous data.
Results
The study consisted of 100 cases and 100 controls. The mean age was 21 years. The majority of cases reported an age of onset of acne of 11 to 20 years (66%), were predominantly female (58%) from rural backgrounds, and had a family history of acne (68%). The majority of lesions ceased within 24 months (60%). The face was the most commonly involved area (80%) and papules were the most prevalent lesion type (62%).
Cases predominantly had grade 2 acne (46%), and there was medium to high impairment in QOL according to CADI scores.
The scores for all the domains of the WHOQOL-BREF as well as the total score were lower in cases compared to controls (Table). There was a statistically significant difference between the 2 groups in the psychological (P=.0402) and environment (P=.006) domains.
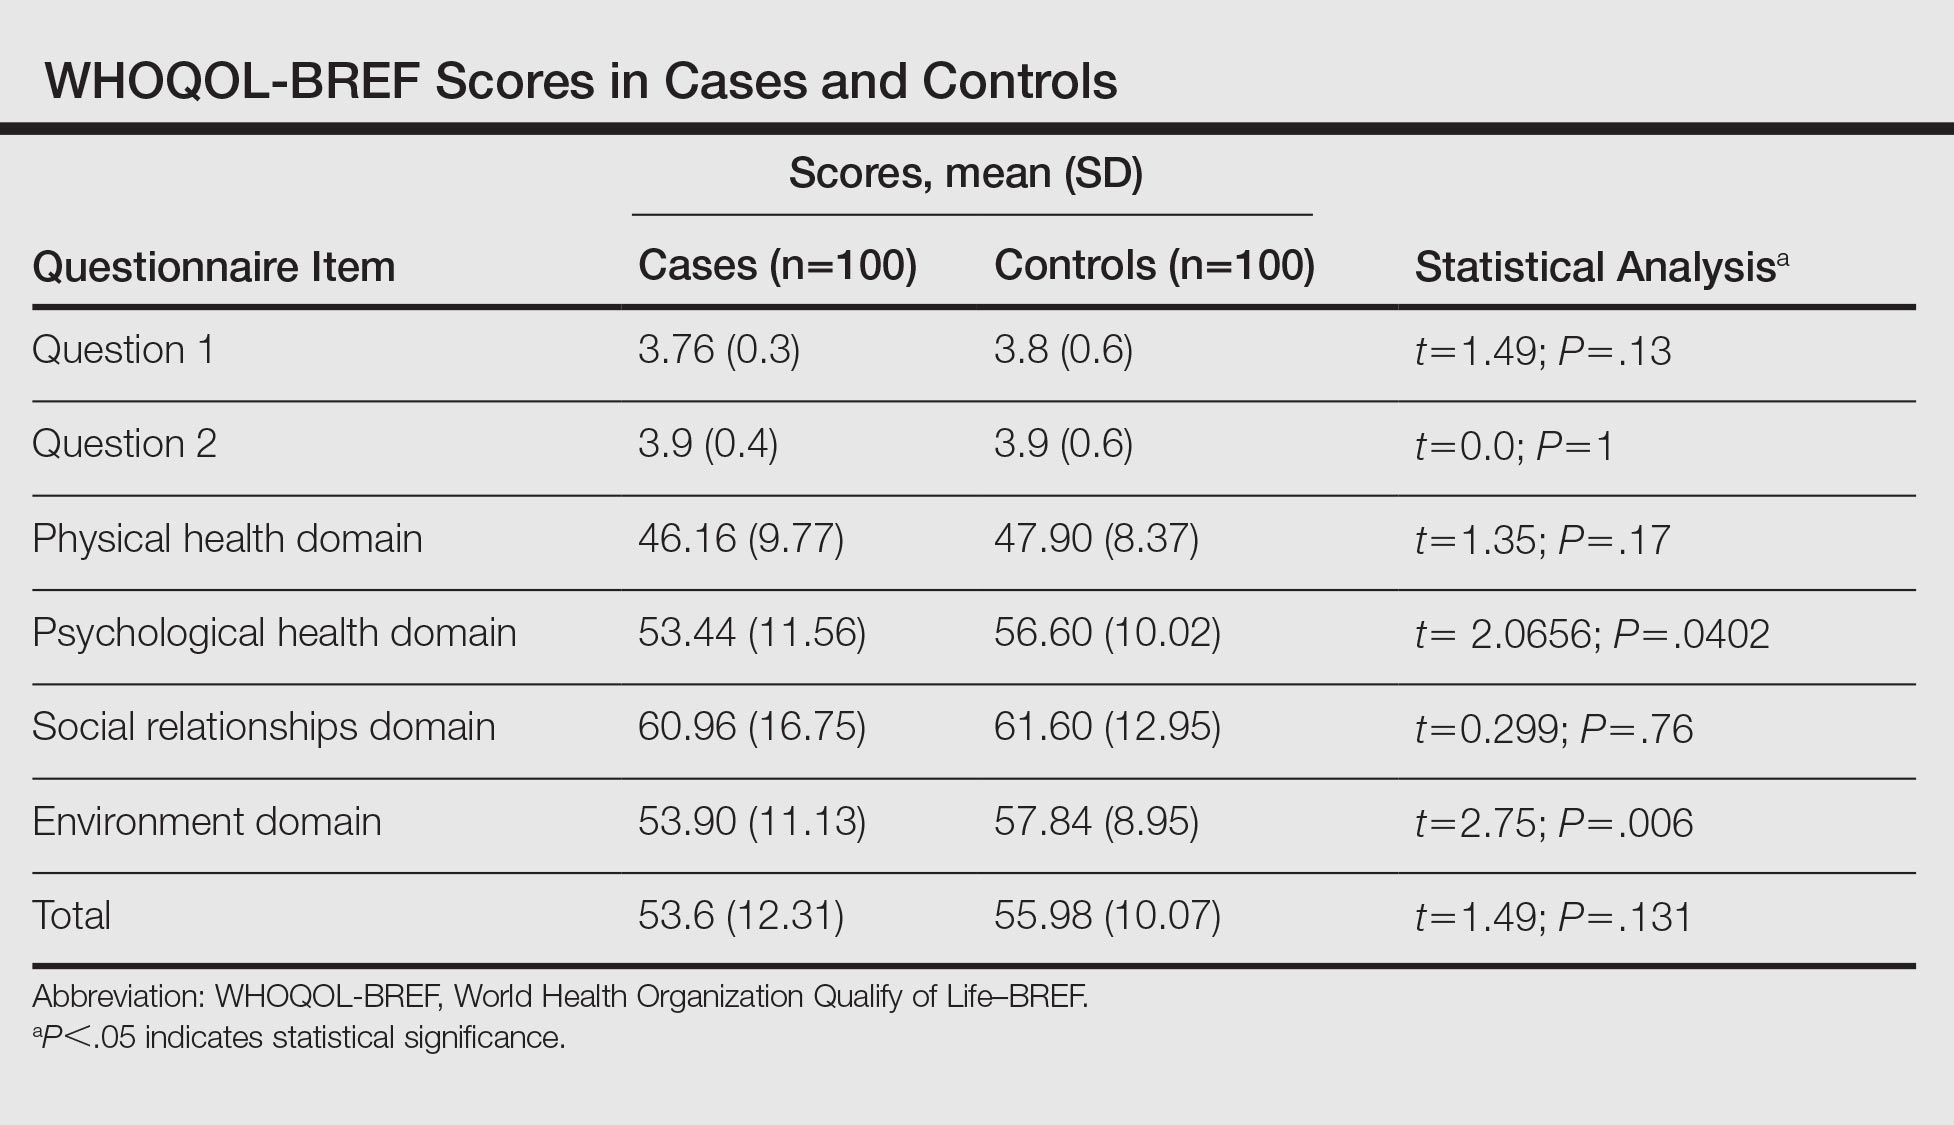
The RSES mean (SD) score was higher in controls (19.74 [4.23]) than in cases (15.72 [5.06]) and was statistically significant (P<.0001). Low self-esteem was noted in 38% of cases and 16% of controls, and high self-esteem was noted in 62% and 84%, respectively.
In reviewing the correlation between acne severity, CADI, WHOQOL-BREF, and RSES scores, we found a positive correlation between acne severity and CADI scores (R=0.51), which implies that as the severity of acne worsens, the QOL impairment increases. There was a negative correlation between acne severity, WHOQOL-BREF score (R=–0.13), and RSES score (R=–0.18), which showed that as the severity of acne increases, QOL and self-esteem decrease. We observed that as the grade of acne increases, there is a statistically significant impairment in the QOL according to CADI (P<.001), while there is a reduction in QOL and self-esteem according to WHOQOL-BREF and RSES, respectively (P>.05).
Comment
Patients are more likely to develop acne than any other skin disease in their lifetime. Only in recent years has the psychodermatologic literature begun to address the possibility of acne having a psychological and emotional impact.4 Although the cause-and-effect relationship between acne and psychological trauma has been debated for decades, only recently has the measurement focus shifted from psychological correlates (eg, personality) and emotional triggers (eg, stress) to the effect of acne on patients’ QOL and self-esteem. This shift occurred as validated instruments for measuring disability, QOL, and self-esteem, specifically in patients with skin diseases, became available.9
In our study, the age of onset of acne was 11 to 20 years and it affected predominantly females (58%), which is in concordance with other studies, as acne develops in adolescence and subsides in adulthood.1,10 Acne is more common in females due to hormonal factors and use of cosmetics. We observed that the face (80%) was most frequently affected, followed by the back (14%) and chest (6%), which is similar to prior studies.1,10 Because the face plays an important role in body image, the presence of facial lesions may be unacceptable for patients and therefore they may present more frequently to dermatologists.
In our study, 68% of cases and 22% of controls had a family history of acne. A similar correlation also was noted in other studies, which suggests acne has an inherited predisposition due to involvement of the cytochrome P450-1A1 gene, CYP1A1, and steroid 21-hydroxylase, P-450-c21.1,11 We found 46% of cases had grade 2 acne and 36% had grade 1 acne, which was congruent with prior studies.12,13 Patients with severe acne are more likely to seek medical intervention in hospitals.
In our study, 58% of the cases had medium to high impairment in QOL according to CADI scores. We noticed as the severity of acne increased there was severe impairment in QOL. Similar findings have been found in studies that used other scales to assess QOL.1,6,9
In our study, 38% of cases and 16% of controls had low self-esteem, which was statistically significant (P<.0001). There was a negative correlation between the severity of acne and self-esteem. In a prior study of 240 professional college students, 53% had feelings of low self-esteem and 40% revealed they avoided social gatherings and interactions with the opposite sex because of their acne.14 In a questionnaire-based survey of 3775 students, it was observed that the presence of acne correlated with poor self-attitude in boys and poor self-worth in girls.3 We found patients with grade 1 acne had higher self-esteem as compared to other grades of acne. Similarly, a cross-sectional study by Uslu et al15 found a direct correlation between acne severity and lower self-esteem using the RSES questionnaire. Although acne may be viewed as a minor cosmetic issue, it can have a negative impact on self-esteem and interpersonal relationships. Many of the studies had not used a validated structured questionnaire to assess self-esteem and there is a paucity of literature in relation to acne and self-esteem.3,16,17
According to the WHOQOL-BREF, the psychological domain was affected more in cases than in controls, which was a statistically significant difference. One study observed that patients experience immediate psychological consequences of acne such as reduced self-esteem, poor self-image, self-consciousness, and embarrassment.3 These effects are exacerbated by taunting, stigmatization, and perceptions of scrutiny and being judged, causing patients to avoid interaction and social situations. Similarly, Pruthi and Babu18 observed that acne had an impact on the psychosocial aspects of adult females using the Dermatology Life Quality Index and CADI.
Financial resources, health and social care accessibility, and opportunities for acquiring new information and skills were the factors that were considered in the environment domain of the WHOQOL-BREF.8 We noted that the environment domain scores were significantly lower in cases than in controls. The cases could have had a detrimental effect on the latest opportunities in occupational functioning due to acne, and as most of the population was from a rural area, they were having less favorable circumstances in acquiring new information about the management of acne.
There was no statistically significant difference between cases and controls in the social and physical domains of the WHOQOL-BREF, which suggests that these fields do not influence QOL. Similarly, patients in Sarawak, Malaysia, were least affected in the domain of social functioning, which was likely attributed to the upbringing of this population encouraging stoicism.19
In the current study, QOL impairment showed a positive correlation with acne severity according to CADI scores; however, there was no significant difference between WHOQOL-BREF score and acne grading, which suggests that QOL impairment does not depend on severity of acne alone. Physical, psychological, social, and environment domains play an important role in impaired QOL. Hence, by using the WHOQOL-BREF we can evaluate the actual domain that is adversely affected by acne and can be treated with a holistic approach. This point must be stressed in the training of medical faculty, as the treatment of acne should not be based on acne severity alone but also on the degree of QOL impairment.19
These results indicate that more data are required and there is a need to consider other variables that could play a role. This study was a hospital-based, cross-sectional study with a small sample group that cannot be generalized, which are limitations. Longitudinal follow-up of the cases before and after treatment was not done. The questionnaires helped us to detect psychosocial aspects but were insufficient to diagnose psychiatric comorbidity.
The strengths of this study include the use of a specific scale for the assessment of self-esteem. The usage of comprehensive (WHOQOL-BREF) and specific (CADI) scales to evaluate QOL has mutual advantage.
Conclusion
Acne vulgaris is a disease that can adversely affect an individual’s QOL and self-esteem. This study suggested the importance of screening for psychosocial problems in those who present for management of acne. It is important for dermatologists to be cautious about psychological problems in acne patients and be aware of the importance of basic psychosomatic treatment in conjunction with medical treatment in the management of acne.
- Durai PC, Nair DG. Acne vulgaris and quality of life among young adults in South India. Indian J Dermatol. 2015;60:33-40.
- Karciauskiene J, Valiukeviciene S, Gollnick H, et al. The prevalence and risk factors of adolescent acne among schoolchildren in Lithuania: a cross-sectional study. J Eur Acad Dermatol Venereol. 2014;28:733-740.
- Dunn LK, O’Neill JL, Feldman SR. Acne in adolescents: quality of life, self-esteem, mood, and psychological disorders. Dermatol Online J. 2011;17:1.
- Do JE, Cho SM, In SI, et al. Psychosocial aspects of acne vulgaris: a community-based study with Korean adolescents. Ann Dermatol. 2009;21:125-129.
- Rosenberg M. Society and the Adolescent Self-Image. Princeton, NJ: Princeton University Press; 1965.
- Ogedegbe EE, Henshaw EB. Severity and impact of acne vulgaris on the quality of life of adolescents in Nigeria. Clin Cosmet Investig Dermatol. 2014;7:329-334.
- Cardiff Acne Disability Index (CADI). Cardiff University website. sites.cardiff.ac.uk/dermatology/…of…/Cardiff-acne-disability-index-cadi/. Accessed July 21, 2016.
- WHO QOL-BREF: Introduction, administration, scoring and generic version of the assessment. World Health Organization website. http://www.who.int/mental_health/media/en/76.pdf. Published December 1996. Accessed June 6, 2016.
- Lasek RJ, Chren MM. Acne vulgaris and the quality of life of adult dermatology patients. Arch Dermatol. 1998;134:454-458.
- Adityan B, Thappa DM. Profile of acne vulgaris—a hospital-based study from South India. Indian J Dermatol Venereol Leprol. 2009;75:272-278.
- Tasoula E, Gregoriou S, Chalikias J, et al. The impact of acne vulgaris on quality of life and psychic health in young adolescents in Greece. results of a population survey. An Bras Dermatol. 2012;87:862-869.
- Agheai S, Mazaharinia N, Jafari P, et al. The Persian version of the Cardiff Acne Disability Index. reliability and validity study. Saudi Med J. 2006;27:80-82.
- Mallon E, Newton JN, Klassen A, et al. The quality of life in acne: a comparison with general medical conditions using generic questionnaires. Br J Dermatol. 1999;140:672-676.
- Goel S, Goel S. Clinico-psychological profile of acne vulgaris among professional students. Indian J Public Health Res Dev. 2012;3:175-178.
- Uslu G, Sendur N, Uslu M, et al. Acne: prevalence, perceptions and effects on psychological health among adolescents in Aydin, Turkey. J Eur Acad Dermatol Venereol. 2008;22:462-469.
- Ayer J, Burrows N. Acne: more than skin deep. Postgrad Med J. 2006;82:500-506.
- Fried RG, Gupta MA, Gupta AK. Depression and skin disease. Dermatol Clin. 2005;23:657-664.
- Pruthi GK, Babu N. Physical and psychosocial impact of acne in adult females. Indian J Dermatol. 2012;57:26-29.
- Yap FB. Cardiff Acne Disability Index in Sarawak, Malaysia. Ann Dermatol. 2012;24:158-161.
Acne vulgaris predominantly occurs during puberty and can persist beyond 25 years of age, most commonly in women.1,2 Although acne does not cause physical impairment, it can be associated with a considerable psychosocial burden including increased levels of anxiety, anger, depression, and frustration, which in turn can affect vocational and academic performance, quality of life (QOL), and self-esteem.3
Quality of life measures provide valuable insight into the debilitating effects of acne.1 It has been suggested that acne patients may experience poor body image and low self-esteem as well as social isolation and constriction of activities.4 Self-esteem is a favorable and unfavorable attitude toward oneself.5 A marked emphasis has been placed on body image in society, fueled by external cues such as the media.3,6 This study was carried out to assess QOL and self-esteem in acne patients.
Methods
This prospective, hospital-based, cross-sectional, case-control study was conducted at The Oxford Medical College, Hospital & Research Center (Bangalore, India), over a period of 3 months. One hundred consecutive acne cases (age range, 12–45 years) and 100 age- and gender-matched controls who did not have any skin disease provided consent and were included in the analysis. Guardians gave consent for individuals who were younger than 18 years. Exclusion criteria for cases included a medical disorder (eg, epilepsy, diabetes mellitus, hypertension) or medications that would likely interfere with acne assessment.
The cases and controls were administered a semistructured questionnaire to collect sociodemographic details. Acne was graded for the predominant lesions, QOL was assessed using the Cardiff Acne Disability Index (CADI) and World Health Organization Quality of Life–BREF (WHOQOL-BREF) scale, and self-esteem was measured using the Rosenberg self-esteem scale (RSES). The study was approved by the institutional review board.
Acne Grading
Acne was graded according to the predominant lesions using the following criteria: grade 1=comedones and occasional papules; grade 2=papules, comedones, and few pustules; grade 3=predominant pustules, nodules, and abscesses; and grade 4=mainly cysts, abscesses, and widespread scarring.1
Quality of Life Assessment
The CADI questionnaire was used to assess the level of disability caused by acne.6 It is a 5-item questionnaire with scores ranging from 0 to 3 for a total maximum score of 15 and minimum score of 0. Total scores were classified as low (0–4), medium (5–9), and high (10–15).7
The WHOQOL-BREF is a self-reported questionnaire containing 26 items that make up the 4 domains of physical health (7 items), psychological health (6 items), social relationships (3 items), and environment (8 items); there also are 2 single questions regarding the overall perception of QOL and health. Questions were scored on aseries of 5-point scales with higher scores denoting better QOL.8
Self-esteem Assessment
The RSES uses a 5-point Likert scale from strongly agree to strongly disagree to rate a series of 10 statements. The total score ranges from 0 to 30. Scores less than 15 suggest low self-esteem, while scores of 15 and greater indicate high self-esteem.5
Statistical Analysis
Results were analyzed using descriptive and inferential statistical methods. A χ2 test was used for categorical data, and a Student t test and an analysis of variance were used for continuous data.
Results
The study consisted of 100 cases and 100 controls. The mean age was 21 years. The majority of cases reported an age of onset of acne of 11 to 20 years (66%), were predominantly female (58%) from rural backgrounds, and had a family history of acne (68%). The majority of lesions ceased within 24 months (60%). The face was the most commonly involved area (80%) and papules were the most prevalent lesion type (62%).
Cases predominantly had grade 2 acne (46%), and there was medium to high impairment in QOL according to CADI scores.
The scores for all the domains of the WHOQOL-BREF as well as the total score were lower in cases compared to controls (Table). There was a statistically significant difference between the 2 groups in the psychological (P=.0402) and environment (P=.006) domains.
The RSES mean (SD) score was higher in controls (19.74 [4.23]) than in cases (15.72 [5.06]) and was statistically significant (P<.0001). Low self-esteem was noted in 38% of cases and 16% of controls, and high self-esteem was noted in 62% and 84%, respectively.
In reviewing the correlation between acne severity, CADI, WHOQOL-BREF, and RSES scores, we found a positive correlation between acne severity and CADI scores (R=0.51), which implies that as the severity of acne worsens, the QOL impairment increases. There was a negative correlation between acne severity, WHOQOL-BREF score (R=–0.13), and RSES score (R=–0.18), which showed that as the severity of acne increases, QOL and self-esteem decrease. We observed that as the grade of acne increases, there is a statistically significant impairment in the QOL according to CADI (P<.001), while there is a reduction in QOL and self-esteem according to WHOQOL-BREF and RSES, respectively (P>.05).
Comment
Patients are more likely to develop acne than any other skin disease in their lifetime. Only in recent years has the psychodermatologic literature begun to address the possibility of acne having a psychological and emotional impact.4 Although the cause-and-effect relationship between acne and psychological trauma has been debated for decades, only recently has the measurement focus shifted from psychological correlates (eg, personality) and emotional triggers (eg, stress) to the effect of acne on patients’ QOL and self-esteem. This shift occurred as validated instruments for measuring disability, QOL, and self-esteem, specifically in patients with skin diseases, became available.9
In our study, the age of onset of acne was 11 to 20 years and it affected predominantly females (58%), which is in concordance with other studies, as acne develops in adolescence and subsides in adulthood.1,10 Acne is more common in females due to hormonal factors and use of cosmetics. We observed that the face (80%) was most frequently affected, followed by the back (14%) and chest (6%), which is similar to prior studies.1,10 Because the face plays an important role in body image, the presence of facial lesions may be unacceptable for patients and therefore they may present more frequently to dermatologists.
In our study, 68% of cases and 22% of controls had a family history of acne. A similar correlation also was noted in other studies, which suggests acne has an inherited predisposition due to involvement of the cytochrome P450-1A1 gene, CYP1A1, and steroid 21-hydroxylase, P-450-c21.1,11 We found 46% of cases had grade 2 acne and 36% had grade 1 acne, which was congruent with prior studies.12,13 Patients with severe acne are more likely to seek medical intervention in hospitals.
In our study, 58% of the cases had medium to high impairment in QOL according to CADI scores. We noticed as the severity of acne increased there was severe impairment in QOL. Similar findings have been found in studies that used other scales to assess QOL.1,6,9
In our study, 38% of cases and 16% of controls had low self-esteem, which was statistically significant (P<.0001). There was a negative correlation between the severity of acne and self-esteem. In a prior study of 240 professional college students, 53% had feelings of low self-esteem and 40% revealed they avoided social gatherings and interactions with the opposite sex because of their acne.14 In a questionnaire-based survey of 3775 students, it was observed that the presence of acne correlated with poor self-attitude in boys and poor self-worth in girls.3 We found patients with grade 1 acne had higher self-esteem as compared to other grades of acne. Similarly, a cross-sectional study by Uslu et al15 found a direct correlation between acne severity and lower self-esteem using the RSES questionnaire. Although acne may be viewed as a minor cosmetic issue, it can have a negative impact on self-esteem and interpersonal relationships. Many of the studies had not used a validated structured questionnaire to assess self-esteem and there is a paucity of literature in relation to acne and self-esteem.3,16,17
According to the WHOQOL-BREF, the psychological domain was affected more in cases than in controls, which was a statistically significant difference. One study observed that patients experience immediate psychological consequences of acne such as reduced self-esteem, poor self-image, self-consciousness, and embarrassment.3 These effects are exacerbated by taunting, stigmatization, and perceptions of scrutiny and being judged, causing patients to avoid interaction and social situations. Similarly, Pruthi and Babu18 observed that acne had an impact on the psychosocial aspects of adult females using the Dermatology Life Quality Index and CADI.
Financial resources, health and social care accessibility, and opportunities for acquiring new information and skills were the factors that were considered in the environment domain of the WHOQOL-BREF.8 We noted that the environment domain scores were significantly lower in cases than in controls. The cases could have had a detrimental effect on the latest opportunities in occupational functioning due to acne, and as most of the population was from a rural area, they were having less favorable circumstances in acquiring new information about the management of acne.
There was no statistically significant difference between cases and controls in the social and physical domains of the WHOQOL-BREF, which suggests that these fields do not influence QOL. Similarly, patients in Sarawak, Malaysia, were least affected in the domain of social functioning, which was likely attributed to the upbringing of this population encouraging stoicism.19
In the current study, QOL impairment showed a positive correlation with acne severity according to CADI scores; however, there was no significant difference between WHOQOL-BREF score and acne grading, which suggests that QOL impairment does not depend on severity of acne alone. Physical, psychological, social, and environment domains play an important role in impaired QOL. Hence, by using the WHOQOL-BREF we can evaluate the actual domain that is adversely affected by acne and can be treated with a holistic approach. This point must be stressed in the training of medical faculty, as the treatment of acne should not be based on acne severity alone but also on the degree of QOL impairment.19
These results indicate that more data are required and there is a need to consider other variables that could play a role. This study was a hospital-based, cross-sectional study with a small sample group that cannot be generalized, which are limitations. Longitudinal follow-up of the cases before and after treatment was not done. The questionnaires helped us to detect psychosocial aspects but were insufficient to diagnose psychiatric comorbidity.
The strengths of this study include the use of a specific scale for the assessment of self-esteem. The usage of comprehensive (WHOQOL-BREF) and specific (CADI) scales to evaluate QOL has mutual advantage.
Conclusion
Acne vulgaris is a disease that can adversely affect an individual’s QOL and self-esteem. This study suggested the importance of screening for psychosocial problems in those who present for management of acne. It is important for dermatologists to be cautious about psychological problems in acne patients and be aware of the importance of basic psychosomatic treatment in conjunction with medical treatment in the management of acne.
- Durai PC, Nair DG. Acne vulgaris and quality of life among young adults in South India. Indian J Dermatol. 2015;60:33-40.
- Karciauskiene J, Valiukeviciene S, Gollnick H, et al. The prevalence and risk factors of adolescent acne among schoolchildren in Lithuania: a cross-sectional study. J Eur Acad Dermatol Venereol. 2014;28:733-740.
- Dunn LK, O’Neill JL, Feldman SR. Acne in adolescents: quality of life, self-esteem, mood, and psychological disorders. Dermatol Online J. 2011;17:1.
- Do JE, Cho SM, In SI, et al. Psychosocial aspects of acne vulgaris: a community-based study with Korean adolescents. Ann Dermatol. 2009;21:125-129.
- Rosenberg M. Society and the Adolescent Self-Image. Princeton, NJ: Princeton University Press; 1965.
- Ogedegbe EE, Henshaw EB. Severity and impact of acne vulgaris on the quality of life of adolescents in Nigeria. Clin Cosmet Investig Dermatol. 2014;7:329-334.
- Cardiff Acne Disability Index (CADI). Cardiff University website. sites.cardiff.ac.uk/dermatology/…of…/Cardiff-acne-disability-index-cadi/. Accessed July 21, 2016.
- WHO QOL-BREF: Introduction, administration, scoring and generic version of the assessment. World Health Organization website. http://www.who.int/mental_health/media/en/76.pdf. Published December 1996. Accessed June 6, 2016.
- Lasek RJ, Chren MM. Acne vulgaris and the quality of life of adult dermatology patients. Arch Dermatol. 1998;134:454-458.
- Adityan B, Thappa DM. Profile of acne vulgaris—a hospital-based study from South India. Indian J Dermatol Venereol Leprol. 2009;75:272-278.
- Tasoula E, Gregoriou S, Chalikias J, et al. The impact of acne vulgaris on quality of life and psychic health in young adolescents in Greece. results of a population survey. An Bras Dermatol. 2012;87:862-869.
- Agheai S, Mazaharinia N, Jafari P, et al. The Persian version of the Cardiff Acne Disability Index. reliability and validity study. Saudi Med J. 2006;27:80-82.
- Mallon E, Newton JN, Klassen A, et al. The quality of life in acne: a comparison with general medical conditions using generic questionnaires. Br J Dermatol. 1999;140:672-676.
- Goel S, Goel S. Clinico-psychological profile of acne vulgaris among professional students. Indian J Public Health Res Dev. 2012;3:175-178.
- Uslu G, Sendur N, Uslu M, et al. Acne: prevalence, perceptions and effects on psychological health among adolescents in Aydin, Turkey. J Eur Acad Dermatol Venereol. 2008;22:462-469.
- Ayer J, Burrows N. Acne: more than skin deep. Postgrad Med J. 2006;82:500-506.
- Fried RG, Gupta MA, Gupta AK. Depression and skin disease. Dermatol Clin. 2005;23:657-664.
- Pruthi GK, Babu N. Physical and psychosocial impact of acne in adult females. Indian J Dermatol. 2012;57:26-29.
- Yap FB. Cardiff Acne Disability Index in Sarawak, Malaysia. Ann Dermatol. 2012;24:158-161.
Practice Points
- Grading of acne will help with appropriate treatment, thus reducing the adverse psychological effects of the condition.
- Acne severity has a negative impact on quality of life and self-esteem.
- A sympathetic approach and basic psychosomatic treatment are necessary in the management of acne.

Effectiveness of an Employee Skin Cancer Screening Program for Secondary Prevention
The incidence of skin cancer, along with its effects on patients and the economy, has continued to increase and therefore requires particular attention from dermatologists. UV light has been shown to be of etiopathologic importance in the development of various types of skin cancer.1-3 Studies have shown that there is a direct correlation between the incidence of skin cancer and average annual amounts of UV radiation exposure.3 Accordingly, in 2009 the International Agency for Research on Cancer classified UV light as carcinogenic to humans.4 Therefore, the general public must be made aware of the danger of exposure to UV radiation.
In Australia, government initiatives to educate the population on causes of skin cancer development and its relationship to UV radiation have already caused the public to change their way of thinking and to deal with sunlight in a conscious and responsible manner.5 A large proportion of the Australian population with light skin is at a particularly high risk for developing skin cancer due to intense exposure to UV radiation. Numerous campaigns in Germany and other countries have attempted to sensitize the public to this issue by emphasizing a reduction in UV exposure (primary prevention) or highlighting the importance of early diagnosis (secondary prevention).6,7
For a good prognosis, it is crucial that skin cancer, particularly melanoma, is discovered at an early or precancerous stage.8 For this reason, self-examination of the skin and skin cancer screening are important factors that can contribute to ensuring early and curative treatment.9-11 Since July 1, 2008, skin cancer screenings have been included in the preventative health care program by statutory health insurance providers in Germany. As part of this program, the cost of screening once every 2 years for individuals 35 years and older is covered by statutory health insurance.12 Several studies have shown a decline in the melanoma mortality rate since the introduction of skin cancer screening programs in Germany.11,13,14
Employee skin cancer screening programs are an important method of examining high numbers of individuals quickly and effectively. These programs have been carried out in Germany and other countries.15,16 Studies have shown that skin cancer screening carried out selectively on defined groups can be an effective form of secondary prevention, particularly for those who work outdoors.17
An employee skin cancer screening program was carried out as part of this study. The findings are interpreted and discussed in relation to other employee screening programs that have been reported as well as those introduced by statutory health insurance providers in Germany. The aim of this study was to determine the importance and effectiveness of employee skin cancer screening programs and the role they play in secondary prevention of skin cancer.
Methods
Study Population
Employees of a technical company in Bavaria, Germany, were offered a skin cancer screening program by the employer’s occupational health service and health insurance provider in collaboration with the Department of Dermatology at the University Hospital Erlangen (Erlangen, Germany). Skin examinations were performed exclusively by 5 trained dermatologists. Only direct employees of the company at 3 of its locations in the Erlangen area were eligible to participate. The total number of employees varied by location (1072–5126 employees). The majority of employees had a university education or had completed technical training. Family members and other individuals who were not members of the company were excluded. There were no further inclusion or exclusion criteria. Over a period of 13 days, 783 of 7823 total employees (10.0%) were examined and included in the study. The study was approved by the Responsible Ethics Commission of the Faculty of Medicine at Friedrich-Alexander-University Erlangen-Nürnberg, Germany.
Study Design
Employees signed a consent form for participation in the study and completed a standardized questionnaire. The questionnaire was based on surveys used in a prior study18 and collected information on current and prior skin lesions, prior dermatological screening, personal and family history of skin tumors, frequency of UV exposure, and type of UV protection used. For the question on measures taken for protection from UV radiation, possible answers included with sunscreen cream, with suitable sun-protective clothing, and by staying in the shade, or no measures were taken. In contrast to the other questions, multiple answers were accepted for this question. Answering no automatically excluded other possible answers. Participants also were asked to assess their own Fitzpatrick skin type19; the questionnaire included explanations of each skin type (I–IV).
The participants were then called in for examination by the dermatologist at 15-minute intervals. All clothing was removed and the skin was examined. Dermatoscopes were used for closer examination of suspicious skin lesions. The clinical results of the examinations were recorded on a standardized form.
An estimation of the number of melanocytic nevi—≤20, 21–49, or ≥50—was recorded for each patient. Suspicious skin lesions were assigned to one of the following categories: nevus requiring future checkup (Nc), nevus requiring excision (Ne), suspected malignant melanoma (MM), suspected squamous cell carcinoma, suspected basal cell carcinoma (BCC), suspected other skin tumor, and precancerous lesion. Fitzpatrick skin type also was assessed for all participants and recorded by the dermatologist carrying out the examination. Each participant was assigned to a risk group—low, moderate, or high risk—based on their individual risk for developing a skin tumor. Factors that were considered when determining participants’ risk for developing skin cancer included Fitzpatrick skin type, number of melanocytic nevi, personal and family history, leisure activities, UV protection used, and current clinical diagnosis of skin lesions.
After the skin examination, participants were informed of recommended treatment but were not given any additional dermatologic advice. Participants could arrange an appointment at the Department of Dermatology, University Hospital Erlangen, for the excision and histological analysis of the skin lesions. All recorded data were collected in a computerized spreadsheet program. When evaluating the questionnaires, questions that were not answered or were answered incorrectly (participant chose more than 1 answer) were ignored.
Statistical Analysis
Statistical analysis was carried out using SPSS software version 16.0. The majority of the data were nominal or ordinal. Metric data were checked for normal distribution using the Shapiro-Wilk test before carrying out parametric tests. Statistical tests were carried out using the χ2 test and the t test for independent samples. Non-nominal distributed data were checked using the Mann-Whitney U test. P<.05 was considered statistically significant in the exploratory data analysis.
Results
Of 783 employees included in the study, 288 (36.8%) were female and 495 (63.2%) were male (Table 1). In comparison with the total workforce, a significantly higher proportion of women than men took part in the cross-sectional study (P<.01). The average age (SD) was 42.3 (9.5) years (range, 18–64 years). Female participants (average age [SD], 39.8 [10.2] years) were significantly younger than male participants (average age [SD], 43.8 [8.8] years; P<.01). Forty-one percent of participants had a prior skin cancer screening. One percent of participants had a personal history of skin cancer, with 1 participant reporting a history of MM; 6.5% had a family history of skin cancer, of which 39.2% had a family history of MM.
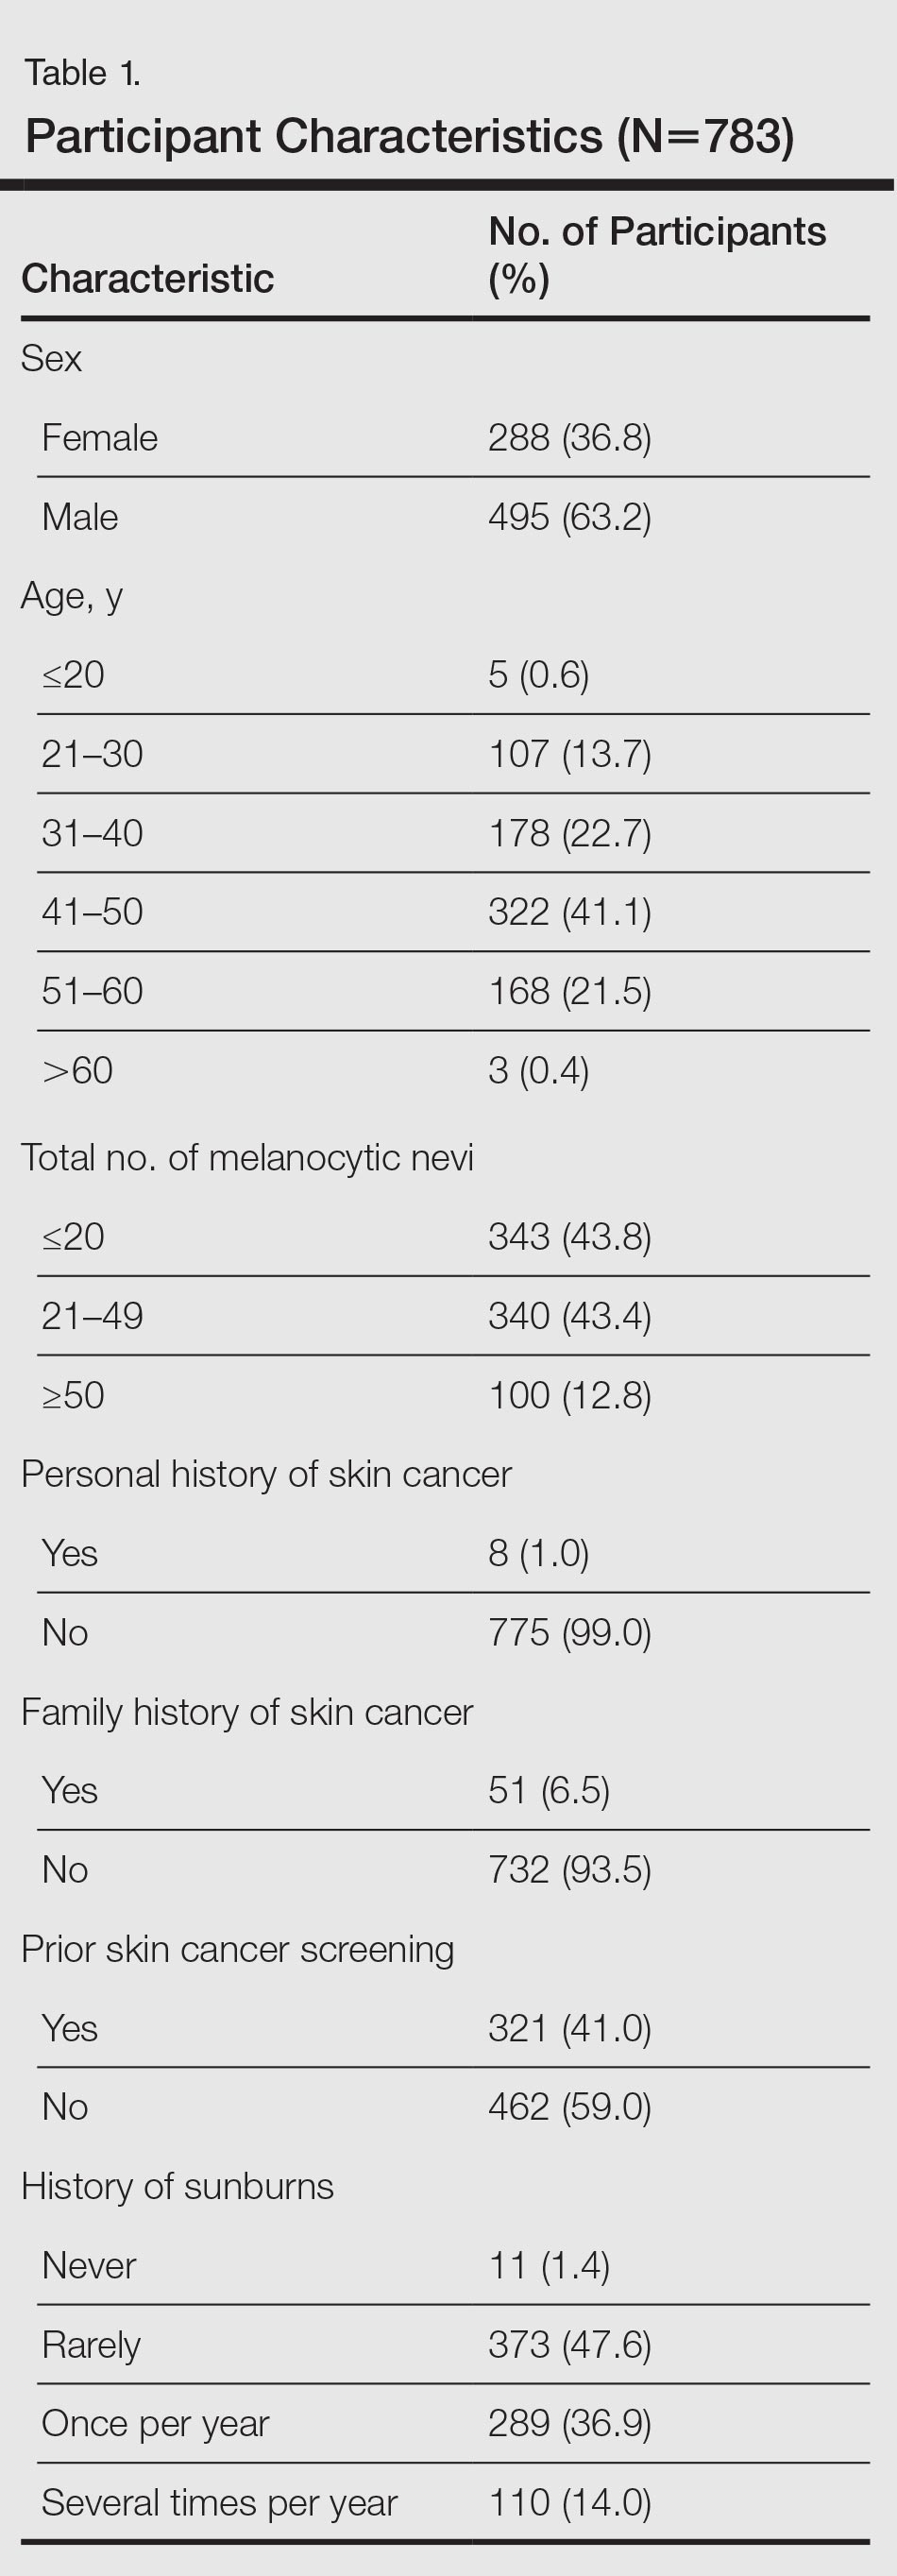
The results of the clinical examinations showed that 43.8% of participants had 20 or fewer melanocytic nevi, 43.4% had 21 to 49 melanocytic nevi, and 12.8% had 50 or more melanocytic nevi. Significantly more women than men had 20 or fewer melanocytic nevi (P<.05).
Approximately 92% of participants assessed themselves as having Fitzpatrick skin types II (35.2%) or III (56.7%), while only approximately 3.6% and 4.5% assessed themselves as having skin types I and IV, respectively. The results of the Fitzpatrick skin type assessments made by dermatologists were similar: 96.9% of participants were assessed as having Fitzpatrick skin types II (43.0%) and III (53.8%); approximately 1.9% and 1.3% were assessed as having Fitzpatrick skin types I and IV, respectively. Results showed that 80.2% of all participants assessed their skin type in the same way as the dermatologist; 13.5% assessed their skin type as darker and 6.3% (49/783) assessed it as lighter. A quantitative analysis of Fitzpatrick skin type and sex showed that significantly more male participants than female participants assessed their Fitzpatrick skin type darker than their actual skin type (P<.01).
Overall, 47.6% of participants reported having had sunburn rarely in the past, while 36.9% and 14.0% had experienced sunburn once per year and several times per year, respectively. Approximately 1.4% of participants reported never having a sunburn. More of the male participants made use of comprehensive sun protection using all methods listed (34.5%; P<.05) or a combination of sunscreen and sun-protective clothing (14.9%; P<.01) than the female participants who relied more frequently on sunscreen alone (29.5%; P<.01) or a combination of sunscreen and staying in the shade (29.5%; P<.01)
In general it was clear that sunscreen, either alone or in combination with other sun-protection methods, was used most frequently (88.0%); 58.0% protected themselves by staying in the shade, while 48.0% used suitable sun-protective clothing. Only 3.6% of participants did not protect themselves using any of the suggested methods.
A total of 661 categorized skin lesions were found in 377 participants. Of these lesions, 491 were Nc and 121 were Ne. Twenty-four of the skin lesions were suspected precancerous lesions, 13 were suspected BCC, 2 were suspected MM, and 10 were suspected other skin tumor (Table 2). Overall, male participants who were diagnosed with at least 1 skin lesion (average age, 44.0 years) were significantly older than the women (average age, 39.3 years)(P<.01). Similar findings were observed in participants with at least 1 Nc (men, 43.3 years; women, 38.7 years; P<.01) and at least 1 Ne (men, 44.2 years; women, 38.0 years; P<.05). With regard to the individual risk for developing skin cancer, 32.6% of participants were considered to be at low risk, 64.9% were at moderate risk, and 2.6% were at high risk.
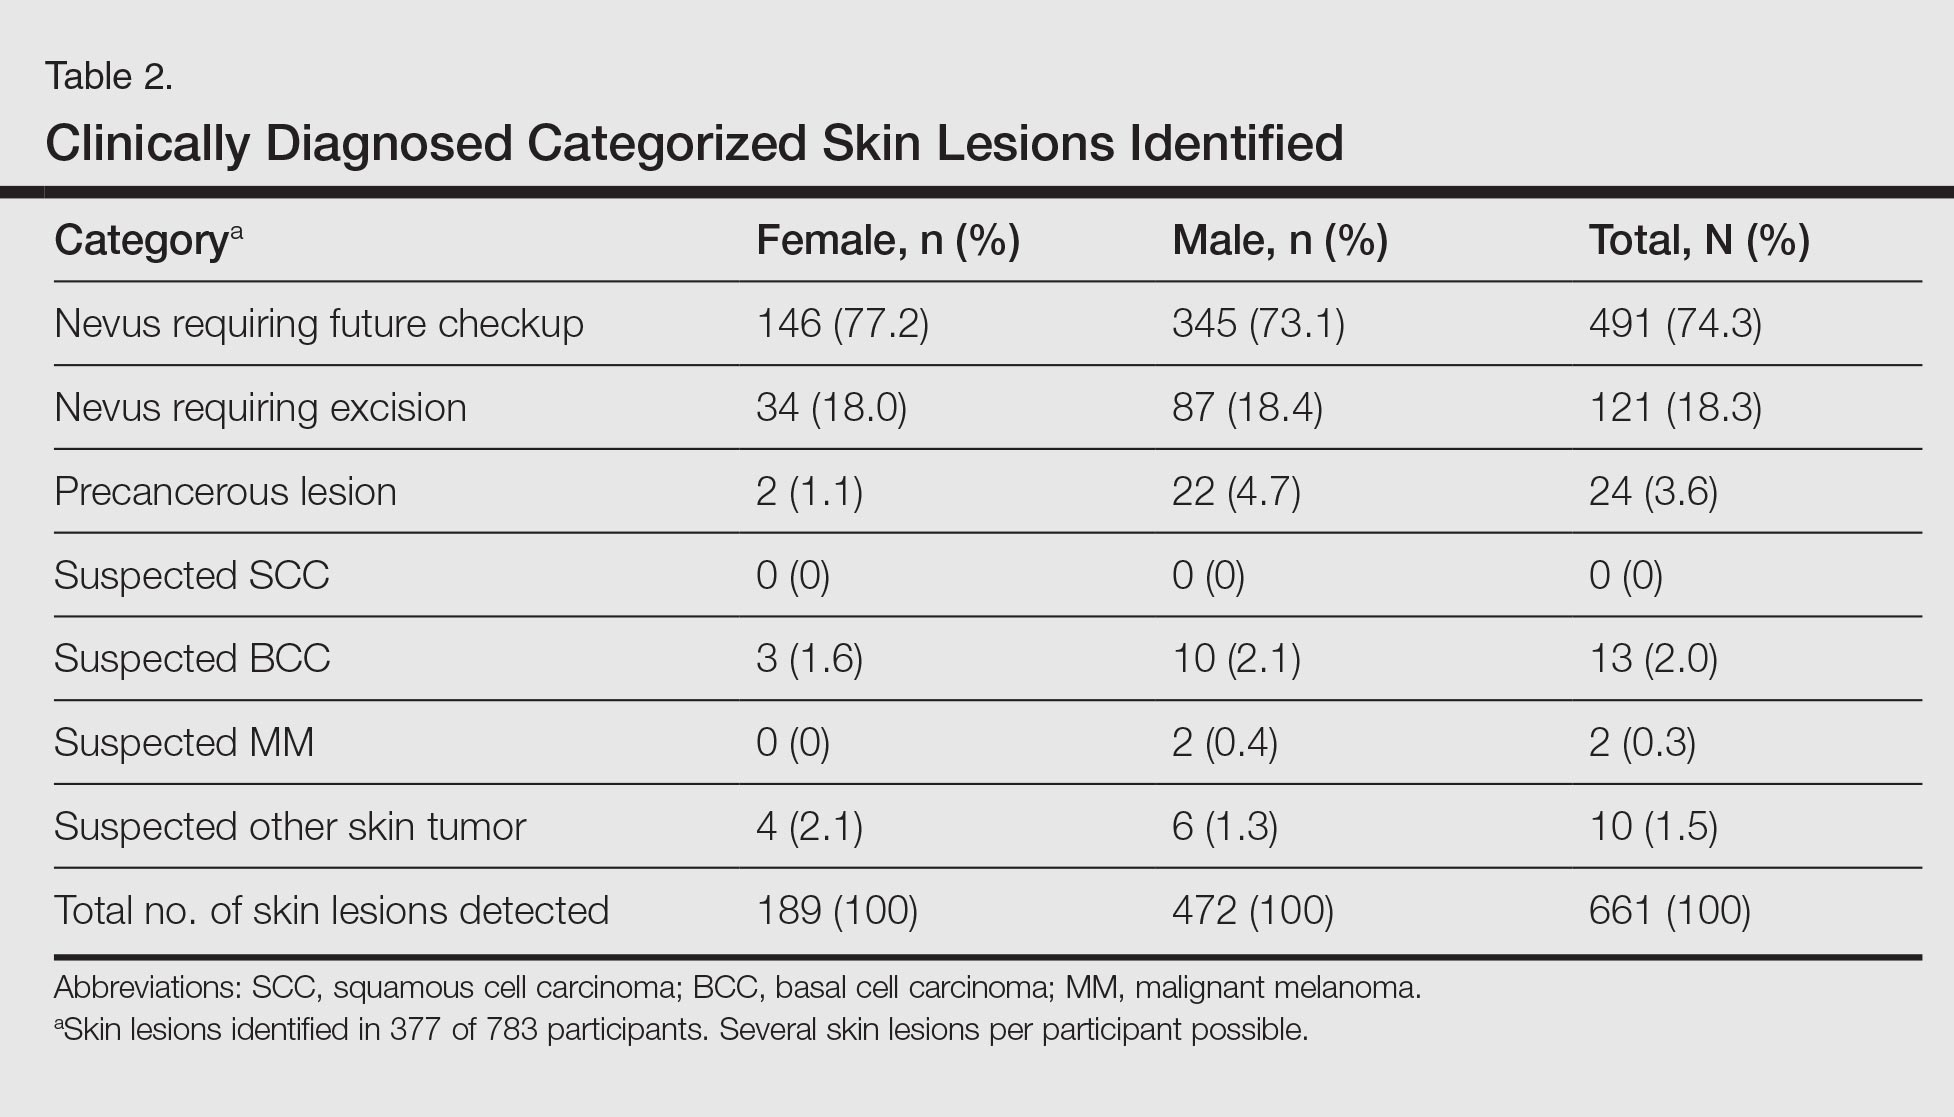
Approximately 61.5% of 377 participants who were diagnosed with at least 1 categorized skin lesion were advised to have a specific skin lesion checked by a dermatologist or to have a full examination for skin cancer once every 12 months. Furthermore, 22.5% were advised to follow-up biannually and 11.7% were advised to follow-up once every 2 years. Of the remaining participants who were advised to have follow-ups, 0.3% were advised to have a skin examination once every 3 months after having had MM, and 4.0% were advised to have follow-up once every 18 months. Overall, follow-up was recommended within 1 year in 84.4% of cases and within 1 to 2 years in 15.6% (Table 3).
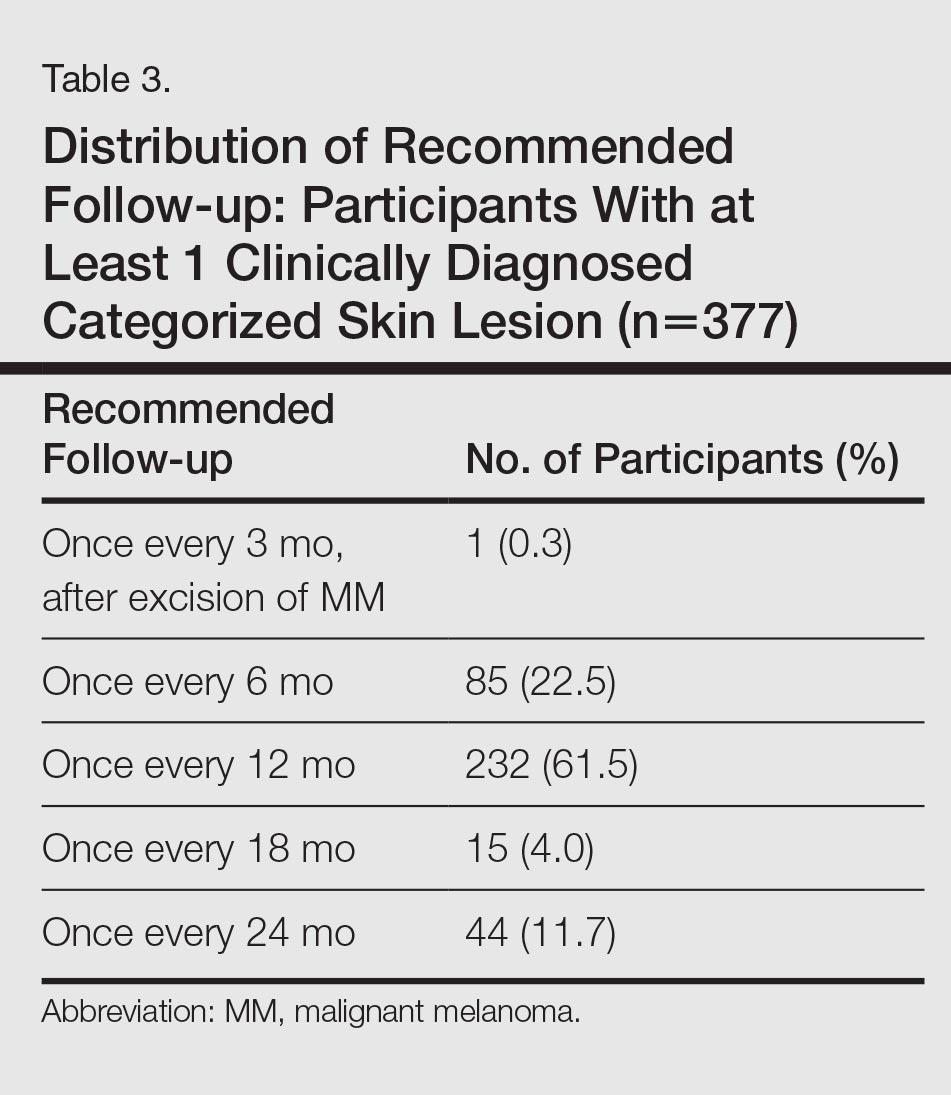
Subsequent histological analysis of the excised tissue resulted in a diagnosis of only 21 clinically significant skin conditions. One case of Bowen disease and 1 case of BCC was confirmed. Histological analysis identified the remaining 19 excised skin lesions, which included the 2 suspected MMs, as dysplastic nevi.
Comment
The aim of this cross-sectional study was to examine the importance and effectiveness of employee skin cancer screening programs. In comparison with the total workforce, significantly more women took part than men. Female participants were significantly younger than male participants, which mirrors the findings of prior studies showing that screening programs reach women more frequently than men and that women who participate in screenings are also younger on average in comparison to men.7-13 Men and older individuals usually are underrepresented.7,13 The average age of participants in our study was 42.3 years, which is lower than in the SCREEN (Skin Cancer Research to Provide Evidence for Effectiveness of Screening in Northern Germany) study (average age, 49.7 years).13 The average age in our study also is likely to be lower than patients who undergo skin cancer screenings offered by statutory health insurance providers in Germany, which has a minimum age restriction of 35 years; however, it is comparable to the average age of participants in other employee screening programs and therefore represents the average age of individuals employed in Germany.15,16
The employee skin cancer screening program in this study generated a high level of interest, indicated by the fact that all available appointments had been booked just 36 hours after the screening was announced. Furthermore, there was a waiting list of approximately 300 employees who were not able to undergo a skin examination. For logistical reasons, the number of participants was limited to 10% of the workforce. The high level of interest is an indication of increased awareness of the importance of recognizing skin tumors early and the associated need for information as well as the need to undergo screening for skin cancer as a precaution. This observation also can be made with regard to the skin cancer screening introduced by statutory health insurance providers in Germany. Studies published by Augustin et al20 and Kornek et al21,22 confirm that skin cancer screenings have gained wide acceptance in Germany because they were introduced by statutory health insurance providers in 2008. The number of skin cancer screenings carried out by dermatologists in Germany also is increasing.20-22 Although approximately 19% of those eligible to participate took part in the SCREEN pilot project,13 approximately 31% of individuals who were eligible to participate took part in skin cancer screenings offered by statutory health insurance providers in Germany in 2012, and the percentage is rising.23 Two important factors affecting the high level of interest in the employee screening program used in our study were undoubtedly the advantages of the examination taking place during working hours and being held on the occupational health services’ premises in the workplace, which helped participants avoid the cost of travel and wait times associated with visiting a medical practice.
Of 783 participants included in this study, 377 displayed at least 1 categorized skin lesion; the majority were suspicious melanocytic nevi. This high incidence rate suggested that regular skin cancer screenings are useful, as it has been shown that there is a correlation between higher numbers of melanocytic nevi and increased risk for developing melanoma.24
In a study by Winkler et al,25 a skin cancer screening of 1658 bank and insurance employees found that 33.8% of those examined displayed at least 1 atypical melanocytic nevus and 27.2% displayed more than 50 melanocytic nevi (compared to 12.8% with ≥50 melanocytic nevi in the current study). The risk for developing skin cancer was classified as intermediate or high in 54.5% (compared to 67.5% at moderate or high risk in the current study).25 Therefore, the rate of suspicious skin lesions was lower in the population of the study by Winkler et al25 in comparison to the population of the current study. As the overall number of melanocytic nevi and the individual risk for skin cancer, however, was underestimated by the majority of the bank and insurance employees,25 employee skin cancer screening programs can be used as a potentially effective tool to make employees aware of the issue and sensitizing them to it. Employee screening in addition to a final diagnosis can contribute to ensuring suitable treatment is started. For example, in the large-scale employee screening published by Schaefer et al15 and Augustin et al,16 48,665 and 90,880 employees, respectively, were screened for inflammatory and noninflammatory skin diseases, and 19% and 27% of participants, respectively, were diagnosed with skin lesions that required treatment.
Participants in the current study were given no further treatment or advice. Recommendations were made that participants monitor suspicious skin lesions or have them removed. With regard to future screening, 84.4% of participants with at least 1 categorized skin lesion were advised to have a regular follow-up within 1 year, while 15.6% were advised to follow-up within 1 to 2 years. Therefore, a period of 2 years before the next checkup, the period between screenings offered by statutory health insurance providers in Germany,12 was considered too long for the majority of participants, according to the dermatologists involved with our study.
Conclusion
The high rate of suspicious skin lesions diagnosed demonstrated the effectiveness of skin cancer screenings organized in the workplace, which should be recommended for all employees, not only those who are at high risk for developing skin cancer due to the nature of their work, such as those who work outdoors. It should be noted that the study group examined in the current study was a homogeneous group of employees of a technical company only and is therefore relatively selective. Nevertheless, despite the comparatively selective and young participant group, these examinations provide evidence of the importance of skin cancer screening programs for a wider population.
Acknowledgments
The authors thank Heidi Seybold, MD; Petra Wörl, MD; Sybille Thoma-Uszynski, MD; and Jens Bussmann, MD (all from Erlangen, Germany), for their support and active assistance in the practical implementation of this study.
- Boniol M, Autier P, Boyle P, et al. Cutaneous melanoma attributable to sunbed use: systematic review and meta-analysis. BMJ. 2012;345:e4757.
- Gilchrest BA, Eller MS, Geller AC, et al. The pathogenesis of melanoma induced by ultraviolet radiation. N Engl J Med. 1999;340:1341-1348.
- Rigel DS. Cutaneous ultraviolet exposure and its relationship to the development of skin cancer. J Am Acad Dermatol. 2008;58:129-132.
- El Ghissassi F, Baan R, Straif K, et al; WHO International Agency for Research on Cancer Monograph Working Group. A review of human carcinogens—part D: radiation. Lancet Oncol. 2009;10:751-752.
- MacLennan R, Green AC, McLeod GR, et al. Increasing incidence of cutaneous melanoma in Queensland, Australia. J Natl Cancer Inst. 1992;84:1427-1432.
- Heinzerling LM, Dummer R, Panizzon RG, et al. Prevention campaign against skin cancer. Dermatology. 2002;205:229-233.
- Stratigos A, Nikolaou V, Kedicoglou S, et al. Melanoma/skin cancer screening in a Mediterranean country: results of the Euromelanoma Screening Day Campaign in Greece. J Eur Acad Dermatol Venereol. 2007;21:56-62.
- Garbe C, Hauschild A, Volkenandt M, et al. Evidence and interdisciplinary consense-based German guidelines: diagnosis and surveillance of melanoma. Melanoma Res. 2007;17:393-399.
- Choudhury K, Volkmer B, Greinert R, et al. Effectiveness of skin cancer screening programmes. Br J Dermatol. 2012;167:94-98.
- Eisemann N, Waldmann A, Geller AC, et al. Non-melanoma skin cancer incidence and impact of skin cancer screening on incidence. J Invest Dermatol. 2014;134:43-50.
- Katalinic A, Waldmann A, Weinstock MA, et al. Does skin cancer screening save lives? an observational study comparing trends in melanoma mortality in regions with and without screening. Cancer. 2012;118:5395-5402.
- Bekanntmachung (1430 A) eines Beschlusses des Gemeinsamen Bundeausschusses über eine Änderung der Krebsfrüherkennungs-Richtlinien: Hautkrebs-Screening [press release]. Berlin, Germany: Bundesministerium für Gesundheit (Federal Ministry of Health, Germany); vom 15. November 2007.
- Breitbart EW, Waldmann A, Nolte S, et al. Systematic skin cancer screening in Northern Germany. J Am Acad Dermatol. 2012;66:201-211.
- Waldmann A, Nolte S, Weinstock MA, et al. Skin cancer screening participation and impact on melanoma incidence in Germany—an observational study on incidence trends in regions with and without population-based screening. Br J Cancer. 2012;106:970-974.
- Schaefer I, Rustenbach SJ, Zimmer L, et al. Prevalence of skin diseases in a cohort of 48,665 employees in Germany. Dermatology. 2008;217:169-172.
- Augustin M, Herberger K, Hintzen S, et al. Prevalence of skin lesions and need for treatment in a cohort of 90880 workers. Br J Dermatol. 2011;165:865-873.
- LeBlanc WG, Vidal L, Kirsner RS, et al. Reported skin cancer screening of US adult workers. J Am Acad Dermatol. 2008;59:55-63.
- Harbauer A, Binder M, Pehamberger H, et al. Validity of an unsupervised self-administered questionnaire for self-assessment of melanoma risk. Melanoma Res. 2003;13:537-542.
- Fitzpatrick TB. The validity and practicality of sun-reactive skin types I through VI. Arch Dermatol. 1988;124:869-871.
- Augustin M, Stadler R, Reusch M, et al. Skin cancer screening in Germany—perception by the public. J Dtsch Dermatol Ges. 2012;10:42-49.
- Kornek T, Augustin M. Skin cancer prevention. J Dtsch Dermatol Ges. 2013;11:283-296.
- Kornek T, Schäfer I, Reusch M, et al. Routine skin cancer screening in Germany: four years of experience from the dermatologists’ perspective. Dermatology. 2012;225:289-293.
- Barmer GEK Arztreport 2014 [press release]. Berlin, Germany: Barmer GEK; February 4, 2014.
- Bauer J, Garbe C. Acquired melanocytic nevi as riskfactor for melanoma development. a comprehensive review of epidemiological data. Pigment Cell Res. 2003;16:297-306.
- Winkler A, Plugfelder A, Weide B, et al. Screening for skin cancer in bank and insurance employees: risk profile and correlation of self and physician’s assessment. Int J Dermatol. 2015;54:419-423.
The incidence of skin cancer, along with its effects on patients and the economy, has continued to increase and therefore requires particular attention from dermatologists. UV light has been shown to be of etiopathologic importance in the development of various types of skin cancer.1-3 Studies have shown that there is a direct correlation between the incidence of skin cancer and average annual amounts of UV radiation exposure.3 Accordingly, in 2009 the International Agency for Research on Cancer classified UV light as carcinogenic to humans.4 Therefore, the general public must be made aware of the danger of exposure to UV radiation.
In Australia, government initiatives to educate the population on causes of skin cancer development and its relationship to UV radiation have already caused the public to change their way of thinking and to deal with sunlight in a conscious and responsible manner.5 A large proportion of the Australian population with light skin is at a particularly high risk for developing skin cancer due to intense exposure to UV radiation. Numerous campaigns in Germany and other countries have attempted to sensitize the public to this issue by emphasizing a reduction in UV exposure (primary prevention) or highlighting the importance of early diagnosis (secondary prevention).6,7
For a good prognosis, it is crucial that skin cancer, particularly melanoma, is discovered at an early or precancerous stage.8 For this reason, self-examination of the skin and skin cancer screening are important factors that can contribute to ensuring early and curative treatment.9-11 Since July 1, 2008, skin cancer screenings have been included in the preventative health care program by statutory health insurance providers in Germany. As part of this program, the cost of screening once every 2 years for individuals 35 years and older is covered by statutory health insurance.12 Several studies have shown a decline in the melanoma mortality rate since the introduction of skin cancer screening programs in Germany.11,13,14
Employee skin cancer screening programs are an important method of examining high numbers of individuals quickly and effectively. These programs have been carried out in Germany and other countries.15,16 Studies have shown that skin cancer screening carried out selectively on defined groups can be an effective form of secondary prevention, particularly for those who work outdoors.17
An employee skin cancer screening program was carried out as part of this study. The findings are interpreted and discussed in relation to other employee screening programs that have been reported as well as those introduced by statutory health insurance providers in Germany. The aim of this study was to determine the importance and effectiveness of employee skin cancer screening programs and the role they play in secondary prevention of skin cancer.
Methods
Study Population
Employees of a technical company in Bavaria, Germany, were offered a skin cancer screening program by the employer’s occupational health service and health insurance provider in collaboration with the Department of Dermatology at the University Hospital Erlangen (Erlangen, Germany). Skin examinations were performed exclusively by 5 trained dermatologists. Only direct employees of the company at 3 of its locations in the Erlangen area were eligible to participate. The total number of employees varied by location (1072–5126 employees). The majority of employees had a university education or had completed technical training. Family members and other individuals who were not members of the company were excluded. There were no further inclusion or exclusion criteria. Over a period of 13 days, 783 of 7823 total employees (10.0%) were examined and included in the study. The study was approved by the Responsible Ethics Commission of the Faculty of Medicine at Friedrich-Alexander-University Erlangen-Nürnberg, Germany.
Study Design
Employees signed a consent form for participation in the study and completed a standardized questionnaire. The questionnaire was based on surveys used in a prior study18 and collected information on current and prior skin lesions, prior dermatological screening, personal and family history of skin tumors, frequency of UV exposure, and type of UV protection used. For the question on measures taken for protection from UV radiation, possible answers included with sunscreen cream, with suitable sun-protective clothing, and by staying in the shade, or no measures were taken. In contrast to the other questions, multiple answers were accepted for this question. Answering no automatically excluded other possible answers. Participants also were asked to assess their own Fitzpatrick skin type19; the questionnaire included explanations of each skin type (I–IV).
The participants were then called in for examination by the dermatologist at 15-minute intervals. All clothing was removed and the skin was examined. Dermatoscopes were used for closer examination of suspicious skin lesions. The clinical results of the examinations were recorded on a standardized form.
An estimation of the number of melanocytic nevi—≤20, 21–49, or ≥50—was recorded for each patient. Suspicious skin lesions were assigned to one of the following categories: nevus requiring future checkup (Nc), nevus requiring excision (Ne), suspected malignant melanoma (MM), suspected squamous cell carcinoma, suspected basal cell carcinoma (BCC), suspected other skin tumor, and precancerous lesion. Fitzpatrick skin type also was assessed for all participants and recorded by the dermatologist carrying out the examination. Each participant was assigned to a risk group—low, moderate, or high risk—based on their individual risk for developing a skin tumor. Factors that were considered when determining participants’ risk for developing skin cancer included Fitzpatrick skin type, number of melanocytic nevi, personal and family history, leisure activities, UV protection used, and current clinical diagnosis of skin lesions.
After the skin examination, participants were informed of recommended treatment but were not given any additional dermatologic advice. Participants could arrange an appointment at the Department of Dermatology, University Hospital Erlangen, for the excision and histological analysis of the skin lesions. All recorded data were collected in a computerized spreadsheet program. When evaluating the questionnaires, questions that were not answered or were answered incorrectly (participant chose more than 1 answer) were ignored.
Statistical Analysis
Statistical analysis was carried out using SPSS software version 16.0. The majority of the data were nominal or ordinal. Metric data were checked for normal distribution using the Shapiro-Wilk test before carrying out parametric tests. Statistical tests were carried out using the χ2 test and the t test for independent samples. Non-nominal distributed data were checked using the Mann-Whitney U test. P<.05 was considered statistically significant in the exploratory data analysis.
Results
Of 783 employees included in the study, 288 (36.8%) were female and 495 (63.2%) were male (Table 1). In comparison with the total workforce, a significantly higher proportion of women than men took part in the cross-sectional study (P<.01). The average age (SD) was 42.3 (9.5) years (range, 18–64 years). Female participants (average age [SD], 39.8 [10.2] years) were significantly younger than male participants (average age [SD], 43.8 [8.8] years; P<.01). Forty-one percent of participants had a prior skin cancer screening. One percent of participants had a personal history of skin cancer, with 1 participant reporting a history of MM; 6.5% had a family history of skin cancer, of which 39.2% had a family history of MM.
The results of the clinical examinations showed that 43.8% of participants had 20 or fewer melanocytic nevi, 43.4% had 21 to 49 melanocytic nevi, and 12.8% had 50 or more melanocytic nevi. Significantly more women than men had 20 or fewer melanocytic nevi (P<.05).
Approximately 92% of participants assessed themselves as having Fitzpatrick skin types II (35.2%) or III (56.7%), while only approximately 3.6% and 4.5% assessed themselves as having skin types I and IV, respectively. The results of the Fitzpatrick skin type assessments made by dermatologists were similar: 96.9% of participants were assessed as having Fitzpatrick skin types II (43.0%) and III (53.8%); approximately 1.9% and 1.3% were assessed as having Fitzpatrick skin types I and IV, respectively. Results showed that 80.2% of all participants assessed their skin type in the same way as the dermatologist; 13.5% assessed their skin type as darker and 6.3% (49/783) assessed it as lighter. A quantitative analysis of Fitzpatrick skin type and sex showed that significantly more male participants than female participants assessed their Fitzpatrick skin type darker than their actual skin type (P<.01).
Overall, 47.6% of participants reported having had sunburn rarely in the past, while 36.9% and 14.0% had experienced sunburn once per year and several times per year, respectively. Approximately 1.4% of participants reported never having a sunburn. More of the male participants made use of comprehensive sun protection using all methods listed (34.5%; P<.05) or a combination of sunscreen and sun-protective clothing (14.9%; P<.01) than the female participants who relied more frequently on sunscreen alone (29.5%; P<.01) or a combination of sunscreen and staying in the shade (29.5%; P<.01)
In general it was clear that sunscreen, either alone or in combination with other sun-protection methods, was used most frequently (88.0%); 58.0% protected themselves by staying in the shade, while 48.0% used suitable sun-protective clothing. Only 3.6% of participants did not protect themselves using any of the suggested methods.
A total of 661 categorized skin lesions were found in 377 participants. Of these lesions, 491 were Nc and 121 were Ne. Twenty-four of the skin lesions were suspected precancerous lesions, 13 were suspected BCC, 2 were suspected MM, and 10 were suspected other skin tumor (Table 2). Overall, male participants who were diagnosed with at least 1 skin lesion (average age, 44.0 years) were significantly older than the women (average age, 39.3 years)(P<.01). Similar findings were observed in participants with at least 1 Nc (men, 43.3 years; women, 38.7 years; P<.01) and at least 1 Ne (men, 44.2 years; women, 38.0 years; P<.05). With regard to the individual risk for developing skin cancer, 32.6% of participants were considered to be at low risk, 64.9% were at moderate risk, and 2.6% were at high risk.
Approximately 61.5% of 377 participants who were diagnosed with at least 1 categorized skin lesion were advised to have a specific skin lesion checked by a dermatologist or to have a full examination for skin cancer once every 12 months. Furthermore, 22.5% were advised to follow-up biannually and 11.7% were advised to follow-up once every 2 years. Of the remaining participants who were advised to have follow-ups, 0.3% were advised to have a skin examination once every 3 months after having had MM, and 4.0% were advised to have follow-up once every 18 months. Overall, follow-up was recommended within 1 year in 84.4% of cases and within 1 to 2 years in 15.6% (Table 3).
Subsequent histological analysis of the excised tissue resulted in a diagnosis of only 21 clinically significant skin conditions. One case of Bowen disease and 1 case of BCC was confirmed. Histological analysis identified the remaining 19 excised skin lesions, which included the 2 suspected MMs, as dysplastic nevi.
Comment
The aim of this cross-sectional study was to examine the importance and effectiveness of employee skin cancer screening programs. In comparison with the total workforce, significantly more women took part than men. Female participants were significantly younger than male participants, which mirrors the findings of prior studies showing that screening programs reach women more frequently than men and that women who participate in screenings are also younger on average in comparison to men.7-13 Men and older individuals usually are underrepresented.7,13 The average age of participants in our study was 42.3 years, which is lower than in the SCREEN (Skin Cancer Research to Provide Evidence for Effectiveness of Screening in Northern Germany) study (average age, 49.7 years).13 The average age in our study also is likely to be lower than patients who undergo skin cancer screenings offered by statutory health insurance providers in Germany, which has a minimum age restriction of 35 years; however, it is comparable to the average age of participants in other employee screening programs and therefore represents the average age of individuals employed in Germany.15,16
The employee skin cancer screening program in this study generated a high level of interest, indicated by the fact that all available appointments had been booked just 36 hours after the screening was announced. Furthermore, there was a waiting list of approximately 300 employees who were not able to undergo a skin examination. For logistical reasons, the number of participants was limited to 10% of the workforce. The high level of interest is an indication of increased awareness of the importance of recognizing skin tumors early and the associated need for information as well as the need to undergo screening for skin cancer as a precaution. This observation also can be made with regard to the skin cancer screening introduced by statutory health insurance providers in Germany. Studies published by Augustin et al20 and Kornek et al21,22 confirm that skin cancer screenings have gained wide acceptance in Germany because they were introduced by statutory health insurance providers in 2008. The number of skin cancer screenings carried out by dermatologists in Germany also is increasing.20-22 Although approximately 19% of those eligible to participate took part in the SCREEN pilot project,13 approximately 31% of individuals who were eligible to participate took part in skin cancer screenings offered by statutory health insurance providers in Germany in 2012, and the percentage is rising.23 Two important factors affecting the high level of interest in the employee screening program used in our study were undoubtedly the advantages of the examination taking place during working hours and being held on the occupational health services’ premises in the workplace, which helped participants avoid the cost of travel and wait times associated with visiting a medical practice.
Of 783 participants included in this study, 377 displayed at least 1 categorized skin lesion; the majority were suspicious melanocytic nevi. This high incidence rate suggested that regular skin cancer screenings are useful, as it has been shown that there is a correlation between higher numbers of melanocytic nevi and increased risk for developing melanoma.24
In a study by Winkler et al,25 a skin cancer screening of 1658 bank and insurance employees found that 33.8% of those examined displayed at least 1 atypical melanocytic nevus and 27.2% displayed more than 50 melanocytic nevi (compared to 12.8% with ≥50 melanocytic nevi in the current study). The risk for developing skin cancer was classified as intermediate or high in 54.5% (compared to 67.5% at moderate or high risk in the current study).25 Therefore, the rate of suspicious skin lesions was lower in the population of the study by Winkler et al25 in comparison to the population of the current study. As the overall number of melanocytic nevi and the individual risk for skin cancer, however, was underestimated by the majority of the bank and insurance employees,25 employee skin cancer screening programs can be used as a potentially effective tool to make employees aware of the issue and sensitizing them to it. Employee screening in addition to a final diagnosis can contribute to ensuring suitable treatment is started. For example, in the large-scale employee screening published by Schaefer et al15 and Augustin et al,16 48,665 and 90,880 employees, respectively, were screened for inflammatory and noninflammatory skin diseases, and 19% and 27% of participants, respectively, were diagnosed with skin lesions that required treatment.
Participants in the current study were given no further treatment or advice. Recommendations were made that participants monitor suspicious skin lesions or have them removed. With regard to future screening, 84.4% of participants with at least 1 categorized skin lesion were advised to have a regular follow-up within 1 year, while 15.6% were advised to follow-up within 1 to 2 years. Therefore, a period of 2 years before the next checkup, the period between screenings offered by statutory health insurance providers in Germany,12 was considered too long for the majority of participants, according to the dermatologists involved with our study.
Conclusion
The high rate of suspicious skin lesions diagnosed demonstrated the effectiveness of skin cancer screenings organized in the workplace, which should be recommended for all employees, not only those who are at high risk for developing skin cancer due to the nature of their work, such as those who work outdoors. It should be noted that the study group examined in the current study was a homogeneous group of employees of a technical company only and is therefore relatively selective. Nevertheless, despite the comparatively selective and young participant group, these examinations provide evidence of the importance of skin cancer screening programs for a wider population.
Acknowledgments
The authors thank Heidi Seybold, MD; Petra Wörl, MD; Sybille Thoma-Uszynski, MD; and Jens Bussmann, MD (all from Erlangen, Germany), for their support and active assistance in the practical implementation of this study.
- Boniol M, Autier P, Boyle P, et al. Cutaneous melanoma attributable to sunbed use: systematic review and meta-analysis. BMJ. 2012;345:e4757.
- Gilchrest BA, Eller MS, Geller AC, et al. The pathogenesis of melanoma induced by ultraviolet radiation. N Engl J Med. 1999;340:1341-1348.
- Rigel DS. Cutaneous ultraviolet exposure and its relationship to the development of skin cancer. J Am Acad Dermatol. 2008;58:129-132.
- El Ghissassi F, Baan R, Straif K, et al; WHO International Agency for Research on Cancer Monograph Working Group. A review of human carcinogens—part D: radiation. Lancet Oncol. 2009;10:751-752.
- MacLennan R, Green AC, McLeod GR, et al. Increasing incidence of cutaneous melanoma in Queensland, Australia. J Natl Cancer Inst. 1992;84:1427-1432.
- Heinzerling LM, Dummer R, Panizzon RG, et al. Prevention campaign against skin cancer. Dermatology. 2002;205:229-233.
- Stratigos A, Nikolaou V, Kedicoglou S, et al. Melanoma/skin cancer screening in a Mediterranean country: results of the Euromelanoma Screening Day Campaign in Greece. J Eur Acad Dermatol Venereol. 2007;21:56-62.
- Garbe C, Hauschild A, Volkenandt M, et al. Evidence and interdisciplinary consense-based German guidelines: diagnosis and surveillance of melanoma. Melanoma Res. 2007;17:393-399.
- Choudhury K, Volkmer B, Greinert R, et al. Effectiveness of skin cancer screening programmes. Br J Dermatol. 2012;167:94-98.
- Eisemann N, Waldmann A, Geller AC, et al. Non-melanoma skin cancer incidence and impact of skin cancer screening on incidence. J Invest Dermatol. 2014;134:43-50.
- Katalinic A, Waldmann A, Weinstock MA, et al. Does skin cancer screening save lives? an observational study comparing trends in melanoma mortality in regions with and without screening. Cancer. 2012;118:5395-5402.
- Bekanntmachung (1430 A) eines Beschlusses des Gemeinsamen Bundeausschusses über eine Änderung der Krebsfrüherkennungs-Richtlinien: Hautkrebs-Screening [press release]. Berlin, Germany: Bundesministerium für Gesundheit (Federal Ministry of Health, Germany); vom 15. November 2007.
- Breitbart EW, Waldmann A, Nolte S, et al. Systematic skin cancer screening in Northern Germany. J Am Acad Dermatol. 2012;66:201-211.
- Waldmann A, Nolte S, Weinstock MA, et al. Skin cancer screening participation and impact on melanoma incidence in Germany—an observational study on incidence trends in regions with and without population-based screening. Br J Cancer. 2012;106:970-974.
- Schaefer I, Rustenbach SJ, Zimmer L, et al. Prevalence of skin diseases in a cohort of 48,665 employees in Germany. Dermatology. 2008;217:169-172.
- Augustin M, Herberger K, Hintzen S, et al. Prevalence of skin lesions and need for treatment in a cohort of 90880 workers. Br J Dermatol. 2011;165:865-873.
- LeBlanc WG, Vidal L, Kirsner RS, et al. Reported skin cancer screening of US adult workers. J Am Acad Dermatol. 2008;59:55-63.
- Harbauer A, Binder M, Pehamberger H, et al. Validity of an unsupervised self-administered questionnaire for self-assessment of melanoma risk. Melanoma Res. 2003;13:537-542.
- Fitzpatrick TB. The validity and practicality of sun-reactive skin types I through VI. Arch Dermatol. 1988;124:869-871.
- Augustin M, Stadler R, Reusch M, et al. Skin cancer screening in Germany—perception by the public. J Dtsch Dermatol Ges. 2012;10:42-49.
- Kornek T, Augustin M. Skin cancer prevention. J Dtsch Dermatol Ges. 2013;11:283-296.
- Kornek T, Schäfer I, Reusch M, et al. Routine skin cancer screening in Germany: four years of experience from the dermatologists’ perspective. Dermatology. 2012;225:289-293.
- Barmer GEK Arztreport 2014 [press release]. Berlin, Germany: Barmer GEK; February 4, 2014.
- Bauer J, Garbe C. Acquired melanocytic nevi as riskfactor for melanoma development. a comprehensive review of epidemiological data. Pigment Cell Res. 2003;16:297-306.
- Winkler A, Plugfelder A, Weide B, et al. Screening for skin cancer in bank and insurance employees: risk profile and correlation of self and physician’s assessment. Int J Dermatol. 2015;54:419-423.
Practice Points
- Employee skin cancer screening programs are an important method of examining high numbers of individuals quickly and efficiently and should be used as an important tool for secondary skin cancer prevention.
- The high rate of suspicious skin lesions diagnosed in this study demonstrates the effectiveness of skin cancer screenings organized in the workplace and provides evidence of the importance of skin cancer screening programs for a wider population.
- Employee skin cancer screening programs should be recommended for all employees, not only those who are at high risk for developing skin cancer due to the nature of their work, such as those who work outdoors.