User login
PCP Visits to Hospitalized Patients
Transitions in care are vulnerable periods. As patients are transferred between settings of care (such as from hospital back to the community), communication between healthcare providers is vital for care continuity.[1] A significant number of preventable adverse events may be related to ineffective communication between care providers.[1, 2, 3] The advent of specialized care, such as the introduction of hospitalists in acute care settings, has created an environment in which a patient's most responsible physician can often change multiple times as they move through the healthcare system.[4] Although there are many benefits to this type of concentrated care, the increase in care transitions may result in breakdowns in communication that may then be linked to risks in patient safety and suboptimal patient outcomes.[5, 6, 7, 8]
Improved continuity of care has been demonstrated to enhance patient safety during care transitions.[7] Efforts to develop continuity of care interventions are largely focused on care‐provider continuity, improved facilitation of communication, care planning, and increasing involvement of primary care physicians during follow‐up to hospitalizations and specialist visits.[9, 10] Such continuity of care efforts may provide a moderate benefit, but there remains room for improvement.[10, 11]
One dimension of continuity of care that has received limited attention is the potential impact of primary care physicians hospital visits to their hospitalized patients in a supportive‐care role.[12] In these situations, the primary care physician is neither the most responsible physician nor are they involved directly in their patient's hospital care. However, visiting their patient implies that they are aware of the hospitalization, thereby facilitating the potential for communication between care providers. Primary care physicians can also provide valuable contextual and relevant information as well as be involved in the discharge process. To identify the extent to which primary care physicians visit hospitalized patients and to measure the potential impact of primary care physician supportive visits on future outcomes, we used population‐level data to determine the frequency of supportive‐care visits by primary care physicians to hospitalized patients and to identify the association between these visits, patient outcomes, and health services utilization.
METHODS
Overview
We applied a retrospective cohort design utilizing linked population‐based administrative databases in the province of Ontario, Canada to examine outcome differences between patients who received a supportive‐care in‐hospital visit by their primary care physician compared to those who did not.
Databases
We assembled the cohort from linked and encrypted population‐based healthcare administrative databases. Data were derived from information on patients and physicians from the Ontario Health Insurance Plan, the Canadian Census, the Canadian Institute of Health Information Hospital Discharge Abstract Database, Registered Persons Databases, National Ambulatory Care Reporting System, Corporate Provider Database, Client Agency Program Enrolment, and Home Care Database. These databases have been validated and widely used in numerous studies.[13, 14, 15] All adults aged18 years who were discharged from the hospital in Ontario, Canada between January 1, 2008 and December 31, 2009 were included. Patients transferred to nursing homes or other acute care facilities following discharge, including rehabilitation centers, were excluded because they may have different readmission patterns. Among remaining hospitalized patients, only those with an identifiable primary care physician in the community were included. The patientprimary care physician pairings were identified using validated algorithms based on historical physician billing information.[16] This approach, adapted from previous studies, maximized the comparability among the study groups.[17, 18] In addition to having an historical relationship with the patients, primary care physicians had to have a history of conducting in‐hospital supportive visits (i.e., visits to at least 2 hospital patients within the previous year) for the patientprimary care physician pair to be included. This criterion was included to increase the likelihood that we were capturing a usual physician practice behavior and not a single circumstantial visit by a primary care physician. The history of supportive visits was also identified with physician billing data using a specific fee code.
Exposure
The exposure of interest was an in‐hospital visit in a supportive‐care role by the primary care physician during a patient's hospitalization and was obtained from physician fee codes. The fee paid for a visit during the study period was less than $20 CND.
Outcome Measures
Two different composite outcome measures were examined. The primary outcome was a composite of an emergent hospital readmission, death, or emergency department visit (without hospital admission). A composite measure was utilized to account for all outcomes simultaneously and thus be representative of the overall patient experience.[19] This approach has been applied in several studies examining continuity of care.[19, 20, 21] The secondary outcome examined processes of care. It was a composite evaluating ambulatory health services use postdischarge, specifically the number of primary care physician office visits and formal (ie, paid for by the universal provincial health plan) home‐care services. Home‐care services included both visits for nursing care as well as formal social support such as personal care. All outcome measures were assessed at 30 and 90 days following hospital discharge to assess for short and medium range outcomes.[22]
Patient Characteristics
Patient demographics including age, sex, low income (defined as individual income below $16,018 [CND] or couples income below $24,175 [CND]), living in a rural region, and the number of previous visits with primary care physicians were described from the available data. Readmission risk from the initial hospitalization was calculated based on the LACE score.[23] The LACE score is a validated measure of 30‐day readmission risk based on healthcare administrative data that account for (L) length of stay, (A) acute admission, (C) comorbid disease burden, and number of (E) emergency department visits in previous 6 months.[23] The LACE score ranges from 0 to 19, which correspond to a probability of readmissions of 2% to 43.7%, respectively. We considered individuals to have a high risk of readmission with a LACE score 10, which corresponds to a probability of readmission of 12.2%.[23]
Statistical Analyses
Descriptive statistics were used to compare patient characteristics among those with a primary care physician supportive‐care visit to those without. Logistic regression modeling was conducted to examine the impact of primary care physician visits on outcomes. The results reported here reflect the selection of adjusting for the confounders of age, sex, a history of primary care physician visits, low income, rurality, and the LACE score.
Ethics
The project analysis was conducted at the Institute for Clinical Evaluative Sciences (ICES) in Toronto, Ontario and was approved by the Sunnybrook Health Sciences Centre Research Ethics Board.
RESULTS
Overview
There were 11,316 primary care physicians identified as practicing in Ontario during the study period, of which 3236 had a history of conducting regular in‐hospital visits to 2 or more patients. The final patient cohort consisted of 164,059 hospitalized patients; 19,614 patients received a visit from their primary care physician, whereas 144,445 did not (Figure 1).

The hospitalized patients who received a visit from their primary care physician were significantly different than the patients who did not receive an in‐hospital visit (Table 1). Notably, patients who received a visit by their primary care physician had longer lengths of hospital stay (9.7 days vs 6.8 days, P<0.001). As well, a greater proportion had a high 30‐day readmission risk (LACE score10: 39.4% vs 29.9%, P<0.001) (Table 1).[21]
| Variablea | With PCP Visit (N=19,614) | Without PCP Visit (N=144,445) |
|---|---|---|
| ||
| Age, meanSD | 68.3716.85 | 65.7318.54 |
| Sex, no. of males | 9,393 (47.9%) | 67,030 (46.4%) |
| Low income | 3,937 (20.1%) | 30,157 (20.9%) |
| Individuals living in rural regions, no. | 1,951 (9.9%) | 25,731 (17.8%) |
| PCP visits in previous 6 months, meanSD | 4.764.47 | 4.174.28 |
| Length of stay, d, meanSD | 9.7217.40 | 6.7913.17 |
| Acute emergent visits, no. | 19,138 (97.6%) | 136,374 (94.4%) |
| Charlson score, meanSD | 1.061.60 | 0.921.49 |
| ED visits in previous 6 months, meanSD | 0.951.48 | 1.091.98 |
| LACE score, meanSDc | 9.022.88 | 8.103.02 |
| High risk for readmission (LACE score10), no. (%)c | 7,721 (39.4%) | 43,126 (29.9%) |
Patients who received an in‐hospital visit by their primary care physician were significantly different from those who did not (Table 2). They were older (68.4 years vs 65.7 years), and had a higher risk of readmission (LACE score of 9 vs 8). As well, proportionally fewer patients who received a visit were from rural regions than in the comparator group (9.9% of patients visited were from rural regions vs 17.8% of patients who did not receive a visit) (Table 2).
| Variable | Patients Who Received an In‐hospital Visit (N=19,614) | Patients Who Did Not Receive an In‐hospital Visit (N=144,445) | P Value |
|---|---|---|---|
| |||
| Primary outcome of emergency department visit, hospital readmission, or death | |||
| 30 days postdischarge, no. (%) | |||
| Readmission | 1,742 (8.9%) | 11,212 (7.8%) | <0.001 |
| ED visit | 2,039 (10.4%) | 16,823 (11.6%) | <0.001 |
| Death | 727 (3.7%) | 4,688 (3.2%) | <0.001 |
| Composite endpointa | 4,227 (21.6%) | 30,848 (21.4%) | 0.533 |
| 90 days postdischarge | |||
| Readmission | 2,791 (14.2%) | 18,257 (12.6%) | <0.001 |
| ED visit | 3,652 (18.6%) | 29,590 (20.5%) | <0.001 |
| Death | 1,507 (7.7%) | 9,821 (6.8%) | <0.001 |
| Composite endpointa | 7,125 (36.3%) | 52,245 (36.2%) | 0.668 |
| Secondary outcome of PCP office visits and home‐care services | |||
| 30 days postdischarge | |||
| Community PCP visits, meanSD | 3.85.1 | 3.14.6 | <0.001 |
| PCP visit, no. (%) | 15,732 (80.2%) | 108,266 (75%) | <0.001 |
| Home‐care services, no. (%) | 6,197 (31.6%) | 38,745 (26.8%) | <0.001 |
| Composite endpoint, no. (%)b | 16,851 (85.9%) | 117, 290 (81.2%) | <0.001 |
| 90 days postdischarge | |||
| Community PCP visits, meanSD | 8.210.1 | 6.99.3 | <0.001 |
| PCP visit, no. (%) | 18,112 (92.3%) | 128, 806 (89.2%) | <0.001 |
| Home‐care services, no. (%) | 7,256 (37.0%) | 45,675 (31.6%) | <0.001 |
| Composite endpoint, no. (%)b | 18, 504 (94.3%) | 132, 448 (91.7%) | <0.001 |
Individual Outcomes
Patients who received an in‐hospital visit by their primary care physician were also more likely to be readmitted within 30 days of discharge (8.9% vs 7.8%, P<0.001) and within 90 days of discharge (14.2% vs 12.6%, P<0.001). Additionally, patients who were visited by their primary care physician while hospitalized were more likely to die within 30 days postdischarge than those who did not receive an in‐hospital visit (3.7% vs 3.2%, P<0.001) and similarly by 90 days postdischarge (7.7% vs 6.8%, P<0.001) (Table 2).
Patients who received an in‐hospital visit were less likely to visit the emergency department at 30 days (10.4% vs 11.6%, P<0.001) and at 90 days (18.6% vs 20.5%, P<0.001) compared to patients who did not receive an in‐hospital visit (Table 2).
The patients who received in‐hospital visits by their primary care physician had a greater average number of primary care physician visits in the community at 30 days (3.8 vs 3.1, P<0.001) and 90 days (8.2 vs 6.9, P<0.001) (Table 2). Additionally, a higher proportion of patients who received an in‐hospital visit accessed home‐care services at 30 days postdischarge (31.6% vs 26.8%, P<0.001) and 90 days postdischarge (37.0% vs 31.6%, P<0.001) (Table 2).
Primary Outcome
There was no difference in proportion of patients who experienced the composite endpoint at 30 days (4227 [21.6%] vs 30,848 [21.4%], P>0.5) or 90 days (7125 [36.3%] vs 52,245 [36.2%], P>0.6) for patients who received an in‐hospital visit by their primary care physician compared to those who did not. The unadjusted model found no statistically significant difference between the 2 groups upon a primary care physician visit (odds ratio [OR]: 1.01; 95% confidence interval [CI]: 0.98‐1.04). However, once adjusting for differences in the groups for patient factors such as age, sex, location and health status, patients who received an in‐hospital visit by their primary care physician had lower adjusted risk for the composite outcome at 30 days postdischarge (adjusted OR [aOR]: 0.92; 95% CI: 0.89‐0.96) and 90 days postdischarge (aOR: 0.90; 95% CI: 0.87‐0.92) (Table 3). Estimates for each individual component of the composite outcome revealed significantly lower risk for ED visit and death but similar risk for readmission at both 30 days and 90 days after hospital discharge for patients who received and in‐hospital visit from their primary care physician and those who did not (Table 3).
| Variable | Unadjusted Odds Ratio (95% CI) | Adjusted Odds Ratio (95% CI)a |
|---|---|---|
| ||
| Primary outcome of emergency department visit, hospital readmission, or death | ||
| 30 days postdischarge | ||
| Readmission | 1.16 (1.10‐1.22) | 1.03 (0.97‐1.08) |
| ED visit | 0.88 (0.84‐0.92) | 0.88 (0.84‐0.92) |
| Death | 1.15 (1.06‐1.24) | 0.88 (0.81‐0.96) |
| Composite endpointb | 1.01 (0.98‐1.05) | 0.92 (0.89‐0.96) |
| 90 days postdischarge | ||
| Readmission | 1.15 (1.10‐1.20) | 1.00 (0.96‐1.04) |
| ED visit | 0.89 (0.86‐0.92) | 0.89 (0.86‐0.93) |
| Death | 1.14 (1.08‐1.21) | 0.87 (0.82‐0.93) |
| Composite endpointb | 1.01 (0.98‐1.04) | 0.90 (0.87‐0.92) |
| Secondary outcome of PCP office visits and home‐care services | ||
| 30 days postdischarge | ||
| Community PCP visits | 1.35 (1.31‐1.41) | 1.21 (1.16‐1.25) |
| Home‐care services | 1.26 (1.22‐1.30) | 1.05 (1.01‐1.09) |
| Composite endpointc | 1.41 (1.34‐1.47) | 1.16 (1.11‐1.21) |
| 90 days postdischarge | ||
| Community PCP visits | 1.46 (1.39‐1.55) | 1.25 (1.18‐1.33) |
| Home‐care services | 1.27 (1.23‐1.31) | 1.05 (1.01‐1.08) |
| Composite endpointc | 1.51 (1.42‐1.61) | 1.19 (1.12‐1.27) |
Secondary Outcome
Patients who received an in‐hospital visit by their primary care physician were more likely to experience the composite outcome of home‐care services and community primary care physician visits at 30 postdischarge (16,851 [85.9%] vs 117,290 [81.2%], P<0.001) and 90 days postdischarge (18,504 [94.3%] vs 132,448 [91.7%], P<0.001) compared to patients who did not receive an in‐hospital visit (Table 3). Once accounting for patient variables such as age, sex, location, and health status, patients who received an in‐hospital visit by their primary care physician had a higher adjusted risk for the composite outcome at 30 days postdischarge (aOR: 1.16; 95% CI: 1.11‐1.21) and 90 days postdischarge (aOR: 1.19; 95% CI: 1.12‐1.27) (Table 3).
DISCUSSION
Our population‐based study of primary care physicians is among the first to examine outcomes of patients whose primary care physicians have a history of providing supportive visits to hospitalized patients. After controlling for risk differences in patients at hospital discharge, we found that a primary care physician visit to a patient in the hospital was associated with a lower adjusted risk for the composite outcome of death, emergent hospital readmission, or emergency department visit at 30 and 90 days postdischarge compared to hospitalized patients who did not receive a visit by their primary care physician. We found this to be driven by patients having a lower risk of emergency department visits and death, whereas there was a similar risk of hospital readmission. We also found that visited patients were more likely to access home‐care services and have more primary care physician visits in the community following discharge.
The unadjusted model differs substantially from the adjusted model. On the surface this is an apparent paradox where the unadjusted results suggest an association with potential harm or no difference with a supportive visit. Conversely, the adjusted model suggests a reduction in harms. The differences between the unadjusted and adjusted model is driven by changes in the point estimates for readmission and death rates at both 30 and 90 day postdischarge. Prior to adjustment, it appears as if a primary care physician visit is associated with a significant increase of death; however, upon adjustment, it is associated with a significant reduction in death. Interestingly, this is a different effect than that observed with the secondary analysis, where the adjusted analyses demonstrate a more modest (but still positive) effect of supportive‐care visits. This observed change is likely due to differences in the patient groups. We can speculate that this may be an observed phenomenon of primary care physicians opting to visit their sicker patients, as perhaps it should be; however, further research is required to fully understand the real drivers of a supportive visit.
Our results are consistent with an earlier study that identified that a minority number of primary care physicians visit their hospitalized patients.[24] As well, findings from a randomized controlled trial of 364 patients over 60 years old identified a limited impact of primary care physician visits on patient outcomes but noted enhanced access to community health services.[12] Our work highlights the potential impact of primary care physician visits, which could, in theory, be leveraged and be an important role that primary care physicians can play in planning postdischarge care and improving the quality of care following hospitalization.
Our research study did not examine the impact of in‐hospital primary care physician visits on patient satisfaction directly. However, it has been demonstrated that patients have a strong desire for their primary care physician to be involved in their hospital care and their preference is for direct contact, with face‐to‐face visits compared to telephone or other communication.[25] This choice is important because dissatisfaction with services is associated with a loss of patient confidence in care quality and decreased adherence.[26] Also, primary care physicians acknowledge that information exchange is lacking when their patients are discharged, and that improving this aspect of a patient's care transition is important.[20] Research into discharge summaries as a tool to fill the communication gap has noted some success, yet there remains uncertainty regarding the type of information that should be included in a discharge summary, the time frame in which primary care physicians actually receive the summaries, and the accuracy of the information provided.[20, 27]
Our use of population‐based administrative data sources make the findings of our research generalizable to other similarly designed healthcare systems where a primary care physician may visit their hospitalized patients in a supportive‐care role. We were interested in a complex patientphysician interaction with a number of potential confounding factors, and our use of a composite measure represents the broad outcomes from this contact. Our cohort methodology was designed to isolate the exposure of interest while maximizing uniformity between the 2 study groups on other characteristics. Additionally a number of potential confounding factors were considered in an effort to isolate the effect of the primary care physician in‐hospital visit such as age, comorbid disease, and risk of hospital readmission.[12] The findings of our work support that of earlier research, but on a broader and more generalizable scale.[12]
There were notable differences between the intervention and control patient populations in the proportion of patients from rural regions who receive a supportive visit. This may be due to systemic differences between rural and nonrural regions with regard to access to care and ease of visit by primary care physicians. Alternatively, observed differences may be due to limitations of our study design in that some rural environments rely on primary care physicians to be involved in hospital care for the region. As such, they may actually be visiting their patients in a manner that was not captured as a supportive‐care visit. This is an important area that should be pursued in the future.
We acknowledge there are limits to our research findings. First, the nature of administrative data introduces challenges to causal inferences. As such, we are careful to describe associations and not draw causative links as there may be additional variables influencing outcomes including the patientphysician relationship, the location of the hospital relative to the physician practice and/or home, the time of the primary care physician visit, primary care physician hospital privileges for supportive‐care visits, and the number of other patients the primary care physician had in the same hospital at the same time. A second limitation is the use of the selected outcomes, which may not be direct measures of care quality.[28] However, the selected outcomes have been shown to be good quality measures in other work relevant to health policy.[8, 20, 21, 29] Third, the use of a composite outcome may over‐ or underestimate an exposure's impact.[19] Our composite outcome might have been dominated by some of its components. These observations may reflect the reality of primary care physicians visiting their sicker patients, or may be an attribute of the relatively short length of follow‐up of the study design. Fourth, we cannot determine whether there were additional interventions in place that assisted the continuity of care for primary care physician visits.[20, 27] However, this research included a broad range of hospitals throughout a large province where there were no system‐level quality interventions applied during this time. Fifth, our readmission rate may appear lower than other studies. However, our analysis is population based and not limited in focus to seniors.[30] As well, our posthospitalization death rates are similar to others, and the readmission rates are comparable to other Canadian studies.[31] Sixth, patients at higher risk for adverse outcomes may be identified as requiring more communication with their primary care physicians and we may not have fully captured this risk in our adjustment models, thereby underestimating the effect of exposure.[27] Further, primary care physicians may be involved in major medical decisions such as transitions to palliative care. A supportive‐care visit that facilitated these transitions and its ensuing outcomes may not have been included in our analysis. Seventh, our inherent assumption is that more care, such as posthospital primary care visits and home visits, denotes better care. This may not always be the case.[32] Eighth, physicians may find it difficult to visit their patient in the hospital, even when asked.[12] Finally, our findings are contingent on a system that supports primary care physicians being aware of their patients who become hospitalized. This is not only incumbent on any individual (eg, hospitalist) but a system where all providers work cohesively and seamlessly. On balance, however, these limitations do not overshadow our study's findings and conclusions.
Visits by primary care physicians to hospitalized patients are a longstanding tradition. The practice likely varies according to regional, patient, and individual physician characteristics.[16, 17, 18, 25] However, reimbursement codes for these services are present in a number of international healthcare systems' physician fee schedules with fairly modest remuneration amounts. The fairly nominal fee of less than $20 CND for a supportive‐care visit is similar to other systems and does not constitute a strong financial incentive to encourage this practice. The fee likely compensates the primary care physician for some of their time but comes with an opportunity cost to other aspects of their practice. Thus, results may differ in other environments or if the fee were higher, thereby incenting more primary care physicians to conduct visits. Indeed, the entire program for supportive hospital visits cost approximately $2.5 million CND per year for the 13 million people in the province of Ontario. Future work in this area could address the overall value and cost‐effectiveness of any potential fee changes. Still, it highlights the generalizability of our findings to other health systems and the ease in assessing the effect of the practice.
Overall, our findings underscore the importance and relevance for the practice of supportive‐care visits in its association with patient outcomes and health services utilization, which may prove to be an important key factor to improve quality healthcare. Our results suggest that an in‐hospital visit by a primary care physician may improve patient outcomes and increase subsequent support in the community. An in‐hospital supportive visit may be an additional method by which primary care physicians, and healthcare systems as a whole, strive to achieve the best care for patients.
Acknowledgements
Michael Manno, an analyst with the Institute of Clinical Evaluative Sciences (ICES) at the time of this study, assisted with the analyses.
Disclosures: This study was supported by the Institute for Clinical Evaluative Sciences (ICES), which is funded by an annual grant from the Ontario Ministry of Health and Long‐Term Care (MOHLTC). The opinions, results, and conclusions reported in this article are those of the authors and are independent from the funding sources. No endorsement by the ICES or the Ontario MOHLTC is intended or should be inferred. No researcher or persons involved in this study had any declared or otherwise known conflicts of interest. Stacey Brener received funding from a Canadian Institutes of Health Research (CIHR) Master's award in the area of primary care; the Ontario Graduate Student in Science and Technology award, an award from the CIHR Women's College Hospital Interdisciplinary Capacity Enhancement Team, and team grant OTG‐88591 from the CIHR. Susan Bronskill is supported by a CIHR New Investigator Award in the Area of Aging. Chaim Bell is supported by a CIHR/Canadian Patient Safety Institute Chair in Patient Safety and Continuity of Care. These funding agencies had no role in the design and conduct of the study; collection, management, analysis, or interpretation of the data; or preparation, review, or approval of the manuscript. The corresponding author had full access to all of the data in the study and takes responsibility for the integrity of the data and the accuracy of the data analysis. The authors report no conflicts of interest.
- , , , . Continuity of care and patient outcomes after hospital discharge. J Gen Intern Med. 2004;19(6):624–631.
- , , , et al. Incidence of adverse events and negligence in hospitalized patients: results of the Harvard Medical Practice Study I. 1991. Qual Saf Health Care. 2004;13(2):145–151; discussion 51–52.
- , , , , . The incidence and severity of adverse events affecting patients after discharge from the hospital. Ann Intern Med. 2003;138(3):161–167.
- The College of Family Physicians of Canada. Family physicians caring for hospital inpatients. Available at: http://www.cfpc.ca/uploadedFiles/Resources/Resource_Items/FPs20Inpt20Hosp20Care_En.pdf. Published October 2003. Accessed August 15, 2015.
- , , . Is volume related to outcome in health care?. A systematic review and methodologic critique of the literature. Ann Intern Med. 2002;137(6):511–520.
- , , , , , . Outcomes of care by hospitalists, general internists, and family physicians. N Engl J Med. 2007;357(25):2589–2600.
- , , , . Maintaining continuity of care: a look at the quality of communication between Ontario emergency departments and community physicians. CJEM. 2005;7(3):155–161.
- , , , et al. The independent association of provider and information continuity on outcomes after hospital discharge: implications for hospitalists. J Hosp Med. 2010;5(7):398–405.
- , , , , , . Patient‐reported care coordination: associations with primary care continuity and specialty care use. Ann Fam Med. 2011;9(4):323–329.
- , . The Wellness Planner: empowerment, quality of life, and continuity of care in mental illness. Arch Psychiatr Nurs. 2011;25(4):284–293.
- , , , et al. Evaluation of the impact of interdisciplinarity in cancer care. BMC Health Serv Res. 2011;11:144.
- , , , , . Can GP input into discharge planning result in better outcomes for the frail aged: results from a randomized controlled trial. Fam Pract. 1999;16(3):289–293.
- , , , et al. Association of ICU or hospital admission with unintentional discontinuation of medications for chronic diseases. JAMA. 2011;306(8):840–847.
- , , , , , . Potentially unintended discontinuation of long‐term medication use after elective surgical procedures. Arch Intern Med. 2006;166(22):2525–2531.
- , , , , , , . Canadian Institute for Health Information Discharge Abstract Database: A Validation Study. Toronto: Institute for Clinical Evaluative Sciences; 2006. Available at: http://www.ices.on.ca/Publications/Atlases‐and‐Reports/2006/Canadian‐Institute‐for‐Health‐Information. Accessed August 15, 2015.
- , , , . Primary care physician workforce and Medicare beneficiaries' health outcomes. JAMA. 2011;305(20):2096–2104.
- , , , . Assigning ambulatory patients and their physicians to hospitals: a method for obtaining population‐based provider performance measurements. Health Serv Res. 2007;42(1 pt 1):45–62.
- , , , , , . Administrative data algorithms can describe ambulatory physician utilization. Health Serv Res. 2007;42(4):1783–1796.
- , , , et al. Validity of composite end points in clinical trials. BMJ. 2005;330(7491):594–596.
- , , , , , . Deficits in communication and information transfer between hospital‐based and primary care physicians: implications for patient safety and continuity of care. JAMA. 2007;297(8):831–841.
- , , , , , . Predicting readmission to the psychiatric hospital in a managed care environment: implications for quality indicators. Am J Psychiatry. 1997;154(3):337–340.
- , . The validity of readmission rate as a marker of the quality of hospital care, and a recommendation for its definition. N Z Med J. 2009;122(1289):63–70.
- , , , et al. Derivation and validation of an index to predict early death or unplanned readmission after discharge from hospital to the community. CMAJ. 2010;182(6):551–557.
- , , , et al. Information exchange among physicians caring for the same patient in the community. CMAJ. 2008;179(10):1013–1018.
- . Supply of physicians' services in Ontario. Hosp Q. 1999;3(2):17.
- , , , , . Evaluation of outreach clinics held by specialists in general practice in England. J Epidemiol Community Health. 2000;54(2):149–156.
- , , , et al. Association of communication between hospital‐based physicians and primary care providers with patient outcomes. J Gen Intern Med. 2009;24(3):381–386.
- , , , et al. Relationship between hospital readmission and mortality rates for patients hospitalized with acute myocardial infarction, heart failure, or pneumonia. JAMA. 2013;309(6):587–593.
- , . A conceptual framework for the study of early readmission as an indicator of quality of care. Soc Sci Med. 1996;43(11):1533–1541.
- , , . Rehospitalizations among patients in the Medicare fee‐for‐service program. N Engl J Med. 2009;360(14):1418–1428.
- , , , et al. Effect of a postdischarge virtual ward on readmission or death for high‐risk patients: a randomized clinical trial. JAMA. 2014;312(13):1305–1312.
- , . Less is more: how less health care can result in better health. Arch Intern Med. 2010;170(9):749–750.
Transitions in care are vulnerable periods. As patients are transferred between settings of care (such as from hospital back to the community), communication between healthcare providers is vital for care continuity.[1] A significant number of preventable adverse events may be related to ineffective communication between care providers.[1, 2, 3] The advent of specialized care, such as the introduction of hospitalists in acute care settings, has created an environment in which a patient's most responsible physician can often change multiple times as they move through the healthcare system.[4] Although there are many benefits to this type of concentrated care, the increase in care transitions may result in breakdowns in communication that may then be linked to risks in patient safety and suboptimal patient outcomes.[5, 6, 7, 8]
Improved continuity of care has been demonstrated to enhance patient safety during care transitions.[7] Efforts to develop continuity of care interventions are largely focused on care‐provider continuity, improved facilitation of communication, care planning, and increasing involvement of primary care physicians during follow‐up to hospitalizations and specialist visits.[9, 10] Such continuity of care efforts may provide a moderate benefit, but there remains room for improvement.[10, 11]
One dimension of continuity of care that has received limited attention is the potential impact of primary care physicians hospital visits to their hospitalized patients in a supportive‐care role.[12] In these situations, the primary care physician is neither the most responsible physician nor are they involved directly in their patient's hospital care. However, visiting their patient implies that they are aware of the hospitalization, thereby facilitating the potential for communication between care providers. Primary care physicians can also provide valuable contextual and relevant information as well as be involved in the discharge process. To identify the extent to which primary care physicians visit hospitalized patients and to measure the potential impact of primary care physician supportive visits on future outcomes, we used population‐level data to determine the frequency of supportive‐care visits by primary care physicians to hospitalized patients and to identify the association between these visits, patient outcomes, and health services utilization.
METHODS
Overview
We applied a retrospective cohort design utilizing linked population‐based administrative databases in the province of Ontario, Canada to examine outcome differences between patients who received a supportive‐care in‐hospital visit by their primary care physician compared to those who did not.
Databases
We assembled the cohort from linked and encrypted population‐based healthcare administrative databases. Data were derived from information on patients and physicians from the Ontario Health Insurance Plan, the Canadian Census, the Canadian Institute of Health Information Hospital Discharge Abstract Database, Registered Persons Databases, National Ambulatory Care Reporting System, Corporate Provider Database, Client Agency Program Enrolment, and Home Care Database. These databases have been validated and widely used in numerous studies.[13, 14, 15] All adults aged18 years who were discharged from the hospital in Ontario, Canada between January 1, 2008 and December 31, 2009 were included. Patients transferred to nursing homes or other acute care facilities following discharge, including rehabilitation centers, were excluded because they may have different readmission patterns. Among remaining hospitalized patients, only those with an identifiable primary care physician in the community were included. The patientprimary care physician pairings were identified using validated algorithms based on historical physician billing information.[16] This approach, adapted from previous studies, maximized the comparability among the study groups.[17, 18] In addition to having an historical relationship with the patients, primary care physicians had to have a history of conducting in‐hospital supportive visits (i.e., visits to at least 2 hospital patients within the previous year) for the patientprimary care physician pair to be included. This criterion was included to increase the likelihood that we were capturing a usual physician practice behavior and not a single circumstantial visit by a primary care physician. The history of supportive visits was also identified with physician billing data using a specific fee code.
Exposure
The exposure of interest was an in‐hospital visit in a supportive‐care role by the primary care physician during a patient's hospitalization and was obtained from physician fee codes. The fee paid for a visit during the study period was less than $20 CND.
Outcome Measures
Two different composite outcome measures were examined. The primary outcome was a composite of an emergent hospital readmission, death, or emergency department visit (without hospital admission). A composite measure was utilized to account for all outcomes simultaneously and thus be representative of the overall patient experience.[19] This approach has been applied in several studies examining continuity of care.[19, 20, 21] The secondary outcome examined processes of care. It was a composite evaluating ambulatory health services use postdischarge, specifically the number of primary care physician office visits and formal (ie, paid for by the universal provincial health plan) home‐care services. Home‐care services included both visits for nursing care as well as formal social support such as personal care. All outcome measures were assessed at 30 and 90 days following hospital discharge to assess for short and medium range outcomes.[22]
Patient Characteristics
Patient demographics including age, sex, low income (defined as individual income below $16,018 [CND] or couples income below $24,175 [CND]), living in a rural region, and the number of previous visits with primary care physicians were described from the available data. Readmission risk from the initial hospitalization was calculated based on the LACE score.[23] The LACE score is a validated measure of 30‐day readmission risk based on healthcare administrative data that account for (L) length of stay, (A) acute admission, (C) comorbid disease burden, and number of (E) emergency department visits in previous 6 months.[23] The LACE score ranges from 0 to 19, which correspond to a probability of readmissions of 2% to 43.7%, respectively. We considered individuals to have a high risk of readmission with a LACE score 10, which corresponds to a probability of readmission of 12.2%.[23]
Statistical Analyses
Descriptive statistics were used to compare patient characteristics among those with a primary care physician supportive‐care visit to those without. Logistic regression modeling was conducted to examine the impact of primary care physician visits on outcomes. The results reported here reflect the selection of adjusting for the confounders of age, sex, a history of primary care physician visits, low income, rurality, and the LACE score.
Ethics
The project analysis was conducted at the Institute for Clinical Evaluative Sciences (ICES) in Toronto, Ontario and was approved by the Sunnybrook Health Sciences Centre Research Ethics Board.
RESULTS
Overview
There were 11,316 primary care physicians identified as practicing in Ontario during the study period, of which 3236 had a history of conducting regular in‐hospital visits to 2 or more patients. The final patient cohort consisted of 164,059 hospitalized patients; 19,614 patients received a visit from their primary care physician, whereas 144,445 did not (Figure 1).
The hospitalized patients who received a visit from their primary care physician were significantly different than the patients who did not receive an in‐hospital visit (Table 1). Notably, patients who received a visit by their primary care physician had longer lengths of hospital stay (9.7 days vs 6.8 days, P<0.001). As well, a greater proportion had a high 30‐day readmission risk (LACE score10: 39.4% vs 29.9%, P<0.001) (Table 1).[21]
| Variablea | With PCP Visit (N=19,614) | Without PCP Visit (N=144,445) |
|---|---|---|
| ||
| Age, meanSD | 68.3716.85 | 65.7318.54 |
| Sex, no. of males | 9,393 (47.9%) | 67,030 (46.4%) |
| Low income | 3,937 (20.1%) | 30,157 (20.9%) |
| Individuals living in rural regions, no. | 1,951 (9.9%) | 25,731 (17.8%) |
| PCP visits in previous 6 months, meanSD | 4.764.47 | 4.174.28 |
| Length of stay, d, meanSD | 9.7217.40 | 6.7913.17 |
| Acute emergent visits, no. | 19,138 (97.6%) | 136,374 (94.4%) |
| Charlson score, meanSD | 1.061.60 | 0.921.49 |
| ED visits in previous 6 months, meanSD | 0.951.48 | 1.091.98 |
| LACE score, meanSDc | 9.022.88 | 8.103.02 |
| High risk for readmission (LACE score10), no. (%)c | 7,721 (39.4%) | 43,126 (29.9%) |
Patients who received an in‐hospital visit by their primary care physician were significantly different from those who did not (Table 2). They were older (68.4 years vs 65.7 years), and had a higher risk of readmission (LACE score of 9 vs 8). As well, proportionally fewer patients who received a visit were from rural regions than in the comparator group (9.9% of patients visited were from rural regions vs 17.8% of patients who did not receive a visit) (Table 2).
| Variable | Patients Who Received an In‐hospital Visit (N=19,614) | Patients Who Did Not Receive an In‐hospital Visit (N=144,445) | P Value |
|---|---|---|---|
| |||
| Primary outcome of emergency department visit, hospital readmission, or death | |||
| 30 days postdischarge, no. (%) | |||
| Readmission | 1,742 (8.9%) | 11,212 (7.8%) | <0.001 |
| ED visit | 2,039 (10.4%) | 16,823 (11.6%) | <0.001 |
| Death | 727 (3.7%) | 4,688 (3.2%) | <0.001 |
| Composite endpointa | 4,227 (21.6%) | 30,848 (21.4%) | 0.533 |
| 90 days postdischarge | |||
| Readmission | 2,791 (14.2%) | 18,257 (12.6%) | <0.001 |
| ED visit | 3,652 (18.6%) | 29,590 (20.5%) | <0.001 |
| Death | 1,507 (7.7%) | 9,821 (6.8%) | <0.001 |
| Composite endpointa | 7,125 (36.3%) | 52,245 (36.2%) | 0.668 |
| Secondary outcome of PCP office visits and home‐care services | |||
| 30 days postdischarge | |||
| Community PCP visits, meanSD | 3.85.1 | 3.14.6 | <0.001 |
| PCP visit, no. (%) | 15,732 (80.2%) | 108,266 (75%) | <0.001 |
| Home‐care services, no. (%) | 6,197 (31.6%) | 38,745 (26.8%) | <0.001 |
| Composite endpoint, no. (%)b | 16,851 (85.9%) | 117, 290 (81.2%) | <0.001 |
| 90 days postdischarge | |||
| Community PCP visits, meanSD | 8.210.1 | 6.99.3 | <0.001 |
| PCP visit, no. (%) | 18,112 (92.3%) | 128, 806 (89.2%) | <0.001 |
| Home‐care services, no. (%) | 7,256 (37.0%) | 45,675 (31.6%) | <0.001 |
| Composite endpoint, no. (%)b | 18, 504 (94.3%) | 132, 448 (91.7%) | <0.001 |
Individual Outcomes
Patients who received an in‐hospital visit by their primary care physician were also more likely to be readmitted within 30 days of discharge (8.9% vs 7.8%, P<0.001) and within 90 days of discharge (14.2% vs 12.6%, P<0.001). Additionally, patients who were visited by their primary care physician while hospitalized were more likely to die within 30 days postdischarge than those who did not receive an in‐hospital visit (3.7% vs 3.2%, P<0.001) and similarly by 90 days postdischarge (7.7% vs 6.8%, P<0.001) (Table 2).
Patients who received an in‐hospital visit were less likely to visit the emergency department at 30 days (10.4% vs 11.6%, P<0.001) and at 90 days (18.6% vs 20.5%, P<0.001) compared to patients who did not receive an in‐hospital visit (Table 2).
The patients who received in‐hospital visits by their primary care physician had a greater average number of primary care physician visits in the community at 30 days (3.8 vs 3.1, P<0.001) and 90 days (8.2 vs 6.9, P<0.001) (Table 2). Additionally, a higher proportion of patients who received an in‐hospital visit accessed home‐care services at 30 days postdischarge (31.6% vs 26.8%, P<0.001) and 90 days postdischarge (37.0% vs 31.6%, P<0.001) (Table 2).
Primary Outcome
There was no difference in proportion of patients who experienced the composite endpoint at 30 days (4227 [21.6%] vs 30,848 [21.4%], P>0.5) or 90 days (7125 [36.3%] vs 52,245 [36.2%], P>0.6) for patients who received an in‐hospital visit by their primary care physician compared to those who did not. The unadjusted model found no statistically significant difference between the 2 groups upon a primary care physician visit (odds ratio [OR]: 1.01; 95% confidence interval [CI]: 0.98‐1.04). However, once adjusting for differences in the groups for patient factors such as age, sex, location and health status, patients who received an in‐hospital visit by their primary care physician had lower adjusted risk for the composite outcome at 30 days postdischarge (adjusted OR [aOR]: 0.92; 95% CI: 0.89‐0.96) and 90 days postdischarge (aOR: 0.90; 95% CI: 0.87‐0.92) (Table 3). Estimates for each individual component of the composite outcome revealed significantly lower risk for ED visit and death but similar risk for readmission at both 30 days and 90 days after hospital discharge for patients who received and in‐hospital visit from their primary care physician and those who did not (Table 3).
| Variable | Unadjusted Odds Ratio (95% CI) | Adjusted Odds Ratio (95% CI)a |
|---|---|---|
| ||
| Primary outcome of emergency department visit, hospital readmission, or death | ||
| 30 days postdischarge | ||
| Readmission | 1.16 (1.10‐1.22) | 1.03 (0.97‐1.08) |
| ED visit | 0.88 (0.84‐0.92) | 0.88 (0.84‐0.92) |
| Death | 1.15 (1.06‐1.24) | 0.88 (0.81‐0.96) |
| Composite endpointb | 1.01 (0.98‐1.05) | 0.92 (0.89‐0.96) |
| 90 days postdischarge | ||
| Readmission | 1.15 (1.10‐1.20) | 1.00 (0.96‐1.04) |
| ED visit | 0.89 (0.86‐0.92) | 0.89 (0.86‐0.93) |
| Death | 1.14 (1.08‐1.21) | 0.87 (0.82‐0.93) |
| Composite endpointb | 1.01 (0.98‐1.04) | 0.90 (0.87‐0.92) |
| Secondary outcome of PCP office visits and home‐care services | ||
| 30 days postdischarge | ||
| Community PCP visits | 1.35 (1.31‐1.41) | 1.21 (1.16‐1.25) |
| Home‐care services | 1.26 (1.22‐1.30) | 1.05 (1.01‐1.09) |
| Composite endpointc | 1.41 (1.34‐1.47) | 1.16 (1.11‐1.21) |
| 90 days postdischarge | ||
| Community PCP visits | 1.46 (1.39‐1.55) | 1.25 (1.18‐1.33) |
| Home‐care services | 1.27 (1.23‐1.31) | 1.05 (1.01‐1.08) |
| Composite endpointc | 1.51 (1.42‐1.61) | 1.19 (1.12‐1.27) |
Secondary Outcome
Patients who received an in‐hospital visit by their primary care physician were more likely to experience the composite outcome of home‐care services and community primary care physician visits at 30 postdischarge (16,851 [85.9%] vs 117,290 [81.2%], P<0.001) and 90 days postdischarge (18,504 [94.3%] vs 132,448 [91.7%], P<0.001) compared to patients who did not receive an in‐hospital visit (Table 3). Once accounting for patient variables such as age, sex, location, and health status, patients who received an in‐hospital visit by their primary care physician had a higher adjusted risk for the composite outcome at 30 days postdischarge (aOR: 1.16; 95% CI: 1.11‐1.21) and 90 days postdischarge (aOR: 1.19; 95% CI: 1.12‐1.27) (Table 3).
DISCUSSION
Our population‐based study of primary care physicians is among the first to examine outcomes of patients whose primary care physicians have a history of providing supportive visits to hospitalized patients. After controlling for risk differences in patients at hospital discharge, we found that a primary care physician visit to a patient in the hospital was associated with a lower adjusted risk for the composite outcome of death, emergent hospital readmission, or emergency department visit at 30 and 90 days postdischarge compared to hospitalized patients who did not receive a visit by their primary care physician. We found this to be driven by patients having a lower risk of emergency department visits and death, whereas there was a similar risk of hospital readmission. We also found that visited patients were more likely to access home‐care services and have more primary care physician visits in the community following discharge.
The unadjusted model differs substantially from the adjusted model. On the surface this is an apparent paradox where the unadjusted results suggest an association with potential harm or no difference with a supportive visit. Conversely, the adjusted model suggests a reduction in harms. The differences between the unadjusted and adjusted model is driven by changes in the point estimates for readmission and death rates at both 30 and 90 day postdischarge. Prior to adjustment, it appears as if a primary care physician visit is associated with a significant increase of death; however, upon adjustment, it is associated with a significant reduction in death. Interestingly, this is a different effect than that observed with the secondary analysis, where the adjusted analyses demonstrate a more modest (but still positive) effect of supportive‐care visits. This observed change is likely due to differences in the patient groups. We can speculate that this may be an observed phenomenon of primary care physicians opting to visit their sicker patients, as perhaps it should be; however, further research is required to fully understand the real drivers of a supportive visit.
Our results are consistent with an earlier study that identified that a minority number of primary care physicians visit their hospitalized patients.[24] As well, findings from a randomized controlled trial of 364 patients over 60 years old identified a limited impact of primary care physician visits on patient outcomes but noted enhanced access to community health services.[12] Our work highlights the potential impact of primary care physician visits, which could, in theory, be leveraged and be an important role that primary care physicians can play in planning postdischarge care and improving the quality of care following hospitalization.
Our research study did not examine the impact of in‐hospital primary care physician visits on patient satisfaction directly. However, it has been demonstrated that patients have a strong desire for their primary care physician to be involved in their hospital care and their preference is for direct contact, with face‐to‐face visits compared to telephone or other communication.[25] This choice is important because dissatisfaction with services is associated with a loss of patient confidence in care quality and decreased adherence.[26] Also, primary care physicians acknowledge that information exchange is lacking when their patients are discharged, and that improving this aspect of a patient's care transition is important.[20] Research into discharge summaries as a tool to fill the communication gap has noted some success, yet there remains uncertainty regarding the type of information that should be included in a discharge summary, the time frame in which primary care physicians actually receive the summaries, and the accuracy of the information provided.[20, 27]
Our use of population‐based administrative data sources make the findings of our research generalizable to other similarly designed healthcare systems where a primary care physician may visit their hospitalized patients in a supportive‐care role. We were interested in a complex patientphysician interaction with a number of potential confounding factors, and our use of a composite measure represents the broad outcomes from this contact. Our cohort methodology was designed to isolate the exposure of interest while maximizing uniformity between the 2 study groups on other characteristics. Additionally a number of potential confounding factors were considered in an effort to isolate the effect of the primary care physician in‐hospital visit such as age, comorbid disease, and risk of hospital readmission.[12] The findings of our work support that of earlier research, but on a broader and more generalizable scale.[12]
There were notable differences between the intervention and control patient populations in the proportion of patients from rural regions who receive a supportive visit. This may be due to systemic differences between rural and nonrural regions with regard to access to care and ease of visit by primary care physicians. Alternatively, observed differences may be due to limitations of our study design in that some rural environments rely on primary care physicians to be involved in hospital care for the region. As such, they may actually be visiting their patients in a manner that was not captured as a supportive‐care visit. This is an important area that should be pursued in the future.
We acknowledge there are limits to our research findings. First, the nature of administrative data introduces challenges to causal inferences. As such, we are careful to describe associations and not draw causative links as there may be additional variables influencing outcomes including the patientphysician relationship, the location of the hospital relative to the physician practice and/or home, the time of the primary care physician visit, primary care physician hospital privileges for supportive‐care visits, and the number of other patients the primary care physician had in the same hospital at the same time. A second limitation is the use of the selected outcomes, which may not be direct measures of care quality.[28] However, the selected outcomes have been shown to be good quality measures in other work relevant to health policy.[8, 20, 21, 29] Third, the use of a composite outcome may over‐ or underestimate an exposure's impact.[19] Our composite outcome might have been dominated by some of its components. These observations may reflect the reality of primary care physicians visiting their sicker patients, or may be an attribute of the relatively short length of follow‐up of the study design. Fourth, we cannot determine whether there were additional interventions in place that assisted the continuity of care for primary care physician visits.[20, 27] However, this research included a broad range of hospitals throughout a large province where there were no system‐level quality interventions applied during this time. Fifth, our readmission rate may appear lower than other studies. However, our analysis is population based and not limited in focus to seniors.[30] As well, our posthospitalization death rates are similar to others, and the readmission rates are comparable to other Canadian studies.[31] Sixth, patients at higher risk for adverse outcomes may be identified as requiring more communication with their primary care physicians and we may not have fully captured this risk in our adjustment models, thereby underestimating the effect of exposure.[27] Further, primary care physicians may be involved in major medical decisions such as transitions to palliative care. A supportive‐care visit that facilitated these transitions and its ensuing outcomes may not have been included in our analysis. Seventh, our inherent assumption is that more care, such as posthospital primary care visits and home visits, denotes better care. This may not always be the case.[32] Eighth, physicians may find it difficult to visit their patient in the hospital, even when asked.[12] Finally, our findings are contingent on a system that supports primary care physicians being aware of their patients who become hospitalized. This is not only incumbent on any individual (eg, hospitalist) but a system where all providers work cohesively and seamlessly. On balance, however, these limitations do not overshadow our study's findings and conclusions.
Visits by primary care physicians to hospitalized patients are a longstanding tradition. The practice likely varies according to regional, patient, and individual physician characteristics.[16, 17, 18, 25] However, reimbursement codes for these services are present in a number of international healthcare systems' physician fee schedules with fairly modest remuneration amounts. The fairly nominal fee of less than $20 CND for a supportive‐care visit is similar to other systems and does not constitute a strong financial incentive to encourage this practice. The fee likely compensates the primary care physician for some of their time but comes with an opportunity cost to other aspects of their practice. Thus, results may differ in other environments or if the fee were higher, thereby incenting more primary care physicians to conduct visits. Indeed, the entire program for supportive hospital visits cost approximately $2.5 million CND per year for the 13 million people in the province of Ontario. Future work in this area could address the overall value and cost‐effectiveness of any potential fee changes. Still, it highlights the generalizability of our findings to other health systems and the ease in assessing the effect of the practice.
Overall, our findings underscore the importance and relevance for the practice of supportive‐care visits in its association with patient outcomes and health services utilization, which may prove to be an important key factor to improve quality healthcare. Our results suggest that an in‐hospital visit by a primary care physician may improve patient outcomes and increase subsequent support in the community. An in‐hospital supportive visit may be an additional method by which primary care physicians, and healthcare systems as a whole, strive to achieve the best care for patients.
Acknowledgements
Michael Manno, an analyst with the Institute of Clinical Evaluative Sciences (ICES) at the time of this study, assisted with the analyses.
Disclosures: This study was supported by the Institute for Clinical Evaluative Sciences (ICES), which is funded by an annual grant from the Ontario Ministry of Health and Long‐Term Care (MOHLTC). The opinions, results, and conclusions reported in this article are those of the authors and are independent from the funding sources. No endorsement by the ICES or the Ontario MOHLTC is intended or should be inferred. No researcher or persons involved in this study had any declared or otherwise known conflicts of interest. Stacey Brener received funding from a Canadian Institutes of Health Research (CIHR) Master's award in the area of primary care; the Ontario Graduate Student in Science and Technology award, an award from the CIHR Women's College Hospital Interdisciplinary Capacity Enhancement Team, and team grant OTG‐88591 from the CIHR. Susan Bronskill is supported by a CIHR New Investigator Award in the Area of Aging. Chaim Bell is supported by a CIHR/Canadian Patient Safety Institute Chair in Patient Safety and Continuity of Care. These funding agencies had no role in the design and conduct of the study; collection, management, analysis, or interpretation of the data; or preparation, review, or approval of the manuscript. The corresponding author had full access to all of the data in the study and takes responsibility for the integrity of the data and the accuracy of the data analysis. The authors report no conflicts of interest.
- , , , . Continuity of care and patient outcomes after hospital discharge. J Gen Intern Med. 2004;19(6):624–631.
- , , , et al. Incidence of adverse events and negligence in hospitalized patients: results of the Harvard Medical Practice Study I. 1991. Qual Saf Health Care. 2004;13(2):145–151; discussion 51–52.
- , , , , . The incidence and severity of adverse events affecting patients after discharge from the hospital. Ann Intern Med. 2003;138(3):161–167.
- The College of Family Physicians of Canada. Family physicians caring for hospital inpatients. Available at: http://www.cfpc.ca/uploadedFiles/Resources/Resource_Items/FPs20Inpt20Hosp20Care_En.pdf. Published October 2003. Accessed August 15, 2015.
- , , . Is volume related to outcome in health care?. A systematic review and methodologic critique of the literature. Ann Intern Med. 2002;137(6):511–520.
- , , , , , . Outcomes of care by hospitalists, general internists, and family physicians. N Engl J Med. 2007;357(25):2589–2600.
- , , , . Maintaining continuity of care: a look at the quality of communication between Ontario emergency departments and community physicians. CJEM. 2005;7(3):155–161.
- , , , et al. The independent association of provider and information continuity on outcomes after hospital discharge: implications for hospitalists. J Hosp Med. 2010;5(7):398–405.
- , , , , , . Patient‐reported care coordination: associations with primary care continuity and specialty care use. Ann Fam Med. 2011;9(4):323–329.
- , . The Wellness Planner: empowerment, quality of life, and continuity of care in mental illness. Arch Psychiatr Nurs. 2011;25(4):284–293.
- , , , et al. Evaluation of the impact of interdisciplinarity in cancer care. BMC Health Serv Res. 2011;11:144.
- , , , , . Can GP input into discharge planning result in better outcomes for the frail aged: results from a randomized controlled trial. Fam Pract. 1999;16(3):289–293.
- , , , et al. Association of ICU or hospital admission with unintentional discontinuation of medications for chronic diseases. JAMA. 2011;306(8):840–847.
- , , , , , . Potentially unintended discontinuation of long‐term medication use after elective surgical procedures. Arch Intern Med. 2006;166(22):2525–2531.
- , , , , , , . Canadian Institute for Health Information Discharge Abstract Database: A Validation Study. Toronto: Institute for Clinical Evaluative Sciences; 2006. Available at: http://www.ices.on.ca/Publications/Atlases‐and‐Reports/2006/Canadian‐Institute‐for‐Health‐Information. Accessed August 15, 2015.
- , , , . Primary care physician workforce and Medicare beneficiaries' health outcomes. JAMA. 2011;305(20):2096–2104.
- , , , . Assigning ambulatory patients and their physicians to hospitals: a method for obtaining population‐based provider performance measurements. Health Serv Res. 2007;42(1 pt 1):45–62.
- , , , , , . Administrative data algorithms can describe ambulatory physician utilization. Health Serv Res. 2007;42(4):1783–1796.
- , , , et al. Validity of composite end points in clinical trials. BMJ. 2005;330(7491):594–596.
- , , , , , . Deficits in communication and information transfer between hospital‐based and primary care physicians: implications for patient safety and continuity of care. JAMA. 2007;297(8):831–841.
- , , , , , . Predicting readmission to the psychiatric hospital in a managed care environment: implications for quality indicators. Am J Psychiatry. 1997;154(3):337–340.
- , . The validity of readmission rate as a marker of the quality of hospital care, and a recommendation for its definition. N Z Med J. 2009;122(1289):63–70.
- , , , et al. Derivation and validation of an index to predict early death or unplanned readmission after discharge from hospital to the community. CMAJ. 2010;182(6):551–557.
- , , , et al. Information exchange among physicians caring for the same patient in the community. CMAJ. 2008;179(10):1013–1018.
- . Supply of physicians' services in Ontario. Hosp Q. 1999;3(2):17.
- , , , , . Evaluation of outreach clinics held by specialists in general practice in England. J Epidemiol Community Health. 2000;54(2):149–156.
- , , , et al. Association of communication between hospital‐based physicians and primary care providers with patient outcomes. J Gen Intern Med. 2009;24(3):381–386.
- , , , et al. Relationship between hospital readmission and mortality rates for patients hospitalized with acute myocardial infarction, heart failure, or pneumonia. JAMA. 2013;309(6):587–593.
- , . A conceptual framework for the study of early readmission as an indicator of quality of care. Soc Sci Med. 1996;43(11):1533–1541.
- , , . Rehospitalizations among patients in the Medicare fee‐for‐service program. N Engl J Med. 2009;360(14):1418–1428.
- , , , et al. Effect of a postdischarge virtual ward on readmission or death for high‐risk patients: a randomized clinical trial. JAMA. 2014;312(13):1305–1312.
- , . Less is more: how less health care can result in better health. Arch Intern Med. 2010;170(9):749–750.
© 2016 Society of Hospital Medicine
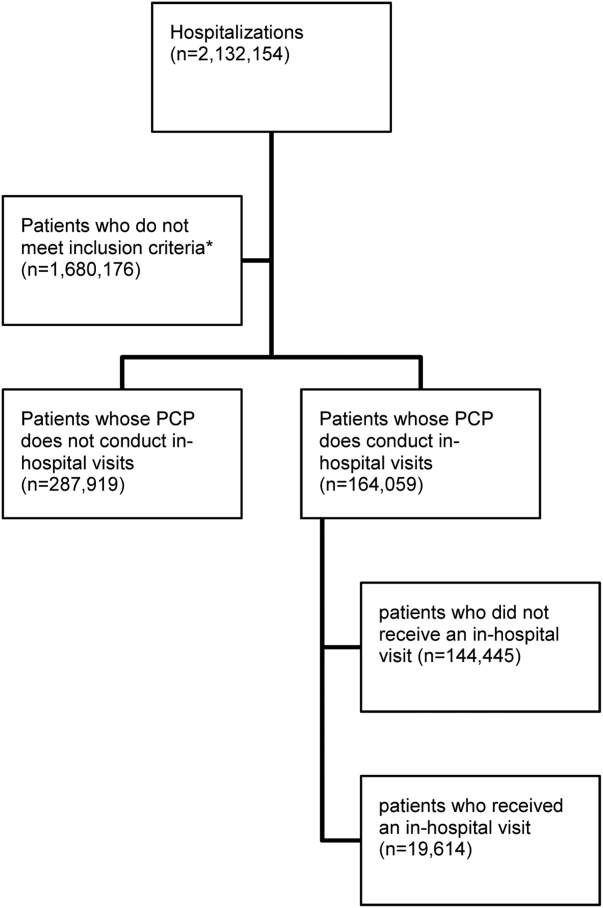
Discharge Summaries and Readmissions
Across the continuum of care, the discharge summary is a critical tool for communication among care providers.[1] In the United States, the Joint Commission policies mandate that all hospital providers complete a discharge summary for patients with specific components to foster effective communication with future providers.[2] Because outpatient providers and emergency physicians rely on clinical information in the discharge summary to ensure appropriate postdischarge continuity of care, timely documentation is potentially an essential aspect of readmission reduction initiatives.[3, 4, 5] Prior reports indicate that poor discharge documentation of follow‐up plan‐of‐care increases the risk of hospitalization, whereas structured instructions, patient education, and direct communications with primary care physicians (PCPs) reduce repeat hospital visits.[6, 7, 8, 9] However, the current literature is limited in its narrow focus on the contents of discharge summaries, considered only same‐hospital readmissions, or considered readmissions within 3 months of discharge.[10, 11, 12, 13] Moreover, some prior research has suggested no association between discharge summary timeliness with readmission,[12, 13, 14] whereas another study did find a relationship,[15] hence the need to study this further is important. Filling this gap in knowledge could provide an avenue to track and improve quality of patient care, as delays in discharge summaries have been linked with pot‐discharge adverse outcomes and patient safety concerns.[15, 16, 17, 18] Because readmissions often occur soon after discharge, having timely discharge summaries may be particularly important to outcomes.[19, 20]
This research began under the framework of evaluating a bundle of care coordination strategies that were implemented at the Johns Hopkins Health System. These strategies were informed by the early Centers for Medicare and Medicaid Services (CMS) demonstration projects and other best practices that have been documented in the literature to improve utilization and improve communication during transitions of care.[21, 22, 23, 24, 25] Later they were augmented through a contract with the Center of Medicare and Medicaid Innovation to improve access to healthcare services and improve patient outcomes through improved care coordination processes. One of the domains our institution has increased efforts to improve is in provider handoffs. Toward that goal, we have worked to disentangle the effects of different factors of provider‐to‐provider communication that may influence readmissions.[26] For example, effective written provider handoffs in the form of accurate and timely discharge summaries was considered a key care coordination component of this program, but there was institutional resistance to endorsing an expectation that discharge summary turnaround should be shortened. To build a case for this concept, we sought to test the hypothesis that, at our hospital, longer time to complete hospital discharge summaries was associated with increased readmission rates. Unique to this analysis is that, in the state of Maryland, there is statewide reporting of readmissions, so we were able to account for intra‐ and interhospital readmissions for an all‐payer population. The authors anticipated that findings from this study would help inform discharge quality‐improvement initiatives and reemphasize the importance of timely discharge documentation across all disciplines as part of quality patient care.
METHODS
Study Population and Setting
We conducted a single‐center, retrospective cohort study of 87,994 consecutive patients discharged from Johns Hopkins Hospital, which is a 1000‐bed, tertiary academic medical center in Baltimore, Maryland between January 1, 2013 and December 31, 2014. One thousand ninety‐three (1.2%) of the records on days to complete the discharge summary were missing and were excluded from the analysis.
Data Source and Covariates
Data were derived from several sources. The Johns Hopkins Hospital data mart financial database, used for mandatory reporting to the State of Maryland, provided the following patient data: age, gender, race/ethnicity, payer (Medicare, Medicaid, and other) as a proxy for socioeconomic status,[27] hospital service prior to discharge (gynecologyobstetrics, medicine, neurosciences, oncology, pediatrics, and surgical sciences), hospital length of stay (LOS) prior to discharge, Agency for Healthcare Research and Quality (AHRQ) Comorbidity Index (which is an update to the original Elixhauser methodology[28]), and all‐payerrefined diagnosis‐related group (APRDRG) and severity of illness (SOI) combinations (a tool to group patients into clinically comparable disease and SOI categories expected to use similar resources and experience similar outcomes). The Health Services Cost Review Commission (HSCRC) in Maryland provided the observed readmission rate in Maryland for each APRDRG‐SOI combination and served as an expected readmission rate. This risk stratification methodology is similar to the approach used in previous studies.[26, 29] Discharge summary turnaround time was obtained from institutional administrative databases used to track compliance with discharge summary completion. Discharge location (home, facility, home with homecare or hospice, or other) was obtained from Curaspan databases (Curaspan Health Group, Inc., Newton, MA).
Primary Outcome: 30‐Day Readmission
The primary outcome was unplanned rehospitalizations to an acute care hospital in Maryland within 30 days of discharge from Johns Hopkins Hospital. This was as defined by the Maryland HSCRC using an algorithm to exclude readmissions that were likely to be scheduled, as defined by the index admission diagnosis and readmission diagnosis; this algorithm is updated based on the CMS all‐cause readmission algorithm.[30, 31]
Primary Exposure: Days to Complete the Discharge Summary
Discharge summary completion time was defined as the date when the discharge attending physician electronically signs the discharge summary. At our institution, an auto‐fax system sends documents (eg, discharge summaries, clinic notes) to linked providers (eg, primary care providers) shortly after midnight from the day the document is signed by an attending physician. During the period of the project, the policy for discharge summaries at the Johns Hopkins Hospital went from requiring them to be completed within 30 days to 14 days, and we were hoping to use our analyses to inform decision makers why this was important. To emphasize the need for timely completion of discharge summaries, we dichotomized the number of days to complete the discharge summary into >3 versus 3 days (20th percentile cutoff) and modeled it as a continuous variable (per 3‐day increase in days to complete the discharge summary).
Statistical Analysis
To evaluate differences in patient characteristics by readmission status, analysis of variance and 2 tests were used for continuous and dichotomous variables, respectively. Logistic regression was used to evaluate the association between days to complete the discharge summary >3 days and readmission status, adjusting for potentially confounding variables. Before inclusion in the logistic regression model, we confirmed a lack of multicollinearity in the multivariable regression model using variance inflation factors. We evaluated residual versus predicted value plots and residual versus fitted value plots with a locally weighted scatterplot smoothing line. In a sensitivity analysis we evaluated the association between readmission status and different cutoffs (>8 days, 50th percentile; and >14 days, 70% percentile). In a separate analysis, we used interaction terms to test whether the association between the association between days to complete the discharge summary >3 days and hospital readmission varied by the covariates in the analysis (age, sex, race, payer, hospital service, discharge location, LOS, APRDRG‐SOI expected readmission rate, and AHRQ Comorbidity Index). We observed a significant interaction between 30‐day readmission and days to complete the discharge summary >3 days by hospital service. Hence, we separately calculated the adjusted mean readmission rates separately for each hospital service using the least squared means method for the multivariable logistic regression analysis and adjusting for the previously mentioned covariates. In a separate analysis, we used linear regression to evaluate the association between LOS and days to complete the discharge summary, adjusting for potentially confounding variables. Statistical significance was defined as a 2‐sided P < 0.05. Data were analyzed with R (version 2.15.0; R Foundation for Statistical Computing, Vienna, Austria;
RESULTS
Readmitted Patients
In the study period, 14,248 out of 87,994 (16.2%) consecutive eligible patients were readmitted to a hospital in Maryland from patients discharged from Johns Hopkins Hospital between January 1, 2013 and December 31, 2014. A total of 11,027 (77.4%) of the readmissions were back to Johns Hopkins Hospital. Table 1 compares characteristics of readmitted versus nonreadmitted patients, with the following variables being significantly different between these patient groups: age, gender, healthcare payer, hospital service, discharge location, length of stay expected readmission rate, AHRQ Comorbidity Index, and days to complete inpatient discharge summary.
| Characteristics | All Patients, N = 87,994 | Not Readmitted, N = 73,746 | Readmitted, N = 14,248 | P Value |
|---|---|---|---|---|
| ||||
| Age, y | 42.1 (25.1) | 41.3 (25.4) | 46.4 (23.1) | <0.001 |
| Male | 43,210 (49.1%) | 35,851 (48.6%) | 7,359 (51.6%) | <0.001 |
| Race | <0.001 | |||
| Caucasian | 45,705 (51.9%) | 3,8661 (52.4%) | 7,044 (49.4%) | |
| African American | 32,777 (37.2%) | 2,6841 (36.4%) | 5,936 (41.7%) | |
| Other | 9,512 (10.8%) | 8,244 (11.2%) | 1,268 (8.9%) | |
| Payer | <0.001 | |||
| Medicare | 22,345 (25.4%) | 17,614 (23.9%) | 4,731 (33.2%) | |
| Medicaid | 24,080 (27.4%) | 20,100 (27.3%) | 3,980 (27.9%) | |
| Other | 41,569 (47.2%) | 36,032 (48.9%) | 5,537 (38.9%) | |
| Hospital service | <0.001 | |||
| Gynecologyobstetrics | 9,299 (10.6%) | 8,829 (12.0%) | 470 (3.3%) | |
| Medicine | 26,036 (29.6%) | 20,069 (27.2%) | 5,967 (41.9%) | |
| Neurosciences | 8,269 (9.4%) | 7,331 (9.9%) | 938 (6.6%) | |
| Oncology | 5,222 (5.9%) | 3,898 (5.3%) | 1,324 (9.3%) | |
| Pediatrics | 17,029 (19.4%) | 14,684 (19.9%) | 2,345 (16.5%) | |
| Surgical sciences | 22,139 (25.2%) | 18,935 (25.7%) | 3,204 (22.5%) | |
| Discharge location | <0.001 | |||
| Home | 65,478 (74.4%) | 56,359 (76.4%) | 9,119 (64.0%) | |
| Home with homecare or hospice | 9,524 (10.8%) | 7,440 (10.1%) | 2,084 (14.6%) | |
| Facility (SNF, rehabilitation facility) | 5,398 (6.1%) | 4,131 (5.6%) | 1,267 (8.9%) | |
| Other | 7,594 (8.6%) | 5,816 (7.9%) | 1,778 (12.5%) | |
| Length of stay, d | 5.5 (8.6) | 5.1 (7.8) | 7.5 (11.6) | <0.001 |
| APRDRG‐SOI Expected Readmission Rate, % | 14.4 (9.5) | 13.3 (9.2) | 20.1 (9.0) | <0.001 |
| AHRQ Comorbidity Index (1 point) | 2.5 (1.4) | 2.4 (1.4) | 3.0 (1.8) | <0.001 |
| Discharge summary completed >3 days | 66,242 (75.3%) | 55,329 (75.0%) | 10,913 (76.6%) | <0.001 |
Association Between Days to Complete the Discharge Summary and Readmission
After hospital discharge, median (IQR) number of days to complete discharge summaries was 8 (416) days. After hospital discharge, median (IQR) number of days to complete discharge summaries and the number of days from discharge to readmission was 8 (416) and 11 (519) days, respectively (P < 0.001). Six thousand one hundred one patients (42.8%) were readmitted before their discharge summary was completed. The median (IQR) days to complete discharge summaries by hospital service in order from shortest to longest was: oncology, 6 (212) days; surgical sciences, 6 (312) days; pediatrics, 7 (315) days; gynecologyobstetrics, 8 (415) days; medicine, 9 (420) days; neurosciences, 12 (621) days.
When we divided the number of days to complete the discharge summary into deciles (02, 2.13, 3.14, 4.16, 6.18, 8.210, 10.114, 14.119, 19.130, >30), a longer number of days to complete discharge summaries had higher unadjusted and adjusted readmission rates (Figure 1). In unadjusted analysis, Table 2 shows that older age, male sex, African American race, oncological versus medicine hospital service, discharge location, longer LOS, higher APRDRG‐SOI expected readmission rate, and higher AHRQ Comorbidity Index were associated with readmission. Days to complete the discharge summary >3 days versus 3 days was associated with a higher readmission rate, with an unadjusted odds ratio (OR) and 95% confidence interval (CI) of 1.09 (95% CI: 1.04 to 1.13, P < 0.001).
| Characteristic | Bivariable Analysis* | Multivariable Analysis* | ||
|---|---|---|---|---|
| OR (95% CI) | P Value | OR (95% CI) | P Value | |
| ||||
| Age, 10 y | 1.09 (1.08 to 1.09) | <0.001 | 0.97 (0.95 to 0.98) | <0.001 |
| Male | 1.13 (1.09 to 1.17) | <0.001 | 1.01 (0.97 to 1.05) | 0.76 |
| Race | ||||
| Caucasian | Referent | Referent | ||
| African American | 1.21 (1.17 to 1.26) | <0.001 | 1.01 (0.96 to 1.05) | 0.74 |
| Other | 0.84 (0.79 to 0.90) | <0.001 | 0.92 (0.86 to 0.98) | 0.01 |
| Payer | ||||
| Medicare | Referent | Referent | ||
| Medicaid | 0.74 (0.70 to 0.77) | <0.001 | 1.03 (0.97 to 1.09) | 0.42 |
| Other | 0.57 (0.55 to 0.60) | <0.001 | 0.86 (0.82 to 0.91) | <0.001 |
| Hospital service | ||||
| Medicine | Referent | Referent | ||
| Gynecologyobstetrics | 0.18 (0.16 to 0.20) | <0.001 | 0.50 (0.45 to 0.56) | <0.001 |
| Neurosciences | 0.43 (0.40 to 0.46) | <0.001 | 0.76 (0.70 to 0.82) | <0.001 |
| Oncology | 1.14 (1.07 to 1.22) | <0.001 | 1.18 (1.10 to 1.28) | <0.001 |
| Pediatrics | 0.54 (0.51 to 0.57) | <0.001 | 0.77 (0.71 to 0.83) | <0.001 |
| Surgical sciences | 0.57 (0.54 to 0.60) | <0.001 | 0.92 (0.87 to 0.97) | 0.002 |
| Discharge location | ||||
| Home | Referent | |||
| Facility (SNF, rehabilitation facility) | 1.90 (1.77 to 2.03) | <0.001 | 1.11 (1.02 to 1.19) | 0.009 |
| Home with homecare or hospice | 1.73 (1.64 to 1.83) | <0.001 | 1.26 (1.19 to 1.34) | <0.001 |
| Other | 1.89 (1.78 to 2.00) | <0.001 | 1.25 (1.18 to 1.34) | <0.001 |
| Length of stay, d | 1.03 (1.02 to 1.03) | <0.001 | 1.00 (1.00 to 1.01) | <0.001 |
| APRDRG‐SOI expected readmission rate, % | 1.08 (1.07 to 1.08) | <0.001 | 1.06 (1.06 to 1.06) | <0.001 |
| AHRQ Comorbidity Index (1 point) | 1.27 (1.26 to 1.28) | <0.001 | 1.11 (1.09 to 1.12) | <0.001 |
| Discharge summary completed >3 days | 1.09 (1.04 to 1.14) | <0.001 | 1.09 (1.05 to 1.14) | <0.001 |

Multivariable and Secondary Analyses
In adjusted analysis (Table 2), patients discharged from an oncologic service relative to a medicine hospital service (OR: 1.19, 95% CI: 1.10 to 1.28, P < 0.001), patients discharged to a facility, home with homecare or hospice, or other location compared to home (facility OR: 1.11, 95% CI: 1.02 to 1.19, P = 0.009; home with homecare or hospice OR: 1.26, 95% CI: 1.19 to 1.34, P < 0.001; other OR: 1.25, 95% CI: 1.18 to 1.34, P < 0.001), patients with longer LOS (OR: 1.11 per day, 95% CI: 1.10 to 1.12, P < 0.001), patients with a higher expected readmission rates (OR: 1.01 per percent, 95% CI: 1.00 to 1.01, P < 0.001), and patients with a higher AHRQ comorbidity index (OR: 1.06 per 1 point, 95% CI: 1.06 to 1.06, P < 0.001) had higher 30‐day readmission rates. Overall, days to complete the discharge summary >3 days versus 3 days was associated with a higher readmission rate (OR: 1.09, 95% CI: 1.05 to 1.14, P < 0.001).
In a sensitivity analysis, discharge summary completion >8 days (median) versus 8 days was associated with higher unadjusted readmission rate (OR: 1.11, 95% CI: 1.07 to 1.15, P < 0.001) and a higher adjusted readmission rate (OR: 1.06, 95% CI: 1.02 to 1.10, P < 0.001). Discharge summary completion >14 days (70th percentile) versus 14 days was also associated with higher unadjusted readmission rate (OR: 1.15, 95% CI: 1.08 to 1.21, P < 0.001) and a higher adjusted readmission rate (OR: 1.09, 95% CI: 1.02 to 1.16, P = 0.008). The association between days to complete the discharge summary >3 days and readmissions was found to vary significantly by hospital service (P = 0.03). For comparing days to complete the discharge summary >3 versus 3 days, Table 3 shows that neurosciences, pediatrics, oncology, and medicine hospital services were associated with significantly increased adjusted mean readmission rates. Additionally, when days to complete the discharge summary was modeled as a continuous variable, we found that for every 3 days the odds of readmission increased by 1% (OR: 1.01, 95% CI: 1.00 to 1.01, P < 0.001).
| Days to Complete Discharge Summary by Hospital Service | Adjusted Mean Readmission Rate (95% CI)* | P Value |
|---|---|---|
| ||
| Gynecologyobstetrics | 0.30 | |
| 03 days, n = 1,792 | 5.4 (4.1 to 6.7) | |
| >3 days, n = 7,507 | 6.0 (4.9 to 7.0) | |
| Medicine | 0.04 | |
| 03 days, n = 6,137 | 21.1 (20.0 to 22.3) | |
| >3 days, n = 19,899 | 22.4 (21.6 to 23.2) | |
| Neurosciences | 0.02 | |
| 03 days, n = 1,116 | 10.1 (8.2 to 12.1) | |
| >3 days, n = 7,153 | 12.5 (11.6 to 13.5) | |
| Oncology | 0.01 | |
| 03 days, n = 1,885 | 25.0 (22.6 to 27.4) | |
| >3 days, n = 3,337 | 28.2 (26.6 to 30.2) | |
| Pediatrics | 0.001 | |
| 03 days, n = 4,561 | 9.5 (6.9 to 12.2) | |
| >3 days, n = 12,468 | 11.4 (8.9 to 13.9) | |
| Surgical sciences | 0.89 | |
| 03 days, n = 6,261 | 15.2 (14.2 to 16.1) | |
| >3 days, n = 15,878 | 15.1 (14.4 to 15.8) | |
In an unadjusted analysis, we found that the relationship between LOS and days to complete the discharge summary was not significant ( coefficient and 95% CI:, 0.01, 0.02 to 0.00, P = 0.20). However, we found a small but significant relationship in our multivariable analysis, such that each hospitalization day was associated with a 0.01 (95% CI: 0.00 to 0.02, P = 0.03) increase in days to complete the discharge summary.
DISCUSSION
In this single‐center retrospective analysis, the number of days to complete the discharge summary was significantly associated with readmissions after hospitalization. This association was independent of age, gender, comorbidity index, payer, discharge location, length of hospital stay, expected readmission rate based on diagnosis and severity of illness, and all hospital services. The odds of readmission for patients with delayed discharge summaries was small but significant. This is important in the current landscape of readmissions, particularly for institutions who are challenged to reduce readmission rates, and a small relative difference in readmissions may be the difference between getting penalized or not. In the context of prior studies, the results highlight the role of timely discharge summary as an under‐recognized metric, which may be a valid litmus test for care coordination. The findings also emphasize the potential of early summaries to expedite communication and to help facilitate quality of patient care. Hence, the study results extend the literature examining the relationship of delay in discharge summary with unfavorable patient outcomes.[15, 32]
In contrast to prior reports with limited focus on same‐hospital readmissions,[18, 33, 34, 35] readmissions beyond 30 days,[12] or focused on a specific patient population,[13, 36] this study evaluates both intra‐ and interhospital 30‐day readmissions in Maryland in an all‐payer, multi‐institution, diverse patient population. Additionally, prior research is conflicting with respect to whether timely discharges summaries are significantly associated with increased hospital readmissions.[12, 13, 14, 15] Although it is not surprising that inadequate care during hospitalization could result in readmissions, the role of discharge summaries remain underappreciated. Having a timely discharge summary may not always prevent readmissions, but our study showed that 43% of readmission occurred before the discharge summary completion. Not having a completed discharge summary at the time of readmission may have been a driver for the positive association between timely completion and 30‐day readmission we observed. This study highlights that delay in the discharge summary could be a marker of poor transitions of care, because suboptimal dissemination of critical information to care providers may result in discontinuity of patient care posthospitalization.
A plausible mechanism of the association between discharge summary delays and readmissions could be the provision of collateral information, which may potentially alter the threshold for readmissions. For example, in the emergency room/emergency department (ER/ED) setting, discharge summaries may help with preventable readmissions. For patients who present repeatedly with the same complaint, timely summaries to ER/ED providers may help reframe the patient complaints, such as patient has concern X, which was previously identified to be related to diagnosis Y. As others have shown, the content of discharge summaries, format, and accessibility (electronic vs paper chart), as well as timely distribution of summaries, are key factors that impact quality outcomes.[2, 12, 15, 37, 38] By detailing prior hospital information (ie, discharge medications, prior presentations, tests completed), summaries could help prevent errors in medication dosing, reduce unnecessary testing, and help facilitate admission triage. Summaries may have information regarding a new diagnosis such as the results of an endoscopic evaluation that revealed the source of occult gastrointestinal bleeding, which could help contextualize a complaint of repeat melena and redirect goals of care. Discussions of goals of care in the discharge summary may guide primary providers in continued care management plans.
Our study findings underscore a positive correlation between late discharge summaries and readmissions. However, the extent that this is a causal relationship is unclear; the association of delay in days to complete the discharge summary with readmission may be an epiphenomenon related to processes related to quality of clinical care. For example, delays in discharge summary completion could be a marker of other system issues, such as a stressed work environment. It is possible that providers who fail to complete timely discharge summaries may also fail to do other important functions related to transitions of care and care coordination. However, even if this is so, timely discharge summaries could become a focal point for discussion for optimization of care transitions. A discharge summary could be delayed because the patient has already been readmitted before the summary was distributed, thus making that original summary less relevant. Delays could also be a reflection of the data complexity for patients with longer hospital stays. This is supported by the small but significant relationship between LOS and days to complete the discharge summary in this study. Lastly, delays in discharge summary completion may also be a proxy of provider communication and can reflect the culture of communication at the institution.
Although unplanned hospital readmission is an important outcome, many readmissions may be related to other factors such as disease progression, rather than late summaries or the lack of postdischarge communication. For instance, prior reports did not find any association between the PCP seeing the discharge summaries or direct communications with the PCP and 30‐day clinical outcomes for readmission and death.[26, 39] However, these studies were limited in their use of self‐reported handoffs, did not measure quality of information transfer, and failed to capture a broader audience beyond the PCP, such as ED physicians or specialists.
Our results suggest that the relationship between days to complete discharge summaries and 30‐day readmissions may vary depending on whether the hospitalization is primarily surgical/procedural versus medical treatment. A recent study found that most readmissions after surgery were associated with new complications related to the procedure and not exacerbation of prior index hospitalization complications.[40] Hence, treatment for common causes of hospital readmissions after surgical or gynecological procedures, such as wound infections, acute anemia, ileus, or dehydration, may not necessarily require a completed discharge summary for appropriate management. However, we caution extending this finding to clinical practice before further studies are conducted on specific procedures and in different clinical settings.
Results from this study also support institutional policies that specify the need for practitioners to complete discharge summaries contemporaneously, such as at the time of discharge or within a couple of days. Unlike other forms of communication that are optional, discharge summaries are required, so we recommend that practitioners be held accountable for short turnaround times. For example, providers could be graded and rated on timely completions of discharge summaries, among other performance variables. Anecdotally at our institutions, we have heard from practitioners that it takes less time to complete them when you do them on the day of discharge, because the hospitalization course is fresher in their mind and they have to wade through less information in the medical record to complete an accurate discharge summary. To this point, a barrier to on‐time completion is that providers may have misconceptions about what is really vital information to convey to the next provider. In agreement with past research and in the era of the electronic medical record system, we recommend that the discharge summary should be a quick synthesis of key findings that incorporates only the important elements, such as why the patient was hospitalized, what were key findings and key responses to therapy, what is pending at the time of discharge, what medications the patient is currently taking, and what are the follow‐up plans, rather than a lengthy expose of all the findings.[13, 36, 41, 42]
Lastly, our study results should be taken in the context of its limitations. As a single‐center study, findings may lack generalizability. In particular, the results may not generalize to hospitals that lack access to statewide reporting. We were also not able to assess readmission for patients who may have been readmitted to a hospital outside of Maryland. Although we adjusted for pertinent variables such as age, gender, healthcare payer, hospital service, comorbidity index, discharge location, LOS, and expected readmission rates, there may be other relevant confounders that we failed to capture or measure optimally. Median days to complete the discharge summary in this study was 8 days, which is longer than practices at other institutions, and may also limit this study's generalizability.[15, 36, 42] However, prior research supports our findings,[15] and a systematic review found that only 29% and 52% of discharge summaries were completed by 2 weeks and 4 weeks, respectively.[9] Finally, as noted above and perhaps most important, it is possible that discharge summary turnaround time does not in itself causally impact readmissions, but rather reflects an underlying commitment of the inpatient team to effectively coordinate care following hospital discharge.
CONCLUSION
In sum, this study delineates an underappreciated but important relationship of timely discharge summary completion and readmission outcomes. The discharge summary may be a relevant metric reflecting quality of patient care. Healthcare providers may begin to target timely discharge summaries as a potential focal point of quality‐improvement projects with the goal to facilitate better patient outcomes.
Disclosures
The authors certify that no party having a direct interest in the results of the research supporting this article has or will confer a benefit on us or on any organization with which we are associated, and, if applicable, the authors certify that all financial and material support for this research (eg, Centers for Medicare and Medicaid Services, National Institutes of Health, or National Health Service grants) and work are clearly identified. This study was supported by funding opportunity, number CMS‐1C1‐12‐0001, from the Centers for Medicare and Medicaid Services and Center for Medicare and Medicaid Innovation. Its contents are solely the responsibility of the authors and do not necessarily represent the official views of the Department of Health and Human Services or any of its agencies.
- , , , et al. Development and sustainability of an inpatient‐to‐outpatient discharge handoff tool: a quality improvement project. Jt Comm J Qual Patient Saf. 2014;40(5):219–227.
- , , , , , . Documentation of mandated discharge summary components in transitions from acute to subacute care. In: Henriksen K, Battles JB, Keyes MA, et al., eds. Advances in Patient Safety: New Directions and Alternative Approaches. Vol. 2. Culture and Redesign. Rockville, MD: Agency for Healthcare Research and Quality; 2008.
- , , , . Better transitions: improving comprehension of discharge instructions. Front Health Serv Manage. 2009;25(3):11–32.
- , , , . Structured discharge education improves early outcome in orthopedic patients. Int J Orthop Trauma Nurs. 2010;14(2):66–74.
- , , , et al. Hospital discharge documentation and risk of rehospitalisation. BMJ Qual Saf. 2011;20(9):773–778.
- , , . The hospital discharge: a review of a high risk care transition with highlights of a reengineered discharge process. J Patient Saf. 2007;3(2):97–106.
- , , , , . Interventions to reduce 30‐day rehospitalization: a systematic review. Ann Intern Med. 2011;155(8):520–528.
- , , , , , . Effect of hospital follow‐up appointment on clinical event outcomes and mortality. Arch Intern Med. 2010;170(11):955–960.
- , , , , , . Deficits in communication and information transfer between hospital‐based and primary care physicians: implications for patient safety and continuity of care. JAMA. 2007;297(8):831–841.
- , , , , . Provider characteristics, clinical‐work processes and their relationship to discharge summary quality for sub‐acute care patients. J Gen Intern Med. 2012;27(1):78–84.
- , , , et al. Contemporary evidence about hospital strategies for reducing 30‐day readmissions: a national study. J Am Coll Cardiol. 2012;60(7):607–614.
- , , , . Effect of discharge summary availability during post‐discharge visits on hospital readmission. J Gen Intern Med. 2002;17(3):186–192.
- , , , et al. Association of discharge summary quality with readmission risk for patients hospitalized with heart failure exacerbation. Circ Cardiovasc Qual Outcomes. 2015;8(1):109–111.
- , , , et al. The independent association of provider and information continuity on outcomes after hospital discharge: implications for hospitalists. J Hosp Med. 2010;5(7):398–405.
- , , , , . Timeliness in discharge summary dissemination is associated with patients' clinical outcomes. J Eval Clin Pract. 2013;19(1):76–79.
- , , , et al. Communication and information deficits in patients discharged to rehabilitation facilities: an evaluation of five acute care hospitals. J Hosp Med. 2009;4(8):E28–E33.
- , , . Preventing readmissions through comprehensive discharge planning. Prof Case Manag. 2013;18(2):56–63; quiz 64–65.
- , , , et al. Effect of a postdischarge virtual ward on readmission or death for high‐risk patients: a randomized clinical trial. JAMA. 2014;312(13):1305–1312..
- , , . Risk factors for early unplanned hospital readmission in the elderly. J Gen Intern Med. 1991;6(3):223–228.
- , , , , . Differences between early and late readmissions among patients: a cohort study. Ann Intern Med. 2015;162(11):741–749.
- , , , et al. Post‐acute care payment reform demonstration report to congress supplement‐interim report. Centers for Medicare 14(3):1–14; quiz 88–89.
- , , , et al. Comprehensive discharge planning and home follow‐up of hospitalized elders: a randomized clinical trial. JAMA. 1999;281(7):613–620.
- , , , . Posthospital care transitions: patterns, complications, and risk identification. Health Serv Res. 2004;39(5):1449–1465.
- , , , et al. Transitions of care consensus policy statement: American College of Physicians, Society of General Internal Medicine, Society of Hospital Medicine, American Geriatrics Society, American College of Emergency Physicians, and Society for Academic Emergency Medicine. J Hosp Med. 2009;4(6):364–370.
- , , , et al. Association of self‐reported hospital discharge handoffs with 30‐day readmissions. JAMA Intern Med. 2013;173(8):624–629.
- , . Socioeconomic disparities in health: pathways and policies. Health Aff (Millwood). 2002;21(2):60–76.
- , , , . Comorbidity measures for use with administrative data. Med Care. 1998;36(1):8–27.
- , , , , , . Functional status impairment is associated with unplanned readmissions. Arch Phys Med Rehabil. 2013;94(10):1951–1958.
- Centers for Medicare 35(10):1044–1059.
- , , , et al. Understanding and execution of discharge instructions. Am J Med Qual. 2013;28(5):383–391.
- , , , , . Beyond the hospital gates: elucidating the interactive association of social support, depressive symptoms, and physical function with 30‐day readmissions. Am J Phys Med Rehabil. 2015;94(7):555–567.
- , , , et al. Improving the discharge process by embedding a discharge facilitator in a resident team. J Hosp Med. 2011;6(9):494–500.
- , , , et al. Hospital variation in quality of discharge summaries for patients hospitalized with heart failure exacerbation. Circ Cardiovasc Qual Outcomes. 2015;8(1):77–86
- , , , . Addressing the business of discharge: building a case for an electronic discharge summary. J Hosp Med. 2011;6(1):37–42.
- , , , , . Joint commission requirements for discharge instructions in patients with heart failure: is understanding important for preventing readmissions? J Card Fail. 2014;20(9):641–649.
- , , , et al. Association of communication between hospital‐based physicians and primary care providers with patient outcomes. J Gen Intern Med. 2009;24(3):381–386.
- , , , et al. Underlying reasons associated with hospital readmission following surgery in the united states. JAMA. 2015;313(5):483–495.
- , , , , . Assessing quality and efficiency of discharge summaries. Am J Med Qual. 2005;20(6):337–343.
- , , , et al. Comprehensive quality of discharge summaries at an academic medical center. J Hosp Med. 2013;8(8):436–443.
Across the continuum of care, the discharge summary is a critical tool for communication among care providers.[1] In the United States, the Joint Commission policies mandate that all hospital providers complete a discharge summary for patients with specific components to foster effective communication with future providers.[2] Because outpatient providers and emergency physicians rely on clinical information in the discharge summary to ensure appropriate postdischarge continuity of care, timely documentation is potentially an essential aspect of readmission reduction initiatives.[3, 4, 5] Prior reports indicate that poor discharge documentation of follow‐up plan‐of‐care increases the risk of hospitalization, whereas structured instructions, patient education, and direct communications with primary care physicians (PCPs) reduce repeat hospital visits.[6, 7, 8, 9] However, the current literature is limited in its narrow focus on the contents of discharge summaries, considered only same‐hospital readmissions, or considered readmissions within 3 months of discharge.[10, 11, 12, 13] Moreover, some prior research has suggested no association between discharge summary timeliness with readmission,[12, 13, 14] whereas another study did find a relationship,[15] hence the need to study this further is important. Filling this gap in knowledge could provide an avenue to track and improve quality of patient care, as delays in discharge summaries have been linked with pot‐discharge adverse outcomes and patient safety concerns.[15, 16, 17, 18] Because readmissions often occur soon after discharge, having timely discharge summaries may be particularly important to outcomes.[19, 20]
This research began under the framework of evaluating a bundle of care coordination strategies that were implemented at the Johns Hopkins Health System. These strategies were informed by the early Centers for Medicare and Medicaid Services (CMS) demonstration projects and other best practices that have been documented in the literature to improve utilization and improve communication during transitions of care.[21, 22, 23, 24, 25] Later they were augmented through a contract with the Center of Medicare and Medicaid Innovation to improve access to healthcare services and improve patient outcomes through improved care coordination processes. One of the domains our institution has increased efforts to improve is in provider handoffs. Toward that goal, we have worked to disentangle the effects of different factors of provider‐to‐provider communication that may influence readmissions.[26] For example, effective written provider handoffs in the form of accurate and timely discharge summaries was considered a key care coordination component of this program, but there was institutional resistance to endorsing an expectation that discharge summary turnaround should be shortened. To build a case for this concept, we sought to test the hypothesis that, at our hospital, longer time to complete hospital discharge summaries was associated with increased readmission rates. Unique to this analysis is that, in the state of Maryland, there is statewide reporting of readmissions, so we were able to account for intra‐ and interhospital readmissions for an all‐payer population. The authors anticipated that findings from this study would help inform discharge quality‐improvement initiatives and reemphasize the importance of timely discharge documentation across all disciplines as part of quality patient care.
METHODS
Study Population and Setting
We conducted a single‐center, retrospective cohort study of 87,994 consecutive patients discharged from Johns Hopkins Hospital, which is a 1000‐bed, tertiary academic medical center in Baltimore, Maryland between January 1, 2013 and December 31, 2014. One thousand ninety‐three (1.2%) of the records on days to complete the discharge summary were missing and were excluded from the analysis.
Data Source and Covariates
Data were derived from several sources. The Johns Hopkins Hospital data mart financial database, used for mandatory reporting to the State of Maryland, provided the following patient data: age, gender, race/ethnicity, payer (Medicare, Medicaid, and other) as a proxy for socioeconomic status,[27] hospital service prior to discharge (gynecologyobstetrics, medicine, neurosciences, oncology, pediatrics, and surgical sciences), hospital length of stay (LOS) prior to discharge, Agency for Healthcare Research and Quality (AHRQ) Comorbidity Index (which is an update to the original Elixhauser methodology[28]), and all‐payerrefined diagnosis‐related group (APRDRG) and severity of illness (SOI) combinations (a tool to group patients into clinically comparable disease and SOI categories expected to use similar resources and experience similar outcomes). The Health Services Cost Review Commission (HSCRC) in Maryland provided the observed readmission rate in Maryland for each APRDRG‐SOI combination and served as an expected readmission rate. This risk stratification methodology is similar to the approach used in previous studies.[26, 29] Discharge summary turnaround time was obtained from institutional administrative databases used to track compliance with discharge summary completion. Discharge location (home, facility, home with homecare or hospice, or other) was obtained from Curaspan databases (Curaspan Health Group, Inc., Newton, MA).
Primary Outcome: 30‐Day Readmission
The primary outcome was unplanned rehospitalizations to an acute care hospital in Maryland within 30 days of discharge from Johns Hopkins Hospital. This was as defined by the Maryland HSCRC using an algorithm to exclude readmissions that were likely to be scheduled, as defined by the index admission diagnosis and readmission diagnosis; this algorithm is updated based on the CMS all‐cause readmission algorithm.[30, 31]
Primary Exposure: Days to Complete the Discharge Summary
Discharge summary completion time was defined as the date when the discharge attending physician electronically signs the discharge summary. At our institution, an auto‐fax system sends documents (eg, discharge summaries, clinic notes) to linked providers (eg, primary care providers) shortly after midnight from the day the document is signed by an attending physician. During the period of the project, the policy for discharge summaries at the Johns Hopkins Hospital went from requiring them to be completed within 30 days to 14 days, and we were hoping to use our analyses to inform decision makers why this was important. To emphasize the need for timely completion of discharge summaries, we dichotomized the number of days to complete the discharge summary into >3 versus 3 days (20th percentile cutoff) and modeled it as a continuous variable (per 3‐day increase in days to complete the discharge summary).
Statistical Analysis
To evaluate differences in patient characteristics by readmission status, analysis of variance and 2 tests were used for continuous and dichotomous variables, respectively. Logistic regression was used to evaluate the association between days to complete the discharge summary >3 days and readmission status, adjusting for potentially confounding variables. Before inclusion in the logistic regression model, we confirmed a lack of multicollinearity in the multivariable regression model using variance inflation factors. We evaluated residual versus predicted value plots and residual versus fitted value plots with a locally weighted scatterplot smoothing line. In a sensitivity analysis we evaluated the association between readmission status and different cutoffs (>8 days, 50th percentile; and >14 days, 70% percentile). In a separate analysis, we used interaction terms to test whether the association between the association between days to complete the discharge summary >3 days and hospital readmission varied by the covariates in the analysis (age, sex, race, payer, hospital service, discharge location, LOS, APRDRG‐SOI expected readmission rate, and AHRQ Comorbidity Index). We observed a significant interaction between 30‐day readmission and days to complete the discharge summary >3 days by hospital service. Hence, we separately calculated the adjusted mean readmission rates separately for each hospital service using the least squared means method for the multivariable logistic regression analysis and adjusting for the previously mentioned covariates. In a separate analysis, we used linear regression to evaluate the association between LOS and days to complete the discharge summary, adjusting for potentially confounding variables. Statistical significance was defined as a 2‐sided P < 0.05. Data were analyzed with R (version 2.15.0; R Foundation for Statistical Computing, Vienna, Austria;
RESULTS
Readmitted Patients
In the study period, 14,248 out of 87,994 (16.2%) consecutive eligible patients were readmitted to a hospital in Maryland from patients discharged from Johns Hopkins Hospital between January 1, 2013 and December 31, 2014. A total of 11,027 (77.4%) of the readmissions were back to Johns Hopkins Hospital. Table 1 compares characteristics of readmitted versus nonreadmitted patients, with the following variables being significantly different between these patient groups: age, gender, healthcare payer, hospital service, discharge location, length of stay expected readmission rate, AHRQ Comorbidity Index, and days to complete inpatient discharge summary.
| Characteristics | All Patients, N = 87,994 | Not Readmitted, N = 73,746 | Readmitted, N = 14,248 | P Value |
|---|---|---|---|---|
| ||||
| Age, y | 42.1 (25.1) | 41.3 (25.4) | 46.4 (23.1) | <0.001 |
| Male | 43,210 (49.1%) | 35,851 (48.6%) | 7,359 (51.6%) | <0.001 |
| Race | <0.001 | |||
| Caucasian | 45,705 (51.9%) | 3,8661 (52.4%) | 7,044 (49.4%) | |
| African American | 32,777 (37.2%) | 2,6841 (36.4%) | 5,936 (41.7%) | |
| Other | 9,512 (10.8%) | 8,244 (11.2%) | 1,268 (8.9%) | |
| Payer | <0.001 | |||
| Medicare | 22,345 (25.4%) | 17,614 (23.9%) | 4,731 (33.2%) | |
| Medicaid | 24,080 (27.4%) | 20,100 (27.3%) | 3,980 (27.9%) | |
| Other | 41,569 (47.2%) | 36,032 (48.9%) | 5,537 (38.9%) | |
| Hospital service | <0.001 | |||
| Gynecologyobstetrics | 9,299 (10.6%) | 8,829 (12.0%) | 470 (3.3%) | |
| Medicine | 26,036 (29.6%) | 20,069 (27.2%) | 5,967 (41.9%) | |
| Neurosciences | 8,269 (9.4%) | 7,331 (9.9%) | 938 (6.6%) | |
| Oncology | 5,222 (5.9%) | 3,898 (5.3%) | 1,324 (9.3%) | |
| Pediatrics | 17,029 (19.4%) | 14,684 (19.9%) | 2,345 (16.5%) | |
| Surgical sciences | 22,139 (25.2%) | 18,935 (25.7%) | 3,204 (22.5%) | |
| Discharge location | <0.001 | |||
| Home | 65,478 (74.4%) | 56,359 (76.4%) | 9,119 (64.0%) | |
| Home with homecare or hospice | 9,524 (10.8%) | 7,440 (10.1%) | 2,084 (14.6%) | |
| Facility (SNF, rehabilitation facility) | 5,398 (6.1%) | 4,131 (5.6%) | 1,267 (8.9%) | |
| Other | 7,594 (8.6%) | 5,816 (7.9%) | 1,778 (12.5%) | |
| Length of stay, d | 5.5 (8.6) | 5.1 (7.8) | 7.5 (11.6) | <0.001 |
| APRDRG‐SOI Expected Readmission Rate, % | 14.4 (9.5) | 13.3 (9.2) | 20.1 (9.0) | <0.001 |
| AHRQ Comorbidity Index (1 point) | 2.5 (1.4) | 2.4 (1.4) | 3.0 (1.8) | <0.001 |
| Discharge summary completed >3 days | 66,242 (75.3%) | 55,329 (75.0%) | 10,913 (76.6%) | <0.001 |
Association Between Days to Complete the Discharge Summary and Readmission
After hospital discharge, median (IQR) number of days to complete discharge summaries was 8 (416) days. After hospital discharge, median (IQR) number of days to complete discharge summaries and the number of days from discharge to readmission was 8 (416) and 11 (519) days, respectively (P < 0.001). Six thousand one hundred one patients (42.8%) were readmitted before their discharge summary was completed. The median (IQR) days to complete discharge summaries by hospital service in order from shortest to longest was: oncology, 6 (212) days; surgical sciences, 6 (312) days; pediatrics, 7 (315) days; gynecologyobstetrics, 8 (415) days; medicine, 9 (420) days; neurosciences, 12 (621) days.
When we divided the number of days to complete the discharge summary into deciles (02, 2.13, 3.14, 4.16, 6.18, 8.210, 10.114, 14.119, 19.130, >30), a longer number of days to complete discharge summaries had higher unadjusted and adjusted readmission rates (Figure 1). In unadjusted analysis, Table 2 shows that older age, male sex, African American race, oncological versus medicine hospital service, discharge location, longer LOS, higher APRDRG‐SOI expected readmission rate, and higher AHRQ Comorbidity Index were associated with readmission. Days to complete the discharge summary >3 days versus 3 days was associated with a higher readmission rate, with an unadjusted odds ratio (OR) and 95% confidence interval (CI) of 1.09 (95% CI: 1.04 to 1.13, P < 0.001).
| Characteristic | Bivariable Analysis* | Multivariable Analysis* | ||
|---|---|---|---|---|
| OR (95% CI) | P Value | OR (95% CI) | P Value | |
| ||||
| Age, 10 y | 1.09 (1.08 to 1.09) | <0.001 | 0.97 (0.95 to 0.98) | <0.001 |
| Male | 1.13 (1.09 to 1.17) | <0.001 | 1.01 (0.97 to 1.05) | 0.76 |
| Race | ||||
| Caucasian | Referent | Referent | ||
| African American | 1.21 (1.17 to 1.26) | <0.001 | 1.01 (0.96 to 1.05) | 0.74 |
| Other | 0.84 (0.79 to 0.90) | <0.001 | 0.92 (0.86 to 0.98) | 0.01 |
| Payer | ||||
| Medicare | Referent | Referent | ||
| Medicaid | 0.74 (0.70 to 0.77) | <0.001 | 1.03 (0.97 to 1.09) | 0.42 |
| Other | 0.57 (0.55 to 0.60) | <0.001 | 0.86 (0.82 to 0.91) | <0.001 |
| Hospital service | ||||
| Medicine | Referent | Referent | ||
| Gynecologyobstetrics | 0.18 (0.16 to 0.20) | <0.001 | 0.50 (0.45 to 0.56) | <0.001 |
| Neurosciences | 0.43 (0.40 to 0.46) | <0.001 | 0.76 (0.70 to 0.82) | <0.001 |
| Oncology | 1.14 (1.07 to 1.22) | <0.001 | 1.18 (1.10 to 1.28) | <0.001 |
| Pediatrics | 0.54 (0.51 to 0.57) | <0.001 | 0.77 (0.71 to 0.83) | <0.001 |
| Surgical sciences | 0.57 (0.54 to 0.60) | <0.001 | 0.92 (0.87 to 0.97) | 0.002 |
| Discharge location | ||||
| Home | Referent | |||
| Facility (SNF, rehabilitation facility) | 1.90 (1.77 to 2.03) | <0.001 | 1.11 (1.02 to 1.19) | 0.009 |
| Home with homecare or hospice | 1.73 (1.64 to 1.83) | <0.001 | 1.26 (1.19 to 1.34) | <0.001 |
| Other | 1.89 (1.78 to 2.00) | <0.001 | 1.25 (1.18 to 1.34) | <0.001 |
| Length of stay, d | 1.03 (1.02 to 1.03) | <0.001 | 1.00 (1.00 to 1.01) | <0.001 |
| APRDRG‐SOI expected readmission rate, % | 1.08 (1.07 to 1.08) | <0.001 | 1.06 (1.06 to 1.06) | <0.001 |
| AHRQ Comorbidity Index (1 point) | 1.27 (1.26 to 1.28) | <0.001 | 1.11 (1.09 to 1.12) | <0.001 |
| Discharge summary completed >3 days | 1.09 (1.04 to 1.14) | <0.001 | 1.09 (1.05 to 1.14) | <0.001 |
Multivariable and Secondary Analyses
In adjusted analysis (Table 2), patients discharged from an oncologic service relative to a medicine hospital service (OR: 1.19, 95% CI: 1.10 to 1.28, P < 0.001), patients discharged to a facility, home with homecare or hospice, or other location compared to home (facility OR: 1.11, 95% CI: 1.02 to 1.19, P = 0.009; home with homecare or hospice OR: 1.26, 95% CI: 1.19 to 1.34, P < 0.001; other OR: 1.25, 95% CI: 1.18 to 1.34, P < 0.001), patients with longer LOS (OR: 1.11 per day, 95% CI: 1.10 to 1.12, P < 0.001), patients with a higher expected readmission rates (OR: 1.01 per percent, 95% CI: 1.00 to 1.01, P < 0.001), and patients with a higher AHRQ comorbidity index (OR: 1.06 per 1 point, 95% CI: 1.06 to 1.06, P < 0.001) had higher 30‐day readmission rates. Overall, days to complete the discharge summary >3 days versus 3 days was associated with a higher readmission rate (OR: 1.09, 95% CI: 1.05 to 1.14, P < 0.001).
In a sensitivity analysis, discharge summary completion >8 days (median) versus 8 days was associated with higher unadjusted readmission rate (OR: 1.11, 95% CI: 1.07 to 1.15, P < 0.001) and a higher adjusted readmission rate (OR: 1.06, 95% CI: 1.02 to 1.10, P < 0.001). Discharge summary completion >14 days (70th percentile) versus 14 days was also associated with higher unadjusted readmission rate (OR: 1.15, 95% CI: 1.08 to 1.21, P < 0.001) and a higher adjusted readmission rate (OR: 1.09, 95% CI: 1.02 to 1.16, P = 0.008). The association between days to complete the discharge summary >3 days and readmissions was found to vary significantly by hospital service (P = 0.03). For comparing days to complete the discharge summary >3 versus 3 days, Table 3 shows that neurosciences, pediatrics, oncology, and medicine hospital services were associated with significantly increased adjusted mean readmission rates. Additionally, when days to complete the discharge summary was modeled as a continuous variable, we found that for every 3 days the odds of readmission increased by 1% (OR: 1.01, 95% CI: 1.00 to 1.01, P < 0.001).
| Days to Complete Discharge Summary by Hospital Service | Adjusted Mean Readmission Rate (95% CI)* | P Value |
|---|---|---|
| ||
| Gynecologyobstetrics | 0.30 | |
| 03 days, n = 1,792 | 5.4 (4.1 to 6.7) | |
| >3 days, n = 7,507 | 6.0 (4.9 to 7.0) | |
| Medicine | 0.04 | |
| 03 days, n = 6,137 | 21.1 (20.0 to 22.3) | |
| >3 days, n = 19,899 | 22.4 (21.6 to 23.2) | |
| Neurosciences | 0.02 | |
| 03 days, n = 1,116 | 10.1 (8.2 to 12.1) | |
| >3 days, n = 7,153 | 12.5 (11.6 to 13.5) | |
| Oncology | 0.01 | |
| 03 days, n = 1,885 | 25.0 (22.6 to 27.4) | |
| >3 days, n = 3,337 | 28.2 (26.6 to 30.2) | |
| Pediatrics | 0.001 | |
| 03 days, n = 4,561 | 9.5 (6.9 to 12.2) | |
| >3 days, n = 12,468 | 11.4 (8.9 to 13.9) | |
| Surgical sciences | 0.89 | |
| 03 days, n = 6,261 | 15.2 (14.2 to 16.1) | |
| >3 days, n = 15,878 | 15.1 (14.4 to 15.8) | |
In an unadjusted analysis, we found that the relationship between LOS and days to complete the discharge summary was not significant ( coefficient and 95% CI:, 0.01, 0.02 to 0.00, P = 0.20). However, we found a small but significant relationship in our multivariable analysis, such that each hospitalization day was associated with a 0.01 (95% CI: 0.00 to 0.02, P = 0.03) increase in days to complete the discharge summary.
DISCUSSION
In this single‐center retrospective analysis, the number of days to complete the discharge summary was significantly associated with readmissions after hospitalization. This association was independent of age, gender, comorbidity index, payer, discharge location, length of hospital stay, expected readmission rate based on diagnosis and severity of illness, and all hospital services. The odds of readmission for patients with delayed discharge summaries was small but significant. This is important in the current landscape of readmissions, particularly for institutions who are challenged to reduce readmission rates, and a small relative difference in readmissions may be the difference between getting penalized or not. In the context of prior studies, the results highlight the role of timely discharge summary as an under‐recognized metric, which may be a valid litmus test for care coordination. The findings also emphasize the potential of early summaries to expedite communication and to help facilitate quality of patient care. Hence, the study results extend the literature examining the relationship of delay in discharge summary with unfavorable patient outcomes.[15, 32]
In contrast to prior reports with limited focus on same‐hospital readmissions,[18, 33, 34, 35] readmissions beyond 30 days,[12] or focused on a specific patient population,[13, 36] this study evaluates both intra‐ and interhospital 30‐day readmissions in Maryland in an all‐payer, multi‐institution, diverse patient population. Additionally, prior research is conflicting with respect to whether timely discharges summaries are significantly associated with increased hospital readmissions.[12, 13, 14, 15] Although it is not surprising that inadequate care during hospitalization could result in readmissions, the role of discharge summaries remain underappreciated. Having a timely discharge summary may not always prevent readmissions, but our study showed that 43% of readmission occurred before the discharge summary completion. Not having a completed discharge summary at the time of readmission may have been a driver for the positive association between timely completion and 30‐day readmission we observed. This study highlights that delay in the discharge summary could be a marker of poor transitions of care, because suboptimal dissemination of critical information to care providers may result in discontinuity of patient care posthospitalization.
A plausible mechanism of the association between discharge summary delays and readmissions could be the provision of collateral information, which may potentially alter the threshold for readmissions. For example, in the emergency room/emergency department (ER/ED) setting, discharge summaries may help with preventable readmissions. For patients who present repeatedly with the same complaint, timely summaries to ER/ED providers may help reframe the patient complaints, such as patient has concern X, which was previously identified to be related to diagnosis Y. As others have shown, the content of discharge summaries, format, and accessibility (electronic vs paper chart), as well as timely distribution of summaries, are key factors that impact quality outcomes.[2, 12, 15, 37, 38] By detailing prior hospital information (ie, discharge medications, prior presentations, tests completed), summaries could help prevent errors in medication dosing, reduce unnecessary testing, and help facilitate admission triage. Summaries may have information regarding a new diagnosis such as the results of an endoscopic evaluation that revealed the source of occult gastrointestinal bleeding, which could help contextualize a complaint of repeat melena and redirect goals of care. Discussions of goals of care in the discharge summary may guide primary providers in continued care management plans.
Our study findings underscore a positive correlation between late discharge summaries and readmissions. However, the extent that this is a causal relationship is unclear; the association of delay in days to complete the discharge summary with readmission may be an epiphenomenon related to processes related to quality of clinical care. For example, delays in discharge summary completion could be a marker of other system issues, such as a stressed work environment. It is possible that providers who fail to complete timely discharge summaries may also fail to do other important functions related to transitions of care and care coordination. However, even if this is so, timely discharge summaries could become a focal point for discussion for optimization of care transitions. A discharge summary could be delayed because the patient has already been readmitted before the summary was distributed, thus making that original summary less relevant. Delays could also be a reflection of the data complexity for patients with longer hospital stays. This is supported by the small but significant relationship between LOS and days to complete the discharge summary in this study. Lastly, delays in discharge summary completion may also be a proxy of provider communication and can reflect the culture of communication at the institution.
Although unplanned hospital readmission is an important outcome, many readmissions may be related to other factors such as disease progression, rather than late summaries or the lack of postdischarge communication. For instance, prior reports did not find any association between the PCP seeing the discharge summaries or direct communications with the PCP and 30‐day clinical outcomes for readmission and death.[26, 39] However, these studies were limited in their use of self‐reported handoffs, did not measure quality of information transfer, and failed to capture a broader audience beyond the PCP, such as ED physicians or specialists.
Our results suggest that the relationship between days to complete discharge summaries and 30‐day readmissions may vary depending on whether the hospitalization is primarily surgical/procedural versus medical treatment. A recent study found that most readmissions after surgery were associated with new complications related to the procedure and not exacerbation of prior index hospitalization complications.[40] Hence, treatment for common causes of hospital readmissions after surgical or gynecological procedures, such as wound infections, acute anemia, ileus, or dehydration, may not necessarily require a completed discharge summary for appropriate management. However, we caution extending this finding to clinical practice before further studies are conducted on specific procedures and in different clinical settings.
Results from this study also support institutional policies that specify the need for practitioners to complete discharge summaries contemporaneously, such as at the time of discharge or within a couple of days. Unlike other forms of communication that are optional, discharge summaries are required, so we recommend that practitioners be held accountable for short turnaround times. For example, providers could be graded and rated on timely completions of discharge summaries, among other performance variables. Anecdotally at our institutions, we have heard from practitioners that it takes less time to complete them when you do them on the day of discharge, because the hospitalization course is fresher in their mind and they have to wade through less information in the medical record to complete an accurate discharge summary. To this point, a barrier to on‐time completion is that providers may have misconceptions about what is really vital information to convey to the next provider. In agreement with past research and in the era of the electronic medical record system, we recommend that the discharge summary should be a quick synthesis of key findings that incorporates only the important elements, such as why the patient was hospitalized, what were key findings and key responses to therapy, what is pending at the time of discharge, what medications the patient is currently taking, and what are the follow‐up plans, rather than a lengthy expose of all the findings.[13, 36, 41, 42]
Lastly, our study results should be taken in the context of its limitations. As a single‐center study, findings may lack generalizability. In particular, the results may not generalize to hospitals that lack access to statewide reporting. We were also not able to assess readmission for patients who may have been readmitted to a hospital outside of Maryland. Although we adjusted for pertinent variables such as age, gender, healthcare payer, hospital service, comorbidity index, discharge location, LOS, and expected readmission rates, there may be other relevant confounders that we failed to capture or measure optimally. Median days to complete the discharge summary in this study was 8 days, which is longer than practices at other institutions, and may also limit this study's generalizability.[15, 36, 42] However, prior research supports our findings,[15] and a systematic review found that only 29% and 52% of discharge summaries were completed by 2 weeks and 4 weeks, respectively.[9] Finally, as noted above and perhaps most important, it is possible that discharge summary turnaround time does not in itself causally impact readmissions, but rather reflects an underlying commitment of the inpatient team to effectively coordinate care following hospital discharge.
CONCLUSION
In sum, this study delineates an underappreciated but important relationship of timely discharge summary completion and readmission outcomes. The discharge summary may be a relevant metric reflecting quality of patient care. Healthcare providers may begin to target timely discharge summaries as a potential focal point of quality‐improvement projects with the goal to facilitate better patient outcomes.
Disclosures
The authors certify that no party having a direct interest in the results of the research supporting this article has or will confer a benefit on us or on any organization with which we are associated, and, if applicable, the authors certify that all financial and material support for this research (eg, Centers for Medicare and Medicaid Services, National Institutes of Health, or National Health Service grants) and work are clearly identified. This study was supported by funding opportunity, number CMS‐1C1‐12‐0001, from the Centers for Medicare and Medicaid Services and Center for Medicare and Medicaid Innovation. Its contents are solely the responsibility of the authors and do not necessarily represent the official views of the Department of Health and Human Services or any of its agencies.
- , , , et al. Development and sustainability of an inpatient‐to‐outpatient discharge handoff tool: a quality improvement project. Jt Comm J Qual Patient Saf. 2014;40(5):219–227.
- , , , , , . Documentation of mandated discharge summary components in transitions from acute to subacute care. In: Henriksen K, Battles JB, Keyes MA, et al., eds. Advances in Patient Safety: New Directions and Alternative Approaches. Vol. 2. Culture and Redesign. Rockville, MD: Agency for Healthcare Research and Quality; 2008.
- , , , . Better transitions: improving comprehension of discharge instructions. Front Health Serv Manage. 2009;25(3):11–32.
- , , , . Structured discharge education improves early outcome in orthopedic patients. Int J Orthop Trauma Nurs. 2010;14(2):66–74.
- , , , et al. Hospital discharge documentation and risk of rehospitalisation. BMJ Qual Saf. 2011;20(9):773–778.
- , , . The hospital discharge: a review of a high risk care transition with highlights of a reengineered discharge process. J Patient Saf. 2007;3(2):97–106.
- , , , , . Interventions to reduce 30‐day rehospitalization: a systematic review. Ann Intern Med. 2011;155(8):520–528.
- , , , , , . Effect of hospital follow‐up appointment on clinical event outcomes and mortality. Arch Intern Med. 2010;170(11):955–960.
- , , , , , . Deficits in communication and information transfer between hospital‐based and primary care physicians: implications for patient safety and continuity of care. JAMA. 2007;297(8):831–841.
- , , , , . Provider characteristics, clinical‐work processes and their relationship to discharge summary quality for sub‐acute care patients. J Gen Intern Med. 2012;27(1):78–84.
- , , , et al. Contemporary evidence about hospital strategies for reducing 30‐day readmissions: a national study. J Am Coll Cardiol. 2012;60(7):607–614.
- , , , . Effect of discharge summary availability during post‐discharge visits on hospital readmission. J Gen Intern Med. 2002;17(3):186–192.
- , , , et al. Association of discharge summary quality with readmission risk for patients hospitalized with heart failure exacerbation. Circ Cardiovasc Qual Outcomes. 2015;8(1):109–111.
- , , , et al. The independent association of provider and information continuity on outcomes after hospital discharge: implications for hospitalists. J Hosp Med. 2010;5(7):398–405.
- , , , , . Timeliness in discharge summary dissemination is associated with patients' clinical outcomes. J Eval Clin Pract. 2013;19(1):76–79.
- , , , et al. Communication and information deficits in patients discharged to rehabilitation facilities: an evaluation of five acute care hospitals. J Hosp Med. 2009;4(8):E28–E33.
- , , . Preventing readmissions through comprehensive discharge planning. Prof Case Manag. 2013;18(2):56–63; quiz 64–65.
- , , , et al. Effect of a postdischarge virtual ward on readmission or death for high‐risk patients: a randomized clinical trial. JAMA. 2014;312(13):1305–1312..
- , , . Risk factors for early unplanned hospital readmission in the elderly. J Gen Intern Med. 1991;6(3):223–228.
- , , , , . Differences between early and late readmissions among patients: a cohort study. Ann Intern Med. 2015;162(11):741–749.
- , , , et al. Post‐acute care payment reform demonstration report to congress supplement‐interim report. Centers for Medicare 14(3):1–14; quiz 88–89.
- , , , et al. Comprehensive discharge planning and home follow‐up of hospitalized elders: a randomized clinical trial. JAMA. 1999;281(7):613–620.
- , , , . Posthospital care transitions: patterns, complications, and risk identification. Health Serv Res. 2004;39(5):1449–1465.
- , , , et al. Transitions of care consensus policy statement: American College of Physicians, Society of General Internal Medicine, Society of Hospital Medicine, American Geriatrics Society, American College of Emergency Physicians, and Society for Academic Emergency Medicine. J Hosp Med. 2009;4(6):364–370.
- , , , et al. Association of self‐reported hospital discharge handoffs with 30‐day readmissions. JAMA Intern Med. 2013;173(8):624–629.
- , . Socioeconomic disparities in health: pathways and policies. Health Aff (Millwood). 2002;21(2):60–76.
- , , , . Comorbidity measures for use with administrative data. Med Care. 1998;36(1):8–27.
- , , , , , . Functional status impairment is associated with unplanned readmissions. Arch Phys Med Rehabil. 2013;94(10):1951–1958.
- Centers for Medicare 35(10):1044–1059.
- , , , et al. Understanding and execution of discharge instructions. Am J Med Qual. 2013;28(5):383–391.
- , , , , . Beyond the hospital gates: elucidating the interactive association of social support, depressive symptoms, and physical function with 30‐day readmissions. Am J Phys Med Rehabil. 2015;94(7):555–567.
- , , , et al. Improving the discharge process by embedding a discharge facilitator in a resident team. J Hosp Med. 2011;6(9):494–500.
- , , , et al. Hospital variation in quality of discharge summaries for patients hospitalized with heart failure exacerbation. Circ Cardiovasc Qual Outcomes. 2015;8(1):77–86
- , , , . Addressing the business of discharge: building a case for an electronic discharge summary. J Hosp Med. 2011;6(1):37–42.
- , , , , . Joint commission requirements for discharge instructions in patients with heart failure: is understanding important for preventing readmissions? J Card Fail. 2014;20(9):641–649.
- , , , et al. Association of communication between hospital‐based physicians and primary care providers with patient outcomes. J Gen Intern Med. 2009;24(3):381–386.
- , , , et al. Underlying reasons associated with hospital readmission following surgery in the united states. JAMA. 2015;313(5):483–495.
- , , , , . Assessing quality and efficiency of discharge summaries. Am J Med Qual. 2005;20(6):337–343.
- , , , et al. Comprehensive quality of discharge summaries at an academic medical center. J Hosp Med. 2013;8(8):436–443.
© 2016 Society of Hospital Medicine
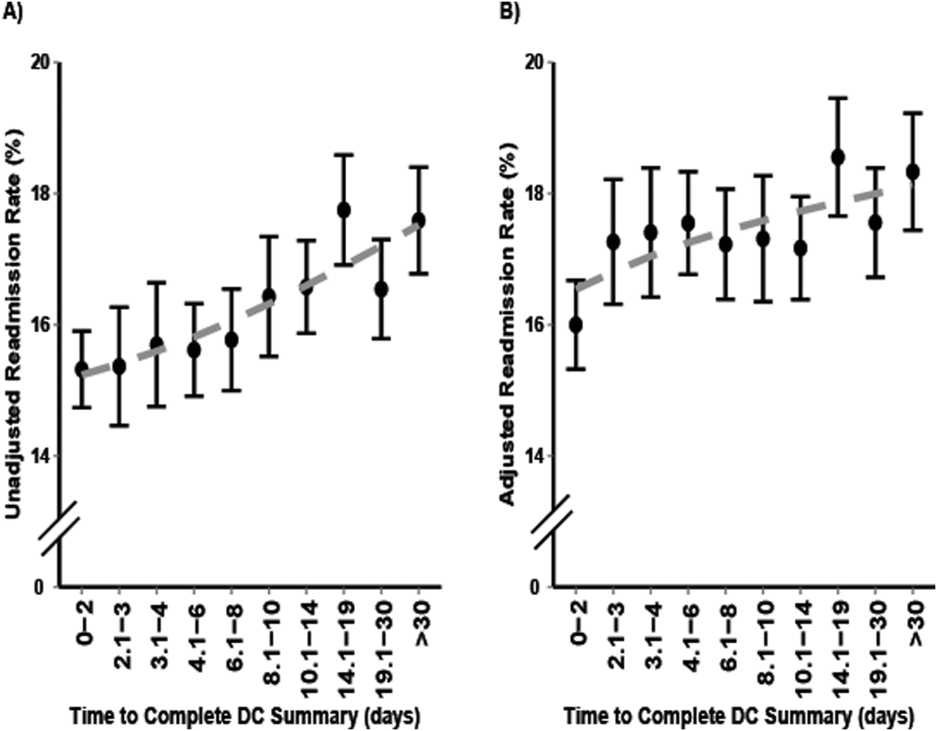
Optimizing Outcomes of Total Joint Arthroplasty Under the Comprehensive Care for Joint Replacement
On July 9, 2015, the Centers for Medicare and Medicaid Services announced the Comprehensive Care for Joint Replacement model, which aims to improve coordination of the whole episode of care for total hip and knee replacement.1 At stake is the fact that hip and knee replacements are the most common inpatient procedures among Medicare beneficiaries, costing over $7 billion in 20141 and projected to grow to $50 billion by 2030.2 Under Medicare’s new initiative, hospitals and physicians are held accountable for the quality and cost of care delivered from the time of surgery through 90 days after discharge. For the first time in the history of our profession, large-scale reimbursement is based on outcomes and value rather than fee-for-service. As a result, a hospital can either earn a reward or be held liable for added expenses related to events such as prolonged hospitalization, readmissions, and complications.
How can we optimize outcomes for total joint arthroplasty (TJA) patients in this era of Medicare (r)evolution? A good outcome starts with good patient selection. Numerous studies have been published on patient-related risk factors for postoperative TJA complications including obesity, congestive heart failure, lung disease, and depression.3,4 The risks and benefits of TJA should be carefully weighed in high-risk patients and surgery delayed until appropriate medical optimization has been achieved. Following the famous saying, “Good surgeons know how to operate, better surgeons know when to operate, and the best surgeons know when not to operate,” one cannot overemphasize the need for an objective assessment of the likelihood of patient outcome weighed against patient risk factors.
Moderating patient expectation is another crucial component given the changing demographics of our country. Patients seeking TJA today are younger, more obese, and better educated; live longer; and have higher expectations.5 Unrealistic expectations can have a profound impact on surgical outcomes, leading to frustration, dissatisfaction, and unnecessary resource utilization. For example, despite alleviating pain and restoring function in a severely degenerative joint, TJA does not necessarily translate to weight loss. There is currently conflicting evidence on this topic,6-8 and the expectation of weight loss after TJA cannot be supported. There is also a paucity of data regarding return to athletic activity after TJA and the effect of athletic activity on TJA survivorship.9 Communication and transparency are needed to moderate unrealistic expectations before surgery, outlining clear and achievable goals.
Clinical pathways for TJA have seen tremendous improvements in the past decade with the advent of multimodal analgesia, rapid recovery programs, use of spinal and regional anesthesia, and evidence-based guidelines for prevention of venous thromboembolic disease. Adequate pain control is critical to recovery. In a prospective, randomized controlled trial, Lamplot and colleagues10 showed that the use of multimodal analgesia correlated with improved pain scores, decreased narcotic usage, faster functional recovery, and higher patient satisfaction after total knee arthroplasty (TKA). In another study, Quack and colleagues11 performed a systematic review of the literature on fast-track rehabilitation and found that it reduced both inpatient length of stay and costs after TKA. With respect to anesthetic choice, Pugely and colleagues12 reviewed a national database of 14,052 cases of primary TKA and found that patients with multiple comorbidities were at higher risk of complications after general anesthesia when compared with spinal anesthesia. We should continue to invest in safer and more effective modalities for pain control and functional recovery.
Last but not least, in today’s era of Medicare’s Comprehensive Care for Joint Replacement, the role of low-volume orthopedic surgeons performing TJA deserves special mention. Over the next few years, we could likely see a decline in the role of low-volume surgeons in favor of high-volume surgeons. While most orthopedic surgeons are comfortable doing primary TJA, failed cases and complications are frequently referred to larger centers, which may create frustration among patients owing to fragmentation of care. The economic pressures related to bundled payments could further influence this transition. Given the lack of a widespread, long-standing national joint registry, the incidence of failed TJA performed by low-volume orthopedic surgeons compared with high-volume orthopedic surgeons is unknown. However, multiple studies have shown surgeon volume to be associated with lower rates of complication, mortality, readmission, reoperation, and discharge to postacute facilities.13-16 As hospitals assume further financial risk, considerable data on physician performance will undoubtedly be gathered and leveraged. Time and data will determine the value of this transition of care.
Today, more than ever, we are challenged to provide efficient, high-quality, patient-centered care. As our nation grapples with reforming a broken health care system, initiatives like the Comprehensive Care for Joint Replacement will continue to emerge in the future. Orthopedic surgeons are the gatekeepers of the system and therefore hold significant responsibility to patients and society. Ensuring good outcomes should be a top priority not just from a financial standpoint, but as a moral obligation. We shall continue to be leaders in the face of challenges, using innovation and integrity to produce the best results and advance our profession.
1. Comprehensive Care for Joint Replacement model. Centers for Medicare and Medicaid Services website. https://innovation.cms.gov/initiatives/cjr. Updated December 21, 2015. Accessed December 30, 2015.
2. Wilson NA, Schneller ES, Montgomery K, Bozic KJ. Hip and knee implants: current trends and policy considerations. Health Aff. 2008;27(6):1587-1598.
3. Bozic KJ, Lau E, Ong K, et al. Risk factors for early revision after primary total hip arthroplasty in Medicare patients. Clin Orthop Relat Res. 2014;472(2):449-454.
4. Bozic KJ, Lau E, Ong K, et al. Risk factors for early revision after primary TKA in Medicare patients. Clin Orthop Relat Res. 2014;472(1):232-237.
5. Mason JB. The new demands by patients in the modern era of total joint arthroplasty: a point of view. Clin Orthop Relat Res. 2008;466(1):146-152.
6. Riddle DL, Singh JA, Harmsen WS, Schleck CD, Lewallen DG. Clinically important body weight gain following knee arthroplasty: a five-year comparative cohort study. Arthritis Care Res. 2013;65(5):669-677.
7. Zeni JA Jr, Snyder-Mackler L. Most patients gain weight in the 2 years after total knee arthroplasty: comparison to a healthy control group. Osteoarthritis Cartilage. 2010;18(4):510-514.
8. Ast MP, Abdel MP, Lee YY, Lyman S, Ruel AV, Westrich GH. Weight changes after total hip or knee arthroplasty: prevalence, predictors, and effects on outcomes. J Bone Joint Surg Am. 2015;97(11):911-919.
9. Healy WL, Sharma S, Schwartz B, Iorio R. Athletic activity after total joint arthroplasty. J Bone Joint Surg Am. 2008;90(10):2245-2252.
10. Lamplot JD, Wagner ER, Manning DW. Multimodal pain management in total knee arthroplasty: a prospective randomized controlled trial. J Arthroplasty. 2014;29(2):329-334.
11. Quack V, Ippendorf AV, Betsch M, et al. Multidisciplinary rehabilitation and fast-track rehabilitation after knee replacement: faster, better, cheaper? A survey and systematic review of literature [in German]. Rehabilitation (Stuttg). 2015;54(4):245-251.
12. Pugely AJ, Martin CT, Gao Y, Mendoza-Lattes S, Callaghan JJ. Differences in short-term complications between spinal and general anesthesia for primary total knee arthroplasty. J Bone Joint Surg Am. 2013;95(3):193-199.
13. Katz JN, Losina E, Barrett J, et al. Association between hospital and surgeon procedure volume and outcomes of total hip replacement in the United States medicare population. J Bone Joint Surg Am. 2001;83(11):1622-1629.
14. Manley M, Ong K, Lau E, Kurtz SM. Effect of volume on total hip arthroplasty revision rates in the United States Medicare population. J Bone Joint Surg Am. 2008;90(11):2446-2451.
15. Bozic KJ, Maselli J, Pekow PS, Lindenauer PK, Vail TP, Auerbach AD. The influence of procedure volumes and standardization of care on quality and efficiency in total joint replacement surgery. J Bone Joint Surg Am. 2010;92(16):2643-2652.
16. Lau RL, Perruccio AV, Gandhi R, Mahomed NN. The role of surgeon volume on patient outcome in total knee arthroplasty: a systematic review of the literature. BMC Musculoskelet Disord. 2012;13:250.
On July 9, 2015, the Centers for Medicare and Medicaid Services announced the Comprehensive Care for Joint Replacement model, which aims to improve coordination of the whole episode of care for total hip and knee replacement.1 At stake is the fact that hip and knee replacements are the most common inpatient procedures among Medicare beneficiaries, costing over $7 billion in 20141 and projected to grow to $50 billion by 2030.2 Under Medicare’s new initiative, hospitals and physicians are held accountable for the quality and cost of care delivered from the time of surgery through 90 days after discharge. For the first time in the history of our profession, large-scale reimbursement is based on outcomes and value rather than fee-for-service. As a result, a hospital can either earn a reward or be held liable for added expenses related to events such as prolonged hospitalization, readmissions, and complications.
How can we optimize outcomes for total joint arthroplasty (TJA) patients in this era of Medicare (r)evolution? A good outcome starts with good patient selection. Numerous studies have been published on patient-related risk factors for postoperative TJA complications including obesity, congestive heart failure, lung disease, and depression.3,4 The risks and benefits of TJA should be carefully weighed in high-risk patients and surgery delayed until appropriate medical optimization has been achieved. Following the famous saying, “Good surgeons know how to operate, better surgeons know when to operate, and the best surgeons know when not to operate,” one cannot overemphasize the need for an objective assessment of the likelihood of patient outcome weighed against patient risk factors.
Moderating patient expectation is another crucial component given the changing demographics of our country. Patients seeking TJA today are younger, more obese, and better educated; live longer; and have higher expectations.5 Unrealistic expectations can have a profound impact on surgical outcomes, leading to frustration, dissatisfaction, and unnecessary resource utilization. For example, despite alleviating pain and restoring function in a severely degenerative joint, TJA does not necessarily translate to weight loss. There is currently conflicting evidence on this topic,6-8 and the expectation of weight loss after TJA cannot be supported. There is also a paucity of data regarding return to athletic activity after TJA and the effect of athletic activity on TJA survivorship.9 Communication and transparency are needed to moderate unrealistic expectations before surgery, outlining clear and achievable goals.
Clinical pathways for TJA have seen tremendous improvements in the past decade with the advent of multimodal analgesia, rapid recovery programs, use of spinal and regional anesthesia, and evidence-based guidelines for prevention of venous thromboembolic disease. Adequate pain control is critical to recovery. In a prospective, randomized controlled trial, Lamplot and colleagues10 showed that the use of multimodal analgesia correlated with improved pain scores, decreased narcotic usage, faster functional recovery, and higher patient satisfaction after total knee arthroplasty (TKA). In another study, Quack and colleagues11 performed a systematic review of the literature on fast-track rehabilitation and found that it reduced both inpatient length of stay and costs after TKA. With respect to anesthetic choice, Pugely and colleagues12 reviewed a national database of 14,052 cases of primary TKA and found that patients with multiple comorbidities were at higher risk of complications after general anesthesia when compared with spinal anesthesia. We should continue to invest in safer and more effective modalities for pain control and functional recovery.
Last but not least, in today’s era of Medicare’s Comprehensive Care for Joint Replacement, the role of low-volume orthopedic surgeons performing TJA deserves special mention. Over the next few years, we could likely see a decline in the role of low-volume surgeons in favor of high-volume surgeons. While most orthopedic surgeons are comfortable doing primary TJA, failed cases and complications are frequently referred to larger centers, which may create frustration among patients owing to fragmentation of care. The economic pressures related to bundled payments could further influence this transition. Given the lack of a widespread, long-standing national joint registry, the incidence of failed TJA performed by low-volume orthopedic surgeons compared with high-volume orthopedic surgeons is unknown. However, multiple studies have shown surgeon volume to be associated with lower rates of complication, mortality, readmission, reoperation, and discharge to postacute facilities.13-16 As hospitals assume further financial risk, considerable data on physician performance will undoubtedly be gathered and leveraged. Time and data will determine the value of this transition of care.
Today, more than ever, we are challenged to provide efficient, high-quality, patient-centered care. As our nation grapples with reforming a broken health care system, initiatives like the Comprehensive Care for Joint Replacement will continue to emerge in the future. Orthopedic surgeons are the gatekeepers of the system and therefore hold significant responsibility to patients and society. Ensuring good outcomes should be a top priority not just from a financial standpoint, but as a moral obligation. We shall continue to be leaders in the face of challenges, using innovation and integrity to produce the best results and advance our profession.
1. Comprehensive Care for Joint Replacement model. Centers for Medicare and Medicaid Services website. https://innovation.cms.gov/initiatives/cjr. Updated December 21, 2015. Accessed December 30, 2015.
2. Wilson NA, Schneller ES, Montgomery K, Bozic KJ. Hip and knee implants: current trends and policy considerations. Health Aff. 2008;27(6):1587-1598.
3. Bozic KJ, Lau E, Ong K, et al. Risk factors for early revision after primary total hip arthroplasty in Medicare patients. Clin Orthop Relat Res. 2014;472(2):449-454.
4. Bozic KJ, Lau E, Ong K, et al. Risk factors for early revision after primary TKA in Medicare patients. Clin Orthop Relat Res. 2014;472(1):232-237.
5. Mason JB. The new demands by patients in the modern era of total joint arthroplasty: a point of view. Clin Orthop Relat Res. 2008;466(1):146-152.
6. Riddle DL, Singh JA, Harmsen WS, Schleck CD, Lewallen DG. Clinically important body weight gain following knee arthroplasty: a five-year comparative cohort study. Arthritis Care Res. 2013;65(5):669-677.
7. Zeni JA Jr, Snyder-Mackler L. Most patients gain weight in the 2 years after total knee arthroplasty: comparison to a healthy control group. Osteoarthritis Cartilage. 2010;18(4):510-514.
8. Ast MP, Abdel MP, Lee YY, Lyman S, Ruel AV, Westrich GH. Weight changes after total hip or knee arthroplasty: prevalence, predictors, and effects on outcomes. J Bone Joint Surg Am. 2015;97(11):911-919.
9. Healy WL, Sharma S, Schwartz B, Iorio R. Athletic activity after total joint arthroplasty. J Bone Joint Surg Am. 2008;90(10):2245-2252.
10. Lamplot JD, Wagner ER, Manning DW. Multimodal pain management in total knee arthroplasty: a prospective randomized controlled trial. J Arthroplasty. 2014;29(2):329-334.
11. Quack V, Ippendorf AV, Betsch M, et al. Multidisciplinary rehabilitation and fast-track rehabilitation after knee replacement: faster, better, cheaper? A survey and systematic review of literature [in German]. Rehabilitation (Stuttg). 2015;54(4):245-251.
12. Pugely AJ, Martin CT, Gao Y, Mendoza-Lattes S, Callaghan JJ. Differences in short-term complications between spinal and general anesthesia for primary total knee arthroplasty. J Bone Joint Surg Am. 2013;95(3):193-199.
13. Katz JN, Losina E, Barrett J, et al. Association between hospital and surgeon procedure volume and outcomes of total hip replacement in the United States medicare population. J Bone Joint Surg Am. 2001;83(11):1622-1629.
14. Manley M, Ong K, Lau E, Kurtz SM. Effect of volume on total hip arthroplasty revision rates in the United States Medicare population. J Bone Joint Surg Am. 2008;90(11):2446-2451.
15. Bozic KJ, Maselli J, Pekow PS, Lindenauer PK, Vail TP, Auerbach AD. The influence of procedure volumes and standardization of care on quality and efficiency in total joint replacement surgery. J Bone Joint Surg Am. 2010;92(16):2643-2652.
16. Lau RL, Perruccio AV, Gandhi R, Mahomed NN. The role of surgeon volume on patient outcome in total knee arthroplasty: a systematic review of the literature. BMC Musculoskelet Disord. 2012;13:250.
Are Hook Plates Advantageous Compared to Antiglide Plates for Vertical Shear Malleolar Fractures?
Supination-adduction (SAD)-type fractures of the ankle comprise approximately 5% to 20% of ankle fractures.1-3 As the name describes, this fracture is caused by forceful adduction of the supinated foot. There are 2 stages of the fracture pattern: the injury usually occurs first on the lateral side of the ankle with injury to the soft tissues or a low transverse fracture of the distal fibula. With continued force, in the second stage, the talus causes a shearing of the medial malleolus, creating the vertical shear fracture pattern.4-7 The vertical shear medial malleolus fracture pattern is the subject of this investigation.
Several techniques have been traditionally recommended for fixation of SAD-type ankle fracture, including: a 2-screw construct without plate fixation, oriented perpendicular to the fracture; and an AG plate construct with variable positioning and numbers of screws for fixation. There have been, however, only 2 published articles about the biomechanical properties of fixation of vertical shear medial malleolar fractures, which reported conflicting results.8,9 The most recent of these studies argued that one-third tubular plate fixation offers significant mechanical advantage over screw-only fixation, supporting the use of AG plates for fixation of SAD ankle fractures.8
An additional design for fixation of medial malleolus fractures has been introduced, consisting of a hook plate (HP) contoured for the medial malleolus. To our knowledge, no studies have investigated HP’s biomechanical properties. Thus, the objective of this study was to investigate and compare the biomechanical properties of 3 constructs for fixation of SAD-ankle fractures: an antiglide (AG) plate, an AG plate with an additional lag-screw across the fracture, and a precontoured HP.
Materials and Methods
Thirty 4th-generation–composite polyurethane models of the left tibia were obtained (Sawbones, Pacific Research Laboratories, Inc.). Largely, our methods accorded with the precedent set by other studies on these fracture types.8,9
Prior to creation of the fractures, each model was individually evaluated for pretest stiffness by using the slope of the linear portion of the load-displacement curve during offset-axial loading. This demonstrated the baseline elasticity of the models during loading. Assessing pretest stiffness was performed to reduce potential variables in the stiffness of individual models in the analysis of the testing data.
The models were numbered 1 through 30 on the shaft and on the medial malleolus. A custom jig was constructed with a table saw to create identical vertical shear medial malleolar fracture patterns in each model. The jig created the vertical shear SAD fracture described by Lauge-Hansen.7 All models were randomly assigned to 1 of 3 groups; each group consisted of 10 models (Figures 1A, 1B).
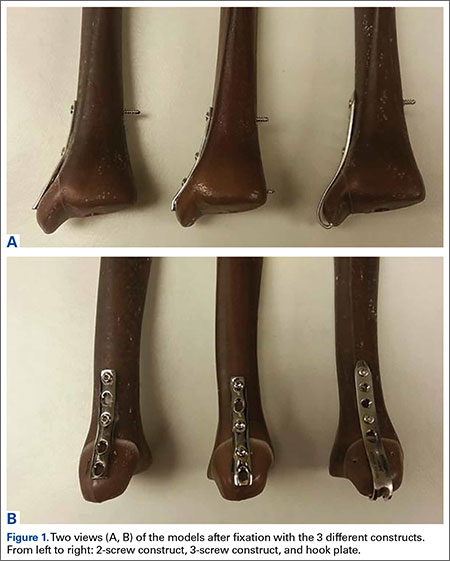
The 10 specimens in group 1 were fixed with a 5-hole, 3.5-mm, one-third tubular plate (Smith & Nephew) in a traditional AG fashion. The plates were placed at the same location on all tibiae. The proximal hole and the hole closest to the fracture line were filled with 3.5-mm cortical screws, which were long enough to achieve bicortical fixation. No lag screws were placed in this specimen group. In group 2, specimens were fixed with the same plate used in group 1 (Smith & Nephew). In this modified AG (MAG) construct, specimens were fixed identically to group 1 for plate placement and fixation of the 2 proximal screws. In this group, an additional screw was placed perpendicular to the fracture and parallel to the distal tibial articular surface. In both groups (AG and MAG), the plates were not bent before application.
Group 3 consisted of specimens fixed with a 5-hole, precontoured medial malleolar HP (Arthrex). This HP construct was fixed with two 3.5-mm cortical screws long enough to achieve bicortical fixation. The plate also engaged the bone at the tip of the medial malleolus by using 2 sharp prongs. The screws were placed in the most proximal hole and the hole just proximal to the fracture line. No lag screws were placed in the HP construct.
All models were tested in offset-axial loading to replicate a SAD moment similar to previous studies. To test offset-axial loading, a vice held each model identically with a 17º angle from the longitudinal axis (Figure 2). Loading was performed with a material testing system; a material testing system plunger was directed at the inferior articulating cartilage surface of the medial malleolus. The specimens were loaded at a rate of 1 mm/sec until 2 mm of displacement was reached (Figure 3) or catastrophic failure occurred. The raw data analyzed consisted of the initial stiffness of the construct and the overall load-to-failure. The slope of the linear portion of the load-displacement curve of stiffness determined stiffness of the construct.
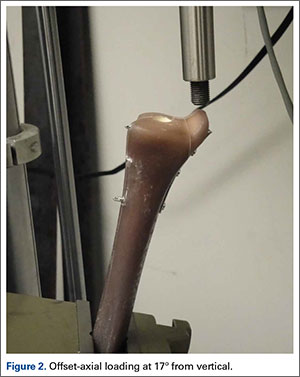
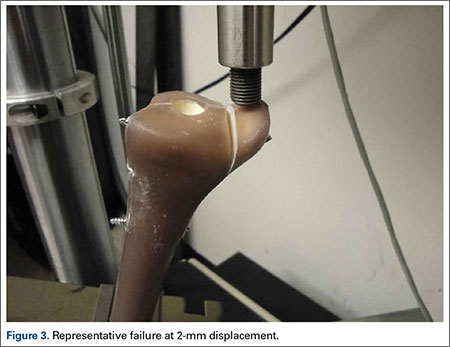
One-way analysis of variance with post hoc Tukey HSD data analysis was performed to determine if there were statistical differences among the different fixation constructs during load-to-failure. To prevent skewing of results by different values of model elasticity, pretest stiffness was accounted for by calculating a ratio of construct stiffness as a function of pretest model stiffness. Total force-to-failure was the recorded maximum force (in N) to cause failure. A P value of < .05 was set for significance. All data were analyzed using SPSS software (SPSS Version 15.0; SPSS Inc.).
Results
Analysis of pretest stiffness showed no significant difference among models (P = .490). All models failed by a gap of 2 mm at the distal fracture site except for 3 models in the MAG group. These 3 models failed at a much higher load than the remainder of the models and failed by fracture of the models.
The MAG group demonstrated significantly superior stiffness to the 2 other models tested (Figure 4). On average, this group required 753.5 N of force before failure. This was 530 N higher than the HP (P < .05) and 638 N higher than the AG constructs, respectively (P < .05). The HP and AG groups required forces of 223.2 N and 115.5 N for failure, respectively. These numbers were not significant (P= .063).
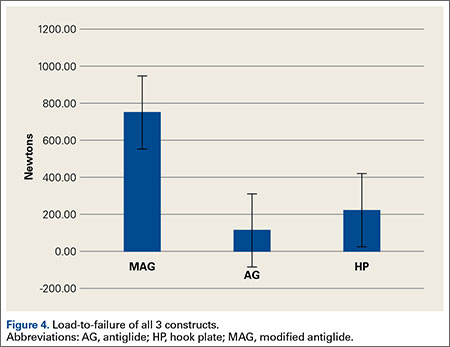
The absolute construct stiffness and construct stiffness as a function of pretest stiffness of the MAG group was the highest of all groups, 271.7 N/mm and 57.2%, respectively (Figure 5). These numbers showed significance when compared with the values of the HP group (P < .05 for both) and the AG group (P < .05 for both). The average stiffness of the HP group was 159.7 N/mm, which was 36.8% of pretest stiffness.
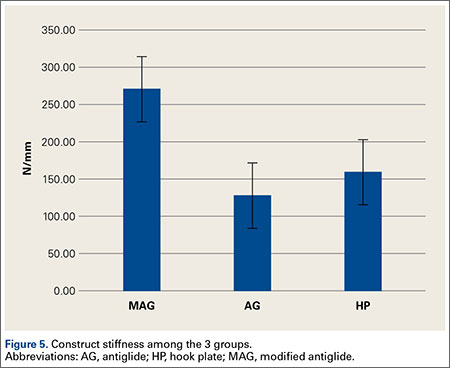
The AG group had the lowest construct stiffness and percent of pretest stiffness (128.1 N/mm and 29.6%). The HP and AG groups were not statistically different in these comparisons, P = .350 for construct stiffness and P = .395 for percent of pretest stiffness.
Discussion
These results support the use of a one-third tubular plate and lag-screw construct for fixation of vertical shear medial malleolus fractures. This is clinically important because one-third tubular plates with 3.5-mm screws are readily available and cost significantly less than a precountoured anatomic-specific type of fixation. These results are based on the biomechanical properties of the constructs tested in this study.
The previous 2 studies8,9showed conflicting results about the most biomechanically sound fixation for SAD medial malleolar fractures. The study by Toolan and colleagues9 reported that 2 screws placed perpendicular to the fracture demonstrated the strongest overall construct. This study compared 3 separate types of 2-screw–only fixations and 2 plate-and-screw fixations. One construct was similar to the AG group in our study, and the other construct had a lag screw at the apex of the fracture. This previous study,9 however, did not investigate a similar construct to the MAG group that was tested in our study.
According to Dumigan and associates,8 a construct that consisted of a 4-hole plate with 2 screws proximal to the fracture and 2 lag screws showed the strongest fixation. This study, however, did not include a group like our study’s AG group, which is the traditional AG form of fixation.
In our study, we examined the biomechanic properties of a traditional fixation (AG construct), a commonly used fixation (MAG construct), and a newer construct (HP construct). The HP group is unique to this study and, to our knowledge, there is no literature on its use as fixation for this fracture. We did not include a 2-screw–only group, which is a limitation, because this fixation type is not common for the SAD fracture. This study also did not include an HP construct with an additional lag screw, which is an available option as well.
The current investigation used synthetic bone models constructed for biomechanical testing. The models were thought to provide a consistent model for fixation as opposed to using potentially osteopenic cadaveric bone. Each model was the same size and laterality. The stiffness as determined by pretest stiffness was not significantly different among models. Because all models were similar in composition and size, this allowed for more consistent osteotomies and similarly sized malleolar fragments. Theoretically, this allowed a more uniform comparison of all specimens and constructs.
Using models, however, is a limit of this study. While the models were of similar biomechanical quality, it is possible that a model may not reproduce the biology of a cavaderic specimen or the physiology of a construct in vivo. Of the 2 studies that investigated SAD fractures, the Dumigan study8 used cadaveric specimens. The fact that these models were all mildly osteoporotic and were embalmed specimens were study limits. The Toolan study9 used synthetic models. Although these models were consistent, they were models of bones and not intended for biomechanical studies, thereby increasing the potential for skewed results.
Our study investigated loading only in the offset-axial direction, a difference when compared to the Dumigan and colleagues8 and Toolan and colleagues9 studies. The offest transverse loading previously investigated would most likely represent an external rotation moment. While fixation in vivo could experience an external rotation moment, the specific fracture pattern of interest fails in offset-axial loading. In the original discription of the SAD fracture, Lauge-Hanson7 stated that the talus causes the vertically oriented medial malleolar fracture in the extreme of ankle supination with an adduction moment. Considering this, we investigated failure with a force in the direction that causes this type of fracture.
There are some additional limitations. This study demonstrated superiority of a one-third tubular plate with 2 screws proximally and 1 lag screw. While this was shown in the laboratory under pure offset-axial loading conditions, this may not reproduce daily forces experienced by the constructs. Additionally, this study examined load-to-failure of the constructs and did not investigate cyclic loading that a construct would experience in vivo. Because the testing is not recognizably consistent with day-to-day stresses of these constructs in vivo, this confounds the clinical application of our study.
The stiffness required for clinical healing is undetermined and, therefore, all 3 types of fixation could be adequate clinically. Patients are typically instructed to adhere to weight-bearing limitations on the affected extremity, and casts or splints are applied postoperatively for extended periods of time. Clinical studies would have significant benefit in the evaluation of fixation of vertical shear medial malleolar fractures.
Conclusion
AG plating technique with lag-screw placement is biomechanically superior to the other 2 constructs investigated. The clinical applications of these results are not known, and clinical trials are suggested to determine the best type of fixation for SAD-type medial malleolar fractures.
1. Hak DJ, Egol KA, Gardner MJ, Haskell A. The “not so simple” ankle fracture: avoiding problems and pitfalls to improve patient outcomes. Instr Course Lect. 2011;60:73-88.
2. Hamilton WC. Supination-adduction injuries. In: Hamilton WC, ed. Traumatic Disorders of the Ankle. 1st ed. New York, NY: Springer-Verlag; 1984:101-112.
3. McConnell T, Tornetta P. Marginal plafond impaction in association with supination-adduction ankle fractures: a report of eight cases. J Orthop Trauma. 2001;15(6):447-449.
4. Arimoto HK, Forrester DM. Classification of ankle fractures: an algorithm. AJR Am J Roentgenol. 1980;135(5):1057-1063.
5. Carr JB. Malleolar fractures and soft tissue injuries of the ankle. In: Browner BD, Jupiter JB, Levine AM, Trafton PG, Krettek C, eds. Skeletal Trauma: Basic Science, Management and Reconstruction. 4th ed. Philadelphia, PA: Saunders Elsevier; 2009:2515-2584.
6. Davidovitch RI, Egol KA. Ankle fractures. In: Bucholz RW HJ, Court-Brown CM, Tornetta P III, eds. Rockwood and Green’s Fractures in Adults. 7th ed. Philadelphia, PA: Lippincott, Williams, & Wilkins; 2010:1975-2021.
7. Lauge-Hansen N. Fractures of the ankle. II. Combined experimental-surgical and experimental-roentgenologic investigations. Arch Surg. 1950;60(5):957-985.
8. Dumigan RM, Bronson DG, Early JS. Analysis of fixation methods for vertical shear fractures of the medial malleolus. J Orthop Trauma. 2006;20(10):687-691.
9. Toolan BC, Koval KJ, Kummer FJ, Sanders R, Zuckerman JD. Vertical shear fractures of the medial malleolus: a biomechanical study of five internal fixation techniques. Foot Ankle Int. 1994;15(9):483-489.
Supination-adduction (SAD)-type fractures of the ankle comprise approximately 5% to 20% of ankle fractures.1-3 As the name describes, this fracture is caused by forceful adduction of the supinated foot. There are 2 stages of the fracture pattern: the injury usually occurs first on the lateral side of the ankle with injury to the soft tissues or a low transverse fracture of the distal fibula. With continued force, in the second stage, the talus causes a shearing of the medial malleolus, creating the vertical shear fracture pattern.4-7 The vertical shear medial malleolus fracture pattern is the subject of this investigation.
Several techniques have been traditionally recommended for fixation of SAD-type ankle fracture, including: a 2-screw construct without plate fixation, oriented perpendicular to the fracture; and an AG plate construct with variable positioning and numbers of screws for fixation. There have been, however, only 2 published articles about the biomechanical properties of fixation of vertical shear medial malleolar fractures, which reported conflicting results.8,9 The most recent of these studies argued that one-third tubular plate fixation offers significant mechanical advantage over screw-only fixation, supporting the use of AG plates for fixation of SAD ankle fractures.8
An additional design for fixation of medial malleolus fractures has been introduced, consisting of a hook plate (HP) contoured for the medial malleolus. To our knowledge, no studies have investigated HP’s biomechanical properties. Thus, the objective of this study was to investigate and compare the biomechanical properties of 3 constructs for fixation of SAD-ankle fractures: an antiglide (AG) plate, an AG plate with an additional lag-screw across the fracture, and a precontoured HP.
Materials and Methods
Thirty 4th-generation–composite polyurethane models of the left tibia were obtained (Sawbones, Pacific Research Laboratories, Inc.). Largely, our methods accorded with the precedent set by other studies on these fracture types.8,9
Prior to creation of the fractures, each model was individually evaluated for pretest stiffness by using the slope of the linear portion of the load-displacement curve during offset-axial loading. This demonstrated the baseline elasticity of the models during loading. Assessing pretest stiffness was performed to reduce potential variables in the stiffness of individual models in the analysis of the testing data.
The models were numbered 1 through 30 on the shaft and on the medial malleolus. A custom jig was constructed with a table saw to create identical vertical shear medial malleolar fracture patterns in each model. The jig created the vertical shear SAD fracture described by Lauge-Hansen.7 All models were randomly assigned to 1 of 3 groups; each group consisted of 10 models (Figures 1A, 1B).
The 10 specimens in group 1 were fixed with a 5-hole, 3.5-mm, one-third tubular plate (Smith & Nephew) in a traditional AG fashion. The plates were placed at the same location on all tibiae. The proximal hole and the hole closest to the fracture line were filled with 3.5-mm cortical screws, which were long enough to achieve bicortical fixation. No lag screws were placed in this specimen group. In group 2, specimens were fixed with the same plate used in group 1 (Smith & Nephew). In this modified AG (MAG) construct, specimens were fixed identically to group 1 for plate placement and fixation of the 2 proximal screws. In this group, an additional screw was placed perpendicular to the fracture and parallel to the distal tibial articular surface. In both groups (AG and MAG), the plates were not bent before application.
Group 3 consisted of specimens fixed with a 5-hole, precontoured medial malleolar HP (Arthrex). This HP construct was fixed with two 3.5-mm cortical screws long enough to achieve bicortical fixation. The plate also engaged the bone at the tip of the medial malleolus by using 2 sharp prongs. The screws were placed in the most proximal hole and the hole just proximal to the fracture line. No lag screws were placed in the HP construct.
All models were tested in offset-axial loading to replicate a SAD moment similar to previous studies. To test offset-axial loading, a vice held each model identically with a 17º angle from the longitudinal axis (Figure 2). Loading was performed with a material testing system; a material testing system plunger was directed at the inferior articulating cartilage surface of the medial malleolus. The specimens were loaded at a rate of 1 mm/sec until 2 mm of displacement was reached (Figure 3) or catastrophic failure occurred. The raw data analyzed consisted of the initial stiffness of the construct and the overall load-to-failure. The slope of the linear portion of the load-displacement curve of stiffness determined stiffness of the construct.
One-way analysis of variance with post hoc Tukey HSD data analysis was performed to determine if there were statistical differences among the different fixation constructs during load-to-failure. To prevent skewing of results by different values of model elasticity, pretest stiffness was accounted for by calculating a ratio of construct stiffness as a function of pretest model stiffness. Total force-to-failure was the recorded maximum force (in N) to cause failure. A P value of < .05 was set for significance. All data were analyzed using SPSS software (SPSS Version 15.0; SPSS Inc.).
Results
Analysis of pretest stiffness showed no significant difference among models (P = .490). All models failed by a gap of 2 mm at the distal fracture site except for 3 models in the MAG group. These 3 models failed at a much higher load than the remainder of the models and failed by fracture of the models.
The MAG group demonstrated significantly superior stiffness to the 2 other models tested (Figure 4). On average, this group required 753.5 N of force before failure. This was 530 N higher than the HP (P < .05) and 638 N higher than the AG constructs, respectively (P < .05). The HP and AG groups required forces of 223.2 N and 115.5 N for failure, respectively. These numbers were not significant (P= .063).
The absolute construct stiffness and construct stiffness as a function of pretest stiffness of the MAG group was the highest of all groups, 271.7 N/mm and 57.2%, respectively (Figure 5). These numbers showed significance when compared with the values of the HP group (P < .05 for both) and the AG group (P < .05 for both). The average stiffness of the HP group was 159.7 N/mm, which was 36.8% of pretest stiffness.
The AG group had the lowest construct stiffness and percent of pretest stiffness (128.1 N/mm and 29.6%). The HP and AG groups were not statistically different in these comparisons, P = .350 for construct stiffness and P = .395 for percent of pretest stiffness.
Discussion
These results support the use of a one-third tubular plate and lag-screw construct for fixation of vertical shear medial malleolus fractures. This is clinically important because one-third tubular plates with 3.5-mm screws are readily available and cost significantly less than a precountoured anatomic-specific type of fixation. These results are based on the biomechanical properties of the constructs tested in this study.
The previous 2 studies8,9showed conflicting results about the most biomechanically sound fixation for SAD medial malleolar fractures. The study by Toolan and colleagues9 reported that 2 screws placed perpendicular to the fracture demonstrated the strongest overall construct. This study compared 3 separate types of 2-screw–only fixations and 2 plate-and-screw fixations. One construct was similar to the AG group in our study, and the other construct had a lag screw at the apex of the fracture. This previous study,9 however, did not investigate a similar construct to the MAG group that was tested in our study.
According to Dumigan and associates,8 a construct that consisted of a 4-hole plate with 2 screws proximal to the fracture and 2 lag screws showed the strongest fixation. This study, however, did not include a group like our study’s AG group, which is the traditional AG form of fixation.
In our study, we examined the biomechanic properties of a traditional fixation (AG construct), a commonly used fixation (MAG construct), and a newer construct (HP construct). The HP group is unique to this study and, to our knowledge, there is no literature on its use as fixation for this fracture. We did not include a 2-screw–only group, which is a limitation, because this fixation type is not common for the SAD fracture. This study also did not include an HP construct with an additional lag screw, which is an available option as well.
The current investigation used synthetic bone models constructed for biomechanical testing. The models were thought to provide a consistent model for fixation as opposed to using potentially osteopenic cadaveric bone. Each model was the same size and laterality. The stiffness as determined by pretest stiffness was not significantly different among models. Because all models were similar in composition and size, this allowed for more consistent osteotomies and similarly sized malleolar fragments. Theoretically, this allowed a more uniform comparison of all specimens and constructs.
Using models, however, is a limit of this study. While the models were of similar biomechanical quality, it is possible that a model may not reproduce the biology of a cavaderic specimen or the physiology of a construct in vivo. Of the 2 studies that investigated SAD fractures, the Dumigan study8 used cadaveric specimens. The fact that these models were all mildly osteoporotic and were embalmed specimens were study limits. The Toolan study9 used synthetic models. Although these models were consistent, they were models of bones and not intended for biomechanical studies, thereby increasing the potential for skewed results.
Our study investigated loading only in the offset-axial direction, a difference when compared to the Dumigan and colleagues8 and Toolan and colleagues9 studies. The offest transverse loading previously investigated would most likely represent an external rotation moment. While fixation in vivo could experience an external rotation moment, the specific fracture pattern of interest fails in offset-axial loading. In the original discription of the SAD fracture, Lauge-Hanson7 stated that the talus causes the vertically oriented medial malleolar fracture in the extreme of ankle supination with an adduction moment. Considering this, we investigated failure with a force in the direction that causes this type of fracture.
There are some additional limitations. This study demonstrated superiority of a one-third tubular plate with 2 screws proximally and 1 lag screw. While this was shown in the laboratory under pure offset-axial loading conditions, this may not reproduce daily forces experienced by the constructs. Additionally, this study examined load-to-failure of the constructs and did not investigate cyclic loading that a construct would experience in vivo. Because the testing is not recognizably consistent with day-to-day stresses of these constructs in vivo, this confounds the clinical application of our study.
The stiffness required for clinical healing is undetermined and, therefore, all 3 types of fixation could be adequate clinically. Patients are typically instructed to adhere to weight-bearing limitations on the affected extremity, and casts or splints are applied postoperatively for extended periods of time. Clinical studies would have significant benefit in the evaluation of fixation of vertical shear medial malleolar fractures.
Conclusion
AG plating technique with lag-screw placement is biomechanically superior to the other 2 constructs investigated. The clinical applications of these results are not known, and clinical trials are suggested to determine the best type of fixation for SAD-type medial malleolar fractures.
1. Hak DJ, Egol KA, Gardner MJ, Haskell A. The “not so simple” ankle fracture: avoiding problems and pitfalls to improve patient outcomes. Instr Course Lect. 2011;60:73-88.
2. Hamilton WC. Supination-adduction injuries. In: Hamilton WC, ed. Traumatic Disorders of the Ankle. 1st ed. New York, NY: Springer-Verlag; 1984:101-112.
3. McConnell T, Tornetta P. Marginal plafond impaction in association with supination-adduction ankle fractures: a report of eight cases. J Orthop Trauma. 2001;15(6):447-449.
4. Arimoto HK, Forrester DM. Classification of ankle fractures: an algorithm. AJR Am J Roentgenol. 1980;135(5):1057-1063.
5. Carr JB. Malleolar fractures and soft tissue injuries of the ankle. In: Browner BD, Jupiter JB, Levine AM, Trafton PG, Krettek C, eds. Skeletal Trauma: Basic Science, Management and Reconstruction. 4th ed. Philadelphia, PA: Saunders Elsevier; 2009:2515-2584.
6. Davidovitch RI, Egol KA. Ankle fractures. In: Bucholz RW HJ, Court-Brown CM, Tornetta P III, eds. Rockwood and Green’s Fractures in Adults. 7th ed. Philadelphia, PA: Lippincott, Williams, & Wilkins; 2010:1975-2021.
7. Lauge-Hansen N. Fractures of the ankle. II. Combined experimental-surgical and experimental-roentgenologic investigations. Arch Surg. 1950;60(5):957-985.
8. Dumigan RM, Bronson DG, Early JS. Analysis of fixation methods for vertical shear fractures of the medial malleolus. J Orthop Trauma. 2006;20(10):687-691.
9. Toolan BC, Koval KJ, Kummer FJ, Sanders R, Zuckerman JD. Vertical shear fractures of the medial malleolus: a biomechanical study of five internal fixation techniques. Foot Ankle Int. 1994;15(9):483-489.
Shoulder Instability Management: A Survey of the American Shoulder and Elbow Surgeons
Despite an abundance of peer-reviewed resources, there is wide variation in the surgical management of shoulder instability.1,2 Current American Academy of Orthopaedic Surgeons (AAOS) clinical practice guidelines regarding the shoulder address only generalized shoulder pain, glenohumeral osteoarthritis, and rotator cuff injuries,3,4 and treatment algorithms focus on conservative treatment, rather than surgical recommendations.4-7
Shoulder instability most commonly results from 1 or more of 4 common lesions (capsular laxity, glenoid bone loss, humeral bone loss, and capsulolabral insufficiency).8 While it is a relatively common condition that represents 1% to 2% of all athletic injuries,9,10 little consensus exists about surgical indications, ideal treatment algorithms, or optimal operative technique. This is a critical issue because more than 50% of patients with glenohumeral instability will undergo surgical intervention.11 Chahal and associates6 surveyed 44 shoulder experts and reported strong consensus about diagnosis, but little agreement regarding surgical management. Owens and colleagues1 have also evaluated current trends for surgical treatment of this pathology. Randelli and associates5 attempted to categorize operative management based upon case-specific shoulder scenarios through online surveys. Their survey, however, covered a broad range of shoulder injuries rather than instability in particular. In this study, we assess trends for surgical management of glenohumeral instability in a case-based survey of shoulder experts.
Materials and Methods
Survey Information
An online survey (Survey Monkey) of 417 active members of the American Shoulder and Elbow Surgeons (ASES) was administered on May 1, 2014. Respondents were blinded to the institution and co-investigators conducting the survey. The survey link was distributed via email because it has been shown to be a more efficacious conduit than standard postal mail.12 The case-based, 25-question survey (Appendix) was designed to assess respondents’ selection of surgical intervention. Section 1 determined member demographics, including fellowship training, arthroscopy experience, and years of practice. Section 2 involved the presentation of 5 case scenarios. For each case, respondents were asked to identify the optimal surgical procedure in both primary and revision settings. Section 3 posed several general questions regarding shoulder-instability management.
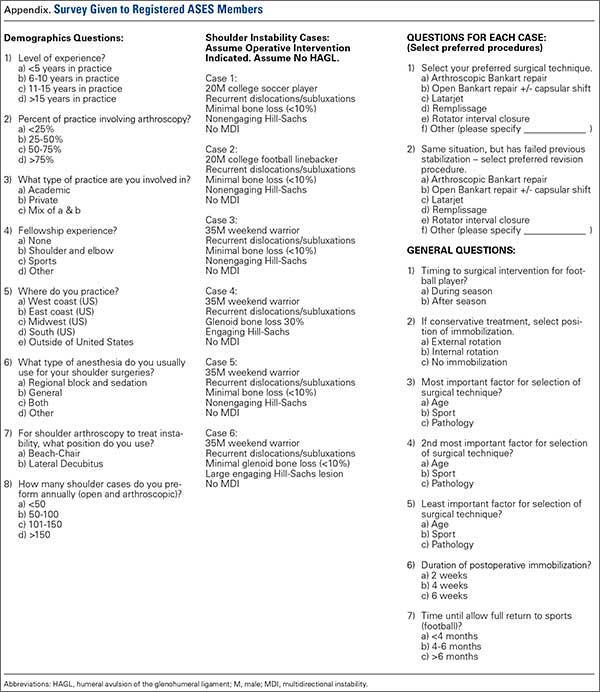
Statistical Analysis
Data were stored using Microsoft Excel (Microsoft) and analyzed using SAS Software version 9.3 (SAS Institute, Inc.). Demographic survey responses were reported using descriptive statistics. Responses to clinical survey questions were reported using frequencies and percentages. To identify when a majority consensus was achieved for a given question, responses were flagged as reaching consensus when more than 50% of participants gave the same response.13In the event that only 2 response options were available, reaching consensus required 67% of respondents to choose a single answer (since, by default, a consensus would be reached with only 2 response options). Because this was an analysis of all respondents, an a priori power calculation was not performed. Associations between training and practice demographics and responses to clinical questions were investigated using chi-square analyses. All comparative analyses were two-tailed and used P = .05 as the threshold for statistical significance.
Results
Demographics
One hundred and twenty-five (29.9%) ASES members responded to the survey. Of the respondents, 71.2% reported at least 15 years of experience, and 71% performed more than 150 shoulder cases annually. Surgeons came from academic institutions (41.6%), private practice (24.8%), or mixed (33.6%). The majority of respondents were fellowship-trained in shoulder/elbow surgery (52.8%), while fewer had completed a sports-medicine fellowship (24.0%). For arthroscopic procedures, responses were nearly divided between those who preferred beach-chair positioning (47.2%) and those who preferred the lateral decubitus position (46.4%). The majority (70.4%) of respondents practiced in the United States and with a relatively even distribution among states and region. The remaining 29.6% of those surveyed practiced abroad.
Degree of Consensus Responses and Cases
Of the 25 survey questions, 6 questions were omitted from consensus calculations because these were designed for demographic categorization rather than professional opinion (questions 1-5, 8). Thirteen of the remaining 19 questions (68%) reached consensus response. All clinical case scenarios (5 of 5) reached consensus for selection of technique for the primary procedure; however, only 40% (2 of 5) of cases had a consensus in the revision setting.
In case 1, a young soccer player (noncontact athlete) with negligible bone loss, arthroscopic Bankart repair was recommended by 81.6% of respondents. In the event of revision surgery, only 22.4% recommended arthroscopic Bankart repair, and the remainder split between open Bankart repair with possible capsular shift (36%) or Latarjet procedure (32.8%).
In case 2, a college American football player (contact athlete) with negligible bone loss, arthroscopic Bankart repair was recommended by 56.8%. In the event of revision surgery, a majority of members (51.2%) suggested a Latarjet procedure.
In case 3, the weekend warrior with significant bone loss, most respondents recommended a Latarjet procedure for both primary (72.8%) and revision surgery (79.0%).
In case 4, a weekend warrior with multidirectional instability, 60% of respondents suggested arthroscopic Bankart repair, 21.6% recommended rotator interval closure, and 10.4% chose a capsular shift. As a revision procedure, there was less agreement, with a split between open Bankart repair (39.2%) and capsular shift only (39.2%).
In case 5, the weekend warrior with large engaging Hill-Sachs lesions, 60% of respondent selected a remplissage procedure. If revision was required, a Latarjet procedure was the choice of 48.8% of respondents (Table).
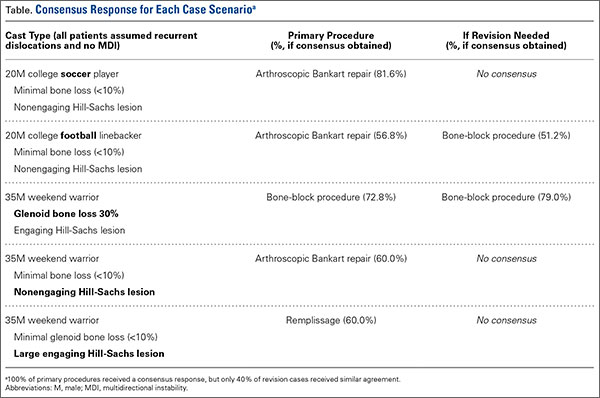
General Questions
For contact athletes, most respondents (87.2%) would allow return to play in the same season and recommended surgery after the end of the season. After surgical intervention, 56.8% prescribed 4 weeks of immobilization. When counseling a return to contact sports, 51.2% recommended waiting for 4 to 6 months.
The ASES members were divided on conservative management of instability injuries. Responses included immobilization in internal rotation (39.2%), no immobilization (39.2%), and external-rotation bracing (21.6%).
Finally, members thought the most important factor in choosing surgical technique was the patient’s pathology, then age; the least influential criteria was the patient’s sports participation.
Analysis of Training Demographics and Surgical Technique Preferences
Chi-square analyses demonstrated that respondents who completed a sports fellowship were more likely to do at least 50% of cases arthroscopically (odds ratio [OR], 15.3; P < .001) and were more likely to use the lateral decubitus position (OR, 2.8; P < .021). Furthermore, American respondents had a higher likelihood of having completed either a sports fellowship (OR, 12.8; P < .001) or a shoulder/elbow fellowship (OR, 4.6; P = .002) when compared with foreign respondents.
Discussion
In the absence of formal clinical practice guidelines, most surgeons formulate treatment strategy based upon a combination of experience and peer-reviewed evidence. The cohort analyzed in the current study was highly experienced, with more than 70% performing 150 shoulder cases annually and having more than 15 years of experience. We found a consensus response in 68% of questions and all primary surgical techniques for our shoulder instability scenarios. While expert consensus reported here is not equivalent to evidence-based clinical practice guidelines, it does provide important information to consider when treating anterior shoulder instability.
Specific responses to our case scenarios invite further reflection. Considering young (both noncontact and contact) athletes without bony pathology (cases 1 and 2, respectively), the ASES surgeons recommended arthroscopic Bankart repair for both. Randelli and associates5 found 71% of survey respondents recommended arthroscopic Bankart repair in a similar setting. It is interesting to note that consensus persisted regardless of the sport in which they engaged. Contact athletes have the highest rates of dislocation (up to 7 times higher incidence) compared with the general population.14 In addition, they have a higher recurrence rate after surgery.15 It should be noted, however, that although both cases reached consensus, the percentage of experts who recommended an arthroscopic procedure fell from 82% in the noncontact athlete to 57% in the contact athlete. This concurs with a recent review by Harris and Romeo,16 who recommended similar treatments for athletes without bony defects. In an older patient population with recurrent instability (case 3), responses varied more widely but still reached a consensus on primary surgical techniques. Respondents agreed that, even for patients with multidirectional instability, initial management should consist of arthroscopic capsulolabral repair. Overall, the agreement for arthroscopy for cases 1 through 3 mimics recent US practice patterns, showing 90% of stabilizations are being performed arthroscopically.17 Additionally, a recent meta-analysis by Harris and associates18 favored arthroscopic Bankart repair, showing no significant difference vs open stabilization even on long-term follow-up.
Glenoid bone loss is a difficult clinical scenario and that is reflected in this study’s findings. The literature suggests that arthroscopic Bankart repair, in this setting, is usually not sufficient and may result in a recurrence rate up to 75%, if bone loss greater than 20% is unaddressed.19 Our study supports this trend because ASES members recommended a Latarjet procedure when there is substantial bone loss.
While open Latarjet procedure was the consensus for dealing with glenoid bone loss, arthroscopic techniques were strongly favored for humeral head defects. This change in practice patterns results from the introduction of the arthroscopic remplissage technique.20 Two recent systemic reviews have supported this technique, reporting good functional outcomes for engaging Hill-Sachs lesions.21,22 Our study had similar agreement, with most respondents recommending remplissage for these patients.
This study found the lowest rates of expert consensus in the setting of revision surgery, likely caused, in part, by the paucity of available large cohort studies. This is a major void in the literature, and more studies are needed to help guide surgeons on the best techniques to deal with this difficult patient population.
Conservative bracing technique was 1 of the survey questions lacking a consensus response. Interestingly, 39% of members recommended no immobilization after an instability event. This contrasts with recent literature concerning the best position for bracing. We also found twice as many surgeons recommended internal rotation immobilization over external rotation. This is a subject of debate, with some studies stating improvement with external rotation immobilization,23 while other studies reported no difference.24 Overall, recommendations regarding type of immobilization are unclear, which will likely continue until larger studies can be performed.
The literature describing surgical trends in the treatment of shoulder instability is sparse and variable. With regard to other shoulder etiologies, only rotator cuff pathology has used expert consensus. Acevedo and colleagues13 reported agreement of ASES members surveyed regarding rotator cuff management. There was no consensus among surgeons in more than 50% of questions, despite AAOS published guidelines for rotator cuff treatment.25 Despite the lack of guidelines for our topic, we found a consensus among respondents with 68% of survey questions.
To date, only 2 studies of shoulder instability management have elicited the opinion of experts in shoulder surgery. Chahal and associates6 surveyed 42 members of ASES and JOINTS (Joined Orthopaedic Initiatives for National Trials of the Shoulder) Canada on shoulder instability cases and found substantial agreement on diagnosis but little consensus regarding surgical technique. This lack of agreement on procedures differs from our findings and may be related to their complicated case scenarios that generated a wide array of treatment recommendations. Randelli and colleagues5 surveyed more than 1000 European Society of Sports Traumatology, Knee Surgery, and Arthroscopy members and reported similar agreement on arthroscopic Bankart repair in young male shoulder-dislocation patients, although no other instability scenarios were investigated. Our study is the first to report responses from expert shoulder surgeons on surgical-treatment strategies for an array of common shoulder instability pathologies.
This study had several limitations. First, while our study suffered from a low response rate (29.9%), it was similar to other published studies.5,13 Second, because the case series included in the survey attempted to capture the most common instability scenarios, they were limited in their scope and failed to address additional etiologies or pathologic permutations. We believe, however, that a more comprehensive survey would have resulted in respondent fatigue and lowered the response rate. It is unlikely that any survey could capture all variables that come into play during clinical decision-making, and we sought to evaluate the most common shoulder instability scenarios. Third, 30% of respondents were from outside the United States, where the Latarjet procedure is much more popular. While this was not a majority, Latarjet’s regional preference may have decreased the consensus response in some scenarios if only the United States was included. Finally, there is inherent bias in a respondent pool that is heavily weighted to shoulder-surgery experts (ASES members) and does not consider the responses of the general orthopedic surgery community as have other studies.7
Conclusion
This study demonstrates that expert shoulder surgeons often agreed on shoulder-treatment principles for anterior shoulder instability. In the setting of primary repair, arthroscopic Bankart repair was favored in the absence of bony pathology, regardless of age (20 to 35 years) or nature of sport (contact versus noncontact). Latarjet procedures were favored in the setting of glenoid bone loss, and remplissage for an engaging Hill-Sachs lesion. Less agreement was observed for revision stabilization. It should be noted that, while consensus was often reached for our cases, there was a wide distribution of technical considerations and surgical preferences even among those who are fellowship-trained and high-volume surgeons, and who can be considered experts in the field of shoulder surgery.
1. Owens BD, Harrast JJ, Hurwitz SR, Thompson TL, Wolf JM. Surgical trends in bankart repair: an analysis of data from the American Board of Orthopaedic Surgery certification examination. Am J Sports Med. 2011;39(9):1865-1869.
2. Loebenberg MI, Rosen JE, Ishak C, Jazrawi LM, Zuckerman JD. A survey of decision-making processes in the treatment of common shoulder ailments among primary care physicians. Bull Hosp Jt Dis. 2006;63(3-4):137-144.
3. American Academy of Orthopaedic Surgeons. AAOS clinical practice guidelines (CPG). www.aaos.org/research/guidelines/guide.asp. Updated December 30, 2013. Accessed May 1, 2015.
4. Sanders JO, Bozic KJ, Glassman SD, Jevsevar DS, Weber KL. Clinical practice guidelines: their use, misuse, and future directions. J Am Acad Orthop Surg. 2014;22(3):135-144.
5. Randelli P, Arrigoni P, Cabitza F, Ragone V, Cabitza P. Current practice in shoulder pathology: results of a web-based survey among a community of 1,084 orthopedic surgeons. Knee Surg Sports Traumatol Arthrosc. 2011;20(5):803-815.
6. Chahal J, Kassiri K, Dion A, MacDonald P, Leiter J. Diagnostic and treatment differences among experienced shoulder surgeons for instability conditions of the shoulder. Clin J Sport Med. 2007;17(1):5-9.
7. Redfern J, Burks R. 2009 survey results: surgeon practice patterns regarding arthroscopic surgery. Arthroscopy. 2009;25(12):1447-1452.
8. Burkhart SS, De Beer JF. Traumatic glenohumeral bone defects and their relationship to failure of arthroscopic bankart repairs: significance of the inverted-pear glenoid and the humeral engaging hill-sachs lesion. Arthroscopy. 2000;16(7):677-694.
9. Owens BD, Agel J, Mountcastle SB, Cameron KL, Nelson BJ. Incidence of glenohumeral instability in collegiate athletics. Am J Sports Med. 2009;37(9):1750-1754.
10. Owens MBD, Duffey ML, Nelson BJ, et al. The incidence and characteristics of shoulder instability at the United States Military Academy. Am J Sports Med. 2007;35(7):1168-1173.
11. Hovelius L, Olofsson A, Sandström B, et al. Nonoperative treatment of primary anterior shoulder dislocation in patients forty years of age and younger. A prospective twenty-five-year follow-up. J Bone Joint Surg Am. 2008;90(5):945-952.
12. Raziano DB, Jayadevappa R, Valenzula D, Weiner M, Lavizzo-Mourey R. E-mail versus conventional postal mail survey of geriatric chiefs. Gerontologist. 2001;41(6):799-804.
13. Acevedo DC, Paxton ES, Williams GR, Abboud JA. A survey of expert opinion regarding rotator cuff repair. J Bone Joint Surg Am. 2014;96(14):e123.
14. Kaplan LD, Flanigan DC, Norwig J, Jost P, Bradley J. Prevalence and variance of shoulder injuries in elite collegiate football players. Am J Sports Med. 2005;33(8):1142-1146.
15. Petrera M, Dwyer T, Tsuji MR, Theodoropoulos JS. Outcomes of arthroscopic Bankart repair in collision versus noncollision athletes. Orthopedics. 2013;36(5):e621-e626.
16. Harris JD, Romeo AA. Arthroscopic management of the contact athlete with instability. Clin Sports Med. 2013;32(4):709-730.
17. Zhang AL, Montgomery SR, Ngo SS, Hame SL, Wang JC, Gamradt SC. Arthroscopic versus open shoulder stabilization: current practice patterns in the united states. Arthroscopy. 2014;30(4):436-443.
18. Harris JD, Gupta AK, Mall NA, et al. Long-term outcomes after Bankart shoulder stabilization. Arthroscopy. 2013;29(5):920-933.
19. Boileau P, Villalba M, Héry J, Balg F, Ahrens P, Neyton L. Risk factors for recurrence of shoulder instability after arthroscopic Bankart repair. J Bone Joint Surg Am. 2006;88(8):1755-1763.
20. Purchase RJ, Wolf EM, Hobgood ER, Pollock ME, Smalley CC. Hill-sachs ”remplissage”: an arthroscopic solution for the engaging hill-sachs lesion. Arthroscopy. 2008;24(6):723-726.
21. Buza JA 3rd, Iyengar JJ, Anakwenze OA, Ahmad CS, Levine WN. Arthroscopic Hill-Sachs remplissage: a systematic review. J Bone Joint Surg Am. 2014;96(7):549-555.
22. Rashid MS, Crichton J, Butt U, Akimau PI, Charalambous CP. Arthroscopic “Remplissage” for shoulder instability: a systematic review. Knee Surg Sports Traumatol Arthrosc. 2014:1-7.
23. Itoi E, Hatakeyama Y, Kido T, et al. A new method of immobilization after traumatic anterior dislocation of the shoulder: a preliminary study. J Shoulder Elbow Surg. 2003;12(5):413-415.
24. Whelan DB, Litchfield R, Wambolt E, Dainty KN; Joint Orthopaedic Initiative for National Trials of the Shoulder (JOINTS). External rotation immobilization for primary shoulder dislocation: A randomized controlled trial. Clin Orthop Relat Res. 2014;472(8):2380-2386.
25. Pedowitz RA, Yamaguchi K, Ahmad CS, et al. American Academy of Orthopaedic Surgeons Clinical Practice Guideline on: optimizing the management of rotator cuff problems. J Bone Joint Surg Am. 2012;94(2):163-167.
Despite an abundance of peer-reviewed resources, there is wide variation in the surgical management of shoulder instability.1,2 Current American Academy of Orthopaedic Surgeons (AAOS) clinical practice guidelines regarding the shoulder address only generalized shoulder pain, glenohumeral osteoarthritis, and rotator cuff injuries,3,4 and treatment algorithms focus on conservative treatment, rather than surgical recommendations.4-7
Shoulder instability most commonly results from 1 or more of 4 common lesions (capsular laxity, glenoid bone loss, humeral bone loss, and capsulolabral insufficiency).8 While it is a relatively common condition that represents 1% to 2% of all athletic injuries,9,10 little consensus exists about surgical indications, ideal treatment algorithms, or optimal operative technique. This is a critical issue because more than 50% of patients with glenohumeral instability will undergo surgical intervention.11 Chahal and associates6 surveyed 44 shoulder experts and reported strong consensus about diagnosis, but little agreement regarding surgical management. Owens and colleagues1 have also evaluated current trends for surgical treatment of this pathology. Randelli and associates5 attempted to categorize operative management based upon case-specific shoulder scenarios through online surveys. Their survey, however, covered a broad range of shoulder injuries rather than instability in particular. In this study, we assess trends for surgical management of glenohumeral instability in a case-based survey of shoulder experts.
Materials and Methods
Survey Information
An online survey (Survey Monkey) of 417 active members of the American Shoulder and Elbow Surgeons (ASES) was administered on May 1, 2014. Respondents were blinded to the institution and co-investigators conducting the survey. The survey link was distributed via email because it has been shown to be a more efficacious conduit than standard postal mail.12 The case-based, 25-question survey (Appendix) was designed to assess respondents’ selection of surgical intervention. Section 1 determined member demographics, including fellowship training, arthroscopy experience, and years of practice. Section 2 involved the presentation of 5 case scenarios. For each case, respondents were asked to identify the optimal surgical procedure in both primary and revision settings. Section 3 posed several general questions regarding shoulder-instability management.
Statistical Analysis
Data were stored using Microsoft Excel (Microsoft) and analyzed using SAS Software version 9.3 (SAS Institute, Inc.). Demographic survey responses were reported using descriptive statistics. Responses to clinical survey questions were reported using frequencies and percentages. To identify when a majority consensus was achieved for a given question, responses were flagged as reaching consensus when more than 50% of participants gave the same response.13In the event that only 2 response options were available, reaching consensus required 67% of respondents to choose a single answer (since, by default, a consensus would be reached with only 2 response options). Because this was an analysis of all respondents, an a priori power calculation was not performed. Associations between training and practice demographics and responses to clinical questions were investigated using chi-square analyses. All comparative analyses were two-tailed and used P = .05 as the threshold for statistical significance.
Results
Demographics
One hundred and twenty-five (29.9%) ASES members responded to the survey. Of the respondents, 71.2% reported at least 15 years of experience, and 71% performed more than 150 shoulder cases annually. Surgeons came from academic institutions (41.6%), private practice (24.8%), or mixed (33.6%). The majority of respondents were fellowship-trained in shoulder/elbow surgery (52.8%), while fewer had completed a sports-medicine fellowship (24.0%). For arthroscopic procedures, responses were nearly divided between those who preferred beach-chair positioning (47.2%) and those who preferred the lateral decubitus position (46.4%). The majority (70.4%) of respondents practiced in the United States and with a relatively even distribution among states and region. The remaining 29.6% of those surveyed practiced abroad.
Degree of Consensus Responses and Cases
Of the 25 survey questions, 6 questions were omitted from consensus calculations because these were designed for demographic categorization rather than professional opinion (questions 1-5, 8). Thirteen of the remaining 19 questions (68%) reached consensus response. All clinical case scenarios (5 of 5) reached consensus for selection of technique for the primary procedure; however, only 40% (2 of 5) of cases had a consensus in the revision setting.
In case 1, a young soccer player (noncontact athlete) with negligible bone loss, arthroscopic Bankart repair was recommended by 81.6% of respondents. In the event of revision surgery, only 22.4% recommended arthroscopic Bankart repair, and the remainder split between open Bankart repair with possible capsular shift (36%) or Latarjet procedure (32.8%).
In case 2, a college American football player (contact athlete) with negligible bone loss, arthroscopic Bankart repair was recommended by 56.8%. In the event of revision surgery, a majority of members (51.2%) suggested a Latarjet procedure.
In case 3, the weekend warrior with significant bone loss, most respondents recommended a Latarjet procedure for both primary (72.8%) and revision surgery (79.0%).
In case 4, a weekend warrior with multidirectional instability, 60% of respondents suggested arthroscopic Bankart repair, 21.6% recommended rotator interval closure, and 10.4% chose a capsular shift. As a revision procedure, there was less agreement, with a split between open Bankart repair (39.2%) and capsular shift only (39.2%).
In case 5, the weekend warrior with large engaging Hill-Sachs lesions, 60% of respondent selected a remplissage procedure. If revision was required, a Latarjet procedure was the choice of 48.8% of respondents (Table).
General Questions
For contact athletes, most respondents (87.2%) would allow return to play in the same season and recommended surgery after the end of the season. After surgical intervention, 56.8% prescribed 4 weeks of immobilization. When counseling a return to contact sports, 51.2% recommended waiting for 4 to 6 months.
The ASES members were divided on conservative management of instability injuries. Responses included immobilization in internal rotation (39.2%), no immobilization (39.2%), and external-rotation bracing (21.6%).
Finally, members thought the most important factor in choosing surgical technique was the patient’s pathology, then age; the least influential criteria was the patient’s sports participation.
Analysis of Training Demographics and Surgical Technique Preferences
Chi-square analyses demonstrated that respondents who completed a sports fellowship were more likely to do at least 50% of cases arthroscopically (odds ratio [OR], 15.3; P < .001) and were more likely to use the lateral decubitus position (OR, 2.8; P < .021). Furthermore, American respondents had a higher likelihood of having completed either a sports fellowship (OR, 12.8; P < .001) or a shoulder/elbow fellowship (OR, 4.6; P = .002) when compared with foreign respondents.
Discussion
In the absence of formal clinical practice guidelines, most surgeons formulate treatment strategy based upon a combination of experience and peer-reviewed evidence. The cohort analyzed in the current study was highly experienced, with more than 70% performing 150 shoulder cases annually and having more than 15 years of experience. We found a consensus response in 68% of questions and all primary surgical techniques for our shoulder instability scenarios. While expert consensus reported here is not equivalent to evidence-based clinical practice guidelines, it does provide important information to consider when treating anterior shoulder instability.
Specific responses to our case scenarios invite further reflection. Considering young (both noncontact and contact) athletes without bony pathology (cases 1 and 2, respectively), the ASES surgeons recommended arthroscopic Bankart repair for both. Randelli and associates5 found 71% of survey respondents recommended arthroscopic Bankart repair in a similar setting. It is interesting to note that consensus persisted regardless of the sport in which they engaged. Contact athletes have the highest rates of dislocation (up to 7 times higher incidence) compared with the general population.14 In addition, they have a higher recurrence rate after surgery.15 It should be noted, however, that although both cases reached consensus, the percentage of experts who recommended an arthroscopic procedure fell from 82% in the noncontact athlete to 57% in the contact athlete. This concurs with a recent review by Harris and Romeo,16 who recommended similar treatments for athletes without bony defects. In an older patient population with recurrent instability (case 3), responses varied more widely but still reached a consensus on primary surgical techniques. Respondents agreed that, even for patients with multidirectional instability, initial management should consist of arthroscopic capsulolabral repair. Overall, the agreement for arthroscopy for cases 1 through 3 mimics recent US practice patterns, showing 90% of stabilizations are being performed arthroscopically.17 Additionally, a recent meta-analysis by Harris and associates18 favored arthroscopic Bankart repair, showing no significant difference vs open stabilization even on long-term follow-up.
Glenoid bone loss is a difficult clinical scenario and that is reflected in this study’s findings. The literature suggests that arthroscopic Bankart repair, in this setting, is usually not sufficient and may result in a recurrence rate up to 75%, if bone loss greater than 20% is unaddressed.19 Our study supports this trend because ASES members recommended a Latarjet procedure when there is substantial bone loss.
While open Latarjet procedure was the consensus for dealing with glenoid bone loss, arthroscopic techniques were strongly favored for humeral head defects. This change in practice patterns results from the introduction of the arthroscopic remplissage technique.20 Two recent systemic reviews have supported this technique, reporting good functional outcomes for engaging Hill-Sachs lesions.21,22 Our study had similar agreement, with most respondents recommending remplissage for these patients.
This study found the lowest rates of expert consensus in the setting of revision surgery, likely caused, in part, by the paucity of available large cohort studies. This is a major void in the literature, and more studies are needed to help guide surgeons on the best techniques to deal with this difficult patient population.
Conservative bracing technique was 1 of the survey questions lacking a consensus response. Interestingly, 39% of members recommended no immobilization after an instability event. This contrasts with recent literature concerning the best position for bracing. We also found twice as many surgeons recommended internal rotation immobilization over external rotation. This is a subject of debate, with some studies stating improvement with external rotation immobilization,23 while other studies reported no difference.24 Overall, recommendations regarding type of immobilization are unclear, which will likely continue until larger studies can be performed.
The literature describing surgical trends in the treatment of shoulder instability is sparse and variable. With regard to other shoulder etiologies, only rotator cuff pathology has used expert consensus. Acevedo and colleagues13 reported agreement of ASES members surveyed regarding rotator cuff management. There was no consensus among surgeons in more than 50% of questions, despite AAOS published guidelines for rotator cuff treatment.25 Despite the lack of guidelines for our topic, we found a consensus among respondents with 68% of survey questions.
To date, only 2 studies of shoulder instability management have elicited the opinion of experts in shoulder surgery. Chahal and associates6 surveyed 42 members of ASES and JOINTS (Joined Orthopaedic Initiatives for National Trials of the Shoulder) Canada on shoulder instability cases and found substantial agreement on diagnosis but little consensus regarding surgical technique. This lack of agreement on procedures differs from our findings and may be related to their complicated case scenarios that generated a wide array of treatment recommendations. Randelli and colleagues5 surveyed more than 1000 European Society of Sports Traumatology, Knee Surgery, and Arthroscopy members and reported similar agreement on arthroscopic Bankart repair in young male shoulder-dislocation patients, although no other instability scenarios were investigated. Our study is the first to report responses from expert shoulder surgeons on surgical-treatment strategies for an array of common shoulder instability pathologies.
This study had several limitations. First, while our study suffered from a low response rate (29.9%), it was similar to other published studies.5,13 Second, because the case series included in the survey attempted to capture the most common instability scenarios, they were limited in their scope and failed to address additional etiologies or pathologic permutations. We believe, however, that a more comprehensive survey would have resulted in respondent fatigue and lowered the response rate. It is unlikely that any survey could capture all variables that come into play during clinical decision-making, and we sought to evaluate the most common shoulder instability scenarios. Third, 30% of respondents were from outside the United States, where the Latarjet procedure is much more popular. While this was not a majority, Latarjet’s regional preference may have decreased the consensus response in some scenarios if only the United States was included. Finally, there is inherent bias in a respondent pool that is heavily weighted to shoulder-surgery experts (ASES members) and does not consider the responses of the general orthopedic surgery community as have other studies.7
Conclusion
This study demonstrates that expert shoulder surgeons often agreed on shoulder-treatment principles for anterior shoulder instability. In the setting of primary repair, arthroscopic Bankart repair was favored in the absence of bony pathology, regardless of age (20 to 35 years) or nature of sport (contact versus noncontact). Latarjet procedures were favored in the setting of glenoid bone loss, and remplissage for an engaging Hill-Sachs lesion. Less agreement was observed for revision stabilization. It should be noted that, while consensus was often reached for our cases, there was a wide distribution of technical considerations and surgical preferences even among those who are fellowship-trained and high-volume surgeons, and who can be considered experts in the field of shoulder surgery.
1. Owens BD, Harrast JJ, Hurwitz SR, Thompson TL, Wolf JM. Surgical trends in bankart repair: an analysis of data from the American Board of Orthopaedic Surgery certification examination. Am J Sports Med. 2011;39(9):1865-1869.
2. Loebenberg MI, Rosen JE, Ishak C, Jazrawi LM, Zuckerman JD. A survey of decision-making processes in the treatment of common shoulder ailments among primary care physicians. Bull Hosp Jt Dis. 2006;63(3-4):137-144.
3. American Academy of Orthopaedic Surgeons. AAOS clinical practice guidelines (CPG). www.aaos.org/research/guidelines/guide.asp. Updated December 30, 2013. Accessed May 1, 2015.
4. Sanders JO, Bozic KJ, Glassman SD, Jevsevar DS, Weber KL. Clinical practice guidelines: their use, misuse, and future directions. J Am Acad Orthop Surg. 2014;22(3):135-144.
5. Randelli P, Arrigoni P, Cabitza F, Ragone V, Cabitza P. Current practice in shoulder pathology: results of a web-based survey among a community of 1,084 orthopedic surgeons. Knee Surg Sports Traumatol Arthrosc. 2011;20(5):803-815.
6. Chahal J, Kassiri K, Dion A, MacDonald P, Leiter J. Diagnostic and treatment differences among experienced shoulder surgeons for instability conditions of the shoulder. Clin J Sport Med. 2007;17(1):5-9.
7. Redfern J, Burks R. 2009 survey results: surgeon practice patterns regarding arthroscopic surgery. Arthroscopy. 2009;25(12):1447-1452.
8. Burkhart SS, De Beer JF. Traumatic glenohumeral bone defects and their relationship to failure of arthroscopic bankart repairs: significance of the inverted-pear glenoid and the humeral engaging hill-sachs lesion. Arthroscopy. 2000;16(7):677-694.
9. Owens BD, Agel J, Mountcastle SB, Cameron KL, Nelson BJ. Incidence of glenohumeral instability in collegiate athletics. Am J Sports Med. 2009;37(9):1750-1754.
10. Owens MBD, Duffey ML, Nelson BJ, et al. The incidence and characteristics of shoulder instability at the United States Military Academy. Am J Sports Med. 2007;35(7):1168-1173.
11. Hovelius L, Olofsson A, Sandström B, et al. Nonoperative treatment of primary anterior shoulder dislocation in patients forty years of age and younger. A prospective twenty-five-year follow-up. J Bone Joint Surg Am. 2008;90(5):945-952.
12. Raziano DB, Jayadevappa R, Valenzula D, Weiner M, Lavizzo-Mourey R. E-mail versus conventional postal mail survey of geriatric chiefs. Gerontologist. 2001;41(6):799-804.
13. Acevedo DC, Paxton ES, Williams GR, Abboud JA. A survey of expert opinion regarding rotator cuff repair. J Bone Joint Surg Am. 2014;96(14):e123.
14. Kaplan LD, Flanigan DC, Norwig J, Jost P, Bradley J. Prevalence and variance of shoulder injuries in elite collegiate football players. Am J Sports Med. 2005;33(8):1142-1146.
15. Petrera M, Dwyer T, Tsuji MR, Theodoropoulos JS. Outcomes of arthroscopic Bankart repair in collision versus noncollision athletes. Orthopedics. 2013;36(5):e621-e626.
16. Harris JD, Romeo AA. Arthroscopic management of the contact athlete with instability. Clin Sports Med. 2013;32(4):709-730.
17. Zhang AL, Montgomery SR, Ngo SS, Hame SL, Wang JC, Gamradt SC. Arthroscopic versus open shoulder stabilization: current practice patterns in the united states. Arthroscopy. 2014;30(4):436-443.
18. Harris JD, Gupta AK, Mall NA, et al. Long-term outcomes after Bankart shoulder stabilization. Arthroscopy. 2013;29(5):920-933.
19. Boileau P, Villalba M, Héry J, Balg F, Ahrens P, Neyton L. Risk factors for recurrence of shoulder instability after arthroscopic Bankart repair. J Bone Joint Surg Am. 2006;88(8):1755-1763.
20. Purchase RJ, Wolf EM, Hobgood ER, Pollock ME, Smalley CC. Hill-sachs ”remplissage”: an arthroscopic solution for the engaging hill-sachs lesion. Arthroscopy. 2008;24(6):723-726.
21. Buza JA 3rd, Iyengar JJ, Anakwenze OA, Ahmad CS, Levine WN. Arthroscopic Hill-Sachs remplissage: a systematic review. J Bone Joint Surg Am. 2014;96(7):549-555.
22. Rashid MS, Crichton J, Butt U, Akimau PI, Charalambous CP. Arthroscopic “Remplissage” for shoulder instability: a systematic review. Knee Surg Sports Traumatol Arthrosc. 2014:1-7.
23. Itoi E, Hatakeyama Y, Kido T, et al. A new method of immobilization after traumatic anterior dislocation of the shoulder: a preliminary study. J Shoulder Elbow Surg. 2003;12(5):413-415.
24. Whelan DB, Litchfield R, Wambolt E, Dainty KN; Joint Orthopaedic Initiative for National Trials of the Shoulder (JOINTS). External rotation immobilization for primary shoulder dislocation: A randomized controlled trial. Clin Orthop Relat Res. 2014;472(8):2380-2386.
25. Pedowitz RA, Yamaguchi K, Ahmad CS, et al. American Academy of Orthopaedic Surgeons Clinical Practice Guideline on: optimizing the management of rotator cuff problems. J Bone Joint Surg Am. 2012;94(2):163-167.
In Vivo Measurement of Rotator Cuff Tear Tension: Medial Versus Lateral Footprint Position
Although recent clinical results of arthroscopic rotator cuff repair (RCR) have been encouraging, achieving anatomical healing of full-thickness rotator cuff tears remains a challenge.1-4 Several factors influence rotator cuff healing after repair.1,3-8 Patient-related factors include advanced patient age, tear size, tear chronicity, and amount of fatty infiltration.1,3,5,6,8-10 Tension applied to the repair construct is a significant factor as well.11,12
In the literature, limited consideration has been given to repair tension.13 The majority of studies have focused on other factors, mainly repair technique. Some surgeons advocate use of a double-row repair construct in which the rotator cuff tendon is pulled to the lateral margin of the footprint.14-19 Double-row techniques, which include the transosseous-equivalent (TOE) construct, are biomechanically superior to other repairs.20-26 Another purported benefit of double-row repair is more complete restoration and pressurization of the rotator cuff footprint.21,24,27,28
Rotator cuff tears typically occur near the dysvascular region of the diseased musculotendinous unit, often leaving a stump of tissue attached to the tuberosity and ultimately a shortened tendon.29 In addition, full-thickness tears often retract over time. Meyer and colleagues29 recently demonstrated that this shortening is irreversible. Snyder30 and Sostak and colleagues31 suggested that pulling a shortened, degenerative rotator cuff tendon to the lateral margin of the footprint results in increased tissue tension compared with that produced with a more medially based repair just off the articular margin. In our opinion, the possible increase in tension during a laterally based repair, whether single- or double-row, may place excessive strain on the diseased tissue as well as the surgical construct, potentially contributing to repair failure.
We conducted a study to evaluate the difference, if any, in tension applied to the rotator cuff tendon positioned at the medial versus lateral margin of the footprint during arthroscopic RCR. We hypothesized significantly more tension would be placed on the rotator cuff tendon when positioned at the lateral versus medial footprint.
Methods
After obtaining Institutional Review Board approval for this study, we collected data on a consecutive series of patients who underwent arthroscopic RCR performed by Dr. Getelman at a single institution. Only patients with primary full-thickness tears of the supraspinatus and/or infraspinatus were included. Exclusion criteria included revision rotator cuff surgeries, partial-thickness tears, concurrent subscapularis tears requiring anchor fixation, and any tears that could not be mobilized to the lateral footprint without interval slides or margin convergence. The 20 identified patients constituted the study group.
Demographic factors, including age and preoperative length of symptoms, were recorded after chart review. Magnetic resonance imaging (MRI) was performed for all patients before surgery and was retrospectively reviewed. Dr. Getelman assigned each patient a modified Goutallier score, based on MRI, to assess for fatty infiltration/atrophy.32 Each patient was placed in the lateral decubitus position with the operative arm in balanced suspension at 70° of abduction. Standard glenohumeral and subacromial diagnostic arthroscopy was performed. The rotator cuff tear was gently debrided back to a healthy-appearing margin in preparation for repair. The tear was then measured in the anterior-posterior (A-P) and medial-lateral (M-L) planes using a premeasured, marked suture, as previously described.33 Complete bursal and articular-sided releases were performed to allow for appropriate mobilization of the tendon. The tear was classified as crescent-shaped, U-shaped, or L-shaped.
Viewing from the posterior portal, the surgeon inserted a tissue grasper through the lateral portal. The tendon was grasped at multiple points along its edge, anterior to posterior, and was translated laterally to assess its reducibility; the apex of the tear correlated with the point of maximal excursion and coverage of the footprint. Once confirmed, the rotator cuff tear apex was clamped with a tissue grasper. After placement in a sterile arthroscopic camera sleeve (DeRoyal camera drape with perforated tip), a calibrated digital weigh scale (American Weigh Scales model H22 portable electronic hanging scale, with accuracy of 0.01 lb) was attached to the tissue grasper with an S-hook (Figure 1). The tendon edge was first translated about 3 mm lateral to the articular margin (the medial footprint position), and tension was recorded (Figures 2A, 2B). After a 1-minute relaxation period, the tendon edge was translated to the lateral edge of the rotator cuff footprint (the lateral footprint position), and tension was recorded again (Figures 2C, 2D). A medially based single-row RCR with triple-loaded sutures and bone marrow vents placed in the lateral tuberosity was then completed, regardless of tension, tear size, or tear morphology.31 Typically, 1 anchor was used for every 10 to 15 mm of A-P tear length.
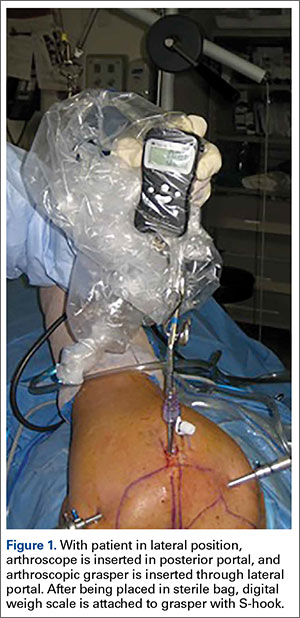
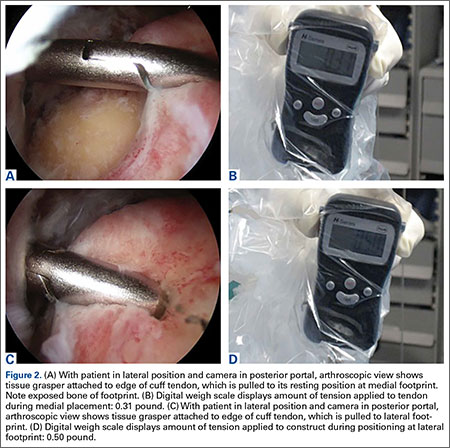
SAS software was used for statistical analysis, the Wilcoxon signed rank test for continuous or ordinal data comparisons between paired groups, and the Mann-Whitney test for continuous or ordinal data comparisons between independent, unmatched groups. One-way analysis of variance (ANOVA) was used to compare means among the 3 groups of morphology subtypes. Linear regression was performed to assess the simultaneous relationship between potential predictors (age, sex, length of symptoms, Goutallier score, tear size) and medial or lateral tension, where medial tension was included as an additional potential predictor for lateral tension. Restricted cubic splines were fit to assess linearity. Predictors were retained in multivariate regression using backward variable retention. Because of inadequate sample size, additivity was assumed except for sex. Statistical significance was set at P < .05.
Results
Of the 20 rotator cuff tears evaluated (Table 1), 13 were crescent-shaped, 5 were U-shaped, and 2 were L-shaped. Mean (SD) A-P tear size was 17.7 (5.8) mm, and mean (SD) M-L tear size was 19.1 (8.6) mm. Mean age of the 20 patients (15 men, 5 women) was 57.9 years (range, 44-72 years). Mean (SD) length of symptoms was 12.9 (12.4) months (range, 3-48 months). Mean (SD) modified Goutallier score was 1.4 (0.7; range, 0-3).
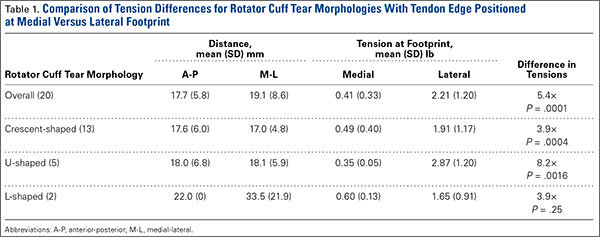
Mean (SD) rotator cuff tension for all tears approximated to the medial footprint was 0.41 (0.33) pound, and mean (SD) cuff tension for all tears approximated to the lateral footprint was 2.21 (1.20) pounds—representing a 5.4-fold difference (P < .0001).
No statistically significant differences were detected in the ANOVA comparing tensions at medial and lateral positions among tear morphologic subtypes (all Ps >.05).
Subgroup analysis (Table 2) was performed for smaller (≤20 mm A-P) and larger (>20 mm A-P) tears. For smaller tears, mean (SD) tension was 0.27 (0.24) pound applied with the cuff tendon pulled to the medial footprint and 2.06 (1.06) pounds applied with the tendon pulled to the lateral footprint—a 7.6-fold difference (P < .0018). For larger tears, mean (SD) tension was 0.58 (0.37) pound applied with the tendon pulled to the medial footprint and 2.38 (1.4) pounds applied with the tendon pulled to the lateral footprint—a 4.1-fold difference (P < .005).
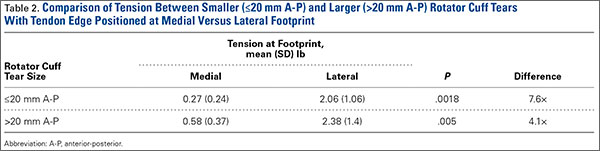
A statistically significant difference in tensions was found between small and large cuff tears positioned at the medial footprint (0.27 vs 0.58 lb; P = .0367); no difference was found between groups with the tendon at the lateral footprint (2.06 vs 2.38 lb; P = .284).
Univariate and multivariate analyses were performed using linear regression analysis (Table 3). During univariate analysis for medial footprint position, A-P tear size and Goutallier score both positively correlated with increasing tension; for lateral footprint position, no factors statistically correlated with lateral tension, though there was a positive trend for medial tension and female sex. During multivariate analysis for medial footprint position, only A-P tear size positively correlated with increasing tension; for lateral footprint position, both age (in nonlinear fashion as function of age + age2) and medial tension positively correlated with increasing tension.
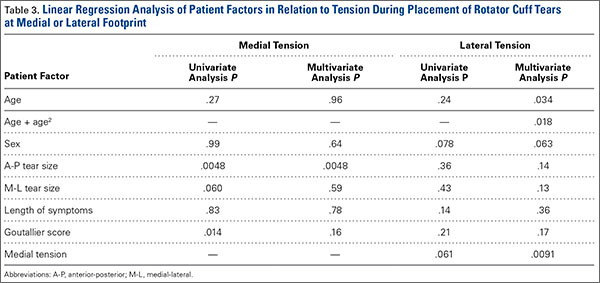
Discussion
Our results indicated that significantly more tension is placed on the torn rotator cuff tendon when it is reduced across the footprint from a medial to a more lateral position in vivo. More tension was required for all tears to be reduced to the lateral footprint compared with the medial footprint. As expected, compared with smaller tears, larger tears required significantly more tension in order to be reduced to the medial footprint. Interestingly, no statistical difference was found between tensions required to reduce either small or large tears to the lateral footprint, which suggests that, regardless of tear size, more force must be applied to reduce the torn tendon to the lateral footprint compared with the medial footprint.
Hersche and Gerber34 were the first to report rotator cuff tension measurements in vivo. Although their study did not specifically compare cuff tensions reducing the tear to the medial versus lateral footprint, it did examine tension at displacement of 10 and 20 mm. Tension increased from 27 N to 60 N, correlating with a 2.2-fold difference between the 2 distances. Domb and colleagues35 also compared in vivo rotator cuff tension differences between the medial footprint and the lateral footprint in 4 patients. Mean tension applied to the cuff during reduction to the articular margin was 27 N, or 6 pounds. Mean tension needed to reduce the cuff to the lateral tuberosity was 76 N, or 17 pounds, for a 2.8-fold difference. Tears were not measured but were described as massive and retracted.
Although repair tension has long been recognized as a crucial factor in RCR healing, little clinical research has focused on the effects of excess tension. Davidson and Rivenburgh11 prospectively followed the clinical outcomes of 67 consecutive cuff repairs after intraoperative tension measurement and found that high-tension repairs (>8 lb) had significantly lower clinical outcome measures. However, the authors did not report on correlations with radiologic healing and stated, “Functional outcome is inversely proportional to rotator cuff repair tension.” Further study of the in vivo effects of increased tension on clinical and radiologic outcomes is needed.
Several animal studies have been conducted on the effects of tension on RCRs. Gerber and colleagues36 reported that the force needed to produce 1 cm of sheep supraspinatus tendon excursion increased 7-fold, from 6.8 N to 47.8 N, after 40 weeks of tendon tear. Coleman and colleagues37 compared the modulus of elasticity in sheep supraspinatus tendon after 6 weeks and 18 weeks of detachment and reported increases of 60% and 70%, respectively. Gimbel and colleagues38 showed that, in a rat model, “repair tension rapidly increased initially after injury followed by a progressive, but less dramatic, increase with additional time.” Of note, we did not identify any correlation between chronicity of symptoms and the tension needed to reduce the tendon medially or to a more lateral position on the footprint.
In acute tears, the cuff tissue is more compliant and mobile and can be pulled laterally across its anatomical footprint with minimal tension.39 In contrast, cuff tissue in the more commonly encountered chronic tear is less compliant and is not mobile enough to be pulled to the lateral margin of the footprint without added stress.30,34,35 In large, acute tears in which there are minimal tissue degeneration and retraction, a laterally based footprint-restoring technique may be performed with minimal tension. This technique may have advantages over a medially based repair. In the literature, more attention needs to be directed toward the biomechanics and biology of chronic rotator cuff tears, as these are more commonly encountered.
Almost all of the prospective studies that have compared single- and double-row RCR have found no significant differences in MRI healing rates or clinical results at follow-up up to 2 years.14,16,40-45 Detailed analysis of the surgical techniques used in all these studies revealed that the rotator cuff tendons were repaired back to the lateral footprint in both the single- and double-row constructs.14,16,40-45 Although no clinical studies have compared medially and laterally based single-row repairs, our data suggest that medially based repairs have lower tensions and therefore should not be considered equivalent. Sostak and colleagues31 and Murray and colleagues46 have shown that a medially based single-row RCR can achieve excellent clinical and anatomical results, likely partly because of the lower tension applied to the torn cuff tissue.31,46 Studies are needed to compare medially and laterally based repairs, including single- and double-row repairs.
The vast majority of recent research has aimed to counteract construct tension with stronger biomechanical constructs.20-26 Surgeons have also aimed to improve biological healing by pulling the tendon laterally across the footprint to achieve complete footprint coverage, ultimately increasing the surface area for tendon–bone healing. This has led to the development of various double-row repair techniques, in which the cuff tendon is pulled to the lateral margin of its footprint. One row of anchors is placed in the medial aspect of the footprint, while a second is placed in the lateral aspect; the cuff is reduced and compressed to the tuberosity with various suture configurations. The TOE technique was developed to improve pressurization of the cuff tendon across the footprint by linking the 2 rows with bridging sutures. In doing so, however, the potentially deleterious effects of increased tension introduced by pulling the tendon laterally may have been overlooked. Nevertheless, the biomechanics and stress distribution likely differ between single-row repair and TOE repairs, and direct comparisons cannot be made at this time. The medial row of a double-row or TOE construct may stress-shield or “unload” the more lateral tissue. Studies are needed in order to better understand the tension differential and stress distribution of various double-row constructs.
Recognizing tear morphology is crucial in maximizing chances of healing after cuff repair. For example, a crescent-shaped tear is reduced to the tuberosity with direct lateral translation of the apex of the tear, which is also the deepest or most displaced part of the tear. On the other hand, reducing an L- or reverse L-shaped tear to the tuberosity is not as direct; reducing the deepest or most displaced part of the tear would lead to overreduction and overtensioning of the tendon. However, often the exact “elbow” of the tear is not obvious and appears more rounded; therefore, it is crucial for the surgeon to examine the mobility of the torn tendon along its entire length to minimize tension. Study is needed to assess tension along the entire length of the tear for different tear morphologies and sizes.
Although our results showed that increased tension was needed to reduce a torn tendon to its lateral footprint, no study has indicated exactly how much is “too much” tension. As stated earlier, use of stronger biomechanical constructs, including TOE constructs, may overcome the increased tension associated with laterally based repairs. In addition, laterally based repairs, either single- or double-row, may be best suited for tears with lower tension, whereas medially based repairs may be best suited for higher tension tears. It is also possible that the difference in tensions noted in this study is not significant enough to have a clinical impact on choice of construct or on anatomical healing. We need studies that correlate anatomical healing rates with repair tension in order to better guide surgeons on when to use a medially or laterally based repair.
Other possible effects of increased tension associated with laterally based repairs, including beneficial effects, must be considered as well. Viscoelastic properties of human rotator cuff tendon may dissipate increased tension over time through a variety of mechanisms. Stress relaxation, gap formation, creep, and the hysteresis effect, all associated with cyclical loading in the early healing period, may lead to dissipation of force over time.47,48 These more complex biomechanical properties of RCR constructs are yet to be clearly defined.
This study had several weaknesses. Its data represent a static measurement of time-zero rotator cuff tension, which greatly simplifies the biomechanics of the torn rotator cuff and repair construct as well as changes that occur with healing. During cuff repair, forces typically are distributed through several fixation points in stepwise process and are not focused on a single point of tissue with a grasper. Therefore, the findings of this study may not directly correlate with medially versus laterally based repairs in vivo. Furthermore, as this is a time-zero measurement, we could not determine whether the tension differential between the 2 repair positions remained static over time. Current literature suggests that muscle atrophy, fatty infiltration, and loss of elasticity of the musculotendinous unit are relatively irreversible.35,37,49 In addition, determining the precise apex of a cuff tear can be difficult, so error may have been introduced during this process. Last, although placement of the cuff tissue at the medial or lateral footprint position was based on visual estimation by an experienced and skilled arthroscopist, error may have been introduced based on this imprecise technique.
Conclusion
This study demonstrated a significant, 5.4-fold increase in in vivo time-zero rotator cuff tension with the tendon edge reduced to the lateral footprint rather than the medial footprint.
1. Boileau P, Brassart N, Watkinson DJ, Carles M, Hatzidakis AM, Krishnan SG. Arthroscopic repair of full-thickness tears of the supraspinatus: does the tendon really heal? J Bone Joint Surg Am. 2005;87(6):1229-1240.
2. Galatz LM, Ball CM, Teefey SA, Middleton WD, Yamaguchi K. The outcome and repair integrity of completely arthroscopically repaired large and massive rotator cuff tears. J Bone Joint Surg Am. 2004;86(2):219-224.
3. Nho SJ, Brown BS, Lyman S, Adler RS, Altchek DW, MacGillivray JD. Prospective analysis of arthroscopic rotator cuff repair: prognostic factors affecting clinical and ultrasound outcome. J Shoulder Elbow Surg. 2009;18(1):13-20.
4. Huijsmans PE, Pritchard MP, Berghs BM, van Rooyen KS, Wallace AL, de Beer JF. Arthroscopic rotator cuff repair with double-row fixation. J Bone Joint Surg Am. 2007;89(6):1248-1257.
5. Gulotta LV, Nho SJ, Dodson CC, Adler RS, Altchek DW, MacGillivray JD; HSS Arthroscopic Rotator Cuff Registry. Prospective evaluation of arthroscopic rotator cuff repairs at 5 years: part II—prognostic factors for clinical and radiographic outcomes. J Shoulder Elbow Surg. 2011;20(6):941-946.
6. Cho NS, Rhee YG. The factors affecting the clinical outcome and integrity of arthroscopically repaired rotator cuff tears of the shoulder. Clin Orthop Surg. 2009;1(2):96-104.
7. Gladstone JN, Bishop JY, Lo IK, Flatow EL. Fatty infiltration and atrophy of the rotator cuff do not improve after rotator cuff repair and correlate with poor functional outcome. Am J Sports Med. 2007;35(5):719-728.
8. Oh JH, Kim SH, Ji HM, Jo KH, Bin SW, Gong HS. Prognostic factors affecting anatomic outcome of rotator cuff repair and correlation with functional outcome. Arthroscopy. 2009;25(1):30-39.
9. Tashjian RZ, Hollins AM, Kim HM, et al. Factors affecting healing rates after arthroscopic double-row rotator cuff repair. Am J Sports Med. 2010;38(12):2435-2442.
10. Burkhart SS, Lo IK. Arthroscopic rotator cuff repair. J Am Acad Orthop Surg. 2006;14(6):333-346.
11. Davidson PA, Rivenburgh DW. Rotator cuff repair tension as a determinant of functional outcome. J Shoulder Elbow Surg. 2000;9(6):502-506.
12. Goutallier D, Postel JM, Van Driessche S, Godefroy D, Radier C. Tension-free cuff repairs with excision of macroscopic tendon lesions and muscular advancement: results in a prospective series with limited fatty muscular degeneration. J Shoulder Elbow Surg. 2006;15(2):164-172.
13. Gimbel JA, Van Kleunen JP, Lake SP, Williams GR, Soslowsky LJ. The role of repair tension on tendon to bone healing in an animal model of chronic rotator cuff tears. J Biomech. 2007;40(3):561-568.
14. Ma HL, Chiang ER, Wu HT, et al. Clinical outcome and imaging of arthroscopic single-row and double-row rotator cuff repair: a prospective randomized trial. Arthroscopy. 2012;28(1):16-24.
15. Mihata T, Watanabe C, Fukunishi K, et al. Functional and structural outcomes of single-row versus double-row versus combined double-row and suture-bridge repair for rotator cuff tears. Am J Sports Med. 2011;39(10):2091-2098.
16. Koh KH, Kang KC, Lim TK, Shon MS, Yoo JC. Prospective randomized clinical trial of single- versus double-row suture anchor repair in 2- to 4-cm rotator cuff tears: clinical and magnetic resonance imaging results. Arthroscopy. 2011;27(4):453-462.
17. Voigt C, Bosse C, Vosshenrich R, Schulz AP, Lill H. Arthroscopic supraspinatus tendon repair with suture-bridging technique: functional outcome and magnetic resonance imaging. Am J Sports Med. 2010;38(5):983-991.
18. Lafosse L, Brzoska R, Toussaint B, Gobezie R. The outcome and structural integrity of arthroscopic rotator cuff repair with use of the double-row suture anchor technique. Surgical technique. J Bone Joint Surg Am. 2008;90(suppl 2 pt 2):275-286.
19. Park JY, Lhee SH, Choi JH, Park HK, Yu JW, Seo JB. Comparison of the clinical outcomes of single- and double-row repairs in rotator cuff tears. Am J Sports Med. 2008;36(7):1310-1316.
20. Kim DH, ElAttrache NS, Tibone JE, et al. Biomechanical comparison of a single-row versus double-row suture anchor technique for rotator cuff repair. Am J Sports Med. 2006;34(3):407-414.
21. Mazzocca AD, Bollier MJ, Ciminiello AM, et al. Biomechanical evaluation of arthroscopic rotator cuff repairs over time. Arthroscopy. 2010;26(5):592-599.
22. Grimberg J, Diop A, Kalra K, Charousset C, Duranthon LD, Maurel N. In vitro biomechanical comparison of three different types of single- and double-row arthroscopic rotator cuff repairs: analysis of continuous bone–tendon contact pressure and surface during different simulated joint positions. J Shoulder Elbow Surg. 2010;19(2):236-243.
23. Nelson CO, Sileo MJ, Grossman MG, Serra-Hsu F. Single-row modified Mason-Allen versus double-row arthroscopic rotator cuff repair: a biomechanical and surface area comparison. Arthroscopy. 2008;24(8):941-948.
24. Park MC, ElAttrache NS, Tibone JE, Ahmad CS, Jun BJ, Lee TQ. Part I: footprint contact characteristics for a transosseous-equivalent rotator cuff repair technique compared with a double-row repair technique. J Shoulder Elbow Surg. 2007;16(4):461-468.
25. Park MC, Tibone JE, ElAttrache NS, Ahmad CS, Jun BJ, Lee TQ. Part II: biomechanical assessment for a footprint-restoring transosseous-equivalent rotator cuff repair technique compared with a double-row repair technique. J Shoulder Elbow Surg. 2007;16(4):469-476.
26. Ma CB, Comerford L, Wilson J, Puttlitz CM. Biomechanical evaluation of arthroscopic rotator cuff repairs: double-row compared with single-row fixation. J Bone Joint Surg Am. 2006;88(2):403-410.
27. Lo IK, Burkhart SS. Double-row arthroscopic rotator cuff repair: re-establishing the footprint of the rotator cuff. Arthroscopy. 2003;19(9):1035-1042.
28. Tuoheti Y, Itoi E, Yamamoto N, et al. Contact area, contact pressure, and pressure patterns of the tendon–bone interface after rotator cuff repair. Am J Sports Med. 2005;33(12):1869-1874.
29. Meyer DC, Farshad M, Amacker NA, Gerber C, Wieser K. Quantitative analysis of muscle and tendon retraction in chronic rotator cuff tears. Am J Sports Med. 2012;40(3):606-610.
30. Snyder SJ. Single vs. double row suture anchor fixation rotator cuff repair. Paper presented at: American Academy of Orthopedic Surgeons Annual Meeting; March 8, 2007; San Francisco, CA.
31. Sostak JP, Bahk MS, Getelman MH, Wong IH, Snyder SJ, Burns JP. Arthroscopic single row rotator cuff repair using the “SCOI row”: structural and clinical outcomes. Paper presented at: American Academy of Orthopedic Surgeons Annual Meeting; February 7-11, 2012; San Francisco, CA.
32. Fuchs B, Weishaupt D, Zanetti M, Hodler J, Gerber C. Fatty degeneration of the muscles of the rotator cuff: assessment by computed tomography versus magnetic resonance imaging. J Shoulder Elbow Surg. 1999;8(6):599-605.
33. Bond JL, Dopirak RM, Higgins J, Burns J, Snyder SJ. Arthroscopic replacement of massive, irreparable rotator cuff tears using a GraftJacket allograft: technique and preliminary results. Arthroscopy. 2008;24(4):403-409.
34. Hersche O, Gerber C. Passive tension in the supraspinatus musculotendinous unit after long-standing rupture of its tendon: a preliminary report. J Shoulder Elbow Surg. 1998;7(4):393-396.
35. Domb BG, Glousman RE, Brooks A, Hansen M, Lee TQ, ElAttrache NS. High-tension double-row footprint repair compared with reduced-tension single-row repair for massive rotator cuff tears. J Bone Joint Surg Am. 2008;90(suppl 4):35-39.
36. Gerber C, Meyer DC, Schneeberger AG, Hoppeler H, von Rechenberg B. Effect of tendon release and delayed repair on the structure of the muscles of the rotator cuff: an experimental study in sheep. J Bone Joint Surg Am. 2004;86(9):1973-1982.
37. Coleman SH, Fealy S, Ehteshami JR, et al. Chronic rotator cuff injury and repair model in sheep. J Bone Joint Surg Am. 2003;85(12):2391-2402.
38. Gimbel JA, Mehta S, Van Kleunen JP, Williams GR, Soslowsky LJ. The tension required at repair to reappose the supraspinatus tendon to bone rapidly increases after injury. Clin Orthop Relat Res. 2004;(426):258-265.
39. Mannava S, Plate JF, Whitlock PW, et al. Evaluation of in vivo rotator cuff muscle function after acute and chronic detachment of the supraspinatus tendon: an experimental study in an animal model. J Bone Joint Surg Am. 2011;93(18):1702-1711.
40. Burks RT, Crim J, Brown N, Fink B, Greis PE. A prospective randomized clinical trial comparing arthroscopic single- and double-row rotator cuff repair: magnetic resonance imaging and early clinical evaluation. Am J Sports Med. 2009;37(4):674-682.
41. Grasso A, Milano G, Salvatore M, Falcone G, Deriu L, Fabbriciani C. Single-row versus double-row arthroscopic rotator cuff repair: a prospective randomized clinical study. Arthroscopy. 2009;25(1):4-12.
42. Franceschi F, Ruzzini L, Longo UG, et al. Equivalent clinical results of arthroscopic single-row and double-row suture anchor repair for rotator cuff tears: a randomized controlled trial. Am J Sports Med. 2007;35(8):1254-1260.
43. Carbonel I, Martinez AA, Calvo A, Ripalda J, Herrera A. Single-row versus double-row arthroscopic repair in the treatment of rotator cuff tears: a prospective randomized clinical study. Int Orthop. 2012;36(9):1877-1883.
44. Lapner PL, Sabri E, Rakhra K, et al. A multicenter randomized controlled trial comparing single-row with double-row fixation in arthroscopic rotator cuff repair. J Bone Joint Surg Am. 2012;94(14):1249-1257.
45. Gartsman GM, Drake G, Edwards TB, et al. Ultrasound evaluation of arthroscopic full-thickness supraspinatus rotator cuff repair: single-row versus double-row suture bridge (transosseous equivalent) fixation. Results of a prospective, randomized study. J Shoulder Elbow Surg. 2013;22(11):1480-1487.
46. Murray TF Jr, Lajtai G, Mileski RM, Snyder SJ. Arthroscopic repair of medium to large full-thickness rotator cuff tears: outcome at 2- to 6-year follow-up. J Shoulder Elbow Surg. 2002;11(1):19-24.
47. Szczesny SE, Peloquin JM, Cortes DH, Kadlowec JA, Soslowsky LJ, Elliott DM. Biaxial tensile testing and constitutive modeling of human supraspinatus tendon. J Biomech Eng. 2012;134(2):021004.
48. Chaudhury S, Holland C, Vollrath F, Carr AJ. Comparing normal and torn rotator cuff tendons using dynamic shear analysis. J Bone Joint Surg Br. 2011;93(7):942-948.
49. Meyer DC, Hoppeler H, von Rechenberg B, Gerber C. A pathomechanical concept explains muscle loss and fatty muscular changes following surgical tendon release. J Orthop Res. 2004;22(5):1004-1007.
Although recent clinical results of arthroscopic rotator cuff repair (RCR) have been encouraging, achieving anatomical healing of full-thickness rotator cuff tears remains a challenge.1-4 Several factors influence rotator cuff healing after repair.1,3-8 Patient-related factors include advanced patient age, tear size, tear chronicity, and amount of fatty infiltration.1,3,5,6,8-10 Tension applied to the repair construct is a significant factor as well.11,12
In the literature, limited consideration has been given to repair tension.13 The majority of studies have focused on other factors, mainly repair technique. Some surgeons advocate use of a double-row repair construct in which the rotator cuff tendon is pulled to the lateral margin of the footprint.14-19 Double-row techniques, which include the transosseous-equivalent (TOE) construct, are biomechanically superior to other repairs.20-26 Another purported benefit of double-row repair is more complete restoration and pressurization of the rotator cuff footprint.21,24,27,28
Rotator cuff tears typically occur near the dysvascular region of the diseased musculotendinous unit, often leaving a stump of tissue attached to the tuberosity and ultimately a shortened tendon.29 In addition, full-thickness tears often retract over time. Meyer and colleagues29 recently demonstrated that this shortening is irreversible. Snyder30 and Sostak and colleagues31 suggested that pulling a shortened, degenerative rotator cuff tendon to the lateral margin of the footprint results in increased tissue tension compared with that produced with a more medially based repair just off the articular margin. In our opinion, the possible increase in tension during a laterally based repair, whether single- or double-row, may place excessive strain on the diseased tissue as well as the surgical construct, potentially contributing to repair failure.
We conducted a study to evaluate the difference, if any, in tension applied to the rotator cuff tendon positioned at the medial versus lateral margin of the footprint during arthroscopic RCR. We hypothesized significantly more tension would be placed on the rotator cuff tendon when positioned at the lateral versus medial footprint.
Methods
After obtaining Institutional Review Board approval for this study, we collected data on a consecutive series of patients who underwent arthroscopic RCR performed by Dr. Getelman at a single institution. Only patients with primary full-thickness tears of the supraspinatus and/or infraspinatus were included. Exclusion criteria included revision rotator cuff surgeries, partial-thickness tears, concurrent subscapularis tears requiring anchor fixation, and any tears that could not be mobilized to the lateral footprint without interval slides or margin convergence. The 20 identified patients constituted the study group.
Demographic factors, including age and preoperative length of symptoms, were recorded after chart review. Magnetic resonance imaging (MRI) was performed for all patients before surgery and was retrospectively reviewed. Dr. Getelman assigned each patient a modified Goutallier score, based on MRI, to assess for fatty infiltration/atrophy.32 Each patient was placed in the lateral decubitus position with the operative arm in balanced suspension at 70° of abduction. Standard glenohumeral and subacromial diagnostic arthroscopy was performed. The rotator cuff tear was gently debrided back to a healthy-appearing margin in preparation for repair. The tear was then measured in the anterior-posterior (A-P) and medial-lateral (M-L) planes using a premeasured, marked suture, as previously described.33 Complete bursal and articular-sided releases were performed to allow for appropriate mobilization of the tendon. The tear was classified as crescent-shaped, U-shaped, or L-shaped.
Viewing from the posterior portal, the surgeon inserted a tissue grasper through the lateral portal. The tendon was grasped at multiple points along its edge, anterior to posterior, and was translated laterally to assess its reducibility; the apex of the tear correlated with the point of maximal excursion and coverage of the footprint. Once confirmed, the rotator cuff tear apex was clamped with a tissue grasper. After placement in a sterile arthroscopic camera sleeve (DeRoyal camera drape with perforated tip), a calibrated digital weigh scale (American Weigh Scales model H22 portable electronic hanging scale, with accuracy of 0.01 lb) was attached to the tissue grasper with an S-hook (Figure 1). The tendon edge was first translated about 3 mm lateral to the articular margin (the medial footprint position), and tension was recorded (Figures 2A, 2B). After a 1-minute relaxation period, the tendon edge was translated to the lateral edge of the rotator cuff footprint (the lateral footprint position), and tension was recorded again (Figures 2C, 2D). A medially based single-row RCR with triple-loaded sutures and bone marrow vents placed in the lateral tuberosity was then completed, regardless of tension, tear size, or tear morphology.31 Typically, 1 anchor was used for every 10 to 15 mm of A-P tear length.
SAS software was used for statistical analysis, the Wilcoxon signed rank test for continuous or ordinal data comparisons between paired groups, and the Mann-Whitney test for continuous or ordinal data comparisons between independent, unmatched groups. One-way analysis of variance (ANOVA) was used to compare means among the 3 groups of morphology subtypes. Linear regression was performed to assess the simultaneous relationship between potential predictors (age, sex, length of symptoms, Goutallier score, tear size) and medial or lateral tension, where medial tension was included as an additional potential predictor for lateral tension. Restricted cubic splines were fit to assess linearity. Predictors were retained in multivariate regression using backward variable retention. Because of inadequate sample size, additivity was assumed except for sex. Statistical significance was set at P < .05.
Results
Of the 20 rotator cuff tears evaluated (Table 1), 13 were crescent-shaped, 5 were U-shaped, and 2 were L-shaped. Mean (SD) A-P tear size was 17.7 (5.8) mm, and mean (SD) M-L tear size was 19.1 (8.6) mm. Mean age of the 20 patients (15 men, 5 women) was 57.9 years (range, 44-72 years). Mean (SD) length of symptoms was 12.9 (12.4) months (range, 3-48 months). Mean (SD) modified Goutallier score was 1.4 (0.7; range, 0-3).
Mean (SD) rotator cuff tension for all tears approximated to the medial footprint was 0.41 (0.33) pound, and mean (SD) cuff tension for all tears approximated to the lateral footprint was 2.21 (1.20) pounds—representing a 5.4-fold difference (P < .0001).
No statistically significant differences were detected in the ANOVA comparing tensions at medial and lateral positions among tear morphologic subtypes (all Ps >.05).
Subgroup analysis (Table 2) was performed for smaller (≤20 mm A-P) and larger (>20 mm A-P) tears. For smaller tears, mean (SD) tension was 0.27 (0.24) pound applied with the cuff tendon pulled to the medial footprint and 2.06 (1.06) pounds applied with the tendon pulled to the lateral footprint—a 7.6-fold difference (P < .0018). For larger tears, mean (SD) tension was 0.58 (0.37) pound applied with the tendon pulled to the medial footprint and 2.38 (1.4) pounds applied with the tendon pulled to the lateral footprint—a 4.1-fold difference (P < .005).
A statistically significant difference in tensions was found between small and large cuff tears positioned at the medial footprint (0.27 vs 0.58 lb; P = .0367); no difference was found between groups with the tendon at the lateral footprint (2.06 vs 2.38 lb; P = .284).
Univariate and multivariate analyses were performed using linear regression analysis (Table 3). During univariate analysis for medial footprint position, A-P tear size and Goutallier score both positively correlated with increasing tension; for lateral footprint position, no factors statistically correlated with lateral tension, though there was a positive trend for medial tension and female sex. During multivariate analysis for medial footprint position, only A-P tear size positively correlated with increasing tension; for lateral footprint position, both age (in nonlinear fashion as function of age + age2) and medial tension positively correlated with increasing tension.
Discussion
Our results indicated that significantly more tension is placed on the torn rotator cuff tendon when it is reduced across the footprint from a medial to a more lateral position in vivo. More tension was required for all tears to be reduced to the lateral footprint compared with the medial footprint. As expected, compared with smaller tears, larger tears required significantly more tension in order to be reduced to the medial footprint. Interestingly, no statistical difference was found between tensions required to reduce either small or large tears to the lateral footprint, which suggests that, regardless of tear size, more force must be applied to reduce the torn tendon to the lateral footprint compared with the medial footprint.
Hersche and Gerber34 were the first to report rotator cuff tension measurements in vivo. Although their study did not specifically compare cuff tensions reducing the tear to the medial versus lateral footprint, it did examine tension at displacement of 10 and 20 mm. Tension increased from 27 N to 60 N, correlating with a 2.2-fold difference between the 2 distances. Domb and colleagues35 also compared in vivo rotator cuff tension differences between the medial footprint and the lateral footprint in 4 patients. Mean tension applied to the cuff during reduction to the articular margin was 27 N, or 6 pounds. Mean tension needed to reduce the cuff to the lateral tuberosity was 76 N, or 17 pounds, for a 2.8-fold difference. Tears were not measured but were described as massive and retracted.
Although repair tension has long been recognized as a crucial factor in RCR healing, little clinical research has focused on the effects of excess tension. Davidson and Rivenburgh11 prospectively followed the clinical outcomes of 67 consecutive cuff repairs after intraoperative tension measurement and found that high-tension repairs (>8 lb) had significantly lower clinical outcome measures. However, the authors did not report on correlations with radiologic healing and stated, “Functional outcome is inversely proportional to rotator cuff repair tension.” Further study of the in vivo effects of increased tension on clinical and radiologic outcomes is needed.
Several animal studies have been conducted on the effects of tension on RCRs. Gerber and colleagues36 reported that the force needed to produce 1 cm of sheep supraspinatus tendon excursion increased 7-fold, from 6.8 N to 47.8 N, after 40 weeks of tendon tear. Coleman and colleagues37 compared the modulus of elasticity in sheep supraspinatus tendon after 6 weeks and 18 weeks of detachment and reported increases of 60% and 70%, respectively. Gimbel and colleagues38 showed that, in a rat model, “repair tension rapidly increased initially after injury followed by a progressive, but less dramatic, increase with additional time.” Of note, we did not identify any correlation between chronicity of symptoms and the tension needed to reduce the tendon medially or to a more lateral position on the footprint.
In acute tears, the cuff tissue is more compliant and mobile and can be pulled laterally across its anatomical footprint with minimal tension.39 In contrast, cuff tissue in the more commonly encountered chronic tear is less compliant and is not mobile enough to be pulled to the lateral margin of the footprint without added stress.30,34,35 In large, acute tears in which there are minimal tissue degeneration and retraction, a laterally based footprint-restoring technique may be performed with minimal tension. This technique may have advantages over a medially based repair. In the literature, more attention needs to be directed toward the biomechanics and biology of chronic rotator cuff tears, as these are more commonly encountered.
Almost all of the prospective studies that have compared single- and double-row RCR have found no significant differences in MRI healing rates or clinical results at follow-up up to 2 years.14,16,40-45 Detailed analysis of the surgical techniques used in all these studies revealed that the rotator cuff tendons were repaired back to the lateral footprint in both the single- and double-row constructs.14,16,40-45 Although no clinical studies have compared medially and laterally based single-row repairs, our data suggest that medially based repairs have lower tensions and therefore should not be considered equivalent. Sostak and colleagues31 and Murray and colleagues46 have shown that a medially based single-row RCR can achieve excellent clinical and anatomical results, likely partly because of the lower tension applied to the torn cuff tissue.31,46 Studies are needed to compare medially and laterally based repairs, including single- and double-row repairs.
The vast majority of recent research has aimed to counteract construct tension with stronger biomechanical constructs.20-26 Surgeons have also aimed to improve biological healing by pulling the tendon laterally across the footprint to achieve complete footprint coverage, ultimately increasing the surface area for tendon–bone healing. This has led to the development of various double-row repair techniques, in which the cuff tendon is pulled to the lateral margin of its footprint. One row of anchors is placed in the medial aspect of the footprint, while a second is placed in the lateral aspect; the cuff is reduced and compressed to the tuberosity with various suture configurations. The TOE technique was developed to improve pressurization of the cuff tendon across the footprint by linking the 2 rows with bridging sutures. In doing so, however, the potentially deleterious effects of increased tension introduced by pulling the tendon laterally may have been overlooked. Nevertheless, the biomechanics and stress distribution likely differ between single-row repair and TOE repairs, and direct comparisons cannot be made at this time. The medial row of a double-row or TOE construct may stress-shield or “unload” the more lateral tissue. Studies are needed in order to better understand the tension differential and stress distribution of various double-row constructs.
Recognizing tear morphology is crucial in maximizing chances of healing after cuff repair. For example, a crescent-shaped tear is reduced to the tuberosity with direct lateral translation of the apex of the tear, which is also the deepest or most displaced part of the tear. On the other hand, reducing an L- or reverse L-shaped tear to the tuberosity is not as direct; reducing the deepest or most displaced part of the tear would lead to overreduction and overtensioning of the tendon. However, often the exact “elbow” of the tear is not obvious and appears more rounded; therefore, it is crucial for the surgeon to examine the mobility of the torn tendon along its entire length to minimize tension. Study is needed to assess tension along the entire length of the tear for different tear morphologies and sizes.
Although our results showed that increased tension was needed to reduce a torn tendon to its lateral footprint, no study has indicated exactly how much is “too much” tension. As stated earlier, use of stronger biomechanical constructs, including TOE constructs, may overcome the increased tension associated with laterally based repairs. In addition, laterally based repairs, either single- or double-row, may be best suited for tears with lower tension, whereas medially based repairs may be best suited for higher tension tears. It is also possible that the difference in tensions noted in this study is not significant enough to have a clinical impact on choice of construct or on anatomical healing. We need studies that correlate anatomical healing rates with repair tension in order to better guide surgeons on when to use a medially or laterally based repair.
Other possible effects of increased tension associated with laterally based repairs, including beneficial effects, must be considered as well. Viscoelastic properties of human rotator cuff tendon may dissipate increased tension over time through a variety of mechanisms. Stress relaxation, gap formation, creep, and the hysteresis effect, all associated with cyclical loading in the early healing period, may lead to dissipation of force over time.47,48 These more complex biomechanical properties of RCR constructs are yet to be clearly defined.
This study had several weaknesses. Its data represent a static measurement of time-zero rotator cuff tension, which greatly simplifies the biomechanics of the torn rotator cuff and repair construct as well as changes that occur with healing. During cuff repair, forces typically are distributed through several fixation points in stepwise process and are not focused on a single point of tissue with a grasper. Therefore, the findings of this study may not directly correlate with medially versus laterally based repairs in vivo. Furthermore, as this is a time-zero measurement, we could not determine whether the tension differential between the 2 repair positions remained static over time. Current literature suggests that muscle atrophy, fatty infiltration, and loss of elasticity of the musculotendinous unit are relatively irreversible.35,37,49 In addition, determining the precise apex of a cuff tear can be difficult, so error may have been introduced during this process. Last, although placement of the cuff tissue at the medial or lateral footprint position was based on visual estimation by an experienced and skilled arthroscopist, error may have been introduced based on this imprecise technique.
Conclusion
This study demonstrated a significant, 5.4-fold increase in in vivo time-zero rotator cuff tension with the tendon edge reduced to the lateral footprint rather than the medial footprint.
1. Boileau P, Brassart N, Watkinson DJ, Carles M, Hatzidakis AM, Krishnan SG. Arthroscopic repair of full-thickness tears of the supraspinatus: does the tendon really heal? J Bone Joint Surg Am. 2005;87(6):1229-1240.
2. Galatz LM, Ball CM, Teefey SA, Middleton WD, Yamaguchi K. The outcome and repair integrity of completely arthroscopically repaired large and massive rotator cuff tears. J Bone Joint Surg Am. 2004;86(2):219-224.
3. Nho SJ, Brown BS, Lyman S, Adler RS, Altchek DW, MacGillivray JD. Prospective analysis of arthroscopic rotator cuff repair: prognostic factors affecting clinical and ultrasound outcome. J Shoulder Elbow Surg. 2009;18(1):13-20.
4. Huijsmans PE, Pritchard MP, Berghs BM, van Rooyen KS, Wallace AL, de Beer JF. Arthroscopic rotator cuff repair with double-row fixation. J Bone Joint Surg Am. 2007;89(6):1248-1257.
5. Gulotta LV, Nho SJ, Dodson CC, Adler RS, Altchek DW, MacGillivray JD; HSS Arthroscopic Rotator Cuff Registry. Prospective evaluation of arthroscopic rotator cuff repairs at 5 years: part II—prognostic factors for clinical and radiographic outcomes. J Shoulder Elbow Surg. 2011;20(6):941-946.
6. Cho NS, Rhee YG. The factors affecting the clinical outcome and integrity of arthroscopically repaired rotator cuff tears of the shoulder. Clin Orthop Surg. 2009;1(2):96-104.
7. Gladstone JN, Bishop JY, Lo IK, Flatow EL. Fatty infiltration and atrophy of the rotator cuff do not improve after rotator cuff repair and correlate with poor functional outcome. Am J Sports Med. 2007;35(5):719-728.
8. Oh JH, Kim SH, Ji HM, Jo KH, Bin SW, Gong HS. Prognostic factors affecting anatomic outcome of rotator cuff repair and correlation with functional outcome. Arthroscopy. 2009;25(1):30-39.
9. Tashjian RZ, Hollins AM, Kim HM, et al. Factors affecting healing rates after arthroscopic double-row rotator cuff repair. Am J Sports Med. 2010;38(12):2435-2442.
10. Burkhart SS, Lo IK. Arthroscopic rotator cuff repair. J Am Acad Orthop Surg. 2006;14(6):333-346.
11. Davidson PA, Rivenburgh DW. Rotator cuff repair tension as a determinant of functional outcome. J Shoulder Elbow Surg. 2000;9(6):502-506.
12. Goutallier D, Postel JM, Van Driessche S, Godefroy D, Radier C. Tension-free cuff repairs with excision of macroscopic tendon lesions and muscular advancement: results in a prospective series with limited fatty muscular degeneration. J Shoulder Elbow Surg. 2006;15(2):164-172.
13. Gimbel JA, Van Kleunen JP, Lake SP, Williams GR, Soslowsky LJ. The role of repair tension on tendon to bone healing in an animal model of chronic rotator cuff tears. J Biomech. 2007;40(3):561-568.
14. Ma HL, Chiang ER, Wu HT, et al. Clinical outcome and imaging of arthroscopic single-row and double-row rotator cuff repair: a prospective randomized trial. Arthroscopy. 2012;28(1):16-24.
15. Mihata T, Watanabe C, Fukunishi K, et al. Functional and structural outcomes of single-row versus double-row versus combined double-row and suture-bridge repair for rotator cuff tears. Am J Sports Med. 2011;39(10):2091-2098.
16. Koh KH, Kang KC, Lim TK, Shon MS, Yoo JC. Prospective randomized clinical trial of single- versus double-row suture anchor repair in 2- to 4-cm rotator cuff tears: clinical and magnetic resonance imaging results. Arthroscopy. 2011;27(4):453-462.
17. Voigt C, Bosse C, Vosshenrich R, Schulz AP, Lill H. Arthroscopic supraspinatus tendon repair with suture-bridging technique: functional outcome and magnetic resonance imaging. Am J Sports Med. 2010;38(5):983-991.
18. Lafosse L, Brzoska R, Toussaint B, Gobezie R. The outcome and structural integrity of arthroscopic rotator cuff repair with use of the double-row suture anchor technique. Surgical technique. J Bone Joint Surg Am. 2008;90(suppl 2 pt 2):275-286.
19. Park JY, Lhee SH, Choi JH, Park HK, Yu JW, Seo JB. Comparison of the clinical outcomes of single- and double-row repairs in rotator cuff tears. Am J Sports Med. 2008;36(7):1310-1316.
20. Kim DH, ElAttrache NS, Tibone JE, et al. Biomechanical comparison of a single-row versus double-row suture anchor technique for rotator cuff repair. Am J Sports Med. 2006;34(3):407-414.
21. Mazzocca AD, Bollier MJ, Ciminiello AM, et al. Biomechanical evaluation of arthroscopic rotator cuff repairs over time. Arthroscopy. 2010;26(5):592-599.
22. Grimberg J, Diop A, Kalra K, Charousset C, Duranthon LD, Maurel N. In vitro biomechanical comparison of three different types of single- and double-row arthroscopic rotator cuff repairs: analysis of continuous bone–tendon contact pressure and surface during different simulated joint positions. J Shoulder Elbow Surg. 2010;19(2):236-243.
23. Nelson CO, Sileo MJ, Grossman MG, Serra-Hsu F. Single-row modified Mason-Allen versus double-row arthroscopic rotator cuff repair: a biomechanical and surface area comparison. Arthroscopy. 2008;24(8):941-948.
24. Park MC, ElAttrache NS, Tibone JE, Ahmad CS, Jun BJ, Lee TQ. Part I: footprint contact characteristics for a transosseous-equivalent rotator cuff repair technique compared with a double-row repair technique. J Shoulder Elbow Surg. 2007;16(4):461-468.
25. Park MC, Tibone JE, ElAttrache NS, Ahmad CS, Jun BJ, Lee TQ. Part II: biomechanical assessment for a footprint-restoring transosseous-equivalent rotator cuff repair technique compared with a double-row repair technique. J Shoulder Elbow Surg. 2007;16(4):469-476.
26. Ma CB, Comerford L, Wilson J, Puttlitz CM. Biomechanical evaluation of arthroscopic rotator cuff repairs: double-row compared with single-row fixation. J Bone Joint Surg Am. 2006;88(2):403-410.
27. Lo IK, Burkhart SS. Double-row arthroscopic rotator cuff repair: re-establishing the footprint of the rotator cuff. Arthroscopy. 2003;19(9):1035-1042.
28. Tuoheti Y, Itoi E, Yamamoto N, et al. Contact area, contact pressure, and pressure patterns of the tendon–bone interface after rotator cuff repair. Am J Sports Med. 2005;33(12):1869-1874.
29. Meyer DC, Farshad M, Amacker NA, Gerber C, Wieser K. Quantitative analysis of muscle and tendon retraction in chronic rotator cuff tears. Am J Sports Med. 2012;40(3):606-610.
30. Snyder SJ. Single vs. double row suture anchor fixation rotator cuff repair. Paper presented at: American Academy of Orthopedic Surgeons Annual Meeting; March 8, 2007; San Francisco, CA.
31. Sostak JP, Bahk MS, Getelman MH, Wong IH, Snyder SJ, Burns JP. Arthroscopic single row rotator cuff repair using the “SCOI row”: structural and clinical outcomes. Paper presented at: American Academy of Orthopedic Surgeons Annual Meeting; February 7-11, 2012; San Francisco, CA.
32. Fuchs B, Weishaupt D, Zanetti M, Hodler J, Gerber C. Fatty degeneration of the muscles of the rotator cuff: assessment by computed tomography versus magnetic resonance imaging. J Shoulder Elbow Surg. 1999;8(6):599-605.
33. Bond JL, Dopirak RM, Higgins J, Burns J, Snyder SJ. Arthroscopic replacement of massive, irreparable rotator cuff tears using a GraftJacket allograft: technique and preliminary results. Arthroscopy. 2008;24(4):403-409.
34. Hersche O, Gerber C. Passive tension in the supraspinatus musculotendinous unit after long-standing rupture of its tendon: a preliminary report. J Shoulder Elbow Surg. 1998;7(4):393-396.
35. Domb BG, Glousman RE, Brooks A, Hansen M, Lee TQ, ElAttrache NS. High-tension double-row footprint repair compared with reduced-tension single-row repair for massive rotator cuff tears. J Bone Joint Surg Am. 2008;90(suppl 4):35-39.
36. Gerber C, Meyer DC, Schneeberger AG, Hoppeler H, von Rechenberg B. Effect of tendon release and delayed repair on the structure of the muscles of the rotator cuff: an experimental study in sheep. J Bone Joint Surg Am. 2004;86(9):1973-1982.
37. Coleman SH, Fealy S, Ehteshami JR, et al. Chronic rotator cuff injury and repair model in sheep. J Bone Joint Surg Am. 2003;85(12):2391-2402.
38. Gimbel JA, Mehta S, Van Kleunen JP, Williams GR, Soslowsky LJ. The tension required at repair to reappose the supraspinatus tendon to bone rapidly increases after injury. Clin Orthop Relat Res. 2004;(426):258-265.
39. Mannava S, Plate JF, Whitlock PW, et al. Evaluation of in vivo rotator cuff muscle function after acute and chronic detachment of the supraspinatus tendon: an experimental study in an animal model. J Bone Joint Surg Am. 2011;93(18):1702-1711.
40. Burks RT, Crim J, Brown N, Fink B, Greis PE. A prospective randomized clinical trial comparing arthroscopic single- and double-row rotator cuff repair: magnetic resonance imaging and early clinical evaluation. Am J Sports Med. 2009;37(4):674-682.
41. Grasso A, Milano G, Salvatore M, Falcone G, Deriu L, Fabbriciani C. Single-row versus double-row arthroscopic rotator cuff repair: a prospective randomized clinical study. Arthroscopy. 2009;25(1):4-12.
42. Franceschi F, Ruzzini L, Longo UG, et al. Equivalent clinical results of arthroscopic single-row and double-row suture anchor repair for rotator cuff tears: a randomized controlled trial. Am J Sports Med. 2007;35(8):1254-1260.
43. Carbonel I, Martinez AA, Calvo A, Ripalda J, Herrera A. Single-row versus double-row arthroscopic repair in the treatment of rotator cuff tears: a prospective randomized clinical study. Int Orthop. 2012;36(9):1877-1883.
44. Lapner PL, Sabri E, Rakhra K, et al. A multicenter randomized controlled trial comparing single-row with double-row fixation in arthroscopic rotator cuff repair. J Bone Joint Surg Am. 2012;94(14):1249-1257.
45. Gartsman GM, Drake G, Edwards TB, et al. Ultrasound evaluation of arthroscopic full-thickness supraspinatus rotator cuff repair: single-row versus double-row suture bridge (transosseous equivalent) fixation. Results of a prospective, randomized study. J Shoulder Elbow Surg. 2013;22(11):1480-1487.
46. Murray TF Jr, Lajtai G, Mileski RM, Snyder SJ. Arthroscopic repair of medium to large full-thickness rotator cuff tears: outcome at 2- to 6-year follow-up. J Shoulder Elbow Surg. 2002;11(1):19-24.
47. Szczesny SE, Peloquin JM, Cortes DH, Kadlowec JA, Soslowsky LJ, Elliott DM. Biaxial tensile testing and constitutive modeling of human supraspinatus tendon. J Biomech Eng. 2012;134(2):021004.
48. Chaudhury S, Holland C, Vollrath F, Carr AJ. Comparing normal and torn rotator cuff tendons using dynamic shear analysis. J Bone Joint Surg Br. 2011;93(7):942-948.
49. Meyer DC, Hoppeler H, von Rechenberg B, Gerber C. A pathomechanical concept explains muscle loss and fatty muscular changes following surgical tendon release. J Orthop Res. 2004;22(5):1004-1007.

Clinical Outcomes of Minimally Invasive Versus Open TLIF: A Propensity-Matched Cohort Study
Transforaminal lumbar interbody fusion (TLIF) has become an increasingly popular method of lumbar fusion, since its introduction by Harms and Rolinger in 1982.1 The procedure allows for a circumferential fusion through a posterior-only approach, with improved sagittal alignment2 and minimal risk for iatrogenic nerve injury. In the past decade, a minimally invasive surgical method of TLIF (MIS TLIF) has been introduced3-5 and involves neural decompression and interbody fusion through a tubular retractor, and percutaneous placement of pedicle-screw instrumentation. This technique uses muscle dilation rather than large-scale detachment of muscle. Proponents of the MIS technique have postulated that decreased muscle damage would lead to better short-term, and possibly long-term, clinical outcomes, because of less iatrogenic soft-tissue damage.
Studies that have compared results of MIS TLIF with open TLIF have shown improved perioperative outcomes, but most have shown similar intermediate-term clinical outcomes.6 In the short term, multiple studies demonstrate that MIS TLIF is associated with decreased blood loss, less postoperative pain and narcotic requirements, and shorter hospital length of stay.7-13 However, changes in pain score and disease-specific and generic health-related quality of life measures have been similar for the 2 procedures, beyond 6 months postoperatively.10,13-15 These studies have generally involved retrospective reviews of unmatched patient groups, with small sample sizes and significant heterogeneity in surgical indications and case complexity. In our study, we compared intermediate-term clinical outcomes of MIS TLIF with open TLIF, using propensity matching to optimize baseline similarity of the groups.
Methods
This retrospective study was conducted after receiving approval from the Institutional Review Board. Surgical and clinical databases of 2 centers from 2008 to 2012 were reviewed for eligible subjects. Cases in 2007 were excluded because this was the year that MIS was introduced as a new technique in the practice. Inclusion criteria consisted of patients who underwent 1- to 2-level MIS TLIF and had complete baseline, 1- and 2-year postoperative outcome measures. Patients who had surgery for trauma, tumor, or osteomyelitis were excluded. Outcome measures collected and reviewed in this study included the Oswestry Disability Index (ODI),16,17 the Medical Outcomes Study Short-Form 36 (SF-36),18 and numeric rating scales for back and leg pain (0-100 scale).19 The Physical Composite Summary (PCS) and Mental Composite Summary of the SF-36 were reviewed separately. We recorded the following patient demographic data: age, gender, American Society of Anesthesiologists (ASA) grade, body mass index, indication for surgery, workers’ compensation, and smoking status. Surgical data included number of levels fused, operative time, estimated blood loss, and length of hospital stay.
Propensity-scoring technique20,21 was used to match the MIS TLIF patients to a control group of patients who underwent TLIF using an open approach (open TLIF), matching for multiple characteristics to produce 2 similar comparison groups. Propensity matching was performed to control for bias. In controlling for known confounders or biases, propensity matching, in theory, should also control for unknown confounders. Gender, age, body mass index, smoking status, indication for fusion, as well as preoperative ODI, SF-36 PCS, SF-36 Mental Composite Summary, and pain scores were used to generate a control open TLIF group.
MIS TLIF Surgical Technique
Patients in the MIS TLIF group underwent neural decompression and interbody fusion through a tubular retractor system (METRx, Medtronic Inc.), followed by percutaneous pedicle-screw fixation under fluoroscopic guidance (Sextant, Medtronic Inc.). After successful induction of general endotracheal anesthesia, patients were positioned prone on a radiolucent table. Posteroanterior (PA) and lateral fluoroscopic images were used to localize 2 paramedian incisions, approximately 3-cm to 5-cm lateral to midline, over the pedicles of interest. Modified Jamshidi needles (Medtronic Inc.) were used to cannulate the pedicles under PA, posterior-oblique, PA, and lateral fluoroscopic guidance. The pedicles were tapped with a cannulated tap. Pedicle screws and rods were introduced on the side contralateral to the TLIF and were used as needed to maintain intradiscal distraction during the TLIF portion of the procedure.
Decompression and TLIF were carried out on the side of the patient’s radicular pain or bilaterally, according to the surgeon’s discretion. A K-wire was advanced to the facet joint complex, after which sequential dilators were used to dilate through the muscles to establish an intramuscular corridor to the facet. A 26-mm fixed tubular retractor was docked over the facet and locked in place, using a post attached to the operating room table. Neural decompression was obtained by removal of the entire facet-joint complex and lamina to the base of the spinous process, using a combination of high-speed drills and Kerrison rongeurs. The ligamentum flavum was completely resected. The superior articular process of the caudal vertebra was removed all the way to the pedicle below. Ball-tipped probes were used to confirm that traversing and exiting nerve roots were completely free. An annulotomy was performed, and all disc material was removed from the disc through a combination of rotating shavers, serrated curettes, endplate scrapers, and rasps. Bone graft was placed anterior and contralateral to the interbody cage. (Bone grafts included autogenous iliac crest, local bone obtained from the decompression, recombinant human bone morphogenetic protein 2, or allograft demineralized bone matrix at the surgeon’s discretion.) After placement of the interbody cage, the ipsilateral pedicle-screw instrumentation was put over the remaining guide wires and compression applied across the construct to lock the interbody cage and restore lordosis. Wounds were closed without drains.
Open TLIF Surgical Technique
In patients undergoing open TLIF, a midline incision was made over the vertebrae of interest, and paraspinal muscles were subperiosteally dissected to the tips of the transverse processes. The appropriate level was confirmed with intraoperative radiograph. Pedicle screws were placed free-hand using anatomic landmarks, and appropriate placement was confirmed with intraoperative radiograph and evoked electromyography stimulation. Laminectomy and facetectomy were performed, and the disc was entered on the side of the facetectomy. After thorough disc-space preparation, bone graft and an interbody cage were placed, rods inserted, and compression carried out. A supplemental posterolateral fusion was also performed after decortication of the transverse processes and cartilaginous surface of the contralateral facet. Layered wound closure was performed over drains.
Analysis
Statistical analysis was carried out using SPSS Statistics version 17.0 (IBM) with significance set at the P < .01 level. A small, conservative P-value threshold was used to minimize type II error that resulted from the multiple comparisons performed. Student t test was used to determine any significant differences between continuous demographic variables, and to compare preoperative and postoperative outcome measure scores within and between study groups. Fisher’s exact test was used to compare categorical variables between the 2 groups.
Results
The MIS TLIF group consisted of 64 patients (average age, 52 years), and included 22 patients with degenerative spondylolisthesis, 33 with disc pathology, 8 with postdecompression, and 1 non-union patient. The open TLIF group consisted of 64 patients (average age, 54 years), and included 39 degenerative spondylolisthesis, 15 disc pathology, 7 postdecompression, and 3 nonunion patients (Table 1). All 64 open and 19 MIS cases were from a spine practice with 6 surgeons, and 45 MIS cases came from a spine practice with 2 surgeons. There was also an unequal distribution of the specific levels fused between the open and MIS groups.
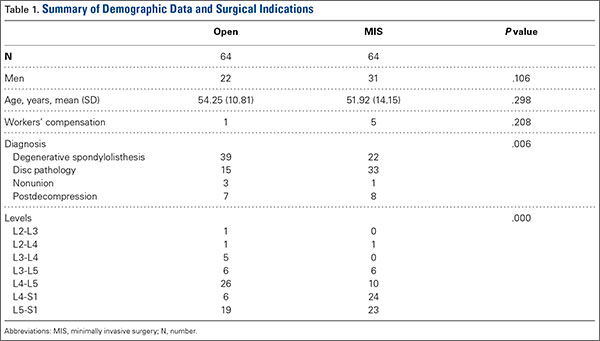
Although the operative time was similar in both groups, the MIS TLIF group had a statistically significantly lower blood loss compared with the open TLIF group (Table 2). Both MIS TLIF and open TLIF lead to significant improvements in pain, ODI, and SF-36 PCS (P < .01) (Table 3). At 1 year, both groups had similar improvements in pain (36.9 vs 30.8, P = .178) and SF-36 PCS (9.9 vs 7.5, P = .231), but the MIS TLIF group had a statistically significantly greater improvement in ODI compared with the open TLIF group (30.4 vs 15.1, P < .000). At 2 years, both groups had similar improvements in SF-36 PCS (12.1 vs 7.5, P = .033), but the MIS TLIF group had a statistically significantly greater improvement in pain (40.2 vs 27.0, P = .005) and ODI (33.1 vs 15.4, P < .000) compared with the open TLIF group (Table 4).
![]()
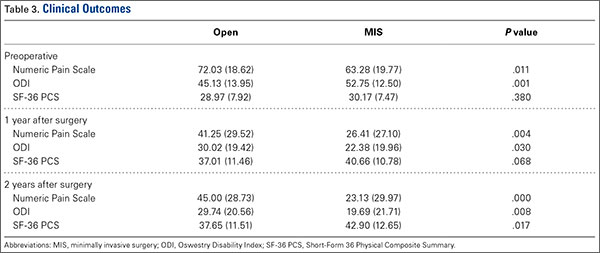
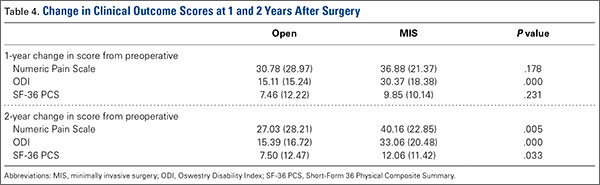
Discussion
The current study compared intermediate-term clinical outcomes of MIS TLIF to open TLIF. We used propensity matching to identify a control group of open TLIFs that were comparable to the MIS TLIF group across a variety of covariates that are known to influence the results of lumbar fusion. This created comparison groups that were as closely matched at baseline as possible. We found that, at 2-year follow-up, MIS TLIF patients had less pain and less low-back pain–related disability as measured by ODI. There was also a trend toward better generic health-related quality of life in the MIS TLIF group.
These data suggest that the decreased soft-tissue trauma of the minimally invasive surgical technique, which leads to improved perioperative parameters in the short term, may also lead to some advantages that translate to improved intermediate-term clinical outcomes. Traditional lumbar fusion procedures have shown excellent clinical results when used for accepted clinical indications.22 However, the procedure requires extensive dissection of the paraspinal muscles, which causes significant muscle damage as evidenced by muscle breakdown products that can be detected in the bloodstream postoperatively.23,24 The lateral dissection also transects the dorsal ramus of the segmental nerves, which innervate the paraspinal muscles, leading to significant scarring and atrophy on postoperative imaging studies.23 Some authors have used the term “fusion disease” to describe the constellation of soft-tissue degradation seen after open lumbar fusion.5
An MIS version of the TLIF procedure that was described in 20033 avoids much of this iatrogenic soft-tissue trauma. It involves intramuscular dilation to approach the spine and to carry out neural decompression and interbody fusion, in conjunction with percutaneous pedicle-screw instrumentation. Proponents of this technique point to diminished iatrogenic soft-tissue and muscle damage as an advantage. Multiple studies have, in fact, confirmed improved short-term perioperative parameters, such as less blood loss, lower narcotic requirements, and decreased length-of-hospital stay.25 Economic analyses have also shown lower direct and indirect costs with the MIS technique.26
Several studies have compared patient-reported outcome measures of MIS and open TLIF, and the results have been mixed. Most of these studies have shown similar improvement in clinical outcomes between the 2 procedures, but the MIS technique demonstrated short-term perioperative advantages, such as lower blood loss, less narcotic requirements, and shorter length of stay.7-15 The authors of these studies conclude that the MIS technique can provide similar long-term results with lower short-term morbidity when compared with open TLIF. In contrast, some studies have shown better short- and intermediate-term clinical outcomes with the MIS technique.23,27-29 As a whole, the literature comparing the 2 procedures consists of mostly small retrospective studies with nonrandomized patient samples, heterogeneous surgical indications, and differing surgical techniques, making it difficult to draw conclusions.
The current study suggests that MIS TLIF may lead to improved clinical results at 2-year follow-up, compared with open TLIF. Our study used propensity-score matching to minimize the effects of nonrandom assignment of subjects to MIS TLIF or open TLIF. A limitation of observational studies is that bias in assignment of subjects to treatment groups can lead to overestimation or underestimation of the effect of the treatment itself. Propensity-score matching attempts to reduce this bias by accounting for several covariates that predict whether a subject will receive a certain treatment. These covariates are used in a logistic regression to produce a propensity score, which can be used to match subjects to controls across multiple dimensions, thus ensuring groups are as comparable as possible at baseline.
Our study still has several limitations. Sample size is relatively small, and follow-up is still only intermediate, at 2 years. There was unequal distribution of specific levels of surgery. Because patients were not blinded to the treatment they received, it is possible that patient perception of receiving a newer, less-invasive treatment method may influence their subjective improvement. The study sample was drawn from 2 different centers, with one center providing mostly MIS cases and the other providing mostly open cases. Because of this, undetected differences in how patients were selected for surgery could also affect outcomes. Any latent confounding variables, which are not identified a priori, will not be accounted for in the matching process. Only a prospective, randomized study with large numbers can control for observed and unobserved confounding patient characteristics.
In summary, our study shows that MIS TLIF is associated with improved low back pain and low back–related disability at 2 years compared with open TLIF. Other studies comparing the 2 techniques have come to different conclusions regarding whether the short-term benefits of MIS TLIF translate into long-term differences in clinical outcome. This study adds to this evidence and suggests there may be longer term advantages to the MIS approach, but prospective randomized trials are needed to confirm this finding and determine the true magnitude of these differences.
1. Harms J, Rolinger H. A one-stager procedure in operative treatment of spondylolisthesis: dorsal traction-reposition and anterior fusion (author’s transl). Z Orthop Ihre Grenzgeb. 1982;120(3):343-347.
2. Jagannathan J, Sansur CA, Oskouian RJ Jr, Fu KM, Shaffrey CI. Radiographic restoration of lumbar alignment after transforaminal lumbar interbody fusion. Neurosurgery. 2009;64(5):955-963.
3. Foley KT, Holly LT, Schwender JD. Minimally invasive lumbar fusion. Spine. 2003;28(15 suppl):S26-S35.
4. Rouben D, Casnellie M, Ferguson M. Long-term durability of minimally invasive posterior transforaminal lumbar interbody fusion: a clinical and radiographic follow-up. J Spinal Disord Tech. 2011;24(5):288-296.
5. Schwender JD, Holly LT, Rouben DP, Foley KT. Minimally invasive transforaminal lumbar interbody fusion (TLIF): technical feasibility and initial results. J Spinal Disord Tech. 2005;18(suppl):S1-S6.
6. Goldstein CL, Macwan K, Sundararajan K, Rampersaud YR. Comparative outcomes of minimally invasive surgery for posterior lumbar fusion: a systematic review. Clin Orthop Relat Res. 2014;472(6):1727-1737.
7. Adogwa O, Parker SL, Bydon A, Cheng J, McGirt MJ. Comparative effectiveness of minimally invasive versus open transforaminal lumbar interbody fusion: 2-year assessment of narcotic use, return to work, disability, and quality of life. J Spinal Disord Tech. 2011;24(8):479-484.
8. Ghahreman A, Ferch RD, Rao PJ, Bogduk N. Minimal access versus open posterior lumbar interbody fusion in the treatment of spondylolisthesis. Neurosurgery. 2010;66(2):296-304.
9. Park Y, Ha JW. Comparison of one-level posterior lumbar interbody fusion performed with a minimally invasive approach or a traditional open approach. Spine. 2007;32(5):537-543.
10. Saetia K, Phankhongsab A, Kuansongtham V, Paiboonsirijit S. Comparison between minimally invasive and open transforaminal lumbar interbody fusion. J Med Assoc Thai. 2013;96(1):41-46.
11. Schizas C, Tzinieris N, Tsiridis E, Kosmopoulos V. Minimally invasive versus open transforaminal lumbar interbody fusion: evaluating initial experience. Int Ortop. 2009;33(6):1683-1688.
12. Wang J, Zhou Y, Zhang ZF, Li CQ, Zheng WJ, Liu J. Comparison of one-level minimally invasive and open transforaminal lumbar interbody fusion in degenerative and isthmic spondylolisthesis grades 1 and 2. Eur Spine J. 2010;19(1):1780-1784.
13. Lee KH, Yue WM, Yeo W, Soeharno H, Tan SB. Clinical and radiological outcomes of open versus minimally invasive transforaminal lumbar interbody fusion. Eur Spine J. 2012;21(11):2265-2270.
14. Peng CW, Yue WM, Poh SY, Yeo W, Tan SB. Clinical and radiological outcomes of minimally invasive versus open transforaminal lumbar interbody fusion. Spine. 2009;34(13):1385-1389.
15. Seng C, Siddiqui MA, Wong KP, et al. Five-year outcomes of minimally invasive versus open transforaminal lumbar interbody fusion: a matched-pair comparison study. Spine. 2013;38(23):2049-2055.
16. Fairbank JC, Pynsent PB. The Oswestry Disability Index. Spine. 2000;25(22):2940-2953.
17. Fairbank JC, Couper J, Davies JB, O’Brien JP. The Oswestry low back pain disability questionnaire. Physiotherapy. 1980;66(8):271-273.
18. Ware JE, Kosinski M, Keller SK. SF-36 Physical and Mental Health Summary Scales: A User’s Manual. Boston, MA: The Health Institute, 1994.
19. McCaffery M, Beebe A. Pain: Clinical Manual for Nursing Practice. Baltimore, MD: V.V. Mosby Company, 1993.
20. D’Agostino RB Jr. Propensity score methods for bias reduction in the comparison of a treatment to a non-randomized control group. Stat Med. 1998;17(19):2265-2281.
21. Rosenbaum PR. Model-based direct adjustment. J Am Stat Assn. 1987;82:387-394.
22. Glassman SD, Carreon LY, Djurasovic M, et al. Lumbar fusion outcomes stratified by specific diagnostic indication. Spine J. 2009;9(1):13-21.
23. Fan S, Hu Z, Zhao F, Zhao X, Huang Y, Fang X. Multifidus muscle changes and clinical effects of one-level posterior lumbar interbody fusion: minimally invasive procedure versus conventional open approach. Eur Spine J. 2010;19(2):316-324.
24. Kawaguchi Y, Matsui H, Tsuji H. Back muscle injury after posterior lumbar spine surgery. A histologic and enzymatic analysis. Spine. 1996;21(8):941-944.
25. Sun ZJ, Li WJ, Zhao Y, Qui GX. Comparing minimally invasive and open transforaminal lumbar interbody fusion for treatment of degenerative lumbar disease: a meta-analysis. Chin Med J. 2013;126(2):3962-3971.
26. Parker SL, Mendenhall SK, Shau DN, et al. Minimally invasive versus open transforaminal lumbar interbody fusion for degenerative spondylolisthesis: comparative effectiveness and cost-utility analysis. World Neurosurg. 2014;82(1-2):230-238.
27. Kotani Y, Abumi K, Ito M, Sudo H, Abe Y, Minami A. Mid-term clinical results of minimally invasive decompression and posterolateral fusion with percutaneous pedicle screws versus conventional approach for degenerative spondylolisthesis with spinal stenosis. Eur Spine J. 2012;21(6):1171-1177.
28. Pelton MA, Phillips FM, Singh K. A comparison of perioperative costs and outcomes in patients with and without worker’s compensation claims treated with MIS or open TLIF. Spine. 2012;37(22):1914-1919.
29. Wong AP, Smith ZA, Stadler JA 3rd, et al. Minimally invasive transforaminal lumbar interbody fusion (MI-TLIF). Surgical technique, long-term 4 year prospective outcomes and complications compared with an open TLIF cohort. Neurosurg Clin N Am. 2014;25(2):279-304.
Transforaminal lumbar interbody fusion (TLIF) has become an increasingly popular method of lumbar fusion, since its introduction by Harms and Rolinger in 1982.1 The procedure allows for a circumferential fusion through a posterior-only approach, with improved sagittal alignment2 and minimal risk for iatrogenic nerve injury. In the past decade, a minimally invasive surgical method of TLIF (MIS TLIF) has been introduced3-5 and involves neural decompression and interbody fusion through a tubular retractor, and percutaneous placement of pedicle-screw instrumentation. This technique uses muscle dilation rather than large-scale detachment of muscle. Proponents of the MIS technique have postulated that decreased muscle damage would lead to better short-term, and possibly long-term, clinical outcomes, because of less iatrogenic soft-tissue damage.
Studies that have compared results of MIS TLIF with open TLIF have shown improved perioperative outcomes, but most have shown similar intermediate-term clinical outcomes.6 In the short term, multiple studies demonstrate that MIS TLIF is associated with decreased blood loss, less postoperative pain and narcotic requirements, and shorter hospital length of stay.7-13 However, changes in pain score and disease-specific and generic health-related quality of life measures have been similar for the 2 procedures, beyond 6 months postoperatively.10,13-15 These studies have generally involved retrospective reviews of unmatched patient groups, with small sample sizes and significant heterogeneity in surgical indications and case complexity. In our study, we compared intermediate-term clinical outcomes of MIS TLIF with open TLIF, using propensity matching to optimize baseline similarity of the groups.
Methods
This retrospective study was conducted after receiving approval from the Institutional Review Board. Surgical and clinical databases of 2 centers from 2008 to 2012 were reviewed for eligible subjects. Cases in 2007 were excluded because this was the year that MIS was introduced as a new technique in the practice. Inclusion criteria consisted of patients who underwent 1- to 2-level MIS TLIF and had complete baseline, 1- and 2-year postoperative outcome measures. Patients who had surgery for trauma, tumor, or osteomyelitis were excluded. Outcome measures collected and reviewed in this study included the Oswestry Disability Index (ODI),16,17 the Medical Outcomes Study Short-Form 36 (SF-36),18 and numeric rating scales for back and leg pain (0-100 scale).19 The Physical Composite Summary (PCS) and Mental Composite Summary of the SF-36 were reviewed separately. We recorded the following patient demographic data: age, gender, American Society of Anesthesiologists (ASA) grade, body mass index, indication for surgery, workers’ compensation, and smoking status. Surgical data included number of levels fused, operative time, estimated blood loss, and length of hospital stay.
Propensity-scoring technique20,21 was used to match the MIS TLIF patients to a control group of patients who underwent TLIF using an open approach (open TLIF), matching for multiple characteristics to produce 2 similar comparison groups. Propensity matching was performed to control for bias. In controlling for known confounders or biases, propensity matching, in theory, should also control for unknown confounders. Gender, age, body mass index, smoking status, indication for fusion, as well as preoperative ODI, SF-36 PCS, SF-36 Mental Composite Summary, and pain scores were used to generate a control open TLIF group.
MIS TLIF Surgical Technique
Patients in the MIS TLIF group underwent neural decompression and interbody fusion through a tubular retractor system (METRx, Medtronic Inc.), followed by percutaneous pedicle-screw fixation under fluoroscopic guidance (Sextant, Medtronic Inc.). After successful induction of general endotracheal anesthesia, patients were positioned prone on a radiolucent table. Posteroanterior (PA) and lateral fluoroscopic images were used to localize 2 paramedian incisions, approximately 3-cm to 5-cm lateral to midline, over the pedicles of interest. Modified Jamshidi needles (Medtronic Inc.) were used to cannulate the pedicles under PA, posterior-oblique, PA, and lateral fluoroscopic guidance. The pedicles were tapped with a cannulated tap. Pedicle screws and rods were introduced on the side contralateral to the TLIF and were used as needed to maintain intradiscal distraction during the TLIF portion of the procedure.
Decompression and TLIF were carried out on the side of the patient’s radicular pain or bilaterally, according to the surgeon’s discretion. A K-wire was advanced to the facet joint complex, after which sequential dilators were used to dilate through the muscles to establish an intramuscular corridor to the facet. A 26-mm fixed tubular retractor was docked over the facet and locked in place, using a post attached to the operating room table. Neural decompression was obtained by removal of the entire facet-joint complex and lamina to the base of the spinous process, using a combination of high-speed drills and Kerrison rongeurs. The ligamentum flavum was completely resected. The superior articular process of the caudal vertebra was removed all the way to the pedicle below. Ball-tipped probes were used to confirm that traversing and exiting nerve roots were completely free. An annulotomy was performed, and all disc material was removed from the disc through a combination of rotating shavers, serrated curettes, endplate scrapers, and rasps. Bone graft was placed anterior and contralateral to the interbody cage. (Bone grafts included autogenous iliac crest, local bone obtained from the decompression, recombinant human bone morphogenetic protein 2, or allograft demineralized bone matrix at the surgeon’s discretion.) After placement of the interbody cage, the ipsilateral pedicle-screw instrumentation was put over the remaining guide wires and compression applied across the construct to lock the interbody cage and restore lordosis. Wounds were closed without drains.
Open TLIF Surgical Technique
In patients undergoing open TLIF, a midline incision was made over the vertebrae of interest, and paraspinal muscles were subperiosteally dissected to the tips of the transverse processes. The appropriate level was confirmed with intraoperative radiograph. Pedicle screws were placed free-hand using anatomic landmarks, and appropriate placement was confirmed with intraoperative radiograph and evoked electromyography stimulation. Laminectomy and facetectomy were performed, and the disc was entered on the side of the facetectomy. After thorough disc-space preparation, bone graft and an interbody cage were placed, rods inserted, and compression carried out. A supplemental posterolateral fusion was also performed after decortication of the transverse processes and cartilaginous surface of the contralateral facet. Layered wound closure was performed over drains.
Analysis
Statistical analysis was carried out using SPSS Statistics version 17.0 (IBM) with significance set at the P < .01 level. A small, conservative P-value threshold was used to minimize type II error that resulted from the multiple comparisons performed. Student t test was used to determine any significant differences between continuous demographic variables, and to compare preoperative and postoperative outcome measure scores within and between study groups. Fisher’s exact test was used to compare categorical variables between the 2 groups.
Results
The MIS TLIF group consisted of 64 patients (average age, 52 years), and included 22 patients with degenerative spondylolisthesis, 33 with disc pathology, 8 with postdecompression, and 1 non-union patient. The open TLIF group consisted of 64 patients (average age, 54 years), and included 39 degenerative spondylolisthesis, 15 disc pathology, 7 postdecompression, and 3 nonunion patients (Table 1). All 64 open and 19 MIS cases were from a spine practice with 6 surgeons, and 45 MIS cases came from a spine practice with 2 surgeons. There was also an unequal distribution of the specific levels fused between the open and MIS groups.
Although the operative time was similar in both groups, the MIS TLIF group had a statistically significantly lower blood loss compared with the open TLIF group (Table 2). Both MIS TLIF and open TLIF lead to significant improvements in pain, ODI, and SF-36 PCS (P < .01) (Table 3). At 1 year, both groups had similar improvements in pain (36.9 vs 30.8, P = .178) and SF-36 PCS (9.9 vs 7.5, P = .231), but the MIS TLIF group had a statistically significantly greater improvement in ODI compared with the open TLIF group (30.4 vs 15.1, P < .000). At 2 years, both groups had similar improvements in SF-36 PCS (12.1 vs 7.5, P = .033), but the MIS TLIF group had a statistically significantly greater improvement in pain (40.2 vs 27.0, P = .005) and ODI (33.1 vs 15.4, P < .000) compared with the open TLIF group (Table 4).
![]()
Discussion
The current study compared intermediate-term clinical outcomes of MIS TLIF to open TLIF. We used propensity matching to identify a control group of open TLIFs that were comparable to the MIS TLIF group across a variety of covariates that are known to influence the results of lumbar fusion. This created comparison groups that were as closely matched at baseline as possible. We found that, at 2-year follow-up, MIS TLIF patients had less pain and less low-back pain–related disability as measured by ODI. There was also a trend toward better generic health-related quality of life in the MIS TLIF group.
These data suggest that the decreased soft-tissue trauma of the minimally invasive surgical technique, which leads to improved perioperative parameters in the short term, may also lead to some advantages that translate to improved intermediate-term clinical outcomes. Traditional lumbar fusion procedures have shown excellent clinical results when used for accepted clinical indications.22 However, the procedure requires extensive dissection of the paraspinal muscles, which causes significant muscle damage as evidenced by muscle breakdown products that can be detected in the bloodstream postoperatively.23,24 The lateral dissection also transects the dorsal ramus of the segmental nerves, which innervate the paraspinal muscles, leading to significant scarring and atrophy on postoperative imaging studies.23 Some authors have used the term “fusion disease” to describe the constellation of soft-tissue degradation seen after open lumbar fusion.5
An MIS version of the TLIF procedure that was described in 20033 avoids much of this iatrogenic soft-tissue trauma. It involves intramuscular dilation to approach the spine and to carry out neural decompression and interbody fusion, in conjunction with percutaneous pedicle-screw instrumentation. Proponents of this technique point to diminished iatrogenic soft-tissue and muscle damage as an advantage. Multiple studies have, in fact, confirmed improved short-term perioperative parameters, such as less blood loss, lower narcotic requirements, and decreased length-of-hospital stay.25 Economic analyses have also shown lower direct and indirect costs with the MIS technique.26
Several studies have compared patient-reported outcome measures of MIS and open TLIF, and the results have been mixed. Most of these studies have shown similar improvement in clinical outcomes between the 2 procedures, but the MIS technique demonstrated short-term perioperative advantages, such as lower blood loss, less narcotic requirements, and shorter length of stay.7-15 The authors of these studies conclude that the MIS technique can provide similar long-term results with lower short-term morbidity when compared with open TLIF. In contrast, some studies have shown better short- and intermediate-term clinical outcomes with the MIS technique.23,27-29 As a whole, the literature comparing the 2 procedures consists of mostly small retrospective studies with nonrandomized patient samples, heterogeneous surgical indications, and differing surgical techniques, making it difficult to draw conclusions.
The current study suggests that MIS TLIF may lead to improved clinical results at 2-year follow-up, compared with open TLIF. Our study used propensity-score matching to minimize the effects of nonrandom assignment of subjects to MIS TLIF or open TLIF. A limitation of observational studies is that bias in assignment of subjects to treatment groups can lead to overestimation or underestimation of the effect of the treatment itself. Propensity-score matching attempts to reduce this bias by accounting for several covariates that predict whether a subject will receive a certain treatment. These covariates are used in a logistic regression to produce a propensity score, which can be used to match subjects to controls across multiple dimensions, thus ensuring groups are as comparable as possible at baseline.
Our study still has several limitations. Sample size is relatively small, and follow-up is still only intermediate, at 2 years. There was unequal distribution of specific levels of surgery. Because patients were not blinded to the treatment they received, it is possible that patient perception of receiving a newer, less-invasive treatment method may influence their subjective improvement. The study sample was drawn from 2 different centers, with one center providing mostly MIS cases and the other providing mostly open cases. Because of this, undetected differences in how patients were selected for surgery could also affect outcomes. Any latent confounding variables, which are not identified a priori, will not be accounted for in the matching process. Only a prospective, randomized study with large numbers can control for observed and unobserved confounding patient characteristics.
In summary, our study shows that MIS TLIF is associated with improved low back pain and low back–related disability at 2 years compared with open TLIF. Other studies comparing the 2 techniques have come to different conclusions regarding whether the short-term benefits of MIS TLIF translate into long-term differences in clinical outcome. This study adds to this evidence and suggests there may be longer term advantages to the MIS approach, but prospective randomized trials are needed to confirm this finding and determine the true magnitude of these differences.
1. Harms J, Rolinger H. A one-stager procedure in operative treatment of spondylolisthesis: dorsal traction-reposition and anterior fusion (author’s transl). Z Orthop Ihre Grenzgeb. 1982;120(3):343-347.
2. Jagannathan J, Sansur CA, Oskouian RJ Jr, Fu KM, Shaffrey CI. Radiographic restoration of lumbar alignment after transforaminal lumbar interbody fusion. Neurosurgery. 2009;64(5):955-963.
3. Foley KT, Holly LT, Schwender JD. Minimally invasive lumbar fusion. Spine. 2003;28(15 suppl):S26-S35.
4. Rouben D, Casnellie M, Ferguson M. Long-term durability of minimally invasive posterior transforaminal lumbar interbody fusion: a clinical and radiographic follow-up. J Spinal Disord Tech. 2011;24(5):288-296.
5. Schwender JD, Holly LT, Rouben DP, Foley KT. Minimally invasive transforaminal lumbar interbody fusion (TLIF): technical feasibility and initial results. J Spinal Disord Tech. 2005;18(suppl):S1-S6.
6. Goldstein CL, Macwan K, Sundararajan K, Rampersaud YR. Comparative outcomes of minimally invasive surgery for posterior lumbar fusion: a systematic review. Clin Orthop Relat Res. 2014;472(6):1727-1737.
7. Adogwa O, Parker SL, Bydon A, Cheng J, McGirt MJ. Comparative effectiveness of minimally invasive versus open transforaminal lumbar interbody fusion: 2-year assessment of narcotic use, return to work, disability, and quality of life. J Spinal Disord Tech. 2011;24(8):479-484.
8. Ghahreman A, Ferch RD, Rao PJ, Bogduk N. Minimal access versus open posterior lumbar interbody fusion in the treatment of spondylolisthesis. Neurosurgery. 2010;66(2):296-304.
9. Park Y, Ha JW. Comparison of one-level posterior lumbar interbody fusion performed with a minimally invasive approach or a traditional open approach. Spine. 2007;32(5):537-543.
10. Saetia K, Phankhongsab A, Kuansongtham V, Paiboonsirijit S. Comparison between minimally invasive and open transforaminal lumbar interbody fusion. J Med Assoc Thai. 2013;96(1):41-46.
11. Schizas C, Tzinieris N, Tsiridis E, Kosmopoulos V. Minimally invasive versus open transforaminal lumbar interbody fusion: evaluating initial experience. Int Ortop. 2009;33(6):1683-1688.
12. Wang J, Zhou Y, Zhang ZF, Li CQ, Zheng WJ, Liu J. Comparison of one-level minimally invasive and open transforaminal lumbar interbody fusion in degenerative and isthmic spondylolisthesis grades 1 and 2. Eur Spine J. 2010;19(1):1780-1784.
13. Lee KH, Yue WM, Yeo W, Soeharno H, Tan SB. Clinical and radiological outcomes of open versus minimally invasive transforaminal lumbar interbody fusion. Eur Spine J. 2012;21(11):2265-2270.
14. Peng CW, Yue WM, Poh SY, Yeo W, Tan SB. Clinical and radiological outcomes of minimally invasive versus open transforaminal lumbar interbody fusion. Spine. 2009;34(13):1385-1389.
15. Seng C, Siddiqui MA, Wong KP, et al. Five-year outcomes of minimally invasive versus open transforaminal lumbar interbody fusion: a matched-pair comparison study. Spine. 2013;38(23):2049-2055.
16. Fairbank JC, Pynsent PB. The Oswestry Disability Index. Spine. 2000;25(22):2940-2953.
17. Fairbank JC, Couper J, Davies JB, O’Brien JP. The Oswestry low back pain disability questionnaire. Physiotherapy. 1980;66(8):271-273.
18. Ware JE, Kosinski M, Keller SK. SF-36 Physical and Mental Health Summary Scales: A User’s Manual. Boston, MA: The Health Institute, 1994.
19. McCaffery M, Beebe A. Pain: Clinical Manual for Nursing Practice. Baltimore, MD: V.V. Mosby Company, 1993.
20. D’Agostino RB Jr. Propensity score methods for bias reduction in the comparison of a treatment to a non-randomized control group. Stat Med. 1998;17(19):2265-2281.
21. Rosenbaum PR. Model-based direct adjustment. J Am Stat Assn. 1987;82:387-394.
22. Glassman SD, Carreon LY, Djurasovic M, et al. Lumbar fusion outcomes stratified by specific diagnostic indication. Spine J. 2009;9(1):13-21.
23. Fan S, Hu Z, Zhao F, Zhao X, Huang Y, Fang X. Multifidus muscle changes and clinical effects of one-level posterior lumbar interbody fusion: minimally invasive procedure versus conventional open approach. Eur Spine J. 2010;19(2):316-324.
24. Kawaguchi Y, Matsui H, Tsuji H. Back muscle injury after posterior lumbar spine surgery. A histologic and enzymatic analysis. Spine. 1996;21(8):941-944.
25. Sun ZJ, Li WJ, Zhao Y, Qui GX. Comparing minimally invasive and open transforaminal lumbar interbody fusion for treatment of degenerative lumbar disease: a meta-analysis. Chin Med J. 2013;126(2):3962-3971.
26. Parker SL, Mendenhall SK, Shau DN, et al. Minimally invasive versus open transforaminal lumbar interbody fusion for degenerative spondylolisthesis: comparative effectiveness and cost-utility analysis. World Neurosurg. 2014;82(1-2):230-238.
27. Kotani Y, Abumi K, Ito M, Sudo H, Abe Y, Minami A. Mid-term clinical results of minimally invasive decompression and posterolateral fusion with percutaneous pedicle screws versus conventional approach for degenerative spondylolisthesis with spinal stenosis. Eur Spine J. 2012;21(6):1171-1177.
28. Pelton MA, Phillips FM, Singh K. A comparison of perioperative costs and outcomes in patients with and without worker’s compensation claims treated with MIS or open TLIF. Spine. 2012;37(22):1914-1919.
29. Wong AP, Smith ZA, Stadler JA 3rd, et al. Minimally invasive transforaminal lumbar interbody fusion (MI-TLIF). Surgical technique, long-term 4 year prospective outcomes and complications compared with an open TLIF cohort. Neurosurg Clin N Am. 2014;25(2):279-304.
Operative Versus Nonoperative Treatment of Jones Fractures: A Decision Analysis Model
The optimal management strategy for acute fractures of the metadiaphyseal fifth metatarsal (Jones fractures) is controversial. Patients can be successfully treated nonoperatively with non-weight-bearing and immobilization in a short leg cast1-7 or operatively with placement of an intramedullary screw.8-10 The primary advantage of nonoperative treatment is avoiding the risks and discomfort of surgery; disadvantages include the need for prolonged immobilization and protected weight-bearing as well as a decreased union rate.8,9 Advantages of operative treatment include accelerated functional recovery and an improved union rate; disadvantages include exposure to the risks, inconvenience, and discomfort of surgery. Clear, definitive evidence for guiding treatment is not available in the orthopedic literature, and treatment strategies vary substantially according to surgeon and patient preference.
Expected-value decision analysis, a research tool that helps guide decision-making in situations of uncertainty, has been effectively applied to other areas of uncertainty in the orthopedic literature.11-14 Borrowed from gaming theory, the technique involves creating a decision tree to define the clinical problem, determining outcome probabilities and utilities, performing a fold-back analysis to determine the optimal decision-making strategy, and performing a sensitivity analysis to model the effect of varying outcome probabilities and utilities on decision-making. Decision analysis may therefore allow the clinician and the patient to optimize decision-making based on best available evidence and patient preferences. It also helps determine the most important factors affecting management strategies and the decision-making process, which may not always be intuitive.
In the present study, we used expected-value decision analysis to determine the optimal management strategy, operative or nonoperative, for acute Jones fracture. We also explored factors with the most influence on the model and identified important questions for future research.
Materials and Methods
Institutional review board approval was obtained for this study. Analysis was performed with Treeage Pro statistical software (Treeage Software).
Outcome Probabilities
Outcome probabilities were determined by reviewing the literature for articles on Jones fractures. This body of literature was summarized in a comprehensive review by Dean and colleagues15, who extracted data from 19 studies: 1 randomized controlled trial, 1 prospective case series, and 17 retrospective case series.15 We used data from these studies to determine outcome probabilities (Table).
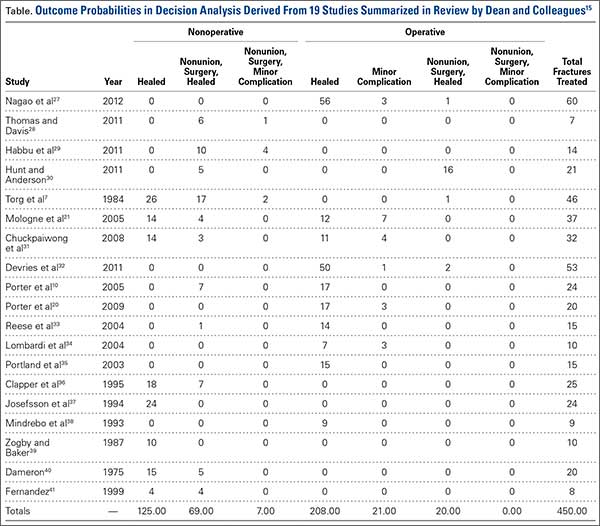
Outcome Utilities
Utilities represent patient preferences for various disease states. Outcome utility values were obtained from 32 adults (25 women, 7 men) with no history of foot injury. Mean age was 32.4 years (range, 20-69 years). The questionnaire presented scenarios for the different outcomes and asked patients to rate these outcomes on a scale ranging from 0 (worst possible outcome) to 10 (best possible outcome). The Sports subscale of the Foot and Ankle Ability Measure (FAAM) 16 was used to quantify patient activity level.
Decision Tree and Fold-Back Analysis
A decision tree was constructed with 1 decision node, 4 chance nodes, and 7 terminal nodes (Figure 1). The decision tree demonstrates 2 different strategies for managing a Jones fracture. The decision node divides the tree into 2 branches: initial operative or nonoperative treatment. Both branches are followed by various chance nodes, each terminating in a discrete clinical outcome. Per convention, utility data were placed to the right of the terminal nodes, and probability data were placed under the terminal nodes.
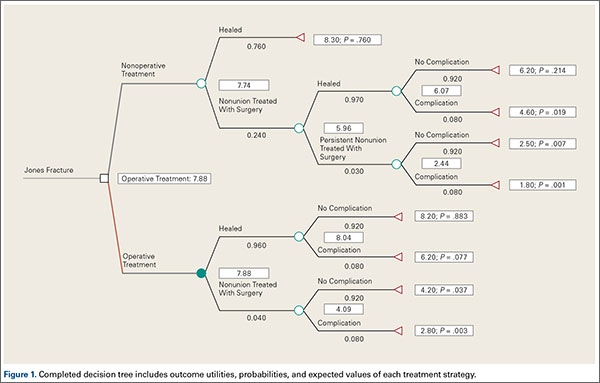
Fold-back analysis was performed to identify the optimal strategy. Fold-back analysis involves multiplying each outcome utility by its associated probability, thereby providing an “expected value” for each clinical endpoint. Then, the expected values for each endpoint can be summed for a given management strategy, and the ultimate expected values of the different strategies can be compared. The management strategy associated with the highest expected value is optimal for the given outcome utilities and probabilities.
Sensitivity Analysis
One-way sensitivity analysis was performed to model the effect on decision-making of changing the values for utility for uncomplicated surgery, utility for healing with nonoperative treatment, utility for uncomplicated treatment of nonunion, likelihood of healing with nonoperative treatment, likelihood of healing with surgery, and likelihood of minor complication with surgery. These were the variables found to affect the decision-making strategy within their clinically plausible ranges.
Results
Outcome Probabilities and Utilities
Outcome probabilities and utilities are illustrated in Figure 1. By convention, probabilities appear below the corresponding branches of the decision tree, and utilities appear at the end of each branch. Mean (SD) FAAM Sports subscale score was 84.6 (27.4). This subscale is scored as a percentage from 0% to 100%, with higher scores indicating a higher level of physical function.
Decision Analysis
The expected value for nonoperative treatment was 7.74, and the expected value for intramedullary screw fixation was 7.88 (Figure 1). Therefore, operative treatment was identified as the optimal treatment strategy.
Sensitivity analyses revealed that the optimal decision making strategy was very sensitive to small changes in several variables. Nonoperative treatment becomes the preferred strategy when the utility value for uncomplicated surgery falls below 8.04 (Figure 2), when the utility for healing with nonoperative treatment rises above 8.49 (Figure 3), when the likelihood of healing with nonoperative treatment rises above 82% (Figure 4), or when the probability of healing after surgery falls below 92% (Figure 5). Nonoperative treatment is also favored when the probability of minor complication with surgery is above 17% (Figure 6) and when utility for a successfully treated nonunion is higher than 6.9 (Figure 7).
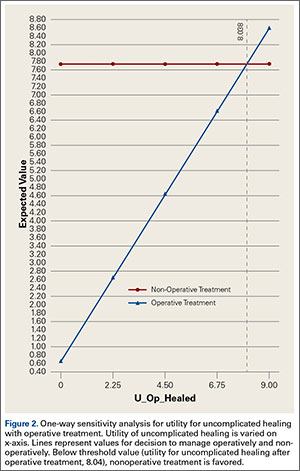
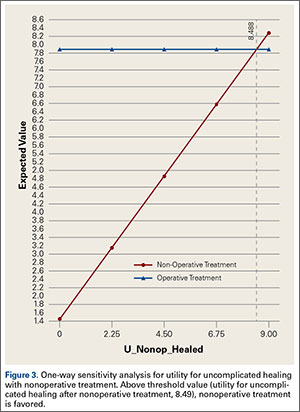
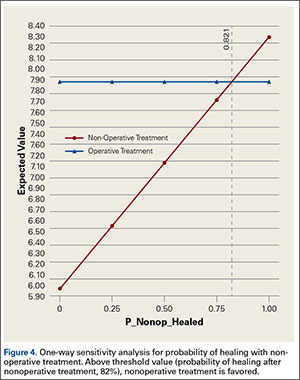
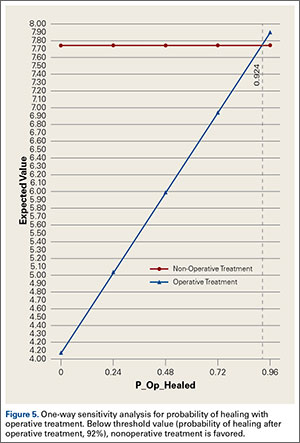
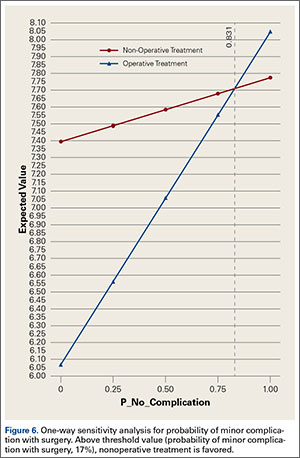
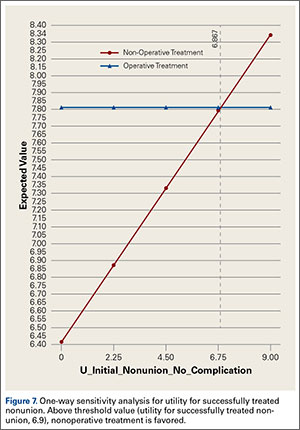
Discussion
Optimal management of a metadiaphyseal fracture of the fifth metatarsal (Jones fracture) remains controversial. The decision between initial operative or nonoperative treatment lends itself to expected-value decision analysis because of well-defined treatment options and relatively discrete outcomes. The principal advantages of nonoperative treatment are that it allows the patient to avoid the risks and discomfort of surgery, and the principal advantages of operative treatment are that it maximizes the chance of fracture union and may accelerate functional recovery.
Our decision analysis determined that operative fixation is the optimal decision path, given the outcome probabilities derived from the literature and the utilities obtained from surveys. This finding is in accordance with several expert opinions in foot and ankle fracture surgery.17,18 However, the expected values of the operative and nonoperative treatment strategies differed by only 0.3 on a 10-point scale. Such similar expected values in our model are not surprising given the controversy surrounding clinical decision making in the treatment of these fractures.19
In addition, our analysis identified the important variables in the decision-making process. Patients averse to surgery, patients not averse to successful nonoperative treatment, and patients who view successful nonunion surgery after initial nonoperative treatment as a relatively positive outcome may be best treated nonoperatively. These findings emphasize the importance of patient preferences and shared decision-making. Higher rates of healing with nonoperative treatment, lower rates of healing with surgery, and higher complication rates with surgery also favor nonoperative management. It would therefore be valuable to identify risk factors for nonunion with nonoperative treatment and to identify the technical details of surgery that maximize rates of healing and minimize the risk of complications.
The limitations of decision analysis involve the methods by which probabilities and utilities are obtained. In general, the most accurate, stable, and robust estimates of outcome probabilities are derived from a meta-analytic synthesis of randomized clinical trials, the highest level of clinical evidence. In our model, data were extracted primarily from level IV studies; only 1 level III study20 and 1 level II study21 were available for analysis. Thus, as is the case with many foot and ankle disorders22, the information on treatment of Jones fractures is very limited in its level of clinical evidence.
Determination of outcome utility also has limitations. Utility is a subjective value that an individual places on a specific outcome. This can be very difficult to quantify. In general, the most robust estimates of patient-derived utilities are derived from complex qualitative methods, such as the standard reference gamble or time trade-offs, in which patients are asked to gamble or choose between health states usually referenced to death. In this study, we determined patient-derived utility values from a direct scaling method using a Likert scale because of the complexity of the standard reference gamble and the difficulty of referencing to death for metatarsal fracture. Although use of a direct scale to determine utility values is less rigorous than the standard reference gamble, this technique has been corroborated methodologically,23 is advantageous in terms of feasibility and reliability,24 and has been successfully used in other orthopedic decision analysis models.12,25,26 In our estimation, generally active patients without a history of foot pathology constituted a sample of convenience but also were representative of individuals at risk for Jones fracture. Although specific scenarios were presented, the patients who completed the questionnaire may not have had deep insights into the subtleties and implications of the various disease states and treatments. Regardless of how outcome probabilities and utilities are determined, they are considered point estimates in decision analysis, and sensitivity analyses are therefore performed to assess how decision making changes over a range of values.
Conclusion
The results of this study may help optimize the process of deciding between operative and nonoperative treatment for Jones fracture. For a given patient, the optimal strategy depends not only on the probabilities of the various outcomes but also on personal preference. Thus, there may not be one right answer for all patients. Patients who value a higher chance of fracture healing with initial treatment or an earlier return to sports are best treated operatively, whereas patients who are risk-averse and place a high value on fracture healing without surgery should be managed nonoperatively. We therefore advocate a model of shared medical decision-making in which the physician and the patient are jointly involved, considering both outcome probabilities and patient preferences. Ongoing research efforts should focus on predictors of nonunion with nonoperative treatment.
1. Dameron TB Jr. Fractures of the proximal fifth metatarsal: selecting the best treatment option. J Am Acad Orthop Surg. 1995;3(2):110-114.
2. Fetzer GB, Wright RW. Metatarsal shaft fractures and fractures of the proximal fifth metatarsal. Clin Sports Med. 2006;25(1):139-150, x.
3. Konkel KF, Menger AG, Retzlaff SA. Nonoperative treatment of fifth metatarsal fractures in an orthopaedic suburban private multispeciality practice. Foot Ankle Int. 2005;26(9):704-707.
4. Lawrence SJ, Botte MJ. Jones’ fractures and related fractures of the proximal fifth metatarsal. Foot Ankle. 1993;14(6):358-365.
5. Nunley JA. Fractures of the base of the fifth metatarsal: the Jones fracture. Orthop Clin North Am. 2001;32(1):171-180.
6. Quill GE Jr. Fractures of the proximal fifth metatarsal. Orthop Clin North Am. 1995;26(2):353-361.
7. Torg JS, Balduini FC, Zelko RR, Pavlov H, Peff TC, Das M. Fractures of the base of the fifth metatarsal distal to the tuberosity. Classification and guidelines for non-surgical and surgical management. J Bone Joint Surg Am. 1984;66(2):209-214.
8. DeLee JC, Evans JP, Julian J. Stress fracture of the fifth metatarsal. Am J Sports Med. 1983;11(5):349-353.
9. Kavanaugh JH, Brower TD, Mann RV. The Jones fracture revisited. J Bone Joint Surg Am. 1978;60(6):776-782.
10. Porter DA, Duncan M, Meyer SJ. Fifth metatarsal Jones fracture fixation with a 4.5-mm cannulated stainless steel screw in the competitive and recreational athlete: a clinical and radiographic evaluation. Am J Sports Med. 2005;33(5):726-733.
11. Aleem IS, Jalal H, Sheikh AA, Bhandari M. Clinical decision analysis: Incorporating the evidence with patient p. Patient Prefer Adherence. 2009;3:21-24.
12. Bishop J, Ring D. Management of radial nerve palsy associated with humeral shaft fracture: a decision analysis model. J Hand Surg Am. 2009;34(6):991-996.e1.
13. Chen NC, Shauver MJ, Chung KC. A primer on use of decision analysis methodology in hand surgery. J Hand Surg Am. 2009;34(6):983-990.
14. Kocher MS, Henley MB. It is money that matters: decision analysis and cost-effectiveness analysis. Clin Orthop Relat Res. 2003(413):106-116.
15. Dean BJ, Kothari A, Uppal H, Kankate R. The jones fracture classification, management, outcome, and complications: a systematic review. Foot Ankle Spec. 2012;5(4):256-259.
16. Martin RL, Irrgang JJ, Burdett RG, Conti SF, Van Swearingen JM. Evidence of validity for the Foot and Ankle Ability Measure (FAAM). Foot Ankle Int. 2005;26(11):968-983.
17. Roche AJ, Calder JD. Treatment and return to sport following a Jones fracture of the fifth metatarsal: a systematic review. Knee Surg Sports Traumatol Arthrosc. 2013;21(6):1307-1315.
18. Zwitser EW, Breederveld RS. Fractures of the fifth metatarsal; diagnosis and treatment. Injury. 2010;41(6):555-562.
19. McBryde AM Jr. The complicated Jones fracture, including revision and malalignment. Foot Ankle Clin. 2009;14(2):151-168.
20. Porter DA, Rund AM, Dobslaw R, Duncan M. Comparison of 4.5- and 5.5-mm cannulated stainless steel screws for fifth metatarsal Jones fracture fixation. Foot Ankle Int. 2009;30(1):27-33.
21. Mologne TS, Lundeen JM, Clapper MF, O’Brien TJ. Early screw fixation versus casting in the treatment of acute Jones fractures. Am J Sports Med. 2005;33(7):970-975.
22. Hunt KJ, Hurwit D. Use of patient-reported outcome measures in foot and ankle research. J Bone Joint Surg Am. 2013;95(16):e118(1-9).
23. Stiggelbout AM, Eijkemans MJ, Kiebert GM, Kievit J, Leer JW, De Haes HJ. The ‘utility’ of the visual analog scale in medical decision making and technology assessment. Is it an alternative to the time trade-off? International journal of technology assessment in health care. Spring. 1996;12(2):291-298.
24. Parkin D, Devlin N. Is there a case for using visual analogue scale valuations in cost-utility analysis? Health Econ. 2006;15(7):653-664.
25. Bishop JA, Crall TS, Kocher MS. Operative versus nonoperative treatment after primary traumatic anterior glenohumeral dislocation: expected-value decision analysis. J Shoulder Elbow Surg. 2011;20(7):1087-1094.
26. Kocher MS, Bishop J, Marshall R, Briggs KK, Hawkins RJ. Operative versus nonoperative management of acute Achilles tendon rupture: expected-value decision analysis. Am J Sports Med. 2002;30(6):783-790.
27. Nagao M, Saita Y, Kameda S, et al. Headless compression screw fixation of jones fractures: an outcomes study in Japanese athletes. Am J Sports Med. 2012;40(11):2578-2582.
28. Thomas JL, Davis BC. Treatment of Jones fracture nonunion with isolated intramedullary screw fixation. J Foot Ankle Surg. 2011;50(5):566-568.
29. Habbu RA, Marsh RS, Anderson JG, Bohay DR. Closed intramedullary screw fixation for nonunion of fifth metatarsal Jones fracture. Foot Ankle Int. 2011;32(6):603-608.
30. Hunt KJ, Anderson RB. Treatment of Jones fracture nonunions and refractures in the elite athlete: outcomes of intramedullary screw fixation with bone grafting. Am J Sports Med. 2011;39(9):1948-1954.
31. Chuckpaiwong B, Queen RM, Easley ME, Nunley JA. Distinguishing Jones and proximal diaphyseal fractures of the fifth metatarsal. Clin Orthop Relat Res. 2008;466(8):1966-1970.
32. DeVries JG, Cuttica DJ, Hyer CF. Cannulated screw fixation of Jones fifth metatarsal fractures: a comparison of titanium and stainless steel screw fixation. J Foot Ankle Surg. 2011;50(2):207-212.
33. Reese K, Litsky A, Kaeding C, Pedroza A, Shah N. Cannulated screw fixation of Jones fractures: a clinical and biomechanical study. Am J Sports Med. 2004;32(7):1736-1742.
34. Lombardi CM, Connolly FG, Silhanek AD. The use of external fixation for treatment of the acute Jones fracture: a retrospective review of 10 cases. J Foot Ankle Surg. 2004;43(3):173-178.
35. Portland G, Kelikian A, Kodros S. Acute surgical management of Jones’ fractures. Foot Ankle Int. 2003;24(11):829-833.
36. Clapper MF, O’Brien TJ, Lyons PM. Fractures of the fifth metatarsal. Analysis of a fracture registry. Clin Orthop Relat Res. 1995(315):238-241.
37. Josefsson PO, Karlsson M, Redlund-Johnell I, Wendeberg B. Closed treatment of Jones fracture. Good results in 40 cases after 11-26 years. Orthop Scand. 1994;65(5):545-547.
38. Mindrebo N, Shelbourne KD, Van Meter CD, Rettig AC. Outpatient percutaneous screw fixation of the acute Jones fracture. Am J Sports Med. 1993;21(5):720-723.
39. Zogby RG, Baker BE. A review of nonoperative treatment of Jones’ fracture. Am J Sports Med. 1987;15(4):304-307.
40. Dameron TB Jr. Fractures and anatomical variations of the proximal portion of the fifth metatarsal. J Bone Joint Surg Am. 1975;57(6):788-792.
41. Fernandez Fairen M, Guillen J, Busto JM, Roura J. Fractures of the fifth metatarsal in basketball players. Knee Surg Sports Traumatol Arthrosc. 1999;7(6):373-377.
The optimal management strategy for acute fractures of the metadiaphyseal fifth metatarsal (Jones fractures) is controversial. Patients can be successfully treated nonoperatively with non-weight-bearing and immobilization in a short leg cast1-7 or operatively with placement of an intramedullary screw.8-10 The primary advantage of nonoperative treatment is avoiding the risks and discomfort of surgery; disadvantages include the need for prolonged immobilization and protected weight-bearing as well as a decreased union rate.8,9 Advantages of operative treatment include accelerated functional recovery and an improved union rate; disadvantages include exposure to the risks, inconvenience, and discomfort of surgery. Clear, definitive evidence for guiding treatment is not available in the orthopedic literature, and treatment strategies vary substantially according to surgeon and patient preference.
Expected-value decision analysis, a research tool that helps guide decision-making in situations of uncertainty, has been effectively applied to other areas of uncertainty in the orthopedic literature.11-14 Borrowed from gaming theory, the technique involves creating a decision tree to define the clinical problem, determining outcome probabilities and utilities, performing a fold-back analysis to determine the optimal decision-making strategy, and performing a sensitivity analysis to model the effect of varying outcome probabilities and utilities on decision-making. Decision analysis may therefore allow the clinician and the patient to optimize decision-making based on best available evidence and patient preferences. It also helps determine the most important factors affecting management strategies and the decision-making process, which may not always be intuitive.
In the present study, we used expected-value decision analysis to determine the optimal management strategy, operative or nonoperative, for acute Jones fracture. We also explored factors with the most influence on the model and identified important questions for future research.
Materials and Methods
Institutional review board approval was obtained for this study. Analysis was performed with Treeage Pro statistical software (Treeage Software).
Outcome Probabilities
Outcome probabilities were determined by reviewing the literature for articles on Jones fractures. This body of literature was summarized in a comprehensive review by Dean and colleagues15, who extracted data from 19 studies: 1 randomized controlled trial, 1 prospective case series, and 17 retrospective case series.15 We used data from these studies to determine outcome probabilities (Table).
Outcome Utilities
Utilities represent patient preferences for various disease states. Outcome utility values were obtained from 32 adults (25 women, 7 men) with no history of foot injury. Mean age was 32.4 years (range, 20-69 years). The questionnaire presented scenarios for the different outcomes and asked patients to rate these outcomes on a scale ranging from 0 (worst possible outcome) to 10 (best possible outcome). The Sports subscale of the Foot and Ankle Ability Measure (FAAM) 16 was used to quantify patient activity level.
Decision Tree and Fold-Back Analysis
A decision tree was constructed with 1 decision node, 4 chance nodes, and 7 terminal nodes (Figure 1). The decision tree demonstrates 2 different strategies for managing a Jones fracture. The decision node divides the tree into 2 branches: initial operative or nonoperative treatment. Both branches are followed by various chance nodes, each terminating in a discrete clinical outcome. Per convention, utility data were placed to the right of the terminal nodes, and probability data were placed under the terminal nodes.
Fold-back analysis was performed to identify the optimal strategy. Fold-back analysis involves multiplying each outcome utility by its associated probability, thereby providing an “expected value” for each clinical endpoint. Then, the expected values for each endpoint can be summed for a given management strategy, and the ultimate expected values of the different strategies can be compared. The management strategy associated with the highest expected value is optimal for the given outcome utilities and probabilities.
Sensitivity Analysis
One-way sensitivity analysis was performed to model the effect on decision-making of changing the values for utility for uncomplicated surgery, utility for healing with nonoperative treatment, utility for uncomplicated treatment of nonunion, likelihood of healing with nonoperative treatment, likelihood of healing with surgery, and likelihood of minor complication with surgery. These were the variables found to affect the decision-making strategy within their clinically plausible ranges.
Results
Outcome Probabilities and Utilities
Outcome probabilities and utilities are illustrated in Figure 1. By convention, probabilities appear below the corresponding branches of the decision tree, and utilities appear at the end of each branch. Mean (SD) FAAM Sports subscale score was 84.6 (27.4). This subscale is scored as a percentage from 0% to 100%, with higher scores indicating a higher level of physical function.
Decision Analysis
The expected value for nonoperative treatment was 7.74, and the expected value for intramedullary screw fixation was 7.88 (Figure 1). Therefore, operative treatment was identified as the optimal treatment strategy.
Sensitivity analyses revealed that the optimal decision making strategy was very sensitive to small changes in several variables. Nonoperative treatment becomes the preferred strategy when the utility value for uncomplicated surgery falls below 8.04 (Figure 2), when the utility for healing with nonoperative treatment rises above 8.49 (Figure 3), when the likelihood of healing with nonoperative treatment rises above 82% (Figure 4), or when the probability of healing after surgery falls below 92% (Figure 5). Nonoperative treatment is also favored when the probability of minor complication with surgery is above 17% (Figure 6) and when utility for a successfully treated nonunion is higher than 6.9 (Figure 7).
Discussion
Optimal management of a metadiaphyseal fracture of the fifth metatarsal (Jones fracture) remains controversial. The decision between initial operative or nonoperative treatment lends itself to expected-value decision analysis because of well-defined treatment options and relatively discrete outcomes. The principal advantages of nonoperative treatment are that it allows the patient to avoid the risks and discomfort of surgery, and the principal advantages of operative treatment are that it maximizes the chance of fracture union and may accelerate functional recovery.
Our decision analysis determined that operative fixation is the optimal decision path, given the outcome probabilities derived from the literature and the utilities obtained from surveys. This finding is in accordance with several expert opinions in foot and ankle fracture surgery.17,18 However, the expected values of the operative and nonoperative treatment strategies differed by only 0.3 on a 10-point scale. Such similar expected values in our model are not surprising given the controversy surrounding clinical decision making in the treatment of these fractures.19
In addition, our analysis identified the important variables in the decision-making process. Patients averse to surgery, patients not averse to successful nonoperative treatment, and patients who view successful nonunion surgery after initial nonoperative treatment as a relatively positive outcome may be best treated nonoperatively. These findings emphasize the importance of patient preferences and shared decision-making. Higher rates of healing with nonoperative treatment, lower rates of healing with surgery, and higher complication rates with surgery also favor nonoperative management. It would therefore be valuable to identify risk factors for nonunion with nonoperative treatment and to identify the technical details of surgery that maximize rates of healing and minimize the risk of complications.
The limitations of decision analysis involve the methods by which probabilities and utilities are obtained. In general, the most accurate, stable, and robust estimates of outcome probabilities are derived from a meta-analytic synthesis of randomized clinical trials, the highest level of clinical evidence. In our model, data were extracted primarily from level IV studies; only 1 level III study20 and 1 level II study21 were available for analysis. Thus, as is the case with many foot and ankle disorders22, the information on treatment of Jones fractures is very limited in its level of clinical evidence.
Determination of outcome utility also has limitations. Utility is a subjective value that an individual places on a specific outcome. This can be very difficult to quantify. In general, the most robust estimates of patient-derived utilities are derived from complex qualitative methods, such as the standard reference gamble or time trade-offs, in which patients are asked to gamble or choose between health states usually referenced to death. In this study, we determined patient-derived utility values from a direct scaling method using a Likert scale because of the complexity of the standard reference gamble and the difficulty of referencing to death for metatarsal fracture. Although use of a direct scale to determine utility values is less rigorous than the standard reference gamble, this technique has been corroborated methodologically,23 is advantageous in terms of feasibility and reliability,24 and has been successfully used in other orthopedic decision analysis models.12,25,26 In our estimation, generally active patients without a history of foot pathology constituted a sample of convenience but also were representative of individuals at risk for Jones fracture. Although specific scenarios were presented, the patients who completed the questionnaire may not have had deep insights into the subtleties and implications of the various disease states and treatments. Regardless of how outcome probabilities and utilities are determined, they are considered point estimates in decision analysis, and sensitivity analyses are therefore performed to assess how decision making changes over a range of values.
Conclusion
The results of this study may help optimize the process of deciding between operative and nonoperative treatment for Jones fracture. For a given patient, the optimal strategy depends not only on the probabilities of the various outcomes but also on personal preference. Thus, there may not be one right answer for all patients. Patients who value a higher chance of fracture healing with initial treatment or an earlier return to sports are best treated operatively, whereas patients who are risk-averse and place a high value on fracture healing without surgery should be managed nonoperatively. We therefore advocate a model of shared medical decision-making in which the physician and the patient are jointly involved, considering both outcome probabilities and patient preferences. Ongoing research efforts should focus on predictors of nonunion with nonoperative treatment.
1. Dameron TB Jr. Fractures of the proximal fifth metatarsal: selecting the best treatment option. J Am Acad Orthop Surg. 1995;3(2):110-114.
2. Fetzer GB, Wright RW. Metatarsal shaft fractures and fractures of the proximal fifth metatarsal. Clin Sports Med. 2006;25(1):139-150, x.
3. Konkel KF, Menger AG, Retzlaff SA. Nonoperative treatment of fifth metatarsal fractures in an orthopaedic suburban private multispeciality practice. Foot Ankle Int. 2005;26(9):704-707.
4. Lawrence SJ, Botte MJ. Jones’ fractures and related fractures of the proximal fifth metatarsal. Foot Ankle. 1993;14(6):358-365.
5. Nunley JA. Fractures of the base of the fifth metatarsal: the Jones fracture. Orthop Clin North Am. 2001;32(1):171-180.
6. Quill GE Jr. Fractures of the proximal fifth metatarsal. Orthop Clin North Am. 1995;26(2):353-361.
7. Torg JS, Balduini FC, Zelko RR, Pavlov H, Peff TC, Das M. Fractures of the base of the fifth metatarsal distal to the tuberosity. Classification and guidelines for non-surgical and surgical management. J Bone Joint Surg Am. 1984;66(2):209-214.
8. DeLee JC, Evans JP, Julian J. Stress fracture of the fifth metatarsal. Am J Sports Med. 1983;11(5):349-353.
9. Kavanaugh JH, Brower TD, Mann RV. The Jones fracture revisited. J Bone Joint Surg Am. 1978;60(6):776-782.
10. Porter DA, Duncan M, Meyer SJ. Fifth metatarsal Jones fracture fixation with a 4.5-mm cannulated stainless steel screw in the competitive and recreational athlete: a clinical and radiographic evaluation. Am J Sports Med. 2005;33(5):726-733.
11. Aleem IS, Jalal H, Sheikh AA, Bhandari M. Clinical decision analysis: Incorporating the evidence with patient p. Patient Prefer Adherence. 2009;3:21-24.
12. Bishop J, Ring D. Management of radial nerve palsy associated with humeral shaft fracture: a decision analysis model. J Hand Surg Am. 2009;34(6):991-996.e1.
13. Chen NC, Shauver MJ, Chung KC. A primer on use of decision analysis methodology in hand surgery. J Hand Surg Am. 2009;34(6):983-990.
14. Kocher MS, Henley MB. It is money that matters: decision analysis and cost-effectiveness analysis. Clin Orthop Relat Res. 2003(413):106-116.
15. Dean BJ, Kothari A, Uppal H, Kankate R. The jones fracture classification, management, outcome, and complications: a systematic review. Foot Ankle Spec. 2012;5(4):256-259.
16. Martin RL, Irrgang JJ, Burdett RG, Conti SF, Van Swearingen JM. Evidence of validity for the Foot and Ankle Ability Measure (FAAM). Foot Ankle Int. 2005;26(11):968-983.
17. Roche AJ, Calder JD. Treatment and return to sport following a Jones fracture of the fifth metatarsal: a systematic review. Knee Surg Sports Traumatol Arthrosc. 2013;21(6):1307-1315.
18. Zwitser EW, Breederveld RS. Fractures of the fifth metatarsal; diagnosis and treatment. Injury. 2010;41(6):555-562.
19. McBryde AM Jr. The complicated Jones fracture, including revision and malalignment. Foot Ankle Clin. 2009;14(2):151-168.
20. Porter DA, Rund AM, Dobslaw R, Duncan M. Comparison of 4.5- and 5.5-mm cannulated stainless steel screws for fifth metatarsal Jones fracture fixation. Foot Ankle Int. 2009;30(1):27-33.
21. Mologne TS, Lundeen JM, Clapper MF, O’Brien TJ. Early screw fixation versus casting in the treatment of acute Jones fractures. Am J Sports Med. 2005;33(7):970-975.
22. Hunt KJ, Hurwit D. Use of patient-reported outcome measures in foot and ankle research. J Bone Joint Surg Am. 2013;95(16):e118(1-9).
23. Stiggelbout AM, Eijkemans MJ, Kiebert GM, Kievit J, Leer JW, De Haes HJ. The ‘utility’ of the visual analog scale in medical decision making and technology assessment. Is it an alternative to the time trade-off? International journal of technology assessment in health care. Spring. 1996;12(2):291-298.
24. Parkin D, Devlin N. Is there a case for using visual analogue scale valuations in cost-utility analysis? Health Econ. 2006;15(7):653-664.
25. Bishop JA, Crall TS, Kocher MS. Operative versus nonoperative treatment after primary traumatic anterior glenohumeral dislocation: expected-value decision analysis. J Shoulder Elbow Surg. 2011;20(7):1087-1094.
26. Kocher MS, Bishop J, Marshall R, Briggs KK, Hawkins RJ. Operative versus nonoperative management of acute Achilles tendon rupture: expected-value decision analysis. Am J Sports Med. 2002;30(6):783-790.
27. Nagao M, Saita Y, Kameda S, et al. Headless compression screw fixation of jones fractures: an outcomes study in Japanese athletes. Am J Sports Med. 2012;40(11):2578-2582.
28. Thomas JL, Davis BC. Treatment of Jones fracture nonunion with isolated intramedullary screw fixation. J Foot Ankle Surg. 2011;50(5):566-568.
29. Habbu RA, Marsh RS, Anderson JG, Bohay DR. Closed intramedullary screw fixation for nonunion of fifth metatarsal Jones fracture. Foot Ankle Int. 2011;32(6):603-608.
30. Hunt KJ, Anderson RB. Treatment of Jones fracture nonunions and refractures in the elite athlete: outcomes of intramedullary screw fixation with bone grafting. Am J Sports Med. 2011;39(9):1948-1954.
31. Chuckpaiwong B, Queen RM, Easley ME, Nunley JA. Distinguishing Jones and proximal diaphyseal fractures of the fifth metatarsal. Clin Orthop Relat Res. 2008;466(8):1966-1970.
32. DeVries JG, Cuttica DJ, Hyer CF. Cannulated screw fixation of Jones fifth metatarsal fractures: a comparison of titanium and stainless steel screw fixation. J Foot Ankle Surg. 2011;50(2):207-212.
33. Reese K, Litsky A, Kaeding C, Pedroza A, Shah N. Cannulated screw fixation of Jones fractures: a clinical and biomechanical study. Am J Sports Med. 2004;32(7):1736-1742.
34. Lombardi CM, Connolly FG, Silhanek AD. The use of external fixation for treatment of the acute Jones fracture: a retrospective review of 10 cases. J Foot Ankle Surg. 2004;43(3):173-178.
35. Portland G, Kelikian A, Kodros S. Acute surgical management of Jones’ fractures. Foot Ankle Int. 2003;24(11):829-833.
36. Clapper MF, O’Brien TJ, Lyons PM. Fractures of the fifth metatarsal. Analysis of a fracture registry. Clin Orthop Relat Res. 1995(315):238-241.
37. Josefsson PO, Karlsson M, Redlund-Johnell I, Wendeberg B. Closed treatment of Jones fracture. Good results in 40 cases after 11-26 years. Orthop Scand. 1994;65(5):545-547.
38. Mindrebo N, Shelbourne KD, Van Meter CD, Rettig AC. Outpatient percutaneous screw fixation of the acute Jones fracture. Am J Sports Med. 1993;21(5):720-723.
39. Zogby RG, Baker BE. A review of nonoperative treatment of Jones’ fracture. Am J Sports Med. 1987;15(4):304-307.
40. Dameron TB Jr. Fractures and anatomical variations of the proximal portion of the fifth metatarsal. J Bone Joint Surg Am. 1975;57(6):788-792.
41. Fernandez Fairen M, Guillen J, Busto JM, Roura J. Fractures of the fifth metatarsal in basketball players. Knee Surg Sports Traumatol Arthrosc. 1999;7(6):373-377.
Epidemiology and Impact of Knee Injuries in Major and Minor League Baseball Players
Injuries among professional baseball players have been on the rise for several years.1,2 From 1989 to 1999, the number of disabled list (DL) reports increased 38% (266 to 367 annual reports),1 and a similar increase in injury rates was noted from the 2002 to the 2008 seasons (37%).2 These injuries have important implications for future injury risk and time away from play. Identifying these injuries and determining correlates and risk factors is important for targeted prevention efforts.
Several studies have explored the prevalence of upper extremity injuries in professional and collegiate baseball players;2-4 however, detailed epidemiology of knee injuries in Major League Baseball (MLB) and Minor League Baseball (MiLB) players is lacking. Much more is known about the prevalence, treatment, and outcomes of knee injuries in other professional sporting organizations, such as the National Basketball Association (NBA), National Football League (NFL), and National Hockey League (NHL).4-12 A recent meta-analysis exploring injuries in professional athletes found that studies on lower extremity injuries comprised approximately 12% of the literature reporting injuries in MLB players.4 In other professional leagues, publications on lower extremity injuries comprise approximately 56% of the sports medicine literature in the NFL, 54% in the NBA, and 62% in the NHL.4 Since few studies have investigated lower extremity injuries among professional baseball players, there is an opportunity for additional research to guide evidence-based prevention strategies.
A better understanding of the nature of these injuries is one of the first steps towards developing targeted injury prevention programs and treatment algorithms. The study of injury epidemiology among professional baseball players has been aided by the creation of an injury tracking system initiated by the MLB, its minor league affiliates, and the Major League Baseball Players Association.5,13,14 This surveillance system allows for the tracking of medical histories and injuries to players as they move across major and minor league organizations. Similar systems have been utilized in the National Collegiate Athletic Association and other professional sports organizations.3,15-17 A unique advantage of the MLB surveillance system is the required participation of all major and minor league teams, which allows for investigation of the entire population of players rather than simply a sample of players from select teams. This system has propelled an effort to identify injury patterns as a means of developing appropriate targets for potential preventative measures.5
The purpose of this descriptive epidemiologic study is to better understand the distribution and characteristics of knee injuries in these elite athletes by reporting on all knee injuries occurring over a span of 4 seasons (2011-2014). Additionally, this study seeks to characterize the impact of these injuries by analyzing the time required for return to play and the treatments rendered (surgical and nonsurgical).
Materials and Methods
After approval from the Johns Hopkins Bloomberg School of Public Health Institutional Review Board, detailed data regarding knee injuries in both MLB and MiLB baseball players were extracted from the de-identified MLB Health and Injury Tracking System (HITS). The HITS database is a centralized database that contains data on injuries from an electronic medical record (EMR). All players provided consent to have their data included in this EMR. HITS system captures injuries reported by the athletic trainers for all professional baseball players from 30 MLB clubs and their 230 minor league affiliates. Additional details on this population of professional baseball players have been published elsewhere.5 Only injuries that result in time out of play (≥1 day missed) are included in the database, and they are logged with basic information such as region of the body, diagnosis, date, player position, activity leading to injury, and general treatment. Any injury that affects participation in any aspect of baseball-related activity (eg, game, practice, warm-up, conditioning, weight training) is captured in HITS.
All baseball-related knee injuries occurring during the 2011-2014 seasons that resulted in time out of sport were included in the study. These injuries were identified based on the Sports Medicine Diagnostic Coding System (SMDCS) to capture injuries by diagnostic groups.18 Knee injuries were included if they occurred during spring training, regular season, or postseason play. Offseason injuries were not included. Injury events that were classified as “season-ending” were not included in the analysis of days missed because many of these players may not have been cleared to play until the beginning of the following season. To determine the proportion of knee injuries during the study period, all injuries were included for comparative purposes (subdivided based on 30 anatomic regions or types).
For each knee injury, a number of variables were analyzed, including diagnosis, level of play (MLB vs. MiLB), age, player position at the time of injury (pitcher, catcher, infield, outfield, base runner, or batter), field location where the injury occurred (home plate, pitcher’s mound, infield, outfield, foul territory or bullpen, or other), mechanism of injury, days missed, and treatment rendered (conservative vs surgical). The classification used to describe the mechanism of injury consisted of contact with ball, contact with ground, contact with another player, contact with another object, or noncontact.
Statistical Analysis Epidemiologic data are presented with descriptive statistics such as mean, median, frequency, and percentage where appropriate. When comparing player age, days missed, and surgical vs nonsurgical treatment between MLB and MiLB players, t-tests and tests for difference in proportions were applied as appropriate. Statistical significance was established for P values < .05.
The distribution of days missed for the variables considered was often skewed to the right (ie, days missed mostly concentrated on the low to moderate number of days, with fewer values in the much higher days missed range), even after excluding the season-ending injuries; hence the mean (or average) days missed was often larger than the median days missed. Reporting the median would allow for a robust estimate of the expected number of days missed, but would down weight those instances when knee injuries result in much longer missed days, as reflected by the mean. Because of the importance of the days missed measure for professional baseball, both the mean and median are presented.
In order to estimate exposure, the average number of players per team per game was calculated based on analysis of regular season game participation via box scores. This average number over a season, multiplied by the number of team games at each professional level of baseball, was used as an estimate of athlete exposures in order to provide rates comparable to those of other injury surveillance systems. Injury rates were reported as injuries per 1000 athlete-exposures (AE) for those knee injuries that occurred during the regular season. It should be noted that the number of regular season knee injuries and the subsequent AE rates are based on injuries that were deemed work-related during the regular season. This does not necessarily only include injuries occurring during the course of a game, but injuries in game preparation as well. Due to the variations in spring training games and fluctuating rosters, an exposure rate could not be calculated for spring training knee injuries.
RESULTS
Overall Summary
Of the 30 general body regions/systems included in the HITS database, injuries to the knee were the fifth most common reason for days missed in all of professional baseball from 2011-2014 (Table 1). Injuries to the knee represented 6.5% of the nearly 34,000 injuries sustained during the study period. Knee injuries were the fifth most common reason for time out of play for players in both the MiLB and MLB.
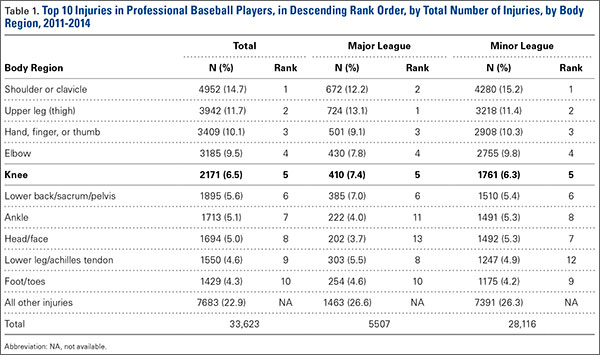
A total of 2171 isolated knee injuries resulted in time out of sport for professional baseball players (Table 2). Of these, 410 (19%) occurred in MLB players and 1761 (81%) occurred in MiLB players. MLB players were older than MiLB players at the time of injury (29.5 vs 22.8 years, respectively). Overall mean number of days missed was 16.2 days per knee injury, with MLB players missing an approximately 7 days more per injury than MiLB athletes (21.8 vs. 14.9 days respectively; P = .001).Over the course of the 4 seasons, a total of 30,449 days were missed due to knee injuries in professional baseball, giving an average rate of 7612 days lost per season. Surgery was performed for 263 (12.1%) of the 2171 knee injuries, with a greater proportion of MLB players requiring surgery than MiLB players (17.3% vs 10.9%) (P < .001). With respect to number of days missed per injury, 26% of knee injuries in the minor leagues resulted in greater than 30 days missed, while this number rose to 32% for knee injuries in MLB players (Table 3).
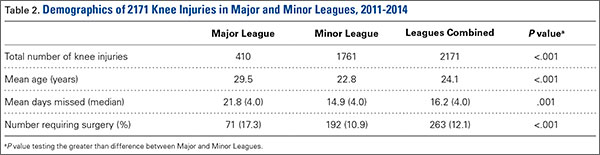
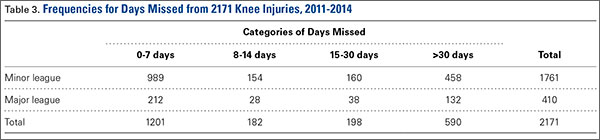
For regular season games, it was estimated that there were 1,197,738 MiLB and 276,608 MLB AE, respectively, over the course of the 4 seasons (2011-2014). The overall knee injury rate across both the MiLB and MLB was 1.2 per 1000 AE, based on the subset of 308 and 1473 regular season knee injuries in MiLB and MLB, respectively. The rate of knee injury was similar and not significantly different between the MiLB and MLB (1.2 per 1000 AE in the MiLB and 1.1 per 1000 AE in the MLB).
Characteristics of Injuries
When considering the position of the player during injury, defensive players were most frequently injured (n = 742, 56.5%), with pitchers (n = 227, 17.3%), infielders (n =193, 14.7%), outfielders (n = 193, 14.7%), and catchers (n = 129, 9.8%) sustaining injuries in decreasing frequency. Injuries while on offense (n = 571, 43.5%) were most frequent in base runners (n = 320, 24.4%) followed by batters (n = 251, 19.1%) (Table 4). Injuries while on defense occurring in infielders and catchers resulted in the longest period of time away from play (average of 22.4 and 20.8 days missed, respectively), while those occurring in batters resulted in the least average days missed (8.9 days).
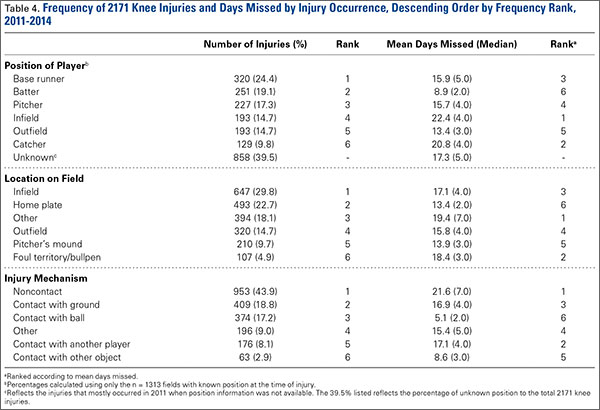
The most common field location for knee injuries to occur was the infield, which was responsible for n = 647 (29.8%) of the total knee injuries (Table 4). This was followed by home plate (n = 493, 22.7%), other locations outside those specified (n = 394, 18.1%), outfield (n = 320, 14.7%), pitcher’s mound (n = 210, 9.7%), and foul territory or the bullpen (n = 107, 4.9%). Of the knee injuries with a specified location, those occurring in foul territory or the bullpen resulted in the highest mean days missed (18.4), while those occurring at home plate resulted in the least mean days missed (13.4 days).
When analyzed by mechanism of injury, noncontact injuries (n = 953, 43.9%) were more common than being hit with the ball (n = 374, 17.2%), striking the ground (n = 409, 18.8%), other mechanisms not listed (n = 196, 9%), contact with another player (n = 176, 8.1%), or contact with other objects (n = 63, 2.9%) (Table 4). Noncontact injuries and player to player collisions resulted in the greatest number of missed days (21.6 and 17.1 days, respectively) while being struck by the ball resulted in the least mean days missed (5.1).
Of the n = 493 knee injuries occurring at home plate, n = 212 (43%) occurred to the batter, n = 100 (20%) to the catcher, n = 34 (6.9%) to base runners, and n = 7 (1.4%) to pitchers (Table 5). The majority of knee injuries in the infield occurred to base runners (n = 283, 43.7%). Player-to-player collisions at home plate were responsible for 51 (2.3%) knee injuries, while 163 (24%) were noncontact injuries and 376 (56%) were the result of a player being hit by the ball (Table 5).
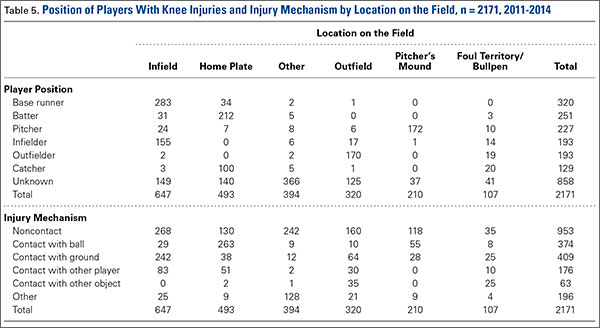
Injury Diagnosis
By diagnosis, the most common knee injuries observed were contusions or hematomas (n = 662, 30.5%), other injuries (n = 415, 19.1%), sprains or ligament injuries (n = 380, 17.5%), tendinopathies or bursitis (n = 367, 16.9%), and meniscal or cartilage injury (n = 200, 9.2%) (Table 6). Injuries resulting in the greatest mean number of days missed included meniscal or cartilage injuries (44 days), sprains or ligament injuries (30 days), or dislocations (22 days).
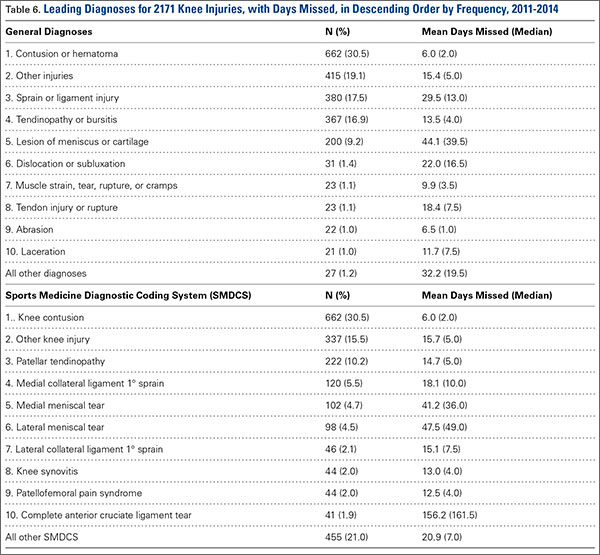
Based on specific SMDCS descriptors, the most frequent knee injuries reported were contusion (n = 662, 30.5%), patella tendinopathy (n = 222, 10.2%), and meniscal tears (n = 200, 9.2%) (Table 6). Complete anterior cruciate ligament tears, although infrequent, were responsible for the greatest mean days missed (156.2 days). This was followed by lateral meniscus tears (47.5 days) and medial meniscus tears (41.2 days). Knee contusions, although very common, resulted in the least number of days missed (6.0 days).
Discussion
Although much is known about knee injuries in other professional athletic leagues, little is known about knee injuries in professional baseball players.2-4 The majority of epidemiologic studies regarding baseball players at any level emphasizes the study of shoulder and elbow injuries.3,4,19 Since the implementation of the electronic medical record and the HITS database in professional baseball, there has been increased effort to document injuries that have received less attention in the existing literature. Understanding the epidemiology of these injuries is important for the development of targeted prevention efforts.
Prior studies of injuries in professional baseball relied on data captured by the publicly available DL. Posner and colleagues2 provide one of the most comprehensive reports on MLB injuries in a report utilizing DL assignment data over a period of 7 seasons.They demonstrated that knee injuries were responsible for 7.7% (12.5% for fielders and 3.7% for pitchers) of assignments to the DL. The current study utilized a comprehensive surveillance and builds on this existing knowledge. The present study found similar trends to Posner and colleagues2 in that knee injuries were responsible for 6.5% of injuries in professional baseball players that resulted in missed games. From the 2002 season to the 2008 season, knee injuries were the fifth most common reason MLB players were placed on the DL,2 and the current study indicates that they remain the fifth most common reason for missed time from play based on the HITS data. Since the prevalence of these injuries have remained constant since the 2002 season, efforts to better understand these injuries are warranted in order to identify strategies to prevent them. These analyses have generated important data towards achieving this understanding.
As with most injuries in professional sports, goals for treatment are aimed at maximizing patient function and performance while minimizing time out of play. For the 2011-2014 professional baseball seasons, a total of 2171 players sustained knee injuries and missed an average of 16.2 days per injury. Knee injuries were responsible for a total of 7612 days of missed work for MLB and MiLB players per season (30,449 days over the 4-season study period). This is equivalent to a total of 20.9 years of players’ time lost in professional baseball per season over the last 4 years. The implications of this amount of time away from sport are significant, and further study should be targeted at prevention of these injuries and optimizing return to play times.
When attempting to reduce the burden of knee injuries in professional baseball, it may prove beneficial to first understand how the injuries occur, where on the field, and who is at greatest risk. From 2011 to 2014, nearly 44% of knee injuries occurred by noncontact mechanisms. Among all locations on the field where knee injuries occurred, those occurring in the infield were responsible for the greatest mean days missed. The players who seem to be at greatest risk for knee injuries appear to be base runners. These data suggest the need for prevention efforts targeting base runners and infield players, as well as players in MiLB, where the largest number of injuries occurred.
Recently, playing rules implemented by MLB after consultation with players have focused on reducing the number of player-to-player collisions at home plate in an attempt to decrease the injury burden to catchers and base runners.20 This present analysis suggests that this rule change may also reduce the occurrence of knee injuries, as player collisions at home plate were responsible for a total of 51 knee injuries during the study period. The impact of this rule change on injury rates should also be explored. Interestingly, of the 51 knees injuries occurring due to contact at home plate, 23 occurred in 2011, and only 2 occurred in 2014—the first year of the new rule. Additional areas that resulted in high numbers of knee injuries were player-to-player contact in the infield and player contact with the ground in the infield.
Attempting to reduce injury burden and time out of play related to knee injuries in professional baseball players will likely prove to be a difficult task. In order to generate meaningful improvement, a comprehensive approach that involves players, management, trainers, therapists, and physicians will likely be required. As the first report of the epidemiology of knee injuries in professional baseball players, this study is one important step in that process. The strengths of this study are its comprehensive nature that analyzes injuries from an entire population of players on more than 200 teams over a 3-year period. Also, this research is strengthened by its focus on one particular region of the body that has received limited attention in the empirical literature, but represents a significant source of lost time during the baseball season.
There are some limitations to this study. As with any injury surveillance system, there is the possibility that not all cases were captured. Additionally, since the surveillance system is based on data from multiple teams, data entry discrepancy is possible; however, the presence of dropdown boxes and systematic definitions for injuries reduces this risk. Finally, this study did not investigate the various treatments for knee injuries beyond whether or not the injury required surgery. Since this was the first comprehensive exploration of knee injuries in professional baseball, future studies are needed to explore additional facets including outcomes related to treatment, return to play, and performance.
Conclusion
Knee injuries represent 6.5% of all injuries in professional baseball, occurring at a rate of 1.3 per 1000 AE. The burden of these injuries is significant for professional baseball players. This study fills a critical gap in sports injury research by contributing to the knowledge about the effect of knee injuries in professional baseball. It also provides an important foundation for future epidemiologic inquiry to identify modifiable risk factors and interventions that may reduce the impact of these injuries in athletes.
1. Conte S, Requa RK, Garrick JG. Disability days in major league baseball. Am J Sports Med. 2001;29(4):431-436.
2. Posner M, Cameron KL, Wolf JM, Belmont PJ Jr, Owens BD. Epidemiology of Major League Baseball injuries. Am J Sports Med. 2011;39(8):1676-1680.
3. Dick R, Sauers EL, Agel J, et al. Descriptive epidemiology of collegiate men’s baseball injuries: National Collegiate Athletic Association Injury Surveillance System, 1988-1989 through 2003-2004. J Athletic Training. 2007;42(2):183-193.
4. Makhni EC, Buza JA, Byram I, Ahmad CS. Sports reporting: A comprehensive review of the medical literature regarding North American professional sports. Phys Sportsmed. 2014;42(2):154-162.
5. Ahmad CS, Dick RW, Snell E, et al. Major and Minor League Baseball hamstring injuries: epidemiologic findings from the Major League Baseball Injury Surveillance System. Am J Sports Med. 2014;42(6):1464-1470.
6. Aune KT, Andrews JR, Dugas JR, Cain EL Jr. Return to play after partial lateral meniscectomy in National Football League Athletes. Am J Sports Med. 2014;42(8):1865-1872.
7. Brophy RH, Gill CS, Lyman S, Barnes RP, Rodeo SA, Warren RF. Effect of anterior cruciate ligament reconstruction and meniscectomy on length of career in National Football League athletes: a case control study. Am J Sports Med. 2009;37(11):2102-2107.
8. Brophy RH, Rodeo SA, Barnes RP, Powell JW, Warren RF. Knee articular cartilage injuries in the National Football League: epidemiology and treatment approach by team physicians. J Knee Surg. 2009;22(4):331-338.
9. Cerynik DL, Lewullis GE, Joves BC, Palmer MP, Tom JA. Outcomes of microfracture in professional basketball players. Knee Surg Sports Traumatol Arthrosc. 2009;17(9):1135-1139.
10. Hershman EB, Anderson R, Bergfeld JA, et al; National Football League Injury and Safety Panel. An analysis of specific lower extremity injury rates on grass and FieldTurf playing surfaces in National Football League Games: 2000-2009 seasons. Am J Sports Med. 2012;40(10):2200-2205.
11. Namdari S, Baldwin K, Anakwenze O, Park MJ, Huffman GR, Sennett BJ. Results and performance after microfracture in National Basketball Association athletes. Am J Sports Med. 2009;37(5):943-948.
12. Yeh PC, Starkey C, Lombardo S, Vitti G, Kharrazi FD. Epidemiology of isolated meniscal injury and its effect on performance in athletes from the National Basketball Association. Am J Sports Med. 2012;40(3):589-594.
13. Pollack KM, D’Angelo J, Green G, et al. Developing and implementing major league baseball’s health and injury tracking system. Am J Epidem. (accepted), 2016.
14. Green GA, Pollack KM, D’Angelo J, et al. Mild traumatic brain injury in major and Minor League Baseball players. Am J Sports Med. 2015;43(5):1118-1126.
15. Dick R, Agel J, Marshall SW. National Collegiate Athletic Association Injury Surveillance System commentaries: introduction and methods. J Athletic Training. 2007;42(2):173-182.
16. Pellman EJ, Viano DC, Casson IR, Arfken C, Feuer H. Concussion in professional football players returning to the same game—part 7. Neurosurg. 2005;56(1):79-90.
17. Stevens ST, Lassonde M, De Beaumont L, Keenan JP. The effect of visors on head and facial injury in national hockey league players. J Sci Med Sport. 2006;9(3):238-242.
18. Meeuwisse WH, Wiley JP. The sport medicine diagnostic coding system. Clin J Sport Med. 2007;17(3):205-207.
19. Mcfarland EG, Wasik M. Epidemiology of collegiate baseball injuries. Clin J Sport Med. 1998;8(1):10-13.
20. Hagen P. New rule on home-plate collisions put into effect. Major League Baseball website. http://m.mlb.com/news/article/68267610/mlb-institutes-new-rule-on-home-plate-collisions. Accessed December 5, 2014.
Injuries among professional baseball players have been on the rise for several years.1,2 From 1989 to 1999, the number of disabled list (DL) reports increased 38% (266 to 367 annual reports),1 and a similar increase in injury rates was noted from the 2002 to the 2008 seasons (37%).2 These injuries have important implications for future injury risk and time away from play. Identifying these injuries and determining correlates and risk factors is important for targeted prevention efforts.
Several studies have explored the prevalence of upper extremity injuries in professional and collegiate baseball players;2-4 however, detailed epidemiology of knee injuries in Major League Baseball (MLB) and Minor League Baseball (MiLB) players is lacking. Much more is known about the prevalence, treatment, and outcomes of knee injuries in other professional sporting organizations, such as the National Basketball Association (NBA), National Football League (NFL), and National Hockey League (NHL).4-12 A recent meta-analysis exploring injuries in professional athletes found that studies on lower extremity injuries comprised approximately 12% of the literature reporting injuries in MLB players.4 In other professional leagues, publications on lower extremity injuries comprise approximately 56% of the sports medicine literature in the NFL, 54% in the NBA, and 62% in the NHL.4 Since few studies have investigated lower extremity injuries among professional baseball players, there is an opportunity for additional research to guide evidence-based prevention strategies.
A better understanding of the nature of these injuries is one of the first steps towards developing targeted injury prevention programs and treatment algorithms. The study of injury epidemiology among professional baseball players has been aided by the creation of an injury tracking system initiated by the MLB, its minor league affiliates, and the Major League Baseball Players Association.5,13,14 This surveillance system allows for the tracking of medical histories and injuries to players as they move across major and minor league organizations. Similar systems have been utilized in the National Collegiate Athletic Association and other professional sports organizations.3,15-17 A unique advantage of the MLB surveillance system is the required participation of all major and minor league teams, which allows for investigation of the entire population of players rather than simply a sample of players from select teams. This system has propelled an effort to identify injury patterns as a means of developing appropriate targets for potential preventative measures.5
The purpose of this descriptive epidemiologic study is to better understand the distribution and characteristics of knee injuries in these elite athletes by reporting on all knee injuries occurring over a span of 4 seasons (2011-2014). Additionally, this study seeks to characterize the impact of these injuries by analyzing the time required for return to play and the treatments rendered (surgical and nonsurgical).
Materials and Methods
After approval from the Johns Hopkins Bloomberg School of Public Health Institutional Review Board, detailed data regarding knee injuries in both MLB and MiLB baseball players were extracted from the de-identified MLB Health and Injury Tracking System (HITS). The HITS database is a centralized database that contains data on injuries from an electronic medical record (EMR). All players provided consent to have their data included in this EMR. HITS system captures injuries reported by the athletic trainers for all professional baseball players from 30 MLB clubs and their 230 minor league affiliates. Additional details on this population of professional baseball players have been published elsewhere.5 Only injuries that result in time out of play (≥1 day missed) are included in the database, and they are logged with basic information such as region of the body, diagnosis, date, player position, activity leading to injury, and general treatment. Any injury that affects participation in any aspect of baseball-related activity (eg, game, practice, warm-up, conditioning, weight training) is captured in HITS.
All baseball-related knee injuries occurring during the 2011-2014 seasons that resulted in time out of sport were included in the study. These injuries were identified based on the Sports Medicine Diagnostic Coding System (SMDCS) to capture injuries by diagnostic groups.18 Knee injuries were included if they occurred during spring training, regular season, or postseason play. Offseason injuries were not included. Injury events that were classified as “season-ending” were not included in the analysis of days missed because many of these players may not have been cleared to play until the beginning of the following season. To determine the proportion of knee injuries during the study period, all injuries were included for comparative purposes (subdivided based on 30 anatomic regions or types).
For each knee injury, a number of variables were analyzed, including diagnosis, level of play (MLB vs. MiLB), age, player position at the time of injury (pitcher, catcher, infield, outfield, base runner, or batter), field location where the injury occurred (home plate, pitcher’s mound, infield, outfield, foul territory or bullpen, or other), mechanism of injury, days missed, and treatment rendered (conservative vs surgical). The classification used to describe the mechanism of injury consisted of contact with ball, contact with ground, contact with another player, contact with another object, or noncontact.
Statistical Analysis Epidemiologic data are presented with descriptive statistics such as mean, median, frequency, and percentage where appropriate. When comparing player age, days missed, and surgical vs nonsurgical treatment between MLB and MiLB players, t-tests and tests for difference in proportions were applied as appropriate. Statistical significance was established for P values < .05.
The distribution of days missed for the variables considered was often skewed to the right (ie, days missed mostly concentrated on the low to moderate number of days, with fewer values in the much higher days missed range), even after excluding the season-ending injuries; hence the mean (or average) days missed was often larger than the median days missed. Reporting the median would allow for a robust estimate of the expected number of days missed, but would down weight those instances when knee injuries result in much longer missed days, as reflected by the mean. Because of the importance of the days missed measure for professional baseball, both the mean and median are presented.
In order to estimate exposure, the average number of players per team per game was calculated based on analysis of regular season game participation via box scores. This average number over a season, multiplied by the number of team games at each professional level of baseball, was used as an estimate of athlete exposures in order to provide rates comparable to those of other injury surveillance systems. Injury rates were reported as injuries per 1000 athlete-exposures (AE) for those knee injuries that occurred during the regular season. It should be noted that the number of regular season knee injuries and the subsequent AE rates are based on injuries that were deemed work-related during the regular season. This does not necessarily only include injuries occurring during the course of a game, but injuries in game preparation as well. Due to the variations in spring training games and fluctuating rosters, an exposure rate could not be calculated for spring training knee injuries.
RESULTS
Overall Summary
Of the 30 general body regions/systems included in the HITS database, injuries to the knee were the fifth most common reason for days missed in all of professional baseball from 2011-2014 (Table 1). Injuries to the knee represented 6.5% of the nearly 34,000 injuries sustained during the study period. Knee injuries were the fifth most common reason for time out of play for players in both the MiLB and MLB.
A total of 2171 isolated knee injuries resulted in time out of sport for professional baseball players (Table 2). Of these, 410 (19%) occurred in MLB players and 1761 (81%) occurred in MiLB players. MLB players were older than MiLB players at the time of injury (29.5 vs 22.8 years, respectively). Overall mean number of days missed was 16.2 days per knee injury, with MLB players missing an approximately 7 days more per injury than MiLB athletes (21.8 vs. 14.9 days respectively; P = .001).Over the course of the 4 seasons, a total of 30,449 days were missed due to knee injuries in professional baseball, giving an average rate of 7612 days lost per season. Surgery was performed for 263 (12.1%) of the 2171 knee injuries, with a greater proportion of MLB players requiring surgery than MiLB players (17.3% vs 10.9%) (P < .001). With respect to number of days missed per injury, 26% of knee injuries in the minor leagues resulted in greater than 30 days missed, while this number rose to 32% for knee injuries in MLB players (Table 3).
For regular season games, it was estimated that there were 1,197,738 MiLB and 276,608 MLB AE, respectively, over the course of the 4 seasons (2011-2014). The overall knee injury rate across both the MiLB and MLB was 1.2 per 1000 AE, based on the subset of 308 and 1473 regular season knee injuries in MiLB and MLB, respectively. The rate of knee injury was similar and not significantly different between the MiLB and MLB (1.2 per 1000 AE in the MiLB and 1.1 per 1000 AE in the MLB).
Characteristics of Injuries
When considering the position of the player during injury, defensive players were most frequently injured (n = 742, 56.5%), with pitchers (n = 227, 17.3%), infielders (n =193, 14.7%), outfielders (n = 193, 14.7%), and catchers (n = 129, 9.8%) sustaining injuries in decreasing frequency. Injuries while on offense (n = 571, 43.5%) were most frequent in base runners (n = 320, 24.4%) followed by batters (n = 251, 19.1%) (Table 4). Injuries while on defense occurring in infielders and catchers resulted in the longest period of time away from play (average of 22.4 and 20.8 days missed, respectively), while those occurring in batters resulted in the least average days missed (8.9 days).
The most common field location for knee injuries to occur was the infield, which was responsible for n = 647 (29.8%) of the total knee injuries (Table 4). This was followed by home plate (n = 493, 22.7%), other locations outside those specified (n = 394, 18.1%), outfield (n = 320, 14.7%), pitcher’s mound (n = 210, 9.7%), and foul territory or the bullpen (n = 107, 4.9%). Of the knee injuries with a specified location, those occurring in foul territory or the bullpen resulted in the highest mean days missed (18.4), while those occurring at home plate resulted in the least mean days missed (13.4 days).
When analyzed by mechanism of injury, noncontact injuries (n = 953, 43.9%) were more common than being hit with the ball (n = 374, 17.2%), striking the ground (n = 409, 18.8%), other mechanisms not listed (n = 196, 9%), contact with another player (n = 176, 8.1%), or contact with other objects (n = 63, 2.9%) (Table 4). Noncontact injuries and player to player collisions resulted in the greatest number of missed days (21.6 and 17.1 days, respectively) while being struck by the ball resulted in the least mean days missed (5.1).
Of the n = 493 knee injuries occurring at home plate, n = 212 (43%) occurred to the batter, n = 100 (20%) to the catcher, n = 34 (6.9%) to base runners, and n = 7 (1.4%) to pitchers (Table 5). The majority of knee injuries in the infield occurred to base runners (n = 283, 43.7%). Player-to-player collisions at home plate were responsible for 51 (2.3%) knee injuries, while 163 (24%) were noncontact injuries and 376 (56%) were the result of a player being hit by the ball (Table 5).
Injury Diagnosis
By diagnosis, the most common knee injuries observed were contusions or hematomas (n = 662, 30.5%), other injuries (n = 415, 19.1%), sprains or ligament injuries (n = 380, 17.5%), tendinopathies or bursitis (n = 367, 16.9%), and meniscal or cartilage injury (n = 200, 9.2%) (Table 6). Injuries resulting in the greatest mean number of days missed included meniscal or cartilage injuries (44 days), sprains or ligament injuries (30 days), or dislocations (22 days).
Based on specific SMDCS descriptors, the most frequent knee injuries reported were contusion (n = 662, 30.5%), patella tendinopathy (n = 222, 10.2%), and meniscal tears (n = 200, 9.2%) (Table 6). Complete anterior cruciate ligament tears, although infrequent, were responsible for the greatest mean days missed (156.2 days). This was followed by lateral meniscus tears (47.5 days) and medial meniscus tears (41.2 days). Knee contusions, although very common, resulted in the least number of days missed (6.0 days).
Discussion
Although much is known about knee injuries in other professional athletic leagues, little is known about knee injuries in professional baseball players.2-4 The majority of epidemiologic studies regarding baseball players at any level emphasizes the study of shoulder and elbow injuries.3,4,19 Since the implementation of the electronic medical record and the HITS database in professional baseball, there has been increased effort to document injuries that have received less attention in the existing literature. Understanding the epidemiology of these injuries is important for the development of targeted prevention efforts.
Prior studies of injuries in professional baseball relied on data captured by the publicly available DL. Posner and colleagues2 provide one of the most comprehensive reports on MLB injuries in a report utilizing DL assignment data over a period of 7 seasons.They demonstrated that knee injuries were responsible for 7.7% (12.5% for fielders and 3.7% for pitchers) of assignments to the DL. The current study utilized a comprehensive surveillance and builds on this existing knowledge. The present study found similar trends to Posner and colleagues2 in that knee injuries were responsible for 6.5% of injuries in professional baseball players that resulted in missed games. From the 2002 season to the 2008 season, knee injuries were the fifth most common reason MLB players were placed on the DL,2 and the current study indicates that they remain the fifth most common reason for missed time from play based on the HITS data. Since the prevalence of these injuries have remained constant since the 2002 season, efforts to better understand these injuries are warranted in order to identify strategies to prevent them. These analyses have generated important data towards achieving this understanding.
As with most injuries in professional sports, goals for treatment are aimed at maximizing patient function and performance while minimizing time out of play. For the 2011-2014 professional baseball seasons, a total of 2171 players sustained knee injuries and missed an average of 16.2 days per injury. Knee injuries were responsible for a total of 7612 days of missed work for MLB and MiLB players per season (30,449 days over the 4-season study period). This is equivalent to a total of 20.9 years of players’ time lost in professional baseball per season over the last 4 years. The implications of this amount of time away from sport are significant, and further study should be targeted at prevention of these injuries and optimizing return to play times.
When attempting to reduce the burden of knee injuries in professional baseball, it may prove beneficial to first understand how the injuries occur, where on the field, and who is at greatest risk. From 2011 to 2014, nearly 44% of knee injuries occurred by noncontact mechanisms. Among all locations on the field where knee injuries occurred, those occurring in the infield were responsible for the greatest mean days missed. The players who seem to be at greatest risk for knee injuries appear to be base runners. These data suggest the need for prevention efforts targeting base runners and infield players, as well as players in MiLB, where the largest number of injuries occurred.
Recently, playing rules implemented by MLB after consultation with players have focused on reducing the number of player-to-player collisions at home plate in an attempt to decrease the injury burden to catchers and base runners.20 This present analysis suggests that this rule change may also reduce the occurrence of knee injuries, as player collisions at home plate were responsible for a total of 51 knee injuries during the study period. The impact of this rule change on injury rates should also be explored. Interestingly, of the 51 knees injuries occurring due to contact at home plate, 23 occurred in 2011, and only 2 occurred in 2014—the first year of the new rule. Additional areas that resulted in high numbers of knee injuries were player-to-player contact in the infield and player contact with the ground in the infield.
Attempting to reduce injury burden and time out of play related to knee injuries in professional baseball players will likely prove to be a difficult task. In order to generate meaningful improvement, a comprehensive approach that involves players, management, trainers, therapists, and physicians will likely be required. As the first report of the epidemiology of knee injuries in professional baseball players, this study is one important step in that process. The strengths of this study are its comprehensive nature that analyzes injuries from an entire population of players on more than 200 teams over a 3-year period. Also, this research is strengthened by its focus on one particular region of the body that has received limited attention in the empirical literature, but represents a significant source of lost time during the baseball season.
There are some limitations to this study. As with any injury surveillance system, there is the possibility that not all cases were captured. Additionally, since the surveillance system is based on data from multiple teams, data entry discrepancy is possible; however, the presence of dropdown boxes and systematic definitions for injuries reduces this risk. Finally, this study did not investigate the various treatments for knee injuries beyond whether or not the injury required surgery. Since this was the first comprehensive exploration of knee injuries in professional baseball, future studies are needed to explore additional facets including outcomes related to treatment, return to play, and performance.
Conclusion
Knee injuries represent 6.5% of all injuries in professional baseball, occurring at a rate of 1.3 per 1000 AE. The burden of these injuries is significant for professional baseball players. This study fills a critical gap in sports injury research by contributing to the knowledge about the effect of knee injuries in professional baseball. It also provides an important foundation for future epidemiologic inquiry to identify modifiable risk factors and interventions that may reduce the impact of these injuries in athletes.
1. Conte S, Requa RK, Garrick JG. Disability days in major league baseball. Am J Sports Med. 2001;29(4):431-436.
2. Posner M, Cameron KL, Wolf JM, Belmont PJ Jr, Owens BD. Epidemiology of Major League Baseball injuries. Am J Sports Med. 2011;39(8):1676-1680.
3. Dick R, Sauers EL, Agel J, et al. Descriptive epidemiology of collegiate men’s baseball injuries: National Collegiate Athletic Association Injury Surveillance System, 1988-1989 through 2003-2004. J Athletic Training. 2007;42(2):183-193.
4. Makhni EC, Buza JA, Byram I, Ahmad CS. Sports reporting: A comprehensive review of the medical literature regarding North American professional sports. Phys Sportsmed. 2014;42(2):154-162.
5. Ahmad CS, Dick RW, Snell E, et al. Major and Minor League Baseball hamstring injuries: epidemiologic findings from the Major League Baseball Injury Surveillance System. Am J Sports Med. 2014;42(6):1464-1470.
6. Aune KT, Andrews JR, Dugas JR, Cain EL Jr. Return to play after partial lateral meniscectomy in National Football League Athletes. Am J Sports Med. 2014;42(8):1865-1872.
7. Brophy RH, Gill CS, Lyman S, Barnes RP, Rodeo SA, Warren RF. Effect of anterior cruciate ligament reconstruction and meniscectomy on length of career in National Football League athletes: a case control study. Am J Sports Med. 2009;37(11):2102-2107.
8. Brophy RH, Rodeo SA, Barnes RP, Powell JW, Warren RF. Knee articular cartilage injuries in the National Football League: epidemiology and treatment approach by team physicians. J Knee Surg. 2009;22(4):331-338.
9. Cerynik DL, Lewullis GE, Joves BC, Palmer MP, Tom JA. Outcomes of microfracture in professional basketball players. Knee Surg Sports Traumatol Arthrosc. 2009;17(9):1135-1139.
10. Hershman EB, Anderson R, Bergfeld JA, et al; National Football League Injury and Safety Panel. An analysis of specific lower extremity injury rates on grass and FieldTurf playing surfaces in National Football League Games: 2000-2009 seasons. Am J Sports Med. 2012;40(10):2200-2205.
11. Namdari S, Baldwin K, Anakwenze O, Park MJ, Huffman GR, Sennett BJ. Results and performance after microfracture in National Basketball Association athletes. Am J Sports Med. 2009;37(5):943-948.
12. Yeh PC, Starkey C, Lombardo S, Vitti G, Kharrazi FD. Epidemiology of isolated meniscal injury and its effect on performance in athletes from the National Basketball Association. Am J Sports Med. 2012;40(3):589-594.
13. Pollack KM, D’Angelo J, Green G, et al. Developing and implementing major league baseball’s health and injury tracking system. Am J Epidem. (accepted), 2016.
14. Green GA, Pollack KM, D’Angelo J, et al. Mild traumatic brain injury in major and Minor League Baseball players. Am J Sports Med. 2015;43(5):1118-1126.
15. Dick R, Agel J, Marshall SW. National Collegiate Athletic Association Injury Surveillance System commentaries: introduction and methods. J Athletic Training. 2007;42(2):173-182.
16. Pellman EJ, Viano DC, Casson IR, Arfken C, Feuer H. Concussion in professional football players returning to the same game—part 7. Neurosurg. 2005;56(1):79-90.
17. Stevens ST, Lassonde M, De Beaumont L, Keenan JP. The effect of visors on head and facial injury in national hockey league players. J Sci Med Sport. 2006;9(3):238-242.
18. Meeuwisse WH, Wiley JP. The sport medicine diagnostic coding system. Clin J Sport Med. 2007;17(3):205-207.
19. Mcfarland EG, Wasik M. Epidemiology of collegiate baseball injuries. Clin J Sport Med. 1998;8(1):10-13.
20. Hagen P. New rule on home-plate collisions put into effect. Major League Baseball website. http://m.mlb.com/news/article/68267610/mlb-institutes-new-rule-on-home-plate-collisions. Accessed December 5, 2014.
A Patient's Perspective on Readmissions
Years into the national discourse on reducing readmissions, hospitals and providers are still struggling with how to sustainably reduce 30‐day readmissions.[1] All‐cause hospital readmission rates for Medicare benificiaries averaged 19% from 2007 through 2011 and showed only a modest improvement to 18.4% in 2012.[2] A review of 43 studies in 2011 concluded that no single intervention was reliably associated with reducing readmission rates.[3] However, although no institution has found a magic bullet for reducing readmissions, progress has been made. A 2014 meta‐analysis of randomized trials aimed at preventing 30‐day readmissions found that overall readmission interventions are effective, and that the most successful interventions are more complex in nature and focus on empowering patients to engage in self‐care after discharge.[4] Readmission reduction efforts for patients with specific diagnoses have also made gains. Among patients with heart failure, for instance, higher rates of early outpatient follow‐up and care‐transition interventions for high‐risk patients have been shown to reduce 30‐day readmissions.[5, 6]
An emerging, yet still underexplored, area in readmissions is the importance of evaluating patient perspectives. The patient has intimate knowledge of the circumstances surrounding their readmission and can be a valuable resource. This is particularly true given evidence that patient perspectives do not always align with those of providers.[7, 8] Coleman's Care Transitions Intervention was one of the earliest care‐transition models demonstrating value in engaging patients to become actively involved in their care.[9] Since then, others have begun to analyze transitions of care from the patient perspective, identifying patient‐reported needs in anticipation of discharge and after they are home.[10, 11, 12, 13, 14] However, still only a few studies have endeavored to gain a thorough understanding of the readmitted patient perspective.[7, 15, 16] These studies have already identified important issues such as lack of patient readiness for discharge and the need for additional advanced care planning and caregiver resources. A few smaller studies have interviewed readmitted patients with specific diagnoses and have also shed light on disease‐specific issues.[17, 18, 19, 20] Outside the field of readmissions, improving patient‐centered communication has been shown to reduce expenditures on diagnostic tests,[21, 22] increase adherence to treatment,[23] and improve health outcomes.[24, 25] It is time for us to incorporate the patient voice into all areas of care.
In 2014, our group published the results of a study aimed at understanding the patient perspective surrounding readmissions. In this study, 27% of patients believed their readmission could have been prevented. This opinion was associated with not feeling ready for discharge, not having a follow‐up appointment scheduled, and poor satisfaction with the discharging team.[7] A key observation in these initial interviews was that patients often expressed sentiments of relief rather than frustration when they returned to the hospital. With the results of this previous study in mind, we designed a more comprehensive evaluation to investigate why patients felt unprepared for discharge, explore reasons for and attitudes surrounding readmissions, and identify patient‐centered interventions that could prevent future readmissions.
METHODS
Study Design and Recruitment
We designed the study as an in‐person survey of readmitted patients. Over a 7‐month period (February 11, 2014September 8, 2014), we identified all patients readmitted within 30 days to general medicine and cardiology services through daily queries from the electronic health record. The study took place in a 540‐bed tertiary academic medical center, as well as a 266‐bed affiliated community hospital. We reviewed the discharge summary from the index admission and the history and physical documentation from the readmission for exclusion criteria. Patients were excluded if they were: (1) readmitted to the intensive care unit, (2) had a planned readmission, (3) received an organ transplant in the preceding 3 months, (4) did not speak English, or (5) had a physical or mental incapacity preventing interview and no family member or caregiver was available to interview.
Patient Interviews
Five trained study volunteers approached all eligible patients for an interview starting the day after the patient was readmitted. Prior to the start of the interview, we obtained verbal consent from all patients. Interviews typically lasted 10 to 30 minutes in the patient's hospital room. Caregivers and/or family members were allowed to respond to interview questions if the patient granted them permission or if the patient was unable to participate. The interviewers were not part of the patient's medical team and the patients could refuse the interview at any time. According to the University of California Los Angeles (UCLA) Institutional Review Board, this work met criteria for quality‐improvement activities and was deemed to be exempt.
The survey was comprised of 24 questions addressing causes, preventability, and attitudes toward readmissions, readiness for discharge, quality of the discharge process, outpatient resources, and follow‐up care (see Supporting Information in the online version of this article). These areas of focus were chosen based on a pilot study of 98 patient interviews in which these topics emerged as worthy of further investigation.[7] With regard to patient readiness for discharge, we investigated correlations between patient readiness and symptom resolution, pain control, discharge location, level of support at home, and concerns about independent self‐care after discharge.
Data Analysis
We administered the surveys, collected and managed the data using REDCap (Research Electronic Data Capture) hosted at UCLA.[26] We collected demographic data, including race, ethnicity, and insurance status retrospectively though automated chart abstraction.
We summarized descriptive characteristics by mean and standard deviation (SD) for continuous variables (except for length of stay, which was summarized by median and range) and by proportions for categorical variables. To compare demographic variables between interviewed participants and those not interviewed (not available, not approached, refused, or excluded) we used Pearson 2 tests and Fisher exact tests for categorical variables and Student t tests for the only continuous variable, age. In evaluating patient readiness for discharge, we divided patients into groups of ready and not ready as determined by interview responses, then performed Pearson 2 tests and Fisher exact tests where appropriate.
For comparing the extent of burden and relief patients endorsed upon being readmitted, we subtracted the burden score (110) from the relief score (110) for each patient, resulting in a net relief score. We then performed a 1‐sample t test to determine whether the net relief was significantly different from 0. A P value of<0.05 was considered to be statistically significant. All statistical analyses were performed using R version 3.0.2 (
RESULTS
Patient Characteristics
Eight hundred nineteen patients were readmitted to general medicine and cardiology services over the 7‐month study period at both institutions. Two hundred thirty‐five patients (29%) were excluded based on the predetermined exclusion criteria, and 105 patients (13%) were not approached for interview due to time constraints. Of the 479 eligible patients approached for interview, 164 patients (34%) could not be interviewed because they were unavailable, and 85 patients (18%) refused. We interviewed 230 patients (48%). We conducted 115 interviews at our academic medical center and 115 at our community affiliate. The only significant demographic difference between interviewed and not‐interviewed patients was race (P=0.004).
Interviewed patients had a mean (SD) age of 63 (SD 20) years, and 45% were male. Sixty‐three percent of interviewees were white, 21% black, 8% Asian, and 8% other. The index admission median length of stay was 4 days, and the average time between admission and readmission was 13 days (Table 1). Seventy‐nine percent of the interviews were performed directly with the patient, and 21% were conducted predominantly with the patient's caregiver.
| Characteristic | Value |
|---|---|
| |
| Age, y, mean (SD) | 62.9 (20.2) |
| Female, n (%) | 127 (55.2) |
| Insurance status, n (%) | |
| Commercial | 36 (16.3) |
| Medi‐Cal/Medicaid | 31 (14.0) |
| Medicare | 123 (55.7) |
| Other | 5 (2.3) |
| UCLA managed care | 26 (11.8) |
| Missing | 9 |
| Race, n (%) | |
| Asian | 18 (7.9) |
| Black or African American | 48 (21.1) |
| Other/refused | 19 (8.3) |
| White or Caucasian | 143 (62.7) |
| Missing | 2 |
| Index length of stay, d, median (maximum, minimum) | 4 (1, 49) |
| Time between discharge and readmission, d, mean (SD) | 13 (9) |
| Discharge location following index admission, n (%) | |
| Home | 202 (88.2) |
| Skilled nursing facility | 3 (1.3) |
| Acute rehab facility | 17 (7.4) |
| Assisted living facility | 2 (0.9) |
| Other | 5 (2.2) |
| Missing | 1 |
Patient Readiness
Twenty‐eight percent of patients reported feeling unready for discharge from their index admission. Patients who felt that their readmission was preventable were significantly more likely to report feeling unready at the time of discharge compared to those who did not classify their readmission as preventable (53% vs 17%, P<0.01). Among patients who did not feel ready for discharge, over two‐thirds felt their symptoms were not adequately resolved. Conversely, among patients who did feel ready for discharge, only 8% felt their symptoms were not resolved (P<0.01). Patients who felt they were not ready for discharge were also significantly more likely to endorse poor pain control (43% vs 7%, P<0.01). The location of discharge (ie, home, rehab facility, or skilled nursing facility) and having someone to help take care of them at home did not significantly correlate with patient readiness. Over 80% of patients in both groups reported having someone to help at home, but patients who felt unready for discharge were significantly more likely to have concerns about taking care of themselves at home (54% vs 25%, P<0.001) (Table 2).
| All Participants, n=230 | Ready, n=164 | Not Ready, n=65 | P Value | |
|---|---|---|---|---|
| Symptoms were resolved enough to leave the hospital, n=227 | 170 (74.9%) | 149 (92.0%) | 21 (32.3%) | <0.01 |
| Felt pain was under control when left the hospital, n=229 | 190 (83.0%) | 153 (93.3%) | 37 (56.9%) | <0.01 |
| Discharged to home following index admission, n=229 | 202 (88.2%) | 146 (89.6%) | 56 (86.2%) | 0.62 |
| If discharged home, had someone at home able to help, n=202 | 178 (88.1%) | 132 (90.4%) | 46 (82.1%) | 0.17 |
| If discharged home, had concerns about being able to take of themselves at home or not being strong enough to go home, n=202 | 67 (33.2%) | 37 (25.3%) | 30 (53.6%) | <0.01 |
| Thought something could have been done to prevent them from coming back to the hospital, n=228 | 75 (32.9%) | 35 (21.6%) | 39 (60.0%) | <0.01 |
Discharge Instructions
Twenty‐nine percent of patients did not recall a physician talking to them about their discharge, and 35% did not remember receiving and reviewing the discharge paperwork. Of those who read the discharge paperwork, 23% noted difficulty identifying contact phone numbers, and 22% could not locate warning symptoms indicating when to seek medical attention. Patients were able to identify medications and follow‐up appointments on the discharge paperwork a majority of the time (92% and 85%, respectively).
Ambulatory Resources and Utilization
Patients were asked about their access to outpatient resources as well as their reason(s) for returning to the hospital. Eighty‐five percent of patients reported having a primary care doctor that they would feel comfortable calling if their symptoms worsened at home. Of the patients who indicated that they were given a contact number by their discharging team, only 56% contacted a doctor before returning to the emergency room. One‐third of patients reported knowing where to obtain urgent or same‐day care besides the emergency room. Among those who did report knowledge of same‐day care centers, 89% still chose not to utilize them.
Attitudes About Readmission
To investigate the patient experience with readmissions, patients were asked to rate the extent of the burden they felt upon returning to the hospital on a scale of 1 to 10, where 1 was no burden and 10 was extreme burden. Patients were also asked to evaluate the extent of relief they felt upon readmission using the same scale. On average, patients rated their sense of relief 1.8 points higher than their sense of burden upon readmission to the hospital (7.7 [SD 2.8] vs 5.9 [SD 3.4], P<0.001). The relief of readmission was rated as equal to or greater than the burden of readmission in 79% of cases. Lastly, patients' mean (SD) overall satisfaction with their medical care was 8.5 (SD 2.0) on a scale of 1 to 10, where 1 was the least satisfied and 10 was the most satisfied a patient could imagine.
DISCUSSION
This study performs a comprehensive evaluation of the patient perspective on 30‐day readmissions. Our previous work indicated that patients associate preventable readmissions with lack of preparedness at the time of discharge.[7] This study further evaluates the basis of this association. We found that nearly 1 in 3 readmitted patients did not feel ready to leave the hospital at the time of initial discharge. Feelings of inadequate symptom resolution and poor pain control appear to be major contributors to this sentiment. Furthermore, although 88% of patients endorse having a caretaker at home, patients with concerns about taking care of themselves are more likely to feel unready at discharge. Presumably, when healthcare providers discharge patients, they believe that the patient is ready to be discharged. However, our findings suggest that often patients do not agree, highlighting a gap between the beliefs of patients and those of healthcare providers. Creating patient‐centered education on symptom management and engaging patients in developing skills for independent self‐care may minimize this gap and allow patients to feel more prepared at discharge. Future research investigating provider opinions and the steps providers take when there is a disagreement over discharge readiness would also be useful.
One way to enhance education at the time of discharge is through improvements in printed discharge instructions. Jha et al. previously showed that chart documentation of providing discharge instructions does not correlate with patients reporting receiving discharge instructions.[27] Our study echoes this finding, with only 65% of the patients remembering receiving and reviewing the discharge paperwork. Horwitz et al. have also previously demonstrated poor comprehension of discharge planning and postdischarge care among patients discharged from an academic medical center.[28] Ensuring that all patients understand and retain their discharge instructions is an essential step in improving the patient experience and potentially decreasing readmissions. Our surveys have illuminated potential shortcomings in our own center's discharge instructions. Interventions aimed at clarifying critical pieces of information on the discharge paperwork, such as warning symptoms, contact phone numbers and follow‐up appointments, could be especially helpful.
After discharge, our findings suggest that only about half of patients will call a physician before returning to the hospital. Furthermore, there is limited knowledge and poor utilization of same‐day treatment centers besides the emergency room. In previous studies, Long et al. found that frequently readmitted patients self‐triage to the emergency room because they believe primary care clinics cannot treat acute illness.[11] Another study concluded that low‐income patients prefer hospital care to ambulatory care because of a greater sense of trust in inpatient care.[29]
Our patients' attitudes about readmission may also be different from those of providers. For patients, coming back to the hospital is not a significant burden, and satisfaction with their medical care remains high despite readmission. Additional research is needed to further explore the complex emotions patients have when coming back to the hospital and why patients may not be as upset with returning to the hospital as providers may expect. Ultimately, if patients continue to feel more comfortable being hospitalized, there are few incentives for patients to stay out of the hospital, and readmission rates will remain elevated.
Based on our survey results we have hypothesized a potential framework for studying readmissions from a patient‐centered approach (Figure 1). This figure is not meant to imply causality, but rather to highlight a potential journey from discharge to readmission for a patient who does not feel ready to go home. This schema principally applies to patients who are worried about symptom management and/or self‐care before discharge and may not apply to everyone. Each asterisk in this framework represents an area where an intervention could be designed to improve the patient experience and possibly reduce readmissions. Such interventions should be centered around increasing patient education about symptom management and self‐care at the time of discharge, improving printed discharge instructions, increasing patient awareness of outpatient resources, enhancing communication after discharge, and changing patients' attitudes about readmissions.
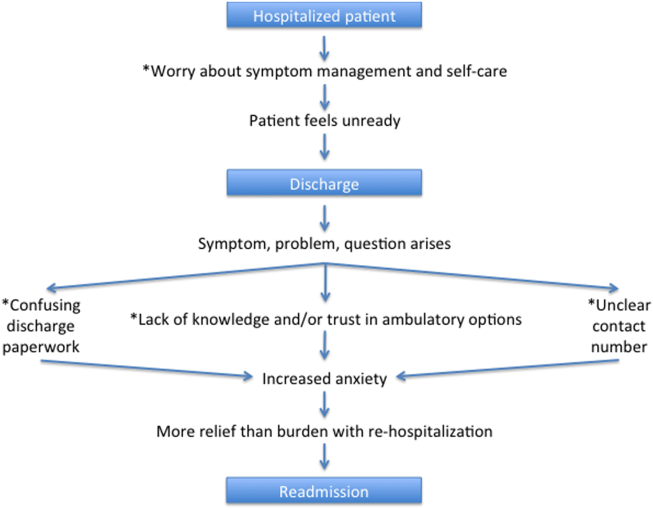
This study's limitations include that it is a single‐institution study focusing on patients admitted to a large academic medical center and its partner community hospital. Only English‐speaking patients were included, and thus our results may not be generalizable to other populations. All patients were interviewed at the time of readmission, potentially introducing recall bias regarding their prior discharge. For example, patients might be more likely to state they were not ready for discharge once they have been readmitted to the hospital. Lastly, because there are only a few prior studies interviewing readmitted patients, our survey instrument was not previously validated. Nevertheless, we believe this study offers a unique view on 30‐day readmissions from the patient perspective, with a focus on identifying areas for quality‐improvement interventions.
In conclusion, this study has enabled us to understand readmissions from a patient‐centered perspective. This perspective helps to challenge provider assumptions and gives much‐needed insight into the patient experience. For example, prior to surveying patients, one might assume that if a patient has a caregiver at home, they are unlikely to have concerns about taking care of themselves. We now know this is not the case. Similarly, we have discovered sections of our discharge paperwork that are confusing. Additionally, this study has revealed that patient attitudes regarding readmission can vary significantly from provider attitudes. By exploring the patient perspective and creating a new transition framework, we have identified specific target areas for interventions that would be meaningful to patients. As the nation continues to strive to identify sustainable solutions to reduce readmissions, the way to redesign care must always start and end with the patient.
Acknowledgements
The authors acknowledge Puneet Rana, James Haggerty‐Skeans, Jae Kim, Rhea Mathew, and Anna Do (UCLA volunteers) for helping to perform the patient interviews. We acknowledge Sandy Berry, MA (Senior Behavioral Scientist at RAND Corporation) for her help in reviewing our patient interview script. Additionally Anna Dermenchyan, RN, BSN (Senior Clinical Quality Specialist in the Department of Medicine at UCLA) provided significant administrative support.
Disclosures: This project was supported by a Patient Experience Grant from the Beryl Institute awarded to Jessica Howard‐Anderson, Sarah Lonowski, Ashley Busuttil, and Nasim Afsar‐manesh. Dr. Howard‐Anderson had full access to all of the data in the study and takes responsibility for the integrity of the data and the accuracy of the data analysis. All coauthors have seen and agree with the contents of the article. The article is not under review by any other publication. An earlier version of this work was written as a research report (not peer reviewed) for the Beryl Institute (available at:
- , . What will it take to move the needle on hospital readmissions? Am J Med Qual. 2013;29(4):357–359.
- , , , , , . Medicare readmission rates showed meaningful decline in 2012. Medicare Medicaid Res Rev. 2013;3(2):E1–E12.
- , , , , . Interventions to reduce 30‐day rehospitalization: a systematic review. Ann Intern Med. 2011;155(8):520–528.
- , , , et al. Preventing 30‐day hospital readmissions: a systematic review and meta‐analysis of randomized trials. JAMA Intern Med. 2014;174(7):1095–1107.
- , , , et al. Relationship between early physician follow‐up and 30‐day readmission among Medicare beneficiaries hospitalized for heart failure. JAMA. 2010;303(17):1716–1722.
- , , , et al. Allocating scarce resources in real‐time to reduce heart failure readmissions: a prospective, controlled study. BMJ Qual Saf. 2013;22(12):998–1005.
- , , , , , . Readmissions in the era of patient engagement. JAMA Intern Med. 2014;174(11):1870–1872.
- , , , et al. Comparing perspectives of patients, caregivers, and clinicians on heart failure management [published online October 23, 2015]. J Card Fail. doi: 10.1016/j.cardfail.2015.10.011.
- , , , . The care transitions intervention: results of a randomized controlled trial. Arch Intern Med. 2006;166(17):1822–1828.
- , , . Understanding rehospitalization risk: can hospital discharge be modified to reduce recurrent hospitalization? J Hosp Med. 2007;2(5):297–304.
- , , . Reasons for readmission in an underserved high‐risk population: a qualitative analysis of a series of inpatient interviews. BMJ Open. 2013;3(9):e003212.
- , , , , , . Improving care transitions: the patient perspective. J Health Commun. 2012;17(suppl 3):312–324.
- , , , et al. Challenges faced by patients with low socioeconomic status during the post‐hospital transition. J Gen Intern Med. 2014;29(2):283–289.
- , , , et al. “Missing pieces”—functional, social, and environmental barriers to recovery for vulnerable older adults transitioning from hospital to home. J Am Geriatr Soc. 2014;62(8):1556–1561.
- , , , , , . Perceptions of readmitted patients on the transition from hospital to home. J Hosp Med. 2012;7(9):709–712.
- , , , et al. Factors contributing to all‐cause 30‐day readmissions: a structured case series across 18 hospitals. Med Care. 2012;50(7):599–605.
- , , . Reasons for readmission in heart failure: perspectives of patients, caregivers, cardiologists, and heart failure nurses. Heart Lung. 2009;38(5):427–434.
- , , , et al. Patient‐identified factors related to heart failure readmissions. Circ Cardiovasc Qual Outcomes. 2013;6(2):171–177.
- , , , , . Early readmission among patients with diabetes: a qualitative assessment of contributing factors. J Diabetes Complications. 2014;28(6):869–873.
- , , , , . “Because I was sick”: seriously ill veterans' perspectives on reason for 30‐day readmissions. J Am Geriatr Soc. 2015;63(3):537–542.
- , , , et al. The impact of patient‐centered care on outcomes. J Fam Pract. 2000;49(9):796–804.
- , , , et al. Patient‐centered communication and diagnostic testing. Ann Fam Med. 2005;3(5):415–421.
- , . Physician communication and patient adherence to treatment: a meta‐analysis. Med Care. 2009;47(8):826–834.
- , , , et al. Closing the loop: physician communication with diabetic patients who have low health literacy. Arch Intern Med. 2003;163(1):83–90.
- , , , , . Patients' participation in medical care: effects on blood sugar control and quality of life in diabetes. J Gen Intern Med. 1988;3(5):448–457.
- , , , , , . Research electronic data capture (REDCap)—a metadata‐driven methodology and workflow process for providing translational research informatics support. J Biomed Inform. 2009;42(2):377–381.
- , , . Public reporting of discharge planning and rates of readmissions. N Engl J Med. 2009;361(27):2637–2645.
- , , , et al. Quality of discharge practices and patient understanding at an academic medical center. JAMA Intern Med. 2013;173(18):1715–1722
- , , , , , . Understanding why patients of low socioeconomic status prefer hospitals over ambulatory care. Health Aff (Millwood). 2013;32(7):1196–1203.
Years into the national discourse on reducing readmissions, hospitals and providers are still struggling with how to sustainably reduce 30‐day readmissions.[1] All‐cause hospital readmission rates for Medicare benificiaries averaged 19% from 2007 through 2011 and showed only a modest improvement to 18.4% in 2012.[2] A review of 43 studies in 2011 concluded that no single intervention was reliably associated with reducing readmission rates.[3] However, although no institution has found a magic bullet for reducing readmissions, progress has been made. A 2014 meta‐analysis of randomized trials aimed at preventing 30‐day readmissions found that overall readmission interventions are effective, and that the most successful interventions are more complex in nature and focus on empowering patients to engage in self‐care after discharge.[4] Readmission reduction efforts for patients with specific diagnoses have also made gains. Among patients with heart failure, for instance, higher rates of early outpatient follow‐up and care‐transition interventions for high‐risk patients have been shown to reduce 30‐day readmissions.[5, 6]
An emerging, yet still underexplored, area in readmissions is the importance of evaluating patient perspectives. The patient has intimate knowledge of the circumstances surrounding their readmission and can be a valuable resource. This is particularly true given evidence that patient perspectives do not always align with those of providers.[7, 8] Coleman's Care Transitions Intervention was one of the earliest care‐transition models demonstrating value in engaging patients to become actively involved in their care.[9] Since then, others have begun to analyze transitions of care from the patient perspective, identifying patient‐reported needs in anticipation of discharge and after they are home.[10, 11, 12, 13, 14] However, still only a few studies have endeavored to gain a thorough understanding of the readmitted patient perspective.[7, 15, 16] These studies have already identified important issues such as lack of patient readiness for discharge and the need for additional advanced care planning and caregiver resources. A few smaller studies have interviewed readmitted patients with specific diagnoses and have also shed light on disease‐specific issues.[17, 18, 19, 20] Outside the field of readmissions, improving patient‐centered communication has been shown to reduce expenditures on diagnostic tests,[21, 22] increase adherence to treatment,[23] and improve health outcomes.[24, 25] It is time for us to incorporate the patient voice into all areas of care.
In 2014, our group published the results of a study aimed at understanding the patient perspective surrounding readmissions. In this study, 27% of patients believed their readmission could have been prevented. This opinion was associated with not feeling ready for discharge, not having a follow‐up appointment scheduled, and poor satisfaction with the discharging team.[7] A key observation in these initial interviews was that patients often expressed sentiments of relief rather than frustration when they returned to the hospital. With the results of this previous study in mind, we designed a more comprehensive evaluation to investigate why patients felt unprepared for discharge, explore reasons for and attitudes surrounding readmissions, and identify patient‐centered interventions that could prevent future readmissions.
METHODS
Study Design and Recruitment
We designed the study as an in‐person survey of readmitted patients. Over a 7‐month period (February 11, 2014September 8, 2014), we identified all patients readmitted within 30 days to general medicine and cardiology services through daily queries from the electronic health record. The study took place in a 540‐bed tertiary academic medical center, as well as a 266‐bed affiliated community hospital. We reviewed the discharge summary from the index admission and the history and physical documentation from the readmission for exclusion criteria. Patients were excluded if they were: (1) readmitted to the intensive care unit, (2) had a planned readmission, (3) received an organ transplant in the preceding 3 months, (4) did not speak English, or (5) had a physical or mental incapacity preventing interview and no family member or caregiver was available to interview.
Patient Interviews
Five trained study volunteers approached all eligible patients for an interview starting the day after the patient was readmitted. Prior to the start of the interview, we obtained verbal consent from all patients. Interviews typically lasted 10 to 30 minutes in the patient's hospital room. Caregivers and/or family members were allowed to respond to interview questions if the patient granted them permission or if the patient was unable to participate. The interviewers were not part of the patient's medical team and the patients could refuse the interview at any time. According to the University of California Los Angeles (UCLA) Institutional Review Board, this work met criteria for quality‐improvement activities and was deemed to be exempt.
The survey was comprised of 24 questions addressing causes, preventability, and attitudes toward readmissions, readiness for discharge, quality of the discharge process, outpatient resources, and follow‐up care (see Supporting Information in the online version of this article). These areas of focus were chosen based on a pilot study of 98 patient interviews in which these topics emerged as worthy of further investigation.[7] With regard to patient readiness for discharge, we investigated correlations between patient readiness and symptom resolution, pain control, discharge location, level of support at home, and concerns about independent self‐care after discharge.
Data Analysis
We administered the surveys, collected and managed the data using REDCap (Research Electronic Data Capture) hosted at UCLA.[26] We collected demographic data, including race, ethnicity, and insurance status retrospectively though automated chart abstraction.
We summarized descriptive characteristics by mean and standard deviation (SD) for continuous variables (except for length of stay, which was summarized by median and range) and by proportions for categorical variables. To compare demographic variables between interviewed participants and those not interviewed (not available, not approached, refused, or excluded) we used Pearson 2 tests and Fisher exact tests for categorical variables and Student t tests for the only continuous variable, age. In evaluating patient readiness for discharge, we divided patients into groups of ready and not ready as determined by interview responses, then performed Pearson 2 tests and Fisher exact tests where appropriate.
For comparing the extent of burden and relief patients endorsed upon being readmitted, we subtracted the burden score (110) from the relief score (110) for each patient, resulting in a net relief score. We then performed a 1‐sample t test to determine whether the net relief was significantly different from 0. A P value of<0.05 was considered to be statistically significant. All statistical analyses were performed using R version 3.0.2 (
RESULTS
Patient Characteristics
Eight hundred nineteen patients were readmitted to general medicine and cardiology services over the 7‐month study period at both institutions. Two hundred thirty‐five patients (29%) were excluded based on the predetermined exclusion criteria, and 105 patients (13%) were not approached for interview due to time constraints. Of the 479 eligible patients approached for interview, 164 patients (34%) could not be interviewed because they were unavailable, and 85 patients (18%) refused. We interviewed 230 patients (48%). We conducted 115 interviews at our academic medical center and 115 at our community affiliate. The only significant demographic difference between interviewed and not‐interviewed patients was race (P=0.004).
Interviewed patients had a mean (SD) age of 63 (SD 20) years, and 45% were male. Sixty‐three percent of interviewees were white, 21% black, 8% Asian, and 8% other. The index admission median length of stay was 4 days, and the average time between admission and readmission was 13 days (Table 1). Seventy‐nine percent of the interviews were performed directly with the patient, and 21% were conducted predominantly with the patient's caregiver.
| Characteristic | Value |
|---|---|
| |
| Age, y, mean (SD) | 62.9 (20.2) |
| Female, n (%) | 127 (55.2) |
| Insurance status, n (%) | |
| Commercial | 36 (16.3) |
| Medi‐Cal/Medicaid | 31 (14.0) |
| Medicare | 123 (55.7) |
| Other | 5 (2.3) |
| UCLA managed care | 26 (11.8) |
| Missing | 9 |
| Race, n (%) | |
| Asian | 18 (7.9) |
| Black or African American | 48 (21.1) |
| Other/refused | 19 (8.3) |
| White or Caucasian | 143 (62.7) |
| Missing | 2 |
| Index length of stay, d, median (maximum, minimum) | 4 (1, 49) |
| Time between discharge and readmission, d, mean (SD) | 13 (9) |
| Discharge location following index admission, n (%) | |
| Home | 202 (88.2) |
| Skilled nursing facility | 3 (1.3) |
| Acute rehab facility | 17 (7.4) |
| Assisted living facility | 2 (0.9) |
| Other | 5 (2.2) |
| Missing | 1 |
Patient Readiness
Twenty‐eight percent of patients reported feeling unready for discharge from their index admission. Patients who felt that their readmission was preventable were significantly more likely to report feeling unready at the time of discharge compared to those who did not classify their readmission as preventable (53% vs 17%, P<0.01). Among patients who did not feel ready for discharge, over two‐thirds felt their symptoms were not adequately resolved. Conversely, among patients who did feel ready for discharge, only 8% felt their symptoms were not resolved (P<0.01). Patients who felt they were not ready for discharge were also significantly more likely to endorse poor pain control (43% vs 7%, P<0.01). The location of discharge (ie, home, rehab facility, or skilled nursing facility) and having someone to help take care of them at home did not significantly correlate with patient readiness. Over 80% of patients in both groups reported having someone to help at home, but patients who felt unready for discharge were significantly more likely to have concerns about taking care of themselves at home (54% vs 25%, P<0.001) (Table 2).
| All Participants, n=230 | Ready, n=164 | Not Ready, n=65 | P Value | |
|---|---|---|---|---|
| Symptoms were resolved enough to leave the hospital, n=227 | 170 (74.9%) | 149 (92.0%) | 21 (32.3%) | <0.01 |
| Felt pain was under control when left the hospital, n=229 | 190 (83.0%) | 153 (93.3%) | 37 (56.9%) | <0.01 |
| Discharged to home following index admission, n=229 | 202 (88.2%) | 146 (89.6%) | 56 (86.2%) | 0.62 |
| If discharged home, had someone at home able to help, n=202 | 178 (88.1%) | 132 (90.4%) | 46 (82.1%) | 0.17 |
| If discharged home, had concerns about being able to take of themselves at home or not being strong enough to go home, n=202 | 67 (33.2%) | 37 (25.3%) | 30 (53.6%) | <0.01 |
| Thought something could have been done to prevent them from coming back to the hospital, n=228 | 75 (32.9%) | 35 (21.6%) | 39 (60.0%) | <0.01 |
Discharge Instructions
Twenty‐nine percent of patients did not recall a physician talking to them about their discharge, and 35% did not remember receiving and reviewing the discharge paperwork. Of those who read the discharge paperwork, 23% noted difficulty identifying contact phone numbers, and 22% could not locate warning symptoms indicating when to seek medical attention. Patients were able to identify medications and follow‐up appointments on the discharge paperwork a majority of the time (92% and 85%, respectively).
Ambulatory Resources and Utilization
Patients were asked about their access to outpatient resources as well as their reason(s) for returning to the hospital. Eighty‐five percent of patients reported having a primary care doctor that they would feel comfortable calling if their symptoms worsened at home. Of the patients who indicated that they were given a contact number by their discharging team, only 56% contacted a doctor before returning to the emergency room. One‐third of patients reported knowing where to obtain urgent or same‐day care besides the emergency room. Among those who did report knowledge of same‐day care centers, 89% still chose not to utilize them.
Attitudes About Readmission
To investigate the patient experience with readmissions, patients were asked to rate the extent of the burden they felt upon returning to the hospital on a scale of 1 to 10, where 1 was no burden and 10 was extreme burden. Patients were also asked to evaluate the extent of relief they felt upon readmission using the same scale. On average, patients rated their sense of relief 1.8 points higher than their sense of burden upon readmission to the hospital (7.7 [SD 2.8] vs 5.9 [SD 3.4], P<0.001). The relief of readmission was rated as equal to or greater than the burden of readmission in 79% of cases. Lastly, patients' mean (SD) overall satisfaction with their medical care was 8.5 (SD 2.0) on a scale of 1 to 10, where 1 was the least satisfied and 10 was the most satisfied a patient could imagine.
DISCUSSION
This study performs a comprehensive evaluation of the patient perspective on 30‐day readmissions. Our previous work indicated that patients associate preventable readmissions with lack of preparedness at the time of discharge.[7] This study further evaluates the basis of this association. We found that nearly 1 in 3 readmitted patients did not feel ready to leave the hospital at the time of initial discharge. Feelings of inadequate symptom resolution and poor pain control appear to be major contributors to this sentiment. Furthermore, although 88% of patients endorse having a caretaker at home, patients with concerns about taking care of themselves are more likely to feel unready at discharge. Presumably, when healthcare providers discharge patients, they believe that the patient is ready to be discharged. However, our findings suggest that often patients do not agree, highlighting a gap between the beliefs of patients and those of healthcare providers. Creating patient‐centered education on symptom management and engaging patients in developing skills for independent self‐care may minimize this gap and allow patients to feel more prepared at discharge. Future research investigating provider opinions and the steps providers take when there is a disagreement over discharge readiness would also be useful.
One way to enhance education at the time of discharge is through improvements in printed discharge instructions. Jha et al. previously showed that chart documentation of providing discharge instructions does not correlate with patients reporting receiving discharge instructions.[27] Our study echoes this finding, with only 65% of the patients remembering receiving and reviewing the discharge paperwork. Horwitz et al. have also previously demonstrated poor comprehension of discharge planning and postdischarge care among patients discharged from an academic medical center.[28] Ensuring that all patients understand and retain their discharge instructions is an essential step in improving the patient experience and potentially decreasing readmissions. Our surveys have illuminated potential shortcomings in our own center's discharge instructions. Interventions aimed at clarifying critical pieces of information on the discharge paperwork, such as warning symptoms, contact phone numbers and follow‐up appointments, could be especially helpful.
After discharge, our findings suggest that only about half of patients will call a physician before returning to the hospital. Furthermore, there is limited knowledge and poor utilization of same‐day treatment centers besides the emergency room. In previous studies, Long et al. found that frequently readmitted patients self‐triage to the emergency room because they believe primary care clinics cannot treat acute illness.[11] Another study concluded that low‐income patients prefer hospital care to ambulatory care because of a greater sense of trust in inpatient care.[29]
Our patients' attitudes about readmission may also be different from those of providers. For patients, coming back to the hospital is not a significant burden, and satisfaction with their medical care remains high despite readmission. Additional research is needed to further explore the complex emotions patients have when coming back to the hospital and why patients may not be as upset with returning to the hospital as providers may expect. Ultimately, if patients continue to feel more comfortable being hospitalized, there are few incentives for patients to stay out of the hospital, and readmission rates will remain elevated.
Based on our survey results we have hypothesized a potential framework for studying readmissions from a patient‐centered approach (Figure 1). This figure is not meant to imply causality, but rather to highlight a potential journey from discharge to readmission for a patient who does not feel ready to go home. This schema principally applies to patients who are worried about symptom management and/or self‐care before discharge and may not apply to everyone. Each asterisk in this framework represents an area where an intervention could be designed to improve the patient experience and possibly reduce readmissions. Such interventions should be centered around increasing patient education about symptom management and self‐care at the time of discharge, improving printed discharge instructions, increasing patient awareness of outpatient resources, enhancing communication after discharge, and changing patients' attitudes about readmissions.
This study's limitations include that it is a single‐institution study focusing on patients admitted to a large academic medical center and its partner community hospital. Only English‐speaking patients were included, and thus our results may not be generalizable to other populations. All patients were interviewed at the time of readmission, potentially introducing recall bias regarding their prior discharge. For example, patients might be more likely to state they were not ready for discharge once they have been readmitted to the hospital. Lastly, because there are only a few prior studies interviewing readmitted patients, our survey instrument was not previously validated. Nevertheless, we believe this study offers a unique view on 30‐day readmissions from the patient perspective, with a focus on identifying areas for quality‐improvement interventions.
In conclusion, this study has enabled us to understand readmissions from a patient‐centered perspective. This perspective helps to challenge provider assumptions and gives much‐needed insight into the patient experience. For example, prior to surveying patients, one might assume that if a patient has a caregiver at home, they are unlikely to have concerns about taking care of themselves. We now know this is not the case. Similarly, we have discovered sections of our discharge paperwork that are confusing. Additionally, this study has revealed that patient attitudes regarding readmission can vary significantly from provider attitudes. By exploring the patient perspective and creating a new transition framework, we have identified specific target areas for interventions that would be meaningful to patients. As the nation continues to strive to identify sustainable solutions to reduce readmissions, the way to redesign care must always start and end with the patient.
Acknowledgements
The authors acknowledge Puneet Rana, James Haggerty‐Skeans, Jae Kim, Rhea Mathew, and Anna Do (UCLA volunteers) for helping to perform the patient interviews. We acknowledge Sandy Berry, MA (Senior Behavioral Scientist at RAND Corporation) for her help in reviewing our patient interview script. Additionally Anna Dermenchyan, RN, BSN (Senior Clinical Quality Specialist in the Department of Medicine at UCLA) provided significant administrative support.
Disclosures: This project was supported by a Patient Experience Grant from the Beryl Institute awarded to Jessica Howard‐Anderson, Sarah Lonowski, Ashley Busuttil, and Nasim Afsar‐manesh. Dr. Howard‐Anderson had full access to all of the data in the study and takes responsibility for the integrity of the data and the accuracy of the data analysis. All coauthors have seen and agree with the contents of the article. The article is not under review by any other publication. An earlier version of this work was written as a research report (not peer reviewed) for the Beryl Institute (available at:
- , . What will it take to move the needle on hospital readmissions? Am J Med Qual. 2013;29(4):357–359.
- , , , , , . Medicare readmission rates showed meaningful decline in 2012. Medicare Medicaid Res Rev. 2013;3(2):E1–E12.
- , , , , . Interventions to reduce 30‐day rehospitalization: a systematic review. Ann Intern Med. 2011;155(8):520–528.
- , , , et al. Preventing 30‐day hospital readmissions: a systematic review and meta‐analysis of randomized trials. JAMA Intern Med. 2014;174(7):1095–1107.
- , , , et al. Relationship between early physician follow‐up and 30‐day readmission among Medicare beneficiaries hospitalized for heart failure. JAMA. 2010;303(17):1716–1722.
- , , , et al. Allocating scarce resources in real‐time to reduce heart failure readmissions: a prospective, controlled study. BMJ Qual Saf. 2013;22(12):998–1005.
- , , , , , . Readmissions in the era of patient engagement. JAMA Intern Med. 2014;174(11):1870–1872.
- , , , et al. Comparing perspectives of patients, caregivers, and clinicians on heart failure management [published online October 23, 2015]. J Card Fail. doi: 10.1016/j.cardfail.2015.10.011.
- , , , . The care transitions intervention: results of a randomized controlled trial. Arch Intern Med. 2006;166(17):1822–1828.
- , , . Understanding rehospitalization risk: can hospital discharge be modified to reduce recurrent hospitalization? J Hosp Med. 2007;2(5):297–304.
- , , . Reasons for readmission in an underserved high‐risk population: a qualitative analysis of a series of inpatient interviews. BMJ Open. 2013;3(9):e003212.
- , , , , , . Improving care transitions: the patient perspective. J Health Commun. 2012;17(suppl 3):312–324.
- , , , et al. Challenges faced by patients with low socioeconomic status during the post‐hospital transition. J Gen Intern Med. 2014;29(2):283–289.
- , , , et al. “Missing pieces”—functional, social, and environmental barriers to recovery for vulnerable older adults transitioning from hospital to home. J Am Geriatr Soc. 2014;62(8):1556–1561.
- , , , , , . Perceptions of readmitted patients on the transition from hospital to home. J Hosp Med. 2012;7(9):709–712.
- , , , et al. Factors contributing to all‐cause 30‐day readmissions: a structured case series across 18 hospitals. Med Care. 2012;50(7):599–605.
- , , . Reasons for readmission in heart failure: perspectives of patients, caregivers, cardiologists, and heart failure nurses. Heart Lung. 2009;38(5):427–434.
- , , , et al. Patient‐identified factors related to heart failure readmissions. Circ Cardiovasc Qual Outcomes. 2013;6(2):171–177.
- , , , , . Early readmission among patients with diabetes: a qualitative assessment of contributing factors. J Diabetes Complications. 2014;28(6):869–873.
- , , , , . “Because I was sick”: seriously ill veterans' perspectives on reason for 30‐day readmissions. J Am Geriatr Soc. 2015;63(3):537–542.
- , , , et al. The impact of patient‐centered care on outcomes. J Fam Pract. 2000;49(9):796–804.
- , , , et al. Patient‐centered communication and diagnostic testing. Ann Fam Med. 2005;3(5):415–421.
- , . Physician communication and patient adherence to treatment: a meta‐analysis. Med Care. 2009;47(8):826–834.
- , , , et al. Closing the loop: physician communication with diabetic patients who have low health literacy. Arch Intern Med. 2003;163(1):83–90.
- , , , , . Patients' participation in medical care: effects on blood sugar control and quality of life in diabetes. J Gen Intern Med. 1988;3(5):448–457.
- , , , , , . Research electronic data capture (REDCap)—a metadata‐driven methodology and workflow process for providing translational research informatics support. J Biomed Inform. 2009;42(2):377–381.
- , , . Public reporting of discharge planning and rates of readmissions. N Engl J Med. 2009;361(27):2637–2645.
- , , , et al. Quality of discharge practices and patient understanding at an academic medical center. JAMA Intern Med. 2013;173(18):1715–1722
- , , , , , . Understanding why patients of low socioeconomic status prefer hospitals over ambulatory care. Health Aff (Millwood). 2013;32(7):1196–1203.
© 2016 Society of Hospital Medicine
