User login
Epidemiology and Impact of Knee Injuries in Major and Minor League Baseball Players
Injuries among professional baseball players have been on the rise for several years.1,2 From 1989 to 1999, the number of disabled list (DL) reports increased 38% (266 to 367 annual reports),1 and a similar increase in injury rates was noted from the 2002 to the 2008 seasons (37%).2 These injuries have important implications for future injury risk and time away from play. Identifying these injuries and determining correlates and risk factors is important for targeted prevention efforts.
Several studies have explored the prevalence of upper extremity injuries in professional and collegiate baseball players;2-4 however, detailed epidemiology of knee injuries in Major League Baseball (MLB) and Minor League Baseball (MiLB) players is lacking. Much more is known about the prevalence, treatment, and outcomes of knee injuries in other professional sporting organizations, such as the National Basketball Association (NBA), National Football League (NFL), and National Hockey League (NHL).4-12 A recent meta-analysis exploring injuries in professional athletes found that studies on lower extremity injuries comprised approximately 12% of the literature reporting injuries in MLB players.4 In other professional leagues, publications on lower extremity injuries comprise approximately 56% of the sports medicine literature in the NFL, 54% in the NBA, and 62% in the NHL.4 Since few studies have investigated lower extremity injuries among professional baseball players, there is an opportunity for additional research to guide evidence-based prevention strategies.
A better understanding of the nature of these injuries is one of the first steps towards developing targeted injury prevention programs and treatment algorithms. The study of injury epidemiology among professional baseball players has been aided by the creation of an injury tracking system initiated by the MLB, its minor league affiliates, and the Major League Baseball Players Association.5,13,14 This surveillance system allows for the tracking of medical histories and injuries to players as they move across major and minor league organizations. Similar systems have been utilized in the National Collegiate Athletic Association and other professional sports organizations.3,15-17 A unique advantage of the MLB surveillance system is the required participation of all major and minor league teams, which allows for investigation of the entire population of players rather than simply a sample of players from select teams. This system has propelled an effort to identify injury patterns as a means of developing appropriate targets for potential preventative measures.5
The purpose of this descriptive epidemiologic study is to better understand the distribution and characteristics of knee injuries in these elite athletes by reporting on all knee injuries occurring over a span of 4 seasons (2011-2014). Additionally, this study seeks to characterize the impact of these injuries by analyzing the time required for return to play and the treatments rendered (surgical and nonsurgical).
Materials and Methods
After approval from the Johns Hopkins Bloomberg School of Public Health Institutional Review Board, detailed data regarding knee injuries in both MLB and MiLB baseball players were extracted from the de-identified MLB Health and Injury Tracking System (HITS). The HITS database is a centralized database that contains data on injuries from an electronic medical record (EMR). All players provided consent to have their data included in this EMR. HITS system captures injuries reported by the athletic trainers for all professional baseball players from 30 MLB clubs and their 230 minor league affiliates. Additional details on this population of professional baseball players have been published elsewhere.5 Only injuries that result in time out of play (≥1 day missed) are included in the database, and they are logged with basic information such as region of the body, diagnosis, date, player position, activity leading to injury, and general treatment. Any injury that affects participation in any aspect of baseball-related activity (eg, game, practice, warm-up, conditioning, weight training) is captured in HITS.
All baseball-related knee injuries occurring during the 2011-2014 seasons that resulted in time out of sport were included in the study. These injuries were identified based on the Sports Medicine Diagnostic Coding System (SMDCS) to capture injuries by diagnostic groups.18 Knee injuries were included if they occurred during spring training, regular season, or postseason play. Offseason injuries were not included. Injury events that were classified as “season-ending” were not included in the analysis of days missed because many of these players may not have been cleared to play until the beginning of the following season. To determine the proportion of knee injuries during the study period, all injuries were included for comparative purposes (subdivided based on 30 anatomic regions or types).
For each knee injury, a number of variables were analyzed, including diagnosis, level of play (MLB vs. MiLB), age, player position at the time of injury (pitcher, catcher, infield, outfield, base runner, or batter), field location where the injury occurred (home plate, pitcher’s mound, infield, outfield, foul territory or bullpen, or other), mechanism of injury, days missed, and treatment rendered (conservative vs surgical). The classification used to describe the mechanism of injury consisted of contact with ball, contact with ground, contact with another player, contact with another object, or noncontact.
Statistical Analysis Epidemiologic data are presented with descriptive statistics such as mean, median, frequency, and percentage where appropriate. When comparing player age, days missed, and surgical vs nonsurgical treatment between MLB and MiLB players, t-tests and tests for difference in proportions were applied as appropriate. Statistical significance was established for P values < .05.
The distribution of days missed for the variables considered was often skewed to the right (ie, days missed mostly concentrated on the low to moderate number of days, with fewer values in the much higher days missed range), even after excluding the season-ending injuries; hence the mean (or average) days missed was often larger than the median days missed. Reporting the median would allow for a robust estimate of the expected number of days missed, but would down weight those instances when knee injuries result in much longer missed days, as reflected by the mean. Because of the importance of the days missed measure for professional baseball, both the mean and median are presented.
In order to estimate exposure, the average number of players per team per game was calculated based on analysis of regular season game participation via box scores. This average number over a season, multiplied by the number of team games at each professional level of baseball, was used as an estimate of athlete exposures in order to provide rates comparable to those of other injury surveillance systems. Injury rates were reported as injuries per 1000 athlete-exposures (AE) for those knee injuries that occurred during the regular season. It should be noted that the number of regular season knee injuries and the subsequent AE rates are based on injuries that were deemed work-related during the regular season. This does not necessarily only include injuries occurring during the course of a game, but injuries in game preparation as well. Due to the variations in spring training games and fluctuating rosters, an exposure rate could not be calculated for spring training knee injuries.
RESULTS
Overall Summary
Of the 30 general body regions/systems included in the HITS database, injuries to the knee were the fifth most common reason for days missed in all of professional baseball from 2011-2014 (Table 1). Injuries to the knee represented 6.5% of the nearly 34,000 injuries sustained during the study period. Knee injuries were the fifth most common reason for time out of play for players in both the MiLB and MLB.
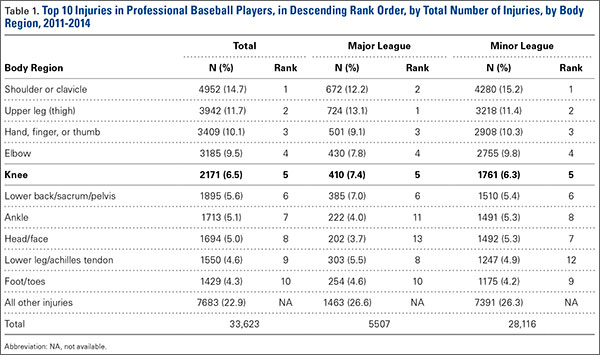
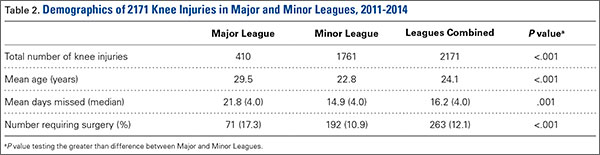
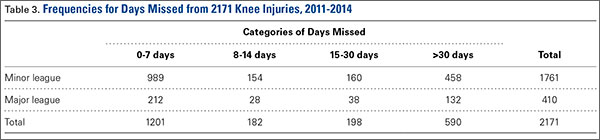
A total of 2171 isolated knee injuries resulted in time out of sport for professional baseball players (Table 2). Of these, 410 (19%) occurred in MLB players and 1761 (81%) occurred in MiLB players. MLB players were older than MiLB players at the time of injury (29.5 vs 22.8 years, respectively). Overall mean number of days missed was 16.2 days per knee injury, with MLB players missing an approximately 7 days more per injury than MiLB athletes (21.8 vs. 14.9 days respectively; P = .001).Over the course of the 4 seasons, a total of 30,449 days were missed due to knee injuries in professional baseball, giving an average rate of 7612 days lost per season. Surgery was performed for 263 (12.1%) of the 2171 knee injuries, with a greater proportion of MLB players requiring surgery than MiLB players (17.3% vs 10.9%) (P < .001). With respect to number of days missed per injury, 26% of knee injuries in the minor leagues resulted in greater than 30 days missed, while this number rose to 32% for knee injuries in MLB players (Table 3).
For regular season games, it was estimated that there were 1,197,738 MiLB and 276,608 MLB AE, respectively, over the course of the 4 seasons (2011-2014). The overall knee injury rate across both the MiLB and MLB was 1.2 per 1000 AE, based on the subset of 308 and 1473 regular season knee injuries in MiLB and MLB, respectively. The rate of knee injury was similar and not significantly different between the MiLB and MLB (1.2 per 1000 AE in the MiLB and 1.1 per 1000 AE in the MLB).
Characteristics of Injuries
When considering the position of the player during injury, defensive players were most frequently injured (n = 742, 56.5%), with pitchers (n = 227, 17.3%), infielders (n =193, 14.7%), outfielders (n = 193, 14.7%), and catchers (n = 129, 9.8%) sustaining injuries in decreasing frequency. Injuries while on offense (n = 571, 43.5%) were most frequent in base runners (n = 320, 24.4%) followed by batters (n = 251, 19.1%) (Table 4). Injuries while on defense occurring in infielders and catchers resulted in the longest period of time away from play (average of 22.4 and 20.8 days missed, respectively), while those occurring in batters resulted in the least average days missed (8.9 days).
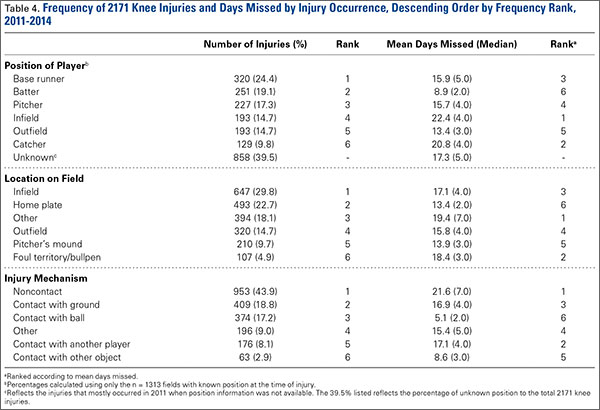
The most common field location for knee injuries to occur was the infield, which was responsible for n = 647 (29.8%) of the total knee injuries (Table 4). This was followed by home plate (n = 493, 22.7%), other locations outside those specified (n = 394, 18.1%), outfield (n = 320, 14.7%), pitcher’s mound (n = 210, 9.7%), and foul territory or the bullpen (n = 107, 4.9%). Of the knee injuries with a specified location, those occurring in foul territory or the bullpen resulted in the highest mean days missed (18.4), while those occurring at home plate resulted in the least mean days missed (13.4 days).
When analyzed by mechanism of injury, noncontact injuries (n = 953, 43.9%) were more common than being hit with the ball (n = 374, 17.2%), striking the ground (n = 409, 18.8%), other mechanisms not listed (n = 196, 9%), contact with another player (n = 176, 8.1%), or contact with other objects (n = 63, 2.9%) (Table 4). Noncontact injuries and player to player collisions resulted in the greatest number of missed days (21.6 and 17.1 days, respectively) while being struck by the ball resulted in the least mean days missed (5.1).
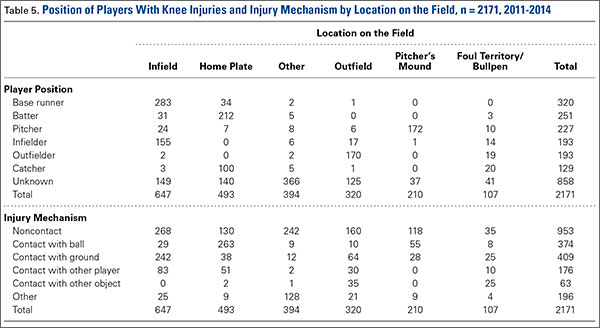
Of the n = 493 knee injuries occurring at home plate, n = 212 (43%) occurred to the batter, n = 100 (20%) to the catcher, n = 34 (6.9%) to base runners, and n = 7 (1.4%) to pitchers (Table 5). The majority of knee injuries in the infield occurred to base runners (n = 283, 43.7%). Player-to-player collisions at home plate were responsible for 51 (2.3%) knee injuries, while 163 (24%) were noncontact injuries and 376 (56%) were the result of a player being hit by the ball (Table 5).
Injury Diagnosis
By diagnosis, the most common knee injuries observed were contusions or hematomas (n = 662, 30.5%), other injuries (n = 415, 19.1%), sprains or ligament injuries (n = 380, 17.5%), tendinopathies or bursitis (n = 367, 16.9%), and meniscal or cartilage injury (n = 200, 9.2%) (Table 6). Injuries resulting in the greatest mean number of days missed included meniscal or cartilage injuries (44 days), sprains or ligament injuries (30 days), or dislocations (22 days).
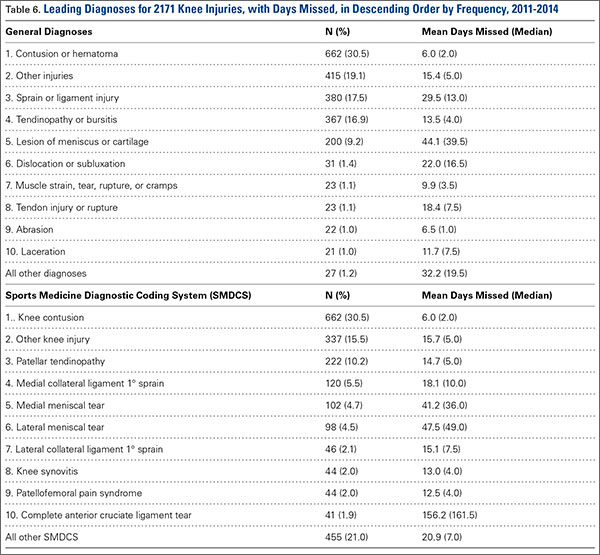
Based on specific SMDCS descriptors, the most frequent knee injuries reported were contusion (n = 662, 30.5%), patella tendinopathy (n = 222, 10.2%), and meniscal tears (n = 200, 9.2%) (Table 6). Complete anterior cruciate ligament tears, although infrequent, were responsible for the greatest mean days missed (156.2 days). This was followed by lateral meniscus tears (47.5 days) and medial meniscus tears (41.2 days). Knee contusions, although very common, resulted in the least number of days missed (6.0 days).
Discussion
Although much is known about knee injuries in other professional athletic leagues, little is known about knee injuries in professional baseball players.2-4 The majority of epidemiologic studies regarding baseball players at any level emphasizes the study of shoulder and elbow injuries.3,4,19 Since the implementation of the electronic medical record and the HITS database in professional baseball, there has been increased effort to document injuries that have received less attention in the existing literature. Understanding the epidemiology of these injuries is important for the development of targeted prevention efforts.
Prior studies of injuries in professional baseball relied on data captured by the publicly available DL. Posner and colleagues2 provide one of the most comprehensive reports on MLB injuries in a report utilizing DL assignment data over a period of 7 seasons.They demonstrated that knee injuries were responsible for 7.7% (12.5% for fielders and 3.7% for pitchers) of assignments to the DL. The current study utilized a comprehensive surveillance and builds on this existing knowledge. The present study found similar trends to Posner and colleagues2 in that knee injuries were responsible for 6.5% of injuries in professional baseball players that resulted in missed games. From the 2002 season to the 2008 season, knee injuries were the fifth most common reason MLB players were placed on the DL,2 and the current study indicates that they remain the fifth most common reason for missed time from play based on the HITS data. Since the prevalence of these injuries have remained constant since the 2002 season, efforts to better understand these injuries are warranted in order to identify strategies to prevent them. These analyses have generated important data towards achieving this understanding.
As with most injuries in professional sports, goals for treatment are aimed at maximizing patient function and performance while minimizing time out of play. For the 2011-2014 professional baseball seasons, a total of 2171 players sustained knee injuries and missed an average of 16.2 days per injury. Knee injuries were responsible for a total of 7612 days of missed work for MLB and MiLB players per season (30,449 days over the 4-season study period). This is equivalent to a total of 20.9 years of players’ time lost in professional baseball per season over the last 4 years. The implications of this amount of time away from sport are significant, and further study should be targeted at prevention of these injuries and optimizing return to play times.
When attempting to reduce the burden of knee injuries in professional baseball, it may prove beneficial to first understand how the injuries occur, where on the field, and who is at greatest risk. From 2011 to 2014, nearly 44% of knee injuries occurred by noncontact mechanisms. Among all locations on the field where knee injuries occurred, those occurring in the infield were responsible for the greatest mean days missed. The players who seem to be at greatest risk for knee injuries appear to be base runners. These data suggest the need for prevention efforts targeting base runners and infield players, as well as players in MiLB, where the largest number of injuries occurred.
Recently, playing rules implemented by MLB after consultation with players have focused on reducing the number of player-to-player collisions at home plate in an attempt to decrease the injury burden to catchers and base runners.20 This present analysis suggests that this rule change may also reduce the occurrence of knee injuries, as player collisions at home plate were responsible for a total of 51 knee injuries during the study period. The impact of this rule change on injury rates should also be explored. Interestingly, of the 51 knees injuries occurring due to contact at home plate, 23 occurred in 2011, and only 2 occurred in 2014—the first year of the new rule. Additional areas that resulted in high numbers of knee injuries were player-to-player contact in the infield and player contact with the ground in the infield.
Attempting to reduce injury burden and time out of play related to knee injuries in professional baseball players will likely prove to be a difficult task. In order to generate meaningful improvement, a comprehensive approach that involves players, management, trainers, therapists, and physicians will likely be required. As the first report of the epidemiology of knee injuries in professional baseball players, this study is one important step in that process. The strengths of this study are its comprehensive nature that analyzes injuries from an entire population of players on more than 200 teams over a 3-year period. Also, this research is strengthened by its focus on one particular region of the body that has received limited attention in the empirical literature, but represents a significant source of lost time during the baseball season.
There are some limitations to this study. As with any injury surveillance system, there is the possibility that not all cases were captured. Additionally, since the surveillance system is based on data from multiple teams, data entry discrepancy is possible; however, the presence of dropdown boxes and systematic definitions for injuries reduces this risk. Finally, this study did not investigate the various treatments for knee injuries beyond whether or not the injury required surgery. Since this was the first comprehensive exploration of knee injuries in professional baseball, future studies are needed to explore additional facets including outcomes related to treatment, return to play, and performance.
Conclusion
Knee injuries represent 6.5% of all injuries in professional baseball, occurring at a rate of 1.3 per 1000 AE. The burden of these injuries is significant for professional baseball players. This study fills a critical gap in sports injury research by contributing to the knowledge about the effect of knee injuries in professional baseball. It also provides an important foundation for future epidemiologic inquiry to identify modifiable risk factors and interventions that may reduce the impact of these injuries in athletes.
1. Conte S, Requa RK, Garrick JG. Disability days in major league baseball. Am J Sports Med. 2001;29(4):431-436.
2. Posner M, Cameron KL, Wolf JM, Belmont PJ Jr, Owens BD. Epidemiology of Major League Baseball injuries. Am J Sports Med. 2011;39(8):1676-1680.
3. Dick R, Sauers EL, Agel J, et al. Descriptive epidemiology of collegiate men’s baseball injuries: National Collegiate Athletic Association Injury Surveillance System, 1988-1989 through 2003-2004. J Athletic Training. 2007;42(2):183-193.
4. Makhni EC, Buza JA, Byram I, Ahmad CS. Sports reporting: A comprehensive review of the medical literature regarding North American professional sports. Phys Sportsmed. 2014;42(2):154-162.
5. Ahmad CS, Dick RW, Snell E, et al. Major and Minor League Baseball hamstring injuries: epidemiologic findings from the Major League Baseball Injury Surveillance System. Am J Sports Med. 2014;42(6):1464-1470.
6. Aune KT, Andrews JR, Dugas JR, Cain EL Jr. Return to play after partial lateral meniscectomy in National Football League Athletes. Am J Sports Med. 2014;42(8):1865-1872.
7. Brophy RH, Gill CS, Lyman S, Barnes RP, Rodeo SA, Warren RF. Effect of anterior cruciate ligament reconstruction and meniscectomy on length of career in National Football League athletes: a case control study. Am J Sports Med. 2009;37(11):2102-2107.
8. Brophy RH, Rodeo SA, Barnes RP, Powell JW, Warren RF. Knee articular cartilage injuries in the National Football League: epidemiology and treatment approach by team physicians. J Knee Surg. 2009;22(4):331-338.
9. Cerynik DL, Lewullis GE, Joves BC, Palmer MP, Tom JA. Outcomes of microfracture in professional basketball players. Knee Surg Sports Traumatol Arthrosc. 2009;17(9):1135-1139.
10. Hershman EB, Anderson R, Bergfeld JA, et al; National Football League Injury and Safety Panel. An analysis of specific lower extremity injury rates on grass and FieldTurf playing surfaces in National Football League Games: 2000-2009 seasons. Am J Sports Med. 2012;40(10):2200-2205.
11. Namdari S, Baldwin K, Anakwenze O, Park MJ, Huffman GR, Sennett BJ. Results and performance after microfracture in National Basketball Association athletes. Am J Sports Med. 2009;37(5):943-948.
12. Yeh PC, Starkey C, Lombardo S, Vitti G, Kharrazi FD. Epidemiology of isolated meniscal injury and its effect on performance in athletes from the National Basketball Association. Am J Sports Med. 2012;40(3):589-594.
13. Pollack KM, D’Angelo J, Green G, et al. Developing and implementing major league baseball’s health and injury tracking system. Am J Epidem. (accepted), 2016.
14. Green GA, Pollack KM, D’Angelo J, et al. Mild traumatic brain injury in major and Minor League Baseball players. Am J Sports Med. 2015;43(5):1118-1126.
15. Dick R, Agel J, Marshall SW. National Collegiate Athletic Association Injury Surveillance System commentaries: introduction and methods. J Athletic Training. 2007;42(2):173-182.
16. Pellman EJ, Viano DC, Casson IR, Arfken C, Feuer H. Concussion in professional football players returning to the same game—part 7. Neurosurg. 2005;56(1):79-90.
17. Stevens ST, Lassonde M, De Beaumont L, Keenan JP. The effect of visors on head and facial injury in national hockey league players. J Sci Med Sport. 2006;9(3):238-242.
18. Meeuwisse WH, Wiley JP. The sport medicine diagnostic coding system. Clin J Sport Med. 2007;17(3):205-207.
19. Mcfarland EG, Wasik M. Epidemiology of collegiate baseball injuries. Clin J Sport Med. 1998;8(1):10-13.
20. Hagen P. New rule on home-plate collisions put into effect. Major League Baseball website. http://m.mlb.com/news/article/68267610/mlb-institutes-new-rule-on-home-plate-collisions. Accessed December 5, 2014.
Injuries among professional baseball players have been on the rise for several years.1,2 From 1989 to 1999, the number of disabled list (DL) reports increased 38% (266 to 367 annual reports),1 and a similar increase in injury rates was noted from the 2002 to the 2008 seasons (37%).2 These injuries have important implications for future injury risk and time away from play. Identifying these injuries and determining correlates and risk factors is important for targeted prevention efforts.
Several studies have explored the prevalence of upper extremity injuries in professional and collegiate baseball players;2-4 however, detailed epidemiology of knee injuries in Major League Baseball (MLB) and Minor League Baseball (MiLB) players is lacking. Much more is known about the prevalence, treatment, and outcomes of knee injuries in other professional sporting organizations, such as the National Basketball Association (NBA), National Football League (NFL), and National Hockey League (NHL).4-12 A recent meta-analysis exploring injuries in professional athletes found that studies on lower extremity injuries comprised approximately 12% of the literature reporting injuries in MLB players.4 In other professional leagues, publications on lower extremity injuries comprise approximately 56% of the sports medicine literature in the NFL, 54% in the NBA, and 62% in the NHL.4 Since few studies have investigated lower extremity injuries among professional baseball players, there is an opportunity for additional research to guide evidence-based prevention strategies.
A better understanding of the nature of these injuries is one of the first steps towards developing targeted injury prevention programs and treatment algorithms. The study of injury epidemiology among professional baseball players has been aided by the creation of an injury tracking system initiated by the MLB, its minor league affiliates, and the Major League Baseball Players Association.5,13,14 This surveillance system allows for the tracking of medical histories and injuries to players as they move across major and minor league organizations. Similar systems have been utilized in the National Collegiate Athletic Association and other professional sports organizations.3,15-17 A unique advantage of the MLB surveillance system is the required participation of all major and minor league teams, which allows for investigation of the entire population of players rather than simply a sample of players from select teams. This system has propelled an effort to identify injury patterns as a means of developing appropriate targets for potential preventative measures.5
The purpose of this descriptive epidemiologic study is to better understand the distribution and characteristics of knee injuries in these elite athletes by reporting on all knee injuries occurring over a span of 4 seasons (2011-2014). Additionally, this study seeks to characterize the impact of these injuries by analyzing the time required for return to play and the treatments rendered (surgical and nonsurgical).
Materials and Methods
After approval from the Johns Hopkins Bloomberg School of Public Health Institutional Review Board, detailed data regarding knee injuries in both MLB and MiLB baseball players were extracted from the de-identified MLB Health and Injury Tracking System (HITS). The HITS database is a centralized database that contains data on injuries from an electronic medical record (EMR). All players provided consent to have their data included in this EMR. HITS system captures injuries reported by the athletic trainers for all professional baseball players from 30 MLB clubs and their 230 minor league affiliates. Additional details on this population of professional baseball players have been published elsewhere.5 Only injuries that result in time out of play (≥1 day missed) are included in the database, and they are logged with basic information such as region of the body, diagnosis, date, player position, activity leading to injury, and general treatment. Any injury that affects participation in any aspect of baseball-related activity (eg, game, practice, warm-up, conditioning, weight training) is captured in HITS.
All baseball-related knee injuries occurring during the 2011-2014 seasons that resulted in time out of sport were included in the study. These injuries were identified based on the Sports Medicine Diagnostic Coding System (SMDCS) to capture injuries by diagnostic groups.18 Knee injuries were included if they occurred during spring training, regular season, or postseason play. Offseason injuries were not included. Injury events that were classified as “season-ending” were not included in the analysis of days missed because many of these players may not have been cleared to play until the beginning of the following season. To determine the proportion of knee injuries during the study period, all injuries were included for comparative purposes (subdivided based on 30 anatomic regions or types).
For each knee injury, a number of variables were analyzed, including diagnosis, level of play (MLB vs. MiLB), age, player position at the time of injury (pitcher, catcher, infield, outfield, base runner, or batter), field location where the injury occurred (home plate, pitcher’s mound, infield, outfield, foul territory or bullpen, or other), mechanism of injury, days missed, and treatment rendered (conservative vs surgical). The classification used to describe the mechanism of injury consisted of contact with ball, contact with ground, contact with another player, contact with another object, or noncontact.
Statistical Analysis Epidemiologic data are presented with descriptive statistics such as mean, median, frequency, and percentage where appropriate. When comparing player age, days missed, and surgical vs nonsurgical treatment between MLB and MiLB players, t-tests and tests for difference in proportions were applied as appropriate. Statistical significance was established for P values < .05.
The distribution of days missed for the variables considered was often skewed to the right (ie, days missed mostly concentrated on the low to moderate number of days, with fewer values in the much higher days missed range), even after excluding the season-ending injuries; hence the mean (or average) days missed was often larger than the median days missed. Reporting the median would allow for a robust estimate of the expected number of days missed, but would down weight those instances when knee injuries result in much longer missed days, as reflected by the mean. Because of the importance of the days missed measure for professional baseball, both the mean and median are presented.
In order to estimate exposure, the average number of players per team per game was calculated based on analysis of regular season game participation via box scores. This average number over a season, multiplied by the number of team games at each professional level of baseball, was used as an estimate of athlete exposures in order to provide rates comparable to those of other injury surveillance systems. Injury rates were reported as injuries per 1000 athlete-exposures (AE) for those knee injuries that occurred during the regular season. It should be noted that the number of regular season knee injuries and the subsequent AE rates are based on injuries that were deemed work-related during the regular season. This does not necessarily only include injuries occurring during the course of a game, but injuries in game preparation as well. Due to the variations in spring training games and fluctuating rosters, an exposure rate could not be calculated for spring training knee injuries.
RESULTS
Overall Summary
Of the 30 general body regions/systems included in the HITS database, injuries to the knee were the fifth most common reason for days missed in all of professional baseball from 2011-2014 (Table 1). Injuries to the knee represented 6.5% of the nearly 34,000 injuries sustained during the study period. Knee injuries were the fifth most common reason for time out of play for players in both the MiLB and MLB.
A total of 2171 isolated knee injuries resulted in time out of sport for professional baseball players (Table 2). Of these, 410 (19%) occurred in MLB players and 1761 (81%) occurred in MiLB players. MLB players were older than MiLB players at the time of injury (29.5 vs 22.8 years, respectively). Overall mean number of days missed was 16.2 days per knee injury, with MLB players missing an approximately 7 days more per injury than MiLB athletes (21.8 vs. 14.9 days respectively; P = .001).Over the course of the 4 seasons, a total of 30,449 days were missed due to knee injuries in professional baseball, giving an average rate of 7612 days lost per season. Surgery was performed for 263 (12.1%) of the 2171 knee injuries, with a greater proportion of MLB players requiring surgery than MiLB players (17.3% vs 10.9%) (P < .001). With respect to number of days missed per injury, 26% of knee injuries in the minor leagues resulted in greater than 30 days missed, while this number rose to 32% for knee injuries in MLB players (Table 3).
For regular season games, it was estimated that there were 1,197,738 MiLB and 276,608 MLB AE, respectively, over the course of the 4 seasons (2011-2014). The overall knee injury rate across both the MiLB and MLB was 1.2 per 1000 AE, based on the subset of 308 and 1473 regular season knee injuries in MiLB and MLB, respectively. The rate of knee injury was similar and not significantly different between the MiLB and MLB (1.2 per 1000 AE in the MiLB and 1.1 per 1000 AE in the MLB).
Characteristics of Injuries
When considering the position of the player during injury, defensive players were most frequently injured (n = 742, 56.5%), with pitchers (n = 227, 17.3%), infielders (n =193, 14.7%), outfielders (n = 193, 14.7%), and catchers (n = 129, 9.8%) sustaining injuries in decreasing frequency. Injuries while on offense (n = 571, 43.5%) were most frequent in base runners (n = 320, 24.4%) followed by batters (n = 251, 19.1%) (Table 4). Injuries while on defense occurring in infielders and catchers resulted in the longest period of time away from play (average of 22.4 and 20.8 days missed, respectively), while those occurring in batters resulted in the least average days missed (8.9 days).
The most common field location for knee injuries to occur was the infield, which was responsible for n = 647 (29.8%) of the total knee injuries (Table 4). This was followed by home plate (n = 493, 22.7%), other locations outside those specified (n = 394, 18.1%), outfield (n = 320, 14.7%), pitcher’s mound (n = 210, 9.7%), and foul territory or the bullpen (n = 107, 4.9%). Of the knee injuries with a specified location, those occurring in foul territory or the bullpen resulted in the highest mean days missed (18.4), while those occurring at home plate resulted in the least mean days missed (13.4 days).
When analyzed by mechanism of injury, noncontact injuries (n = 953, 43.9%) were more common than being hit with the ball (n = 374, 17.2%), striking the ground (n = 409, 18.8%), other mechanisms not listed (n = 196, 9%), contact with another player (n = 176, 8.1%), or contact with other objects (n = 63, 2.9%) (Table 4). Noncontact injuries and player to player collisions resulted in the greatest number of missed days (21.6 and 17.1 days, respectively) while being struck by the ball resulted in the least mean days missed (5.1).
Of the n = 493 knee injuries occurring at home plate, n = 212 (43%) occurred to the batter, n = 100 (20%) to the catcher, n = 34 (6.9%) to base runners, and n = 7 (1.4%) to pitchers (Table 5). The majority of knee injuries in the infield occurred to base runners (n = 283, 43.7%). Player-to-player collisions at home plate were responsible for 51 (2.3%) knee injuries, while 163 (24%) were noncontact injuries and 376 (56%) were the result of a player being hit by the ball (Table 5).
Injury Diagnosis
By diagnosis, the most common knee injuries observed were contusions or hematomas (n = 662, 30.5%), other injuries (n = 415, 19.1%), sprains or ligament injuries (n = 380, 17.5%), tendinopathies or bursitis (n = 367, 16.9%), and meniscal or cartilage injury (n = 200, 9.2%) (Table 6). Injuries resulting in the greatest mean number of days missed included meniscal or cartilage injuries (44 days), sprains or ligament injuries (30 days), or dislocations (22 days).
Based on specific SMDCS descriptors, the most frequent knee injuries reported were contusion (n = 662, 30.5%), patella tendinopathy (n = 222, 10.2%), and meniscal tears (n = 200, 9.2%) (Table 6). Complete anterior cruciate ligament tears, although infrequent, were responsible for the greatest mean days missed (156.2 days). This was followed by lateral meniscus tears (47.5 days) and medial meniscus tears (41.2 days). Knee contusions, although very common, resulted in the least number of days missed (6.0 days).
Discussion
Although much is known about knee injuries in other professional athletic leagues, little is known about knee injuries in professional baseball players.2-4 The majority of epidemiologic studies regarding baseball players at any level emphasizes the study of shoulder and elbow injuries.3,4,19 Since the implementation of the electronic medical record and the HITS database in professional baseball, there has been increased effort to document injuries that have received less attention in the existing literature. Understanding the epidemiology of these injuries is important for the development of targeted prevention efforts.
Prior studies of injuries in professional baseball relied on data captured by the publicly available DL. Posner and colleagues2 provide one of the most comprehensive reports on MLB injuries in a report utilizing DL assignment data over a period of 7 seasons.They demonstrated that knee injuries were responsible for 7.7% (12.5% for fielders and 3.7% for pitchers) of assignments to the DL. The current study utilized a comprehensive surveillance and builds on this existing knowledge. The present study found similar trends to Posner and colleagues2 in that knee injuries were responsible for 6.5% of injuries in professional baseball players that resulted in missed games. From the 2002 season to the 2008 season, knee injuries were the fifth most common reason MLB players were placed on the DL,2 and the current study indicates that they remain the fifth most common reason for missed time from play based on the HITS data. Since the prevalence of these injuries have remained constant since the 2002 season, efforts to better understand these injuries are warranted in order to identify strategies to prevent them. These analyses have generated important data towards achieving this understanding.
As with most injuries in professional sports, goals for treatment are aimed at maximizing patient function and performance while minimizing time out of play. For the 2011-2014 professional baseball seasons, a total of 2171 players sustained knee injuries and missed an average of 16.2 days per injury. Knee injuries were responsible for a total of 7612 days of missed work for MLB and MiLB players per season (30,449 days over the 4-season study period). This is equivalent to a total of 20.9 years of players’ time lost in professional baseball per season over the last 4 years. The implications of this amount of time away from sport are significant, and further study should be targeted at prevention of these injuries and optimizing return to play times.
When attempting to reduce the burden of knee injuries in professional baseball, it may prove beneficial to first understand how the injuries occur, where on the field, and who is at greatest risk. From 2011 to 2014, nearly 44% of knee injuries occurred by noncontact mechanisms. Among all locations on the field where knee injuries occurred, those occurring in the infield were responsible for the greatest mean days missed. The players who seem to be at greatest risk for knee injuries appear to be base runners. These data suggest the need for prevention efforts targeting base runners and infield players, as well as players in MiLB, where the largest number of injuries occurred.
Recently, playing rules implemented by MLB after consultation with players have focused on reducing the number of player-to-player collisions at home plate in an attempt to decrease the injury burden to catchers and base runners.20 This present analysis suggests that this rule change may also reduce the occurrence of knee injuries, as player collisions at home plate were responsible for a total of 51 knee injuries during the study period. The impact of this rule change on injury rates should also be explored. Interestingly, of the 51 knees injuries occurring due to contact at home plate, 23 occurred in 2011, and only 2 occurred in 2014—the first year of the new rule. Additional areas that resulted in high numbers of knee injuries were player-to-player contact in the infield and player contact with the ground in the infield.
Attempting to reduce injury burden and time out of play related to knee injuries in professional baseball players will likely prove to be a difficult task. In order to generate meaningful improvement, a comprehensive approach that involves players, management, trainers, therapists, and physicians will likely be required. As the first report of the epidemiology of knee injuries in professional baseball players, this study is one important step in that process. The strengths of this study are its comprehensive nature that analyzes injuries from an entire population of players on more than 200 teams over a 3-year period. Also, this research is strengthened by its focus on one particular region of the body that has received limited attention in the empirical literature, but represents a significant source of lost time during the baseball season.
There are some limitations to this study. As with any injury surveillance system, there is the possibility that not all cases were captured. Additionally, since the surveillance system is based on data from multiple teams, data entry discrepancy is possible; however, the presence of dropdown boxes and systematic definitions for injuries reduces this risk. Finally, this study did not investigate the various treatments for knee injuries beyond whether or not the injury required surgery. Since this was the first comprehensive exploration of knee injuries in professional baseball, future studies are needed to explore additional facets including outcomes related to treatment, return to play, and performance.
Conclusion
Knee injuries represent 6.5% of all injuries in professional baseball, occurring at a rate of 1.3 per 1000 AE. The burden of these injuries is significant for professional baseball players. This study fills a critical gap in sports injury research by contributing to the knowledge about the effect of knee injuries in professional baseball. It also provides an important foundation for future epidemiologic inquiry to identify modifiable risk factors and interventions that may reduce the impact of these injuries in athletes.
1. Conte S, Requa RK, Garrick JG. Disability days in major league baseball. Am J Sports Med. 2001;29(4):431-436.
2. Posner M, Cameron KL, Wolf JM, Belmont PJ Jr, Owens BD. Epidemiology of Major League Baseball injuries. Am J Sports Med. 2011;39(8):1676-1680.
3. Dick R, Sauers EL, Agel J, et al. Descriptive epidemiology of collegiate men’s baseball injuries: National Collegiate Athletic Association Injury Surveillance System, 1988-1989 through 2003-2004. J Athletic Training. 2007;42(2):183-193.
4. Makhni EC, Buza JA, Byram I, Ahmad CS. Sports reporting: A comprehensive review of the medical literature regarding North American professional sports. Phys Sportsmed. 2014;42(2):154-162.
5. Ahmad CS, Dick RW, Snell E, et al. Major and Minor League Baseball hamstring injuries: epidemiologic findings from the Major League Baseball Injury Surveillance System. Am J Sports Med. 2014;42(6):1464-1470.
6. Aune KT, Andrews JR, Dugas JR, Cain EL Jr. Return to play after partial lateral meniscectomy in National Football League Athletes. Am J Sports Med. 2014;42(8):1865-1872.
7. Brophy RH, Gill CS, Lyman S, Barnes RP, Rodeo SA, Warren RF. Effect of anterior cruciate ligament reconstruction and meniscectomy on length of career in National Football League athletes: a case control study. Am J Sports Med. 2009;37(11):2102-2107.
8. Brophy RH, Rodeo SA, Barnes RP, Powell JW, Warren RF. Knee articular cartilage injuries in the National Football League: epidemiology and treatment approach by team physicians. J Knee Surg. 2009;22(4):331-338.
9. Cerynik DL, Lewullis GE, Joves BC, Palmer MP, Tom JA. Outcomes of microfracture in professional basketball players. Knee Surg Sports Traumatol Arthrosc. 2009;17(9):1135-1139.
10. Hershman EB, Anderson R, Bergfeld JA, et al; National Football League Injury and Safety Panel. An analysis of specific lower extremity injury rates on grass and FieldTurf playing surfaces in National Football League Games: 2000-2009 seasons. Am J Sports Med. 2012;40(10):2200-2205.
11. Namdari S, Baldwin K, Anakwenze O, Park MJ, Huffman GR, Sennett BJ. Results and performance after microfracture in National Basketball Association athletes. Am J Sports Med. 2009;37(5):943-948.
12. Yeh PC, Starkey C, Lombardo S, Vitti G, Kharrazi FD. Epidemiology of isolated meniscal injury and its effect on performance in athletes from the National Basketball Association. Am J Sports Med. 2012;40(3):589-594.
13. Pollack KM, D’Angelo J, Green G, et al. Developing and implementing major league baseball’s health and injury tracking system. Am J Epidem. (accepted), 2016.
14. Green GA, Pollack KM, D’Angelo J, et al. Mild traumatic brain injury in major and Minor League Baseball players. Am J Sports Med. 2015;43(5):1118-1126.
15. Dick R, Agel J, Marshall SW. National Collegiate Athletic Association Injury Surveillance System commentaries: introduction and methods. J Athletic Training. 2007;42(2):173-182.
16. Pellman EJ, Viano DC, Casson IR, Arfken C, Feuer H. Concussion in professional football players returning to the same game—part 7. Neurosurg. 2005;56(1):79-90.
17. Stevens ST, Lassonde M, De Beaumont L, Keenan JP. The effect of visors on head and facial injury in national hockey league players. J Sci Med Sport. 2006;9(3):238-242.
18. Meeuwisse WH, Wiley JP. The sport medicine diagnostic coding system. Clin J Sport Med. 2007;17(3):205-207.
19. Mcfarland EG, Wasik M. Epidemiology of collegiate baseball injuries. Clin J Sport Med. 1998;8(1):10-13.
20. Hagen P. New rule on home-plate collisions put into effect. Major League Baseball website. http://m.mlb.com/news/article/68267610/mlb-institutes-new-rule-on-home-plate-collisions. Accessed December 5, 2014.
A Patient's Perspective on Readmissions
Years into the national discourse on reducing readmissions, hospitals and providers are still struggling with how to sustainably reduce 30‐day readmissions.[1] All‐cause hospital readmission rates for Medicare benificiaries averaged 19% from 2007 through 2011 and showed only a modest improvement to 18.4% in 2012.[2] A review of 43 studies in 2011 concluded that no single intervention was reliably associated with reducing readmission rates.[3] However, although no institution has found a magic bullet for reducing readmissions, progress has been made. A 2014 meta‐analysis of randomized trials aimed at preventing 30‐day readmissions found that overall readmission interventions are effective, and that the most successful interventions are more complex in nature and focus on empowering patients to engage in self‐care after discharge.[4] Readmission reduction efforts for patients with specific diagnoses have also made gains. Among patients with heart failure, for instance, higher rates of early outpatient follow‐up and care‐transition interventions for high‐risk patients have been shown to reduce 30‐day readmissions.[5, 6]
An emerging, yet still underexplored, area in readmissions is the importance of evaluating patient perspectives. The patient has intimate knowledge of the circumstances surrounding their readmission and can be a valuable resource. This is particularly true given evidence that patient perspectives do not always align with those of providers.[7, 8] Coleman's Care Transitions Intervention was one of the earliest care‐transition models demonstrating value in engaging patients to become actively involved in their care.[9] Since then, others have begun to analyze transitions of care from the patient perspective, identifying patient‐reported needs in anticipation of discharge and after they are home.[10, 11, 12, 13, 14] However, still only a few studies have endeavored to gain a thorough understanding of the readmitted patient perspective.[7, 15, 16] These studies have already identified important issues such as lack of patient readiness for discharge and the need for additional advanced care planning and caregiver resources. A few smaller studies have interviewed readmitted patients with specific diagnoses and have also shed light on disease‐specific issues.[17, 18, 19, 20] Outside the field of readmissions, improving patient‐centered communication has been shown to reduce expenditures on diagnostic tests,[21, 22] increase adherence to treatment,[23] and improve health outcomes.[24, 25] It is time for us to incorporate the patient voice into all areas of care.
In 2014, our group published the results of a study aimed at understanding the patient perspective surrounding readmissions. In this study, 27% of patients believed their readmission could have been prevented. This opinion was associated with not feeling ready for discharge, not having a follow‐up appointment scheduled, and poor satisfaction with the discharging team.[7] A key observation in these initial interviews was that patients often expressed sentiments of relief rather than frustration when they returned to the hospital. With the results of this previous study in mind, we designed a more comprehensive evaluation to investigate why patients felt unprepared for discharge, explore reasons for and attitudes surrounding readmissions, and identify patient‐centered interventions that could prevent future readmissions.
METHODS
Study Design and Recruitment
We designed the study as an in‐person survey of readmitted patients. Over a 7‐month period (February 11, 2014September 8, 2014), we identified all patients readmitted within 30 days to general medicine and cardiology services through daily queries from the electronic health record. The study took place in a 540‐bed tertiary academic medical center, as well as a 266‐bed affiliated community hospital. We reviewed the discharge summary from the index admission and the history and physical documentation from the readmission for exclusion criteria. Patients were excluded if they were: (1) readmitted to the intensive care unit, (2) had a planned readmission, (3) received an organ transplant in the preceding 3 months, (4) did not speak English, or (5) had a physical or mental incapacity preventing interview and no family member or caregiver was available to interview.
Patient Interviews
Five trained study volunteers approached all eligible patients for an interview starting the day after the patient was readmitted. Prior to the start of the interview, we obtained verbal consent from all patients. Interviews typically lasted 10 to 30 minutes in the patient's hospital room. Caregivers and/or family members were allowed to respond to interview questions if the patient granted them permission or if the patient was unable to participate. The interviewers were not part of the patient's medical team and the patients could refuse the interview at any time. According to the University of California Los Angeles (UCLA) Institutional Review Board, this work met criteria for quality‐improvement activities and was deemed to be exempt.
The survey was comprised of 24 questions addressing causes, preventability, and attitudes toward readmissions, readiness for discharge, quality of the discharge process, outpatient resources, and follow‐up care (see Supporting Information in the online version of this article). These areas of focus were chosen based on a pilot study of 98 patient interviews in which these topics emerged as worthy of further investigation.[7] With regard to patient readiness for discharge, we investigated correlations between patient readiness and symptom resolution, pain control, discharge location, level of support at home, and concerns about independent self‐care after discharge.
Data Analysis
We administered the surveys, collected and managed the data using REDCap (Research Electronic Data Capture) hosted at UCLA.[26] We collected demographic data, including race, ethnicity, and insurance status retrospectively though automated chart abstraction.
We summarized descriptive characteristics by mean and standard deviation (SD) for continuous variables (except for length of stay, which was summarized by median and range) and by proportions for categorical variables. To compare demographic variables between interviewed participants and those not interviewed (not available, not approached, refused, or excluded) we used Pearson 2 tests and Fisher exact tests for categorical variables and Student t tests for the only continuous variable, age. In evaluating patient readiness for discharge, we divided patients into groups of ready and not ready as determined by interview responses, then performed Pearson 2 tests and Fisher exact tests where appropriate.
For comparing the extent of burden and relief patients endorsed upon being readmitted, we subtracted the burden score (110) from the relief score (110) for each patient, resulting in a net relief score. We then performed a 1‐sample t test to determine whether the net relief was significantly different from 0. A P value of<0.05 was considered to be statistically significant. All statistical analyses were performed using R version 3.0.2 (
RESULTS
Patient Characteristics
Eight hundred nineteen patients were readmitted to general medicine and cardiology services over the 7‐month study period at both institutions. Two hundred thirty‐five patients (29%) were excluded based on the predetermined exclusion criteria, and 105 patients (13%) were not approached for interview due to time constraints. Of the 479 eligible patients approached for interview, 164 patients (34%) could not be interviewed because they were unavailable, and 85 patients (18%) refused. We interviewed 230 patients (48%). We conducted 115 interviews at our academic medical center and 115 at our community affiliate. The only significant demographic difference between interviewed and not‐interviewed patients was race (P=0.004).
Interviewed patients had a mean (SD) age of 63 (SD 20) years, and 45% were male. Sixty‐three percent of interviewees were white, 21% black, 8% Asian, and 8% other. The index admission median length of stay was 4 days, and the average time between admission and readmission was 13 days (Table 1). Seventy‐nine percent of the interviews were performed directly with the patient, and 21% were conducted predominantly with the patient's caregiver.
| Characteristic | Value |
|---|---|
| |
| Age, y, mean (SD) | 62.9 (20.2) |
| Female, n (%) | 127 (55.2) |
| Insurance status, n (%) | |
| Commercial | 36 (16.3) |
| Medi‐Cal/Medicaid | 31 (14.0) |
| Medicare | 123 (55.7) |
| Other | 5 (2.3) |
| UCLA managed care | 26 (11.8) |
| Missing | 9 |
| Race, n (%) | |
| Asian | 18 (7.9) |
| Black or African American | 48 (21.1) |
| Other/refused | 19 (8.3) |
| White or Caucasian | 143 (62.7) |
| Missing | 2 |
| Index length of stay, d, median (maximum, minimum) | 4 (1, 49) |
| Time between discharge and readmission, d, mean (SD) | 13 (9) |
| Discharge location following index admission, n (%) | |
| Home | 202 (88.2) |
| Skilled nursing facility | 3 (1.3) |
| Acute rehab facility | 17 (7.4) |
| Assisted living facility | 2 (0.9) |
| Other | 5 (2.2) |
| Missing | 1 |
Patient Readiness
Twenty‐eight percent of patients reported feeling unready for discharge from their index admission. Patients who felt that their readmission was preventable were significantly more likely to report feeling unready at the time of discharge compared to those who did not classify their readmission as preventable (53% vs 17%, P<0.01). Among patients who did not feel ready for discharge, over two‐thirds felt their symptoms were not adequately resolved. Conversely, among patients who did feel ready for discharge, only 8% felt their symptoms were not resolved (P<0.01). Patients who felt they were not ready for discharge were also significantly more likely to endorse poor pain control (43% vs 7%, P<0.01). The location of discharge (ie, home, rehab facility, or skilled nursing facility) and having someone to help take care of them at home did not significantly correlate with patient readiness. Over 80% of patients in both groups reported having someone to help at home, but patients who felt unready for discharge were significantly more likely to have concerns about taking care of themselves at home (54% vs 25%, P<0.001) (Table 2).
| All Participants, n=230 | Ready, n=164 | Not Ready, n=65 | P Value | |
|---|---|---|---|---|
| Symptoms were resolved enough to leave the hospital, n=227 | 170 (74.9%) | 149 (92.0%) | 21 (32.3%) | <0.01 |
| Felt pain was under control when left the hospital, n=229 | 190 (83.0%) | 153 (93.3%) | 37 (56.9%) | <0.01 |
| Discharged to home following index admission, n=229 | 202 (88.2%) | 146 (89.6%) | 56 (86.2%) | 0.62 |
| If discharged home, had someone at home able to help, n=202 | 178 (88.1%) | 132 (90.4%) | 46 (82.1%) | 0.17 |
| If discharged home, had concerns about being able to take of themselves at home or not being strong enough to go home, n=202 | 67 (33.2%) | 37 (25.3%) | 30 (53.6%) | <0.01 |
| Thought something could have been done to prevent them from coming back to the hospital, n=228 | 75 (32.9%) | 35 (21.6%) | 39 (60.0%) | <0.01 |
Discharge Instructions
Twenty‐nine percent of patients did not recall a physician talking to them about their discharge, and 35% did not remember receiving and reviewing the discharge paperwork. Of those who read the discharge paperwork, 23% noted difficulty identifying contact phone numbers, and 22% could not locate warning symptoms indicating when to seek medical attention. Patients were able to identify medications and follow‐up appointments on the discharge paperwork a majority of the time (92% and 85%, respectively).
Ambulatory Resources and Utilization
Patients were asked about their access to outpatient resources as well as their reason(s) for returning to the hospital. Eighty‐five percent of patients reported having a primary care doctor that they would feel comfortable calling if their symptoms worsened at home. Of the patients who indicated that they were given a contact number by their discharging team, only 56% contacted a doctor before returning to the emergency room. One‐third of patients reported knowing where to obtain urgent or same‐day care besides the emergency room. Among those who did report knowledge of same‐day care centers, 89% still chose not to utilize them.
Attitudes About Readmission
To investigate the patient experience with readmissions, patients were asked to rate the extent of the burden they felt upon returning to the hospital on a scale of 1 to 10, where 1 was no burden and 10 was extreme burden. Patients were also asked to evaluate the extent of relief they felt upon readmission using the same scale. On average, patients rated their sense of relief 1.8 points higher than their sense of burden upon readmission to the hospital (7.7 [SD 2.8] vs 5.9 [SD 3.4], P<0.001). The relief of readmission was rated as equal to or greater than the burden of readmission in 79% of cases. Lastly, patients' mean (SD) overall satisfaction with their medical care was 8.5 (SD 2.0) on a scale of 1 to 10, where 1 was the least satisfied and 10 was the most satisfied a patient could imagine.
DISCUSSION
This study performs a comprehensive evaluation of the patient perspective on 30‐day readmissions. Our previous work indicated that patients associate preventable readmissions with lack of preparedness at the time of discharge.[7] This study further evaluates the basis of this association. We found that nearly 1 in 3 readmitted patients did not feel ready to leave the hospital at the time of initial discharge. Feelings of inadequate symptom resolution and poor pain control appear to be major contributors to this sentiment. Furthermore, although 88% of patients endorse having a caretaker at home, patients with concerns about taking care of themselves are more likely to feel unready at discharge. Presumably, when healthcare providers discharge patients, they believe that the patient is ready to be discharged. However, our findings suggest that often patients do not agree, highlighting a gap between the beliefs of patients and those of healthcare providers. Creating patient‐centered education on symptom management and engaging patients in developing skills for independent self‐care may minimize this gap and allow patients to feel more prepared at discharge. Future research investigating provider opinions and the steps providers take when there is a disagreement over discharge readiness would also be useful.
One way to enhance education at the time of discharge is through improvements in printed discharge instructions. Jha et al. previously showed that chart documentation of providing discharge instructions does not correlate with patients reporting receiving discharge instructions.[27] Our study echoes this finding, with only 65% of the patients remembering receiving and reviewing the discharge paperwork. Horwitz et al. have also previously demonstrated poor comprehension of discharge planning and postdischarge care among patients discharged from an academic medical center.[28] Ensuring that all patients understand and retain their discharge instructions is an essential step in improving the patient experience and potentially decreasing readmissions. Our surveys have illuminated potential shortcomings in our own center's discharge instructions. Interventions aimed at clarifying critical pieces of information on the discharge paperwork, such as warning symptoms, contact phone numbers and follow‐up appointments, could be especially helpful.
After discharge, our findings suggest that only about half of patients will call a physician before returning to the hospital. Furthermore, there is limited knowledge and poor utilization of same‐day treatment centers besides the emergency room. In previous studies, Long et al. found that frequently readmitted patients self‐triage to the emergency room because they believe primary care clinics cannot treat acute illness.[11] Another study concluded that low‐income patients prefer hospital care to ambulatory care because of a greater sense of trust in inpatient care.[29]
Our patients' attitudes about readmission may also be different from those of providers. For patients, coming back to the hospital is not a significant burden, and satisfaction with their medical care remains high despite readmission. Additional research is needed to further explore the complex emotions patients have when coming back to the hospital and why patients may not be as upset with returning to the hospital as providers may expect. Ultimately, if patients continue to feel more comfortable being hospitalized, there are few incentives for patients to stay out of the hospital, and readmission rates will remain elevated.
Based on our survey results we have hypothesized a potential framework for studying readmissions from a patient‐centered approach (Figure 1). This figure is not meant to imply causality, but rather to highlight a potential journey from discharge to readmission for a patient who does not feel ready to go home. This schema principally applies to patients who are worried about symptom management and/or self‐care before discharge and may not apply to everyone. Each asterisk in this framework represents an area where an intervention could be designed to improve the patient experience and possibly reduce readmissions. Such interventions should be centered around increasing patient education about symptom management and self‐care at the time of discharge, improving printed discharge instructions, increasing patient awareness of outpatient resources, enhancing communication after discharge, and changing patients' attitudes about readmissions.
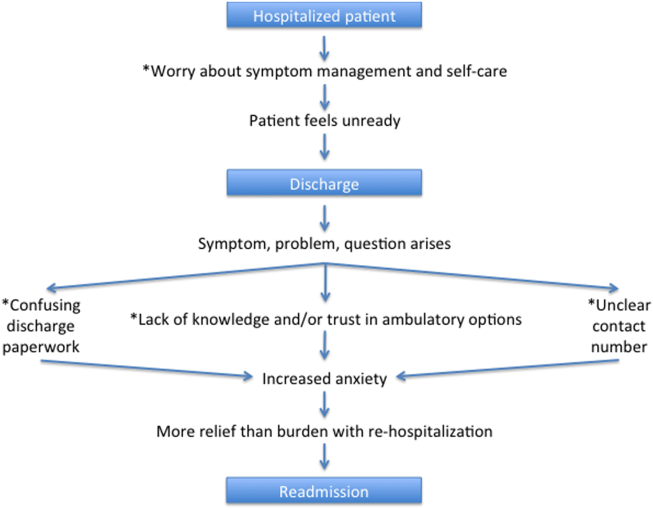
This study's limitations include that it is a single‐institution study focusing on patients admitted to a large academic medical center and its partner community hospital. Only English‐speaking patients were included, and thus our results may not be generalizable to other populations. All patients were interviewed at the time of readmission, potentially introducing recall bias regarding their prior discharge. For example, patients might be more likely to state they were not ready for discharge once they have been readmitted to the hospital. Lastly, because there are only a few prior studies interviewing readmitted patients, our survey instrument was not previously validated. Nevertheless, we believe this study offers a unique view on 30‐day readmissions from the patient perspective, with a focus on identifying areas for quality‐improvement interventions.
In conclusion, this study has enabled us to understand readmissions from a patient‐centered perspective. This perspective helps to challenge provider assumptions and gives much‐needed insight into the patient experience. For example, prior to surveying patients, one might assume that if a patient has a caregiver at home, they are unlikely to have concerns about taking care of themselves. We now know this is not the case. Similarly, we have discovered sections of our discharge paperwork that are confusing. Additionally, this study has revealed that patient attitudes regarding readmission can vary significantly from provider attitudes. By exploring the patient perspective and creating a new transition framework, we have identified specific target areas for interventions that would be meaningful to patients. As the nation continues to strive to identify sustainable solutions to reduce readmissions, the way to redesign care must always start and end with the patient.
Acknowledgements
The authors acknowledge Puneet Rana, James Haggerty‐Skeans, Jae Kim, Rhea Mathew, and Anna Do (UCLA volunteers) for helping to perform the patient interviews. We acknowledge Sandy Berry, MA (Senior Behavioral Scientist at RAND Corporation) for her help in reviewing our patient interview script. Additionally Anna Dermenchyan, RN, BSN (Senior Clinical Quality Specialist in the Department of Medicine at UCLA) provided significant administrative support.
Disclosures: This project was supported by a Patient Experience Grant from the Beryl Institute awarded to Jessica Howard‐Anderson, Sarah Lonowski, Ashley Busuttil, and Nasim Afsar‐manesh. Dr. Howard‐Anderson had full access to all of the data in the study and takes responsibility for the integrity of the data and the accuracy of the data analysis. All coauthors have seen and agree with the contents of the article. The article is not under review by any other publication. An earlier version of this work was written as a research report (not peer reviewed) for the Beryl Institute (available at:
- , . What will it take to move the needle on hospital readmissions? Am J Med Qual. 2013;29(4):357–359.
- , , , , , . Medicare readmission rates showed meaningful decline in 2012. Medicare Medicaid Res Rev. 2013;3(2):E1–E12.
- , , , , . Interventions to reduce 30‐day rehospitalization: a systematic review. Ann Intern Med. 2011;155(8):520–528.
- , , , et al. Preventing 30‐day hospital readmissions: a systematic review and meta‐analysis of randomized trials. JAMA Intern Med. 2014;174(7):1095–1107.
- , , , et al. Relationship between early physician follow‐up and 30‐day readmission among Medicare beneficiaries hospitalized for heart failure. JAMA. 2010;303(17):1716–1722.
- , , , et al. Allocating scarce resources in real‐time to reduce heart failure readmissions: a prospective, controlled study. BMJ Qual Saf. 2013;22(12):998–1005.
- , , , , , . Readmissions in the era of patient engagement. JAMA Intern Med. 2014;174(11):1870–1872.
- , , , et al. Comparing perspectives of patients, caregivers, and clinicians on heart failure management [published online October 23, 2015]. J Card Fail. doi: 10.1016/j.cardfail.2015.10.011.
- , , , . The care transitions intervention: results of a randomized controlled trial. Arch Intern Med. 2006;166(17):1822–1828.
- , , . Understanding rehospitalization risk: can hospital discharge be modified to reduce recurrent hospitalization? J Hosp Med. 2007;2(5):297–304.
- , , . Reasons for readmission in an underserved high‐risk population: a qualitative analysis of a series of inpatient interviews. BMJ Open. 2013;3(9):e003212.
- , , , , , . Improving care transitions: the patient perspective. J Health Commun. 2012;17(suppl 3):312–324.
- , , , et al. Challenges faced by patients with low socioeconomic status during the post‐hospital transition. J Gen Intern Med. 2014;29(2):283–289.
- , , , et al. “Missing pieces”—functional, social, and environmental barriers to recovery for vulnerable older adults transitioning from hospital to home. J Am Geriatr Soc. 2014;62(8):1556–1561.
- , , , , , . Perceptions of readmitted patients on the transition from hospital to home. J Hosp Med. 2012;7(9):709–712.
- , , , et al. Factors contributing to all‐cause 30‐day readmissions: a structured case series across 18 hospitals. Med Care. 2012;50(7):599–605.
- , , . Reasons for readmission in heart failure: perspectives of patients, caregivers, cardiologists, and heart failure nurses. Heart Lung. 2009;38(5):427–434.
- , , , et al. Patient‐identified factors related to heart failure readmissions. Circ Cardiovasc Qual Outcomes. 2013;6(2):171–177.
- , , , , . Early readmission among patients with diabetes: a qualitative assessment of contributing factors. J Diabetes Complications. 2014;28(6):869–873.
- , , , , . “Because I was sick”: seriously ill veterans' perspectives on reason for 30‐day readmissions. J Am Geriatr Soc. 2015;63(3):537–542.
- , , , et al. The impact of patient‐centered care on outcomes. J Fam Pract. 2000;49(9):796–804.
- , , , et al. Patient‐centered communication and diagnostic testing. Ann Fam Med. 2005;3(5):415–421.
- , . Physician communication and patient adherence to treatment: a meta‐analysis. Med Care. 2009;47(8):826–834.
- , , , et al. Closing the loop: physician communication with diabetic patients who have low health literacy. Arch Intern Med. 2003;163(1):83–90.
- , , , , . Patients' participation in medical care: effects on blood sugar control and quality of life in diabetes. J Gen Intern Med. 1988;3(5):448–457.
- , , , , , . Research electronic data capture (REDCap)—a metadata‐driven methodology and workflow process for providing translational research informatics support. J Biomed Inform. 2009;42(2):377–381.
- , , . Public reporting of discharge planning and rates of readmissions. N Engl J Med. 2009;361(27):2637–2645.
- , , , et al. Quality of discharge practices and patient understanding at an academic medical center. JAMA Intern Med. 2013;173(18):1715–1722
- , , , , , . Understanding why patients of low socioeconomic status prefer hospitals over ambulatory care. Health Aff (Millwood). 2013;32(7):1196–1203.
Years into the national discourse on reducing readmissions, hospitals and providers are still struggling with how to sustainably reduce 30‐day readmissions.[1] All‐cause hospital readmission rates for Medicare benificiaries averaged 19% from 2007 through 2011 and showed only a modest improvement to 18.4% in 2012.[2] A review of 43 studies in 2011 concluded that no single intervention was reliably associated with reducing readmission rates.[3] However, although no institution has found a magic bullet for reducing readmissions, progress has been made. A 2014 meta‐analysis of randomized trials aimed at preventing 30‐day readmissions found that overall readmission interventions are effective, and that the most successful interventions are more complex in nature and focus on empowering patients to engage in self‐care after discharge.[4] Readmission reduction efforts for patients with specific diagnoses have also made gains. Among patients with heart failure, for instance, higher rates of early outpatient follow‐up and care‐transition interventions for high‐risk patients have been shown to reduce 30‐day readmissions.[5, 6]
An emerging, yet still underexplored, area in readmissions is the importance of evaluating patient perspectives. The patient has intimate knowledge of the circumstances surrounding their readmission and can be a valuable resource. This is particularly true given evidence that patient perspectives do not always align with those of providers.[7, 8] Coleman's Care Transitions Intervention was one of the earliest care‐transition models demonstrating value in engaging patients to become actively involved in their care.[9] Since then, others have begun to analyze transitions of care from the patient perspective, identifying patient‐reported needs in anticipation of discharge and after they are home.[10, 11, 12, 13, 14] However, still only a few studies have endeavored to gain a thorough understanding of the readmitted patient perspective.[7, 15, 16] These studies have already identified important issues such as lack of patient readiness for discharge and the need for additional advanced care planning and caregiver resources. A few smaller studies have interviewed readmitted patients with specific diagnoses and have also shed light on disease‐specific issues.[17, 18, 19, 20] Outside the field of readmissions, improving patient‐centered communication has been shown to reduce expenditures on diagnostic tests,[21, 22] increase adherence to treatment,[23] and improve health outcomes.[24, 25] It is time for us to incorporate the patient voice into all areas of care.
In 2014, our group published the results of a study aimed at understanding the patient perspective surrounding readmissions. In this study, 27% of patients believed their readmission could have been prevented. This opinion was associated with not feeling ready for discharge, not having a follow‐up appointment scheduled, and poor satisfaction with the discharging team.[7] A key observation in these initial interviews was that patients often expressed sentiments of relief rather than frustration when they returned to the hospital. With the results of this previous study in mind, we designed a more comprehensive evaluation to investigate why patients felt unprepared for discharge, explore reasons for and attitudes surrounding readmissions, and identify patient‐centered interventions that could prevent future readmissions.
METHODS
Study Design and Recruitment
We designed the study as an in‐person survey of readmitted patients. Over a 7‐month period (February 11, 2014September 8, 2014), we identified all patients readmitted within 30 days to general medicine and cardiology services through daily queries from the electronic health record. The study took place in a 540‐bed tertiary academic medical center, as well as a 266‐bed affiliated community hospital. We reviewed the discharge summary from the index admission and the history and physical documentation from the readmission for exclusion criteria. Patients were excluded if they were: (1) readmitted to the intensive care unit, (2) had a planned readmission, (3) received an organ transplant in the preceding 3 months, (4) did not speak English, or (5) had a physical or mental incapacity preventing interview and no family member or caregiver was available to interview.
Patient Interviews
Five trained study volunteers approached all eligible patients for an interview starting the day after the patient was readmitted. Prior to the start of the interview, we obtained verbal consent from all patients. Interviews typically lasted 10 to 30 minutes in the patient's hospital room. Caregivers and/or family members were allowed to respond to interview questions if the patient granted them permission or if the patient was unable to participate. The interviewers were not part of the patient's medical team and the patients could refuse the interview at any time. According to the University of California Los Angeles (UCLA) Institutional Review Board, this work met criteria for quality‐improvement activities and was deemed to be exempt.
The survey was comprised of 24 questions addressing causes, preventability, and attitudes toward readmissions, readiness for discharge, quality of the discharge process, outpatient resources, and follow‐up care (see Supporting Information in the online version of this article). These areas of focus were chosen based on a pilot study of 98 patient interviews in which these topics emerged as worthy of further investigation.[7] With regard to patient readiness for discharge, we investigated correlations between patient readiness and symptom resolution, pain control, discharge location, level of support at home, and concerns about independent self‐care after discharge.
Data Analysis
We administered the surveys, collected and managed the data using REDCap (Research Electronic Data Capture) hosted at UCLA.[26] We collected demographic data, including race, ethnicity, and insurance status retrospectively though automated chart abstraction.
We summarized descriptive characteristics by mean and standard deviation (SD) for continuous variables (except for length of stay, which was summarized by median and range) and by proportions for categorical variables. To compare demographic variables between interviewed participants and those not interviewed (not available, not approached, refused, or excluded) we used Pearson 2 tests and Fisher exact tests for categorical variables and Student t tests for the only continuous variable, age. In evaluating patient readiness for discharge, we divided patients into groups of ready and not ready as determined by interview responses, then performed Pearson 2 tests and Fisher exact tests where appropriate.
For comparing the extent of burden and relief patients endorsed upon being readmitted, we subtracted the burden score (110) from the relief score (110) for each patient, resulting in a net relief score. We then performed a 1‐sample t test to determine whether the net relief was significantly different from 0. A P value of<0.05 was considered to be statistically significant. All statistical analyses were performed using R version 3.0.2 (
RESULTS
Patient Characteristics
Eight hundred nineteen patients were readmitted to general medicine and cardiology services over the 7‐month study period at both institutions. Two hundred thirty‐five patients (29%) were excluded based on the predetermined exclusion criteria, and 105 patients (13%) were not approached for interview due to time constraints. Of the 479 eligible patients approached for interview, 164 patients (34%) could not be interviewed because they were unavailable, and 85 patients (18%) refused. We interviewed 230 patients (48%). We conducted 115 interviews at our academic medical center and 115 at our community affiliate. The only significant demographic difference between interviewed and not‐interviewed patients was race (P=0.004).
Interviewed patients had a mean (SD) age of 63 (SD 20) years, and 45% were male. Sixty‐three percent of interviewees were white, 21% black, 8% Asian, and 8% other. The index admission median length of stay was 4 days, and the average time between admission and readmission was 13 days (Table 1). Seventy‐nine percent of the interviews were performed directly with the patient, and 21% were conducted predominantly with the patient's caregiver.
| Characteristic | Value |
|---|---|
| |
| Age, y, mean (SD) | 62.9 (20.2) |
| Female, n (%) | 127 (55.2) |
| Insurance status, n (%) | |
| Commercial | 36 (16.3) |
| Medi‐Cal/Medicaid | 31 (14.0) |
| Medicare | 123 (55.7) |
| Other | 5 (2.3) |
| UCLA managed care | 26 (11.8) |
| Missing | 9 |
| Race, n (%) | |
| Asian | 18 (7.9) |
| Black or African American | 48 (21.1) |
| Other/refused | 19 (8.3) |
| White or Caucasian | 143 (62.7) |
| Missing | 2 |
| Index length of stay, d, median (maximum, minimum) | 4 (1, 49) |
| Time between discharge and readmission, d, mean (SD) | 13 (9) |
| Discharge location following index admission, n (%) | |
| Home | 202 (88.2) |
| Skilled nursing facility | 3 (1.3) |
| Acute rehab facility | 17 (7.4) |
| Assisted living facility | 2 (0.9) |
| Other | 5 (2.2) |
| Missing | 1 |
Patient Readiness
Twenty‐eight percent of patients reported feeling unready for discharge from their index admission. Patients who felt that their readmission was preventable were significantly more likely to report feeling unready at the time of discharge compared to those who did not classify their readmission as preventable (53% vs 17%, P<0.01). Among patients who did not feel ready for discharge, over two‐thirds felt their symptoms were not adequately resolved. Conversely, among patients who did feel ready for discharge, only 8% felt their symptoms were not resolved (P<0.01). Patients who felt they were not ready for discharge were also significantly more likely to endorse poor pain control (43% vs 7%, P<0.01). The location of discharge (ie, home, rehab facility, or skilled nursing facility) and having someone to help take care of them at home did not significantly correlate with patient readiness. Over 80% of patients in both groups reported having someone to help at home, but patients who felt unready for discharge were significantly more likely to have concerns about taking care of themselves at home (54% vs 25%, P<0.001) (Table 2).
| All Participants, n=230 | Ready, n=164 | Not Ready, n=65 | P Value | |
|---|---|---|---|---|
| Symptoms were resolved enough to leave the hospital, n=227 | 170 (74.9%) | 149 (92.0%) | 21 (32.3%) | <0.01 |
| Felt pain was under control when left the hospital, n=229 | 190 (83.0%) | 153 (93.3%) | 37 (56.9%) | <0.01 |
| Discharged to home following index admission, n=229 | 202 (88.2%) | 146 (89.6%) | 56 (86.2%) | 0.62 |
| If discharged home, had someone at home able to help, n=202 | 178 (88.1%) | 132 (90.4%) | 46 (82.1%) | 0.17 |
| If discharged home, had concerns about being able to take of themselves at home or not being strong enough to go home, n=202 | 67 (33.2%) | 37 (25.3%) | 30 (53.6%) | <0.01 |
| Thought something could have been done to prevent them from coming back to the hospital, n=228 | 75 (32.9%) | 35 (21.6%) | 39 (60.0%) | <0.01 |
Discharge Instructions
Twenty‐nine percent of patients did not recall a physician talking to them about their discharge, and 35% did not remember receiving and reviewing the discharge paperwork. Of those who read the discharge paperwork, 23% noted difficulty identifying contact phone numbers, and 22% could not locate warning symptoms indicating when to seek medical attention. Patients were able to identify medications and follow‐up appointments on the discharge paperwork a majority of the time (92% and 85%, respectively).
Ambulatory Resources and Utilization
Patients were asked about their access to outpatient resources as well as their reason(s) for returning to the hospital. Eighty‐five percent of patients reported having a primary care doctor that they would feel comfortable calling if their symptoms worsened at home. Of the patients who indicated that they were given a contact number by their discharging team, only 56% contacted a doctor before returning to the emergency room. One‐third of patients reported knowing where to obtain urgent or same‐day care besides the emergency room. Among those who did report knowledge of same‐day care centers, 89% still chose not to utilize them.
Attitudes About Readmission
To investigate the patient experience with readmissions, patients were asked to rate the extent of the burden they felt upon returning to the hospital on a scale of 1 to 10, where 1 was no burden and 10 was extreme burden. Patients were also asked to evaluate the extent of relief they felt upon readmission using the same scale. On average, patients rated their sense of relief 1.8 points higher than their sense of burden upon readmission to the hospital (7.7 [SD 2.8] vs 5.9 [SD 3.4], P<0.001). The relief of readmission was rated as equal to or greater than the burden of readmission in 79% of cases. Lastly, patients' mean (SD) overall satisfaction with their medical care was 8.5 (SD 2.0) on a scale of 1 to 10, where 1 was the least satisfied and 10 was the most satisfied a patient could imagine.
DISCUSSION
This study performs a comprehensive evaluation of the patient perspective on 30‐day readmissions. Our previous work indicated that patients associate preventable readmissions with lack of preparedness at the time of discharge.[7] This study further evaluates the basis of this association. We found that nearly 1 in 3 readmitted patients did not feel ready to leave the hospital at the time of initial discharge. Feelings of inadequate symptom resolution and poor pain control appear to be major contributors to this sentiment. Furthermore, although 88% of patients endorse having a caretaker at home, patients with concerns about taking care of themselves are more likely to feel unready at discharge. Presumably, when healthcare providers discharge patients, they believe that the patient is ready to be discharged. However, our findings suggest that often patients do not agree, highlighting a gap between the beliefs of patients and those of healthcare providers. Creating patient‐centered education on symptom management and engaging patients in developing skills for independent self‐care may minimize this gap and allow patients to feel more prepared at discharge. Future research investigating provider opinions and the steps providers take when there is a disagreement over discharge readiness would also be useful.
One way to enhance education at the time of discharge is through improvements in printed discharge instructions. Jha et al. previously showed that chart documentation of providing discharge instructions does not correlate with patients reporting receiving discharge instructions.[27] Our study echoes this finding, with only 65% of the patients remembering receiving and reviewing the discharge paperwork. Horwitz et al. have also previously demonstrated poor comprehension of discharge planning and postdischarge care among patients discharged from an academic medical center.[28] Ensuring that all patients understand and retain their discharge instructions is an essential step in improving the patient experience and potentially decreasing readmissions. Our surveys have illuminated potential shortcomings in our own center's discharge instructions. Interventions aimed at clarifying critical pieces of information on the discharge paperwork, such as warning symptoms, contact phone numbers and follow‐up appointments, could be especially helpful.
After discharge, our findings suggest that only about half of patients will call a physician before returning to the hospital. Furthermore, there is limited knowledge and poor utilization of same‐day treatment centers besides the emergency room. In previous studies, Long et al. found that frequently readmitted patients self‐triage to the emergency room because they believe primary care clinics cannot treat acute illness.[11] Another study concluded that low‐income patients prefer hospital care to ambulatory care because of a greater sense of trust in inpatient care.[29]
Our patients' attitudes about readmission may also be different from those of providers. For patients, coming back to the hospital is not a significant burden, and satisfaction with their medical care remains high despite readmission. Additional research is needed to further explore the complex emotions patients have when coming back to the hospital and why patients may not be as upset with returning to the hospital as providers may expect. Ultimately, if patients continue to feel more comfortable being hospitalized, there are few incentives for patients to stay out of the hospital, and readmission rates will remain elevated.
Based on our survey results we have hypothesized a potential framework for studying readmissions from a patient‐centered approach (Figure 1). This figure is not meant to imply causality, but rather to highlight a potential journey from discharge to readmission for a patient who does not feel ready to go home. This schema principally applies to patients who are worried about symptom management and/or self‐care before discharge and may not apply to everyone. Each asterisk in this framework represents an area where an intervention could be designed to improve the patient experience and possibly reduce readmissions. Such interventions should be centered around increasing patient education about symptom management and self‐care at the time of discharge, improving printed discharge instructions, increasing patient awareness of outpatient resources, enhancing communication after discharge, and changing patients' attitudes about readmissions.
This study's limitations include that it is a single‐institution study focusing on patients admitted to a large academic medical center and its partner community hospital. Only English‐speaking patients were included, and thus our results may not be generalizable to other populations. All patients were interviewed at the time of readmission, potentially introducing recall bias regarding their prior discharge. For example, patients might be more likely to state they were not ready for discharge once they have been readmitted to the hospital. Lastly, because there are only a few prior studies interviewing readmitted patients, our survey instrument was not previously validated. Nevertheless, we believe this study offers a unique view on 30‐day readmissions from the patient perspective, with a focus on identifying areas for quality‐improvement interventions.
In conclusion, this study has enabled us to understand readmissions from a patient‐centered perspective. This perspective helps to challenge provider assumptions and gives much‐needed insight into the patient experience. For example, prior to surveying patients, one might assume that if a patient has a caregiver at home, they are unlikely to have concerns about taking care of themselves. We now know this is not the case. Similarly, we have discovered sections of our discharge paperwork that are confusing. Additionally, this study has revealed that patient attitudes regarding readmission can vary significantly from provider attitudes. By exploring the patient perspective and creating a new transition framework, we have identified specific target areas for interventions that would be meaningful to patients. As the nation continues to strive to identify sustainable solutions to reduce readmissions, the way to redesign care must always start and end with the patient.
Acknowledgements
The authors acknowledge Puneet Rana, James Haggerty‐Skeans, Jae Kim, Rhea Mathew, and Anna Do (UCLA volunteers) for helping to perform the patient interviews. We acknowledge Sandy Berry, MA (Senior Behavioral Scientist at RAND Corporation) for her help in reviewing our patient interview script. Additionally Anna Dermenchyan, RN, BSN (Senior Clinical Quality Specialist in the Department of Medicine at UCLA) provided significant administrative support.
Disclosures: This project was supported by a Patient Experience Grant from the Beryl Institute awarded to Jessica Howard‐Anderson, Sarah Lonowski, Ashley Busuttil, and Nasim Afsar‐manesh. Dr. Howard‐Anderson had full access to all of the data in the study and takes responsibility for the integrity of the data and the accuracy of the data analysis. All coauthors have seen and agree with the contents of the article. The article is not under review by any other publication. An earlier version of this work was written as a research report (not peer reviewed) for the Beryl Institute (available at:
- , . What will it take to move the needle on hospital readmissions? Am J Med Qual. 2013;29(4):357–359.
- , , , , , . Medicare readmission rates showed meaningful decline in 2012. Medicare Medicaid Res Rev. 2013;3(2):E1–E12.
- , , , , . Interventions to reduce 30‐day rehospitalization: a systematic review. Ann Intern Med. 2011;155(8):520–528.
- , , , et al. Preventing 30‐day hospital readmissions: a systematic review and meta‐analysis of randomized trials. JAMA Intern Med. 2014;174(7):1095–1107.
- , , , et al. Relationship between early physician follow‐up and 30‐day readmission among Medicare beneficiaries hospitalized for heart failure. JAMA. 2010;303(17):1716–1722.
- , , , et al. Allocating scarce resources in real‐time to reduce heart failure readmissions: a prospective, controlled study. BMJ Qual Saf. 2013;22(12):998–1005.
- , , , , , . Readmissions in the era of patient engagement. JAMA Intern Med. 2014;174(11):1870–1872.
- , , , et al. Comparing perspectives of patients, caregivers, and clinicians on heart failure management [published online October 23, 2015]. J Card Fail. doi: 10.1016/j.cardfail.2015.10.011.
- , , , . The care transitions intervention: results of a randomized controlled trial. Arch Intern Med. 2006;166(17):1822–1828.
- , , . Understanding rehospitalization risk: can hospital discharge be modified to reduce recurrent hospitalization? J Hosp Med. 2007;2(5):297–304.
- , , . Reasons for readmission in an underserved high‐risk population: a qualitative analysis of a series of inpatient interviews. BMJ Open. 2013;3(9):e003212.
- , , , , , . Improving care transitions: the patient perspective. J Health Commun. 2012;17(suppl 3):312–324.
- , , , et al. Challenges faced by patients with low socioeconomic status during the post‐hospital transition. J Gen Intern Med. 2014;29(2):283–289.
- , , , et al. “Missing pieces”—functional, social, and environmental barriers to recovery for vulnerable older adults transitioning from hospital to home. J Am Geriatr Soc. 2014;62(8):1556–1561.
- , , , , , . Perceptions of readmitted patients on the transition from hospital to home. J Hosp Med. 2012;7(9):709–712.
- , , , et al. Factors contributing to all‐cause 30‐day readmissions: a structured case series across 18 hospitals. Med Care. 2012;50(7):599–605.
- , , . Reasons for readmission in heart failure: perspectives of patients, caregivers, cardiologists, and heart failure nurses. Heart Lung. 2009;38(5):427–434.
- , , , et al. Patient‐identified factors related to heart failure readmissions. Circ Cardiovasc Qual Outcomes. 2013;6(2):171–177.
- , , , , . Early readmission among patients with diabetes: a qualitative assessment of contributing factors. J Diabetes Complications. 2014;28(6):869–873.
- , , , , . “Because I was sick”: seriously ill veterans' perspectives on reason for 30‐day readmissions. J Am Geriatr Soc. 2015;63(3):537–542.
- , , , et al. The impact of patient‐centered care on outcomes. J Fam Pract. 2000;49(9):796–804.
- , , , et al. Patient‐centered communication and diagnostic testing. Ann Fam Med. 2005;3(5):415–421.
- , . Physician communication and patient adherence to treatment: a meta‐analysis. Med Care. 2009;47(8):826–834.
- , , , et al. Closing the loop: physician communication with diabetic patients who have low health literacy. Arch Intern Med. 2003;163(1):83–90.
- , , , , . Patients' participation in medical care: effects on blood sugar control and quality of life in diabetes. J Gen Intern Med. 1988;3(5):448–457.
- , , , , , . Research electronic data capture (REDCap)—a metadata‐driven methodology and workflow process for providing translational research informatics support. J Biomed Inform. 2009;42(2):377–381.
- , , . Public reporting of discharge planning and rates of readmissions. N Engl J Med. 2009;361(27):2637–2645.
- , , , et al. Quality of discharge practices and patient understanding at an academic medical center. JAMA Intern Med. 2013;173(18):1715–1722
- , , , , , . Understanding why patients of low socioeconomic status prefer hospitals over ambulatory care. Health Aff (Millwood). 2013;32(7):1196–1203.
© 2016 Society of Hospital Medicine

Arthroscopic Management of Full-Thickness Rotator Cuff Tears in Major League Baseball Pitchers: The Lateralized Footprint Repair Technique
Rotator cuff injuries can be a source of debilitating pain and dysfunction in athletes at all levels, occasionally precluding return to competitive sport. Overhead athletes place extraordinary physiologic demands on the shoulder, as humeral angular velocities of 7000° to 8000° per second and rotational torques higher than 70 Nm have been measured during the baseball pitch.1 Repetitive supraphysiologic loading of the rotator cuff throughout the coordinated phases of throwing can result in a characteristic spectrum of shoulder pathology in overhead throwers. Several studies have demonstrated partial-thickness articular-sided rotator cuff tears (RCTs) in the area of the posterior supraspinatus and anterior infraspinatus tendons.2-4 Although the precise mechanism remains unclear, plausible explanations for the pathogenesis of these injuries include eccentric tensile and shear forces that lead to tendon failure with repetitive throwing, as well as internal impingement (mechanical impingement of the aforementioned tendons against the posterosuperior glenoid at 90° of shoulder abduction and maximum external rotation).5,6
Whereas partial-thickness articular-sided RCTs have been described in overhead athletes with rotator cuff pathology, full-thickness tears are encountered less often.7,8 Accordingly, there is a paucity of literature on clinical outcomes in professional baseball players with these injuries. To our knowledge, only 2 studies have investigated functional outcomes of open surgical repair of full-thickness tears in this population, and the outcomes have been uniformly poor.8,9
An anatomical description of rotator cuff anatomy has demonstrated a consistent pattern of supraspinatus and infraspinatus tendon insertion relative to the articular surface, biceps groove, and the bare area of the humerus.10 Using gross and microscopic analyses, the authors noted that the supraspinatus tendon inserted immediately adjacent to the articular margin, and the infraspinatus and teres minor tapered laterally away from the margin to form the bare area. Detailed knowledge of the insertional anatomy of the rotator cuff is important, as surgical repair should recreate the broad footprint to restore normal biomechanics and increase the surface area available for healing.11,12 Medial advancement of the rotator cuff insertion during surgical repair can have deleterious biomechanical effects on glenohumeral motion.11
Given the unfavorable results found after routine open repair of full-thickness tears, we altered our approach to these injuries and adopted an arthroscopic technique in which the tendon is repaired immediately lateral to the anatomical footprint. Research studies have demonstrated that chronic stress from repetitive throwing can lead to attenuation of soft-tissue restraints, and we think preservation of these adaptive changes after surgical repair may be important for these athletes to maintain extraordinary glenohumeral rotation and achieve high throwing velocities.13 We conducted a study to describe the lateralized repair technique for full-thickness RCTs and to report functional outcomes in Major League Baseball (MLB) pitchers treated with this procedure at minimum 2-year follow-up. We hypothesized that use of this novel technique would result in a higher rate of return to preinjury level of play in comparison with open rotator cuff repair in comparable cohorts, as reported in other studies.8,9
Materials and Methods
After obtaining Institutional Review Board approval for this study, we performed a retrospective chart review of MLB players treated by Dr. Altchek. We identified all professional baseball players who received a diagnosis of full-thickness RCT after preoperative magnetic resonance imaging with subsequent confirmation during surgery. Any patient who underwent arthroscopic repair using the lateralized footprint technique was included in the study. Demographic and preoperative injury information was collected from the chart, and final follow-up data were collected at the last available clinic visit. From available team records, we also obtained return-to-play data and objective pitching statistics: seasons played, games played, innings pitched, strikeouts per 9 innings, walks per 9 innings, and earned run average.
Surgical Technique
We routinely perform arthroscopic rotator cuff repairs with the patient under regional anesthesia in the beach-chair position. The operative extremity is placed in a Spider Limb Positioner (Smith & Nephew) to facilitate easy manipulation of the arm throughout the procedure. A standard posterior portal is established, and then an anterior portal is placed in the superolateral aspect of the rotator interval directly anterior to the leading edge of the supraspinatus tendon. A lateral portal created 2 to 3 cm distal to the anterolateral margin of the acromion may be used as an additional working portal. A thorough diagnostic arthroscopy is performed to evaluate the glenohumeral joint for any concomitant intra-articular pathology. Particular attention is directed to inspection of the superior labrum, biceps tendon, and capsuloligamentous structures, as injuries to these structures are often associated with rotator cuff pathology in overhead athletes.
Once presence of an RCT is confirmed, a thorough subacromial bursectomy is performed to help with visualization and inspection of the injury. The tissue is provisionally grasped and mobilized to measure the amount of available tendon excursion. In this unique population, the vast majority of injuries are diagnosed in an expeditious manner, thereby precluding the presence of significant retraction, poor tissue quality, and inadequate mobilization of the tendons. The greater tuberosity is identified, and the area immediately adjacent to the articular margin is abraded with a mechanical shaver to enhance healing potential. For supraspinatus tears, an anchor is placed immediately lateral to the articular margin in the region of the anterior attachment of the rotator cable (Figure 1). The posterior anchor is placed about 10 to 15 mm lateral to the articular margin to reattach the infraspinatus tendon (Figure 2). When the medial row sutures are tied down, anatomical placement of these anchors effectively re-creates the bare area described by Curtis and colleagues10 (Figure 3). In most cases, the medial row sutures are left intact and fixed laterally with a knotless anchor to provide a transosseous equivalent (double-row) repair.
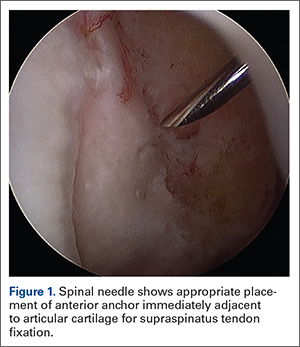
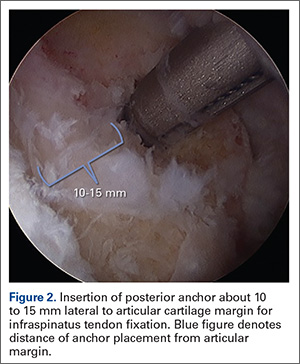
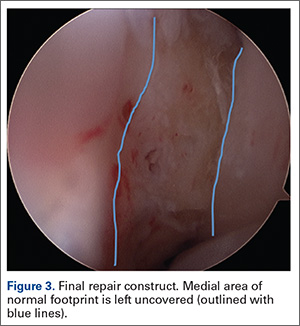
Results
We identified 6 MLB pitchers who underwent arthroscopic rotator cuff repair using the aforementioned technique over an 8-year period. Each patient presented with complaints of debilitating shoulder pain and decreased pitching performance, including loss of throwing accuracy and velocity. There were 4 right-hand–dominant pitchers and 2 left-hand–dominant pitchers; rotator cuff pathology was observed in the dominant pitching arm in each case. Three players were classified as starting pitchers; the other 3 pitched in a relief role. Mean age of all pitchers at time of surgery was 29.8 years (range, 25-37 years). According to records, 2 patients (33%) underwent previous rotator cuff débridement for partial-thickness RCTs before surgical intervention at our institution. Operative information on the depth of the partial-thickness tears observed during the previous procedures was not available for review. At time of rotator cuff repair, 3 patients (50%) underwent concomitant procedures, including superior labrum anterior-posterior (SLAP) lesion repair (1 patient) and posterior labrum débridement (2 patients). A double-row fixation construct was achieved in each case. Review of operative records revealed a mean tear size of 2.1 cm (range, 1.5-3.0 cm) measured anterior to posterior, and all tears involved the supraspinatus and/or infraspinatus tendons. Postoperative rehabilitation included immobilization in a sling for 4 weeks. Hand, wrist, and elbow range-of-motion (ROM) exercises were started immediately to help reduce inflammation. Passive ROM exercises in the plane of the scapula were begun 4 weeks after surgery. Isometric scapular stabilization exercises were also incorporated at that time. Active-assisted ROM exercises were started at about 6 weeks, and isometric strengthening exercises were started at week 8 with progression to eccentric strengthening and weight training at about 3 months. Most pitchers were allowed to begin an interval throwing program at 24 weeks. There were no significant differences in the therapy programs for pitchers who underwent concomitant labral procedures, but the patient who underwent SLAP repair was limited to 30° of external rotation and 90° of forward flexion, with avoidance of active biceps contractions, for the first 6 weeks of rehabilitation.
By mean follow-up of 66.7 months (range, 23.2-94.6 months), 5 pitchers (83%) returned to their preinjury level of competition for at least 1 full season. One player pitched at Minor League Class AA level for about 1 season but was forced to retire because of persistent symptoms related to the shoulder. This pitcher underwent simultaneous rotator cuff and SLAP lesion repair. Of the 5 pitchers who resumed MLB play, none returned to their preoperative pitching productivity; mean number of innings pitched decreased from 1806.5 to 183.7. Three (60%) of these 5 pitchers experienced a slight reduction in performance as measured by earned run average. Interestingly, both players over age 30 years at time of surgery, versus 3 of the 4 pitchers under age 30 years, returned to their preoperative level of competition for at least 1 season. The Table summarizes MLB player data and objective pitching statistics. There were no perioperative complications related to this arthroscopic technique, and there were no glenohumeral ROM deficits at final follow-up.
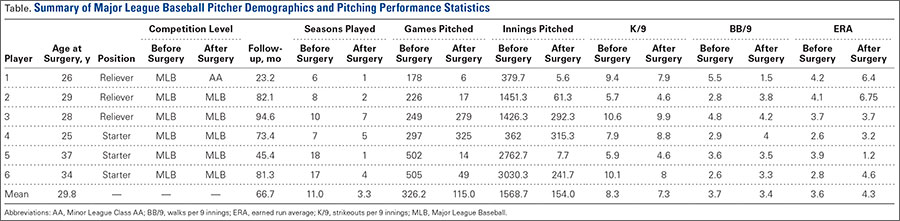
Discussion
Although the incidence of full-thickness RCTs in professional baseball players is presumably low, available studies suggest that it is a debilitating injury with a poor prognosis for return to high-level athletics. Mazoué and Andrews9 reviewed the outcomes of 16 professional baseball players (12 pitchers, 4 position players) who underwent mini-open repair of full-thickness RCTs that involved more than 90% of the rotator cuff. Fifteen patients underwent mini-open rotator cuff repair using suture anchors in the anatomical footprint along with bone tunnels established near the lateral margin of the greater tuberosity to create a 2-level anatomical repair. One patient was treated with a mini-open repair using suture anchors in the greater tuberosity with a side-side repair of a longitudinal split within the rotator cuff. In the evaluation of outcomes by player position, only 1 pitcher (8%) returned to a competitive level of pitching at a mean follow-up of 67 months. On review of 2 position players with a full-thickness RCT in the dominant shoulder, only 1 (50%) returned to Major League play at a mean follow-up of 62.5 months. The remaining 2 position players underwent surgical repair of the nondominant shoulder, and, not surprisingly, both returned to their previous level of athletic activity without any difficulty. These results should be examined carefully, as the associated pathology in this high-demand cohort should not be discounted. Eleven (almost 92%) of the 12 pitchers had undergone at least 1 previous procedure on the shoulder. Furthermore, at time of full-thickness rotator cuff repair, 9 (75%) of the 12 pitchers were treated for concomitant intra-articular pathology, including SLAP tears, capsular attenuation, and/or labral fraying. In our study, 50% of pitchers underwent an associated labral procedure. Although labral débridement did not have a significant effect on return to play, the 1 pitcher who underwent SLAP repair was not able to return to preinjury level of play.
Tibone and colleagues8 reviewed postoperative outcomes in 45 athletes with rotator cuff pathology. Within their series, 5 professional baseball pitchers with full-thickness tears were treated with open subacromial decompression and rotator cuff repair. Two baseball pitchers with RCTs larger than 2 cm underwent open transosseous footprint repair in which the cuff was reinserted using bone tunnels created within the greater tuberosity. At long-term follow-up, only 2 (40%) of the 5 pitchers returned to competitive pitching. Interestingly, both pitchers who underwent transosseous footprint fixation were unable to return to professional baseball.
Overhead athletes require a delicate balance of shoulder mobility and stability to meet the high functional demands of their sports. Significant debate continues as to whether innate alterations in glenohumeral mobility preselect individuals for overhead sports, or if these changes are acquired through adaptations in supporting soft-tissue and osseous structures. Sethi and colleagues14 used an instrumented manual laxity examination to compare anterior-posterior laxity in asymptomatic professional and Division I college baseball players. The authors noted asymmetric anterior-posterior translation (>3 mm) between the throwing shoulder and the nondominant shoulder in 12 (60%) of 20 professional pitchers and 10 (59%) of 17 college pitchers. Although the authors did not correlate translational differences with corresponding shoulder pathology, the observed asymmetry supported the idea that these athletes may experience adaptive glenohumeral changes with repetitive throwing. The association between adaptive changes and shoulder biomechanics has been studied. Burkhart and Lo15 used a cadaveric model to describe the cam effect of the proximal humerus and the biomechanical consequences of a relative reduction in this effect after pathologic changes within the glenohumeral joint (constriction of posteroinferior capsule). They noted that a posterosuperior shift in the glenohumeral contact point in the throwing position can result in anterior capsular redundancy that may contribute to microinstability of the shoulder. This relative laxity increases external rotation, resulting in increased torsional and shear forces at the rotator cuff insertion.16 Ultimately, these abnormal forces may predispose overhead athletes to rotator cuff injury.
Given the available literature, it is clear that full-thickness RCTs are potentially career-ending injuries for professional baseball players. The question arises as to why the results are so poor. Ultimately, the high incidence of concomitant intra-articular pathology associated with full-thickness RCTs underscores the severity of soft-tissue damage sustained with repetitive overhead throwing. Mazoué and Andrews9 proposed the presence of associated labral and capsular pathology as a potential explanation for poor outcomes of surgical repair. Given the myriad of additional pathology observed in each patient, it is difficult to ascertain the precise impact of these injuries on postoperative outcome. However, early diagnosis and aggressive surgical intervention are clearly necessary to prevent accumulative injury. Regarding surgical intervention, both Tibone and colleagues8 and Mazoué and Andrews9 reported use of an open surgical repair technique in which the tendon was repaired to the anatomical footprint. Certainly, the benefits of an all-arthroscopic technique include optimal visualization of the RCT, less perioperative morbidity, and minimal soft-tissue injury. With our arthroscopic technique, the rotator cuff was fixed immediately lateral to the anatomical footprint, thereby leaving the medial aspect of the footprint uncovered. Functionally, the goal of this procedure is to restore the integrity of the rotator cuff without compromising glenohumeral mobility acquired through soft-tissue adaptation. Investigation of the insertional anatomy of the rotator cuff has demonstrated that the supraspinatus tendon inserts about 0.9 mm from the edge of the articular surface, and the infraspinatus insertional footprint tapers away from the articular surface to form the bare area as it extends inferiorly on the greater tuberosity.10 We think preexisting adaptations in glenohumeral anatomy are important for peak performance in this unique population, and even small alterations in the repair location can have deleterious effects on throwing mechanics. Lateralized repair of the cuff precludes potential medialization of the cuff insertion and may facilitate preservation of soft-tissue adaptations that these athletes rely on to achieve extraordinary glenohumeral motion.
Interestingly, with this technique we noted a higher rate of return to MLB play in pitchers over age 30 years. Although several individual factors (eg, player talent level, work ethics, compliance with rehabilitation) may play a role in this finding, it is possible that older, more mature patients may be more willing to assume diminished roles to continue to play. Jones and colleagues17 recently reported similar findings in older MLB pitchers after revision ulnar collateral ligament reconstruction.
This study had several limitations. First, the patient cohort was small (a result of the nature and relatively infrequent incidence of the clinical problem). Second, clinical information was collected retrospectively, which limited our ability to determine precise differences between preoperative and postoperative glenohumeral ROM with this technique. Third, the cohort included patients who demonstrated additional intra-articular (labral) pathology. Although associated pathology is common in this high-demand athletic population, it is clear that advanced pathology (eg, SLAP tears) may affect clinical outcomes, as in our study. Despite these limitations, our study is the largest review of professional baseball players treated for full-thickness rotator cuff injuries with an arthroscopic technique. Overall, the results of this study are promising and call for further clinical and biomechanical evaluation.
Conclusion
Surgical management of rotator cuff injuries in professional baseball players remains an extremely difficult problem. Current studies of full-thickness RCTs highlight these athletes’ poor functional outcomes. These unfavorable results prompted us to alter our surgical technique. Initial outcomes have been encouraging, and extended follow-up in this cohort of patients will provide a more definitive assessment of the success of this technique.
1. Dillman CJ, Fleisig GS, Andrews JR. Biomechanics of pitching with emphasis upon shoulder kinematics. J Orthop Sports Phys Ther. 1993;18(2):402-408.
2. Andrews JR, Broussard TS, Carson WG. Arthroscopy of the shoulder in the management of partial tears of the rotator cuff: a preliminary report. Arthroscopy. 1985;1(2):117-122.
3. Paley KJ, Jobe FW, Pink MM, Kvitne RS, ElAttrache NS. Arthroscopic findings in the overhead throwing athlete: evidence for posterior internal impingement of the rotator cuff. Arthroscopy. 2000;16(1):35-40.
4. Nakagawa S, Yoneda M, Hayashida K, Wakitani S, Okamura K. Greater tuberosity notch: an important indicator of articular-side partial rotator cuff tears in the shoulders of throwing athletes. Am J Sports Med. 2001;29(6):762-770.
5. Walch G, Boileau P, Noel E, Donell ST. Impingement of the deep surface of the supraspinatus tendon on the posterosuperior glenoid rim: an arthroscopic study. J Shoulder Elbow Surg. 1992;1(5):238-245.
6. Halbrecht JL, Tirman P, Atkin D. Internal impingement of the shoulder: comparison of findings between the throwing and nonthrowing shoulders of college baseball players. Arthroscopy. 1999;15(3):253-258.
7. Reynolds SB, Dugas JR, Cain EL, McMichael CS, Andrews JR. Debridement of small partial-thickness rotator cuff tears in elite overhead throwers. Clin Orthop Relat Res. 2008;466(3):614-621.
8. Tibone JE, Elrod B, Jobe FW, et al. Surgical treatment of tears of the rotator cuff in athletes. J Bone Joint Surg Am. 1986;68(6):887-891.
9. Mazoué C, Andrews JR. Repair of full-thickness rotator cuff tears in professional baseball players. Am J Sports Med. 2006;34():182-189.
10. Curtis AS, Burbank KM, Tierney JJ, Scheller AD, Curran AR. The insertional footprint of the rotator cuff: an anatomic study. Arthroscopy. 2006;22(6):603-609.
11. Liu J, Hughes RE, O’Driscoll SW, An K. Biomechanical effect of medial advancement of the supraspinatus tendon. J Bone Joint Surg Am. 1998;80(6):853-859.
12. Lo IK, Burkhart SS. Double row arthroscopic rotator cuff repair: re-establishing the footprint of the rotator cuff. Arthroscopy. 2003;19(9):1035-1042.
13. Borsa PA, Laudner KG, Sauers EL. Mobility and stability adaptations in the shoulder of the overhead athlete: a theoretical and evidence-based perspective. Sports Med. 2008;38(1):17-36.
14. Sethi PM, Tibone JE, Lee TQ. Quantitative assessment of glenohumeral translation in baseball players: a comparison of pitchers versus nonpitching athletes. Am J Sports Med. 2004;32(7):1711-1715.
15. Burkhart SS, Lo IK. The cam effect of the proximal humerus: its role in the production of relative capsular redundancy of the shoulder. Arthroscopy. 2007;23(3):241-246.
16. Burkhart SS, Morgan CD, Kibler WB. The disabled throwing shoulder: spectrum of pathology. Part I: pathoanatomy and biomechanics. Arthroscopy. 2003;19(4):404-420.
17. Jones KJ, Conte S, Patterson N, ElAttrache NS, Dines JS. Functional outcomes following revision ulnar collateral ligament reconstruction in Major League Baseball pitchers. J Shoulder Elbow Surg. 2013;22(5):642-646.
Rotator cuff injuries can be a source of debilitating pain and dysfunction in athletes at all levels, occasionally precluding return to competitive sport. Overhead athletes place extraordinary physiologic demands on the shoulder, as humeral angular velocities of 7000° to 8000° per second and rotational torques higher than 70 Nm have been measured during the baseball pitch.1 Repetitive supraphysiologic loading of the rotator cuff throughout the coordinated phases of throwing can result in a characteristic spectrum of shoulder pathology in overhead throwers. Several studies have demonstrated partial-thickness articular-sided rotator cuff tears (RCTs) in the area of the posterior supraspinatus and anterior infraspinatus tendons.2-4 Although the precise mechanism remains unclear, plausible explanations for the pathogenesis of these injuries include eccentric tensile and shear forces that lead to tendon failure with repetitive throwing, as well as internal impingement (mechanical impingement of the aforementioned tendons against the posterosuperior glenoid at 90° of shoulder abduction and maximum external rotation).5,6
Whereas partial-thickness articular-sided RCTs have been described in overhead athletes with rotator cuff pathology, full-thickness tears are encountered less often.7,8 Accordingly, there is a paucity of literature on clinical outcomes in professional baseball players with these injuries. To our knowledge, only 2 studies have investigated functional outcomes of open surgical repair of full-thickness tears in this population, and the outcomes have been uniformly poor.8,9
An anatomical description of rotator cuff anatomy has demonstrated a consistent pattern of supraspinatus and infraspinatus tendon insertion relative to the articular surface, biceps groove, and the bare area of the humerus.10 Using gross and microscopic analyses, the authors noted that the supraspinatus tendon inserted immediately adjacent to the articular margin, and the infraspinatus and teres minor tapered laterally away from the margin to form the bare area. Detailed knowledge of the insertional anatomy of the rotator cuff is important, as surgical repair should recreate the broad footprint to restore normal biomechanics and increase the surface area available for healing.11,12 Medial advancement of the rotator cuff insertion during surgical repair can have deleterious biomechanical effects on glenohumeral motion.11
Given the unfavorable results found after routine open repair of full-thickness tears, we altered our approach to these injuries and adopted an arthroscopic technique in which the tendon is repaired immediately lateral to the anatomical footprint. Research studies have demonstrated that chronic stress from repetitive throwing can lead to attenuation of soft-tissue restraints, and we think preservation of these adaptive changes after surgical repair may be important for these athletes to maintain extraordinary glenohumeral rotation and achieve high throwing velocities.13 We conducted a study to describe the lateralized repair technique for full-thickness RCTs and to report functional outcomes in Major League Baseball (MLB) pitchers treated with this procedure at minimum 2-year follow-up. We hypothesized that use of this novel technique would result in a higher rate of return to preinjury level of play in comparison with open rotator cuff repair in comparable cohorts, as reported in other studies.8,9
Materials and Methods
After obtaining Institutional Review Board approval for this study, we performed a retrospective chart review of MLB players treated by Dr. Altchek. We identified all professional baseball players who received a diagnosis of full-thickness RCT after preoperative magnetic resonance imaging with subsequent confirmation during surgery. Any patient who underwent arthroscopic repair using the lateralized footprint technique was included in the study. Demographic and preoperative injury information was collected from the chart, and final follow-up data were collected at the last available clinic visit. From available team records, we also obtained return-to-play data and objective pitching statistics: seasons played, games played, innings pitched, strikeouts per 9 innings, walks per 9 innings, and earned run average.
Surgical Technique
We routinely perform arthroscopic rotator cuff repairs with the patient under regional anesthesia in the beach-chair position. The operative extremity is placed in a Spider Limb Positioner (Smith & Nephew) to facilitate easy manipulation of the arm throughout the procedure. A standard posterior portal is established, and then an anterior portal is placed in the superolateral aspect of the rotator interval directly anterior to the leading edge of the supraspinatus tendon. A lateral portal created 2 to 3 cm distal to the anterolateral margin of the acromion may be used as an additional working portal. A thorough diagnostic arthroscopy is performed to evaluate the glenohumeral joint for any concomitant intra-articular pathology. Particular attention is directed to inspection of the superior labrum, biceps tendon, and capsuloligamentous structures, as injuries to these structures are often associated with rotator cuff pathology in overhead athletes.
Once presence of an RCT is confirmed, a thorough subacromial bursectomy is performed to help with visualization and inspection of the injury. The tissue is provisionally grasped and mobilized to measure the amount of available tendon excursion. In this unique population, the vast majority of injuries are diagnosed in an expeditious manner, thereby precluding the presence of significant retraction, poor tissue quality, and inadequate mobilization of the tendons. The greater tuberosity is identified, and the area immediately adjacent to the articular margin is abraded with a mechanical shaver to enhance healing potential. For supraspinatus tears, an anchor is placed immediately lateral to the articular margin in the region of the anterior attachment of the rotator cable (Figure 1). The posterior anchor is placed about 10 to 15 mm lateral to the articular margin to reattach the infraspinatus tendon (Figure 2). When the medial row sutures are tied down, anatomical placement of these anchors effectively re-creates the bare area described by Curtis and colleagues10 (Figure 3). In most cases, the medial row sutures are left intact and fixed laterally with a knotless anchor to provide a transosseous equivalent (double-row) repair.
Results
We identified 6 MLB pitchers who underwent arthroscopic rotator cuff repair using the aforementioned technique over an 8-year period. Each patient presented with complaints of debilitating shoulder pain and decreased pitching performance, including loss of throwing accuracy and velocity. There were 4 right-hand–dominant pitchers and 2 left-hand–dominant pitchers; rotator cuff pathology was observed in the dominant pitching arm in each case. Three players were classified as starting pitchers; the other 3 pitched in a relief role. Mean age of all pitchers at time of surgery was 29.8 years (range, 25-37 years). According to records, 2 patients (33%) underwent previous rotator cuff débridement for partial-thickness RCTs before surgical intervention at our institution. Operative information on the depth of the partial-thickness tears observed during the previous procedures was not available for review. At time of rotator cuff repair, 3 patients (50%) underwent concomitant procedures, including superior labrum anterior-posterior (SLAP) lesion repair (1 patient) and posterior labrum débridement (2 patients). A double-row fixation construct was achieved in each case. Review of operative records revealed a mean tear size of 2.1 cm (range, 1.5-3.0 cm) measured anterior to posterior, and all tears involved the supraspinatus and/or infraspinatus tendons. Postoperative rehabilitation included immobilization in a sling for 4 weeks. Hand, wrist, and elbow range-of-motion (ROM) exercises were started immediately to help reduce inflammation. Passive ROM exercises in the plane of the scapula were begun 4 weeks after surgery. Isometric scapular stabilization exercises were also incorporated at that time. Active-assisted ROM exercises were started at about 6 weeks, and isometric strengthening exercises were started at week 8 with progression to eccentric strengthening and weight training at about 3 months. Most pitchers were allowed to begin an interval throwing program at 24 weeks. There were no significant differences in the therapy programs for pitchers who underwent concomitant labral procedures, but the patient who underwent SLAP repair was limited to 30° of external rotation and 90° of forward flexion, with avoidance of active biceps contractions, for the first 6 weeks of rehabilitation.
By mean follow-up of 66.7 months (range, 23.2-94.6 months), 5 pitchers (83%) returned to their preinjury level of competition for at least 1 full season. One player pitched at Minor League Class AA level for about 1 season but was forced to retire because of persistent symptoms related to the shoulder. This pitcher underwent simultaneous rotator cuff and SLAP lesion repair. Of the 5 pitchers who resumed MLB play, none returned to their preoperative pitching productivity; mean number of innings pitched decreased from 1806.5 to 183.7. Three (60%) of these 5 pitchers experienced a slight reduction in performance as measured by earned run average. Interestingly, both players over age 30 years at time of surgery, versus 3 of the 4 pitchers under age 30 years, returned to their preoperative level of competition for at least 1 season. The Table summarizes MLB player data and objective pitching statistics. There were no perioperative complications related to this arthroscopic technique, and there were no glenohumeral ROM deficits at final follow-up.
Discussion
Although the incidence of full-thickness RCTs in professional baseball players is presumably low, available studies suggest that it is a debilitating injury with a poor prognosis for return to high-level athletics. Mazoué and Andrews9 reviewed the outcomes of 16 professional baseball players (12 pitchers, 4 position players) who underwent mini-open repair of full-thickness RCTs that involved more than 90% of the rotator cuff. Fifteen patients underwent mini-open rotator cuff repair using suture anchors in the anatomical footprint along with bone tunnels established near the lateral margin of the greater tuberosity to create a 2-level anatomical repair. One patient was treated with a mini-open repair using suture anchors in the greater tuberosity with a side-side repair of a longitudinal split within the rotator cuff. In the evaluation of outcomes by player position, only 1 pitcher (8%) returned to a competitive level of pitching at a mean follow-up of 67 months. On review of 2 position players with a full-thickness RCT in the dominant shoulder, only 1 (50%) returned to Major League play at a mean follow-up of 62.5 months. The remaining 2 position players underwent surgical repair of the nondominant shoulder, and, not surprisingly, both returned to their previous level of athletic activity without any difficulty. These results should be examined carefully, as the associated pathology in this high-demand cohort should not be discounted. Eleven (almost 92%) of the 12 pitchers had undergone at least 1 previous procedure on the shoulder. Furthermore, at time of full-thickness rotator cuff repair, 9 (75%) of the 12 pitchers were treated for concomitant intra-articular pathology, including SLAP tears, capsular attenuation, and/or labral fraying. In our study, 50% of pitchers underwent an associated labral procedure. Although labral débridement did not have a significant effect on return to play, the 1 pitcher who underwent SLAP repair was not able to return to preinjury level of play.
Tibone and colleagues8 reviewed postoperative outcomes in 45 athletes with rotator cuff pathology. Within their series, 5 professional baseball pitchers with full-thickness tears were treated with open subacromial decompression and rotator cuff repair. Two baseball pitchers with RCTs larger than 2 cm underwent open transosseous footprint repair in which the cuff was reinserted using bone tunnels created within the greater tuberosity. At long-term follow-up, only 2 (40%) of the 5 pitchers returned to competitive pitching. Interestingly, both pitchers who underwent transosseous footprint fixation were unable to return to professional baseball.
Overhead athletes require a delicate balance of shoulder mobility and stability to meet the high functional demands of their sports. Significant debate continues as to whether innate alterations in glenohumeral mobility preselect individuals for overhead sports, or if these changes are acquired through adaptations in supporting soft-tissue and osseous structures. Sethi and colleagues14 used an instrumented manual laxity examination to compare anterior-posterior laxity in asymptomatic professional and Division I college baseball players. The authors noted asymmetric anterior-posterior translation (>3 mm) between the throwing shoulder and the nondominant shoulder in 12 (60%) of 20 professional pitchers and 10 (59%) of 17 college pitchers. Although the authors did not correlate translational differences with corresponding shoulder pathology, the observed asymmetry supported the idea that these athletes may experience adaptive glenohumeral changes with repetitive throwing. The association between adaptive changes and shoulder biomechanics has been studied. Burkhart and Lo15 used a cadaveric model to describe the cam effect of the proximal humerus and the biomechanical consequences of a relative reduction in this effect after pathologic changes within the glenohumeral joint (constriction of posteroinferior capsule). They noted that a posterosuperior shift in the glenohumeral contact point in the throwing position can result in anterior capsular redundancy that may contribute to microinstability of the shoulder. This relative laxity increases external rotation, resulting in increased torsional and shear forces at the rotator cuff insertion.16 Ultimately, these abnormal forces may predispose overhead athletes to rotator cuff injury.
Given the available literature, it is clear that full-thickness RCTs are potentially career-ending injuries for professional baseball players. The question arises as to why the results are so poor. Ultimately, the high incidence of concomitant intra-articular pathology associated with full-thickness RCTs underscores the severity of soft-tissue damage sustained with repetitive overhead throwing. Mazoué and Andrews9 proposed the presence of associated labral and capsular pathology as a potential explanation for poor outcomes of surgical repair. Given the myriad of additional pathology observed in each patient, it is difficult to ascertain the precise impact of these injuries on postoperative outcome. However, early diagnosis and aggressive surgical intervention are clearly necessary to prevent accumulative injury. Regarding surgical intervention, both Tibone and colleagues8 and Mazoué and Andrews9 reported use of an open surgical repair technique in which the tendon was repaired to the anatomical footprint. Certainly, the benefits of an all-arthroscopic technique include optimal visualization of the RCT, less perioperative morbidity, and minimal soft-tissue injury. With our arthroscopic technique, the rotator cuff was fixed immediately lateral to the anatomical footprint, thereby leaving the medial aspect of the footprint uncovered. Functionally, the goal of this procedure is to restore the integrity of the rotator cuff without compromising glenohumeral mobility acquired through soft-tissue adaptation. Investigation of the insertional anatomy of the rotator cuff has demonstrated that the supraspinatus tendon inserts about 0.9 mm from the edge of the articular surface, and the infraspinatus insertional footprint tapers away from the articular surface to form the bare area as it extends inferiorly on the greater tuberosity.10 We think preexisting adaptations in glenohumeral anatomy are important for peak performance in this unique population, and even small alterations in the repair location can have deleterious effects on throwing mechanics. Lateralized repair of the cuff precludes potential medialization of the cuff insertion and may facilitate preservation of soft-tissue adaptations that these athletes rely on to achieve extraordinary glenohumeral motion.
Interestingly, with this technique we noted a higher rate of return to MLB play in pitchers over age 30 years. Although several individual factors (eg, player talent level, work ethics, compliance with rehabilitation) may play a role in this finding, it is possible that older, more mature patients may be more willing to assume diminished roles to continue to play. Jones and colleagues17 recently reported similar findings in older MLB pitchers after revision ulnar collateral ligament reconstruction.
This study had several limitations. First, the patient cohort was small (a result of the nature and relatively infrequent incidence of the clinical problem). Second, clinical information was collected retrospectively, which limited our ability to determine precise differences between preoperative and postoperative glenohumeral ROM with this technique. Third, the cohort included patients who demonstrated additional intra-articular (labral) pathology. Although associated pathology is common in this high-demand athletic population, it is clear that advanced pathology (eg, SLAP tears) may affect clinical outcomes, as in our study. Despite these limitations, our study is the largest review of professional baseball players treated for full-thickness rotator cuff injuries with an arthroscopic technique. Overall, the results of this study are promising and call for further clinical and biomechanical evaluation.
Conclusion
Surgical management of rotator cuff injuries in professional baseball players remains an extremely difficult problem. Current studies of full-thickness RCTs highlight these athletes’ poor functional outcomes. These unfavorable results prompted us to alter our surgical technique. Initial outcomes have been encouraging, and extended follow-up in this cohort of patients will provide a more definitive assessment of the success of this technique.
1. Dillman CJ, Fleisig GS, Andrews JR. Biomechanics of pitching with emphasis upon shoulder kinematics. J Orthop Sports Phys Ther. 1993;18(2):402-408.
2. Andrews JR, Broussard TS, Carson WG. Arthroscopy of the shoulder in the management of partial tears of the rotator cuff: a preliminary report. Arthroscopy. 1985;1(2):117-122.
3. Paley KJ, Jobe FW, Pink MM, Kvitne RS, ElAttrache NS. Arthroscopic findings in the overhead throwing athlete: evidence for posterior internal impingement of the rotator cuff. Arthroscopy. 2000;16(1):35-40.
4. Nakagawa S, Yoneda M, Hayashida K, Wakitani S, Okamura K. Greater tuberosity notch: an important indicator of articular-side partial rotator cuff tears in the shoulders of throwing athletes. Am J Sports Med. 2001;29(6):762-770.
5. Walch G, Boileau P, Noel E, Donell ST. Impingement of the deep surface of the supraspinatus tendon on the posterosuperior glenoid rim: an arthroscopic study. J Shoulder Elbow Surg. 1992;1(5):238-245.
6. Halbrecht JL, Tirman P, Atkin D. Internal impingement of the shoulder: comparison of findings between the throwing and nonthrowing shoulders of college baseball players. Arthroscopy. 1999;15(3):253-258.
7. Reynolds SB, Dugas JR, Cain EL, McMichael CS, Andrews JR. Debridement of small partial-thickness rotator cuff tears in elite overhead throwers. Clin Orthop Relat Res. 2008;466(3):614-621.
8. Tibone JE, Elrod B, Jobe FW, et al. Surgical treatment of tears of the rotator cuff in athletes. J Bone Joint Surg Am. 1986;68(6):887-891.
9. Mazoué C, Andrews JR. Repair of full-thickness rotator cuff tears in professional baseball players. Am J Sports Med. 2006;34():182-189.
10. Curtis AS, Burbank KM, Tierney JJ, Scheller AD, Curran AR. The insertional footprint of the rotator cuff: an anatomic study. Arthroscopy. 2006;22(6):603-609.
11. Liu J, Hughes RE, O’Driscoll SW, An K. Biomechanical effect of medial advancement of the supraspinatus tendon. J Bone Joint Surg Am. 1998;80(6):853-859.
12. Lo IK, Burkhart SS. Double row arthroscopic rotator cuff repair: re-establishing the footprint of the rotator cuff. Arthroscopy. 2003;19(9):1035-1042.
13. Borsa PA, Laudner KG, Sauers EL. Mobility and stability adaptations in the shoulder of the overhead athlete: a theoretical and evidence-based perspective. Sports Med. 2008;38(1):17-36.
14. Sethi PM, Tibone JE, Lee TQ. Quantitative assessment of glenohumeral translation in baseball players: a comparison of pitchers versus nonpitching athletes. Am J Sports Med. 2004;32(7):1711-1715.
15. Burkhart SS, Lo IK. The cam effect of the proximal humerus: its role in the production of relative capsular redundancy of the shoulder. Arthroscopy. 2007;23(3):241-246.
16. Burkhart SS, Morgan CD, Kibler WB. The disabled throwing shoulder: spectrum of pathology. Part I: pathoanatomy and biomechanics. Arthroscopy. 2003;19(4):404-420.
17. Jones KJ, Conte S, Patterson N, ElAttrache NS, Dines JS. Functional outcomes following revision ulnar collateral ligament reconstruction in Major League Baseball pitchers. J Shoulder Elbow Surg. 2013;22(5):642-646.
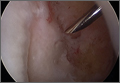
Ulnar Collateral Ligament Repair: An Old Idea With a New Wrinkle
Repair of the ulnar collateral ligament (UCL) was first reported by Norwood and colleagues1 in a group of athletes who sustained acute UCL ruptures. Of the 4 athletes in their cohort who underwent direct UCL repair, none were noted to have any residual instability 2 years after the surgery. However, none of these 4 were overhead throwing athletes. Jobe and colleagues2 first published Jobe’s technique of UCL reconstruction in 1986, but it was Conway and colleagus’3 1992 publication describing Jobe’s experience with UCL injury and surgical treatment in throwing athletes that set the early standard for management in that population. Since those landmark studies, there has been a tremendous increase in attention to this near-epidemic clinical problem.
Although these studies were the first to describe the surgical procedure that is now often referred to as “Tommy John surgery,” named after Jobe’s initial patient in 1974, Conway and colleagues3 also reported on Jobe’s early experience with UCL repair. In fact, of the 70 patients reported in the Conway and colleagues’3 article, 14 were treated with repair of the ligament. Only 7 of the 14 (50%) of those who underwent UCL repair were able to return to the same level of play, and only 2 of the 7 (29%) of Major League Baseball (MLB) players who underwent UCL repair were able to return to competition at the MLB level. This compared very poorly with the nearly 75% rate of return to competition in patients who underwent UCL reconstructions in the same cohort. In Azar and colleagues’4 2000 report on Dr. James Andrews’ experience with UCL injury and treatment in male college and professional baseball players, UCL repair again did poorly when compared to UCL reconstruction, with only 5 of the 8 (63%) of UCL repair patients returning to the same level of play compared to 41 of the 51 (81%) of UCL reconstructions using a modification of Jobe’s original technique.
Since the mid-1990s, numerous new techniques have been described and shown to have acceptable and largely successful outcomes in treating UCL injuries.5-9 All of them involve placing or anchoring a spanning piece of tendon graft from the native origin on the medial epicondyle of the humerus to the native insertion on the sublime tubercle of the ulna. These palpable and visible anatomic landmarks are important to the UCL surgeon due to the need to place the graft or repair the torn ligament tissue to its normal anatomic origin and/or insertion.10 Regardless of whether the graft is sewn, docked, tunneled, or anchored, these types of procedures have demonstrated rates of return to competition at the same or higher level of play in the 75% to 92% range.3,4,7,11-13 In the largest published series of 1281 UCL reconstructions by Cain and colleagues7 at American Sports Medicine Institute (Birmingham, AL), the rate of return to play at the same or higher level was 84%, with the average time to return to play of 11.4 months. On the basis of these robust clinical studies and numerous basic science studies demonstrating essentially equivalent strength and function among reconstruction techniques, UCL reconstruction now enjoys an acceptance among clinicians, athletes, athletic trainers, coaches, and team management at all levels of overhead sports.
In comparison to UCL reconstruction, relatively little has been published on UCL repair since 2000. Certainly this is in part due to the success of its clinical descendant. UCL repair did not appear on the pages of peer-reviewed literature until 2006, when Argo and colleagues11 published a report on the outcome of 17 UCL repairs in female athletes using a variety of techniques, including plication, anchor-to-bone, and drill holes. Although there was only 1 pitcher in the group, 16 of the 17 (94%) returned to the same or higher level of competition at an average of only 3 months after surgery.11
Savoie and colleagues13 followed this in 2008 with a report on 60 UCL repairs in overhead athletes. Of the 51 patients in this study in which the ligament was repaired to bone using suture anchors, 93% returned to the same or higher level of play at an average of only 6 months after surgery. Including Jobe’s original group, there have been less than 100 patients ever reported to have had a UCL repair performed. In comparison to the thousands of UCL reconstructions that have been reported over the last 20 years, it is not surprising that UCL repair has not gained great popularity among surgeons and patients. It is also important to remember that suture and anchor technology has come a long way since the 1970s, and our overall knowledge of the injury and its treatments and rehabilitation have grown tremendously since that time.
A New Technique for UCL Repair
Since we began data collection in Birmingham, Alabama in the mid 1990s, our practice has successfully treated thousands of overhead athletes of all types with the modified Jobe technique of UCL reconstruction, using either a palmaris longus tendon or a gracilis tendon graft.7 Until August 2013, this technique was exclusively utilized regardless of the amount and location of pathology encountered at the time of surgery. The range of pathology, from partial undersurface tearing to complete disruption of the ligament tissue, was treated by placing a graft at the anatomic insertion points of the native ligament. While the success of this experience cannot be overlooked, we also realized that we were treating a broad spectrum of pathology and injury with the same operation.
Recognizing the valuable contributions of earlier authors who had attempted UCL repair previously, we asked whether we were doing too much of an operation for all of the various pathology we saw at the time of surgery, and whether the availability of modern anchor and suture technology, vast clinical experience with these injuries and their outcomes, and even biologic additives could be applied to some of these patients in order to achieve an equal or superior outcome in less time. In particular, could such a technique be applied to the ever-increasing number of younger athletes with less pathology, who more frequently suffer end-avulsions and partial tears of their UCL?
These thoughts, along with Savoie and colleagues’13 experience with UCL repair using suture anchors, led us to create a construct that could be used to not only repair the torn native UCL tissue to bone, but also span the anatomic native ligament from its origin to its insertion. The construct includes an ultra-strong collagen coated tape (FiberTape, Arthrex) attached at the anatomic insertions of the ligament using two 3.5-mm nonabsorbable PEEK corkscrew anchors (SwiveLock, Arthrex), and a suture through the eyelet of one of the anchors (Figure 1). Using this construct, the native ligament disruption can be repaired directly to bone using the suture through the eyelet of the anchor, and the remainder of the native ligament is augmented with the spanning biologic enhanced tape (Figures 2A-2C). The construct is created by placing one end of the tape through the eyelet of the first anchor, and then placing one end of a No. zero braided permanent suture through the same eyelet. Both ends of the tape are then placed through the eyelet of the second anchor. The first anchor is inserted into a hole drilled at the apex of the insertion of the torn end of the native ligament. This anchor is placed first in order to allow for direct repair of the native torn ligament using the free suture through the eyelet of the first anchor. The second hole is then drilled at the insertion of the native ligament on the uninjured end of the native ligament. In order to accommodate the volume of tape in the hole created for the second anchor, a slightly oversized drill and tap were created specifically for this technique (Arthrex).
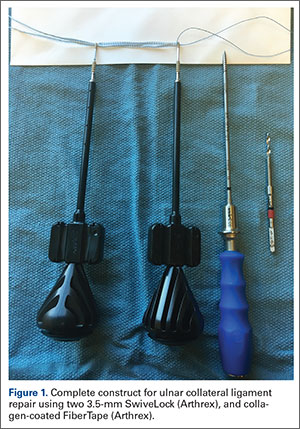
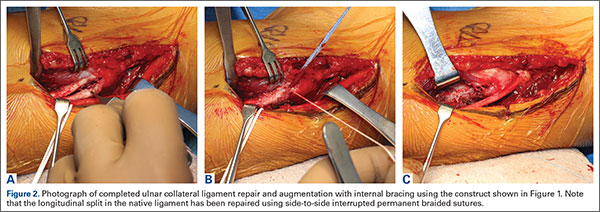
Before attempting this in vivo, a cadaveric study was carried out in order to ensure that the time-zero function of the construct would be at least as good as the standard UCL reconstruction technique we have used for several decades.14 The time-zero gap formation under valgus load was less for the repair/augmentation than for the standard reconstruction with palmaris longus, and the ultimate failure strength of the repair was the same as in the reconstruction group, with all failures through bone in the cadaveric specimens. No anchors pulled out of bone, and the tape did not tear in any specimen.
This basic science study has given us confidence to proceed with the use of this technique in patients. The first patient was treated with this construct in August 2013. The outcomes of our first series of patients were presented on Saturday, March 5 at American Orthopaedic Society for Sports Medicine Specialty Day during the 2016 American Academy of Orthopaedic Surgeons annual meeting in Orlando, FL.
We do not feel that this technique is adequate for the treatment of the UCL that has sustained attritional injury and contains poor quality native ligament tissue. Before we do these procedures, we always discuss with the patient the possibility that full reconstruction may be required, and that the decision to proceed with UCL repair is contingent upon the quality and quantity of the native UCL tissue present at the time of surgery. If the quality of the native tissue is poor (chronic degenerative changes, etc), full reconstruction with autograft tendon is recommended. It is our hope that this technique will afford the UCL surgeon another option for treating end-avulsions and partial thickness injuries, with a more rapid and successful return to normal function and competition.
1. Norwood LA, Shook JA, Andrews JR. Acute medial elbow ruptures. Am J Sports Med. 1981;9(1):16-19.
2. Jobe FW, Stark H, Lombardo SJ. Reconstruction of the ulnar collateral ligament in athletes. J Bone Joint Surg Am. 1986;68(8):1158-1163.
3. Conway JE, Jobe FW, Glousman RE, Pink M. Medial instability of the elbow in throwing athletes: treatment by repair or reconstruction of the ulnar collateral ligament. J Bone Joint Surg Am. 1992;74(1):67-83.
4. Azar FM, Andrews JR, Wilk KE, Groh D. Operative treatment of ulnar collateral ligament injuries of the elbow in athletes. Am J Sports Med. 2000;28(1):16-23.
5. Ahmad CS, Lee TQ, ElAttrache NS. Biomechanical evaluation of a new ulnar collateral ligament reconstruction technique with interference screw fixation. Am J Sports Med. 2003;31(3):332-337.
6. Armstrong AD, Dunning CE, Ferreira LM, Faber KJ, Johnson JA, King GJ. A biomechanical comparison of four reconstruction techniques for the medial collateral ligament-deficient elbow. J Shoulder Elbow Surg. 2005;14(2):207-215.
7. Cain EL, Andrews JR, Dugas JR, et al. Outcome of ulnar collateral ligament reconstruction of the elbow in 1281 athletes: results in 743 athletes with minimum 2-year follow-up. Am J Sports Med. 2010;38(12):2426-2434.
8. Paletta GA, Klepps SJ, Difelice GS, et al. Biomechanical evaluation of 2 techniques for ulnar collateral ligament reconstruction of the elbow. Am J Sports Med. 2006;34(10):1599-1603.
9. Ruland RT, Hogan CJH, Randall CJ, Richards A, Belkoff SM. Biomechanical comparison of ulnar collateral ligament reconstruction techniques. Am J Sports Med. 2008;36(8):1565-1570.
10. Dugas JR, Ostrander RV, Cain EL, Kingsley D, Andrews JR. Anatomy of the anterior bundle of the ulnar collateral ligament. J Shoulder Elbow Surg. 2007;16(5):657-660.
11. Argo D, Trenhaile SW, Savoie FH, Field LD. Operative treatment of ulnar collateral ligament insufficiency of the elbow in female athletes. Am J Sports Med. 2006;34(3):431-437.
12. Petty DH, Andrews JR, Fleisig GS, Cain EL. Ulnar collateral ligament reconstruction in high school baseball players: clinical results and injury risk factors. Am J Sports Med. 2003;32(5):1158-1164.
13. Savoie FH, Trenhaile SW, Roberts J, Field LD, Ramsey JR. Primary repair of ulnar collateral ligament injuries of the elbow in young athletes: a case series of injuries to the proximal and distal ends of the ligament. Am J Sports Med. 2008;36(6):1066-1072.
14. Dugas JR, Walters BL, Beason DP, Fleisig GS, Chronister JE. Biomechanical comparison of ulnar collateral ligament repair with internal bracing versus modified Jobe reconstruction. Am J Sports Med. 2015. [Epub ahead of print].
Repair of the ulnar collateral ligament (UCL) was first reported by Norwood and colleagues1 in a group of athletes who sustained acute UCL ruptures. Of the 4 athletes in their cohort who underwent direct UCL repair, none were noted to have any residual instability 2 years after the surgery. However, none of these 4 were overhead throwing athletes. Jobe and colleagues2 first published Jobe’s technique of UCL reconstruction in 1986, but it was Conway and colleagus’3 1992 publication describing Jobe’s experience with UCL injury and surgical treatment in throwing athletes that set the early standard for management in that population. Since those landmark studies, there has been a tremendous increase in attention to this near-epidemic clinical problem.
Although these studies were the first to describe the surgical procedure that is now often referred to as “Tommy John surgery,” named after Jobe’s initial patient in 1974, Conway and colleagues3 also reported on Jobe’s early experience with UCL repair. In fact, of the 70 patients reported in the Conway and colleagues’3 article, 14 were treated with repair of the ligament. Only 7 of the 14 (50%) of those who underwent UCL repair were able to return to the same level of play, and only 2 of the 7 (29%) of Major League Baseball (MLB) players who underwent UCL repair were able to return to competition at the MLB level. This compared very poorly with the nearly 75% rate of return to competition in patients who underwent UCL reconstructions in the same cohort. In Azar and colleagues’4 2000 report on Dr. James Andrews’ experience with UCL injury and treatment in male college and professional baseball players, UCL repair again did poorly when compared to UCL reconstruction, with only 5 of the 8 (63%) of UCL repair patients returning to the same level of play compared to 41 of the 51 (81%) of UCL reconstructions using a modification of Jobe’s original technique.
Since the mid-1990s, numerous new techniques have been described and shown to have acceptable and largely successful outcomes in treating UCL injuries.5-9 All of them involve placing or anchoring a spanning piece of tendon graft from the native origin on the medial epicondyle of the humerus to the native insertion on the sublime tubercle of the ulna. These palpable and visible anatomic landmarks are important to the UCL surgeon due to the need to place the graft or repair the torn ligament tissue to its normal anatomic origin and/or insertion.10 Regardless of whether the graft is sewn, docked, tunneled, or anchored, these types of procedures have demonstrated rates of return to competition at the same or higher level of play in the 75% to 92% range.3,4,7,11-13 In the largest published series of 1281 UCL reconstructions by Cain and colleagues7 at American Sports Medicine Institute (Birmingham, AL), the rate of return to play at the same or higher level was 84%, with the average time to return to play of 11.4 months. On the basis of these robust clinical studies and numerous basic science studies demonstrating essentially equivalent strength and function among reconstruction techniques, UCL reconstruction now enjoys an acceptance among clinicians, athletes, athletic trainers, coaches, and team management at all levels of overhead sports.
In comparison to UCL reconstruction, relatively little has been published on UCL repair since 2000. Certainly this is in part due to the success of its clinical descendant. UCL repair did not appear on the pages of peer-reviewed literature until 2006, when Argo and colleagues11 published a report on the outcome of 17 UCL repairs in female athletes using a variety of techniques, including plication, anchor-to-bone, and drill holes. Although there was only 1 pitcher in the group, 16 of the 17 (94%) returned to the same or higher level of competition at an average of only 3 months after surgery.11
Savoie and colleagues13 followed this in 2008 with a report on 60 UCL repairs in overhead athletes. Of the 51 patients in this study in which the ligament was repaired to bone using suture anchors, 93% returned to the same or higher level of play at an average of only 6 months after surgery. Including Jobe’s original group, there have been less than 100 patients ever reported to have had a UCL repair performed. In comparison to the thousands of UCL reconstructions that have been reported over the last 20 years, it is not surprising that UCL repair has not gained great popularity among surgeons and patients. It is also important to remember that suture and anchor technology has come a long way since the 1970s, and our overall knowledge of the injury and its treatments and rehabilitation have grown tremendously since that time.
A New Technique for UCL Repair
Since we began data collection in Birmingham, Alabama in the mid 1990s, our practice has successfully treated thousands of overhead athletes of all types with the modified Jobe technique of UCL reconstruction, using either a palmaris longus tendon or a gracilis tendon graft.7 Until August 2013, this technique was exclusively utilized regardless of the amount and location of pathology encountered at the time of surgery. The range of pathology, from partial undersurface tearing to complete disruption of the ligament tissue, was treated by placing a graft at the anatomic insertion points of the native ligament. While the success of this experience cannot be overlooked, we also realized that we were treating a broad spectrum of pathology and injury with the same operation.
Recognizing the valuable contributions of earlier authors who had attempted UCL repair previously, we asked whether we were doing too much of an operation for all of the various pathology we saw at the time of surgery, and whether the availability of modern anchor and suture technology, vast clinical experience with these injuries and their outcomes, and even biologic additives could be applied to some of these patients in order to achieve an equal or superior outcome in less time. In particular, could such a technique be applied to the ever-increasing number of younger athletes with less pathology, who more frequently suffer end-avulsions and partial tears of their UCL?
These thoughts, along with Savoie and colleagues’13 experience with UCL repair using suture anchors, led us to create a construct that could be used to not only repair the torn native UCL tissue to bone, but also span the anatomic native ligament from its origin to its insertion. The construct includes an ultra-strong collagen coated tape (FiberTape, Arthrex) attached at the anatomic insertions of the ligament using two 3.5-mm nonabsorbable PEEK corkscrew anchors (SwiveLock, Arthrex), and a suture through the eyelet of one of the anchors (Figure 1). Using this construct, the native ligament disruption can be repaired directly to bone using the suture through the eyelet of the anchor, and the remainder of the native ligament is augmented with the spanning biologic enhanced tape (Figures 2A-2C). The construct is created by placing one end of the tape through the eyelet of the first anchor, and then placing one end of a No. zero braided permanent suture through the same eyelet. Both ends of the tape are then placed through the eyelet of the second anchor. The first anchor is inserted into a hole drilled at the apex of the insertion of the torn end of the native ligament. This anchor is placed first in order to allow for direct repair of the native torn ligament using the free suture through the eyelet of the first anchor. The second hole is then drilled at the insertion of the native ligament on the uninjured end of the native ligament. In order to accommodate the volume of tape in the hole created for the second anchor, a slightly oversized drill and tap were created specifically for this technique (Arthrex).
Before attempting this in vivo, a cadaveric study was carried out in order to ensure that the time-zero function of the construct would be at least as good as the standard UCL reconstruction technique we have used for several decades.14 The time-zero gap formation under valgus load was less for the repair/augmentation than for the standard reconstruction with palmaris longus, and the ultimate failure strength of the repair was the same as in the reconstruction group, with all failures through bone in the cadaveric specimens. No anchors pulled out of bone, and the tape did not tear in any specimen.
This basic science study has given us confidence to proceed with the use of this technique in patients. The first patient was treated with this construct in August 2013. The outcomes of our first series of patients were presented on Saturday, March 5 at American Orthopaedic Society for Sports Medicine Specialty Day during the 2016 American Academy of Orthopaedic Surgeons annual meeting in Orlando, FL.
We do not feel that this technique is adequate for the treatment of the UCL that has sustained attritional injury and contains poor quality native ligament tissue. Before we do these procedures, we always discuss with the patient the possibility that full reconstruction may be required, and that the decision to proceed with UCL repair is contingent upon the quality and quantity of the native UCL tissue present at the time of surgery. If the quality of the native tissue is poor (chronic degenerative changes, etc), full reconstruction with autograft tendon is recommended. It is our hope that this technique will afford the UCL surgeon another option for treating end-avulsions and partial thickness injuries, with a more rapid and successful return to normal function and competition.
1. Norwood LA, Shook JA, Andrews JR. Acute medial elbow ruptures. Am J Sports Med. 1981;9(1):16-19.
2. Jobe FW, Stark H, Lombardo SJ. Reconstruction of the ulnar collateral ligament in athletes. J Bone Joint Surg Am. 1986;68(8):1158-1163.
3. Conway JE, Jobe FW, Glousman RE, Pink M. Medial instability of the elbow in throwing athletes: treatment by repair or reconstruction of the ulnar collateral ligament. J Bone Joint Surg Am. 1992;74(1):67-83.
4. Azar FM, Andrews JR, Wilk KE, Groh D. Operative treatment of ulnar collateral ligament injuries of the elbow in athletes. Am J Sports Med. 2000;28(1):16-23.
5. Ahmad CS, Lee TQ, ElAttrache NS. Biomechanical evaluation of a new ulnar collateral ligament reconstruction technique with interference screw fixation. Am J Sports Med. 2003;31(3):332-337.
6. Armstrong AD, Dunning CE, Ferreira LM, Faber KJ, Johnson JA, King GJ. A biomechanical comparison of four reconstruction techniques for the medial collateral ligament-deficient elbow. J Shoulder Elbow Surg. 2005;14(2):207-215.
7. Cain EL, Andrews JR, Dugas JR, et al. Outcome of ulnar collateral ligament reconstruction of the elbow in 1281 athletes: results in 743 athletes with minimum 2-year follow-up. Am J Sports Med. 2010;38(12):2426-2434.
8. Paletta GA, Klepps SJ, Difelice GS, et al. Biomechanical evaluation of 2 techniques for ulnar collateral ligament reconstruction of the elbow. Am J Sports Med. 2006;34(10):1599-1603.
9. Ruland RT, Hogan CJH, Randall CJ, Richards A, Belkoff SM. Biomechanical comparison of ulnar collateral ligament reconstruction techniques. Am J Sports Med. 2008;36(8):1565-1570.
10. Dugas JR, Ostrander RV, Cain EL, Kingsley D, Andrews JR. Anatomy of the anterior bundle of the ulnar collateral ligament. J Shoulder Elbow Surg. 2007;16(5):657-660.
11. Argo D, Trenhaile SW, Savoie FH, Field LD. Operative treatment of ulnar collateral ligament insufficiency of the elbow in female athletes. Am J Sports Med. 2006;34(3):431-437.
12. Petty DH, Andrews JR, Fleisig GS, Cain EL. Ulnar collateral ligament reconstruction in high school baseball players: clinical results and injury risk factors. Am J Sports Med. 2003;32(5):1158-1164.
13. Savoie FH, Trenhaile SW, Roberts J, Field LD, Ramsey JR. Primary repair of ulnar collateral ligament injuries of the elbow in young athletes: a case series of injuries to the proximal and distal ends of the ligament. Am J Sports Med. 2008;36(6):1066-1072.
14. Dugas JR, Walters BL, Beason DP, Fleisig GS, Chronister JE. Biomechanical comparison of ulnar collateral ligament repair with internal bracing versus modified Jobe reconstruction. Am J Sports Med. 2015. [Epub ahead of print].
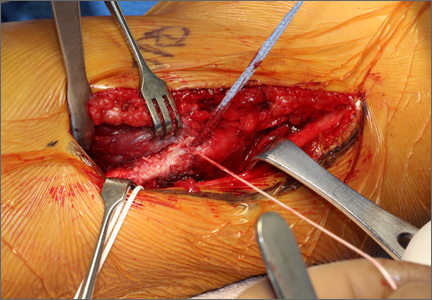
The Epidemiology of Hip and Groin Injuries in Professional Baseball Players
Injuries around the hip and groin occurring in professional baseball players can present as muscle strains, avulsions, contusions, hip subluxations or dislocations, femoroacetabular impingement (FAI) causing labral tears or chondral defects, and athletic pubalgia.1-9 Several recent articles have reported on the epidemiology of musculoskeletal injuries in Major League Baseball (MLB) players4,8,10 but with little attention to injuries to the hip and groin, likely because prior studies show only a 6.3% overall incidence for these injuries, much less than the more commonly discussed shoulder or elbow injuries.8 Despite the lower proportion of hip and groin injuries overall, these injuries lead to a relatively long period of disability for the players and often have a high rate of recurrence.4,8,9
The important contribution of hip mechanics and the surrounding muscular function in the kinetic chain during overhead athletic activities, such as a tennis serve or throwing, has recently been discussed.11,12 In sports requiring overhead activities, trunk rotation is a key component to generating force, and hip internal and external rotation is necessary for this trunk rotation to occur.12,13 Alterations in hip morphology causing constrained motion, as seen in FAI, may predispose an overhead throwing athlete to intra-articular injury such as labral tears or chondral injuries, or to a compensatory movement pattern causing an extra-articular soft tissue injury about the hip.12 Decreased hip range of motion may also lead to increased forces across the upper extremity during the throwing motion, which puts the shoulder and elbow at increased risk of injury.12
Increased awareness of hip and groin injuries, advances in diagnostic imaging, and an understanding of the relationship between the throwing motion in baseball and hip mechanics have improved our ability to appropriately identify and treat athletes with injuries of the hip and groin. Several studies on hip and groin injuries in elite athletes treated both operatively and nonoperatively have reported a high rate of return to sport.3,7,14-19 A systematic review on return to sport following hip arthroscopy for intra-articular pathology associated with FAI showed a 95% return to sport rate and a 92% rate of return to pre-injury level of play in a subgroup of professional athletes in 9 studies.20
Despite the large body of literature on upper extremity injuries, there is no study specifically focusing on the epidemiology of hip and groin injuries in MLB or Minor League Baseball (MiLB) players. The incidence of all injuries in professional baseball players has steadily increased over the last 2 decades,8 and the reported incidence of hip and groin injuries will likely increase as well. The current incidence of this injury, the positions most at risk, the mechanism of injury, and the time to return to sport are important to understand given the large number of players who participate in baseball not only at a professional level, but also at an amateur level, where this information may also be applicable. This information could improve our efforts at prevention and rehabilitation of these injuries, and can guide efforts to counsel and train players at high risk of a hip or groin injury. To address this gap in the literature, the purpose of this study was to describe the epidemiology of hip and groin injuries in MLB and MiLB players from 2011 to 2014.
Materials and Methods
Population and Sample
US MLB is comprised of the major and minor leagues. The major leagues are divided into 30 clubs, with 25 active players, for a total of 750 active players. Each club has a 40-man roster consisting of 25 active players and up to 15 additional players who are either not active or optioned to the minor leagues. The minor leagues are comprised of a network of over 200 clubs that are each affiliated with a major league club, and organized by geography and level of play. The minor leagues consist of roughly 7500 players, of whom about 6500 are actively playing at any given time. The entire population of players in the MLB who sustained a hip or groin injury over the study period was eligible for this study.
Data
The MLB’s Health and Injury Tracking System (HITS) is a centralized database that contains the de-identified medical data from the electronic medical record (EMR) system. Data on all injuries are entered into the EMR by each team’s certified athletic trainer. An injury is defined as any physical complaint sustained by a player that affects or limits participation in any aspect of baseball-related activity (eg, game, practice, warm-up, conditioning, weight training). The data extracted from HITS only relates to injuries that resulted in lost game time for a player and that occurred during spring training, regular season, or postseason play; off-season injuries were not included. Injury events that were classified as “season-ending” were not included in the analysis of assessing days missed because many of these players may not have been cleared to play until the beginning of the following season. For each injury, data were collected on the diagnosis, body part, activity, location, and date of injury.
Materials and Methods
Hip and groin injuries were defined as cases having a body region variable classified as “hip/groin” or a Sports Medicine Diagnostic Coding System (SMDCS) that included any “adductor” or “hernia” or “hip pointer” labels. Cases categorized as inguinal and femoral hernia (n = 26) and testicular contusions (n = 87) were excluded. Characteristics about each hip and groin injury were also extracted from HITS. These variables included level of play, player position (activity at the time of injury), field location, injury mechanism, chronicity of the injury, and days missed. Chronicity of the injury was documented as acute, overuse, or undetermined. For level of play, the injury event was categorized as the league in which the game was played when the injury occurred. Players were excluded if they had an unknown level of play or were in the amateur league. The injuries of the hip and groin were further classified as intra-articular and extra-articular. Treatment for each injury was characterized as surgical or nonsurgical, and correlated with days missed for each type of injury.
Statistical Analysis
Data for the 2011-2014 seasons were combined, and results presented for all players and separately for MiLB and MLB. Frequencies and comparative analyses for hip and groin injuries were performed across the aforementioned injury characteristics. The distribution of days missed for the variables considered was often skewed to the right, even after excluding the season-ending injuries; hence, the mean days missed was often larger than the median days missed. Reporting the median would allow for a robust estimate of the expected number of days missed, but would down weight those instances when hip and groin injuries result in much longer missed days, as reflected by the mean. Because of the importance of the days missed measure for professional baseball, both the mean and median are presented. Chi-square tests were used to test the hypothesis of equal proportions between the various categories of hip and groin characteristics, with statistical significance determined at the P = .05 level.
In order to estimate exposure, the average number of players per team per game was calculated based on analysis of regular season game participation via box scores that are publicly available. This average number over a season, multiplied by the number of team games at each professional level of baseball, was used as an estimate of athlete exposures in order to provide rates comparable to those of other injury surveillance systems. Injury rates were reported as injuries per 1000 athlete-exposures (AE) for those hip and groin injuries that occurred during the regular season. It should be noted that the number of regular season hip and groin injuries and the subsequent AE rates are based on injuries that were deemed work-related during the regular season. This does not necessarily only include injuries occurring during the course of a game, but injuries in game preparation as well. Due to the variations in spring training games and fluctuating rosters, an exposure rate could not be calculated for spring training hip and groin injuries.
Data analysis was performed in the R statistical computing Environment (R Core Team 2014). Study procedures were approved by the Johns Hopkins Bloomberg School of Public Health Institutional Review Board.
Results
Overall Summary
A total of 1823 hip and groin injuries occurred from 2011-2014, with 83% occurring in MiLB and 17% occurring in MLB (Table 1). There were 1146 acute injuries, 252 overuse injuries, and 425 injuries of undetermined chronicity. The average age of players experiencing a hip and groin injury in MiLB was 22.9 years compared to 29.7 years in MLB. Of the 1514 hip and groin injuries in MiLB, 76 (5.0%) required surgery and of the 309 hip and groin injuries in MLB, 24 (7.8%) required surgery. Compared to league-wide injury events, hip and groin injuries ranked 6th highest in prevalence in MiLB and 8th highest in prevalence in MLB, accounting for 5.4% and 5.6%, respectively, of the 28,116 MiLB and 5507 MLB injury events that occurred between 2011-2014.
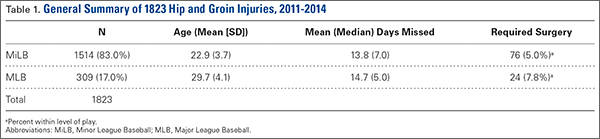
For regular season games, it was estimated that there were 1,197,738 MiLB and 276,608 MLB AE from 2011-2014. The overall hip and groin rate across both MLB and MiLB was 1.2 per 1000 AE, based on the 238 and 1152 regular season hip and groin injuries in MLB and MiLB, respectively. The rate of hip and groin injury was 1.5 times more likely in MiLB than in MLB (P < .0001) (rate of 1.26 per 1000 AE in MiLB and 0.86 per 1000 AE in MLB).
Characteristics of Injuries
Injury activity was based on the position being played at the time of injury, with categories of infield and outfield corresponding to fielding activities (defense), with batting and base runner categories corresponding to activities while on offense (Table 2). The occurrence of hip and groin injuries while players are fielding on defense (MiLB 33.0%, MLB 37.2%, all players 33.8%) was significantly greater compared to injuries while batting and base running on offense (MiLB 24.9%, MLB 21.7%, all players 24.3%) (all P values < .001). There was a high percentage of missing data for the event position variable, which resulted from this field not being available in HITS for 2011. Time lost due to hip and groin injuries was similar across leagues with respect to injury activity, ranging on average between 8 and 18 days.
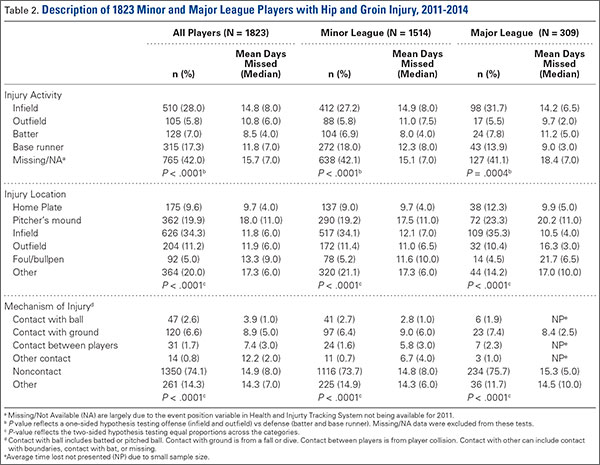
There were statistically significant differences for MiLB and MLB separately, and combined, in the number of hip and groin injuries by field location (all P values < .0001) (Table 2). For MiLB, MLB, and across both leagues, by injury location, the majority of hip and groin injuries occurred in the infield (MiLB 34.1%, MLB 35.3%, all players 34.3%). As a single location, the pitcher’s mound accounted for a large proportion of hip and groin injuries (MiLB 19.2%, MLB 23.3%, all players 19.9%). Time lost due to hip and groin injuries was similar across leagues with respect to field location, ranging on average between about 10 and 22 days. Among all players, injuries on the pitcher’s mound resulted in the largest mean days missed after injury.
There were statistically significant differences across the mechanisms of injury for MiLB and MLB, as well as both leagues combined (all P values < .0001) (Table 2). The majority of hip and groin injuries were noncontact-related (MiLB 73.7%, MLB 75.7%, all players 74.1%) compared to those resulting from some form of contact (MiLB 11.4%, MLB 12.6%, all players 11.7%) or other mechanisms. Time lost across these mechanisms varied, ranging on average between 4 and 15 days with noncontact-related hip and groin injuries resulting in the largest time lost.
Surgery
The 1823 hip and groin injuries across both leagues were further classified using the SMDCS descriptions as intra-articular (N = 84) or extra-articular (N = 1739) (Table 3). A much larger percentage of hip and groin injuries were extra-articular (MiLB 95.6%, MLB 94.4%, all players 95.4%) compared to those classified as intra-articular (Table 3). The most common extra-articular injuries were strains or contusions of the adductor, iliopsoas, or gluteal muscles, making up 79.1% of this group of injuries. The most common intra-articular injuries were FAI and a labral tear, accounting for 80.9% of these injuries. Only a small percentage of the extra-articular cases required surgery (MiLB 3.4%, MLB 5.8%, all players 3.8%) (Table 4). This finding was in contrast to the larger percentage of intra-articular cases requiring surgery (MiLB 40.3%, MLB 41.2%, all players 40.5%). Time lost varied greatly by surgery status, as well as extra-articular or intra-articular, as would be expected even after excluding season-ending injuries. For both types of injuries, the average time lost was consistently greater for injuries that required surgery versus the ones that did not result in surgery.
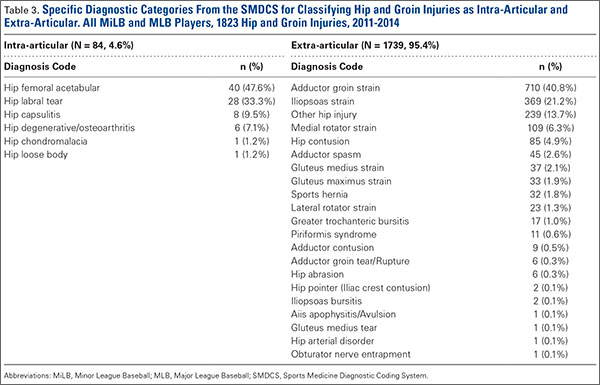
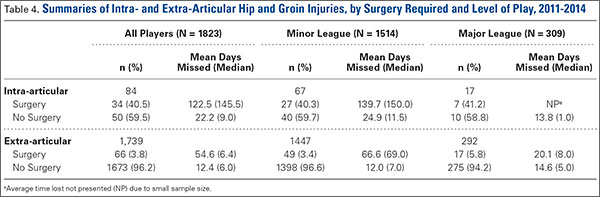
Discussion
The incidence of overall injuries in MLB players is increasing.8 Injuries to the hip and groin for professional baseball players continue to be of concern both in the number of injuries and the potential for these injuries to be debilitating or to recur. The correct diagnosis of hip injuries can be challenging in these athletes due to the complex anatomy of the region. However, our understanding of the pathoanatomy of hip and groin injuries, combined with the utilization of improved magnetic resonance imaging (MRI,) has aided in making the correct diagnosis more reliable. Although upper extremity injuries have traditionally been the focus of MLB injury reporting, hip injuries have been shown to cause an average of 23 days missed per player.4 This was similar to the more commonly highlighted elbow and knee injuries in the same study (23 and 27 days, respectively). The purpose of this study was to explore the epidemiology of hip and groin injuries in MLB. The lack of existing data on this issue is important for sports injury research. Exploring these injuries increases the understanding of which players are at risk, and how we can tailor training programs for prevention or rehabilitation programs for those players who suffer these injuries.
In addition to the increased awareness of hip injuries, there has been a recent focus on the contribution of hip range of motion, leg drive, and pelvic rotation to the overall mechanics of overhead activities such as throwing, a tennis serve, or pitching.12 Pelvic rotation and leg drive have been correlated to throwing velocity,21 and therefore if hip range of motion is inhibited by pain or a structural issue such as FAI, there will likely be altered upper extremity mechanics leading to less power and possibly injury.12 Additionally, it has been shown that limited hip range of motion due to FAI is correlated with compensatory lower extremity muscular injuries such as hamstring and adductor strains as well as overload of the lumbar spine and sacroiliac joint.22
In the current study, extra-articular injuries about the hip were the most common, making up 95.4% of the total injuries. Many (79.1%) of these were strains or contusions of the adductor, iliopsoas, or gluteal muscles. This is consistent with other articles reporting hip injuries in athletes.3,9 A study on hip injuries in the National Football League found that strains and contusions comprised 92% of all hip injuries.3 Another report on European professional football found that 72% of hip injuries over a 7-season period were adductor or iliopsoas injuries.9 This prior study also reported that 15% of the hip and groin strains were re-injuries. Intra-articular injuries comprised only 4.6% of the hip injuries in our study. FAI and labral tears were the most common intra-articular diagnosis at 80.9%.
Almost all (96.2%) of the extra-articular hip injuries in this series were able to be treated nonoperatively and caused a mean of 12.4 days missed. Those which required operative treatment caused a mean of 54.6 days missed. For intra-articular injuries, 40.5% were treated surgically and these players missed a mean 122.5 days. Those treated nonsurgically missed an average of 22.2 days. Whether treated surgically or nonsurgically, the mean days missed following an intra-articular injury was approximately twice that of extra-articular injuries. Our findings regarding time or games missed are similar to other reports studying hip injuries in professional athletes.2,3,9 Intra-articular injuries such as FAI, chondral injuries, or labral tears caused between 46 and 64 days missed compared to 3 to 27 days missed for extra-articular injuries in professional soccer players.9 Feeley and colleagues3 found a mean of 5.07 to 33.6 days missed for extra-articular injuries such as strains or contusions, and 63.5 to 126.2 days missed for intra-articular injuries including arthritis, labral tears, subluxations, dislocations, and fractures. A report on National Hockey League players found that intra-articular injuries made up 10.6% of all hip and groin injuries and caused significantly more games missed than extra-articular injuries.2
In both minor and major league players, for all reported positions at the time of hip or groin injury, infield players collectively were more commonly injured than outfielders, batters, or base runners, and fielding was the most common activity being performed at the time of injury. The pitcher’s mound was the most common single location for injuries and these players had the longest time missed following injury. The correlation between hip and groin pathology and upper extremity injuries in overhead athletes has been discussed in previous studies.12,21 Interestingly, we found that the specific location on the field with the highest incidence of hip and groin injuries was the pitcher’s mound. As we follow these players over time, a future correlation between the incidence of hip and groin injuries and the incidence of shoulder and elbow injuries may be noted. A noncontact injury was the most frequent mechanism of injury. This corroborates the finding that muscle strains and contusions made up the majority of injuries in this series. Other series on hip injuries have also found that noncontact mechanisms are common.3
Although this was one of the first studies exploring the epidemiology of hip and groin injury, there are some limitations of this study. The retrospective nature of this study relied upon the reporting of injuries in the MLB database. As such, there may be underreporting of injuries into the official database by players or medical staff for a variety of reasons. Differences in technique for diagnosis and treatment among the medical staff for different teams were not controlled for. Due to the wide range of hip and groin pathology, and the often difficult diagnosis, a specific injury was not always provided. Therefore, the category of “other” hip injury was entered in to the database when symptoms were nonspecific or not all details were provided. Fortunately, this category made up a small percentage of the reported injuries, but does remain a confounding factor in describing the etiology of hip injuries in these players. Our data were taken from professional baseball players only, and so we cannot recommend extrapolation to other sports or nonprofessional baseball athletes.
Despite the inherent limitations of reporting registry data, this study serves as the initial report of the occurrence of hip and groin injuries in professional baseball players, and improves our knowledge of the positions and situations that put players at most risk for these injuries. An understanding of the overall epidemiology of these injuries serves as a platform for more focused research in this area in the future. We can now focus research on specific positions, such as pitchers, that have a high incidence of injury to determine the physiologic and environmental factors which put them at higher risk for injury in general and for more significant injuries with more days missed. This information can help to guide position-specific training programs for injury prevention as well as improve rehabilitation protocols for more efficient recovery and return to sports.
1. Amenabar T, O’Donnell J. Return to sport in Australian football league footballers after hip arthroscopy and midterm outcome. Arthroscopy. 2013;29(7):1188-1194.
2. Epstein DM, McHugh M, Yorio M, Neri B. Intra-articular hip injuries in national hockey league players: a descriptive epidemiological study. Am J Sports Med. 2013;41(2):343-348.
3. Feeley BT, Powell JW, Muller MS, Barnes RP, Warren RF, Kelly BT. Hip injuries and labral tears in the national football league. Am J Sports Med. 2008;36(11):2187-2195.
4. Li X, Zhou H, Williams P, et al. The epidemiology of single season musculoskeletal injuries in professional baseball. Orthop Rev (Pavia). 2013;5(1):e3.
5. Meyers WC, Foley DP, Garrett WE, Lohnes JH, Mandlebaum BR. Management of severe lower abdominal or inguinal pain in high-performance athletes. PAIN (Performing Athletes with Abdominal or Inguinal Neuromuscular Pain Study Group). Am J Sports Med. 2000;28(1):2-8.
6. Moorman CT 3rd, Warren RF, Hershman EB, et al. Traumatic posterior hip subluxation in American football. J Bone Joint Surg Am. 2003;85-A(7):1190-1196.
7. Philippon M, Schenker M, Briggs K, Kuppersmith D. Femoroacetabular impingement in 45 professional athletes: associated pathologies and return to sport following arthroscopic decompression. Knee Surg Sports Traumatol Arthrosc. 2007;15(7):908-914.
8. Posner M, Cameron KL, Wolf JM, Belmont PJ Jr, Owens BD. Epidemiology of Major League Baseball injuries. Am J Sports Med. 2011;39(8):1676-1680.
9. Werner J, Hagglund M, Walden M, Ekstrand J. UEFA injury study: a prospective study of hip and groin injuries in professional football over seven consecutive seasons. Br J Sports Med. 2009;43(13):1036-1040.
10. Conte S, Requa RK, Garrick JG. Disability days in major league baseball. Am J Sports Med. 2001;29(4):431-436.
11. Ellenbecker TS, Ellenbecker GA, Roetert EP, Silva RT, Keuter G, Sperling F. Descriptive profile of hip rotation range of motion in elite tennis players and professional baseball pitchers. Am J Sports Med. 2007;35(8):1371-1376.
12. Klingenstein GG, Martin R, Kivlan B, Kelly BT. Hip injuries in the overhead athlete. Clin Orthop Relat Res. 2012;470(6):1579-1585.
13. McCarthy J, Barsoum W, Puri L, Lee JA, Murphy S, Cooke P. The role of hip arthroscopy in the elite athlete. Clin Orthop Relat Res. 2003(406):71-74.
14. Anderson K, Strickland SM, Warren R. Hip and groin injuries in athletes. Am J Sports Med. 2001;29(4):521-533.
15. Boykin RE, Patterson D, Briggs KK, Dee A, Philippon MJ. Results of arthroscopic labral reconstruction of the hip in elite athletes. Am J Sports Med. 2013;41(10):2296-2301.
16. Malviya A, Paliobeis CP, Villar RN. Do professional athletes perform better than recreational athletes after arthroscopy for femoroacetabular impingement? Clin Orthop Relat Res. 2013;471(8):2477-2483.
17. McDonald JE, Herzog MM, Philippon MJ. Performance outcomes in professional hockey players following arthroscopic treatment of FAI and microfracture of the hip. Knee Surg Sports Traumatol Arthrosc. 2014;22(4):915-919.
18. McDonald JE, Herzog MM, Philippon MJ. Return to play after hip arthroscopy with microfracture in elite athletes. Arthroscopy. 2013;29(2):330-335.
19. Philippon MJ, Weiss DR, Kuppersmith DA, Briggs KK, Hay CJ. Arthroscopic labral repair and treatment of femoroacetabular impingement in professional hockey players. Am J Sports Med. 2010;38(1):99-104.
20. Alradwan H, Philippon MJ, Farrokhyar F, et al. Return to preinjury activity levels after surgical management of femoroacetabular impingement in athletes. Arthroscopy. 2012;28(10):1567-1576.
21. Stodden DF, Langendorfer SJ, Fleisig GS, Andrews JR. Kinematic constraints associated with the acquisition of overarm throwing part I: step and trunk actions. Res Q Exerc Sport. 2006;77(4):417-427.
22. Hammoud S, Bedi A, Voos JE, Mauro CS, Kelly BT. The recognition and evaluation of patterns of compensatory injury in patients with mechanical hip pain. Sports Health. 2014;6(2):108-118.
Injuries around the hip and groin occurring in professional baseball players can present as muscle strains, avulsions, contusions, hip subluxations or dislocations, femoroacetabular impingement (FAI) causing labral tears or chondral defects, and athletic pubalgia.1-9 Several recent articles have reported on the epidemiology of musculoskeletal injuries in Major League Baseball (MLB) players4,8,10 but with little attention to injuries to the hip and groin, likely because prior studies show only a 6.3% overall incidence for these injuries, much less than the more commonly discussed shoulder or elbow injuries.8 Despite the lower proportion of hip and groin injuries overall, these injuries lead to a relatively long period of disability for the players and often have a high rate of recurrence.4,8,9
The important contribution of hip mechanics and the surrounding muscular function in the kinetic chain during overhead athletic activities, such as a tennis serve or throwing, has recently been discussed.11,12 In sports requiring overhead activities, trunk rotation is a key component to generating force, and hip internal and external rotation is necessary for this trunk rotation to occur.12,13 Alterations in hip morphology causing constrained motion, as seen in FAI, may predispose an overhead throwing athlete to intra-articular injury such as labral tears or chondral injuries, or to a compensatory movement pattern causing an extra-articular soft tissue injury about the hip.12 Decreased hip range of motion may also lead to increased forces across the upper extremity during the throwing motion, which puts the shoulder and elbow at increased risk of injury.12
Increased awareness of hip and groin injuries, advances in diagnostic imaging, and an understanding of the relationship between the throwing motion in baseball and hip mechanics have improved our ability to appropriately identify and treat athletes with injuries of the hip and groin. Several studies on hip and groin injuries in elite athletes treated both operatively and nonoperatively have reported a high rate of return to sport.3,7,14-19 A systematic review on return to sport following hip arthroscopy for intra-articular pathology associated with FAI showed a 95% return to sport rate and a 92% rate of return to pre-injury level of play in a subgroup of professional athletes in 9 studies.20
Despite the large body of literature on upper extremity injuries, there is no study specifically focusing on the epidemiology of hip and groin injuries in MLB or Minor League Baseball (MiLB) players. The incidence of all injuries in professional baseball players has steadily increased over the last 2 decades,8 and the reported incidence of hip and groin injuries will likely increase as well. The current incidence of this injury, the positions most at risk, the mechanism of injury, and the time to return to sport are important to understand given the large number of players who participate in baseball not only at a professional level, but also at an amateur level, where this information may also be applicable. This information could improve our efforts at prevention and rehabilitation of these injuries, and can guide efforts to counsel and train players at high risk of a hip or groin injury. To address this gap in the literature, the purpose of this study was to describe the epidemiology of hip and groin injuries in MLB and MiLB players from 2011 to 2014.
Materials and Methods
Population and Sample
US MLB is comprised of the major and minor leagues. The major leagues are divided into 30 clubs, with 25 active players, for a total of 750 active players. Each club has a 40-man roster consisting of 25 active players and up to 15 additional players who are either not active or optioned to the minor leagues. The minor leagues are comprised of a network of over 200 clubs that are each affiliated with a major league club, and organized by geography and level of play. The minor leagues consist of roughly 7500 players, of whom about 6500 are actively playing at any given time. The entire population of players in the MLB who sustained a hip or groin injury over the study period was eligible for this study.
Data
The MLB’s Health and Injury Tracking System (HITS) is a centralized database that contains the de-identified medical data from the electronic medical record (EMR) system. Data on all injuries are entered into the EMR by each team’s certified athletic trainer. An injury is defined as any physical complaint sustained by a player that affects or limits participation in any aspect of baseball-related activity (eg, game, practice, warm-up, conditioning, weight training). The data extracted from HITS only relates to injuries that resulted in lost game time for a player and that occurred during spring training, regular season, or postseason play; off-season injuries were not included. Injury events that were classified as “season-ending” were not included in the analysis of assessing days missed because many of these players may not have been cleared to play until the beginning of the following season. For each injury, data were collected on the diagnosis, body part, activity, location, and date of injury.
Materials and Methods
Hip and groin injuries were defined as cases having a body region variable classified as “hip/groin” or a Sports Medicine Diagnostic Coding System (SMDCS) that included any “adductor” or “hernia” or “hip pointer” labels. Cases categorized as inguinal and femoral hernia (n = 26) and testicular contusions (n = 87) were excluded. Characteristics about each hip and groin injury were also extracted from HITS. These variables included level of play, player position (activity at the time of injury), field location, injury mechanism, chronicity of the injury, and days missed. Chronicity of the injury was documented as acute, overuse, or undetermined. For level of play, the injury event was categorized as the league in which the game was played when the injury occurred. Players were excluded if they had an unknown level of play or were in the amateur league. The injuries of the hip and groin were further classified as intra-articular and extra-articular. Treatment for each injury was characterized as surgical or nonsurgical, and correlated with days missed for each type of injury.
Statistical Analysis
Data for the 2011-2014 seasons were combined, and results presented for all players and separately for MiLB and MLB. Frequencies and comparative analyses for hip and groin injuries were performed across the aforementioned injury characteristics. The distribution of days missed for the variables considered was often skewed to the right, even after excluding the season-ending injuries; hence, the mean days missed was often larger than the median days missed. Reporting the median would allow for a robust estimate of the expected number of days missed, but would down weight those instances when hip and groin injuries result in much longer missed days, as reflected by the mean. Because of the importance of the days missed measure for professional baseball, both the mean and median are presented. Chi-square tests were used to test the hypothesis of equal proportions between the various categories of hip and groin characteristics, with statistical significance determined at the P = .05 level.
In order to estimate exposure, the average number of players per team per game was calculated based on analysis of regular season game participation via box scores that are publicly available. This average number over a season, multiplied by the number of team games at each professional level of baseball, was used as an estimate of athlete exposures in order to provide rates comparable to those of other injury surveillance systems. Injury rates were reported as injuries per 1000 athlete-exposures (AE) for those hip and groin injuries that occurred during the regular season. It should be noted that the number of regular season hip and groin injuries and the subsequent AE rates are based on injuries that were deemed work-related during the regular season. This does not necessarily only include injuries occurring during the course of a game, but injuries in game preparation as well. Due to the variations in spring training games and fluctuating rosters, an exposure rate could not be calculated for spring training hip and groin injuries.
Data analysis was performed in the R statistical computing Environment (R Core Team 2014). Study procedures were approved by the Johns Hopkins Bloomberg School of Public Health Institutional Review Board.
Results
Overall Summary
A total of 1823 hip and groin injuries occurred from 2011-2014, with 83% occurring in MiLB and 17% occurring in MLB (Table 1). There were 1146 acute injuries, 252 overuse injuries, and 425 injuries of undetermined chronicity. The average age of players experiencing a hip and groin injury in MiLB was 22.9 years compared to 29.7 years in MLB. Of the 1514 hip and groin injuries in MiLB, 76 (5.0%) required surgery and of the 309 hip and groin injuries in MLB, 24 (7.8%) required surgery. Compared to league-wide injury events, hip and groin injuries ranked 6th highest in prevalence in MiLB and 8th highest in prevalence in MLB, accounting for 5.4% and 5.6%, respectively, of the 28,116 MiLB and 5507 MLB injury events that occurred between 2011-2014.
For regular season games, it was estimated that there were 1,197,738 MiLB and 276,608 MLB AE from 2011-2014. The overall hip and groin rate across both MLB and MiLB was 1.2 per 1000 AE, based on the 238 and 1152 regular season hip and groin injuries in MLB and MiLB, respectively. The rate of hip and groin injury was 1.5 times more likely in MiLB than in MLB (P < .0001) (rate of 1.26 per 1000 AE in MiLB and 0.86 per 1000 AE in MLB).
Characteristics of Injuries
Injury activity was based on the position being played at the time of injury, with categories of infield and outfield corresponding to fielding activities (defense), with batting and base runner categories corresponding to activities while on offense (Table 2). The occurrence of hip and groin injuries while players are fielding on defense (MiLB 33.0%, MLB 37.2%, all players 33.8%) was significantly greater compared to injuries while batting and base running on offense (MiLB 24.9%, MLB 21.7%, all players 24.3%) (all P values < .001). There was a high percentage of missing data for the event position variable, which resulted from this field not being available in HITS for 2011. Time lost due to hip and groin injuries was similar across leagues with respect to injury activity, ranging on average between 8 and 18 days.
There were statistically significant differences for MiLB and MLB separately, and combined, in the number of hip and groin injuries by field location (all P values < .0001) (Table 2). For MiLB, MLB, and across both leagues, by injury location, the majority of hip and groin injuries occurred in the infield (MiLB 34.1%, MLB 35.3%, all players 34.3%). As a single location, the pitcher’s mound accounted for a large proportion of hip and groin injuries (MiLB 19.2%, MLB 23.3%, all players 19.9%). Time lost due to hip and groin injuries was similar across leagues with respect to field location, ranging on average between about 10 and 22 days. Among all players, injuries on the pitcher’s mound resulted in the largest mean days missed after injury.
There were statistically significant differences across the mechanisms of injury for MiLB and MLB, as well as both leagues combined (all P values < .0001) (Table 2). The majority of hip and groin injuries were noncontact-related (MiLB 73.7%, MLB 75.7%, all players 74.1%) compared to those resulting from some form of contact (MiLB 11.4%, MLB 12.6%, all players 11.7%) or other mechanisms. Time lost across these mechanisms varied, ranging on average between 4 and 15 days with noncontact-related hip and groin injuries resulting in the largest time lost.
Surgery
The 1823 hip and groin injuries across both leagues were further classified using the SMDCS descriptions as intra-articular (N = 84) or extra-articular (N = 1739) (Table 3). A much larger percentage of hip and groin injuries were extra-articular (MiLB 95.6%, MLB 94.4%, all players 95.4%) compared to those classified as intra-articular (Table 3). The most common extra-articular injuries were strains or contusions of the adductor, iliopsoas, or gluteal muscles, making up 79.1% of this group of injuries. The most common intra-articular injuries were FAI and a labral tear, accounting for 80.9% of these injuries. Only a small percentage of the extra-articular cases required surgery (MiLB 3.4%, MLB 5.8%, all players 3.8%) (Table 4). This finding was in contrast to the larger percentage of intra-articular cases requiring surgery (MiLB 40.3%, MLB 41.2%, all players 40.5%). Time lost varied greatly by surgery status, as well as extra-articular or intra-articular, as would be expected even after excluding season-ending injuries. For both types of injuries, the average time lost was consistently greater for injuries that required surgery versus the ones that did not result in surgery.
Discussion
The incidence of overall injuries in MLB players is increasing.8 Injuries to the hip and groin for professional baseball players continue to be of concern both in the number of injuries and the potential for these injuries to be debilitating or to recur. The correct diagnosis of hip injuries can be challenging in these athletes due to the complex anatomy of the region. However, our understanding of the pathoanatomy of hip and groin injuries, combined with the utilization of improved magnetic resonance imaging (MRI,) has aided in making the correct diagnosis more reliable. Although upper extremity injuries have traditionally been the focus of MLB injury reporting, hip injuries have been shown to cause an average of 23 days missed per player.4 This was similar to the more commonly highlighted elbow and knee injuries in the same study (23 and 27 days, respectively). The purpose of this study was to explore the epidemiology of hip and groin injuries in MLB. The lack of existing data on this issue is important for sports injury research. Exploring these injuries increases the understanding of which players are at risk, and how we can tailor training programs for prevention or rehabilitation programs for those players who suffer these injuries.
In addition to the increased awareness of hip injuries, there has been a recent focus on the contribution of hip range of motion, leg drive, and pelvic rotation to the overall mechanics of overhead activities such as throwing, a tennis serve, or pitching.12 Pelvic rotation and leg drive have been correlated to throwing velocity,21 and therefore if hip range of motion is inhibited by pain or a structural issue such as FAI, there will likely be altered upper extremity mechanics leading to less power and possibly injury.12 Additionally, it has been shown that limited hip range of motion due to FAI is correlated with compensatory lower extremity muscular injuries such as hamstring and adductor strains as well as overload of the lumbar spine and sacroiliac joint.22
In the current study, extra-articular injuries about the hip were the most common, making up 95.4% of the total injuries. Many (79.1%) of these were strains or contusions of the adductor, iliopsoas, or gluteal muscles. This is consistent with other articles reporting hip injuries in athletes.3,9 A study on hip injuries in the National Football League found that strains and contusions comprised 92% of all hip injuries.3 Another report on European professional football found that 72% of hip injuries over a 7-season period were adductor or iliopsoas injuries.9 This prior study also reported that 15% of the hip and groin strains were re-injuries. Intra-articular injuries comprised only 4.6% of the hip injuries in our study. FAI and labral tears were the most common intra-articular diagnosis at 80.9%.
Almost all (96.2%) of the extra-articular hip injuries in this series were able to be treated nonoperatively and caused a mean of 12.4 days missed. Those which required operative treatment caused a mean of 54.6 days missed. For intra-articular injuries, 40.5% were treated surgically and these players missed a mean 122.5 days. Those treated nonsurgically missed an average of 22.2 days. Whether treated surgically or nonsurgically, the mean days missed following an intra-articular injury was approximately twice that of extra-articular injuries. Our findings regarding time or games missed are similar to other reports studying hip injuries in professional athletes.2,3,9 Intra-articular injuries such as FAI, chondral injuries, or labral tears caused between 46 and 64 days missed compared to 3 to 27 days missed for extra-articular injuries in professional soccer players.9 Feeley and colleagues3 found a mean of 5.07 to 33.6 days missed for extra-articular injuries such as strains or contusions, and 63.5 to 126.2 days missed for intra-articular injuries including arthritis, labral tears, subluxations, dislocations, and fractures. A report on National Hockey League players found that intra-articular injuries made up 10.6% of all hip and groin injuries and caused significantly more games missed than extra-articular injuries.2
In both minor and major league players, for all reported positions at the time of hip or groin injury, infield players collectively were more commonly injured than outfielders, batters, or base runners, and fielding was the most common activity being performed at the time of injury. The pitcher’s mound was the most common single location for injuries and these players had the longest time missed following injury. The correlation between hip and groin pathology and upper extremity injuries in overhead athletes has been discussed in previous studies.12,21 Interestingly, we found that the specific location on the field with the highest incidence of hip and groin injuries was the pitcher’s mound. As we follow these players over time, a future correlation between the incidence of hip and groin injuries and the incidence of shoulder and elbow injuries may be noted. A noncontact injury was the most frequent mechanism of injury. This corroborates the finding that muscle strains and contusions made up the majority of injuries in this series. Other series on hip injuries have also found that noncontact mechanisms are common.3
Although this was one of the first studies exploring the epidemiology of hip and groin injury, there are some limitations of this study. The retrospective nature of this study relied upon the reporting of injuries in the MLB database. As such, there may be underreporting of injuries into the official database by players or medical staff for a variety of reasons. Differences in technique for diagnosis and treatment among the medical staff for different teams were not controlled for. Due to the wide range of hip and groin pathology, and the often difficult diagnosis, a specific injury was not always provided. Therefore, the category of “other” hip injury was entered in to the database when symptoms were nonspecific or not all details were provided. Fortunately, this category made up a small percentage of the reported injuries, but does remain a confounding factor in describing the etiology of hip injuries in these players. Our data were taken from professional baseball players only, and so we cannot recommend extrapolation to other sports or nonprofessional baseball athletes.
Despite the inherent limitations of reporting registry data, this study serves as the initial report of the occurrence of hip and groin injuries in professional baseball players, and improves our knowledge of the positions and situations that put players at most risk for these injuries. An understanding of the overall epidemiology of these injuries serves as a platform for more focused research in this area in the future. We can now focus research on specific positions, such as pitchers, that have a high incidence of injury to determine the physiologic and environmental factors which put them at higher risk for injury in general and for more significant injuries with more days missed. This information can help to guide position-specific training programs for injury prevention as well as improve rehabilitation protocols for more efficient recovery and return to sports.
1. Amenabar T, O’Donnell J. Return to sport in Australian football league footballers after hip arthroscopy and midterm outcome. Arthroscopy. 2013;29(7):1188-1194.
2. Epstein DM, McHugh M, Yorio M, Neri B. Intra-articular hip injuries in national hockey league players: a descriptive epidemiological study. Am J Sports Med. 2013;41(2):343-348.
3. Feeley BT, Powell JW, Muller MS, Barnes RP, Warren RF, Kelly BT. Hip injuries and labral tears in the national football league. Am J Sports Med. 2008;36(11):2187-2195.
4. Li X, Zhou H, Williams P, et al. The epidemiology of single season musculoskeletal injuries in professional baseball. Orthop Rev (Pavia). 2013;5(1):e3.
5. Meyers WC, Foley DP, Garrett WE, Lohnes JH, Mandlebaum BR. Management of severe lower abdominal or inguinal pain in high-performance athletes. PAIN (Performing Athletes with Abdominal or Inguinal Neuromuscular Pain Study Group). Am J Sports Med. 2000;28(1):2-8.
6. Moorman CT 3rd, Warren RF, Hershman EB, et al. Traumatic posterior hip subluxation in American football. J Bone Joint Surg Am. 2003;85-A(7):1190-1196.
7. Philippon M, Schenker M, Briggs K, Kuppersmith D. Femoroacetabular impingement in 45 professional athletes: associated pathologies and return to sport following arthroscopic decompression. Knee Surg Sports Traumatol Arthrosc. 2007;15(7):908-914.
8. Posner M, Cameron KL, Wolf JM, Belmont PJ Jr, Owens BD. Epidemiology of Major League Baseball injuries. Am J Sports Med. 2011;39(8):1676-1680.
9. Werner J, Hagglund M, Walden M, Ekstrand J. UEFA injury study: a prospective study of hip and groin injuries in professional football over seven consecutive seasons. Br J Sports Med. 2009;43(13):1036-1040.
10. Conte S, Requa RK, Garrick JG. Disability days in major league baseball. Am J Sports Med. 2001;29(4):431-436.
11. Ellenbecker TS, Ellenbecker GA, Roetert EP, Silva RT, Keuter G, Sperling F. Descriptive profile of hip rotation range of motion in elite tennis players and professional baseball pitchers. Am J Sports Med. 2007;35(8):1371-1376.
12. Klingenstein GG, Martin R, Kivlan B, Kelly BT. Hip injuries in the overhead athlete. Clin Orthop Relat Res. 2012;470(6):1579-1585.
13. McCarthy J, Barsoum W, Puri L, Lee JA, Murphy S, Cooke P. The role of hip arthroscopy in the elite athlete. Clin Orthop Relat Res. 2003(406):71-74.
14. Anderson K, Strickland SM, Warren R. Hip and groin injuries in athletes. Am J Sports Med. 2001;29(4):521-533.
15. Boykin RE, Patterson D, Briggs KK, Dee A, Philippon MJ. Results of arthroscopic labral reconstruction of the hip in elite athletes. Am J Sports Med. 2013;41(10):2296-2301.
16. Malviya A, Paliobeis CP, Villar RN. Do professional athletes perform better than recreational athletes after arthroscopy for femoroacetabular impingement? Clin Orthop Relat Res. 2013;471(8):2477-2483.
17. McDonald JE, Herzog MM, Philippon MJ. Performance outcomes in professional hockey players following arthroscopic treatment of FAI and microfracture of the hip. Knee Surg Sports Traumatol Arthrosc. 2014;22(4):915-919.
18. McDonald JE, Herzog MM, Philippon MJ. Return to play after hip arthroscopy with microfracture in elite athletes. Arthroscopy. 2013;29(2):330-335.
19. Philippon MJ, Weiss DR, Kuppersmith DA, Briggs KK, Hay CJ. Arthroscopic labral repair and treatment of femoroacetabular impingement in professional hockey players. Am J Sports Med. 2010;38(1):99-104.
20. Alradwan H, Philippon MJ, Farrokhyar F, et al. Return to preinjury activity levels after surgical management of femoroacetabular impingement in athletes. Arthroscopy. 2012;28(10):1567-1576.
21. Stodden DF, Langendorfer SJ, Fleisig GS, Andrews JR. Kinematic constraints associated with the acquisition of overarm throwing part I: step and trunk actions. Res Q Exerc Sport. 2006;77(4):417-427.
22. Hammoud S, Bedi A, Voos JE, Mauro CS, Kelly BT. The recognition and evaluation of patterns of compensatory injury in patients with mechanical hip pain. Sports Health. 2014;6(2):108-118.
Injury Trends in Major League Baseball Over 18 Seasons: 1998-2015
While the exact origins of the game of baseball are commonly debated, one thing is certain: statistics have been an integral part of the game since its existence.1-3 This is true at nearly every level of baseball, especially in Major League Baseball (MLB). As our knowledge and technical capabilities advance, new statistical measures of baseball performance are added at a rapid pace.1,3 One example is the Pitch f/x video tracking system (Sportvision, Inc.), which now analyzes over 60 variables on each of the estimated 660,000 pitches thrown in the MLB annually. In addition to measuring performance and production, these advancements are being leveraged to better understand the epidemiology and impact of injuries in MLB players.4,5 As with any sport, performance at the most elite level is highly dependent upon player health and functional capacity. Accordingly, player injuries can have a profound impact not only on individual performance but also on the success of the team as a whole.
The first epidemiologic study of injuries in professional baseball was published by Conte and colleagues4 in 2001. This work utilized publically available disabled list (DL) data to perform a comprehensive review of injury patterns in MLB from 1989 to 1999. They demonstrated that injuries were on the rise and that pitchers were more commonly injured (48.4% of all DL reports) and had greater time out of play compared to players of other positions.4 Shoulder and elbow injuries were responsible for 49.8% of all DL assignments, distantly followed by knee (7.3%), wrist/hand (6.1%), and back (5.0%).4 In a later study, Posner and colleagues5 analyzed DL data spanning the 2002 to 2008 seasons. Similarly, they found that injuries continued to increase, and over half (51.2%) of DL assignments occurred secondary to upper extremity injuries.5 Although the DL is primarily designed as a roster management tool rather than an injury database, it has provided valuable epidemiologic injury information through the years. Out of concern for player health and well-being, MLB and the MLB Players Association (MLBPA) worked together to create and implement an electronic medical record and Health and Injury Tracking System (HITS) for all MLB and Minor League Baseball (MiLB) players. Now active for over 5 seasons, this database has provided valuable, detailed reports regarding specific injuries occurring in professional baseball, such as hamstring strains and concussions.6,7
With shoulder and elbow injuries in pitchers representing the greatest proportion of DL assignments in recent years, a large body of literature on these injuries, particularly medial ulnar collateral ligament (MUCL) injuries, has been published.8-13 Since the initial description of MUCL reconstruction, or “Tommy John surgery,” by Dr. Frank Jobe in 1986, much has been done to improve the technique and rehabilitation to maximize player performance following surgery.10,14-16 Despite this increased attention, large-scale epidemiologic reporting of MUCL injuries in MLB is lacking, but such a report is desirable. The purpose of this work is to: 1) provide a large-scale analysis of injuries occurring in MLB baseball over the course of 18 seasons (1998-2015); 2) highlight the financial implications of these injuries; and 3) detail the evolution of MUCL injuries and reconstructive surgery since it was first performed on a MLB pitcher in 1974. Our study represents the largest longitudinal analysis of MLB injuries since the league expanded to its current level of 30 teams in 1998. It is our hope that this work will serve as a framework for future study of the most common and highest impact injuries occurring in baseball.
Materials And Methods
We performed a retrospective review of the MLB DL from 1998 to 2015. Data analyzed included player demographics such as club, year of placement, age, and position. Injury-specific variables included date of placement on DL, length of time on DL, date of reinstatement, body part injured, diagnosis, and cost of replacement. If a player was put on the DL multiple times during a season, each placement was viewed as a different injury, even if it was to the same body part. If a player was put on the DL for injuries to multiple body parts, the primary injury was analyzed.
Disabled List Data
Although the DL has existed since 1916, this current study covers 18 seasons from 1998 to 2015. The 1998 season was chosen as a starting point because this is the year when MLB expanded to 30 teams. Since then, the number of teams and the active roster limits (25 players) have remained constant, allowing for reliable comparisons across seasons. Initially designed as a roster management tool to allow injured players to temporarily be replaced with healthy players, the DL was not created as an injury database. However, the rules and regulations of the DL have remained fairly constant over the last 18 years, allowing reasonable comparisons of injury data and trends across this timespan. In order for a player to be assigned to the DL, the nature and extent of injury must be certified by a physician. Once designated for the DL, a player cannot return to the major league team for a minimum of 15 days. If the injury is severe, the player can remain on the DL for the remainder of the season or until he is deemed healthy enough to return to play by a physician. One notable exception is the treatment of concussions. Since 2011, a player diagnosed with a concussion may be placed on the DL for a minimum of 7 days rather than 15. The introduction of the HITS database in 2010 should allow for more detailed and reliable study of injuries in baseball moving forward. Although it contains robust data for every injury that has occurred in MLB and MiLB over the last 5 seasons, it does not allow for epidemiologic and longitudinal study of injury patterns and trends in baseball prior to 2010.
Cost of Placing Players on the DL
The dollars lost were calculated by prorating the injured player’s daily salary and multiplying by the number of days missed on the DL. For example, if a player’s annual salary is $1,820,000, his daily salary for the 182 day season is $10,000. If assigned to the DL for 15 days, $150,000 is paid to that player while he is inactive and unable to play. An additional cost is the salary of the replacement player who fills the roster spot. For this work, the replacement player’s prorated, daily salary was assumed to be the league minimum for that specific year. For example, if the league minimum for a given season is $182,000, and the season is 182 days long, a replacement player earns a minimum of $1,000 per day while he is on the 25-man active roster. Thus, the dollars paid to the replacement would be $15,000. In this scenario, that brings the team’s total cost to $165,000 ($150,000 plus $15,000). Because the league minimum salary changes year to year, salaries specific to the year of injury were utilized in this analysis.
MUCL Injury Analysis
In order to better understand the evaluation of MUCL injuries over time, all MLB players undergoing MUCL reconstruction (“Tommy John surgery”) were analyzed separately. Similar to prior studies of UCL injuries, these players were identified using DL data, team websites, and publically available internet databases (primarily www.heatmaps.com).9,12,17-19 Variables studied include the number of procedures, year of surgery, player position, and mean time until return to play at the MLB level. All MLB players undergoing MUCL reconstruction since 1974 (the year the first procedure was performed) were included.
Statistical Methods
Epidemiologic data are reported using descriptive statistics (mean, range, and percentage) where indicated. To determine the significance of trends over time, a best-fit line was generated to illustrate the change over the years. These lines are reported with corresponding R2 values. To assess the trend for significance, the slope was compared to a line with a slope of zero (no change over time) using t tests. For all statistical comparisons, the threshold for alpha was set to P < .05.
Results
Between 1998 and 2015, there were 8357 placements of players on the DL, at an average rate of 464 designations per year (Table 1, Figure 1). This resulted in 460,432 days lost to injury, with a mean of 25,186 days out of play per season (Table 1, Figure 2). The mean length of DL assignment per year was 55.1 days per injury, with a low of 49.1 days in 2011 and a high of 59.2 days in 2001 (Table 1, Figure 3). During the study period, the number of players placed on the DL and the total number of DL days steadily increased (P < .001 and P = .003, respectively), while the average length of DL assignments remained steady (P = .647). When analyzing the data by body region injured, the shoulder (20.6%) and elbow (19.6%) were the 2 leading causes of time out of play (Table 2). This was followed distantly by the chest/back/spine (13.7%), wrist/hand/fingers (10.1%), lower leg/knee (9.8%), and the upper leg/thigh (9.5%). Although the percentage of injuries occurring to the upper extremity remained stable, the rate of shoulder injuries steadily decreased (P = .023) as elbow injuries increased (P = .015) (Table 3, Figure 4). This inverse relationship was also demonstrated for the annual number of DL days for shoulder (P = .033) and elbow (P = 0.005) injuries (Figure 5).
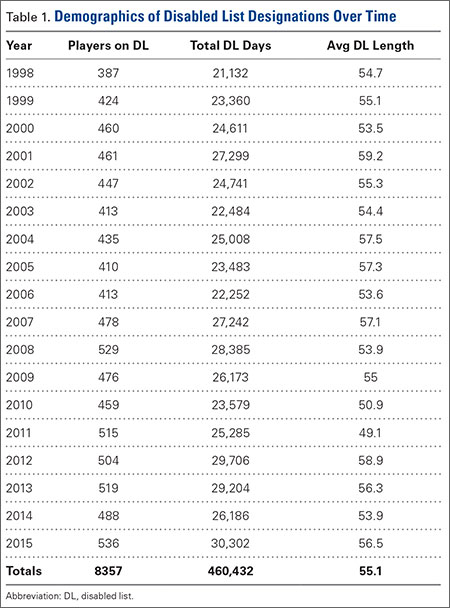
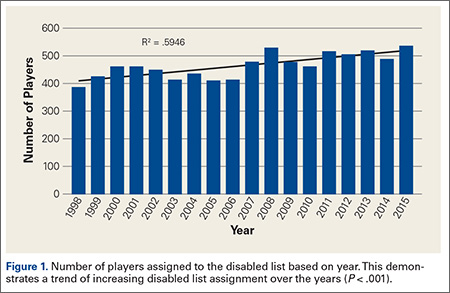
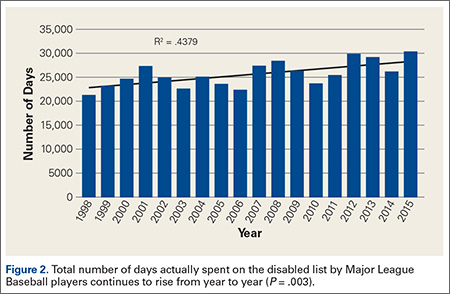
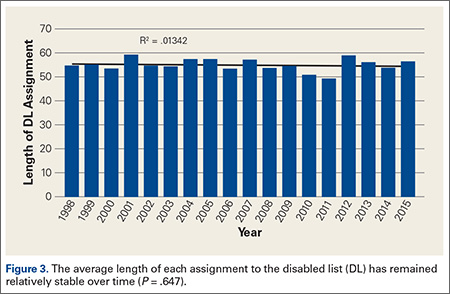
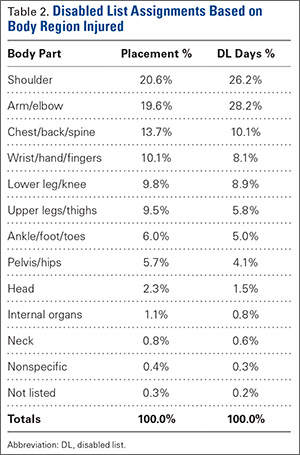
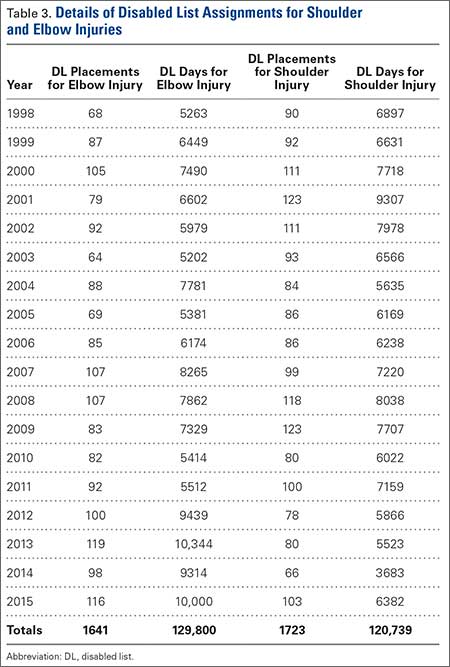
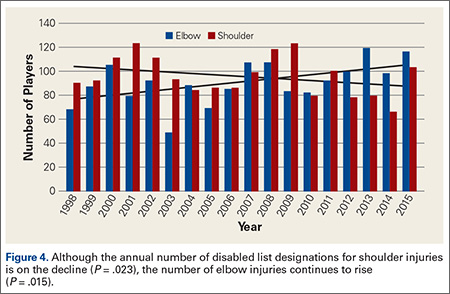
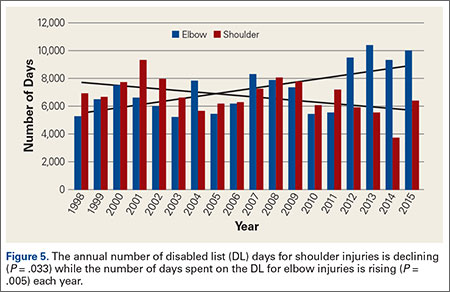
Regarding the financial impact of these injuries, the mean annual cost of replacing players on the DL was $423,267,633.78 (Table 4). This ranged from a low of $136,397,147 in 1998 to a high of $694,835,359 in 2015. There was a steady increase in the cost of replacement during the study period (P < .001) that coincides with the increasing salaries during that time span (Figure 6). In total, $6,732,167,180 was paid to players assigned to the DL and $886,650,228 was spent to fill their positions. This brings the total cost of DL assignments to $7,618,817,407 for the study period.
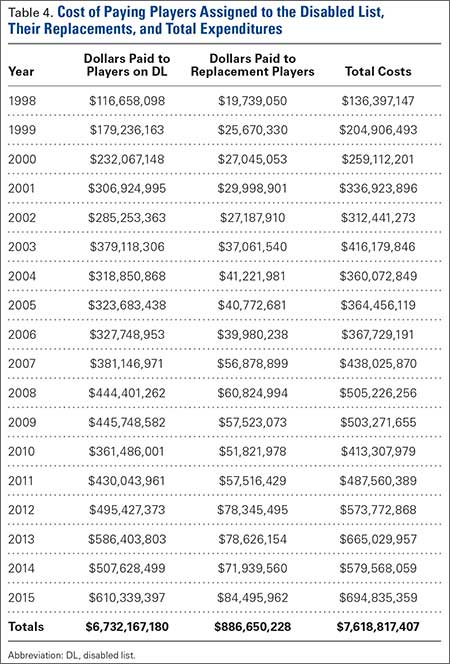
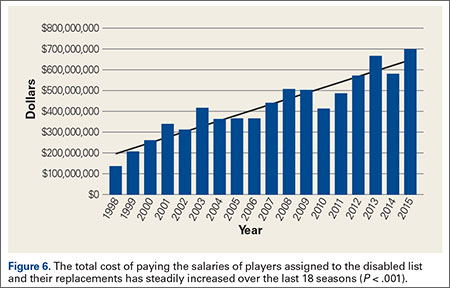
Looking specifically at MUCL injuries, a total of 400 MUCL reconstructions have been performed on MLB players since the procedure was first developed in 1974. The vast majority of these were performed in pitchers (n = 361, 90.3%) followed by outfielders (n = 16, 4.0%), infielders (n = 14, 3.5%) and catchers (n = 9, 2.3%) (Table 5). The mean time to return to competition at the MLB level was 17.8 months for pitchers, 11.1 months for outfielders, 9.6 months for infielders, and 10.5 months for catchers. The overall mean time to return was 17.1 months. The annual number of MUCL reconstructions continues to rise dramatically (P < .001) (Figure 7). During the first 12 years (1974-1985), a total of 8 (2.0%) MUCL reconstructions were performed on MLB players. In subsequent decades, this number increased to 44 (11.0%) from 1986-1995, 123 (30.8%) from 1996-2005, and 225 (56.3%) from 2006-2015. Of all Tommy John surgeries performed over 42 years, nearly one-third (n = 131, 32.75%) were performed in the last 5 years alone (2011-2015).
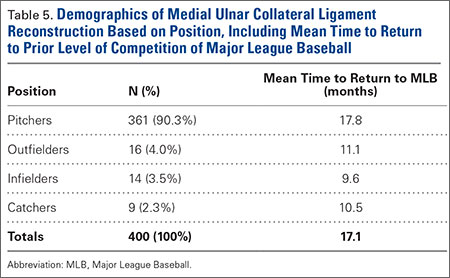
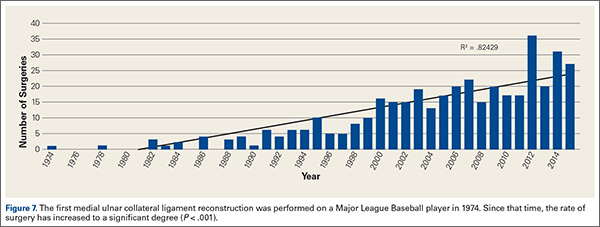
Discussion
To date, a number of studies have been published on injuries in professional baseball. These can primarily be categorized as either studies with a detailed focus on a single injury type or body region6-13,17,19 or broader reviews that are limited by the relatively short time span covered.4,5 The purpose of this work was to provide a comprehensive review of injury trends in MLB since the league expanded to 30 teams in 1998 while paying special attention to the financial impact of those injuries. Additionally, we sought to provide an up-to-date review of MUCL injuries and surgeries since the procedure was first developed in 1974. Ultimately, this data demonstrates that injuries continue to rise in MLB and this increase is accompanied by increased expense for teams. Thankfully, the rates of DL assignments for shoulder injuries are on the decline; however, this decrease is countered by a reciprocal increase in elbow injuries. Similarly, the rates of MUCL reconstruction have also risen dramatically in recent years.
The fact that injury rates are on the rise is confirmed by other published reports. This trend was demonstrated in prior analyses of DL data from the 1989 to 19984 and 2002 to 2008 seasons.5 These 2 studies represent the only comprehensive reviews of MLB injury trends to date, and each provides valuable information. Both are consistent with the current study findings that pitchers are the most commonly injured players and that shoulder and elbow injuries represent about half of all injuries.4,5 Similar injury rates and characteristics have been reported at the collegiate20 and minor league levels.21 Despite this consistency, this analysis of injuries from 1998 to 2015 is the first to report that DL designations for shoulder injuries are on the decline while designations for elbow injuries continue to rise. Although the exact etiology of this decline in shoulder injuries remains unknown, there are a number of possible explanations. In recent years, increased emphasis has been placed on shoulder rehabilitation, reduction of glenohumeral internal rotation deficits, scapular stabilization, and overall kinetic chain balance and coordination. However, this does not explain why elbow injuries continue to rise annually.
With this increase in injuries, the cost of maintaining an active 25-man roster is also climbing. As expected, this growing expense is primarily due to the increased number of DL days each year as well as the increase in league salaries. Fortunately, this increased financial strain has been met with steadily increased annual revenues in professional baseball. In 2014, the prorated salary cost to players designated to the DL and their replacements was $579,568,059. This figure represents an estimated 6.4% of the $9 billion in total revenue for MLB that same year.22 Although this may represent a small percentage of the whole, it still embodies an exceptionally large financial responsibility. This does not include the medical expenses incurred to treat and rehabilitate the players’ injuries.
Every injury that occurs in MLB players has the potential to adversely affect players, teams, and MLB as a whole. With its increasing prevalence, need for surgical treatment, and prolonged return to play, injuries to the MUCL of the elbow may represent the most costly of all injuries. Although a multitude of reports on MUCL injuries, treatments, techniques, rehabilitation, and outcomes have been reported,8,9,12,14-19,23-25 to our knowledge, a comprehensive and longitudinal incidence study in MLB players has not yet been published. By including every MUCL reconstruction that has been performed on a MLB player, our study demonstrates the dramatic increase in the annual incidence of MUCL surgeries. Studies performed over shorter time intervals corroborate these findings. A recent review of a privately insured patient database revealed an annual increase in MUCL reconstructions of 4.2% in that cohort.26 When looking specifically at the MLB, a recent survey of all 30 clubs found that 25% (96 of 382) of MLB pitchers and 15% (341 of 2324) of minor league pitchers have undergone MUCL reconstruction.8 Because it occurs so frequently and requires a mean of 17 months to return to sport, MUCL injuries represent a very significant cause of time out of play.
While this study represents a unique epidemiologic report on injuries in baseball, it is certainly not without its limitations. As stated previously, it relies on DL data that was initially intended to serve as a roster management tool rather than an injury database. Accordingly, detailed and specific information about every injury is not always available. The limitations of DL data will largely be overcome in future studies thanks to the implementation of the HITS database in 2010. Moving forward, this system will allow for more detailed analysis of injury patterns, characteristics, time out of play, treatments rendered, etc. Its main limitation is that the earliest data dates back to 2010, making it less applicable for longitudinal studies like the present one. Another limitation of this study is the estimations used for the cost of replacing players designated to the DL. For each injury, it was assumed that the replacement player was paid a prorated portion of the league minimum salary while on the major league roster, but in some instances, that may not have been the case. It is possible that some players filling roster spots were already under contract for amounts higher than the league minimum. Since that player would be making that amount regardless of the level of play, the team may not have paid them any additional salary while filling the position of the injured player. The strengths of this study are its comprehensive nature and inclusion of 18 years of data, making it the longest such study of injuries in MLB. It also represents the first report of cost of replacement for players designated to the DL. To our knowledge, this study also represents the first comprehensive report of every MUCL surgery that has been performed on MLB players.
Conclusion
Injury rates continue to rise in MLB, and upper extremity injuries continue to represent approximately half of all injuries resulting in time out of play. Although shoulder injuries have been on the decline in recent years, this decline is offset by a steady increase in elbow injuries. Each year, MLB players are designated to the DL an average of 464 times for a total of 25,579.6 days. This results in a mean annual cost of over $400 million dollars to replace players lost to injury. Looking specifically at MUCL injuries, a total of 400 MUCL reconstructions have been performed in the MLB since 1974, and nearly one-third of these were performed in the last 5 years. Pitchers represent 90.3% of players requiring MUCL surgery, and the average time to return to sport for all players is 17 months. These data may serve as a foundation for identifying appropriate targets for continued study into the etiologies, strategies for prevention, and optimal treatments of injuries commonly affecting professional baseball players.
1. Lewis M. Moneyball: The Art of Winning an Unfair Game. Vol 1. New York, NY: W. W. Norton & Company; 2004.
2. Block D. Baseball Before We Knew It: A Search for the Roots of the Game. Vol 1. Lincoln, NE: Bison Books; 2006.
3. James B. The New Bill James Historical Baseball Abstract. Vol 2. Detroit, MI: Free Press; 2003.
4. Conte S, Requa RK, Garrick JG. Disability days in major league baseball. Am J Sports Med. 2001;29(4):431-436.
5. Posner M, Cameron KL, Wolf JM, Belmont PJ, Owens BD. Epidemiology of Major League Baseball injuries. Am J Sports Med. 2011;39(8):1676-1680.
6. Ahmad CS, Dick RW, Snell E, et al. Major and Minor League Baseball hamstring injuries: epidemiologic findings from the Major League Baseball Injury Surveillance System. Am J Sports Med. 2014;42(6):1464-1470.
7. Green GA, Pollack KM, D’Angelo J, et al. Mild traumatic brain injury in major and Minor League Baseball players. Am J Sports Med. 2015;43(5):1118-1126.
8. Conte SA, Fleisig GS, Dines JS, et al. Prevalence of ulnar collateral ligament surgery in professional baseball players. Am J Sports Med. 2015;43(7):1764-1769.
9. Jones KJ, Conte S, Patterson N, ElAttrache NS, Dines JS. Functional outcomes following revision ulnar collateral ligament reconstruction in Major League Baseball pitchers. J Shoulder Elb Surg. 2013;22(5):642-646.
10. Jones KJ, Osbahr DC, Schrumpf MA, Dines JS, Altchek DW. Ulnar collateral ligament reconstruction in throwing athletes: a review of current concepts. AAOS exhibit selection. J Bone Joint Surg Am. 2012;94(8):e49.
11. Dodson CC, Thomas A, Dines JS, Nho SJ, Williams RJ 3rd, Altchek DW. Medial ulnar collateral ligament reconstruction of the elbow in throwing athletes. Am J Sports Med. 2006;34(12):1926-1932.
12. Erickson BJ, Gupta AK, Harris JD, et al. Rate of return to pitching and performance after Tommy John surgery in Major League Baseball pitchers. Am J Sports Med. 2014;42(3):536-543.
13. Makhni EC, Lee RW, Morrow ZS, Gualtieri AP, Gorroochurn P, Ahmad CS. Performance, return to competition, and reinjury after Tommy John surgery in Major League Baseball pitchers: A review of 147 cases. Am J Sports Med. 2014;42(6):
1323-1332.
14. Jobe FW, Stark H, Lombardo SJ. Reconstruction of the ulnar collateral ligament in athletes. J Bone Joint Surg Am. 1986;68(8):1158-1163.
15. Rohrbough JT, Altchek DW, Hyman J, Williams RJ 3rd, Botts JD. Medial collateral ligament reconstruction of the elbow using the docking technique. Am J Sports Med. 2002;30(4):541-548.
16. Andrews JR, Jost PW, Cain EL. The ulnar collateral ligament procedure revisited: the procedure we use. Sports Health. 2012;4(5):438-441.
17. Keller RA, Steffes MJ, Zhuo D, Bey MJ, Moutzouros V. The effects of medial ulnar collateral ligament reconstruction on Major League pitching performance. J Shoulder Elbow Surg. 2014;23(11):1591-1598.
18. Marshall NE, Keller RA, Lynch JR, Bey MJ, Moutzouros V. Pitching performance and longevity after revision ulnar collateral ligament reconstruction in Major League Baseball pitchers. Am J Sports Med. 2015;43(5):1051-1056.
19. Liu JN, Garcia GH, Conte S, ElAttrache N, Altchek DW, Dines JS. Outcomes in revision Tommy John surgery in Major League Baseball pitchers. J Shoulder Elbow Surg. 2016;25(1):90-97.
20. McFarland EG, Wasik M. Epidemiology of collegiate baseball injuries. Clin J Sport Med. 1998;8(1):10-13.
21. Chambless KM, Knudtson J, Eck JC, Covington LA. Rate of injury in minor league baseball by level of play. Am J Orthop. 2000;29(11):869-872.
22. Brown M. Major League Baseball Sees Record $9 Billion In Revenues For 2014. Forbes. http://www.forbes.com/sites/maurybrown/2014/12/10/major-league-baseball-sees-record-9-billion-in-revenues-for-2014/. Published December 10, 2014. Accessed February 3, 2016.
23. Jones KJ, Dines JS, Rebolledo BJ, et al. Operative management of ulnar collateral ligament insufficiency in adolescent athletes. Am J Sports Med. 2014;42(1):117-121.
24. Vitale MA, Ahmad CS. The outcome of elbow ulnar collateral ligament reconstruction in overhead athletes: a systematic review. Am J Sports Med. 2008;36(6):1193-1205.
25. Wilk KE, Meister K, Andrews JR. Current concepts in the rehabilitation of the overhead throwing athlete. Am J Sports Med. 2002;30(1):136-151.
26. Erickson BJ, Nwachukwu BU, Rosas S, et al. Trends in medial ulnar collateral ligament reconstruction in the United States: A retrospective review of a large private-payer database from 2007 to 2011. Am J Sports Med. 2015;43(7):1770-1774.
While the exact origins of the game of baseball are commonly debated, one thing is certain: statistics have been an integral part of the game since its existence.1-3 This is true at nearly every level of baseball, especially in Major League Baseball (MLB). As our knowledge and technical capabilities advance, new statistical measures of baseball performance are added at a rapid pace.1,3 One example is the Pitch f/x video tracking system (Sportvision, Inc.), which now analyzes over 60 variables on each of the estimated 660,000 pitches thrown in the MLB annually. In addition to measuring performance and production, these advancements are being leveraged to better understand the epidemiology and impact of injuries in MLB players.4,5 As with any sport, performance at the most elite level is highly dependent upon player health and functional capacity. Accordingly, player injuries can have a profound impact not only on individual performance but also on the success of the team as a whole.
The first epidemiologic study of injuries in professional baseball was published by Conte and colleagues4 in 2001. This work utilized publically available disabled list (DL) data to perform a comprehensive review of injury patterns in MLB from 1989 to 1999. They demonstrated that injuries were on the rise and that pitchers were more commonly injured (48.4% of all DL reports) and had greater time out of play compared to players of other positions.4 Shoulder and elbow injuries were responsible for 49.8% of all DL assignments, distantly followed by knee (7.3%), wrist/hand (6.1%), and back (5.0%).4 In a later study, Posner and colleagues5 analyzed DL data spanning the 2002 to 2008 seasons. Similarly, they found that injuries continued to increase, and over half (51.2%) of DL assignments occurred secondary to upper extremity injuries.5 Although the DL is primarily designed as a roster management tool rather than an injury database, it has provided valuable epidemiologic injury information through the years. Out of concern for player health and well-being, MLB and the MLB Players Association (MLBPA) worked together to create and implement an electronic medical record and Health and Injury Tracking System (HITS) for all MLB and Minor League Baseball (MiLB) players. Now active for over 5 seasons, this database has provided valuable, detailed reports regarding specific injuries occurring in professional baseball, such as hamstring strains and concussions.6,7
With shoulder and elbow injuries in pitchers representing the greatest proportion of DL assignments in recent years, a large body of literature on these injuries, particularly medial ulnar collateral ligament (MUCL) injuries, has been published.8-13 Since the initial description of MUCL reconstruction, or “Tommy John surgery,” by Dr. Frank Jobe in 1986, much has been done to improve the technique and rehabilitation to maximize player performance following surgery.10,14-16 Despite this increased attention, large-scale epidemiologic reporting of MUCL injuries in MLB is lacking, but such a report is desirable. The purpose of this work is to: 1) provide a large-scale analysis of injuries occurring in MLB baseball over the course of 18 seasons (1998-2015); 2) highlight the financial implications of these injuries; and 3) detail the evolution of MUCL injuries and reconstructive surgery since it was first performed on a MLB pitcher in 1974. Our study represents the largest longitudinal analysis of MLB injuries since the league expanded to its current level of 30 teams in 1998. It is our hope that this work will serve as a framework for future study of the most common and highest impact injuries occurring in baseball.
Materials And Methods
We performed a retrospective review of the MLB DL from 1998 to 2015. Data analyzed included player demographics such as club, year of placement, age, and position. Injury-specific variables included date of placement on DL, length of time on DL, date of reinstatement, body part injured, diagnosis, and cost of replacement. If a player was put on the DL multiple times during a season, each placement was viewed as a different injury, even if it was to the same body part. If a player was put on the DL for injuries to multiple body parts, the primary injury was analyzed.
Disabled List Data
Although the DL has existed since 1916, this current study covers 18 seasons from 1998 to 2015. The 1998 season was chosen as a starting point because this is the year when MLB expanded to 30 teams. Since then, the number of teams and the active roster limits (25 players) have remained constant, allowing for reliable comparisons across seasons. Initially designed as a roster management tool to allow injured players to temporarily be replaced with healthy players, the DL was not created as an injury database. However, the rules and regulations of the DL have remained fairly constant over the last 18 years, allowing reasonable comparisons of injury data and trends across this timespan. In order for a player to be assigned to the DL, the nature and extent of injury must be certified by a physician. Once designated for the DL, a player cannot return to the major league team for a minimum of 15 days. If the injury is severe, the player can remain on the DL for the remainder of the season or until he is deemed healthy enough to return to play by a physician. One notable exception is the treatment of concussions. Since 2011, a player diagnosed with a concussion may be placed on the DL for a minimum of 7 days rather than 15. The introduction of the HITS database in 2010 should allow for more detailed and reliable study of injuries in baseball moving forward. Although it contains robust data for every injury that has occurred in MLB and MiLB over the last 5 seasons, it does not allow for epidemiologic and longitudinal study of injury patterns and trends in baseball prior to 2010.
Cost of Placing Players on the DL
The dollars lost were calculated by prorating the injured player’s daily salary and multiplying by the number of days missed on the DL. For example, if a player’s annual salary is $1,820,000, his daily salary for the 182 day season is $10,000. If assigned to the DL for 15 days, $150,000 is paid to that player while he is inactive and unable to play. An additional cost is the salary of the replacement player who fills the roster spot. For this work, the replacement player’s prorated, daily salary was assumed to be the league minimum for that specific year. For example, if the league minimum for a given season is $182,000, and the season is 182 days long, a replacement player earns a minimum of $1,000 per day while he is on the 25-man active roster. Thus, the dollars paid to the replacement would be $15,000. In this scenario, that brings the team’s total cost to $165,000 ($150,000 plus $15,000). Because the league minimum salary changes year to year, salaries specific to the year of injury were utilized in this analysis.
MUCL Injury Analysis
In order to better understand the evaluation of MUCL injuries over time, all MLB players undergoing MUCL reconstruction (“Tommy John surgery”) were analyzed separately. Similar to prior studies of UCL injuries, these players were identified using DL data, team websites, and publically available internet databases (primarily www.heatmaps.com).9,12,17-19 Variables studied include the number of procedures, year of surgery, player position, and mean time until return to play at the MLB level. All MLB players undergoing MUCL reconstruction since 1974 (the year the first procedure was performed) were included.
Statistical Methods
Epidemiologic data are reported using descriptive statistics (mean, range, and percentage) where indicated. To determine the significance of trends over time, a best-fit line was generated to illustrate the change over the years. These lines are reported with corresponding R2 values. To assess the trend for significance, the slope was compared to a line with a slope of zero (no change over time) using t tests. For all statistical comparisons, the threshold for alpha was set to P < .05.
Results
Between 1998 and 2015, there were 8357 placements of players on the DL, at an average rate of 464 designations per year (Table 1, Figure 1). This resulted in 460,432 days lost to injury, with a mean of 25,186 days out of play per season (Table 1, Figure 2). The mean length of DL assignment per year was 55.1 days per injury, with a low of 49.1 days in 2011 and a high of 59.2 days in 2001 (Table 1, Figure 3). During the study period, the number of players placed on the DL and the total number of DL days steadily increased (P < .001 and P = .003, respectively), while the average length of DL assignments remained steady (P = .647). When analyzing the data by body region injured, the shoulder (20.6%) and elbow (19.6%) were the 2 leading causes of time out of play (Table 2). This was followed distantly by the chest/back/spine (13.7%), wrist/hand/fingers (10.1%), lower leg/knee (9.8%), and the upper leg/thigh (9.5%). Although the percentage of injuries occurring to the upper extremity remained stable, the rate of shoulder injuries steadily decreased (P = .023) as elbow injuries increased (P = .015) (Table 3, Figure 4). This inverse relationship was also demonstrated for the annual number of DL days for shoulder (P = .033) and elbow (P = 0.005) injuries (Figure 5).
Regarding the financial impact of these injuries, the mean annual cost of replacing players on the DL was $423,267,633.78 (Table 4). This ranged from a low of $136,397,147 in 1998 to a high of $694,835,359 in 2015. There was a steady increase in the cost of replacement during the study period (P < .001) that coincides with the increasing salaries during that time span (Figure 6). In total, $6,732,167,180 was paid to players assigned to the DL and $886,650,228 was spent to fill their positions. This brings the total cost of DL assignments to $7,618,817,407 for the study period.
Looking specifically at MUCL injuries, a total of 400 MUCL reconstructions have been performed on MLB players since the procedure was first developed in 1974. The vast majority of these were performed in pitchers (n = 361, 90.3%) followed by outfielders (n = 16, 4.0%), infielders (n = 14, 3.5%) and catchers (n = 9, 2.3%) (Table 5). The mean time to return to competition at the MLB level was 17.8 months for pitchers, 11.1 months for outfielders, 9.6 months for infielders, and 10.5 months for catchers. The overall mean time to return was 17.1 months. The annual number of MUCL reconstructions continues to rise dramatically (P < .001) (Figure 7). During the first 12 years (1974-1985), a total of 8 (2.0%) MUCL reconstructions were performed on MLB players. In subsequent decades, this number increased to 44 (11.0%) from 1986-1995, 123 (30.8%) from 1996-2005, and 225 (56.3%) from 2006-2015. Of all Tommy John surgeries performed over 42 years, nearly one-third (n = 131, 32.75%) were performed in the last 5 years alone (2011-2015).
Discussion
To date, a number of studies have been published on injuries in professional baseball. These can primarily be categorized as either studies with a detailed focus on a single injury type or body region6-13,17,19 or broader reviews that are limited by the relatively short time span covered.4,5 The purpose of this work was to provide a comprehensive review of injury trends in MLB since the league expanded to 30 teams in 1998 while paying special attention to the financial impact of those injuries. Additionally, we sought to provide an up-to-date review of MUCL injuries and surgeries since the procedure was first developed in 1974. Ultimately, this data demonstrates that injuries continue to rise in MLB and this increase is accompanied by increased expense for teams. Thankfully, the rates of DL assignments for shoulder injuries are on the decline; however, this decrease is countered by a reciprocal increase in elbow injuries. Similarly, the rates of MUCL reconstruction have also risen dramatically in recent years.
The fact that injury rates are on the rise is confirmed by other published reports. This trend was demonstrated in prior analyses of DL data from the 1989 to 19984 and 2002 to 2008 seasons.5 These 2 studies represent the only comprehensive reviews of MLB injury trends to date, and each provides valuable information. Both are consistent with the current study findings that pitchers are the most commonly injured players and that shoulder and elbow injuries represent about half of all injuries.4,5 Similar injury rates and characteristics have been reported at the collegiate20 and minor league levels.21 Despite this consistency, this analysis of injuries from 1998 to 2015 is the first to report that DL designations for shoulder injuries are on the decline while designations for elbow injuries continue to rise. Although the exact etiology of this decline in shoulder injuries remains unknown, there are a number of possible explanations. In recent years, increased emphasis has been placed on shoulder rehabilitation, reduction of glenohumeral internal rotation deficits, scapular stabilization, and overall kinetic chain balance and coordination. However, this does not explain why elbow injuries continue to rise annually.
With this increase in injuries, the cost of maintaining an active 25-man roster is also climbing. As expected, this growing expense is primarily due to the increased number of DL days each year as well as the increase in league salaries. Fortunately, this increased financial strain has been met with steadily increased annual revenues in professional baseball. In 2014, the prorated salary cost to players designated to the DL and their replacements was $579,568,059. This figure represents an estimated 6.4% of the $9 billion in total revenue for MLB that same year.22 Although this may represent a small percentage of the whole, it still embodies an exceptionally large financial responsibility. This does not include the medical expenses incurred to treat and rehabilitate the players’ injuries.
Every injury that occurs in MLB players has the potential to adversely affect players, teams, and MLB as a whole. With its increasing prevalence, need for surgical treatment, and prolonged return to play, injuries to the MUCL of the elbow may represent the most costly of all injuries. Although a multitude of reports on MUCL injuries, treatments, techniques, rehabilitation, and outcomes have been reported,8,9,12,14-19,23-25 to our knowledge, a comprehensive and longitudinal incidence study in MLB players has not yet been published. By including every MUCL reconstruction that has been performed on a MLB player, our study demonstrates the dramatic increase in the annual incidence of MUCL surgeries. Studies performed over shorter time intervals corroborate these findings. A recent review of a privately insured patient database revealed an annual increase in MUCL reconstructions of 4.2% in that cohort.26 When looking specifically at the MLB, a recent survey of all 30 clubs found that 25% (96 of 382) of MLB pitchers and 15% (341 of 2324) of minor league pitchers have undergone MUCL reconstruction.8 Because it occurs so frequently and requires a mean of 17 months to return to sport, MUCL injuries represent a very significant cause of time out of play.
While this study represents a unique epidemiologic report on injuries in baseball, it is certainly not without its limitations. As stated previously, it relies on DL data that was initially intended to serve as a roster management tool rather than an injury database. Accordingly, detailed and specific information about every injury is not always available. The limitations of DL data will largely be overcome in future studies thanks to the implementation of the HITS database in 2010. Moving forward, this system will allow for more detailed analysis of injury patterns, characteristics, time out of play, treatments rendered, etc. Its main limitation is that the earliest data dates back to 2010, making it less applicable for longitudinal studies like the present one. Another limitation of this study is the estimations used for the cost of replacing players designated to the DL. For each injury, it was assumed that the replacement player was paid a prorated portion of the league minimum salary while on the major league roster, but in some instances, that may not have been the case. It is possible that some players filling roster spots were already under contract for amounts higher than the league minimum. Since that player would be making that amount regardless of the level of play, the team may not have paid them any additional salary while filling the position of the injured player. The strengths of this study are its comprehensive nature and inclusion of 18 years of data, making it the longest such study of injuries in MLB. It also represents the first report of cost of replacement for players designated to the DL. To our knowledge, this study also represents the first comprehensive report of every MUCL surgery that has been performed on MLB players.
Conclusion
Injury rates continue to rise in MLB, and upper extremity injuries continue to represent approximately half of all injuries resulting in time out of play. Although shoulder injuries have been on the decline in recent years, this decline is offset by a steady increase in elbow injuries. Each year, MLB players are designated to the DL an average of 464 times for a total of 25,579.6 days. This results in a mean annual cost of over $400 million dollars to replace players lost to injury. Looking specifically at MUCL injuries, a total of 400 MUCL reconstructions have been performed in the MLB since 1974, and nearly one-third of these were performed in the last 5 years. Pitchers represent 90.3% of players requiring MUCL surgery, and the average time to return to sport for all players is 17 months. These data may serve as a foundation for identifying appropriate targets for continued study into the etiologies, strategies for prevention, and optimal treatments of injuries commonly affecting professional baseball players.
1. Lewis M. Moneyball: The Art of Winning an Unfair Game. Vol 1. New York, NY: W. W. Norton & Company; 2004.
2. Block D. Baseball Before We Knew It: A Search for the Roots of the Game. Vol 1. Lincoln, NE: Bison Books; 2006.
3. James B. The New Bill James Historical Baseball Abstract. Vol 2. Detroit, MI: Free Press; 2003.
4. Conte S, Requa RK, Garrick JG. Disability days in major league baseball. Am J Sports Med. 2001;29(4):431-436.
5. Posner M, Cameron KL, Wolf JM, Belmont PJ, Owens BD. Epidemiology of Major League Baseball injuries. Am J Sports Med. 2011;39(8):1676-1680.
6. Ahmad CS, Dick RW, Snell E, et al. Major and Minor League Baseball hamstring injuries: epidemiologic findings from the Major League Baseball Injury Surveillance System. Am J Sports Med. 2014;42(6):1464-1470.
7. Green GA, Pollack KM, D’Angelo J, et al. Mild traumatic brain injury in major and Minor League Baseball players. Am J Sports Med. 2015;43(5):1118-1126.
8. Conte SA, Fleisig GS, Dines JS, et al. Prevalence of ulnar collateral ligament surgery in professional baseball players. Am J Sports Med. 2015;43(7):1764-1769.
9. Jones KJ, Conte S, Patterson N, ElAttrache NS, Dines JS. Functional outcomes following revision ulnar collateral ligament reconstruction in Major League Baseball pitchers. J Shoulder Elb Surg. 2013;22(5):642-646.
10. Jones KJ, Osbahr DC, Schrumpf MA, Dines JS, Altchek DW. Ulnar collateral ligament reconstruction in throwing athletes: a review of current concepts. AAOS exhibit selection. J Bone Joint Surg Am. 2012;94(8):e49.
11. Dodson CC, Thomas A, Dines JS, Nho SJ, Williams RJ 3rd, Altchek DW. Medial ulnar collateral ligament reconstruction of the elbow in throwing athletes. Am J Sports Med. 2006;34(12):1926-1932.
12. Erickson BJ, Gupta AK, Harris JD, et al. Rate of return to pitching and performance after Tommy John surgery in Major League Baseball pitchers. Am J Sports Med. 2014;42(3):536-543.
13. Makhni EC, Lee RW, Morrow ZS, Gualtieri AP, Gorroochurn P, Ahmad CS. Performance, return to competition, and reinjury after Tommy John surgery in Major League Baseball pitchers: A review of 147 cases. Am J Sports Med. 2014;42(6):
1323-1332.
14. Jobe FW, Stark H, Lombardo SJ. Reconstruction of the ulnar collateral ligament in athletes. J Bone Joint Surg Am. 1986;68(8):1158-1163.
15. Rohrbough JT, Altchek DW, Hyman J, Williams RJ 3rd, Botts JD. Medial collateral ligament reconstruction of the elbow using the docking technique. Am J Sports Med. 2002;30(4):541-548.
16. Andrews JR, Jost PW, Cain EL. The ulnar collateral ligament procedure revisited: the procedure we use. Sports Health. 2012;4(5):438-441.
17. Keller RA, Steffes MJ, Zhuo D, Bey MJ, Moutzouros V. The effects of medial ulnar collateral ligament reconstruction on Major League pitching performance. J Shoulder Elbow Surg. 2014;23(11):1591-1598.
18. Marshall NE, Keller RA, Lynch JR, Bey MJ, Moutzouros V. Pitching performance and longevity after revision ulnar collateral ligament reconstruction in Major League Baseball pitchers. Am J Sports Med. 2015;43(5):1051-1056.
19. Liu JN, Garcia GH, Conte S, ElAttrache N, Altchek DW, Dines JS. Outcomes in revision Tommy John surgery in Major League Baseball pitchers. J Shoulder Elbow Surg. 2016;25(1):90-97.
20. McFarland EG, Wasik M. Epidemiology of collegiate baseball injuries. Clin J Sport Med. 1998;8(1):10-13.
21. Chambless KM, Knudtson J, Eck JC, Covington LA. Rate of injury in minor league baseball by level of play. Am J Orthop. 2000;29(11):869-872.
22. Brown M. Major League Baseball Sees Record $9 Billion In Revenues For 2014. Forbes. http://www.forbes.com/sites/maurybrown/2014/12/10/major-league-baseball-sees-record-9-billion-in-revenues-for-2014/. Published December 10, 2014. Accessed February 3, 2016.
23. Jones KJ, Dines JS, Rebolledo BJ, et al. Operative management of ulnar collateral ligament insufficiency in adolescent athletes. Am J Sports Med. 2014;42(1):117-121.
24. Vitale MA, Ahmad CS. The outcome of elbow ulnar collateral ligament reconstruction in overhead athletes: a systematic review. Am J Sports Med. 2008;36(6):1193-1205.
25. Wilk KE, Meister K, Andrews JR. Current concepts in the rehabilitation of the overhead throwing athlete. Am J Sports Med. 2002;30(1):136-151.
26. Erickson BJ, Nwachukwu BU, Rosas S, et al. Trends in medial ulnar collateral ligament reconstruction in the United States: A retrospective review of a large private-payer database from 2007 to 2011. Am J Sports Med. 2015;43(7):1770-1774.
Guttate Psoriasis Outcomes
Guttate psoriasis (GP) typically occurs abruptly following an acute infection such as streptococcal pharyngitis. It is thought to have a good prognosis and show rapid resolution; however, there are limited studies addressing long-term outcomes of GP, particularly the probability of developing chronic plaque psoriasis (PP) following a single episode of acute GP.
Ko et al1 reported a long-term follow-up study of Korean patients with acute GP. The investigators determined that 19 of 36 participants (38.9%) with acute GP went on to develop chronic PP over a mean follow-up period of 6.3 years. Martin et al2 reported a smaller follow-up study of 15 patients in England; 5 of 15 patients (33.3%) developed chronic PP within 10 years.
Methods
A retrospective cohort study was performed using data from the Geisinger Medical Center (Danville, Pennsylvania) electronic medical records from January 2000 to September 2012 to identify medical records that showed a specific clinical diagnosis of GP or a diagnosis of either dermatitis or psoriasis with a positive molecular probe for streptococci or antistreptolysin O (ASO) titer. (A molecular probe is used in place of culture for streptococcal pharyngeal specimens at our institution.) A separate search of the Co-Path database for biopsy-proven GP also was performed. Each medical record was reviewed by one of the authors (L.F.P.) to confirm the true diagnosis of GP. Exclusion criteria included a prior diagnosis of PP or a follow-up period of less than 1 year. Based on this chart review, the prevalence of developing chronic PP in patients with GP was determined. The patients were split into 2 cohorts: those who had a single episode of GP with resolution versus those who developed PP. We compared the clinical characteristics to those who developed chronic PP. The clinical characteristics that were recorded included patient age; whether or not the patient developed PP; length of time for clearance of GP; molecular probe or ASO results; family history; GP treatment used; smoking status; and comorbid conditions such as hyperlipidemia, hypertension, diabete mellitus, and obesity, which were lumped under the category of metabolic syndrome due to their low prevalence individually.
The study group data set contained 79 patients with GP who had a history of at least 1 year of follow-up. Descriptive statistics of the patients were provided for continuous and categorical variables in the study. Continuous variables were described using the mean and SD or, for skewed distributions, the median and interquartile range (25th-75th percentiles), while categorical variables were presented using frequency counts and percentages. Comparisons between groups were tested using 2-sample t tests or Wilcoxon rank sum tests, or Pearson χ2 or Fisher exact tests, as appropriate.
Results
A total of 79 patients were included in the study. Descriptive statistics for the total patient population as well as those who did and did not develop PP are shown in Table 1. The median age of patients was 37 years. The median follow-up time was 5 years. The majority of patients were female (68.4%). There were 20 patients (25.3%) who developed PP and 59 (74.7%) who did not (95% CI, 0.1-0.36).
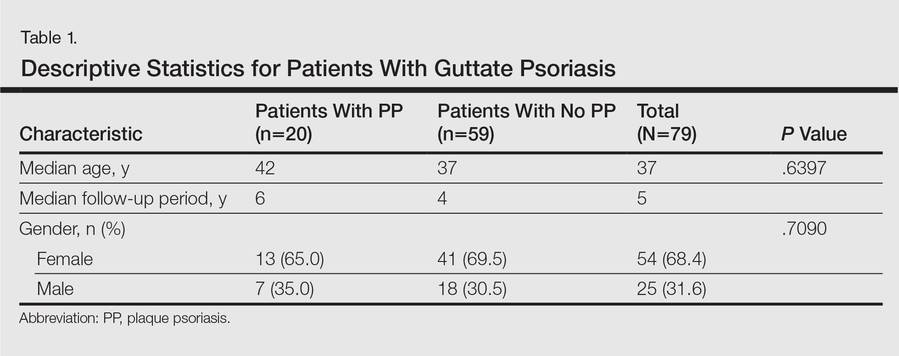
Molecular probes for streptoccoci were obtained from 31 patients (39.2%) during the workup for GP. Patients who had a molecular probe and developed PP were less likely to have had a molecular probe that was positive for streptococci versus patients who did not develop PP (0% vs 61.5%; P=.0177)(Table 2). Patients who developed PP were more likely to have persistent GP at 12 months than patients who did not develop PP (26.3% vs 6.8%, respectively; P=.0414). At the end of the observation period, 4 patients (5.1%) did not yet show GP clearance. The patients who developed PP were more likely to have had a case of GP that never cleared than patients who did not develop PP (15.8% vs 1.7%; P=.0505)(Table 3).
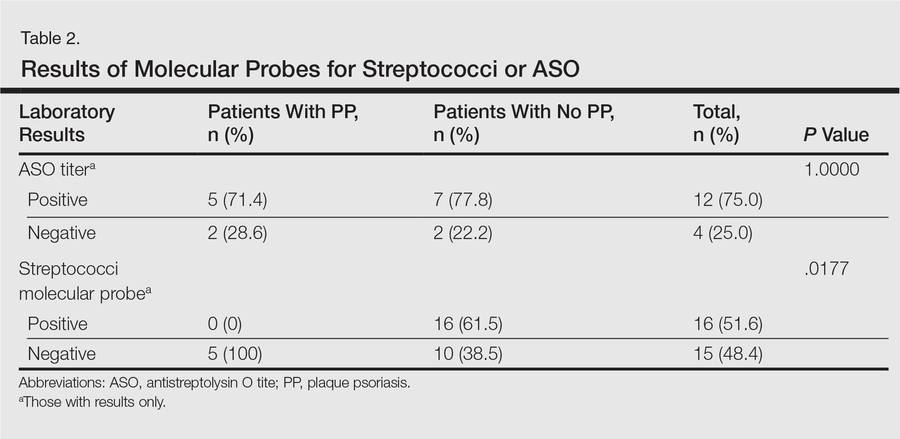
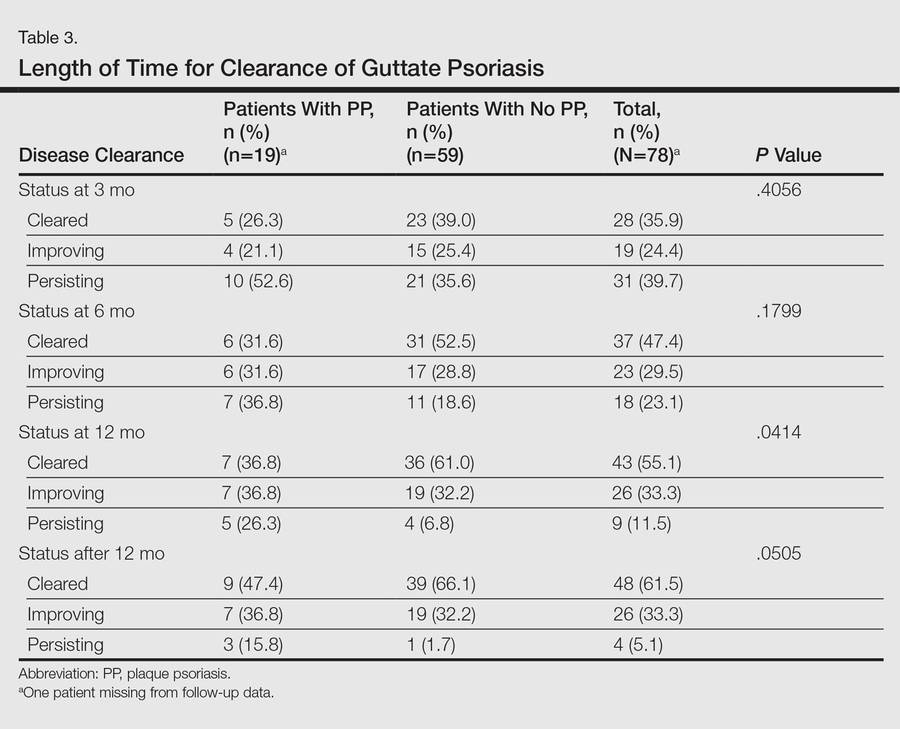
No significant differences were detected among those who developed PP compared to those who did not with respect to any degree of family history of psoriasis (22.2% vs 26.4%; P=1.0000)(Table 4). There were no significant differences in the value of a positive ASO titer between groups (Table 2), but it should be noted that the small number of patients with positive values in each group impacts a test’s power to detect statistically significant differences. There were no significant differences in the likelihood of developing PP if a patient was treated with systemic steroids or antibiotics (data not shown). Additionally, smoking status, hyperlipidemia, hypertension, diabetes mellitus, and obesity were not predictive of evolution of GP into PP (data not shown).
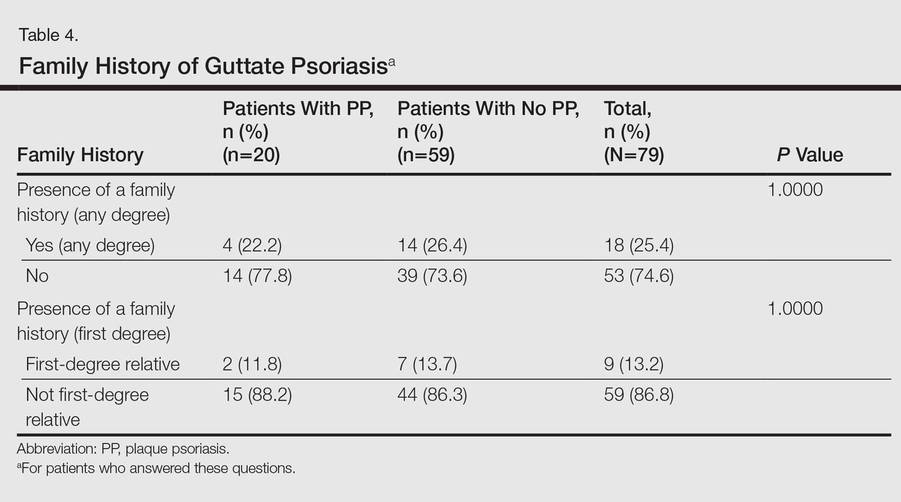
Comment
Ryan et al3 noted in a report on research gaps in psoriasis that studies are needed to validate frequency and characteristic factors associated with spontaneous remission for different phenotypes of psoriasis, including disease severity, patient age, morphologic attributes of plaques, and comorbidities. Our analysis attempts to bridge this gap in reference to type, specifically GP, and factors associated with development of chronic PP.
Our study showed that 20 of 79 patients (25.3%) with GP went on to develop chronic PP. The incidence is slightly lower than in prior smaller studies from Korea and England, which reported incidence rates of 38.9% and 33.3%, respectively.1,2 Although Ko et al1 noted that a younger age of onset was more frequently found in the cohort with complete remission of GP, this finding was not observed in our study. Although only a minority of patients underwent a molecular probe for streptococci, of those who were tested and had positive results, they were significantly less likely to develop chronic PP (P=.0177). This finding supports the classic teaching that GP originates after an episode of a streptococcal infection. Of those who developed PP, only one-fourth had been tested for streptococci via molecular probe and all were negative. Interestingly, there was no difference noted in those that had ASO titers drawn (P=1.0000). Although the data were too low to achieve statistical significance, this finding contrasts with Ko et al1 who reported that a high ASO titer correlated with a good prognosis (ie, GP did not evolve into PP). There was no difference in the likelihood of developing PP seen in patients that were treated with antibiotics (P=.1651), suggesting that obtaining a molecular probe that is positive for streptococci may be predictive of prognosis (ie, resolution) and thus is a reasonable diagnostic test to obtain. We do recognize that nonpharyngeal sources for streptococci may occur (ie, perianal), but these data were not captured in our patient population.
In our study, patients were more likely to develop chronic PP if they had a GP history that was longer than 12 months. Ko et al1 also showed that GP patients who did not develop PP were typically cleared after 8 months. There were no statistical differences noted when comparing the different treatments used to treat GP. It appears that the rapidity with which the episode clears is more predictive than the method used to clear it.
There were several limitations to this study including the small number of patients, the median 5-year follow-up time, and the retrospective design.
Conclusion
Based on our cohort study, we have concluded that GP evolves into chronic PP in approximately 25% of cases. Obtaining a group A streptococcal molecular probe or culture may serve as a prognostic tool, as physicians should recognize that GP flares associated with a positive result indicate a favorable prognosis. Additionally, GP flares that resolve within the first year of an outbreak, regardless of treatment choice, are less likely to be followed by chronic PP.
- Ko HC, Jwa SW, Song M, et al. Clinical course of guttate psoriasis: long-term follow up study. J Dermatol. 2010;37:894-899.
- Martin BA, Chalmers RJ, Telfer NR. How great is the risk of further psoriasis following a single episode of acute guttate psoriasis? Arch Dermatol. 1996;132:717-718.
- Ryan C, Korman NJ, Gelfand JM, et al. Research gaps in psoriasis: opportunities for future studies. J Am Acad Dermatol. 2014;70:146-167.
Guttate psoriasis (GP) typically occurs abruptly following an acute infection such as streptococcal pharyngitis. It is thought to have a good prognosis and show rapid resolution; however, there are limited studies addressing long-term outcomes of GP, particularly the probability of developing chronic plaque psoriasis (PP) following a single episode of acute GP.
Ko et al1 reported a long-term follow-up study of Korean patients with acute GP. The investigators determined that 19 of 36 participants (38.9%) with acute GP went on to develop chronic PP over a mean follow-up period of 6.3 years. Martin et al2 reported a smaller follow-up study of 15 patients in England; 5 of 15 patients (33.3%) developed chronic PP within 10 years.
Methods
A retrospective cohort study was performed using data from the Geisinger Medical Center (Danville, Pennsylvania) electronic medical records from January 2000 to September 2012 to identify medical records that showed a specific clinical diagnosis of GP or a diagnosis of either dermatitis or psoriasis with a positive molecular probe for streptococci or antistreptolysin O (ASO) titer. (A molecular probe is used in place of culture for streptococcal pharyngeal specimens at our institution.) A separate search of the Co-Path database for biopsy-proven GP also was performed. Each medical record was reviewed by one of the authors (L.F.P.) to confirm the true diagnosis of GP. Exclusion criteria included a prior diagnosis of PP or a follow-up period of less than 1 year. Based on this chart review, the prevalence of developing chronic PP in patients with GP was determined. The patients were split into 2 cohorts: those who had a single episode of GP with resolution versus those who developed PP. We compared the clinical characteristics to those who developed chronic PP. The clinical characteristics that were recorded included patient age; whether or not the patient developed PP; length of time for clearance of GP; molecular probe or ASO results; family history; GP treatment used; smoking status; and comorbid conditions such as hyperlipidemia, hypertension, diabete mellitus, and obesity, which were lumped under the category of metabolic syndrome due to their low prevalence individually.
The study group data set contained 79 patients with GP who had a history of at least 1 year of follow-up. Descriptive statistics of the patients were provided for continuous and categorical variables in the study. Continuous variables were described using the mean and SD or, for skewed distributions, the median and interquartile range (25th-75th percentiles), while categorical variables were presented using frequency counts and percentages. Comparisons between groups were tested using 2-sample t tests or Wilcoxon rank sum tests, or Pearson χ2 or Fisher exact tests, as appropriate.
Results
A total of 79 patients were included in the study. Descriptive statistics for the total patient population as well as those who did and did not develop PP are shown in Table 1. The median age of patients was 37 years. The median follow-up time was 5 years. The majority of patients were female (68.4%). There were 20 patients (25.3%) who developed PP and 59 (74.7%) who did not (95% CI, 0.1-0.36).
Molecular probes for streptoccoci were obtained from 31 patients (39.2%) during the workup for GP. Patients who had a molecular probe and developed PP were less likely to have had a molecular probe that was positive for streptococci versus patients who did not develop PP (0% vs 61.5%; P=.0177)(Table 2). Patients who developed PP were more likely to have persistent GP at 12 months than patients who did not develop PP (26.3% vs 6.8%, respectively; P=.0414). At the end of the observation period, 4 patients (5.1%) did not yet show GP clearance. The patients who developed PP were more likely to have had a case of GP that never cleared than patients who did not develop PP (15.8% vs 1.7%; P=.0505)(Table 3).
No significant differences were detected among those who developed PP compared to those who did not with respect to any degree of family history of psoriasis (22.2% vs 26.4%; P=1.0000)(Table 4). There were no significant differences in the value of a positive ASO titer between groups (Table 2), but it should be noted that the small number of patients with positive values in each group impacts a test’s power to detect statistically significant differences. There were no significant differences in the likelihood of developing PP if a patient was treated with systemic steroids or antibiotics (data not shown). Additionally, smoking status, hyperlipidemia, hypertension, diabetes mellitus, and obesity were not predictive of evolution of GP into PP (data not shown).
Comment
Ryan et al3 noted in a report on research gaps in psoriasis that studies are needed to validate frequency and characteristic factors associated with spontaneous remission for different phenotypes of psoriasis, including disease severity, patient age, morphologic attributes of plaques, and comorbidities. Our analysis attempts to bridge this gap in reference to type, specifically GP, and factors associated with development of chronic PP.
Our study showed that 20 of 79 patients (25.3%) with GP went on to develop chronic PP. The incidence is slightly lower than in prior smaller studies from Korea and England, which reported incidence rates of 38.9% and 33.3%, respectively.1,2 Although Ko et al1 noted that a younger age of onset was more frequently found in the cohort with complete remission of GP, this finding was not observed in our study. Although only a minority of patients underwent a molecular probe for streptococci, of those who were tested and had positive results, they were significantly less likely to develop chronic PP (P=.0177). This finding supports the classic teaching that GP originates after an episode of a streptococcal infection. Of those who developed PP, only one-fourth had been tested for streptococci via molecular probe and all were negative. Interestingly, there was no difference noted in those that had ASO titers drawn (P=1.0000). Although the data were too low to achieve statistical significance, this finding contrasts with Ko et al1 who reported that a high ASO titer correlated with a good prognosis (ie, GP did not evolve into PP). There was no difference in the likelihood of developing PP seen in patients that were treated with antibiotics (P=.1651), suggesting that obtaining a molecular probe that is positive for streptococci may be predictive of prognosis (ie, resolution) and thus is a reasonable diagnostic test to obtain. We do recognize that nonpharyngeal sources for streptococci may occur (ie, perianal), but these data were not captured in our patient population.
In our study, patients were more likely to develop chronic PP if they had a GP history that was longer than 12 months. Ko et al1 also showed that GP patients who did not develop PP were typically cleared after 8 months. There were no statistical differences noted when comparing the different treatments used to treat GP. It appears that the rapidity with which the episode clears is more predictive than the method used to clear it.
There were several limitations to this study including the small number of patients, the median 5-year follow-up time, and the retrospective design.
Conclusion
Based on our cohort study, we have concluded that GP evolves into chronic PP in approximately 25% of cases. Obtaining a group A streptococcal molecular probe or culture may serve as a prognostic tool, as physicians should recognize that GP flares associated with a positive result indicate a favorable prognosis. Additionally, GP flares that resolve within the first year of an outbreak, regardless of treatment choice, are less likely to be followed by chronic PP.
- Ko HC, Jwa SW, Song M, et al. Clinical course of guttate psoriasis: long-term follow up study. J Dermatol. 2010;37:894-899.
- Martin BA, Chalmers RJ, Telfer NR. How great is the risk of further psoriasis following a single episode of acute guttate psoriasis? Arch Dermatol. 1996;132:717-718.
- Ryan C, Korman NJ, Gelfand JM, et al. Research gaps in psoriasis: opportunities for future studies. J Am Acad Dermatol. 2014;70:146-167.
Practice Points
- Following an initial episode of guttate psoriasis, a patient has a 25.3% chance of developing plaque psoriasis (PP).
- A streptococci culture can be prognostic; if the culture is positive, the patient is less likely to develop PP.
- If the patient’s rash clears within 1 year, he/she is less likely to develop PP.

Psychiatric Morbidity in Patients With Psoriasis
Psoriasis is a common immune-mediated papulosquamous skin disease with a generally chronic course. Impairments in quality of life (QOL) and psychological morbidity in the form of anxiety and depression have been reported.1 Because psoriasis is not known to directly affect the central nervous system, the associated psychiatric morbidity is likely caused by the complex interplay of the stress, physical discomfort, and possible disfigurement inherent to psoriasis, as well as the emotional response to the condition mediated by the patient’s personality, emotional and cognitive state, and other social factors (eg, self-stigma and perceived stigma, lack of knowledge about the illness in the patient and in the community and family, lack of resources and support).2 Because a variety of methodologies have been used in research on the association of psoriasis with psychiatric morbidity, it is not easy to compare findings. Most studies have assessed psychiatric symptoms rather than findings from psychiatric diagnostic instruments.3 The diagnosis of psychiatric disorders in patients with psoriasis rather than focusing on symptoms alone is likely to be more useful in generating scientific epidemiologic data and also would serve as a guide in making treatment and policy decisions. Validated clinician-rated instruments are useful in generating these data. However, psychiatric diagnoses are often missed by dermatologists, which may have an adverse impact on eventual outcomes in psoriasis patients.4,5 Patient-assessed diagnostic instruments may help dermatologists overcome this problem.
This study investigated the prevalence and determinants of psychiatric disorders in a cohort of psoriasis patients in North India using both patient self-assessment and clinician-administered instruments.
Methods
Study Participants
The study was conducted from January 2013 to November 2013 at the Postgraduate Institute of Medical Education and Research, a tertiary-level teaching hospital in Chandigarh, India, which serves the population of a large geographic area in North India. Clearance for this study was obtained from the institute ethics committee.
Patients with chronic plaque psoriasis who presented consecutively to the outpatient clinic of the Departments of Dermatology, Venereology, and Leprology during the study period were approached for participation. Written informed consent was obtained from all participants. Inclusion criteria were the ability to read the self-assessment questionnaires, and no financial compensation was offered for inclusion in the study. Patients with psoriatic arthritis as well as erythrodermic and pustular variants of psoriasis were excluded. Exclusion criteria also included patients with known diabetes mellitus, cardiovascular disease, chronic respiratory ailments, or other notable systemic comorbidities; however, patients did not undergo biochemical testing.
Assessments
A 2-stage methodology was employed. In the first stage of the assessment, sociodemographic and clinical data were recorded. Thereafter, psychiatric symptoms and morbidity were assessed using the patient health questionnaire (PHQ).6 Quality of life was assessed using the dermatology life quality index (DLQI).7 Both tools were based on patient self-assessment. Study participants could seek assistance from the clinician in completing the questionnaires, if needed. Psoriasis severity was evaluated by the clinician using the psoriasis area severity index (PASI) score.8
In the second stage of the assessment, participants underwent subsequent evaluation by a psychiatrist who was blinded to the results of the first assessments. All participants were screened using the Mini international neuropsychiatric interview (MINI)9 and a formal psychiatric diagnosis was made. In subsequent analyses, we considered psychiatric diagnoses as generated with MINI as the gold standard against which other results were compared.
A participant was considered positive for psychiatric morbidity if he/she was positive for at least 1 PHQ or MINI diagnosis.
To assess for concordance between the 2 diagnostic instruments, the following diagnostic groups were compared against each other: (1) MINI depressive disorders (DDs)(ie, major depressive episode, current and recurrent; dysthymia) versus PHQ depressive disorders (ie, major DDs and other DDs); (2) MINI anxiety disorders (ie, panic disorder and generalized anxiety disorder) versus PHQ anxiety disorders (ie, panic syndrome and other anxiety syndromes); (3) MINI alcohol abuse (ie, alcohol dependence and abuse) versus PHQ alcohol abuse; (4) comorbid disorders if more than 1 diagnosis was made; and (5) any positive score on the MINI suicide module with a response other than not at all on PHQ depression module item 2(i), which deals with thoughts of self-harm and wishing that one was dead. The MINI depressive disorders and PHQ depressive disorders indicate the presence of a clinically significant depressive state and a need for assessment and treatment.
The PHQ can be used to diagnose somatoform disorders, while the MINI cannot be used. Because the somatoform disorders diagnosed were few in number and comorbid with DDs (n=3) and anxiety disorders (n=1), we included these cases with DDs and anxiety disorders, respectively, for purposes of statistical analysis. All data were analyzed using SPSS software.
Results
One hundred four participants were included in this study. The sociodemographic, clinical, and diagnostic profiles, as well as the determinants of MINI diagnosis, are provided in Tables 1 through 4. The PASI and DLQI scores indicated that most participants had mild to moderate psoriasis severity.10 The prevalence of alcohol-related disorders was only found in the male subpopulation, which is consistent with the sociocultural context of North India. Psoriasis severity (ie, PASI score) was not found to be a determinant of psychiatric diagnoses in the study population. There was no statistical difference in measures of current clinical status and treatment modality when those with or without any psychiatric diagnoses were compared. When the variables of disease duration, treatment duration, and DLQI were entered into a binary logistic regression with positive status for a MINI diagnosis as a dependent variable indicating the presence of a psychiatric disorder, it was found that the DLQI score was a significant predictor (b=0.19; SE=0.47; χ2=17.92; P<.05). This finding was the same for regression analyses for males and females separately and also for DD as a dependent variable.
Mean DLQI and PASI scores were positively correlated with each other (Pearson r=0.23; P=.01). This relationship was maintained in males (Pearson r=0.24; P=.03) but not in females (Pearson r=0.14; P=.30). The correlations between DLQI and PASI scores and both disease duration and treatment duration were not significant. The Cohen κ values for the interrater reliability analyses done to assess the concordance of the PHQ and MINI diagnostic groups were modest (0.31-0.42), which was true even when MINI depressive disorders without dysthymia and PHQ depressive disorders were compared.
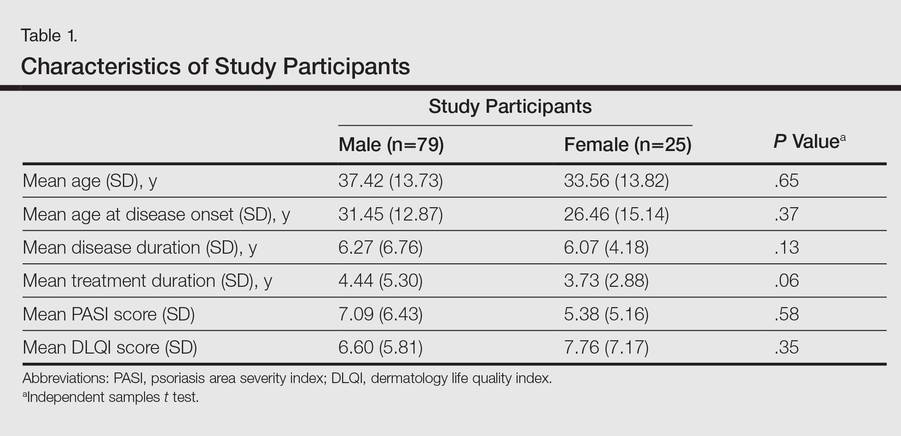
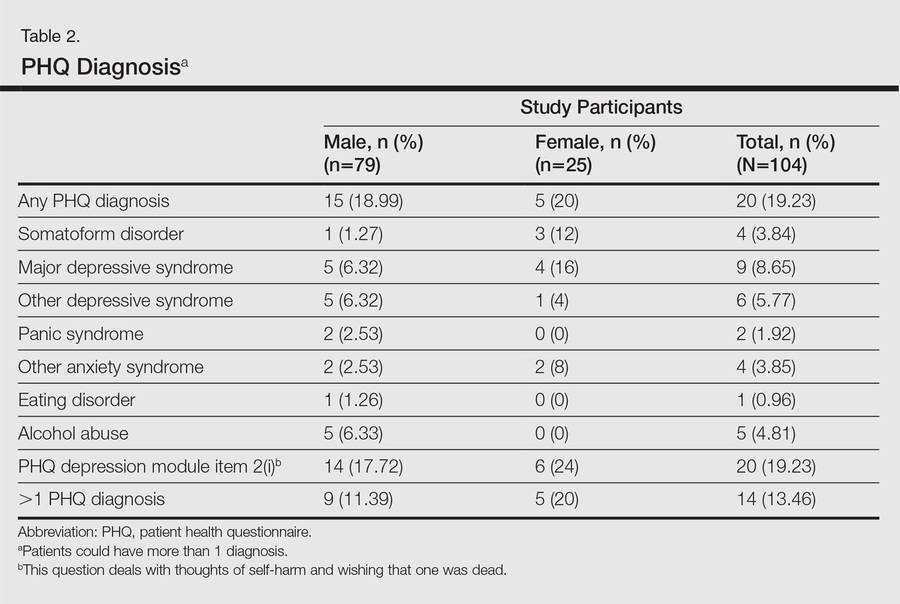
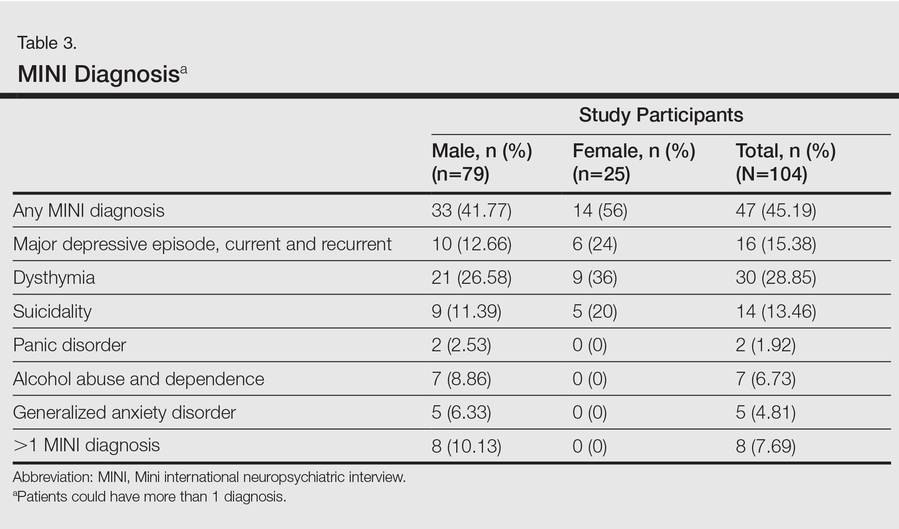
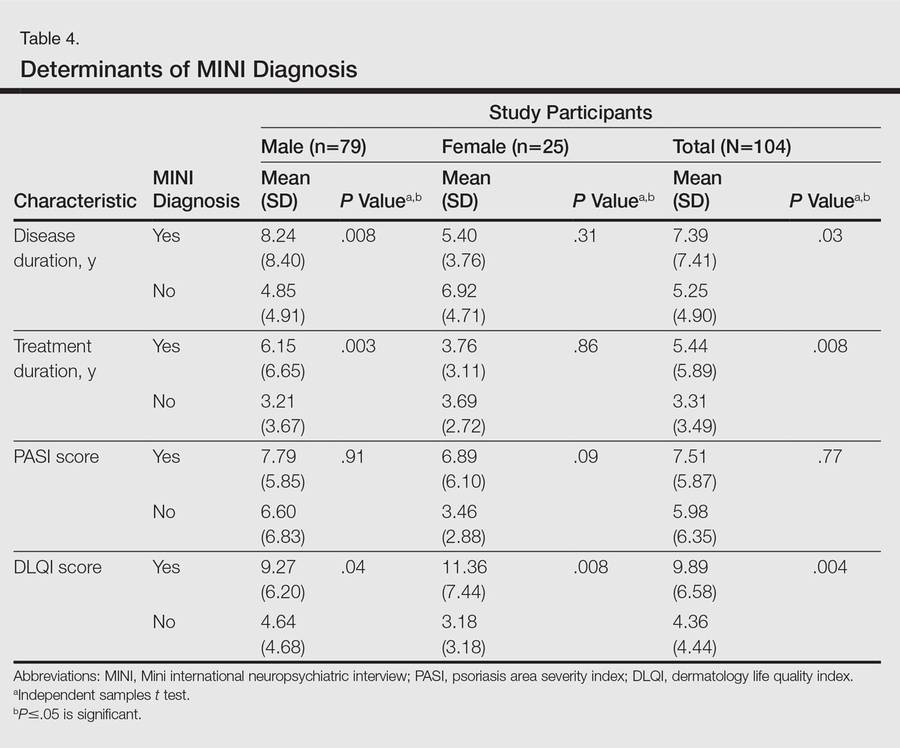
Comment
Studies investigating psychiatric morbidity in psoriasis have varying methodologies, mostly assessing psychiatric symptoms rather than screening for psychiatric disorders.3 In chronic diseases such as psoriasis, there often is an overlap between disease symptoms and common psychiatric disorders (eg, depression).11 Therefore, assessment of symptoms can be misleading. The current study was designed to detect psychiatric disorders in psoriasis patients using both patient self-assessment and clinician-administered instruments. We also investigated the contribution of sociodemographic and clinical variables (eg, psoriasis severity, impairment in QOL) on psychiatric morbidity.
An increased risk for depression, anxiety, and suicidality associated with greater psoriasis severity has been reported.12 The results of the current study indicate that even in a patient population with predominantly mild to moderate psoriasis, psychiatric morbidity, particularly DDs, is common. This finding was seen both on patient self-assessment and clinician-administered evaluations. Earlier studies from this institution and region have reported a lower prevalence of psychiatric disorders in patients with psoriasis (24.7%–36.7%).13-16 However, prior studies were based on assessment of specific symptoms and clinical diagnoses derived from history and mental status examination rather than the administration of more rigorous research diagnostic assessment tools. A systematic review and meta-analysis also revealed a lower prevalence of clinical depression using International Classification of Diseases, Tenth Revision, and Diagnostic and Statistical Manual of Mental Disorders (Fourth Edition) codes.3 A possible reason for this apparent discrepancy is the fact that psychiatric morbidity in a majority of participants in the current study was constituted by the diagnosis of dysthymia. If the diagnosis of dysthymia is removed from the current analysis, the prevalence of clinical major depressive syndromes is similar to other data. We found that chronic low-grade depression (dysthymia) was the most common diagnosis from the MINI. Lower prevalence was noted in a prior study, but methodology using clinical interviewing may have resulted in an underestimated prevalence.13 It also is possible that chronic low-grade depression in psoriasis patients may be missed or underestimated in comparison to more readily diagnosed and severe depressive syndromes in other studies. However, there is enough evidence to suggest that dysthymia is clinically relevant in the causation of morbidity and disability (eg, physical, psychological, or cognitive impairment) in patients with chronic physical disorders.17 This distinction between clinical major depressive syndrome and dysthymia is important because different treatment methods may be required; the former may warrant treatment with antidepressants in addition to psychosocial treatment modalities (eg, learning to cope with stress, problem-solving techniques), while the latter may benefit predominantly from psychosocial treatment modalities alone.18,19 In the current study, most of the participants who were diagnosed with dysthymia refused treatment with any psychotropic medications but perceived benefit from discussing their problems with a professional. Our results indicated that chronic low-grade depression is more common than more severe major depressive states, and mental health professionals who are well versed in psychosocial treatment modalities should play an integral role in treatment planning for patients with psoriasis.
In the current study, there was only a modest correlation between the results of the patient self-assessment and clinician-administered evaluations, which indicated that psychiatric disorders may not be obvious to clinicians unless specifically investigated, even for some severely depressed and suicidal patients. Given the high prevalence of clinically relevant psychiatric morbidity among psoriasis patients, dermatology professionals should be more sensitive to the possible presence of psychiatric disorders in this patient population and should consider the use of formal screening or other diagnostic tools for detection of depression and anxiety in psoriasis patients.
The main determinant of psychiatric morbidity in our study population was impairment in QOL. Interestingly enough, psoriasis severity was not associated with psychiatric morbidity in our study. Depressive states in patients with chronic physical illnesses are well known and could be due to the chronic stress of illness or impaired QOL, or depression may be a direct effect of the illness and/or treatment on the central nervous system. Psoriasis is not known to have any direct effect on the central nervous system. Our findings suggest that QOL impairment plays an important role in psychiatric morbidity in patients with psoriasis. Even though the DLQI is designed to measure QOL over the preceding week, our findings suggest that impairment in QOL in psoriasis is a manifestation of a more long-term effect of interplay between many factors; the impairment in activities of daily living, disease-related physical discomfort and impaired self-esteem and self-perception, impairments in interpersonal relationships, and the stress of chronicity of illness seem to play an important role. Additionally, variables such as emotional dysfunction, magnitude and site of the area of involvement, nature and magnitude of comorbidities, and complications of illness and coping also may be relevant.20 Although these factors are common in other chronic disorders, psoriasis in particular may predisposepatients to depression due to its unpredictable and relapsing nature, lack of any curative therapy, and the stigmatizing prominent lesions that often are impossible to camouflage. In chronic diseases such as psoriasis, the amelioration of impairment of different aspects of QOL may be more important than mere symptom control.
Our study was limited in that the study population was predominantly male. Fewer females may have consented to participate in the study due to time constraints associated with domestic responsibilities, reluctance to discuss psychological distress, or inability to meet the inclusion criteria (eg, level of education required to read questionnaires). However, there was no significant difference between males and females for sociodemographic variables or diagnoses other than alcohol-related disorders. Our study also had a cross-sectional design and there was no control group, without which it is difficult to assess the true prevalence and determinants of these psychiatric morbidities. Moreover, the sample size was small and did not include enough participants with moderate to severe psoriasis (ie, PASI score ≥10) to be able to detect a correlation between psychiatric morbidities and psoriasis severity. Our findings underline the need for effective screening and integrated management of psychiatric disorders in patients with psoriasis.
- Griffiths CE, Barker JN. Pathogenesis and clinical features of psoriasis. Lancet. 2007;370:263-271.
- Fried RG, Gupta MA, Gupta AK. Depression and skin disease. Dermatol Clin. 2005;23:657-664.
- Dowlatshahi EA, Wakkee M, Arends LR, et al. The prevalence and odds of depressive symptoms and clinical depression in psoriasis patients: a systematic review and meta-analysis. J Invest Dermatol. 2014;134:1542-1551.
- Richards HL, Fortune DG, Weidmann A, et al. Detection of psychological distress in patients with psoriasis: low consensus between dermatologist and patient. Br J Dermatol. 2004;151:1227-1233.
- Scharloo M, Kaptein AA, Weinman J, et al. Patients’ illness perceptions and coping as predictors of functional status in psoriasis: a 1-year follow-up. Br J Dermatol. 2000;142:899-907.
- Spitzer RL, Kroenke K, Williams JB. Validation and utility of a self-report version of PRIME-MD: the PHQ primary care study. primary care evaluation of mental disorders. patient health questionnaire. JAMA. 1999;282:1737-1744.
- Finlay AY, Khan GK. Dermatology Life Quality Index (DLQI)—a simple practical measure for routine clinical use. Clin Exp Dermatol. 1994;19:210-216.
- Langley RG, Ellis CN. Evaluating psoriasis with Psoriasis Area and Severity Index, Psoriasis Global Assessment, and Lattice System Physician’s Global Assessment. J Am Acad Dermatol. 2004;51:563-569.
- Sheehan DV, Lecrubier Y, Sheehan KH, et al. The Mini-International Neuropsychiatric Interview (M.I.N.I.): the development and validation of a structured diagnostic psychiatric interview for DSM-IV and ICD-10. J Clin Psychiatry. 1998;59(suppl 20):22-33, quiz 34-57.
- Mrowietz U, Kragballe K, Reich K, et al. Definition of treatment goals for moderate to severe psoriasis: a European consensus. Arch Dermatol Res. 2011;303:1-10.
- Ellis GK, Robinson JA, Crawford GB. When symptoms of disease overlap with symptoms of depression. Aust Fam Physician. 2006;35:647-649.
- Kurd SK, Troxel AB, Crits-Christoph P, et al. The risk of depression, anxiety, and suicidality in patients with psoriasis: a population-based cohort study. Arch Dermatol. 2010;146:891-895.
- Kumar V, Mattoo SK, Handa S. Psychiatric morbidity in pemphigus and psoriasis: a comparative study from India. Asian J Psychiatry. 2013;6:151-156.
- Mattoo S, Handa S, Kaur I, et al. Psychiatric morbidity in psoriasis: prevalence and correlates in India. Ger J Psychiatry. 2005;8:17-22.
- Mattoo SK, Handa S, Kaur I, et al. Psychiatric morbidity in vitiligo and psoriasis: a comparative study from India. J Dermatol. 2001;28:424-432.
- Mehta V, Malhotra S. Psychiatric evaluation of patients with psoriasis vulgaris and chronic urticaria. Ger J Psychiatry. 2007;10:104-110.
- Meeks TW, Vahia IV, Lavretsky H, et al. A tune in “a minor” can “b major”: a review of epidemiology, illness course, and public health implications of subthreshold depression in older adults. J Affect Disord. 2011;129:126-142.
- Hegerl U, Schönknecht P, Mergl R. Are antidepressants useful in the treatment of minor depression: a critical update of the current literature. Curr Opin Psychiatry. 2012;25:1-6.
- Rizzo M, Creed F, Goldberg D, et al. A systematic review of non-pharmacological treatments for depression in people with chronic physical health problems. J Psychosom Res. 2011;71:18-27.
- de Korte J, Sprangers MA, Mombers FM, et al. Quality of life in patients with psoriasis: a systematic literature review. J Investig Dermatol Symp Proc. 2004;9:140-147.
Psoriasis is a common immune-mediated papulosquamous skin disease with a generally chronic course. Impairments in quality of life (QOL) and psychological morbidity in the form of anxiety and depression have been reported.1 Because psoriasis is not known to directly affect the central nervous system, the associated psychiatric morbidity is likely caused by the complex interplay of the stress, physical discomfort, and possible disfigurement inherent to psoriasis, as well as the emotional response to the condition mediated by the patient’s personality, emotional and cognitive state, and other social factors (eg, self-stigma and perceived stigma, lack of knowledge about the illness in the patient and in the community and family, lack of resources and support).2 Because a variety of methodologies have been used in research on the association of psoriasis with psychiatric morbidity, it is not easy to compare findings. Most studies have assessed psychiatric symptoms rather than findings from psychiatric diagnostic instruments.3 The diagnosis of psychiatric disorders in patients with psoriasis rather than focusing on symptoms alone is likely to be more useful in generating scientific epidemiologic data and also would serve as a guide in making treatment and policy decisions. Validated clinician-rated instruments are useful in generating these data. However, psychiatric diagnoses are often missed by dermatologists, which may have an adverse impact on eventual outcomes in psoriasis patients.4,5 Patient-assessed diagnostic instruments may help dermatologists overcome this problem.
This study investigated the prevalence and determinants of psychiatric disorders in a cohort of psoriasis patients in North India using both patient self-assessment and clinician-administered instruments.
Methods
Study Participants
The study was conducted from January 2013 to November 2013 at the Postgraduate Institute of Medical Education and Research, a tertiary-level teaching hospital in Chandigarh, India, which serves the population of a large geographic area in North India. Clearance for this study was obtained from the institute ethics committee.
Patients with chronic plaque psoriasis who presented consecutively to the outpatient clinic of the Departments of Dermatology, Venereology, and Leprology during the study period were approached for participation. Written informed consent was obtained from all participants. Inclusion criteria were the ability to read the self-assessment questionnaires, and no financial compensation was offered for inclusion in the study. Patients with psoriatic arthritis as well as erythrodermic and pustular variants of psoriasis were excluded. Exclusion criteria also included patients with known diabetes mellitus, cardiovascular disease, chronic respiratory ailments, or other notable systemic comorbidities; however, patients did not undergo biochemical testing.
Assessments
A 2-stage methodology was employed. In the first stage of the assessment, sociodemographic and clinical data were recorded. Thereafter, psychiatric symptoms and morbidity were assessed using the patient health questionnaire (PHQ).6 Quality of life was assessed using the dermatology life quality index (DLQI).7 Both tools were based on patient self-assessment. Study participants could seek assistance from the clinician in completing the questionnaires, if needed. Psoriasis severity was evaluated by the clinician using the psoriasis area severity index (PASI) score.8
In the second stage of the assessment, participants underwent subsequent evaluation by a psychiatrist who was blinded to the results of the first assessments. All participants were screened using the Mini international neuropsychiatric interview (MINI)9 and a formal psychiatric diagnosis was made. In subsequent analyses, we considered psychiatric diagnoses as generated with MINI as the gold standard against which other results were compared.
A participant was considered positive for psychiatric morbidity if he/she was positive for at least 1 PHQ or MINI diagnosis.
To assess for concordance between the 2 diagnostic instruments, the following diagnostic groups were compared against each other: (1) MINI depressive disorders (DDs)(ie, major depressive episode, current and recurrent; dysthymia) versus PHQ depressive disorders (ie, major DDs and other DDs); (2) MINI anxiety disorders (ie, panic disorder and generalized anxiety disorder) versus PHQ anxiety disorders (ie, panic syndrome and other anxiety syndromes); (3) MINI alcohol abuse (ie, alcohol dependence and abuse) versus PHQ alcohol abuse; (4) comorbid disorders if more than 1 diagnosis was made; and (5) any positive score on the MINI suicide module with a response other than not at all on PHQ depression module item 2(i), which deals with thoughts of self-harm and wishing that one was dead. The MINI depressive disorders and PHQ depressive disorders indicate the presence of a clinically significant depressive state and a need for assessment and treatment.
The PHQ can be used to diagnose somatoform disorders, while the MINI cannot be used. Because the somatoform disorders diagnosed were few in number and comorbid with DDs (n=3) and anxiety disorders (n=1), we included these cases with DDs and anxiety disorders, respectively, for purposes of statistical analysis. All data were analyzed using SPSS software.
Results
One hundred four participants were included in this study. The sociodemographic, clinical, and diagnostic profiles, as well as the determinants of MINI diagnosis, are provided in Tables 1 through 4. The PASI and DLQI scores indicated that most participants had mild to moderate psoriasis severity.10 The prevalence of alcohol-related disorders was only found in the male subpopulation, which is consistent with the sociocultural context of North India. Psoriasis severity (ie, PASI score) was not found to be a determinant of psychiatric diagnoses in the study population. There was no statistical difference in measures of current clinical status and treatment modality when those with or without any psychiatric diagnoses were compared. When the variables of disease duration, treatment duration, and DLQI were entered into a binary logistic regression with positive status for a MINI diagnosis as a dependent variable indicating the presence of a psychiatric disorder, it was found that the DLQI score was a significant predictor (b=0.19; SE=0.47; χ2=17.92; P<.05). This finding was the same for regression analyses for males and females separately and also for DD as a dependent variable.
Mean DLQI and PASI scores were positively correlated with each other (Pearson r=0.23; P=.01). This relationship was maintained in males (Pearson r=0.24; P=.03) but not in females (Pearson r=0.14; P=.30). The correlations between DLQI and PASI scores and both disease duration and treatment duration were not significant. The Cohen κ values for the interrater reliability analyses done to assess the concordance of the PHQ and MINI diagnostic groups were modest (0.31-0.42), which was true even when MINI depressive disorders without dysthymia and PHQ depressive disorders were compared.
Comment
Studies investigating psychiatric morbidity in psoriasis have varying methodologies, mostly assessing psychiatric symptoms rather than screening for psychiatric disorders.3 In chronic diseases such as psoriasis, there often is an overlap between disease symptoms and common psychiatric disorders (eg, depression).11 Therefore, assessment of symptoms can be misleading. The current study was designed to detect psychiatric disorders in psoriasis patients using both patient self-assessment and clinician-administered instruments. We also investigated the contribution of sociodemographic and clinical variables (eg, psoriasis severity, impairment in QOL) on psychiatric morbidity.
An increased risk for depression, anxiety, and suicidality associated with greater psoriasis severity has been reported.12 The results of the current study indicate that even in a patient population with predominantly mild to moderate psoriasis, psychiatric morbidity, particularly DDs, is common. This finding was seen both on patient self-assessment and clinician-administered evaluations. Earlier studies from this institution and region have reported a lower prevalence of psychiatric disorders in patients with psoriasis (24.7%–36.7%).13-16 However, prior studies were based on assessment of specific symptoms and clinical diagnoses derived from history and mental status examination rather than the administration of more rigorous research diagnostic assessment tools. A systematic review and meta-analysis also revealed a lower prevalence of clinical depression using International Classification of Diseases, Tenth Revision, and Diagnostic and Statistical Manual of Mental Disorders (Fourth Edition) codes.3 A possible reason for this apparent discrepancy is the fact that psychiatric morbidity in a majority of participants in the current study was constituted by the diagnosis of dysthymia. If the diagnosis of dysthymia is removed from the current analysis, the prevalence of clinical major depressive syndromes is similar to other data. We found that chronic low-grade depression (dysthymia) was the most common diagnosis from the MINI. Lower prevalence was noted in a prior study, but methodology using clinical interviewing may have resulted in an underestimated prevalence.13 It also is possible that chronic low-grade depression in psoriasis patients may be missed or underestimated in comparison to more readily diagnosed and severe depressive syndromes in other studies. However, there is enough evidence to suggest that dysthymia is clinically relevant in the causation of morbidity and disability (eg, physical, psychological, or cognitive impairment) in patients with chronic physical disorders.17 This distinction between clinical major depressive syndrome and dysthymia is important because different treatment methods may be required; the former may warrant treatment with antidepressants in addition to psychosocial treatment modalities (eg, learning to cope with stress, problem-solving techniques), while the latter may benefit predominantly from psychosocial treatment modalities alone.18,19 In the current study, most of the participants who were diagnosed with dysthymia refused treatment with any psychotropic medications but perceived benefit from discussing their problems with a professional. Our results indicated that chronic low-grade depression is more common than more severe major depressive states, and mental health professionals who are well versed in psychosocial treatment modalities should play an integral role in treatment planning for patients with psoriasis.
In the current study, there was only a modest correlation between the results of the patient self-assessment and clinician-administered evaluations, which indicated that psychiatric disorders may not be obvious to clinicians unless specifically investigated, even for some severely depressed and suicidal patients. Given the high prevalence of clinically relevant psychiatric morbidity among psoriasis patients, dermatology professionals should be more sensitive to the possible presence of psychiatric disorders in this patient population and should consider the use of formal screening or other diagnostic tools for detection of depression and anxiety in psoriasis patients.
The main determinant of psychiatric morbidity in our study population was impairment in QOL. Interestingly enough, psoriasis severity was not associated with psychiatric morbidity in our study. Depressive states in patients with chronic physical illnesses are well known and could be due to the chronic stress of illness or impaired QOL, or depression may be a direct effect of the illness and/or treatment on the central nervous system. Psoriasis is not known to have any direct effect on the central nervous system. Our findings suggest that QOL impairment plays an important role in psychiatric morbidity in patients with psoriasis. Even though the DLQI is designed to measure QOL over the preceding week, our findings suggest that impairment in QOL in psoriasis is a manifestation of a more long-term effect of interplay between many factors; the impairment in activities of daily living, disease-related physical discomfort and impaired self-esteem and self-perception, impairments in interpersonal relationships, and the stress of chronicity of illness seem to play an important role. Additionally, variables such as emotional dysfunction, magnitude and site of the area of involvement, nature and magnitude of comorbidities, and complications of illness and coping also may be relevant.20 Although these factors are common in other chronic disorders, psoriasis in particular may predisposepatients to depression due to its unpredictable and relapsing nature, lack of any curative therapy, and the stigmatizing prominent lesions that often are impossible to camouflage. In chronic diseases such as psoriasis, the amelioration of impairment of different aspects of QOL may be more important than mere symptom control.
Our study was limited in that the study population was predominantly male. Fewer females may have consented to participate in the study due to time constraints associated with domestic responsibilities, reluctance to discuss psychological distress, or inability to meet the inclusion criteria (eg, level of education required to read questionnaires). However, there was no significant difference between males and females for sociodemographic variables or diagnoses other than alcohol-related disorders. Our study also had a cross-sectional design and there was no control group, without which it is difficult to assess the true prevalence and determinants of these psychiatric morbidities. Moreover, the sample size was small and did not include enough participants with moderate to severe psoriasis (ie, PASI score ≥10) to be able to detect a correlation between psychiatric morbidities and psoriasis severity. Our findings underline the need for effective screening and integrated management of psychiatric disorders in patients with psoriasis.
- Griffiths CE, Barker JN. Pathogenesis and clinical features of psoriasis. Lancet. 2007;370:263-271.
- Fried RG, Gupta MA, Gupta AK. Depression and skin disease. Dermatol Clin. 2005;23:657-664.
- Dowlatshahi EA, Wakkee M, Arends LR, et al. The prevalence and odds of depressive symptoms and clinical depression in psoriasis patients: a systematic review and meta-analysis. J Invest Dermatol. 2014;134:1542-1551.
- Richards HL, Fortune DG, Weidmann A, et al. Detection of psychological distress in patients with psoriasis: low consensus between dermatologist and patient. Br J Dermatol. 2004;151:1227-1233.
- Scharloo M, Kaptein AA, Weinman J, et al. Patients’ illness perceptions and coping as predictors of functional status in psoriasis: a 1-year follow-up. Br J Dermatol. 2000;142:899-907.
- Spitzer RL, Kroenke K, Williams JB. Validation and utility of a self-report version of PRIME-MD: the PHQ primary care study. primary care evaluation of mental disorders. patient health questionnaire. JAMA. 1999;282:1737-1744.
- Finlay AY, Khan GK. Dermatology Life Quality Index (DLQI)—a simple practical measure for routine clinical use. Clin Exp Dermatol. 1994;19:210-216.
- Langley RG, Ellis CN. Evaluating psoriasis with Psoriasis Area and Severity Index, Psoriasis Global Assessment, and Lattice System Physician’s Global Assessment. J Am Acad Dermatol. 2004;51:563-569.
- Sheehan DV, Lecrubier Y, Sheehan KH, et al. The Mini-International Neuropsychiatric Interview (M.I.N.I.): the development and validation of a structured diagnostic psychiatric interview for DSM-IV and ICD-10. J Clin Psychiatry. 1998;59(suppl 20):22-33, quiz 34-57.
- Mrowietz U, Kragballe K, Reich K, et al. Definition of treatment goals for moderate to severe psoriasis: a European consensus. Arch Dermatol Res. 2011;303:1-10.
- Ellis GK, Robinson JA, Crawford GB. When symptoms of disease overlap with symptoms of depression. Aust Fam Physician. 2006;35:647-649.
- Kurd SK, Troxel AB, Crits-Christoph P, et al. The risk of depression, anxiety, and suicidality in patients with psoriasis: a population-based cohort study. Arch Dermatol. 2010;146:891-895.
- Kumar V, Mattoo SK, Handa S. Psychiatric morbidity in pemphigus and psoriasis: a comparative study from India. Asian J Psychiatry. 2013;6:151-156.
- Mattoo S, Handa S, Kaur I, et al. Psychiatric morbidity in psoriasis: prevalence and correlates in India. Ger J Psychiatry. 2005;8:17-22.
- Mattoo SK, Handa S, Kaur I, et al. Psychiatric morbidity in vitiligo and psoriasis: a comparative study from India. J Dermatol. 2001;28:424-432.
- Mehta V, Malhotra S. Psychiatric evaluation of patients with psoriasis vulgaris and chronic urticaria. Ger J Psychiatry. 2007;10:104-110.
- Meeks TW, Vahia IV, Lavretsky H, et al. A tune in “a minor” can “b major”: a review of epidemiology, illness course, and public health implications of subthreshold depression in older adults. J Affect Disord. 2011;129:126-142.
- Hegerl U, Schönknecht P, Mergl R. Are antidepressants useful in the treatment of minor depression: a critical update of the current literature. Curr Opin Psychiatry. 2012;25:1-6.
- Rizzo M, Creed F, Goldberg D, et al. A systematic review of non-pharmacological treatments for depression in people with chronic physical health problems. J Psychosom Res. 2011;71:18-27.
- de Korte J, Sprangers MA, Mombers FM, et al. Quality of life in patients with psoriasis: a systematic literature review. J Investig Dermatol Symp Proc. 2004;9:140-147.
Practice Points
- Psychiatric disorders, especially depressive disorders, are common in patients with psoriasis.
- Impairments in quality of life in patients with psoriasis can predict psychiatric morbidity.
- Screening for psychiatric disorders and depression in particular should be considered in patients with psoriasis.
- Treatment should focus not just on symptom alleviation but also coping with the effects of living with a chronic illness such as psoriasis and improving quality of life.
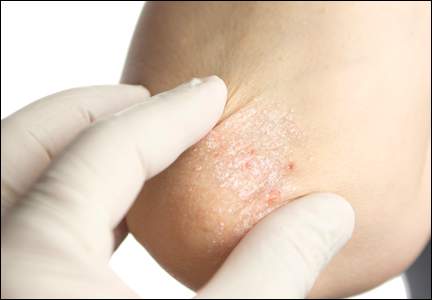
Electronic Assessment of Mental Status
Altered mental status (AMS) is a complex spectrum of cognitive deficits that includes orientation, memory, language, visuospatial ability, and perception.[1] The clinical definitions of both delirium and dementia include AMS as a hallmark clinical prerequisite. Regardless of etiology, this broader AMS definition is particularly salient in the hospital setting, where AMS is present in up to 60% of inpatients and is associated with longer hospital stay as well as increased morbidity and mortality.[2, 3] Not surprisingly, due to the complexity of identifying and assessing changes in mental status, clinically relevant AMS is often undetected among inpatients.[2] However, when detected, the most common causes of AMS (infection, polypharmacy, and pain) are treatable, suggesting that early AMS identification could alert clinicians to early signs of clinical decompensation, potentially improving clinical outcomes.[4]
Because rapid and systemic clinical detection of AMS is limited by the complexity of mental status, a number of assessments have been created, each with their own advantages, limitations, and target populations. These assessments are often limited by time‐intensive administration, subjectivity of mental status assessment, and lack of sensitivity in general medicine patients. Time‐intensive measures, such as the Short Portable Mental Status Questionnaire (SPMSQ) have utility in the research setting, whereas current common clinical risk stratification tools (eg, National Early Warning Score) utilize simpler measures such as the Alert, Voice, Pain, Unresponsive (AVPU) and Glasgow Coma Scale (GCS) as measures of mental status.[2, 5, 6, 7, 8, 9]
To address the need for a brief, clinically feasible, accurate tool in clinical detection of AMS, our group developed a mobile application for working memory testing, the Functional Assessment of Mentation (FAMTM). In this study, we aimed to identify baseline scoring distributions of the FAMTM in a nonhospitalized subgroup, as well as assess the correlation of the FAMTM to discharge disposition and compare it to the SPMSQ in inpatients.
METHODS
Study Design
We conducted a prospective observational study. Data were collected from both hospitalized and nonhospitalized adult participants as 2 distinct subgroups. Nonhospitalized adult subjects were recruited from a university medical campus (June 2013July 2013; IRB‐12‐0175). Hospitalized participants were recruited from the general medicine service as part of an ongoing study measuring quality of care and resource allocation at the same academic medical center (June 2014August 2014; IRB‐9967).[10]
FAMTM Application
The FAMTM application is a bedside tool for working memory assessment developed for the iPhone mobile operating system (Apple Inc., Cupertino, CA) and presented on an iPad mini (Apple). The application interface displays 4 colored rectangles individually labeled with a number (see Supporting Figure 1 in the online version of this article). The testing portion of the application presents a sequence of numbered rectangles, illuminated 1 at a time in random order. Subjects are prompted first to watch and remember the sequence and then repeat the sequence by touching the screen within each numbered rectangle. Successful reproduction of the sequence is followed by a distinct and longer sequence, whereas unsuccessful attempts are followed by a shorter sequence. The final FAMTM score corresponds to the longest sequence of rectangles successfully repeated by the subject.
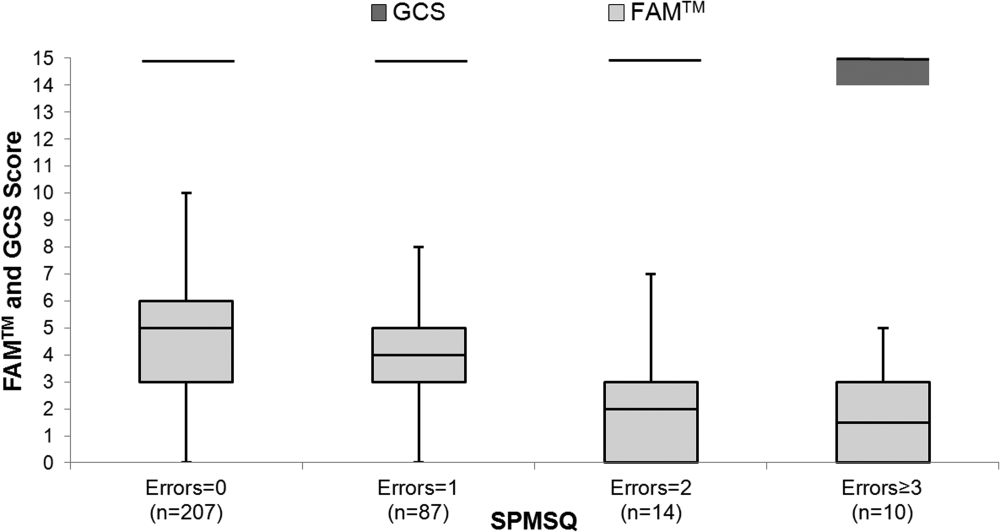
Data Collection
In the nonhospitalized subject population, research assistants collected demographic data immediately prior to FAMTM administration. Among hospitalized subjects, GCS information was collected by nursing staff as part of standard clinical care. One research assistant administered the SPMSQ while a second assistant, blinded to the SPMSQ and GCS scores, administered the FAMTM. Clinical data were obtained from medical records (EPIC Systems Corp., Verona, WI). Discharge disposition was dichotomized as discharged home or not.
Statistical Analyses
Demographic characteristics of the 2 subject populations were compared using Student t tests (continuous variables) and 2 tests (categorical variables). Score distribution and discharge disposition comparison was conducted with the Mann‐Whitney U test and area under receiver operating characteristic curve (AUC) analysis, using the trapezoidal rule.[11] Multivariable linear regression was used to investigate the impact of age, race, education, discharge disposition, and hospitalization status on patient scores and times. Correlations between the FAMTM and SPMSQ scores and between the GCS and SPMSQ scores were calculated using the Spearman rank test. Significance was set at a 2‐sided P value of <0.05. Analyses were conducted using Stata version 13.1 (StataCorp, College Station, TX).
RESULTS
A total of 931 subjects were enrolled in the study. In the nonhospitalized subgroup, 651 consented to study participation and 612 were included in final analysis. Subjects were excluded if they started but did not complete the application (n = 36) or were under the age of 18 years (n = 3). Of the 363 hospitalized subjects approached for enrollment, 319 were included in the final analysis. Subjects were excluded if they refused to participate (n = 23), were under the age of 18 (n = 2), had technical failures (n = 5), or had physical or visual limitations that precluded them from participation (n = 14). Within the hospitalized subgroup, 268 subjects were discharged home (85%). The table displays demographics and score distributions by subgroup.1
| Nonhospitalized Subjects, n = 612 | Hospitalized Subjects Discharged Home, n = 268 | Hospitalized Subjects Discharged Elsewhere, n = 48 | P Value | |
|---|---|---|---|---|
| ||||
| Age, y | 52 18 | 52 19 | 62 17 | <0.001 |
| Female sex | 343 (56%) | 158 (59%) | 26 (54%) | 0.63 |
| Education | <0.001 | |||
| Less than high school graduate | 31 (5%) | 32 (12%) | 7 (15%) | |
| High school graduate | 312 (51%) | 153 (57%) | 26 (54%) | |
| College graduate | 263 (43%) | 43 (16%) | 8 (17%) | |
| Missing | 6 (1%) | 40 (15%) | 7 (15%) | |
| Race | <0.001 | |||
| Black | 196 (32%) | 185 (69%) | 34 (71%) | |
| White | 324 (53%) | 75 (28%) | 13 (27%) | |
| Other | 86 (14%) | 4 (1%) | 4 (1%) | |
| Missing | 6 (1%) | 4 (1%) | 0 (0%) | |
| FAMTM score, median (IQR) | 5 (47) | 5 (36) | 3 (15) | <0.001 |
The median FAMTM score for the combined study population was 5 (interquartile range [IQR] 36), and median time to completion was 55 seconds (IQR 4567 seconds). A graded reduction was found in the FAMTM score for all stepwise comparisons between nonhospitalized subjects, hospitalized subjects discharged home, and hospitalized subjects not discharged home (median 5 [IQR 47] vs 5 [IQR 36] vs 3 [IQR 15]; P < 0.001 for all pairwise comparisons). The AUC for the FAMTM predicting discharge disposition (home vs not) was 0.66 (95% confidence interval [CI]: 0.58‐0.74]. After adjusting for confounders, higher FAMTM scores were independently associated with not being hospitalized, being discharged home, higher levels of education, younger age, and white race (see Supporting Table 1 in the online version of this article). Additionally, in the hospitalized subgroup, decreasing FAMTM score was significantly correlated with increasing errors on the SPMSQ (Spearman = 0.27, P < 0.001), whereas the GCS score was not correlated with the SPMSQ (Spearman = 0.05, P = 0.40) (Figure 1).
DISCUSSION
We demonstrated the utility of a rapid and accurate mobile application for assessment of mental status. The FAMTM was able to be quickly administered with a median time to completion of approximately 1 minute. The ability to detect mild alterations in mental status was shown through concurrent validity by FAMTM correlation with the SPMSQ and predictive validity with the association between the FAMTM and discharge disposition. Our study highlights the potential for the FAMTM to be used as a sensitive marker of AMS.
The novel design of the FAMTM presents unique advantages compared to current mental status testing. First, the FAMTM could allow patients with hearing impairment or language barriers to complete a mental status assessment. Additionally, the approximately 1‐minute median time to completion is much faster than other established mental status assessments including the SPMSQ (510 minutes). Compared to the SPMSQ taking 5 minutes, in a 400‐bed hospital, taken once per nursing shift, the FAMTM would save approximately 20,000 hours and 10 nursing full‐time equivalents per year.[5] Finally, many current mental status tests such as the Confusion Assessment Model utilize subjective mental status assessments.[2] However, the FAMTM is designed to be conducted through self‐assessment and, thus, could theoretically be free of observer bias. This potential for self‐administration expands beyond other proposed alternative testing mechanisms of the AMS such as ultrabrief assessments that include items such as asking subjects the months of the year backwards, and what is the day of the week?, and assessing arousal.[12, 13, 14]
In research settings and commonly in hospitals, the GCS and AVPU are used clinically for mental status assessment of hospitalized patients.[6, 15] However, similar to previous literature, our study found that the vast majority of hospitalized patients were defined as neurologically intact by the GCS, which is the more accurate predictor of the 2.[7] One major strength of the FAMTM was that it identified an extensive gradation of scores for patients previously labeled as merely alert, providing greater resolution than the GCS in quantifying mental status.
One of the key benefits of the FAMTM is that it can be measured longitudinally over the course of a patient's hospital stay. Therefore, once a baseline FAMTM score is established, variation from the patient's personal baseline could indicate mental status deterioration, which would not be affected by the patient's demographics, health status, or underlying neurocognitive deficits.
There were important limitations to this study. First, limited generalizability of these data may exist due to the single‐center setting and patient population. However, this initial study provides pilot data for further expansion into the potential broad applicability of the FAMTM to other patient populations and settings. Additionally, the cost of large‐scale implementation of the FAMTM is unknown and was beyond the scope of this pilot study. However, to reduce costs, the FAMTM technology could be integrated into existing hospital technology infrastructure. Finally, the scope of this study prevented a complete assessment of all validity measures or comparison to other mental status assessments such as the digit span or serial sevens tests. However, predictive and concurrent validity were assessed with comparison by discharge disposition, SPMSQ, and GCS scores.
In conclusion, this pilot study identifies the FAMTM application as a potentially clinically useful, novel, rapid, and feasible assessment tool of mental status in a general medicine inpatient setting.
Acknowledgements
The authors thank Frank Zadravecz, MPH, for his support with this project.
Disclosures: This research was supported in part by a grant from the National Institutes of Health (NIA 2T35AG029795‐07) and in part by career development awards granted to Dr. Churpek, Dr. Edelson, and Dr. Press by the National Heart, Lung, and Blood Institute (K08 HL121080, K23 HL097157, and K23 HL118151, respectively). Dr. Churpek has received honoraria from Chest for invited speaking engagements. Drs. Churpek and Edelson have a patent pending (ARCD. P0535US.P2) for risk stratification algorithms for hospitalized patients. In addition, Dr. Edelson has received research support from Philips Healthcare (Andover, MA), the American Heart Association (Dallas, TX), and Laerdal Medical (Stavanger, Norway). She has ownership interest in Quant HC (Chicago, IL), which is developing products for risk stratification of hospitalized patients. All other authors report no potential conflicts of interest.
- , . Altered mental status in older patients in the emergency department. Clin Geriatr Med. 2013;29(1):101–136.
- , , , , , . Clarifying confusion: the confusion assessment method. A new method for detection of delirium. Ann Intern Med. 1990;113(12):941–948.
- , , , , . Association between clinically abnormal observations and subsequent in‐hospital mortality: a prospective study. Resuscitation. 2004;62(2):137–141.
- , , . Early recognition of delirium: review of the literature. J Clin Nurs. 2001;10(6):721–729.
- . A short portable mental status questionnaire for the assessment of organic brain deficit in elderly patients. J Am Geriatr Soc. 1975;23(10):433–441.
- , , , , . The ability of the National Early Warning Score (NEWS) to discriminate patients at risk of early cardiac arrest, unanticipated intensive care unit admission, and death. Resuscitation. 2013;84(4):465–470.
- , , , et al. Comparison of mental‐status scales for predicting mortality on the general wards. J Hosp Med. 2015;10(10):658–663.
- , . Assessment of coma and impaired consciousness: a practical scale. Lancet. 1974;304(7872):81–84.
- , , , . Short Portable Mental Status Questionnaire as a Screening Test for Dementia and Delirium Among the Elderly. J Am Geriatr Soc. 1987;35(5):412–416.
- , , , et al. Effects of physician experience on costs and outcomes on an academic general medicine service: results of a trial of hospitalists. Ann Intern Med. 2002;137(11):866–874.
- , , . Comparing the areas under two or more correlated receiver operating characteristic curves: a nonparametric approach. Biometrics. 1988;44(3):837–845.
- , , , et al. Preliminary development of an ultrabrief two‐item bedside test for delirium. J Hosp Med. 2015;10(10):645–650.
- , , , , , . The association between an ultrabrief cognitive screening in older adults and hospital outcomes. J Hosp Med. 2015;10(10):651–657.
- , , , et al. Selecting optimal screening items for delirium: an application of item response theory. BMC Med Res Methodol. 2013;13:8.
- , , . Variability in agreement between physicians and nurses when measuring the Glasgow Coma Scale in the emergency department limits its clinical usefulness. Emerg Med Australas. 2006;18(4):379–384.
Altered mental status (AMS) is a complex spectrum of cognitive deficits that includes orientation, memory, language, visuospatial ability, and perception.[1] The clinical definitions of both delirium and dementia include AMS as a hallmark clinical prerequisite. Regardless of etiology, this broader AMS definition is particularly salient in the hospital setting, where AMS is present in up to 60% of inpatients and is associated with longer hospital stay as well as increased morbidity and mortality.[2, 3] Not surprisingly, due to the complexity of identifying and assessing changes in mental status, clinically relevant AMS is often undetected among inpatients.[2] However, when detected, the most common causes of AMS (infection, polypharmacy, and pain) are treatable, suggesting that early AMS identification could alert clinicians to early signs of clinical decompensation, potentially improving clinical outcomes.[4]
Because rapid and systemic clinical detection of AMS is limited by the complexity of mental status, a number of assessments have been created, each with their own advantages, limitations, and target populations. These assessments are often limited by time‐intensive administration, subjectivity of mental status assessment, and lack of sensitivity in general medicine patients. Time‐intensive measures, such as the Short Portable Mental Status Questionnaire (SPMSQ) have utility in the research setting, whereas current common clinical risk stratification tools (eg, National Early Warning Score) utilize simpler measures such as the Alert, Voice, Pain, Unresponsive (AVPU) and Glasgow Coma Scale (GCS) as measures of mental status.[2, 5, 6, 7, 8, 9]
To address the need for a brief, clinically feasible, accurate tool in clinical detection of AMS, our group developed a mobile application for working memory testing, the Functional Assessment of Mentation (FAMTM). In this study, we aimed to identify baseline scoring distributions of the FAMTM in a nonhospitalized subgroup, as well as assess the correlation of the FAMTM to discharge disposition and compare it to the SPMSQ in inpatients.
METHODS
Study Design
We conducted a prospective observational study. Data were collected from both hospitalized and nonhospitalized adult participants as 2 distinct subgroups. Nonhospitalized adult subjects were recruited from a university medical campus (June 2013July 2013; IRB‐12‐0175). Hospitalized participants were recruited from the general medicine service as part of an ongoing study measuring quality of care and resource allocation at the same academic medical center (June 2014August 2014; IRB‐9967).[10]
FAMTM Application
The FAMTM application is a bedside tool for working memory assessment developed for the iPhone mobile operating system (Apple Inc., Cupertino, CA) and presented on an iPad mini (Apple). The application interface displays 4 colored rectangles individually labeled with a number (see Supporting Figure 1 in the online version of this article). The testing portion of the application presents a sequence of numbered rectangles, illuminated 1 at a time in random order. Subjects are prompted first to watch and remember the sequence and then repeat the sequence by touching the screen within each numbered rectangle. Successful reproduction of the sequence is followed by a distinct and longer sequence, whereas unsuccessful attempts are followed by a shorter sequence. The final FAMTM score corresponds to the longest sequence of rectangles successfully repeated by the subject.
Data Collection
In the nonhospitalized subject population, research assistants collected demographic data immediately prior to FAMTM administration. Among hospitalized subjects, GCS information was collected by nursing staff as part of standard clinical care. One research assistant administered the SPMSQ while a second assistant, blinded to the SPMSQ and GCS scores, administered the FAMTM. Clinical data were obtained from medical records (EPIC Systems Corp., Verona, WI). Discharge disposition was dichotomized as discharged home or not.
Statistical Analyses
Demographic characteristics of the 2 subject populations were compared using Student t tests (continuous variables) and 2 tests (categorical variables). Score distribution and discharge disposition comparison was conducted with the Mann‐Whitney U test and area under receiver operating characteristic curve (AUC) analysis, using the trapezoidal rule.[11] Multivariable linear regression was used to investigate the impact of age, race, education, discharge disposition, and hospitalization status on patient scores and times. Correlations between the FAMTM and SPMSQ scores and between the GCS and SPMSQ scores were calculated using the Spearman rank test. Significance was set at a 2‐sided P value of <0.05. Analyses were conducted using Stata version 13.1 (StataCorp, College Station, TX).
RESULTS
A total of 931 subjects were enrolled in the study. In the nonhospitalized subgroup, 651 consented to study participation and 612 were included in final analysis. Subjects were excluded if they started but did not complete the application (n = 36) or were under the age of 18 years (n = 3). Of the 363 hospitalized subjects approached for enrollment, 319 were included in the final analysis. Subjects were excluded if they refused to participate (n = 23), were under the age of 18 (n = 2), had technical failures (n = 5), or had physical or visual limitations that precluded them from participation (n = 14). Within the hospitalized subgroup, 268 subjects were discharged home (85%). The table displays demographics and score distributions by subgroup.1
| Nonhospitalized Subjects, n = 612 | Hospitalized Subjects Discharged Home, n = 268 | Hospitalized Subjects Discharged Elsewhere, n = 48 | P Value | |
|---|---|---|---|---|
| ||||
| Age, y | 52 18 | 52 19 | 62 17 | <0.001 |
| Female sex | 343 (56%) | 158 (59%) | 26 (54%) | 0.63 |
| Education | <0.001 | |||
| Less than high school graduate | 31 (5%) | 32 (12%) | 7 (15%) | |
| High school graduate | 312 (51%) | 153 (57%) | 26 (54%) | |
| College graduate | 263 (43%) | 43 (16%) | 8 (17%) | |
| Missing | 6 (1%) | 40 (15%) | 7 (15%) | |
| Race | <0.001 | |||
| Black | 196 (32%) | 185 (69%) | 34 (71%) | |
| White | 324 (53%) | 75 (28%) | 13 (27%) | |
| Other | 86 (14%) | 4 (1%) | 4 (1%) | |
| Missing | 6 (1%) | 4 (1%) | 0 (0%) | |
| FAMTM score, median (IQR) | 5 (47) | 5 (36) | 3 (15) | <0.001 |
The median FAMTM score for the combined study population was 5 (interquartile range [IQR] 36), and median time to completion was 55 seconds (IQR 4567 seconds). A graded reduction was found in the FAMTM score for all stepwise comparisons between nonhospitalized subjects, hospitalized subjects discharged home, and hospitalized subjects not discharged home (median 5 [IQR 47] vs 5 [IQR 36] vs 3 [IQR 15]; P < 0.001 for all pairwise comparisons). The AUC for the FAMTM predicting discharge disposition (home vs not) was 0.66 (95% confidence interval [CI]: 0.58‐0.74]. After adjusting for confounders, higher FAMTM scores were independently associated with not being hospitalized, being discharged home, higher levels of education, younger age, and white race (see Supporting Table 1 in the online version of this article). Additionally, in the hospitalized subgroup, decreasing FAMTM score was significantly correlated with increasing errors on the SPMSQ (Spearman = 0.27, P < 0.001), whereas the GCS score was not correlated with the SPMSQ (Spearman = 0.05, P = 0.40) (Figure 1).
DISCUSSION
We demonstrated the utility of a rapid and accurate mobile application for assessment of mental status. The FAMTM was able to be quickly administered with a median time to completion of approximately 1 minute. The ability to detect mild alterations in mental status was shown through concurrent validity by FAMTM correlation with the SPMSQ and predictive validity with the association between the FAMTM and discharge disposition. Our study highlights the potential for the FAMTM to be used as a sensitive marker of AMS.
The novel design of the FAMTM presents unique advantages compared to current mental status testing. First, the FAMTM could allow patients with hearing impairment or language barriers to complete a mental status assessment. Additionally, the approximately 1‐minute median time to completion is much faster than other established mental status assessments including the SPMSQ (510 minutes). Compared to the SPMSQ taking 5 minutes, in a 400‐bed hospital, taken once per nursing shift, the FAMTM would save approximately 20,000 hours and 10 nursing full‐time equivalents per year.[5] Finally, many current mental status tests such as the Confusion Assessment Model utilize subjective mental status assessments.[2] However, the FAMTM is designed to be conducted through self‐assessment and, thus, could theoretically be free of observer bias. This potential for self‐administration expands beyond other proposed alternative testing mechanisms of the AMS such as ultrabrief assessments that include items such as asking subjects the months of the year backwards, and what is the day of the week?, and assessing arousal.[12, 13, 14]
In research settings and commonly in hospitals, the GCS and AVPU are used clinically for mental status assessment of hospitalized patients.[6, 15] However, similar to previous literature, our study found that the vast majority of hospitalized patients were defined as neurologically intact by the GCS, which is the more accurate predictor of the 2.[7] One major strength of the FAMTM was that it identified an extensive gradation of scores for patients previously labeled as merely alert, providing greater resolution than the GCS in quantifying mental status.
One of the key benefits of the FAMTM is that it can be measured longitudinally over the course of a patient's hospital stay. Therefore, once a baseline FAMTM score is established, variation from the patient's personal baseline could indicate mental status deterioration, which would not be affected by the patient's demographics, health status, or underlying neurocognitive deficits.
There were important limitations to this study. First, limited generalizability of these data may exist due to the single‐center setting and patient population. However, this initial study provides pilot data for further expansion into the potential broad applicability of the FAMTM to other patient populations and settings. Additionally, the cost of large‐scale implementation of the FAMTM is unknown and was beyond the scope of this pilot study. However, to reduce costs, the FAMTM technology could be integrated into existing hospital technology infrastructure. Finally, the scope of this study prevented a complete assessment of all validity measures or comparison to other mental status assessments such as the digit span or serial sevens tests. However, predictive and concurrent validity were assessed with comparison by discharge disposition, SPMSQ, and GCS scores.
In conclusion, this pilot study identifies the FAMTM application as a potentially clinically useful, novel, rapid, and feasible assessment tool of mental status in a general medicine inpatient setting.
Acknowledgements
The authors thank Frank Zadravecz, MPH, for his support with this project.
Disclosures: This research was supported in part by a grant from the National Institutes of Health (NIA 2T35AG029795‐07) and in part by career development awards granted to Dr. Churpek, Dr. Edelson, and Dr. Press by the National Heart, Lung, and Blood Institute (K08 HL121080, K23 HL097157, and K23 HL118151, respectively). Dr. Churpek has received honoraria from Chest for invited speaking engagements. Drs. Churpek and Edelson have a patent pending (ARCD. P0535US.P2) for risk stratification algorithms for hospitalized patients. In addition, Dr. Edelson has received research support from Philips Healthcare (Andover, MA), the American Heart Association (Dallas, TX), and Laerdal Medical (Stavanger, Norway). She has ownership interest in Quant HC (Chicago, IL), which is developing products for risk stratification of hospitalized patients. All other authors report no potential conflicts of interest.
- , . Altered mental status in older patients in the emergency department. Clin Geriatr Med. 2013;29(1):101–136.
- , , , , , . Clarifying confusion: the confusion assessment method. A new method for detection of delirium. Ann Intern Med. 1990;113(12):941–948.
- , , , , . Association between clinically abnormal observations and subsequent in‐hospital mortality: a prospective study. Resuscitation. 2004;62(2):137–141.
- , , . Early recognition of delirium: review of the literature. J Clin Nurs. 2001;10(6):721–729.
- . A short portable mental status questionnaire for the assessment of organic brain deficit in elderly patients. J Am Geriatr Soc. 1975;23(10):433–441.
- , , , , . The ability of the National Early Warning Score (NEWS) to discriminate patients at risk of early cardiac arrest, unanticipated intensive care unit admission, and death. Resuscitation. 2013;84(4):465–470.
- , , , et al. Comparison of mental‐status scales for predicting mortality on the general wards. J Hosp Med. 2015;10(10):658–663.
- , . Assessment of coma and impaired consciousness: a practical scale. Lancet. 1974;304(7872):81–84.
- , , , . Short Portable Mental Status Questionnaire as a Screening Test for Dementia and Delirium Among the Elderly. J Am Geriatr Soc. 1987;35(5):412–416.
- , , , et al. Effects of physician experience on costs and outcomes on an academic general medicine service: results of a trial of hospitalists. Ann Intern Med. 2002;137(11):866–874.
- , , . Comparing the areas under two or more correlated receiver operating characteristic curves: a nonparametric approach. Biometrics. 1988;44(3):837–845.
- , , , et al. Preliminary development of an ultrabrief two‐item bedside test for delirium. J Hosp Med. 2015;10(10):645–650.
- , , , , , . The association between an ultrabrief cognitive screening in older adults and hospital outcomes. J Hosp Med. 2015;10(10):651–657.
- , , , et al. Selecting optimal screening items for delirium: an application of item response theory. BMC Med Res Methodol. 2013;13:8.
- , , . Variability in agreement between physicians and nurses when measuring the Glasgow Coma Scale in the emergency department limits its clinical usefulness. Emerg Med Australas. 2006;18(4):379–384.

Management of Diabetic Foot Ulcers: A Review
The prevalence of diabetes mellitus (DM) is growing at epidemic proportions in the U.S. and has been reported as the most common reason for hospital admissions in western countries.1 There continues to be an alarmingly steady increase in the incidence of type 2 DM (T2DM), especially among the young and obese. Long-term diabetes-related complications also are likely to rise in prevalence. In particular, the diabetic foot is associated with morbidity and disability, leading to a significant impairment of quality of life.2 People with DM develop foot ulcers because of neuropathy (sensory, motor, and autonomic deficits), ischemia, or both.3 The initiating injury may be from acute mechanical or thermal trauma or from repetitively or continuously applied mechanical stress.4
From foot ulcerations to neuropathy to peripheral vascular disease, the challenges are significant and can result in amputations and even premature death. To address these challenges, early diagnosis and a multidisciplinary team approach should be employed. Managing the numerous comorbidities is essential for treatment.1,2,5
Due to the longevity of patients with DM, diabetes-associated complications are expected to rise in prevalence.6 The American Diabetes Association recently reported that T2DM accounts for about 90% to 95% of all persons with DM.7,8 Today, many hospitalizations for patients with DM are for lower extremity conditions, such as ulceration, infection, or gangrene. Diabetic foot ulcerations (DFUs) are painful and costly for both the patient and the health care system. Every year, more than 1 million people with DM worldwide lose a leg as a consequence of this disease.9 Most DM-related amputations are preceded by a foot ulcer.
Diabetic foot ulcerations are the most common foot condition leading to lower extremity amputation (Figure 1).10 About 14 million individuals in the U.S. with diagnosed and undiagnosed DM will experience pathologic changes of their lower extremities that, when combined with minor trauma and infection, may lead to serious foot problems.11 Although the triad of vasculopathy, neuropathy, and susceptibility to infection are the primary permissive factors in its pathogenesis, DFU can also be attributed to other important risk factors. The presence of peripheral neuropathy and peripheral arterial disease (PAD) are considered to be the most significant risk factors for all types of diabetic foot complications.12
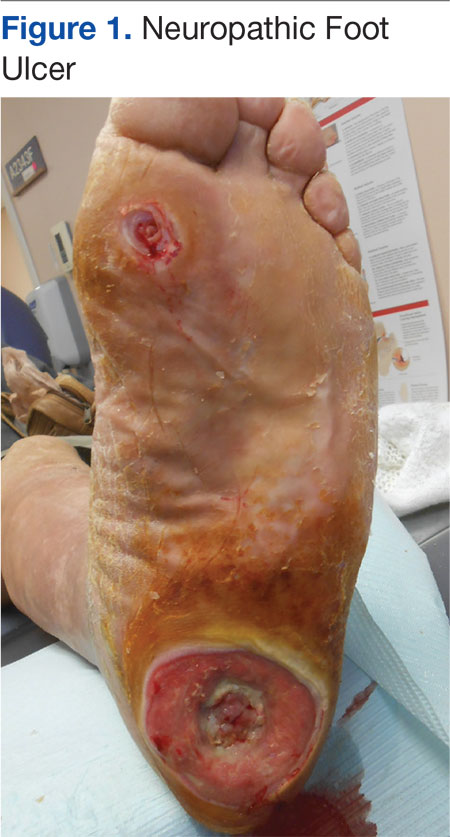
Related: A Combined Treatment Protocol for Patients With Diabetic Peripheral Neuropathy
Optimal care of foot ulceration depends on the treating physician’s understanding of the pathophysiology involved, familiarity with accepted principles of treatment, and the knowledge that a coordinated, multidisciplinary team approach will best accomplish the goal of limb salvage. All efforts should be made to prevent foot lesions, and when present, existing ulcers should be treated promptly and aggressively, which can often prevent an exacerbation of the problem and decrease the incidence of amputations. Even when ulcers have healed, patients with DM and a history of a lower extremity ulcer should consider it a lifelong condition that requires monitoring to prevent recurrence.13,14
This review provides a brief overview of DFU, including etiology, evaluation, treatment, and prevention, to provide clinicians with the clinical markers, evidence, and DFU treatment recommendations.
Etiologies
Multiple risk factors contribute to the development and pathogenesis of DFUs.5,6,15,16 Neuropathy and PAD are major factors in the pathogenesis of diabetic foot ulcers.17 However, there are several additional factors leading to the occurrence of foot complications. Reiber and colleagues have determined that 63% of their patients’ ulcers were attributed to the critical triad of peripheral sensory neuropathy, trauma, and deformity.15
Other factors also implicated in the causal pathway to ulceration were ischemia, callus, and edema. Infection was rarely implicated in the etiology of these lesions, although once an ulcer has developed, infection and PAD were found to be the major causes for amputation.10,18,19 Many of the risk factors for foot ulcer are also predisposing factors for amputation, because ulcers are primary antecedent events leading to amputation.20-23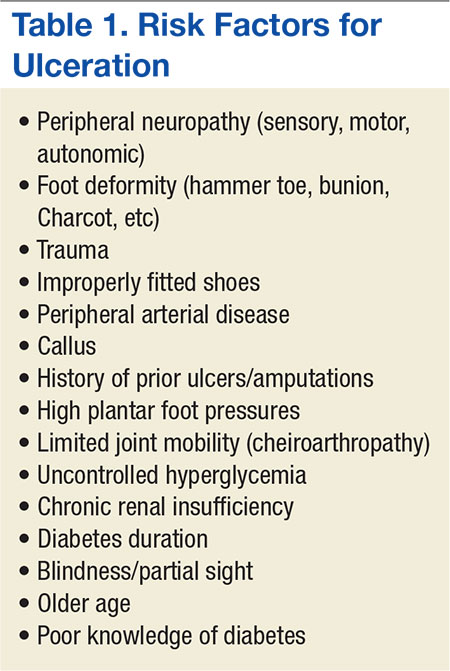
Evaluation
The clinical evaluation must include a thorough and systematic lower extremity examination when starting DFU treatment. It is important to have a thorough assessment of the ulcer’s size and depth, and the evaluation should include a description of its appearance and measurement of its diameter at each visit. Evaluation for the presence of local and systemic infection and potential for osteomyelitis, using a small sterile blunt probe, is critical in determining depth of penetration and tracking along tendon sheaths (Figure 2).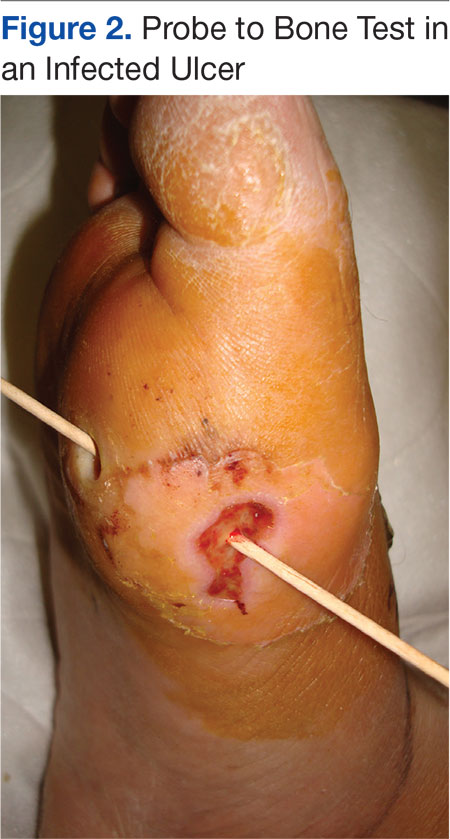
Peripheral arterial disease is directly linked to lower extremity disorders, such as intermittent claudication, pain on exertion, pain at rest, and, in severe cases, critical limb ischemia and gangrene.1 Bilateral lower extremity pulses should routinely be palpated. When dorsalis pedis or posterior tibial artery pulses are absent or diminished, Doppler segmental pressures to the toes, pulse volume recording, skin perfusion pressure, or transcutaneous oxygen evaluation is indicated, and vascular consultation should be sought.3 Ischemia is caused by peripheral arterial occlusive disease of larger vessels, not by microangiopathy.13 Poor arterial inflow is associated not only with impaired ulcer healing, but also subsequent infection, gangrene, and amputation.13
Diabetic peripheral neuropathy is characterized by loss of protective sensation, allowing ulceration in areas of high pressure. Peripheral sensory neuropathy as measured by vibration perception thresholds can impart a 3.4-fold to 32-fold risk of ulceration.19,21 Patients insensitive to a 10-g monofilament, commonly used to assess peripheral neuropathy, has been shown in several studies to convey a 2.2-fold to18-fold risk of ulceration.6,19,27,28 In the large, population-based North-West Diabetes Foot Care Study, loss of protective sensation to the 10-g monofilament increased the risk of ulceration 80%, whereas abnormal ankle reflexes increased this risk 55%.29
Peripheral neuropathy has been demonstrated as a strong risk factor for foot ulceration in many cross-sectional studies and is present in > 80% of affected patients.29 Recent studies suggested that impaired sensation makes the foot increasingly vulnerable to damage caused by mechanical, thermal, or pressure-related injury.30 Autonomic neuropathy by virtue of subsequent anhidrosis causes dryness of the skin and, therefore, vulnerability to fissuring.13
Unhealed cracks in the skin can easily lead to infection, especially in the presence of PAD. Neuropathy has an insidious and nonhomogeneous manifestation, making it difficult to identify its onset and a challenge for patients and clinicians.31,32
Sacco and colleagues reviewed current literature and the International Consensus on the Diabetic Foot recommendation and concluded that most attention is given to patients with imminent foot ulceration rather than attempting to develop and improve assessment techniques that detect early impairments.31,33 They propose that effort should be made that detect patients at risk of developing diabetic polyneuropathy. Although the 10-g monofilament pressure perception threshold is a common screening technique for early detection, tests of the vibration perception threshold may be more sensitive.
The authors propose that different monofilament sizes could probably better help determine the disease status, as the vibration tests do. In addition to the considerable subjectivity of both methods of assessing sensitivity, they are unquestionably clinical resources that can contribute to early detection of DPN. Future studies should focus on developing assessment strategies and tools that better detect early neuropathic changes. Early diagnosis of impending problems will aid in preventing further limb-threatening complications.
Treatment
The management of diabetic foot disease is focused primarily on avoiding lower extremity amputation and should be carried out through 3 main strategies: identification of the at risk foot, treatment of the acutely diseased foot, and prevention of further complications.34 The primary goal in the treatment of DFUs is to obtain wound closure. Prompt, aggressive treatment of DFUs can often prevent an exacerbation of the problem and the potential need for amputation. The aim of therapy, therefore, should be early intervention to allow prompt healing of the lesion and, once healed, prevent its recurrence.3,20,25,35
Management of the foot ulcer is largely determined by its severity (grade), vascularity, and presence of infection.3,14,36 A multidisciplinary team approach should be used due to the multifaceted nature of foot ulcers, as well as for managing the numerous comorbidities attendant with these patients. The choice of treatment methods is determined by patient and ulcer characteristics. Equally important is the ability of patients to comply with the treatment as well as with the location and severity of the ulcer.4
Rest, elevation, and removal of pressure (off-loading) are essential components of treatment and should be initiated at first presentation. Recent studies provided evidence that indicated proper off-loading promotes more rapid DFU healing.37,38 Ill-fitting footwear should be discarded and replaced with an appropriate off-loading device for mitigating pressure at the site of the ulceration. Although many off-loading modalities are currently in use, only a few studies describe the frequency and rate of wound healing associated with their use.
The total contact cast (TCC) is considered the superior standard therapy in management for neuropathic ulcers due to its proven ability to redistribute pressure, thereby promoting expeditious wound closure. Another inherent benefit is to ensure patient adherence with off-loading as well as reducing activity levels.24,39 Previous randomized controlled trials have demonstrated that patients treated with TCC healed a higher percentage of plantar ulcers at a faster rate than did patients in the control groups. One unique study demonstrated histologic evidence of more rapid angiogenesis with formation of granulation tissue in the casted group compared with the standard treatment group.40,41
Potential disadvantages of the TCC include the need for expertise in its proper application, the need for weekly cast changes, and related costs.24,35 Although a number of new devices have been introduced as alternatives to the TCC, only several clinical studies demonstrating their efficacy have been published.5,14,25,36 If nonweight bearing with crutches, wheelchair, or more effective devices are not feasible, even a pressure-attenuating insert can be used in a simple postoperative shoe until specialty referral is made.
Debridement of necrotic, callus, fibrous, and senescent tissues is a mainstay of ulcer therapy.42,43 It is considered the first and the most important therapeutic step leading to wound closure in patients with DFU.42-44 Unhealthy tissue must be sharply debrided back to bleeding tissue to fully visualize the extent of the ulcer as well as to detect any underlying abscesses or sinuses. It has been reported that regular (weekly) sharp debridement is associated with more rapid healing of ulcers compared with less frequent debridement.45-47 Wilcox and colleagues indicated that frequent debridement healed more wounds in a shorter time (P < .001).46 The more frequent the debridement, the better the healing outcome. There are different types of debridement methods, including surgical, enzymatic, autolytic, mechanical, and biologic.48 Surgical or sharp debridement can convert a chronic ulcer into an acute wound that is more likely to heal.24 Adequate debridement must always precede the application of topical wound healing agents, dressings, or wound closure procedures.24 Conversely, a wound that does not receive the necessary debridement is one that has not been adequately treated.
There are numerous types of dressings that have been developed over the past decade that promote wound healing. Few have undergone any formal clinical studies to determine efficacy or effectiveness to help guide clinicians in their use.
Yazdanpanah and colleagues argued that dressings should confer moisture balance, protease sequestration, growth factor stimulation, antimicrobial activity, oxygen permeability, and the capacity to promote autolytic debridement to facilitate the production of granulation tissues and the re-epithelialization process.24 In addition, it should have a prolonged time of action, high efficiency, and protection against contamination or infection.17 The group noted that no single dressing fulfills all the requirements of a diabetic patient with a foot ulcer. The choice of dressing is largely determined by the causes of DFU, wound location, depth, amount of scar or slough, exudates, condition of wound margins, presence of infection and pain, need for adhesiveness, and conformability of the dressing (Table 2).
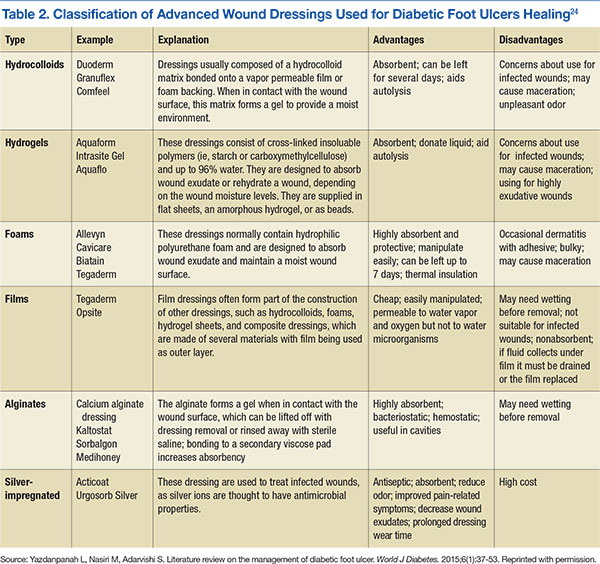
Advanced Therapies
In 2003, Sheehan and colleagues reported that a 50% change in foot ulcer area after 4 weeks of observation is a robust predictor of healing at 12 weeks.49 In addition, wounds failing to achieve a 50% reduction in area after 4 weeks need to be reassessed and considered for advanced treatment modalities if there are no otherwise identified impediments to wound healing.6,9,38 These findings have served as a pivotal clinical decision point in the care of DFUs over the past several years for early identification of patients who may not respond to the standard of care. Today, most wound care protocols advocate use of standard therapies for at least 4 weeks before advanced therapies are considered.
Significant improvements have been achieved in the treatment of ulcerations, and today clinicians have several advanced therapeutic options for management of chronic DFUs. These new technologies have been shown to increase the probability of complete wound closure in difficult-to-heal foot ulcerations in patients with diabetes. Among these are recombinant platelet-derived growth factors, a human living skin equivalent, and a human fibroblast-derived dermal substitute.49-51 Tissue-engineered skin equivalent (Apligraf) and human dermis (Dermagraft) are types of biologically active dressings that are derived from fibroblasts of neonatal foreskins.
The most recent advancements for wound care therapies is that of stem cell therapies, primarily bone marrow-derived and, most recently, placental-derived stem cells, including dehydrated human amnion chorion (Epifix) and amniotic matrix with mesenchymal stem cells (Grafix).52,53 Because of the expense of these products, they cannot be used universally in the treatment of DFUs but rather are used and reserved for difficult-to-heal wounds. In addition, negative pressure therapy has assumed a major role in the management of traumatic, acute, and chronic wounds and has shown efficacy in healing DFUs.54-57 Hyperbaric oxygen therapy and several biophysical modalities have been studied and found to be efficacious in healing a wide variety of chronic wounds over the past decade as well, although results vary by study, and no advanced modality has become universal in its application.58-64
Table 3 lists most of the wound care technologies commonly used in current clinical practice. Although randomized controlled trials have been published supporting the use of most of these modalities, a lack of strong data proving efficacy for use of such treatment options remains.
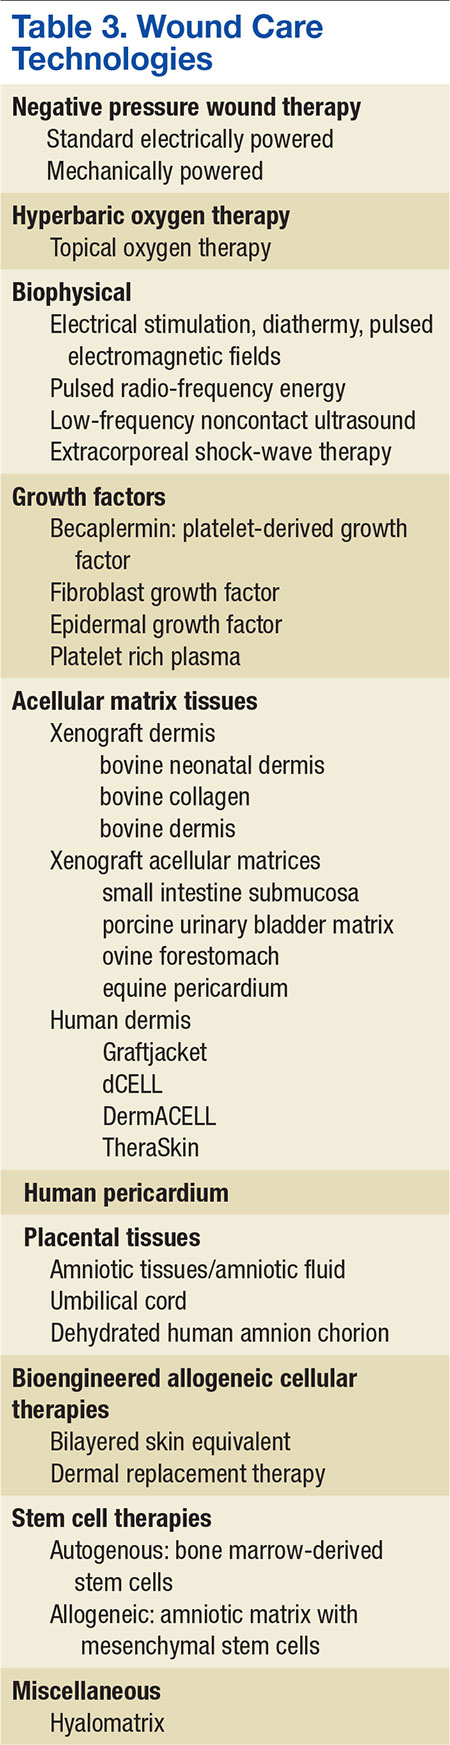
Treatment of any underlying ischemia is critical in achieving a successful outcome. Vascular surgical consultation should be obtained on presentation of an ischemic wound and in cases where ulcers show no sign of progress despite appropriate management.4,13 Revascularization is commonly performed in patients with critical limb ischemia and DFUs but is also performed in patients with less severe arteriopathy. The goal is to restore a palpable pulse on the affected foot.65 The postrevascularization ulcer-healing rate ranges from 46% to 91% at 1 year and seems to be improved in those patients with distal arterial reconstruction and restoration of pulsatile flow.66
Endovascular approaches are becoming increasingly common in patients whose arterial disease is more limited or morbidity is a significant concern.67,68 Studies report that the exact role of isolated endovascular procedures is still to be determined, although such interventions are frequently performed in concert with angiography preceding vascular reconstructive procedures.69,70 However, in many such studies, healing was often a secondary criterion, and there was no description of the initial wound or its management.71
Challenges
Within the VA setting there is a wide range of patient comorbidities that frequently present clinicians with unique challenges. Often these patients are older with many social and mental health conditions, including self-abuse, drug-abuse, nonadherence, psychological issues and lack of financial and/or educational resources or support. Many of these patients have comorbidities associated with diabetes that can delay healing of their ulcerations.
Systemwide VA mandates have implemented multidisciplinary foot care teams. The teams identify veterans at risk for lower limb complications; provide preventive care; track high-risk foot care across the continuum of outpatient, inpatient, and rehabilitative care; and provide education, orthoses, and social support.72,73 In the late 1990s, the VHA implemented a national program of foot risk screening and referral, conducted largely in primary care.29 By 1998 as determined from medical record reviews, 95% of veterans had a visual examination, 84% had palpation of pulses, and 78% had undergone a sensory examination. In addition, about 83% of patients had a monofilament examination, and 85% of individuals with risk factors were referred to foot specialists in 2004.72,74 Veterans at higher risk for lower extremity complications routinely receive subsequent preventive foot care, such as education or prescription of therapeutic shoes in the VHA.
Tseng and colleagues evaluated risk-adjusted trends in amputations among veterans with diabetes during a 5-year period and reported a decrease in amputation rates observed for all types of lower extremity amputations (LEA) and among all racial groups.74 Implementation of such universal programs for foot screening, tracked through performance measures, may have contributed to a decrease in LEAs and improved outcomes in the VA patient population.
Prevention
A healthy, intact diabetic foot is best maintained by a consistent and recurrent preventive treatment strategy. Prevention of ulcer recurrence remains to be a major clinical challenge. Andrews and colleagues demonstrated that recurrence rates range from 28% at 12 months to 100% at 40 months.75 They report that the highest incidence of reulceration is in the site of a previous ulceration, noting that a newly healed ulcer is covered with fragile skin and after complete healing, there is an area of higher density tissue (scar). Shearing between the different tissue densities often contributes to new ulcers.
After the ulcer heals, the patient and their caregivers must incorporate preventative measures in care plans to reduce the risk of wound reoccurrence. A study reported by Barshes and colleagues demonstrated that a majority of people with diabetes do not receive guideline-recommended foot care, including regular foot examinations.76 Identifying the patients with diabetes at risk for ulceration requires foot examination,including the vascular and neurologic systems, skin conditions, and foot structure.77 Among the complications of diabetes, lower limb amputation is considered to be preventable.78,79 Because there is a great beneficial effect of patient education on reducing LEAs, a flexible schedule for diabetes education, that offers education at any time for the maximum convenience of patients rather than focusing on health care provider’s convenience is critical.79,80 Conservative management of foot problems also has reduced the risk of amputation by simple procedures, such as appropriate foot wear, cleanliness, aggressive surgical debridement, and evidence-based ulcer management.34 This is best accomplished through a multidisciplinary approach involving a team of specialists and personnel who provide a coordinated process of care, including a patient motivated to ensure its success.6
Conclusions
The authors have described the components of assessment and treatment that can help ensure successful healing of foot ulcers in diabetic patients. These approaches should be used whenever feasible to reduce the high morbidity and risk of serious complications resulting from foot ulcers. Advances in treating chronic diabetic wounds are promising; however, the intrinsic pathophysiologic abnormalities that lead to ulcers in the first place cannot be ignored. No known therapy will be effective without concomitant management of ischemia, infection, and adequate off-loading.6,75
Not all diabetic foot complications can be prevented, but it is possible to dramatically reduce their incidence through appropriate management and prevention programs. The multidisciplinary team approach that combines the expertise of many types of health care providers for diabetic foot disorders has been demonstrated as the optimal method to achieve favorable rates of limb salvage in the high-risk diabetic patient.
1. Phillips A, Mehl AA. Diabetes mellitus and the increased risk of foot injuries. J Wound Care. 2015;24(5)(suppl 2):4-7.
2. Anichini R, Zecchini F, Cerretini I, et al. Improvement of diabetic foot care after the implementation of the International Consensus on the Diabetic Foot (ICDF): results of a 5-year prospective study. Diabetes Res Clin Pract. 2007;75(2):153-158.
3. Frykberg RG. Diabetic foot ulcers: current concepts. J Foot Ankle Surg. 1998;37(5):440-446.
4. Cavanagh PR, Ulbrecht JS, Caputo GM. New developments in the biomechanics of the diabetic foot. Diabetes Metab Res Rev. 2000;16(suppl 1):S6-S10.
5. Frykberg RG. Diabetic foot ulcers: pathogenesis and management. Am Fam Physician. 2002;66(9):1655-1662.
6. Frykberg RG, Zgonis T, Armstrong DG, et al. Diabetic foot disorders: a clinical practice guideline (2006 revision). J Foot Ankle Surg. 2006;45(5)(suppl 1):S1-S66.
7. American Diabetes Association. Diagnosis and classification of diabetes mellitus. Diabetes Care. 2014;37(suppl 1):S81-S90.
8. American Diabetes Association. Classification and diagnosis of diabetes. Diabetes Care. 2015;38(suppl 1):S8-S16.
9. Bakker K, Schaper N; International Working Group on Diabetic Foot Editorial Board.The development of global consensus guidelines on the management and prevention of the diabetic foot 2011. Diabetes Metab Res Rev. 2012;28(suppl 1):116-118.
10. Armstrong DG, Nguyen HC, Lavery LA, van Schie CH, Boulton AJ, Harkless LB. Off-loading the diabetic foot wound: a randomized clinical trial. Diabetes Care. 2001;24(6):1019-1022.
11. Reiber GE, Vileikyte L, Boyko Ed, et al. Causal pathways for incident lower-extremity ulcers in patients with diabetes from two settings. Diabetes Care. 1999;22(1):157-162.
12. Al-Rubeaan K, Al Derwish M, et al. Diabetic foot complications and their risk factors from a large retrospective cohort study. PLoS One. 2015;10(5):e0124446.
13. Vuorisalo S, Venermo M, Lepantalo M. Treatment of diabetic foot ulcers. J Cardiovasc Surg (Torino). 2009;50(3):275-291.
14. Frykberg ER. Medical management of disasters and mass casualties from terrorist bombings: how can we cope? J Trauma. 2002;53(2):201-212.
15. Reiber GE, Boyko EJ, Smith DG. Lower extremity foot ulcers and amputations in diabetes. In: National Diabetes Data Group of the National Institute of Diabetes and Digestive and Kidney Diseases. Diabetes in America. 2nd ed. Bethesda, MD: National Institutes of Health; 1995:409-427.
16. Waaijman R, de Haart M, Arts ML, et al. Risk factors for plantar foot ulcer recurrence in neuropathic diabetic patients. Diabetes Care. 2014;37(6):1697-1705.
17. O'Loughlin A, McIntosh C, Dinneen SF, O'Brien T. Review paper: basic concepts to novel therapies: a review of the diabetic foot. Int J Low Extrem Wounds. 2010;9(2):90-102.
18. Jeffcoate WJ, Chipchase SY, Ince P, Game FL. Assessing the outcome of the management of diabetic foot ulcers using ulcer-related and person-related measures. Diabetes Care. 2006;29(8):1784-1787.
19. McNeely MJ, Boyko EJ, Ahroni JH, et al. The independent contributions of diabetic neuropathy and yasculopatny in foot ulceration: how great are the risks? Diabetes Care. 1995;18(2):216-219.
20. Frykberg RG. Diabetic foot ulcers: pathogenesis and management. Am Fam Physician. 2002;66(9):1655-1662.
21. Pecoraro RE, Reiber GE, Burgess EM. Pathways to diabetic limb amputation: basis for prevention. Diabetes Care. 1990;13(5):513-521.
22. Boyko EJ, Ahroni JH, Stensel V, Forsberg RC, Davignon DR, Smith DG. A prospective study of risk factors for diabetic foot ulcer. The Seattle Diabetic Foot Study. Diabetes Care. 1999;22(7):1036-1042.
23. Armstrong DG, Lavery LA. Diabetic foot ulcers: prevention, diagnosis and classification. Am Fam Physician. 1998;57(6):1325-1332, 1337-1328.
24. Yazdanpanah L, Nasiri M, Adarvishi S. Literature review on the management of diabetic foot ulcer. World J Diabetes. 2015;6(1):37-53.
25. Frykberg RG. Diabetic foot ulcerations. In: Frykberg RG, ed. The High Risk Foot in Diabetes Mellitus. New York, NY: Churchill Livingstone; 1991.
26. Grayson ML, Gibbons GW, Balogh K, Levin E, Karchmer AW. Probing to bone in infected pedal ulcers. A clinical sign of underlying osteomyelitis in diabetic patients. JAMA. 1995;273(9):721-723.
27. Mayfield JA, Reiber GE, Sanders LJ, Janisse D, Pogach LM. Preventive foot care in people with diabetes. Diabetes Care. 1998;21(12):2161-2177.
28. Kalani M, Brismar K, Fagrell B, Ostergren J, Jörneskog G. Transcutaneous oxygen tension and toe blood pressure as predictors for outcome of diabetic foot ulcers. Diabetes Care. 1999;22(1):147-151.
29. Abbott CA, Vileikyte L, Williamson S, Carrington AL, Boulton AJ. Multicenter study of the incidence of and predictive risk factors for diabetic neuropathic foot ulceration. Diabetes Care. 1998;21(7):1071-1075.
30. Tuttolomondo A, Maida C, Pinto A. Diabetic foot syndrome: immune-inflammatory features as possible cardiovascular markers in diabetes. World J Orthop. 2015;6(1):62-76.
31. Sacco IC, Suda EY, Vigneron V, Sartor CD. An 'importance' map of signs and symptoms to classify diabetic polyneuropathy: an exploratory data analysis. PLoS One. 2015;10(6):e0129763.
32. Asad A, Hameed MA, Khan UA, Ahmed N, Butt MU. Reliability of the neurological scores for assessment of sensorimotor neuropathy in type 2 diabetics. J Pak Med Assoc. 2010;60(3):166-170.
33. Dyck PJ, Albers JW, Andersen H, et al. Diabetic polyneuropathies: update on research definition, diagnostic criteria and estimation of severity. Diabetes Metab Res Rev. 2011;27(7):620-628.
34. Ahmad J. The diabetic foot. Diabetes Metab Syndr. 2015;pii: S1871-4021(15)00030-2. [Epub ahead of print.]
35. Prompers L, Schaper N, Apelqvist J, et al. Prediction of outcome in individuals with diabetic foot ulcers: focus on the differences between individuals with and without peripheral arterial disease. The EURODIALE Study. Diabetologia. 2008;51(5):747-755.
36. Frykberg RG. Team approach toward lower extremity amputation prevention in diabetes. J Am Podiatr Med Assoc. 1997;87(7):305-312.
37. Cavanagh PR, Bus SA. Off-loading the diabetic foot for ulcer prevention and healing. J Am Podiatr Med Assoc. 2010;100(5):360-368.
38. Boulton A. The diabetic foot: from art to science. The 18th Camillo Golgi lecture. Diabetologia. 2004;47(8):1343-1353.
39. Boulton AJ. Pressure and the diabetic foot: clinical science and offloading techniques. Am J Surg. 2004;187(5)(suppl 1):S17-S24.
40. Mueller MJ, Diamond JE, Sinacore DR, et al. Total contact casting in treatment of diabetic plantar ulcers. Controlled clinical trial. Diabetes Care. 1989;12(6):384-388.
41. Piaggesi A, Viacava P, Rizzo L, et al. Semiquantitative analysis of the histopathological features of the neuropathic foot ulcer: effects of pressure relief. Diabetes Care. 2003;26(11):3123-3128.
42. Lebrun E, Tomic-Canic M, Kirsner RS. The role of surgical debridement in healing of diabetic foot ulcers. Wound Repair Regen. 2010;18(5):433-438.
43. Edwards J, Stapley S. Debridement of diabetic foot ulcers. Cochrane Database Syst Rev. 2010(1):CD003556.
44. Tallis A, Motley TA, Wunderlich RP, et al. Clinical and economic assessment of diabetic foot ulcer debridement with collagenase: results of a randomized controlled study. Clin Ther. 2013;35(11):1805-1820.
45. Falanga V. Wound healing and its impairment in the diabetic foot. Lancet. 2005;366(9498):1736-1743.
46. Warriner RA III, Wilcox JR, Carter MJ, Stewart DG. More frequent visits to wound care clinics result in faster times to close diabetic foot and venous leg ulcers. Adv Skin Wound Care. 2012;25(11):494-501.
47. Wilcox JR, Carter MJ, Covington S. Frequency of debridements and time to heal: a retrospective cohort study of 312 744 wounds. JAMA Dermatol. 2013;149(9):1050-1058.
48. Tiwari A, Jain S, Mehta S, Kumar R, Kapoor G, Kumar K. Limb salvage surgery for osteosarcoma: early results in Indian patients. Indian J Orthop. 2014;48(3):266-272.
49. Sheehan P, Jones P, Caselli A, Giurini JM, Veves A. Percent change in wound area of diabetic foot ulcers over a 4-week period is a robust predictor of complete healing in a 12-week prospective trial. Diabetes Care. 2003;26(6):1879-1882.
50. Wieman TJ, Smiell JM, Su Y. Efficacy and safely of a topical gel formulation of recombinant human platelet-derived growth factor-BB (becaplermin) in patients with chronic neuropathic diabetic ulcers: a phase III randomized placebo-controlled double-blind study. Diabetes Care. 1998;21(5):822-827.
51. Naughton G, Mansbridge J, Gentzkow G. A metabolically active human dermal replacement for the treatment of diabetic foot ulcers. Artif Organs.1997;21(11):1203-1210.
52. Zelen CM, Serena TE, Denoziere G, Fetterolf DE. A prospective randomised comparative parallel study of amniotic membrane wound graft in the management of diabetic foot ulcers. Int Wound J. 2013;10(5):502-507.
53. Lavery LA, Fulmer J, Shebetka KA, et al. The efficacy and safety of Grafix® for the treatment of chronic diabetic foot ulcers: results of a multi-centre, controlled, randomised, blinded, clinical trial. Int Wound J. 2014;11(5):554-560.
54. Wolvos TA. Negative pressure wound therapy with instillation: the current state of the art. Surg Technol Int. 2014;24:53-62.
55. Andros G, Armstrong DG, Attinger CE, et al; Tucson Expert Consensus Conference. Consensus statement on negative pressure wound therapy (V.A.C. Therapy) for the management of diabetic foot wounds. Ostomy Wound Manage. 2006(suppl):1-32.
56. Armstrong DG, Lavery LA. Negative pressure wound therapy after partial diabetic foot amputation: a multicentre, randomised controlled trial. Lancet. 2005;366(9498):1704-1710.
57. Armstrong DG, Marston WA, Reyzelman AM, Kirsner RS. Comparative effectiveness of mechanically and electrically powered negative pressure wound therapy devices: a multicenter randomized controlled trial. Wound Repair Regen. 2012;20(3):332-341.
58. Faglia E, Favales F, Aldeghi A, et al. Adjunctive systemic hyperbaric oxygen therapy in treatment of severe prevalently ischemic diabetic foot ulcer. A randomized study. Diabetes Care. 1996;19(12):1338-1343.
59. Fife CE, Buyukcakir C, Otto G, Sheffield P, Love T, Warriner R 3rd. Factors influencing the outcome of lower-extremity diabetic ulcers treated with hyperbaric oxygen therapy. Wound Repair Regen. 2007;15(3):322-331.
60. Kranke P, Bennett MH, Martyn-St. James M, Schnabel A, Debus SE. Hyperbaric oxygen therapy for chronic wounds. Cochrane Database Syst Rev. 2012;4:CD004123.
61. Frykberg R, Martin E, Tallis A, Tierney E. A case history of multimodal therapy in healing a complicated diabetic foot wound: negative pressure, dermal replacement and pulsed radio frequency energy therapies. Int Wound J. 2011;8(2):132-139.
62. Frykberg RG, Driver VR, Lavery LA, Armstrong DG, Isenberg RA. The use of pulsed radio frequency energy therapy in treating lower extremity wounds: results of a retrospective study of a wound registry. Ostomy Wound Manage. 2011;57(3):22-29.
63. Kloth LC. Electrical Stimulation Technologies for Wound Healing. Adv Wound Care. 2014;3(2):81-90.
64. Ennis WJ, Foremann P, Mozen N, Massey J, Conner-Kerr T, Meneses P. Ultrasound therapy for recalcitrant diabetic foot ulcers: results of a randomized, double-blind, controlled, multicenter study. Ostomy Wound Manage. 2005;51(8):24-39.
65. Mills JL Sr, Conte MS, Armstrong DG, et al. The Society for Vascular Surgery Lower Extremity Threatened Limb Classification System: risk stratification based on wound, ischemia, and foot infection (WIfI). J Vasc Surg. 2014;59(1):220-234.e2.
66. Pomposelli FB, Kansal N, Hamdan AD, et al. A decade of experience with dorsalis pedis artery bypass: analysis of outcome in more than 1000 cases. J Vasc Surg. 2003;37(2):307-315.
67. Bradbury AW, Adam DJ, Bell J, et al. Multicentre randomised controlled trial of the clinical and cost-effectiveness of a bypass-surgery-first versus a balloon-angioplasty-first revascularisation strategy for severe limb ischaemia due to infrainguinal disease. The Bypass versus Angioplasty in Severe Ischaemia of the Leg (BASIL) trial. Health Technol Assess. 2010;14(14):1-210, iii-iv.
68. Conte MS. Challenges of distal bypass surgery in patients with diabetes: patient selection, techniques, and outcomes. J Am Podiatr Med Assoc. 2010;100(5):429-438.
69. Caputo GM, Cavanagh PR, Ulbrecht JS, Gibbons GW, Karchmer AW. Assessment and management of foot disease in patients with diabetes. N Engl J Med. 1994;331(13):854-860.
70. Dyet JF, Nicholson AA, Ettles DF. Vascular imaging and intervention in peripheral arteries in the diabetic patient. Diabetes Metab Res Rev. 2000;16(suppl):S16-S22.
71. Vouillarmet J, Bourron O, Gaudric J, Lermusiaux P, Millon A, Hartemann A. Lower-extremity arterial revascularization: is there any evidence for diabetic foot ulcer-healing? Diabetes Metab. 2015; pii: S1262-3636(15)00083-X. [Epub ahead of print.]
72. Pogach L, Charns MP, Wrobel JS, et al. Impact of policies and performance measurement on development of organizational coordinating strategies for chronic care delivery. Am J Manag Care. 2004;10(2, pt 2):171-180.
73. Longo WE, Cheadle W, Fink A, et al. The role of the Veterans Affairs Medical Centers in patient care, surgical education, research and faculty development. Am J Surg. 2005;190(5):662-675.
74. Tseng CL, Rajan M, Miller DR, Lafrance JP, Pogach L. Trends in initial lower extremity amputation rates among Veterans Health Administration health care System users from 2000 to 2004. Diabetes Care. 2011;34(5):1157-1163.
75. Andrews KL, Houdek MT, Kiemele LJ. Wound management of chronic diabetic foot ulcers: from the basics to regenerative medicine. Prostht Orthot Int. 2015;39(1):29-39.
76. Barshes NR, Sigireddi M, Wrobel JS, et al. The system of care for the diabetic foot: objectives, outcomes, and opportunities. Diabet Foot Ankle. 2013;4:10.3402/dfa.v4i0.21847.
77. Boulton AJ, Armstrong DG, Albert SF, et al. Comprehensive foot examination and risk assessment: a report of the task force of the foot care interest group of the American Diabetes Association, with endorsement by the American Association of Clinical Endocrinologists. Diabetes Care. 2008;31(8):1679-1685.
78. Morey-Vargas OL, Smith SA. BE SMART: strategies for foot care and prevention of foot complications in patients with diabetes. Prosthet Orthot Int. 2015;39(1):48-60.
79. Chiwanga FS, Njelekela MA. Diabetic foot: prevalence, knowledge, and foot self-care practices among diabetic patients in Dar es Salaam, Tanzania-a cross-sectional study. J Foot Ankle Res. 2015;8:20.
80. Ward A, Metz L, Oddone EZ, Edelman D. Foot education improves knowledge and satisfaction among patients at high risk for diabetic foot ulcer. Diabetes Educ. 1999;25(4):560-567.
The prevalence of diabetes mellitus (DM) is growing at epidemic proportions in the U.S. and has been reported as the most common reason for hospital admissions in western countries.1 There continues to be an alarmingly steady increase in the incidence of type 2 DM (T2DM), especially among the young and obese. Long-term diabetes-related complications also are likely to rise in prevalence. In particular, the diabetic foot is associated with morbidity and disability, leading to a significant impairment of quality of life.2 People with DM develop foot ulcers because of neuropathy (sensory, motor, and autonomic deficits), ischemia, or both.3 The initiating injury may be from acute mechanical or thermal trauma or from repetitively or continuously applied mechanical stress.4
From foot ulcerations to neuropathy to peripheral vascular disease, the challenges are significant and can result in amputations and even premature death. To address these challenges, early diagnosis and a multidisciplinary team approach should be employed. Managing the numerous comorbidities is essential for treatment.1,2,5
Due to the longevity of patients with DM, diabetes-associated complications are expected to rise in prevalence.6 The American Diabetes Association recently reported that T2DM accounts for about 90% to 95% of all persons with DM.7,8 Today, many hospitalizations for patients with DM are for lower extremity conditions, such as ulceration, infection, or gangrene. Diabetic foot ulcerations (DFUs) are painful and costly for both the patient and the health care system. Every year, more than 1 million people with DM worldwide lose a leg as a consequence of this disease.9 Most DM-related amputations are preceded by a foot ulcer.
Diabetic foot ulcerations are the most common foot condition leading to lower extremity amputation (Figure 1).10 About 14 million individuals in the U.S. with diagnosed and undiagnosed DM will experience pathologic changes of their lower extremities that, when combined with minor trauma and infection, may lead to serious foot problems.11 Although the triad of vasculopathy, neuropathy, and susceptibility to infection are the primary permissive factors in its pathogenesis, DFU can also be attributed to other important risk factors. The presence of peripheral neuropathy and peripheral arterial disease (PAD) are considered to be the most significant risk factors for all types of diabetic foot complications.12
Related: A Combined Treatment Protocol for Patients With Diabetic Peripheral Neuropathy
Optimal care of foot ulceration depends on the treating physician’s understanding of the pathophysiology involved, familiarity with accepted principles of treatment, and the knowledge that a coordinated, multidisciplinary team approach will best accomplish the goal of limb salvage. All efforts should be made to prevent foot lesions, and when present, existing ulcers should be treated promptly and aggressively, which can often prevent an exacerbation of the problem and decrease the incidence of amputations. Even when ulcers have healed, patients with DM and a history of a lower extremity ulcer should consider it a lifelong condition that requires monitoring to prevent recurrence.13,14
This review provides a brief overview of DFU, including etiology, evaluation, treatment, and prevention, to provide clinicians with the clinical markers, evidence, and DFU treatment recommendations.
Etiologies
Multiple risk factors contribute to the development and pathogenesis of DFUs.5,6,15,16 Neuropathy and PAD are major factors in the pathogenesis of diabetic foot ulcers.17 However, there are several additional factors leading to the occurrence of foot complications. Reiber and colleagues have determined that 63% of their patients’ ulcers were attributed to the critical triad of peripheral sensory neuropathy, trauma, and deformity.15
Other factors also implicated in the causal pathway to ulceration were ischemia, callus, and edema. Infection was rarely implicated in the etiology of these lesions, although once an ulcer has developed, infection and PAD were found to be the major causes for amputation.10,18,19 Many of the risk factors for foot ulcer are also predisposing factors for amputation, because ulcers are primary antecedent events leading to amputation.20-23
Evaluation
The clinical evaluation must include a thorough and systematic lower extremity examination when starting DFU treatment. It is important to have a thorough assessment of the ulcer’s size and depth, and the evaluation should include a description of its appearance and measurement of its diameter at each visit. Evaluation for the presence of local and systemic infection and potential for osteomyelitis, using a small sterile blunt probe, is critical in determining depth of penetration and tracking along tendon sheaths (Figure 2).
Peripheral arterial disease is directly linked to lower extremity disorders, such as intermittent claudication, pain on exertion, pain at rest, and, in severe cases, critical limb ischemia and gangrene.1 Bilateral lower extremity pulses should routinely be palpated. When dorsalis pedis or posterior tibial artery pulses are absent or diminished, Doppler segmental pressures to the toes, pulse volume recording, skin perfusion pressure, or transcutaneous oxygen evaluation is indicated, and vascular consultation should be sought.3 Ischemia is caused by peripheral arterial occlusive disease of larger vessels, not by microangiopathy.13 Poor arterial inflow is associated not only with impaired ulcer healing, but also subsequent infection, gangrene, and amputation.13
Diabetic peripheral neuropathy is characterized by loss of protective sensation, allowing ulceration in areas of high pressure. Peripheral sensory neuropathy as measured by vibration perception thresholds can impart a 3.4-fold to 32-fold risk of ulceration.19,21 Patients insensitive to a 10-g monofilament, commonly used to assess peripheral neuropathy, has been shown in several studies to convey a 2.2-fold to18-fold risk of ulceration.6,19,27,28 In the large, population-based North-West Diabetes Foot Care Study, loss of protective sensation to the 10-g monofilament increased the risk of ulceration 80%, whereas abnormal ankle reflexes increased this risk 55%.29
Peripheral neuropathy has been demonstrated as a strong risk factor for foot ulceration in many cross-sectional studies and is present in > 80% of affected patients.29 Recent studies suggested that impaired sensation makes the foot increasingly vulnerable to damage caused by mechanical, thermal, or pressure-related injury.30 Autonomic neuropathy by virtue of subsequent anhidrosis causes dryness of the skin and, therefore, vulnerability to fissuring.13
Unhealed cracks in the skin can easily lead to infection, especially in the presence of PAD. Neuropathy has an insidious and nonhomogeneous manifestation, making it difficult to identify its onset and a challenge for patients and clinicians.31,32
Sacco and colleagues reviewed current literature and the International Consensus on the Diabetic Foot recommendation and concluded that most attention is given to patients with imminent foot ulceration rather than attempting to develop and improve assessment techniques that detect early impairments.31,33 They propose that effort should be made that detect patients at risk of developing diabetic polyneuropathy. Although the 10-g monofilament pressure perception threshold is a common screening technique for early detection, tests of the vibration perception threshold may be more sensitive.
The authors propose that different monofilament sizes could probably better help determine the disease status, as the vibration tests do. In addition to the considerable subjectivity of both methods of assessing sensitivity, they are unquestionably clinical resources that can contribute to early detection of DPN. Future studies should focus on developing assessment strategies and tools that better detect early neuropathic changes. Early diagnosis of impending problems will aid in preventing further limb-threatening complications.
Treatment
The management of diabetic foot disease is focused primarily on avoiding lower extremity amputation and should be carried out through 3 main strategies: identification of the at risk foot, treatment of the acutely diseased foot, and prevention of further complications.34 The primary goal in the treatment of DFUs is to obtain wound closure. Prompt, aggressive treatment of DFUs can often prevent an exacerbation of the problem and the potential need for amputation. The aim of therapy, therefore, should be early intervention to allow prompt healing of the lesion and, once healed, prevent its recurrence.3,20,25,35
Management of the foot ulcer is largely determined by its severity (grade), vascularity, and presence of infection.3,14,36 A multidisciplinary team approach should be used due to the multifaceted nature of foot ulcers, as well as for managing the numerous comorbidities attendant with these patients. The choice of treatment methods is determined by patient and ulcer characteristics. Equally important is the ability of patients to comply with the treatment as well as with the location and severity of the ulcer.4
Rest, elevation, and removal of pressure (off-loading) are essential components of treatment and should be initiated at first presentation. Recent studies provided evidence that indicated proper off-loading promotes more rapid DFU healing.37,38 Ill-fitting footwear should be discarded and replaced with an appropriate off-loading device for mitigating pressure at the site of the ulceration. Although many off-loading modalities are currently in use, only a few studies describe the frequency and rate of wound healing associated with their use.
The total contact cast (TCC) is considered the superior standard therapy in management for neuropathic ulcers due to its proven ability to redistribute pressure, thereby promoting expeditious wound closure. Another inherent benefit is to ensure patient adherence with off-loading as well as reducing activity levels.24,39 Previous randomized controlled trials have demonstrated that patients treated with TCC healed a higher percentage of plantar ulcers at a faster rate than did patients in the control groups. One unique study demonstrated histologic evidence of more rapid angiogenesis with formation of granulation tissue in the casted group compared with the standard treatment group.40,41
Potential disadvantages of the TCC include the need for expertise in its proper application, the need for weekly cast changes, and related costs.24,35 Although a number of new devices have been introduced as alternatives to the TCC, only several clinical studies demonstrating their efficacy have been published.5,14,25,36 If nonweight bearing with crutches, wheelchair, or more effective devices are not feasible, even a pressure-attenuating insert can be used in a simple postoperative shoe until specialty referral is made.
Debridement of necrotic, callus, fibrous, and senescent tissues is a mainstay of ulcer therapy.42,43 It is considered the first and the most important therapeutic step leading to wound closure in patients with DFU.42-44 Unhealthy tissue must be sharply debrided back to bleeding tissue to fully visualize the extent of the ulcer as well as to detect any underlying abscesses or sinuses. It has been reported that regular (weekly) sharp debridement is associated with more rapid healing of ulcers compared with less frequent debridement.45-47 Wilcox and colleagues indicated that frequent debridement healed more wounds in a shorter time (P < .001).46 The more frequent the debridement, the better the healing outcome. There are different types of debridement methods, including surgical, enzymatic, autolytic, mechanical, and biologic.48 Surgical or sharp debridement can convert a chronic ulcer into an acute wound that is more likely to heal.24 Adequate debridement must always precede the application of topical wound healing agents, dressings, or wound closure procedures.24 Conversely, a wound that does not receive the necessary debridement is one that has not been adequately treated.
There are numerous types of dressings that have been developed over the past decade that promote wound healing. Few have undergone any formal clinical studies to determine efficacy or effectiveness to help guide clinicians in their use.
Yazdanpanah and colleagues argued that dressings should confer moisture balance, protease sequestration, growth factor stimulation, antimicrobial activity, oxygen permeability, and the capacity to promote autolytic debridement to facilitate the production of granulation tissues and the re-epithelialization process.24 In addition, it should have a prolonged time of action, high efficiency, and protection against contamination or infection.17 The group noted that no single dressing fulfills all the requirements of a diabetic patient with a foot ulcer. The choice of dressing is largely determined by the causes of DFU, wound location, depth, amount of scar or slough, exudates, condition of wound margins, presence of infection and pain, need for adhesiveness, and conformability of the dressing (Table 2).
Advanced Therapies
In 2003, Sheehan and colleagues reported that a 50% change in foot ulcer area after 4 weeks of observation is a robust predictor of healing at 12 weeks.49 In addition, wounds failing to achieve a 50% reduction in area after 4 weeks need to be reassessed and considered for advanced treatment modalities if there are no otherwise identified impediments to wound healing.6,9,38 These findings have served as a pivotal clinical decision point in the care of DFUs over the past several years for early identification of patients who may not respond to the standard of care. Today, most wound care protocols advocate use of standard therapies for at least 4 weeks before advanced therapies are considered.
Significant improvements have been achieved in the treatment of ulcerations, and today clinicians have several advanced therapeutic options for management of chronic DFUs. These new technologies have been shown to increase the probability of complete wound closure in difficult-to-heal foot ulcerations in patients with diabetes. Among these are recombinant platelet-derived growth factors, a human living skin equivalent, and a human fibroblast-derived dermal substitute.49-51 Tissue-engineered skin equivalent (Apligraf) and human dermis (Dermagraft) are types of biologically active dressings that are derived from fibroblasts of neonatal foreskins.
The most recent advancements for wound care therapies is that of stem cell therapies, primarily bone marrow-derived and, most recently, placental-derived stem cells, including dehydrated human amnion chorion (Epifix) and amniotic matrix with mesenchymal stem cells (Grafix).52,53 Because of the expense of these products, they cannot be used universally in the treatment of DFUs but rather are used and reserved for difficult-to-heal wounds. In addition, negative pressure therapy has assumed a major role in the management of traumatic, acute, and chronic wounds and has shown efficacy in healing DFUs.54-57 Hyperbaric oxygen therapy and several biophysical modalities have been studied and found to be efficacious in healing a wide variety of chronic wounds over the past decade as well, although results vary by study, and no advanced modality has become universal in its application.58-64
Table 3 lists most of the wound care technologies commonly used in current clinical practice. Although randomized controlled trials have been published supporting the use of most of these modalities, a lack of strong data proving efficacy for use of such treatment options remains.
Treatment of any underlying ischemia is critical in achieving a successful outcome. Vascular surgical consultation should be obtained on presentation of an ischemic wound and in cases where ulcers show no sign of progress despite appropriate management.4,13 Revascularization is commonly performed in patients with critical limb ischemia and DFUs but is also performed in patients with less severe arteriopathy. The goal is to restore a palpable pulse on the affected foot.65 The postrevascularization ulcer-healing rate ranges from 46% to 91% at 1 year and seems to be improved in those patients with distal arterial reconstruction and restoration of pulsatile flow.66
Endovascular approaches are becoming increasingly common in patients whose arterial disease is more limited or morbidity is a significant concern.67,68 Studies report that the exact role of isolated endovascular procedures is still to be determined, although such interventions are frequently performed in concert with angiography preceding vascular reconstructive procedures.69,70 However, in many such studies, healing was often a secondary criterion, and there was no description of the initial wound or its management.71
Challenges
Within the VA setting there is a wide range of patient comorbidities that frequently present clinicians with unique challenges. Often these patients are older with many social and mental health conditions, including self-abuse, drug-abuse, nonadherence, psychological issues and lack of financial and/or educational resources or support. Many of these patients have comorbidities associated with diabetes that can delay healing of their ulcerations.
Systemwide VA mandates have implemented multidisciplinary foot care teams. The teams identify veterans at risk for lower limb complications; provide preventive care; track high-risk foot care across the continuum of outpatient, inpatient, and rehabilitative care; and provide education, orthoses, and social support.72,73 In the late 1990s, the VHA implemented a national program of foot risk screening and referral, conducted largely in primary care.29 By 1998 as determined from medical record reviews, 95% of veterans had a visual examination, 84% had palpation of pulses, and 78% had undergone a sensory examination. In addition, about 83% of patients had a monofilament examination, and 85% of individuals with risk factors were referred to foot specialists in 2004.72,74 Veterans at higher risk for lower extremity complications routinely receive subsequent preventive foot care, such as education or prescription of therapeutic shoes in the VHA.
Tseng and colleagues evaluated risk-adjusted trends in amputations among veterans with diabetes during a 5-year period and reported a decrease in amputation rates observed for all types of lower extremity amputations (LEA) and among all racial groups.74 Implementation of such universal programs for foot screening, tracked through performance measures, may have contributed to a decrease in LEAs and improved outcomes in the VA patient population.
Prevention
A healthy, intact diabetic foot is best maintained by a consistent and recurrent preventive treatment strategy. Prevention of ulcer recurrence remains to be a major clinical challenge. Andrews and colleagues demonstrated that recurrence rates range from 28% at 12 months to 100% at 40 months.75 They report that the highest incidence of reulceration is in the site of a previous ulceration, noting that a newly healed ulcer is covered with fragile skin and after complete healing, there is an area of higher density tissue (scar). Shearing between the different tissue densities often contributes to new ulcers.
After the ulcer heals, the patient and their caregivers must incorporate preventative measures in care plans to reduce the risk of wound reoccurrence. A study reported by Barshes and colleagues demonstrated that a majority of people with diabetes do not receive guideline-recommended foot care, including regular foot examinations.76 Identifying the patients with diabetes at risk for ulceration requires foot examination,including the vascular and neurologic systems, skin conditions, and foot structure.77 Among the complications of diabetes, lower limb amputation is considered to be preventable.78,79 Because there is a great beneficial effect of patient education on reducing LEAs, a flexible schedule for diabetes education, that offers education at any time for the maximum convenience of patients rather than focusing on health care provider’s convenience is critical.79,80 Conservative management of foot problems also has reduced the risk of amputation by simple procedures, such as appropriate foot wear, cleanliness, aggressive surgical debridement, and evidence-based ulcer management.34 This is best accomplished through a multidisciplinary approach involving a team of specialists and personnel who provide a coordinated process of care, including a patient motivated to ensure its success.6
Conclusions
The authors have described the components of assessment and treatment that can help ensure successful healing of foot ulcers in diabetic patients. These approaches should be used whenever feasible to reduce the high morbidity and risk of serious complications resulting from foot ulcers. Advances in treating chronic diabetic wounds are promising; however, the intrinsic pathophysiologic abnormalities that lead to ulcers in the first place cannot be ignored. No known therapy will be effective without concomitant management of ischemia, infection, and adequate off-loading.6,75
Not all diabetic foot complications can be prevented, but it is possible to dramatically reduce their incidence through appropriate management and prevention programs. The multidisciplinary team approach that combines the expertise of many types of health care providers for diabetic foot disorders has been demonstrated as the optimal method to achieve favorable rates of limb salvage in the high-risk diabetic patient.
1. Phillips A, Mehl AA. Diabetes mellitus and the increased risk of foot injuries. J Wound Care. 2015;24(5)(suppl 2):4-7.
2. Anichini R, Zecchini F, Cerretini I, et al. Improvement of diabetic foot care after the implementation of the International Consensus on the Diabetic Foot (ICDF): results of a 5-year prospective study. Diabetes Res Clin Pract. 2007;75(2):153-158.
3. Frykberg RG. Diabetic foot ulcers: current concepts. J Foot Ankle Surg. 1998;37(5):440-446.
4. Cavanagh PR, Ulbrecht JS, Caputo GM. New developments in the biomechanics of the diabetic foot. Diabetes Metab Res Rev. 2000;16(suppl 1):S6-S10.
5. Frykberg RG. Diabetic foot ulcers: pathogenesis and management. Am Fam Physician. 2002;66(9):1655-1662.
6. Frykberg RG, Zgonis T, Armstrong DG, et al. Diabetic foot disorders: a clinical practice guideline (2006 revision). J Foot Ankle Surg. 2006;45(5)(suppl 1):S1-S66.
7. American Diabetes Association. Diagnosis and classification of diabetes mellitus. Diabetes Care. 2014;37(suppl 1):S81-S90.
8. American Diabetes Association. Classification and diagnosis of diabetes. Diabetes Care. 2015;38(suppl 1):S8-S16.
9. Bakker K, Schaper N; International Working Group on Diabetic Foot Editorial Board.The development of global consensus guidelines on the management and prevention of the diabetic foot 2011. Diabetes Metab Res Rev. 2012;28(suppl 1):116-118.
10. Armstrong DG, Nguyen HC, Lavery LA, van Schie CH, Boulton AJ, Harkless LB. Off-loading the diabetic foot wound: a randomized clinical trial. Diabetes Care. 2001;24(6):1019-1022.
11. Reiber GE, Vileikyte L, Boyko Ed, et al. Causal pathways for incident lower-extremity ulcers in patients with diabetes from two settings. Diabetes Care. 1999;22(1):157-162.
12. Al-Rubeaan K, Al Derwish M, et al. Diabetic foot complications and their risk factors from a large retrospective cohort study. PLoS One. 2015;10(5):e0124446.
13. Vuorisalo S, Venermo M, Lepantalo M. Treatment of diabetic foot ulcers. J Cardiovasc Surg (Torino). 2009;50(3):275-291.
14. Frykberg ER. Medical management of disasters and mass casualties from terrorist bombings: how can we cope? J Trauma. 2002;53(2):201-212.
15. Reiber GE, Boyko EJ, Smith DG. Lower extremity foot ulcers and amputations in diabetes. In: National Diabetes Data Group of the National Institute of Diabetes and Digestive and Kidney Diseases. Diabetes in America. 2nd ed. Bethesda, MD: National Institutes of Health; 1995:409-427.
16. Waaijman R, de Haart M, Arts ML, et al. Risk factors for plantar foot ulcer recurrence in neuropathic diabetic patients. Diabetes Care. 2014;37(6):1697-1705.
17. O'Loughlin A, McIntosh C, Dinneen SF, O'Brien T. Review paper: basic concepts to novel therapies: a review of the diabetic foot. Int J Low Extrem Wounds. 2010;9(2):90-102.
18. Jeffcoate WJ, Chipchase SY, Ince P, Game FL. Assessing the outcome of the management of diabetic foot ulcers using ulcer-related and person-related measures. Diabetes Care. 2006;29(8):1784-1787.
19. McNeely MJ, Boyko EJ, Ahroni JH, et al. The independent contributions of diabetic neuropathy and yasculopatny in foot ulceration: how great are the risks? Diabetes Care. 1995;18(2):216-219.
20. Frykberg RG. Diabetic foot ulcers: pathogenesis and management. Am Fam Physician. 2002;66(9):1655-1662.
21. Pecoraro RE, Reiber GE, Burgess EM. Pathways to diabetic limb amputation: basis for prevention. Diabetes Care. 1990;13(5):513-521.
22. Boyko EJ, Ahroni JH, Stensel V, Forsberg RC, Davignon DR, Smith DG. A prospective study of risk factors for diabetic foot ulcer. The Seattle Diabetic Foot Study. Diabetes Care. 1999;22(7):1036-1042.
23. Armstrong DG, Lavery LA. Diabetic foot ulcers: prevention, diagnosis and classification. Am Fam Physician. 1998;57(6):1325-1332, 1337-1328.
24. Yazdanpanah L, Nasiri M, Adarvishi S. Literature review on the management of diabetic foot ulcer. World J Diabetes. 2015;6(1):37-53.
25. Frykberg RG. Diabetic foot ulcerations. In: Frykberg RG, ed. The High Risk Foot in Diabetes Mellitus. New York, NY: Churchill Livingstone; 1991.
26. Grayson ML, Gibbons GW, Balogh K, Levin E, Karchmer AW. Probing to bone in infected pedal ulcers. A clinical sign of underlying osteomyelitis in diabetic patients. JAMA. 1995;273(9):721-723.
27. Mayfield JA, Reiber GE, Sanders LJ, Janisse D, Pogach LM. Preventive foot care in people with diabetes. Diabetes Care. 1998;21(12):2161-2177.
28. Kalani M, Brismar K, Fagrell B, Ostergren J, Jörneskog G. Transcutaneous oxygen tension and toe blood pressure as predictors for outcome of diabetic foot ulcers. Diabetes Care. 1999;22(1):147-151.
29. Abbott CA, Vileikyte L, Williamson S, Carrington AL, Boulton AJ. Multicenter study of the incidence of and predictive risk factors for diabetic neuropathic foot ulceration. Diabetes Care. 1998;21(7):1071-1075.
30. Tuttolomondo A, Maida C, Pinto A. Diabetic foot syndrome: immune-inflammatory features as possible cardiovascular markers in diabetes. World J Orthop. 2015;6(1):62-76.
31. Sacco IC, Suda EY, Vigneron V, Sartor CD. An 'importance' map of signs and symptoms to classify diabetic polyneuropathy: an exploratory data analysis. PLoS One. 2015;10(6):e0129763.
32. Asad A, Hameed MA, Khan UA, Ahmed N, Butt MU. Reliability of the neurological scores for assessment of sensorimotor neuropathy in type 2 diabetics. J Pak Med Assoc. 2010;60(3):166-170.
33. Dyck PJ, Albers JW, Andersen H, et al. Diabetic polyneuropathies: update on research definition, diagnostic criteria and estimation of severity. Diabetes Metab Res Rev. 2011;27(7):620-628.
34. Ahmad J. The diabetic foot. Diabetes Metab Syndr. 2015;pii: S1871-4021(15)00030-2. [Epub ahead of print.]
35. Prompers L, Schaper N, Apelqvist J, et al. Prediction of outcome in individuals with diabetic foot ulcers: focus on the differences between individuals with and without peripheral arterial disease. The EURODIALE Study. Diabetologia. 2008;51(5):747-755.
36. Frykberg RG. Team approach toward lower extremity amputation prevention in diabetes. J Am Podiatr Med Assoc. 1997;87(7):305-312.
37. Cavanagh PR, Bus SA. Off-loading the diabetic foot for ulcer prevention and healing. J Am Podiatr Med Assoc. 2010;100(5):360-368.
38. Boulton A. The diabetic foot: from art to science. The 18th Camillo Golgi lecture. Diabetologia. 2004;47(8):1343-1353.
39. Boulton AJ. Pressure and the diabetic foot: clinical science and offloading techniques. Am J Surg. 2004;187(5)(suppl 1):S17-S24.
40. Mueller MJ, Diamond JE, Sinacore DR, et al. Total contact casting in treatment of diabetic plantar ulcers. Controlled clinical trial. Diabetes Care. 1989;12(6):384-388.
41. Piaggesi A, Viacava P, Rizzo L, et al. Semiquantitative analysis of the histopathological features of the neuropathic foot ulcer: effects of pressure relief. Diabetes Care. 2003;26(11):3123-3128.
42. Lebrun E, Tomic-Canic M, Kirsner RS. The role of surgical debridement in healing of diabetic foot ulcers. Wound Repair Regen. 2010;18(5):433-438.
43. Edwards J, Stapley S. Debridement of diabetic foot ulcers. Cochrane Database Syst Rev. 2010(1):CD003556.
44. Tallis A, Motley TA, Wunderlich RP, et al. Clinical and economic assessment of diabetic foot ulcer debridement with collagenase: results of a randomized controlled study. Clin Ther. 2013;35(11):1805-1820.
45. Falanga V. Wound healing and its impairment in the diabetic foot. Lancet. 2005;366(9498):1736-1743.
46. Warriner RA III, Wilcox JR, Carter MJ, Stewart DG. More frequent visits to wound care clinics result in faster times to close diabetic foot and venous leg ulcers. Adv Skin Wound Care. 2012;25(11):494-501.
47. Wilcox JR, Carter MJ, Covington S. Frequency of debridements and time to heal: a retrospective cohort study of 312 744 wounds. JAMA Dermatol. 2013;149(9):1050-1058.
48. Tiwari A, Jain S, Mehta S, Kumar R, Kapoor G, Kumar K. Limb salvage surgery for osteosarcoma: early results in Indian patients. Indian J Orthop. 2014;48(3):266-272.
49. Sheehan P, Jones P, Caselli A, Giurini JM, Veves A. Percent change in wound area of diabetic foot ulcers over a 4-week period is a robust predictor of complete healing in a 12-week prospective trial. Diabetes Care. 2003;26(6):1879-1882.
50. Wieman TJ, Smiell JM, Su Y. Efficacy and safely of a topical gel formulation of recombinant human platelet-derived growth factor-BB (becaplermin) in patients with chronic neuropathic diabetic ulcers: a phase III randomized placebo-controlled double-blind study. Diabetes Care. 1998;21(5):822-827.
51. Naughton G, Mansbridge J, Gentzkow G. A metabolically active human dermal replacement for the treatment of diabetic foot ulcers. Artif Organs.1997;21(11):1203-1210.
52. Zelen CM, Serena TE, Denoziere G, Fetterolf DE. A prospective randomised comparative parallel study of amniotic membrane wound graft in the management of diabetic foot ulcers. Int Wound J. 2013;10(5):502-507.
53. Lavery LA, Fulmer J, Shebetka KA, et al. The efficacy and safety of Grafix® for the treatment of chronic diabetic foot ulcers: results of a multi-centre, controlled, randomised, blinded, clinical trial. Int Wound J. 2014;11(5):554-560.
54. Wolvos TA. Negative pressure wound therapy with instillation: the current state of the art. Surg Technol Int. 2014;24:53-62.
55. Andros G, Armstrong DG, Attinger CE, et al; Tucson Expert Consensus Conference. Consensus statement on negative pressure wound therapy (V.A.C. Therapy) for the management of diabetic foot wounds. Ostomy Wound Manage. 2006(suppl):1-32.
56. Armstrong DG, Lavery LA. Negative pressure wound therapy after partial diabetic foot amputation: a multicentre, randomised controlled trial. Lancet. 2005;366(9498):1704-1710.
57. Armstrong DG, Marston WA, Reyzelman AM, Kirsner RS. Comparative effectiveness of mechanically and electrically powered negative pressure wound therapy devices: a multicenter randomized controlled trial. Wound Repair Regen. 2012;20(3):332-341.
58. Faglia E, Favales F, Aldeghi A, et al. Adjunctive systemic hyperbaric oxygen therapy in treatment of severe prevalently ischemic diabetic foot ulcer. A randomized study. Diabetes Care. 1996;19(12):1338-1343.
59. Fife CE, Buyukcakir C, Otto G, Sheffield P, Love T, Warriner R 3rd. Factors influencing the outcome of lower-extremity diabetic ulcers treated with hyperbaric oxygen therapy. Wound Repair Regen. 2007;15(3):322-331.
60. Kranke P, Bennett MH, Martyn-St. James M, Schnabel A, Debus SE. Hyperbaric oxygen therapy for chronic wounds. Cochrane Database Syst Rev. 2012;4:CD004123.
61. Frykberg R, Martin E, Tallis A, Tierney E. A case history of multimodal therapy in healing a complicated diabetic foot wound: negative pressure, dermal replacement and pulsed radio frequency energy therapies. Int Wound J. 2011;8(2):132-139.
62. Frykberg RG, Driver VR, Lavery LA, Armstrong DG, Isenberg RA. The use of pulsed radio frequency energy therapy in treating lower extremity wounds: results of a retrospective study of a wound registry. Ostomy Wound Manage. 2011;57(3):22-29.
63. Kloth LC. Electrical Stimulation Technologies for Wound Healing. Adv Wound Care. 2014;3(2):81-90.
64. Ennis WJ, Foremann P, Mozen N, Massey J, Conner-Kerr T, Meneses P. Ultrasound therapy for recalcitrant diabetic foot ulcers: results of a randomized, double-blind, controlled, multicenter study. Ostomy Wound Manage. 2005;51(8):24-39.
65. Mills JL Sr, Conte MS, Armstrong DG, et al. The Society for Vascular Surgery Lower Extremity Threatened Limb Classification System: risk stratification based on wound, ischemia, and foot infection (WIfI). J Vasc Surg. 2014;59(1):220-234.e2.
66. Pomposelli FB, Kansal N, Hamdan AD, et al. A decade of experience with dorsalis pedis artery bypass: analysis of outcome in more than 1000 cases. J Vasc Surg. 2003;37(2):307-315.
67. Bradbury AW, Adam DJ, Bell J, et al. Multicentre randomised controlled trial of the clinical and cost-effectiveness of a bypass-surgery-first versus a balloon-angioplasty-first revascularisation strategy for severe limb ischaemia due to infrainguinal disease. The Bypass versus Angioplasty in Severe Ischaemia of the Leg (BASIL) trial. Health Technol Assess. 2010;14(14):1-210, iii-iv.
68. Conte MS. Challenges of distal bypass surgery in patients with diabetes: patient selection, techniques, and outcomes. J Am Podiatr Med Assoc. 2010;100(5):429-438.
69. Caputo GM, Cavanagh PR, Ulbrecht JS, Gibbons GW, Karchmer AW. Assessment and management of foot disease in patients with diabetes. N Engl J Med. 1994;331(13):854-860.
70. Dyet JF, Nicholson AA, Ettles DF. Vascular imaging and intervention in peripheral arteries in the diabetic patient. Diabetes Metab Res Rev. 2000;16(suppl):S16-S22.
71. Vouillarmet J, Bourron O, Gaudric J, Lermusiaux P, Millon A, Hartemann A. Lower-extremity arterial revascularization: is there any evidence for diabetic foot ulcer-healing? Diabetes Metab. 2015; pii: S1262-3636(15)00083-X. [Epub ahead of print.]
72. Pogach L, Charns MP, Wrobel JS, et al. Impact of policies and performance measurement on development of organizational coordinating strategies for chronic care delivery. Am J Manag Care. 2004;10(2, pt 2):171-180.
73. Longo WE, Cheadle W, Fink A, et al. The role of the Veterans Affairs Medical Centers in patient care, surgical education, research and faculty development. Am J Surg. 2005;190(5):662-675.
74. Tseng CL, Rajan M, Miller DR, Lafrance JP, Pogach L. Trends in initial lower extremity amputation rates among Veterans Health Administration health care System users from 2000 to 2004. Diabetes Care. 2011;34(5):1157-1163.
75. Andrews KL, Houdek MT, Kiemele LJ. Wound management of chronic diabetic foot ulcers: from the basics to regenerative medicine. Prostht Orthot Int. 2015;39(1):29-39.
76. Barshes NR, Sigireddi M, Wrobel JS, et al. The system of care for the diabetic foot: objectives, outcomes, and opportunities. Diabet Foot Ankle. 2013;4:10.3402/dfa.v4i0.21847.
77. Boulton AJ, Armstrong DG, Albert SF, et al. Comprehensive foot examination and risk assessment: a report of the task force of the foot care interest group of the American Diabetes Association, with endorsement by the American Association of Clinical Endocrinologists. Diabetes Care. 2008;31(8):1679-1685.
78. Morey-Vargas OL, Smith SA. BE SMART: strategies for foot care and prevention of foot complications in patients with diabetes. Prosthet Orthot Int. 2015;39(1):48-60.
79. Chiwanga FS, Njelekela MA. Diabetic foot: prevalence, knowledge, and foot self-care practices among diabetic patients in Dar es Salaam, Tanzania-a cross-sectional study. J Foot Ankle Res. 2015;8:20.
80. Ward A, Metz L, Oddone EZ, Edelman D. Foot education improves knowledge and satisfaction among patients at high risk for diabetic foot ulcer. Diabetes Educ. 1999;25(4):560-567.