User login
Monitoring Heat Injuries in a Hazmat Environment
Heat injuries are a major problem worldwide. In a study chronicling heat deaths in the U.S. from 1979 to 1999, a total of 8,015 deaths were associated with excessive heat exposure.1 Weather conditions caused 3,829 (48%) deaths, and manmade conditions (kitchens, vehicles, boiler rooms, etc) caused 377 (5%) deaths, particularly for those wearing protective clothing.1
Military members who wear combat gear are especially vulnerable to heat injuries, but none more so than members who wear personal protective equipment (PPE). In this review, PPE is defined as self-contained breathing apparatus protective equipment (SCBA) levels B or C. The challenge of PPE is the inability of the individual to dispel heat through radiation, convection, and evaporation. The only close approximation of the PPE environment is combat and football protective equipment. In 2011, CDC reported that football players in uniforms, which resemble PPE for the purpose of this discussion, experienced heat injury at a rate 10 times higher than the average rate for other sports.2 These heat injuries in football players occurred most often during August.2 The injuries could be due to the application of protective clothing and the lack of the participants’ acclimatization. Protective clothing impedes the wearer’s ability to balance heat production with heat dissipation.
In 2010, Armstrong and colleagues suggested that the weight of a football uniform increases heat production.3 And the insulation provided by a football uniform reduces heat dissipation to the surrounding air, decreasing heat loss.3 Additionally, this same study indicated that the more protective gear the subject used, the greater the heat stress.3 The most challenging environment for heat injury is PPE due to the inability to facilitate any heat loss. In 2011, Caldwell and colleagues observed that wearing torso armor increased body temperature 10.8% faster than that of the control group, and those wearing full armor increased body temperature 38% faster than that of the control group.4 And it was proposed that 60% of this heat effect was from wearing the combat helmet.4
The inability to dissipate heat, particularly in protective gear, results in degradation of the effectiveness of the individual and, if left unchecked, may lead to death. Methods exist for health care providers to assess, intervene, and treat populations with heat injuries. These methods include but are not limited to vital signs (blood pressure [BP], body temperature, respiration rate), history of previous heat injury, medications (over-the-counter and prescription), and mental status.
Heat Injuries
Heat injuries are generally divided into 3 categories defined by their severity: heat stress, heat exhaustion, and heat stroke. Heat injuries are due to the individual’s inability to dissipate heat. As the severity of the heat exposure continues, the individual will experience heat stress, and if decompensation continues, the individual will progress to heat exhaustion and finally heat stroke.
If the individual’s physiology is limited or if compensatory mechanisms are compromised, heat stress may occur. Heat compensation can be retarded by any number of the following (including but not limited to): humidity, previous heat injury, lack of sleep, medications, sedentary lifestyle, obesity, caffeinated energy drinks, and dehydration.
In the early phases of heat stress, an individual’s vital signs will increase to compensate for the increase in body heat. Heat exchange is dependent on gradients of temperature and humidity, and as temperature and humidity increase, the ability to transfer heat decreases and becomes less efficient. Failure to accommodate for the increased heat generated and transferred will inevitably result in heat injury.
Working in a hazmat environment in PPE is the worst possible heat transfer scenario due to the inability to use evaporation, the primary means by which heat is released from the body. In this scenario, heat injuries can become dangerous and even fatal if monitoring of vital signs and uncompensated heat production is allowed to continue. As the heat insult progresses from heat stress to heat exhaustion and heat stroke, the core temperature, heart rate, and BP continue to increase. Also, during the progression of heat injury, mental status changes often begin to occur. In 2012, Morley and colleagues found that firefighters wearing protective clothing demonstrated a neurocognitive decline after 50 minutes of treadmill exercise, but these performance declines were not noted until 1 hour or more following the exercise.5
Mental status change is a key diagnostic factor that indicates the progression of the patient from heat stress to heat exhaustion and from heat exhaustion to heat stroke. As the hyperthermia progresses, vital signs increase, and the patient’s mental status will begin to deteriorate. If the hyperthermia advances from heat exhaustion to heat stroke, hospitalization is required to reverse the condition. If homeostasis is not restored, the patient may die.
Mental status changes are usually described as fatigue, lethargy, disorientation, headache, seizure and coma. Indeed, mental status changes may be one of the most important factors that can assist the clinician in the identification, mitigation, and treatment of heat injury before it reaches a critical stage. Clinical familiarity with and diagnosis of delirium resulting from heat injury could prove beneficial in protecting an individual exposed to severe heat environments.
In 2011, Becker and Stewart suggested that in the absence of hyperthermia, the presence of central nervous system (CNS) symptoms should prompt the clinician to pursue another diagnosis.6 However, a core temperature of 104°F with associated CNS changes and anhydrosis should be defined as heat stroke and is a medical emergency.6
Death rates from excessive heat are documented as high as 31%.7 Signs of CNS dysfunction such as irritability, ataxia, headache, nausea, vomiting, anhydrosis, confusion, and decreased cognitive function are essential to the diagnosis of heat stroke. Classic heat stroke will present as a triad of hyperpyrexia, anhydrosis, and mental status changes.8 However, making the diagnosis of heat stroke based on anhydrosis could be dangerous, because in exertional heat stroke, many patients continue to sweat. Overlooking the diagnosis of heat stroke based on anhydrosis could lead to a delay in treatment and severe complications.8 These complications may include hyperkalemia, hyperphosphatemia, hypocalcemia, and myoglobinuria.
Once heat stroke has occurred, coagulopathies may manifest as epistaxis, and endothelial damage may present as peripheral or pulmonary edema. Additionally, a core temperature of above 104°F may trigger a cascade of events that may include systemic inflammatory response resulting in increased cell wall permeability and release of endotoxins. These events can lead to tissue hypoxia, metabolic acidosis, and organ failure. Sequalae from heat stroke can result in multisystem failure. A 1998 study of Chicago heat wave victims reported that the degree of functional disability predicted survival at 1 year.9 Although hospital mortality was 21%, severe functional impairment at discharge was 33%, with an additional 28% mortality at 1 year.9 And the 1-year mortality from heat stroke is similar to that of cerebral vascular accidents.10 Within 24 hours, heat stroke victims often will display evidence of muscle, kidney, and cardiac dysfunction. Delay in intervention raises the risk of fatalities associated with hyperthermia.11,12 Tissue destruction due to uncompensated heat may lead to rhabdomyolysis and subsequent myoglobinuria and renal injury. Damaged hepatocytes may lead to coagulopathies and hepatitis. Injured heart muscle may lead to arrhythmias and cardiac arrest.
The CNS symptoms may be difficult to ascertain in an intense working environment. The CNS system dysfunction is indicative of progression from heat injury to heat stroke and thus a medical emergency. It is imperative that the clinician be able to assess the individual quickly and accurately.

Delirium
Along with physical problems associated with it, heat injury can also lead to relatively abrupt mental status changes. In 2005, Glazer reported that even with minimally elevated core temperatures, CNS system changes can present with altered mental status, convulsions, and coma.13 This qualifies as a medical emergency known as delirium. Patients with delirium may present with a history of abrupt and fluctuating levels of consciousness. This fluctuation in symptoms that resemble sepsis could confuse medical providers.13 Thus, it is imperative that there be continuity of care of the patient with the ability to compare states of consciousness longitudinally over time.
In 1984, Pérez reported that nurses, perhaps because of their familiarity with and proximity to the patient, recorded delirium in 93% of patients, whereas psychiatric consultants recorded delirium only 34% of the time.14 Delirium manifests with several neurologic signs and symptoms; these include but are not limited to tremor, myoclonus, difficulty reading and writing, and visuoconstructive deficits, such as copying designs and problem solving.15 No matter the method to discover the delirium, the definitive treatment is to identify and treat the underlying medical condition.15 The CNS system dysfunction consistent with delirium such as irritability, ataxia, and confusion are essential to the diagnosis of heat stroke.13 Coma and seizures may occur, and retarded recovery of functional ability is an indication of a poor prognosis.9
Objective
The authors propose that in addition to vital signs, an assessment of a patient’s mental status through the use of a mental status exam could be a tool that identifies the problem early and avoids the progression of symptoms from heat stress to heat exhaustion and heat stroke. Early intervention in the progression of symptoms of hyperthermia can save lives, decrease suffering, and maintain a more robust mission-ready posture for the individual and the unit.
Study
During the fall of 2014, the Chemical, Biological, Radiological, Nuclear, and Explosive (CBRNE) unit of the Utah Air and Army National Guard participated in exercises using 2,159 patient encounters that were in PPE (full hazmat and SCBA) also known as level C protective clothing. Temperatures ranged from a minimum of 29°F to a high of 56°F. A mock disaster was practiced for 5 days, and of those 2,159 iterations, 43 were disqualified (2%) for any reason. Two individuals presented with altered mental status and disrupted vital signs and were disqualified for heat injuries with cognitive symptoms (0.00092%). These members were excused from duty, monitored in the medical work/rest tent until mental status and vital signs returned to baseline.
The tool used in the study was the Micro-Mental Test. This is a mental status exam that is more than a simple gestalt of how the patient is performing cognitively but less than a full Mini-Mental State Examination (MMSE). This abbreviated mental status exam provides a field expedient measurement of the individual’s ability to function cognitively. It is important to realize that this exam is most effective when repeated over time to assess the patients’ mental status longitudinally. It would be cavalier to propose that an abbreviated mental status exam would be sufficient to diagnose heat stroke, but a mental status exam—however brief—along with symptoms of hyperpyrexia, abnormal vital signs, and anhydrosis can be a useful tool to make the diagnostic transition from heat exhaustion to heat stroke.
Micro-Mental Status Exam
The traditional mental status measures are appearance, behavior, speech, mood, affect, thought process, thought content, cognition, insight, and judgment. Rapidly assessing mental status is crucial for the assessment of heat injuries, because increased vital signs coupled with neurologic changes indicate a medical emergency. The MMSE is painstaking and a somewhat cumbersome tool to use in the field. Therefore, the authors suggest a micro-mental status exam (Table). This abbreviated mental status exam is performed before the individual is placed in the PPE and enters the working environment.
The individual is then assessed after every rotation exiting the PPE and allowed to rest under supervision. Assessing the individual with vital signs and mental status longitudinally allows the provider to rapidly assess and intervene if the patient begins to exhibit mental status changes along with increased vital signs. The patient is assessed for ataxia, confusion, irritability, and lack of coordination. Patients are asked to find from a file drawer their individual prescreen checklist. This test assesses fine motor skills and cognition. Following this, self-identifying personal information from a precheck sheet is verified, and finally, simple questions regarding orientation to person, place, date, and time are posed.
Assessing Executive Function
Examples of measures of thought processes include assessing executive function by having participants find their paperwork, identifying their platoon leader, and correctly responding to questions, such as, “Where exactly were you working in the emergency area and what exactly were you doing?” This assesses executive function and thought process. Thought content could be assessed with inquiries such as, “Anything troubling about your work?” or “Would you tell me honestly if there were anything troubling or unsafe about the work you have performed?” Cognition could be assessed by questions regarding chain of command (both officer and enlisted), 3 suggestions to improve, 3 suggestions to maintain, and knowledge of the rotation schedule for the rest of the day.
The abbreviated mental status exam should in no way replace the robust and accurate mental status exam. However, in a rapidly changing, austere, or asymmetrical environment, a simple gestalt of the patient is ineffective, and the full mental status evaluation may be too time consuming. The authors propose the Micro-Mental Exam as an alternative. It is imperative that the exam be compared with the baseline assessment of the individual during the prescreening of vital signs before the individual enters the exercise.
This Micro-Mental Exam provides a quick, easy, nonintrusive, and stress-free assessment of the patient. The clarity of cognition and ability to perform simple mental tasks could serve to reassure the provider that the patient has not progressed into the dangerous area of delirium secondary to heat exposure.
Use of this simple tool during the CBRNE exercise resulted in the disqualification of 2 individuals for probable heat injury; additionally, it gave the providers a rapid assessment tool to quickly identify and treat individuals with progressive heat stress to heat stroke.
Discussion
Compared with studies of heat injuries in military and football equipment, the expected heat injury in PPE gear is very low.2-4 The low number of disqualifications during the CBRNE exercise could be due to the extensive measures in place to assist individuals under heat stress. These measures include strict adherence to the work/rest cycles mandated by the DoD, competent leadership in evaluating and treating individuals participating in the exercise, and paying close attention not only to the vital signs, but also participants’ mental status.
A study in 2002 suggested that spending time in an air-conditioned area is the strongest factor in preventing heat-related deaths.16 The study also recommended prevention measures if heat exposure cannot be avoided: working in the cooler part of the day, plenty of water or nonalcoholic drinks, cool showers, lightweight light-colored clothing, and avoiding direct sunshine.16
A study in 2013 suggested that heat injuries are a significant threat to the effectiveness of military operations in general and to the youngest (the most inexperienced soldiers) specifically.17 The study further suggested that it is imperative that leaders be aware of adequate hydration on the one hand and excessive water intake on the other and enforce effective countermeasures against all types of heat injuries.17
Hyponatremia
Hyponatremia is a possible complication of heat exposure and can be divided into categories according to volume: hypovolemia, euvolemia, and hypervolemia.18 Hyponatremia is associated with excessive water consumption and excessive sodium losses via sweat during prolonged physical exertion. Symptoms of hyponatremia are related to the severity of sodium deficit and the rate of sodium decline.18 These symptoms include but are not limited to polydipsia, muscle cramps, headache, altered mental status, coma, and status epilepticus.
Hypovolemic hyponatremia usually will have signs of volume depletion, and sodium levels < 20 mEq/L. Treatment typically consists of volume replenishment with isotonic saline (0.9%), treatment of the underlying condition, and correction of the factors causing hypovolemia.
Euvolemic hyponatremia is typically due to the syndrome of inappropriate antidiuretic hormone (SIADH) and spot urinary sodium is > 20 mEq/L. Correction consists of fluid restriction and correction of the underlying cause.18
Hypervolemic hyponatremia occurs when the kidneys are overwhelmed and cannot excrete water effectively. It is commonly caused by heart failure, cirrhosis, or renal injury. Treatment consists of correction of the underlying cause, sodium and fluid restriction, and diuretic therapy.18 In severe cases of hyponatremia, sodium levels usually have decreased rapidly—typically in less than 24 hours.
Hyponatremia is defined as plasma sodium levels < 135 mEq/L, and severe symptoms often occur when the sodium level reaches 120 mEq/L. Treatment must be initiated quickly to avoid cerebral edema, respiratory failure, brain stem herniation, and death. Correction includes hypertonic 3% saline infusion at a rate of 0.5 to 2 mL/kg per hour until symptoms resolve. Two separate studies in 2014 and 2013 suggested that the rate of sodium correction should be 6 to 12 mEq/L in the first 24 hours and 18 mEq/L or less in 48 hours.19,20
In 2009, Sterns and colleagues suggested that for the treatment of hyponatremia the therapeutic goals for serum sodium concentrations should be 6 to 8 mmol/L in 24 hours, 12 to 14 mmol/L in 48 hours, and 14 to 16 mmol/L in 72 hours.21 To exceed these parameters in the correction of hyponatremia risks overcorrection and iatrogenic brain damage.21
Care must be taken not to overcorrect sodium levels. In 2013, Sood and colleagues reported that in severe hyponatremia, a combination of 3% saline and 1 to 2 µg of desmopressin every 6 to 8 hours achieved a predictable correction of 3 to 7 mEq/L per hour with no overcorrection.22
In the spring of 1998, U.S. Army guidelines were revised not only to protect service members from heat injury, but also from hyponatremia caused by excessive sodium loss due to exertion combined with excessive water consumption. There were fewer hospitalizations of soldiers for hyponatremia due to excessive water consumption after the guidelines were implemented.23 Potential hyponatremia in PPE is even greater due to the strenuous environment. The potential injury due to heat injury on the one hand and hyponatremia on the other demands tailored scrutiny by experienced providers and commanders who can make appropriate changes to the work-rest cycle as needed.
Quick recognition and treatment of exercise-induced hyponatremia is essential to avoid altered mental status, seizures, coma, and death. Current guidelines for the correction of exercise-induced hyponatremia suggest rapid correction of hyponatremia with up to three 100 mL boluses of 3% NaCl in 10-minute intervals. A 2012 case study by Elsaesser and colleagues reported that a severely dehydrated marathon runner with exercise-induced hyponatremic encephalopathy achieved a resolution of symptoms with rapid correction with 100 mL boluses of 3% NaCl spaced in 10-minute intervals. An additional volume of 650 mL of 3% NaCl given over 2 hours for a total volume of 950 mL was needed to resolve the exercise-induced hyponatremia.24 It seems that a 4- to 6-mmol/L increase in serum (Na+) is adequate to reverse most serious clinical manifestations of acute hyponatremia.21
When hyponatremia is corrected too rapidly, the brain’s ability to absorb the metabolites is overwhelmed, resulting in osmotic demyelination.21 Demyelination was produced in animal models by the rapid induction of hypernatremia and can occur in patients who are overcorrected to a hypernatremic state.20 When individuals with chronic hyponatremia are corrected to normal sodium levels, an initial improvement may occur followed by new and often progressive neurologic deficits.20
In 2012, Elsaesser and colleagues suggested that concern regarding overcorrection of hyponatremia might be exaggerated in the setting of exercise-induced hyponatremia. Indeed, the only cases of death associated with exercise-induced hyponatremia have been in the setting of no treatment or slow correction of hyponatremia with normal saline.24
Conclusions
The issue of heat injury in athletic and military environments plagues participants and leaders alike. This article has sought to shed light on mechanisms that are helpful in mitigating heat injury. Football equipment and military protective gear that diminishes that ability to dissipate heat through the retardation of evaporation, convection, and radiation is a key factor in the development of heat injury.
Personal protective equipment is the most hazardous environment for the development of heat injury. This protective gear along with increased environmental humidity, elevated temperature, and increased workload create a dangerous environment for the individuals involved. Careful monitoring of vital signs is an important factor in avoiding heat injuries.
This article proposes that vital signs along with strict monitoring of mental status through (1) orientation; (2) simple task completion; (3) thought processes; and (4) cognitive ability over time combine to be a powerful deterrent to heat injury in an austere and dangerous working environment. It would be cavalier to propose that all heat injuries in any environment could be avoided by following these guidelines, and more tools to avoid heat injury will be developed. But medical providers trained not only to use vital signs, but also monitor and respond to mental status changes in the patient can mitigate heat injuries more effectively. Finally, careful attention should be placed on correcting hypo- and hypernatremia when rehydrating individuals in this challenging environment.
Acknowledgements
The authors wish to thank the following for their contribution to this manuscript: Sarah M. Paulsen, REB Smith, and the entire CERF-P leadership of the Utah National Guard.
1. U.S. Centers for Disease Control and Prevention. Heat-related deaths--four states, July-August 2001, and United States, 1979-1999. MMWR Morb Mortal Wkly Rep. 2002;51(26):567-570.
2. Centers for Disease Control and Prevention. Heat illness among high school athletes--United States, 2005-2009. MMWR Morb Mortal Wkly Rep. 2010;59(32):1009-1013.
3. Armstrong LE, Johnson EC, Casa DJ, Ganio, et al. The American football uniform: uncompensable heat stress and hyperthermic exhaustion. J Athl Train. 2010;45(2):117-127.
4. Caldwell JN, Engelen L, van der Henst C, Patterson MJ, Taylor AS. The interaction of body armor, low-intensity exercise and hot-humid conditions on physiological strain and cognitive function. Mil Med. 2011;176(5):488-493.
5. Morley J, Beauchamp G, Suyama J, et al. Cognitive function following treadmill exercise in thermal protective clothing. Eur J Appl Physiol. 2012;112(5):1733-1740.
6. Becker JA, Stewart LK. Heat-related illness. Am Fam Physician. 2011;83(11):1325-1330.
7. Centers for Disease Control and Prevention, National Health Statistics Reports. Deaths attributed to heat, cold, and other weather events in the United States, 2006-2010. Centers for Disease Control and Prevention Website. http://www.cdc.gov/nchs/data/nhsr/nhsr076.pdf. Accessed January 18, 2016.
8. Wexler RK. Evaluation and treatment of heat-related illnesses. Am Fam Physician. 2002;65(11):2307-2314.
9. Dematte JE, O'Mara K, Buescher J, et al. Near-fatal heat stroke during the 1995 heat wave in Chicago. Ann Intern Med. 1998;129(3):173-181.
10. Kaarisalo MM, Immonen-Räihä P, Marttila RJ, et al. Atrial fibrillation and stroke. Mortality and causes of death after the first acute ischemic stroke. Stroke. 1997;28(2):311-315.
11. Casa DJ, McDermott BP, Lee EC, Yeargin SW, Armstrong LE, Maresh CM. Cold water immersion: the gold standard for exertional heatstroke treatment. Exerc Sport Sci Rev. 2007;35(3):141-149.
12. Marshall SW. Heat injury in youth sport. Br J Sports Med. 2010;44(1):8-12.
13. Glazer JL. Management of heatstroke and heat exhaustion. Am Fam Physician. 2005;71(11):2133-2140.
14. Pérez E, Silverman M. Delirium: the often overlooked diagnosis. Int Psychiatric Med. 1984;14(3):181-188.
15. Gleason O. Delirium. Am Fam Physician. 2003;67(5):1027-1034.
16. Centers for Disease Control and Prevention. Heat-related deaths--Los Angeles County, California, 1999-2000, and United States, 1979-1998. MMWR Morb Mortal Wkly Rep. 2001;50(29):623-626.
17. Update: heat injuries, active component, U.S. Armed Forces, 2012. MSMR. 2013;20(3):17-20.
18. Braun MM, Barstow CH, Pyzocha NJ. Diagnosis and management of sodium disorders: hyponatremia and hypernatremia. Am Fam Physician. 2015;91(5):299-307.
19. Spasovski G, Vanholder R, Allolio B, et al; Hyponatraemia Guideline Development Group. Clinical practice guideline on diagnosis and treatment of hyponatremia. Eur Soc Endocrinol. 2014;170:G1-G47.
20. Verbalis JG, Goldsmith SR, Greenberg A, et al. Diagnosis, evaluation, and treatment of hyponatremia: expert panel recommendations. Am J Med. 2013;126(10)(suppl 1):S1-S42.
21. Sterns RH, Nigwekar SU, Hix JK. The treatment of hyponatremia. Semin Nephrol. 2009;29(3):282-299.
22. Sood L, Sterns RH, Hix JK, Silver SM, Chen L. Hypertonic saline and desmopressin: a simple strategy for safe correction of severe hyponatremia. Am J Kidney Dis. 2013;61(4):571-578.
23. Update: heat injuries, active component, U.S. Armed Forces, 2012. MSMR. 2013;20(3):20-28.
24. Elsaesser TF, Pang PS, Malik S, Chiampas GT. Large-volume hypertonic saline therapy in endurance athlete with exercise -associated hyponatremic encephalopathy. J Emerg Med. 2013;44(6):1132-1135.
Heat injuries are a major problem worldwide. In a study chronicling heat deaths in the U.S. from 1979 to 1999, a total of 8,015 deaths were associated with excessive heat exposure.1 Weather conditions caused 3,829 (48%) deaths, and manmade conditions (kitchens, vehicles, boiler rooms, etc) caused 377 (5%) deaths, particularly for those wearing protective clothing.1
Military members who wear combat gear are especially vulnerable to heat injuries, but none more so than members who wear personal protective equipment (PPE). In this review, PPE is defined as self-contained breathing apparatus protective equipment (SCBA) levels B or C. The challenge of PPE is the inability of the individual to dispel heat through radiation, convection, and evaporation. The only close approximation of the PPE environment is combat and football protective equipment. In 2011, CDC reported that football players in uniforms, which resemble PPE for the purpose of this discussion, experienced heat injury at a rate 10 times higher than the average rate for other sports.2 These heat injuries in football players occurred most often during August.2 The injuries could be due to the application of protective clothing and the lack of the participants’ acclimatization. Protective clothing impedes the wearer’s ability to balance heat production with heat dissipation.
In 2010, Armstrong and colleagues suggested that the weight of a football uniform increases heat production.3 And the insulation provided by a football uniform reduces heat dissipation to the surrounding air, decreasing heat loss.3 Additionally, this same study indicated that the more protective gear the subject used, the greater the heat stress.3 The most challenging environment for heat injury is PPE due to the inability to facilitate any heat loss. In 2011, Caldwell and colleagues observed that wearing torso armor increased body temperature 10.8% faster than that of the control group, and those wearing full armor increased body temperature 38% faster than that of the control group.4 And it was proposed that 60% of this heat effect was from wearing the combat helmet.4
The inability to dissipate heat, particularly in protective gear, results in degradation of the effectiveness of the individual and, if left unchecked, may lead to death. Methods exist for health care providers to assess, intervene, and treat populations with heat injuries. These methods include but are not limited to vital signs (blood pressure [BP], body temperature, respiration rate), history of previous heat injury, medications (over-the-counter and prescription), and mental status.
Heat Injuries
Heat injuries are generally divided into 3 categories defined by their severity: heat stress, heat exhaustion, and heat stroke. Heat injuries are due to the individual’s inability to dissipate heat. As the severity of the heat exposure continues, the individual will experience heat stress, and if decompensation continues, the individual will progress to heat exhaustion and finally heat stroke.
If the individual’s physiology is limited or if compensatory mechanisms are compromised, heat stress may occur. Heat compensation can be retarded by any number of the following (including but not limited to): humidity, previous heat injury, lack of sleep, medications, sedentary lifestyle, obesity, caffeinated energy drinks, and dehydration.
In the early phases of heat stress, an individual’s vital signs will increase to compensate for the increase in body heat. Heat exchange is dependent on gradients of temperature and humidity, and as temperature and humidity increase, the ability to transfer heat decreases and becomes less efficient. Failure to accommodate for the increased heat generated and transferred will inevitably result in heat injury.
Working in a hazmat environment in PPE is the worst possible heat transfer scenario due to the inability to use evaporation, the primary means by which heat is released from the body. In this scenario, heat injuries can become dangerous and even fatal if monitoring of vital signs and uncompensated heat production is allowed to continue. As the heat insult progresses from heat stress to heat exhaustion and heat stroke, the core temperature, heart rate, and BP continue to increase. Also, during the progression of heat injury, mental status changes often begin to occur. In 2012, Morley and colleagues found that firefighters wearing protective clothing demonstrated a neurocognitive decline after 50 minutes of treadmill exercise, but these performance declines were not noted until 1 hour or more following the exercise.5
Mental status change is a key diagnostic factor that indicates the progression of the patient from heat stress to heat exhaustion and from heat exhaustion to heat stroke. As the hyperthermia progresses, vital signs increase, and the patient’s mental status will begin to deteriorate. If the hyperthermia advances from heat exhaustion to heat stroke, hospitalization is required to reverse the condition. If homeostasis is not restored, the patient may die.
Mental status changes are usually described as fatigue, lethargy, disorientation, headache, seizure and coma. Indeed, mental status changes may be one of the most important factors that can assist the clinician in the identification, mitigation, and treatment of heat injury before it reaches a critical stage. Clinical familiarity with and diagnosis of delirium resulting from heat injury could prove beneficial in protecting an individual exposed to severe heat environments.
In 2011, Becker and Stewart suggested that in the absence of hyperthermia, the presence of central nervous system (CNS) symptoms should prompt the clinician to pursue another diagnosis.6 However, a core temperature of 104°F with associated CNS changes and anhydrosis should be defined as heat stroke and is a medical emergency.6
Death rates from excessive heat are documented as high as 31%.7 Signs of CNS dysfunction such as irritability, ataxia, headache, nausea, vomiting, anhydrosis, confusion, and decreased cognitive function are essential to the diagnosis of heat stroke. Classic heat stroke will present as a triad of hyperpyrexia, anhydrosis, and mental status changes.8 However, making the diagnosis of heat stroke based on anhydrosis could be dangerous, because in exertional heat stroke, many patients continue to sweat. Overlooking the diagnosis of heat stroke based on anhydrosis could lead to a delay in treatment and severe complications.8 These complications may include hyperkalemia, hyperphosphatemia, hypocalcemia, and myoglobinuria.
Once heat stroke has occurred, coagulopathies may manifest as epistaxis, and endothelial damage may present as peripheral or pulmonary edema. Additionally, a core temperature of above 104°F may trigger a cascade of events that may include systemic inflammatory response resulting in increased cell wall permeability and release of endotoxins. These events can lead to tissue hypoxia, metabolic acidosis, and organ failure. Sequalae from heat stroke can result in multisystem failure. A 1998 study of Chicago heat wave victims reported that the degree of functional disability predicted survival at 1 year.9 Although hospital mortality was 21%, severe functional impairment at discharge was 33%, with an additional 28% mortality at 1 year.9 And the 1-year mortality from heat stroke is similar to that of cerebral vascular accidents.10 Within 24 hours, heat stroke victims often will display evidence of muscle, kidney, and cardiac dysfunction. Delay in intervention raises the risk of fatalities associated with hyperthermia.11,12 Tissue destruction due to uncompensated heat may lead to rhabdomyolysis and subsequent myoglobinuria and renal injury. Damaged hepatocytes may lead to coagulopathies and hepatitis. Injured heart muscle may lead to arrhythmias and cardiac arrest.
The CNS symptoms may be difficult to ascertain in an intense working environment. The CNS system dysfunction is indicative of progression from heat injury to heat stroke and thus a medical emergency. It is imperative that the clinician be able to assess the individual quickly and accurately.
Delirium
Along with physical problems associated with it, heat injury can also lead to relatively abrupt mental status changes. In 2005, Glazer reported that even with minimally elevated core temperatures, CNS system changes can present with altered mental status, convulsions, and coma.13 This qualifies as a medical emergency known as delirium. Patients with delirium may present with a history of abrupt and fluctuating levels of consciousness. This fluctuation in symptoms that resemble sepsis could confuse medical providers.13 Thus, it is imperative that there be continuity of care of the patient with the ability to compare states of consciousness longitudinally over time.
In 1984, Pérez reported that nurses, perhaps because of their familiarity with and proximity to the patient, recorded delirium in 93% of patients, whereas psychiatric consultants recorded delirium only 34% of the time.14 Delirium manifests with several neurologic signs and symptoms; these include but are not limited to tremor, myoclonus, difficulty reading and writing, and visuoconstructive deficits, such as copying designs and problem solving.15 No matter the method to discover the delirium, the definitive treatment is to identify and treat the underlying medical condition.15 The CNS system dysfunction consistent with delirium such as irritability, ataxia, and confusion are essential to the diagnosis of heat stroke.13 Coma and seizures may occur, and retarded recovery of functional ability is an indication of a poor prognosis.9
Objective
The authors propose that in addition to vital signs, an assessment of a patient’s mental status through the use of a mental status exam could be a tool that identifies the problem early and avoids the progression of symptoms from heat stress to heat exhaustion and heat stroke. Early intervention in the progression of symptoms of hyperthermia can save lives, decrease suffering, and maintain a more robust mission-ready posture for the individual and the unit.
Study
During the fall of 2014, the Chemical, Biological, Radiological, Nuclear, and Explosive (CBRNE) unit of the Utah Air and Army National Guard participated in exercises using 2,159 patient encounters that were in PPE (full hazmat and SCBA) also known as level C protective clothing. Temperatures ranged from a minimum of 29°F to a high of 56°F. A mock disaster was practiced for 5 days, and of those 2,159 iterations, 43 were disqualified (2%) for any reason. Two individuals presented with altered mental status and disrupted vital signs and were disqualified for heat injuries with cognitive symptoms (0.00092%). These members were excused from duty, monitored in the medical work/rest tent until mental status and vital signs returned to baseline.
The tool used in the study was the Micro-Mental Test. This is a mental status exam that is more than a simple gestalt of how the patient is performing cognitively but less than a full Mini-Mental State Examination (MMSE). This abbreviated mental status exam provides a field expedient measurement of the individual’s ability to function cognitively. It is important to realize that this exam is most effective when repeated over time to assess the patients’ mental status longitudinally. It would be cavalier to propose that an abbreviated mental status exam would be sufficient to diagnose heat stroke, but a mental status exam—however brief—along with symptoms of hyperpyrexia, abnormal vital signs, and anhydrosis can be a useful tool to make the diagnostic transition from heat exhaustion to heat stroke.
Micro-Mental Status Exam
The traditional mental status measures are appearance, behavior, speech, mood, affect, thought process, thought content, cognition, insight, and judgment. Rapidly assessing mental status is crucial for the assessment of heat injuries, because increased vital signs coupled with neurologic changes indicate a medical emergency. The MMSE is painstaking and a somewhat cumbersome tool to use in the field. Therefore, the authors suggest a micro-mental status exam (Table). This abbreviated mental status exam is performed before the individual is placed in the PPE and enters the working environment.
The individual is then assessed after every rotation exiting the PPE and allowed to rest under supervision. Assessing the individual with vital signs and mental status longitudinally allows the provider to rapidly assess and intervene if the patient begins to exhibit mental status changes along with increased vital signs. The patient is assessed for ataxia, confusion, irritability, and lack of coordination. Patients are asked to find from a file drawer their individual prescreen checklist. This test assesses fine motor skills and cognition. Following this, self-identifying personal information from a precheck sheet is verified, and finally, simple questions regarding orientation to person, place, date, and time are posed.
Assessing Executive Function
Examples of measures of thought processes include assessing executive function by having participants find their paperwork, identifying their platoon leader, and correctly responding to questions, such as, “Where exactly were you working in the emergency area and what exactly were you doing?” This assesses executive function and thought process. Thought content could be assessed with inquiries such as, “Anything troubling about your work?” or “Would you tell me honestly if there were anything troubling or unsafe about the work you have performed?” Cognition could be assessed by questions regarding chain of command (both officer and enlisted), 3 suggestions to improve, 3 suggestions to maintain, and knowledge of the rotation schedule for the rest of the day.
The abbreviated mental status exam should in no way replace the robust and accurate mental status exam. However, in a rapidly changing, austere, or asymmetrical environment, a simple gestalt of the patient is ineffective, and the full mental status evaluation may be too time consuming. The authors propose the Micro-Mental Exam as an alternative. It is imperative that the exam be compared with the baseline assessment of the individual during the prescreening of vital signs before the individual enters the exercise.
This Micro-Mental Exam provides a quick, easy, nonintrusive, and stress-free assessment of the patient. The clarity of cognition and ability to perform simple mental tasks could serve to reassure the provider that the patient has not progressed into the dangerous area of delirium secondary to heat exposure.
Use of this simple tool during the CBRNE exercise resulted in the disqualification of 2 individuals for probable heat injury; additionally, it gave the providers a rapid assessment tool to quickly identify and treat individuals with progressive heat stress to heat stroke.
Discussion
Compared with studies of heat injuries in military and football equipment, the expected heat injury in PPE gear is very low.2-4 The low number of disqualifications during the CBRNE exercise could be due to the extensive measures in place to assist individuals under heat stress. These measures include strict adherence to the work/rest cycles mandated by the DoD, competent leadership in evaluating and treating individuals participating in the exercise, and paying close attention not only to the vital signs, but also participants’ mental status.
A study in 2002 suggested that spending time in an air-conditioned area is the strongest factor in preventing heat-related deaths.16 The study also recommended prevention measures if heat exposure cannot be avoided: working in the cooler part of the day, plenty of water or nonalcoholic drinks, cool showers, lightweight light-colored clothing, and avoiding direct sunshine.16
A study in 2013 suggested that heat injuries are a significant threat to the effectiveness of military operations in general and to the youngest (the most inexperienced soldiers) specifically.17 The study further suggested that it is imperative that leaders be aware of adequate hydration on the one hand and excessive water intake on the other and enforce effective countermeasures against all types of heat injuries.17
Hyponatremia
Hyponatremia is a possible complication of heat exposure and can be divided into categories according to volume: hypovolemia, euvolemia, and hypervolemia.18 Hyponatremia is associated with excessive water consumption and excessive sodium losses via sweat during prolonged physical exertion. Symptoms of hyponatremia are related to the severity of sodium deficit and the rate of sodium decline.18 These symptoms include but are not limited to polydipsia, muscle cramps, headache, altered mental status, coma, and status epilepticus.
Hypovolemic hyponatremia usually will have signs of volume depletion, and sodium levels < 20 mEq/L. Treatment typically consists of volume replenishment with isotonic saline (0.9%), treatment of the underlying condition, and correction of the factors causing hypovolemia.
Euvolemic hyponatremia is typically due to the syndrome of inappropriate antidiuretic hormone (SIADH) and spot urinary sodium is > 20 mEq/L. Correction consists of fluid restriction and correction of the underlying cause.18
Hypervolemic hyponatremia occurs when the kidneys are overwhelmed and cannot excrete water effectively. It is commonly caused by heart failure, cirrhosis, or renal injury. Treatment consists of correction of the underlying cause, sodium and fluid restriction, and diuretic therapy.18 In severe cases of hyponatremia, sodium levels usually have decreased rapidly—typically in less than 24 hours.
Hyponatremia is defined as plasma sodium levels < 135 mEq/L, and severe symptoms often occur when the sodium level reaches 120 mEq/L. Treatment must be initiated quickly to avoid cerebral edema, respiratory failure, brain stem herniation, and death. Correction includes hypertonic 3% saline infusion at a rate of 0.5 to 2 mL/kg per hour until symptoms resolve. Two separate studies in 2014 and 2013 suggested that the rate of sodium correction should be 6 to 12 mEq/L in the first 24 hours and 18 mEq/L or less in 48 hours.19,20
In 2009, Sterns and colleagues suggested that for the treatment of hyponatremia the therapeutic goals for serum sodium concentrations should be 6 to 8 mmol/L in 24 hours, 12 to 14 mmol/L in 48 hours, and 14 to 16 mmol/L in 72 hours.21 To exceed these parameters in the correction of hyponatremia risks overcorrection and iatrogenic brain damage.21
Care must be taken not to overcorrect sodium levels. In 2013, Sood and colleagues reported that in severe hyponatremia, a combination of 3% saline and 1 to 2 µg of desmopressin every 6 to 8 hours achieved a predictable correction of 3 to 7 mEq/L per hour with no overcorrection.22
In the spring of 1998, U.S. Army guidelines were revised not only to protect service members from heat injury, but also from hyponatremia caused by excessive sodium loss due to exertion combined with excessive water consumption. There were fewer hospitalizations of soldiers for hyponatremia due to excessive water consumption after the guidelines were implemented.23 Potential hyponatremia in PPE is even greater due to the strenuous environment. The potential injury due to heat injury on the one hand and hyponatremia on the other demands tailored scrutiny by experienced providers and commanders who can make appropriate changes to the work-rest cycle as needed.
Quick recognition and treatment of exercise-induced hyponatremia is essential to avoid altered mental status, seizures, coma, and death. Current guidelines for the correction of exercise-induced hyponatremia suggest rapid correction of hyponatremia with up to three 100 mL boluses of 3% NaCl in 10-minute intervals. A 2012 case study by Elsaesser and colleagues reported that a severely dehydrated marathon runner with exercise-induced hyponatremic encephalopathy achieved a resolution of symptoms with rapid correction with 100 mL boluses of 3% NaCl spaced in 10-minute intervals. An additional volume of 650 mL of 3% NaCl given over 2 hours for a total volume of 950 mL was needed to resolve the exercise-induced hyponatremia.24 It seems that a 4- to 6-mmol/L increase in serum (Na+) is adequate to reverse most serious clinical manifestations of acute hyponatremia.21
When hyponatremia is corrected too rapidly, the brain’s ability to absorb the metabolites is overwhelmed, resulting in osmotic demyelination.21 Demyelination was produced in animal models by the rapid induction of hypernatremia and can occur in patients who are overcorrected to a hypernatremic state.20 When individuals with chronic hyponatremia are corrected to normal sodium levels, an initial improvement may occur followed by new and often progressive neurologic deficits.20
In 2012, Elsaesser and colleagues suggested that concern regarding overcorrection of hyponatremia might be exaggerated in the setting of exercise-induced hyponatremia. Indeed, the only cases of death associated with exercise-induced hyponatremia have been in the setting of no treatment or slow correction of hyponatremia with normal saline.24
Conclusions
The issue of heat injury in athletic and military environments plagues participants and leaders alike. This article has sought to shed light on mechanisms that are helpful in mitigating heat injury. Football equipment and military protective gear that diminishes that ability to dissipate heat through the retardation of evaporation, convection, and radiation is a key factor in the development of heat injury.
Personal protective equipment is the most hazardous environment for the development of heat injury. This protective gear along with increased environmental humidity, elevated temperature, and increased workload create a dangerous environment for the individuals involved. Careful monitoring of vital signs is an important factor in avoiding heat injuries.
This article proposes that vital signs along with strict monitoring of mental status through (1) orientation; (2) simple task completion; (3) thought processes; and (4) cognitive ability over time combine to be a powerful deterrent to heat injury in an austere and dangerous working environment. It would be cavalier to propose that all heat injuries in any environment could be avoided by following these guidelines, and more tools to avoid heat injury will be developed. But medical providers trained not only to use vital signs, but also monitor and respond to mental status changes in the patient can mitigate heat injuries more effectively. Finally, careful attention should be placed on correcting hypo- and hypernatremia when rehydrating individuals in this challenging environment.
Acknowledgements
The authors wish to thank the following for their contribution to this manuscript: Sarah M. Paulsen, REB Smith, and the entire CERF-P leadership of the Utah National Guard.
1. U.S. Centers for Disease Control and Prevention. Heat-related deaths--four states, July-August 2001, and United States, 1979-1999. MMWR Morb Mortal Wkly Rep. 2002;51(26):567-570.
2. Centers for Disease Control and Prevention. Heat illness among high school athletes--United States, 2005-2009. MMWR Morb Mortal Wkly Rep. 2010;59(32):1009-1013.
3. Armstrong LE, Johnson EC, Casa DJ, Ganio, et al. The American football uniform: uncompensable heat stress and hyperthermic exhaustion. J Athl Train. 2010;45(2):117-127.
4. Caldwell JN, Engelen L, van der Henst C, Patterson MJ, Taylor AS. The interaction of body armor, low-intensity exercise and hot-humid conditions on physiological strain and cognitive function. Mil Med. 2011;176(5):488-493.
5. Morley J, Beauchamp G, Suyama J, et al. Cognitive function following treadmill exercise in thermal protective clothing. Eur J Appl Physiol. 2012;112(5):1733-1740.
6. Becker JA, Stewart LK. Heat-related illness. Am Fam Physician. 2011;83(11):1325-1330.
7. Centers for Disease Control and Prevention, National Health Statistics Reports. Deaths attributed to heat, cold, and other weather events in the United States, 2006-2010. Centers for Disease Control and Prevention Website. http://www.cdc.gov/nchs/data/nhsr/nhsr076.pdf. Accessed January 18, 2016.
8. Wexler RK. Evaluation and treatment of heat-related illnesses. Am Fam Physician. 2002;65(11):2307-2314.
9. Dematte JE, O'Mara K, Buescher J, et al. Near-fatal heat stroke during the 1995 heat wave in Chicago. Ann Intern Med. 1998;129(3):173-181.
10. Kaarisalo MM, Immonen-Räihä P, Marttila RJ, et al. Atrial fibrillation and stroke. Mortality and causes of death after the first acute ischemic stroke. Stroke. 1997;28(2):311-315.
11. Casa DJ, McDermott BP, Lee EC, Yeargin SW, Armstrong LE, Maresh CM. Cold water immersion: the gold standard for exertional heatstroke treatment. Exerc Sport Sci Rev. 2007;35(3):141-149.
12. Marshall SW. Heat injury in youth sport. Br J Sports Med. 2010;44(1):8-12.
13. Glazer JL. Management of heatstroke and heat exhaustion. Am Fam Physician. 2005;71(11):2133-2140.
14. Pérez E, Silverman M. Delirium: the often overlooked diagnosis. Int Psychiatric Med. 1984;14(3):181-188.
15. Gleason O. Delirium. Am Fam Physician. 2003;67(5):1027-1034.
16. Centers for Disease Control and Prevention. Heat-related deaths--Los Angeles County, California, 1999-2000, and United States, 1979-1998. MMWR Morb Mortal Wkly Rep. 2001;50(29):623-626.
17. Update: heat injuries, active component, U.S. Armed Forces, 2012. MSMR. 2013;20(3):17-20.
18. Braun MM, Barstow CH, Pyzocha NJ. Diagnosis and management of sodium disorders: hyponatremia and hypernatremia. Am Fam Physician. 2015;91(5):299-307.
19. Spasovski G, Vanholder R, Allolio B, et al; Hyponatraemia Guideline Development Group. Clinical practice guideline on diagnosis and treatment of hyponatremia. Eur Soc Endocrinol. 2014;170:G1-G47.
20. Verbalis JG, Goldsmith SR, Greenberg A, et al. Diagnosis, evaluation, and treatment of hyponatremia: expert panel recommendations. Am J Med. 2013;126(10)(suppl 1):S1-S42.
21. Sterns RH, Nigwekar SU, Hix JK. The treatment of hyponatremia. Semin Nephrol. 2009;29(3):282-299.
22. Sood L, Sterns RH, Hix JK, Silver SM, Chen L. Hypertonic saline and desmopressin: a simple strategy for safe correction of severe hyponatremia. Am J Kidney Dis. 2013;61(4):571-578.
23. Update: heat injuries, active component, U.S. Armed Forces, 2012. MSMR. 2013;20(3):20-28.
24. Elsaesser TF, Pang PS, Malik S, Chiampas GT. Large-volume hypertonic saline therapy in endurance athlete with exercise -associated hyponatremic encephalopathy. J Emerg Med. 2013;44(6):1132-1135.
Hyponatremia Secondary to Lisinopril in a Veteran Patient
Angiotensin-converting enzyme (ACE) inhibitors are commonly used medications in the treatment of hypertension in the ambulatory care setting. Serum sodium concentrations are not usually affected in the majority of patients treated with ACE inhibitors. Nonetheless, hyponatremia, defined as serum sodium level < 135 mEq/L, has been reported in patients taking ACE inhibitors.1,2 The authors report a case of hyponatremia attributed to the use of lisinopril.
Case Presentation
In 2012, a 49-year-old man with a past medical history significant for polysubstance abuse, alcohol use, and hypertension was referred to the pharmacy clinic by his primary care physician (PCP) for management of hypertension. At the PCP visit, the patient’s blood pressure (BP) was above the goal of < 140/90 mm Hg and hydrochlorothiazide (HCTZ) 12.5 mg by mouth daily monotherapy was initiated. At the follow-up pharmacy appointment 6 weeks later, his BP remained uncontrolled, and HCTZ was increased to 25 mg daily. Of note, at that time the patient reported drinking about 6 beers per week. His electrolytes—serum sodium, potassium, chloride, carbon dioxide (CO2), blood urea nitrogen (BUN), and serum creatinine (SCr)—were all within normal limits and stable to previous baseline results after taking HCTZ for about 2 weeks.
The patient returned to the pharmacy clinic at week 11, and his BP was controlled (136/83 mm Hg) on HCTZ 25 mg daily. His electrolytes, BUN, and SCr continued to be stable. The patient requested another appointment 8 weeks later to continue to monitor his BP.
The patient did not return to the pharmacy clinic until week 31, when he reported that he was told his BP was very high when attempting to donate plasma. The patient reported drinking a “6 pack of beer per day” at that visit. Two BP readings were taken in the clinic. The first of systolic blood pressure (SBP) was 144 mm Hg and the second was below the patient’s goal (< 140 mm Hg). His pulse (94 bpm) was also noted to be higher than baseline range (66-84 bpm). Atenolol 25 mg daily by mouth was added to the patient’s regimen of HCTZ 25 mg daily.
The patient returned at week 38, and his BP of 149/101 mm Hg was elevated above goal range. Lisinopril was added to HCTZ 25 mg in a combination formulation of lisinopril/HCTZ 20 mg/25 mg by mouth daily. The patient reported drinking 4 beers on days he worked (5 days per week) and 6 beers on days he was off (2 days per week). A repeated electrolyte, BUN, and SCr panel 1 month later (week 42) revealed a drop in the patient’s sodium level from 136 mEq/L (baseline) to 130 mEq/L (Table 1). Other measured electrolytes remained within normal limits with the exception of a slight decrease in serum chloride to 93 mEq/L (Table 2). No symptoms of hyponatremia were noted.

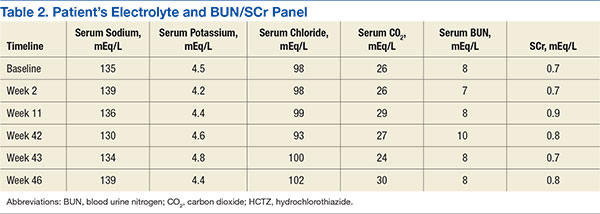
The patient was instructed to cut the lisinopril/HCTZ tablet in half and take it daily, then repeat blood work in 5 days. The patient’s repeated laboratory work noted an increase in sodium level to 134 mEq/L. All other measured electrolytes, including serum chloride, were within normal limits. During his follow-up visit, the patient reported stopping lisinopril/HCTZ altogether and resuming HCTZ 25 mg daily for the 5 days prior, in lieu of taking the reduced lisinopril/HCTZ dose as instructed. The patient continued to report drinking 6 beers daily.
Medication was changed to HCTZ 25 mg daily, with lisinopril discontinued, and atenolol increased to 50 mg daily. At week 46, the patient repeated electrolytes, BUN, and SCr laboratory work while on HCTZ 25 mg and atenolol 50 mg daily, and the serum sodium level increased to 139 mEq/L. After the laboratory work at week 49, he noted a reduction in alcohol to 4 beers daily at the pharmacy appointment. The patient’s BP was controlled to below the < 140/90 mm Hg goal. Medications were not changed. He was instructed to follow up with his PCP and return to the pharmacy clinic as needed for BP control.
Of note, serum magnesium levels are not included in the standard electrolyte panel and must be ordered separately. Additionally, serum magnesium levels are not monitored routinely with thiazide and ACE inhibitor therapy. In this case, serum magnesium levels were not drawn at baseline or in subsequent laboratory monitoring.
Discussion
This case demonstrates a potential link between administration of lisinopril and the development of hyponatremia. Adverse effects (AEs) of ACE inhibitors frequently include elevation in SCr, hyperkalemia, and/or a dry cough. Hyponatremia, although not commonly associated with ACE inhibitors, has been reported in the literature.1,2
Although the mechanism is not completely understood, previous case reports hypothesized that ACE inhibitor therapy can lead to Syndrome of Inappropriate Antidiuretic Hormone (SIADH).1,3 Angiotensin I is not converted to angiotensin II peripherally with ACE inhibitor therapy. This elevated circulating level of angiotensin I is available to cross the blood-brain barrier where it is converted to angiotensin II. Angiotensin can then stimulate vasopressin release, which, in turn, increases thirst and leads to decreased amounts of concentrated urine.4 The combination of increased thirst and concentrated urine can lead to hyponatremia.
The clinical manifestations of hyponatremia can vary. In patients with ACE inhibitor-induced hyponatremia, an early sign may be polydipsia. Once hyponatremia develops, patients may experience nausea, muscle spasms or weakness, and general malaise. Additionally, lethargy, a decreased level of consciousness, and headaches may occur. In the most severe cases, hyponatremia may lead to seizures, coma, and eventually death.
Several case reports involving various ACE inhibitors, such as captopril, enalapril, and lisinopril, have been reported over the past 30 years, citing the connection linking these medications to SIADH and symptomatic hyponatremia. A large number of cases involved patients with established congestive heart failure for whom ACE inhibitors were added because of their beneficial impact on improved survival and reduced left ventricular dysfunction.5 Angiotensin converting enzyme inhibitor-induced hyponatremia may be confounded by heart failure, due to the complex disease pathophysiology.1 Therefore, case reports of ACE inhibitors use in patients treated for indications other than heart failure, such as hypertension, provide a clearer picture of ACE inhibitor-induced hyponatremia.
One such striking case report involved a 63-year-old woman taking lisinopril 10 mg daily as monotherapy (no other medications) for mild hypertension with a baseline serum sodium level within normal limits.6 One month later, the patient was admitted a with serum sodium level of 101 mEq/L and symptomatic with altered mental status and generalized tonic-clonic seizures. Once the serum sodium was corrected, the patient’s mental status improved, and her 1-year follow-up examination was unremarkable. This case report is significant for its findings that there may be a cause-and-effect relationship between lisinopril monotherapy and symptomatic hyponatremia that occurred within a month. There are cases of hyponatremia in patients receiving ACE inhibitor therapy in addition to established diuretic therapy. For example, a woman aged 71 years was admitted for elevated BP with an initial medication regimen that included HCTZ and other antihypertensive medications.7 She was given captopril at increasing doses up to 150 mg daily. The patient’s serum sodium levels dropped correspondingly with titrated doses of captopril. The patient reported feeling confusion, and her serum sodium levels dropped to 114 mEq/L. Once captopril was discontinued and serum sodium corrected with IV fluids, the patient’s confusion subsided. The patient was discharged on a medication regimen that continued HCTZ but not the ACE inhibitor, with no clinical consequences and normal serum sodium levels over the following year. Similarly, the patient in this case study had established HCTZ therapy with normal serum sodium that declined upon addition of an ACE inhibitor.
Other factors that could contribute to hyponatremia, such as beer potomania, confound the current case of hyponatremia. This patient reported chronic beer ingestion, which can lead to hyponatremia and may have aggravated the hyponatremia upon initiation of lisinopril. Additionally, the patient was taking HCTZ, an agent known to cause hyponatremia, prior to initiation of the ACE inhibitor. Another limiting factor noted was that serum magnesium levels were not measured to assess for potential hypomagnesemia, which may affect other electrolytes.
Using the Naranjo Assessment scale, a score of 3 was calculated, indicating a possible link to lisinopril as the cause of hyponatremia.8 Although the patient had the aforementioned risk factors, the notable drop of serum sodium level correlated with the lisinopril administration, which was previously stable despite HCTZ treatment and alcohol consumption. The time line of events led the authors to believe that hyponatremia was strongly related to lisinopril. This patient was fortunate that he experienced no neurologic complications, which have been reported in other cases of ACE inhibitor-induced hyponatremia, manifested from the drop in serum sodium.
Conclusion
Though rarely occurring, hyponatremia should be considered a potentially serious AE associated with ACE inhibitor therapy. Timely monitoring of electrolytes, BUN, and SCr should continue to assess for more common AEs of elevated SCr and hyperkalemia, but clinicians should be aware of the potential for ACE inhibitor-induced hyponatremia.
1. Izzedine H, Fardet L, Launay-Vacher V, Dorent R, Petitclerc T, Deray G. Angiotensin-converting enzyme inhibitor-induced syndrome of inappropriate secretion of antidiuretic hormone: case report and review of literature. Clin Pharmacol Ther. 2002;71(6):503-507.
2. Chakithandy S, Evans R, Vyakarnam P. Acute severe hyponatremia and seizures associated with postoperative enalapril administration. Anaesth Intensive Care. 2009;37(4):673-674.
3. Castrillón JL, Mediavilla A, Méndez MA, Cavada E, Carrascosa M, Valle R. Syndrome of inappropriate antidiuretic hormone secretion (SIADH) and enalapril. J Intern Med. 1993;233(1):89-91.
4. Gonzalez-Martinez H, Gaspard JJ, Espino DV. Hyponatremia due to enalapril in an elderly patient. A case report. Arch Fam Med. 1993;2(7):791-793.
5. Effects of enalapril on mortality in severe congestive heart failure. Results of the Cooperative North Scandinavian Enalapril Survival Study(CONSENSUS). The CONSENSUS Trial Study group. N Engl J Med. 1987;316(23):1429-1435.
6. Subramanian D, Ayus JC. Case report: severe symptomatic hyponatremia associated with lisinopril therapy. Am J Med Sci. 1992;303(3):177-179.
7. Huang HS, Reynertson RH, Boshell BR. Severe hyponatremia associated with captopril therapy. Ala J Med Sci. 1984;21(2):142-144.
8. National Library of Medicine. Adverse drug reaction probability scale (Naranjo) in drug induced liver injury. National Library of Medicine Website. http://livertox.nih.gov/Narajo.html. Updated September 30, 2015. Accessed January 12, 2016.
Angiotensin-converting enzyme (ACE) inhibitors are commonly used medications in the treatment of hypertension in the ambulatory care setting. Serum sodium concentrations are not usually affected in the majority of patients treated with ACE inhibitors. Nonetheless, hyponatremia, defined as serum sodium level < 135 mEq/L, has been reported in patients taking ACE inhibitors.1,2 The authors report a case of hyponatremia attributed to the use of lisinopril.
Case Presentation
In 2012, a 49-year-old man with a past medical history significant for polysubstance abuse, alcohol use, and hypertension was referred to the pharmacy clinic by his primary care physician (PCP) for management of hypertension. At the PCP visit, the patient’s blood pressure (BP) was above the goal of < 140/90 mm Hg and hydrochlorothiazide (HCTZ) 12.5 mg by mouth daily monotherapy was initiated. At the follow-up pharmacy appointment 6 weeks later, his BP remained uncontrolled, and HCTZ was increased to 25 mg daily. Of note, at that time the patient reported drinking about 6 beers per week. His electrolytes—serum sodium, potassium, chloride, carbon dioxide (CO2), blood urea nitrogen (BUN), and serum creatinine (SCr)—were all within normal limits and stable to previous baseline results after taking HCTZ for about 2 weeks.
The patient returned to the pharmacy clinic at week 11, and his BP was controlled (136/83 mm Hg) on HCTZ 25 mg daily. His electrolytes, BUN, and SCr continued to be stable. The patient requested another appointment 8 weeks later to continue to monitor his BP.
The patient did not return to the pharmacy clinic until week 31, when he reported that he was told his BP was very high when attempting to donate plasma. The patient reported drinking a “6 pack of beer per day” at that visit. Two BP readings were taken in the clinic. The first of systolic blood pressure (SBP) was 144 mm Hg and the second was below the patient’s goal (< 140 mm Hg). His pulse (94 bpm) was also noted to be higher than baseline range (66-84 bpm). Atenolol 25 mg daily by mouth was added to the patient’s regimen of HCTZ 25 mg daily.
The patient returned at week 38, and his BP of 149/101 mm Hg was elevated above goal range. Lisinopril was added to HCTZ 25 mg in a combination formulation of lisinopril/HCTZ 20 mg/25 mg by mouth daily. The patient reported drinking 4 beers on days he worked (5 days per week) and 6 beers on days he was off (2 days per week). A repeated electrolyte, BUN, and SCr panel 1 month later (week 42) revealed a drop in the patient’s sodium level from 136 mEq/L (baseline) to 130 mEq/L (Table 1). Other measured electrolytes remained within normal limits with the exception of a slight decrease in serum chloride to 93 mEq/L (Table 2). No symptoms of hyponatremia were noted.
The patient was instructed to cut the lisinopril/HCTZ tablet in half and take it daily, then repeat blood work in 5 days. The patient’s repeated laboratory work noted an increase in sodium level to 134 mEq/L. All other measured electrolytes, including serum chloride, were within normal limits. During his follow-up visit, the patient reported stopping lisinopril/HCTZ altogether and resuming HCTZ 25 mg daily for the 5 days prior, in lieu of taking the reduced lisinopril/HCTZ dose as instructed. The patient continued to report drinking 6 beers daily.
Medication was changed to HCTZ 25 mg daily, with lisinopril discontinued, and atenolol increased to 50 mg daily. At week 46, the patient repeated electrolytes, BUN, and SCr laboratory work while on HCTZ 25 mg and atenolol 50 mg daily, and the serum sodium level increased to 139 mEq/L. After the laboratory work at week 49, he noted a reduction in alcohol to 4 beers daily at the pharmacy appointment. The patient’s BP was controlled to below the < 140/90 mm Hg goal. Medications were not changed. He was instructed to follow up with his PCP and return to the pharmacy clinic as needed for BP control.
Of note, serum magnesium levels are not included in the standard electrolyte panel and must be ordered separately. Additionally, serum magnesium levels are not monitored routinely with thiazide and ACE inhibitor therapy. In this case, serum magnesium levels were not drawn at baseline or in subsequent laboratory monitoring.
Discussion
This case demonstrates a potential link between administration of lisinopril and the development of hyponatremia. Adverse effects (AEs) of ACE inhibitors frequently include elevation in SCr, hyperkalemia, and/or a dry cough. Hyponatremia, although not commonly associated with ACE inhibitors, has been reported in the literature.1,2
Although the mechanism is not completely understood, previous case reports hypothesized that ACE inhibitor therapy can lead to Syndrome of Inappropriate Antidiuretic Hormone (SIADH).1,3 Angiotensin I is not converted to angiotensin II peripherally with ACE inhibitor therapy. This elevated circulating level of angiotensin I is available to cross the blood-brain barrier where it is converted to angiotensin II. Angiotensin can then stimulate vasopressin release, which, in turn, increases thirst and leads to decreased amounts of concentrated urine.4 The combination of increased thirst and concentrated urine can lead to hyponatremia.
The clinical manifestations of hyponatremia can vary. In patients with ACE inhibitor-induced hyponatremia, an early sign may be polydipsia. Once hyponatremia develops, patients may experience nausea, muscle spasms or weakness, and general malaise. Additionally, lethargy, a decreased level of consciousness, and headaches may occur. In the most severe cases, hyponatremia may lead to seizures, coma, and eventually death.
Several case reports involving various ACE inhibitors, such as captopril, enalapril, and lisinopril, have been reported over the past 30 years, citing the connection linking these medications to SIADH and symptomatic hyponatremia. A large number of cases involved patients with established congestive heart failure for whom ACE inhibitors were added because of their beneficial impact on improved survival and reduced left ventricular dysfunction.5 Angiotensin converting enzyme inhibitor-induced hyponatremia may be confounded by heart failure, due to the complex disease pathophysiology.1 Therefore, case reports of ACE inhibitors use in patients treated for indications other than heart failure, such as hypertension, provide a clearer picture of ACE inhibitor-induced hyponatremia.
One such striking case report involved a 63-year-old woman taking lisinopril 10 mg daily as monotherapy (no other medications) for mild hypertension with a baseline serum sodium level within normal limits.6 One month later, the patient was admitted a with serum sodium level of 101 mEq/L and symptomatic with altered mental status and generalized tonic-clonic seizures. Once the serum sodium was corrected, the patient’s mental status improved, and her 1-year follow-up examination was unremarkable. This case report is significant for its findings that there may be a cause-and-effect relationship between lisinopril monotherapy and symptomatic hyponatremia that occurred within a month. There are cases of hyponatremia in patients receiving ACE inhibitor therapy in addition to established diuretic therapy. For example, a woman aged 71 years was admitted for elevated BP with an initial medication regimen that included HCTZ and other antihypertensive medications.7 She was given captopril at increasing doses up to 150 mg daily. The patient’s serum sodium levels dropped correspondingly with titrated doses of captopril. The patient reported feeling confusion, and her serum sodium levels dropped to 114 mEq/L. Once captopril was discontinued and serum sodium corrected with IV fluids, the patient’s confusion subsided. The patient was discharged on a medication regimen that continued HCTZ but not the ACE inhibitor, with no clinical consequences and normal serum sodium levels over the following year. Similarly, the patient in this case study had established HCTZ therapy with normal serum sodium that declined upon addition of an ACE inhibitor.
Other factors that could contribute to hyponatremia, such as beer potomania, confound the current case of hyponatremia. This patient reported chronic beer ingestion, which can lead to hyponatremia and may have aggravated the hyponatremia upon initiation of lisinopril. Additionally, the patient was taking HCTZ, an agent known to cause hyponatremia, prior to initiation of the ACE inhibitor. Another limiting factor noted was that serum magnesium levels were not measured to assess for potential hypomagnesemia, which may affect other electrolytes.
Using the Naranjo Assessment scale, a score of 3 was calculated, indicating a possible link to lisinopril as the cause of hyponatremia.8 Although the patient had the aforementioned risk factors, the notable drop of serum sodium level correlated with the lisinopril administration, which was previously stable despite HCTZ treatment and alcohol consumption. The time line of events led the authors to believe that hyponatremia was strongly related to lisinopril. This patient was fortunate that he experienced no neurologic complications, which have been reported in other cases of ACE inhibitor-induced hyponatremia, manifested from the drop in serum sodium.
Conclusion
Though rarely occurring, hyponatremia should be considered a potentially serious AE associated with ACE inhibitor therapy. Timely monitoring of electrolytes, BUN, and SCr should continue to assess for more common AEs of elevated SCr and hyperkalemia, but clinicians should be aware of the potential for ACE inhibitor-induced hyponatremia.
1. Izzedine H, Fardet L, Launay-Vacher V, Dorent R, Petitclerc T, Deray G. Angiotensin-converting enzyme inhibitor-induced syndrome of inappropriate secretion of antidiuretic hormone: case report and review of literature. Clin Pharmacol Ther. 2002;71(6):503-507.
2. Chakithandy S, Evans R, Vyakarnam P. Acute severe hyponatremia and seizures associated with postoperative enalapril administration. Anaesth Intensive Care. 2009;37(4):673-674.
3. Castrillón JL, Mediavilla A, Méndez MA, Cavada E, Carrascosa M, Valle R. Syndrome of inappropriate antidiuretic hormone secretion (SIADH) and enalapril. J Intern Med. 1993;233(1):89-91.
4. Gonzalez-Martinez H, Gaspard JJ, Espino DV. Hyponatremia due to enalapril in an elderly patient. A case report. Arch Fam Med. 1993;2(7):791-793.
5. Effects of enalapril on mortality in severe congestive heart failure. Results of the Cooperative North Scandinavian Enalapril Survival Study(CONSENSUS). The CONSENSUS Trial Study group. N Engl J Med. 1987;316(23):1429-1435.
6. Subramanian D, Ayus JC. Case report: severe symptomatic hyponatremia associated with lisinopril therapy. Am J Med Sci. 1992;303(3):177-179.
7. Huang HS, Reynertson RH, Boshell BR. Severe hyponatremia associated with captopril therapy. Ala J Med Sci. 1984;21(2):142-144.
8. National Library of Medicine. Adverse drug reaction probability scale (Naranjo) in drug induced liver injury. National Library of Medicine Website. http://livertox.nih.gov/Narajo.html. Updated September 30, 2015. Accessed January 12, 2016.
Asymptomatic but Time for a Hip Revision
Total hip arthroplasty (THA) is considered to be one of the most successful orthopedic interventions of its generation.1 In 2010, 332,000 THAs were performed in the U.S.2 Although used to correct advanced joint diseases in the elderly, the THA procedure has become increasingly common in a younger population for posttraumatic fractures and conditions that lead to early onset secondary arthritis such as avascular necrosis, juvenile rheumatoid arthritis, hip dysplasia, Perthes disease, and femoro-acetabular impingement.
Current hip replacements are expected to function at least 10 to 20 years in 90% of patients.3 As increasing numbers of young patients have these procedures and as seniors continue to live longer, patients will outlast their implants. Younger and more active patients have a higher rate of revision, because the longevity of the prosthesis is usually a function of usage.3 The number of revision THAs is projected to increase 137% by 2030.4
Hip resurfacing has been developed as a bone preserving surgical alternative to THA. The first system for use in the U.S. received FDA approval in 2006, but concerns about the metal on metal bearing surfaces, high failure and revision rates, and early catastrophic modes of failure compared with THAs has resulted in the recall of many of these devices. Hip resurfacing may offer some advantages compared with those of a THA in a carefully selected population, but its use will not be further discussed in this case study.5 Periprosthetic osteolysis and aseptic loosening are 2 of the long-term consequences of THA.6 Bone loss is felt to be secondary to a biologic reaction to particulate debris from implants.6 Some patients, especially those with loosening, complete wear, or fracture, will be symptomatic with pain. However, wear and osteolysis is a silent disease unless there is mechanical failure. Other patients may not experience discomfort. Radiographic studies may reveal significant changes, which warrant the recommendation for a hip revision.
Hip revision surgery has 3 major purposes: relieving pain in the affected joint, restoring the patient’s mobility, and removing a loose or damaged prosthesis before irreversible harm is done to the joint. It’s anticipated that most primary care providers (PCPs) will encounter patients who seek advice on the need for a revision hip arthroplasty.
This case will present an asymptomatic patient who underwent a THA in 1997 at age 37, to address developmental dysplasia of the hip (DDH) and was advised to undergo a revision hip arthroplasty due to abnormal radiographic findings at age 55 years. A discussion will follow that includes a brief review of the history of THA, the materials and bearings commonly used, the presenting symptoms or radiographic changes that signal the need for a revision, and the current options available for a patient such as this.
Case Report
A man aged 55 years presented to a new orthopedic surgeon for his first orthopedic appointment in 10 years. The patient had a left metal-on-polyethylene (M-on-PE) THA 18 years prior due to early onset secondary degenerative joint disease from DDH. The patient’s M-on-PE THA was a titanium acetabular socket and femoral stem with a cobalt-chromium alloy femoral head and a polyethylene liner. The patient remained physically active with an exercise routine consisting of walking, swimming, and weight training.
The patient’s orthopedic history was notable for a right knee arthroscopy for intervention due to a torn medial and lateral meniscus, and birth history was noteworthy for a breech presentation. The physical exam was unremarkable except for a slight leg length discrepancy, but the patient did not exhibit a Trendelenburg gait.
Plain X-rays and a computed tomography (CT) scan showed eccentric PE wear and superior migration of the femoral head, which was indicative of significant PE liner wear. No significant osteolysis or periprosthetic loosening was observed on the X-rays or CT scan. He was advised that a hip revision procedure would need to be done, optimally, within the next 6 months to a year.
Discussion
Hip dysplasia represents a broad group of disorders and generally means abnormal development of the hip joint. The term is most commonly used to refer to DDH with inadequate coverage of the femoral head. In one study, 25% of hip replacements performed in patients aged ≤ 40 years were due to underlying hip dysplasia.7
Developmental dysplasia of the hip occurs more often in children who present in the breech position.8 One theory argues that packaging issues in utero may account for the increased incidence of DDH.9 The earliest recorded attempts at hip replacement occurred in Germany, in 1891, when ivory was used to replace the femoral heads of patients whose hip joints had been destroyed by tuberculosis.1
The orthopedic surgeon Sir John Charnley, who worked at the Manchester Royal Infirmary, is considered the father of the modern THA.1 His low friction arthroplasty, designed in the early 1960s is identical, in principle, to the M-on-PE prosthesis used today.1 The PE liner used was ultrahigh molecular weight polyethylene (UHMWPE).1
Due to the early success of the Charnley prosthesis, the M-on-PE prosthesis became the most widely used. Although PE is the most studied and understood of all acetabular liner materials, it will eventually wear and shed debris. Acetabular cup wear is the most frequent reason for mid-to-long-term revisions, especially in young and active patients.10 More active patients shed more debris.3 The PE debris instigates the release of inflammatory mediators, which results in chronic inflammation and tissue damage that erodes the supporting bone and can lead to implant loosening or fracture.6 Ongoing studies seek to optimize and improve properties of the UHMWPE and to develop alternative bearings. After FDA approval in 1999, highly cross-linked polyethylene liners (HXLPE) rapidly became the standard of care for THAs, at least in the U.S.11 Highly cross-linked polyethylene liners are created from UHMWPE through a process of cross-linking by exposure to gamma radiation, and subsequent heat treatment to neutralize free radicals and limit oxidative degradation.12
In one study, the 5-year annual linear wear rate for a HXLPE liner was only 45% of that seen with the UHMWPE liner, although the qualitative wear pattern was the same.13 In a study that followed patients for 7 years postoperatively, the mean steady-state wear rate of the HXLPE was 0.005 mm/y compared with 0.037 mm/y for UHMWPE.14 In a long-term study (a minimum follow-up of 10 years) of 50 patients who were aged < 50 years and underwent THA using HXLPE liners, there was no radiographic evidence of osteolysis or component loosening, and liner wear was 0.020 ± 0.0047 mm/y.12 In 2005, second-generation HXLPE liners were introduced clinically and have been shown to further reduce wear in vitro compared with both UHMWPE and first-generation HXLPE liners. Callary and colleagues calculated that the wear rates between 1 year and 5 years were all < 0.001 mm/y.15
The use of ceramic for THAs began in 1970, and ceramic heads on polyethylene (C-on-PE) liners and ceramic-on-ceramic (C-on-C) bearings have been in continual use for > 30 years in Europe. Premarket FDA approval based on European data was granted in 1983; however, the manufacturer voluntarily removed it from the market because of a high incidence of stem loosening (> 30% within 3 years in some series).16 FDA approvals came much later for C-on-PE (1989) and C-on-C (2003) bearings.
Ceramic is the hardest implant material used, and it can be concluded from many clinical and laboratory reports that C-on-PE and C-on-C combinations confer a potentially significant reduction in wear on THA bearings.16 Ceramic hips initially had 2 concerns: catastrophic shattering and squeaking. Current ceramic hips have been substantially improved, and some experts feel shattering has been essentially eliminated.16 Other experts note that ceramic brittleness remains a major concern.17 Squeaking remains a problem for some, but it usually abates over time. No study has correlated squeaking with impending failure or increased pain or disability.
While C-on-C bearings are now felt to be a good implant for young active patients, these bearings have generally not resulted in significantly lower wear rates and fewer revisions.18 High rates of wear and osteolysis have been sporadically documented over the 35-year history of ceramic implants.16 The FDA approved the first ceramic-on-metal total hip replacement system on June 13, 2011.
Metal-on-metal (M-on-M) implants have been used by some for decades, although they were not approved by the FDA until the late 1990s. However, some device recalls have brought negative attention to M-on-M implants.19 It was felt that they would generate less wear debris than PE, but reports of pseudotumors (from inflammatory mediators) and metallosis have significantly tempered enthusiasm for these products.20,21 The wear rates are very low, estimated to be only 0.01 mm/y, but concerns about the carcinogenetic potential of systemically increased metal ions remains a possible and much debated concern.19,22,23 In January 2013, FDA issued a safety communication on M-on-M implants.
Many experts feel that modern ceramic or metal on second-generation HXLPE represents the gold standard and the most predictable bearing choice for young, active patients.18 Others feel that the optimal choice of bearing surfaces in THA, particularly in the younger and more active patient, remains controversial.24
Follow-Up
Intermittent orthopedic monitoring is recommended for all patients who have undergone a THA. The frequency of hip X-rays on follow-up appointments is left to the orthopedic surgeon. After the initial recovery, serial images every 2 to 5 years can identify progressive failure, and annual X-rays may be used for closer follow-up in high-risk patients.
Patients who experience dislocations, fractures, infections, or pain usually maintain close orthopedic follow-up. Significant wear of the prosthesis damages the socket; osteolysis can cause irreversible bone loss, fracture, and loosening. Massive acetabular bone loss is very difficult to reverse and creates major reconstruction challenges.
Figure 1A is a 2009 X-ray of a woman aged 44 years who underwent a THA after a motor vehicle accident in 1997 and who was advised to have a revision THA when seen in 2009.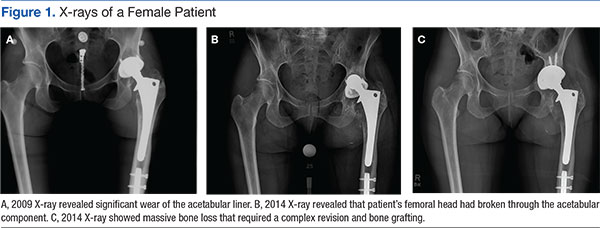
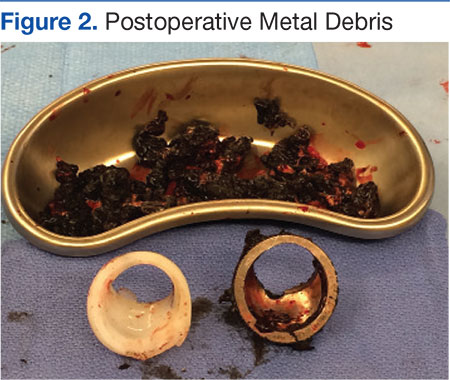
Figure 3A is an X-ray of a man aged 71 years who had undergone THA 21 years earlier and had complied with routine follow-up. When his X-rays showed significant wear of the liner and some osteolysis, he was able to undergo a simple revision (Figure 3B).
Three-dimensional CT is useful for quantifying the presence and severity of osteolytic lesions, because plain radiographs may underestimate the amount of bone loss that is present.25 The CT in Figure 3C shows the magnitude of osteolysis that was underestimated by the preoperative plain X-rays (Figure 3A). Computed tomography scans are crucial for surgical planning in the setting of severe acetabular bone loss.
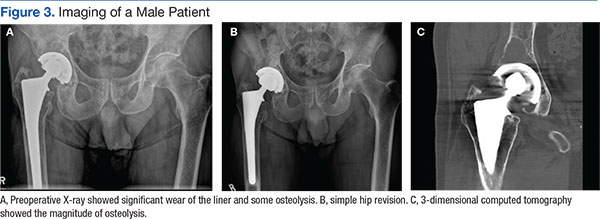
There is a wide spectrum of signs and symptoms that can occur in the setting of acetabular component failure. Pain is a common presenting symptom. Groin pain can represent acetabular failure; thigh pain may be correlated to femoral component failure.25 The clinical patient presentation ultimately depends on the underlying cause: an infection, polyethylene wear, instability, or aseptic loosening.25 Leg-length discrepancy, joint deformity, location of prior incisions, functional status, and baseline neurologic status should be evaluated and documented during the preoperative evaluation as well.25
Case Study Revision Options
The X-rays and CT scans for this case study patient showed that he was a possible candidate for the simplest revision surgery; an isolated liner exchange and replacement of the femoral head. When the original surgery was performed (1997), the only FDA approved PE liner was UHMWPE. To justify isolated liner exchange, the modular acetabular metallic shell also should be well-fixed and appropriately oriented.26 This is evaluated both preoperatively and intraoperatively.
If found to be well fixed with an appropriate orientation and locking mechanism, the UHMWPE liner could be replaced with a HXLPE liner and a larger metal femoral head for improved wear and stability. Acetabular revision is indicted for an asymptomatic patient who has progressive osteolysis, severe wear, or bone loss that would compromise future reconstruction.
Conclusions
Over the past several decades, THA has become recognized as an effective treatment option for the reduction of pain and disability associated with hip joint disease and is associated with successful clinical outcomes. The most frequently noted recommendations for trying to increase the life expectancy of an artificial hip replacement include maintaining a normal weight, keeping leg muscles strong, and avoiding repetitive squatting and kneeling.
As the number of primary THAs has increased and the average age of those undergoing a primary THA has decreased, the need for revisions has risen. Reviews have demonstrated that the most common causes for early total hip revision, regardless of component, included infection, instability/dislocation, and fracture, whereas wear is the most common reason for mid to late revisions.
The wear of all materials used has been shown to be greatest in the most active patients.
Studies continue to identify ways to potentially prevent or reverse osteolysis from wear debris. Alendronate therapy has been shown to prevent and treat PE debris-induced periprosthetic bone loss in rats.27 It also was successfully used in a case report of an asymptomatic woman aged 39 years who had rapid PE wear and aggressive periprosthetic osteolysis within just 2 years of a bilateral THA.28 Other areas of research on decreasing osteolysis in THA recipients include trials with mesenchymal stem cells, bone morphogenic proteins, and gene therapy.6
In the U.S., 46,000 revisions were performed in 2004 and this number is expected to more than double by 2030.4 Primary care providers are sure to encounter patients who will be in need of a hip revision procedure. It’s important for them to make sure that their patients who have undergone a THA are periodically seen for orthopedic follow-up. Despite the long history of primary THAs, there is still not a single technique and material to suit all patient characteristics.1 Unfortunately, the same currently applies to hip revision procedures.
1. Knight SR, Aujla R, Biswas SP. Total hip arthroplasty--over 100 years of operative history. Orthop Rev (Pavia). 2011;3(2):e16.
2. Centers for Disease Control and Prevention. FastStats: inpatient surgery. Centers for Disease Control and Prevention Website. http://www.cdc.gov/nchs/fastats/inpatient-surgery.htm. Updated April 29, 2015. Accessed January 18, 2016.
3. Joint Revision Surgery-When do I need it? American Academy of Orthopedic Surgeons Website. http://www.tlhoc.com/uploads/documents/when_do_I_need_it.pdf. Accessed January 18, 2016.
4. Kurtz S, Ong K, Lau E, Mowat F, Halpern M. Projections of primary and revision hip and knee arthroplasty in the United States from 2005 to 2030. J Bone Joint Surg Am. 2007;89(4):780-785.
5. Nunley RM, Della Valle CJ, Barrack RL. Is patient selection important for hip resurfacing? Clin Orthop Relat Res. 2009;467(1):56-65.
6. Dattani R. Femoral osteolysis following total hip replacement. Postgrad Med J. 2007;83(979):312-316.
7. Engesæter IØ, Lehmann T, Laborie LB, Lie SA, Rosendahl K, Engesæter LB. Total hip replacement in young adults with hip dysplasia: age at diagnosis, previous treatment, quality of life, and validation of diagnoses reported to the Norwegian Arthroplasty Register between 1987 and 2007. Acta Orthop. 2011;82(2):149-154.
8. Salter RB. Etiology, pathogenesis and possible prevention of congenital dislocation of the hip. Can Med Assoc J. 1968;98(20):933-945.
9. Storer SK, Skaggs DL. Developmental dysplasia of the hip. Am Fam Physician. 2006;74(8):1310-1316.
10. Pace TB, Keith KC, Alvarez E, Snider RG, Tanner, SL, Desjardins JD. Comparison of conventional polyethylene wear and signs of cup failure in two similar total hip designs. Adv Orthop. 2013;2013:710621.
11. Kurtz SM. The UHMWPE Handbook: Ultra-High Molecular Weight Polyethylene in Total Joint Replacement. Academic Press: London; 2014.
12. Babovic N, Trousdale RT. Total hip athroplasty using highly cross-linked polyethylene in patients younger than 50 years with minimum 10-year follow-up. J Arthroplasty. 2013;29(5):815-817.
13. Dorr LD, Wan Z, Shahrdar C, Sirianni L, Boutary M, Yun A. Clinical performance of a Durasal highly cross-linked polyethylene acetabular liner for total hip arthroplasty at five years. J Bone Joint Surg Am. 2005;87(8):1816-1821.
14. Thomas G, Simpson D, Mehmmod S, et al. The seven-year wear of highly cross-linked polyethylene in total hip arthroplasty: a double-blind, randomized controlled trial using radiostereometric analysis. J Bone Joint Surg Am. 2011;93(8):716-722.
15. Callary SA, Field JR, Campbell DG. Low wear of a second-generation highly crosslinked polyethylene liner: a 5-year radiostereometric analysis study. Clin Orthop Relat Res. 2013;471(11):3596-3600.
16. Tateiwa T, Clarke IC, Williams PA, et al. Ceramic total hip arthroplasty in the United States: safety and risk issues revisited. Am J Orthop (Belle Mead NJ). 2008;37(2):E26-E31.
17. Traina F, De Fine M, Di Martino A, Faldini C. Fracture of ceramic bearing surfaces following total hip replacement: a systematic review. BioMed Res Int. 2013;2013:157247.
18. Haidukewych GJ, Petrie J. Bearing surface considerations for total hip arthroplasty in young patients. Orthop Clin N Am. 2012;43(3):395-402.
19. Cohen D. How safe are metal-on-metal hip implants? BMJ. 2012;344:e1410.
20. Campbell P, Ebramzadeh E, Nelson S, Takamura K, De Smet K, Amstutz HC. Histological features of pseudotumor-like tissues from metal-on-metal hips. Clin Orthop Relat Res. 2010;468(9):2321-2327.
21. Pritchett JW. Adverse reaction to metal debris: metallosis of the resurfaced hip. Curr Orthop Pract. 2012;23(1):50-58.
22. Smith AJ, Dieppe P, Porter M, Blom AW; National Joint Registry of England and Wales. Risk of cancer in first seven years after metal-on-metal hip replacement compared with other bearings and general population: linkage study between the National Joint registry of England and Wales and hospital episode statistics. BMJ. 2012;344:e2383.
23. Kretzer JP, Jakubowitz E, Krachler M, Thomsen M, Heisel C. Metal release and corrosion effects of modular neck total hip arthroplasty. Int Orthop. 2009;33(6):1531-1536.
24. Cash, D, Khanduja V. The case for ceramics-on-polyethylene as the preferred bearing for a young adult hip replacement. Hip Int. 2014;24(5):421-427.
25. Taylor ED, Browne JA. Reconstruction options for acetabular revision. World J Orthop. 2012;3(7):95-100.
26. Lombardi AV, Berend KR. Isolated acetabular liner exchange. J Am Acad Orthop Surg. 2008;16(5):243-248.
27. Millet PJ, Allen MJ, Bostrom MP. Effects of alendronate on particle-induced osteolysis in a rat model. J Bone Joint Surg Am. 2002;84-A(2):236-249.
28. O'Hara LJ, Nivbrant B, Rohrl S.Cross-linked polyethylene and bisphosphonate therapy for osteolysis in total hip athroplasty: a case report. J Orthop Surg (Hong Kong). 2004;12(1):114-121.
Total hip arthroplasty (THA) is considered to be one of the most successful orthopedic interventions of its generation.1 In 2010, 332,000 THAs were performed in the U.S.2 Although used to correct advanced joint diseases in the elderly, the THA procedure has become increasingly common in a younger population for posttraumatic fractures and conditions that lead to early onset secondary arthritis such as avascular necrosis, juvenile rheumatoid arthritis, hip dysplasia, Perthes disease, and femoro-acetabular impingement.
Current hip replacements are expected to function at least 10 to 20 years in 90% of patients.3 As increasing numbers of young patients have these procedures and as seniors continue to live longer, patients will outlast their implants. Younger and more active patients have a higher rate of revision, because the longevity of the prosthesis is usually a function of usage.3 The number of revision THAs is projected to increase 137% by 2030.4
Hip resurfacing has been developed as a bone preserving surgical alternative to THA. The first system for use in the U.S. received FDA approval in 2006, but concerns about the metal on metal bearing surfaces, high failure and revision rates, and early catastrophic modes of failure compared with THAs has resulted in the recall of many of these devices. Hip resurfacing may offer some advantages compared with those of a THA in a carefully selected population, but its use will not be further discussed in this case study.5 Periprosthetic osteolysis and aseptic loosening are 2 of the long-term consequences of THA.6 Bone loss is felt to be secondary to a biologic reaction to particulate debris from implants.6 Some patients, especially those with loosening, complete wear, or fracture, will be symptomatic with pain. However, wear and osteolysis is a silent disease unless there is mechanical failure. Other patients may not experience discomfort. Radiographic studies may reveal significant changes, which warrant the recommendation for a hip revision.
Hip revision surgery has 3 major purposes: relieving pain in the affected joint, restoring the patient’s mobility, and removing a loose or damaged prosthesis before irreversible harm is done to the joint. It’s anticipated that most primary care providers (PCPs) will encounter patients who seek advice on the need for a revision hip arthroplasty.
This case will present an asymptomatic patient who underwent a THA in 1997 at age 37, to address developmental dysplasia of the hip (DDH) and was advised to undergo a revision hip arthroplasty due to abnormal radiographic findings at age 55 years. A discussion will follow that includes a brief review of the history of THA, the materials and bearings commonly used, the presenting symptoms or radiographic changes that signal the need for a revision, and the current options available for a patient such as this.
Case Report
A man aged 55 years presented to a new orthopedic surgeon for his first orthopedic appointment in 10 years. The patient had a left metal-on-polyethylene (M-on-PE) THA 18 years prior due to early onset secondary degenerative joint disease from DDH. The patient’s M-on-PE THA was a titanium acetabular socket and femoral stem with a cobalt-chromium alloy femoral head and a polyethylene liner. The patient remained physically active with an exercise routine consisting of walking, swimming, and weight training.
The patient’s orthopedic history was notable for a right knee arthroscopy for intervention due to a torn medial and lateral meniscus, and birth history was noteworthy for a breech presentation. The physical exam was unremarkable except for a slight leg length discrepancy, but the patient did not exhibit a Trendelenburg gait.
Plain X-rays and a computed tomography (CT) scan showed eccentric PE wear and superior migration of the femoral head, which was indicative of significant PE liner wear. No significant osteolysis or periprosthetic loosening was observed on the X-rays or CT scan. He was advised that a hip revision procedure would need to be done, optimally, within the next 6 months to a year.
Discussion
Hip dysplasia represents a broad group of disorders and generally means abnormal development of the hip joint. The term is most commonly used to refer to DDH with inadequate coverage of the femoral head. In one study, 25% of hip replacements performed in patients aged ≤ 40 years were due to underlying hip dysplasia.7
Developmental dysplasia of the hip occurs more often in children who present in the breech position.8 One theory argues that packaging issues in utero may account for the increased incidence of DDH.9 The earliest recorded attempts at hip replacement occurred in Germany, in 1891, when ivory was used to replace the femoral heads of patients whose hip joints had been destroyed by tuberculosis.1
The orthopedic surgeon Sir John Charnley, who worked at the Manchester Royal Infirmary, is considered the father of the modern THA.1 His low friction arthroplasty, designed in the early 1960s is identical, in principle, to the M-on-PE prosthesis used today.1 The PE liner used was ultrahigh molecular weight polyethylene (UHMWPE).1
Due to the early success of the Charnley prosthesis, the M-on-PE prosthesis became the most widely used. Although PE is the most studied and understood of all acetabular liner materials, it will eventually wear and shed debris. Acetabular cup wear is the most frequent reason for mid-to-long-term revisions, especially in young and active patients.10 More active patients shed more debris.3 The PE debris instigates the release of inflammatory mediators, which results in chronic inflammation and tissue damage that erodes the supporting bone and can lead to implant loosening or fracture.6 Ongoing studies seek to optimize and improve properties of the UHMWPE and to develop alternative bearings. After FDA approval in 1999, highly cross-linked polyethylene liners (HXLPE) rapidly became the standard of care for THAs, at least in the U.S.11 Highly cross-linked polyethylene liners are created from UHMWPE through a process of cross-linking by exposure to gamma radiation, and subsequent heat treatment to neutralize free radicals and limit oxidative degradation.12
In one study, the 5-year annual linear wear rate for a HXLPE liner was only 45% of that seen with the UHMWPE liner, although the qualitative wear pattern was the same.13 In a study that followed patients for 7 years postoperatively, the mean steady-state wear rate of the HXLPE was 0.005 mm/y compared with 0.037 mm/y for UHMWPE.14 In a long-term study (a minimum follow-up of 10 years) of 50 patients who were aged < 50 years and underwent THA using HXLPE liners, there was no radiographic evidence of osteolysis or component loosening, and liner wear was 0.020 ± 0.0047 mm/y.12 In 2005, second-generation HXLPE liners were introduced clinically and have been shown to further reduce wear in vitro compared with both UHMWPE and first-generation HXLPE liners. Callary and colleagues calculated that the wear rates between 1 year and 5 years were all < 0.001 mm/y.15
The use of ceramic for THAs began in 1970, and ceramic heads on polyethylene (C-on-PE) liners and ceramic-on-ceramic (C-on-C) bearings have been in continual use for > 30 years in Europe. Premarket FDA approval based on European data was granted in 1983; however, the manufacturer voluntarily removed it from the market because of a high incidence of stem loosening (> 30% within 3 years in some series).16 FDA approvals came much later for C-on-PE (1989) and C-on-C (2003) bearings.
Ceramic is the hardest implant material used, and it can be concluded from many clinical and laboratory reports that C-on-PE and C-on-C combinations confer a potentially significant reduction in wear on THA bearings.16 Ceramic hips initially had 2 concerns: catastrophic shattering and squeaking. Current ceramic hips have been substantially improved, and some experts feel shattering has been essentially eliminated.16 Other experts note that ceramic brittleness remains a major concern.17 Squeaking remains a problem for some, but it usually abates over time. No study has correlated squeaking with impending failure or increased pain or disability.
While C-on-C bearings are now felt to be a good implant for young active patients, these bearings have generally not resulted in significantly lower wear rates and fewer revisions.18 High rates of wear and osteolysis have been sporadically documented over the 35-year history of ceramic implants.16 The FDA approved the first ceramic-on-metal total hip replacement system on June 13, 2011.
Metal-on-metal (M-on-M) implants have been used by some for decades, although they were not approved by the FDA until the late 1990s. However, some device recalls have brought negative attention to M-on-M implants.19 It was felt that they would generate less wear debris than PE, but reports of pseudotumors (from inflammatory mediators) and metallosis have significantly tempered enthusiasm for these products.20,21 The wear rates are very low, estimated to be only 0.01 mm/y, but concerns about the carcinogenetic potential of systemically increased metal ions remains a possible and much debated concern.19,22,23 In January 2013, FDA issued a safety communication on M-on-M implants.
Many experts feel that modern ceramic or metal on second-generation HXLPE represents the gold standard and the most predictable bearing choice for young, active patients.18 Others feel that the optimal choice of bearing surfaces in THA, particularly in the younger and more active patient, remains controversial.24
Follow-Up
Intermittent orthopedic monitoring is recommended for all patients who have undergone a THA. The frequency of hip X-rays on follow-up appointments is left to the orthopedic surgeon. After the initial recovery, serial images every 2 to 5 years can identify progressive failure, and annual X-rays may be used for closer follow-up in high-risk patients.
Patients who experience dislocations, fractures, infections, or pain usually maintain close orthopedic follow-up. Significant wear of the prosthesis damages the socket; osteolysis can cause irreversible bone loss, fracture, and loosening. Massive acetabular bone loss is very difficult to reverse and creates major reconstruction challenges.
Figure 1A is a 2009 X-ray of a woman aged 44 years who underwent a THA after a motor vehicle accident in 1997 and who was advised to have a revision THA when seen in 2009.
Figure 3A is an X-ray of a man aged 71 years who had undergone THA 21 years earlier and had complied with routine follow-up. When his X-rays showed significant wear of the liner and some osteolysis, he was able to undergo a simple revision (Figure 3B).
Three-dimensional CT is useful for quantifying the presence and severity of osteolytic lesions, because plain radiographs may underestimate the amount of bone loss that is present.25 The CT in Figure 3C shows the magnitude of osteolysis that was underestimated by the preoperative plain X-rays (Figure 3A). Computed tomography scans are crucial for surgical planning in the setting of severe acetabular bone loss.
There is a wide spectrum of signs and symptoms that can occur in the setting of acetabular component failure. Pain is a common presenting symptom. Groin pain can represent acetabular failure; thigh pain may be correlated to femoral component failure.25 The clinical patient presentation ultimately depends on the underlying cause: an infection, polyethylene wear, instability, or aseptic loosening.25 Leg-length discrepancy, joint deformity, location of prior incisions, functional status, and baseline neurologic status should be evaluated and documented during the preoperative evaluation as well.25
Case Study Revision Options
The X-rays and CT scans for this case study patient showed that he was a possible candidate for the simplest revision surgery; an isolated liner exchange and replacement of the femoral head. When the original surgery was performed (1997), the only FDA approved PE liner was UHMWPE. To justify isolated liner exchange, the modular acetabular metallic shell also should be well-fixed and appropriately oriented.26 This is evaluated both preoperatively and intraoperatively.
If found to be well fixed with an appropriate orientation and locking mechanism, the UHMWPE liner could be replaced with a HXLPE liner and a larger metal femoral head for improved wear and stability. Acetabular revision is indicted for an asymptomatic patient who has progressive osteolysis, severe wear, or bone loss that would compromise future reconstruction.
Conclusions
Over the past several decades, THA has become recognized as an effective treatment option for the reduction of pain and disability associated with hip joint disease and is associated with successful clinical outcomes. The most frequently noted recommendations for trying to increase the life expectancy of an artificial hip replacement include maintaining a normal weight, keeping leg muscles strong, and avoiding repetitive squatting and kneeling.
As the number of primary THAs has increased and the average age of those undergoing a primary THA has decreased, the need for revisions has risen. Reviews have demonstrated that the most common causes for early total hip revision, regardless of component, included infection, instability/dislocation, and fracture, whereas wear is the most common reason for mid to late revisions.
The wear of all materials used has been shown to be greatest in the most active patients.
Studies continue to identify ways to potentially prevent or reverse osteolysis from wear debris. Alendronate therapy has been shown to prevent and treat PE debris-induced periprosthetic bone loss in rats.27 It also was successfully used in a case report of an asymptomatic woman aged 39 years who had rapid PE wear and aggressive periprosthetic osteolysis within just 2 years of a bilateral THA.28 Other areas of research on decreasing osteolysis in THA recipients include trials with mesenchymal stem cells, bone morphogenic proteins, and gene therapy.6
In the U.S., 46,000 revisions were performed in 2004 and this number is expected to more than double by 2030.4 Primary care providers are sure to encounter patients who will be in need of a hip revision procedure. It’s important for them to make sure that their patients who have undergone a THA are periodically seen for orthopedic follow-up. Despite the long history of primary THAs, there is still not a single technique and material to suit all patient characteristics.1 Unfortunately, the same currently applies to hip revision procedures.
1. Knight SR, Aujla R, Biswas SP. Total hip arthroplasty--over 100 years of operative history. Orthop Rev (Pavia). 2011;3(2):e16.
2. Centers for Disease Control and Prevention. FastStats: inpatient surgery. Centers for Disease Control and Prevention Website. http://www.cdc.gov/nchs/fastats/inpatient-surgery.htm. Updated April 29, 2015. Accessed January 18, 2016.
3. Joint Revision Surgery-When do I need it? American Academy of Orthopedic Surgeons Website. http://www.tlhoc.com/uploads/documents/when_do_I_need_it.pdf. Accessed January 18, 2016.
4. Kurtz S, Ong K, Lau E, Mowat F, Halpern M. Projections of primary and revision hip and knee arthroplasty in the United States from 2005 to 2030. J Bone Joint Surg Am. 2007;89(4):780-785.
5. Nunley RM, Della Valle CJ, Barrack RL. Is patient selection important for hip resurfacing? Clin Orthop Relat Res. 2009;467(1):56-65.
6. Dattani R. Femoral osteolysis following total hip replacement. Postgrad Med J. 2007;83(979):312-316.
7. Engesæter IØ, Lehmann T, Laborie LB, Lie SA, Rosendahl K, Engesæter LB. Total hip replacement in young adults with hip dysplasia: age at diagnosis, previous treatment, quality of life, and validation of diagnoses reported to the Norwegian Arthroplasty Register between 1987 and 2007. Acta Orthop. 2011;82(2):149-154.
8. Salter RB. Etiology, pathogenesis and possible prevention of congenital dislocation of the hip. Can Med Assoc J. 1968;98(20):933-945.
9. Storer SK, Skaggs DL. Developmental dysplasia of the hip. Am Fam Physician. 2006;74(8):1310-1316.
10. Pace TB, Keith KC, Alvarez E, Snider RG, Tanner, SL, Desjardins JD. Comparison of conventional polyethylene wear and signs of cup failure in two similar total hip designs. Adv Orthop. 2013;2013:710621.
11. Kurtz SM. The UHMWPE Handbook: Ultra-High Molecular Weight Polyethylene in Total Joint Replacement. Academic Press: London; 2014.
12. Babovic N, Trousdale RT. Total hip athroplasty using highly cross-linked polyethylene in patients younger than 50 years with minimum 10-year follow-up. J Arthroplasty. 2013;29(5):815-817.
13. Dorr LD, Wan Z, Shahrdar C, Sirianni L, Boutary M, Yun A. Clinical performance of a Durasal highly cross-linked polyethylene acetabular liner for total hip arthroplasty at five years. J Bone Joint Surg Am. 2005;87(8):1816-1821.
14. Thomas G, Simpson D, Mehmmod S, et al. The seven-year wear of highly cross-linked polyethylene in total hip arthroplasty: a double-blind, randomized controlled trial using radiostereometric analysis. J Bone Joint Surg Am. 2011;93(8):716-722.
15. Callary SA, Field JR, Campbell DG. Low wear of a second-generation highly crosslinked polyethylene liner: a 5-year radiostereometric analysis study. Clin Orthop Relat Res. 2013;471(11):3596-3600.
16. Tateiwa T, Clarke IC, Williams PA, et al. Ceramic total hip arthroplasty in the United States: safety and risk issues revisited. Am J Orthop (Belle Mead NJ). 2008;37(2):E26-E31.
17. Traina F, De Fine M, Di Martino A, Faldini C. Fracture of ceramic bearing surfaces following total hip replacement: a systematic review. BioMed Res Int. 2013;2013:157247.
18. Haidukewych GJ, Petrie J. Bearing surface considerations for total hip arthroplasty in young patients. Orthop Clin N Am. 2012;43(3):395-402.
19. Cohen D. How safe are metal-on-metal hip implants? BMJ. 2012;344:e1410.
20. Campbell P, Ebramzadeh E, Nelson S, Takamura K, De Smet K, Amstutz HC. Histological features of pseudotumor-like tissues from metal-on-metal hips. Clin Orthop Relat Res. 2010;468(9):2321-2327.
21. Pritchett JW. Adverse reaction to metal debris: metallosis of the resurfaced hip. Curr Orthop Pract. 2012;23(1):50-58.
22. Smith AJ, Dieppe P, Porter M, Blom AW; National Joint Registry of England and Wales. Risk of cancer in first seven years after metal-on-metal hip replacement compared with other bearings and general population: linkage study between the National Joint registry of England and Wales and hospital episode statistics. BMJ. 2012;344:e2383.
23. Kretzer JP, Jakubowitz E, Krachler M, Thomsen M, Heisel C. Metal release and corrosion effects of modular neck total hip arthroplasty. Int Orthop. 2009;33(6):1531-1536.
24. Cash, D, Khanduja V. The case for ceramics-on-polyethylene as the preferred bearing for a young adult hip replacement. Hip Int. 2014;24(5):421-427.
25. Taylor ED, Browne JA. Reconstruction options for acetabular revision. World J Orthop. 2012;3(7):95-100.
26. Lombardi AV, Berend KR. Isolated acetabular liner exchange. J Am Acad Orthop Surg. 2008;16(5):243-248.
27. Millet PJ, Allen MJ, Bostrom MP. Effects of alendronate on particle-induced osteolysis in a rat model. J Bone Joint Surg Am. 2002;84-A(2):236-249.
28. O'Hara LJ, Nivbrant B, Rohrl S.Cross-linked polyethylene and bisphosphonate therapy for osteolysis in total hip athroplasty: a case report. J Orthop Surg (Hong Kong). 2004;12(1):114-121.
Impact of Patient Aligned Care Team Interprofessional Care Updates on Metabolic Parameters
Chronic conditions contribute to increasing health care expenditures, and a small number of patients with chronic medical conditions consume a disproportionately larger amount of health care resources.1,2 Naessens and colleagues showed that 2.6% of adult patients accounted for 20.7% of all primary care clinic visits during a calendar year.2 These high-risk patients may be using much of the health care resources but have unmet needs even with the increased amount of health care services they receive.
The impact of interprofessional forms of chronic disease management on patient outcomes is unclear.3-5 Definitions for high-risk patients and interprofessional care are broad, making comparison of studies difficult. In a team setting, it is difficult to discern the exact contributions of a single member of the team. Katon and colleagues concluded in a randomized, controlled trial that a nurse care manager collaborative treatment program added additional depression-free days and quality-adjusted life-years in adults with depression and poorly controlled diabetes mellitus (DM), coronary artery disease, or both.3 The intervention also resulted in improvements in a composite outcome of hemoglobin A1c (A1c), low-densitylipoprotein cholesterol, systolic blood pressure (BP) levels, and depression symptoms at 12 months, but these improvements were not sustained at 24 months.3,4
A study looked at interprofessional team care provided by primary care internal medicine residents, nurse practitioner students, and pharmacy students, compared with usual care by only internal medicine residents. The study showed improvements in patient assessments and a trend toward the decreased use of urgent care in patients with type 2 DM over 18 months but no significant improvements in A1c or BP values.5 The impact of pharmacists participating in team-based care and patient-centered medical home models has also been shown to be positive regarding metabolic parameters.6,7Patient aligned care teams (PACT), the VA patient-centered medical home model initiative, seek to optimize patient care through provision of interprofessional, team-based care. At the Boise VAMC in Idaho, PACT training occurs at a primary care academic training clinic that includes 40 primary care providers, supervisors, and trainees in internal medicine, nurse practitioner programs, pharmacy, and behavioral health.
The Boise VAMC is also 1 of 5 VA Centers of Excellence in Primary Care Education (CoEPCE), institutions that prepare health care trainees from many disciplines to participate in interprofessional PACTs, provide patient-centered, team-based care, and learn and understand the roles of other team members.8 This VAMC CoEPCE, implemented in 2010, is an academic partnership with area professional schools of medicine, nursing, and pharmacy.
Team-Based Care
At the Boise VAMC CoEPCE, primary care trainees are taught a team-based approach to providing more effective care for high-risk patients through a complex curriculum that includes interprofessional case conferences called PACT interprofessional care updates (ICU). During these case conferences, high-risk patients on a primary care trainee’s panel are presented to an interprofessional group of health care professionals (HCPs) for recommendations to improve care. Trainees from the various disciplines participate in these PACT ICU presentations during time spent rotating through the institution’s academic clinic.
The CoEPCE activities include PACT ICU, interprofessional didactic sessions, and provision of primary care to patients in an interprofessional clinic. Physician trainees participate in one-half day per week of ambulatory didactics and conferences during a 2-week clinic block, which occurs every 2 months. Other health care disciplines participate in PACT ICU during longitudinal experiences (ranging from 4 to 12 months) in the primary care training clinic throughout the academic year.
The PACT ICU case conferences occur weekly at the academic clinic with 2 patient cases presented and discussed at each meeting. Prior to each conference, a primary care trainee, generally an internal medicine resident, is given a list of the top 5 high-risk patients from their panel, determined by a care assessment needs score that is based on high health care use and risk of hospitalization or death within 90 days. To determine care assessment needs scores, patient electronic health records (EHRs) are scanned weekly to review more than 150 data elements, including vital signs; recent clinic, urgent care, and emergency department (ED) visits; medications; laboratory values; and the number and types of illnesses. Statistical analyses are run on the EHR data to provide up-to-date estimates of likelihood of hospital admission or death.
Trainees may also select any patient on their panel whose health care they feel would benefit from a case conference discussion. The trainee presents all medical and social problems related to the selected patient to a team of HCPs, including other trainees and their supervisors, from multiple different disciplines, such as medicine, nursing, pharmacy, behavioral health, and social work. The interprofessional team then provides recommendations.
A care plan is developed by the group to implement as appropriate. The care plan may consist of various recommendations from the different disciplines, such as consults to a pharmacist for medication review or medication management, referrals to social work to coordinate care with home health services, or asking the nurse care manager to follow up with a patient by phone on a more regular basis. Trainees are encouraged to use alternate forms of care, including team-based care from other health care disciplines as well as other methods of communication, such as secure electronic messaging to increase access.
Interprofessional patient case conferences could offer another tool for HCPs to improve the care of high-risk patients through team-based efforts if the effect on patient outcomes or health care use is beneficial. The objective of this study was to evaluate the relationship of interprofessional case conferences and A1c levels in high-risk patients with DM and BP measurements in patients with hypertension whose case was discussed at PACT ICU case conferences at the Boise VAMC. The authors hypothesized that the PACT ICU presentation intervention would lead to improved metabolic parameters as care plans were implemented. This evaluation is a subset of a larger study assessing the impact of PACT ICU presentation on various patient, trainee, and team level outcomes.
Methods
This study was a retrospective, observational analysis of patients seen at the Boise VAMC academic clinic whose cases were discussed at PACT ICU case conferences from January 2013 to April 2014. For the analysis of A1c values, patients must have been discussed at a PACT ICU presentation during the study time period and had a diagnosis of DM in the EHR. Those included must have A1c results in the EHR before and after the patient case presentation. The most recent A1c measured prior to presentation was chosen as the prepresentation value. The next measured value 2 to 6 months after the case presentation date was chosen as the postpresentation value. This was chosen as the postpresentation value because it may be more indicative of the impact of the PACT ICU care plan. An A1c measured at least 2 months following the case conference intervention was chosen to allow all possible measurements to be included in the analysis, according to usual care for measuring A1c at the clinic. The primary outcome was the mean change in A1c values pre- and post-PACT ICU presentation.
Blood pressure analyses were included if patients had a diagnosis of hypertension in the EHR as well as recorded BP values measured during the 6 months prior to PACT ICU presentation and 1 to 6 months after presentation. Blood pressure values were limited to 1 to 6 months after presentation to be more suggestive of the case conference care plan impact. Blood pressure measured during hospitalizations, urgent care, or ED visits were excluded from the analysis. The primary outcome in the BP analysis was the mean change in systolic and diastolic BP pre- and post-PACT ICU presentation. The mean of all in-clinic BP measurements was calculated as the prepresentation value and compared with the mean of all postpresentation BP measurements in the designated time period.
Assessment of DM or hypertension control was not a factor for inclusion in the study. The types of interventions and recommendations resulting from the case conferences were not evaluated.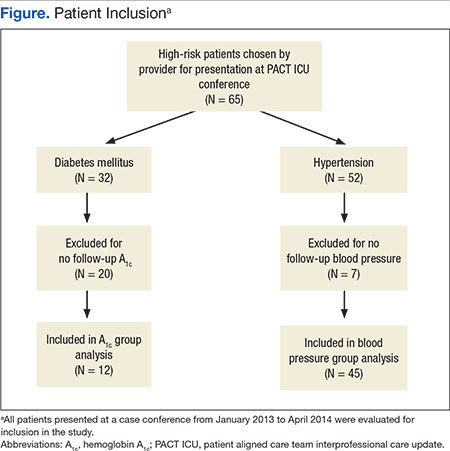
Results
During the study period, 65 patients were discussed at a PACT ICU case conferences (Figure). The average age was 67 years, and 89% of patients were male. Of these patients, 32 had a DM diagnosis. A total of 12 patients had A1c values within the parameters specified for this study and were included in the final analysis for the A1c group. 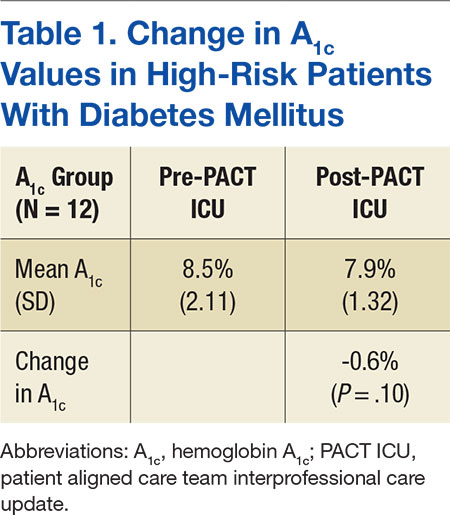
Of all patients discussed at a PACT ICU case conference, 52 had a diagnosis of hypertension (Table 2). 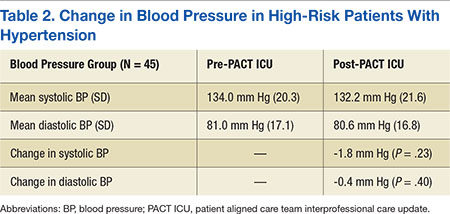
Discussion
High-risk patients with DM enrolled in this primary care academic clinic and discussed at interprofessional case conferences did not have a statistically significant change in A1c values following the case conferences. There was also no statistically significant change in systolic and diastolic BP measurements following PACT ICU case conferences in high-risk patients with hypertension. The relationship between PACT ICU presentations and patient outcomes may not be direct, but the potential to decrease A1c values by 0.6% may be of clinical benefit to patients enrolled at the Boise VAMC academic clinic.
The results of this study are comparable with other studies where the impact of interprofessional forms of care on patient outcomes such as A1c and BP is not as apparent.3-5 The patients included in this study were high-risk compared with other patients, and patient outcome goals for DM and hypertension management according to clinical practice guidelines may be less stringent for these patients.9-11
Interprofessional case conferences are being used at the Boise VAMC academic clinic to teach primary care trainees how to improve care for patients by working on teams, with a goal of promoting alternate forms of health care. Referrals of patients to pharmacy services for chronic disease management may result from these case conferences, and patients could benefit from pharmacy review and management of medications for the treatment of DM and hypertension. There may be other advantages to patients and to the health system in the form of more appropriate health care use, increased contact with providers, and use of other health care resources to decrease costs and medication burden, although these are speculative at this time.
Limitations
This study had several limitations. The patients included in this study were high-risk patients seen by primary care trainees at the Boise VAMC academic clinic, and a small number of patients were included in the final analysis, limiting the generalizability of the results to other patient populations. Finding a difference in A1c and BP values before and after PACT ICU case conferences was also limited by the small number of patients who met inclusion criteria. Many patients included in the study also had reasonably controlled A1c and BP levels prior to PACT ICU case conferences; therefore, a difference would be more difficult to determine.
The PACT ICU case conferences occur at one point in time, but the impact of the intervention and recommendations may take longer to appreciate. A longer study duration may be needed to determine differences in A1c and BP values over time. Regression to the mean is also a possibility given the type of data collected. As each primary care trainee selects the patient to be discussed at a PACT ICU case conference, bias could also be present, because the provider may focus on patients with recent clinic visits or on patients who are the most difficult for the provider to manage or contact.
The Boise VAMC PACTs include many different health care disciplines; therefore, the institution may foster interprofessional, team-based care more easily compared with that of other health care systems. Trainees in the CoEPCE also are aware of other team members’ roles, and clinical pharmacists are currently part of PACTs at the institution. The idea of interprofessional case conferences may be simple, but the process at this institution requires time and effort from a nurse care manager who coordinates patient selection and information distribution and an attending physician supervisor who facilitates each case conference. The Boise VAMC also supports pharmacy chronic disease management services, and several of these patients with uncontrolled DM or resistant hypertension may have been seen by the pharmacy-managed insulin titration or hypertension clinics. Finally, there is also limited documentation of whether DM or hypertension management was discussed at the case conferences.
Despite the medical complexities seen in these patients, discussions during PACT ICU presentations may involve many social and behavioral interventions, and DM and hypertension issues may not be significant enough for review at a case conference. However, the intervention of PACT ICU case conferences encompassed a variety of care plans, and this study evaluated the impact of the entire discussion and recommendations and not any individual component. Other recommendations were not evaluated due to the wide variety of interventions that were potentially discussed, and a process for tracking these was not in place.
The results of this study did not show that the care plans that develop at PACT ICU case conferences impacted high-risk patients with DM or hypertension, likely due to small sample sizes (2 patient cases were discussed per week). The impact could be better determined through a larger sample size, longer duration, or assessment of patients whose disease was not controlled. The impact may also be more significant for individuals who benefit from the increased review and assessment of their chronic medical conditions and increased access to care.
Seeing a possible trend toward benefit in A1c values in this short time frame helps support continuing and expanding case conferences at the Boise VAMC. The goals of these interprofessional case conferences include developing a proactive approach to identify high-risk patients to improve the care of these patients and increase use of more appropriate health care resources. Other outcomes currently being studied include the impact of PACT ICU presentations on health care use, the impact on alternate health care consult patterns, and trainee participant opinions. Future directions for the interprofessional case conferences include expansion to other nonacademic primary care teams. The benefit of PACT ICU case conferences also extends to the primary care trainees as they continue to learn how to best work with other HCPs as part of a team and how to use the resources available through these other health care disciplines.
Conclusions
Presentation at an interprofessional case conference was not associated with a statistically significant change in mean A1c or BP values in a small group of high-risk patients at the Boise VAMC PACT academic clinic. Although there was a trend toward a decrease in A1c values, it is difficult to determine whether there is a relation to the interprofessional case conferences. Interprofessional case conferences are still occurring at the Boise VAMC with efforts in place to incorporate concurrent PACT ICU outcomes data collection and further the educational goals of primary care trainees.
Acknowledgments
The authors would like to express their appreciation to Rick Tivis, MPH, and Tim Gordon, MA, MPH, MS, for their assistance in the analysis and collection of data for this study.
1. Thorpe KE, Ogden LL, Galactionova K. Chronic conditions account for rise in Medicare spending from 1987 to 2006. Health Aff (Millwood). 2010;29(4):718-724.
2. Naessens JM, Baird MA, Van Houten HK, Vanness DJ, Campbell CR. Predicting persistently high primary care use. Ann Fam Med. 2005;3(4):324-330.
3. Katon W, Russo J, Lin EH, et al. Cost-effectiveness of a multicondition collaborative care intervention: a randomized controlled trial. Arch Gen Psychiatry. 2012;69(5):506-514.
4. Katon WJ, Lin EH, Von Korff M, et al. Collaborative care for patients with depression and chronic illnesses. N Engl J Med. 2010;363(27):2611-2620.
5. Janson SL, Cooke M, McGrath K, Kroon LA, Robinson S, Baron RB. Improving chronic care of type 2 diabetes using teams of interprofessional learners. Acad Med. 2009;84 (11):1540-1548.
6. Lamb KD, Baker JW, McFarland MS. Implementation of a pharmacotherapy clinic into the patient centered medical home model by a second year pharmacy resident. Am J Health Syst Pharm. 2015;72(17)(suppl 2):S83-S89.
7. Chisholm-Burns MA, Kim Lee J, Spivey CA, et al. US pharmacists' effect as team members on patient care: systematic review and meta-analyses. Med Care. 2010;48(10):923-933.
8. Gilman SC, Chokshi DA, Bowen JL, Rugen KW, Cox M. Connecting the dots: interprofessional health education and delivery system redesign at the Veterans Health Administration. Acad Med. 2014;89(8):1113-1116.
9. Department of Veteran Affairs, Department of Defense. VA/DoD clinical practice guideline for the management of diabetes mellitus (DM). Department of Veteran Affairs Website. http://www.healthquality.va.gov/guidelines/CD/diabetes/DM2010_FUL-v4e.pdf. Published August 2010. Accessed January 19, 2016.
10. American Diabetes Association. Standards of medical care in diabetes-2014. Diabetes Care. 2014;37(suppl 1):S14-S80.
11. James PA, Oparil S, Carter BL, et al. 2014 evidence-based guideline for the management of high blood pressure in adults: report from the panel members appointed to the Eighth Joint National Committee (JNC 8). JAMA. 2014;311(5):507-520.
Chronic conditions contribute to increasing health care expenditures, and a small number of patients with chronic medical conditions consume a disproportionately larger amount of health care resources.1,2 Naessens and colleagues showed that 2.6% of adult patients accounted for 20.7% of all primary care clinic visits during a calendar year.2 These high-risk patients may be using much of the health care resources but have unmet needs even with the increased amount of health care services they receive.
The impact of interprofessional forms of chronic disease management on patient outcomes is unclear.3-5 Definitions for high-risk patients and interprofessional care are broad, making comparison of studies difficult. In a team setting, it is difficult to discern the exact contributions of a single member of the team. Katon and colleagues concluded in a randomized, controlled trial that a nurse care manager collaborative treatment program added additional depression-free days and quality-adjusted life-years in adults with depression and poorly controlled diabetes mellitus (DM), coronary artery disease, or both.3 The intervention also resulted in improvements in a composite outcome of hemoglobin A1c (A1c), low-densitylipoprotein cholesterol, systolic blood pressure (BP) levels, and depression symptoms at 12 months, but these improvements were not sustained at 24 months.3,4
A study looked at interprofessional team care provided by primary care internal medicine residents, nurse practitioner students, and pharmacy students, compared with usual care by only internal medicine residents. The study showed improvements in patient assessments and a trend toward the decreased use of urgent care in patients with type 2 DM over 18 months but no significant improvements in A1c or BP values.5 The impact of pharmacists participating in team-based care and patient-centered medical home models has also been shown to be positive regarding metabolic parameters.6,7Patient aligned care teams (PACT), the VA patient-centered medical home model initiative, seek to optimize patient care through provision of interprofessional, team-based care. At the Boise VAMC in Idaho, PACT training occurs at a primary care academic training clinic that includes 40 primary care providers, supervisors, and trainees in internal medicine, nurse practitioner programs, pharmacy, and behavioral health.
The Boise VAMC is also 1 of 5 VA Centers of Excellence in Primary Care Education (CoEPCE), institutions that prepare health care trainees from many disciplines to participate in interprofessional PACTs, provide patient-centered, team-based care, and learn and understand the roles of other team members.8 This VAMC CoEPCE, implemented in 2010, is an academic partnership with area professional schools of medicine, nursing, and pharmacy.
Team-Based Care
At the Boise VAMC CoEPCE, primary care trainees are taught a team-based approach to providing more effective care for high-risk patients through a complex curriculum that includes interprofessional case conferences called PACT interprofessional care updates (ICU). During these case conferences, high-risk patients on a primary care trainee’s panel are presented to an interprofessional group of health care professionals (HCPs) for recommendations to improve care. Trainees from the various disciplines participate in these PACT ICU presentations during time spent rotating through the institution’s academic clinic.
The CoEPCE activities include PACT ICU, interprofessional didactic sessions, and provision of primary care to patients in an interprofessional clinic. Physician trainees participate in one-half day per week of ambulatory didactics and conferences during a 2-week clinic block, which occurs every 2 months. Other health care disciplines participate in PACT ICU during longitudinal experiences (ranging from 4 to 12 months) in the primary care training clinic throughout the academic year.
The PACT ICU case conferences occur weekly at the academic clinic with 2 patient cases presented and discussed at each meeting. Prior to each conference, a primary care trainee, generally an internal medicine resident, is given a list of the top 5 high-risk patients from their panel, determined by a care assessment needs score that is based on high health care use and risk of hospitalization or death within 90 days. To determine care assessment needs scores, patient electronic health records (EHRs) are scanned weekly to review more than 150 data elements, including vital signs; recent clinic, urgent care, and emergency department (ED) visits; medications; laboratory values; and the number and types of illnesses. Statistical analyses are run on the EHR data to provide up-to-date estimates of likelihood of hospital admission or death.
Trainees may also select any patient on their panel whose health care they feel would benefit from a case conference discussion. The trainee presents all medical and social problems related to the selected patient to a team of HCPs, including other trainees and their supervisors, from multiple different disciplines, such as medicine, nursing, pharmacy, behavioral health, and social work. The interprofessional team then provides recommendations.
A care plan is developed by the group to implement as appropriate. The care plan may consist of various recommendations from the different disciplines, such as consults to a pharmacist for medication review or medication management, referrals to social work to coordinate care with home health services, or asking the nurse care manager to follow up with a patient by phone on a more regular basis. Trainees are encouraged to use alternate forms of care, including team-based care from other health care disciplines as well as other methods of communication, such as secure electronic messaging to increase access.
Interprofessional patient case conferences could offer another tool for HCPs to improve the care of high-risk patients through team-based efforts if the effect on patient outcomes or health care use is beneficial. The objective of this study was to evaluate the relationship of interprofessional case conferences and A1c levels in high-risk patients with DM and BP measurements in patients with hypertension whose case was discussed at PACT ICU case conferences at the Boise VAMC. The authors hypothesized that the PACT ICU presentation intervention would lead to improved metabolic parameters as care plans were implemented. This evaluation is a subset of a larger study assessing the impact of PACT ICU presentation on various patient, trainee, and team level outcomes.
Methods
This study was a retrospective, observational analysis of patients seen at the Boise VAMC academic clinic whose cases were discussed at PACT ICU case conferences from January 2013 to April 2014. For the analysis of A1c values, patients must have been discussed at a PACT ICU presentation during the study time period and had a diagnosis of DM in the EHR. Those included must have A1c results in the EHR before and after the patient case presentation. The most recent A1c measured prior to presentation was chosen as the prepresentation value. The next measured value 2 to 6 months after the case presentation date was chosen as the postpresentation value. This was chosen as the postpresentation value because it may be more indicative of the impact of the PACT ICU care plan. An A1c measured at least 2 months following the case conference intervention was chosen to allow all possible measurements to be included in the analysis, according to usual care for measuring A1c at the clinic. The primary outcome was the mean change in A1c values pre- and post-PACT ICU presentation.
Blood pressure analyses were included if patients had a diagnosis of hypertension in the EHR as well as recorded BP values measured during the 6 months prior to PACT ICU presentation and 1 to 6 months after presentation. Blood pressure values were limited to 1 to 6 months after presentation to be more suggestive of the case conference care plan impact. Blood pressure measured during hospitalizations, urgent care, or ED visits were excluded from the analysis. The primary outcome in the BP analysis was the mean change in systolic and diastolic BP pre- and post-PACT ICU presentation. The mean of all in-clinic BP measurements was calculated as the prepresentation value and compared with the mean of all postpresentation BP measurements in the designated time period.
Assessment of DM or hypertension control was not a factor for inclusion in the study. The types of interventions and recommendations resulting from the case conferences were not evaluated.
Results
During the study period, 65 patients were discussed at a PACT ICU case conferences (Figure). The average age was 67 years, and 89% of patients were male. Of these patients, 32 had a DM diagnosis. A total of 12 patients had A1c values within the parameters specified for this study and were included in the final analysis for the A1c group.
Of all patients discussed at a PACT ICU case conference, 52 had a diagnosis of hypertension (Table 2).
Discussion
High-risk patients with DM enrolled in this primary care academic clinic and discussed at interprofessional case conferences did not have a statistically significant change in A1c values following the case conferences. There was also no statistically significant change in systolic and diastolic BP measurements following PACT ICU case conferences in high-risk patients with hypertension. The relationship between PACT ICU presentations and patient outcomes may not be direct, but the potential to decrease A1c values by 0.6% may be of clinical benefit to patients enrolled at the Boise VAMC academic clinic.
The results of this study are comparable with other studies where the impact of interprofessional forms of care on patient outcomes such as A1c and BP is not as apparent.3-5 The patients included in this study were high-risk compared with other patients, and patient outcome goals for DM and hypertension management according to clinical practice guidelines may be less stringent for these patients.9-11
Interprofessional case conferences are being used at the Boise VAMC academic clinic to teach primary care trainees how to improve care for patients by working on teams, with a goal of promoting alternate forms of health care. Referrals of patients to pharmacy services for chronic disease management may result from these case conferences, and patients could benefit from pharmacy review and management of medications for the treatment of DM and hypertension. There may be other advantages to patients and to the health system in the form of more appropriate health care use, increased contact with providers, and use of other health care resources to decrease costs and medication burden, although these are speculative at this time.
Limitations
This study had several limitations. The patients included in this study were high-risk patients seen by primary care trainees at the Boise VAMC academic clinic, and a small number of patients were included in the final analysis, limiting the generalizability of the results to other patient populations. Finding a difference in A1c and BP values before and after PACT ICU case conferences was also limited by the small number of patients who met inclusion criteria. Many patients included in the study also had reasonably controlled A1c and BP levels prior to PACT ICU case conferences; therefore, a difference would be more difficult to determine.
The PACT ICU case conferences occur at one point in time, but the impact of the intervention and recommendations may take longer to appreciate. A longer study duration may be needed to determine differences in A1c and BP values over time. Regression to the mean is also a possibility given the type of data collected. As each primary care trainee selects the patient to be discussed at a PACT ICU case conference, bias could also be present, because the provider may focus on patients with recent clinic visits or on patients who are the most difficult for the provider to manage or contact.
The Boise VAMC PACTs include many different health care disciplines; therefore, the institution may foster interprofessional, team-based care more easily compared with that of other health care systems. Trainees in the CoEPCE also are aware of other team members’ roles, and clinical pharmacists are currently part of PACTs at the institution. The idea of interprofessional case conferences may be simple, but the process at this institution requires time and effort from a nurse care manager who coordinates patient selection and information distribution and an attending physician supervisor who facilitates each case conference. The Boise VAMC also supports pharmacy chronic disease management services, and several of these patients with uncontrolled DM or resistant hypertension may have been seen by the pharmacy-managed insulin titration or hypertension clinics. Finally, there is also limited documentation of whether DM or hypertension management was discussed at the case conferences.
Despite the medical complexities seen in these patients, discussions during PACT ICU presentations may involve many social and behavioral interventions, and DM and hypertension issues may not be significant enough for review at a case conference. However, the intervention of PACT ICU case conferences encompassed a variety of care plans, and this study evaluated the impact of the entire discussion and recommendations and not any individual component. Other recommendations were not evaluated due to the wide variety of interventions that were potentially discussed, and a process for tracking these was not in place.
The results of this study did not show that the care plans that develop at PACT ICU case conferences impacted high-risk patients with DM or hypertension, likely due to small sample sizes (2 patient cases were discussed per week). The impact could be better determined through a larger sample size, longer duration, or assessment of patients whose disease was not controlled. The impact may also be more significant for individuals who benefit from the increased review and assessment of their chronic medical conditions and increased access to care.
Seeing a possible trend toward benefit in A1c values in this short time frame helps support continuing and expanding case conferences at the Boise VAMC. The goals of these interprofessional case conferences include developing a proactive approach to identify high-risk patients to improve the care of these patients and increase use of more appropriate health care resources. Other outcomes currently being studied include the impact of PACT ICU presentations on health care use, the impact on alternate health care consult patterns, and trainee participant opinions. Future directions for the interprofessional case conferences include expansion to other nonacademic primary care teams. The benefit of PACT ICU case conferences also extends to the primary care trainees as they continue to learn how to best work with other HCPs as part of a team and how to use the resources available through these other health care disciplines.
Conclusions
Presentation at an interprofessional case conference was not associated with a statistically significant change in mean A1c or BP values in a small group of high-risk patients at the Boise VAMC PACT academic clinic. Although there was a trend toward a decrease in A1c values, it is difficult to determine whether there is a relation to the interprofessional case conferences. Interprofessional case conferences are still occurring at the Boise VAMC with efforts in place to incorporate concurrent PACT ICU outcomes data collection and further the educational goals of primary care trainees.
Acknowledgments
The authors would like to express their appreciation to Rick Tivis, MPH, and Tim Gordon, MA, MPH, MS, for their assistance in the analysis and collection of data for this study.
1. Thorpe KE, Ogden LL, Galactionova K. Chronic conditions account for rise in Medicare spending from 1987 to 2006. Health Aff (Millwood). 2010;29(4):718-724.
2. Naessens JM, Baird MA, Van Houten HK, Vanness DJ, Campbell CR. Predicting persistently high primary care use. Ann Fam Med. 2005;3(4):324-330.
3. Katon W, Russo J, Lin EH, et al. Cost-effectiveness of a multicondition collaborative care intervention: a randomized controlled trial. Arch Gen Psychiatry. 2012;69(5):506-514.
4. Katon WJ, Lin EH, Von Korff M, et al. Collaborative care for patients with depression and chronic illnesses. N Engl J Med. 2010;363(27):2611-2620.
5. Janson SL, Cooke M, McGrath K, Kroon LA, Robinson S, Baron RB. Improving chronic care of type 2 diabetes using teams of interprofessional learners. Acad Med. 2009;84 (11):1540-1548.
6. Lamb KD, Baker JW, McFarland MS. Implementation of a pharmacotherapy clinic into the patient centered medical home model by a second year pharmacy resident. Am J Health Syst Pharm. 2015;72(17)(suppl 2):S83-S89.
7. Chisholm-Burns MA, Kim Lee J, Spivey CA, et al. US pharmacists' effect as team members on patient care: systematic review and meta-analyses. Med Care. 2010;48(10):923-933.
8. Gilman SC, Chokshi DA, Bowen JL, Rugen KW, Cox M. Connecting the dots: interprofessional health education and delivery system redesign at the Veterans Health Administration. Acad Med. 2014;89(8):1113-1116.
9. Department of Veteran Affairs, Department of Defense. VA/DoD clinical practice guideline for the management of diabetes mellitus (DM). Department of Veteran Affairs Website. http://www.healthquality.va.gov/guidelines/CD/diabetes/DM2010_FUL-v4e.pdf. Published August 2010. Accessed January 19, 2016.
10. American Diabetes Association. Standards of medical care in diabetes-2014. Diabetes Care. 2014;37(suppl 1):S14-S80.
11. James PA, Oparil S, Carter BL, et al. 2014 evidence-based guideline for the management of high blood pressure in adults: report from the panel members appointed to the Eighth Joint National Committee (JNC 8). JAMA. 2014;311(5):507-520.
Promoting Mobility and Reducing LOS
Annually, more than 35 million patients are hospitalized in the United States, with many experiencing hospital‐acquired impairments in physical functioning during their in‐patient stay.[1, 2, 3, 4] Such impairments include difficulties performing basic activities of daily living, such as rising from a chair, toileting, or ambulating. This functional decline may result in increased length of stay (LOS), nursing home placement, and decreased mobility and participation in community activities even years after hospitalization.[1, 2, 3, 5, 6, 7] Ameliorating this hospital‐acquired functional impairment is important to improving patient outcomes and reducing healthcare utilization. Even the sickest hospitalized patients (eg, those in the intensive care unit [ICU]), can safely and feasibly benefit from early mobilization.[6, 8, 9, 10, 11] In the non‐ICU setting there is also evidence that patient mobilization reduces LOS and hospital costs, while improving patient satisfaction and physical and psychological outcomes.[12, 13, 14, 15, 16] These studies are, however, difficult to replicate as part of routine clinical care, because they often do not present the details of how early mobility was incorporated into daily practice, require additional hospital resources (eg, specially trained providers or additional staff), or are focused only on a select patient population.
The Johns Hopkins medical ICU started early rehabilitation quality‐improvement (QI) work in 2007, which has demonstrated ongoing reductions in LOS and been transformative in terms of helping to foster a culture of mobility at our institution. Previous research suggests that ICU‐based rehabilitation interventions are often not carried over to the ward setting, even in post‐ICU patients.[17] Moreover, trends for sicker patients being admitted in our general medicine units,[18] growing reports of patients spending most of their time in bed,[2, 19, 20] and healthcare policies emphasizing the importance of improving inpatient outcomes motivated the need for QI to improve patient mobility in this setting. Experience from the medical ICU‐based early rehabilitation program helped drive multidisciplinary collaboration of stakeholders to develop this nurse‐driven, mobility promotion QI project on 2 general medicine hospital units. The main goals of the project were to see whether a QI framework can be used in a general medicine setting to increase patient mobility and reduce LOS.[21, 22]
METHODS
Overview of Project
Mobility, for this project, was defined as a patient getting out of bed (eg, sitting out of bed, toileting at bedside commode or bathroom, standing, and ambulating). We aimed to increase patient mobility using preexisting unit staffing ratios of clinicians and support staff. This project was reported in accordance with the SQUIRE (Standards for QUality Improvement Reporting Excellence) guidelines and used a structured QI model that had been used to successfully promote early mobility in the intensive care unit.[21, 23, 24, 25] The planning phase of the QI project began in spring 2012, with initiation of the 12‐month project on March 1, 2013. During the 12‐month QI period, prospective collection of mobility status occurred for all patients, with no exclusions based on patient characteristics.
Setting
The QI project setting was 2, 24‐bed, general medicine units at the Johns Hopkins Hospital, a large academic medical center located in Baltimore, Maryland.
QI Process
The primary goals of the QI project were to mobilize patients 3 times daily, quantify and document the mobility of the patients, set daily goals to increase mobility (eg, move up 1 step on the scale today), and standardize the description of patient mobility across all hospital staff. We used a structured QI model that that has been used to implement an early mobility program in a medical ICU at our institution[21, 22, 24] (see Supporting Information, Appendix, in the online version of this article). At a programmatic level, we involved key stakeholders (nurses, physicians, rehabilitation therapists, administrators) in the QI project team, we identified local barriers to implementation through team meetings as well as a survey tool to identify perceived barriers,[26] and we developed a scale (the Johns Hopkins Highest Level of Mobility [JH‐HLM]) to document mobility. The JH‐HLM is an 8‐point ordinal scale that captures mobility milestones, where 1 = only lying, 2 = bed activities, 3 = sit at edge of bed, 4 = transfer to chair/commode, 5 = standing for 1 minute, 6 = walking 10+ steps, 7 = walking 25+ feet, and 8 = walking 250+ feet (see Supporting Information, Appendix and Supporting Figure 1, in the online version of this article for additional information on the JH‐HLM scale).
The 12‐month QI project was characterized by several phases and milestones and involved a number of intervention components. During the first 4 months (ramp‐up phase), nurses received education in the form of unit‐based presentations, hands‐on‐training, and online education modules. On a 5‐times weekly basis, nurses met with rehabilitation therapists for unit‐based huddles to discuss baseline patient mobility, current patient mobility levels, barriers to mobilizing patients, and daily goals to progress mobility. Mobility levels were included on daily nursing report sheets to facilitate communication with subsequent shifts. Discussion of JH‐HLM scores also occurred during daily unit‐based care‐coordination meetings of the nurses, physicians, and social‐workers to address barriers to mobilizing patients, such as optimizing pain control, facilitating discharge location planning, and expediting physician consultation with physical and occupational therapy for appropriate patients. Audit and feedback from huddles and care‐coordination rounds resulted in improved nurse attendance and engagement during these meetings. Nurses were expected to document patient mobility scores using the JH‐HLM 3 times daily in the patient medical record. On the fourth month, reports on JH‐HLM scores and documentation compliance were available to nurse managers, champions, and unit staff. Via twice‐monthly meetings with the units and quarterly meetings with hospital leadership and administration, problems arising during the QI intervention were evaluated and resolved on a timely basis. Seven months after project execution started, educational sessions were repeated to all staff, and feedback was provided based on the data collected, such as documentation compliance rates and patient mobility levels, and nurse champions presented the project during an American Nurses Credentialing Center magnet recognition program visit. Lastly, mobility scores and documentation compliance were continually assessed for 4 months after the project completion to determine sustainability of the intervention. Additional details of the QI project implementation are provided in the Supporting Information, Appendix, in the online version of this article.
Data Sources and Covariates for Project Evaluation
The Sunrise Clinical Manager system (Allscripts Healthcare Solutions Inc., Chicago, IL) was used to document and extract nursing‐documented JH‐HLM scores. The Johns Hopkins Hospital Datamart financial database, used for mandatory reporting to the State of Maryland, provided data on LOS, age, sex, race (white, black, other), payer (Medicare, Medicaid, other), primary admission diagnosis, and comorbidity index using Agency for Healthcare Research and Quality (AHRQ) methodology.[27] Expected LOS was calculated using the risk adjustment method developed by the University Health System Consortium (UHC).[28] This calculation uses a combination of the Diagnostic‐Related Group grouper and the Sachs Complication Profiler[29] in conjunction with data on specific patient characteristics (age, sex, urgency of admission, payer category) to construct risk‐adjustment regression models that assign expected values for LOS, and is not based on actual LOS.[28] The databases were linked at the patient level using the patient's medical record and unique admission record number.
Outcome Measures
Two functional outcome measures were based on daily JH‐HLM scores, which frequently occurred several times on each patient‐day: (1) the maximum daily JH‐HLM scores for each patient‐day during hospitalization, and (2) the intrapatient change in JH‐HLM scores between the maximum JH‐HLM score within 24 hours of hospital admission and 24 hours before discharge for all patients who were on the unit >48 hours. We also compared the mean LOS during the 12‐month QI project versus the 12‐months prior so we could more accurately address seasonal differences.[30, 31, 32, 33, 34, 35] Lastly, because the perception of increased falls was an important barrier to address in the QI process, we compared the rate of injurious falls between the QI period and 12‐months prior.
Statistical Analysis
To evaluate changes in the percent of ambulatory patients (JH‐HLM 6), we compared the initial 4 months of the QI project (ramp‐up phase) with the same 4‐month period occurring immediately after project completion (post‐QI phase) using generalized estimating equations to account for clustering at the patient‐level. This test was also used to evaluate changes in documentation compliance rates between the 2 phases, with compliance defined as at least 1 instance of JH‐HLM documentation per day, excluding the day of admission and discharge. To evaluate if improved JH‐HLM results were driven by improved documentation compliance rates over time, we performed a sensitivity analysis by imputing a JH‐HLM score of 6 (ambulate 10+ steps) for any missing daily maximum JH‐HLM scores.
To assess unadjusted changes in LOS during the 12‐month QI project versus the same period 1 year earlier, we compared mean and median LOS using a t test and Wilcoxon rank sum test, respectively. We used a multivariable linear regression model to estimate the change (expressed in days) in adjusted median LOS comparing the project months (March 2013March 2014) with 12 months prior (March 2012March 2013). The model adjusted for age, gender, race, payer, admission diagnostic category, UHC expected LOS, and AHRQ comorbidity index. We confirmed a lack of multicollinearity in the multivariable regression model using variance inflation factors. We evaluated residual versus predicted value plots and residual versus fitted value plots with a locally weighted scatterplot smoothing line to confirm model fit. P values are reported from the test of the null hypothesis that the change in adjusted median LOS is the same comparing the QI project months versus 12 months prior. Separate models estimated and tested the change in adjusted median LOS by tertiles of expected LOS (<4, 47, and >7 days). Lastly, we compared the rate of injurious falls (the number of injurious falls by total patient‐days) between the QI period and 12 months prior using an exact Poisson method.[36] Statistical significance was defined as a 2‐sided P < 0.05. Statistical analyses were conducted using R (version 3.1.0; The R Foundation for Statistical Computing, Vienna, Austria;
RESULTS
During the QI project period, 3352 patients were admitted to the 2 general medicine units. Twelve (0.4%) patients expired on the units, but their data were retained in the analysis. Mean (standard deviation [SD]) age of the patients was 54.4 (18.3) years, with 47% male, and 54% African American. A total of 1896 of 6654 (28%) patients on the QI units were 65 years old. Patient characteristics were similar during the QI period versus 12 months prior (Table 1).
| Characteristics | Comparison Period, March 2012March 2013, N = 3,302 | QI Period, March 2013March 2014, N = 3,352 |
|---|---|---|
| ||
| Age, y | 53.3 (17.8) | 54.4 (18.3) |
| Male | 1467 (44%) | 1569 (47%) |
| Race | ||
| African American | 1883 (57%) | 1809 (54%) |
| Caucasian | 1269 (38%) | 1348 (40%) |
| Other | 150 (5%) | 195 (6%) |
| Payer | ||
| Medicare | 1310 (40%) | 1470 (44%) |
| Medicaid | 1015 (31%) | 925 (28%) |
| Other | 977 (30%) | 957 (29%) |
| Admission diagnostic category | ||
| Infectious disease | 579 (18%) | 629 (19%) |
| Pulmonary | 519 (16%) | 559 (17%) |
| Gastrointestinal | 535 (16%) | 494 (15%) |
| Cardiovascular | 410 (12%) | 405 (12%) |
| Hematologic | 199 (6%) | 195 (6%) |
| Renal | 220 (7%) | 205 (6%) |
| Other | 840 (25%) | 865 (26%) |
| UHC expected length of stay, d | 5.5 (3.3) | 5.3 (3.2) |
| AHRQ comorbidity index | 3.3 (1.7) | 3.5 (1.8) |
During the 12‐month QI project, there were a total of 13,815 patient‐days of documented mobility data and the median (interquartile range [IQR]) number of days of documentation for each hospital admission was 3 (25) days. Compliance with daily documentation of JH‐HLM was 85.0% over the entire 12‐month QI project. Documentation compliance started at 83% during the ramp‐up phase and increased to 89% during the last 4 months of the project (late‐QI phase, P < 0.001).
Comparing the ramp‐up phase versus post‐QI phase, the percentage of patient‐days in which patients ambulated (JH‐HLM 6) increased from 43% to 70% (P < 0.001), and the percentage of patients who experienced an improvement in their mobility scores between admission and discharge increased from 32% to 45% (P < 0.001), as shown in Table 2. In the sensitivity analysis imputing missing daily JH‐HLM scores and comparing the ramp‐up versus post‐QI phases, the results were similar to the primary analysis; the percent of patient‐days where patients ambulated increased from 60% to 78% (P < 0.001), and the percent of patients who experienced an improvement in their mobility scores increased from 26% to 48% (P < 0.001).
| JH‐HLM Category | Ramp‐up Phase, March 1, 2013 June 30, 2013, n = 4,649 | Late‐QI Phase, November 1, 2013February 28, 2013, n = 4,515 | Post‐QI Phase, March 1, 2014 June 30, 2014, n = 4,298 |
|---|---|---|---|
| Change in Mobility (Admission Versus Discharge) | Ramp‐up Phase, March 1, 2013June 30, 2013, n = 968 | Late‐QI Phase, November 1, 2013February 28, 2013, n = 893 | Post‐QI Phase, March 1, 2014 June 30, 2014, n = 834 |
| |||
| Walk (JH‐HLM = 6, 7, or 8) | 1,994 (43) | 3,430 (76) | 2,986 (70) |
| Stand/chair (JH‐HLM = 4 or 5) | 1,772 (38) | 488 (10) | 511 (12) |
| Bed (JH‐HLM = 1, 2, or 3) | 883 (19) | 597 (13) | 801 (19) |
| Improved | 305 (32) | 392 (44) | 379 (45) |
| No change | 512 (53) | 428 (48) | 386 (46) |
| Declined | 151 (16) | 73 (8) | 69 (8) |
LOS during the 12‐month QI project versus the 12‐months immediately prior was shorter (Table 3), with an unadjusted median (IQR) LOS of 3 (26) versus 4 (27) days (P < 0.001) and an unadjusted mean (SD) LOS of 5.1 (5.6) versus 6.0 (7.6) (P < 0.001).
Adjusted Median LOS, d | Absolute Change in Adjusted Median LOS (95% CI), d | P Value | ||
|---|---|---|---|---|
| 12 Months Prior | QI Project Months | |||
| ||||
| All patients | 6.01 | 5.61 | 0.40 (0.57 to 0.21), N = 4,411 | <0.001 |
| Subgroups by ELOS | ||||
| ELOS <4 days | 4.68 | 4.77 | 0.09 (0.13 to 0.32), N = 1,357 | 0.42 |
| ELOS 47 days | 5.68 | 5.38 | 0.30 (0.57 to 0.01), N = 1,509 | 0.04 |
| ELOS >7 days | 8.07 | 6.96 | 1.11 (1.53 to 0.65), N = 1,545 | <0.001 |
Table 3 displays the change in adjusted median LOS for the project months versus the 12 months prior among the QI units. We found that for all patients, there was an overall reduction in adjusted median LOS of 0.40 (95% confidence interval [CI]: 0.57 to 0.21, P<0.001) days. When we divided patients into tertiles based on their UHC expected LOS (ELOS), we observed that patients with longer ELOS had greater reductions in adjusted median LOS. Patients on the QI units with ELOS <4 days (lowest tertile) did not show a significant reduction in adjusted median LOS (0.09 days, 95% CI: 0.13 to 0.32, P = 0.42); however, patients with UHC ELOS 4 to 7 days (middle tertile) and ELOS >7 days (highest tertile) had a significant reduction in adjusted median LOS by 0.30 (95% CI: 0.57 to 0.01, P = 0.04) and 1.11 (95% CI: 1.53 to 0.65, P < 0.001) days during the QI project versus 12 months prior, respectively.
Lastly, we found that there was no difference in the rate of injurious falls on the QI units during QI period compared to 12 months prior (QI: 0.34 per 1000 patient‐days versus 12 months prior: 0.48 per 1000 patient‐days, P = 0.73).
DISCUSSION
We conducted a nurse‐driven, multidisciplinary mobility promotion QI project on 2 general medicine units at a large teaching hospital. The 12‐month QI project, conducted between March 1, 2013 and February 28, 2014, was associated with patients ambulating more frequently, with improved mobility status between hospital admission and discharge. These improvements in mobility were not associated with increased rates of injurious falls, and were sustained for at least 4 months after project completion. The QI project was associated with overall significant reduction in LOS for more complex patients with longer expected LOS (4 days or longer). Hence, such QI efforts may be important for maintaining or improving patients' functional status during hospitalization in a safe and cost‐effective manner.
Our findings are consistent with previous studies showing that mobility promotion in the acute hospital setting is feasible, can reduce length of stay, and can be applied to a diverse population including vulnerable medical patients with multiple comorbidities and the elderly.[12, 16, 37, 38, 39, 40, 41, 42] These studies provide valuable evidence of the benefits of mobility promotion; however, it is difficult to translate these prior results into routine clinical practice because they used specially trained staff to mobilize patients, focused on a select patient population, or did not specify how the mobility intervention was delivered within daily clinical workflows. Research in the medical ICU at our institution has previously described the use of a structured QI model to successfully implement an early rehabilitation program.[22, 24] Here, we successfully adapted the same QI framework to a general medicine setting. Hence, our study contributes to the literature with respect to (1) use of a structured QI framework to develop a successful patient mobility program in a general medicine patient population, and (2) sharing best practices from 1 clinical setting, such as the ICU, as a source of learning and knowledge translation for other care settings, with the addition of novel tools, such as the JH‐HLM scale.
There may have been several factors that contributed to shorter stays in the hospital we observed during the QI project. First, we increased the number of ambulatory patient‐days, which may have helped prevent physiological complications of bed rest, such as muscle weakness, atelectasis, insulin resistance, vascular dysfunction, contractures, and pressure ulcers.[43] As such, mobility promotion has been associated with reduced rates of other hospital‐acquired complications, such as deep venous thrombosis, pneumonia, and delirium.[44, 45, 46] In our study, we saw the greatest LOS reduction in more complex patients who were expected to spend a longer time in the hospital and are at greater risk of developing complications from bed rest. Second, our early mobility project may have had a direct impact on care‐coordination processes as reported in prior studies.[47, 48, 49] An important component of our intervention was incorporating functional status into multidisciplinary discussions, either through nurse‐to‐therapist huddles or care‐coordination rounds between nurses, therapists, physicians, social workers, and case managers. During care‐coordination rounds, JH‐HLM scores were reported to expedite appropriate physical and occupational therapy consultations and assist in determining appropriate discharge location. During the QI project, we transitioned from a unit‐based daily huddle between nursing and rehabilitation therapists to a system where mobility status was discussed primarily during care coordination rounds 5 times per week. We saw that mobility scores were maintained after QI project completion, suggesting that reporting on patient function in a multidisciplinary setting is a potentially sustainable mechanism to improve care‐coordination processes that are affected by functional status.
Our study has several potential limitations. First, this is a single‐site study in 2 general medicine units of a large academic hospital. Further research is needed to determine if this structured QI intervention and its benefits can be generalized to different settings and different patient populations. Second, because the documentation was initially an optional element in the electronic medical record system, we observed higher rates of missing documentation during the first 4 months of the project versus the comparison period at 4 months after project completion. However, a sensitivity analysis conducted of these missing data demonstrated similar results to our primary analysis. Third, our nonrandomized pre‐post study design does not allow us to conclude a direct cause‐and‐effect relationship between our intervention and increased mobility and reduced LOS. Although patient characteristics were similar between the 2 periods and adjusted for in our multivariable regression analysis, we cannot rule out the possibility of secular trends in LOS on the project units and that broader QI efforts at our institution also contributed to reduction in LOS. Fourth, we do not have data on 30‐day readmissions and discharge location. Future studies should explore the impact of hospital‐based mobility interventions on these outcomes.[50] Fifth, although nurses consistently documented the highest level of mobility on a daily basis, these data did not capture other potentially important information about patient mobility such as the daily frequency that patients were mobilized, the length of time a patient was engaged in a mobility event (ie, number of hours sitting in a chair), or the mobility that occurred during physical therapy or occupational therapy sessions. Hence, although we used JH‐HLM as a marker of improved mobility during our QI project it is likely that our data cannot fully describe the total mobility and activity that patients experienced during hospitalization. Lastly, although the front‐line staff and QI team found the JH‐HLM scale to be a useful tool to measure and advance patient mobility, further studies are needed to evaluate the reliability and validity of this scale.
CONCLUSION
A structured QI process can improve patient mobility and may contribute to reduction in LOS, particularly for more complex patients in this setting. Active prevention of decline in physical function that commonly occurs during hospitalization may prove valuable for improving patient outcomes and reducing healthcare resource utilization.
Disclosures
The authors certify that no party having a direct interest in the results of the research supporting this article has or will confer a benefit on us or on any organization with which we are associated. The authors report no conflicts of interest.
- , , , et al. Loss of independence in activities of daily living in older adults hospitalized with medical illnesses: increased vulnerability with age. J Am Geriatr Soc. 2003;51(4):451–458.
- , , . Prevalence and outcomes of low mobility in hospitalized older patients. J Am Geriatr Soc. 2004;52(8):1263–1270.
- , , , , , . Trajectories of life‐space mobility after hospitalization. Ann Intern Med. 2009;150(6):372–378.
- , , . Hospitalization‐associated disability: “She was probably able to ambulate, but I'm not sure”. JAMA. 2011;306(16):1782–1793.
- , , , , , . Physical fitness and all‐cause mortality. A prospective study of healthy men and women. JAMA. 1989;262(17):2395–2401.
- . Mobilizing patients in the intensive care unit: improving neuromuscular weakness and physical function. JAMA. 2008;300(14):1685–1690.
- , . Mobility limitation in the older patient: a clinical review. JAMA. 2013;310(11):1168–1177.
- , , , et al. Early physical and occupational therapy in mechanically ventilated, critically ill patients: a randomised controlled trial. Lancet. 2009;373(9678):1874–1882.
- , , . Technology to enhance physical rehabilitation of critically ill patients. Crit Care Med. 2009;37(10 suppl):S436–S441.
- , , , et al. Receiving early mobility during an intensive care unit admission is a predictor of improved outcomes in acute respiratory failure. Am J Med Sci. 2011;341(5):373–377.
- . Physiotherapy in intensive care: an updated systematic review. Chest. 2013;144(3):825–847.
- , , . Exercise for acutely hospitalised older medical patients. Cochrane Database Syst Rev. 2007;(1):CD005955.
- , , . Extra physical therapy reduces patient length of stay and improves functional outcomes and quality of life in people with acute or subacute conditions: a systematic review. Arch Phys Med Rehabil. 2011;92(9):1490–1500.
- , . Impact of early mobilization protocol on the medical‐surgical inpatient population: an integrated review of literature. Clin Nurse Spec. 2012;26(2):87–94.
- , , . Outcomes of inpatient mobilization: a literature review. J Clin Nurs. 2014;23(11–12):1486–1501.
- , , , et al. The early mobility bundle: a simple enhancement of therapy which may reduce incidence of hospital‐acquired pneumonia and length of hospital stay. J Hosp Infect. 2014;88(1):34–39.
- , , , , . Physical therapy on the wards after early physical activity and mobility in the intensive care unit. Phys Ther. 2012;92(12):1518–1523.
- , , , . Impact of hospital variables on case mix index as a marker of disease severity. Popul Health Manag. 2014;17(1):28–34.
- , , , , . Frequency of hallway ambulation by hospitalized older adults on medical units of an academic hospital. Geriatr Nurs. 2004;25(4):212–217.
- , , . Activity level of hospital medical inpatients: an observational study. Arch Gerontol Geriatr. 2012;55(2):417–421.
- , , . Translating evidence into practice: a model for large scale knowledge translation. BMJ. 2008;337:a1714.
- , , , et al. Early physical medicine and rehabilitation for patients with acute respiratory failure: a quality improvement project. Arch Phys Med Rehabil. 2010;91(4):536–542.
- , , , , ; SQUIRE development group. Publication guidelines for quality improvement studies in health care: evolution of the SQUIRE project. BMJ. 2009;338:a3152.
- , . Rehabilitation quality improvement in an intensive care unit setting: implementation of a quality improvement model. Top Stroke Rehabil. 2010;17(4):271–281.
- , , , . ICU early mobilization: from recommendation to implementation at three medical centers. Crit Care Med. 2013;41(9 suppl 1):S69–S80.
- , , , . Barriers to early mobility of hospitalized general medicine patients: survey development and results. Am J Phys Med Rehabil. 2015;94(4):304–312.
- , , , . Comorbidity measures for use with administrative data. Med Care. 1998;36(1):8–27.
- UHC Clinical Information Management Risk Adjustment of the UHC Clinical Data Base. Chicago, IL: University HealthSystem Consortium; 1998.
- Sachs Complications Profiler, Version 1.0, User's Guide. Evanston, IL: Sachs Group; 1995.
- , , . Assessing hospital‐associated deaths from discharge data. The role of length of stay and comorbidities. JAMA. 1988;260(15):2240–2246.
- , , , et al. Annual rates of admission and seasonal variations in hospitalizations for heart failure. Eur J Heart Fail. 2002;4(6):779–786.
- , , , . Regional and seasonal variation in the length of hospital stay for chronic obstructive pulmonary disease in Finland. Int J Circumpolar Health. 2002;61(2):131–135.
- , , , , , ; Canadian CABG Surgery Quality Indicator Consensus Panel. The identification and development of canadian coronary artery bypass graft surgery quality indicators. J Thorac Cardiovasc Surg. 2005;130(5):1257.
- , , , . Quality of care and length of hospital stay among patients with stroke. Med Care. 2009;47(5):575–582.
- . A systematic review of outcomes and quality measures in adult patients cared for by hospitalists vs nonhospitalists. Mayo Clin Proc. 2009;84(3):248–254.
- . Confidence intervals that match Fisher's exact or Blaker's exact tests. Biostatistics. 2010;11(2):373–374.
- , , , et al. A multicomponent intervention to prevent delirium in hospitalized older patients. N Engl J Med. 1999;340(9):669–676.
- , , , , . Early mobilization of patients hospitalized with community‐acquired pneumonia. Chest. 2003;124(3):883–889.
- , , , et al. Effects of a walking intervention on fatigue‐related experiences of hospitalized acute myelogenous leukemia patients undergoing chemotherapy: a randomized controlled trial. J Pain Symptom Manage. 2008;35(5):524–534.
- , , , , . Early ambulation and length of stay in older adults hospitalized for acute illness. Arch Intern Med. 2010;170(21):1942–1943.
- , , . Impact of a nurse‐driven mobility protocol on functional decline in hospitalized older adults. J Nurs Care Qual. 2009;24(4):325–331.
- , , . Exercising body and mind: an integrated approach to functional independence in hospitalized older people. J Am Geriatr Soc. 2008;56(4):630–635.
- . Consequences of bed rest. Crit Care Med. 2009;37(10 suppl):S422–S428.
- , , , , . Time to ambulation after hip fracture surgery: relation to hospitalization outcomes. J Gerontol A Biol Sci Med Sci. 2003;58(11):M1042–M1045.
- , , , . Early mobilization after total knee replacement reduces the incidence of deep venous thrombosis. ANZ J Surg. 2009;79(7–8):526–529.
- , , , . Efficacy and safety of postoperative early mobilization for chronic subdural hematoma in elderly patients. Acta Neurochir (Wien). 2010;152(7):1171–1174.
- , , , et al. Impact of relational coordination on quality of care, postoperative pain and functioning, and length of stay: a nine‐hospital study of surgical patients. Med Care. 2000;38(8):807–819.
- Care coordination cuts admissions, ED visits, LOS. Hosp Case Manag. 2013;21(5):67–68.
- , . A heart failure initiative to reduce the length of stay and readmission rates. Prof Case Manag. 2014;19(6):276–284.
- , , , , , . Association of impaired functional status at hospital discharge and subsequent rehospitalization. J Hosp Med. 2014;9(5):277–282.
Annually, more than 35 million patients are hospitalized in the United States, with many experiencing hospital‐acquired impairments in physical functioning during their in‐patient stay.[1, 2, 3, 4] Such impairments include difficulties performing basic activities of daily living, such as rising from a chair, toileting, or ambulating. This functional decline may result in increased length of stay (LOS), nursing home placement, and decreased mobility and participation in community activities even years after hospitalization.[1, 2, 3, 5, 6, 7] Ameliorating this hospital‐acquired functional impairment is important to improving patient outcomes and reducing healthcare utilization. Even the sickest hospitalized patients (eg, those in the intensive care unit [ICU]), can safely and feasibly benefit from early mobilization.[6, 8, 9, 10, 11] In the non‐ICU setting there is also evidence that patient mobilization reduces LOS and hospital costs, while improving patient satisfaction and physical and psychological outcomes.[12, 13, 14, 15, 16] These studies are, however, difficult to replicate as part of routine clinical care, because they often do not present the details of how early mobility was incorporated into daily practice, require additional hospital resources (eg, specially trained providers or additional staff), or are focused only on a select patient population.
The Johns Hopkins medical ICU started early rehabilitation quality‐improvement (QI) work in 2007, which has demonstrated ongoing reductions in LOS and been transformative in terms of helping to foster a culture of mobility at our institution. Previous research suggests that ICU‐based rehabilitation interventions are often not carried over to the ward setting, even in post‐ICU patients.[17] Moreover, trends for sicker patients being admitted in our general medicine units,[18] growing reports of patients spending most of their time in bed,[2, 19, 20] and healthcare policies emphasizing the importance of improving inpatient outcomes motivated the need for QI to improve patient mobility in this setting. Experience from the medical ICU‐based early rehabilitation program helped drive multidisciplinary collaboration of stakeholders to develop this nurse‐driven, mobility promotion QI project on 2 general medicine hospital units. The main goals of the project were to see whether a QI framework can be used in a general medicine setting to increase patient mobility and reduce LOS.[21, 22]
METHODS
Overview of Project
Mobility, for this project, was defined as a patient getting out of bed (eg, sitting out of bed, toileting at bedside commode or bathroom, standing, and ambulating). We aimed to increase patient mobility using preexisting unit staffing ratios of clinicians and support staff. This project was reported in accordance with the SQUIRE (Standards for QUality Improvement Reporting Excellence) guidelines and used a structured QI model that had been used to successfully promote early mobility in the intensive care unit.[21, 23, 24, 25] The planning phase of the QI project began in spring 2012, with initiation of the 12‐month project on March 1, 2013. During the 12‐month QI period, prospective collection of mobility status occurred for all patients, with no exclusions based on patient characteristics.
Setting
The QI project setting was 2, 24‐bed, general medicine units at the Johns Hopkins Hospital, a large academic medical center located in Baltimore, Maryland.
QI Process
The primary goals of the QI project were to mobilize patients 3 times daily, quantify and document the mobility of the patients, set daily goals to increase mobility (eg, move up 1 step on the scale today), and standardize the description of patient mobility across all hospital staff. We used a structured QI model that that has been used to implement an early mobility program in a medical ICU at our institution[21, 22, 24] (see Supporting Information, Appendix, in the online version of this article). At a programmatic level, we involved key stakeholders (nurses, physicians, rehabilitation therapists, administrators) in the QI project team, we identified local barriers to implementation through team meetings as well as a survey tool to identify perceived barriers,[26] and we developed a scale (the Johns Hopkins Highest Level of Mobility [JH‐HLM]) to document mobility. The JH‐HLM is an 8‐point ordinal scale that captures mobility milestones, where 1 = only lying, 2 = bed activities, 3 = sit at edge of bed, 4 = transfer to chair/commode, 5 = standing for 1 minute, 6 = walking 10+ steps, 7 = walking 25+ feet, and 8 = walking 250+ feet (see Supporting Information, Appendix and Supporting Figure 1, in the online version of this article for additional information on the JH‐HLM scale).
The 12‐month QI project was characterized by several phases and milestones and involved a number of intervention components. During the first 4 months (ramp‐up phase), nurses received education in the form of unit‐based presentations, hands‐on‐training, and online education modules. On a 5‐times weekly basis, nurses met with rehabilitation therapists for unit‐based huddles to discuss baseline patient mobility, current patient mobility levels, barriers to mobilizing patients, and daily goals to progress mobility. Mobility levels were included on daily nursing report sheets to facilitate communication with subsequent shifts. Discussion of JH‐HLM scores also occurred during daily unit‐based care‐coordination meetings of the nurses, physicians, and social‐workers to address barriers to mobilizing patients, such as optimizing pain control, facilitating discharge location planning, and expediting physician consultation with physical and occupational therapy for appropriate patients. Audit and feedback from huddles and care‐coordination rounds resulted in improved nurse attendance and engagement during these meetings. Nurses were expected to document patient mobility scores using the JH‐HLM 3 times daily in the patient medical record. On the fourth month, reports on JH‐HLM scores and documentation compliance were available to nurse managers, champions, and unit staff. Via twice‐monthly meetings with the units and quarterly meetings with hospital leadership and administration, problems arising during the QI intervention were evaluated and resolved on a timely basis. Seven months after project execution started, educational sessions were repeated to all staff, and feedback was provided based on the data collected, such as documentation compliance rates and patient mobility levels, and nurse champions presented the project during an American Nurses Credentialing Center magnet recognition program visit. Lastly, mobility scores and documentation compliance were continually assessed for 4 months after the project completion to determine sustainability of the intervention. Additional details of the QI project implementation are provided in the Supporting Information, Appendix, in the online version of this article.
Data Sources and Covariates for Project Evaluation
The Sunrise Clinical Manager system (Allscripts Healthcare Solutions Inc., Chicago, IL) was used to document and extract nursing‐documented JH‐HLM scores. The Johns Hopkins Hospital Datamart financial database, used for mandatory reporting to the State of Maryland, provided data on LOS, age, sex, race (white, black, other), payer (Medicare, Medicaid, other), primary admission diagnosis, and comorbidity index using Agency for Healthcare Research and Quality (AHRQ) methodology.[27] Expected LOS was calculated using the risk adjustment method developed by the University Health System Consortium (UHC).[28] This calculation uses a combination of the Diagnostic‐Related Group grouper and the Sachs Complication Profiler[29] in conjunction with data on specific patient characteristics (age, sex, urgency of admission, payer category) to construct risk‐adjustment regression models that assign expected values for LOS, and is not based on actual LOS.[28] The databases were linked at the patient level using the patient's medical record and unique admission record number.
Outcome Measures
Two functional outcome measures were based on daily JH‐HLM scores, which frequently occurred several times on each patient‐day: (1) the maximum daily JH‐HLM scores for each patient‐day during hospitalization, and (2) the intrapatient change in JH‐HLM scores between the maximum JH‐HLM score within 24 hours of hospital admission and 24 hours before discharge for all patients who were on the unit >48 hours. We also compared the mean LOS during the 12‐month QI project versus the 12‐months prior so we could more accurately address seasonal differences.[30, 31, 32, 33, 34, 35] Lastly, because the perception of increased falls was an important barrier to address in the QI process, we compared the rate of injurious falls between the QI period and 12‐months prior.
Statistical Analysis
To evaluate changes in the percent of ambulatory patients (JH‐HLM 6), we compared the initial 4 months of the QI project (ramp‐up phase) with the same 4‐month period occurring immediately after project completion (post‐QI phase) using generalized estimating equations to account for clustering at the patient‐level. This test was also used to evaluate changes in documentation compliance rates between the 2 phases, with compliance defined as at least 1 instance of JH‐HLM documentation per day, excluding the day of admission and discharge. To evaluate if improved JH‐HLM results were driven by improved documentation compliance rates over time, we performed a sensitivity analysis by imputing a JH‐HLM score of 6 (ambulate 10+ steps) for any missing daily maximum JH‐HLM scores.
To assess unadjusted changes in LOS during the 12‐month QI project versus the same period 1 year earlier, we compared mean and median LOS using a t test and Wilcoxon rank sum test, respectively. We used a multivariable linear regression model to estimate the change (expressed in days) in adjusted median LOS comparing the project months (March 2013March 2014) with 12 months prior (March 2012March 2013). The model adjusted for age, gender, race, payer, admission diagnostic category, UHC expected LOS, and AHRQ comorbidity index. We confirmed a lack of multicollinearity in the multivariable regression model using variance inflation factors. We evaluated residual versus predicted value plots and residual versus fitted value plots with a locally weighted scatterplot smoothing line to confirm model fit. P values are reported from the test of the null hypothesis that the change in adjusted median LOS is the same comparing the QI project months versus 12 months prior. Separate models estimated and tested the change in adjusted median LOS by tertiles of expected LOS (<4, 47, and >7 days). Lastly, we compared the rate of injurious falls (the number of injurious falls by total patient‐days) between the QI period and 12 months prior using an exact Poisson method.[36] Statistical significance was defined as a 2‐sided P < 0.05. Statistical analyses were conducted using R (version 3.1.0; The R Foundation for Statistical Computing, Vienna, Austria;
RESULTS
During the QI project period, 3352 patients were admitted to the 2 general medicine units. Twelve (0.4%) patients expired on the units, but their data were retained in the analysis. Mean (standard deviation [SD]) age of the patients was 54.4 (18.3) years, with 47% male, and 54% African American. A total of 1896 of 6654 (28%) patients on the QI units were 65 years old. Patient characteristics were similar during the QI period versus 12 months prior (Table 1).
| Characteristics | Comparison Period, March 2012March 2013, N = 3,302 | QI Period, March 2013March 2014, N = 3,352 |
|---|---|---|
| ||
| Age, y | 53.3 (17.8) | 54.4 (18.3) |
| Male | 1467 (44%) | 1569 (47%) |
| Race | ||
| African American | 1883 (57%) | 1809 (54%) |
| Caucasian | 1269 (38%) | 1348 (40%) |
| Other | 150 (5%) | 195 (6%) |
| Payer | ||
| Medicare | 1310 (40%) | 1470 (44%) |
| Medicaid | 1015 (31%) | 925 (28%) |
| Other | 977 (30%) | 957 (29%) |
| Admission diagnostic category | ||
| Infectious disease | 579 (18%) | 629 (19%) |
| Pulmonary | 519 (16%) | 559 (17%) |
| Gastrointestinal | 535 (16%) | 494 (15%) |
| Cardiovascular | 410 (12%) | 405 (12%) |
| Hematologic | 199 (6%) | 195 (6%) |
| Renal | 220 (7%) | 205 (6%) |
| Other | 840 (25%) | 865 (26%) |
| UHC expected length of stay, d | 5.5 (3.3) | 5.3 (3.2) |
| AHRQ comorbidity index | 3.3 (1.7) | 3.5 (1.8) |
During the 12‐month QI project, there were a total of 13,815 patient‐days of documented mobility data and the median (interquartile range [IQR]) number of days of documentation for each hospital admission was 3 (25) days. Compliance with daily documentation of JH‐HLM was 85.0% over the entire 12‐month QI project. Documentation compliance started at 83% during the ramp‐up phase and increased to 89% during the last 4 months of the project (late‐QI phase, P < 0.001).
Comparing the ramp‐up phase versus post‐QI phase, the percentage of patient‐days in which patients ambulated (JH‐HLM 6) increased from 43% to 70% (P < 0.001), and the percentage of patients who experienced an improvement in their mobility scores between admission and discharge increased from 32% to 45% (P < 0.001), as shown in Table 2. In the sensitivity analysis imputing missing daily JH‐HLM scores and comparing the ramp‐up versus post‐QI phases, the results were similar to the primary analysis; the percent of patient‐days where patients ambulated increased from 60% to 78% (P < 0.001), and the percent of patients who experienced an improvement in their mobility scores increased from 26% to 48% (P < 0.001).
| JH‐HLM Category | Ramp‐up Phase, March 1, 2013 June 30, 2013, n = 4,649 | Late‐QI Phase, November 1, 2013February 28, 2013, n = 4,515 | Post‐QI Phase, March 1, 2014 June 30, 2014, n = 4,298 |
|---|---|---|---|
| Change in Mobility (Admission Versus Discharge) | Ramp‐up Phase, March 1, 2013June 30, 2013, n = 968 | Late‐QI Phase, November 1, 2013February 28, 2013, n = 893 | Post‐QI Phase, March 1, 2014 June 30, 2014, n = 834 |
| |||
| Walk (JH‐HLM = 6, 7, or 8) | 1,994 (43) | 3,430 (76) | 2,986 (70) |
| Stand/chair (JH‐HLM = 4 or 5) | 1,772 (38) | 488 (10) | 511 (12) |
| Bed (JH‐HLM = 1, 2, or 3) | 883 (19) | 597 (13) | 801 (19) |
| Improved | 305 (32) | 392 (44) | 379 (45) |
| No change | 512 (53) | 428 (48) | 386 (46) |
| Declined | 151 (16) | 73 (8) | 69 (8) |
LOS during the 12‐month QI project versus the 12‐months immediately prior was shorter (Table 3), with an unadjusted median (IQR) LOS of 3 (26) versus 4 (27) days (P < 0.001) and an unadjusted mean (SD) LOS of 5.1 (5.6) versus 6.0 (7.6) (P < 0.001).
Adjusted Median LOS, d | Absolute Change in Adjusted Median LOS (95% CI), d | P Value | ||
|---|---|---|---|---|
| 12 Months Prior | QI Project Months | |||
| ||||
| All patients | 6.01 | 5.61 | 0.40 (0.57 to 0.21), N = 4,411 | <0.001 |
| Subgroups by ELOS | ||||
| ELOS <4 days | 4.68 | 4.77 | 0.09 (0.13 to 0.32), N = 1,357 | 0.42 |
| ELOS 47 days | 5.68 | 5.38 | 0.30 (0.57 to 0.01), N = 1,509 | 0.04 |
| ELOS >7 days | 8.07 | 6.96 | 1.11 (1.53 to 0.65), N = 1,545 | <0.001 |
Table 3 displays the change in adjusted median LOS for the project months versus the 12 months prior among the QI units. We found that for all patients, there was an overall reduction in adjusted median LOS of 0.40 (95% confidence interval [CI]: 0.57 to 0.21, P<0.001) days. When we divided patients into tertiles based on their UHC expected LOS (ELOS), we observed that patients with longer ELOS had greater reductions in adjusted median LOS. Patients on the QI units with ELOS <4 days (lowest tertile) did not show a significant reduction in adjusted median LOS (0.09 days, 95% CI: 0.13 to 0.32, P = 0.42); however, patients with UHC ELOS 4 to 7 days (middle tertile) and ELOS >7 days (highest tertile) had a significant reduction in adjusted median LOS by 0.30 (95% CI: 0.57 to 0.01, P = 0.04) and 1.11 (95% CI: 1.53 to 0.65, P < 0.001) days during the QI project versus 12 months prior, respectively.
Lastly, we found that there was no difference in the rate of injurious falls on the QI units during QI period compared to 12 months prior (QI: 0.34 per 1000 patient‐days versus 12 months prior: 0.48 per 1000 patient‐days, P = 0.73).
DISCUSSION
We conducted a nurse‐driven, multidisciplinary mobility promotion QI project on 2 general medicine units at a large teaching hospital. The 12‐month QI project, conducted between March 1, 2013 and February 28, 2014, was associated with patients ambulating more frequently, with improved mobility status between hospital admission and discharge. These improvements in mobility were not associated with increased rates of injurious falls, and were sustained for at least 4 months after project completion. The QI project was associated with overall significant reduction in LOS for more complex patients with longer expected LOS (4 days or longer). Hence, such QI efforts may be important for maintaining or improving patients' functional status during hospitalization in a safe and cost‐effective manner.
Our findings are consistent with previous studies showing that mobility promotion in the acute hospital setting is feasible, can reduce length of stay, and can be applied to a diverse population including vulnerable medical patients with multiple comorbidities and the elderly.[12, 16, 37, 38, 39, 40, 41, 42] These studies provide valuable evidence of the benefits of mobility promotion; however, it is difficult to translate these prior results into routine clinical practice because they used specially trained staff to mobilize patients, focused on a select patient population, or did not specify how the mobility intervention was delivered within daily clinical workflows. Research in the medical ICU at our institution has previously described the use of a structured QI model to successfully implement an early rehabilitation program.[22, 24] Here, we successfully adapted the same QI framework to a general medicine setting. Hence, our study contributes to the literature with respect to (1) use of a structured QI framework to develop a successful patient mobility program in a general medicine patient population, and (2) sharing best practices from 1 clinical setting, such as the ICU, as a source of learning and knowledge translation for other care settings, with the addition of novel tools, such as the JH‐HLM scale.
There may have been several factors that contributed to shorter stays in the hospital we observed during the QI project. First, we increased the number of ambulatory patient‐days, which may have helped prevent physiological complications of bed rest, such as muscle weakness, atelectasis, insulin resistance, vascular dysfunction, contractures, and pressure ulcers.[43] As such, mobility promotion has been associated with reduced rates of other hospital‐acquired complications, such as deep venous thrombosis, pneumonia, and delirium.[44, 45, 46] In our study, we saw the greatest LOS reduction in more complex patients who were expected to spend a longer time in the hospital and are at greater risk of developing complications from bed rest. Second, our early mobility project may have had a direct impact on care‐coordination processes as reported in prior studies.[47, 48, 49] An important component of our intervention was incorporating functional status into multidisciplinary discussions, either through nurse‐to‐therapist huddles or care‐coordination rounds between nurses, therapists, physicians, social workers, and case managers. During care‐coordination rounds, JH‐HLM scores were reported to expedite appropriate physical and occupational therapy consultations and assist in determining appropriate discharge location. During the QI project, we transitioned from a unit‐based daily huddle between nursing and rehabilitation therapists to a system where mobility status was discussed primarily during care coordination rounds 5 times per week. We saw that mobility scores were maintained after QI project completion, suggesting that reporting on patient function in a multidisciplinary setting is a potentially sustainable mechanism to improve care‐coordination processes that are affected by functional status.
Our study has several potential limitations. First, this is a single‐site study in 2 general medicine units of a large academic hospital. Further research is needed to determine if this structured QI intervention and its benefits can be generalized to different settings and different patient populations. Second, because the documentation was initially an optional element in the electronic medical record system, we observed higher rates of missing documentation during the first 4 months of the project versus the comparison period at 4 months after project completion. However, a sensitivity analysis conducted of these missing data demonstrated similar results to our primary analysis. Third, our nonrandomized pre‐post study design does not allow us to conclude a direct cause‐and‐effect relationship between our intervention and increased mobility and reduced LOS. Although patient characteristics were similar between the 2 periods and adjusted for in our multivariable regression analysis, we cannot rule out the possibility of secular trends in LOS on the project units and that broader QI efforts at our institution also contributed to reduction in LOS. Fourth, we do not have data on 30‐day readmissions and discharge location. Future studies should explore the impact of hospital‐based mobility interventions on these outcomes.[50] Fifth, although nurses consistently documented the highest level of mobility on a daily basis, these data did not capture other potentially important information about patient mobility such as the daily frequency that patients were mobilized, the length of time a patient was engaged in a mobility event (ie, number of hours sitting in a chair), or the mobility that occurred during physical therapy or occupational therapy sessions. Hence, although we used JH‐HLM as a marker of improved mobility during our QI project it is likely that our data cannot fully describe the total mobility and activity that patients experienced during hospitalization. Lastly, although the front‐line staff and QI team found the JH‐HLM scale to be a useful tool to measure and advance patient mobility, further studies are needed to evaluate the reliability and validity of this scale.
CONCLUSION
A structured QI process can improve patient mobility and may contribute to reduction in LOS, particularly for more complex patients in this setting. Active prevention of decline in physical function that commonly occurs during hospitalization may prove valuable for improving patient outcomes and reducing healthcare resource utilization.
Disclosures
The authors certify that no party having a direct interest in the results of the research supporting this article has or will confer a benefit on us or on any organization with which we are associated. The authors report no conflicts of interest.
- , , , et al. Loss of independence in activities of daily living in older adults hospitalized with medical illnesses: increased vulnerability with age. J Am Geriatr Soc. 2003;51(4):451–458.
- , , . Prevalence and outcomes of low mobility in hospitalized older patients. J Am Geriatr Soc. 2004;52(8):1263–1270.
- , , , , , . Trajectories of life‐space mobility after hospitalization. Ann Intern Med. 2009;150(6):372–378.
- , , . Hospitalization‐associated disability: “She was probably able to ambulate, but I'm not sure”. JAMA. 2011;306(16):1782–1793.
- , , , , , . Physical fitness and all‐cause mortality. A prospective study of healthy men and women. JAMA. 1989;262(17):2395–2401.
- . Mobilizing patients in the intensive care unit: improving neuromuscular weakness and physical function. JAMA. 2008;300(14):1685–1690.
- , . Mobility limitation in the older patient: a clinical review. JAMA. 2013;310(11):1168–1177.
- , , , et al. Early physical and occupational therapy in mechanically ventilated, critically ill patients: a randomised controlled trial. Lancet. 2009;373(9678):1874–1882.
- , , . Technology to enhance physical rehabilitation of critically ill patients. Crit Care Med. 2009;37(10 suppl):S436–S441.
- , , , et al. Receiving early mobility during an intensive care unit admission is a predictor of improved outcomes in acute respiratory failure. Am J Med Sci. 2011;341(5):373–377.
- . Physiotherapy in intensive care: an updated systematic review. Chest. 2013;144(3):825–847.
- , , . Exercise for acutely hospitalised older medical patients. Cochrane Database Syst Rev. 2007;(1):CD005955.
- , , . Extra physical therapy reduces patient length of stay and improves functional outcomes and quality of life in people with acute or subacute conditions: a systematic review. Arch Phys Med Rehabil. 2011;92(9):1490–1500.
- , . Impact of early mobilization protocol on the medical‐surgical inpatient population: an integrated review of literature. Clin Nurse Spec. 2012;26(2):87–94.
- , , . Outcomes of inpatient mobilization: a literature review. J Clin Nurs. 2014;23(11–12):1486–1501.
- , , , et al. The early mobility bundle: a simple enhancement of therapy which may reduce incidence of hospital‐acquired pneumonia and length of hospital stay. J Hosp Infect. 2014;88(1):34–39.
- , , , , . Physical therapy on the wards after early physical activity and mobility in the intensive care unit. Phys Ther. 2012;92(12):1518–1523.
- , , , . Impact of hospital variables on case mix index as a marker of disease severity. Popul Health Manag. 2014;17(1):28–34.
- , , , , . Frequency of hallway ambulation by hospitalized older adults on medical units of an academic hospital. Geriatr Nurs. 2004;25(4):212–217.
- , , . Activity level of hospital medical inpatients: an observational study. Arch Gerontol Geriatr. 2012;55(2):417–421.
- , , . Translating evidence into practice: a model for large scale knowledge translation. BMJ. 2008;337:a1714.
- , , , et al. Early physical medicine and rehabilitation for patients with acute respiratory failure: a quality improvement project. Arch Phys Med Rehabil. 2010;91(4):536–542.
- , , , , ; SQUIRE development group. Publication guidelines for quality improvement studies in health care: evolution of the SQUIRE project. BMJ. 2009;338:a3152.
- , . Rehabilitation quality improvement in an intensive care unit setting: implementation of a quality improvement model. Top Stroke Rehabil. 2010;17(4):271–281.
- , , , . ICU early mobilization: from recommendation to implementation at three medical centers. Crit Care Med. 2013;41(9 suppl 1):S69–S80.
- , , , . Barriers to early mobility of hospitalized general medicine patients: survey development and results. Am J Phys Med Rehabil. 2015;94(4):304–312.
- , , , . Comorbidity measures for use with administrative data. Med Care. 1998;36(1):8–27.
- UHC Clinical Information Management Risk Adjustment of the UHC Clinical Data Base. Chicago, IL: University HealthSystem Consortium; 1998.
- Sachs Complications Profiler, Version 1.0, User's Guide. Evanston, IL: Sachs Group; 1995.
- , , . Assessing hospital‐associated deaths from discharge data. The role of length of stay and comorbidities. JAMA. 1988;260(15):2240–2246.
- , , , et al. Annual rates of admission and seasonal variations in hospitalizations for heart failure. Eur J Heart Fail. 2002;4(6):779–786.
- , , , . Regional and seasonal variation in the length of hospital stay for chronic obstructive pulmonary disease in Finland. Int J Circumpolar Health. 2002;61(2):131–135.
- , , , , , ; Canadian CABG Surgery Quality Indicator Consensus Panel. The identification and development of canadian coronary artery bypass graft surgery quality indicators. J Thorac Cardiovasc Surg. 2005;130(5):1257.
- , , , . Quality of care and length of hospital stay among patients with stroke. Med Care. 2009;47(5):575–582.
- . A systematic review of outcomes and quality measures in adult patients cared for by hospitalists vs nonhospitalists. Mayo Clin Proc. 2009;84(3):248–254.
- . Confidence intervals that match Fisher's exact or Blaker's exact tests. Biostatistics. 2010;11(2):373–374.
- , , , et al. A multicomponent intervention to prevent delirium in hospitalized older patients. N Engl J Med. 1999;340(9):669–676.
- , , , , . Early mobilization of patients hospitalized with community‐acquired pneumonia. Chest. 2003;124(3):883–889.
- , , , et al. Effects of a walking intervention on fatigue‐related experiences of hospitalized acute myelogenous leukemia patients undergoing chemotherapy: a randomized controlled trial. J Pain Symptom Manage. 2008;35(5):524–534.
- , , , , . Early ambulation and length of stay in older adults hospitalized for acute illness. Arch Intern Med. 2010;170(21):1942–1943.
- , , . Impact of a nurse‐driven mobility protocol on functional decline in hospitalized older adults. J Nurs Care Qual. 2009;24(4):325–331.
- , , . Exercising body and mind: an integrated approach to functional independence in hospitalized older people. J Am Geriatr Soc. 2008;56(4):630–635.
- . Consequences of bed rest. Crit Care Med. 2009;37(10 suppl):S422–S428.
- , , , , . Time to ambulation after hip fracture surgery: relation to hospitalization outcomes. J Gerontol A Biol Sci Med Sci. 2003;58(11):M1042–M1045.
- , , , . Early mobilization after total knee replacement reduces the incidence of deep venous thrombosis. ANZ J Surg. 2009;79(7–8):526–529.
- , , , . Efficacy and safety of postoperative early mobilization for chronic subdural hematoma in elderly patients. Acta Neurochir (Wien). 2010;152(7):1171–1174.
- , , , et al. Impact of relational coordination on quality of care, postoperative pain and functioning, and length of stay: a nine‐hospital study of surgical patients. Med Care. 2000;38(8):807–819.
- Care coordination cuts admissions, ED visits, LOS. Hosp Case Manag. 2013;21(5):67–68.
- , . A heart failure initiative to reduce the length of stay and readmission rates. Prof Case Manag. 2014;19(6):276–284.
- , , , , , . Association of impaired functional status at hospital discharge and subsequent rehospitalization. J Hosp Med. 2014;9(5):277–282.
© 2016 Society of Hospital Medicine
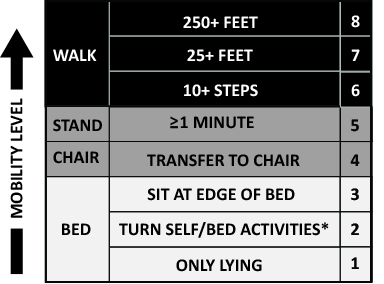
Multifaceted Intervention Reduces Cost
Healthcare costs continue to increase and are estimated to be approximately $3.1 trillion per year in the United States.[1] Waste is a major contributor to this cost, accounting for an estimated $910 billion/year.[2] Laboratory tests are well documented to contribute to healthcare waste, with an estimated 30% to 50% of tests for hospitalized patients being unnecessary.[3, 4, 5] This issue has been highlighted by the American Board of Internal Medicine Foundation's Choosing Wisely campaign as an area to reduce waste.[6] Evaluating this concern locally, a University Health Systems Consortium 2011 analysis indicated that the University of Utah general internal medicine hospitalist service had a higher average direct lab cost per discharge compared to top performers, indicating an opportunity for improvement.
Multiple interventions have been described in the literature to address excessive laboratory utilization, including physician education, audit and feedback, cost information display, and administrative rules restricting certain types of ordering.[7, 8, 9, 10, 11] Despite these interventions, barriers remain common and not all interventions are sustained. For example, interventions focused mainly on education see a small improvement initially that is not sustained.[4, 12, 13] Additionally, although most studies focus on individual interventions, those that target multiple factors have been found to be more successful at producing and sustaining change.[14] Therefore, the opportunity existed to incorporate multiple etiologies into a single intervention and apply a checklist to laboratory ordering to see if combined modalities could be effective at reducing laboratory costs in a sustainable manner.
In addition to cost, there is potential patient harm resulting from unnecessary laboratory testing. For prolonged hospitalizations, anemia is a well‐recognized side effect of phlebotomy,[15, 16] and a recent evaluation of cardiac surgery patients found an average cumulative blood loss due to phlebotomy of 454 mL/hospital stay.[17] The sheer number of tests ordered can lead to false positive tests that result in additional testing and monitoring. Furthermore, patients subjected to laboratory blood draws are often awakened early in the morning, which is unpleasant and could adversely affect the patient experience.
Recognizing laboratory cost as a problem, the University of Utah general internal medicine hospitalist service implemented a multifaceted quality‐improvement initiative with a goal to reduce laboratory testing. At the time of this project, University of Utah Health Care (UUHC) developed a Value Driven Outcomes (VDO) tool to give direct data related to costs of care, including the actual cost paid by the hospital to the university‐owned laboratory vendor (ARUP Laboratories, Salt Lake City, UT) for testing.[18] The hospitalist group incorporated VDO into the initiative for routine cost feedback. This study evaluates the impact of this intervention on laboratory costs.
METHODS
Design
A retrospective, controlled, interrupted time series (ITS) study was performed to compare changes in lab costs between hospitalists (intervention study group) and other providers (control study group). The intervention initiation date was February 1, 2013. The baseline period was July 1, 2012 to January 31, 2013, as that was the period in which the VDO tool became available for cost analysis prior to intervention. The intervention period was February 1, 2013 to April 30, 2014, as there was a change in the electronic health record (EHR) in May 2014 that affected data flow and could act as a major confounder. The institutional review board classified this project as quality improvement and did not require review and oversight.
Setting
UUHC is a 500‐bed academic medical center in Salt Lake City, Utah. The hospitalist service is a teaching service composed of 4 teams with internal medicine residents and medical students. The nonhospitalist services include all surgical services, as well as pulmonary, cardiology, hematology, and oncology services on which internal medicine residents rotate. All services at UUHC are staffed by academic physicians affiliated with the University of Utah School of Medicine.
Population
All patients 18 years and older admitted to the hospital to a service other than obstetrics, rehabilitation, or psychiatry between July 1, 2012 and April 30, 2014 were evaluated. Patients with missing data for outcomes or covariates were excluded.
Intervention
Initial evaluation included an informal review of patient charts and discussion with hospitalist group members, both indicating laboratory overuse. A working group was then established including hospitalists and process engineers to evaluate the workflow by which laboratory tests were ordered. Concurrently, a literature review was performed to help identify the scope of the problem and evaluate methods that had been successful at other institutions. Through this review, it was noted that interns were the most frequent orderers of tests and the largest contributors to variation of testing for inpatients.[19] Two specific studies with direct applicability to this project demonstrated that discussion of costs with attendings in a trauma intensive care unit resulted in a 30% reduction of tests ordered,[20] and discussion of testing with a senior resident in an internal medicine inpatient setting demonstrated a 20% reduction in laboratory testing.[21]
Our laboratory reduction intervention expanded on the current literature to incorporate education, process change, cost feedback, and financial incentives. Specifically, starting February 1, 2013, the following interventions were performed:
- Education of all providers involved, including the hospitalist group and all internal medicine residents at the start of their rotation with the hospitalist service. Education included a 30‐minute discussion of laboratory overuse, costs associated with laboratory overuse, previous interventions and their success, and current intervention with goals. Each resident was provided a pocket card with the most common lab tests and associated charges. Charges were used instead of costs due to concerns regarding the possible public dissemination of institutional costs.
- Standardization of the rounding process including a checklist review (see Supporting Information, Appendix, in the online version of this article) for all patients that ensured discussion of labs, telemetry, pain, lines/tubes, nursing presence, and follow‐up needed. The expectation was that all plans for lab testing would be discussed during rounds. The third‐year medical student was responsible to ensure that all items were covered daily on each patient.
- Monthly feedback at the hospitalist group meeting regarding laboratory costs using the VDO tool. Data were presented as a monthly group average and compared to preintervention baseline costs. Individual performance could be viewed and compared to other providers within the group.
- Financial incentive through a program that shares 50% of cost savings realized by the hospital with the Division of General Internal Medicine. The incentive could be used to support future quality‐improvement projects, but there was no individual physician incentive.
Data Collection and Preparation
Clinical data were collected in the inpatient EHR (Cerner Corp., Kansas City, MO) and later imported into the enterprise data warehouse (EDW) as part of the normal data flow. Billing data were imported into the EDW from the billing system. Cost data were estimated using the VDO tool developed by the University of Utah to identify clinical costs to the UUHC system.[18]
Clinical and Cost Outcomes
We hypothesized that following the intervention, the number of tests and lab costs would decrease greater for patients in the intervention group than in the control group, with no adverse effect on length of stay (LOS) or 30‐day readmissions.
Lab cost per day was calculated as the total lab cost per visit divided by the LOS. We adjusted all lab costs to 2013 US dollars using Consumer Price Index inflation data.[22] To account for different LOS, we used LOS as a weight variable when estimating descriptive characteristics and P values for lab cost per day and the number of tests. Thirty‐day readmissions included inpatient encounters followed by another inpatient encounter within 30 days excluding obstetrics, rehabilitation, and psychiatry visits.
Descriptive Variables
We included information on age at admission in years and Charlson Comorbidity Index (CCI) to evaluate differences in control and intervention groups.[23]
Statistical Analysis
First, unadjusted descriptive statistics were calculated for study outcomes and visit characteristics. Descriptive statistics were expressed as n (%) and mean standard deviation. Simple comparisons were performed based on 2 tests of homogeneity for categorical variables and on t tests for continuous variables.
Second, an ITS analysis was conducted to evaluate the impact of the intervention while accounting for baseline trends.[24] In this analysis, the dependent variable (yt) was the difference in aggregated outcome measures between the intervention and control groups every 2 weeks (eg, difference in average lab costs in a given 2‐week period between the 2 groups). Intervention impact was then evaluated in terms of changes in the level of the outcome (b2) as well as in the trend over time (b3) compared to the initial difference in means (b0) and baseline trend (b1). The following difference‐in‐differences segmented regression model was fitted using the autoreg procedure in SAS: yt = b0 + b1*timet + b2*study periodt + b3*time after the interventiont + errort, where timet is biweekly intervals after the beginning of the study, time after the interventiont is biweekly intervals after the intervention date, and study periodt is 1 postintervention and 0 preintervention. The models were fitted using maximum likelihood and stepwise autoregression to test 24 lags.
P values <0.05 were considered significant. SAS (version 9.3; SAS Institute Inc., Cary, NC) was used for data analysis.
RESULTS
We analyzed 48,327 inpatient visits that met inclusion criteria. We excluded 15,659 obstetrics, rehabilitation, and psychiatry visits. Seven hundred seventy‐two (2.4%) of the remaining visits were excluded due to missing data. A total of 31,896 inpatient visits by 22,545 patients were included in the analysis. There were 10,136 visits before the intervention and 21,760 visits after. Characteristics of the study groups for the full study timeframe (July 1, 2012April 30, 2014) are summarized in Table 1.
| Characteristic | Study Group* | |||
|---|---|---|---|---|
| Overall, N = 31,896 | Control, N = 25,586 | Intervention, N = 6,310 | P Value | |
| ||||
| Patient characteristics | ||||
| Age, y | 55.47 17.61 | 55.27 17.13 | 56.30 19.39 | <0.001 |
| Female gender | 14,995 (47%) | 11,753 (46%) | 3,242 (51%) | <0.001 |
| CCI | 3.73 3.25 | 3.61 3.17 | 4.20 3.54 | <0.001 |
| Outcomes | ||||
| Cost per day, $ | 130.95 392.16 | 131.57 423.94 | 127.68 220.40 | 0.022 |
| Cost per visit, $ | 733.75 1,693.98 | 772.30 1,847.65 | 577.40 795.29 | <0.001 |
| BMP tests per day | 0.73 1.17 | 0.74 1.19 | 0.67 1.05 | <0.001 |
| CMP tests per day | 0.20 0.67 | 0.19 0.68 | 0.26 0.62 | <0.001 |
| CBC tests per day | 0.83 1.10 | 0.84 1.15 | 0.73 0.82 | <0.001 |
| PT/INR tests per day | 0.36 1.03 | 0.36 1.07 | 0.34 0.83 | <.001 |
| LOS, d | 5.60 7.12 | 5.87 7.55 | 4.52 4.82 | <0.001 |
| 30‐day readmissions | 4,374 (14%) | 3,603 (14%) | 771 (12%) | <0.001 |
During the study period, there were 25,586 visits in the control group and 6310 visits in the intervention group. Patients in the intervention group were on average older than patients in the control group. There were more female patients in the intervention group. Mean CCI was 4.2 in the intervention group and 3.6 in the control group. The intervention group had lower LOS and 30‐day readmissions than the control group.
Descriptive statistics and simple comparisons of covariates and outcomes before and after the intervention are shown in Table 2. Age and gender distributions remained unchanged in both groups. CCI increased in the control group by 0.24 (P < 0.001) and remained unchanged in the intervention group. In the intervention group, lab cost per day was reduced from $138 before the intervention to $123 after the intervention (P < 0.001). In contrast, among control patients, cost per day increased nonsignificantly from $130 preintervention to $132 postintervention (P = 0.37). Number of tests per day significantly decreased for all specific tests in the intervention group. Readmission rates decreased significantly from 14% to 11% in the intervention group (P = 0.01). LOS remained constant in both groups.
| Characteristic* | Control | Intervention | ||||
|---|---|---|---|---|---|---|
| Preintervention, N = 8,102 | Postintervention, N = 17,484 | P Value | Preintervention, N = 2,034 | Postintervention, N = 4,276 | P Value | |
| ||||||
| Patient characteristics | ||||||
| Age, yr | 55.17 17.46 | 55.31 16.98 | 0.55 | 55.90 19.47 | 56.50 19.35 | 0.25 |
| Female gender | 3,707 (46%) | 8,046 (46%) | 0.69 | 1,039 (51%) | 2,203 (52%) | 0.74 |
| CCI | 3.45 3.06 | 3.69 3.21 | <0.001 | 4.19 3.51 | 4.20 3.56 | 0.89 |
| Outcomes | ||||||
| Cost per day, $ | 130.1 431.8 | 132.2 420.3 | 0.37 | 137.9 232.9 | 122.9 213.5 | <0.001 |
| Cost per visit, $ | 760.4 1,813.6 | 777.8 1,863.3 | 0.48 | 617.8 844.1 | 558.2 770.3 | 0.005 |
| BMP tests per day | 0.74 1.21 | 0.74 1.18 | 0.67 | 0.75 1.03 | 0.63 1.05 | <0.001 |
| CMP tests per day | 0.19 0.68 | 0.19 0.68 | 0.85 | 0.32 0.68 | 0.23 0.58 | <0.001 |
| CBC tests per day | 0.85 1.14 | 0.84 1.15 | 0.045 | 0.92 0.79 | 0.64 0.76 | <0.001 |
| PT/INR tests per day | 0.34 1.04 | 0.37 1.08 | <0.001 | 0.35 0.82 | 0.33 0.84 | 0.020 |
| LOS, d | 5.84 7.66 | 5.88 7.50 | 0.71 | 4.48 5.12 | 4.54 4.67 | 0.63 |
| 30‐day readmissions | 1,173 (14%) | 2,430 (14%) | 0.22 | 280 (14%) | 491 (11%) | 0.010 |
ITS analysis results are shown in Table 3. After the intervention, the difference in monthly means between the 2 groups dropped by $16 for cost per day (P = 0.034) and by $128 for cost per visit (P = 0.02). The decreased cost in the intervention group amounts to approximately $251,427 (95% confidence interval [CI]: $20,370‐$482,484) savings over the first year. If the intervention was rolled out for the control group and had a similar impact, it could have led to an additional cost savings of $1,321,669 (95% CI: 107,081‐2,536,256). Moreover, the number of basic metabolic panel, comprehensive metabolic panel, and complete blood count test per day were reduced significantly more in the intervention group compared to the control group (<0.001, 0.004, and <0.001).
| Outcome | Parameter* | Parameter Estimate | Standard Error | t Value | Pr > |t| |
|---|---|---|---|---|---|
| |||||
| Lab cost per day ($) | Baseline difference level (b0) | 9.3450 | 6.5640 | 1.4237 | 0.16 |
| Baseline difference trend (b1) | 0.2150 | 0.7709 | 0.2789 | 0.78 | |
| Change in difference level after intervention(b2) | 16.1200 | 7.3297 | 2.1993 | 0.034 | |
| Change in difference trend after intervention (b3) | 0.2388 | 0.8090 | 0.2952 | 0.77 | |
| Lab cost per visit ($) | Baseline difference level (b0) | 166.081 | 48.3425 | 3.4355 | 0.001 |
| Baseline difference trend (b1) | 3.6663 | 5.8571 | 0.6260 | 0.53 | |
| Change in difference level after intervention(b2) | 128.527 | 53.0278 | 2.4238 | 0.020 | |
| Change in difference trend after intervention (b3) | 2.2586 | 5.8463 | 0.3863 | 0.70 | |
| BMP tests per day | Baseline difference level (b0) | 0.0061 | 0.0250 | 0.2439 | 0.81 |
| Baseline difference trend (b1) | 0.0004 | 0.0030 | 0.1449 | 0.89 | |
| Change in difference level after intervention(b2) | 0.1034 | 0.0276 | 3.7426 | <0.001 | |
| Change in difference trend after intervention (b3) | 0.0014 | 0.0030 | 0.4588 | 0.65 | |
| CMP tests per day | Baseline difference level (b0) | 0.1226 | 0.0226 | 5.4302 | <0.001 |
| Baseline difference trend (b1) | 0.0015 | 0.0028 | 0.5539 | 0.58 | |
| Change in difference level after intervention(b2) | 0.0754 | 0.0248 | 3.0397 | 0.004 | |
| Change in difference trend after intervention (b3) | 0.0030 | 0.0028 | 1.0937 | 0.28 | |
| CBC tests per day | Baseline difference level (b0) | 0.0539 | 0.0190 | 2.8338 | 0.007 |
| Baseline difference trend (b1) | 0.0013 | 0.0023 | 0.5594 | 0.58 | |
| Change in difference level after intervention(b2) | 0.2343 | 0.0213 | 10.997 | <0.001 | |
| Change in difference trend after intervention (b3) | 0.0036 | 0.0023 | 1.5539 | 0.13 | |
| PT/INR tests per day | Baseline difference level (b0) | 0.0413 | 0.0242 | 1.7063 | 0.096 |
| Baseline difference trend (b1) | 0.0040 | 0.0028 | 1.4095 | 0.17 | |
| Change in difference level after intervention(b2) | 0.0500 | 0.0270 | 1.8507 | 0.072 | |
| Change in difference trend after intervention (b3) | 0.0054 | 0.0030 | 1.7940 | 0.080 | |
| LOS, d | Baseline difference level (b0) | 1.4211 | 0.2746 | 5.1743 | <0.001 |
| Baseline difference trend (b1) | 0.0093 | 0.0333 | 0.2807 | 0.78 | |
| Change in difference level after intervention(b2) | 0.1007 | 0.2988 | 0.3368 | 0.74 | |
| Change in difference trend after intervention (b3) | 0.0053 | 0.0331 | 0.1588 | 0.87 | |
| 30‐day readmissions | Baseline difference level (b0) | 0.0057 | 0.0185 | 0.3084 | 0.76 |
| Baseline difference trend (b1) | 0.0017 | 0.0022 | 0.8016 | 0.43 | |
| Change in difference level after intervention(b2) | 0.0110 | 0.0206 | 0.5315 | 0.60 | |
| Change in difference trend after intervention (b3) | 0.0021 | 0.0023 | 0.9111 | 0.37 | |
Figure 1 shows a graphical representation of the biweekly means for the 2 primary outcomeslab cost per day and lab cost per visit. Figure 2 shows all other outcomes. To the right of each figure, P values are provided for the b2 coefficients from Table 3.
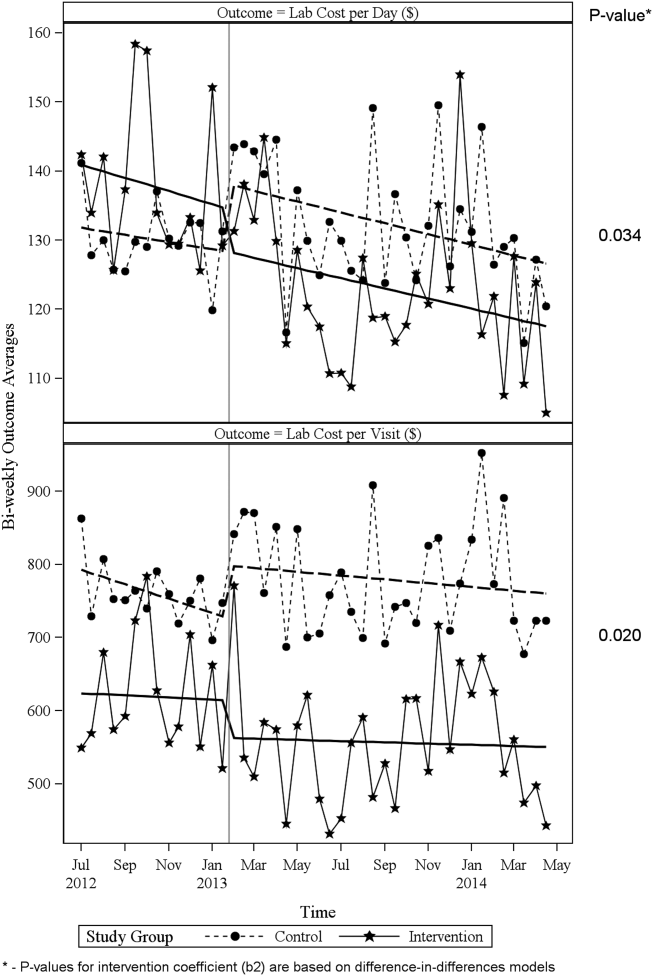
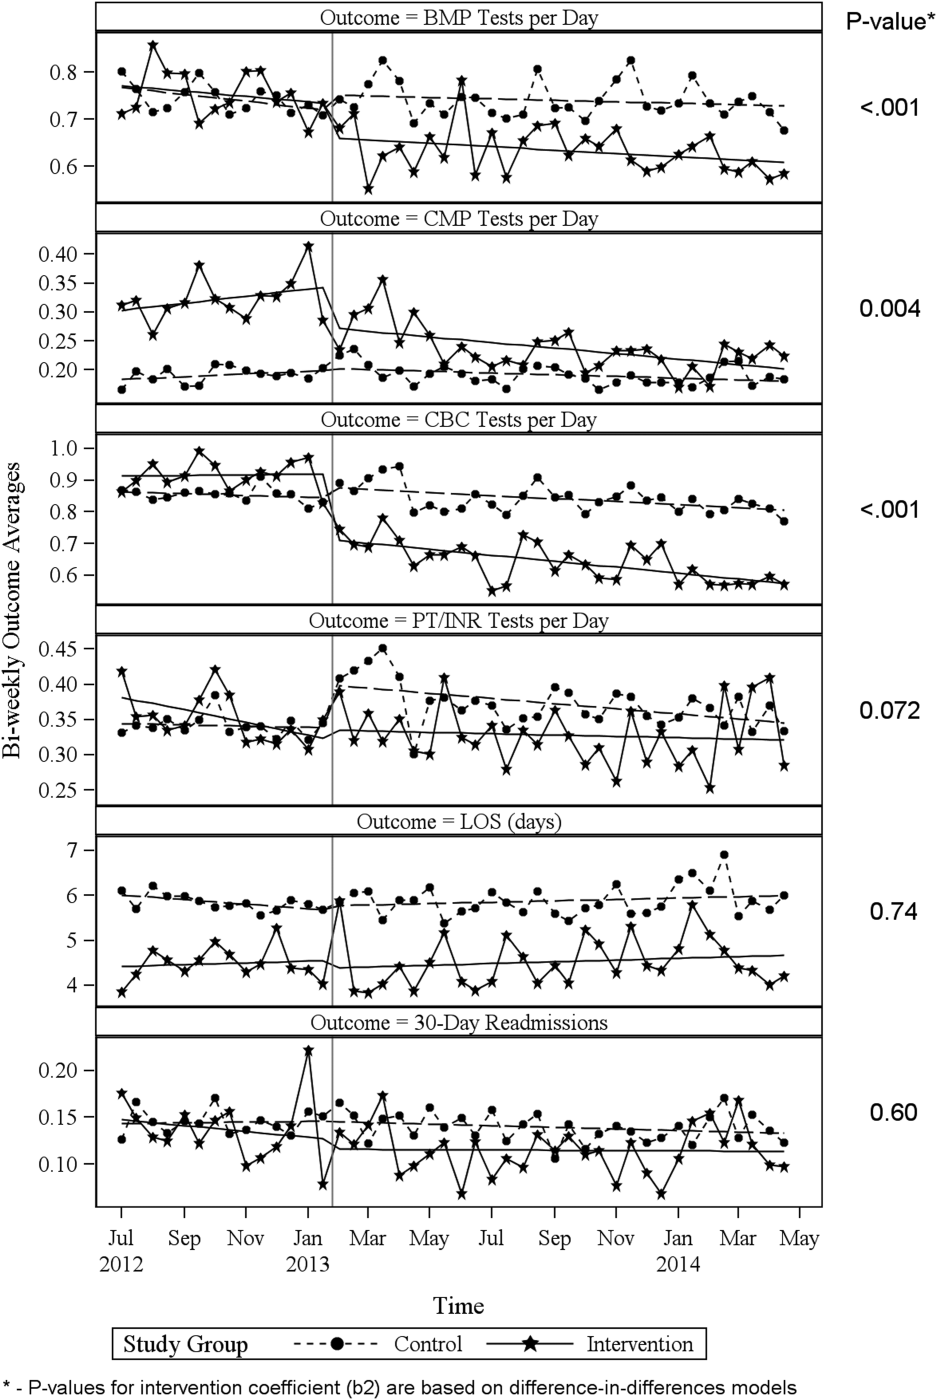
DISCUSSION
Through a multifaceted quality‐improvement initiative, the UUHC hospitalist group was able to reduce lab cost per day and per visit as well as commonly ordered routine labs as compared to an institutional control group. A multifaceted approach was selected given the literature supporting this approach as the most likely method to sustain improvement.[14] At the same time, the use of a multifaceted intervention makes it difficult to rigorously determine the relative impact of different components of the intervention. In discussing this issue, however, the hospitalist group felt that the driving factors for change were those related to process change, specifically, the use of a standardized rounding checklist to discuss lab testing and the routine review of lab costs at group meetings. The ultimate goal was to change the culture of routine test ordering into a thoughtful process of needed tests and thereby reduce costs. Prior to this intervention, the least experienced person on this team (the intern) ordered any test he or she wanted, usually without discussion. The intervention focused on this issue through standardized supervision and explicit discussion of laboratory tests. Importantly, although improvements from education initiatives typically decrease over time, the incorporation of process change in this intervention was felt to likely contribute to the sustained reduction seen at 15 months. Although use of the rounding checklist added another step to daily rounds, the routine cost feedback, including comparisons to peers, helped encourage use of the checklist. Thus, we feel that routine feedback was essential to sustaining the intervention and its impact.
Inappropriate and unnecessary testing has been recognized for decades, and multiple interventions have been attempted, including a recent article that demonstrated a 10% reduction in common laboratory ordering through an initiative mainly focused on education and ordering feedback.[25] Despite reported success of several interventions, none have combined multiple interventions and explicitly required discussion of laboratory tests on rounds. For example, although the UUHC intervention used Attali et al.[21] and Barie and Hydo's[20] work to develop the intervention, neither of these studies described how laboratory testing was discussed with the attending or supervising resident. The UUHC intervention thus builds on the current literature by combining other successful modalities with explicit discussion of laboratory testing via a rounding checklist and feedback with the novel VDO tool to reduce laboratory costs. A major strength of this intervention is the relatively low cost and the generalizability of implementing rounding checklists. Initial support from the hospital was needed to provide accurate VDO information to the hospitalist group. However, ongoing costs were minimal and related to any additional time spent during rounds to discuss laboratory tests. Thus, we feel that this intervention is feasible for wide replication.
Another strength of the study is the use of the VDO tool to measure actual costs. Whereas previous studies have relied on estimated costs with extrapolation to potential cost savings, this study used direct costs to the institution as a more accurate marker of cost savings. Additionally, most studies on lab utilization have used a before/after analysis without a control group. The presence of a control group for this analysis is important to help assess for institutional trends that may not be reflected in a before/after intervention. The reduction in cost in the intervention group despite a trend toward increased cost in the institutional control group supports the impact of this intervention.
Limitations of this study include that it was a single‐center, controlled ITS study and not a randomized controlled trial. Related to this limitation, the control group reflected a different patient population compared to the intervention group, with a longer LOS, lower CCI, and inclusion of nonmedical patients. However, these differences were relatively stable before and after the intervention. Also, ITS is considered one of the most robust research designs outside of randomized controlled trials, and it accounts for baseline differences in both levels and trends.[24] Nevertheless, it remains possible that secular trends existed that we did not capture and that affected the 2 populations differently.
A further limitation is that the baseline period was only 7 months and the intervention was 15 months. As the 7 months started in July, this could have reflected the time when interns were least experienced with ordering. Unfortunately, we did not have VDO availability for a full year prior to the intervention. We believe that any major effect due to this shortened baseline period should have been seen in the control group as well, and therefore accounted for in the analysis. Additionally, it is possible that there was spillover of the intervention to the control group, as internal medicine residents rotated throughout the hospital to other medical services (pulmonary, cardiology, hematology, and oncology). However, any effect of their rotation should have been to lower the control lab cost, thus making differences less profound.
CONCLUSIONS
A multifaceted approach to laboratory reduction through education, process change, cost feedback, and financial incentive resulted in a significant reduction in laboratory cost per day, laboratory cost per visit, and the ordering of common laboratory tests at a major academic medical center.
Acknowledgements
The authors thank Mr. Michael Swanicke for his assistance in process engineering, Mr. Tony Clawson for his routine provision of VDO data, and Ms. Selma Lopez for her editorial support.
Disclosures: K.K. is or has been a consultant on clinical decision support (CDS) or electronic clinical quality measurement to the US Office of the National Coordinator for Health IT, ARUP Laboratories, McKesson InterQual, ESAC, Inc., JBS International, Inc., Inflexxion, Inc., Intelligent Automation, Inc., Partners HealthCare, Mayo Clinic, and the RAND Corporation. K.K. receives royalties for a Duke University‐owned CDS technology for infectious disease management known as CustomID that he helped develop. K.K. was formerly a consultant for Religent, Inc. and a co‐owner and consultant for Clinica Software, Inc., both of which provide commercial CDS services, including through use of a CDS technology known as SEBASTIAN that K.K. developed. K.K. no longer has a financial relationship with either Religent or Clinica Software. K.K. has no competing interest with any specific product or intervention evaluated in this article. All other authors declare no competing interests.
- , , , et al. National health expenditure projections, 2014–24: spending growth faster than recent trends. Health Aff (Millwood). 2015;34(8):1407–1417.
- , . Eliminating waste in US health care. JAMA. 2012;307(14):1513–1516.
- , , , et al. Utilization of arterial blood gas measurements in a large tertiary care hospital. Am J Clin Pathol. 2007;127:604–609.
- , . Strategies to promote rational clinical chemistry test utilization. Clin Biochem. 1996;29:291–299.
- , , , , . The landscape of inappropriate laboratory testing: a 15‐year meta‐analysis. PLoS One. 2013;8:e78962.
- ABIM Choosing Wisely Society of Hospital Medicine–Adult Hospital Medicine. Five things physicians and patients should question. Available at: http://www.choosingwisely.org/societies/society‐of‐hospital‐medicine‐adult. Published February 21, 2013. Accessed September 2, 2015.
- , , , , , . Effect of daily charge feedback on inpatient charges and physician knowledge and behavior. Arch Intern Med. 1989;149:426–429.
- , , , et al. A utilization management intervention to reduce unnecessary testing in the coronary care unit. Arch Intern Med. 2002;162:1885–1890.
- , , , et al. The impact of peer management on test‐ordering behavior. Ann Intern Med. 2004;141:196–204.
- , , , , . An administrative intervention to improve the utilization of laboratory tests within a university hospital. Int J Qual Health Care. 2005;17:243–248.
- , , , et al. Impact of providing fee data on laboratory test ordering. JAMA Intern Med. 2013;173(10):903–908.
- , , , et al. The failure of physician education as a cost containment strategy. JAMA. 1984;252:225–230.
- . Is that lab test necessary? Am J Clin Pathol. 2006;126:335–336.
- , , , . Techniques to improve physicians' use of diagnostic tests. JAMA. 1998;280:2020–2027.
- , , . Laboratory testing in the intensive care unit. Crit Care Clin. 2007;23:435–465.
- . Complications of critical care: lab testing and iatrogenic anemia. MLO Med Lab Obs. 200;33(10):28–31.
- , , , et al. Contemporary bloodletting in cardiac surgical care. Ann Thorac Surg. 2015;99:779–785.
- , , , et al. Value Driven Outcomes (VDO): a pragmatic, modular, and extensible software framework for understanding and improving health care costs and outcomes. J Am Med Inform Assoc. 2015:22:223–235.
- , , . The impact of residents, interns, and attendings on inpatient laboratory ordering patterns: a report from one university's hospitalist service. Acad Med. 2011;86:139–145.
- , . Learning to not know: results of a program for ancillary cost reduction in surgical care. J Trauma. 1996;41:714–720.
- , , , et al. A cost‐effective method for reducing the volume of laboratory tests in a university‐associated teaching hospital. Mt Sinai J Med. 2006;73:787–794.
- US Bureau of Labor Statistics. CPI inflation calculator. Available at: http://www.bls.gov/data/inflation_calculator.htm. Accessed May 22, 2015.
- , , , et al. Coding algorithms for defining comorbidities in ICD‐9‐CM and ICD‐10 administrative data. Med Care. 2005;43:113–1139.
- , , , . Segmented regression analysis of interrupted time series studies in medication use research. J Clin Pharm Ther. 2002;27(4):299–309.
- , , , et al. A multifaceted hospitalist quality improvement intervention: decreased frequency of common labs. J Hosp Med. 2015;10:390–395.
Healthcare costs continue to increase and are estimated to be approximately $3.1 trillion per year in the United States.[1] Waste is a major contributor to this cost, accounting for an estimated $910 billion/year.[2] Laboratory tests are well documented to contribute to healthcare waste, with an estimated 30% to 50% of tests for hospitalized patients being unnecessary.[3, 4, 5] This issue has been highlighted by the American Board of Internal Medicine Foundation's Choosing Wisely campaign as an area to reduce waste.[6] Evaluating this concern locally, a University Health Systems Consortium 2011 analysis indicated that the University of Utah general internal medicine hospitalist service had a higher average direct lab cost per discharge compared to top performers, indicating an opportunity for improvement.
Multiple interventions have been described in the literature to address excessive laboratory utilization, including physician education, audit and feedback, cost information display, and administrative rules restricting certain types of ordering.[7, 8, 9, 10, 11] Despite these interventions, barriers remain common and not all interventions are sustained. For example, interventions focused mainly on education see a small improvement initially that is not sustained.[4, 12, 13] Additionally, although most studies focus on individual interventions, those that target multiple factors have been found to be more successful at producing and sustaining change.[14] Therefore, the opportunity existed to incorporate multiple etiologies into a single intervention and apply a checklist to laboratory ordering to see if combined modalities could be effective at reducing laboratory costs in a sustainable manner.
In addition to cost, there is potential patient harm resulting from unnecessary laboratory testing. For prolonged hospitalizations, anemia is a well‐recognized side effect of phlebotomy,[15, 16] and a recent evaluation of cardiac surgery patients found an average cumulative blood loss due to phlebotomy of 454 mL/hospital stay.[17] The sheer number of tests ordered can lead to false positive tests that result in additional testing and monitoring. Furthermore, patients subjected to laboratory blood draws are often awakened early in the morning, which is unpleasant and could adversely affect the patient experience.
Recognizing laboratory cost as a problem, the University of Utah general internal medicine hospitalist service implemented a multifaceted quality‐improvement initiative with a goal to reduce laboratory testing. At the time of this project, University of Utah Health Care (UUHC) developed a Value Driven Outcomes (VDO) tool to give direct data related to costs of care, including the actual cost paid by the hospital to the university‐owned laboratory vendor (ARUP Laboratories, Salt Lake City, UT) for testing.[18] The hospitalist group incorporated VDO into the initiative for routine cost feedback. This study evaluates the impact of this intervention on laboratory costs.
METHODS
Design
A retrospective, controlled, interrupted time series (ITS) study was performed to compare changes in lab costs between hospitalists (intervention study group) and other providers (control study group). The intervention initiation date was February 1, 2013. The baseline period was July 1, 2012 to January 31, 2013, as that was the period in which the VDO tool became available for cost analysis prior to intervention. The intervention period was February 1, 2013 to April 30, 2014, as there was a change in the electronic health record (EHR) in May 2014 that affected data flow and could act as a major confounder. The institutional review board classified this project as quality improvement and did not require review and oversight.
Setting
UUHC is a 500‐bed academic medical center in Salt Lake City, Utah. The hospitalist service is a teaching service composed of 4 teams with internal medicine residents and medical students. The nonhospitalist services include all surgical services, as well as pulmonary, cardiology, hematology, and oncology services on which internal medicine residents rotate. All services at UUHC are staffed by academic physicians affiliated with the University of Utah School of Medicine.
Population
All patients 18 years and older admitted to the hospital to a service other than obstetrics, rehabilitation, or psychiatry between July 1, 2012 and April 30, 2014 were evaluated. Patients with missing data for outcomes or covariates were excluded.
Intervention
Initial evaluation included an informal review of patient charts and discussion with hospitalist group members, both indicating laboratory overuse. A working group was then established including hospitalists and process engineers to evaluate the workflow by which laboratory tests were ordered. Concurrently, a literature review was performed to help identify the scope of the problem and evaluate methods that had been successful at other institutions. Through this review, it was noted that interns were the most frequent orderers of tests and the largest contributors to variation of testing for inpatients.[19] Two specific studies with direct applicability to this project demonstrated that discussion of costs with attendings in a trauma intensive care unit resulted in a 30% reduction of tests ordered,[20] and discussion of testing with a senior resident in an internal medicine inpatient setting demonstrated a 20% reduction in laboratory testing.[21]
Our laboratory reduction intervention expanded on the current literature to incorporate education, process change, cost feedback, and financial incentives. Specifically, starting February 1, 2013, the following interventions were performed:
- Education of all providers involved, including the hospitalist group and all internal medicine residents at the start of their rotation with the hospitalist service. Education included a 30‐minute discussion of laboratory overuse, costs associated with laboratory overuse, previous interventions and their success, and current intervention with goals. Each resident was provided a pocket card with the most common lab tests and associated charges. Charges were used instead of costs due to concerns regarding the possible public dissemination of institutional costs.
- Standardization of the rounding process including a checklist review (see Supporting Information, Appendix, in the online version of this article) for all patients that ensured discussion of labs, telemetry, pain, lines/tubes, nursing presence, and follow‐up needed. The expectation was that all plans for lab testing would be discussed during rounds. The third‐year medical student was responsible to ensure that all items were covered daily on each patient.
- Monthly feedback at the hospitalist group meeting regarding laboratory costs using the VDO tool. Data were presented as a monthly group average and compared to preintervention baseline costs. Individual performance could be viewed and compared to other providers within the group.
- Financial incentive through a program that shares 50% of cost savings realized by the hospital with the Division of General Internal Medicine. The incentive could be used to support future quality‐improvement projects, but there was no individual physician incentive.
Data Collection and Preparation
Clinical data were collected in the inpatient EHR (Cerner Corp., Kansas City, MO) and later imported into the enterprise data warehouse (EDW) as part of the normal data flow. Billing data were imported into the EDW from the billing system. Cost data were estimated using the VDO tool developed by the University of Utah to identify clinical costs to the UUHC system.[18]
Clinical and Cost Outcomes
We hypothesized that following the intervention, the number of tests and lab costs would decrease greater for patients in the intervention group than in the control group, with no adverse effect on length of stay (LOS) or 30‐day readmissions.
Lab cost per day was calculated as the total lab cost per visit divided by the LOS. We adjusted all lab costs to 2013 US dollars using Consumer Price Index inflation data.[22] To account for different LOS, we used LOS as a weight variable when estimating descriptive characteristics and P values for lab cost per day and the number of tests. Thirty‐day readmissions included inpatient encounters followed by another inpatient encounter within 30 days excluding obstetrics, rehabilitation, and psychiatry visits.
Descriptive Variables
We included information on age at admission in years and Charlson Comorbidity Index (CCI) to evaluate differences in control and intervention groups.[23]
Statistical Analysis
First, unadjusted descriptive statistics were calculated for study outcomes and visit characteristics. Descriptive statistics were expressed as n (%) and mean standard deviation. Simple comparisons were performed based on 2 tests of homogeneity for categorical variables and on t tests for continuous variables.
Second, an ITS analysis was conducted to evaluate the impact of the intervention while accounting for baseline trends.[24] In this analysis, the dependent variable (yt) was the difference in aggregated outcome measures between the intervention and control groups every 2 weeks (eg, difference in average lab costs in a given 2‐week period between the 2 groups). Intervention impact was then evaluated in terms of changes in the level of the outcome (b2) as well as in the trend over time (b3) compared to the initial difference in means (b0) and baseline trend (b1). The following difference‐in‐differences segmented regression model was fitted using the autoreg procedure in SAS: yt = b0 + b1*timet + b2*study periodt + b3*time after the interventiont + errort, where timet is biweekly intervals after the beginning of the study, time after the interventiont is biweekly intervals after the intervention date, and study periodt is 1 postintervention and 0 preintervention. The models were fitted using maximum likelihood and stepwise autoregression to test 24 lags.
P values <0.05 were considered significant. SAS (version 9.3; SAS Institute Inc., Cary, NC) was used for data analysis.
RESULTS
We analyzed 48,327 inpatient visits that met inclusion criteria. We excluded 15,659 obstetrics, rehabilitation, and psychiatry visits. Seven hundred seventy‐two (2.4%) of the remaining visits were excluded due to missing data. A total of 31,896 inpatient visits by 22,545 patients were included in the analysis. There were 10,136 visits before the intervention and 21,760 visits after. Characteristics of the study groups for the full study timeframe (July 1, 2012April 30, 2014) are summarized in Table 1.
| Characteristic | Study Group* | |||
|---|---|---|---|---|
| Overall, N = 31,896 | Control, N = 25,586 | Intervention, N = 6,310 | P Value | |
| ||||
| Patient characteristics | ||||
| Age, y | 55.47 17.61 | 55.27 17.13 | 56.30 19.39 | <0.001 |
| Female gender | 14,995 (47%) | 11,753 (46%) | 3,242 (51%) | <0.001 |
| CCI | 3.73 3.25 | 3.61 3.17 | 4.20 3.54 | <0.001 |
| Outcomes | ||||
| Cost per day, $ | 130.95 392.16 | 131.57 423.94 | 127.68 220.40 | 0.022 |
| Cost per visit, $ | 733.75 1,693.98 | 772.30 1,847.65 | 577.40 795.29 | <0.001 |
| BMP tests per day | 0.73 1.17 | 0.74 1.19 | 0.67 1.05 | <0.001 |
| CMP tests per day | 0.20 0.67 | 0.19 0.68 | 0.26 0.62 | <0.001 |
| CBC tests per day | 0.83 1.10 | 0.84 1.15 | 0.73 0.82 | <0.001 |
| PT/INR tests per day | 0.36 1.03 | 0.36 1.07 | 0.34 0.83 | <.001 |
| LOS, d | 5.60 7.12 | 5.87 7.55 | 4.52 4.82 | <0.001 |
| 30‐day readmissions | 4,374 (14%) | 3,603 (14%) | 771 (12%) | <0.001 |
During the study period, there were 25,586 visits in the control group and 6310 visits in the intervention group. Patients in the intervention group were on average older than patients in the control group. There were more female patients in the intervention group. Mean CCI was 4.2 in the intervention group and 3.6 in the control group. The intervention group had lower LOS and 30‐day readmissions than the control group.
Descriptive statistics and simple comparisons of covariates and outcomes before and after the intervention are shown in Table 2. Age and gender distributions remained unchanged in both groups. CCI increased in the control group by 0.24 (P < 0.001) and remained unchanged in the intervention group. In the intervention group, lab cost per day was reduced from $138 before the intervention to $123 after the intervention (P < 0.001). In contrast, among control patients, cost per day increased nonsignificantly from $130 preintervention to $132 postintervention (P = 0.37). Number of tests per day significantly decreased for all specific tests in the intervention group. Readmission rates decreased significantly from 14% to 11% in the intervention group (P = 0.01). LOS remained constant in both groups.
| Characteristic* | Control | Intervention | ||||
|---|---|---|---|---|---|---|
| Preintervention, N = 8,102 | Postintervention, N = 17,484 | P Value | Preintervention, N = 2,034 | Postintervention, N = 4,276 | P Value | |
| ||||||
| Patient characteristics | ||||||
| Age, yr | 55.17 17.46 | 55.31 16.98 | 0.55 | 55.90 19.47 | 56.50 19.35 | 0.25 |
| Female gender | 3,707 (46%) | 8,046 (46%) | 0.69 | 1,039 (51%) | 2,203 (52%) | 0.74 |
| CCI | 3.45 3.06 | 3.69 3.21 | <0.001 | 4.19 3.51 | 4.20 3.56 | 0.89 |
| Outcomes | ||||||
| Cost per day, $ | 130.1 431.8 | 132.2 420.3 | 0.37 | 137.9 232.9 | 122.9 213.5 | <0.001 |
| Cost per visit, $ | 760.4 1,813.6 | 777.8 1,863.3 | 0.48 | 617.8 844.1 | 558.2 770.3 | 0.005 |
| BMP tests per day | 0.74 1.21 | 0.74 1.18 | 0.67 | 0.75 1.03 | 0.63 1.05 | <0.001 |
| CMP tests per day | 0.19 0.68 | 0.19 0.68 | 0.85 | 0.32 0.68 | 0.23 0.58 | <0.001 |
| CBC tests per day | 0.85 1.14 | 0.84 1.15 | 0.045 | 0.92 0.79 | 0.64 0.76 | <0.001 |
| PT/INR tests per day | 0.34 1.04 | 0.37 1.08 | <0.001 | 0.35 0.82 | 0.33 0.84 | 0.020 |
| LOS, d | 5.84 7.66 | 5.88 7.50 | 0.71 | 4.48 5.12 | 4.54 4.67 | 0.63 |
| 30‐day readmissions | 1,173 (14%) | 2,430 (14%) | 0.22 | 280 (14%) | 491 (11%) | 0.010 |
ITS analysis results are shown in Table 3. After the intervention, the difference in monthly means between the 2 groups dropped by $16 for cost per day (P = 0.034) and by $128 for cost per visit (P = 0.02). The decreased cost in the intervention group amounts to approximately $251,427 (95% confidence interval [CI]: $20,370‐$482,484) savings over the first year. If the intervention was rolled out for the control group and had a similar impact, it could have led to an additional cost savings of $1,321,669 (95% CI: 107,081‐2,536,256). Moreover, the number of basic metabolic panel, comprehensive metabolic panel, and complete blood count test per day were reduced significantly more in the intervention group compared to the control group (<0.001, 0.004, and <0.001).
| Outcome | Parameter* | Parameter Estimate | Standard Error | t Value | Pr > |t| |
|---|---|---|---|---|---|
| |||||
| Lab cost per day ($) | Baseline difference level (b0) | 9.3450 | 6.5640 | 1.4237 | 0.16 |
| Baseline difference trend (b1) | 0.2150 | 0.7709 | 0.2789 | 0.78 | |
| Change in difference level after intervention(b2) | 16.1200 | 7.3297 | 2.1993 | 0.034 | |
| Change in difference trend after intervention (b3) | 0.2388 | 0.8090 | 0.2952 | 0.77 | |
| Lab cost per visit ($) | Baseline difference level (b0) | 166.081 | 48.3425 | 3.4355 | 0.001 |
| Baseline difference trend (b1) | 3.6663 | 5.8571 | 0.6260 | 0.53 | |
| Change in difference level after intervention(b2) | 128.527 | 53.0278 | 2.4238 | 0.020 | |
| Change in difference trend after intervention (b3) | 2.2586 | 5.8463 | 0.3863 | 0.70 | |
| BMP tests per day | Baseline difference level (b0) | 0.0061 | 0.0250 | 0.2439 | 0.81 |
| Baseline difference trend (b1) | 0.0004 | 0.0030 | 0.1449 | 0.89 | |
| Change in difference level after intervention(b2) | 0.1034 | 0.0276 | 3.7426 | <0.001 | |
| Change in difference trend after intervention (b3) | 0.0014 | 0.0030 | 0.4588 | 0.65 | |
| CMP tests per day | Baseline difference level (b0) | 0.1226 | 0.0226 | 5.4302 | <0.001 |
| Baseline difference trend (b1) | 0.0015 | 0.0028 | 0.5539 | 0.58 | |
| Change in difference level after intervention(b2) | 0.0754 | 0.0248 | 3.0397 | 0.004 | |
| Change in difference trend after intervention (b3) | 0.0030 | 0.0028 | 1.0937 | 0.28 | |
| CBC tests per day | Baseline difference level (b0) | 0.0539 | 0.0190 | 2.8338 | 0.007 |
| Baseline difference trend (b1) | 0.0013 | 0.0023 | 0.5594 | 0.58 | |
| Change in difference level after intervention(b2) | 0.2343 | 0.0213 | 10.997 | <0.001 | |
| Change in difference trend after intervention (b3) | 0.0036 | 0.0023 | 1.5539 | 0.13 | |
| PT/INR tests per day | Baseline difference level (b0) | 0.0413 | 0.0242 | 1.7063 | 0.096 |
| Baseline difference trend (b1) | 0.0040 | 0.0028 | 1.4095 | 0.17 | |
| Change in difference level after intervention(b2) | 0.0500 | 0.0270 | 1.8507 | 0.072 | |
| Change in difference trend after intervention (b3) | 0.0054 | 0.0030 | 1.7940 | 0.080 | |
| LOS, d | Baseline difference level (b0) | 1.4211 | 0.2746 | 5.1743 | <0.001 |
| Baseline difference trend (b1) | 0.0093 | 0.0333 | 0.2807 | 0.78 | |
| Change in difference level after intervention(b2) | 0.1007 | 0.2988 | 0.3368 | 0.74 | |
| Change in difference trend after intervention (b3) | 0.0053 | 0.0331 | 0.1588 | 0.87 | |
| 30‐day readmissions | Baseline difference level (b0) | 0.0057 | 0.0185 | 0.3084 | 0.76 |
| Baseline difference trend (b1) | 0.0017 | 0.0022 | 0.8016 | 0.43 | |
| Change in difference level after intervention(b2) | 0.0110 | 0.0206 | 0.5315 | 0.60 | |
| Change in difference trend after intervention (b3) | 0.0021 | 0.0023 | 0.9111 | 0.37 | |
Figure 1 shows a graphical representation of the biweekly means for the 2 primary outcomeslab cost per day and lab cost per visit. Figure 2 shows all other outcomes. To the right of each figure, P values are provided for the b2 coefficients from Table 3.
DISCUSSION
Through a multifaceted quality‐improvement initiative, the UUHC hospitalist group was able to reduce lab cost per day and per visit as well as commonly ordered routine labs as compared to an institutional control group. A multifaceted approach was selected given the literature supporting this approach as the most likely method to sustain improvement.[14] At the same time, the use of a multifaceted intervention makes it difficult to rigorously determine the relative impact of different components of the intervention. In discussing this issue, however, the hospitalist group felt that the driving factors for change were those related to process change, specifically, the use of a standardized rounding checklist to discuss lab testing and the routine review of lab costs at group meetings. The ultimate goal was to change the culture of routine test ordering into a thoughtful process of needed tests and thereby reduce costs. Prior to this intervention, the least experienced person on this team (the intern) ordered any test he or she wanted, usually without discussion. The intervention focused on this issue through standardized supervision and explicit discussion of laboratory tests. Importantly, although improvements from education initiatives typically decrease over time, the incorporation of process change in this intervention was felt to likely contribute to the sustained reduction seen at 15 months. Although use of the rounding checklist added another step to daily rounds, the routine cost feedback, including comparisons to peers, helped encourage use of the checklist. Thus, we feel that routine feedback was essential to sustaining the intervention and its impact.
Inappropriate and unnecessary testing has been recognized for decades, and multiple interventions have been attempted, including a recent article that demonstrated a 10% reduction in common laboratory ordering through an initiative mainly focused on education and ordering feedback.[25] Despite reported success of several interventions, none have combined multiple interventions and explicitly required discussion of laboratory tests on rounds. For example, although the UUHC intervention used Attali et al.[21] and Barie and Hydo's[20] work to develop the intervention, neither of these studies described how laboratory testing was discussed with the attending or supervising resident. The UUHC intervention thus builds on the current literature by combining other successful modalities with explicit discussion of laboratory testing via a rounding checklist and feedback with the novel VDO tool to reduce laboratory costs. A major strength of this intervention is the relatively low cost and the generalizability of implementing rounding checklists. Initial support from the hospital was needed to provide accurate VDO information to the hospitalist group. However, ongoing costs were minimal and related to any additional time spent during rounds to discuss laboratory tests. Thus, we feel that this intervention is feasible for wide replication.
Another strength of the study is the use of the VDO tool to measure actual costs. Whereas previous studies have relied on estimated costs with extrapolation to potential cost savings, this study used direct costs to the institution as a more accurate marker of cost savings. Additionally, most studies on lab utilization have used a before/after analysis without a control group. The presence of a control group for this analysis is important to help assess for institutional trends that may not be reflected in a before/after intervention. The reduction in cost in the intervention group despite a trend toward increased cost in the institutional control group supports the impact of this intervention.
Limitations of this study include that it was a single‐center, controlled ITS study and not a randomized controlled trial. Related to this limitation, the control group reflected a different patient population compared to the intervention group, with a longer LOS, lower CCI, and inclusion of nonmedical patients. However, these differences were relatively stable before and after the intervention. Also, ITS is considered one of the most robust research designs outside of randomized controlled trials, and it accounts for baseline differences in both levels and trends.[24] Nevertheless, it remains possible that secular trends existed that we did not capture and that affected the 2 populations differently.
A further limitation is that the baseline period was only 7 months and the intervention was 15 months. As the 7 months started in July, this could have reflected the time when interns were least experienced with ordering. Unfortunately, we did not have VDO availability for a full year prior to the intervention. We believe that any major effect due to this shortened baseline period should have been seen in the control group as well, and therefore accounted for in the analysis. Additionally, it is possible that there was spillover of the intervention to the control group, as internal medicine residents rotated throughout the hospital to other medical services (pulmonary, cardiology, hematology, and oncology). However, any effect of their rotation should have been to lower the control lab cost, thus making differences less profound.
CONCLUSIONS
A multifaceted approach to laboratory reduction through education, process change, cost feedback, and financial incentive resulted in a significant reduction in laboratory cost per day, laboratory cost per visit, and the ordering of common laboratory tests at a major academic medical center.
Acknowledgements
The authors thank Mr. Michael Swanicke for his assistance in process engineering, Mr. Tony Clawson for his routine provision of VDO data, and Ms. Selma Lopez for her editorial support.
Disclosures: K.K. is or has been a consultant on clinical decision support (CDS) or electronic clinical quality measurement to the US Office of the National Coordinator for Health IT, ARUP Laboratories, McKesson InterQual, ESAC, Inc., JBS International, Inc., Inflexxion, Inc., Intelligent Automation, Inc., Partners HealthCare, Mayo Clinic, and the RAND Corporation. K.K. receives royalties for a Duke University‐owned CDS technology for infectious disease management known as CustomID that he helped develop. K.K. was formerly a consultant for Religent, Inc. and a co‐owner and consultant for Clinica Software, Inc., both of which provide commercial CDS services, including through use of a CDS technology known as SEBASTIAN that K.K. developed. K.K. no longer has a financial relationship with either Religent or Clinica Software. K.K. has no competing interest with any specific product or intervention evaluated in this article. All other authors declare no competing interests.
- , , , et al. National health expenditure projections, 2014–24: spending growth faster than recent trends. Health Aff (Millwood). 2015;34(8):1407–1417.
- , . Eliminating waste in US health care. JAMA. 2012;307(14):1513–1516.
- , , , et al. Utilization of arterial blood gas measurements in a large tertiary care hospital. Am J Clin Pathol. 2007;127:604–609.
- , . Strategies to promote rational clinical chemistry test utilization. Clin Biochem. 1996;29:291–299.
- , , , , . The landscape of inappropriate laboratory testing: a 15‐year meta‐analysis. PLoS One. 2013;8:e78962.
- ABIM Choosing Wisely Society of Hospital Medicine–Adult Hospital Medicine. Five things physicians and patients should question. Available at: http://www.choosingwisely.org/societies/society‐of‐hospital‐medicine‐adult. Published February 21, 2013. Accessed September 2, 2015.
- , , , , , . Effect of daily charge feedback on inpatient charges and physician knowledge and behavior. Arch Intern Med. 1989;149:426–429.
- , , , et al. A utilization management intervention to reduce unnecessary testing in the coronary care unit. Arch Intern Med. 2002;162:1885–1890.
- , , , et al. The impact of peer management on test‐ordering behavior. Ann Intern Med. 2004;141:196–204.
- , , , , . An administrative intervention to improve the utilization of laboratory tests within a university hospital. Int J Qual Health Care. 2005;17:243–248.
- , , , et al. Impact of providing fee data on laboratory test ordering. JAMA Intern Med. 2013;173(10):903–908.
- , , , et al. The failure of physician education as a cost containment strategy. JAMA. 1984;252:225–230.
- . Is that lab test necessary? Am J Clin Pathol. 2006;126:335–336.
- , , , . Techniques to improve physicians' use of diagnostic tests. JAMA. 1998;280:2020–2027.
- , , . Laboratory testing in the intensive care unit. Crit Care Clin. 2007;23:435–465.
- . Complications of critical care: lab testing and iatrogenic anemia. MLO Med Lab Obs. 200;33(10):28–31.
- , , , et al. Contemporary bloodletting in cardiac surgical care. Ann Thorac Surg. 2015;99:779–785.
- , , , et al. Value Driven Outcomes (VDO): a pragmatic, modular, and extensible software framework for understanding and improving health care costs and outcomes. J Am Med Inform Assoc. 2015:22:223–235.
- , , . The impact of residents, interns, and attendings on inpatient laboratory ordering patterns: a report from one university's hospitalist service. Acad Med. 2011;86:139–145.
- , . Learning to not know: results of a program for ancillary cost reduction in surgical care. J Trauma. 1996;41:714–720.
- , , , et al. A cost‐effective method for reducing the volume of laboratory tests in a university‐associated teaching hospital. Mt Sinai J Med. 2006;73:787–794.
- US Bureau of Labor Statistics. CPI inflation calculator. Available at: http://www.bls.gov/data/inflation_calculator.htm. Accessed May 22, 2015.
- , , , et al. Coding algorithms for defining comorbidities in ICD‐9‐CM and ICD‐10 administrative data. Med Care. 2005;43:113–1139.
- , , , . Segmented regression analysis of interrupted time series studies in medication use research. J Clin Pharm Ther. 2002;27(4):299–309.
- , , , et al. A multifaceted hospitalist quality improvement intervention: decreased frequency of common labs. J Hosp Med. 2015;10:390–395.
© 2016 Society of Hospital Medicine

Readmission Analysis Using Fault Tree
As physicians strive to increase the value of healthcare delivery, there has been increased focus on improving the quality of care that patients receive while lowering per capita costs. A provision of the Affordable Care Act implemented in 2012 identified all‐cause 30‐day readmission rates as a measure of hospital quality, and as part of the Act's Hospital Readmission and Reduction Program, Medicare now penalizes hospitals with higher than expected all‐cause readmissions rates for adult patients with certain conditions by lowering reimbursements.[1] Although readmissions are not yet commonly used to determine reimbursements for pediatric hospitals, several states are penalizing higher than expected readmission rates for Medicaid enrollees,[2, 3] using an imprecise algorithm to determine which readmissions resulted from low‐quality care during the index admission.[4, 5, 6]
There is growing concern, however, that readmission rates are not an accurate gauge of the quality of care patients receive while in the hospital or during the discharge process to prepare them for their transition home.[7, 8, 9, 10] This is especially true in pediatric settings, where overall readmission rates are much lower than in adult settings, many readmissions are expected as part of a patient's planned course of care, and variation in readmission rates between hospitals is correlated with the percentage of patients with certain complex chronic conditions.[1, 7, 11] Thus, there is increasing agreement that hospitals and external evaluators need to shift the focus from all‐cause readmissions to a reliable, consistent, and fair measure of potentially preventable readmissions.[12, 13] In addition to being a more useful quality metric, analyzing preventable readmissions will help hospitals focus resources on patients with potentially modifiable risk factors and develop meaningful quality‐improvement initiatives to improve inpatient care as well as the discharge process to prepare families for their transition to home.[14]
Although previous studies have attempted to distinguish preventable from nonpreventable readmissions, many reported significant challenges in completing reviews efficiently, achieving consistency in how readmissions were classified, and attaining consensus on final determinations.[12, 13, 14] Studies have also demonstrated that the algorithms some states are using to streamline preventability reviews and determine reimbursements overestimate the rate of potentially preventable readmissions.[4, 5, 6]
To increase the efficiency of preventability reviews and reduce the subjectivity involved in reaching final determinations, while still accounting for the nuances necessary to conduct a fair review, a quality‐improvement team from the Division of General Pediatrics at The Children's Hospital of Philadelphia (CHOP) implemented a fault tree analysis tool based on a framework developed by Howard Parker at Intermountain Primary Children's Hospital. The CHOP team coded this framework into a secure Web‐based data‐collection tool in the form of a decision tree to guide reviewers through a logical progression of questions that result in 1 of 18 root causes of readmissions, 8 of which are considered potentially preventable. We hypothesized that this method would help reviewers efficiently reach consensus on the root causes of hospital readmissions, and thus help the division and the hospital focus efforts on developing relevant quality‐improvement initiatives.
METHODS
Inclusion Criteria and Study Design
This study was conducted at CHOP, a 535‐bed urban, tertiary‐care, freestanding children's hospital with approximately 29,000 annual discharges. Of those discharges, 7000 to 8000 are from the general pediatrics service, meaning that the attending of record was a general pediatrician. Patients were included in the study if (1) they were discharged from the general pediatrics service between January 2014 and December 2014, and (2) they were readmitted to the hospital, for any reason, within 15 days of discharge. Because this analysis was done as part of a quality‐improvement initiative, it focuses on 15‐day, early readmissions to target cases with a higher probability of being potentially preventable from the perspective of the hospital care team.[10, 12, 13] Patients under observation status during the index admission or the readmission were included. However, patients who returned to the emergency department but were not admitted to an inpatient unit were excluded. Objective details about each case, including the patient's name, demographics, chart number, and diagnosis code, were pre‐loaded from EPIC (Epic Systems Corp., Verona, WI) into REDCap (Research Electronic Data Capture;
A panel of 10 general pediatricians divided up the cases to perform retrospective chart reviews. For each case, REDCap guided reviewers through the fault tree analysis. Reviewers met monthly to discuss difficult cases and reach consensus on any identified ambiguities in the process. After all cases were reviewed once, 3 panel members independently reviewed a random selection of cases to measure inter‐rater reliability and confirm reproducibility of final determinations. The inter‐rater reliability statistic was calculated using Stata 12.1 (StataCorp LP, College Station, TX). During chart reviews, panel members were not blinded to the identity of physicians and other staff members caring for the patients under review. CHOP's institutional review board determined this study to be exempt from ongoing review.
Fault Tree Analysis
Using the decision tree framework for analyzing readmissions that was developed at Intermountain Primary Children's Hospital, the REDCap tool prompted reviewers with a series of sequential questions, each with mutually exclusive options. Using imbedded branching logic to select follow‐up questions, the tool guided reviewers to 1 of 18 terminal nodes, each representing a potential root cause of the readmission. Of those 18 potential causes, 8 were considered potentially preventable. A diagram of the fault tree framework, color coded to indicate which nodes were considered potentially preventable, is shown in Figure 1.

RESULTS
In 2014, 7252 patients were discharged from the general pediatrics service at CHOP. Of those patients, 248 were readmitted within 15 days for an overall general pediatrics 15‐day readmission rate of 3.4%.
Preventability Analysis
Of the 248 readmissions, 233 (94.0%) were considered not preventable. The most common cause for readmission, which accounted for 145 cases (58.5%), was a patient developing an unpredictable problem related to the index diagnosis or a natural progression of the disease that required readmission. The second most common cause, which accounted for 53 cases (21.4%), was a patient developing a new condition unrelated to the index diagnosis or a readmission unrelated to the quality of care received during the index stay. The third most frequent cause, which accounted for 11 cases (4.4%), was a legitimate nonclinical readmission due to lack of alternative resources, psychosocial or economic factors, or case‐specific factors. Other nonpreventable causes of readmission, including scheduled readmissions, each accounted for 7 or fewer cases and <3% of total readmissions.
The 15 readmissions considered potentially preventable accounted for 6.0% of total readmissions and 0.2% of total discharges from the general pediatrics service in 2014. The most common cause of preventable readmissions, which accounted for 6 cases, was premature discharge. The second most common cause, which accounted for 4 cases, was a problem resulting from nosocomial or iatrogenic factors. Other potentially preventable causes included delayed detection of problem (3 cases), inappropriate readmission (1 case), and inadequate postdischarge care planning (1 case).
A breakdown of fault tree results, including examples of cases associated with each terminal node, is shown in Table 1. Information about general pediatrics patients and readmitted patients is included in Tables 2 and 3. A breakdown of determinations for each reviewer is included in Supporting Table 1 in the online version of this article.
| Fault Tree Terminal Node | Root Cause of Readmission | No. of Cases | % of Total Readmissions | % Within Preventability Category | % of Total Discharges |
|---|---|---|---|---|---|
| |||||
| 2 (Potentially Preventable) | Problematic condition on discharge. Example:* Index admission: Infant with history of prematurity admitted with RSV and rhinovirus bronchiolitis. Had some waxing and waning symptoms. Just prior to discharge, noted to have increased work of breathing related to feeds. Readmission: 12 hours later with tachypnea, retractions, and hypoxia. | 6 | 2.4% | 40.0% | 0.08% |
| 3 (Potentially Preventable) | Nosocomial/Iatrogenic factors. Example*: Index admission: Toddler admitted with fever and neutropenia. Treated with antibiotics 24 hours. Diagnosed with viral illness and discharged home. Readmission: symptomatic Clostridum difficile infection. | 4 | 1.6% | 26.7% | 0.06% |
| 8 (Potentially Preventable) | Detection/treatment of problem was delayed and not appropriately facilitated. Example:* Index admission: Preteen admitted with abdominal pain, concern for appendicitis. Ultrasound and abdominal MRI negative for appendicitis. Symptoms improved. Tolerated PO. Readmission: 3 days later with similar abdominal pain. Diagnosed with constipation with significant improvement following clean‐out. | 3 | 1.2% | 20.0% | 0.04% |
| 1 (Potentially Preventable) | Inappropriate readmission. Example:* Index admission: Infant with laryngomalacia admitted with bronchiolitis. Readmission: Continued mild bronchiolitis symptoms but did not require oxygen or suctioning, normal CXR. | 1 | 0.4% | 6.7% | 0.01% |
| 5 (Potentially Preventable) | Resulted from inadequate postdischarge care planning. Example:* Index diagnosis: Infant with vomiting, prior admissions, and extensive evaluation, diagnosed with milk protein allergy and GERD. PPI increased. Readmission: Persistent symptoms, required NGT feeds supplementation. | 1 | 0.4% | 6.7% | 0.01% |
| 4 (Potentially Preventable) | Resulted from a preventable complication and hospital/physician did not take the appropriate steps to minimize likelihood of complication. | ||||
| 6 (Potentially Preventable) | Resulted from improper care by patient/family and effort by hospital/physician to ensure correct postdischarge care was inadequate. | ||||
| 7 (Potentially Preventable) | Resulted from inadequate care by community services and effort by hospital/physician to ensure correct postdischarge care was inadequate. | ||||
| 15 | 6.0% | 100% | 0.2% | ||
| 12 (Not Preventable) | Problem was unpredictable. Example:* Index admission: Infant admitted with gastroenteritis and dehydration with an anion gap metabolic acidosis. Vomiting and diarrhea improved, rehydrated, acidosis improved. Readmission: 1 day later, presented with emesis and fussiness. Readmitted for metabolic acidosis. | 145 | 58.5% | 62.2% | 2.00% |
| 10 (Not Preventable) | Patient developed new condition unrelated to index diagnosis or quality of care. Example:* Index admission: Toddler admitted with cellulitis. Readmission: Bronchiolitis (did not meet CDC guidelines for nosocomial infection). | 53 | 21.4% | 22.7% | 0.73% |
| 9 (Not Preventable) | Legitimate nonclinical readmission. Example:* Index admission: Infant admitted with second episode of bronchiolitis. Readmission: 4 days later with mild diarrhea. Tolerated PO challenge in emergency department. Admitted due to parental anxiety. | 11 | 4.4% | 4.7% | 0.15% |
| 17 (Not Preventable) | Problem resulted from improper care by patient/family but effort by hospital/physician to ensure correct postdischarge care was appropriate. Example:* Index admission: Infant admitted with diarrhea, diagnosed with milk protein allergy. Discharged on soy formula. Readmission: Developed vomiting and diarrhea with cow milk formula. | 7 | 2.8% | 3.0% | 0.10% |
| 11 (Not Preventable) | Scheduled readmission. Example:* Index admission: Infant with conjunctivitis and preseptal cellulitis with nasolacrimal duct obstruction. Readmission: Postoperatively following scheduled nasolacrimal duct repair. | 7 | 2.8% | 3.0% | 0.10% |
| 14 (Not Preventable) | Detection/treatment of problem was delayed, but earlier detection was not feasible. Example:* Index admission: Preteen admitted with fever, abdominal pain, and elevated inflammatory markers. Fever resolved and symptoms improved. Diagnosed with unspecified viral infection. Readmission: 4 days later with lower extremity pyomyositis and possible osteomyelitis. | 4 | 1.6% | 1.7% | 0.06% |
| 15 (Not Preventable) | Detection/treatment of problem was delayed, earlier detection was feasible, but detection was appropriately facilitated. Example:* Index admission: Infant with history of laryngomalacia and GER admitted with an ALTE. No events during hospitalization. Appropriate workup and cleared by consultants for discharge. Zantac increased. Readmission: Infant had similar ALTE events within a week after discharge. Ultimately underwent supraglottoplasty. | 2 | 0.8% | 0.9% | 0.03% |
| 13 (Not Preventable) | Resulted from preventable complication but efforts to minimize likelihood were appropriate. Example:* Index admission: Patient on GJ feeds admitted for dislodged GJ. Extensive conversations between primary team and multiple consulting services regarding best type of tube. Determined that no other tube options were appropriate. Temporizing measures were initiated. Readmission: GJ tube dislodged again. | 2 | 0.8% | 0.9% | 0.03% |
| 18 (Not Preventable) | Resulted from medication side effect (after watch period). Example:* Index admission: Preteen with MSSA bacteremia spread to other organs. Sent home on appropriate IV antibiotics. Readmission: Fever, rash, increased LFTs. Blood cultures negative. Presumed drug reaction. Fevers resolved with alternate medication. | 2 | 0.8% | 0.9% | 0.03% |
| 16 (Not Preventable) | Resulted from inadequate care by community services, but effort by hospital/physician to ensure correct postdischarge care was appropriate. | ||||
| 233 | 94.0% | 100% | 3.2% | ||
| Fault Tree Terminal Node | Root Cause of Potentially Preventable Readmission with Case Descriptions* |
|---|---|
| |
| 2 (Potentially Preventable) | Problematic condition on discharge |
| Case 1: Index admission: Infant with history of prematurity admitted with RSV and rhinovirus bronchiolitis. Had some waxing and waning symptoms. Just prior to discharge, noted to have increased work of breathing related to feeds. Readmission: 12 hours later with tachypnea, retractions, and hypoxia. | |
| Case 2: Index admission: Toddler admitted with febrile seizure in setting of gastroenteritis. Poor PO intake during hospitalization. Readmission: 1 day later with dehydration. | |
| Case 3: Index admission: Infant admitted with a prolonged complex febrile seizure. Workup included an unremarkable lumbar puncture. No additional seizures. No inpatient imaging obtained. Readmission: Abnormal outpatient MRI requiring intervention. | |
| Case 4: Index admission: Teenager with wheezing and history of chronic daily symptoms. Discharged <24 hours later on albuterol every 4 hours and prednisone. Readmission: 1 day later, seen by primary care physician with persistent asthma flare. | |
| Case 5: Index admission: Exfull‐term infant admitted with bronchiolitis, early in course. At time of discharge, had been off oxygen for 24 hours, but last recorded respiratory rate was >70. Readmission: 1 day later due to continued tachypnea and increased work of breathing. No hypoxia. CXR normal. | |
| Case 6: Exfull‐term infant admitted with bilious emesis, diarrhea, and dehydration. Ultrasound of pylorus, UGI, and BMP all normal. Tolerated oral intake but had emesis and loose stools prior to discharge. Readmission: <48 hours later with severe metabolic acidosis. | |
| 3 (Potentially Preventable) | Nosocomial/ematrogenic factors |
| Case 1: Index admission: Toddler admitted with fever and neutropenia. Treated with antibiotics 24 hours. Diagnosed with viral illness and discharged home. Readmission: Symptomatic Clostridum difficile infection. | |
| Case 2: Index admission: Patient with autism admitted with viral gastroenteritis. Readmission: Presumed nosocominal upper respiratory infection. | |
| Case 3: Index admission: Infant admitted with bronchiolitis. Recovered from initial infection. Readmission: New upper respiratory infection and presumed nosocomial infection. | |
| Case 4: Index admission: <28‐day‐old full‐term neonate presenting with neonatal fever and rash. Full septic workup performed and all cultures negative at 24 hours. Readmission: CSF culture positive at 36 hours and readmitted while awaiting speciation. Discharged once culture grew out a contaminant. | |
| 8 (Potentially Preventable) | Detection/treatment of problem was delayed and/or not appropriately facilitated |
| Case 1: Index admission: Preteen admitted with abdominal pain, concern for appendicitis. Ultrasound and MRI abdomen negative for appendicitis. Symptoms improved. Tolerated PO. Readmission: 3 days later with similar abdominal pain. Diagnosed with constipation with significant improvement following clean‐out. | |
| Case 2: Index admission: Infant with history of macrocephaly presented with fever and full fontanelle. Head CT showed mild prominence of the extra‐axial space, and lumbar puncture was normal. Readmission: Patient developed torticollis. MRI demonstrated a malignant lesion. | |
| Case 3: Index admission: School‐age child with RLQ abdominal pain, fever, leukocytosis, and indeterminate RLQ abdominal ultrasound. Twelve‐hour observation with no further fevers. Pain and appetite improved. Readmission: 1 day later with fever, anorexia, and abdominal pain. RLQ ultrasound unchanged. Appendectomy performed with inflamed appendix. | |
| 1 (Potentially Preventable) | Inappropriate readmission |
| Case 1: Index admission: Infant with laryngomalacia admitted with bronchiolitis. Readmission: Continued mild bronchiolitis symptoms but did not require oxygen or suctioning. Normal CXR. | |
| 5 (Potentially Preventable) | Resulted from inadequate postdischarge care planning |
| Case 1: Index diagnosis: Infant with vomiting, prior admissions, and extensive evaluation, diagnosed with milk protein allergy and GERD. PPI increased. Readmission: Persistent symptoms, required NGT feeds supplementation. | |
| All General Pediatrics Patients in 2014 | General Pediatric Readmitted Patients in 2014 | ||||
|---|---|---|---|---|---|
| Major Diagnosis Category at Index Admission | No. | % | Major Diagnosis Category at Index Admission | No. | % |
| |||||
| Respiratory | 2,723 | 37.5% | Respiratory | 79 | 31.9% |
| Digestive | 748 | 10.3% | Digestive | 41 | 16.5% |
| Ear, nose, mouth, throat | 675 | 9.3% | Ear, nose, mouth, throat | 24 | 9.7% |
| Skin, subcutaneous tissue | 480 | 6.6% | Musculoskeletal and connective tissue | 14 | 5.6% |
| Infectious, parasitic, systemic | 455 | 6.3% | Nervous | 13 | 5.2% |
| Factors influencing health status | 359 | 5.0% | Endocrine, nutritional, metabolic | 13 | 5.2% |
| Endocrine, nutritional, metabolic | 339 | 4.7% | Infectious, parasitic, systemic | 12 | 4.8% |
| Nervous | 239 | 3.3% | Newborn, neonate, perinatal period | 11 | 4.4% |
| Musculoskeletal and connective tissue | 228 | 3.1% | Hepatobiliary system and pancreas | 8 | 3.2% |
| Newborn, neonate, perinatal period | 206 | 2.8% | Skin, subcutaneous tissue | 8 | 3.2% |
| Other* | 800 | 11.0% | Other | 25 | 10.1% |
| Total | 7,252 | 100% | Total | 248 | 100% |
Inter‐Rater Reliability Analysis
A random selection of 50 cases (20% of total readmissions) was selected for a second review to test the tool's inter‐rater reliability. The second review resulted in the same terminal node for 44 (86%) of the cross‐checked files ( = 0.79; 95% confidence interval: 0.60‐0.98). Of the 6 cross‐checked files that ended at different nodes, 5 resulted in the same final determination about preventability. Only 1 of the cross‐checks (2% of total cross‐checked files) resulted in a different conclusion about preventability.
Efficiency Analysis
Reviewers reported that using the tool to reach a determination about preventability took approximately 20 minutes per case. Thus, initial reviews on the 248 cases required approximately 82.6 reviewer hours. Divided across 10 reviewers, this resulted in 8 to 9 hours of review time per reviewer over the year.
DISCUSSION
As part of an effort to direct quality‐improvement initiatives, this project used a Web‐based fault tree tool to identify root causes of general pediatrics readmissions at a freestanding children's hospital and classify them as either preventable or not preventable. The project also investigated the efficiency and inter‐rater reliability of the tool, which was designed to systematically guide physicians through the chart review process to a final determination about preventability. The project confirmed that using the tool helped reviewers reach final determinations about preventability efficiently with a high degree of consistency. It also confirmed that only a very small percentage of general pediatrics 15‐day readmissions are potentially preventable. Specifically, potentially preventable readmissions accounted for only 6.0% of total readmissions and 0.2% of general pediatrics discharges in 2014. Although our analysis focused on 15‐day readmissions, the fault tree methodology can be applied to any timeframe.
Previous studies attempting to distinguish preventable from nonpreventable readmissions, which used a range of methodologies to reach final determinations, reported that their review process was both time intensive and highly subjective. One study, which had 4 reviewers independently review charts and assign each case a preventability score on a 5‐point Likert scale, reported that reviewers disagreed on the final determination in 62.5% of cases.[12] Another study had 2 physicians independently review a selection of cases and assign a preventability score on a scale from 0 to 3. Scores for the 2 reviewers were added together, and cases above a certain composite threshold were classified as preventable. Despite being time‐intensive, this method resulted in only moderate agreement among physicians about the likelihood of preventability (weighted statistic of 0.44).[14] A more recent study, in which 2 physicians independently classified readmissions into 1 of 4 predefined categories, also reported only moderate agreement between reviewers ( = 0.44).[13] Other methods that have been reported include classifying readmissions as preventable only if multiple reviewers independently agreed, and using a third reviewer as a tie‐breaker.[14]
In an attempt to identify potentially preventable readmissions without using chart reviews, 3M (St. Paul, MN) developed its Potentially Preventable Readmissions software (3M‐PPR), which uses administrative data to identify which readmissions were potentially preventable. Although this automated approach is less time intensive, evidence suggests that due to a lack of nuance, the algorithm significantly overestimates the percentage of readmissions that are potentially preventable.[4, 5] A study that used 3M‐PPR to assess 1.7 million hospitalizations across 58 children's hospitals found that the algorithm classified 81% of sickle cell crisis and asthma readmissions, and 83% of bronchiolitis readmissions as potentially preventable.[10, 11] However, many readmissions for asthma and bronchiolitis are due to social factors that are outside of a hospital's direct control,[4, 5] and at many hospitals, readmissions for sickle cell crisis are part of a high‐value care model that weighs length of stay against potential readmissions. In addition, when assessing readmissions 7, 15, and 30 days after discharge, the algorithm classified almost the same percentage as potentially preventable, which is inconsistent with the notion that readmissions are more likely to have been preventable if they occurred closer to the initial discharge.[4, 13] Another study that assessed the performance of the software in the adult population reported that the algorithm performed with 85% sensitivity, but only 28% specificity.[5, 6]
The results of this quality‐improvement project indicate that using the fault tree tool to guide physicians through the chart review process helped address some of the shortcomings of methods reported in previous studies, by increasing the efficiency and reducing the subjectivity of final determinations, while still accounting for the nuances necessary to conduct a fair review. Because the tool provided a systematic framework for reviews, each case was completed in approximately 20 minutes, and because the process was the same for all reviewers, inter‐rater reliability was extremely high. In 86% of cross‐checked cases, the second reviewer ended at the same terminal node in the decision tree as the original reviewer, and in 98% of cross‐checked cases the second reviewer reached the same conclusion about preventability, even if they did not end at the same terminal node. Even accounting for agreement due to chance, the statistic of 0.79 confirmed that there was substantial agreement among reviewers about final determinations. Because the tool is easily adaptable, other hospitals can adopt this framework for their own preventability reviews and quality‐improvement initiatives.
Using the fault tree tool to access root causes of all 15‐day general pediatric readmissions helped the division focus quality‐improvement efforts on the most common causes of potentially preventable readmissions. Because 40% of potentially preventable readmissions were due to premature discharges, this prompted quality‐improvement teams to focus efforts on improving and clarifying the division's discharge criteria and clinical pathways. The division also initiated processes to improve discharge planning, including improved teaching of discharge instructions and having families pick up prescriptions prior to discharge.
Although these results did help the division identify a few areas of focus to potentially reduce readmissions, the fact that the overall 15‐day readmission rate for general pediatrics, as well as the percentage of readmissions and total discharges that were deemed potentially preventable, were so low (3.4%, 6.0%, and 0.2%, respectively), supports those who question whether prioritizing pediatric readmissions is the best place for hospitals to focus quality‐improvement efforts.[10, 12, 15, 16] As these results indicate, most pediatric readmissions are not preventable, and thus consistent with an efficient, effective, timely, patient‐centered, and equitable health system. Other studies have also shown that because overall and condition‐specific readmissions at pediatric hospitals are low, few pediatric hospitals are high or low performing for readmissions, and thus readmission rates are likely not a good measure of hospital quality.[8]
However, other condition‐specific studies of readmissions in pediatrics have indicated that there are some areas of opportunity to identify populations at high risk for readmission. One study found that although pneumonia‐specific 30‐day readmission rates in a national cohort of children hospitalized with pneumonia was only 3.1%, the chances of readmission were higher for children <1 year old, children with chronic comorbidities or complicated pneumonia, and children cared for in hospitals with lower volumes of pneumonia admissions.[17] Another study found that 17.1% of adolescents in a statewide database were readmitted post‐tonsillectomy for pain, nausea, and dehydration.[18] Thus, adapting the tool to identify root causes of condition‐specific or procedure‐specific readmissions, especially for surgical patients, may be an area of opportunity for future quality‐improvement efforts.[5] However, for general pediatrics, shifting the focus from reducing readmissions to improving the quality of care patients receive in the hospital, improving the discharge process, and adopting a population health approach to mitigate external risk factors, may be appropriate.
This project was subject to limitations. First, because it was conducted at a single site and only on general pediatrics patients, results may not be generalizable to other hospitals or other pediatric divisions. Thus, future studies might use the fault tree framework to assess preventability of pediatric readmissions in other divisions or specialties. Second, because readmissions to other hospitals were not included in the sample, the overall readmissions rate is likely underestimated.[19] However, it is unclear how this would affect the rate of potentially preventable readmissions. Third, although the fault tree framework reduced the subjectivity of the review process, there is still a degree of subjectivity inherent at each decision node. To minimize this, reviewers should try to discuss and come to consensus on how they are making determinations at each juncture in the decision tree. Similarly, because reviewers' answers to decision‐tree questions rely heavily on chart documentation, reviews may be compromised by unclear or incomplete documentation. For example, if information about steps the hospital team took to prepare a family for discharge were not properly documented, it would be difficult to determine whether appropriate steps were taken to minimize the likelihood of a complication. In the case of insufficient documentation of relevant social concerns, cases may be incorrectly classified as preventable, because addressing social issues is often not within a hospital's direct control. Finally, because reviewers were not blinded to the original discharging physician, there may have been some unconscious bias of unknown direction in the reviews.
CONCLUSION
Using the Web‐based fault tree tool helped physicians to identify the root causes of hospital readmissions and classify them as preventable or not preventable in a standardized, efficient, and consistent way, while still accounting for the nuances necessary to conduct a fair review. Thus, other hospitals should consider adopting this framework for their own preventability reviews and quality‐improvement initiatives. However, this project also confirmed that only a very small percentage of general pediatrics 15‐day readmissions are potentially preventable, suggesting that general pediatrics readmissions are not an appropriate measure of hospital quality. Instead, adapting the tool to identify root causes of condition‐specific or procedure‐specific readmission rates may be an area of opportunity for future quality‐improvement efforts.
Disclosures: This work was supported through internal funds from The Children's Hospital of Philadelphia. The authors have no financial interests, relationships or affiliations relevant to the subject matter or materials discussed in the article to disclose. The authors have no potential conflicts of interest relevant to the subject matter or materials discussed in the article to disclose.
- , . Pediatric readmissions as a hospital quality measure. JAMA. 2013;309(4):396–398.
- Texas Health and Human Services Commission. Potentially preventable readmissions in the Texas Medicaid population, state fiscal year 2012. Available at: http://www.hhsc.state.tx.us/reports/2013/ppr‐report.pdf. Published November 2013. Accessed August 16, 2015.
- Illinois Department of Healthcare and Family Services. Quality initiative to reduce hospital potentially preventable readmissions (PPR): Status update. Available at: http://www.illinois.gov/hfs/SiteCollectionDocuments/PPRPolicyStatusUpdate.pdf. Published September 3, 2014. Accessed August 16, 2015.
- , , , et al. Rates and impact of potentially preventable readmissions at children's hospitals. J Pediatr. 2015;166(3):613–619.e615.
- , . Preventing pediatric readmissions: which ones and how? J Pediatr. 2015;166(3):519–520.
- , , , , , . Manual and automated methods for identifying potentially preventable readmissions: a comparison in a large healthcare system. BMC Med Inform Decis Mak. 2014;14:28.
- , . Section on hospital medicine leadership and staff. Hosp Pediatr. 2013;3(4):390–393.
- , , , et al. Measuring hospital quality using pediatric readmission and revisit rates. Pediatrics. 2013;132(3):429–436.
- , . Hospital readmissions—not just a measure of quality. JAMA. 2011;306(16):1796–1797.
- , . Preventing readmissions in children: how do we do that? Hosp Pediatr. 2015;5(11):602–604.
- , , , et al. Pediatric readmission prevalence and variability across hospitals. JAMA. 2013;309(4):372–380.
- , , , , , . Preventability of early readmissions at a children's hospital. Pediatrics. 2013;131(1):e171–e181.
- , , , et al. An examination of physician‐, caregiver‐, and disease‐related factors associated with readmission from a pediatric hospital medicine service. Hosp Pediatr. 2015;5(11):566–573.
- , , , et al. Clinical preventability of 30‐day readmission after percutaneous coronary intervention. J Am Heart Assoc. 2014;3(5):e001290.
- . 3M algorithm overestimates preventable pediatric readmissions. Hospitalist News website. Available at: http://www.ehospitalistnews.com/specialty‐focus/pediatrics/single‐article‐page/3m‐algorithm‐overestimates‐preventable‐pediatric‐readmissions.html. Published August 16, 2013. Accessed August 16, 2015.
- . The 30‐day readmission rate: not a quality measure but an accountability measure. An Ounce of Evidence: Health Policy blog. Available at: https://blogs.sph.harvard.edu/ashish‐jha/?s=30‐day+readmission+rate. Published February 14, 2013. Accessed August 16, 2015.
- , , , et al. Readmissions among children previously hospitalized with pneumonia. Pediatrics. 2014;134(1):100–109.
- , , . A population‐based study of acute care revisits following tonsillectomy. J Pediatr. 2015;166(3):607–612.e605.
- , , , et al. Same‐hospital readmission rates as a measure of pediatric quality of care. JAMA Pediatr. 2015;169(10):905–912.
As physicians strive to increase the value of healthcare delivery, there has been increased focus on improving the quality of care that patients receive while lowering per capita costs. A provision of the Affordable Care Act implemented in 2012 identified all‐cause 30‐day readmission rates as a measure of hospital quality, and as part of the Act's Hospital Readmission and Reduction Program, Medicare now penalizes hospitals with higher than expected all‐cause readmissions rates for adult patients with certain conditions by lowering reimbursements.[1] Although readmissions are not yet commonly used to determine reimbursements for pediatric hospitals, several states are penalizing higher than expected readmission rates for Medicaid enrollees,[2, 3] using an imprecise algorithm to determine which readmissions resulted from low‐quality care during the index admission.[4, 5, 6]
There is growing concern, however, that readmission rates are not an accurate gauge of the quality of care patients receive while in the hospital or during the discharge process to prepare them for their transition home.[7, 8, 9, 10] This is especially true in pediatric settings, where overall readmission rates are much lower than in adult settings, many readmissions are expected as part of a patient's planned course of care, and variation in readmission rates between hospitals is correlated with the percentage of patients with certain complex chronic conditions.[1, 7, 11] Thus, there is increasing agreement that hospitals and external evaluators need to shift the focus from all‐cause readmissions to a reliable, consistent, and fair measure of potentially preventable readmissions.[12, 13] In addition to being a more useful quality metric, analyzing preventable readmissions will help hospitals focus resources on patients with potentially modifiable risk factors and develop meaningful quality‐improvement initiatives to improve inpatient care as well as the discharge process to prepare families for their transition to home.[14]
Although previous studies have attempted to distinguish preventable from nonpreventable readmissions, many reported significant challenges in completing reviews efficiently, achieving consistency in how readmissions were classified, and attaining consensus on final determinations.[12, 13, 14] Studies have also demonstrated that the algorithms some states are using to streamline preventability reviews and determine reimbursements overestimate the rate of potentially preventable readmissions.[4, 5, 6]
To increase the efficiency of preventability reviews and reduce the subjectivity involved in reaching final determinations, while still accounting for the nuances necessary to conduct a fair review, a quality‐improvement team from the Division of General Pediatrics at The Children's Hospital of Philadelphia (CHOP) implemented a fault tree analysis tool based on a framework developed by Howard Parker at Intermountain Primary Children's Hospital. The CHOP team coded this framework into a secure Web‐based data‐collection tool in the form of a decision tree to guide reviewers through a logical progression of questions that result in 1 of 18 root causes of readmissions, 8 of which are considered potentially preventable. We hypothesized that this method would help reviewers efficiently reach consensus on the root causes of hospital readmissions, and thus help the division and the hospital focus efforts on developing relevant quality‐improvement initiatives.
METHODS
Inclusion Criteria and Study Design
This study was conducted at CHOP, a 535‐bed urban, tertiary‐care, freestanding children's hospital with approximately 29,000 annual discharges. Of those discharges, 7000 to 8000 are from the general pediatrics service, meaning that the attending of record was a general pediatrician. Patients were included in the study if (1) they were discharged from the general pediatrics service between January 2014 and December 2014, and (2) they were readmitted to the hospital, for any reason, within 15 days of discharge. Because this analysis was done as part of a quality‐improvement initiative, it focuses on 15‐day, early readmissions to target cases with a higher probability of being potentially preventable from the perspective of the hospital care team.[10, 12, 13] Patients under observation status during the index admission or the readmission were included. However, patients who returned to the emergency department but were not admitted to an inpatient unit were excluded. Objective details about each case, including the patient's name, demographics, chart number, and diagnosis code, were pre‐loaded from EPIC (Epic Systems Corp., Verona, WI) into REDCap (Research Electronic Data Capture;
A panel of 10 general pediatricians divided up the cases to perform retrospective chart reviews. For each case, REDCap guided reviewers through the fault tree analysis. Reviewers met monthly to discuss difficult cases and reach consensus on any identified ambiguities in the process. After all cases were reviewed once, 3 panel members independently reviewed a random selection of cases to measure inter‐rater reliability and confirm reproducibility of final determinations. The inter‐rater reliability statistic was calculated using Stata 12.1 (StataCorp LP, College Station, TX). During chart reviews, panel members were not blinded to the identity of physicians and other staff members caring for the patients under review. CHOP's institutional review board determined this study to be exempt from ongoing review.
Fault Tree Analysis
Using the decision tree framework for analyzing readmissions that was developed at Intermountain Primary Children's Hospital, the REDCap tool prompted reviewers with a series of sequential questions, each with mutually exclusive options. Using imbedded branching logic to select follow‐up questions, the tool guided reviewers to 1 of 18 terminal nodes, each representing a potential root cause of the readmission. Of those 18 potential causes, 8 were considered potentially preventable. A diagram of the fault tree framework, color coded to indicate which nodes were considered potentially preventable, is shown in Figure 1.
RESULTS
In 2014, 7252 patients were discharged from the general pediatrics service at CHOP. Of those patients, 248 were readmitted within 15 days for an overall general pediatrics 15‐day readmission rate of 3.4%.
Preventability Analysis
Of the 248 readmissions, 233 (94.0%) were considered not preventable. The most common cause for readmission, which accounted for 145 cases (58.5%), was a patient developing an unpredictable problem related to the index diagnosis or a natural progression of the disease that required readmission. The second most common cause, which accounted for 53 cases (21.4%), was a patient developing a new condition unrelated to the index diagnosis or a readmission unrelated to the quality of care received during the index stay. The third most frequent cause, which accounted for 11 cases (4.4%), was a legitimate nonclinical readmission due to lack of alternative resources, psychosocial or economic factors, or case‐specific factors. Other nonpreventable causes of readmission, including scheduled readmissions, each accounted for 7 or fewer cases and <3% of total readmissions.
The 15 readmissions considered potentially preventable accounted for 6.0% of total readmissions and 0.2% of total discharges from the general pediatrics service in 2014. The most common cause of preventable readmissions, which accounted for 6 cases, was premature discharge. The second most common cause, which accounted for 4 cases, was a problem resulting from nosocomial or iatrogenic factors. Other potentially preventable causes included delayed detection of problem (3 cases), inappropriate readmission (1 case), and inadequate postdischarge care planning (1 case).
A breakdown of fault tree results, including examples of cases associated with each terminal node, is shown in Table 1. Information about general pediatrics patients and readmitted patients is included in Tables 2 and 3. A breakdown of determinations for each reviewer is included in Supporting Table 1 in the online version of this article.
| Fault Tree Terminal Node | Root Cause of Readmission | No. of Cases | % of Total Readmissions | % Within Preventability Category | % of Total Discharges |
|---|---|---|---|---|---|
| |||||
| 2 (Potentially Preventable) | Problematic condition on discharge. Example:* Index admission: Infant with history of prematurity admitted with RSV and rhinovirus bronchiolitis. Had some waxing and waning symptoms. Just prior to discharge, noted to have increased work of breathing related to feeds. Readmission: 12 hours later with tachypnea, retractions, and hypoxia. | 6 | 2.4% | 40.0% | 0.08% |
| 3 (Potentially Preventable) | Nosocomial/Iatrogenic factors. Example*: Index admission: Toddler admitted with fever and neutropenia. Treated with antibiotics 24 hours. Diagnosed with viral illness and discharged home. Readmission: symptomatic Clostridum difficile infection. | 4 | 1.6% | 26.7% | 0.06% |
| 8 (Potentially Preventable) | Detection/treatment of problem was delayed and not appropriately facilitated. Example:* Index admission: Preteen admitted with abdominal pain, concern for appendicitis. Ultrasound and abdominal MRI negative for appendicitis. Symptoms improved. Tolerated PO. Readmission: 3 days later with similar abdominal pain. Diagnosed with constipation with significant improvement following clean‐out. | 3 | 1.2% | 20.0% | 0.04% |
| 1 (Potentially Preventable) | Inappropriate readmission. Example:* Index admission: Infant with laryngomalacia admitted with bronchiolitis. Readmission: Continued mild bronchiolitis symptoms but did not require oxygen or suctioning, normal CXR. | 1 | 0.4% | 6.7% | 0.01% |
| 5 (Potentially Preventable) | Resulted from inadequate postdischarge care planning. Example:* Index diagnosis: Infant with vomiting, prior admissions, and extensive evaluation, diagnosed with milk protein allergy and GERD. PPI increased. Readmission: Persistent symptoms, required NGT feeds supplementation. | 1 | 0.4% | 6.7% | 0.01% |
| 4 (Potentially Preventable) | Resulted from a preventable complication and hospital/physician did not take the appropriate steps to minimize likelihood of complication. | ||||
| 6 (Potentially Preventable) | Resulted from improper care by patient/family and effort by hospital/physician to ensure correct postdischarge care was inadequate. | ||||
| 7 (Potentially Preventable) | Resulted from inadequate care by community services and effort by hospital/physician to ensure correct postdischarge care was inadequate. | ||||
| 15 | 6.0% | 100% | 0.2% | ||
| 12 (Not Preventable) | Problem was unpredictable. Example:* Index admission: Infant admitted with gastroenteritis and dehydration with an anion gap metabolic acidosis. Vomiting and diarrhea improved, rehydrated, acidosis improved. Readmission: 1 day later, presented with emesis and fussiness. Readmitted for metabolic acidosis. | 145 | 58.5% | 62.2% | 2.00% |
| 10 (Not Preventable) | Patient developed new condition unrelated to index diagnosis or quality of care. Example:* Index admission: Toddler admitted with cellulitis. Readmission: Bronchiolitis (did not meet CDC guidelines for nosocomial infection). | 53 | 21.4% | 22.7% | 0.73% |
| 9 (Not Preventable) | Legitimate nonclinical readmission. Example:* Index admission: Infant admitted with second episode of bronchiolitis. Readmission: 4 days later with mild diarrhea. Tolerated PO challenge in emergency department. Admitted due to parental anxiety. | 11 | 4.4% | 4.7% | 0.15% |
| 17 (Not Preventable) | Problem resulted from improper care by patient/family but effort by hospital/physician to ensure correct postdischarge care was appropriate. Example:* Index admission: Infant admitted with diarrhea, diagnosed with milk protein allergy. Discharged on soy formula. Readmission: Developed vomiting and diarrhea with cow milk formula. | 7 | 2.8% | 3.0% | 0.10% |
| 11 (Not Preventable) | Scheduled readmission. Example:* Index admission: Infant with conjunctivitis and preseptal cellulitis with nasolacrimal duct obstruction. Readmission: Postoperatively following scheduled nasolacrimal duct repair. | 7 | 2.8% | 3.0% | 0.10% |
| 14 (Not Preventable) | Detection/treatment of problem was delayed, but earlier detection was not feasible. Example:* Index admission: Preteen admitted with fever, abdominal pain, and elevated inflammatory markers. Fever resolved and symptoms improved. Diagnosed with unspecified viral infection. Readmission: 4 days later with lower extremity pyomyositis and possible osteomyelitis. | 4 | 1.6% | 1.7% | 0.06% |
| 15 (Not Preventable) | Detection/treatment of problem was delayed, earlier detection was feasible, but detection was appropriately facilitated. Example:* Index admission: Infant with history of laryngomalacia and GER admitted with an ALTE. No events during hospitalization. Appropriate workup and cleared by consultants for discharge. Zantac increased. Readmission: Infant had similar ALTE events within a week after discharge. Ultimately underwent supraglottoplasty. | 2 | 0.8% | 0.9% | 0.03% |
| 13 (Not Preventable) | Resulted from preventable complication but efforts to minimize likelihood were appropriate. Example:* Index admission: Patient on GJ feeds admitted for dislodged GJ. Extensive conversations between primary team and multiple consulting services regarding best type of tube. Determined that no other tube options were appropriate. Temporizing measures were initiated. Readmission: GJ tube dislodged again. | 2 | 0.8% | 0.9% | 0.03% |
| 18 (Not Preventable) | Resulted from medication side effect (after watch period). Example:* Index admission: Preteen with MSSA bacteremia spread to other organs. Sent home on appropriate IV antibiotics. Readmission: Fever, rash, increased LFTs. Blood cultures negative. Presumed drug reaction. Fevers resolved with alternate medication. | 2 | 0.8% | 0.9% | 0.03% |
| 16 (Not Preventable) | Resulted from inadequate care by community services, but effort by hospital/physician to ensure correct postdischarge care was appropriate. | ||||
| 233 | 94.0% | 100% | 3.2% | ||
| Fault Tree Terminal Node | Root Cause of Potentially Preventable Readmission with Case Descriptions* |
|---|---|
| |
| 2 (Potentially Preventable) | Problematic condition on discharge |
| Case 1: Index admission: Infant with history of prematurity admitted with RSV and rhinovirus bronchiolitis. Had some waxing and waning symptoms. Just prior to discharge, noted to have increased work of breathing related to feeds. Readmission: 12 hours later with tachypnea, retractions, and hypoxia. | |
| Case 2: Index admission: Toddler admitted with febrile seizure in setting of gastroenteritis. Poor PO intake during hospitalization. Readmission: 1 day later with dehydration. | |
| Case 3: Index admission: Infant admitted with a prolonged complex febrile seizure. Workup included an unremarkable lumbar puncture. No additional seizures. No inpatient imaging obtained. Readmission: Abnormal outpatient MRI requiring intervention. | |
| Case 4: Index admission: Teenager with wheezing and history of chronic daily symptoms. Discharged <24 hours later on albuterol every 4 hours and prednisone. Readmission: 1 day later, seen by primary care physician with persistent asthma flare. | |
| Case 5: Index admission: Exfull‐term infant admitted with bronchiolitis, early in course. At time of discharge, had been off oxygen for 24 hours, but last recorded respiratory rate was >70. Readmission: 1 day later due to continued tachypnea and increased work of breathing. No hypoxia. CXR normal. | |
| Case 6: Exfull‐term infant admitted with bilious emesis, diarrhea, and dehydration. Ultrasound of pylorus, UGI, and BMP all normal. Tolerated oral intake but had emesis and loose stools prior to discharge. Readmission: <48 hours later with severe metabolic acidosis. | |
| 3 (Potentially Preventable) | Nosocomial/ematrogenic factors |
| Case 1: Index admission: Toddler admitted with fever and neutropenia. Treated with antibiotics 24 hours. Diagnosed with viral illness and discharged home. Readmission: Symptomatic Clostridum difficile infection. | |
| Case 2: Index admission: Patient with autism admitted with viral gastroenteritis. Readmission: Presumed nosocominal upper respiratory infection. | |
| Case 3: Index admission: Infant admitted with bronchiolitis. Recovered from initial infection. Readmission: New upper respiratory infection and presumed nosocomial infection. | |
| Case 4: Index admission: <28‐day‐old full‐term neonate presenting with neonatal fever and rash. Full septic workup performed and all cultures negative at 24 hours. Readmission: CSF culture positive at 36 hours and readmitted while awaiting speciation. Discharged once culture grew out a contaminant. | |
| 8 (Potentially Preventable) | Detection/treatment of problem was delayed and/or not appropriately facilitated |
| Case 1: Index admission: Preteen admitted with abdominal pain, concern for appendicitis. Ultrasound and MRI abdomen negative for appendicitis. Symptoms improved. Tolerated PO. Readmission: 3 days later with similar abdominal pain. Diagnosed with constipation with significant improvement following clean‐out. | |
| Case 2: Index admission: Infant with history of macrocephaly presented with fever and full fontanelle. Head CT showed mild prominence of the extra‐axial space, and lumbar puncture was normal. Readmission: Patient developed torticollis. MRI demonstrated a malignant lesion. | |
| Case 3: Index admission: School‐age child with RLQ abdominal pain, fever, leukocytosis, and indeterminate RLQ abdominal ultrasound. Twelve‐hour observation with no further fevers. Pain and appetite improved. Readmission: 1 day later with fever, anorexia, and abdominal pain. RLQ ultrasound unchanged. Appendectomy performed with inflamed appendix. | |
| 1 (Potentially Preventable) | Inappropriate readmission |
| Case 1: Index admission: Infant with laryngomalacia admitted with bronchiolitis. Readmission: Continued mild bronchiolitis symptoms but did not require oxygen or suctioning. Normal CXR. | |
| 5 (Potentially Preventable) | Resulted from inadequate postdischarge care planning |
| Case 1: Index diagnosis: Infant with vomiting, prior admissions, and extensive evaluation, diagnosed with milk protein allergy and GERD. PPI increased. Readmission: Persistent symptoms, required NGT feeds supplementation. | |
| All General Pediatrics Patients in 2014 | General Pediatric Readmitted Patients in 2014 | ||||
|---|---|---|---|---|---|
| Major Diagnosis Category at Index Admission | No. | % | Major Diagnosis Category at Index Admission | No. | % |
| |||||
| Respiratory | 2,723 | 37.5% | Respiratory | 79 | 31.9% |
| Digestive | 748 | 10.3% | Digestive | 41 | 16.5% |
| Ear, nose, mouth, throat | 675 | 9.3% | Ear, nose, mouth, throat | 24 | 9.7% |
| Skin, subcutaneous tissue | 480 | 6.6% | Musculoskeletal and connective tissue | 14 | 5.6% |
| Infectious, parasitic, systemic | 455 | 6.3% | Nervous | 13 | 5.2% |
| Factors influencing health status | 359 | 5.0% | Endocrine, nutritional, metabolic | 13 | 5.2% |
| Endocrine, nutritional, metabolic | 339 | 4.7% | Infectious, parasitic, systemic | 12 | 4.8% |
| Nervous | 239 | 3.3% | Newborn, neonate, perinatal period | 11 | 4.4% |
| Musculoskeletal and connective tissue | 228 | 3.1% | Hepatobiliary system and pancreas | 8 | 3.2% |
| Newborn, neonate, perinatal period | 206 | 2.8% | Skin, subcutaneous tissue | 8 | 3.2% |
| Other* | 800 | 11.0% | Other | 25 | 10.1% |
| Total | 7,252 | 100% | Total | 248 | 100% |
Inter‐Rater Reliability Analysis
A random selection of 50 cases (20% of total readmissions) was selected for a second review to test the tool's inter‐rater reliability. The second review resulted in the same terminal node for 44 (86%) of the cross‐checked files ( = 0.79; 95% confidence interval: 0.60‐0.98). Of the 6 cross‐checked files that ended at different nodes, 5 resulted in the same final determination about preventability. Only 1 of the cross‐checks (2% of total cross‐checked files) resulted in a different conclusion about preventability.
Efficiency Analysis
Reviewers reported that using the tool to reach a determination about preventability took approximately 20 minutes per case. Thus, initial reviews on the 248 cases required approximately 82.6 reviewer hours. Divided across 10 reviewers, this resulted in 8 to 9 hours of review time per reviewer over the year.
DISCUSSION
As part of an effort to direct quality‐improvement initiatives, this project used a Web‐based fault tree tool to identify root causes of general pediatrics readmissions at a freestanding children's hospital and classify them as either preventable or not preventable. The project also investigated the efficiency and inter‐rater reliability of the tool, which was designed to systematically guide physicians through the chart review process to a final determination about preventability. The project confirmed that using the tool helped reviewers reach final determinations about preventability efficiently with a high degree of consistency. It also confirmed that only a very small percentage of general pediatrics 15‐day readmissions are potentially preventable. Specifically, potentially preventable readmissions accounted for only 6.0% of total readmissions and 0.2% of general pediatrics discharges in 2014. Although our analysis focused on 15‐day readmissions, the fault tree methodology can be applied to any timeframe.
Previous studies attempting to distinguish preventable from nonpreventable readmissions, which used a range of methodologies to reach final determinations, reported that their review process was both time intensive and highly subjective. One study, which had 4 reviewers independently review charts and assign each case a preventability score on a 5‐point Likert scale, reported that reviewers disagreed on the final determination in 62.5% of cases.[12] Another study had 2 physicians independently review a selection of cases and assign a preventability score on a scale from 0 to 3. Scores for the 2 reviewers were added together, and cases above a certain composite threshold were classified as preventable. Despite being time‐intensive, this method resulted in only moderate agreement among physicians about the likelihood of preventability (weighted statistic of 0.44).[14] A more recent study, in which 2 physicians independently classified readmissions into 1 of 4 predefined categories, also reported only moderate agreement between reviewers ( = 0.44).[13] Other methods that have been reported include classifying readmissions as preventable only if multiple reviewers independently agreed, and using a third reviewer as a tie‐breaker.[14]
In an attempt to identify potentially preventable readmissions without using chart reviews, 3M (St. Paul, MN) developed its Potentially Preventable Readmissions software (3M‐PPR), which uses administrative data to identify which readmissions were potentially preventable. Although this automated approach is less time intensive, evidence suggests that due to a lack of nuance, the algorithm significantly overestimates the percentage of readmissions that are potentially preventable.[4, 5] A study that used 3M‐PPR to assess 1.7 million hospitalizations across 58 children's hospitals found that the algorithm classified 81% of sickle cell crisis and asthma readmissions, and 83% of bronchiolitis readmissions as potentially preventable.[10, 11] However, many readmissions for asthma and bronchiolitis are due to social factors that are outside of a hospital's direct control,[4, 5] and at many hospitals, readmissions for sickle cell crisis are part of a high‐value care model that weighs length of stay against potential readmissions. In addition, when assessing readmissions 7, 15, and 30 days after discharge, the algorithm classified almost the same percentage as potentially preventable, which is inconsistent with the notion that readmissions are more likely to have been preventable if they occurred closer to the initial discharge.[4, 13] Another study that assessed the performance of the software in the adult population reported that the algorithm performed with 85% sensitivity, but only 28% specificity.[5, 6]
The results of this quality‐improvement project indicate that using the fault tree tool to guide physicians through the chart review process helped address some of the shortcomings of methods reported in previous studies, by increasing the efficiency and reducing the subjectivity of final determinations, while still accounting for the nuances necessary to conduct a fair review. Because the tool provided a systematic framework for reviews, each case was completed in approximately 20 minutes, and because the process was the same for all reviewers, inter‐rater reliability was extremely high. In 86% of cross‐checked cases, the second reviewer ended at the same terminal node in the decision tree as the original reviewer, and in 98% of cross‐checked cases the second reviewer reached the same conclusion about preventability, even if they did not end at the same terminal node. Even accounting for agreement due to chance, the statistic of 0.79 confirmed that there was substantial agreement among reviewers about final determinations. Because the tool is easily adaptable, other hospitals can adopt this framework for their own preventability reviews and quality‐improvement initiatives.
Using the fault tree tool to access root causes of all 15‐day general pediatric readmissions helped the division focus quality‐improvement efforts on the most common causes of potentially preventable readmissions. Because 40% of potentially preventable readmissions were due to premature discharges, this prompted quality‐improvement teams to focus efforts on improving and clarifying the division's discharge criteria and clinical pathways. The division also initiated processes to improve discharge planning, including improved teaching of discharge instructions and having families pick up prescriptions prior to discharge.
Although these results did help the division identify a few areas of focus to potentially reduce readmissions, the fact that the overall 15‐day readmission rate for general pediatrics, as well as the percentage of readmissions and total discharges that were deemed potentially preventable, were so low (3.4%, 6.0%, and 0.2%, respectively), supports those who question whether prioritizing pediatric readmissions is the best place for hospitals to focus quality‐improvement efforts.[10, 12, 15, 16] As these results indicate, most pediatric readmissions are not preventable, and thus consistent with an efficient, effective, timely, patient‐centered, and equitable health system. Other studies have also shown that because overall and condition‐specific readmissions at pediatric hospitals are low, few pediatric hospitals are high or low performing for readmissions, and thus readmission rates are likely not a good measure of hospital quality.[8]
However, other condition‐specific studies of readmissions in pediatrics have indicated that there are some areas of opportunity to identify populations at high risk for readmission. One study found that although pneumonia‐specific 30‐day readmission rates in a national cohort of children hospitalized with pneumonia was only 3.1%, the chances of readmission were higher for children <1 year old, children with chronic comorbidities or complicated pneumonia, and children cared for in hospitals with lower volumes of pneumonia admissions.[17] Another study found that 17.1% of adolescents in a statewide database were readmitted post‐tonsillectomy for pain, nausea, and dehydration.[18] Thus, adapting the tool to identify root causes of condition‐specific or procedure‐specific readmissions, especially for surgical patients, may be an area of opportunity for future quality‐improvement efforts.[5] However, for general pediatrics, shifting the focus from reducing readmissions to improving the quality of care patients receive in the hospital, improving the discharge process, and adopting a population health approach to mitigate external risk factors, may be appropriate.
This project was subject to limitations. First, because it was conducted at a single site and only on general pediatrics patients, results may not be generalizable to other hospitals or other pediatric divisions. Thus, future studies might use the fault tree framework to assess preventability of pediatric readmissions in other divisions or specialties. Second, because readmissions to other hospitals were not included in the sample, the overall readmissions rate is likely underestimated.[19] However, it is unclear how this would affect the rate of potentially preventable readmissions. Third, although the fault tree framework reduced the subjectivity of the review process, there is still a degree of subjectivity inherent at each decision node. To minimize this, reviewers should try to discuss and come to consensus on how they are making determinations at each juncture in the decision tree. Similarly, because reviewers' answers to decision‐tree questions rely heavily on chart documentation, reviews may be compromised by unclear or incomplete documentation. For example, if information about steps the hospital team took to prepare a family for discharge were not properly documented, it would be difficult to determine whether appropriate steps were taken to minimize the likelihood of a complication. In the case of insufficient documentation of relevant social concerns, cases may be incorrectly classified as preventable, because addressing social issues is often not within a hospital's direct control. Finally, because reviewers were not blinded to the original discharging physician, there may have been some unconscious bias of unknown direction in the reviews.
CONCLUSION
Using the Web‐based fault tree tool helped physicians to identify the root causes of hospital readmissions and classify them as preventable or not preventable in a standardized, efficient, and consistent way, while still accounting for the nuances necessary to conduct a fair review. Thus, other hospitals should consider adopting this framework for their own preventability reviews and quality‐improvement initiatives. However, this project also confirmed that only a very small percentage of general pediatrics 15‐day readmissions are potentially preventable, suggesting that general pediatrics readmissions are not an appropriate measure of hospital quality. Instead, adapting the tool to identify root causes of condition‐specific or procedure‐specific readmission rates may be an area of opportunity for future quality‐improvement efforts.
Disclosures: This work was supported through internal funds from The Children's Hospital of Philadelphia. The authors have no financial interests, relationships or affiliations relevant to the subject matter or materials discussed in the article to disclose. The authors have no potential conflicts of interest relevant to the subject matter or materials discussed in the article to disclose.
- , . Pediatric readmissions as a hospital quality measure. JAMA. 2013;309(4):396–398.
- Texas Health and Human Services Commission. Potentially preventable readmissions in the Texas Medicaid population, state fiscal year 2012. Available at: http://www.hhsc.state.tx.us/reports/2013/ppr‐report.pdf. Published November 2013. Accessed August 16, 2015.
- Illinois Department of Healthcare and Family Services. Quality initiative to reduce hospital potentially preventable readmissions (PPR): Status update. Available at: http://www.illinois.gov/hfs/SiteCollectionDocuments/PPRPolicyStatusUpdate.pdf. Published September 3, 2014. Accessed August 16, 2015.
- , , , et al. Rates and impact of potentially preventable readmissions at children's hospitals. J Pediatr. 2015;166(3):613–619.e615.
- , . Preventing pediatric readmissions: which ones and how? J Pediatr. 2015;166(3):519–520.
- , , , , , . Manual and automated methods for identifying potentially preventable readmissions: a comparison in a large healthcare system. BMC Med Inform Decis Mak. 2014;14:28.
- , . Section on hospital medicine leadership and staff. Hosp Pediatr. 2013;3(4):390–393.
- , , , et al. Measuring hospital quality using pediatric readmission and revisit rates. Pediatrics. 2013;132(3):429–436.
- , . Hospital readmissions—not just a measure of quality. JAMA. 2011;306(16):1796–1797.
- , . Preventing readmissions in children: how do we do that? Hosp Pediatr. 2015;5(11):602–604.
- , , , et al. Pediatric readmission prevalence and variability across hospitals. JAMA. 2013;309(4):372–380.
- , , , , , . Preventability of early readmissions at a children's hospital. Pediatrics. 2013;131(1):e171–e181.
- , , , et al. An examination of physician‐, caregiver‐, and disease‐related factors associated with readmission from a pediatric hospital medicine service. Hosp Pediatr. 2015;5(11):566–573.
- , , , et al. Clinical preventability of 30‐day readmission after percutaneous coronary intervention. J Am Heart Assoc. 2014;3(5):e001290.
- . 3M algorithm overestimates preventable pediatric readmissions. Hospitalist News website. Available at: http://www.ehospitalistnews.com/specialty‐focus/pediatrics/single‐article‐page/3m‐algorithm‐overestimates‐preventable‐pediatric‐readmissions.html. Published August 16, 2013. Accessed August 16, 2015.
- . The 30‐day readmission rate: not a quality measure but an accountability measure. An Ounce of Evidence: Health Policy blog. Available at: https://blogs.sph.harvard.edu/ashish‐jha/?s=30‐day+readmission+rate. Published February 14, 2013. Accessed August 16, 2015.
- , , , et al. Readmissions among children previously hospitalized with pneumonia. Pediatrics. 2014;134(1):100–109.
- , , . A population‐based study of acute care revisits following tonsillectomy. J Pediatr. 2015;166(3):607–612.e605.
- , , , et al. Same‐hospital readmission rates as a measure of pediatric quality of care. JAMA Pediatr. 2015;169(10):905–912.
© 2016 Society of Hospital Medicine
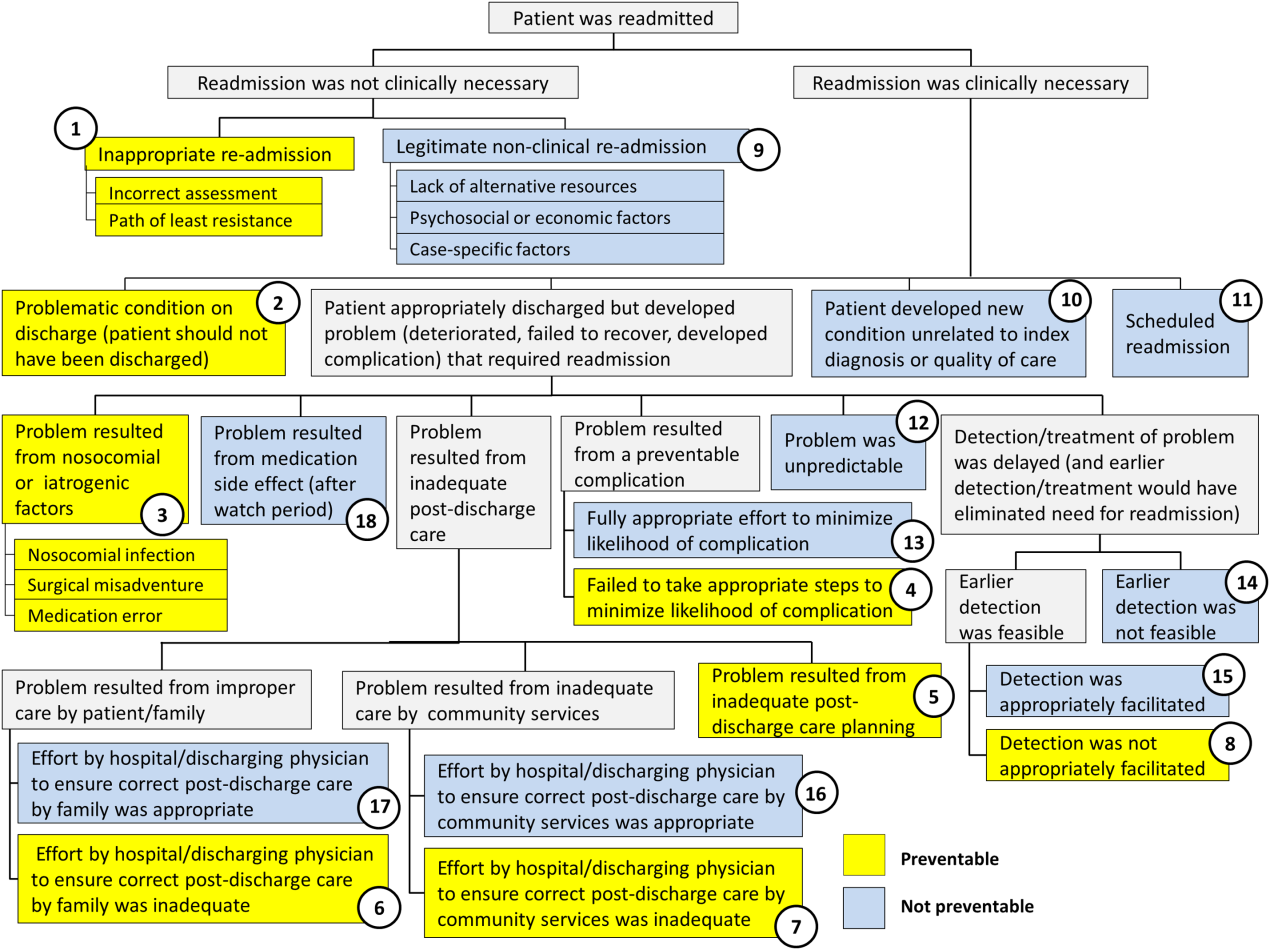
Novel Intraoperative Technique to Visualize the Lower Cervical Spine: A Case Series
Two adequate views of the lower cervical vertebrae are necessary to confirm the 3-dimensional location of any hardware placed during cervical spine fusion. Visualizing the lower cervical vertebrae in 2 planes intraoperatively is often a challenge because the shoulders obstruct the lateral view.1 Techniques have been described to improve lateral visualization, including gentle traction of the arms via wrist restraints or taping the shoulders down inferiorly.2,3 These techniques have their inadequacies, including an association with peripheral nerve injury and brachial plexopathy.4 In patients with stout necks, these methods may still be insufficient to achieve adequate visualization of the lower cervical vertebrae.
Invasive techniques to improve visualization have also been described. In 1 study, exposure had to be extended cephalad to allow for manual counting of cervical vertebrae when the mid- to lower cervical vertebrae had to be identified in a morbidly obese patient.5 More invasive spine procedures are associated with higher rates of complications, increased blood loss, more soft-tissue trauma, and longer hospital stays.6 We present a view 30º oblique from horizontal and 30º cephalad from neutral as a variation of the lateral radiograph that improves visualization of the mid- to lower cervical vertebrae. The authors have obtained the patients’ informed written consent for print and electronic publication of these case reports.
Technique
We used either the Smith-Robinson or Cloward approach to the anterior spine. Both techniques use the avascular plane between the medially located esophagus and trachea and the lateral sternocleidomastoid and carotid sheath to approach the anterior cervical spine. Once adequate exposure was achieved, standard anteroposterior and lateral radiographs were obtained to confirm the correct vertebral level. Gentle caudal traction was applied to the patient’s wrist straps, and when visualization continued to be compromised, a view 30º oblique from horizontal and 30º cephalad from neutral was obtained (Figure 1).
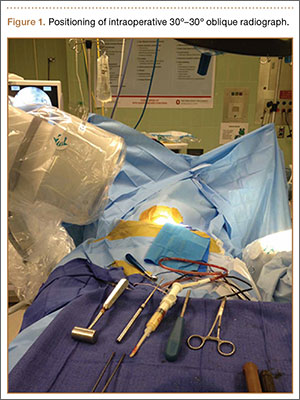
Case Series
Case 1
A 54-year-old man with a body mass index (BMI) of 50 presented with neck and bilateral arm pain, with left greater than right radicular symptoms in the C6 and C7 distribution. Magnetic resonance imaging (MRI) showed disc herniations at C5-C6 and C6-C7 with spinal cord signal changes, and he underwent a C5-C6 and C6-C7 anterior cervical discectomy and fusion. Initial localization was determined using a lateral radiograph and vertebral needle. During hardware placement, anteroposterior and lateral fluoroscopic radiographs confirmed adequate placement of the superior screw, but visualization of the inferior portion of the plate and inferior screw was challenging (Figure 2). Our oblique 30º–30º view provided better visualization of the plate and screws in the lower cervical vertebrae than lateral imaging, and allowed confirmation that the hardware was positioned correctly (Figure 3). It took 1 attempt to achieve adequate visualization with the 30º–30º view.
Postoperatively, the patient’s radiculopathy and motor weakness improved. Radiographs confirmed adequate hardware placement, and he was discharged on postoperative day 1 (Figure 4). Imaging at the patient’s 6-week follow-up confirmed adequate fusion from C5-C7, anatomically aligned facet joints, and no hardware failure. The patient’s Neck Disability Index was 31/50 preoperatively and 26/50 at this visit.

Case 2
A 51-year-old man with a BMI of 29 presented with a long-standing history of neck pain and bilateral arm pain left greater than right in the C6 and C7 dermomyotome. MRI showed a broad-based disc herniation with foraminal narrowing at C5-C6 and C6-C7, and the patient underwent a 2-level anterior cervical discectomy and fusion. This patient had pronounced neck musculature, and a deeper than normal incision was required.
Intraoperative lateral fluoroscopy was obtained to confirm the C5-C6 and C6-C7 level prior to discectomy. The musculature of the patient’s neck and shoulder made visualization of the C6-C7 disc space difficult on the lateral radiograph (Figure 5). One attempt was required to obtain the 30º–30º oblique view, which was used to ensure correct placement of the screws and plate (Figure 6).
Postoperatively, the patient’s pain had improved, and radiographs confirmed adequate hardware placement. He was discharged 1 day after surgery (Figure 7). Imaging at the patient’s 6-week follow-up confirmed adequate fusion from C5-C7, stable disc spaces, and anatomically aligned facet joints. His Neck Disability Index was 34/50 preoperatively and 32/50 at 2-week follow-up.
Discussion
The aim of this study was to describe an alternative to the lateral radiograph for imaging the cervical spine in patients with challenging anatomy or in procedures involving hardware placement at the lower cervical vertebrae. Techniques have been developed to assist with improved lateral visualization, including gentle traction of the arms via wrist restraints or taping the shoulders down inferiorly.2,3 However, visualization in 2 planes continues to be a challenge in a subset of patients. It is particularly difficult to obtain adequate lateral radiographs of the cervical spine in patients with stout necks.3 In patients with stout necks, there is more obstruction of the radiography path through the cervical spine. This leads to imaging that is unclear or may fail to show the mid- to lower cervical spine. The extent to which one should rely on the 30º–30º oblique technique for adequate visualization of the cervical spine depends on the anatomy of a particular patient. Historically, it is more challenging to obtain satisfactory lateral radiographs in patients with stout necks,3 and these patients have benefited the most from using the 30º–30º degree oblique view.
Lack of visualization can lead to aborted surgeries or, potentially, surgery at the wrong level.3 A 2008 American Academy of Neurological Surgeons survey indicated that 50% of spine surgeons had performed a wrong-level surgery at least once in their career, and the cervical spine accounted for 21% of all incorrect-level spine surgeries.7 Intraoperative factors reported during cases of wrong-level spinal surgeries included misinterpretation of intraoperative imaging, no intraoperative imaging, and unusual anatomy or physical characteristics.8 Such complications can lead to revision surgery and other significant morbidities for the patient.
In most patients, fluoroscopy allows confirmation of the correct level before disc incision.3 However, operating at a lower cervical level in a patient with a short neck or prominent shoulders poses a significant problem.3 A case report from Singh and colleagues9 described a modified intraoperative fluoroscopic view for spinal level localization at cervicothoracic levels. Their method focuses on identifying the bony lamina and using them as landmarks to count spinal levels, whereas our 30º–30º oblique image is useful for confirmation of adequate hardware placement during anterior cervical spinal fusions. Often, the initial localization of cervical vertebral levels can be achieved with a standard lateral radiograph. We recognized the utility of the 30º–30º oblique view when we were attempting to visualize the inferior aspect of the plate and inferior screw placement.
In patients with stout necks, a lateral radiograph may show only visualization down to C4 or C5.3 Even with applying traction to the arms or taping the shoulders down, it can be impossible to visualize C6, C7, or T1 because the shoulder bones and muscles obstruct the image.3 Using a 30º–30º oblique view, we were able to obtain adequate visualization and assess the accurate placement of hardware.
Conclusion
A 30º oblique view from horizontal and 30º cephalad from neutral radiograph can be used intraoperatively in patients with challenging anatomy to identify placement of hardware at the correct vertebral level in the lower cervical spine. It is a noninvasive technique that can help reduce the risk of wrong-site surgeries without prolonging operation time. This technique describes an alternative to the lateral radiograph and provides a solution to the difficult problem of intraoperative imaging of the mid- to lower cervical spine in 2 adequate planes.
1. Bebawy JF, Koht A, Mirkovic S. Anterior cervical spine surgery. In: Khot A, Sloan TB, Toleikis JR, eds. Monitoring the Nervous System for Anesthesiologists and Other Health Care Professionals. New York, NY: Springer; 2012:539-554.
2. Abumi K, Shono Y, Ito M, Taneichi H, Kotani Y, Kaneda K. Complications of pedicle screw fixation in reconstructive surgery of the cervical spine. Spine. 2000;25(8):962-969.
3. Irace C. Intraoperative imaging for verification of the correct level during spinal surgery. In: Fountas KN, ed. Novel Frontiers of Advanced Neuroimaging. Rijeka, Croatia: Intech; 2013:175-188.
4. Schwartz DM, Sestokas AK, Hilibrand AS, et al. Neurophysiological identification of position-induced neurologic injury during anterior cervical spine surgery. J Clin Monit Comput. 2006;20(6):437-444.
5. Telfeian AE, Reiter GT, Durham SR, Marcotte P. Spine surgery in morbidly obese patients. J Neurosurg Spine. 2002;97(1):20-24.
6. Oppenheimer JH, DeCastro I, McDonnell DE. Minimally invasive spine technology and minimally invasive spine surgery: a historical review. Neurosurg Focus. 2009;27(3):E9.
7. Mody MG, Nourbakhsh A, Stahl DL, Gibbs M, Alfawareh M, Garges KJ. The prevalence of wrong level surgery among spine surgeons. Spine. 2008;33(2):194.
8. Jhawar BS, Mitsis D, Duggal N. Wrong-sided and wrong-level neurosurgery: A national survey. J Neurosurg Spine. 2007;7(5):467-472.
9. Singh H, Meyer SA, Hecht AC, Jenkins AL 3rd. Novel fluoroscopic technique for localization at cervicothoracic levels. J Spinal Disord Tech. 2009;22(8):615-618.
Two adequate views of the lower cervical vertebrae are necessary to confirm the 3-dimensional location of any hardware placed during cervical spine fusion. Visualizing the lower cervical vertebrae in 2 planes intraoperatively is often a challenge because the shoulders obstruct the lateral view.1 Techniques have been described to improve lateral visualization, including gentle traction of the arms via wrist restraints or taping the shoulders down inferiorly.2,3 These techniques have their inadequacies, including an association with peripheral nerve injury and brachial plexopathy.4 In patients with stout necks, these methods may still be insufficient to achieve adequate visualization of the lower cervical vertebrae.
Invasive techniques to improve visualization have also been described. In 1 study, exposure had to be extended cephalad to allow for manual counting of cervical vertebrae when the mid- to lower cervical vertebrae had to be identified in a morbidly obese patient.5 More invasive spine procedures are associated with higher rates of complications, increased blood loss, more soft-tissue trauma, and longer hospital stays.6 We present a view 30º oblique from horizontal and 30º cephalad from neutral as a variation of the lateral radiograph that improves visualization of the mid- to lower cervical vertebrae. The authors have obtained the patients’ informed written consent for print and electronic publication of these case reports.
Technique
We used either the Smith-Robinson or Cloward approach to the anterior spine. Both techniques use the avascular plane between the medially located esophagus and trachea and the lateral sternocleidomastoid and carotid sheath to approach the anterior cervical spine. Once adequate exposure was achieved, standard anteroposterior and lateral radiographs were obtained to confirm the correct vertebral level. Gentle caudal traction was applied to the patient’s wrist straps, and when visualization continued to be compromised, a view 30º oblique from horizontal and 30º cephalad from neutral was obtained (Figure 1).
Case Series
Case 1
A 54-year-old man with a body mass index (BMI) of 50 presented with neck and bilateral arm pain, with left greater than right radicular symptoms in the C6 and C7 distribution. Magnetic resonance imaging (MRI) showed disc herniations at C5-C6 and C6-C7 with spinal cord signal changes, and he underwent a C5-C6 and C6-C7 anterior cervical discectomy and fusion. Initial localization was determined using a lateral radiograph and vertebral needle. During hardware placement, anteroposterior and lateral fluoroscopic radiographs confirmed adequate placement of the superior screw, but visualization of the inferior portion of the plate and inferior screw was challenging (Figure 2). Our oblique 30º–30º view provided better visualization of the plate and screws in the lower cervical vertebrae than lateral imaging, and allowed confirmation that the hardware was positioned correctly (Figure 3). It took 1 attempt to achieve adequate visualization with the 30º–30º view.
Postoperatively, the patient’s radiculopathy and motor weakness improved. Radiographs confirmed adequate hardware placement, and he was discharged on postoperative day 1 (Figure 4). Imaging at the patient’s 6-week follow-up confirmed adequate fusion from C5-C7, anatomically aligned facet joints, and no hardware failure. The patient’s Neck Disability Index was 31/50 preoperatively and 26/50 at this visit.
Case 2
A 51-year-old man with a BMI of 29 presented with a long-standing history of neck pain and bilateral arm pain left greater than right in the C6 and C7 dermomyotome. MRI showed a broad-based disc herniation with foraminal narrowing at C5-C6 and C6-C7, and the patient underwent a 2-level anterior cervical discectomy and fusion. This patient had pronounced neck musculature, and a deeper than normal incision was required.
Intraoperative lateral fluoroscopy was obtained to confirm the C5-C6 and C6-C7 level prior to discectomy. The musculature of the patient’s neck and shoulder made visualization of the C6-C7 disc space difficult on the lateral radiograph (Figure 5). One attempt was required to obtain the 30º–30º oblique view, which was used to ensure correct placement of the screws and plate (Figure 6).
Postoperatively, the patient’s pain had improved, and radiographs confirmed adequate hardware placement. He was discharged 1 day after surgery (Figure 7). Imaging at the patient’s 6-week follow-up confirmed adequate fusion from C5-C7, stable disc spaces, and anatomically aligned facet joints. His Neck Disability Index was 34/50 preoperatively and 32/50 at 2-week follow-up.
Discussion
The aim of this study was to describe an alternative to the lateral radiograph for imaging the cervical spine in patients with challenging anatomy or in procedures involving hardware placement at the lower cervical vertebrae. Techniques have been developed to assist with improved lateral visualization, including gentle traction of the arms via wrist restraints or taping the shoulders down inferiorly.2,3 However, visualization in 2 planes continues to be a challenge in a subset of patients. It is particularly difficult to obtain adequate lateral radiographs of the cervical spine in patients with stout necks.3 In patients with stout necks, there is more obstruction of the radiography path through the cervical spine. This leads to imaging that is unclear or may fail to show the mid- to lower cervical spine. The extent to which one should rely on the 30º–30º oblique technique for adequate visualization of the cervical spine depends on the anatomy of a particular patient. Historically, it is more challenging to obtain satisfactory lateral radiographs in patients with stout necks,3 and these patients have benefited the most from using the 30º–30º degree oblique view.
Lack of visualization can lead to aborted surgeries or, potentially, surgery at the wrong level.3 A 2008 American Academy of Neurological Surgeons survey indicated that 50% of spine surgeons had performed a wrong-level surgery at least once in their career, and the cervical spine accounted for 21% of all incorrect-level spine surgeries.7 Intraoperative factors reported during cases of wrong-level spinal surgeries included misinterpretation of intraoperative imaging, no intraoperative imaging, and unusual anatomy or physical characteristics.8 Such complications can lead to revision surgery and other significant morbidities for the patient.
In most patients, fluoroscopy allows confirmation of the correct level before disc incision.3 However, operating at a lower cervical level in a patient with a short neck or prominent shoulders poses a significant problem.3 A case report from Singh and colleagues9 described a modified intraoperative fluoroscopic view for spinal level localization at cervicothoracic levels. Their method focuses on identifying the bony lamina and using them as landmarks to count spinal levels, whereas our 30º–30º oblique image is useful for confirmation of adequate hardware placement during anterior cervical spinal fusions. Often, the initial localization of cervical vertebral levels can be achieved with a standard lateral radiograph. We recognized the utility of the 30º–30º oblique view when we were attempting to visualize the inferior aspect of the plate and inferior screw placement.
In patients with stout necks, a lateral radiograph may show only visualization down to C4 or C5.3 Even with applying traction to the arms or taping the shoulders down, it can be impossible to visualize C6, C7, or T1 because the shoulder bones and muscles obstruct the image.3 Using a 30º–30º oblique view, we were able to obtain adequate visualization and assess the accurate placement of hardware.
Conclusion
A 30º oblique view from horizontal and 30º cephalad from neutral radiograph can be used intraoperatively in patients with challenging anatomy to identify placement of hardware at the correct vertebral level in the lower cervical spine. It is a noninvasive technique that can help reduce the risk of wrong-site surgeries without prolonging operation time. This technique describes an alternative to the lateral radiograph and provides a solution to the difficult problem of intraoperative imaging of the mid- to lower cervical spine in 2 adequate planes.
1. Bebawy JF, Koht A, Mirkovic S. Anterior cervical spine surgery. In: Khot A, Sloan TB, Toleikis JR, eds. Monitoring the Nervous System for Anesthesiologists and Other Health Care Professionals. New York, NY: Springer; 2012:539-554.
2. Abumi K, Shono Y, Ito M, Taneichi H, Kotani Y, Kaneda K. Complications of pedicle screw fixation in reconstructive surgery of the cervical spine. Spine. 2000;25(8):962-969.
3. Irace C. Intraoperative imaging for verification of the correct level during spinal surgery. In: Fountas KN, ed. Novel Frontiers of Advanced Neuroimaging. Rijeka, Croatia: Intech; 2013:175-188.
4. Schwartz DM, Sestokas AK, Hilibrand AS, et al. Neurophysiological identification of position-induced neurologic injury during anterior cervical spine surgery. J Clin Monit Comput. 2006;20(6):437-444.
5. Telfeian AE, Reiter GT, Durham SR, Marcotte P. Spine surgery in morbidly obese patients. J Neurosurg Spine. 2002;97(1):20-24.
6. Oppenheimer JH, DeCastro I, McDonnell DE. Minimally invasive spine technology and minimally invasive spine surgery: a historical review. Neurosurg Focus. 2009;27(3):E9.
7. Mody MG, Nourbakhsh A, Stahl DL, Gibbs M, Alfawareh M, Garges KJ. The prevalence of wrong level surgery among spine surgeons. Spine. 2008;33(2):194.
8. Jhawar BS, Mitsis D, Duggal N. Wrong-sided and wrong-level neurosurgery: A national survey. J Neurosurg Spine. 2007;7(5):467-472.
9. Singh H, Meyer SA, Hecht AC, Jenkins AL 3rd. Novel fluoroscopic technique for localization at cervicothoracic levels. J Spinal Disord Tech. 2009;22(8):615-618.
Improving Spanning-Knee External Fixator Stiffness: A Biomechanical Study
External fixators are commonly used as a temporizing treatment for periarticular fractures about the knee. Since its inception with a claw used for patellar fractures by Malgaigne in 1853,1 external fixation has evolved to include pin–crossbar constructs. The stiffness of the construct directly affects the rate at which the frames are likely to fail.2 Most external fixation systems have the option for 2 types of pin–bar connectors, pin-to-bar clamps or multipin clamps. The multipin clamps rely on a cluster of multiple pins to connect the longitudinal supports. These clamps use the “bull horn” extensions to connect the pins to bars (Figure 1). The implant manufacturers recommend the use of 2 longitudinal bars when using these clamps. Conversely, single pin-to-bar clamps permit widely spaced pins but multipin clamps do not. Pin-to-bar clamps also tend to allow the longitudinal cross-bars to be placed closer to bone, improving frame stability.1
In the experience of Dr. Reisman, utilization of pin-to-bar clamps has resulted in improved external fixator construct stiffness compared with those using multipin clamps. He has recognized that, in his own practice, a busy level I trauma center where 4 to 5 spanning knee frames are applied daily, fracture stability is improved with the use of pin-to-bar clamps and often with only a single crossbar, resulting in a simpler, low-cost construct. Despite external fixators used for temporary fixation, frames need to be strong enough to maintain fracture length and stabilize the soft-tissue envelope for days to weeks. It is critical that the frame’s stability allows for patient transfers but controls fracture motion until definitive fixation. Despite having both options available in the external fixator set, there are no biomechanical studies that compare the effect of using pin-to-bar clamps or multipin clamps and bull horns on external fixator stiffness.
In this study, we compared the stiffness of 3 different types of spanning knee external fixator configurations, using multi-pin clamps and 2 crossbars, or pin-to-bar clamps with 1 or 2 crossbars. We compared constructs using 2 systems, 1 with 8-mm–diameter and another with 11-mm–diameter crossbars. We hypothesized that constructs assembled with pin-to-bar clamps would have improved bending stiffness compared with constructs using multipin clamps.
Materials and Methods
Three constructs were made under the supervision of Dr. Reisman, a trauma fellowship–trained orthopedic surgeon. The first construct (construct 1) used two 200-mm bars attached to pin-to-bar clamps with a single 450-mm–long spanning bar connecting the 2 segments (Figure 2). The second construct (construct 2) used 2 spanning bars with pin-to-bar clamps. The third construct (construct 3) used multipin clamps proximally and distally with two 450-mm–long spanning bars. Therefore, we tested 2 types of constructs using pin-to-bar clamps and 1 construct with multipin clamps. Four of each construct type were assembled with both 8-mm (Stryker) and 11-mm bars (Synthes), providing 24 testable constructs. For this study, we tested previously used and cleaned external fixation pins, bars, and clamps obtained from our trauma center. All equipment was examined thoroughly for any potential damaged parts.
To simulate the femoral and tibial attachments, two 5-mm–diameter pins were drilled into each of 2 steel cylinders and welded in place. The femoral cylinder (8.3×2.5 cm) had a pin distance of 55 mm, and the tibial cylinder (6.4×2.5 cm) had a pin distance of 32 mm (Figure 3). The pins were welded intosteel cylinders to help prevent any loosening or failure at the pin (ie, metal interface isolating stress to the components). Dr. Desai assembled the constructs and placed them on the cylinders with a distance of 25 mm between the fixator construct and the cylinder, with 306 mm between the femoral and tibial cylinders. The pin diameters, pin spread, pin number, and bar-to-cylinder distance were constant throughout testing with these specifications.
The assembled constructs were tested on a materials testing machine (MTS 858 Mini-Bionix Test System). A compressive force was applied, through a roller, to a flat plate (Figures 4, 5). This allowed the constructs to flex and bend freely without overly stressing the simulated pin-to-bone interface. Using this loading method, we could compare the stiffness of the different assembled constructs. Each assembled construct was tested 4 times sequentially on the MTS machine. There was no pin deformation when the load was applied through the roller to the flat plate, to the cylinder, to the pins, and onto the construct. It was possible to observe that the construct flexed when the load was applied. Load-displacement curves were produced for each test, and the stiffness was calculated from the slope of this curve. Each test was repeated 4 times, and the stiffness was measured from the load-displacement curve each time. The 4 stiffness measurements were averaged for each construct and compared across all constructs, using a Wilcoxon rank sum test for statistical analysis.
Results
Construct Design
Three different construct designs were evaluated using our testing protocol. The mean stiffness differed across all constructs as seen in Figure 6. Of the constructs using the 11-mm–diameter bars, construct 2 had the highest mean stiffness (32.1 +/- 3.7 N/mm), and this stiffness was significantly greater than the mean stiffness for construct 1 (15.3 +/- 1.5 N/mm; P < .05) and construct 3 (18.4 +/- 2.9 N/mm; P< .05). There was no statistically significant difference in stiffness between construct 1 and construct 3.
Of the constructs using 8-mm–diameter bars, construct 2 had the highest mean stiffness (11.5 +/- 2.4 N/mm), and this stiffness was significantly greater than the mean stiffness for construct 1 (5.0 +/- 0.9 N/mm; P < .05). There was no statistically significant difference in stiffness between construct 2 and construct 3 (7.8 +/- 1.9 N/mm) or between construct 1 and construct 3.
Discussion
Although numerous investigators have examined the biomechanical properties of external fixator systems, the effect of pin-to-bar clamps on frame stiffness is unknown. Biomechanical studies have found that uniplanar constructs with multiple bars can provide adequate strength for temporary fixation.3-9 With multiple options within a particular external fixator set, it is ideal to understand the benefit of using one component instead of another.
The main results from this experiment are: (1) constructs with pin-to-bar clamps and 2 crossbars are stiffer than those using multipin clamps and 2 crossbars; (2) constructs with a single crossbar and pin-to-bar clamps are as stiff as constructs using 2 crossbars and multipin clamps.
Figure 6 shows the average stiffness differences between the 8-mm and 11-mm–diameter bar constructs tested in this study. As expected, each 11-mm diameter–bar construct had a higher average stiffness compared with the 8-mm–diameter bar constructs. Across both the 8-mm and 11-mm–diameter bar constructs, construct 2 had a higher stiffness than that of constructs 1 and 3. Furthermore, there was no difference in the stiffness between constructs 1 and 3.
To improve external fixator stiffness, number of pins and optimization of pin spread can improve the strength of the construct.7 When using pin-to-bar clamps, 1 pin should be as close to the fracture as possible, with the second pin as far from the fracture as possible. 7 Multipin clamps, by design, prevent any optimization of pin spread and require a clustered-pin arrangement.
Bar configuration also plays a critical role in construct stiffness. Bar-to-bone distance should be approximately 2 fingerbreadths from the skin to maximize the stiffness of the construct.4,10-14 Multipin clamps use “bull horn” extensions that tend to elevate the bar away from the skin, increasing the distance between the bar and the bone.
A temporary spanning knee external fixator is commonly used for treating high-energy periarticular tibial or femoral fractures. To hold the fracture in an adequately reduced position, the frame must resist the deforming forces inherent with all fractures. A frame that is not adequately stiff will not hold the fracture in the reduced position, even at the time of initial surgery, which negates one of the benefits of placing the patient in the frame. Hence, adequate stiffness of the spanning-knee fixator is critical to the effectiveness of temporary stabilization before permanent fixation.
The results of this study provide evidence for the superiority of pin-to-bar clamps over multipin clamps in optimizing external fixator construct stiffness. At our institution, we almost exclusively use the single pin-to-bar clamps for spanning-knee external fixation. Based on the results of this study, we often use only a single crossbar. The ability to use a single bar greatly reduces the cost of the construct because crossbars can cost from $100 to $150, depending on the manufacturer.
A recent cost analysis of spanning-knee external fixators showed that construct costs can range from $8,000 to $19,000.15 The lower-cost constructs included 2 crossbars while the more expensive constructs had additional bars and multipin clamps. The authors noted that constructs with larger diameter bars and higher overall stiffness resulted in an improved cost per stiffness ratio. The results of this study support our conclusions regarding bar diameter. Additionally, our results show improved stiffness of constructs with pin-to-bar clamps instead of multipin clamps. By limiting the need for an additional bar, using pin-to-bar clamps and a single large diameter crossbar can create a very cost-efficient and rigidly stable construct.
One criticism of this study is the testing of used equipment. All external fixator manufacturers must evaluate and carefully examine any used equipment prior to the resterilization process and potential release to the practitioner for re-use. Our rationale for using used equipment is based on the assumption that the vast majority of patients do not have their external fixators removed because of failure but because of definitive surgical treatment, and the timing of removal does not necessarily follow a predetermined protocol. For example, timing of definitive surgery is usually set by the patient’s general health status, status of the soft tissues, and surgeon availability. Therefore, this equipment was tested with the presumption that the equipment was in the same state as if the patient continued to wear the frame 1 more day. A study testing unused equipment would be the next step in evaluating external fixators.
Another potential criticism of this study is the use of the same pin spread for constructs using pin-to-bar clamps and those using multipin clamps. We established that, to minimize confounding variables, a constant pin spread was necessary. This also mirrors our more common pin configurations for external fixators with pins placed outside the zone of injury. However, a key determinant of external fixator stability is pin spread, and this is a potential benefit to using pin-to-bar clamps over the multipin clamps that require an exact pin spread. Indeed, our results may have shown a larger difference between constructs using the pin-to-bar clamps compared with the multipin clamps had we maximized the pin spread. Future studies may be able to use a fracture model to compare the pin-to-bar clamps and multipin clamps using pin spread to maximize stability.
Conclusion
This study has shown that using pin-to-bar clamps can create strong, stable constructs for temporary external fixation. In particular, constructs made with a single bar and pin-to-bar clamps can produce easily implantable and less expensive constructs that are stiff enough to withstand deformation and allow patient transfers without excessive displacement of the fracture.
1. Behrens F. A primer of fixator devices and configurations. Clin Orthop Relat Res. 1989;241:5-14.
2. Chao EY, Aro HT, Lewallen DG, Kelly PJ. The effect of rigidity on fracture healing in external fixation. Clin Orthop Relat Res. 1989;241:24-35.
3. Schrøder HA, Weeth RE, Madsen T. Experimental analysis of Hoffman external fixation in various mountings. Arch Orthop Trauma Surg. 1985;104(4):197-200.
4. Kempson GE, Campbell D. The comparative stiffness of external fixation frames. Injury. 1981;12(4):297-304.
5. Giotakis N, Narayan B. Stability with unilateral external fixation in the tibia. Strategies Trauma Limb Reconstr. 2007;2(1):13-20.
6. Briggs BT, Chao EY. The mechanical performance of the standard Hoffmann-Vidal external fixation apparatus. J Bone Joint Surg Am. 1982;64(4):566-573.
7. Hipp JA, Edgerton BC, An KN, Hayes WC. Structural consequences of transcortical holes in long bones loaded in torsion. J Biomech. 1990;23(12):1261-1268.
8. Edgerton BC, An KN, Morrey BF. Torsional strength reduction due to cortical defects in bone. J Orthop Res. 1990;8(6):851-855.
9. Huiskes R, Chao E. Guidelines for external fixation frame rigidity and stresses. J Orthop Res. 1986;4(1):68-75.
10. Pettine KA, Chao EY, Kelly PJ. Analysis of the external fixator pin-bone interface. Clin Orthop Relat Res. 1993;(293):18-27.
11. Halsey D, Fleming B, Pope MH, Krag M, Kristiansen T. External fixator pin design. Clin Orthop Relat Res. 1992;(278):305-312.
12. Huiskes R, Chao EY, Crippen TE. Parametric analyses of pin-bone stresses in external fracture fixation devices. J Orthop Res. 1985;3(3):341-349.
13. Behrens F, Johnson W. Unilateral external fixation methods to increase and reduce frame stiffness. Clin Orthop Relat Res.1989;(241):48-56.
14. Mercer D, Firoozbakhsh K, Prevost M, Mulkey P, DeCoster TA, Schenck R. Stiffness of knee spanning external fixation systems for traumatic knee dislocations: a biomechanical study. J Orthop Trauma. 2010;24(11):693-696.
15. Kim H, Russell JP, Hsieh AH, O’Toole RV. Bar diameter is an important component of knee-spanning external fixator stiffness and cost. Orthopedics. 2014;37(7):e671-e677.
External fixators are commonly used as a temporizing treatment for periarticular fractures about the knee. Since its inception with a claw used for patellar fractures by Malgaigne in 1853,1 external fixation has evolved to include pin–crossbar constructs. The stiffness of the construct directly affects the rate at which the frames are likely to fail.2 Most external fixation systems have the option for 2 types of pin–bar connectors, pin-to-bar clamps or multipin clamps. The multipin clamps rely on a cluster of multiple pins to connect the longitudinal supports. These clamps use the “bull horn” extensions to connect the pins to bars (Figure 1). The implant manufacturers recommend the use of 2 longitudinal bars when using these clamps. Conversely, single pin-to-bar clamps permit widely spaced pins but multipin clamps do not. Pin-to-bar clamps also tend to allow the longitudinal cross-bars to be placed closer to bone, improving frame stability.1
In the experience of Dr. Reisman, utilization of pin-to-bar clamps has resulted in improved external fixator construct stiffness compared with those using multipin clamps. He has recognized that, in his own practice, a busy level I trauma center where 4 to 5 spanning knee frames are applied daily, fracture stability is improved with the use of pin-to-bar clamps and often with only a single crossbar, resulting in a simpler, low-cost construct. Despite external fixators used for temporary fixation, frames need to be strong enough to maintain fracture length and stabilize the soft-tissue envelope for days to weeks. It is critical that the frame’s stability allows for patient transfers but controls fracture motion until definitive fixation. Despite having both options available in the external fixator set, there are no biomechanical studies that compare the effect of using pin-to-bar clamps or multipin clamps and bull horns on external fixator stiffness.
In this study, we compared the stiffness of 3 different types of spanning knee external fixator configurations, using multi-pin clamps and 2 crossbars, or pin-to-bar clamps with 1 or 2 crossbars. We compared constructs using 2 systems, 1 with 8-mm–diameter and another with 11-mm–diameter crossbars. We hypothesized that constructs assembled with pin-to-bar clamps would have improved bending stiffness compared with constructs using multipin clamps.
Materials and Methods
Three constructs were made under the supervision of Dr. Reisman, a trauma fellowship–trained orthopedic surgeon. The first construct (construct 1) used two 200-mm bars attached to pin-to-bar clamps with a single 450-mm–long spanning bar connecting the 2 segments (Figure 2). The second construct (construct 2) used 2 spanning bars with pin-to-bar clamps. The third construct (construct 3) used multipin clamps proximally and distally with two 450-mm–long spanning bars. Therefore, we tested 2 types of constructs using pin-to-bar clamps and 1 construct with multipin clamps. Four of each construct type were assembled with both 8-mm (Stryker) and 11-mm bars (Synthes), providing 24 testable constructs. For this study, we tested previously used and cleaned external fixation pins, bars, and clamps obtained from our trauma center. All equipment was examined thoroughly for any potential damaged parts.
To simulate the femoral and tibial attachments, two 5-mm–diameter pins were drilled into each of 2 steel cylinders and welded in place. The femoral cylinder (8.3×2.5 cm) had a pin distance of 55 mm, and the tibial cylinder (6.4×2.5 cm) had a pin distance of 32 mm (Figure 3). The pins were welded intosteel cylinders to help prevent any loosening or failure at the pin (ie, metal interface isolating stress to the components). Dr. Desai assembled the constructs and placed them on the cylinders with a distance of 25 mm between the fixator construct and the cylinder, with 306 mm between the femoral and tibial cylinders. The pin diameters, pin spread, pin number, and bar-to-cylinder distance were constant throughout testing with these specifications.
The assembled constructs were tested on a materials testing machine (MTS 858 Mini-Bionix Test System). A compressive force was applied, through a roller, to a flat plate (Figures 4, 5). This allowed the constructs to flex and bend freely without overly stressing the simulated pin-to-bone interface. Using this loading method, we could compare the stiffness of the different assembled constructs. Each assembled construct was tested 4 times sequentially on the MTS machine. There was no pin deformation when the load was applied through the roller to the flat plate, to the cylinder, to the pins, and onto the construct. It was possible to observe that the construct flexed when the load was applied. Load-displacement curves were produced for each test, and the stiffness was calculated from the slope of this curve. Each test was repeated 4 times, and the stiffness was measured from the load-displacement curve each time. The 4 stiffness measurements were averaged for each construct and compared across all constructs, using a Wilcoxon rank sum test for statistical analysis.
Results
Construct Design
Three different construct designs were evaluated using our testing protocol. The mean stiffness differed across all constructs as seen in Figure 6. Of the constructs using the 11-mm–diameter bars, construct 2 had the highest mean stiffness (32.1 +/- 3.7 N/mm), and this stiffness was significantly greater than the mean stiffness for construct 1 (15.3 +/- 1.5 N/mm; P < .05) and construct 3 (18.4 +/- 2.9 N/mm; P< .05). There was no statistically significant difference in stiffness between construct 1 and construct 3.
Of the constructs using 8-mm–diameter bars, construct 2 had the highest mean stiffness (11.5 +/- 2.4 N/mm), and this stiffness was significantly greater than the mean stiffness for construct 1 (5.0 +/- 0.9 N/mm; P < .05). There was no statistically significant difference in stiffness between construct 2 and construct 3 (7.8 +/- 1.9 N/mm) or between construct 1 and construct 3.
Discussion
Although numerous investigators have examined the biomechanical properties of external fixator systems, the effect of pin-to-bar clamps on frame stiffness is unknown. Biomechanical studies have found that uniplanar constructs with multiple bars can provide adequate strength for temporary fixation.3-9 With multiple options within a particular external fixator set, it is ideal to understand the benefit of using one component instead of another.
The main results from this experiment are: (1) constructs with pin-to-bar clamps and 2 crossbars are stiffer than those using multipin clamps and 2 crossbars; (2) constructs with a single crossbar and pin-to-bar clamps are as stiff as constructs using 2 crossbars and multipin clamps.
Figure 6 shows the average stiffness differences between the 8-mm and 11-mm–diameter bar constructs tested in this study. As expected, each 11-mm diameter–bar construct had a higher average stiffness compared with the 8-mm–diameter bar constructs. Across both the 8-mm and 11-mm–diameter bar constructs, construct 2 had a higher stiffness than that of constructs 1 and 3. Furthermore, there was no difference in the stiffness between constructs 1 and 3.
To improve external fixator stiffness, number of pins and optimization of pin spread can improve the strength of the construct.7 When using pin-to-bar clamps, 1 pin should be as close to the fracture as possible, with the second pin as far from the fracture as possible. 7 Multipin clamps, by design, prevent any optimization of pin spread and require a clustered-pin arrangement.
Bar configuration also plays a critical role in construct stiffness. Bar-to-bone distance should be approximately 2 fingerbreadths from the skin to maximize the stiffness of the construct.4,10-14 Multipin clamps use “bull horn” extensions that tend to elevate the bar away from the skin, increasing the distance between the bar and the bone.
A temporary spanning knee external fixator is commonly used for treating high-energy periarticular tibial or femoral fractures. To hold the fracture in an adequately reduced position, the frame must resist the deforming forces inherent with all fractures. A frame that is not adequately stiff will not hold the fracture in the reduced position, even at the time of initial surgery, which negates one of the benefits of placing the patient in the frame. Hence, adequate stiffness of the spanning-knee fixator is critical to the effectiveness of temporary stabilization before permanent fixation.
The results of this study provide evidence for the superiority of pin-to-bar clamps over multipin clamps in optimizing external fixator construct stiffness. At our institution, we almost exclusively use the single pin-to-bar clamps for spanning-knee external fixation. Based on the results of this study, we often use only a single crossbar. The ability to use a single bar greatly reduces the cost of the construct because crossbars can cost from $100 to $150, depending on the manufacturer.
A recent cost analysis of spanning-knee external fixators showed that construct costs can range from $8,000 to $19,000.15 The lower-cost constructs included 2 crossbars while the more expensive constructs had additional bars and multipin clamps. The authors noted that constructs with larger diameter bars and higher overall stiffness resulted in an improved cost per stiffness ratio. The results of this study support our conclusions regarding bar diameter. Additionally, our results show improved stiffness of constructs with pin-to-bar clamps instead of multipin clamps. By limiting the need for an additional bar, using pin-to-bar clamps and a single large diameter crossbar can create a very cost-efficient and rigidly stable construct.
One criticism of this study is the testing of used equipment. All external fixator manufacturers must evaluate and carefully examine any used equipment prior to the resterilization process and potential release to the practitioner for re-use. Our rationale for using used equipment is based on the assumption that the vast majority of patients do not have their external fixators removed because of failure but because of definitive surgical treatment, and the timing of removal does not necessarily follow a predetermined protocol. For example, timing of definitive surgery is usually set by the patient’s general health status, status of the soft tissues, and surgeon availability. Therefore, this equipment was tested with the presumption that the equipment was in the same state as if the patient continued to wear the frame 1 more day. A study testing unused equipment would be the next step in evaluating external fixators.
Another potential criticism of this study is the use of the same pin spread for constructs using pin-to-bar clamps and those using multipin clamps. We established that, to minimize confounding variables, a constant pin spread was necessary. This also mirrors our more common pin configurations for external fixators with pins placed outside the zone of injury. However, a key determinant of external fixator stability is pin spread, and this is a potential benefit to using pin-to-bar clamps over the multipin clamps that require an exact pin spread. Indeed, our results may have shown a larger difference between constructs using the pin-to-bar clamps compared with the multipin clamps had we maximized the pin spread. Future studies may be able to use a fracture model to compare the pin-to-bar clamps and multipin clamps using pin spread to maximize stability.
Conclusion
This study has shown that using pin-to-bar clamps can create strong, stable constructs for temporary external fixation. In particular, constructs made with a single bar and pin-to-bar clamps can produce easily implantable and less expensive constructs that are stiff enough to withstand deformation and allow patient transfers without excessive displacement of the fracture.
1. Behrens F. A primer of fixator devices and configurations. Clin Orthop Relat Res. 1989;241:5-14.
2. Chao EY, Aro HT, Lewallen DG, Kelly PJ. The effect of rigidity on fracture healing in external fixation. Clin Orthop Relat Res. 1989;241:24-35.
3. Schrøder HA, Weeth RE, Madsen T. Experimental analysis of Hoffman external fixation in various mountings. Arch Orthop Trauma Surg. 1985;104(4):197-200.
4. Kempson GE, Campbell D. The comparative stiffness of external fixation frames. Injury. 1981;12(4):297-304.
5. Giotakis N, Narayan B. Stability with unilateral external fixation in the tibia. Strategies Trauma Limb Reconstr. 2007;2(1):13-20.
6. Briggs BT, Chao EY. The mechanical performance of the standard Hoffmann-Vidal external fixation apparatus. J Bone Joint Surg Am. 1982;64(4):566-573.
7. Hipp JA, Edgerton BC, An KN, Hayes WC. Structural consequences of transcortical holes in long bones loaded in torsion. J Biomech. 1990;23(12):1261-1268.
8. Edgerton BC, An KN, Morrey BF. Torsional strength reduction due to cortical defects in bone. J Orthop Res. 1990;8(6):851-855.
9. Huiskes R, Chao E. Guidelines for external fixation frame rigidity and stresses. J Orthop Res. 1986;4(1):68-75.
10. Pettine KA, Chao EY, Kelly PJ. Analysis of the external fixator pin-bone interface. Clin Orthop Relat Res. 1993;(293):18-27.
11. Halsey D, Fleming B, Pope MH, Krag M, Kristiansen T. External fixator pin design. Clin Orthop Relat Res. 1992;(278):305-312.
12. Huiskes R, Chao EY, Crippen TE. Parametric analyses of pin-bone stresses in external fracture fixation devices. J Orthop Res. 1985;3(3):341-349.
13. Behrens F, Johnson W. Unilateral external fixation methods to increase and reduce frame stiffness. Clin Orthop Relat Res.1989;(241):48-56.
14. Mercer D, Firoozbakhsh K, Prevost M, Mulkey P, DeCoster TA, Schenck R. Stiffness of knee spanning external fixation systems for traumatic knee dislocations: a biomechanical study. J Orthop Trauma. 2010;24(11):693-696.
15. Kim H, Russell JP, Hsieh AH, O’Toole RV. Bar diameter is an important component of knee-spanning external fixator stiffness and cost. Orthopedics. 2014;37(7):e671-e677.
Outcomes and Aseptic Survivorship of Revision Total Knee Arthroplasty
Over the past 3 decades, total knee arthroplasty (TKA) has been considered a safe and effective treatment for end-stage knee arthritis.1 However, as the population, the incidence of obesity, and life expectancy continue to increase, the number of TKAs will rise as well.2,3 It is expected that over the next 16 years, the number of TKAs performed annually will exceed 3 million in the United States alone.4 This projection represents an over 600% increase from 2005 figures.5 Given the demographic shift expected over the next 2 decades, patients are anticipated to undergo these procedures at younger ages compared with previous generations, such that those age 65 years or younger will account for more than 55% of primary TKAs.6 More important, given this exponential growth in primary TKAs, there will be a concordant rise in revision procedures. It is expected that, the annual number has roughly doubled from that recorded for 2005.4
Compared with primary TKAs, however, revision TKAs have had less promising results, with survivorship as low as 60% over shorter periods.7,8 In addition, recent studies have found an even higher degree of dissatisfaction and functional limitations among revision TKA patients than among primary TKA patients, 15% to 30% of whom are unhappy with their procedures.9-11 These shortcomings of revision TKAs are thought to result from several factors, including poor bone quality, insufficient bone stock, ligamentous instability, soft-tissue incompetence, infection, malalignment, problems with extensor mechanisms, and substantial pain of uncertain etiology.
Despite there being several complex factors that can lead to worse outcomes with revision TKAs, surgeons are expected to produce results equivalent to those of primary TKAs. It is therefore imperative to delineate the objective and subjective outcomes of revision techniques to identify areas in need of improvement. In this article, we provide a concise overview of revision TKA outcomes in order to stimulate manufacturers, surgeons, and hospitals to improve on implant designs, surgical techniques, and care guidelines for revision TKA. We review the evidence on 5 points: aseptic survivorship, functional outcomes, patient satisfaction, quality of life (QOL), and economic impact. In addition, we compare available outcome data for revision and primary TKAs.
1. Aseptic survivorship
Fehring and colleagues12 in 2001 and Sharkey and colleagues13 in 2002 evaluated mechanisms of failure for revision TKA and reported many failures resulted from infection or were associated with the implant, and occurred within 2 years after the primary procedure. More recently, Dy and colleagues14 found the most common reason for revision was aseptic loosening, followed by infection. The present review focuses on aseptic femoral and tibial revision.
The failure rate for revision TKA is substantially higher than for primary TKA with the same type of prosthesis because of the complexity of the revision procedure, the increasing constraint of the implant design, and the higher degree of bone loss. (Appendix 1 lists risk factors for revision surgery. Appendix 2 is a complete list of survivorship outcomes of revision TKA.)
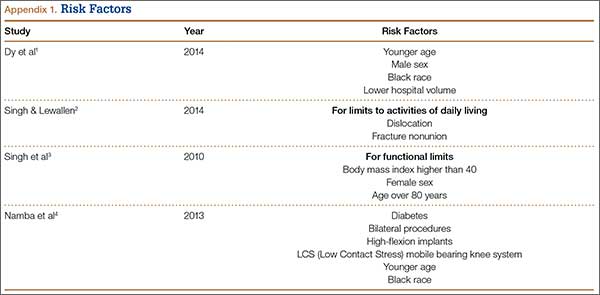
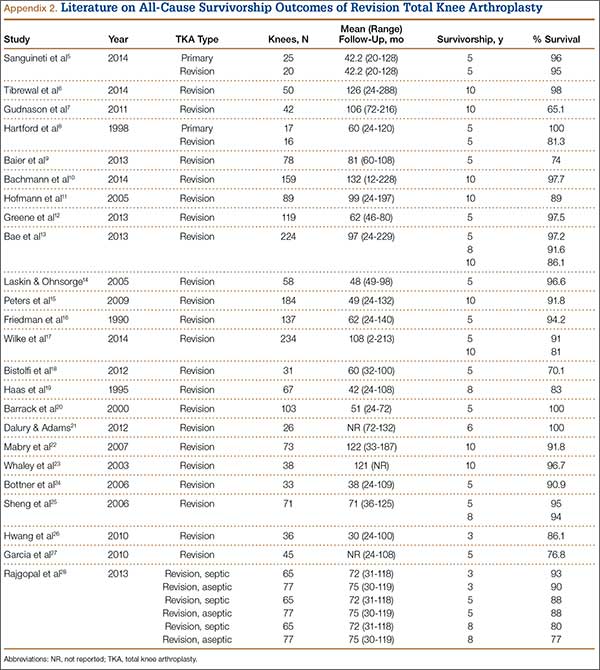
Sheng and colleagues15 in 2006 and Koskinen and colleagues16 in 2008 analyzed Finnish Arthroplasty Register data to determine failure rates for revision and primary TKA. Sheng and colleagues15 examined survivorship of 2637 revision TKAs (performed between 1990 and 2002) for all-cause endpoints after first revision procedure. Survivorship rates were 89% (5 years) and 79% (10 years), while Koskinen and colleagues16 noted all-cause survival rates of 80% at 15 years. More recently, in 2013, the New Zealand Orthopaedic Association17 analyzed New Zealand Joint Registry data for revision and re-revision rates (rates of revision per 100 component years) for 64,556 primary TKAs performed between 1999 and 2012. During the period studied, 1684 revisions were performed, reflecting a 2.6% revision rate, a 0.50% rate of revision per 100 component years, and a 13-year Kaplan-Meier survivorship of 94.5%. The most common reasons for revision were pain, deep infection, and tibial component loosening (Table 1).
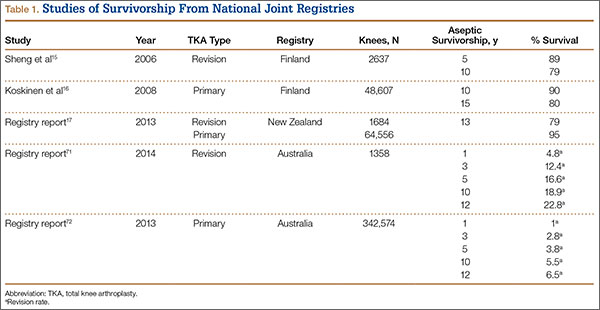
Posterior stabilized implants
Laskin and Ohnsorge18 retrospectively reviewed the cases of 58 patients who underwent unilateral revision TKA (with a posterior stabilized implant), of which 42% were for coronal instability and 44% for a loose tibial component. At minimum 4-year follow-up, 52 of the 58 patients had anteroposterior instability of less than 5 mm. In addition, 5 years after surgery, aseptic survivorship was 96%. Meijer and colleagues19 conducted a retrospective comparative study of 69 revision TKAs (65 patients) in which 9 knees received a primary implant and 60 received a revision implant with stems and augmentation (60 = 37 posterior stabilized, 20 constrained, 3 rotating hinge). Survival rates for the primary implants were 100% (1 year), 73% (2 years), and 44% (5 years), and survival rates for the revision implants were significantly better: 95% (1 year), 92% (2 years), and 92% (5 years) (hazard ratio, 5.87; P = .008). The authors therefore indicated that it was unclear whether using a primary implant should still be an option in revision TKA and, if it is used, whether it should be limited to less complex situations in which bone loss and ligament damage are minimal (Table 2).
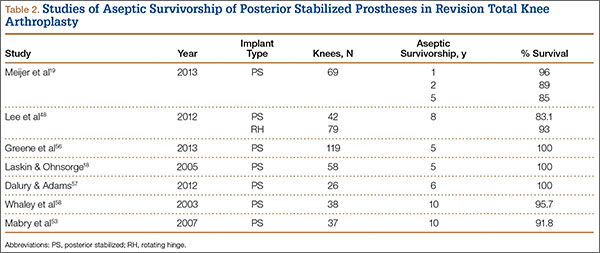
Constrained and semiconstrained implants
In a study of 234 knees (209 patients) with soft-tissue deficiency, Wilke and colleagues20 evaluated the long-term survivorship of revision TKA with use of a semiconstrained modular fixed-bearing implant system. Overall Kaplan-Meier survival rates were 91% (5 years) and 81% (10 years) at a mean follow-up of 9 years. When aseptic revision was evaluated, however, the survival rates increased to 95% (5 years) and 90% (10 years). The authors noted that male sex was the only variable that significantly increased the risk for re-revision (hazard ratio, 2.07; P = .02), which they attributed to potentially higher activity levels. In 2006 and 2011, Lachiewicz and Soileau21,22 evaluated the survival of first- and second-generation constrained condylar prostheses in primary TKA cases with severe valgus deformities, incompetent collateral ligaments, or severe flexion contractures. Of the 54 knees (44 patients) with first-generation prostheses, 42 (34 patients) had a mean follow-up of 9 years (range, 5-16 years). Ten-year survival with failure, defined as component revision for loosening, was 96%. The 27 TKAs using second-generation prostheses had a mean follow-up of about 5 years (range, 2-12 years). At final follow-up, there were no revisions for loosening or patellar problems, but 6 knees (22%) required lateral retinacular release of the patella (Table 3).
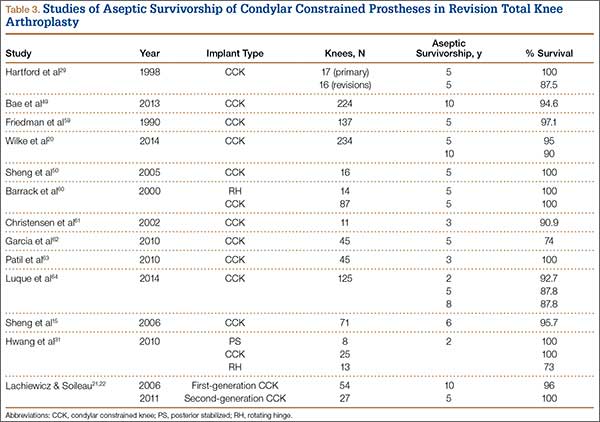
Rotating hinge implants
Neumann and colleagues23 evaluated the clinical and radiographic outcomes of 24 rotating hinge prostheses used for aseptic loosening with substantial bone loss and collateral ligament instability. At a mean follow-up of 56 months (range, 3-5 years), there was no evidence of loosening of any implants, and nonprogressive radiolucent lines were found in only 2 tibial components. Kowalczewski and colleagues24 evaluated the clinical and radiologic outcomes of 12 primary TKAs using a rotating hinge knee prosthesis at a minimum follow-up of 10 years. By most recent follow-up, no implants had been revised for loosening, and only 3 had nonprogressive radiolucent lines (Table 4).
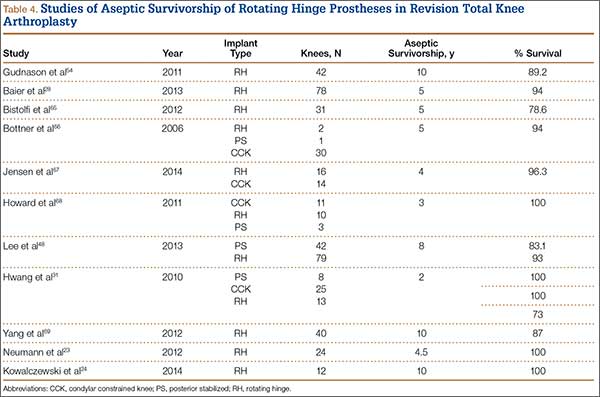
Endoprostheses (modular segmental implants)
In a systematic review of 9 studies, Korim and colleagues25 evaluated 241 endoprostheses used for limb salvage under nononcologic conditions. Mean follow-up was about 3 years (range, 1-5 years). The devices were used to treat various conditions, including periprosthetic fracture, bone loss with aseptic loosening, and ligament insufficiency. The overall reoperation rate was 17% (41/241 cases). Mechanical failures were less frequent (6%-19%) (Table 5).
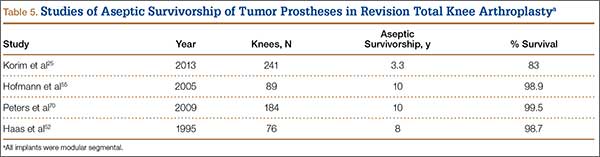
2. Functional outcomes
The goal in both primary and revision TKA is to restore the function and mobility of the knee and to alleviate pain. Whereas primary TKAs are realistically predictable and reproducible in their outcomes, revision TKAs are vastly more complicated, which can result in worse postoperative outcomes and function. In addition, revision TKAs may require extensive surgical exposure, which causes more tissue and muscle damage, prolonging rehabilitation. (Appendix 3 is a complete list of studies of functional outcomes of revision TKA.)
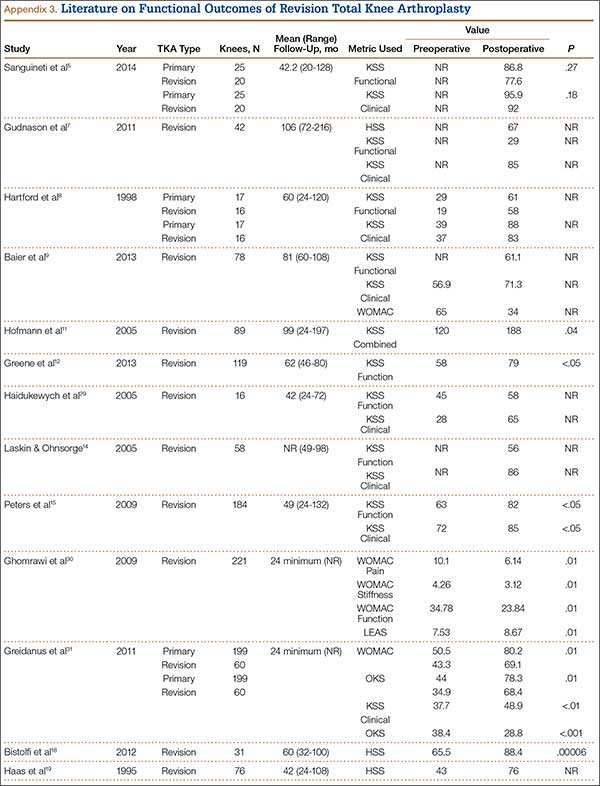
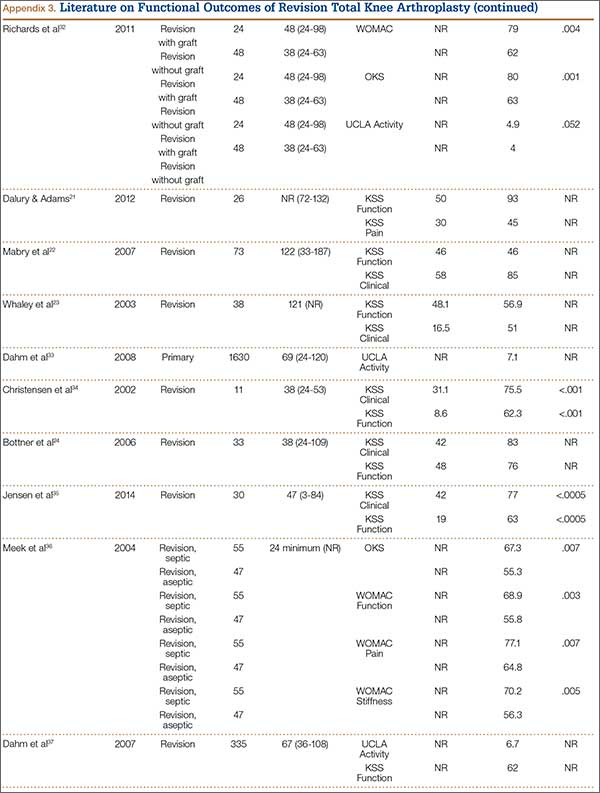
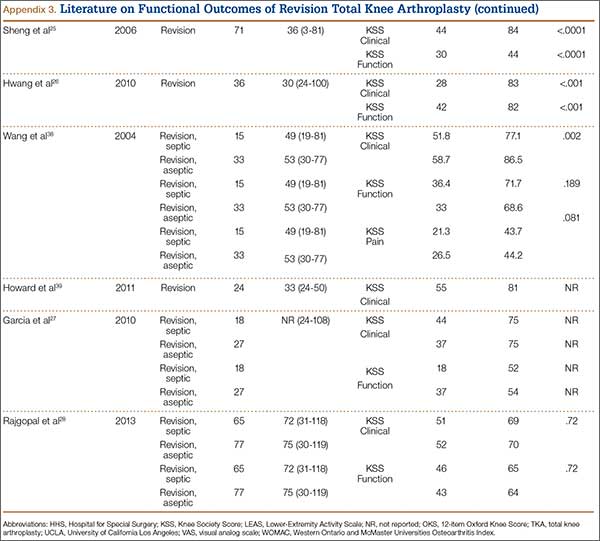
This discrepancy in functional outcomes between primary and revision TKA begins as early as the postoperative inpatient rehabilitation period. Using the functional independence measurement (FIM), which estimates performance of activities of daily living, mobility, and cognition, Vincent and colleagues26 evaluated the functional improvement produced by revision versus primary TKA during inpatient rehabilitation. They compared 424 consecutive primary TKAs with 138 revision TKAs. For both groups, FIM scores increased significantly (P = .015) between admission and discharge. On discharge, however, FIM scores were significantly (P = .01) higher for the primary group than the revision group (29 and 27 points, respectively). Furthermore, in the evaluation of mechanisms of failure, patients who had revision TKA for mechanical or pain-related problems did markedly better than those who had revision TKA for infection.
Compared with primary knee implants, revision implants require increasing constraint. We assume increasing constraint affects knee biomechanics, leading to worsening functional outcomes. In a study of 60 revision TKAs (57 patients) using posterior stabilized, condylar constrained, or rotating hinge prostheses, Vasso and colleagues27 examined functional outcomes at a median follow-up of 9 years (range, 4-12 years). At most recent follow-up, mean International Knee Society (IKS) Knee and Function scores were 81 (range, 48-97) and 79 (range, 56-92), mean Hospital for Special Surgery (HSS) score was 84 (range, 62-98), and mean range of motion (ROM) was 121° (range, 98°-132°) (P < .001). Although there were no significant differences in IKS and HSS scores between prosthesis types, ROM was significantly (P < .01) wider in the posterior stabilized group than in the condylar constrained and rotating hinge groups (127° vs 112° and 108°), suggesting increasing constraint resulted in decreased ROM. Several studies have found increasing constraint might lead to reduced function.28-30
However, Hwang and colleagues31 evaluated functional outcomes in 36 revision TKAs and noted that the cemented posterior stabilized (n = 8), condylar constrained (n = 25), and rotating hinge (n = 13) prostheses used did not differ in their mean Knee Society scores (78, 81, and 83, respectively).
There remains a marked disparity in patient limitations seen after revision versus primary TKA. Given the positive results being obtained with newer implants, studies might suggest recent generations of prostheses have allowed designs to be comparable. As design development continues, we may come closer to achieving outcomes comparable to those of primary TKA.
3. Patient satisfaction
Several recent reports have shown that 10% to 25% of patients who underwent primary TKA were dissatisfied with their surgery30,32; other studies have found patient satisfaction often correlating to function and pain.33-35 Given the worse outcomes for revision TKA (outlined in the preceding section), the substantial pain accompanying a second, more complex procedure, and the extensive rehabilitation expected, we suspect patients who undergo revision TKA are even less satisfied with their surgery than their primary counterparts are. (See Appendix 4 for a complete list of studies of patient satisfaction after revision TKA.)
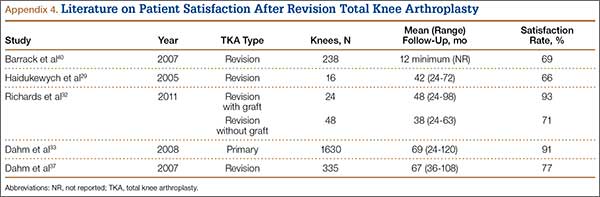
Barrack and colleagues32 evaluated a consecutive series of 238 patients followed up for at least 1 year after revision TKA. Patients were asked to rate their degree of satisfaction with both their primary procedure and the revision and to indicate their expectations regarding their revision prosthesis. Mean satisfaction score was 7.4 (maximum = 10), with 13% of patients dissatisfied, 18% somewhat satisfied, and 69% satisfied. Seventy-four percent of patients expected their revision prosthesis to last longer than the primary prosthesis.
Greidanus and colleagues36 evaluated patient satisfaction in 60 revision TKA cases and 199 primary TKA cases at 2-year follow-up. The primary TKA group had significantly (P < .01) higher satisfaction scores in a comparison with the revision TKA group: Global (86 vs 73), Pain Relief (88 vs 70), Function (83 vs 67), and Recreation (77 vs 62). These findings support the satisfaction rates reported by Dahm and colleagues33,34: 91% for primary TKA patients and 77% for revision TKA patients.
4. Quality of life
Procedure complexity leads to reduced survivorship, function, and mobility, longer rehabilitation, and decreased QOL for revision TKA patients relative to primary TKA patients.37 (See Appendix 5 for a complete list of studies of QOL outcomes of revision TKA.)
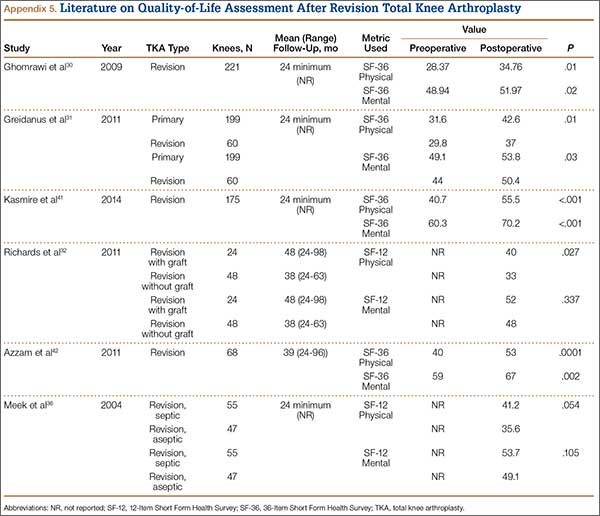
Greidanus and colleagues36 evaluated joint-specific QOL (using the 12-item Oxford Knee Score; OKS) and generic QOL (using the 12-Item Short Form Health Survey; SF-12) in 60 revision TKA cases and 199 primary TKA cases at a mean follow-up of 2 years. (The OKS survey is used to evaluate patient perspectives on TKA outcomes,38 and the multipurpose SF-12 questionnaire is used to assess mental and physical function and general health-related QOL.39) Compared with the revision TKA group, the primary TKA group had significantly higher OKS after surgery (78 vs 68; P = .01) as well as significantly higher SF-12 scores: Global (84 vs 72; P = .01), Mental (54 vs 50; P = .03), and Physical (43 vs 37; P = .01). Similarly, Ghomrawi and colleagues40 evaluated patterns of improvement in 308 patients (318 knees) who had revision TKA. At 24-month follow-up, mean SF-36 Physical and Mental scores were 35 and 52, respectively.
Deehan and colleagues41 used the Nottingham Health Profile (NHP) to compare 94 patients’ health-related QOL scores before revision TKA with their scores 3 months, 1 year, and 5 years after revision. NHP Pain subscale scores were significantly lower 3 and 12 months after surgery than before surgery, but this difference was no longer seen at the 5-year follow-up. There was no significant improvement in scores on the other 5 NHP subscales (Sleep, Energy, Emotion, Mobility, Social Isolation) at any time points.
As shown in the literature, patients’ QOL outcomes improve after revision TKA, but these gains are not at the level of patients who undergo primary TKA.36,41 Given that revision surgery is more extensive, and that perhaps revision patients have poorer muscle function, they usually do not return to the level they attained after their index procedure.
5. Economic impact
Consistent with the outcomes already described, the economic impact of revision TKAs is excess expenditures and costs to patients and health care institutions.42 The sources of this impact are higher implant costs, extra operative trays and times, longer hospital stays, more rehabilitation, and increased medication use.43 Revision TKA costs range from $49,000 to more than $100,000—a tremendous increase over primary TKA costs ($25,000-$30,000).43-45 Furthermore, the annual economic burden associated with revision TKA, now $2.7 billion, is expected to exceed $13 billion by 2030.46 In the United States, about $23.2 billion will be spent on 926,527 primary TKAs in 2015; significantly, the costs associated with revising just 10% of these cases account for almost 50% of the total cost of the primary procedures.46
In a retrospective cost-identification multicenter cohort study, Bozic and colleagues47 found that both-component and single-component revisions, compared with primary procedures, were associated with significantly increased operative time (~265 and 221 minutes vs 200 minutes), use of allograft bone (23% and 14% vs 1%), length of stay (5.4 and 5.7 days vs 5.0 days), and percentage of patients discharged to extended-care facilities (26% and 26% vs 25%) (P < .0001). Hospital costs for both- and single-component revisions were 138% and 114% higher than costs for primary procedures (P < .0001). More recently, Kallala and colleagues44 analyzed UK National Health Service data and compared the costs of revision for infection with revision for other causes (pain, instability, aseptic loosening, fracture). Mean length of stay associated with revision for infection (21.5 days) was more than double that associated with revision for aseptic loosening (9.5 days; P < .0001), and mean cost of revision for septic causes (£30,011) was more than 3 times that of revision for other causes (£9655; P < .0001). The authors concluded that the higher costs of revision knee surgery have a considerable economic impact, especially in infection cases.
With more extensive procedures, long-stem or more constrained prostheses are often needed to obtain adequate fixation and stability. The resulting increased, substantial economic burden is felt by patients and the health care system. Given that health care reimbursements are declining, hospitals that perform revision TKAs can sustain marked financial losses. Some centers are asking whether it is cost-effective to continue to perform these types of procedures. We must find new ways to provide revision procedures using less costly implants and tools so that centers will continue to make these procedures available to patients.
Conclusion
Given the exponential growth in primary TKAs, there will be a concordant increase in revision TKAs in the decades to come. This review provides a concise overview of revision TKA outcomes. Given the low level of evidence regarding revision TKAs, we need further higher quality studies of their prostheses and outcomes. Specifically, we need systematic reviews and meta-analyses to provide higher quality evidence regarding outcomes of using individual prosthetic designs.
1. Cram P, Lu X, Kates SL, Singh JA, Li Y, Wolf BR. Total knee arthroplasty volume, utilization, and outcomes among Medicare beneficiaries, 1991–2010. JAMA. 2012;308(12):1227-1236.
2. Crowninshield RD, Rosenberg AG, Sporer SM. Changing demographics of patients with total joint replacement. Clin Orthop Relat Res. 2006;443:266-272.
3. Ravi B, Croxford R, Reichmann WM, Losina E, Katz JN, Hawker GA. The changing demographics of total joint arthroplasty recipients in the United States and Ontario from 2001 to 2007. Best Pract Res Clin Rheumatol. 2012;26(5):637-647.
4. Kurtz S, Ong K, Lau E, Mowat F, Halpern M. Projections of primary and revision hip and knee arthroplasty in the United States from 2005 to 2030. J Bone Joint Surg Am. 2007;89(4):780-785.
5. Kurtz SM, Ong KL, Schmier J, Zhao K, Mowat F, Lau E. Primary and revision arthroplasty surgery caseloads in the United States from 1990 to 2004. J Arthroplasty. 2009;24(2):195-203.
6. Kurtz SM, Lau E, Ong K, Zhao K, Kelly M, Bozic KJ. Future young patient demand for primary and revision joint replacement: national projections from 2010 to 2030. Clin Orthop Relat Res. 2009;467(10):2606-2612.
7. Bryan RS, Rand JA. Revision total knee arthroplasty. Clin Orthop Relat Res. 1982;170:116-122.
8. Rand JA, Bryan RS. Revision after total knee arthroplasty. Orthop Clin North Am. 1982;13(1):201-212.
9. Bozic KJ, Kurtz SM, Lau E, et al. The epidemiology of revision total knee arthroplasty in the United States. Clin Orthop Relat Res. 2010;468(1):45-51.
10. Parvizi J, Nunley RM, Berend KR, et al. High level of residual symptoms in young patients after total knee arthroplasty. Clin Orthop Relat Res. 2014;472(1):133-137.
11. Ali A, Sundberg M, Robertsson O, et al. Dissatisfied patients after total knee arthroplasty: a registry study involving 114 patients with 8-13 years of followup. Acta Orthop. 2014;85(3):229-233.
12. Fehring TK, Odum S, Griffin WL, Mason JB, Nadaud M. Early failures in total knee arthroplasty. Clin Orthop Relat Res. 2001;392:315-318.
13. Sharkey PF, Hozack WJ, Rothman RH, Shastri S, Jacoby SM. Insall Award paper. Why are total knee arthroplasties failing today? Clin Orthop Relat Res. 2002;404:7-13.
14. Dy CJ, Marx RG, Bozic KJ, Pan TJ, Padgett DE, Lyman S. Risk factors for revision within 10 years of total knee arthroplasty. Clin Orthop Relat Res. 2014;472(4):1198-1207.
15. Sheng PY, Konttinen L, Lehto M, et al. Revision total knee arthroplasty: 1990 through 2002. A review of the Finnish Arthroplasty Registry. J Bone Joint Surg Am. 2006;88(7):1425-1430.
16. Koskinen E, Eskelinen A, Paavolainen P, Pulkkinen P, Remes V. Comparison of survival and cost-effectiveness between unicondylar arthroplasty and total knee arthroplasty in patients with primary osteoarthritis: a follow-up study of 50,493 knee replacements from the Finnish Arthroplasty Register. Acta Orthop. 2008;79(4):499-507.
17. New Zealand Orthopaedic Association. The New Zealand Joint Registry Fourteen Year Report (January 1999 to December 2012). http://www.nzoa.org.nz/system/files/NJR%2014%20Year%20Report.pdf. Published November 2013. Accessed December 16, 2015.
18. Laskin RS, Ohnsorge J. The use of standard posterior stabilized implants in revision total knee arthroplasty. Clin Orthop Relat Res. 2005;(440):122-125.
19. Meijer MF, Reininga IH, Boerboom AL, Stevens M, Bulstra SK. Poorer survival after a primary implant during revision total knee arthroplasty. Int Orthop. 2013;37(3):415-419.
20. Wilke BK, Wagner ER, Trousdale RT. Long-term survival of semi-constrained total knee arthroplasty for revision surgery. J Arthroplasty. 2014;29(5):1005-1008.
21. Lachiewicz PF, Soileau ES. Ten-year survival and clinical results of constrained components in primary total knee arthroplasty. J Arthroplasty. 2006;21(6):803-808.
22. Lachiewicz PF, Soileau ES. Results of a second-generation constrained condylar prosthesis in primary total knee arthroplasty. J Arthroplasty. 2011;26(8):1228-1231.
23. Neumann DR, Hofstaedter T, Dorn U. Follow-up of a modular rotating hinge knee system in salvage revision total knee arthroplasty. J Arthroplasty. 2012;27(5):814-819.
24. Kowalczewski J, Marczak D, Synder M, Sibinski M. Primary rotating-hinge total knee arthroplasty: good outcomes at mid-term follow-up. J Arthroplasty. 2014;29(6):1202-1206.
25. Korim MT, Esler CN, Reddy VR, Ashford RU. A systematic review of endoprosthetic replacement for non-tumour indications around the knee joint. Knee. 2013;20(6):367-375.
26. Vincent KR, Vincent HK, Lee LW, Alfano AP. Inpatient rehabilitation outcomes in primary and revision total knee arthroplasty patients. Clin Orthop Relat Res. 2006;(446):201-207.
27. Vasso M, Beaufils P, Schiavone Panni A. Constraint choice in revision knee arthroplasty. Int Orthop. 2013;37(7):1279-1284.
28. Baier C, Luring C, Schaumburger J, et al. Assessing patient-oriented results after revision total knee arthroplasty. J Orthop Sci. 2013;18(6):955-961.
29. Hartford JM, Goodman SB, Schurman DJ, Knoblick G. Complex primary and revision total knee arthroplasty using the condylar constrained prosthesis: an average 5-year follow-up. J Arthroplasty. 1998;13(4):380-387.
30. Haidukewych GJ, Jacofsky DJ, Pagnano MW, Trousdale RT. Functional results after revision of well-fixed components for stiffness after primary total knee arthroplasty. J Arthroplasty. 2005;20(2):133-138.
31. Hwang SC, Kong JY, Nam DC, et al. Revision total knee arthroplasty with a cemented posterior stabilized, condylar constrained or fully constrained prosthesis: a minimum 2-year follow-up analysis. Clin Orthop Surg. 2010;2(2):112-120.
32. Barrack RL, McClure JT, Burak CF, Clohisy JC, Parvizi J, Sharkey P. Revision total knee arthroplasty: the patient’s perspective. Clin Orthop Relat Res. 2007;464:146-150.
33. Dahm DL, Barnes SA, Harrington JR, Berry DJ. Patient reported activity after revision total knee arthroplasty. J Arthroplasty. 2007;22(6 suppl 2):106-110.
34. Dahm DL, Barnes SA, Harrington JR, Sayeed SA, Berry DJ. Patient-reported activity level after total knee arthroplasty. J Arthroplasty. 2008;23(3):401-407.
35. Richards CJ, Garbuz DS, Pugh L, Masri BA. Revision total knee arthroplasty: clinical outcome comparison with and without the use of femoral head structural allograft. J Arthroplasty. 2011;26(8):1299-1304.
36. Greidanus NV, Peterson RC, Masri BA, Garbuz DS. Quality of life outcomes in revision versus primary total knee arthroplasty. J Arthroplasty. 2011;26(4):615-620.
37. Ethgen O, Bruyere O, Richy F, Dardennes C, Reginster JY. Health-related quality of life in total hip and total knee arthroplasty. A qualitative and systematic review of the literature. J Bone Joint Surg Am. 2004;86(5):963-974.
38. Murray DW, Fitzpatrick R, Rogers K, et al. The use of the Oxford hip and knee scores. J Bone Joint Surg Br. 2007;89(8):1010-1014.
39. Ware J Jr, Kosinski M, Keller SD. A 12-Item Short-Form Health Survey: construction of scales and preliminary tests of reliability and validity. Med Care. 1996;34(3):220-233.
40. Ghomrawi HM, Kane RL, Eberly LE, Bershadsky B, Saleh KJ; North American Knee Arthroplasty Revision Study Group. Patterns of functional improvement after revision knee arthroplasty. J Bone Joint Surg Am. 2009;91(12):2838-2845.
41. Deehan DJ, Murray JD, Birdsall PD, Pinder IM. Quality of life after knee revision arthroplasty. Acta Orthop. 2006;77(5):761-766.
42. Kapadia BH, McElroy MJ, Issa K, Johnson AJ, Bozic KJ, Mont MA. The economic impact of periprosthetic infections following total knee arthroplasty at a specialized tertiary-care center. J Arthroplasty. 2014;29(5):929-932.
43. Bhandari M, Smith J, Miller LE, Block JE. Clinical and economic burden of revision knee arthroplasty. Clin Med Insights Arthritis Musculoskelet Disord. 2012;5:89-94.
44. Kallala RF, Vanhegan IS, Ibrahim MS, Sarmah S, Haddad FS. Financial analysis of revision knee surgery based on NHS tariffs and hospital costs: does it pay to provide a revision service? Bone Joint J Br. 2015;97(2):197-201.
45. Ong KL, Mowat FS, Chan N, Lau E, Halpern MT, Kurtz SM. Economic burden of revision hip and knee arthroplasty in Medicare enrollees. Clin Orthop Relat Res. 2006;446:22-28.
46. Kurtz SM, Ong KL, Lau E, Bozic KJ. Impact of the economic downturn on total joint replacement demand in the United States: updated projections to 2021. J Bone Joint Surg Am. 2014;96(8):624-630.
47. Bozic KJ, Durbhakula S, Berry DJ, et al. Differences in patient and procedure characteristics and hospital resource use in primary and revision total joint arthroplasty: a multicenter study. J Arthroplasty. 2005;20(7 suppl 3):17-25.
48. Lee KJ, Moon JY, Song EK, Lim HA, Seon JK. Minimum Two-year Results of Revision Total Knee Arthroplasty Following Infectious or Non-infectious Causes. Knee Surg Relat Res. 2012;24(4):227-234.
49. Bae DK, Song SJ, Heo DB, Lee SH, Song WJ. Long-term survival rate of implants and modes of failure after revision total knee arthroplasty by a single surgeon. J Arthroplasty. 2013;28(7):1130-1134.
50. Sheng PY, Jämsen E, Lehto MU, Konttinen YT, Pajamäki J, Halonen P. Revision total knee arthroplasty with the Total Condylar III system in inflammatory arthritis. J Bone Joint Surg Br. 2005;87(9):1222-1224.
51. Lachiewicz PF, Soileau ES. Ten-year survival and clinical results of constrained components in primary total knee arthroplasty. J Arthroplasty. 2006;21(6):803-808.
52. Haas SB, Insall JN, Montgomery W 3rd, Windsor RE. Revision total knee arthroplasty with use of modular components with stems inserted without cement. J Bone Joint Surg Am. 1995;77(11):1700-1707.
53. Mabry TM, Vessely MB, Schleck CD, Harmsen WS, Berry DJ. Revision total knee arthroplasty with modular cemented stems: long-term follow-up. J Arthroplasty. 2007;22(6 Suppl 2):100-105.
54. Gudnason A, Milbrink J, Hailer NP. Implant survival and outcome after rotating-hinge total knee revision arthroplasty: a minimum 6-year follow-up. Arch Orthop Trauma Surg. 2011;131(11):1601-1607.
55. Hofmann AA, Goldberg T, Tanner AM, Kurtin SM. Treatment of infected total knee arthroplasty using an articulating spacer: 2- to 12-year experience. Clin Orthop Relat Res. 2005;430:125-131.
56. Greene JW, Reynolds SM, Stimac JD, Malkani AL, Massini MA. Midterm results of hybrid cement technique in revision total knee arthroplasty. J Arthroplasty. 2013;28(4):570-574.
57. Dalury DF, Adams MJ. Minimum 6-year follow-up of revision total knee arthroplasty without patella reimplantation. Journal Arthroplasty. 2012;27(8 Suppl):91-94.
58. Whaley AL, Trousdale RT, Rand JA, Hanssen AD. Cemented long-stem revision total knee arthroplasty. J Arthroplasty. 2003;18(5):592-599.
59. Friedman RJ, Hirst P, Poss R, Kelley K, Sledge CB. Results of revision total knee arthroplasty performed for aseptic loosening. Clinical Orthop Relat Res. 1990;255:235-241.
60. Barrack RL, Rorabeck C, Partington P, Sawhney J, Engh G. The results of retaining a well-fixed patellar component in revision total knee arthroplasty. J Arthroplasty. 2000;15(4):413-417.
61. Christensen CP, Crawford JJ, Olin MD, Vail TP. Revision of the stiff total knee arthroplasty. J Arthroplasty. 2002;17(4):409-415.
62. Garcia RM, Hardy BT, Kraay MJ, Goldberg VM. Revision total knee arthroplasty for aseptic and septic causes in patients with rheumatoid arthritis. Clin Orthop Relat Res. 2010;468(1):82-89.
63. Patil N, Lee K, Huddleston JI, Harris AH, Goodman SB. Aseptic versus septic revision total knee arthroplasty: patient satisfaction, outcome and quality of life improvement. Knee. 2010;17(3):200-203.
64. Luque R, Rizo B, Urda A, et al. Predictive factors for failure after total knee replacement revision. Int Orthop. 2014;38(2):429-435.
65. Bistolfi A, Massazza G, Rosso F, Crova M. Rotating-hinge total knee for revision total knee arthroplasty. Orthopedics. 2012;35(3):e325-e330.
66. Bottner F, Laskin R, Windsor RE, Haas SB. Hybrid component fixation in revision total knee arthroplasty. Clin Orthop Relat Res. 2006;446:127-131.
67. Jensen CL, Winther N, Schroder HM, Petersen MM. Outcome of revision total knee arthroplasty with the use of trabecular metal cone for reconstruction of severe bone loss at the proximal tibia. Knee. 2014;21(6):1233-1237.
68. Howard JL, Kudera J, Lewallen DG, Hanssen AD. Early results of the use of tantalum femoral cones for revision total knee arthroplasty. J Bone Joint Surg Am. 2011;93(5):478-484.
69. Yang JH, Yoon JR, Oh CH, Kim TS. Hybrid component fixation in total knee arthroplasty: minimum of 10-year follow-up study. J Arthroplasty. 2012;27(6):1111-1118.
70. Peters CL, Erickson JA, Gililland JM. Clinical and radiographic results of 184 consecutive revision total knee arthroplasties placed with modular cementless stems. J Arthroplasty. 2009;24(6 Suppl):48-53.
71. Registry AOANJR. Hip and Knee Arthroplasty. Annual Report 2014. 2014.
72. Registry AOANJR. Hip and Knee Arthroplasty. Annual Report 2013. 2013.
Over the past 3 decades, total knee arthroplasty (TKA) has been considered a safe and effective treatment for end-stage knee arthritis.1 However, as the population, the incidence of obesity, and life expectancy continue to increase, the number of TKAs will rise as well.2,3 It is expected that over the next 16 years, the number of TKAs performed annually will exceed 3 million in the United States alone.4 This projection represents an over 600% increase from 2005 figures.5 Given the demographic shift expected over the next 2 decades, patients are anticipated to undergo these procedures at younger ages compared with previous generations, such that those age 65 years or younger will account for more than 55% of primary TKAs.6 More important, given this exponential growth in primary TKAs, there will be a concordant rise in revision procedures. It is expected that, the annual number has roughly doubled from that recorded for 2005.4
Compared with primary TKAs, however, revision TKAs have had less promising results, with survivorship as low as 60% over shorter periods.7,8 In addition, recent studies have found an even higher degree of dissatisfaction and functional limitations among revision TKA patients than among primary TKA patients, 15% to 30% of whom are unhappy with their procedures.9-11 These shortcomings of revision TKAs are thought to result from several factors, including poor bone quality, insufficient bone stock, ligamentous instability, soft-tissue incompetence, infection, malalignment, problems with extensor mechanisms, and substantial pain of uncertain etiology.
Despite there being several complex factors that can lead to worse outcomes with revision TKAs, surgeons are expected to produce results equivalent to those of primary TKAs. It is therefore imperative to delineate the objective and subjective outcomes of revision techniques to identify areas in need of improvement. In this article, we provide a concise overview of revision TKA outcomes in order to stimulate manufacturers, surgeons, and hospitals to improve on implant designs, surgical techniques, and care guidelines for revision TKA. We review the evidence on 5 points: aseptic survivorship, functional outcomes, patient satisfaction, quality of life (QOL), and economic impact. In addition, we compare available outcome data for revision and primary TKAs.
1. Aseptic survivorship
Fehring and colleagues12 in 2001 and Sharkey and colleagues13 in 2002 evaluated mechanisms of failure for revision TKA and reported many failures resulted from infection or were associated with the implant, and occurred within 2 years after the primary procedure. More recently, Dy and colleagues14 found the most common reason for revision was aseptic loosening, followed by infection. The present review focuses on aseptic femoral and tibial revision.
The failure rate for revision TKA is substantially higher than for primary TKA with the same type of prosthesis because of the complexity of the revision procedure, the increasing constraint of the implant design, and the higher degree of bone loss. (Appendix 1 lists risk factors for revision surgery. Appendix 2 is a complete list of survivorship outcomes of revision TKA.)
Sheng and colleagues15 in 2006 and Koskinen and colleagues16 in 2008 analyzed Finnish Arthroplasty Register data to determine failure rates for revision and primary TKA. Sheng and colleagues15 examined survivorship of 2637 revision TKAs (performed between 1990 and 2002) for all-cause endpoints after first revision procedure. Survivorship rates were 89% (5 years) and 79% (10 years), while Koskinen and colleagues16 noted all-cause survival rates of 80% at 15 years. More recently, in 2013, the New Zealand Orthopaedic Association17 analyzed New Zealand Joint Registry data for revision and re-revision rates (rates of revision per 100 component years) for 64,556 primary TKAs performed between 1999 and 2012. During the period studied, 1684 revisions were performed, reflecting a 2.6% revision rate, a 0.50% rate of revision per 100 component years, and a 13-year Kaplan-Meier survivorship of 94.5%. The most common reasons for revision were pain, deep infection, and tibial component loosening (Table 1).
Posterior stabilized implants
Laskin and Ohnsorge18 retrospectively reviewed the cases of 58 patients who underwent unilateral revision TKA (with a posterior stabilized implant), of which 42% were for coronal instability and 44% for a loose tibial component. At minimum 4-year follow-up, 52 of the 58 patients had anteroposterior instability of less than 5 mm. In addition, 5 years after surgery, aseptic survivorship was 96%. Meijer and colleagues19 conducted a retrospective comparative study of 69 revision TKAs (65 patients) in which 9 knees received a primary implant and 60 received a revision implant with stems and augmentation (60 = 37 posterior stabilized, 20 constrained, 3 rotating hinge). Survival rates for the primary implants were 100% (1 year), 73% (2 years), and 44% (5 years), and survival rates for the revision implants were significantly better: 95% (1 year), 92% (2 years), and 92% (5 years) (hazard ratio, 5.87; P = .008). The authors therefore indicated that it was unclear whether using a primary implant should still be an option in revision TKA and, if it is used, whether it should be limited to less complex situations in which bone loss and ligament damage are minimal (Table 2).
Constrained and semiconstrained implants
In a study of 234 knees (209 patients) with soft-tissue deficiency, Wilke and colleagues20 evaluated the long-term survivorship of revision TKA with use of a semiconstrained modular fixed-bearing implant system. Overall Kaplan-Meier survival rates were 91% (5 years) and 81% (10 years) at a mean follow-up of 9 years. When aseptic revision was evaluated, however, the survival rates increased to 95% (5 years) and 90% (10 years). The authors noted that male sex was the only variable that significantly increased the risk for re-revision (hazard ratio, 2.07; P = .02), which they attributed to potentially higher activity levels. In 2006 and 2011, Lachiewicz and Soileau21,22 evaluated the survival of first- and second-generation constrained condylar prostheses in primary TKA cases with severe valgus deformities, incompetent collateral ligaments, or severe flexion contractures. Of the 54 knees (44 patients) with first-generation prostheses, 42 (34 patients) had a mean follow-up of 9 years (range, 5-16 years). Ten-year survival with failure, defined as component revision for loosening, was 96%. The 27 TKAs using second-generation prostheses had a mean follow-up of about 5 years (range, 2-12 years). At final follow-up, there were no revisions for loosening or patellar problems, but 6 knees (22%) required lateral retinacular release of the patella (Table 3).
Rotating hinge implants
Neumann and colleagues23 evaluated the clinical and radiographic outcomes of 24 rotating hinge prostheses used for aseptic loosening with substantial bone loss and collateral ligament instability. At a mean follow-up of 56 months (range, 3-5 years), there was no evidence of loosening of any implants, and nonprogressive radiolucent lines were found in only 2 tibial components. Kowalczewski and colleagues24 evaluated the clinical and radiologic outcomes of 12 primary TKAs using a rotating hinge knee prosthesis at a minimum follow-up of 10 years. By most recent follow-up, no implants had been revised for loosening, and only 3 had nonprogressive radiolucent lines (Table 4).
Endoprostheses (modular segmental implants)
In a systematic review of 9 studies, Korim and colleagues25 evaluated 241 endoprostheses used for limb salvage under nononcologic conditions. Mean follow-up was about 3 years (range, 1-5 years). The devices were used to treat various conditions, including periprosthetic fracture, bone loss with aseptic loosening, and ligament insufficiency. The overall reoperation rate was 17% (41/241 cases). Mechanical failures were less frequent (6%-19%) (Table 5).
2. Functional outcomes
The goal in both primary and revision TKA is to restore the function and mobility of the knee and to alleviate pain. Whereas primary TKAs are realistically predictable and reproducible in their outcomes, revision TKAs are vastly more complicated, which can result in worse postoperative outcomes and function. In addition, revision TKAs may require extensive surgical exposure, which causes more tissue and muscle damage, prolonging rehabilitation. (Appendix 3 is a complete list of studies of functional outcomes of revision TKA.)
This discrepancy in functional outcomes between primary and revision TKA begins as early as the postoperative inpatient rehabilitation period. Using the functional independence measurement (FIM), which estimates performance of activities of daily living, mobility, and cognition, Vincent and colleagues26 evaluated the functional improvement produced by revision versus primary TKA during inpatient rehabilitation. They compared 424 consecutive primary TKAs with 138 revision TKAs. For both groups, FIM scores increased significantly (P = .015) between admission and discharge. On discharge, however, FIM scores were significantly (P = .01) higher for the primary group than the revision group (29 and 27 points, respectively). Furthermore, in the evaluation of mechanisms of failure, patients who had revision TKA for mechanical or pain-related problems did markedly better than those who had revision TKA for infection.
Compared with primary knee implants, revision implants require increasing constraint. We assume increasing constraint affects knee biomechanics, leading to worsening functional outcomes. In a study of 60 revision TKAs (57 patients) using posterior stabilized, condylar constrained, or rotating hinge prostheses, Vasso and colleagues27 examined functional outcomes at a median follow-up of 9 years (range, 4-12 years). At most recent follow-up, mean International Knee Society (IKS) Knee and Function scores were 81 (range, 48-97) and 79 (range, 56-92), mean Hospital for Special Surgery (HSS) score was 84 (range, 62-98), and mean range of motion (ROM) was 121° (range, 98°-132°) (P < .001). Although there were no significant differences in IKS and HSS scores between prosthesis types, ROM was significantly (P < .01) wider in the posterior stabilized group than in the condylar constrained and rotating hinge groups (127° vs 112° and 108°), suggesting increasing constraint resulted in decreased ROM. Several studies have found increasing constraint might lead to reduced function.28-30
However, Hwang and colleagues31 evaluated functional outcomes in 36 revision TKAs and noted that the cemented posterior stabilized (n = 8), condylar constrained (n = 25), and rotating hinge (n = 13) prostheses used did not differ in their mean Knee Society scores (78, 81, and 83, respectively).
There remains a marked disparity in patient limitations seen after revision versus primary TKA. Given the positive results being obtained with newer implants, studies might suggest recent generations of prostheses have allowed designs to be comparable. As design development continues, we may come closer to achieving outcomes comparable to those of primary TKA.
3. Patient satisfaction
Several recent reports have shown that 10% to 25% of patients who underwent primary TKA were dissatisfied with their surgery30,32; other studies have found patient satisfaction often correlating to function and pain.33-35 Given the worse outcomes for revision TKA (outlined in the preceding section), the substantial pain accompanying a second, more complex procedure, and the extensive rehabilitation expected, we suspect patients who undergo revision TKA are even less satisfied with their surgery than their primary counterparts are. (See Appendix 4 for a complete list of studies of patient satisfaction after revision TKA.)
Barrack and colleagues32 evaluated a consecutive series of 238 patients followed up for at least 1 year after revision TKA. Patients were asked to rate their degree of satisfaction with both their primary procedure and the revision and to indicate their expectations regarding their revision prosthesis. Mean satisfaction score was 7.4 (maximum = 10), with 13% of patients dissatisfied, 18% somewhat satisfied, and 69% satisfied. Seventy-four percent of patients expected their revision prosthesis to last longer than the primary prosthesis.
Greidanus and colleagues36 evaluated patient satisfaction in 60 revision TKA cases and 199 primary TKA cases at 2-year follow-up. The primary TKA group had significantly (P < .01) higher satisfaction scores in a comparison with the revision TKA group: Global (86 vs 73), Pain Relief (88 vs 70), Function (83 vs 67), and Recreation (77 vs 62). These findings support the satisfaction rates reported by Dahm and colleagues33,34: 91% for primary TKA patients and 77% for revision TKA patients.
4. Quality of life
Procedure complexity leads to reduced survivorship, function, and mobility, longer rehabilitation, and decreased QOL for revision TKA patients relative to primary TKA patients.37 (See Appendix 5 for a complete list of studies of QOL outcomes of revision TKA.)
Greidanus and colleagues36 evaluated joint-specific QOL (using the 12-item Oxford Knee Score; OKS) and generic QOL (using the 12-Item Short Form Health Survey; SF-12) in 60 revision TKA cases and 199 primary TKA cases at a mean follow-up of 2 years. (The OKS survey is used to evaluate patient perspectives on TKA outcomes,38 and the multipurpose SF-12 questionnaire is used to assess mental and physical function and general health-related QOL.39) Compared with the revision TKA group, the primary TKA group had significantly higher OKS after surgery (78 vs 68; P = .01) as well as significantly higher SF-12 scores: Global (84 vs 72; P = .01), Mental (54 vs 50; P = .03), and Physical (43 vs 37; P = .01). Similarly, Ghomrawi and colleagues40 evaluated patterns of improvement in 308 patients (318 knees) who had revision TKA. At 24-month follow-up, mean SF-36 Physical and Mental scores were 35 and 52, respectively.
Deehan and colleagues41 used the Nottingham Health Profile (NHP) to compare 94 patients’ health-related QOL scores before revision TKA with their scores 3 months, 1 year, and 5 years after revision. NHP Pain subscale scores were significantly lower 3 and 12 months after surgery than before surgery, but this difference was no longer seen at the 5-year follow-up. There was no significant improvement in scores on the other 5 NHP subscales (Sleep, Energy, Emotion, Mobility, Social Isolation) at any time points.
As shown in the literature, patients’ QOL outcomes improve after revision TKA, but these gains are not at the level of patients who undergo primary TKA.36,41 Given that revision surgery is more extensive, and that perhaps revision patients have poorer muscle function, they usually do not return to the level they attained after their index procedure.
5. Economic impact
Consistent with the outcomes already described, the economic impact of revision TKAs is excess expenditures and costs to patients and health care institutions.42 The sources of this impact are higher implant costs, extra operative trays and times, longer hospital stays, more rehabilitation, and increased medication use.43 Revision TKA costs range from $49,000 to more than $100,000—a tremendous increase over primary TKA costs ($25,000-$30,000).43-45 Furthermore, the annual economic burden associated with revision TKA, now $2.7 billion, is expected to exceed $13 billion by 2030.46 In the United States, about $23.2 billion will be spent on 926,527 primary TKAs in 2015; significantly, the costs associated with revising just 10% of these cases account for almost 50% of the total cost of the primary procedures.46
In a retrospective cost-identification multicenter cohort study, Bozic and colleagues47 found that both-component and single-component revisions, compared with primary procedures, were associated with significantly increased operative time (~265 and 221 minutes vs 200 minutes), use of allograft bone (23% and 14% vs 1%), length of stay (5.4 and 5.7 days vs 5.0 days), and percentage of patients discharged to extended-care facilities (26% and 26% vs 25%) (P < .0001). Hospital costs for both- and single-component revisions were 138% and 114% higher than costs for primary procedures (P < .0001). More recently, Kallala and colleagues44 analyzed UK National Health Service data and compared the costs of revision for infection with revision for other causes (pain, instability, aseptic loosening, fracture). Mean length of stay associated with revision for infection (21.5 days) was more than double that associated with revision for aseptic loosening (9.5 days; P < .0001), and mean cost of revision for septic causes (£30,011) was more than 3 times that of revision for other causes (£9655; P < .0001). The authors concluded that the higher costs of revision knee surgery have a considerable economic impact, especially in infection cases.
With more extensive procedures, long-stem or more constrained prostheses are often needed to obtain adequate fixation and stability. The resulting increased, substantial economic burden is felt by patients and the health care system. Given that health care reimbursements are declining, hospitals that perform revision TKAs can sustain marked financial losses. Some centers are asking whether it is cost-effective to continue to perform these types of procedures. We must find new ways to provide revision procedures using less costly implants and tools so that centers will continue to make these procedures available to patients.
Conclusion
Given the exponential growth in primary TKAs, there will be a concordant increase in revision TKAs in the decades to come. This review provides a concise overview of revision TKA outcomes. Given the low level of evidence regarding revision TKAs, we need further higher quality studies of their prostheses and outcomes. Specifically, we need systematic reviews and meta-analyses to provide higher quality evidence regarding outcomes of using individual prosthetic designs.
1. Cram P, Lu X, Kates SL, Singh JA, Li Y, Wolf BR. Total knee arthroplasty volume, utilization, and outcomes among Medicare beneficiaries, 1991–2010. JAMA. 2012;308(12):1227-1236.
2. Crowninshield RD, Rosenberg AG, Sporer SM. Changing demographics of patients with total joint replacement. Clin Orthop Relat Res. 2006;443:266-272.
3. Ravi B, Croxford R, Reichmann WM, Losina E, Katz JN, Hawker GA. The changing demographics of total joint arthroplasty recipients in the United States and Ontario from 2001 to 2007. Best Pract Res Clin Rheumatol. 2012;26(5):637-647.
4. Kurtz S, Ong K, Lau E, Mowat F, Halpern M. Projections of primary and revision hip and knee arthroplasty in the United States from 2005 to 2030. J Bone Joint Surg Am. 2007;89(4):780-785.
5. Kurtz SM, Ong KL, Schmier J, Zhao K, Mowat F, Lau E. Primary and revision arthroplasty surgery caseloads in the United States from 1990 to 2004. J Arthroplasty. 2009;24(2):195-203.
6. Kurtz SM, Lau E, Ong K, Zhao K, Kelly M, Bozic KJ. Future young patient demand for primary and revision joint replacement: national projections from 2010 to 2030. Clin Orthop Relat Res. 2009;467(10):2606-2612.
7. Bryan RS, Rand JA. Revision total knee arthroplasty. Clin Orthop Relat Res. 1982;170:116-122.
8. Rand JA, Bryan RS. Revision after total knee arthroplasty. Orthop Clin North Am. 1982;13(1):201-212.
9. Bozic KJ, Kurtz SM, Lau E, et al. The epidemiology of revision total knee arthroplasty in the United States. Clin Orthop Relat Res. 2010;468(1):45-51.
10. Parvizi J, Nunley RM, Berend KR, et al. High level of residual symptoms in young patients after total knee arthroplasty. Clin Orthop Relat Res. 2014;472(1):133-137.
11. Ali A, Sundberg M, Robertsson O, et al. Dissatisfied patients after total knee arthroplasty: a registry study involving 114 patients with 8-13 years of followup. Acta Orthop. 2014;85(3):229-233.
12. Fehring TK, Odum S, Griffin WL, Mason JB, Nadaud M. Early failures in total knee arthroplasty. Clin Orthop Relat Res. 2001;392:315-318.
13. Sharkey PF, Hozack WJ, Rothman RH, Shastri S, Jacoby SM. Insall Award paper. Why are total knee arthroplasties failing today? Clin Orthop Relat Res. 2002;404:7-13.
14. Dy CJ, Marx RG, Bozic KJ, Pan TJ, Padgett DE, Lyman S. Risk factors for revision within 10 years of total knee arthroplasty. Clin Orthop Relat Res. 2014;472(4):1198-1207.
15. Sheng PY, Konttinen L, Lehto M, et al. Revision total knee arthroplasty: 1990 through 2002. A review of the Finnish Arthroplasty Registry. J Bone Joint Surg Am. 2006;88(7):1425-1430.
16. Koskinen E, Eskelinen A, Paavolainen P, Pulkkinen P, Remes V. Comparison of survival and cost-effectiveness between unicondylar arthroplasty and total knee arthroplasty in patients with primary osteoarthritis: a follow-up study of 50,493 knee replacements from the Finnish Arthroplasty Register. Acta Orthop. 2008;79(4):499-507.
17. New Zealand Orthopaedic Association. The New Zealand Joint Registry Fourteen Year Report (January 1999 to December 2012). http://www.nzoa.org.nz/system/files/NJR%2014%20Year%20Report.pdf. Published November 2013. Accessed December 16, 2015.
18. Laskin RS, Ohnsorge J. The use of standard posterior stabilized implants in revision total knee arthroplasty. Clin Orthop Relat Res. 2005;(440):122-125.
19. Meijer MF, Reininga IH, Boerboom AL, Stevens M, Bulstra SK. Poorer survival after a primary implant during revision total knee arthroplasty. Int Orthop. 2013;37(3):415-419.
20. Wilke BK, Wagner ER, Trousdale RT. Long-term survival of semi-constrained total knee arthroplasty for revision surgery. J Arthroplasty. 2014;29(5):1005-1008.
21. Lachiewicz PF, Soileau ES. Ten-year survival and clinical results of constrained components in primary total knee arthroplasty. J Arthroplasty. 2006;21(6):803-808.
22. Lachiewicz PF, Soileau ES. Results of a second-generation constrained condylar prosthesis in primary total knee arthroplasty. J Arthroplasty. 2011;26(8):1228-1231.
23. Neumann DR, Hofstaedter T, Dorn U. Follow-up of a modular rotating hinge knee system in salvage revision total knee arthroplasty. J Arthroplasty. 2012;27(5):814-819.
24. Kowalczewski J, Marczak D, Synder M, Sibinski M. Primary rotating-hinge total knee arthroplasty: good outcomes at mid-term follow-up. J Arthroplasty. 2014;29(6):1202-1206.
25. Korim MT, Esler CN, Reddy VR, Ashford RU. A systematic review of endoprosthetic replacement for non-tumour indications around the knee joint. Knee. 2013;20(6):367-375.
26. Vincent KR, Vincent HK, Lee LW, Alfano AP. Inpatient rehabilitation outcomes in primary and revision total knee arthroplasty patients. Clin Orthop Relat Res. 2006;(446):201-207.
27. Vasso M, Beaufils P, Schiavone Panni A. Constraint choice in revision knee arthroplasty. Int Orthop. 2013;37(7):1279-1284.
28. Baier C, Luring C, Schaumburger J, et al. Assessing patient-oriented results after revision total knee arthroplasty. J Orthop Sci. 2013;18(6):955-961.
29. Hartford JM, Goodman SB, Schurman DJ, Knoblick G. Complex primary and revision total knee arthroplasty using the condylar constrained prosthesis: an average 5-year follow-up. J Arthroplasty. 1998;13(4):380-387.
30. Haidukewych GJ, Jacofsky DJ, Pagnano MW, Trousdale RT. Functional results after revision of well-fixed components for stiffness after primary total knee arthroplasty. J Arthroplasty. 2005;20(2):133-138.
31. Hwang SC, Kong JY, Nam DC, et al. Revision total knee arthroplasty with a cemented posterior stabilized, condylar constrained or fully constrained prosthesis: a minimum 2-year follow-up analysis. Clin Orthop Surg. 2010;2(2):112-120.
32. Barrack RL, McClure JT, Burak CF, Clohisy JC, Parvizi J, Sharkey P. Revision total knee arthroplasty: the patient’s perspective. Clin Orthop Relat Res. 2007;464:146-150.
33. Dahm DL, Barnes SA, Harrington JR, Berry DJ. Patient reported activity after revision total knee arthroplasty. J Arthroplasty. 2007;22(6 suppl 2):106-110.
34. Dahm DL, Barnes SA, Harrington JR, Sayeed SA, Berry DJ. Patient-reported activity level after total knee arthroplasty. J Arthroplasty. 2008;23(3):401-407.
35. Richards CJ, Garbuz DS, Pugh L, Masri BA. Revision total knee arthroplasty: clinical outcome comparison with and without the use of femoral head structural allograft. J Arthroplasty. 2011;26(8):1299-1304.
36. Greidanus NV, Peterson RC, Masri BA, Garbuz DS. Quality of life outcomes in revision versus primary total knee arthroplasty. J Arthroplasty. 2011;26(4):615-620.
37. Ethgen O, Bruyere O, Richy F, Dardennes C, Reginster JY. Health-related quality of life in total hip and total knee arthroplasty. A qualitative and systematic review of the literature. J Bone Joint Surg Am. 2004;86(5):963-974.
38. Murray DW, Fitzpatrick R, Rogers K, et al. The use of the Oxford hip and knee scores. J Bone Joint Surg Br. 2007;89(8):1010-1014.
39. Ware J Jr, Kosinski M, Keller SD. A 12-Item Short-Form Health Survey: construction of scales and preliminary tests of reliability and validity. Med Care. 1996;34(3):220-233.
40. Ghomrawi HM, Kane RL, Eberly LE, Bershadsky B, Saleh KJ; North American Knee Arthroplasty Revision Study Group. Patterns of functional improvement after revision knee arthroplasty. J Bone Joint Surg Am. 2009;91(12):2838-2845.
41. Deehan DJ, Murray JD, Birdsall PD, Pinder IM. Quality of life after knee revision arthroplasty. Acta Orthop. 2006;77(5):761-766.
42. Kapadia BH, McElroy MJ, Issa K, Johnson AJ, Bozic KJ, Mont MA. The economic impact of periprosthetic infections following total knee arthroplasty at a specialized tertiary-care center. J Arthroplasty. 2014;29(5):929-932.
43. Bhandari M, Smith J, Miller LE, Block JE. Clinical and economic burden of revision knee arthroplasty. Clin Med Insights Arthritis Musculoskelet Disord. 2012;5:89-94.
44. Kallala RF, Vanhegan IS, Ibrahim MS, Sarmah S, Haddad FS. Financial analysis of revision knee surgery based on NHS tariffs and hospital costs: does it pay to provide a revision service? Bone Joint J Br. 2015;97(2):197-201.
45. Ong KL, Mowat FS, Chan N, Lau E, Halpern MT, Kurtz SM. Economic burden of revision hip and knee arthroplasty in Medicare enrollees. Clin Orthop Relat Res. 2006;446:22-28.
46. Kurtz SM, Ong KL, Lau E, Bozic KJ. Impact of the economic downturn on total joint replacement demand in the United States: updated projections to 2021. J Bone Joint Surg Am. 2014;96(8):624-630.
47. Bozic KJ, Durbhakula S, Berry DJ, et al. Differences in patient and procedure characteristics and hospital resource use in primary and revision total joint arthroplasty: a multicenter study. J Arthroplasty. 2005;20(7 suppl 3):17-25.
48. Lee KJ, Moon JY, Song EK, Lim HA, Seon JK. Minimum Two-year Results of Revision Total Knee Arthroplasty Following Infectious or Non-infectious Causes. Knee Surg Relat Res. 2012;24(4):227-234.
49. Bae DK, Song SJ, Heo DB, Lee SH, Song WJ. Long-term survival rate of implants and modes of failure after revision total knee arthroplasty by a single surgeon. J Arthroplasty. 2013;28(7):1130-1134.
50. Sheng PY, Jämsen E, Lehto MU, Konttinen YT, Pajamäki J, Halonen P. Revision total knee arthroplasty with the Total Condylar III system in inflammatory arthritis. J Bone Joint Surg Br. 2005;87(9):1222-1224.
51. Lachiewicz PF, Soileau ES. Ten-year survival and clinical results of constrained components in primary total knee arthroplasty. J Arthroplasty. 2006;21(6):803-808.
52. Haas SB, Insall JN, Montgomery W 3rd, Windsor RE. Revision total knee arthroplasty with use of modular components with stems inserted without cement. J Bone Joint Surg Am. 1995;77(11):1700-1707.
53. Mabry TM, Vessely MB, Schleck CD, Harmsen WS, Berry DJ. Revision total knee arthroplasty with modular cemented stems: long-term follow-up. J Arthroplasty. 2007;22(6 Suppl 2):100-105.
54. Gudnason A, Milbrink J, Hailer NP. Implant survival and outcome after rotating-hinge total knee revision arthroplasty: a minimum 6-year follow-up. Arch Orthop Trauma Surg. 2011;131(11):1601-1607.
55. Hofmann AA, Goldberg T, Tanner AM, Kurtin SM. Treatment of infected total knee arthroplasty using an articulating spacer: 2- to 12-year experience. Clin Orthop Relat Res. 2005;430:125-131.
56. Greene JW, Reynolds SM, Stimac JD, Malkani AL, Massini MA. Midterm results of hybrid cement technique in revision total knee arthroplasty. J Arthroplasty. 2013;28(4):570-574.
57. Dalury DF, Adams MJ. Minimum 6-year follow-up of revision total knee arthroplasty without patella reimplantation. Journal Arthroplasty. 2012;27(8 Suppl):91-94.
58. Whaley AL, Trousdale RT, Rand JA, Hanssen AD. Cemented long-stem revision total knee arthroplasty. J Arthroplasty. 2003;18(5):592-599.
59. Friedman RJ, Hirst P, Poss R, Kelley K, Sledge CB. Results of revision total knee arthroplasty performed for aseptic loosening. Clinical Orthop Relat Res. 1990;255:235-241.
60. Barrack RL, Rorabeck C, Partington P, Sawhney J, Engh G. The results of retaining a well-fixed patellar component in revision total knee arthroplasty. J Arthroplasty. 2000;15(4):413-417.
61. Christensen CP, Crawford JJ, Olin MD, Vail TP. Revision of the stiff total knee arthroplasty. J Arthroplasty. 2002;17(4):409-415.
62. Garcia RM, Hardy BT, Kraay MJ, Goldberg VM. Revision total knee arthroplasty for aseptic and septic causes in patients with rheumatoid arthritis. Clin Orthop Relat Res. 2010;468(1):82-89.
63. Patil N, Lee K, Huddleston JI, Harris AH, Goodman SB. Aseptic versus septic revision total knee arthroplasty: patient satisfaction, outcome and quality of life improvement. Knee. 2010;17(3):200-203.
64. Luque R, Rizo B, Urda A, et al. Predictive factors for failure after total knee replacement revision. Int Orthop. 2014;38(2):429-435.
65. Bistolfi A, Massazza G, Rosso F, Crova M. Rotating-hinge total knee for revision total knee arthroplasty. Orthopedics. 2012;35(3):e325-e330.
66. Bottner F, Laskin R, Windsor RE, Haas SB. Hybrid component fixation in revision total knee arthroplasty. Clin Orthop Relat Res. 2006;446:127-131.
67. Jensen CL, Winther N, Schroder HM, Petersen MM. Outcome of revision total knee arthroplasty with the use of trabecular metal cone for reconstruction of severe bone loss at the proximal tibia. Knee. 2014;21(6):1233-1237.
68. Howard JL, Kudera J, Lewallen DG, Hanssen AD. Early results of the use of tantalum femoral cones for revision total knee arthroplasty. J Bone Joint Surg Am. 2011;93(5):478-484.
69. Yang JH, Yoon JR, Oh CH, Kim TS. Hybrid component fixation in total knee arthroplasty: minimum of 10-year follow-up study. J Arthroplasty. 2012;27(6):1111-1118.
70. Peters CL, Erickson JA, Gililland JM. Clinical and radiographic results of 184 consecutive revision total knee arthroplasties placed with modular cementless stems. J Arthroplasty. 2009;24(6 Suppl):48-53.
71. Registry AOANJR. Hip and Knee Arthroplasty. Annual Report 2014. 2014.
72. Registry AOANJR. Hip and Knee Arthroplasty. Annual Report 2013. 2013.