User login
Liability of Hospitalist Model of Care
The hospitalist model of care is becoming an increasingly prominent part of the inpatient clinical landscape. The percentage of hospitals in which hospitalists provide care has risen every year since 2003, and this trend is anticipated to continue.[1] In 2010, 59.8% of hospitals reported utilizing hospitalists to provide care, with a prevalence as high as 84.9% in New England.[1] Though the model started within internal medicine,[2] hospitalists can now be found in multiple medical disciplines including pediatrics, neurology, obstetrics‐gynecology, and orthopedics.[3] This model has many strengths, which include an improved provider presence in the hospital for acute issues, as well as a better understanding of hospital operations and knowledge of inpatient care. However, concerns have been raised that the hospitalist model, which does not usually involve longitudinal relationships with patients and introduces discontinuities in care, could carry a higher risk of malpractice claims.[4, 5, 6]
However, little is known about whether the hospitalist model actually leads to greater liability. Theoretical analyses suggest that failure to provide adequate follow up care, especially with regard to tests pending at discharge, may be a source of greater medical liability risk for hospitalists.[7] Coordination of care with consulting specialists and supervision of trainees may also be areas of increased liability risk.[7, 8] Prior research evaluating the difference in malpractice payments between the inpatient and outpatient settings found that the mean payment amounts were significantly higher in the inpatient setting.[9] Another study examined the rates of malpractice claims against physicians and determined that internal medicine physicians were at average risk of claims compared to other specialties.[10] However, none of the available data have provided direct information on liability risks specific to the hospitalist model.
METHODS
Design and Malpractice Claims Data
We conducted a retrospective observational analysis using closed claims data obtained from a liability insurer‐maintained database of over 52,000 coded medical malpractice claims. This database includes claims from 20 different insurance programs providing coverage to over 3000 different organizations, including academic medical centers, community hospitals, and physician groups. Approximately 30% of closed claims in the United States are included in the database. Claims in the database are categorized by allegation type, factors contributing to the error or injury, severity of injury, and claim outcome. Database categorization of claims was performed by trained registered nurses and performed according to prespecified criteria. Data on the number of physician coverage years (PCYs) were available for only one of the medical liability carriers, which covers a number of academic medical centers and community hospitals in New England. Therefore, claims rate analyses are based on information from this one insurer, which included 34,942 PCYs during the study period.
Claims with injury dates from 1997 to 2011 were used for analyses in this study. We chose 1997 as the starting year for the analysis because that was the first year the database formally included hospitalist claims as a separate category. For malpractice claims rates, the period analyzed was for injury dates from 1997 to 2008. We used 2008 as the cutoff for the analysis of claims rates to account for the time lag that can exist between the date of the alleged malpractice and the filing of a malpractice claim. Claims were classified by physician practice specialty, based on the attending physician's specialty at the time of the care that led to the claim. Hospitalists were defined as internal medicine physicians who spend >50% of their time practicing in the inpatient setting. This study was approved by the institutional review board at Brigham and Women's Hospital in Boston, Massachusetts.
Outcome Variables
Our primary outcome was the rate of malpractice claims, expressed as the number of malpractice claims per 100 PCYs. Other outcome variables, including major allegation types, contributing factors, and severity of injury, are reported as number of cases within a given category or subcategory and percentages of cases. The percentages are calculated as the percentage of the total number of claims against hospitalists. Severity of injury is ranked based on the National Association of Insurance Commissioners' Severity of Injury Scale, a standard scale for measuring the severity of injury in tort cases.[11, 12] Payment status refers to whether or not payment was made on a malpractice claim, regardless of whether payment resulted from a court judgment or a settlement. Compensation amounts are adjusted for inflation using the US Bureau of Labor Statistics Consumer Price Index, based on the year of payment and reported in 2011 dollars.[13]
Statistical Analysis
Comparisons between mean and median payment amounts were performed using the Wilcoxon rank sum test, as the distributions of the payment amounts were non‐normal. Comparisons for physician claims rates, severity of injury, and the percentage of cases in which payment was made were performed using Fisher's exact test. Confidence intervals (CIs) for proportions were calculated using the exact (Clopper‐Pearson) method. Tests performed were 2‐sided, with a P value <0.05 considered significant. Statistical analysis was performed using the SAS statistical software package, version 9.2 (SAS Institute Inc., Cary, NC).
RESULTS
We identified 272 medical malpractice claims against hospitalists. The mean age of the claimants was 56 years (standard deviation, 22 years). Claimants were 51.8% female and 44.5% male (gender not available for 3.7%).
The rate of claims against hospitalists (0.52 claims per 100 PCYs; 95% CI: 0.30‐0.85) was significantly lower than the rate of claims against nonhospitalist internal medicine physicians (1.91 claims per 100 PCYs; 95% CI: 1.73‐2.11), as well as the other physician types studied (P<0.001 for all claims rate comparisons) (Table 1). The rate of claims against nonhospitalist internal medicine physicians and emergency medicine physicians were approximately 3.5 times and 7 times, respectively, the rate of claims against hospitalists.
| Hospitalists (Internal Medicine Only) | All Other Internal Medicine Physicians | Emergency Medicine Physicians | General Surgeons | Obstetricians‐Gynecologists | |
|---|---|---|---|---|---|
| |||||
| No. of claims | 16 | 398 | 90 | 191 | 248 |
| Physician coverage years | 3,060 | 20,787 | 2,571 | 4,062 | 4,462 |
| Claims per 100 physician coverage years (95% CI) | 0.52 (0.30‐0.85) | 1.91a (1.73‐2.11) | 3.50a (2.82‐4.29) | 4.70a (4.07‐5.40) | 5.56a (4.90‐6.27) |
The most common types of allegations against hospitalists were for issues related to medical treatment (41.5%; 95% CI: 35.6%‐47.6%) and diagnosis‐related claims (36.0%; 95% CI: 30.3%‐42.0) (Table 2). The most common steps in the diagnostic process implicated in the diagnosis‐related allegations were errors in the ordering of diagnostic or lab tests (16.2%; 95% CI: 12.0%‐21.1%) and the performance of the history and physical (12.1%; 95% CI: 8.5%‐16.6%).
| Category | No. of Cases | % of Cases (95% CI) |
|---|---|---|
| ||
| Medical treatment | 113 | 41.5% (35.6%‐47.6%) |
| Diagnosis relatedb | 98 | 36.0% (30.3%‐42.0%) |
| Patient notes problem and seeks medical care | 2 | 0.7% (0.1%‐2.6%) |
| History/physical and evaluation of symptoms | 33 | 12.1% (8.5%‐16.6%) |
| Ordering of diagnostic/labs tests | 44 | 16.2% (12.0%‐21.1%) |
| Performance of tests | 8 | 2.9% (1.3%‐5.7%) |
| Interpretation of tests | 22 | 8.1% (5.1%‐12.0%) |
| Receipt or transmittal of test results | 8 | 2.9% (1.3%‐5.7%) |
| Physician follow‐up with patient | 6 | 2.2% (0.8%‐4.7%) |
| Referral management or consultation errors | 24 | 8.8% (5.7%‐12.8%) |
| Medication related | 26 | 9.6% (6.3%‐13.7%) |
| Patient monitoring | 12 | 4.4% (2.3%‐7.6%) |
| Surgical treatment | 9 | 3.3% (1.5%‐6.2%) |
The most common categories of contributing factors were errors in clinical judgment (54.4%; 95% CI: 48.3%‐60.4%) and lapses in communication (encompassing communication among clinicians and between the clinician and patient) (36.4%; 95% CI: 30.7%‐42.4%) (Table 3). Issues involving transitions of care were a factor in 37.9% of cases (95% CI: 32.1%‐43.9%). Supervision of housestaff was a factor in 1.5% of cases (95% CI: 0.4%‐3.7%).
| Contributing Factor | No. of Cases | % of Cases (95% CI) | Definition or Example |
|---|---|---|---|
| |||
| Clinical judgment | 148 | 54.4% (48.3%‐60.4%) | Problems with patient assessment or choice of therapy; failure/delay in obtaining consult/referral |
| Failure or delay in ordering a diagnostic test | 36 | 13.2% (9.4%‐17.8%) | |
| Failure or delay in obtaining a consult or referral | 35 | 12.9% (9.1%‐17.4%) | |
| Having too narrow a diagnostic focus | 34 | 12.5% (8.8%‐17.0%) | |
| Communication | 99 | 36.4% (30.7%‐42.4%) | Issues with communication among clinicians or between the clinicians and the patient or family |
| Inadequate communication among providers regarding the patient's condition | 61 | 22.4% (17.6%‐27.9%) | |
| Poor rapport with/lack of sympathy toward and patient and/or family | 15 | 5.5% (3.1%‐8.9%) | |
| Insufficient education of the patient and/or family regarding the risks of medications | 9 | 3.3% (1.5%‐6.2%) | |
| Documentation | 53 | 19.5% (14.9%‐24.7%) | Insufficient or lack of documentation |
| Administrative | 47 | 17.3% (13.0%‐22.3%) | Problems with staffing or hospital policies and protocols |
| Clinical systems | 44 | 16.2% (12.0%‐21.1%) | Failure or delay in scheduling a recommended test or failure to identify the provider coordinating care |
| Behavior related | 28 | 10.3% (7.0%‐14.5%) | Patient not following provider recommendations; seeking other providers due to dissatisfaction with care |
The percentage of claims involving a patient death was significantly higher among hospitalist cases (50.4%; 95% CI: 44.3%‐56.5%) compared to all other inpatient cases (29.1%; 95% CI: 28.4%‐29.8%) or outpatient cases (18.2%; 95% CI: 17.6%‐18.9%) (P<0.001 for both comparisons), but lower than nonhospitalist inpatient internal medicine cases (57.6%; 95% CI: 54.6%‐60.5%) (P=0.035) (Table 4).
| Severitya | Hospitalists Cases, Internal Medicine Only, n=272 | All Other Inpatient Internal Medicine Cases, n=1120 | All Other Inpatient Cases, n=14,386 | Outpatient Cases, n=15,039 | ||||
|---|---|---|---|---|---|---|---|---|
| No. of Cases | % of Cases (95% CI) | No. of Cases | % of Cases (95% CI) | No. of Cases | % of Cases (95% CI) | No. of Cases | % of Cases (95% CI) | |
| ||||||||
| Low | 19 | 7.0% (4.3%‐10.7%) | 61 | 5.4% (4.2%‐6.9%) | 1,180 | 8.2% (7.8%‐8.7%) | 2,279 | 15.2%b (14.6%‐15.7%) |
| Medium | 65 | 23.9% (19.0%‐29.4%) | 235 | 21.0% (18.6%‐23.5%) | 6,503 | 45.2%b (44.4%‐46.0%) | 7,803 | 51.9%b (51.1%‐52.7%) |
| High | 188 | 69.1% (63.3%‐74.6%) | 824 | 73.6% (70.9%‐76.1%) | 6,703 | 46.6%b (45.8%‐47.4%) | 4,957 | 33.0%b (32.2%‐33.7%) |
| Death | 137 | 50.4% (44.3%‐56.5%) | 645 | 57.6%c (54.6%‐60.5%) | 4,186 | 29.1%b (28.4%‐29.8%) | 2,744 | 18.2%b (17.6%‐18.9%) |
There were no significant differences in the percentage of hospitalist cases in which payment was made (32.0%; 95% CI: 26.5%‐37.9%) compared to any of the other 3 groups studied (Table 5). The median payment in hospitalist cases, $240,000 (interquartile range [IQR]: $100,000$524,245), was significantly higher than that in all other inpatient cases ($156,714; IQR: $39,188$488,996) (P=0.040) and in outpatient cases ($92,671; IQR: $20,895$325,461) (P<0.001), though not significantly different than the median payment in all other inpatient internal medicine cases ($206,314; IQR: $57,382$488,996).
| Hospitalist Cases, Internal Medicine Only | All Other Inpatient Internal Medicine Cases | All Other Inpatient Cases | Outpatient Cases | |||||
|---|---|---|---|---|---|---|---|---|
| No. of Cases | % of Cases (95% CI) | No. of Cases | % of Cases (95% CI) | No. of Cases | % of Cases (95% CI) | No. of Cases | % of Cases (95% CI) | |
| ||||||||
| Payment made | 87 | 32.0% (26.5%‐37.9%) | 330 | 29.5% (26.8%‐32.2%) | 5164 | 35.9% (35.1%‐36.7%) | 4632 | 30.8% (30.1%‐31.5%) |
| No payment made | 185 | 68.0% (62.1%‐73.5%) | 790 | 70.5% (67.8%‐73.2%) | 9222 | 64.1% (63.3%‐64.9%) | 10407 | 69.2% (68.5%‐69.9%) |
| Mean payment (95% CI) | $384,617 ($289,662‐$479,573) | $451,713 ($359,656‐$543,769) | $482,963 ($452,725‐$513,202) | $305,462b ($286,517‐$324,408) | ||||
| Median payment (IQR) | $240,000 ($100,000$524,245) | $206,314 ($57,382$488,996) | $156,714c ($39,188$488,996) | $92,671b ($20,895$325,461) | ||||
| Standard deviation | $445,531 | $850,086 | $1,108,404 | $657,707 | ||||
DISCUSSION
In our analysis of closed medical malpractice claims, we found that hospitalists have a significantly lower rate of claims compared to the other types of physicians studied, including other internal medicine physicians and emergency medicine physicians. Although hospitalists had a relatively low rate of claims, the severity of injury involved in those claims was high.
Prior research has found that the proportion of internal medicine physicians who face a malpractice claim each year is between 7% and 8%.[10] The rate of claims against internal medicine physicians in this prior study was similar to that of emergency medicine physicians, who, like hospitalists, are defined by their site of practice. In addition, both frequently work with acutely ill patients with whom they do not have a longitudinal relationship. However, this prior analysis did not assess for any difference in malpractice risk based on whether internal medicine physicians were practicing primarily as outpatient physicians or as hospitalists, and so the liability risk of hospitalists (as opposed to internal medicine physicians generally) remains undefined. Our analysis sought to determine whether there is a difference in claims rates when adopting a hospitalist model.
Notably, two factors have been raised as potentially increasing the risk that hospitalists will be subject to malpractice claims. The first is that hospitalists have only a brief relationship with their patients, thus limiting their ability to form the strong physician‐patient relationships that decrease the likelihood of a malpractice claim.[14, 15, 16, 17] Second, hospitalists face the challenge of transitions of care as patients move from the outpatient to the inpatient setting, and vice versa.[4, 7, 18, 19] Despite these theoretical concerns, we found that hospitalists face a relatively low rate of claims compared to other physicians. The reasons for this low liability risk remain uncertain.
One possible explanation for this relatively low rate of claims against hospitalists is that hospitalists are actually at lower risk of missing a diagnosis, the most common reason for a malpractice claim in the ambulatory setting.[20, 21, 22] In contrast to how patients may present in the clinic or the emergency department, when patients are admitted to the hospital, it is likely that they present to the hospitalist with a known problem, rather than a clinical symptom without an etiology. For example, when a patient is admitted to the hospital for chest pain, other physicians may have already been concerned enough to raise clinical suspicion of a myocardial infarction and order basic testing, making the diagnosis less likely to be missed when the hospitalist assumes care of that patient. Indeed, we found that, among the claims made against hospitalists, the leading type of allegation was an error in treatment rather than an error in diagnosis.
It is also possible that the lower rate of claims against hospitalists reflects the high quality of care provided by hospitalists, resulting from their clinical expertise and knowledge of hospital systems. High clinical volume is associated with better outcomes for multiple surgical procedures,[23] and, to a lesser degree, for certain medical conditions.[24] Because hospitalists are likely to see a high volume of those medical conditions that regularly require admission to an inpatient medical service, this high volume could translate into higher quality of care, both because of medical expertise in managing these conditions and because of proficiency in dealing with hospital systems. However, this theory must be tempered by the conclusion from earlier work that did not show a large difference in outcomes among patients cared for by hospitalists.[25]
Another reason for the lower claims rate could be a direct result of how hospitalist jobs are structured. In prior research, an inadequate physician‐patient relationship has been found to be a factor in patients deciding to file a malpractice claim.[14, 15, 16, 17] Although hospitalists usually only care for their patients during the few days of the hospital admission, hospitalists are on site all day and thus are able to frequently communicate with patients and families face to face. This level of interaction may allow for a sufficiently healthy, even if time‐limited, physician‐patient relationship that meets patients' expectations.
For the claims that occur, deficiencies in communication and transitions of care, both of which have been cited as a special concern for hospitalists, were in fact present in 37.9% of the hospitalist cases we evaluated.[7] This proportion appears to be higher than previous work in the ambulatory setting that showed communication generally to be a factor in 30% of cases, and problems related to handoffs specifically to be a factor in 20% of cases.[20] These findings highlight the risks associated with the discontinuities inherent in the hospitalist model, which can occur on admission, during the hospitalization (where a number of hospitalists may care for one patient), and on discharge. These findings also point to the need for ongoing efforts to address these concerns.
More than half of the claims against hospitalists (50.4%; 95% CI: 44.3%‐56.5%) involved the death of the patient. However, this high rate of claims involving the death of the patient did not appear to be specific to hospitalists. Rather, this appeared to be true for inpatient internal medicine cases generally, because the rate of claims in which the severity of injury was death was significantly higher among nonhospitalist inpatient internal medicine cases (57.6%; 95% CI: 54.6%‐60.5%).
Our study has several limitations. Though the database that we used includes hospitals and physician groups from 20 different liability carriers covering multiple regions across the country, it nonetheless may not be entirely representative, especially given the variation in the hospitalist models used at different institutions (for example, coverage of intensive care unit patients) and because of geographic variability. However, the sample did contain a large proportion (approximately 30%) of closed claims nationally. Claims rates are based on data from a single insurance carrier, albeit one with 23,847 PCYs among internal medicine physicians during the study period. Second, we defined hospitalist cases as those cases in which the hospitalist was the attending of record at the time of the clinical event that gave rise to the malpractice claim. It is possible that this definition captured claims in which the hospitalist, although the attending of record, may not have been directly involved in the care leading to the claim (for example, a problem with a surgery gave rise to the claim). Third, we assessed liability risk by years covered, which does not account for risk that may vary based on clinical volume.
Overall, our results suggest that liability fears should not impede the adoption of the hospitalist model in internal medicine. Not only do hospitalists have a lower rate of claims, but there is also no difference in the rate at which claims are paid or mean indemnity amounts for the claims that are paid for hospitalists. Previous analyses of the costs associated with care by hospitalists, compared to care by other types of physicians, have not taken into account the decreased liability costs that are likely associated with care provided by hospitalists.[25, 26]
In conclusion, contrary to concerns that have been raised, we found that hospitalists face a lower rate of malpractice claims when compared to other internal medicine physicians and specialties. However, we did find that care discontinuities may be resulting in liability risk due to communication and handoff‐related errors. Improvements in the hospitalist model of care targeted at improving communication and clinical judgment may not only further reduce claims against hospitalists, but also improve the safety of care associated with this model.
Disclosures
Dr. Kachalia has received honoraria from Quantia MD for presentations on patient safety. Dr. Schaffer, Ms. Raman, and Ms. Puopolo have no disclosures. The authors report no conflicts of interest.
- American Hospital Association. AHA Hospital Statistics. 2012 ed. Chicago, IL: Health Forum; 2012.
- , . The emerging role of "hospitalists" in the American health care system. N Engl J Med. 1996;335(7):514–517.
- , , . Specialty hospitalists: analyzing an emerging phenomenon. JAMA. 2012;307(16):1699–1700.
- , , , . Primary care physician attitudes regarding communication with hospitalists. Am J Med. 2001;111(9B):15S–20S.
- . Hospitalists and the doctor‐patient relationship. J Legal Stud. 2001;30(2):589–606.
- . Rapport and the hospitalist. Am J Med. 2001;111(9B):31S–35S.
- . Key legal principles for hospitalists. Am J Med. 2001;111(9B):5S–9S.
- , . Medical malpractice. In: McKean S, Ross J, Dressler D, Brotman D, Ginsberg J, eds. Principles and Practice of Hospital Medicine. New York, NY: McGraw Hill; 2012.
- , , . Paid malpractice claims for adverse events in inpatient and outpatient settings. JAMA. 2011;305(23):2427–2431.
- , , , . Malpractice risk according to physician specialty. N Engl J Med. 2011;365(7):629–636.
- Sowka MP, ed. NAIC Malpractice Claims, Final Compilation. Brookfield, WI: National Association of Insurance Commissioners; 1980.
- , . Medical Malpractice Insurance Claims in Seven States, 2000–2004. U.S. Department of Justice, Office of Justice Programs, Bureau of Justice Statistics Special Report; March 2007.
- Bureau of Labor Statistics. Available at: http://data.bls.gov/pdq/querytool.jsp?survey=cu. Accessed December 3, 2012.
- , , , . The doctor‐patient relationship and malpractice. Lessons from plaintiff depositions. Arch Intern Med. 1994;154(12):1365–1370.
- , , , . Factors that prompted families to file medical malpractice claims following perinatal injuries. JAMA. 1992;267(10):1359–1363.
- , , . Why do people sue doctors? A study of patients and relatives taking legal action. Lancet. 1994;343(8913):1609–1613.
- , , , , . Physician‐patient communication. The relationship with malpractice claims among primary care physicians and surgeons. JAMA. 1997;277(7):553–559.
- , , , . Medical errors related to discontinuity of care from an inpatient to an outpatient setting. J Gen Intern Med. 2003;18(8):646–651.
- , . The ethics of the hospitalist model. J Hosp Med. 2010;5(3):183–188.
- , , , et al. Missed and delayed diagnoses in the ambulatory setting: a study of closed malpractice claims. Ann Intern Med. 2006;145(7):488–496.
- , , , , , . Learning from malpractice claims about negligent, adverse events in primary care in the United States. Qual Saf Health Care. 2004;13(2):121–126.
- , , , et al. Primary care closed claims experience of Massachusetts malpractice insurers. JAMA Intern Med. 2013;173(22):2063–2068.
- , , , et al. Hospital volume and surgical mortality in the United States. N Engl J Med. 2002;346(15):1128–1137.
- , , , et al. Hospital volume and 30‐day mortality for three common medical conditions. N Engl J Med. 2010;362(12):1110–1118.
- , , , , , . Outcomes of care by hospitalists, general internists, and family physicians. N Engl J Med. 2007;357(25):2589–2600.
- , , , et al. Quality of care for decompensated heart failure: comparable performance between academic hospitalists and non‐hospitalists. J Gen Intern Med. 2008;23(9):1399–1406.
The hospitalist model of care is becoming an increasingly prominent part of the inpatient clinical landscape. The percentage of hospitals in which hospitalists provide care has risen every year since 2003, and this trend is anticipated to continue.[1] In 2010, 59.8% of hospitals reported utilizing hospitalists to provide care, with a prevalence as high as 84.9% in New England.[1] Though the model started within internal medicine,[2] hospitalists can now be found in multiple medical disciplines including pediatrics, neurology, obstetrics‐gynecology, and orthopedics.[3] This model has many strengths, which include an improved provider presence in the hospital for acute issues, as well as a better understanding of hospital operations and knowledge of inpatient care. However, concerns have been raised that the hospitalist model, which does not usually involve longitudinal relationships with patients and introduces discontinuities in care, could carry a higher risk of malpractice claims.[4, 5, 6]
However, little is known about whether the hospitalist model actually leads to greater liability. Theoretical analyses suggest that failure to provide adequate follow up care, especially with regard to tests pending at discharge, may be a source of greater medical liability risk for hospitalists.[7] Coordination of care with consulting specialists and supervision of trainees may also be areas of increased liability risk.[7, 8] Prior research evaluating the difference in malpractice payments between the inpatient and outpatient settings found that the mean payment amounts were significantly higher in the inpatient setting.[9] Another study examined the rates of malpractice claims against physicians and determined that internal medicine physicians were at average risk of claims compared to other specialties.[10] However, none of the available data have provided direct information on liability risks specific to the hospitalist model.
METHODS
Design and Malpractice Claims Data
We conducted a retrospective observational analysis using closed claims data obtained from a liability insurer‐maintained database of over 52,000 coded medical malpractice claims. This database includes claims from 20 different insurance programs providing coverage to over 3000 different organizations, including academic medical centers, community hospitals, and physician groups. Approximately 30% of closed claims in the United States are included in the database. Claims in the database are categorized by allegation type, factors contributing to the error or injury, severity of injury, and claim outcome. Database categorization of claims was performed by trained registered nurses and performed according to prespecified criteria. Data on the number of physician coverage years (PCYs) were available for only one of the medical liability carriers, which covers a number of academic medical centers and community hospitals in New England. Therefore, claims rate analyses are based on information from this one insurer, which included 34,942 PCYs during the study period.
Claims with injury dates from 1997 to 2011 were used for analyses in this study. We chose 1997 as the starting year for the analysis because that was the first year the database formally included hospitalist claims as a separate category. For malpractice claims rates, the period analyzed was for injury dates from 1997 to 2008. We used 2008 as the cutoff for the analysis of claims rates to account for the time lag that can exist between the date of the alleged malpractice and the filing of a malpractice claim. Claims were classified by physician practice specialty, based on the attending physician's specialty at the time of the care that led to the claim. Hospitalists were defined as internal medicine physicians who spend >50% of their time practicing in the inpatient setting. This study was approved by the institutional review board at Brigham and Women's Hospital in Boston, Massachusetts.
Outcome Variables
Our primary outcome was the rate of malpractice claims, expressed as the number of malpractice claims per 100 PCYs. Other outcome variables, including major allegation types, contributing factors, and severity of injury, are reported as number of cases within a given category or subcategory and percentages of cases. The percentages are calculated as the percentage of the total number of claims against hospitalists. Severity of injury is ranked based on the National Association of Insurance Commissioners' Severity of Injury Scale, a standard scale for measuring the severity of injury in tort cases.[11, 12] Payment status refers to whether or not payment was made on a malpractice claim, regardless of whether payment resulted from a court judgment or a settlement. Compensation amounts are adjusted for inflation using the US Bureau of Labor Statistics Consumer Price Index, based on the year of payment and reported in 2011 dollars.[13]
Statistical Analysis
Comparisons between mean and median payment amounts were performed using the Wilcoxon rank sum test, as the distributions of the payment amounts were non‐normal. Comparisons for physician claims rates, severity of injury, and the percentage of cases in which payment was made were performed using Fisher's exact test. Confidence intervals (CIs) for proportions were calculated using the exact (Clopper‐Pearson) method. Tests performed were 2‐sided, with a P value <0.05 considered significant. Statistical analysis was performed using the SAS statistical software package, version 9.2 (SAS Institute Inc., Cary, NC).
RESULTS
We identified 272 medical malpractice claims against hospitalists. The mean age of the claimants was 56 years (standard deviation, 22 years). Claimants were 51.8% female and 44.5% male (gender not available for 3.7%).
The rate of claims against hospitalists (0.52 claims per 100 PCYs; 95% CI: 0.30‐0.85) was significantly lower than the rate of claims against nonhospitalist internal medicine physicians (1.91 claims per 100 PCYs; 95% CI: 1.73‐2.11), as well as the other physician types studied (P<0.001 for all claims rate comparisons) (Table 1). The rate of claims against nonhospitalist internal medicine physicians and emergency medicine physicians were approximately 3.5 times and 7 times, respectively, the rate of claims against hospitalists.
| Hospitalists (Internal Medicine Only) | All Other Internal Medicine Physicians | Emergency Medicine Physicians | General Surgeons | Obstetricians‐Gynecologists | |
|---|---|---|---|---|---|
| |||||
| No. of claims | 16 | 398 | 90 | 191 | 248 |
| Physician coverage years | 3,060 | 20,787 | 2,571 | 4,062 | 4,462 |
| Claims per 100 physician coverage years (95% CI) | 0.52 (0.30‐0.85) | 1.91a (1.73‐2.11) | 3.50a (2.82‐4.29) | 4.70a (4.07‐5.40) | 5.56a (4.90‐6.27) |
The most common types of allegations against hospitalists were for issues related to medical treatment (41.5%; 95% CI: 35.6%‐47.6%) and diagnosis‐related claims (36.0%; 95% CI: 30.3%‐42.0) (Table 2). The most common steps in the diagnostic process implicated in the diagnosis‐related allegations were errors in the ordering of diagnostic or lab tests (16.2%; 95% CI: 12.0%‐21.1%) and the performance of the history and physical (12.1%; 95% CI: 8.5%‐16.6%).
| Category | No. of Cases | % of Cases (95% CI) |
|---|---|---|
| ||
| Medical treatment | 113 | 41.5% (35.6%‐47.6%) |
| Diagnosis relatedb | 98 | 36.0% (30.3%‐42.0%) |
| Patient notes problem and seeks medical care | 2 | 0.7% (0.1%‐2.6%) |
| History/physical and evaluation of symptoms | 33 | 12.1% (8.5%‐16.6%) |
| Ordering of diagnostic/labs tests | 44 | 16.2% (12.0%‐21.1%) |
| Performance of tests | 8 | 2.9% (1.3%‐5.7%) |
| Interpretation of tests | 22 | 8.1% (5.1%‐12.0%) |
| Receipt or transmittal of test results | 8 | 2.9% (1.3%‐5.7%) |
| Physician follow‐up with patient | 6 | 2.2% (0.8%‐4.7%) |
| Referral management or consultation errors | 24 | 8.8% (5.7%‐12.8%) |
| Medication related | 26 | 9.6% (6.3%‐13.7%) |
| Patient monitoring | 12 | 4.4% (2.3%‐7.6%) |
| Surgical treatment | 9 | 3.3% (1.5%‐6.2%) |
The most common categories of contributing factors were errors in clinical judgment (54.4%; 95% CI: 48.3%‐60.4%) and lapses in communication (encompassing communication among clinicians and between the clinician and patient) (36.4%; 95% CI: 30.7%‐42.4%) (Table 3). Issues involving transitions of care were a factor in 37.9% of cases (95% CI: 32.1%‐43.9%). Supervision of housestaff was a factor in 1.5% of cases (95% CI: 0.4%‐3.7%).
| Contributing Factor | No. of Cases | % of Cases (95% CI) | Definition or Example |
|---|---|---|---|
| |||
| Clinical judgment | 148 | 54.4% (48.3%‐60.4%) | Problems with patient assessment or choice of therapy; failure/delay in obtaining consult/referral |
| Failure or delay in ordering a diagnostic test | 36 | 13.2% (9.4%‐17.8%) | |
| Failure or delay in obtaining a consult or referral | 35 | 12.9% (9.1%‐17.4%) | |
| Having too narrow a diagnostic focus | 34 | 12.5% (8.8%‐17.0%) | |
| Communication | 99 | 36.4% (30.7%‐42.4%) | Issues with communication among clinicians or between the clinicians and the patient or family |
| Inadequate communication among providers regarding the patient's condition | 61 | 22.4% (17.6%‐27.9%) | |
| Poor rapport with/lack of sympathy toward and patient and/or family | 15 | 5.5% (3.1%‐8.9%) | |
| Insufficient education of the patient and/or family regarding the risks of medications | 9 | 3.3% (1.5%‐6.2%) | |
| Documentation | 53 | 19.5% (14.9%‐24.7%) | Insufficient or lack of documentation |
| Administrative | 47 | 17.3% (13.0%‐22.3%) | Problems with staffing or hospital policies and protocols |
| Clinical systems | 44 | 16.2% (12.0%‐21.1%) | Failure or delay in scheduling a recommended test or failure to identify the provider coordinating care |
| Behavior related | 28 | 10.3% (7.0%‐14.5%) | Patient not following provider recommendations; seeking other providers due to dissatisfaction with care |
The percentage of claims involving a patient death was significantly higher among hospitalist cases (50.4%; 95% CI: 44.3%‐56.5%) compared to all other inpatient cases (29.1%; 95% CI: 28.4%‐29.8%) or outpatient cases (18.2%; 95% CI: 17.6%‐18.9%) (P<0.001 for both comparisons), but lower than nonhospitalist inpatient internal medicine cases (57.6%; 95% CI: 54.6%‐60.5%) (P=0.035) (Table 4).
| Severitya | Hospitalists Cases, Internal Medicine Only, n=272 | All Other Inpatient Internal Medicine Cases, n=1120 | All Other Inpatient Cases, n=14,386 | Outpatient Cases, n=15,039 | ||||
|---|---|---|---|---|---|---|---|---|
| No. of Cases | % of Cases (95% CI) | No. of Cases | % of Cases (95% CI) | No. of Cases | % of Cases (95% CI) | No. of Cases | % of Cases (95% CI) | |
| ||||||||
| Low | 19 | 7.0% (4.3%‐10.7%) | 61 | 5.4% (4.2%‐6.9%) | 1,180 | 8.2% (7.8%‐8.7%) | 2,279 | 15.2%b (14.6%‐15.7%) |
| Medium | 65 | 23.9% (19.0%‐29.4%) | 235 | 21.0% (18.6%‐23.5%) | 6,503 | 45.2%b (44.4%‐46.0%) | 7,803 | 51.9%b (51.1%‐52.7%) |
| High | 188 | 69.1% (63.3%‐74.6%) | 824 | 73.6% (70.9%‐76.1%) | 6,703 | 46.6%b (45.8%‐47.4%) | 4,957 | 33.0%b (32.2%‐33.7%) |
| Death | 137 | 50.4% (44.3%‐56.5%) | 645 | 57.6%c (54.6%‐60.5%) | 4,186 | 29.1%b (28.4%‐29.8%) | 2,744 | 18.2%b (17.6%‐18.9%) |
There were no significant differences in the percentage of hospitalist cases in which payment was made (32.0%; 95% CI: 26.5%‐37.9%) compared to any of the other 3 groups studied (Table 5). The median payment in hospitalist cases, $240,000 (interquartile range [IQR]: $100,000$524,245), was significantly higher than that in all other inpatient cases ($156,714; IQR: $39,188$488,996) (P=0.040) and in outpatient cases ($92,671; IQR: $20,895$325,461) (P<0.001), though not significantly different than the median payment in all other inpatient internal medicine cases ($206,314; IQR: $57,382$488,996).
| Hospitalist Cases, Internal Medicine Only | All Other Inpatient Internal Medicine Cases | All Other Inpatient Cases | Outpatient Cases | |||||
|---|---|---|---|---|---|---|---|---|
| No. of Cases | % of Cases (95% CI) | No. of Cases | % of Cases (95% CI) | No. of Cases | % of Cases (95% CI) | No. of Cases | % of Cases (95% CI) | |
| ||||||||
| Payment made | 87 | 32.0% (26.5%‐37.9%) | 330 | 29.5% (26.8%‐32.2%) | 5164 | 35.9% (35.1%‐36.7%) | 4632 | 30.8% (30.1%‐31.5%) |
| No payment made | 185 | 68.0% (62.1%‐73.5%) | 790 | 70.5% (67.8%‐73.2%) | 9222 | 64.1% (63.3%‐64.9%) | 10407 | 69.2% (68.5%‐69.9%) |
| Mean payment (95% CI) | $384,617 ($289,662‐$479,573) | $451,713 ($359,656‐$543,769) | $482,963 ($452,725‐$513,202) | $305,462b ($286,517‐$324,408) | ||||
| Median payment (IQR) | $240,000 ($100,000$524,245) | $206,314 ($57,382$488,996) | $156,714c ($39,188$488,996) | $92,671b ($20,895$325,461) | ||||
| Standard deviation | $445,531 | $850,086 | $1,108,404 | $657,707 | ||||
DISCUSSION
In our analysis of closed medical malpractice claims, we found that hospitalists have a significantly lower rate of claims compared to the other types of physicians studied, including other internal medicine physicians and emergency medicine physicians. Although hospitalists had a relatively low rate of claims, the severity of injury involved in those claims was high.
Prior research has found that the proportion of internal medicine physicians who face a malpractice claim each year is between 7% and 8%.[10] The rate of claims against internal medicine physicians in this prior study was similar to that of emergency medicine physicians, who, like hospitalists, are defined by their site of practice. In addition, both frequently work with acutely ill patients with whom they do not have a longitudinal relationship. However, this prior analysis did not assess for any difference in malpractice risk based on whether internal medicine physicians were practicing primarily as outpatient physicians or as hospitalists, and so the liability risk of hospitalists (as opposed to internal medicine physicians generally) remains undefined. Our analysis sought to determine whether there is a difference in claims rates when adopting a hospitalist model.
Notably, two factors have been raised as potentially increasing the risk that hospitalists will be subject to malpractice claims. The first is that hospitalists have only a brief relationship with their patients, thus limiting their ability to form the strong physician‐patient relationships that decrease the likelihood of a malpractice claim.[14, 15, 16, 17] Second, hospitalists face the challenge of transitions of care as patients move from the outpatient to the inpatient setting, and vice versa.[4, 7, 18, 19] Despite these theoretical concerns, we found that hospitalists face a relatively low rate of claims compared to other physicians. The reasons for this low liability risk remain uncertain.
One possible explanation for this relatively low rate of claims against hospitalists is that hospitalists are actually at lower risk of missing a diagnosis, the most common reason for a malpractice claim in the ambulatory setting.[20, 21, 22] In contrast to how patients may present in the clinic or the emergency department, when patients are admitted to the hospital, it is likely that they present to the hospitalist with a known problem, rather than a clinical symptom without an etiology. For example, when a patient is admitted to the hospital for chest pain, other physicians may have already been concerned enough to raise clinical suspicion of a myocardial infarction and order basic testing, making the diagnosis less likely to be missed when the hospitalist assumes care of that patient. Indeed, we found that, among the claims made against hospitalists, the leading type of allegation was an error in treatment rather than an error in diagnosis.
It is also possible that the lower rate of claims against hospitalists reflects the high quality of care provided by hospitalists, resulting from their clinical expertise and knowledge of hospital systems. High clinical volume is associated with better outcomes for multiple surgical procedures,[23] and, to a lesser degree, for certain medical conditions.[24] Because hospitalists are likely to see a high volume of those medical conditions that regularly require admission to an inpatient medical service, this high volume could translate into higher quality of care, both because of medical expertise in managing these conditions and because of proficiency in dealing with hospital systems. However, this theory must be tempered by the conclusion from earlier work that did not show a large difference in outcomes among patients cared for by hospitalists.[25]
Another reason for the lower claims rate could be a direct result of how hospitalist jobs are structured. In prior research, an inadequate physician‐patient relationship has been found to be a factor in patients deciding to file a malpractice claim.[14, 15, 16, 17] Although hospitalists usually only care for their patients during the few days of the hospital admission, hospitalists are on site all day and thus are able to frequently communicate with patients and families face to face. This level of interaction may allow for a sufficiently healthy, even if time‐limited, physician‐patient relationship that meets patients' expectations.
For the claims that occur, deficiencies in communication and transitions of care, both of which have been cited as a special concern for hospitalists, were in fact present in 37.9% of the hospitalist cases we evaluated.[7] This proportion appears to be higher than previous work in the ambulatory setting that showed communication generally to be a factor in 30% of cases, and problems related to handoffs specifically to be a factor in 20% of cases.[20] These findings highlight the risks associated with the discontinuities inherent in the hospitalist model, which can occur on admission, during the hospitalization (where a number of hospitalists may care for one patient), and on discharge. These findings also point to the need for ongoing efforts to address these concerns.
More than half of the claims against hospitalists (50.4%; 95% CI: 44.3%‐56.5%) involved the death of the patient. However, this high rate of claims involving the death of the patient did not appear to be specific to hospitalists. Rather, this appeared to be true for inpatient internal medicine cases generally, because the rate of claims in which the severity of injury was death was significantly higher among nonhospitalist inpatient internal medicine cases (57.6%; 95% CI: 54.6%‐60.5%).
Our study has several limitations. Though the database that we used includes hospitals and physician groups from 20 different liability carriers covering multiple regions across the country, it nonetheless may not be entirely representative, especially given the variation in the hospitalist models used at different institutions (for example, coverage of intensive care unit patients) and because of geographic variability. However, the sample did contain a large proportion (approximately 30%) of closed claims nationally. Claims rates are based on data from a single insurance carrier, albeit one with 23,847 PCYs among internal medicine physicians during the study period. Second, we defined hospitalist cases as those cases in which the hospitalist was the attending of record at the time of the clinical event that gave rise to the malpractice claim. It is possible that this definition captured claims in which the hospitalist, although the attending of record, may not have been directly involved in the care leading to the claim (for example, a problem with a surgery gave rise to the claim). Third, we assessed liability risk by years covered, which does not account for risk that may vary based on clinical volume.
Overall, our results suggest that liability fears should not impede the adoption of the hospitalist model in internal medicine. Not only do hospitalists have a lower rate of claims, but there is also no difference in the rate at which claims are paid or mean indemnity amounts for the claims that are paid for hospitalists. Previous analyses of the costs associated with care by hospitalists, compared to care by other types of physicians, have not taken into account the decreased liability costs that are likely associated with care provided by hospitalists.[25, 26]
In conclusion, contrary to concerns that have been raised, we found that hospitalists face a lower rate of malpractice claims when compared to other internal medicine physicians and specialties. However, we did find that care discontinuities may be resulting in liability risk due to communication and handoff‐related errors. Improvements in the hospitalist model of care targeted at improving communication and clinical judgment may not only further reduce claims against hospitalists, but also improve the safety of care associated with this model.
Disclosures
Dr. Kachalia has received honoraria from Quantia MD for presentations on patient safety. Dr. Schaffer, Ms. Raman, and Ms. Puopolo have no disclosures. The authors report no conflicts of interest.
- American Hospital Association. AHA Hospital Statistics. 2012 ed. Chicago, IL: Health Forum; 2012.
- , . The emerging role of "hospitalists" in the American health care system. N Engl J Med. 1996;335(7):514–517.
- , , . Specialty hospitalists: analyzing an emerging phenomenon. JAMA. 2012;307(16):1699–1700.
- , , , . Primary care physician attitudes regarding communication with hospitalists. Am J Med. 2001;111(9B):15S–20S.
- . Hospitalists and the doctor‐patient relationship. J Legal Stud. 2001;30(2):589–606.
- . Rapport and the hospitalist. Am J Med. 2001;111(9B):31S–35S.
- . Key legal principles for hospitalists. Am J Med. 2001;111(9B):5S–9S.
- , . Medical malpractice. In: McKean S, Ross J, Dressler D, Brotman D, Ginsberg J, eds. Principles and Practice of Hospital Medicine. New York, NY: McGraw Hill; 2012.
- , , . Paid malpractice claims for adverse events in inpatient and outpatient settings. JAMA. 2011;305(23):2427–2431.
- , , , . Malpractice risk according to physician specialty. N Engl J Med. 2011;365(7):629–636.
- Sowka MP, ed. NAIC Malpractice Claims, Final Compilation. Brookfield, WI: National Association of Insurance Commissioners; 1980.
- , . Medical Malpractice Insurance Claims in Seven States, 2000–2004. U.S. Department of Justice, Office of Justice Programs, Bureau of Justice Statistics Special Report; March 2007.
- Bureau of Labor Statistics. Available at: http://data.bls.gov/pdq/querytool.jsp?survey=cu. Accessed December 3, 2012.
- , , , . The doctor‐patient relationship and malpractice. Lessons from plaintiff depositions. Arch Intern Med. 1994;154(12):1365–1370.
- , , , . Factors that prompted families to file medical malpractice claims following perinatal injuries. JAMA. 1992;267(10):1359–1363.
- , , . Why do people sue doctors? A study of patients and relatives taking legal action. Lancet. 1994;343(8913):1609–1613.
- , , , , . Physician‐patient communication. The relationship with malpractice claims among primary care physicians and surgeons. JAMA. 1997;277(7):553–559.
- , , , . Medical errors related to discontinuity of care from an inpatient to an outpatient setting. J Gen Intern Med. 2003;18(8):646–651.
- , . The ethics of the hospitalist model. J Hosp Med. 2010;5(3):183–188.
- , , , et al. Missed and delayed diagnoses in the ambulatory setting: a study of closed malpractice claims. Ann Intern Med. 2006;145(7):488–496.
- , , , , , . Learning from malpractice claims about negligent, adverse events in primary care in the United States. Qual Saf Health Care. 2004;13(2):121–126.
- , , , et al. Primary care closed claims experience of Massachusetts malpractice insurers. JAMA Intern Med. 2013;173(22):2063–2068.
- , , , et al. Hospital volume and surgical mortality in the United States. N Engl J Med. 2002;346(15):1128–1137.
- , , , et al. Hospital volume and 30‐day mortality for three common medical conditions. N Engl J Med. 2010;362(12):1110–1118.
- , , , , , . Outcomes of care by hospitalists, general internists, and family physicians. N Engl J Med. 2007;357(25):2589–2600.
- , , , et al. Quality of care for decompensated heart failure: comparable performance between academic hospitalists and non‐hospitalists. J Gen Intern Med. 2008;23(9):1399–1406.
© 2014 Society of Hospital Medicine
Primary Care Medical Services for Homeless Veterans
On a single night in 2012, 62,619 veterans experienced homelessness.1 With high rates of illness, as well as alcohol, tobacco, and other drug (ATOD) use among homeless adults, ending veteran homelessness is a signature initiative of the VA.2-4 However, despite increasing efforts to improve health care for homeless individuals, little is known about best practices in homeless-focused primary care.2,5
With an age-adjusted mortality that is 2 to 10 times higher than that of their housed counterparts, homeless veterans pose a formidable challenge for primary care providers (PCPs).6,7 The complexity of homeless persons’ primary care needs is compounded by poor social support and the need to navigate priorities (eg, shelter) that compete with medical care.6,8,9 Moreover, veterans may face unique vulnerabilities conferred by military-specific experiences.2,10
As of 2012, only 2 VA facilities had primary care clinics tailored to the needs of homeless veterans. McGuire and colleagues built a system of colocated primary care, mental health, and homeless services for mentally ill veterans in Los Angeles, California.11 Over 18 months, this clinic facilitated greater primary and preventive care delivery, though the population’s physical health status did not improve.11 More recently, O’Toole and colleagues implemented a homeless-focused primary care clinic in Providence, Rhode Island.6 Compared with a historical sample of homeless veterans in traditional VA primary care, veterans in this homeless-tailored clinic had greater improvements in some chronic disease outcomes.6 This clinic also decreased nonacute emergency department (ED) use and hospitalizations for general medical conditions.6
Despite these promising outcomes, the VA lacked a nationwide homeless-focused primary care initiative. In 2012 the VA Office of Homeless Programs and the Office of Primary Care Operations funded a national demonstration project to create Homeless Patient-Aligned Care Teams (HPACTs)—primary care medical clinics for homeless veterans—at 32 facilities. This demonstration project guided HPACTs to tailor clinical and social services to homeless veterans’ needs, establish processes to identify and refer appropriate veterans, and integrate distinct services.
There were no explicit instructions that detailed HPACT structure. Because new VA programs must fit local contextual factors, including infrastructure, space, personnel, and institutional/community resources, different models of homeless-focused primary care have evolved.
This article is a case study of HPACTs at 3 of the 32 participating VA facilities, each reflecting a distinct community and organizational context. In light of projected HPACT expansion and concerns that current services are better tailored to sheltered homeless veterans than to their unsheltered peers, there is particular importance to detailed clinic descriptions that vividly portray the intricate relationships between service design and populations served.1
METHODS
VA HPACTs established in May 2012 at 3 facilities were examined: Birmingham VAMC in Alabama (BIR), West Los Angeles VAMC in California (WLA), and VA Pittsburgh Healthcare System in Pennsylvania (PIT). Prior to this demonstration project, each facility offered a range of housing/social services and traditional primary care for veterans. These sites are a geographically diverse convenience sample that emerged from existing homeless-focused collaborations among the authors and represent geographically diverse HPACTs.
The national director of VA Homeless Programs formally determined that this comparison constitutes a VA operations activity that is not research.12 This activity was exempt from Institutional Review Board review.
Study Design
Timed at an early stage of HPACT implementation, this project had 3 aims: (1) To identify noteworthy similarities and/or differences among the initial HPACT clinic structures; (2) To compare and contrast the patient characteristics of veterans enrolled in each of these clinics; and (3) To use these data to inform ongoing HPACT service design.
HPACT program evaluation data are not presented. Rather, a nascent system of care is illustrated that contributes to the limited literature concerning the design and implementation of homeless-focused primary care. Such organizational profiles inform novel program delivery and hold particular utility for heterogeneous populations who are difficult to engage in care.13,14
Authors at each site independently developed lists of variables that fell within the 3 guiding principles of this demonstration project. These variables were compiled and iteratively reduced to a consolidated table that assessed each clinic, including location, operating hours, methods of patient identification and referral, and linkages to distinct services (eg, primary care, mental health, addiction, and social services).
This table also became a guide for HPACT directors to generate narrative clinic descriptions. Characteristics of VA medical homes that are embraced regardless of patients’ housing status (eg, patient-centered, team-based care) were also incorporated into these descriptions.15
Patient Characteristics
The VA electronic health record (EHR) was used to identify all patients enrolled in HPACTs at BIR, WLA, and PIT from May 1, 2012 (clinic inception), through September 30, 2012. Authors developed a standardized template for EHR review and coined the first HPACT record as the patient’s index visit. This record was used to code initial housing status, demographics, and acute medical conditions diagnosed/treated. If housing status was not recorded at the index visit, the first preceding informative record was used.
Records for 6 months preceding the index visit were used to identify the presence or absence of common medical conditions, psychiatric diagnoses, and ATOD abuse or dependence. Medical conditions were identified from a list of common outpatient diagnoses from the National Ambulatory Medical Care Survey, supplemented by common conditions among homeless men.16-18 The EHR problem list (a list of diagnoses, by patient) was used to obtain diagnoses, supplemented by notes from inpatient admissions/discharges, as well as ED, primary care, and subspecialty consultations within 6 months preceding the index visit. Prior VA health care use was ascertained from the EHR review of the same 6-month window, reflecting ED visits, inpatient admissions, primary care visits, subspecialty visits, and individual/group therapy for ATOD or other mental health problems. Data were used to generate site-specific descriptive statistics.
RESULTS
Like all VA hospital-based clinics, a universal EHR captured all medical and social service notes, orders, medications, and administrative records. All facilities had on-site EDs, medical/mental health specialty care, and pharmacies. Social services, including benefits counseling and housing services, were available on site. Table 1 summarizes the HPACT structures at BIR, WLA, and PIT.
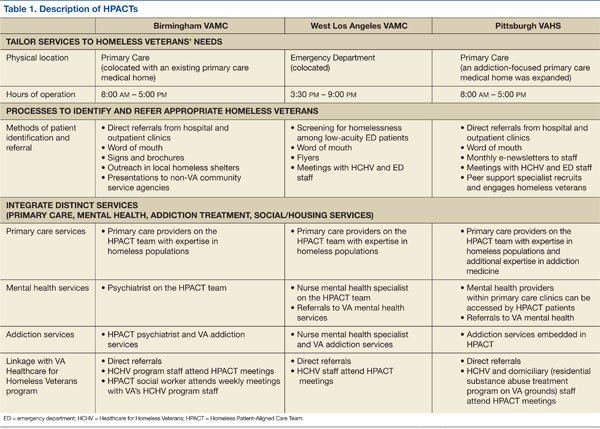
Birmingham
The BIR HPACT was devised as a new homeless-focused team located within a VA primary care clinic where other providers continued to see primary care patients. Staff and space were reallocated for this HPACT, which recruited patients in 4 ways: (1) the facility’s primary homeless program, Healthcare for Homeless Veterans, referred patients who previously sought VA housing but who required primary care; (2) an outreach specialist sought homeless veterans in shelters and on the streets; (3) HPACT staff marketed the clinic with presentations and flyers to other VA services and non-VA community agencies; and (4) a referral mechanism within the EHR.
A nurse practitioner was the PCP at this site, supervised by an academic internist experienced in the care of underserved populations, and the HPACT director, a physician certified in internal and addiction medicine. Patients at the BIR HPACT also received care from a social worker, registered nurse, licensed practical nurse, and psychiatrist who received all or a portion of their salaries from this demonstration project. This clinic accommodated walk-in appointments during business hours. Clinicians discussed clinical cases daily, and the full clinical and administrative team met weekly. To promote service integration, HPACT staff attended meetings of the BIR general primary care and Healthcare for Homeless Veterans programs, and vice versa.
West Los Angeles
At WLA, a previously established Homeless Screening Clinic that offered integrated social and medical services for homeless veterans with mental illness was already available during business hours and located within the site’s mental health program.11 However, because ED use for homeless veterans peaked after hours, the new WLA HPACT was established within the WLA ED.
During WLA HPACT hours (3 weekday evenings/week), routine nursing triage occurred for all patients who presented to the ED. However, distinct from other times of day, veterans who were triaged with low-acuity and who were appropriate for outpatient care were given a self-administered, 4-item questionnaire to identify patients who were homeless or at risk for becoming homeless. Veterans who were identified with this screening tool were offered the choice of an ED or HPACT visit. Veterans who chose the latter were assigned to the queue for an HPACT primary care visit instead of the ED.
A physician led the clinical team, with additional services from a mental health clinical nurse specialist and clerks who worked with homeless and/or mental health patients during business hours and provided part-time HPACT coverage. When needed, additional services were provided from colocated ED nurses and social workers. Providers were chosen for their aptitude in culturally responsive communication.
Patients who chose to be seen in HPACT received a primary care visit that also addressed the reason for ED presentation. HPACT staff worked collaboratively, with interdisciplinary team huddles that preceded each clinic session and ended each patient visit. Referrals and social service needs were tracked and monitored by the PCP. Specialty care referrals were also tracked and facilitated when possible with direct communication between HPACT providers and specialty services. Meetings with daytime Homeless Screening Clinic and ED staff facilitated cross-departmental collaborations that helped veterans prepare for and retain housing.
Pittsburgh
The HPACT at PIT evolved from an existing PACT that provided primary care-based addiction services.2 That team included an internist credentialed in addiction medicine and experienced in homeless health care, nurse practitioner, nurse care manager, nursing assistant, and clerks. At this site, HPACT providers had subspecialty expertise in the assessment and treatment of ATOD use, certification to prescribe buprenorphine for outpatient opioid detoxification and/or maintenance, and experience engaging homeless and other vulnerable veterans. The existing colocated clinic included 2 additional addiction medicine clinicians and a physician assistant experienced in ATOD use. The PIT HPACT was not restricted to patients with ATOD use.
At PIT, HPACT care was provided during business hours in a flexible model that allowed for walk-in visits. Providers from the existing addiction-focused PACT identified and referred homeless veterans, as well as patients deemed at-risk for becoming homeless. In addition, other homeless veterans who did not have a PCP could be referred through e-consults placed by any VA staff member. If a referred homeless veteran was already enrolled on a PCP’s panel, HPACT facilitated reengagement with the existing provider. Near the end of this data collection period, a peer support specialist also began community outreach to engage both enrolled and potential HPACT patients.
Patient Characteristics
Table 2 presents the demographic and housing characteristics of enrolled HPACT patients at BIR, WLA, and PIT from May 1, 2012, to September 30, 2012. Each site had a similar number of patients (n = 35/47/43 at BIR/WLA/PIT, respectively). Across sites, most patients were male and African American or white. The majority of patients at each site were housed in VA transitional housing/residential rehabilitation programs (33%/32%/40% at BIR/WLA/PIT, respectively). Fewer patients were unsheltered (on the streets or other places not meant for sleeping), though WLA had the most unsheltered patients (26%) compared with BIR (6%) and PIT (2%). BIR had more patients from emergency shelters (14%) than did the other 2 sites (4% at WLA and 0% at PIT). PIT had the most domiciled patients in houses/apartments (26%, compared with 6% each at BIR and WLA), but who were at risk for homelessness.
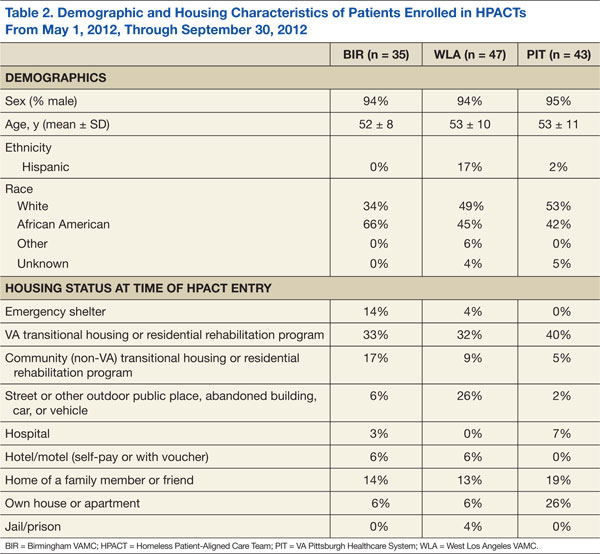
Table 3 summarizes the diagnoses and VA health care use patterns of these cohorts. In the first week of HPACT care, WLA addressed the most acute medical conditions (81% of patients had≥ 1 common condition), followed by BIR (54%) and PIT (23%). Among chronic conditions, chronic pain was diagnosed in 51% of patients at BIR, 30% of patients at WLA, and 12% of patients at PIT. Hepatitis C diagnoses were most common at WLA (36%), similar at PIT (33%), and lower at BIR (17%). Overall, chronic medical diagnoses were most common among patients at BIR (91%), followed by WLA (85%), and PIT (60%).
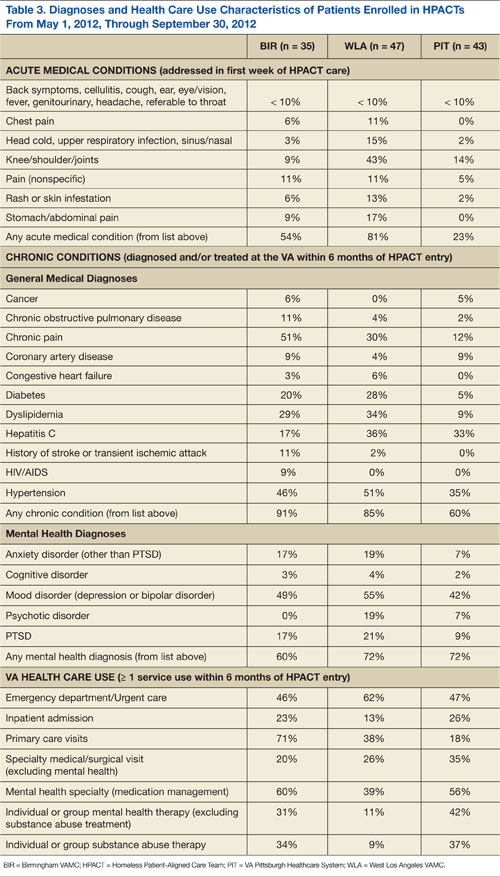
Among mental health diagnoses, mood disorders were the most prevalent across sites (49%/55%/42% at BIR/WLA/PIT, respectively), followed by posttraumatic stress disorder (17%/21%/9% at BIR/WLA/PIT, respectively). WLA had more patients with psychosis (19%) than did the other 2 sites (7% at PIT and 0% at BIR). Overall, mental illness was common among HPACT patients across sites (60%/72%/72% at BIR/WLA/PIT, respectively).
Health care use in the 6 months before HPACT enrollment differed between sites. BIR and PIT had similar rates of ED/urgent care use (46% and 47% sought care over the prior 6 months, respectively), but WLA had the highest rate (62%). However, inpatient admission rates were lowest at WLA (13%) and again similar at BIR (23%) and PIT (26%). BIR patients had the most VA primary care exposure before HPACT entry (71% obtained primary care in the past 6 months), followed by WLA (38%) and PIT (18%). Mental health specialty care was also highest at BIR (60%), followed by PIT (56%), then WLA (39%)
Table 4 presents the prevalence of ATOD abuse or dependence among HPACT patients in the6 months before clinic enrollment. The most commonly misused substances were alcohol (60%/35%/44% at BIR/WLA/PIT, respectively), tobacco (71%/47%/40% at BIR/WLA/PIT, respectively), and cocaine (37%/19%/23% at BIR/WLA/PIT, respectively). PIT had the highest percentages of patients with opioid misuse (21%), followed by BIR (9%) and WLA (6%). Overall, these disorders were prevalent across sites, highest at BIR (94%) and similar at WLA (72%) and PIT (67%).
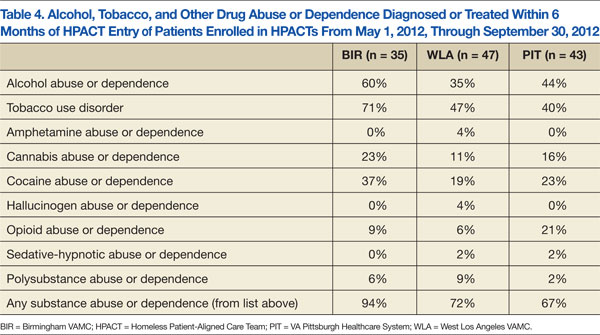
DISCUSSION
In this case report of early HPACT implementation, strikingly different models of homeless-focused primary care at the geographically distinct facilities were found. The lack of a gold standard primary care medical home for homeless persons—compounded by contrasting local contextual features—led to distinct clinic designs. BIR capitalized on primary care needs among veterans who previously sought housing and relied on the available space within an operating primary care clinic. As WLA already offered primary care for homeless veterans that was colocated with mental health services, the HPACT at this site was devised as an after-hours clinic colocated with the ED.11 At PIT, an existing primary care team with addiction expertise expanded its role to include a focus on homelessness, without needing new space or staff.
The initial HPACT patient cohorts likely reflected these contrasting clinic structures. That is, at WLA, the higher rates of unsheltered patients, prevalence of acute medical conditions and psychotic disorders, and greater ED use was likely driven by ED colocation. The physical location of this site’s HPACT may also speak to greater future decreases in ED use. At BIR, the use of a dedicated HPACT community outreach worker likely led to greater recruitment from emergency shelters. However, the clinic mainly recruited veterans who had previously engaged in VA mainstream primary care services and individuals with ATOD use. At PIT, higher rates of psychotherapy were likely facilitated by the HPACT’s placement within an addiction treatment setting, which may favor psychosocial rehabilitation. The distinctly higher rate of patients with opioid misuse at PIT likely paralleled the ATOD expertise of its providers and/or buprenorphine availability.
The more challenging questions surround the implementation of the current clinic models to address the needs of these patient cohorts and possible avenues to improve each clinic. High rates of chronic medical illness, mental illness, and ATOD use are well known in the homeless veteran and general populations.2,9 Within these 3 HPACTs, the high rates of medical/mental illness and ATOD use speak favorably about the clinics’ respective recruitment strategies; ie, normative homeless populations with high rates of illness are enrolling in these clinics. However, current service integration practices may be enhanced with the specific knowledge gained from this examination. For example, the very high rates of mood and anxiety disorders at each site suggest a role for an embedded mental health provider with prescribing privileges (the model adopted by BIR) as opposed to mental health referrals used at WLA and PIT. There may also be a role for cognitive behavioral therapy services within these clinics. Similarly, the high rates of ATOD (especially alcohol, tobacco, and cocaine) misuse suggest a role for addiction medicine training among the PCPs (the PIT model) as well as psychosocial rehabilitation for ATOD use within the HPACTs. High rates of chronic medical conditions, such as diabetes, hepatitis C, and hypertension elucidate possible roles for specialty care integration and/or chronic disease management programs tailored to the homeless.
Comparing the housing status of these cohorts can help in the design of future homeless-tailored primary care operations and improve these HPACTs. Most patients across sites lived in VA transitional housing/residential rehabilitation programs. As such, current referral practices at these 3 HPACTs proved sufficient in recruiting this subpopulation of homeless veterans. However, in light of national data showing that the count of unsheltered homeless veterans has not declined as rapidly as the count of homeless veterans overall, the higher numbers of veterans recruited from interim sheltering arrangements suggest a need for enhanced outreach to unsheltered individuals.1 WLA data suggest that linkages to EDs can advance this objective. BIR data show that targeted outreach in shelters can engage this high-risk, transiently sheltered subpopulation in primary care. At the time of this project, PIT just began using a peer support specialist for outreach to unsheltered veterans. It will be important to evaluate the outcomes of this new referral strategy.
Limitations
These exploratory findings—though from a small convenience sample within a nascent, growing program—generated critical and detailed information to guide ongoing policies and service design. However, these findings have limitations. First, though this research contributes to limited existing literature about the operational design of homeless-focused primary care, no outcome data were included. Although a comprehensive evaluation of all HPACT sites is a distinct and useful endeavor, this project instead offers a rapid, detailed illustration of 3 early-stage clinics. Though smaller in scope, this effort informs other facilities developing homeless-focused primary care initiatives and the larger demonstration project.
Second, a convenience sample of 3 urban facilities with strong academic ties and community commitment to providing services for homeless persons was presented. It may be difficult to translate these findings to communities with fewer resources.
Third, EHR review was used to determine patient demographics, diagnoses, and patterns of health care use. Though EHR review offers detailed information that is unavailable from administrative data, EHR is subject to variations in documentation patterns.
Last, differing characteristics of the homeless veteran population in each city may interact with contrasting HPACT structures to influence the characteristics of patients served. For example, though the data suggest that linkages with the ED may facilitate greater recruitment of unsheltered veterans in WLA, Los Angeles is known to have particularly high rates of unsheltered individuals.1
CONCLUSIONS
Clinicians, administrators, and researchers in the safety net may benefit from the experience implementing new clinics to recruit and engage homeless veterans in primary care. In a relatively nascent field with few accepted models of care, this paper offers detailed descriptions of newly developed homeless-focused primary care clinics at 3 VA facilities, which can inform other sites undertaking similar initiatives. This study highlights the wide range of approaches to building such clinics, with important variations in structural characteristics such as clinic location and operating hours, as well as within the intricacies of service integration patterns.
Within primary care clinics for homeless adults, this study suggests a role for embedded mental health (medication management and psychotherapy) and substance abuse services, chronic disease management programs tailored to this vulnerable population, and the role of linkages to the ED or community-based outreach to recruit unsheltered homeless patients. To pave a path toward identifying an evidence-based model of homeless-focused primary care, future studies are needed to study nationwide HPACT outcomes, including health status, patient satisfaction, quality of life, housing, and cost-effectiveness.
Acknowledgements
This work was undertaken in part by the VA’s PACT Demonstration Laboratory initiative, supporting and evaluating VA’s transition to a patient-centered medical home. Funding for the PACT Demonstration Laboratory initiative was provided by the VA Office of Patient Care Services. This project received support from the VISN 22 VA Assessment and Improvement Lab for Patient Centered Care (VAIL-PCC) (XVA 65-018; PI: Rubenstein).
Dr. Gabrielian was supported in part by the VA Office of Academic Affiliations, Advanced Fellowship Program in Mental Illness Research and Treatment. Drs. Gelberg and Andersen were supported in part by NIDA DA 022445. Dr. Andersen received additional support from the UCLA/DREW Project EXPORT, National Center on Minority Health and Health Disparities, P20MD000148/P20MD000182. Dr. Broyles was supported by a Career Development Award (CDA 10–014) from the VA Health Services Research & Development service. Dr. Kertesz was supported through funding of VISN 7.
Author disclosures
The authors report no actual or potential conflicts of interest with regard to this article.
Disclaimer
The opinions expressed herein are those of the authors and do not necessarily reflect those of Federal Practitioner, Frontline Medical Communications Inc., the U.S. Government, or any of its agencies. This article may discuss unlabeled or investigational use of certain drugs. Please review complete prescribing information for specific drugs or drug combinations—including indications, contraindications, warnings, and adverse effects—before administering pharmacologic therapy to patients.
1. Cortes A, Henry M, de la Cruz RJ, Brown S. The 2012 Point-in-Time Estimates of Homelessness: Volume I of the 2012 Annual Homeless Assessment Report. Washington, DC: The U.S. Department of Housing and Urban Development, Office of Community Planning and Development; 2012.
2. Balshem H, Christensen V, Tuepker A, Kansagara D. A Critical Review of the Literature Regarding Homelessness Among Veterans. U.S. Department of Veterans Affairs, Veterans Health Administration, Health Services Research & Development Service; 2011. VA-ESP Project #05-225.
3. O’Toole TP, Pirraglia PA, Dosa D, et al; Primary Care-Special Populations Treatment Team. Building care systems to improve access for high-risk and vulnerable veteran populations. J Gen Intern Med. 2011;26(suppl 2):683-688.
4. Opening Doors: Federal Strategic Plan to Prevent and End Homelessness. Washington, DC: The United States Interagency Council on Homelessness; 2010.
5. Nakashima J, McGuire J, Berman S, Daniels W. Developing programs for homeless veterans: Understanding driving forces in implementation. Soc Work Health Care. 2004;40(2):1-12.
6. O’Toole TP, Buckel L, Bourgault C, et al. Applying the chronic care model to homeless veterans: Effect of a population approach to primary care on utilization and clinical outcomes. Am J Public Health. 2010;100(12):2493-2499.
7. Desai MM, Rosenheck RA, Kasprow WJ. Determinants of receipt of ambulatory medical care in a national sample of mentally ill homeless veterans. Med Care. 2003;41(2):275-287.
8. Irene Wong YL, Stanhope V. Conceptualizing community: A comparison of neighborhood characteristics of supportive housing for persons with psychiatric and developmental disabilities. Soc Sci Med. 2009;68(8):1376-1387.
9. Gelberg L, Gallagher TC, Andersen RM, Koegel P. Competing priorities as a barrier to medical care among homeless adults in Los Angeles. Am J Public Health. 1997;87(2):217-220.
10. Hamilton AB, Poza I, Washington DL. “Homelessness and trauma go hand-in-hand”: Pathways to homelessness among women veterans. Womens Health Issues. 2011;21(suppl 4):S203-S209.
11. McGuire J, Gelberg L, Blue-Howells J, Rosenheck RA. Access to primary care for homeless veterans with serious mental illness or substance abuse: A follow-up evaluation of co-located primary care and homeless social services. Adm Policy Ment Health. 2009;36(4):255-264.
12. VHA Operations Activities That May Constitute Research. Washington, DC: U.S. Department of Veterans Affairs, Veterans Health Administration; 2011. VHA Handbook 1058.05.
13. Resnick SG, Armstrong M, Sperrazza M, Harkness L, Rosenheck RA. A model of consumer-provider partnership: Vet-to-Vet. Psychiatr Rehabil J. 2004;28(2):185-187.
14. Hogan TP, Wakefield B, Nazi KM, Houston TK, Weaver FM. Promoting access through complementary eHealth technologies: Recommendations for VA’s Home Telehealth and personal health record programs. J Gen Intern Med. 2011;26(suppl 2):628-635.
15. Rosland AM, Nelson K, Sun H, et al. The patient-centered medical home in the Veterans Health Administration. Am J Manag Care. 2013;19(7):e263-e272.
16. Hsiao CJ, Cherry DK, Beatty PC, Rechtsteiner EA. National Ambulatory Medical Care Survey: 2007 summary. Natl Health Stat Report. 2010;3(27):1-32.
17. Hwang SW, Orav EJ, O’Connell JJ, Lebow JM, Brennan TA. Causes of death in homeless adults in Boston. Ann Intern Med. 1997;126(8):625-628.
18. Hwang SW, Tolomiczenko G, Kouyoumdjian FG, Garner RE. Interventions to improve the health of the homeless: A systematic review. Am J Prev Med. 2005;29(4):311-319.
On a single night in 2012, 62,619 veterans experienced homelessness.1 With high rates of illness, as well as alcohol, tobacco, and other drug (ATOD) use among homeless adults, ending veteran homelessness is a signature initiative of the VA.2-4 However, despite increasing efforts to improve health care for homeless individuals, little is known about best practices in homeless-focused primary care.2,5
With an age-adjusted mortality that is 2 to 10 times higher than that of their housed counterparts, homeless veterans pose a formidable challenge for primary care providers (PCPs).6,7 The complexity of homeless persons’ primary care needs is compounded by poor social support and the need to navigate priorities (eg, shelter) that compete with medical care.6,8,9 Moreover, veterans may face unique vulnerabilities conferred by military-specific experiences.2,10
As of 2012, only 2 VA facilities had primary care clinics tailored to the needs of homeless veterans. McGuire and colleagues built a system of colocated primary care, mental health, and homeless services for mentally ill veterans in Los Angeles, California.11 Over 18 months, this clinic facilitated greater primary and preventive care delivery, though the population’s physical health status did not improve.11 More recently, O’Toole and colleagues implemented a homeless-focused primary care clinic in Providence, Rhode Island.6 Compared with a historical sample of homeless veterans in traditional VA primary care, veterans in this homeless-tailored clinic had greater improvements in some chronic disease outcomes.6 This clinic also decreased nonacute emergency department (ED) use and hospitalizations for general medical conditions.6
Despite these promising outcomes, the VA lacked a nationwide homeless-focused primary care initiative. In 2012 the VA Office of Homeless Programs and the Office of Primary Care Operations funded a national demonstration project to create Homeless Patient-Aligned Care Teams (HPACTs)—primary care medical clinics for homeless veterans—at 32 facilities. This demonstration project guided HPACTs to tailor clinical and social services to homeless veterans’ needs, establish processes to identify and refer appropriate veterans, and integrate distinct services.
There were no explicit instructions that detailed HPACT structure. Because new VA programs must fit local contextual factors, including infrastructure, space, personnel, and institutional/community resources, different models of homeless-focused primary care have evolved.
This article is a case study of HPACTs at 3 of the 32 participating VA facilities, each reflecting a distinct community and organizational context. In light of projected HPACT expansion and concerns that current services are better tailored to sheltered homeless veterans than to their unsheltered peers, there is particular importance to detailed clinic descriptions that vividly portray the intricate relationships between service design and populations served.1
METHODS
VA HPACTs established in May 2012 at 3 facilities were examined: Birmingham VAMC in Alabama (BIR), West Los Angeles VAMC in California (WLA), and VA Pittsburgh Healthcare System in Pennsylvania (PIT). Prior to this demonstration project, each facility offered a range of housing/social services and traditional primary care for veterans. These sites are a geographically diverse convenience sample that emerged from existing homeless-focused collaborations among the authors and represent geographically diverse HPACTs.
The national director of VA Homeless Programs formally determined that this comparison constitutes a VA operations activity that is not research.12 This activity was exempt from Institutional Review Board review.
Study Design
Timed at an early stage of HPACT implementation, this project had 3 aims: (1) To identify noteworthy similarities and/or differences among the initial HPACT clinic structures; (2) To compare and contrast the patient characteristics of veterans enrolled in each of these clinics; and (3) To use these data to inform ongoing HPACT service design.
HPACT program evaluation data are not presented. Rather, a nascent system of care is illustrated that contributes to the limited literature concerning the design and implementation of homeless-focused primary care. Such organizational profiles inform novel program delivery and hold particular utility for heterogeneous populations who are difficult to engage in care.13,14
Authors at each site independently developed lists of variables that fell within the 3 guiding principles of this demonstration project. These variables were compiled and iteratively reduced to a consolidated table that assessed each clinic, including location, operating hours, methods of patient identification and referral, and linkages to distinct services (eg, primary care, mental health, addiction, and social services).
This table also became a guide for HPACT directors to generate narrative clinic descriptions. Characteristics of VA medical homes that are embraced regardless of patients’ housing status (eg, patient-centered, team-based care) were also incorporated into these descriptions.15
Patient Characteristics
The VA electronic health record (EHR) was used to identify all patients enrolled in HPACTs at BIR, WLA, and PIT from May 1, 2012 (clinic inception), through September 30, 2012. Authors developed a standardized template for EHR review and coined the first HPACT record as the patient’s index visit. This record was used to code initial housing status, demographics, and acute medical conditions diagnosed/treated. If housing status was not recorded at the index visit, the first preceding informative record was used.
Records for 6 months preceding the index visit were used to identify the presence or absence of common medical conditions, psychiatric diagnoses, and ATOD abuse or dependence. Medical conditions were identified from a list of common outpatient diagnoses from the National Ambulatory Medical Care Survey, supplemented by common conditions among homeless men.16-18 The EHR problem list (a list of diagnoses, by patient) was used to obtain diagnoses, supplemented by notes from inpatient admissions/discharges, as well as ED, primary care, and subspecialty consultations within 6 months preceding the index visit. Prior VA health care use was ascertained from the EHR review of the same 6-month window, reflecting ED visits, inpatient admissions, primary care visits, subspecialty visits, and individual/group therapy for ATOD or other mental health problems. Data were used to generate site-specific descriptive statistics.
RESULTS
Like all VA hospital-based clinics, a universal EHR captured all medical and social service notes, orders, medications, and administrative records. All facilities had on-site EDs, medical/mental health specialty care, and pharmacies. Social services, including benefits counseling and housing services, were available on site. Table 1 summarizes the HPACT structures at BIR, WLA, and PIT.
Birmingham
The BIR HPACT was devised as a new homeless-focused team located within a VA primary care clinic where other providers continued to see primary care patients. Staff and space were reallocated for this HPACT, which recruited patients in 4 ways: (1) the facility’s primary homeless program, Healthcare for Homeless Veterans, referred patients who previously sought VA housing but who required primary care; (2) an outreach specialist sought homeless veterans in shelters and on the streets; (3) HPACT staff marketed the clinic with presentations and flyers to other VA services and non-VA community agencies; and (4) a referral mechanism within the EHR.
A nurse practitioner was the PCP at this site, supervised by an academic internist experienced in the care of underserved populations, and the HPACT director, a physician certified in internal and addiction medicine. Patients at the BIR HPACT also received care from a social worker, registered nurse, licensed practical nurse, and psychiatrist who received all or a portion of their salaries from this demonstration project. This clinic accommodated walk-in appointments during business hours. Clinicians discussed clinical cases daily, and the full clinical and administrative team met weekly. To promote service integration, HPACT staff attended meetings of the BIR general primary care and Healthcare for Homeless Veterans programs, and vice versa.
West Los Angeles
At WLA, a previously established Homeless Screening Clinic that offered integrated social and medical services for homeless veterans with mental illness was already available during business hours and located within the site’s mental health program.11 However, because ED use for homeless veterans peaked after hours, the new WLA HPACT was established within the WLA ED.
During WLA HPACT hours (3 weekday evenings/week), routine nursing triage occurred for all patients who presented to the ED. However, distinct from other times of day, veterans who were triaged with low-acuity and who were appropriate for outpatient care were given a self-administered, 4-item questionnaire to identify patients who were homeless or at risk for becoming homeless. Veterans who were identified with this screening tool were offered the choice of an ED or HPACT visit. Veterans who chose the latter were assigned to the queue for an HPACT primary care visit instead of the ED.
A physician led the clinical team, with additional services from a mental health clinical nurse specialist and clerks who worked with homeless and/or mental health patients during business hours and provided part-time HPACT coverage. When needed, additional services were provided from colocated ED nurses and social workers. Providers were chosen for their aptitude in culturally responsive communication.
Patients who chose to be seen in HPACT received a primary care visit that also addressed the reason for ED presentation. HPACT staff worked collaboratively, with interdisciplinary team huddles that preceded each clinic session and ended each patient visit. Referrals and social service needs were tracked and monitored by the PCP. Specialty care referrals were also tracked and facilitated when possible with direct communication between HPACT providers and specialty services. Meetings with daytime Homeless Screening Clinic and ED staff facilitated cross-departmental collaborations that helped veterans prepare for and retain housing.
Pittsburgh
The HPACT at PIT evolved from an existing PACT that provided primary care-based addiction services.2 That team included an internist credentialed in addiction medicine and experienced in homeless health care, nurse practitioner, nurse care manager, nursing assistant, and clerks. At this site, HPACT providers had subspecialty expertise in the assessment and treatment of ATOD use, certification to prescribe buprenorphine for outpatient opioid detoxification and/or maintenance, and experience engaging homeless and other vulnerable veterans. The existing colocated clinic included 2 additional addiction medicine clinicians and a physician assistant experienced in ATOD use. The PIT HPACT was not restricted to patients with ATOD use.
At PIT, HPACT care was provided during business hours in a flexible model that allowed for walk-in visits. Providers from the existing addiction-focused PACT identified and referred homeless veterans, as well as patients deemed at-risk for becoming homeless. In addition, other homeless veterans who did not have a PCP could be referred through e-consults placed by any VA staff member. If a referred homeless veteran was already enrolled on a PCP’s panel, HPACT facilitated reengagement with the existing provider. Near the end of this data collection period, a peer support specialist also began community outreach to engage both enrolled and potential HPACT patients.
Patient Characteristics
Table 2 presents the demographic and housing characteristics of enrolled HPACT patients at BIR, WLA, and PIT from May 1, 2012, to September 30, 2012. Each site had a similar number of patients (n = 35/47/43 at BIR/WLA/PIT, respectively). Across sites, most patients were male and African American or white. The majority of patients at each site were housed in VA transitional housing/residential rehabilitation programs (33%/32%/40% at BIR/WLA/PIT, respectively). Fewer patients were unsheltered (on the streets or other places not meant for sleeping), though WLA had the most unsheltered patients (26%) compared with BIR (6%) and PIT (2%). BIR had more patients from emergency shelters (14%) than did the other 2 sites (4% at WLA and 0% at PIT). PIT had the most domiciled patients in houses/apartments (26%, compared with 6% each at BIR and WLA), but who were at risk for homelessness.
Table 3 summarizes the diagnoses and VA health care use patterns of these cohorts. In the first week of HPACT care, WLA addressed the most acute medical conditions (81% of patients had≥ 1 common condition), followed by BIR (54%) and PIT (23%). Among chronic conditions, chronic pain was diagnosed in 51% of patients at BIR, 30% of patients at WLA, and 12% of patients at PIT. Hepatitis C diagnoses were most common at WLA (36%), similar at PIT (33%), and lower at BIR (17%). Overall, chronic medical diagnoses were most common among patients at BIR (91%), followed by WLA (85%), and PIT (60%).
Among mental health diagnoses, mood disorders were the most prevalent across sites (49%/55%/42% at BIR/WLA/PIT, respectively), followed by posttraumatic stress disorder (17%/21%/9% at BIR/WLA/PIT, respectively). WLA had more patients with psychosis (19%) than did the other 2 sites (7% at PIT and 0% at BIR). Overall, mental illness was common among HPACT patients across sites (60%/72%/72% at BIR/WLA/PIT, respectively).
Health care use in the 6 months before HPACT enrollment differed between sites. BIR and PIT had similar rates of ED/urgent care use (46% and 47% sought care over the prior 6 months, respectively), but WLA had the highest rate (62%). However, inpatient admission rates were lowest at WLA (13%) and again similar at BIR (23%) and PIT (26%). BIR patients had the most VA primary care exposure before HPACT entry (71% obtained primary care in the past 6 months), followed by WLA (38%) and PIT (18%). Mental health specialty care was also highest at BIR (60%), followed by PIT (56%), then WLA (39%)
Table 4 presents the prevalence of ATOD abuse or dependence among HPACT patients in the6 months before clinic enrollment. The most commonly misused substances were alcohol (60%/35%/44% at BIR/WLA/PIT, respectively), tobacco (71%/47%/40% at BIR/WLA/PIT, respectively), and cocaine (37%/19%/23% at BIR/WLA/PIT, respectively). PIT had the highest percentages of patients with opioid misuse (21%), followed by BIR (9%) and WLA (6%). Overall, these disorders were prevalent across sites, highest at BIR (94%) and similar at WLA (72%) and PIT (67%).
DISCUSSION
In this case report of early HPACT implementation, strikingly different models of homeless-focused primary care at the geographically distinct facilities were found. The lack of a gold standard primary care medical home for homeless persons—compounded by contrasting local contextual features—led to distinct clinic designs. BIR capitalized on primary care needs among veterans who previously sought housing and relied on the available space within an operating primary care clinic. As WLA already offered primary care for homeless veterans that was colocated with mental health services, the HPACT at this site was devised as an after-hours clinic colocated with the ED.11 At PIT, an existing primary care team with addiction expertise expanded its role to include a focus on homelessness, without needing new space or staff.
The initial HPACT patient cohorts likely reflected these contrasting clinic structures. That is, at WLA, the higher rates of unsheltered patients, prevalence of acute medical conditions and psychotic disorders, and greater ED use was likely driven by ED colocation. The physical location of this site’s HPACT may also speak to greater future decreases in ED use. At BIR, the use of a dedicated HPACT community outreach worker likely led to greater recruitment from emergency shelters. However, the clinic mainly recruited veterans who had previously engaged in VA mainstream primary care services and individuals with ATOD use. At PIT, higher rates of psychotherapy were likely facilitated by the HPACT’s placement within an addiction treatment setting, which may favor psychosocial rehabilitation. The distinctly higher rate of patients with opioid misuse at PIT likely paralleled the ATOD expertise of its providers and/or buprenorphine availability.
The more challenging questions surround the implementation of the current clinic models to address the needs of these patient cohorts and possible avenues to improve each clinic. High rates of chronic medical illness, mental illness, and ATOD use are well known in the homeless veteran and general populations.2,9 Within these 3 HPACTs, the high rates of medical/mental illness and ATOD use speak favorably about the clinics’ respective recruitment strategies; ie, normative homeless populations with high rates of illness are enrolling in these clinics. However, current service integration practices may be enhanced with the specific knowledge gained from this examination. For example, the very high rates of mood and anxiety disorders at each site suggest a role for an embedded mental health provider with prescribing privileges (the model adopted by BIR) as opposed to mental health referrals used at WLA and PIT. There may also be a role for cognitive behavioral therapy services within these clinics. Similarly, the high rates of ATOD (especially alcohol, tobacco, and cocaine) misuse suggest a role for addiction medicine training among the PCPs (the PIT model) as well as psychosocial rehabilitation for ATOD use within the HPACTs. High rates of chronic medical conditions, such as diabetes, hepatitis C, and hypertension elucidate possible roles for specialty care integration and/or chronic disease management programs tailored to the homeless.
Comparing the housing status of these cohorts can help in the design of future homeless-tailored primary care operations and improve these HPACTs. Most patients across sites lived in VA transitional housing/residential rehabilitation programs. As such, current referral practices at these 3 HPACTs proved sufficient in recruiting this subpopulation of homeless veterans. However, in light of national data showing that the count of unsheltered homeless veterans has not declined as rapidly as the count of homeless veterans overall, the higher numbers of veterans recruited from interim sheltering arrangements suggest a need for enhanced outreach to unsheltered individuals.1 WLA data suggest that linkages to EDs can advance this objective. BIR data show that targeted outreach in shelters can engage this high-risk, transiently sheltered subpopulation in primary care. At the time of this project, PIT just began using a peer support specialist for outreach to unsheltered veterans. It will be important to evaluate the outcomes of this new referral strategy.
Limitations
These exploratory findings—though from a small convenience sample within a nascent, growing program—generated critical and detailed information to guide ongoing policies and service design. However, these findings have limitations. First, though this research contributes to limited existing literature about the operational design of homeless-focused primary care, no outcome data were included. Although a comprehensive evaluation of all HPACT sites is a distinct and useful endeavor, this project instead offers a rapid, detailed illustration of 3 early-stage clinics. Though smaller in scope, this effort informs other facilities developing homeless-focused primary care initiatives and the larger demonstration project.
Second, a convenience sample of 3 urban facilities with strong academic ties and community commitment to providing services for homeless persons was presented. It may be difficult to translate these findings to communities with fewer resources.
Third, EHR review was used to determine patient demographics, diagnoses, and patterns of health care use. Though EHR review offers detailed information that is unavailable from administrative data, EHR is subject to variations in documentation patterns.
Last, differing characteristics of the homeless veteran population in each city may interact with contrasting HPACT structures to influence the characteristics of patients served. For example, though the data suggest that linkages with the ED may facilitate greater recruitment of unsheltered veterans in WLA, Los Angeles is known to have particularly high rates of unsheltered individuals.1
CONCLUSIONS
Clinicians, administrators, and researchers in the safety net may benefit from the experience implementing new clinics to recruit and engage homeless veterans in primary care. In a relatively nascent field with few accepted models of care, this paper offers detailed descriptions of newly developed homeless-focused primary care clinics at 3 VA facilities, which can inform other sites undertaking similar initiatives. This study highlights the wide range of approaches to building such clinics, with important variations in structural characteristics such as clinic location and operating hours, as well as within the intricacies of service integration patterns.
Within primary care clinics for homeless adults, this study suggests a role for embedded mental health (medication management and psychotherapy) and substance abuse services, chronic disease management programs tailored to this vulnerable population, and the role of linkages to the ED or community-based outreach to recruit unsheltered homeless patients. To pave a path toward identifying an evidence-based model of homeless-focused primary care, future studies are needed to study nationwide HPACT outcomes, including health status, patient satisfaction, quality of life, housing, and cost-effectiveness.
Acknowledgements
This work was undertaken in part by the VA’s PACT Demonstration Laboratory initiative, supporting and evaluating VA’s transition to a patient-centered medical home. Funding for the PACT Demonstration Laboratory initiative was provided by the VA Office of Patient Care Services. This project received support from the VISN 22 VA Assessment and Improvement Lab for Patient Centered Care (VAIL-PCC) (XVA 65-018; PI: Rubenstein).
Dr. Gabrielian was supported in part by the VA Office of Academic Affiliations, Advanced Fellowship Program in Mental Illness Research and Treatment. Drs. Gelberg and Andersen were supported in part by NIDA DA 022445. Dr. Andersen received additional support from the UCLA/DREW Project EXPORT, National Center on Minority Health and Health Disparities, P20MD000148/P20MD000182. Dr. Broyles was supported by a Career Development Award (CDA 10–014) from the VA Health Services Research & Development service. Dr. Kertesz was supported through funding of VISN 7.
Author disclosures
The authors report no actual or potential conflicts of interest with regard to this article.
Disclaimer
The opinions expressed herein are those of the authors and do not necessarily reflect those of Federal Practitioner, Frontline Medical Communications Inc., the U.S. Government, or any of its agencies. This article may discuss unlabeled or investigational use of certain drugs. Please review complete prescribing information for specific drugs or drug combinations—including indications, contraindications, warnings, and adverse effects—before administering pharmacologic therapy to patients.
1. Cortes A, Henry M, de la Cruz RJ, Brown S. The 2012 Point-in-Time Estimates of Homelessness: Volume I of the 2012 Annual Homeless Assessment Report. Washington, DC: The U.S. Department of Housing and Urban Development, Office of Community Planning and Development; 2012.
2. Balshem H, Christensen V, Tuepker A, Kansagara D. A Critical Review of the Literature Regarding Homelessness Among Veterans. U.S. Department of Veterans Affairs, Veterans Health Administration, Health Services Research & Development Service; 2011. VA-ESP Project #05-225.
3. O’Toole TP, Pirraglia PA, Dosa D, et al; Primary Care-Special Populations Treatment Team. Building care systems to improve access for high-risk and vulnerable veteran populations. J Gen Intern Med. 2011;26(suppl 2):683-688.
4. Opening Doors: Federal Strategic Plan to Prevent and End Homelessness. Washington, DC: The United States Interagency Council on Homelessness; 2010.
5. Nakashima J, McGuire J, Berman S, Daniels W. Developing programs for homeless veterans: Understanding driving forces in implementation. Soc Work Health Care. 2004;40(2):1-12.
6. O’Toole TP, Buckel L, Bourgault C, et al. Applying the chronic care model to homeless veterans: Effect of a population approach to primary care on utilization and clinical outcomes. Am J Public Health. 2010;100(12):2493-2499.
7. Desai MM, Rosenheck RA, Kasprow WJ. Determinants of receipt of ambulatory medical care in a national sample of mentally ill homeless veterans. Med Care. 2003;41(2):275-287.
8. Irene Wong YL, Stanhope V. Conceptualizing community: A comparison of neighborhood characteristics of supportive housing for persons with psychiatric and developmental disabilities. Soc Sci Med. 2009;68(8):1376-1387.
9. Gelberg L, Gallagher TC, Andersen RM, Koegel P. Competing priorities as a barrier to medical care among homeless adults in Los Angeles. Am J Public Health. 1997;87(2):217-220.
10. Hamilton AB, Poza I, Washington DL. “Homelessness and trauma go hand-in-hand”: Pathways to homelessness among women veterans. Womens Health Issues. 2011;21(suppl 4):S203-S209.
11. McGuire J, Gelberg L, Blue-Howells J, Rosenheck RA. Access to primary care for homeless veterans with serious mental illness or substance abuse: A follow-up evaluation of co-located primary care and homeless social services. Adm Policy Ment Health. 2009;36(4):255-264.
12. VHA Operations Activities That May Constitute Research. Washington, DC: U.S. Department of Veterans Affairs, Veterans Health Administration; 2011. VHA Handbook 1058.05.
13. Resnick SG, Armstrong M, Sperrazza M, Harkness L, Rosenheck RA. A model of consumer-provider partnership: Vet-to-Vet. Psychiatr Rehabil J. 2004;28(2):185-187.
14. Hogan TP, Wakefield B, Nazi KM, Houston TK, Weaver FM. Promoting access through complementary eHealth technologies: Recommendations for VA’s Home Telehealth and personal health record programs. J Gen Intern Med. 2011;26(suppl 2):628-635.
15. Rosland AM, Nelson K, Sun H, et al. The patient-centered medical home in the Veterans Health Administration. Am J Manag Care. 2013;19(7):e263-e272.
16. Hsiao CJ, Cherry DK, Beatty PC, Rechtsteiner EA. National Ambulatory Medical Care Survey: 2007 summary. Natl Health Stat Report. 2010;3(27):1-32.
17. Hwang SW, Orav EJ, O’Connell JJ, Lebow JM, Brennan TA. Causes of death in homeless adults in Boston. Ann Intern Med. 1997;126(8):625-628.
18. Hwang SW, Tolomiczenko G, Kouyoumdjian FG, Garner RE. Interventions to improve the health of the homeless: A systematic review. Am J Prev Med. 2005;29(4):311-319.
How Effective Is Group Cognitive Behavioral Therapy to Treat PTSD?
Anxiety is a necessary and natural reaction to trauma, but, sometimes, anxiety symptoms become excessive and problematic, as experienced with posttraumatic stress disorder (PTSD). Some patients who struggle with PTSD endure a relentless apprehension so intense that it keeps them from participating in everyday activities, such as attending work and partaking in social activities. Associated anxiety symptoms severely impair everyday function and include increased heart rate, sweating, intrusive images, poor attention, fear, or insomnia. Posttraumatic stress disorder symptoms often lead to occupational dysfunction, relationship difficulty, and numerous other functional impairments.
Approximately 300,000 veterans meet the criteria for PTSD related to ongoing or recent wars.1 The veteran does not bear the personal and functional burden alone; however, the financial load is felt throughout society. One recent study suggests that for veterans diagnosed with PTSD, the first 2 years after deployment cost society an estimated $7,000 per individial.2 Current research suggests that this potentially debilitating disorder occurs in about 14% of Operation Iraqi Freedom/Operation Enduring Freedom combat troops, whereas the similar U.S. demographic population experiences PTSD at a rate of about 7%.1,3 The ongoing military trauma exposures are compelling the mental health community to establish efficient and effective treatment options.4,5
Several treatment strategies exist to reduce PTSD symptoms, but health care professionals must seek a balance between therapeutic benefit and cost. The treatment of PTSD is diverse and variable; however, in the most recent Clinical Practice Guideline (CPG) for PTSD, the VA and DoD specifically endorse some psychotherapeutic interventions while dissuading the use of others.6 Of note, the VA and DoD CPG strongly encourages Stress Inoculation Training (SIT) and similar cognitive therapies aimed at guiding patients through the process of consciously understanding the relationship between thoughts and feelings and then modifying thoughts to appropriately manage stressors.6 Meanwhile, group psychotherapy has been determined to be “somewhat helpful.”6 Even though cognitive- and group-based therapies have long been established as efficacious for numerous psychological disorders (depression, obsessive compulsive disorder, eating disorders, etc), neither the American Group Psychotherapy Association nor the VA and DoD CPG directly endorse the use of group cognitive behavioral therapy (GCBT) for the treatment of PTSD.6,7 However, both VA and DoD mental health providers commonly practice CBT and various group psychotherapies for the treatment of PTSD.
Despite the widespread use of CBT, there is a gap in the clinical understanding of the evidence supporting GCBT for PTSD. The goal of this synthesis was to understand the efficacy of treating PTSD symptoms with group psychotherapy. To begin this investigation, the following PICO (population, intervention, comparison, outcome) question was asked: In adults diagnosed with PTSD, how effective is group cognitive behavioral therapy in reducing PTSD-related symptoms?
Methods
Research articles addressing the use of GCBT in PTSD were obtained via database searches that took place during October 2012 (Table). Searched databases included the Cochrane Central Register of Controlled Trials, Cochrane Database of Systematic Reviews Randomized Controlled Trials, Psychological Information (PsycINFO), and Public Medicine (PubMed).
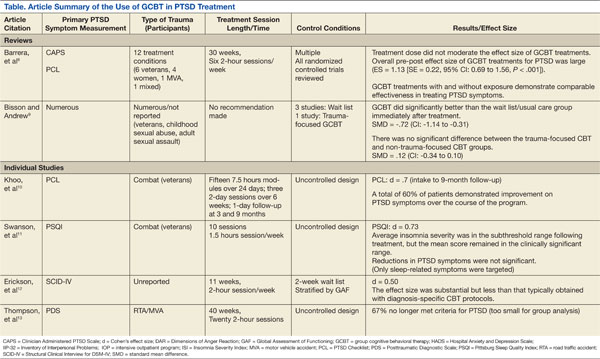
The PubMed database was searched using the following MeSH (medical subject heading) terms: “psychotherapy, group” and “stress disorders, post-traumatic” and “cognitive therapy.” Limitations were set to include only patients aged ≥ 18 years, results in English, those involving human subjects, and articles published within the past 5 years. A manual search of references was also conducted, and relevant articles were retained.
Articles that addressed primary substance abuse, other DSM Axis I disorders, intimate partner violence, or family issues were excluded from the evidence sample due to concerns of an alternate treatment focus. Articles with a focus on telehealth or alternative medicine were considered confounding to the scope of this review were also excluded. It was also noted that the term CBT is used collectively for an umbrella of treatments; however, treatments that focused on elements other than the components of CBT being delivered in a group were not included. To prevent duplication of the results, research from an inclusive review was not considered individually.
SUMMARY OF EVIDENCE
Six works fulfilled the PICO criteria and were of sufficient quality to be synthesized. Of the 6 articles retained for synthesis, 2 were high-level reviews. Both reviews supported the use of GCBT for PTSD treatment. Barrera and colleagues reported an overall large effect size regardless of the presence of exposure in-group among the 12 treatment conditions and 651 study participants.8 These researchers also reported that in-group exposure did not further traumatize other group members.
Similarly, although a notably older and smaller review, Bisson and Andrew reported a significant standard mean deviation between 4 GCBT treatment and wait list controls. These reviewers did not find a significant difference between trauma- and nontrauma-focused treatment groups. The reviews also noted that individual psychotherapy and/or pharmacotherapy was most often continued throughout the reviewed studies.8,9
The 4 other studies contribute substantively to this synthesis but arguably represent lower evidence quality. A large longitudinal study of 496 Australian veterans reported a large effect size that was sustained 9 months after treatment began.10 These researchers used an intensive outpatient program that included medication and other treatment modalities as the basis for GCBT delivery. They reported that the majority of the patients revealed improvement in PTSD symptoms.
Another study sampled a similar group of 10 combat veterans but focused particular attention on sleep-related PTSD symptoms of insomnia, nightmares, and sleep quality.11 Although these researchers were unable to report a significant difference in overall PTSD symptoms for the 8 subjects who completed the protocol, they did find a large effect size on insomnia severity and a medium effect size on sleep quality. Regular treatment, including medication, continued throughout this study.
Other researchers reported a medium effect size on PTSD symptoms while using GCBT in a heterogeneous group with various anxiety disorders, including obsessive compulsive disorder, generalized anxiety disorder, social phobia, panic disorders, and PTSD.12 Although reporting similar results as all other included studies, this study has some significant limitations, including a 26% dropout rate among the 152 participants. The final study included for synthesis reported a remarkable 67% elimination of the PTSD diagnosis among 6 motor vehicle accident survivors in the small, uncontrolled study.13 Concomitant treatments, including medications, were not reported in detail for these 4 studies except as mentioned.
As a whole, the 6 studies revealed some appreciable commonalities. Time since diagnosis did not seem to influence the results. Attrition was consistently found to be similar to other PTSD treatments. The reported session topics were loosely based on common CBT tenets (ie, education, challenging cognitions, and relaxation techniques) and were typically similar among treatment groups, including the use of homework.
DISCUSSION
As the diagnosis of PTSD increases to unfamiliar levels, GCBT has the potential to be helpful to clinicians and patients seeking alternatives to their current treatments.1,4,14 The reported results imply that GCBT can be useful in PTSD symptom reduction. This could be particularly useful to VA and military providers or rural providers operating with limited resources.
Treatment protocols are not well established and should be approached with care prior to the establishment of CBT treatment groups for those diagnosed with PTSD. Session overviews and descriptions, such as those mentioned in Thompson and colleagues, could provide a reference point for future use.13
Also worth considering, CBT can be an ambiguous term requiring deliberate definition within treatment protocols. As noted in the VA and DoD CPG, exposure- and trauma-focused treatment designs can be efficacious, but these elements do not seem to be required within the GCBT treatment setting.
The current research also suggests GCBT efficacy regardless of the index trauma. This does not suggest that heterogeneous groups were frequently studied nor can conclusions be drawn regarding heterogeneous treatment groups. Elements such as group size and session length are inconsistently reported and require specific consideration as well. There is a distinct lack of research directly comparing individual CBT with GCBT directly, which prohibits meaningful conclusions regarding PTSD symptom reduction. This research gap may well have influenced the recommendations within the VA and DoD CPG. Although some higher quality studies exist, many of the published reports on GCBT have noteworthy design flaw, such as inadequate controls and statistical analysis.
LIMITATIONS
There are some limitations to this literature synthesis. Although the search was limited to the past 5 years, the inclusion of reviews accounts for older evidence. As alluded to earlier, the lack of a standardized GCBT treatment protocol challenges results comparisons as well. The consequent treatment variations make direct interstudy comparison and synthesis difficult. Similarly, outcome measures varied between studies. Also, group psychotherapy is well established and accepted. Therefore, much of the supporting research was accomplished outside the parameters of this literature search. This empirical view of group psychotherapy among mental health providers may also contribute to the lack of available research.
It is also worth noting that studies finding neutral or negative results are often unpublished. This publication bias could account for the lack of available evidence. The research reports do not consistently report therapist qualifications; however, board certificates in group psychotherapy and CBT are undeniably variables available for debate. The inclusion of uncontrolled trials limits these findings as well. Although the above limitations are not exhaustive, they do provide necessary caveats to future generalizations.
FUTURE IMPLICATIONS
Perhaps the most important information to gain from future research is that of treatment outcomes. Studies that include a detailed outcome evaluation could reveal patient satisfaction, efficacy, and financial considerations. In the presence of adequate supportive data, GCBT could contribute outcome data regarding trauma survivor symptom normalization, peer support formation, access to care, treatment efficiency, and health care resources utilization. As noted in Barrera and colleagues, future analysis will require a greater volume of trials with an overall increase in methodological rigor.8
Current research has demonstrated a solid base from which to spawn specific treatment protocols. The available research is investigational in terms of treatment procedures. Replication of these studies could dictate treatment protocol and contribute substantively to future VA and DoD CPG updates. Future researchers should consider the use of a standard PTSD symptom assessment tool to make interstudy comparisons more meaningful. The length of treatment and exposure elements should be targeted specifically in future research as these components currently vary the most.
The military represents an obvious avenue for future research due to increased PTSD diagnosis in recent years. Although the etiology of the increase in PTSD is unclear and most likely multifactorial (decreased resilience, increased awareness, increased pursuit of secondary gains, etc), the need for treatment options is apparent.1 Group cohesion has been shown to be a core component of successful group psychotherapy, so military members who are accustomed to unit cohesion might represent a uniquely suitable population for this modality.15 Interestingly and for reasons not currently understood, veterans do not see effects of therapy as large as their civilian counterparts.8 This underscores the need for further evaluation of military-specific outcomes.
CONCLUSIONS
Although the available evidence is not robust, results do support the careful use of GCBT as an effective treatment for PTSD symptom reduction.8 Group psychotherapy has been generally regarded as an efficacious and cost-effective method to achieve similar outcomes to individual therapy. Increasing PTSD prevalence compels mental health care providers to explore all available treatment options. The potential for GCBT as an option is exciting, especially for mental health providers and those with limited resources. Rising health care standards and the current national fiscal situation is dictating a reevaluation of treatment options; so perhaps all health care providers will soon consider the use of GCBT.
As with any group assignment, the clinician should carefully consider the individual’s suitability and desire for group participation.16 With GCBT, providers could facilitate the relief of relentless apprehension and functional impairment for several patients simultaneously. Although there are many details left to explore regarding the use of GCBT for PTSD, the therapy’s foundation for use as a PTSD treatment is apparent.
Author disclosures
The author reports no actual or potential conflicts of interest with regard to this article.
Disclaimer
The opinions expressed herein are those of the author and do not necessarily reflect those of Federal Practitioner, Frontline Medical Communications Inc., the U.S. Government, or any of its agencies. This article may discuss unlabeled or investigational use of certain drugs. Please review the complete prescribing information for specific drugs or drug combinations—including indications, contraindications, warnings, and adverse effects—before administering pharmacologic therapy to patients.
1. Litz B, Schlenger W. Posttraumatic stress disorder in service members and new veterans of the Iraq and Afghanistan wars: A bibliography and critique. PTSD Res Q. 2009;20(1):1-3.
2. Tanielian T. Assessing combat exposure and post-traumatic stress disorder in troops and estimating the costs to society: Implications from the RAND Invisible Wounds of War Study. http://www.rand.org/pubs/testimonies/CT321.html. Published 2009. Accessed September 29, 2014.
3. Kessler RC, Chiu WT, Demler O, Merikangas KR, Walters EE. Prevalence, severity, and comorbidity of 12-month DSM-IV disorders in the National Comorbidity Survey Replication. Arch Gen Psychiatry. 2005;62(6):617-627.
4. Cukor J, Spitalnick J, Difede J, Rizzo A, Rothbaum BO. Emerging treatments for PTSD. Clinical Psychol Rev. 2009;29(8):715-726.
5. Hoge CW. Interventions for war-related posttraumatic stress disorder: Meeting veterans where they are. JAMA. 2011;306(5):549-551.
6. Veterans Health Administration, Department of Defense. VA/DoD Clinical Practice Guideline: Management of Post-Traumatic Stress, Version 2.0. Washington, DC: Veterans Health Administration and Department of Defense; 2010.
7. Burlingame GM, Fuhriman A, Mosier J. The differential effectiveness of group psychotherapy: A meta-analytic perspective. Group Dyn. 2003;7(1):3-12.
8. Barrera TL, Mott JM, Hofstein RF, Teng EJ. A meta-analytic review of exposure in group cognitive behavioral therapy for posttraumatic stress disorder. Clin Psychol Rev. 2013;33(1):24-32.
9. Bisson J, Andrew M. Psychological treatment of post-traumatic stress disorder (PTSD). Cochrane Database Syst Rev. 2007;(3):CD003388.
10. Khoo A, Dent MT, Oei TS. (2011). Group cognitive behaviour therapy for military service-related post-traumatic stress disorder: Effectiveness, sustainability and repeatability. Aust N Z J Psychiatry. 2011;45(8):663-672.
11. Swanson LM, Favorite TK, Horin E, Arnedt JT. A combined group treatment for nightmares and insomnia in combat veterans: A pilot study. J Trauma Stress. 2009;22(6):639-642.
12. Erickson DH, Janeck A, Tallman K. A cognitive-behavioral group for patients with various anxiety disorders. Psychiatr Serv. 2007;58(9):1205-1211.
13. Thompson AR, Wilde E, Boon K. The development of group CBT for the treatment of road-traffic-accident-related post-traumatic stress disorder: A pilot study. Cognitive Behav Therapist. 2010;2(1):32-42.
14. Slade T, Johnston A, Oakley-Browne MA, Andrews G, Whiteford H. 2007 National Survey of Mental Health and Wellbeing: Methods and key findings. Aust N Z J Psychiatry. 2009;43(7):594-605.
15. Crowe TP, Grenyer BF. Is therapist alliance or whole group cohesion more influential in group psychotherapy outcomes? Clin Psychol Psychother. 2008;15(4):239-246.
16. Leszcz M, Kobos JC. Evidence-based group psychotherapy: Using AGPA’s practice guidelines to enhance clinical effectiveness. J Clin Psychol. 2008;64(11):1238-1260.
Anxiety is a necessary and natural reaction to trauma, but, sometimes, anxiety symptoms become excessive and problematic, as experienced with posttraumatic stress disorder (PTSD). Some patients who struggle with PTSD endure a relentless apprehension so intense that it keeps them from participating in everyday activities, such as attending work and partaking in social activities. Associated anxiety symptoms severely impair everyday function and include increased heart rate, sweating, intrusive images, poor attention, fear, or insomnia. Posttraumatic stress disorder symptoms often lead to occupational dysfunction, relationship difficulty, and numerous other functional impairments.
Approximately 300,000 veterans meet the criteria for PTSD related to ongoing or recent wars.1 The veteran does not bear the personal and functional burden alone; however, the financial load is felt throughout society. One recent study suggests that for veterans diagnosed with PTSD, the first 2 years after deployment cost society an estimated $7,000 per individial.2 Current research suggests that this potentially debilitating disorder occurs in about 14% of Operation Iraqi Freedom/Operation Enduring Freedom combat troops, whereas the similar U.S. demographic population experiences PTSD at a rate of about 7%.1,3 The ongoing military trauma exposures are compelling the mental health community to establish efficient and effective treatment options.4,5
Several treatment strategies exist to reduce PTSD symptoms, but health care professionals must seek a balance between therapeutic benefit and cost. The treatment of PTSD is diverse and variable; however, in the most recent Clinical Practice Guideline (CPG) for PTSD, the VA and DoD specifically endorse some psychotherapeutic interventions while dissuading the use of others.6 Of note, the VA and DoD CPG strongly encourages Stress Inoculation Training (SIT) and similar cognitive therapies aimed at guiding patients through the process of consciously understanding the relationship between thoughts and feelings and then modifying thoughts to appropriately manage stressors.6 Meanwhile, group psychotherapy has been determined to be “somewhat helpful.”6 Even though cognitive- and group-based therapies have long been established as efficacious for numerous psychological disorders (depression, obsessive compulsive disorder, eating disorders, etc), neither the American Group Psychotherapy Association nor the VA and DoD CPG directly endorse the use of group cognitive behavioral therapy (GCBT) for the treatment of PTSD.6,7 However, both VA and DoD mental health providers commonly practice CBT and various group psychotherapies for the treatment of PTSD.
Despite the widespread use of CBT, there is a gap in the clinical understanding of the evidence supporting GCBT for PTSD. The goal of this synthesis was to understand the efficacy of treating PTSD symptoms with group psychotherapy. To begin this investigation, the following PICO (population, intervention, comparison, outcome) question was asked: In adults diagnosed with PTSD, how effective is group cognitive behavioral therapy in reducing PTSD-related symptoms?
Methods
Research articles addressing the use of GCBT in PTSD were obtained via database searches that took place during October 2012 (Table). Searched databases included the Cochrane Central Register of Controlled Trials, Cochrane Database of Systematic Reviews Randomized Controlled Trials, Psychological Information (PsycINFO), and Public Medicine (PubMed).
The PubMed database was searched using the following MeSH (medical subject heading) terms: “psychotherapy, group” and “stress disorders, post-traumatic” and “cognitive therapy.” Limitations were set to include only patients aged ≥ 18 years, results in English, those involving human subjects, and articles published within the past 5 years. A manual search of references was also conducted, and relevant articles were retained.
Articles that addressed primary substance abuse, other DSM Axis I disorders, intimate partner violence, or family issues were excluded from the evidence sample due to concerns of an alternate treatment focus. Articles with a focus on telehealth or alternative medicine were considered confounding to the scope of this review were also excluded. It was also noted that the term CBT is used collectively for an umbrella of treatments; however, treatments that focused on elements other than the components of CBT being delivered in a group were not included. To prevent duplication of the results, research from an inclusive review was not considered individually.
SUMMARY OF EVIDENCE
Six works fulfilled the PICO criteria and were of sufficient quality to be synthesized. Of the 6 articles retained for synthesis, 2 were high-level reviews. Both reviews supported the use of GCBT for PTSD treatment. Barrera and colleagues reported an overall large effect size regardless of the presence of exposure in-group among the 12 treatment conditions and 651 study participants.8 These researchers also reported that in-group exposure did not further traumatize other group members.
Similarly, although a notably older and smaller review, Bisson and Andrew reported a significant standard mean deviation between 4 GCBT treatment and wait list controls. These reviewers did not find a significant difference between trauma- and nontrauma-focused treatment groups. The reviews also noted that individual psychotherapy and/or pharmacotherapy was most often continued throughout the reviewed studies.8,9
The 4 other studies contribute substantively to this synthesis but arguably represent lower evidence quality. A large longitudinal study of 496 Australian veterans reported a large effect size that was sustained 9 months after treatment began.10 These researchers used an intensive outpatient program that included medication and other treatment modalities as the basis for GCBT delivery. They reported that the majority of the patients revealed improvement in PTSD symptoms.
Another study sampled a similar group of 10 combat veterans but focused particular attention on sleep-related PTSD symptoms of insomnia, nightmares, and sleep quality.11 Although these researchers were unable to report a significant difference in overall PTSD symptoms for the 8 subjects who completed the protocol, they did find a large effect size on insomnia severity and a medium effect size on sleep quality. Regular treatment, including medication, continued throughout this study.
Other researchers reported a medium effect size on PTSD symptoms while using GCBT in a heterogeneous group with various anxiety disorders, including obsessive compulsive disorder, generalized anxiety disorder, social phobia, panic disorders, and PTSD.12 Although reporting similar results as all other included studies, this study has some significant limitations, including a 26% dropout rate among the 152 participants. The final study included for synthesis reported a remarkable 67% elimination of the PTSD diagnosis among 6 motor vehicle accident survivors in the small, uncontrolled study.13 Concomitant treatments, including medications, were not reported in detail for these 4 studies except as mentioned.
As a whole, the 6 studies revealed some appreciable commonalities. Time since diagnosis did not seem to influence the results. Attrition was consistently found to be similar to other PTSD treatments. The reported session topics were loosely based on common CBT tenets (ie, education, challenging cognitions, and relaxation techniques) and were typically similar among treatment groups, including the use of homework.
DISCUSSION
As the diagnosis of PTSD increases to unfamiliar levels, GCBT has the potential to be helpful to clinicians and patients seeking alternatives to their current treatments.1,4,14 The reported results imply that GCBT can be useful in PTSD symptom reduction. This could be particularly useful to VA and military providers or rural providers operating with limited resources.
Treatment protocols are not well established and should be approached with care prior to the establishment of CBT treatment groups for those diagnosed with PTSD. Session overviews and descriptions, such as those mentioned in Thompson and colleagues, could provide a reference point for future use.13
Also worth considering, CBT can be an ambiguous term requiring deliberate definition within treatment protocols. As noted in the VA and DoD CPG, exposure- and trauma-focused treatment designs can be efficacious, but these elements do not seem to be required within the GCBT treatment setting.
The current research also suggests GCBT efficacy regardless of the index trauma. This does not suggest that heterogeneous groups were frequently studied nor can conclusions be drawn regarding heterogeneous treatment groups. Elements such as group size and session length are inconsistently reported and require specific consideration as well. There is a distinct lack of research directly comparing individual CBT with GCBT directly, which prohibits meaningful conclusions regarding PTSD symptom reduction. This research gap may well have influenced the recommendations within the VA and DoD CPG. Although some higher quality studies exist, many of the published reports on GCBT have noteworthy design flaw, such as inadequate controls and statistical analysis.
LIMITATIONS
There are some limitations to this literature synthesis. Although the search was limited to the past 5 years, the inclusion of reviews accounts for older evidence. As alluded to earlier, the lack of a standardized GCBT treatment protocol challenges results comparisons as well. The consequent treatment variations make direct interstudy comparison and synthesis difficult. Similarly, outcome measures varied between studies. Also, group psychotherapy is well established and accepted. Therefore, much of the supporting research was accomplished outside the parameters of this literature search. This empirical view of group psychotherapy among mental health providers may also contribute to the lack of available research.
It is also worth noting that studies finding neutral or negative results are often unpublished. This publication bias could account for the lack of available evidence. The research reports do not consistently report therapist qualifications; however, board certificates in group psychotherapy and CBT are undeniably variables available for debate. The inclusion of uncontrolled trials limits these findings as well. Although the above limitations are not exhaustive, they do provide necessary caveats to future generalizations.
FUTURE IMPLICATIONS
Perhaps the most important information to gain from future research is that of treatment outcomes. Studies that include a detailed outcome evaluation could reveal patient satisfaction, efficacy, and financial considerations. In the presence of adequate supportive data, GCBT could contribute outcome data regarding trauma survivor symptom normalization, peer support formation, access to care, treatment efficiency, and health care resources utilization. As noted in Barrera and colleagues, future analysis will require a greater volume of trials with an overall increase in methodological rigor.8
Current research has demonstrated a solid base from which to spawn specific treatment protocols. The available research is investigational in terms of treatment procedures. Replication of these studies could dictate treatment protocol and contribute substantively to future VA and DoD CPG updates. Future researchers should consider the use of a standard PTSD symptom assessment tool to make interstudy comparisons more meaningful. The length of treatment and exposure elements should be targeted specifically in future research as these components currently vary the most.
The military represents an obvious avenue for future research due to increased PTSD diagnosis in recent years. Although the etiology of the increase in PTSD is unclear and most likely multifactorial (decreased resilience, increased awareness, increased pursuit of secondary gains, etc), the need for treatment options is apparent.1 Group cohesion has been shown to be a core component of successful group psychotherapy, so military members who are accustomed to unit cohesion might represent a uniquely suitable population for this modality.15 Interestingly and for reasons not currently understood, veterans do not see effects of therapy as large as their civilian counterparts.8 This underscores the need for further evaluation of military-specific outcomes.
CONCLUSIONS
Although the available evidence is not robust, results do support the careful use of GCBT as an effective treatment for PTSD symptom reduction.8 Group psychotherapy has been generally regarded as an efficacious and cost-effective method to achieve similar outcomes to individual therapy. Increasing PTSD prevalence compels mental health care providers to explore all available treatment options. The potential for GCBT as an option is exciting, especially for mental health providers and those with limited resources. Rising health care standards and the current national fiscal situation is dictating a reevaluation of treatment options; so perhaps all health care providers will soon consider the use of GCBT.
As with any group assignment, the clinician should carefully consider the individual’s suitability and desire for group participation.16 With GCBT, providers could facilitate the relief of relentless apprehension and functional impairment for several patients simultaneously. Although there are many details left to explore regarding the use of GCBT for PTSD, the therapy’s foundation for use as a PTSD treatment is apparent.
Author disclosures
The author reports no actual or potential conflicts of interest with regard to this article.
Disclaimer
The opinions expressed herein are those of the author and do not necessarily reflect those of Federal Practitioner, Frontline Medical Communications Inc., the U.S. Government, or any of its agencies. This article may discuss unlabeled or investigational use of certain drugs. Please review the complete prescribing information for specific drugs or drug combinations—including indications, contraindications, warnings, and adverse effects—before administering pharmacologic therapy to patients.
1. Litz B, Schlenger W. Posttraumatic stress disorder in service members and new veterans of the Iraq and Afghanistan wars: A bibliography and critique. PTSD Res Q. 2009;20(1):1-3.
2. Tanielian T. Assessing combat exposure and post-traumatic stress disorder in troops and estimating the costs to society: Implications from the RAND Invisible Wounds of War Study. http://www.rand.org/pubs/testimonies/CT321.html. Published 2009. Accessed September 29, 2014.
3. Kessler RC, Chiu WT, Demler O, Merikangas KR, Walters EE. Prevalence, severity, and comorbidity of 12-month DSM-IV disorders in the National Comorbidity Survey Replication. Arch Gen Psychiatry. 2005;62(6):617-627.
4. Cukor J, Spitalnick J, Difede J, Rizzo A, Rothbaum BO. Emerging treatments for PTSD. Clinical Psychol Rev. 2009;29(8):715-726.
5. Hoge CW. Interventions for war-related posttraumatic stress disorder: Meeting veterans where they are. JAMA. 2011;306(5):549-551.
6. Veterans Health Administration, Department of Defense. VA/DoD Clinical Practice Guideline: Management of Post-Traumatic Stress, Version 2.0. Washington, DC: Veterans Health Administration and Department of Defense; 2010.
7. Burlingame GM, Fuhriman A, Mosier J. The differential effectiveness of group psychotherapy: A meta-analytic perspective. Group Dyn. 2003;7(1):3-12.
8. Barrera TL, Mott JM, Hofstein RF, Teng EJ. A meta-analytic review of exposure in group cognitive behavioral therapy for posttraumatic stress disorder. Clin Psychol Rev. 2013;33(1):24-32.
9. Bisson J, Andrew M. Psychological treatment of post-traumatic stress disorder (PTSD). Cochrane Database Syst Rev. 2007;(3):CD003388.
10. Khoo A, Dent MT, Oei TS. (2011). Group cognitive behaviour therapy for military service-related post-traumatic stress disorder: Effectiveness, sustainability and repeatability. Aust N Z J Psychiatry. 2011;45(8):663-672.
11. Swanson LM, Favorite TK, Horin E, Arnedt JT. A combined group treatment for nightmares and insomnia in combat veterans: A pilot study. J Trauma Stress. 2009;22(6):639-642.
12. Erickson DH, Janeck A, Tallman K. A cognitive-behavioral group for patients with various anxiety disorders. Psychiatr Serv. 2007;58(9):1205-1211.
13. Thompson AR, Wilde E, Boon K. The development of group CBT for the treatment of road-traffic-accident-related post-traumatic stress disorder: A pilot study. Cognitive Behav Therapist. 2010;2(1):32-42.
14. Slade T, Johnston A, Oakley-Browne MA, Andrews G, Whiteford H. 2007 National Survey of Mental Health and Wellbeing: Methods and key findings. Aust N Z J Psychiatry. 2009;43(7):594-605.
15. Crowe TP, Grenyer BF. Is therapist alliance or whole group cohesion more influential in group psychotherapy outcomes? Clin Psychol Psychother. 2008;15(4):239-246.
16. Leszcz M, Kobos JC. Evidence-based group psychotherapy: Using AGPA’s practice guidelines to enhance clinical effectiveness. J Clin Psychol. 2008;64(11):1238-1260.
Stent Thrombosis: A Disease for All Clinicians
Percutaneous coronary intervention (PCI) using coronary artery stent implantation is commonly used to treat symptomatic high-risk and unstable coronary artery disease (CAD). The use of stents has improved the safety and efficacy of PCI by reducing the need for repeat revascularization, reducing acute vessel closure requiring emergent coronary artery bypass graft surgery, and expanding the use of PCI to more complex diseases. Nevertheless, stents carry the risk of sudden thrombotic occlusion or stent thrombosis, particularly during the first several days or weeks after implantation. In turn, stent thrombosis can lead to acute myocardial infarction (MI) and a mortality rate > 25%.1,2
This article highlights 2 cases of patients with stent thrombosis and discusses its pathophysiology, clinical features, and risk-avoidance strategies. Given the high prevalence of CAD and ubiquitous PCI procedures in the U.S. health care system, it is essential that not only cardiologists, but all clinicians and health care providers who care for patients with coronary stents understand how to help prevent and manage this life-threatening clinical entity.1
Case 1
A 56-year-old man presented to his primary care physician with exertion-related angina. The patient had a history of type 2 diabetes mellitus, dyslipidemia, systemic hypertension, obesity, and CAD status post MI in 2002 treated with a bare metal stent (BMS) to the left circumflex coronary artery (LCx). A stress myocardial perfusion imaging with 99mTc-sestamibi revealed moderate reversible exercise-induced myocardial ischemia involving the inferior and inferoapical wall segments of the left ventricle with associated hypokinesia.
Coronary angiography revealed nonsignificant disease of the left anterior descending artery (LAD) and LCx, a patent LCx stent, and a 95% mid-right coronary artery (RCA) obstruction with delayed (TIMI grade 2) antegrade flow. The distal right posterior descending artery filled via left to right collaterals from the LAD.
Percutaneous coronary intervention was performed on the RCA lesion 8 days after the patient was started on dual antiplatelet therapy (DAPT) with aspirin 81 mg and clopidogrel 75 mg (including 300 mg loading dose on the day of the diagnostic angiogram). The mid RCA was treated with a drug-eluting stent (DES) and a BMS in a nonoverlapping fashion with an excellent angiographic result. The patient was instructed to continue DAPT with aspirin 325 mg daily and clopidogrel 75 mg daily for 12 months.
Three days post PCI, the patient arrived at the emergency department with angina of 1-hour duration associated with shortness of breath and diaphoresis. He reported strict adherence to DAPT.
Initial vital signs were normal. The electrocardiogram (ECG) showed ST segment elevation (1-2 mm) on leads III, aVF, and V5 to V6, suggestive of an acute inferolateral injury pattern for which emergent coronary angiography was performed. Angiography showed a 100% proximal RCA occlusion at the proximal edge of the most proximal stent with absence of any antegrade flow beyond the occlusion (TIMI grade 0 flow). This finding was diagnostic of definite angiographic subacute stent thrombosis. The patient underwent successful aspiration thrombectomy, balloon angioplasty, and restoration of normal TIMI grade 3 flow with a door-to-balloon time of 86 minutes.
Because stent thrombosis is relatively unexpected after an excellent angiographic result and DAPT adherence, the possibility of clopidogrel resistance was considered as a major contributor for the thrombotic event. Platelet aggregation tests showed adequate prolongation of collagen/epinephrine (COL-EPI) > 300 seconds (normal: 81-153 seconds), but inadequate prolongation of collagen/adenosindiphosphate (COL-ADP) of 109 seconds (normal: 53-105 seconds) while on clopidogrel. Therefore, the patient was switched to prasugrel.
The patient was discharged home after 5 days of observation at the cardiac care unit without any post-MI complications. During a follow-up appointment 1 month after discharge, he was clinically stable and free of cardiovascular symptoms. Workup performed for acquired or inherited thrombophilia was negative. He continued taking DAPT (daily aspirin 325 mg orally and prasugrel 10 mg orally) for 12 months. After completing 12 months of DAPT, he was maintained on aspirin 81 mg daily. At 24 months’ follow-up, he remained free of recurrent angina with no further cardiovascular events.
Case 2
An 84-year-old man with a medical history of dyslipidemia, paroxysmal atrial fibrillation, previous stroke, and peptic ulcer disease was brought to the emergency department following an episode of near syncope in the early morning hours. The patient revealed that he had experienced neck pain since midnight. The 12-lead ECG showed normal sinus rhythm with 2 mm ST segment elevation in leads II, III, aVF, V5-V6, and ST segment depression in V2, and Q waves in inferior leads. A right-sided ECG showed ST segment elevation in V4, suggestive of right ventricle infarction.
The patient remained hypotensive (83/49 mm Hg) despite isotonic fluid administration (about 1.5-2.0 liters of 0.9 normal saline at 999 mL/h). A dopamine drip for persistent hypotension was started, and he was taken emergently to the catheterization laboratory for primary PCI. Coronary angiography showed no significant left CAD and a 100% mid-RCA occlusion with faint left-to-right collaterals. After aspiration thrombectomy, bare metal RCA stenting was performed. Transient no-reflow was treated with intracoronary nicardipine and nitroglycerin. The patient continued to be in shock, and an intra-aortic balloon pump was inserted and 1:1 counterpulsation was initiated.
Following admission to the coronary care unit, the patient’s mean arterial pressure improved. Inotropes were weaned off 2 days after PCI, and the intra-aortic balloon pump was removed. During his stay, the post-MI course was uneventful except for an episode of asymptomatic paroxysmal atrial flutter and nonspecific back dermatitis attributed to a prolonged recumbent position.
The patient was transferred to the internal medicine ward for medical therapy optimization and the initiation of low-intensity cardiac rehabilitation. After 2 days on the ward, discharge planning was initiated. However, he developed an episode of atrial fibrillation with fast ventricular response. Metoprolol 5 mg IV bolus was given, and the ventricular rate was controlled. At that point, the dose of long-acting beta-blocker (metoprolol succinate) was optimized, he was started on full-dose anticoagulation (warfarin), and clopidogrel was discontinued. Two days later, the patient reported back pruritus, and an erythematous raised rash on his back spreading to the torso was noticed. An aspirin allergy was suspected as the trigger for the rash, thus aspirin was also discontinued.
Three days later, the patient developed recurrent neck pain (angina) with radiation to his shoulders and left arm. The ECG revealed re-elevation of the ST segment (inferior, posterior, and lateral leads). He received reloading of clopidogrel 600 mg and aspirin 325 mg. Also, an eptifibatide IV bolus followed by an infusion was given for immediate antiplatelet action. He was transferred for emergent coronary angiography with suspected subacute stent thrombosis.
Upon arrival to the catheterization lab, the patient was awake and alert but in mild respiratory distress. Intravenous dopamine was started due to hypotension (systolic blood pressure was about 85 mm Hg). Limited RCA angiography showed a large clot burden with a partially thrombosed stent and TIMI grade 3 flow. After intracoronary eptifibatide and nicardipine were given, successful aspiration thrombectomy was performed twice with partial removal of thrombus. In-stent high-pressure balloon angioplasty was performed and optimal stenting was confirmed by intravascular ultrasound (IVUS) criteria. However, a residual layered thrombus along the distal stent edge was noticed. The patient tolerated the procedure without complications.
Dual antiplatelet therapy with aspirin and clopidogrel for 12 months was recommended. The eptifibatide infusion was continued for 48 hours. The jaw pain, shortness of breath, and ECG changes disappeared, but the patient remained on vasopressors for the following 7 days.
Around 1 week after the stent thrombosis event, the patient was found pulseless. Advanced cardiopulmonary resuscitation was started. ST segment elevation in lead II was noted on the cardiac monitor. There was no return of spontaneous circulation after 20 minutes, and the patient was pronounced dead. The autopsy revealed a patent RCA stent without evidence of occlusion, a large transmural inferior MI, left ventricular rupture, and hemopericardium.
Discussion
Stent thrombosis is an uncommon complication after coronary stent implantation. Based on the Academic Research Consortium criteria, definite stent thrombosis is defined as a clinical event with symptoms suggestive of an acute coronary syndrome (ACS) with angiography or pathology that confirms the presence of stent thrombosis.2 Probable stent thrombosis is defined as an unexplained death within 30 days or MI involving the territory of the target vessel without angiographic confirmation of stent thrombosis.2 Finally, possible stent thrombosis is any unexplained death after 30 days.2
Based on timing, stent thrombosis is divided by acute (< 24 hours post stent implantation), subacute (24 hours to 30 days post stent implantation), late (> 30 days post stent implantation), and very late (> 12 months post stent implantation).3 However, most cases (up to 60%) occur within the first 30 days after placement, irrespective of stent type.4
The incidence of subacute stent thrombosis is reported to approach 1% during the first 30 days postprocedure but may be as high as 5% or 10% depending on associated clinical and angiographic variables (Table 1).5 The strongest clinical predictors of stent thrombosis are premature cessation of antiplatelet therapy, renal insufficiency, diabetes mellitus, and ACS.2,6 Lesion and procedural characteristics associated with increased risk of stent thrombosis include bifurcation lesions, longer stent length, multiple implanted stents, stent underexpansion, and/or stent malapposition.6-9 Stent type (drug or non–drug-eluting) has no impact on the risk of stent thrombosis during the first 30 days postprocedure.10,11
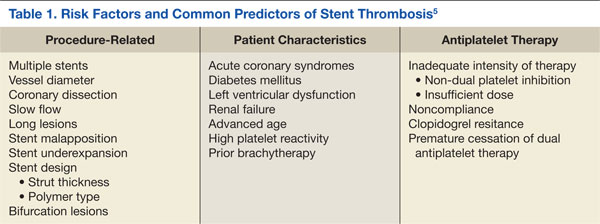
The clinical events related to late stent thrombosis, although rare, carry a mortality rate of up to 45%.12 The specific risk factors for late and very late stent thrombosis are less well defined but relate to delayed neointimal coverage, ongoing vessel inflammation, and the development of neoatherosclerosis within stents.13,14
Rationale for the Use of Dual Antiplatelet Regimen
Stent thrombosis is a platelet-mediated process related to a heightened state of systemic and intracoronary thrombogenicity and inflammation.15 Stent under-expansion enhances abnormal shear stress, which explains as many as 80% of these events.13,15,16 Stent thrombosis also has been frequently related to inadequate neointimal coverage.14 Angioscopic studies, especially with DES, suggest that stent endothelialization is delayed or incomplete, observing a correlation between the areas of uncovered stent surface and thrombosis.14,17
In the early days of coronary stenting, during the 1990s, the risk of acute and subacute stent thrombosis approached 20%.18,19 Initial attempts to reduce the risk included combining aspirin and warfarin, but at the expense of a marked increase in bleeding complications and prolonged hospital stays.20,21 In 1995, it became clear through the pivotal observations of Colombo and colleagues that incomplete expansion of the stent (documented by IVUS) was a major contributor to the risk of stent thrombosis.16 By using noncompliant balloons at high pressure (14-20 atmospheres) for stent postdilatation combined with DAPT (aspirin and ticlopidine), the high rates of early stent thrombosis were markedly reduced to the current level of 1% to 2%.16
Colombo and colleagues’ observations were prospectively evaluated in the Stent Anticoagulation Regimen Study (STARS) trial.22 Patients who underwent successful stenting were randomized to aspirin alone, aspirin and warfarin, or aspirin and ticlopidine. The STARS trial showed convincingly that the combination of aspirin and ticlopidine was superior to the other 2 regimens, reducing the stent thrombosis rate to only 0.5% (compared with 2.7% for aspirin and warfarin, and 3.6% for aspirin alone).22 Afterward, DAPT became the standard of care following coronary stenting.23
Although ticlopidine was the first widely used thienopyridine for the prevention of stent thrombosis, hematologic adverse events (AEs) (eg, neutropenia, thrombotic thrombocytopenia purpura) limited its use.24 Consequently, ticlopidine was replaced with clopidogrel, which seemed to offer similar efficacy but significantly fewer AEs.25
The current American College of Cardiology/American Heart Association/Society for Cardiovascular Angiography and Interventions (ACC/AHA/SCAI) guidelines for the prevention of ST after coronary stent implantation state that after PCI:
- Aspirin use should be continued indefinitely.
- The duration of adenosine diphosphate antagonists depends on the stent type (BMS or DES) and the indication for implantation (ACS or non-ACS).
a. Patients receiving a stent (BMS or DES) for ACS therapy should be given 1 of the following for at least 12 months:
i. Clopidogrel 75 mg daily
ii. Prasugrel 10 mg daily
iii. Ticagrelor 90 mg twice daily
b. In patients receiving DES for a non-ACS indication, clopidogrel should be given for at least 12 months if the patient is not at high risk for bleeding.
c. In patients receiving BMS for a non-ACS indication, clopidogrel should be given for a minimum of 1 month and ideally up to 12 months.23
Clopidogrel Hyporesponse
As shown in case 1, stent thrombosis may still occur in a patient on DAPT because of individual variability in platelet response to clopidogrel.5 Clopidogrel hyporesponse, also known as clopidogrel resistance, has been recognized as clinically significant because of its prevalence and association with poor outcomes.5 Its prevalence may range between 4% and 30%, although the definitions of clopidogrel hyporesponse varied between studies.26
Clopidogrel hyporesponse is defined as an inadequate inhibition of platelet function measured by nonspecific ex-vivo laboratory methods.27,28 The relationship between clopidogrel resistance (nonresponders), stent thrombosis, and ischemic events has been clearly established.5,29
Given the devastating consequences of stent thrombosis, efforts were directed to identify those patients at highest risk. One such effort has been focused on the measurement of platelet function, allowing for the identification of patients who do not respond adequately to antiplatelet therapy.15,28,30,31 However, the treatment of high-residual platelet reactivity as confirmed by laboratory assessment has not shown to clinically correlate with any benefit in the prevention of ST.6,15,29-31 Therefore, the current ACC/AHA/SCAI PCI guidelines do not recommend the routine clinical use of platelet function testing to screen patients treated with clopidogrel who are undergoing PCI.23
Clopidogrel is a prodrug, metabolized to its active form via the cytochrome P450 enzyme system before it can inhibit platelet function.32 Accordingly, certain genetic variation in enzyme activity, or polymorphisms, would be expected to influence its clinical effectiveness.33,34 The most common of these polymorphisms, CYP2C19*2, has been associated (in vitro) with reduced concentrations of active clopidogrel metabolites and with diminished platelet inhibition.35,36 As a result, the FDA has added a safety alert to the prescribing information for clopidogrel concerning how genetic differences in the metabolism of this agent can affect its effectiveness, ways to test for these genetic differences, and advice concerning alternative dosing strategies or use of other medications in poor metabolizers of clopidogrel.37 Although the routine clinical use of genetic testing to screen patients treated with clopidogrel who are undergoing PCI is not recommended, it may be considered in patients undergoing elective high-risk PCI procedures (eg, unprotected left main, last patent coronary artery, or bifurcating left main).23
The newer inhibitors of ADP-induced platelet activation, prasugrel and ticagrelor, are not prodrugs, and thus, their action is not affected by this genetic variability. Accordingly, these drugs have shown a more consistent, stronger, and faster inhibition of platelet aggregation compared with clopidogrel.36-39 In the pivotal trials (TRITON-TIMI 38 and PLATO), these agents have also been shown to be more effective in reducing the incidence of stent thrombosis.36,37,40,41 Therefore, in cases where clopidogrel resistance/hyporesponse is suspected in the setting of DAPT, such as stent thrombosis, guidelines recommend the use of 1 of these agents.23
Premature Discontinuation of Antiplatelet Therapy
As illustrated in case 2, premature discontinuation of antiplatelet therapy may be fatal, as it is associated with a marked increase in the risk of stent thrombosis. Indeed, premature discontinuation of DAPT is the leading independent predictor for stent thrombosis.12,42,43 Premature discontinuation of DAPT is defined when one or both agents (aspirin, ADP-antagonists) are suspended within 30 days of BMS placement or within 1 year of DES placement. In the case of DES, the first 6 months after implantation seem to be most critical. In a large observational study of patients treated with DES, stent thrombosis occurred in 29% of those patients in whom antiplatelet therapy was prematurely discontinued.12
In order to minimize the risk of premature DAPT discontinuation, one should address its causes. There are patient- and physician-related factors that may influence an early discontinuation of aspirin, thienopyridine, or both agents. Patient-related factors were identified in the PREMIER registry, including older age, not having completed high school, not being married, and/or not seeking health care because of costs.42 Another important but often overlooked factor that has an impact on adherence with prolonged DAPT post-DES implantation is nuisance or superficial bleeding.44 Physician-related factors include not providing discharge instructions for medication use and ill-advised instructions given by health care providers to discontinue therapy before procedures with a low risk of bleeding (eg, dental cleaning, cataract surgery, colonoscopy, skin biopsy).42
In addition, the perioperative management of DAPT during the first several weeks after coronary stenting has been shown to critically influence outcomes. In a study by Sharma and colleagues, fatal cases of stent thrombosis occurred after the discontinuation of antiplatelet therapy for noncardiac surgery among patients with BMS implantation within the past 90 days.43
In selected cases when a noncardiac procedure cannot be delayed for 1 year, recognizing the impact of the specific timing for the discontinuation of the antiplatelet regimen is essential. Kaluza and colleagues reported on 40 patients treated with BMS who underwent noncardiac surgery within 6 weeks of the stent implantation.45 Seven patients had an MI, of which 6 were fatal. Stent thrombosis was presumed to be the cause of all MIs. In 5 of 7 cases, ticlopidine was withheld before surgery.45
All clinicians should be aware of the following recommendations to avoid catastrophic cardiovascular complications related to premature discontinuation of DAPT during the perioperative setting:
- Elective procedures should be deferred until patients have completed an appropriate course of thienopyridine therapy (12 months after DES and a minimum of 4 weeks for BMS implantation).
- For those patients treated with DES who are to undergo a nonelective procedure that mandates discontinuation of thienopyridine therapy, the possibility of procedure postponement for completion of DAPT for at least 6 months should be judiciously deliberated. If the procedure cannot be postponed, aspirin should be continued if at all possible and the thienopyridine restarted as soon as possible after the procedure.42,46,47
Conclusion
Stent thrombosis is a rare but devastating complication of coronary stent implantation. Although it can occur at any time after stent placement, the majority of events occur within the first month. The use of optimal stenting techniques and adherence to DAPT are required to minimize the risk of stent thrombosis. Several clinical and procedural predictors have been related to an increased risk of stent thrombosis. The premature cessation of DAPT is the most important risk factor for stent thrombosis.
All physicians should ensure patients are properly and thoroughly educated about the reasons they are prescribed DAPT and the significant risks associated with prematurely discontinuing such therapy. All clinicians, especially noncardiologists, should realize the importance of close communication with a cardiologist or interventional cardiologist in situations when premature discontinuation is being considered for a specific reason.
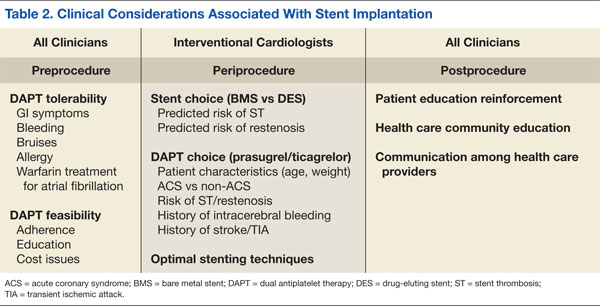
Table 2 summarizes a framework of the most relevant factors that should be taken into account before, during, and after stent implantation, both by interventional cardiologists, as well as by all clinicians involved in the care of the patient. Given current procedural volumes (> 1 million PCI procedures are performed in the U.S. annually) and because the risk of stent thrombosis is both time and treatment dependent, it is of paramount importance that, not only cardiologists, but all physicians know the impact of stent thrombosis in their patients and how to avoid situations that may increase its risk.1 Team-approach decisions about antiplatelet therapy after stent placement, especially within the first 12 months, and a patient-centered mind-set are indispensable to optimize patient outcomes.
Author disclosures
The authors report no actual or potential conflicts of interest with regard to this article.
Disclaimer
The opinions expressed herein are those of the authors and do not necessarily reflect those of Federal Practitioner, Frontline Medical Communications Inc., the U.S. Government, or any of its agencies. This article may discuss unlabeled or investigational use of certain drugs. Please review complete prescribing information for specific drugs or drug combinations—including indications, contraindications, warnings, and adverse effects—before administering pharmacologic therapy to patients.
1. Ryan J, Cohen DJ. Are drug-eluting stents cost-effective? It depends on whom you ask. Circulation. 2006;114(16):1736-1744.
2. Cutlip DE, Windecker S, Mehran R, et al; Academic Research Consortium. Clinical end points in coronary stent trials: A case for standardized definitions. Circulation. 2007;115(17):2344-2351.
3. Yusuf S, Zhao F, Mehta SR, Chrolavicius S, Tognoni G, Fox KK; Clopidogrel in Unstable Angina to Prevent Recurrent Events Trial Investigators. Effects of clopidogrel in addition to aspirin in patients with acute coronary syndromes without ST-segment elevation. N Engl J Med. 2001;345(7):494-502.
4. Palmerini T, Kirtane AJ, Serruys PW, et al. Stent thrombosis with everolimus-eluting stents: Meta-analysis of comparative randomized controlled trials. Circ Cardiovasc Interv. 2012;5(3):357-364.
5. Angiolillo DJ, Fernandez-Ortiz A, Bernardo E, et al. Variability in individual responsiveness to clopidogrel: Clinical implications, management, and future perspectives. J Am Coll Cardiol. 2007;49(14):1505-1516.
6. Moussa I, Di Mario C, Reimers B, Akiyama T, Tobis J, Colombo A. Subacute stent thrombosis in the era of intravascular ultrasound-guided coronary stenting without anticoagulation: Frequency, predictors and clinical outcome. J Am Coll Cardiol. 1997;29(1):6-12.
7. Fujii K, Carlier SG, Mintz GS, et al. Stent underexpansion and residual reference segment stenosis are related to stent thrombosis after sirolimus-eluting stent implantation: An intravascular ultrasound study. J Am Coll Cardiol. 2005;45(7):995-998.
8. Uren NG, Schwarzacher SP, Metz JA, et al; POST Registry Investigators. Predictors and outcomes of stent thrombosis: An intravascular ultrasound registry. Eur Heart J. 2002;23(2):124-132.
9. Cook S, Wenaweser P, Togni M, et al. Intravascular ultrasound in very late DES-stent thrombosis (abstr). J Am Coll Cardiol. 2006;47(suppl B):9B.
10. Moreno R, Fernández C, Hernández R, et al. Drug-eluting stent thrombosis: Results from a pooled analysis including 10 randomized studies. J Am Coll Cardiol. 2005;45(6):954-959.
11. Ellis SG, Colombo A, Grube E, et al. Incidence, timing, and correlates of stent thrombosis with the polymeric paclitaxel drug-eluting stent: A TAXUS II, IV, V, and VI meta-analysis of 3,445 patients followed for up to 3 years. J Am Coll Cardiol. 2007;49(10):1043-1051.
12. Iakovou I, Schmidt T, Bonizzoni E, et al. Incidence, predictors, and outcome of thrombosis after successful implantation of drug-eluting stents. JAMA. 2005;293(17):2126-2130.
13. Cutlip DE, Baim DS, Ho KK, et al. Stent thrombosis in the modern era: A pooled analysis of multicenter coronary stent clinical trials. Circulation. 2001;103(15):1967-1971.
14. Kotani J, Awata M, Nanto S, et al. Incomplete neointimal coverage of sirolimus-eluting stents: Angioscopic findings. J Am Coll Cardiol. 2006;47(10):2108–2111.
15. Cheneau E, Leborgne L, Mintz GS, et al. Predictors of subacute stent thrombosis: Results of a systematic intravascular ultrasound study. Circulation. 2003;108(1):43-47.
16. Colombo A, Hall P, Nakamura S, et al. Intracoronary stenting without anticoagulation achieved with intravascular ultrasound guidance. Circulation. 1995;91(6):1676-1688.
17. Oyabu J, Ueda Y, Ogasawara N, Okada K, Hirayama A, Kodama K. Angioscopic evaluation of neointima coverage: Sirolimus-drug eluting stent versus bare metal stent. Am Heart J. 2006;152(6):1168-1174.
18. Serruys PW, Strauss BH, Beatt KJ, et al. Angiographic follow-up after placement of a self-expanding coronary-artery stent. N Engl J Med. 1991;324(1):13-17.
19. Schatz RA, Baim DS, Leon M, et al. Clinical experience with the Palmaz-Schatz coronary stent. Initial results of a multicenter study. Circulation. 1991:83(1):148-161.
20. Fischman DL, Leon MB, Baim DS, et al. A randomized comparison of coronary-stent placement and balloon angioplasty in the treatment of coronary artery disease. Stent Restenosis Study Investigators. N Engl J Med. 1994;331(8):496-501.
21. Serruys PW, de Jaegere P, Kiemeneij F, et al. A comparison of balloon-expandable-stent implantation with balloon angioplasty in patients with coronary artery disease. Benestent Study Group. N Engl J Med. 1994;331(8):489-495.
22. Leon MD, Baim DS, Gordon P, et al. Clinical and angiographic results from the STent Anticoagulation Regimen Study (STARS) (abstr). Circulation. 1996;94(suppl I):I-685.
23. Levine GN, Bates ER, Blankenship JC, et al. 2011 ACCF/AHA/SCAI Guideline for Percutaneous Coronary Intervention: A report of the American College of Cardiology Foundation/American Heart Association Task Force of Practice Guidelines and the Society for Cardiovascular Angiography and Interventions. J Am Coll Cardiol. 2011;58(24):e44-e122.
24. Bennett CL, Davidson CJ, Raisch DW, Weinberg PD, Bennett RH, Feldman MD. Thrombotic thrombocytopenic purpura associated with ticlopidine in the setting of coronary artery stents and stroke prevention. Arch Intern Med. 1999;159(21):2524-2528.
25. Bertrand ME, Rupprecht HJ, Urban P, Gershlick AH; CLASSICS Investigators. Double-blind study of the safety of clopidogrel with and without a loading dose in combination with aspirin compared with ticlopidine in combination with aspirin after coronary stenting: The clopidogrel aspirin stent international cooperative study (CLASSICS). Circulation. 2000;102(6):624-629.
26. Wang, TH, Bhatt DL, Topol EJ. Aspirin and clopidogrel resistance: An emerging clinical entity. Eur Heart J. 2006;27(6):647-654.
27. Vats HS, Hocking WG, Rezkalla SH. Suspected clopidogrel resistance in a patient with acute stent thrombosis. Nat Clin Pract Cardiovasc Med. 2006;3(4):226-230.
28. Gurbel PA, Becker RC, Mann KG, Steinhubl SR, Michelson AD. Platelet function monitoring in patients with coronary artery disease. J Am Coll Cardiol. 2007;50(19):1822-1834.
29. Fitzgerald DJ, Maree A. Aspirin and clopidogrel resistance. Hematology Am Soc Hematol Educ Program. 2007;2007(1):114-120.
30. Cattaneo M. Resistance to antiplatelet drugs: Molecular mechanisms and laboratory detection. J Thromb Haemost. 2007;5(suppl 1):230-237.
31. Trenk D, Hochholzer W, Fromm MF, et al. Cytochrome P450 2C19 681G>A polymorphism and high on-clopidogrel platelet reactivity associated with adverse 1-year clinical outcome of elective percutaneous coronary intervention with drug-eluting or bare-metal stents. J Am Coll Cardiol. 2008;51(20):1925-1934.
32. Kazui M, Nishiya Y, Ishizuka T, et al. Identification of the human cytochrome P450 enzymes involved in the two oxidative steps in the bioactivation of clopidogrel to its pharmacologically active metabolite. Drug Metab Dispos. 2010;38(1):92-99.
33. Hulot JS, Bura A, Villard E, et al. Cytochrome P450 2C19 loss-of-function polymorphism is a major determinant of clopidogrel responsiveness in healthy subjects. Blood. 2006;108(7):2244-2247.
34. Mega JL, Close SL, Wiviott SD, et al. Cytochrome p-450 polymorphisms and response to clopidogrel. N Engl J Med. 2009;360(4):354-362.
35. U.S. Food and Drug Administration. Plavix (clopidogrel): Reduced effectiveness in patients who are poor metabolizers of the drug. U.S. Food and Drug Administration Website. http://www.fda.gov/Safety/MedWatch/SafetyInformation/SafetyAlertsforHumanMedicalProducts/ucm204256.htm. Updated September 6, 2013. Accessed September 4, 2014.
36. Wiviott SD, Braunwald E, McCabe CH, et al; TRITON-TIMI 38 Investigators. Intensive oral antiplatelet therapy for reduction of ischaemic events including stent thrombosis in patients with acute coronary syndromes treated with percutaneous coronary intervention and stenting in the TRITON-TIMI 38 trial: A subanalysis of a randomised trial. Lancet. 2008;371(9621):1353-1363.
37. Wallentin L, Becker RC, Budaj A, et al; PLATO Investigators. Ticagrelor versus clopidogrel in patients with acute coronary syndromes. N Engl J Med. 2009;361(11):1045-1057.
38. Wallentin L, Varenhorst C, James S, et al. Prasugrel achieves greater and faster P2Y12 receptor-mediated platelet inhibition than clopidogrel due to more efficient generation of its active metabolite in aspirin-treated patients with coronary artery disease. Eur Heart J. 2008;29(1):21-30.
39. Gurbel PA, Bliden KP, Butler K, et al. Randomized double-blind assessment of the ONSET and OFFSET of the antiplatelet effects of ticagrelor versus clopidogrel in patients with stable coronary artery disease: The ONSET/OFFSET study. Circulation. 2009;120(25):2577-2585.
40. Wiviott SD, Trenk D, Frelinger AL, et al; PRINCIPLE-TIMI 44 Investigators. Prasugrel compared with high loading- and maintenance-dose clopidogrel in patients with planned percutaneous coronary intervention: The Prasugrel in Comparison to Clopidogrel for Inhibition of Platelet Activation and Aggregation-Thrombolysis in Myocardial Infarction 44 trial. Circulation. 2007;116(25):2923-2932.
41. Gurbel PA, Bliden KP, Butler K, et al. Response to ticagrelor in clopidogrel nonresponders and responders and effect of switching therapies: The RESPOND study. Circulation. 2010;121(10):1188-1199.
42. Spertus, JA, Kettelkamp R, Vance C, et al. Prevalence, predictors, and outcomes of premature discontinuation of thienopyridine therapy after drug-eluting stent placement: Results from the PREMIER registry. Circulation. 2006;113(24):2803-2809.
43. Sharma AK, Ajani AE, Hamwi SM, et al. Major noncardiac surgery following coronary stenting: When is it safe to operate? Catheter Cardiovasc Interv. 2004;63(2):141-145.
44. Ben-Dor I, Torguson R, Scheinowitz M, et al. Incidence, correlates, and clinical impact of nuisance bleeding after antiplatelet therapy for patients with drug-eluting stents. Am Heart J. 2010;159(5):871-875.
45. Kaluza GL, Joseph J, Lee JR, Raizner ME, Raizner AE. Catastrophic outcomes of noncardiac surgery soon after coronary stenting. J Am Coll Cardiol. 2000;35(5):1288-1294.
46. Airoldi F, Colombo A, Morici N, et al. Incidence and predictors of drug-eluting stent thrombosis during and after discontinuation of thienopyridine treatment. Circulation. 2007;116(7):745-754.
47. Grines CL, Bonow RO, Casey DE Jr, et al; American Heart Association; American College of Cardiology; Society for Cardiovascular Angiography and Interventions; American College of Surgeons; American Dental Association; American College of Physicians. Prevention of premature discontinuation of dual antiplatelet therapy in patients with coronary artery stents: A science advisory from the American Heart Association, American College of Cardiology, Society for Cardiovascular Angiography and Interventions, American College of Surgeons, and American Dental Association, with representation from the American College of Physicians. J Am Coll Cardiol. 2007;49(6):734-739.
Percutaneous coronary intervention (PCI) using coronary artery stent implantation is commonly used to treat symptomatic high-risk and unstable coronary artery disease (CAD). The use of stents has improved the safety and efficacy of PCI by reducing the need for repeat revascularization, reducing acute vessel closure requiring emergent coronary artery bypass graft surgery, and expanding the use of PCI to more complex diseases. Nevertheless, stents carry the risk of sudden thrombotic occlusion or stent thrombosis, particularly during the first several days or weeks after implantation. In turn, stent thrombosis can lead to acute myocardial infarction (MI) and a mortality rate > 25%.1,2
This article highlights 2 cases of patients with stent thrombosis and discusses its pathophysiology, clinical features, and risk-avoidance strategies. Given the high prevalence of CAD and ubiquitous PCI procedures in the U.S. health care system, it is essential that not only cardiologists, but all clinicians and health care providers who care for patients with coronary stents understand how to help prevent and manage this life-threatening clinical entity.1
Case 1
A 56-year-old man presented to his primary care physician with exertion-related angina. The patient had a history of type 2 diabetes mellitus, dyslipidemia, systemic hypertension, obesity, and CAD status post MI in 2002 treated with a bare metal stent (BMS) to the left circumflex coronary artery (LCx). A stress myocardial perfusion imaging with 99mTc-sestamibi revealed moderate reversible exercise-induced myocardial ischemia involving the inferior and inferoapical wall segments of the left ventricle with associated hypokinesia.
Coronary angiography revealed nonsignificant disease of the left anterior descending artery (LAD) and LCx, a patent LCx stent, and a 95% mid-right coronary artery (RCA) obstruction with delayed (TIMI grade 2) antegrade flow. The distal right posterior descending artery filled via left to right collaterals from the LAD.
Percutaneous coronary intervention was performed on the RCA lesion 8 days after the patient was started on dual antiplatelet therapy (DAPT) with aspirin 81 mg and clopidogrel 75 mg (including 300 mg loading dose on the day of the diagnostic angiogram). The mid RCA was treated with a drug-eluting stent (DES) and a BMS in a nonoverlapping fashion with an excellent angiographic result. The patient was instructed to continue DAPT with aspirin 325 mg daily and clopidogrel 75 mg daily for 12 months.
Three days post PCI, the patient arrived at the emergency department with angina of 1-hour duration associated with shortness of breath and diaphoresis. He reported strict adherence to DAPT.
Initial vital signs were normal. The electrocardiogram (ECG) showed ST segment elevation (1-2 mm) on leads III, aVF, and V5 to V6, suggestive of an acute inferolateral injury pattern for which emergent coronary angiography was performed. Angiography showed a 100% proximal RCA occlusion at the proximal edge of the most proximal stent with absence of any antegrade flow beyond the occlusion (TIMI grade 0 flow). This finding was diagnostic of definite angiographic subacute stent thrombosis. The patient underwent successful aspiration thrombectomy, balloon angioplasty, and restoration of normal TIMI grade 3 flow with a door-to-balloon time of 86 minutes.
Because stent thrombosis is relatively unexpected after an excellent angiographic result and DAPT adherence, the possibility of clopidogrel resistance was considered as a major contributor for the thrombotic event. Platelet aggregation tests showed adequate prolongation of collagen/epinephrine (COL-EPI) > 300 seconds (normal: 81-153 seconds), but inadequate prolongation of collagen/adenosindiphosphate (COL-ADP) of 109 seconds (normal: 53-105 seconds) while on clopidogrel. Therefore, the patient was switched to prasugrel.
The patient was discharged home after 5 days of observation at the cardiac care unit without any post-MI complications. During a follow-up appointment 1 month after discharge, he was clinically stable and free of cardiovascular symptoms. Workup performed for acquired or inherited thrombophilia was negative. He continued taking DAPT (daily aspirin 325 mg orally and prasugrel 10 mg orally) for 12 months. After completing 12 months of DAPT, he was maintained on aspirin 81 mg daily. At 24 months’ follow-up, he remained free of recurrent angina with no further cardiovascular events.
Case 2
An 84-year-old man with a medical history of dyslipidemia, paroxysmal atrial fibrillation, previous stroke, and peptic ulcer disease was brought to the emergency department following an episode of near syncope in the early morning hours. The patient revealed that he had experienced neck pain since midnight. The 12-lead ECG showed normal sinus rhythm with 2 mm ST segment elevation in leads II, III, aVF, V5-V6, and ST segment depression in V2, and Q waves in inferior leads. A right-sided ECG showed ST segment elevation in V4, suggestive of right ventricle infarction.
The patient remained hypotensive (83/49 mm Hg) despite isotonic fluid administration (about 1.5-2.0 liters of 0.9 normal saline at 999 mL/h). A dopamine drip for persistent hypotension was started, and he was taken emergently to the catheterization laboratory for primary PCI. Coronary angiography showed no significant left CAD and a 100% mid-RCA occlusion with faint left-to-right collaterals. After aspiration thrombectomy, bare metal RCA stenting was performed. Transient no-reflow was treated with intracoronary nicardipine and nitroglycerin. The patient continued to be in shock, and an intra-aortic balloon pump was inserted and 1:1 counterpulsation was initiated.
Following admission to the coronary care unit, the patient’s mean arterial pressure improved. Inotropes were weaned off 2 days after PCI, and the intra-aortic balloon pump was removed. During his stay, the post-MI course was uneventful except for an episode of asymptomatic paroxysmal atrial flutter and nonspecific back dermatitis attributed to a prolonged recumbent position.
The patient was transferred to the internal medicine ward for medical therapy optimization and the initiation of low-intensity cardiac rehabilitation. After 2 days on the ward, discharge planning was initiated. However, he developed an episode of atrial fibrillation with fast ventricular response. Metoprolol 5 mg IV bolus was given, and the ventricular rate was controlled. At that point, the dose of long-acting beta-blocker (metoprolol succinate) was optimized, he was started on full-dose anticoagulation (warfarin), and clopidogrel was discontinued. Two days later, the patient reported back pruritus, and an erythematous raised rash on his back spreading to the torso was noticed. An aspirin allergy was suspected as the trigger for the rash, thus aspirin was also discontinued.
Three days later, the patient developed recurrent neck pain (angina) with radiation to his shoulders and left arm. The ECG revealed re-elevation of the ST segment (inferior, posterior, and lateral leads). He received reloading of clopidogrel 600 mg and aspirin 325 mg. Also, an eptifibatide IV bolus followed by an infusion was given for immediate antiplatelet action. He was transferred for emergent coronary angiography with suspected subacute stent thrombosis.
Upon arrival to the catheterization lab, the patient was awake and alert but in mild respiratory distress. Intravenous dopamine was started due to hypotension (systolic blood pressure was about 85 mm Hg). Limited RCA angiography showed a large clot burden with a partially thrombosed stent and TIMI grade 3 flow. After intracoronary eptifibatide and nicardipine were given, successful aspiration thrombectomy was performed twice with partial removal of thrombus. In-stent high-pressure balloon angioplasty was performed and optimal stenting was confirmed by intravascular ultrasound (IVUS) criteria. However, a residual layered thrombus along the distal stent edge was noticed. The patient tolerated the procedure without complications.
Dual antiplatelet therapy with aspirin and clopidogrel for 12 months was recommended. The eptifibatide infusion was continued for 48 hours. The jaw pain, shortness of breath, and ECG changes disappeared, but the patient remained on vasopressors for the following 7 days.
Around 1 week after the stent thrombosis event, the patient was found pulseless. Advanced cardiopulmonary resuscitation was started. ST segment elevation in lead II was noted on the cardiac monitor. There was no return of spontaneous circulation after 20 minutes, and the patient was pronounced dead. The autopsy revealed a patent RCA stent without evidence of occlusion, a large transmural inferior MI, left ventricular rupture, and hemopericardium.
Discussion
Stent thrombosis is an uncommon complication after coronary stent implantation. Based on the Academic Research Consortium criteria, definite stent thrombosis is defined as a clinical event with symptoms suggestive of an acute coronary syndrome (ACS) with angiography or pathology that confirms the presence of stent thrombosis.2 Probable stent thrombosis is defined as an unexplained death within 30 days or MI involving the territory of the target vessel without angiographic confirmation of stent thrombosis.2 Finally, possible stent thrombosis is any unexplained death after 30 days.2
Based on timing, stent thrombosis is divided by acute (< 24 hours post stent implantation), subacute (24 hours to 30 days post stent implantation), late (> 30 days post stent implantation), and very late (> 12 months post stent implantation).3 However, most cases (up to 60%) occur within the first 30 days after placement, irrespective of stent type.4
The incidence of subacute stent thrombosis is reported to approach 1% during the first 30 days postprocedure but may be as high as 5% or 10% depending on associated clinical and angiographic variables (Table 1).5 The strongest clinical predictors of stent thrombosis are premature cessation of antiplatelet therapy, renal insufficiency, diabetes mellitus, and ACS.2,6 Lesion and procedural characteristics associated with increased risk of stent thrombosis include bifurcation lesions, longer stent length, multiple implanted stents, stent underexpansion, and/or stent malapposition.6-9 Stent type (drug or non–drug-eluting) has no impact on the risk of stent thrombosis during the first 30 days postprocedure.10,11
The clinical events related to late stent thrombosis, although rare, carry a mortality rate of up to 45%.12 The specific risk factors for late and very late stent thrombosis are less well defined but relate to delayed neointimal coverage, ongoing vessel inflammation, and the development of neoatherosclerosis within stents.13,14
Rationale for the Use of Dual Antiplatelet Regimen
Stent thrombosis is a platelet-mediated process related to a heightened state of systemic and intracoronary thrombogenicity and inflammation.15 Stent under-expansion enhances abnormal shear stress, which explains as many as 80% of these events.13,15,16 Stent thrombosis also has been frequently related to inadequate neointimal coverage.14 Angioscopic studies, especially with DES, suggest that stent endothelialization is delayed or incomplete, observing a correlation between the areas of uncovered stent surface and thrombosis.14,17
In the early days of coronary stenting, during the 1990s, the risk of acute and subacute stent thrombosis approached 20%.18,19 Initial attempts to reduce the risk included combining aspirin and warfarin, but at the expense of a marked increase in bleeding complications and prolonged hospital stays.20,21 In 1995, it became clear through the pivotal observations of Colombo and colleagues that incomplete expansion of the stent (documented by IVUS) was a major contributor to the risk of stent thrombosis.16 By using noncompliant balloons at high pressure (14-20 atmospheres) for stent postdilatation combined with DAPT (aspirin and ticlopidine), the high rates of early stent thrombosis were markedly reduced to the current level of 1% to 2%.16
Colombo and colleagues’ observations were prospectively evaluated in the Stent Anticoagulation Regimen Study (STARS) trial.22 Patients who underwent successful stenting were randomized to aspirin alone, aspirin and warfarin, or aspirin and ticlopidine. The STARS trial showed convincingly that the combination of aspirin and ticlopidine was superior to the other 2 regimens, reducing the stent thrombosis rate to only 0.5% (compared with 2.7% for aspirin and warfarin, and 3.6% for aspirin alone).22 Afterward, DAPT became the standard of care following coronary stenting.23
Although ticlopidine was the first widely used thienopyridine for the prevention of stent thrombosis, hematologic adverse events (AEs) (eg, neutropenia, thrombotic thrombocytopenia purpura) limited its use.24 Consequently, ticlopidine was replaced with clopidogrel, which seemed to offer similar efficacy but significantly fewer AEs.25
The current American College of Cardiology/American Heart Association/Society for Cardiovascular Angiography and Interventions (ACC/AHA/SCAI) guidelines for the prevention of ST after coronary stent implantation state that after PCI:
- Aspirin use should be continued indefinitely.
- The duration of adenosine diphosphate antagonists depends on the stent type (BMS or DES) and the indication for implantation (ACS or non-ACS).
a. Patients receiving a stent (BMS or DES) for ACS therapy should be given 1 of the following for at least 12 months:
i. Clopidogrel 75 mg daily
ii. Prasugrel 10 mg daily
iii. Ticagrelor 90 mg twice daily
b. In patients receiving DES for a non-ACS indication, clopidogrel should be given for at least 12 months if the patient is not at high risk for bleeding.
c. In patients receiving BMS for a non-ACS indication, clopidogrel should be given for a minimum of 1 month and ideally up to 12 months.23
Clopidogrel Hyporesponse
As shown in case 1, stent thrombosis may still occur in a patient on DAPT because of individual variability in platelet response to clopidogrel.5 Clopidogrel hyporesponse, also known as clopidogrel resistance, has been recognized as clinically significant because of its prevalence and association with poor outcomes.5 Its prevalence may range between 4% and 30%, although the definitions of clopidogrel hyporesponse varied between studies.26
Clopidogrel hyporesponse is defined as an inadequate inhibition of platelet function measured by nonspecific ex-vivo laboratory methods.27,28 The relationship between clopidogrel resistance (nonresponders), stent thrombosis, and ischemic events has been clearly established.5,29
Given the devastating consequences of stent thrombosis, efforts were directed to identify those patients at highest risk. One such effort has been focused on the measurement of platelet function, allowing for the identification of patients who do not respond adequately to antiplatelet therapy.15,28,30,31 However, the treatment of high-residual platelet reactivity as confirmed by laboratory assessment has not shown to clinically correlate with any benefit in the prevention of ST.6,15,29-31 Therefore, the current ACC/AHA/SCAI PCI guidelines do not recommend the routine clinical use of platelet function testing to screen patients treated with clopidogrel who are undergoing PCI.23
Clopidogrel is a prodrug, metabolized to its active form via the cytochrome P450 enzyme system before it can inhibit platelet function.32 Accordingly, certain genetic variation in enzyme activity, or polymorphisms, would be expected to influence its clinical effectiveness.33,34 The most common of these polymorphisms, CYP2C19*2, has been associated (in vitro) with reduced concentrations of active clopidogrel metabolites and with diminished platelet inhibition.35,36 As a result, the FDA has added a safety alert to the prescribing information for clopidogrel concerning how genetic differences in the metabolism of this agent can affect its effectiveness, ways to test for these genetic differences, and advice concerning alternative dosing strategies or use of other medications in poor metabolizers of clopidogrel.37 Although the routine clinical use of genetic testing to screen patients treated with clopidogrel who are undergoing PCI is not recommended, it may be considered in patients undergoing elective high-risk PCI procedures (eg, unprotected left main, last patent coronary artery, or bifurcating left main).23
The newer inhibitors of ADP-induced platelet activation, prasugrel and ticagrelor, are not prodrugs, and thus, their action is not affected by this genetic variability. Accordingly, these drugs have shown a more consistent, stronger, and faster inhibition of platelet aggregation compared with clopidogrel.36-39 In the pivotal trials (TRITON-TIMI 38 and PLATO), these agents have also been shown to be more effective in reducing the incidence of stent thrombosis.36,37,40,41 Therefore, in cases where clopidogrel resistance/hyporesponse is suspected in the setting of DAPT, such as stent thrombosis, guidelines recommend the use of 1 of these agents.23
Premature Discontinuation of Antiplatelet Therapy
As illustrated in case 2, premature discontinuation of antiplatelet therapy may be fatal, as it is associated with a marked increase in the risk of stent thrombosis. Indeed, premature discontinuation of DAPT is the leading independent predictor for stent thrombosis.12,42,43 Premature discontinuation of DAPT is defined when one or both agents (aspirin, ADP-antagonists) are suspended within 30 days of BMS placement or within 1 year of DES placement. In the case of DES, the first 6 months after implantation seem to be most critical. In a large observational study of patients treated with DES, stent thrombosis occurred in 29% of those patients in whom antiplatelet therapy was prematurely discontinued.12
In order to minimize the risk of premature DAPT discontinuation, one should address its causes. There are patient- and physician-related factors that may influence an early discontinuation of aspirin, thienopyridine, or both agents. Patient-related factors were identified in the PREMIER registry, including older age, not having completed high school, not being married, and/or not seeking health care because of costs.42 Another important but often overlooked factor that has an impact on adherence with prolonged DAPT post-DES implantation is nuisance or superficial bleeding.44 Physician-related factors include not providing discharge instructions for medication use and ill-advised instructions given by health care providers to discontinue therapy before procedures with a low risk of bleeding (eg, dental cleaning, cataract surgery, colonoscopy, skin biopsy).42
In addition, the perioperative management of DAPT during the first several weeks after coronary stenting has been shown to critically influence outcomes. In a study by Sharma and colleagues, fatal cases of stent thrombosis occurred after the discontinuation of antiplatelet therapy for noncardiac surgery among patients with BMS implantation within the past 90 days.43
In selected cases when a noncardiac procedure cannot be delayed for 1 year, recognizing the impact of the specific timing for the discontinuation of the antiplatelet regimen is essential. Kaluza and colleagues reported on 40 patients treated with BMS who underwent noncardiac surgery within 6 weeks of the stent implantation.45 Seven patients had an MI, of which 6 were fatal. Stent thrombosis was presumed to be the cause of all MIs. In 5 of 7 cases, ticlopidine was withheld before surgery.45
All clinicians should be aware of the following recommendations to avoid catastrophic cardiovascular complications related to premature discontinuation of DAPT during the perioperative setting:
- Elective procedures should be deferred until patients have completed an appropriate course of thienopyridine therapy (12 months after DES and a minimum of 4 weeks for BMS implantation).
- For those patients treated with DES who are to undergo a nonelective procedure that mandates discontinuation of thienopyridine therapy, the possibility of procedure postponement for completion of DAPT for at least 6 months should be judiciously deliberated. If the procedure cannot be postponed, aspirin should be continued if at all possible and the thienopyridine restarted as soon as possible after the procedure.42,46,47
Conclusion
Stent thrombosis is a rare but devastating complication of coronary stent implantation. Although it can occur at any time after stent placement, the majority of events occur within the first month. The use of optimal stenting techniques and adherence to DAPT are required to minimize the risk of stent thrombosis. Several clinical and procedural predictors have been related to an increased risk of stent thrombosis. The premature cessation of DAPT is the most important risk factor for stent thrombosis.
All physicians should ensure patients are properly and thoroughly educated about the reasons they are prescribed DAPT and the significant risks associated with prematurely discontinuing such therapy. All clinicians, especially noncardiologists, should realize the importance of close communication with a cardiologist or interventional cardiologist in situations when premature discontinuation is being considered for a specific reason.
Table 2 summarizes a framework of the most relevant factors that should be taken into account before, during, and after stent implantation, both by interventional cardiologists, as well as by all clinicians involved in the care of the patient. Given current procedural volumes (> 1 million PCI procedures are performed in the U.S. annually) and because the risk of stent thrombosis is both time and treatment dependent, it is of paramount importance that, not only cardiologists, but all physicians know the impact of stent thrombosis in their patients and how to avoid situations that may increase its risk.1 Team-approach decisions about antiplatelet therapy after stent placement, especially within the first 12 months, and a patient-centered mind-set are indispensable to optimize patient outcomes.
Author disclosures
The authors report no actual or potential conflicts of interest with regard to this article.
Disclaimer
The opinions expressed herein are those of the authors and do not necessarily reflect those of Federal Practitioner, Frontline Medical Communications Inc., the U.S. Government, or any of its agencies. This article may discuss unlabeled or investigational use of certain drugs. Please review complete prescribing information for specific drugs or drug combinations—including indications, contraindications, warnings, and adverse effects—before administering pharmacologic therapy to patients.
1. Ryan J, Cohen DJ. Are drug-eluting stents cost-effective? It depends on whom you ask. Circulation. 2006;114(16):1736-1744.
2. Cutlip DE, Windecker S, Mehran R, et al; Academic Research Consortium. Clinical end points in coronary stent trials: A case for standardized definitions. Circulation. 2007;115(17):2344-2351.
3. Yusuf S, Zhao F, Mehta SR, Chrolavicius S, Tognoni G, Fox KK; Clopidogrel in Unstable Angina to Prevent Recurrent Events Trial Investigators. Effects of clopidogrel in addition to aspirin in patients with acute coronary syndromes without ST-segment elevation. N Engl J Med. 2001;345(7):494-502.
4. Palmerini T, Kirtane AJ, Serruys PW, et al. Stent thrombosis with everolimus-eluting stents: Meta-analysis of comparative randomized controlled trials. Circ Cardiovasc Interv. 2012;5(3):357-364.
5. Angiolillo DJ, Fernandez-Ortiz A, Bernardo E, et al. Variability in individual responsiveness to clopidogrel: Clinical implications, management, and future perspectives. J Am Coll Cardiol. 2007;49(14):1505-1516.
6. Moussa I, Di Mario C, Reimers B, Akiyama T, Tobis J, Colombo A. Subacute stent thrombosis in the era of intravascular ultrasound-guided coronary stenting without anticoagulation: Frequency, predictors and clinical outcome. J Am Coll Cardiol. 1997;29(1):6-12.
7. Fujii K, Carlier SG, Mintz GS, et al. Stent underexpansion and residual reference segment stenosis are related to stent thrombosis after sirolimus-eluting stent implantation: An intravascular ultrasound study. J Am Coll Cardiol. 2005;45(7):995-998.
8. Uren NG, Schwarzacher SP, Metz JA, et al; POST Registry Investigators. Predictors and outcomes of stent thrombosis: An intravascular ultrasound registry. Eur Heart J. 2002;23(2):124-132.
9. Cook S, Wenaweser P, Togni M, et al. Intravascular ultrasound in very late DES-stent thrombosis (abstr). J Am Coll Cardiol. 2006;47(suppl B):9B.
10. Moreno R, Fernández C, Hernández R, et al. Drug-eluting stent thrombosis: Results from a pooled analysis including 10 randomized studies. J Am Coll Cardiol. 2005;45(6):954-959.
11. Ellis SG, Colombo A, Grube E, et al. Incidence, timing, and correlates of stent thrombosis with the polymeric paclitaxel drug-eluting stent: A TAXUS II, IV, V, and VI meta-analysis of 3,445 patients followed for up to 3 years. J Am Coll Cardiol. 2007;49(10):1043-1051.
12. Iakovou I, Schmidt T, Bonizzoni E, et al. Incidence, predictors, and outcome of thrombosis after successful implantation of drug-eluting stents. JAMA. 2005;293(17):2126-2130.
13. Cutlip DE, Baim DS, Ho KK, et al. Stent thrombosis in the modern era: A pooled analysis of multicenter coronary stent clinical trials. Circulation. 2001;103(15):1967-1971.
14. Kotani J, Awata M, Nanto S, et al. Incomplete neointimal coverage of sirolimus-eluting stents: Angioscopic findings. J Am Coll Cardiol. 2006;47(10):2108–2111.
15. Cheneau E, Leborgne L, Mintz GS, et al. Predictors of subacute stent thrombosis: Results of a systematic intravascular ultrasound study. Circulation. 2003;108(1):43-47.
16. Colombo A, Hall P, Nakamura S, et al. Intracoronary stenting without anticoagulation achieved with intravascular ultrasound guidance. Circulation. 1995;91(6):1676-1688.
17. Oyabu J, Ueda Y, Ogasawara N, Okada K, Hirayama A, Kodama K. Angioscopic evaluation of neointima coverage: Sirolimus-drug eluting stent versus bare metal stent. Am Heart J. 2006;152(6):1168-1174.
18. Serruys PW, Strauss BH, Beatt KJ, et al. Angiographic follow-up after placement of a self-expanding coronary-artery stent. N Engl J Med. 1991;324(1):13-17.
19. Schatz RA, Baim DS, Leon M, et al. Clinical experience with the Palmaz-Schatz coronary stent. Initial results of a multicenter study. Circulation. 1991:83(1):148-161.
20. Fischman DL, Leon MB, Baim DS, et al. A randomized comparison of coronary-stent placement and balloon angioplasty in the treatment of coronary artery disease. Stent Restenosis Study Investigators. N Engl J Med. 1994;331(8):496-501.
21. Serruys PW, de Jaegere P, Kiemeneij F, et al. A comparison of balloon-expandable-stent implantation with balloon angioplasty in patients with coronary artery disease. Benestent Study Group. N Engl J Med. 1994;331(8):489-495.
22. Leon MD, Baim DS, Gordon P, et al. Clinical and angiographic results from the STent Anticoagulation Regimen Study (STARS) (abstr). Circulation. 1996;94(suppl I):I-685.
23. Levine GN, Bates ER, Blankenship JC, et al. 2011 ACCF/AHA/SCAI Guideline for Percutaneous Coronary Intervention: A report of the American College of Cardiology Foundation/American Heart Association Task Force of Practice Guidelines and the Society for Cardiovascular Angiography and Interventions. J Am Coll Cardiol. 2011;58(24):e44-e122.
24. Bennett CL, Davidson CJ, Raisch DW, Weinberg PD, Bennett RH, Feldman MD. Thrombotic thrombocytopenic purpura associated with ticlopidine in the setting of coronary artery stents and stroke prevention. Arch Intern Med. 1999;159(21):2524-2528.
25. Bertrand ME, Rupprecht HJ, Urban P, Gershlick AH; CLASSICS Investigators. Double-blind study of the safety of clopidogrel with and without a loading dose in combination with aspirin compared with ticlopidine in combination with aspirin after coronary stenting: The clopidogrel aspirin stent international cooperative study (CLASSICS). Circulation. 2000;102(6):624-629.
26. Wang, TH, Bhatt DL, Topol EJ. Aspirin and clopidogrel resistance: An emerging clinical entity. Eur Heart J. 2006;27(6):647-654.
27. Vats HS, Hocking WG, Rezkalla SH. Suspected clopidogrel resistance in a patient with acute stent thrombosis. Nat Clin Pract Cardiovasc Med. 2006;3(4):226-230.
28. Gurbel PA, Becker RC, Mann KG, Steinhubl SR, Michelson AD. Platelet function monitoring in patients with coronary artery disease. J Am Coll Cardiol. 2007;50(19):1822-1834.
29. Fitzgerald DJ, Maree A. Aspirin and clopidogrel resistance. Hematology Am Soc Hematol Educ Program. 2007;2007(1):114-120.
30. Cattaneo M. Resistance to antiplatelet drugs: Molecular mechanisms and laboratory detection. J Thromb Haemost. 2007;5(suppl 1):230-237.
31. Trenk D, Hochholzer W, Fromm MF, et al. Cytochrome P450 2C19 681G>A polymorphism and high on-clopidogrel platelet reactivity associated with adverse 1-year clinical outcome of elective percutaneous coronary intervention with drug-eluting or bare-metal stents. J Am Coll Cardiol. 2008;51(20):1925-1934.
32. Kazui M, Nishiya Y, Ishizuka T, et al. Identification of the human cytochrome P450 enzymes involved in the two oxidative steps in the bioactivation of clopidogrel to its pharmacologically active metabolite. Drug Metab Dispos. 2010;38(1):92-99.
33. Hulot JS, Bura A, Villard E, et al. Cytochrome P450 2C19 loss-of-function polymorphism is a major determinant of clopidogrel responsiveness in healthy subjects. Blood. 2006;108(7):2244-2247.
34. Mega JL, Close SL, Wiviott SD, et al. Cytochrome p-450 polymorphisms and response to clopidogrel. N Engl J Med. 2009;360(4):354-362.
35. U.S. Food and Drug Administration. Plavix (clopidogrel): Reduced effectiveness in patients who are poor metabolizers of the drug. U.S. Food and Drug Administration Website. http://www.fda.gov/Safety/MedWatch/SafetyInformation/SafetyAlertsforHumanMedicalProducts/ucm204256.htm. Updated September 6, 2013. Accessed September 4, 2014.
36. Wiviott SD, Braunwald E, McCabe CH, et al; TRITON-TIMI 38 Investigators. Intensive oral antiplatelet therapy for reduction of ischaemic events including stent thrombosis in patients with acute coronary syndromes treated with percutaneous coronary intervention and stenting in the TRITON-TIMI 38 trial: A subanalysis of a randomised trial. Lancet. 2008;371(9621):1353-1363.
37. Wallentin L, Becker RC, Budaj A, et al; PLATO Investigators. Ticagrelor versus clopidogrel in patients with acute coronary syndromes. N Engl J Med. 2009;361(11):1045-1057.
38. Wallentin L, Varenhorst C, James S, et al. Prasugrel achieves greater and faster P2Y12 receptor-mediated platelet inhibition than clopidogrel due to more efficient generation of its active metabolite in aspirin-treated patients with coronary artery disease. Eur Heart J. 2008;29(1):21-30.
39. Gurbel PA, Bliden KP, Butler K, et al. Randomized double-blind assessment of the ONSET and OFFSET of the antiplatelet effects of ticagrelor versus clopidogrel in patients with stable coronary artery disease: The ONSET/OFFSET study. Circulation. 2009;120(25):2577-2585.
40. Wiviott SD, Trenk D, Frelinger AL, et al; PRINCIPLE-TIMI 44 Investigators. Prasugrel compared with high loading- and maintenance-dose clopidogrel in patients with planned percutaneous coronary intervention: The Prasugrel in Comparison to Clopidogrel for Inhibition of Platelet Activation and Aggregation-Thrombolysis in Myocardial Infarction 44 trial. Circulation. 2007;116(25):2923-2932.
41. Gurbel PA, Bliden KP, Butler K, et al. Response to ticagrelor in clopidogrel nonresponders and responders and effect of switching therapies: The RESPOND study. Circulation. 2010;121(10):1188-1199.
42. Spertus, JA, Kettelkamp R, Vance C, et al. Prevalence, predictors, and outcomes of premature discontinuation of thienopyridine therapy after drug-eluting stent placement: Results from the PREMIER registry. Circulation. 2006;113(24):2803-2809.
43. Sharma AK, Ajani AE, Hamwi SM, et al. Major noncardiac surgery following coronary stenting: When is it safe to operate? Catheter Cardiovasc Interv. 2004;63(2):141-145.
44. Ben-Dor I, Torguson R, Scheinowitz M, et al. Incidence, correlates, and clinical impact of nuisance bleeding after antiplatelet therapy for patients with drug-eluting stents. Am Heart J. 2010;159(5):871-875.
45. Kaluza GL, Joseph J, Lee JR, Raizner ME, Raizner AE. Catastrophic outcomes of noncardiac surgery soon after coronary stenting. J Am Coll Cardiol. 2000;35(5):1288-1294.
46. Airoldi F, Colombo A, Morici N, et al. Incidence and predictors of drug-eluting stent thrombosis during and after discontinuation of thienopyridine treatment. Circulation. 2007;116(7):745-754.
47. Grines CL, Bonow RO, Casey DE Jr, et al; American Heart Association; American College of Cardiology; Society for Cardiovascular Angiography and Interventions; American College of Surgeons; American Dental Association; American College of Physicians. Prevention of premature discontinuation of dual antiplatelet therapy in patients with coronary artery stents: A science advisory from the American Heart Association, American College of Cardiology, Society for Cardiovascular Angiography and Interventions, American College of Surgeons, and American Dental Association, with representation from the American College of Physicians. J Am Coll Cardiol. 2007;49(6):734-739.
Imaging Use in Focal Rhabdomyolysis of the Left Shoulder
Rhabdomyolysis involves the breakdown of skeletal muscle with the release of intracellular contents into the extracellular space and circulation.1 Diffuse rhabdomyolysis has been found in athletes due to overexertion. However, focal rhabdomyolysis is rare.2,3 The clinical presentation of focal rhabdomyolysis is subtle and nonspecific, with swelling, vague pain, weakness, fatigue, and tea-colored urine.
Early recognition and prompt management are crucial to prevent complications such as compression syndrome, acute renal failure, disseminated intravascular coagulation, cardiac dysrhythmia, or even cardiac arrest. Sonography and magnetic resonance imaging (MRI) can, therefore, be a complementary part of the diagnosis and assessment of the extent of rhabdomyolysis.4-7
Case History
The patient was a 34-year-old white man with a history of polysubstance abuse who presented to the emergency department (ED) with numbness and weakness in the left arm and hand, pain in the left side of his neck, and 3 days of intermittent amnesia with confusion. He had used IV heroin about 2 weeks prior to admission and used tobacco and alcohol daily. He reported no current medications or known allergies. The patient was in a monogamous relationship with a same-sex partner.
On physical examination, vital signs were within normal limits. He was in distress, confused, and disoriented as to time and place. An extremity examination revealed 1/5 strength in the extensors of the left elbow, left wrist, and left fingers with normal strength noted in the right upper extremity as well as the lower extremities. No sensory deficits were noted. The patient’s skin was warm and dry. Remarkable laboratory findings included creatine kinase (CK) 1,744 U/L, creatinine (Cr) 1.9 mg/dL, ALT 1,065 U/L, AST 319 U/L, ALP 159 U/L. A urine toxicology screen was positive for cocaine and opiates, and the urine analysis dip was negative for red blood cells, white blood cells, and protein. A differential diagnosis favored a left arm inflammatory reaction to IV drugs, although rhabdomyolysis was questioned.
A neurology consult was obtained, and a bedside electroencephalography test was performed in the ED by the neurologist, showing mild left occipital slow wave abnormality with no epileptiform discharges. A chest X-ray and computed tomography (CT) scan of the head and cervical spine were unremarkable, other than incidental mild prominence of the ventricles.
Over the next 24 hours, the patient was hydrated with IV normal saline without bicarbonate. His altered mental status, urine output, and biochemical abnormalities returned to normal, except for the serum CK, which decreased to 917 U/L. He had minimal improvement in his left upper extremity nerve palsy symptoms; however, he was deemed to be stable for discharge with follow-up in the clinic.
Instead of a clinic follow-up, the patient returned to the ED 7 days later, with progressive weakness of the left arm, forearm, and wrist. The patient noted that his weakness was so significant that he had to move his left arm with his right arm. He also reported extremity swelling and increasing paresthesias involving the lateral aspect of his left arm and hand, dizziness, and left neck pain. A physical examination revealed 3/5 strength at the left deltoid and left triceps, and 0/5 strength in the left fingers and grip. Remeasurement of CK was 54 U/L and Cr was 0.9 mg/dL. Compartment pressures were not measured.
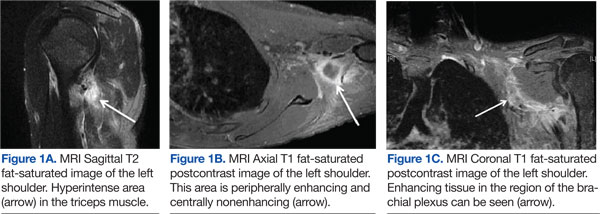
Magnetic resonance imaging using multiplanar spin echo T1 and fast spin T2 weighted and post-IV 16cc Omniscan contrast sequences of the left shoulder were performed, showing multiple patchy T2 hyperintense focal areas with peripheral enhancement in the muscles of the posterior shoulder and in the tissues adjacent to the brachial plexus in the neck and shoulder (Figures 1A, 1B, and 1C). Sonography with matrix array linear 6-15 MH3 transducer was performed, which demonstrated patchy focal hypoechoic areas of muscle with enlarged, thickened, and disrupted muscle, representing devitalized muscle without any drainable fluid collection or abscess (Figures 2A, 2B, 2C, and 2D).
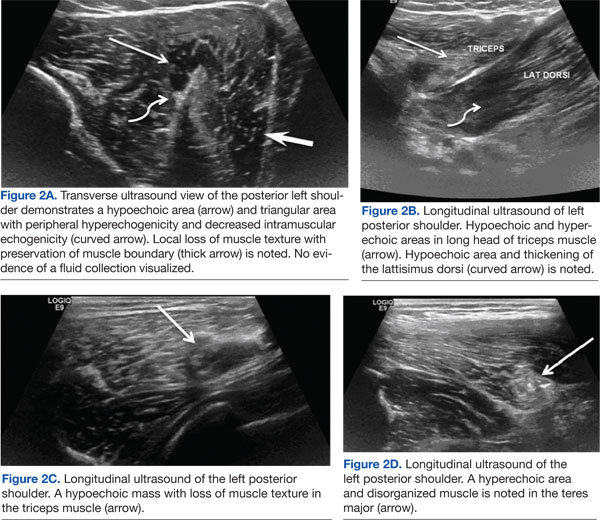
Magnetic resonance imaging and magnetic resonance angiogram scans of the brain and cervical spine with and without contrast were unremarkable. At that time, a definitive diagnosis was made of focal rhabdomyolysis and compressive neuropathy of the brachial plexus posterior cord, leading to brachial plexopathy of the left shoulder.
The patient was treated with hydration, a left arm sling, elevated left arm, and ibuprofen 600 mg qid to reduce inflammation. His swelling decreased markedly, and there was a slight improvement in pain and mobility at a 2-week neurology clinic follow-up. The patient lost contact after that.
Discussion
Rhabdomyolysis is caused by diverse etiologies. Most commonly, it is generalized and occurs due to overexertion, crush injury, steroid use, metabolic abnormalities, and certain medications and illicit drugs.1,2 The most likely etiology of rhabdomyolysis in patients presenting to the ED without significant trauma is of substance abuse, especially with ethanol, heroin, amphetamines, cocaine, and other sedatives or stimulants.1-3 The patient presented in this case study had a history of drug abuse, with a positive urine toxicology screen for cocaine and opiates. He had been intermittently confused and amnesic for 3 days prior to presentation, during which he may have been lying on his shoulder for a prolonged period.
Focal rhabdomyolysis and acute compression at the posterior shoulder leading to compressive brachial plexopathy is rare, with only 3 cases reported in the literature, all occurring with IV drug use.1-3 This patient had compression of the brachial plexus posterior cord from rhabdomyolysis and prolonged immobilization. Intravenous drug abusers may delay medical care due to perceived illicit drug effects and frequently present to the ED confused, agitated, or obtunded. Acute extremity swelling, a palpable lump, and pain can be due to various etiologies, such as trauma, fluid collection, muscle tear, myopathy, venous thrombosis, neoplasm, or rhabdomyolysis.
Diagnosis of nontraumatic rhabdomyolysis depends on clinical history and biochemical tests, such as serum CK and urine myoglobin.1,8 Creatine kinase is present in large quantities in the myocytes and is 100% sensitive as a marker for rhabdomyolysis.1,8 Creatine kinase may increase acutely > 1,000 U/L, suggesting muscle lysis and necrosis as etiology for pain as opposed to other causes such as hematomas, abscesses, or venous thrombi.1,9 Serum CK decreases rapidly at a rate of 39% per day, and it may normalize by the time a patient presents for medical care.1,10-12 Imaging plays a significant complimentary role. During the patient’s second ED presentation, the CK was normal at 54 U/L, whereas ultrasound and MRI findings were suggestive of focal muscle abnormalities.
Although there are diverse etiologies of rhabdomyolysis, the ultimate consequences of rhabdomyolysis are muscle cell membrane injury, metabolism malfunction, and destruction of the myofibril, resulting in inflammatory changes, such as muscle edema, hemorrhage, and myonecrosis and disruption of muscle fibers.1,2,8,9,13 This may cause an alteration in muscle size, shape, and echogenicity on sonography and abnormal signal intensity on MRI.13 The sensitivity of MRI in the detection of muscle involvement is higher than that of CT or ultrasound due to the high soft tissue contrast.4,13,14 Specificity of all 3 modalities is low and not reported.
Although the sensitivity of ultrasound is lower than that of MRI, use of ultrasound in neuromuscular evaluation has been increasing recently due to technical refinements. Ultrasound can be effectively used as a first-line screening modality, especially in an emergency.5 Magnetic resonance imaging best assesses the distribution and extension of the affected muscles, especially when fasciotomy is considered for treatment, and initially reveals edema, inflammation, and findings of myonecrosis; muscle atrophy and fatty degeneration occur later.4,13-15 Typical MRI findings include increased signal intensity on T2-weighted and STIR (short-tau inversion recovery) sequences and variable enhancement on T1 postcontrast images, as was seen in this case, which indicated edema, inflammation, and necrosis of the muscle tissue.
Shintani and colleagues described the reversibility of the MRI findings, showing that the high-intensity lesions seen on T2-weighted images resolved in parallel with the clinical course.14,16 Lu and colleagues investigated 10 patients with rhabdomyolysis and found 2 distinct imaging types: Type 1 shows homogenous signal changes and enhancement in the affected muscles, and Type 2 shows rim enhancement on contrast-enhanced MRI, a “stipple sign” indicating areas of myonecrosis.17 Magnetic resonance imaging signal alterations in the musculature can be nonspecific and overlap with those of inflammatory myopathies such as polymyositis, connective tissue diseases with inflammatory myositis, muscle infection, muscle infarction such as diabetic myonecrosis, muscle contusion, drug-induced myotoxicity, corticosteroids use, and use of cholesterol-lowering agents.18,19
Sonography is a useful screening modality for pain and swelling of the extremity, because it can detect a muscle tear, muscle sprain, and fluid collection, especially in emergent cases. There is scant literature about sonographic findings in rhabdomyolysis and compression nerve entrapment. The sonographic findings of rhabdomyolysis are local disorganization of the damaged muscle, decreased muscle echogenicity, and enlargement of the muscle, with preservation of the muscle boundaries.5-7
Intramuscular hyperechoic areas are seen due to hypercontractility of injured muscle. In this case, noted findings included patchy, irregular, hypoechoic areas, enlargement of the muscles and tendons, and irregular hyperechoic areas without focal defects. These findings differentiated an abnormality from a muscle tear or rupture, as these often show a focal muscle gap and focal defect, signifying the ruptured muscle retracting.
A study by Su and colleagues used the large number of crush injuries after an earthquake in China.5 The characteristic sonographic findings were edema and thickened disrupted striated muscle, good overall muscle continuity, vague muscle texture, and enhanced cloudy or ground-glass-like echo. There was no blood flow signal in the hypoechoic areas.6 Ultrasound was deemed a cost-effective, easily available modality by the authors.
Conclusion
Nontraumatic, focal rhabdomyolysis is rare and should be detected and differentiated from other causes of swelling, lump, pain, or other muscle disorders to prevent late complications. Sonography is an important screening diagnostic modality. MRI is used for assessment of the extent and distribution of injury. Awareness and familiarity with imaging findings can play a significant role, along with clinical and laboratory findings in the diagnosis and management of rhabdomyolysis.
Author disclosures
The authors report no actual or potential conflicts of interest with regard to this article.
Disclaimer
The opinions expressed herein are those of the authors and do not necessarily reflect those of Federal Practitioner, Frontline Medical Communications Inc., the U.S. Government, or any of its agencies. This article may discuss unlabeled or investigational use of certain drugs. Please review complete prescribing information for specific drugs or drug combinations—including indications, contraindications, warnings, and adverse effects—before administering pharmacologic therapy to patients.
:
1. Richards JR. Rhabdomyolysis and drugs of abuse. J Emerg Med. 2000;19(1):51-56.
2. Farkash U, Shabshin N, Pritsch Perry M. Rhabdomyolysis of the deltoid muscle in a bodybuilder using anabolic-androgenic steroids: A case report. J Athl Train. 2009;44(1):98-100.
3. Mubarak SJ, Owen CA, Hargens AR, Garetto LP, Akeson WH. Acute compartment syndromes: Diagnosis and treatment with the aid of the wick catheter. J Bone Joint Surg Am. 1978;60(8):1091-1095.
4. Lamminen AE, Hekali PE, Tiula E, Suramo I, Korhola OA. Acute rhabdomyolysis: Evaluation with magnetic resonance imaging compared with computed tomography and ultrasonography. Br J Radiol. 1989;62(736):326-330.
5. Su BH, Qui L, Fu P, Luo Y, Tao Y, Peng YL. Ultrasonic appearance of rhabdomyolysis in patients with crush injury in the Wenchuan earthquake. Chin Med J (Engl). 2009;122(16):1872-1876.
6. Chiu Y-N, Wang T-G, Hsu C-Y, et al. Sonographic diagnosis of rhabdomyolysis. J Med Ultrasound. 2008;16(2):158-162.
7. Kaplan GN. Ultrasonic appearance of rhabdomyolysis. AJR Am J Roentgenol. 1980;134(2):375-377.
8. Spector R, Choudhury A, Cancilla P, Lakin R. Alcohol myopathy. Diagnosis by alcohol challenge. JAMA. 1979;242(15):1648-1649.
9. Gabow PA, Kaehny WD, Kelleher SP. The spectrum of rhabdomyolysis. Medicine (Baltimore). 1982;61(3):141-152.
10. Knochel JP. Mechanisms of rhabdomyolysis. Curr Opin Rheumatol. 1993;5(6):725-731.
11. Cadnapaphornchai P, Taher S, McDonald FD. Acute drug-association rhabdomyolysis: An examination of its diverse renal manifestations and complications. Am J Med Sci. 1980;280(2):66-72.
12. Curry SC, Chang D, Connor D. Drug and toxin-induced rhabdomyolysis. Ann Emerg Med. 1989;18(10):1068-1084.
13. May D, Disler DG, Jones EA, Balkissoon AA, Manaster BJ. Abnormal signal intensity in skeletal muscle at MR imaging: Patterns, pearls, and pitfalls. RadioGraphics. 2000;20(spec no):S295-S315.
14. Moratalla MB, Braun P, Fornas GM. Importance of MRI in the diagnosis and treatment of rhabdomyolysis. Eur J Radiol. 2008;65(2):311-315.
15. Beltran J, Rosenberg ZS. Diagnosis of compressive and entrapment neurorpathies of the upper extremity: Value of MR imaging. AJR Am J Roentgenol. 1994;163(3):525-531.
16. Shintani S, Shiigai T. Repeat MRI in acute rhabdomyolysis: Correlation with clinicopathological findings. J Comput Assist Tomogr. 1993;17(5):786-791.
17. Lu CH, Tsang YM, Yu CW, et al. Rhabdomyolysis: Magnetic resonance imaging and computed tomography findings. J Comput Assist Tomogr. 2007;31(3):368-374.
18. Schulze M, Kötter I, Ernemann U, et al. MRI findings in inflammatory muscle diseases and their noninflammatory mimics. AJR Am J Roentgenol. 2009;192(6):1708-1716.
19. Adams EM, Chow CK, Premkumar A, Plotz PH. The idiopathic inflammatory myopathies: Spectrum of MR imaging findings. Radiographics. 1995;15(3):563-574.
Rhabdomyolysis involves the breakdown of skeletal muscle with the release of intracellular contents into the extracellular space and circulation.1 Diffuse rhabdomyolysis has been found in athletes due to overexertion. However, focal rhabdomyolysis is rare.2,3 The clinical presentation of focal rhabdomyolysis is subtle and nonspecific, with swelling, vague pain, weakness, fatigue, and tea-colored urine.
Early recognition and prompt management are crucial to prevent complications such as compression syndrome, acute renal failure, disseminated intravascular coagulation, cardiac dysrhythmia, or even cardiac arrest. Sonography and magnetic resonance imaging (MRI) can, therefore, be a complementary part of the diagnosis and assessment of the extent of rhabdomyolysis.4-7
Case History
The patient was a 34-year-old white man with a history of polysubstance abuse who presented to the emergency department (ED) with numbness and weakness in the left arm and hand, pain in the left side of his neck, and 3 days of intermittent amnesia with confusion. He had used IV heroin about 2 weeks prior to admission and used tobacco and alcohol daily. He reported no current medications or known allergies. The patient was in a monogamous relationship with a same-sex partner.
On physical examination, vital signs were within normal limits. He was in distress, confused, and disoriented as to time and place. An extremity examination revealed 1/5 strength in the extensors of the left elbow, left wrist, and left fingers with normal strength noted in the right upper extremity as well as the lower extremities. No sensory deficits were noted. The patient’s skin was warm and dry. Remarkable laboratory findings included creatine kinase (CK) 1,744 U/L, creatinine (Cr) 1.9 mg/dL, ALT 1,065 U/L, AST 319 U/L, ALP 159 U/L. A urine toxicology screen was positive for cocaine and opiates, and the urine analysis dip was negative for red blood cells, white blood cells, and protein. A differential diagnosis favored a left arm inflammatory reaction to IV drugs, although rhabdomyolysis was questioned.
A neurology consult was obtained, and a bedside electroencephalography test was performed in the ED by the neurologist, showing mild left occipital slow wave abnormality with no epileptiform discharges. A chest X-ray and computed tomography (CT) scan of the head and cervical spine were unremarkable, other than incidental mild prominence of the ventricles.
Over the next 24 hours, the patient was hydrated with IV normal saline without bicarbonate. His altered mental status, urine output, and biochemical abnormalities returned to normal, except for the serum CK, which decreased to 917 U/L. He had minimal improvement in his left upper extremity nerve palsy symptoms; however, he was deemed to be stable for discharge with follow-up in the clinic.
Instead of a clinic follow-up, the patient returned to the ED 7 days later, with progressive weakness of the left arm, forearm, and wrist. The patient noted that his weakness was so significant that he had to move his left arm with his right arm. He also reported extremity swelling and increasing paresthesias involving the lateral aspect of his left arm and hand, dizziness, and left neck pain. A physical examination revealed 3/5 strength at the left deltoid and left triceps, and 0/5 strength in the left fingers and grip. Remeasurement of CK was 54 U/L and Cr was 0.9 mg/dL. Compartment pressures were not measured.
Magnetic resonance imaging using multiplanar spin echo T1 and fast spin T2 weighted and post-IV 16cc Omniscan contrast sequences of the left shoulder were performed, showing multiple patchy T2 hyperintense focal areas with peripheral enhancement in the muscles of the posterior shoulder and in the tissues adjacent to the brachial plexus in the neck and shoulder (Figures 1A, 1B, and 1C). Sonography with matrix array linear 6-15 MH3 transducer was performed, which demonstrated patchy focal hypoechoic areas of muscle with enlarged, thickened, and disrupted muscle, representing devitalized muscle without any drainable fluid collection or abscess (Figures 2A, 2B, 2C, and 2D).
Magnetic resonance imaging and magnetic resonance angiogram scans of the brain and cervical spine with and without contrast were unremarkable. At that time, a definitive diagnosis was made of focal rhabdomyolysis and compressive neuropathy of the brachial plexus posterior cord, leading to brachial plexopathy of the left shoulder.
The patient was treated with hydration, a left arm sling, elevated left arm, and ibuprofen 600 mg qid to reduce inflammation. His swelling decreased markedly, and there was a slight improvement in pain and mobility at a 2-week neurology clinic follow-up. The patient lost contact after that.
Discussion
Rhabdomyolysis is caused by diverse etiologies. Most commonly, it is generalized and occurs due to overexertion, crush injury, steroid use, metabolic abnormalities, and certain medications and illicit drugs.1,2 The most likely etiology of rhabdomyolysis in patients presenting to the ED without significant trauma is of substance abuse, especially with ethanol, heroin, amphetamines, cocaine, and other sedatives or stimulants.1-3 The patient presented in this case study had a history of drug abuse, with a positive urine toxicology screen for cocaine and opiates. He had been intermittently confused and amnesic for 3 days prior to presentation, during which he may have been lying on his shoulder for a prolonged period.
Focal rhabdomyolysis and acute compression at the posterior shoulder leading to compressive brachial plexopathy is rare, with only 3 cases reported in the literature, all occurring with IV drug use.1-3 This patient had compression of the brachial plexus posterior cord from rhabdomyolysis and prolonged immobilization. Intravenous drug abusers may delay medical care due to perceived illicit drug effects and frequently present to the ED confused, agitated, or obtunded. Acute extremity swelling, a palpable lump, and pain can be due to various etiologies, such as trauma, fluid collection, muscle tear, myopathy, venous thrombosis, neoplasm, or rhabdomyolysis.
Diagnosis of nontraumatic rhabdomyolysis depends on clinical history and biochemical tests, such as serum CK and urine myoglobin.1,8 Creatine kinase is present in large quantities in the myocytes and is 100% sensitive as a marker for rhabdomyolysis.1,8 Creatine kinase may increase acutely > 1,000 U/L, suggesting muscle lysis and necrosis as etiology for pain as opposed to other causes such as hematomas, abscesses, or venous thrombi.1,9 Serum CK decreases rapidly at a rate of 39% per day, and it may normalize by the time a patient presents for medical care.1,10-12 Imaging plays a significant complimentary role. During the patient’s second ED presentation, the CK was normal at 54 U/L, whereas ultrasound and MRI findings were suggestive of focal muscle abnormalities.
Although there are diverse etiologies of rhabdomyolysis, the ultimate consequences of rhabdomyolysis are muscle cell membrane injury, metabolism malfunction, and destruction of the myofibril, resulting in inflammatory changes, such as muscle edema, hemorrhage, and myonecrosis and disruption of muscle fibers.1,2,8,9,13 This may cause an alteration in muscle size, shape, and echogenicity on sonography and abnormal signal intensity on MRI.13 The sensitivity of MRI in the detection of muscle involvement is higher than that of CT or ultrasound due to the high soft tissue contrast.4,13,14 Specificity of all 3 modalities is low and not reported.
Although the sensitivity of ultrasound is lower than that of MRI, use of ultrasound in neuromuscular evaluation has been increasing recently due to technical refinements. Ultrasound can be effectively used as a first-line screening modality, especially in an emergency.5 Magnetic resonance imaging best assesses the distribution and extension of the affected muscles, especially when fasciotomy is considered for treatment, and initially reveals edema, inflammation, and findings of myonecrosis; muscle atrophy and fatty degeneration occur later.4,13-15 Typical MRI findings include increased signal intensity on T2-weighted and STIR (short-tau inversion recovery) sequences and variable enhancement on T1 postcontrast images, as was seen in this case, which indicated edema, inflammation, and necrosis of the muscle tissue.
Shintani and colleagues described the reversibility of the MRI findings, showing that the high-intensity lesions seen on T2-weighted images resolved in parallel with the clinical course.14,16 Lu and colleagues investigated 10 patients with rhabdomyolysis and found 2 distinct imaging types: Type 1 shows homogenous signal changes and enhancement in the affected muscles, and Type 2 shows rim enhancement on contrast-enhanced MRI, a “stipple sign” indicating areas of myonecrosis.17 Magnetic resonance imaging signal alterations in the musculature can be nonspecific and overlap with those of inflammatory myopathies such as polymyositis, connective tissue diseases with inflammatory myositis, muscle infection, muscle infarction such as diabetic myonecrosis, muscle contusion, drug-induced myotoxicity, corticosteroids use, and use of cholesterol-lowering agents.18,19
Sonography is a useful screening modality for pain and swelling of the extremity, because it can detect a muscle tear, muscle sprain, and fluid collection, especially in emergent cases. There is scant literature about sonographic findings in rhabdomyolysis and compression nerve entrapment. The sonographic findings of rhabdomyolysis are local disorganization of the damaged muscle, decreased muscle echogenicity, and enlargement of the muscle, with preservation of the muscle boundaries.5-7
Intramuscular hyperechoic areas are seen due to hypercontractility of injured muscle. In this case, noted findings included patchy, irregular, hypoechoic areas, enlargement of the muscles and tendons, and irregular hyperechoic areas without focal defects. These findings differentiated an abnormality from a muscle tear or rupture, as these often show a focal muscle gap and focal defect, signifying the ruptured muscle retracting.
A study by Su and colleagues used the large number of crush injuries after an earthquake in China.5 The characteristic sonographic findings were edema and thickened disrupted striated muscle, good overall muscle continuity, vague muscle texture, and enhanced cloudy or ground-glass-like echo. There was no blood flow signal in the hypoechoic areas.6 Ultrasound was deemed a cost-effective, easily available modality by the authors.
Conclusion
Nontraumatic, focal rhabdomyolysis is rare and should be detected and differentiated from other causes of swelling, lump, pain, or other muscle disorders to prevent late complications. Sonography is an important screening diagnostic modality. MRI is used for assessment of the extent and distribution of injury. Awareness and familiarity with imaging findings can play a significant role, along with clinical and laboratory findings in the diagnosis and management of rhabdomyolysis.
Author disclosures
The authors report no actual or potential conflicts of interest with regard to this article.
Disclaimer
The opinions expressed herein are those of the authors and do not necessarily reflect those of Federal Practitioner, Frontline Medical Communications Inc., the U.S. Government, or any of its agencies. This article may discuss unlabeled or investigational use of certain drugs. Please review complete prescribing information for specific drugs or drug combinations—including indications, contraindications, warnings, and adverse effects—before administering pharmacologic therapy to patients.
:
1. Richards JR. Rhabdomyolysis and drugs of abuse. J Emerg Med. 2000;19(1):51-56.
2. Farkash U, Shabshin N, Pritsch Perry M. Rhabdomyolysis of the deltoid muscle in a bodybuilder using anabolic-androgenic steroids: A case report. J Athl Train. 2009;44(1):98-100.
3. Mubarak SJ, Owen CA, Hargens AR, Garetto LP, Akeson WH. Acute compartment syndromes: Diagnosis and treatment with the aid of the wick catheter. J Bone Joint Surg Am. 1978;60(8):1091-1095.
4. Lamminen AE, Hekali PE, Tiula E, Suramo I, Korhola OA. Acute rhabdomyolysis: Evaluation with magnetic resonance imaging compared with computed tomography and ultrasonography. Br J Radiol. 1989;62(736):326-330.
5. Su BH, Qui L, Fu P, Luo Y, Tao Y, Peng YL. Ultrasonic appearance of rhabdomyolysis in patients with crush injury in the Wenchuan earthquake. Chin Med J (Engl). 2009;122(16):1872-1876.
6. Chiu Y-N, Wang T-G, Hsu C-Y, et al. Sonographic diagnosis of rhabdomyolysis. J Med Ultrasound. 2008;16(2):158-162.
7. Kaplan GN. Ultrasonic appearance of rhabdomyolysis. AJR Am J Roentgenol. 1980;134(2):375-377.
8. Spector R, Choudhury A, Cancilla P, Lakin R. Alcohol myopathy. Diagnosis by alcohol challenge. JAMA. 1979;242(15):1648-1649.
9. Gabow PA, Kaehny WD, Kelleher SP. The spectrum of rhabdomyolysis. Medicine (Baltimore). 1982;61(3):141-152.
10. Knochel JP. Mechanisms of rhabdomyolysis. Curr Opin Rheumatol. 1993;5(6):725-731.
11. Cadnapaphornchai P, Taher S, McDonald FD. Acute drug-association rhabdomyolysis: An examination of its diverse renal manifestations and complications. Am J Med Sci. 1980;280(2):66-72.
12. Curry SC, Chang D, Connor D. Drug and toxin-induced rhabdomyolysis. Ann Emerg Med. 1989;18(10):1068-1084.
13. May D, Disler DG, Jones EA, Balkissoon AA, Manaster BJ. Abnormal signal intensity in skeletal muscle at MR imaging: Patterns, pearls, and pitfalls. RadioGraphics. 2000;20(spec no):S295-S315.
14. Moratalla MB, Braun P, Fornas GM. Importance of MRI in the diagnosis and treatment of rhabdomyolysis. Eur J Radiol. 2008;65(2):311-315.
15. Beltran J, Rosenberg ZS. Diagnosis of compressive and entrapment neurorpathies of the upper extremity: Value of MR imaging. AJR Am J Roentgenol. 1994;163(3):525-531.
16. Shintani S, Shiigai T. Repeat MRI in acute rhabdomyolysis: Correlation with clinicopathological findings. J Comput Assist Tomogr. 1993;17(5):786-791.
17. Lu CH, Tsang YM, Yu CW, et al. Rhabdomyolysis: Magnetic resonance imaging and computed tomography findings. J Comput Assist Tomogr. 2007;31(3):368-374.
18. Schulze M, Kötter I, Ernemann U, et al. MRI findings in inflammatory muscle diseases and their noninflammatory mimics. AJR Am J Roentgenol. 2009;192(6):1708-1716.
19. Adams EM, Chow CK, Premkumar A, Plotz PH. The idiopathic inflammatory myopathies: Spectrum of MR imaging findings. Radiographics. 1995;15(3):563-574.
What are cancer survivors’ needs and how well are they being met?
ABSTRACT
Purpose This study sought to identify the needs and unmet needs of the growing number of adult cancer survivors.
Methods Vermont survivor advocates partnered with academic researchers to create a survivor registry and conduct a cross-sectional survey of cancer-related needs and unmet needs of adult survivors. The mailed survey addressed 53 specific needs in 5 domains based on prior research, contributions from the research partners, and pilot testing. Results were summarized by computing proportions who reported having needs met or unmet.
Results Survey participants included 1668 of 2005 individuals invited from the survivor registry (83%); 65.7% were ages 60 or older and 61.9% were women. These participants had received their diagnosis 2 to 16 years earlier; 77.5% had been diagnosed ≥5 years previously; 30.2% had at least one unmet need in the emotional, social, and spiritual (e) domain; just 14.4% had at least one unmet need in the economic and legal domain. The most commonly identified individual unmet needs were in the e and the information (i) domains and included “help reducing stress” (14.8% of all respondents) and “information about possible after effects of treatment” (14.4%).
Conclusions Most needs of these longer-term survivors were met, but substantial proportions of survivors identified unmet needs. Unmet needs such as information about late and long-term adverse effects of treatment could be met within clinical care with a cancer survivor care plan, but some survivors may require referral to services focused on stress and coping.
Following a successful course of treatment for cancer, many patients return to or remain in the care of their primary care physician (PCP). What often goes unrecognized, however, are these cancer survivors’ unique needs—physical, psychological, social, spiritual, economic, and legal—and the informational and professional services available to address them.1,2
Increased cancer survival creates new needs. There are already >12 million cancer survivors in the United States and >30 million worldwide.3 As baby boomers age, the number of cancers diagnosed over the next 45 years will double4 and improved diagnosis and treatments are already prolonging survivors’ lives. With the greater number of cancer survivors and longer survival time, a cancer survivorship advocacy community has developed to help identify and address the concerns, needs, and benefits of having lived with, through, and beyond a cancer diagnosis.
The purpose of our study. Some of these areas of need have been studied extensively with childhood survivors, breast cancer survivors, and, more recently, prostate cancer survivors. However, few studies have examined adult survivors from all cancer types5-9 or have had cohorts large enough to yield meaningful information.5,7-9 The aim of this study was to describe the needs of adult survivors of all cancer types in a general population from Vermont and to determine whether these needs were met. The results of this study can help identify the services needed by cancer survivors.
METHODS
Population and sample
In November 2009, we invited all survivors listed in a cancer survivor registry to complete a 12-page survey. The registry10 was created as part of the Cancer Survivor Community Study, a community-based participatory research project funded by the National Cancer Institute. The study’s Steering Committee was comprised of cancer survivors, cancer registrars, and researchers. We identified and invited cancer survivors from 4 hospital registries in northwest and central Vermont to participate. Registry participants who indicated willingness to enroll in research studies received an invitation letter and informed consent form, the 12-page survey, and an addressed and stamped return envelope. We obtained Institutional Review Board (IRB) approval for these procedures at the University of Vermont and at local hospital IRBs.
Instrument development
A working group from the Steering Committee reviewed a range of available instruments to assess cancer survivors’ needs.9,11-15 We determined that the survey most relevant to our objectives was the Cancer Survivors’ Unmet Needs (CaSun) instrument.13 Because CaSun was developed in Australia, we carefully examined each question for appropriateness to our target audience. We eliminated several questions that we thought less important, added questions from other instruments, and simplified the survey format. Survivors from the Steering Committee pilot tested the draft questionnaire to identify awkward wording or concepts.
We piloted the revised draft using a standardized feedback form with cancer survivors who were not connected to our project and not enrolled in the survivor registry, and with residents at a senior center. Students and a teacher from an Adult Basic Education program helped to ensure easy readability. Our final instrument had 53 questions about needs in 5 domains. Questions within each domain completed the lead-in, “Since your cancer diagnosis, did you need....” We asked participants to check only 1 of the 3 boxes to the right of each question to indicate that there was no need in that area, that there was a need and it was met, or that there was a need and it was not met. We obtained self-reported demographic data during enrollment in the registry.
Data analysis
We summarized data by computing the percent of survivors who reported having each need (either met or unmet) and the percent for whom the need was unmet. The latter was computed both as a percent of all survivors and as a percent of those who had the need. We also calculated the percentage of survivors that had at least one need and at least one unmet need in each domain, as well as the average number of needs per survivor in each domain. We used SPSS for Unix, Release 6.1 (AIX 3.2)(IBM, Armonk, New York).
RESULTS
Of the 2005 cancer survivors invited into the study, 1668 responded, yielding a participation rate of 83%. TABLE 1 describes the self-reported demographic and cancer characteristics of participants in this study. Most respondents were female, ≥60 years old, urban dwellers, married or with a partner, well educated, and had household incomes of ≥$50,000. There were more breast cancer survivors than survivors of other cancers, and 14.6% of all survivors reported being diagnosed with more than one cancer. Cancer was diagnosed at stages 1 or 2 for 78.3% of the participants; 61.9% reported having undergone ≥2 treatment regimens.
The survey addressed needs in 5 domains: access to care and services (A); information (I); emotional, social, and spiritual (E); physical (P); and economic and legal (L). More than 80% of respondents reported having at least one need in the A, I, and E domains. The E domain had the most survivors with at least one unmet need (N=503), followed by the I (N=410) and P (N=375) domains.
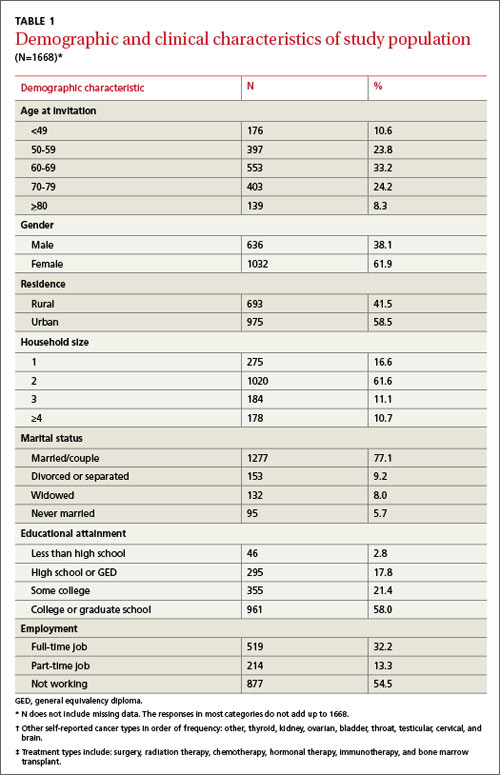
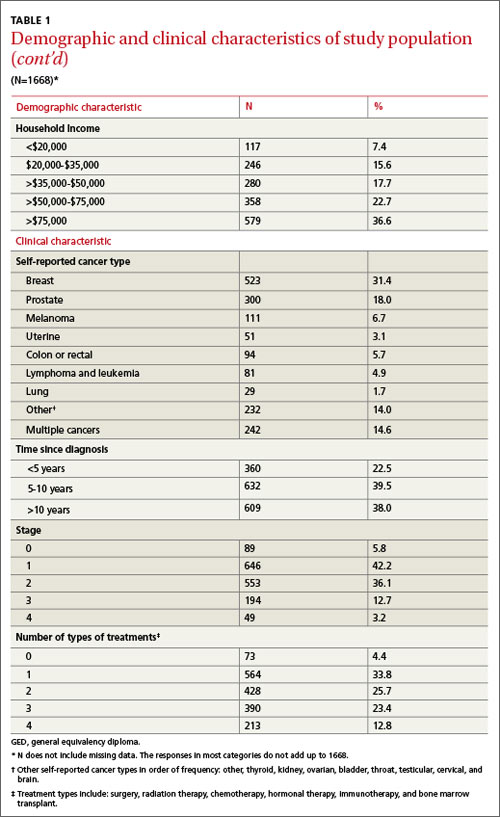
Identifying unmet needs. TABLE 2 shows results for the specific questions within the domains in the order they were asked. Most participants who had a need also had it met. However, some needs that were not commonly reported were deemed unmet by a large proportion of those who expressed the need. For example, the A need for “A case manager to whom you could go to find out about services whenever they were needed” (A5) was reported by only 29.1% of survivors. But 32.1% of those reporting the need said it was unmet, which corresponds to 9.4% of all study participants having the need unmet. Similarly, the need for “More information about complementary and alternative medicine” (I3) was reported by about a quarter of the study population, 41.4% of whom (9.8% of all participants) reported it as unmet. In the P domain, the need for “Help to address problems with your sex life” (P4) was reported by only 26.5% of the respondents; yet 40.7% of those reporting the need had it unmet. Similarly, in the L domain, “Help with life insurance concerns as a result of your cancer” (L3) was only reported by 10.9% of the participants but was unmet for 46.4% of those who reported the need, or 5% of all study participants.
Most commonly expressed needs. TABLE 2 also identifies 12 needs reported by ≥50% of participants. Three of these needs were in the A domain, 6 in the I domain, and 3 in the E domain. The 2 most common needs related to A: the need “To feel like you were managing your health together with the medical team” (A3) was reported by 68.6% and was viewed as unmet by 5.2% of all respondents; the need for “Access to screening for recurrence or other cancers” (A7) was reported by 63.8% of the survivors but was deemed unmet by only 3.1% of all the respondents. “More information about possible after effects of your treatment” (I5) was a need for 63.2% that went unmet in 22.9% (14.4% of all participants). “Help managing your concerns about the cancer coming back” (E13) was reported as a need by 54.1% and as unmet by 11.8% of all participants.
The rank order of 7 unmet needs reported by ≥10% of the participants is shown in TABLE 3. Four of the 7 unmet needs were in the E domain. The most common unmet need in this domain was “Help reducing stress in your life” (E19).
Only 3 needs were both commonly reported and also unmet for at least 10% of the participants: “More information about possible after effects of your treatment” (I5), “More information about possible side effects of your treatment” (I4), and “Help managing your concerns about the cancer coming back” (E13).
DISCUSSION
The survey instrument we used to assess the needs of cancer survivors in a large community-based registry included a detailed list of potential needs generated, in part, by representatives of the survivor community. Most cancer survivor needs mentioned in this survey were met. However, some needs were not met for substantial proportions of respondents and should be examined carefully to determine whether services could be improved to better address them. This study was planned and implemented by researchers and cancer survivors using community-based participatory principles to learn about local needs. The results of this study may be generalizable to similar populations of survivors and will inform the survivorship goals for the Vermont State Cancer Plan and future Vermont Cancer Survivor Network activities.
Acting on patients’ expressed needs. Over 80% of participants had needs in the A, I, and E domains. The most commonly reported need was in the A domain, “To feel like you were managing your health together with the medical team” (A3). It was also a top need in other studies that asked this question.16,17 A cancer diagnosis may cause patients to feel out of control. Participation in the management of their health may help them gain a greater sense of control. PCP accommodation of expressed patient preferences may be an important part of a cancer survivor’s long-term adaptation to the disease.
Six of the 12 most frequently reported needs and 2 frequently reported unmet needs were in the I domain. Communication of information increases patients’ involvement in decision-making and enables them to cope better during diagnosis, treatment, and follow-up.18 “More information about possible after effects of your treatment” and “More information about possible side effects of your treatment” were reported by a high proportion of participants, and many also reported these needs as unmet. In another study about health-related information needs of survivors, 52% wanted more information about “What late and long-term side effects of cancer treatment are expected”19; and in a 2005 review of information needs, 12% of survivors reported similar needs.20 Two recent articles also noted such needs in adolescent and young adult cancer survivors.21,22 Based on current evidence, it would be advisable to discuss anticipated effects of treatment with patients not only at the outset but also at the end of treatment, and to write it in a cancer survivor care plan.
Individual needs that were not met for at least 10% of respondents, regardless of how common the need (TABLE 3), provided additional insights. Among these 7 needs, 3 also were reported as a need by more than 50% of respondents (TABLE 2), and 4 by <50%, indicating that some less common needs are not being met adequately. Among these 7 prominent unmet needs, 4 were E Issues (TABLE 3) and 2 were I Issues.
Unmet needs are an opportunity to improve care. In our study and in others, E needs were most likely to be unmet.17,23-26 Among the 4 common unmet E needs, 2 (E19 and E11) focused on generalized stress and worry, and one (E15) focused on concern about illness impact on family members or partners. Although these issues may be challenging to address successfully in a typical clinical environment, others have confirmed the importance of these needs and proposed ways to meet them.27 The fourth most common unmet E need focused on concern about cancer recurrence, also a prominent need found in other studies.15-17 These needs might be addressed more adequately in the course of usual clinical care by PCPs or specialists. In fact, the American College of Surgeons’ Commission on Cancer 2012 standards now require psychosocial distress screening and the provision of referral for psychosocial services.24 Our results are consistent in many respects with prior studies of needs reported by cancer survivors in other countries. The CaSUN survey developed by Hodgkinson et al13 has been applied to several survivor populations in Australia. In a diverse survivor sample, specific E, I, and A issues were frequently reported as unmet needs.13 The most prominent unmet needs in a gynecologic cancer sample using CaSUN focused on emotional and social issues such as worry, stress, coping, and relationships with, and expectations of, others.25
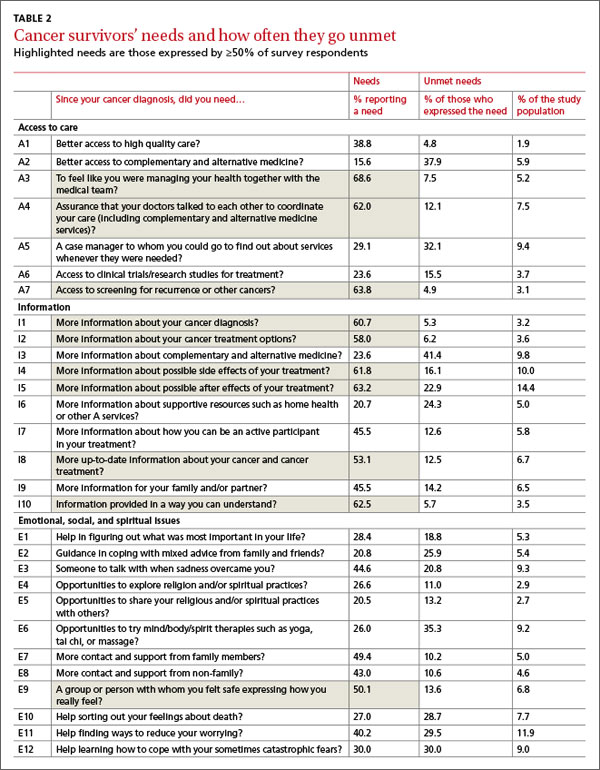
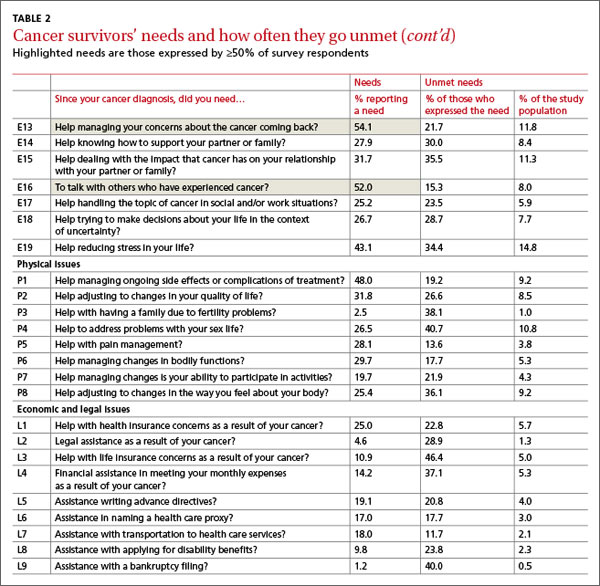
Barg et al23 conducted a survey of unmet needs in the United States using a detailed list based on prior survivor research and targeting individuals in a cancer registry. The most prominent area of need expressed was “emotional,” similar to the high rank of E needs in our study. In contrast to our study, however, physical and financial issues also were prominent. The latter variances might be explained by differences in access to care, or perhaps the study’s low response rate (23.8%). A similar survey reported by Campbell et al12 identified needs in the emotional domain as the most cited unmet survivor needs based on psychometrically developed subscales of a 152-item survey (29% response rate).
These results from several studies, including ours, call for more detailed exploration of the E needs of long-term cancer survivors. A useful framework developed by Stein et al28 accounts for factors contributing to cancer stress and burden as well as resources available to survivors (intrapersonal, social, informational, and tangible services), with the interactions between these 2 domains determining how well a survivor will be able to cope. There clearly is a role for development of more effective communication channels and focused services to meet survivor needs.
The list of most common unmet needs in TABLE 3 also includes a focus on “problems with your sex life” (P4). This is an area that may be difficult to address in a cancer care setting because of the focus on disease management. Primary care providers might be better prepared to address this issue because they likely encounter similar issues among the wide range of patients they serve. However, a recent study reported that only 46% of internists were somewhat or likely to initiate a discussion about sexuality with cancer survivors.29 Some additional preparation for physicians to address this need might be warranted.
The proportion in this sample reporting needs for access to, or information about, complementary and alternative medicine services fell below the thresholds chosen to designate common needs in this study. Although reported use is relatively common among cancer survivor in several studies,30-32 it appears that in our survivor sample, those who were interested in these approaches encountered only moderate barriers.
Study limitations. We invited participants from a registry unlikely to include cancer survivors with lower educational attainment or from rural locations9—that is, our participants were less likely to have challenges in obtaining appropriate services and information. This sample limitation therefore likely underestimates the overall level of needs among cancer survivors.
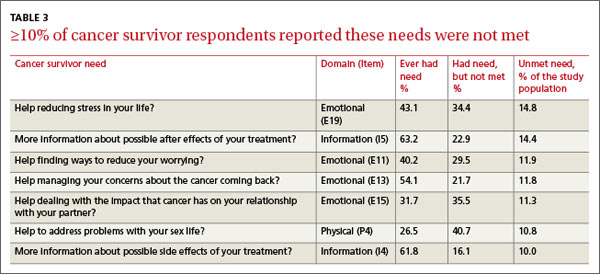
This was a cross-sectional assessment of perceived needs among a diverse group of survivors, which may have overlooked needs that were met but only after considerable effort on the part of survivors. Longitudinal studies would provide more complete accounts of how readily needs are met and the changes in needs at different times in the continuum of care.
The Vermont population is less diverse racially and ethnically, but not with respect to household income or educational attainment, than the overall US population. Access to health care also is relatively high in Vermont compared with many other states. According to a 2009 Vermont Household Health Insurance Survey, only 7.6% of Vermonters are uninsured.33
CORRESPONDENCE
Berta Geller, EdD, University of Vermont, Health Promotion Research/Family Medicine, 1 South Prospect Street, Burlington, VT 05401-3444; berta.geller@uvm.edu
ACKNOWLEDGEMENTS
We would like to thank Anne Dorwaldt, Kathy Howe, Mark Bowman and John Mace at the University of Vermont, and the Cancer Survivor Community Study Steering Committee for their contributions to the successful completion of this study. We also thank the cancer survivors who participated in the pilot testing and the overall survey.
1. Potosky A, Han PK, Rowland J, et al. Differences between primary care physicians’ and oncologists’ knowledge, attitudes and practices regarding the care of cancer survivors. J Gen Intern Med. 2011;26:1403-1410.
2. Rowland J. Survivorship research: past, present, and future. In: Chang AE, Ganz PA, Hayes DF, et al, eds. Oncology: An Evidence-Based Approach. New York, NY: Springer; 2005:1753-1767.
3. Jemal A, Center MM, DeSantis C, et al. Global patterns of cancer incidence and mortality rates and trends. Cancer Epidemiol Biomarkers Prev. 2010;19:1893-1907.
4. Hewitt ME, Greenfield S, Stovall E, eds. From Cancer Patient to Cancer Survivor: Lost in Transition. Washington, DC: National Academies Press; 2005.
5. Hawkins NA, Smith T, Zhao L, et al. Health-related behavior change after cancer: results of the American Cancer Society’s studies of cancer survivors (SCS). J Cancer Surviv. 2010;4:20-32.
6. Katz ML, Reiter PL, Corbin S, et al. Are rural Ohio Appalachia cancer survivors needs different than urban cancer survivors? J Cancer Surviv. 2010;4:140-148.
7. Yabroff KR, Lawrence WF, Clauser S, et al. Burden of illness in cancer survivors: findings from a population-based national sample. J Natl Cancer Inst. 2004;96:1322-1330.
8. Sanson-Fisher R, Girgis A, Boyes A, et al; Supportive Care Review Group. The unmet supportive care needs of patients with cancer. Cancer. 2000;88:226-237.
9. Smith T, Stein KD, Mehta CC, et al. The rationale, design, and implementation of the American Cancer Society’s studies of cancer survivors. Cancer. 2007;109:1-12.
10. Geller BM, Mace J, Vacek P, et al. Are cancer survivors willing to participate in research? J Community Health. 2011;36: 772-778.
11. Crespi CM, Ganz PA, Petersen L, et al. Refinement and psychometric evaluation of the impact of cancer scale. J Natl Cancer Inst. 2008;100:1530-1541.
12. Campbell HS, Sanson-Fisher R, Turner D, et al. Psychometric properties of cancer survivors’ unmet needs survey. Support Care Cancer. 2010;19:221-230.
13. Hodgkinson K, Butow P, Hunt GE, et al. The development and evaluation of a measure to assess cancer survivors’ unmet supportive care needs: the CaSUN (Cancer Survivors’ Unmet Needs measure). Psychooncology. 2007;16:796-804.
14. Zebrack BJ, Ganz PA, Bernaards CA, et al. Assessing the impact of cancer: development of a new instrument for long-term survivors. Psychooncology. 2006;15:407-421.
15. Arora NK, Hesse BW, Rimer BK, et al. Frustrated and confused: the American public rates its cancer-related information-seeking experiences. J Gen Intern Med. 2008;23:223-228.
16. Hodgkinson K, Butow P, Hunt GE, et al. Breast cancer survivors’ supportive care needs 2-10 years after diagnosis. Support Care Cancer. 2007;15:515-523.
17. Harrison SE, Watson EK, Ward AM, et al. Primary health and supportive care needs of long-term cancer survivors: a questionnaire study. J Clin Oncol. 2011;29:2091-2098.
18. Rutten LJ, Squiers L, Treiman K. Requests for information by family and friends of cancer patients calling the National Cancer Institute’s Cancer Information Service. Psychooncology. 2006;15:664-672.
19. Beckjord EB, Arora NK, McLaughlin W, et al. Health-related information needs in a large and diverse sample of adult cancer survivors: implications for cancer care. J Cancer Surviv. 2008;2:179-189.
20. Rutten LJ, Arora NK, Bakos AD, et al. Information needs and sources of information among cancer patients: a systematic review of research (1980-2003). Patient Educ Couns. 2005;57:250-261.
21. Zebrack BJ, Block R, Hayes-Lattin B, et al. Psychosocial service use and unmet need among recently diagnosed adolescent and youg adult patients. Cancer. 2013;119:201-214.
22. Keegan TH, Lichtensztajn DY, Kato I, et al. Unmet adolescent and young adult cancer survivors information and service needs: a population-based cancer registry study. J Cancer Surviv. 2012;6:239-250.
23. Barg KF, Cronholm PF, Straton JB, et al. Unmet psychosocial needs of Pennsylvanians with cancer: 1996-2005. Cancer. 2007;110:631-639.
24. American College of Surgeons. Cancer Program Standards 2012: Ensuring Patient-Centered Care. Chicago, IL: American College of Surgeons; 2011.
25. Hodgkinson K, Butow P, Fuchs A, et al. Long-term survival from gynecologic cancer: psychosocial outcomes, supportive care needs and positive outcomes. Gynecol Oncol. 2007;104:381-389.
26. Houts PS, Yasko JM, Kahn SB, et al. Unmet psychological, social, and economic needs of persons with cancer in Pennsylvania. Cancer. 1986;58:2355-2361.
27. Holland JC, Reznik I. Pathways for psychosocial care of cancer survivors. Cancer. 2005;104(11 suppl):2624-2637.
28. Stein KD, Syrjala KL, Andrykowski MA. Physical and psychological long-term and late effects of cancer. Cancer. 2008;112(11 suppl):2577-2592.
29. Park ER, Bober SL, Campbell EG, et al. General: Internist communication about sexual function with cancer survivors. J Gen Intern Med. 2009;24(suppl 2):S407-S411.
30. Girgis A, Adams J, Sibbritt D. The use of complementary and alternative therapies by patients with cancer. Oncol Res. 2005;15:281-289.
31. Gansler T, Kaw C, Crammer C, et al. A population-based study of prevalence of complementary methods use by cancer survivors: a report from the American Cancer Society’s studies of cancer survivors. Cancer. 2008;113:1048-1057.
32. Fouladbakhsh JM, Stommel M. Gender, symptom experience, and use of complementary and alternative medicine practices among cancer survivors in the U.S. cancer population. Oncol Nurs Forum. 2010;37:E7-E15.
33. Vermont Department of Financial Regulation. Vermont Household Health Insurance Survey (VHHIS). Vermont Department of Financial Regulation Web site. Available at: http://www.dfr.vermont.gov/insurance/health-insurance/vermont-household-health-insurance-survey-vhhis. Accessed July 15, 2014.
ABSTRACT
Purpose This study sought to identify the needs and unmet needs of the growing number of adult cancer survivors.
Methods Vermont survivor advocates partnered with academic researchers to create a survivor registry and conduct a cross-sectional survey of cancer-related needs and unmet needs of adult survivors. The mailed survey addressed 53 specific needs in 5 domains based on prior research, contributions from the research partners, and pilot testing. Results were summarized by computing proportions who reported having needs met or unmet.
Results Survey participants included 1668 of 2005 individuals invited from the survivor registry (83%); 65.7% were ages 60 or older and 61.9% were women. These participants had received their diagnosis 2 to 16 years earlier; 77.5% had been diagnosed ≥5 years previously; 30.2% had at least one unmet need in the emotional, social, and spiritual (e) domain; just 14.4% had at least one unmet need in the economic and legal domain. The most commonly identified individual unmet needs were in the e and the information (i) domains and included “help reducing stress” (14.8% of all respondents) and “information about possible after effects of treatment” (14.4%).
Conclusions Most needs of these longer-term survivors were met, but substantial proportions of survivors identified unmet needs. Unmet needs such as information about late and long-term adverse effects of treatment could be met within clinical care with a cancer survivor care plan, but some survivors may require referral to services focused on stress and coping.
Following a successful course of treatment for cancer, many patients return to or remain in the care of their primary care physician (PCP). What often goes unrecognized, however, are these cancer survivors’ unique needs—physical, psychological, social, spiritual, economic, and legal—and the informational and professional services available to address them.1,2
Increased cancer survival creates new needs. There are already >12 million cancer survivors in the United States and >30 million worldwide.3 As baby boomers age, the number of cancers diagnosed over the next 45 years will double4 and improved diagnosis and treatments are already prolonging survivors’ lives. With the greater number of cancer survivors and longer survival time, a cancer survivorship advocacy community has developed to help identify and address the concerns, needs, and benefits of having lived with, through, and beyond a cancer diagnosis.
The purpose of our study. Some of these areas of need have been studied extensively with childhood survivors, breast cancer survivors, and, more recently, prostate cancer survivors. However, few studies have examined adult survivors from all cancer types5-9 or have had cohorts large enough to yield meaningful information.5,7-9 The aim of this study was to describe the needs of adult survivors of all cancer types in a general population from Vermont and to determine whether these needs were met. The results of this study can help identify the services needed by cancer survivors.
METHODS
Population and sample
In November 2009, we invited all survivors listed in a cancer survivor registry to complete a 12-page survey. The registry10 was created as part of the Cancer Survivor Community Study, a community-based participatory research project funded by the National Cancer Institute. The study’s Steering Committee was comprised of cancer survivors, cancer registrars, and researchers. We identified and invited cancer survivors from 4 hospital registries in northwest and central Vermont to participate. Registry participants who indicated willingness to enroll in research studies received an invitation letter and informed consent form, the 12-page survey, and an addressed and stamped return envelope. We obtained Institutional Review Board (IRB) approval for these procedures at the University of Vermont and at local hospital IRBs.
Instrument development
A working group from the Steering Committee reviewed a range of available instruments to assess cancer survivors’ needs.9,11-15 We determined that the survey most relevant to our objectives was the Cancer Survivors’ Unmet Needs (CaSun) instrument.13 Because CaSun was developed in Australia, we carefully examined each question for appropriateness to our target audience. We eliminated several questions that we thought less important, added questions from other instruments, and simplified the survey format. Survivors from the Steering Committee pilot tested the draft questionnaire to identify awkward wording or concepts.
We piloted the revised draft using a standardized feedback form with cancer survivors who were not connected to our project and not enrolled in the survivor registry, and with residents at a senior center. Students and a teacher from an Adult Basic Education program helped to ensure easy readability. Our final instrument had 53 questions about needs in 5 domains. Questions within each domain completed the lead-in, “Since your cancer diagnosis, did you need....” We asked participants to check only 1 of the 3 boxes to the right of each question to indicate that there was no need in that area, that there was a need and it was met, or that there was a need and it was not met. We obtained self-reported demographic data during enrollment in the registry.
Data analysis
We summarized data by computing the percent of survivors who reported having each need (either met or unmet) and the percent for whom the need was unmet. The latter was computed both as a percent of all survivors and as a percent of those who had the need. We also calculated the percentage of survivors that had at least one need and at least one unmet need in each domain, as well as the average number of needs per survivor in each domain. We used SPSS for Unix, Release 6.1 (AIX 3.2)(IBM, Armonk, New York).
RESULTS
Of the 2005 cancer survivors invited into the study, 1668 responded, yielding a participation rate of 83%. TABLE 1 describes the self-reported demographic and cancer characteristics of participants in this study. Most respondents were female, ≥60 years old, urban dwellers, married or with a partner, well educated, and had household incomes of ≥$50,000. There were more breast cancer survivors than survivors of other cancers, and 14.6% of all survivors reported being diagnosed with more than one cancer. Cancer was diagnosed at stages 1 or 2 for 78.3% of the participants; 61.9% reported having undergone ≥2 treatment regimens.
The survey addressed needs in 5 domains: access to care and services (A); information (I); emotional, social, and spiritual (E); physical (P); and economic and legal (L). More than 80% of respondents reported having at least one need in the A, I, and E domains. The E domain had the most survivors with at least one unmet need (N=503), followed by the I (N=410) and P (N=375) domains.
Identifying unmet needs. TABLE 2 shows results for the specific questions within the domains in the order they were asked. Most participants who had a need also had it met. However, some needs that were not commonly reported were deemed unmet by a large proportion of those who expressed the need. For example, the A need for “A case manager to whom you could go to find out about services whenever they were needed” (A5) was reported by only 29.1% of survivors. But 32.1% of those reporting the need said it was unmet, which corresponds to 9.4% of all study participants having the need unmet. Similarly, the need for “More information about complementary and alternative medicine” (I3) was reported by about a quarter of the study population, 41.4% of whom (9.8% of all participants) reported it as unmet. In the P domain, the need for “Help to address problems with your sex life” (P4) was reported by only 26.5% of the respondents; yet 40.7% of those reporting the need had it unmet. Similarly, in the L domain, “Help with life insurance concerns as a result of your cancer” (L3) was only reported by 10.9% of the participants but was unmet for 46.4% of those who reported the need, or 5% of all study participants.
Most commonly expressed needs. TABLE 2 also identifies 12 needs reported by ≥50% of participants. Three of these needs were in the A domain, 6 in the I domain, and 3 in the E domain. The 2 most common needs related to A: the need “To feel like you were managing your health together with the medical team” (A3) was reported by 68.6% and was viewed as unmet by 5.2% of all respondents; the need for “Access to screening for recurrence or other cancers” (A7) was reported by 63.8% of the survivors but was deemed unmet by only 3.1% of all the respondents. “More information about possible after effects of your treatment” (I5) was a need for 63.2% that went unmet in 22.9% (14.4% of all participants). “Help managing your concerns about the cancer coming back” (E13) was reported as a need by 54.1% and as unmet by 11.8% of all participants.
The rank order of 7 unmet needs reported by ≥10% of the participants is shown in TABLE 3. Four of the 7 unmet needs were in the E domain. The most common unmet need in this domain was “Help reducing stress in your life” (E19).
Only 3 needs were both commonly reported and also unmet for at least 10% of the participants: “More information about possible after effects of your treatment” (I5), “More information about possible side effects of your treatment” (I4), and “Help managing your concerns about the cancer coming back” (E13).
DISCUSSION
The survey instrument we used to assess the needs of cancer survivors in a large community-based registry included a detailed list of potential needs generated, in part, by representatives of the survivor community. Most cancer survivor needs mentioned in this survey were met. However, some needs were not met for substantial proportions of respondents and should be examined carefully to determine whether services could be improved to better address them. This study was planned and implemented by researchers and cancer survivors using community-based participatory principles to learn about local needs. The results of this study may be generalizable to similar populations of survivors and will inform the survivorship goals for the Vermont State Cancer Plan and future Vermont Cancer Survivor Network activities.
Acting on patients’ expressed needs. Over 80% of participants had needs in the A, I, and E domains. The most commonly reported need was in the A domain, “To feel like you were managing your health together with the medical team” (A3). It was also a top need in other studies that asked this question.16,17 A cancer diagnosis may cause patients to feel out of control. Participation in the management of their health may help them gain a greater sense of control. PCP accommodation of expressed patient preferences may be an important part of a cancer survivor’s long-term adaptation to the disease.
Six of the 12 most frequently reported needs and 2 frequently reported unmet needs were in the I domain. Communication of information increases patients’ involvement in decision-making and enables them to cope better during diagnosis, treatment, and follow-up.18 “More information about possible after effects of your treatment” and “More information about possible side effects of your treatment” were reported by a high proportion of participants, and many also reported these needs as unmet. In another study about health-related information needs of survivors, 52% wanted more information about “What late and long-term side effects of cancer treatment are expected”19; and in a 2005 review of information needs, 12% of survivors reported similar needs.20 Two recent articles also noted such needs in adolescent and young adult cancer survivors.21,22 Based on current evidence, it would be advisable to discuss anticipated effects of treatment with patients not only at the outset but also at the end of treatment, and to write it in a cancer survivor care plan.
Individual needs that were not met for at least 10% of respondents, regardless of how common the need (TABLE 3), provided additional insights. Among these 7 needs, 3 also were reported as a need by more than 50% of respondents (TABLE 2), and 4 by <50%, indicating that some less common needs are not being met adequately. Among these 7 prominent unmet needs, 4 were E Issues (TABLE 3) and 2 were I Issues.
Unmet needs are an opportunity to improve care. In our study and in others, E needs were most likely to be unmet.17,23-26 Among the 4 common unmet E needs, 2 (E19 and E11) focused on generalized stress and worry, and one (E15) focused on concern about illness impact on family members or partners. Although these issues may be challenging to address successfully in a typical clinical environment, others have confirmed the importance of these needs and proposed ways to meet them.27 The fourth most common unmet E need focused on concern about cancer recurrence, also a prominent need found in other studies.15-17 These needs might be addressed more adequately in the course of usual clinical care by PCPs or specialists. In fact, the American College of Surgeons’ Commission on Cancer 2012 standards now require psychosocial distress screening and the provision of referral for psychosocial services.24 Our results are consistent in many respects with prior studies of needs reported by cancer survivors in other countries. The CaSUN survey developed by Hodgkinson et al13 has been applied to several survivor populations in Australia. In a diverse survivor sample, specific E, I, and A issues were frequently reported as unmet needs.13 The most prominent unmet needs in a gynecologic cancer sample using CaSUN focused on emotional and social issues such as worry, stress, coping, and relationships with, and expectations of, others.25
Barg et al23 conducted a survey of unmet needs in the United States using a detailed list based on prior survivor research and targeting individuals in a cancer registry. The most prominent area of need expressed was “emotional,” similar to the high rank of E needs in our study. In contrast to our study, however, physical and financial issues also were prominent. The latter variances might be explained by differences in access to care, or perhaps the study’s low response rate (23.8%). A similar survey reported by Campbell et al12 identified needs in the emotional domain as the most cited unmet survivor needs based on psychometrically developed subscales of a 152-item survey (29% response rate).
These results from several studies, including ours, call for more detailed exploration of the E needs of long-term cancer survivors. A useful framework developed by Stein et al28 accounts for factors contributing to cancer stress and burden as well as resources available to survivors (intrapersonal, social, informational, and tangible services), with the interactions between these 2 domains determining how well a survivor will be able to cope. There clearly is a role for development of more effective communication channels and focused services to meet survivor needs.
The list of most common unmet needs in TABLE 3 also includes a focus on “problems with your sex life” (P4). This is an area that may be difficult to address in a cancer care setting because of the focus on disease management. Primary care providers might be better prepared to address this issue because they likely encounter similar issues among the wide range of patients they serve. However, a recent study reported that only 46% of internists were somewhat or likely to initiate a discussion about sexuality with cancer survivors.29 Some additional preparation for physicians to address this need might be warranted.
The proportion in this sample reporting needs for access to, or information about, complementary and alternative medicine services fell below the thresholds chosen to designate common needs in this study. Although reported use is relatively common among cancer survivor in several studies,30-32 it appears that in our survivor sample, those who were interested in these approaches encountered only moderate barriers.
Study limitations. We invited participants from a registry unlikely to include cancer survivors with lower educational attainment or from rural locations9—that is, our participants were less likely to have challenges in obtaining appropriate services and information. This sample limitation therefore likely underestimates the overall level of needs among cancer survivors.
This was a cross-sectional assessment of perceived needs among a diverse group of survivors, which may have overlooked needs that were met but only after considerable effort on the part of survivors. Longitudinal studies would provide more complete accounts of how readily needs are met and the changes in needs at different times in the continuum of care.
The Vermont population is less diverse racially and ethnically, but not with respect to household income or educational attainment, than the overall US population. Access to health care also is relatively high in Vermont compared with many other states. According to a 2009 Vermont Household Health Insurance Survey, only 7.6% of Vermonters are uninsured.33
CORRESPONDENCE
Berta Geller, EdD, University of Vermont, Health Promotion Research/Family Medicine, 1 South Prospect Street, Burlington, VT 05401-3444; berta.geller@uvm.edu
ACKNOWLEDGEMENTS
We would like to thank Anne Dorwaldt, Kathy Howe, Mark Bowman and John Mace at the University of Vermont, and the Cancer Survivor Community Study Steering Committee for their contributions to the successful completion of this study. We also thank the cancer survivors who participated in the pilot testing and the overall survey.
1. Potosky A, Han PK, Rowland J, et al. Differences between primary care physicians’ and oncologists’ knowledge, attitudes and practices regarding the care of cancer survivors. J Gen Intern Med. 2011;26:1403-1410.
2. Rowland J. Survivorship research: past, present, and future. In: Chang AE, Ganz PA, Hayes DF, et al, eds. Oncology: An Evidence-Based Approach. New York, NY: Springer; 2005:1753-1767.
3. Jemal A, Center MM, DeSantis C, et al. Global patterns of cancer incidence and mortality rates and trends. Cancer Epidemiol Biomarkers Prev. 2010;19:1893-1907.
4. Hewitt ME, Greenfield S, Stovall E, eds. From Cancer Patient to Cancer Survivor: Lost in Transition. Washington, DC: National Academies Press; 2005.
5. Hawkins NA, Smith T, Zhao L, et al. Health-related behavior change after cancer: results of the American Cancer Society’s studies of cancer survivors (SCS). J Cancer Surviv. 2010;4:20-32.
6. Katz ML, Reiter PL, Corbin S, et al. Are rural Ohio Appalachia cancer survivors needs different than urban cancer survivors? J Cancer Surviv. 2010;4:140-148.
7. Yabroff KR, Lawrence WF, Clauser S, et al. Burden of illness in cancer survivors: findings from a population-based national sample. J Natl Cancer Inst. 2004;96:1322-1330.
8. Sanson-Fisher R, Girgis A, Boyes A, et al; Supportive Care Review Group. The unmet supportive care needs of patients with cancer. Cancer. 2000;88:226-237.
9. Smith T, Stein KD, Mehta CC, et al. The rationale, design, and implementation of the American Cancer Society’s studies of cancer survivors. Cancer. 2007;109:1-12.
10. Geller BM, Mace J, Vacek P, et al. Are cancer survivors willing to participate in research? J Community Health. 2011;36: 772-778.
11. Crespi CM, Ganz PA, Petersen L, et al. Refinement and psychometric evaluation of the impact of cancer scale. J Natl Cancer Inst. 2008;100:1530-1541.
12. Campbell HS, Sanson-Fisher R, Turner D, et al. Psychometric properties of cancer survivors’ unmet needs survey. Support Care Cancer. 2010;19:221-230.
13. Hodgkinson K, Butow P, Hunt GE, et al. The development and evaluation of a measure to assess cancer survivors’ unmet supportive care needs: the CaSUN (Cancer Survivors’ Unmet Needs measure). Psychooncology. 2007;16:796-804.
14. Zebrack BJ, Ganz PA, Bernaards CA, et al. Assessing the impact of cancer: development of a new instrument for long-term survivors. Psychooncology. 2006;15:407-421.
15. Arora NK, Hesse BW, Rimer BK, et al. Frustrated and confused: the American public rates its cancer-related information-seeking experiences. J Gen Intern Med. 2008;23:223-228.
16. Hodgkinson K, Butow P, Hunt GE, et al. Breast cancer survivors’ supportive care needs 2-10 years after diagnosis. Support Care Cancer. 2007;15:515-523.
17. Harrison SE, Watson EK, Ward AM, et al. Primary health and supportive care needs of long-term cancer survivors: a questionnaire study. J Clin Oncol. 2011;29:2091-2098.
18. Rutten LJ, Squiers L, Treiman K. Requests for information by family and friends of cancer patients calling the National Cancer Institute’s Cancer Information Service. Psychooncology. 2006;15:664-672.
19. Beckjord EB, Arora NK, McLaughlin W, et al. Health-related information needs in a large and diverse sample of adult cancer survivors: implications for cancer care. J Cancer Surviv. 2008;2:179-189.
20. Rutten LJ, Arora NK, Bakos AD, et al. Information needs and sources of information among cancer patients: a systematic review of research (1980-2003). Patient Educ Couns. 2005;57:250-261.
21. Zebrack BJ, Block R, Hayes-Lattin B, et al. Psychosocial service use and unmet need among recently diagnosed adolescent and youg adult patients. Cancer. 2013;119:201-214.
22. Keegan TH, Lichtensztajn DY, Kato I, et al. Unmet adolescent and young adult cancer survivors information and service needs: a population-based cancer registry study. J Cancer Surviv. 2012;6:239-250.
23. Barg KF, Cronholm PF, Straton JB, et al. Unmet psychosocial needs of Pennsylvanians with cancer: 1996-2005. Cancer. 2007;110:631-639.
24. American College of Surgeons. Cancer Program Standards 2012: Ensuring Patient-Centered Care. Chicago, IL: American College of Surgeons; 2011.
25. Hodgkinson K, Butow P, Fuchs A, et al. Long-term survival from gynecologic cancer: psychosocial outcomes, supportive care needs and positive outcomes. Gynecol Oncol. 2007;104:381-389.
26. Houts PS, Yasko JM, Kahn SB, et al. Unmet psychological, social, and economic needs of persons with cancer in Pennsylvania. Cancer. 1986;58:2355-2361.
27. Holland JC, Reznik I. Pathways for psychosocial care of cancer survivors. Cancer. 2005;104(11 suppl):2624-2637.
28. Stein KD, Syrjala KL, Andrykowski MA. Physical and psychological long-term and late effects of cancer. Cancer. 2008;112(11 suppl):2577-2592.
29. Park ER, Bober SL, Campbell EG, et al. General: Internist communication about sexual function with cancer survivors. J Gen Intern Med. 2009;24(suppl 2):S407-S411.
30. Girgis A, Adams J, Sibbritt D. The use of complementary and alternative therapies by patients with cancer. Oncol Res. 2005;15:281-289.
31. Gansler T, Kaw C, Crammer C, et al. A population-based study of prevalence of complementary methods use by cancer survivors: a report from the American Cancer Society’s studies of cancer survivors. Cancer. 2008;113:1048-1057.
32. Fouladbakhsh JM, Stommel M. Gender, symptom experience, and use of complementary and alternative medicine practices among cancer survivors in the U.S. cancer population. Oncol Nurs Forum. 2010;37:E7-E15.
33. Vermont Department of Financial Regulation. Vermont Household Health Insurance Survey (VHHIS). Vermont Department of Financial Regulation Web site. Available at: http://www.dfr.vermont.gov/insurance/health-insurance/vermont-household-health-insurance-survey-vhhis. Accessed July 15, 2014.
Quality and Safety During Off Hours
Patients experience acute illness at all hours of the day. In acute care hospitals, over 60% of patient admissions occur outside of normal business hours, or the off hours.[1, 2] Similarly, the acute decompensation of patients already admitted to hospital‐based units is frequent, with 90% of rapid responses occurring between 9 pm and 6 am.[3] Research suggests worse hospital performance during off hours, including increased patient falls, in‐hospital cardiac arrest mortality, and severity of hospital employee injuries.[2, 4, 5, 6, 7]
Although hospital‐based services should match care demand, the disparity between patient acuity and hospital capability at night is significant. Off hours typically have lower staffing of nurses, and attending and housestaff physicians, and ancillary staff as well as limited availability of consultative and supportive services.[8] Additionally, off‐hours providers are subject to the physiological effects of imbalanced circadian rhythms, including fatigue, attenuating their abilities to provide high‐quality care. The significant patient care needs mandate continuous patient care delivery without compromising quality or safety. To achieve this, further defining the barriers to delivering quality care during off hours is essential to improvement efforts in medicine‐based units.
Previous investigations have found increased occurrence and severity of worker accidents, increased potential for higher occurrence of preventable adverse patient events, and decreased performance during off hours.[4, 9, 10] Additionally, detrimental effects of off‐hours care may be further magnified by rotating employees through both day and night shifts, a common practice in academic hospitals.[11, 12] Potentially modifiable outcomes, such as patient fall rate and in‐hospital cardiac arrest survival differ markedly between day and night shifts.[6, 13] These studies primarily report on specific diseases, such as myocardial infarction and stroke, and are investigated from the perspective of hospital‐level outcomes.
To our knowledge, no study has reported provider‐perceived quality and safety issues occurring during off hours in an academic setting. Likewise, although off‐hours collaborative care requires shared, interprofessional conceptualization regarding care delivery, this perspective has not been reported. Understanding the similarities and differences between provider perceptions will allow the construction of an interprofessional team mental model, facilitating the design of future quality improvement initiatives.[14, 15] Our objectives were to: (1) identify off‐hours quality and safety issues, (2) assess which issues are perceived as most significant, and (3) evaluate differences in perceptions of these issues between nurses, and attending and housestaff physicians.
METHODS
Study Design
To investigate quality and safety issues occurring during off hours, we employed a prospective, mixed‐methods sequential exploratory study design, involving an initial qualitative analysis of adverse events followed by quantitative survey assessment.[16] We chose a mixed‐methods approach because provider‐perceived off‐hours issues had not been explicitly identified in the literature, requiring preliminary qualitative assessment. For the purpose of this study, we defined off hours as the 7 pm to 7am time period, which overlapped night shifts for both nurses and physicians. The study was approved by the institutional review board as a quality improvement project.
Study Setting
The study was conducted at a 378‐bed, university‐based acute care hospital in central Pennsylvania. There are a total of 64 internal medicine beds located in 2 units: a general medicine unit (44 beds, staffed by 60 nurses, nurse‐to‐patient ratio 1:4) and an intermediate care unit (20 beds, staffed by 41 nurses, nurse‐to‐patient ratio 1:3). The medicine residency program consists of 69 residents and 14 combined internal medicinepediatrics residents. During the day, 3 teaching teams and 1 nonteaching team care for all medicine patients. Overnight, 3 junior/senior level residents admit patients to the medicine service, whereas 2 interns provide cross‐coverage for all medicine and specialty service patients. Starting in September 2012 (before data collection), an overnight faculty‐level academic hospitalist, or nocturnist, provided on‐site housestaff supervision.
Qualitative Data Collection
For the qualitative analysis, we used 2 methods to develop our database. First, we created an electronic survey (see Supporting Information, Appendix 1, in the online version of this article) to identify near misses/adverse events occurring overnight, distributed to the nocturnist, 3 daytime hospitalists, and unit charge nurses following each shift (October 2012March 2013). The survey items were developed for the purpose of this study, with several items modified from a previously published survey.[17] Second, residency program directors recorded field notes during end‐of‐rotation debriefings (1 hour) with departing overnight housestaff, which were then dictated and transcribed. The subsequent analysis from these sources informed the quantitative survey (see Supporting Information, Appendix 2, in the online version of this article).
Survey Instrument
Three months after the initiation of qualitative data collection, 1 investigator (J.D.G.) developed a preliminary codebook to identify categories and themes. From this codebook, the research team drafted a survey instrument (the complete qualitative analysis occurred after survey development). To maintain focus on systematic quality improvement, items related to perceived mismanagement, relationship tensions, and professionalism were excluded. The survey was pilot‐tested with 5 faculty physicians and 2 nursing staff, prompting several modifications to improve clarity. Primary demographic items included provider role (nurse, attending physician, or housestaff physician) and years in current role. The 24 survey items were grouped into 5 different categories: (1) Quality of Care Delivery, (2) Communication and Coordination, (3) Staffing and Supervision, (4) Patient Transfers, and (5) Consulting Service Issues. Each item was investigated on a 7‐point scale (1=lowest rating, 7=highest rating). Descriptive text was provided at the extremes (choices 1 and 7), whereas intermediary values (26) did not have descriptive cues. The descriptive anchors for Quality of Care Delivery and Patient Transfers were 1=never and 7=always, whereas the descriptive anchors Communication and Coordination and Staffing and Supervision were 1=poor and 7=superior; Consulting Service Issues used a mix of both. Providers with off‐hours experience were asked to rank 4 time periods (710 pm, 10 pm1 am, 14 am, 47 am) regarding quality of care delivery in the medicine units (1=best, 4=worst). We asked both daytime and nighttime providers about perceptions of off‐hours care because, given the boundary spanning the nature of medical care across work shifts, daytime providers frequently identify issues not apparent until hours (or even days) after completion of a night shift. A similar design was used in prior work investigating safety at night.[17]
Quantitative Data Collection
In June of 2013, we emailed a survey link (
Data Analysis
Using the preliminary codebook, 2 investigators (J.D.G., E.M.) jointly analyzed a segment of the dataset using Atlas.ti 6.0 (Scientific Software, Berlin, Germany). Two investigators independently coded the data, compared codes for agreement, and updated the codebook. The remaining data were coded independently, with regular adjudication sessions to modify the codebook. All investigators reviewed and agreed upon themes and representative quotations.
Descriptive statistics, Pearson correlation statistics, Kruskal‐Wallis tests, and signed rank tests (with Bonferroni correction) were used to report group characteristics, correlate rank order, make comparisons between groups (nursing staff, and attending and housestaff physicians; day/night providers), and compare quality rankings by time period, respectively. The data were analyzed using SAS 9.3 (SAS Institute Inc., Cary, NC) and Stata/IC‐8 (StataCorp, College Park, TX).
RESULTS
Qualitative Analysis of Off‐Hours' Adverse Events and Near Misses
A total of 190 events were reported by daytime attending physicians (n=100), nocturnists (n=60), and nighttime charge nurses (n=30). Although questions asked participants to describe near misses/adverse events, respondents also reported a number of global quality issues not related to specific events. Similarly, debriefing sessions with housestaff (n=5) addressed both specific overnight events and residency‐related issues. Seven themes were identified: (1) perceived mismanagement, (2) quality of delivery processes, (3) communication and coordination, (4) staffing and supervision, (5) patient transfers, (6) consulting service issues, and, (7) professionalism/relational tensions. Table 1 lists the code frequencies and exemplary quotations.
| Category and Themes | Code Frequency No. (% of 322) | Representative Quotation |
|---|---|---|
| ||
| Perceived mismanagement | 97 (30) | We had a new admission to the general medicine unit with atrial flutter and rapid ventricular response who did not receive rate controlling agents but rather received diuretics. [The patient's] heart rate remained between 110 and 130 overnight, with a troponin rise in the am likely from demand. The attending note states rate controllers and discussed with housestaff, but this was not performed. |
| Quality of delivery processes | 63 (20) | One patient had a delay in MRI scanning in the off hours due to the scanner being down and scheduling. When the patient went down, there seemed to be little attempt to make sure patient went through scanner; unclear if housestaff called or not to come to assist. Now, the delay in care is even further along. |
| Communication and coordination | 50 (16) | A patient was transferred to the intermediate care unit with hypercarbic respiratory failure. The patient had delay of >1 hour to receive IV Bumex because pharmacy would not release the dose from Pyxis, and the nurse did not let us know there was a delay. When I asked the nurse why, she responded because she's not the only patient I have. I pointed out that the patient was in failure and needed Bumex, stat. If we had not clearly communicated either verbally or via computer, she should let us know how to do that better. |
| Staffing and supervision | 39 (12) | A patient was admitted DNR/DNI with advanced dementia, new on BiPaP at 100%, and hypotensive. The team's intern [identified] the need for interventions, including a central line. This was discussed with overloaded intensive care unit resident. The intern struggled until another resident assisted along with the night attending. Issues included: initial triage, no resident backup for team, and attending backup. I should have been more hands on in the moment to assist the intern navigating the system of care. Many issues here, but no senior resident was involved in care until [late]. |
| Patient transfers | 38 (12) | One patient went from the emergency department [to us] on the 5th floor at 7:45 pm. The ED placed an order for packed red blood cells and it was written at 4:45 pm. When patient arrived on our floor at 7:45 pm, the transfusion had not been started. The floor nurse started it at 8:10 pm . |
| Consulting services | 18 (6) | Regarding a new outside hospital transfer, the medicine team was informed that [the consulting service] would place official consult on the chart when imaging studies from the outside institution were available. Despite this, the consult was still not done after 36 hours, and [we are] still waiting. We contacted service several times. |
| Professionalism and relational tensions | 17 (5) | [One admission from the emergency department] involved a patient who received subcutaneous insulin for hyperkalemia as opposed to intravenous insulin. When brought to [their] attention, they became very confrontational and abrupt and denied having ordered or administered it that way, although it was documented in the EMR. |
Perceived Mismanagement
Participants commonly questioned the decision making, diagnosis, or management of off‐hours providers. Concerns included the response to acute illness (eg, delay in calling a code), treatment decisions (eg, diuresis in a patient with urinary retention), or omission of necessary actions (eg, no cultures ordered for septicemia).
Quality of Delivery Processes
Participants frequently described quality of care delivery issues primarily related to timeliness or delays in delivery processes (34/63 coding references), or patient safety issues (29/63 coding references). Described events revealed concerns about the timeliness of lab reporting, imaging, blood draws, and medication ordering/processing.
Communication and Coordination
Breakdowns in communication and coordination often threatened patient safety. Identified issues included poor communication between primary physicians, nurses, consulting services, and emergency department (ED) providers, as well as documentation within the electronic medical record.
Staffing and Supervision
Several events highlighted staffing or supervision limitations, such as perceived low nursing or physician staffing levels. The degree of nocturnist supervision was polarizing, with both increased and decreased levels of supervision reported as limiting care delivery (or housestaff education).
Patient Transfers
Patient transfers to medicine units from the ED, other inpatient units, or outside hospitals, were identified several times as an influential factor. The care transition and need for information exchange led to a perceived compromise in quality or safety.
Consulting Service Issues
Several examples highlighted perceived issues related to the communication, coordination, or timeliness of consultant services in providing care.
Professionalism/Relational Tensions
Last, providers described situations in which they perceived lack of professionalism or relational tensions between providers, either in regard to interactions or clinical decisions in patient care.
Quantitative Results
Of 214 surveys sent, data were collected from 160 respondents (75% response), including 64/101 nursing staff (63% response), 25/28 attending physicians (80% response), and 71/85 housestaff physicians (84% response). Table 2 describes the participant demographics.
| Variable | No. (%) |
|---|---|
| |
| Nursing staff | 64 (40) |
| Intermediate care unit | 20 |
| General medicine ward | 44 |
| All night shifts | 16 |
| Mix of day and night shifts | 26 |
| Years of experience, mean (SD) | 7.7 (9.7) |
| Attending physicians | 25 (16) |
| No. providing care only at night | 4 |
| No. of weeks as overnight hospitalist in past year, mean (SD) | 11.5 (4.1) |
| No. providing care only during the day | 21 |
| Years since residency graduation, mean (SD) | 9.0 (8.5) |
| Medicine residents | 71 (44) |
| Intern | 27 |
| Junior resident | 23 |
| Senior resident* | 21 |
Off‐Hours Quality and Safety Issues
Ratings and comparisons of the 24 items are shown in Table 3. For all items, the mean rating was below 5 (7‐point scale). Lowest‐rated (least optimal) items were: timeliness, safety, and communication involved with patients admitted from the ED, number of attending physicians, and timeliness of consults and blood draws. Highest‐rated (more optimal) items were: timely reporting of labs, timely identification of deteriorating status, medication ordering and processing, communication between physicians, and safety and communication involved with intraservice transfers.
| Category and Survey Item, Mean (SD)* | Total (160) | Providers With Night Experience | Nighttime Providers (116) | Daytime Providers (44) | P Value | |||
|---|---|---|---|---|---|---|---|---|
| Nurses (41) | Attending Physicians (4) | Housestaff (71) | P Value | |||||
| ||||||||
| Quality of care delivery | ||||||||
| Timely reporting of labs at night | 4.70 (1.39) | 5.12 (1.50) | 4.50 (1.00) | 4.61 (1.47) | 0.11 | 4.78 (1.48) | 4.48 (1.11) | 0.09 |
| Timely identification of deteriorating status | 4.67 (1.34) | 4.88 (1.36) | 5.00 (0.82) | 4.85 (1.20) | 0.93 | 4.86 (1.24) | 4.16 (1.45) | 0.006 |
| Medication ordering and processing | 4.63 (1.13) | 4.88 (1.25) | 5.25 (0.50) | 4.66 (1.08) | 0.19 | 4.76 (1.13) | 4.27 (1.06) | 0.01 |
| Timely completion of imaging at night | 4.29 (1.32) | 4.32 (1.46) | 4.75 (0.96) | 4.39 (1.29) | 0.88 | 4.38 (1.34) | 4.05 (1.26) | 0.12 |
| Timely reporting of results at night | 4.19 (1.43) | 4.27 (1.53) | 4.00 (1.83) | 4.11 (1.44) | 0.84 | 4.16 (1.47) | 4.27 (1.30) | 0.76 |
| Timely med release from pharmacy at night | 4.16 (1.29) | 4.00 (1.32) | 4.50 (0.58) | 4.28 (1.29) | 0.44 | 4.19 (1.28) | 4.09 (1.31) | 0.90 |
| Timely blood draws at night | 3.96 (1.52) | 4.63 (1.44) | 4.50 (0.58) | 3.53 (1.49) | <0.001 | 3.96 (1.54) | 3.98 (1.47) | 0.98 |
| Communication and coordination | ||||||||
| Communication between physicians | 4.63 (1.26) | 4.29 (1.23) | 6.00 (1.15) | 5.14 (1.12) | <0.001 | 4.87 (1.24) | 3.98 (1.09) | <0.001 |
| Communication between nursing and pharmacy | 4.39 (1.27) | 4.83 (1.41) | 5.00 (0.82) | 4.27 (1.29) | 0.04 | 4.49 (1.34) | 4.11 (4.11) | 0.08 |
| Communication between nursing and physicians | 4.39 (1.28) | 4.44 (1.36) | 5.00 (0.82) | 4.58 (1.31) | 0.64 | 4.54 (1.31) | 3.98 (1.13) | 0.01 |
| Documentation in medical record | 4.33 (1.36) | 5.00 (1.36) | 6.00 (0.82) | 4.23 1.19) | <0.001 | 4.56 (1.31) | 3.70 (1.30) | <0.001 |
| Ease of contacting primary providers at night | 4.31 (1.29) | 4.46 (1.27) | 6.00 (0.00) | 4.54 (1.18) | 0.02 | 4.56 (1.22) | 3.66 (1.27) | <0.001 |
| Staffing and supervision | ||||||||
| No. of nursing staff | 4.51 (1.27) | 4.54 (1.50) | 5.50 (0.58) | 4.59 (1.21) | 0.25 | 4.60 (1.31) | 4.25 (1.14) | 0.025 |
| Supervision of housestaff | 4.43 (1.34) | 4.56 (1.40) | 6.25 (0.50) | 4.55 (1.34) | 0.03 | 4.61 (1.37) | 3.95 (1.14) | 0.002 |
| No. of housestaff | 4.09 (1.39) | 4.27 (1.40) | 4.50 (1.29) | 4.11 (1.44) | 0.70 | 4.18 (1.41) | 3.86 (1.32) | 0.12 |
| No. of ancillary staff | 4.00 (1.40) | 4.27 (1.53) | 5.75 (0.96) | 3.85 (1.40) | 0.02 | 4.06 (1.48) | 3.84 (1.18) | 0.27 |
| No. of attending physicians | 3.79 (1.50) | 3.49 (1.76) | 5.25 (0.96) | 3.89 (1.43) | 0.07 | 3.79 (1.57) | 3.80 (1.32) | 0.98 |
| Patient transfers | ||||||||
| For patients accepted to medicine from another medicine unit | ||||||||
| Timely and safe patient transfers | 4.56 (1.28) | 5.15 (1.11) | 4.75 (0.50) | 4.55 (1.23) | 0.025 | 4.77 (1.20) | 4.00 (1.33) | 0.001 |
| High quality communication between providers | 4.55 (1.35) | 5.34 (1.13) | 5.00 (0.82) | 4.49 (1.22) | 0.001 | 4.81 (1.24) | 3.86 (1.41) | <0.001 |
| For patients admitted from emergency department to medicine unit | ||||||||
| Appropriate testing and treatment | 4.16 (1.34) | 4.15 (1.30) | 4.00 (1.83) | 4.21 (1.43) | 0.96 | 4.18 (1.39) | 4.11 (1.20) | 0.66 |
| Timely and safe transfers | 3.89 (1.38) | 3.63 (1.50) | 5.50 (0.58) | 4.08 (1.32) | 0.02 | 3.97 (1.40) | 3.68 1.29) | 0.23 |
| High‐quality communication between providers | 2.93 (1.38) | 2.56 (1.23) | 3.75 (1.26) | 3.00 (1.39) | 0.08 | 2.87 (1.35) | 3.07 (1.47) | 0.41 |
| Consulting service issues | ||||||||
| Timely consults at night | 4.04 (1.35) | 4.27 (1.28) | 4.00 (0.82) | 4.10 (1.47) | 0.69 | 4.16 (1.38) | 3.73 (1.25) | 0.053 |
| Communication between consults and physicians | 3.93 (1.40) | 3.46 (1.45) | 5.75 (1.26) | 4.35 (1.27) | <0.001 | 4.09 (1.42) | 3.50 (1.27) | 0.016 |
Comparisons Between Professional Groups With Night Experience
Of the 24 items, 11 showed statistically significant differences between groups (P<0.05). Items with the largest difference between groups included: timely blood draws at night (housestaff physicians lowest), communication between physicians (nursing lowest), documentation in medical record (housestaff physicians lowest), and communication between consults and physicians (nursing lowest). The rank order between housestaff physicians and nurses, and housestaff and attending physicians showed moderately positive correlations (r=0.61, P=0.002 and r=0.47, P=0.022, respectively). The correlation between nurses and attending physicians showed a weak correlation (r=0.19, P=0.375).
Comparisons Between Front‐Line Providers With and Without Night Experience
Of the 24 items, 12 showed statistically significant differences between groups (P<0.05), with day providers reporting lower ratings in all 12. Items with the largest difference between groups included: communication between consults and physicians, ease of contacting providers, communication between providers, documentation, and safety and communication related to transfers from other units. The rank order between night and day groups showed a statistically significant positive correlation (r=0.65, P=0.001).
Perceived Highest Quality of Care Time Period During Off Hours
Compared with other time periods, all providers ranked 4 to 7 am as the period with the lowest quality of care delivery (mean rank 3.2, P0.001) (Figure 1). Nursing staff and attending physicians both ranked the 10 pm to 1 am time period as the best period (mean of 2.0 and 1.5, respectively), whereas housestaff physicians ranked the 7 to 10 pm as the best time period (mean 1.62). The only statistical difference between provider groups for any given time period was the 7 to 10 pm time period (P=0.002).

DISCUSSION
In this prospective, mixed‐methods study evaluating perceived off‐hours quality and safety issues, several themes were identified, including perceived mismanagement, insufficient quality of delivery processes, communication/coordination breakdowns, and staffing and supervision issues. In the quantitative analysis, lowest‐rated items (lowest quality) related to timeliness/safety/communication involved with ED transfers, number of attending physicians, and timeliness of consults and blood draws. Highest‐rated items (highest quality) related to timeliness of lab reporting and identification of deteriorating patients, medication ordering/processing, communication between physicians, and safety/communication during intraservice transfers. In general, day providers reported lower ratings than night providers on nearly all quality‐related items. Nursing staff reported the lowest ratings regarding communication between physicians and consults, whereas housestaff physicians reported the lowest ratings regarding documentation in the medical record and timely blood draws. These between‐group differences reveal the lack of shared conceptual understanding regarding off‐hours care delivery.
Our qualitative results reveal several significant issues related to care delivery during off hours, many of which are not obtainable by hospital‐level data or chart review.[18] For hospital‐based medicine units, an understanding of the structure‐ and process‐related factors associated with events is required for quality improvement efforts. Although the primary focus for this work was the off hours, it is plausible that providers may have identified similar issues as important issues during daytime hours. Our study was not designed to investigate if these perceived issues are specific to off hours, or if these issues are an accurate reflection of objective events occurring during this time period. We believe this topic deserves further investigation, as understanding if these off‐hours perceptions are unique to this time period would change the scope of future quality improvement initiatives.
The most significant finding in the quantitative results was the vulnerability in quality and safety during patient admissions from the ED, specifically in relation to communication and timeliness of transfer. Between‐unit handoffs for patients admitted from the ED to medicine units have been identified as particularly vulnerable to breakdowns in the communication process.[19, 20, 21, 22] There are multiple etiologies, including clinical uncertainty, higher acuity in patient illness early in hospitalization, and cultural differences between services.[23] Additionally, patterns of communication and standardized handoff processes are often insufficient. In our hospital system, the transfer process relies primarily upon synchronous communication methods without standardized, asynchronous information exchange. We hypothesize front‐line providers perceive this lack of standardization as a primary threat to quality. Because approximately 60% of new patient admissions from the ED to medicine service (both in our hospital and in prior studies) occur during off hours, these findings highlight a need for subsequent study and quality improvement efforts.[24]
During the time of this study, our medicine units were staffed at night by 5 medicine housestaff physicians and 1 academic hospitalist, or nocturnist. In efforts to improve quality and safety during off hours, our hospital, as well as other health systems, implemented the nocturnist position, a faculty‐level attending physician to provide off‐hours clinical care and housestaff supervision.[25] Although participants reported a moderate rating of housestaff supervision, participants provided lower scores for staffing numbers of nurses, and housestaff and attending physicians, despite nocturnist presence. With both increased off‐hours supervision in our hospital and increasing use of faculty‐level physicians in other academic programs, these results provide context for the anticipated level of overnight housestaff supervision.[26, 27] To our knowledge, this is the first study to investigate perceived overnight quality issues on medicine units following such staffing models. Although this model of direct, on‐site supervision in academic medicine programs may help offset staffing and supervisory issues during off hours, the nocturnist role is insufficient to offset threats to quality/safety already inherent within the system. Furthermore, prospective trials following implementation of nocturnist systems have shown mixed results in improving patient outcomes.[28] These findings have led some to question whether resources dedicated to nocturnist staffing may be better allocated to other overnight initiatives, highlighting the need for a more subtle understanding of quality issues to design targeted interventions.[29]
A notable finding from this work is that providers without night experience reported lower scores for 20 of 24 items, highlighting their perceptions of the quality of care delivery during off hours are lower than those who experience this environment. Although day providers are not directly experiencing off‐hours delivery processes, these providers receive and detect the results from care delivery at night.[17] Most nurse, physician, and hospital leaders are present in the hospital only during day hours, requiring these individuals to account for differences in perceived and actual care delivered overnight.[1] These individuals make critical decisions pertaining to process changes and quality improvement efforts in these units. We believe these results raise awareness for leadership decisions and quality improvement efforts in medicine service units, specifically to focus on overnight issues beyond staffing issues alone.
All respondent groups ranked the latter half of the shift (17 am) as lower in quality compared to the first 6 hours (7 pm1 am). This finding is contrary to our hypothesis that earlier time periods, during the majority of patient admissions (and presumed higher workload for all providers), would be perceived as lower quality. Reasons for this finding are unknown, but may relate to end‐of‐shift tasks, sign‐out preparation, provider fatigue, or disease‐related concerns (eg, increased incidence of stroke and myocardial infarction) during the latter portions of night shifts. One study identified a decrease in nursing clinical judgments from the beginning to end of 12‐hour shifts, with a potential suggested mechanism of decrease in ability to maintain attention during judgments.[30] Additionally, in a study by Folkard et al., risk was highest within the first several hours and fell substantially thereafter during a shift.[9] To our knowledge, no work has investigated perceived or objective quality outcomes by time period during the off‐hours shift in medicine units. Further work could help delineate why provider‐perceived compromises in quality occur late in off‐hours shifts and whether this correlates to safety events.
There are several limitations to our study. First, although all surveys were pilot tested for content validity, the construct validity was not rigorously assessed. Second, although data were collected from all participant groups, the collection methods were unbalanced, favoring attending‐level physician perspectives. Although the relative incidence of vulnerabilities in quality and safety should be interpreted with caution, our methods and general taxonomy provide a framework for developing and monitoring the perceptions of future interventions. Due to limitations in infrastructure, our findings could not be independently validated through review of reported adverse events, but previous investigations have found the vast majority of adverse events are not detected by standard anonymous reporting.[31, 32, 33] Our methodology (used in our prior work) may provide an independent means of detecting causes of poor quality not easily observed through routine surveillance.[22] Although many survey items showed statistical differences between provider groups, the clinical significance is subject to interpretation. Last, the perceptions and events related to our institution may not be fully generalizable to other academic programs or service lines, particularly in community‐based, nonteaching hospitals.
In conclusion, our results suggest a significant discrepancy between the concerns of day and night providers regarding the quality of care delivered to inpatients during the off hours, specifically with issues related to communication, quality‐of‐care delivery processes, and patient transfers from the ED. Although specific concerns may be institution‐ (and service line‐) dependent, appropriately designing initiatives to improve the quality of care delivered overnight will need to take the perspectives of both provider groups into account. Additionally, educational initiatives should focus on achieving a shared mental model among all providers to improve collaboration and performance.
Acknowledgements
The authors thank the nurses, internal medicine housestaff physicians, and general internal medicine attending physicians at the Penn State Hershey Medical Center for their participation in this study.
Disclosure: Nothing to report.
- . Like night and day—shedding light on off‐hours care. N Engl J Med. 2008;358(20):2091–2093.
- , , , . Call nights and patient care. J Gen Intern Med. 1992;7(4):405–410.
- , , , et al. Uncovering system errors using a rapid response team: cross‐coverage caught in the crossfire. Discussion. J Trauma. 2009;67(1):173–179.
- , . The impact of shift work on the risk and severity of injuries for hospital employees: an analysis using Oregon workers' compensation data. Occup Med (Lond). 2004;54(8):556–563.
- , . Mortality among patients admitted to hospitals on weekends as compared with weekdays. N Engl J Med. 2001;345(9):663–668.
- , , , et al. The association of shift‐level nurse staffing with adverse patient events. J Nurs Adm. 2011;41(2):64–70.
- , , , et al. Heart disease and stroke statistics—2010 update A report from the American Heart Association. Circulation. 2010;121(7):e46–e215.
- , , , , O'Neil E. Minimum Nurse Staffing Ratios In California Acute Care Hospitals. Oakland, CA: California Workforce Initiative; 2000.
- , . Shift work, safety and productivity. Occup Med (Lond). 2003;53(2):95–101.
- , , . Increased injuries on night shift. Lancet. 1994;344(8930):1137–1139.
- , . Shift and night work and long working hours‐a systematic review of safety implications. Scand J Work Environ Health. 2011:37(3):173–185.
- , , , et al. Rotating shift work, sleep, and accidents related to sleepiness in hospital nurses. Am J Public Health. 1992;82(7):1011–1014.
- , , , et al. Survival from in‐hospital cardiac arrest during nights and weekends. JAMA. 2008;299(7):785–792.
- , , , , . The influence of shared mental models on team process and performance. J Appl Psychol. 2000;85(2):273.
- , . Team mental models and their potential to improve teamwork and safety: a review and implications for future research in healthcare. Saf Sci. 2012;50(5):1344–1354.
- . Editorial: mapping the field of mixed methods research. J Mix Methods Res. 2009;3(2):95–108.
- , . Decreasing adverse events through night talks: an interdisciplinary, hospital‐based quality improvement project. Perm J. Fall 2009;13(4):16–22.
- , , , et al. “Global trigger tool” shows that adverse events in hospitals may be ten times greater than previously measured. Health Aff (Millwood). 2011;30(4):581–589.
- , , , , , . Dropping the baton: a qualitative analysis of failures during the transition from emergency department to inpatient care. Ann Emerg Med. 2009;53(6):701–710.e704.
- . Smoothing transitions. Joint Commission targets patient handoffs. Mod Healthc. 2010;40(43):8–9.
- , , , , , . The patient handoff: a comprehensive curricular blueprint for resident education to improve continuity of care. Acad Med. 2012;87(4):411–418.
- , , , , , . Patient care transitions from the emergency department to the medicine ward: evaluation of a standardized electronic signout tool. Int J Qual Health Care. 2014;26(4):337–347.
- , . The unappreciated challenges of between‐unit handoffs: negotiating and coordinating across boundaries. Ann Emerg Med. 2013;61(2):155–160.
- , , , , , . The association between night or weekend admission and hospitalization‐relevant patient outcomes. J Hosp Med. 2011;6(1):10–14.
- . Middle‐of‐the‐night medicine is rarely patient‐centred. CMAJ. 2011;183(13):1467–1468.
- , , , et al. Survey of overnight academic hospitalist supervision of trainees. J Hosp Med. 2012;7(7):521–523.
- , , , , , . Effects of increased overnight supervision on resident education, decision‐making, and autonomy. J Hosp Med. 2012;7(8):606–610.
- , , , et al. A randomized trial of nighttime physician staffing in an intensive care unit. N Engl J Med. 2013;368(23):2201–2209.
- . Intensivists at night: putting resources in the right place. Crit Care. 2013;17(5):1008.
- , , . Changes in nurses' decision making during a 12‐h day shift. Occup Med (Lond). 2013;63(1):60–65.
- , , , , , . The incident reporting system does not detect adverse drug events: a problem for quality improvement. Jt Comm J Qual Improv. 1995;21(10):541–548.
- , , , , . An evaluation of adverse incident reporting. J Eval Clin Pract. 1999;5(1):5–12.
- , . Reporting and preventing medical mishaps: lessons from non‐medical near miss reporting systems. BMJ. 2000;320(7237):759–763.
Patients experience acute illness at all hours of the day. In acute care hospitals, over 60% of patient admissions occur outside of normal business hours, or the off hours.[1, 2] Similarly, the acute decompensation of patients already admitted to hospital‐based units is frequent, with 90% of rapid responses occurring between 9 pm and 6 am.[3] Research suggests worse hospital performance during off hours, including increased patient falls, in‐hospital cardiac arrest mortality, and severity of hospital employee injuries.[2, 4, 5, 6, 7]
Although hospital‐based services should match care demand, the disparity between patient acuity and hospital capability at night is significant. Off hours typically have lower staffing of nurses, and attending and housestaff physicians, and ancillary staff as well as limited availability of consultative and supportive services.[8] Additionally, off‐hours providers are subject to the physiological effects of imbalanced circadian rhythms, including fatigue, attenuating their abilities to provide high‐quality care. The significant patient care needs mandate continuous patient care delivery without compromising quality or safety. To achieve this, further defining the barriers to delivering quality care during off hours is essential to improvement efforts in medicine‐based units.
Previous investigations have found increased occurrence and severity of worker accidents, increased potential for higher occurrence of preventable adverse patient events, and decreased performance during off hours.[4, 9, 10] Additionally, detrimental effects of off‐hours care may be further magnified by rotating employees through both day and night shifts, a common practice in academic hospitals.[11, 12] Potentially modifiable outcomes, such as patient fall rate and in‐hospital cardiac arrest survival differ markedly between day and night shifts.[6, 13] These studies primarily report on specific diseases, such as myocardial infarction and stroke, and are investigated from the perspective of hospital‐level outcomes.
To our knowledge, no study has reported provider‐perceived quality and safety issues occurring during off hours in an academic setting. Likewise, although off‐hours collaborative care requires shared, interprofessional conceptualization regarding care delivery, this perspective has not been reported. Understanding the similarities and differences between provider perceptions will allow the construction of an interprofessional team mental model, facilitating the design of future quality improvement initiatives.[14, 15] Our objectives were to: (1) identify off‐hours quality and safety issues, (2) assess which issues are perceived as most significant, and (3) evaluate differences in perceptions of these issues between nurses, and attending and housestaff physicians.
METHODS
Study Design
To investigate quality and safety issues occurring during off hours, we employed a prospective, mixed‐methods sequential exploratory study design, involving an initial qualitative analysis of adverse events followed by quantitative survey assessment.[16] We chose a mixed‐methods approach because provider‐perceived off‐hours issues had not been explicitly identified in the literature, requiring preliminary qualitative assessment. For the purpose of this study, we defined off hours as the 7 pm to 7am time period, which overlapped night shifts for both nurses and physicians. The study was approved by the institutional review board as a quality improvement project.
Study Setting
The study was conducted at a 378‐bed, university‐based acute care hospital in central Pennsylvania. There are a total of 64 internal medicine beds located in 2 units: a general medicine unit (44 beds, staffed by 60 nurses, nurse‐to‐patient ratio 1:4) and an intermediate care unit (20 beds, staffed by 41 nurses, nurse‐to‐patient ratio 1:3). The medicine residency program consists of 69 residents and 14 combined internal medicinepediatrics residents. During the day, 3 teaching teams and 1 nonteaching team care for all medicine patients. Overnight, 3 junior/senior level residents admit patients to the medicine service, whereas 2 interns provide cross‐coverage for all medicine and specialty service patients. Starting in September 2012 (before data collection), an overnight faculty‐level academic hospitalist, or nocturnist, provided on‐site housestaff supervision.
Qualitative Data Collection
For the qualitative analysis, we used 2 methods to develop our database. First, we created an electronic survey (see Supporting Information, Appendix 1, in the online version of this article) to identify near misses/adverse events occurring overnight, distributed to the nocturnist, 3 daytime hospitalists, and unit charge nurses following each shift (October 2012March 2013). The survey items were developed for the purpose of this study, with several items modified from a previously published survey.[17] Second, residency program directors recorded field notes during end‐of‐rotation debriefings (1 hour) with departing overnight housestaff, which were then dictated and transcribed. The subsequent analysis from these sources informed the quantitative survey (see Supporting Information, Appendix 2, in the online version of this article).
Survey Instrument
Three months after the initiation of qualitative data collection, 1 investigator (J.D.G.) developed a preliminary codebook to identify categories and themes. From this codebook, the research team drafted a survey instrument (the complete qualitative analysis occurred after survey development). To maintain focus on systematic quality improvement, items related to perceived mismanagement, relationship tensions, and professionalism were excluded. The survey was pilot‐tested with 5 faculty physicians and 2 nursing staff, prompting several modifications to improve clarity. Primary demographic items included provider role (nurse, attending physician, or housestaff physician) and years in current role. The 24 survey items were grouped into 5 different categories: (1) Quality of Care Delivery, (2) Communication and Coordination, (3) Staffing and Supervision, (4) Patient Transfers, and (5) Consulting Service Issues. Each item was investigated on a 7‐point scale (1=lowest rating, 7=highest rating). Descriptive text was provided at the extremes (choices 1 and 7), whereas intermediary values (26) did not have descriptive cues. The descriptive anchors for Quality of Care Delivery and Patient Transfers were 1=never and 7=always, whereas the descriptive anchors Communication and Coordination and Staffing and Supervision were 1=poor and 7=superior; Consulting Service Issues used a mix of both. Providers with off‐hours experience were asked to rank 4 time periods (710 pm, 10 pm1 am, 14 am, 47 am) regarding quality of care delivery in the medicine units (1=best, 4=worst). We asked both daytime and nighttime providers about perceptions of off‐hours care because, given the boundary spanning the nature of medical care across work shifts, daytime providers frequently identify issues not apparent until hours (or even days) after completion of a night shift. A similar design was used in prior work investigating safety at night.[17]
Quantitative Data Collection
In June of 2013, we emailed a survey link (
Data Analysis
Using the preliminary codebook, 2 investigators (J.D.G., E.M.) jointly analyzed a segment of the dataset using Atlas.ti 6.0 (Scientific Software, Berlin, Germany). Two investigators independently coded the data, compared codes for agreement, and updated the codebook. The remaining data were coded independently, with regular adjudication sessions to modify the codebook. All investigators reviewed and agreed upon themes and representative quotations.
Descriptive statistics, Pearson correlation statistics, Kruskal‐Wallis tests, and signed rank tests (with Bonferroni correction) were used to report group characteristics, correlate rank order, make comparisons between groups (nursing staff, and attending and housestaff physicians; day/night providers), and compare quality rankings by time period, respectively. The data were analyzed using SAS 9.3 (SAS Institute Inc., Cary, NC) and Stata/IC‐8 (StataCorp, College Park, TX).
RESULTS
Qualitative Analysis of Off‐Hours' Adverse Events and Near Misses
A total of 190 events were reported by daytime attending physicians (n=100), nocturnists (n=60), and nighttime charge nurses (n=30). Although questions asked participants to describe near misses/adverse events, respondents also reported a number of global quality issues not related to specific events. Similarly, debriefing sessions with housestaff (n=5) addressed both specific overnight events and residency‐related issues. Seven themes were identified: (1) perceived mismanagement, (2) quality of delivery processes, (3) communication and coordination, (4) staffing and supervision, (5) patient transfers, (6) consulting service issues, and, (7) professionalism/relational tensions. Table 1 lists the code frequencies and exemplary quotations.
| Category and Themes | Code Frequency No. (% of 322) | Representative Quotation |
|---|---|---|
| ||
| Perceived mismanagement | 97 (30) | We had a new admission to the general medicine unit with atrial flutter and rapid ventricular response who did not receive rate controlling agents but rather received diuretics. [The patient's] heart rate remained between 110 and 130 overnight, with a troponin rise in the am likely from demand. The attending note states rate controllers and discussed with housestaff, but this was not performed. |
| Quality of delivery processes | 63 (20) | One patient had a delay in MRI scanning in the off hours due to the scanner being down and scheduling. When the patient went down, there seemed to be little attempt to make sure patient went through scanner; unclear if housestaff called or not to come to assist. Now, the delay in care is even further along. |
| Communication and coordination | 50 (16) | A patient was transferred to the intermediate care unit with hypercarbic respiratory failure. The patient had delay of >1 hour to receive IV Bumex because pharmacy would not release the dose from Pyxis, and the nurse did not let us know there was a delay. When I asked the nurse why, she responded because she's not the only patient I have. I pointed out that the patient was in failure and needed Bumex, stat. If we had not clearly communicated either verbally or via computer, she should let us know how to do that better. |
| Staffing and supervision | 39 (12) | A patient was admitted DNR/DNI with advanced dementia, new on BiPaP at 100%, and hypotensive. The team's intern [identified] the need for interventions, including a central line. This was discussed with overloaded intensive care unit resident. The intern struggled until another resident assisted along with the night attending. Issues included: initial triage, no resident backup for team, and attending backup. I should have been more hands on in the moment to assist the intern navigating the system of care. Many issues here, but no senior resident was involved in care until [late]. |
| Patient transfers | 38 (12) | One patient went from the emergency department [to us] on the 5th floor at 7:45 pm. The ED placed an order for packed red blood cells and it was written at 4:45 pm. When patient arrived on our floor at 7:45 pm, the transfusion had not been started. The floor nurse started it at 8:10 pm . |
| Consulting services | 18 (6) | Regarding a new outside hospital transfer, the medicine team was informed that [the consulting service] would place official consult on the chart when imaging studies from the outside institution were available. Despite this, the consult was still not done after 36 hours, and [we are] still waiting. We contacted service several times. |
| Professionalism and relational tensions | 17 (5) | [One admission from the emergency department] involved a patient who received subcutaneous insulin for hyperkalemia as opposed to intravenous insulin. When brought to [their] attention, they became very confrontational and abrupt and denied having ordered or administered it that way, although it was documented in the EMR. |
Perceived Mismanagement
Participants commonly questioned the decision making, diagnosis, or management of off‐hours providers. Concerns included the response to acute illness (eg, delay in calling a code), treatment decisions (eg, diuresis in a patient with urinary retention), or omission of necessary actions (eg, no cultures ordered for septicemia).
Quality of Delivery Processes
Participants frequently described quality of care delivery issues primarily related to timeliness or delays in delivery processes (34/63 coding references), or patient safety issues (29/63 coding references). Described events revealed concerns about the timeliness of lab reporting, imaging, blood draws, and medication ordering/processing.
Communication and Coordination
Breakdowns in communication and coordination often threatened patient safety. Identified issues included poor communication between primary physicians, nurses, consulting services, and emergency department (ED) providers, as well as documentation within the electronic medical record.
Staffing and Supervision
Several events highlighted staffing or supervision limitations, such as perceived low nursing or physician staffing levels. The degree of nocturnist supervision was polarizing, with both increased and decreased levels of supervision reported as limiting care delivery (or housestaff education).
Patient Transfers
Patient transfers to medicine units from the ED, other inpatient units, or outside hospitals, were identified several times as an influential factor. The care transition and need for information exchange led to a perceived compromise in quality or safety.
Consulting Service Issues
Several examples highlighted perceived issues related to the communication, coordination, or timeliness of consultant services in providing care.
Professionalism/Relational Tensions
Last, providers described situations in which they perceived lack of professionalism or relational tensions between providers, either in regard to interactions or clinical decisions in patient care.
Quantitative Results
Of 214 surveys sent, data were collected from 160 respondents (75% response), including 64/101 nursing staff (63% response), 25/28 attending physicians (80% response), and 71/85 housestaff physicians (84% response). Table 2 describes the participant demographics.
| Variable | No. (%) |
|---|---|
| |
| Nursing staff | 64 (40) |
| Intermediate care unit | 20 |
| General medicine ward | 44 |
| All night shifts | 16 |
| Mix of day and night shifts | 26 |
| Years of experience, mean (SD) | 7.7 (9.7) |
| Attending physicians | 25 (16) |
| No. providing care only at night | 4 |
| No. of weeks as overnight hospitalist in past year, mean (SD) | 11.5 (4.1) |
| No. providing care only during the day | 21 |
| Years since residency graduation, mean (SD) | 9.0 (8.5) |
| Medicine residents | 71 (44) |
| Intern | 27 |
| Junior resident | 23 |
| Senior resident* | 21 |
Off‐Hours Quality and Safety Issues
Ratings and comparisons of the 24 items are shown in Table 3. For all items, the mean rating was below 5 (7‐point scale). Lowest‐rated (least optimal) items were: timeliness, safety, and communication involved with patients admitted from the ED, number of attending physicians, and timeliness of consults and blood draws. Highest‐rated (more optimal) items were: timely reporting of labs, timely identification of deteriorating status, medication ordering and processing, communication between physicians, and safety and communication involved with intraservice transfers.
| Category and Survey Item, Mean (SD)* | Total (160) | Providers With Night Experience | Nighttime Providers (116) | Daytime Providers (44) | P Value | |||
|---|---|---|---|---|---|---|---|---|
| Nurses (41) | Attending Physicians (4) | Housestaff (71) | P Value | |||||
| ||||||||
| Quality of care delivery | ||||||||
| Timely reporting of labs at night | 4.70 (1.39) | 5.12 (1.50) | 4.50 (1.00) | 4.61 (1.47) | 0.11 | 4.78 (1.48) | 4.48 (1.11) | 0.09 |
| Timely identification of deteriorating status | 4.67 (1.34) | 4.88 (1.36) | 5.00 (0.82) | 4.85 (1.20) | 0.93 | 4.86 (1.24) | 4.16 (1.45) | 0.006 |
| Medication ordering and processing | 4.63 (1.13) | 4.88 (1.25) | 5.25 (0.50) | 4.66 (1.08) | 0.19 | 4.76 (1.13) | 4.27 (1.06) | 0.01 |
| Timely completion of imaging at night | 4.29 (1.32) | 4.32 (1.46) | 4.75 (0.96) | 4.39 (1.29) | 0.88 | 4.38 (1.34) | 4.05 (1.26) | 0.12 |
| Timely reporting of results at night | 4.19 (1.43) | 4.27 (1.53) | 4.00 (1.83) | 4.11 (1.44) | 0.84 | 4.16 (1.47) | 4.27 (1.30) | 0.76 |
| Timely med release from pharmacy at night | 4.16 (1.29) | 4.00 (1.32) | 4.50 (0.58) | 4.28 (1.29) | 0.44 | 4.19 (1.28) | 4.09 (1.31) | 0.90 |
| Timely blood draws at night | 3.96 (1.52) | 4.63 (1.44) | 4.50 (0.58) | 3.53 (1.49) | <0.001 | 3.96 (1.54) | 3.98 (1.47) | 0.98 |
| Communication and coordination | ||||||||
| Communication between physicians | 4.63 (1.26) | 4.29 (1.23) | 6.00 (1.15) | 5.14 (1.12) | <0.001 | 4.87 (1.24) | 3.98 (1.09) | <0.001 |
| Communication between nursing and pharmacy | 4.39 (1.27) | 4.83 (1.41) | 5.00 (0.82) | 4.27 (1.29) | 0.04 | 4.49 (1.34) | 4.11 (4.11) | 0.08 |
| Communication between nursing and physicians | 4.39 (1.28) | 4.44 (1.36) | 5.00 (0.82) | 4.58 (1.31) | 0.64 | 4.54 (1.31) | 3.98 (1.13) | 0.01 |
| Documentation in medical record | 4.33 (1.36) | 5.00 (1.36) | 6.00 (0.82) | 4.23 1.19) | <0.001 | 4.56 (1.31) | 3.70 (1.30) | <0.001 |
| Ease of contacting primary providers at night | 4.31 (1.29) | 4.46 (1.27) | 6.00 (0.00) | 4.54 (1.18) | 0.02 | 4.56 (1.22) | 3.66 (1.27) | <0.001 |
| Staffing and supervision | ||||||||
| No. of nursing staff | 4.51 (1.27) | 4.54 (1.50) | 5.50 (0.58) | 4.59 (1.21) | 0.25 | 4.60 (1.31) | 4.25 (1.14) | 0.025 |
| Supervision of housestaff | 4.43 (1.34) | 4.56 (1.40) | 6.25 (0.50) | 4.55 (1.34) | 0.03 | 4.61 (1.37) | 3.95 (1.14) | 0.002 |
| No. of housestaff | 4.09 (1.39) | 4.27 (1.40) | 4.50 (1.29) | 4.11 (1.44) | 0.70 | 4.18 (1.41) | 3.86 (1.32) | 0.12 |
| No. of ancillary staff | 4.00 (1.40) | 4.27 (1.53) | 5.75 (0.96) | 3.85 (1.40) | 0.02 | 4.06 (1.48) | 3.84 (1.18) | 0.27 |
| No. of attending physicians | 3.79 (1.50) | 3.49 (1.76) | 5.25 (0.96) | 3.89 (1.43) | 0.07 | 3.79 (1.57) | 3.80 (1.32) | 0.98 |
| Patient transfers | ||||||||
| For patients accepted to medicine from another medicine unit | ||||||||
| Timely and safe patient transfers | 4.56 (1.28) | 5.15 (1.11) | 4.75 (0.50) | 4.55 (1.23) | 0.025 | 4.77 (1.20) | 4.00 (1.33) | 0.001 |
| High quality communication between providers | 4.55 (1.35) | 5.34 (1.13) | 5.00 (0.82) | 4.49 (1.22) | 0.001 | 4.81 (1.24) | 3.86 (1.41) | <0.001 |
| For patients admitted from emergency department to medicine unit | ||||||||
| Appropriate testing and treatment | 4.16 (1.34) | 4.15 (1.30) | 4.00 (1.83) | 4.21 (1.43) | 0.96 | 4.18 (1.39) | 4.11 (1.20) | 0.66 |
| Timely and safe transfers | 3.89 (1.38) | 3.63 (1.50) | 5.50 (0.58) | 4.08 (1.32) | 0.02 | 3.97 (1.40) | 3.68 1.29) | 0.23 |
| High‐quality communication between providers | 2.93 (1.38) | 2.56 (1.23) | 3.75 (1.26) | 3.00 (1.39) | 0.08 | 2.87 (1.35) | 3.07 (1.47) | 0.41 |
| Consulting service issues | ||||||||
| Timely consults at night | 4.04 (1.35) | 4.27 (1.28) | 4.00 (0.82) | 4.10 (1.47) | 0.69 | 4.16 (1.38) | 3.73 (1.25) | 0.053 |
| Communication between consults and physicians | 3.93 (1.40) | 3.46 (1.45) | 5.75 (1.26) | 4.35 (1.27) | <0.001 | 4.09 (1.42) | 3.50 (1.27) | 0.016 |
Comparisons Between Professional Groups With Night Experience
Of the 24 items, 11 showed statistically significant differences between groups (P<0.05). Items with the largest difference between groups included: timely blood draws at night (housestaff physicians lowest), communication between physicians (nursing lowest), documentation in medical record (housestaff physicians lowest), and communication between consults and physicians (nursing lowest). The rank order between housestaff physicians and nurses, and housestaff and attending physicians showed moderately positive correlations (r=0.61, P=0.002 and r=0.47, P=0.022, respectively). The correlation between nurses and attending physicians showed a weak correlation (r=0.19, P=0.375).
Comparisons Between Front‐Line Providers With and Without Night Experience
Of the 24 items, 12 showed statistically significant differences between groups (P<0.05), with day providers reporting lower ratings in all 12. Items with the largest difference between groups included: communication between consults and physicians, ease of contacting providers, communication between providers, documentation, and safety and communication related to transfers from other units. The rank order between night and day groups showed a statistically significant positive correlation (r=0.65, P=0.001).
Perceived Highest Quality of Care Time Period During Off Hours
Compared with other time periods, all providers ranked 4 to 7 am as the period with the lowest quality of care delivery (mean rank 3.2, P0.001) (Figure 1). Nursing staff and attending physicians both ranked the 10 pm to 1 am time period as the best period (mean of 2.0 and 1.5, respectively), whereas housestaff physicians ranked the 7 to 10 pm as the best time period (mean 1.62). The only statistical difference between provider groups for any given time period was the 7 to 10 pm time period (P=0.002).
DISCUSSION
In this prospective, mixed‐methods study evaluating perceived off‐hours quality and safety issues, several themes were identified, including perceived mismanagement, insufficient quality of delivery processes, communication/coordination breakdowns, and staffing and supervision issues. In the quantitative analysis, lowest‐rated items (lowest quality) related to timeliness/safety/communication involved with ED transfers, number of attending physicians, and timeliness of consults and blood draws. Highest‐rated items (highest quality) related to timeliness of lab reporting and identification of deteriorating patients, medication ordering/processing, communication between physicians, and safety/communication during intraservice transfers. In general, day providers reported lower ratings than night providers on nearly all quality‐related items. Nursing staff reported the lowest ratings regarding communication between physicians and consults, whereas housestaff physicians reported the lowest ratings regarding documentation in the medical record and timely blood draws. These between‐group differences reveal the lack of shared conceptual understanding regarding off‐hours care delivery.
Our qualitative results reveal several significant issues related to care delivery during off hours, many of which are not obtainable by hospital‐level data or chart review.[18] For hospital‐based medicine units, an understanding of the structure‐ and process‐related factors associated with events is required for quality improvement efforts. Although the primary focus for this work was the off hours, it is plausible that providers may have identified similar issues as important issues during daytime hours. Our study was not designed to investigate if these perceived issues are specific to off hours, or if these issues are an accurate reflection of objective events occurring during this time period. We believe this topic deserves further investigation, as understanding if these off‐hours perceptions are unique to this time period would change the scope of future quality improvement initiatives.
The most significant finding in the quantitative results was the vulnerability in quality and safety during patient admissions from the ED, specifically in relation to communication and timeliness of transfer. Between‐unit handoffs for patients admitted from the ED to medicine units have been identified as particularly vulnerable to breakdowns in the communication process.[19, 20, 21, 22] There are multiple etiologies, including clinical uncertainty, higher acuity in patient illness early in hospitalization, and cultural differences between services.[23] Additionally, patterns of communication and standardized handoff processes are often insufficient. In our hospital system, the transfer process relies primarily upon synchronous communication methods without standardized, asynchronous information exchange. We hypothesize front‐line providers perceive this lack of standardization as a primary threat to quality. Because approximately 60% of new patient admissions from the ED to medicine service (both in our hospital and in prior studies) occur during off hours, these findings highlight a need for subsequent study and quality improvement efforts.[24]
During the time of this study, our medicine units were staffed at night by 5 medicine housestaff physicians and 1 academic hospitalist, or nocturnist. In efforts to improve quality and safety during off hours, our hospital, as well as other health systems, implemented the nocturnist position, a faculty‐level attending physician to provide off‐hours clinical care and housestaff supervision.[25] Although participants reported a moderate rating of housestaff supervision, participants provided lower scores for staffing numbers of nurses, and housestaff and attending physicians, despite nocturnist presence. With both increased off‐hours supervision in our hospital and increasing use of faculty‐level physicians in other academic programs, these results provide context for the anticipated level of overnight housestaff supervision.[26, 27] To our knowledge, this is the first study to investigate perceived overnight quality issues on medicine units following such staffing models. Although this model of direct, on‐site supervision in academic medicine programs may help offset staffing and supervisory issues during off hours, the nocturnist role is insufficient to offset threats to quality/safety already inherent within the system. Furthermore, prospective trials following implementation of nocturnist systems have shown mixed results in improving patient outcomes.[28] These findings have led some to question whether resources dedicated to nocturnist staffing may be better allocated to other overnight initiatives, highlighting the need for a more subtle understanding of quality issues to design targeted interventions.[29]
A notable finding from this work is that providers without night experience reported lower scores for 20 of 24 items, highlighting their perceptions of the quality of care delivery during off hours are lower than those who experience this environment. Although day providers are not directly experiencing off‐hours delivery processes, these providers receive and detect the results from care delivery at night.[17] Most nurse, physician, and hospital leaders are present in the hospital only during day hours, requiring these individuals to account for differences in perceived and actual care delivered overnight.[1] These individuals make critical decisions pertaining to process changes and quality improvement efforts in these units. We believe these results raise awareness for leadership decisions and quality improvement efforts in medicine service units, specifically to focus on overnight issues beyond staffing issues alone.
All respondent groups ranked the latter half of the shift (17 am) as lower in quality compared to the first 6 hours (7 pm1 am). This finding is contrary to our hypothesis that earlier time periods, during the majority of patient admissions (and presumed higher workload for all providers), would be perceived as lower quality. Reasons for this finding are unknown, but may relate to end‐of‐shift tasks, sign‐out preparation, provider fatigue, or disease‐related concerns (eg, increased incidence of stroke and myocardial infarction) during the latter portions of night shifts. One study identified a decrease in nursing clinical judgments from the beginning to end of 12‐hour shifts, with a potential suggested mechanism of decrease in ability to maintain attention during judgments.[30] Additionally, in a study by Folkard et al., risk was highest within the first several hours and fell substantially thereafter during a shift.[9] To our knowledge, no work has investigated perceived or objective quality outcomes by time period during the off‐hours shift in medicine units. Further work could help delineate why provider‐perceived compromises in quality occur late in off‐hours shifts and whether this correlates to safety events.
There are several limitations to our study. First, although all surveys were pilot tested for content validity, the construct validity was not rigorously assessed. Second, although data were collected from all participant groups, the collection methods were unbalanced, favoring attending‐level physician perspectives. Although the relative incidence of vulnerabilities in quality and safety should be interpreted with caution, our methods and general taxonomy provide a framework for developing and monitoring the perceptions of future interventions. Due to limitations in infrastructure, our findings could not be independently validated through review of reported adverse events, but previous investigations have found the vast majority of adverse events are not detected by standard anonymous reporting.[31, 32, 33] Our methodology (used in our prior work) may provide an independent means of detecting causes of poor quality not easily observed through routine surveillance.[22] Although many survey items showed statistical differences between provider groups, the clinical significance is subject to interpretation. Last, the perceptions and events related to our institution may not be fully generalizable to other academic programs or service lines, particularly in community‐based, nonteaching hospitals.
In conclusion, our results suggest a significant discrepancy between the concerns of day and night providers regarding the quality of care delivered to inpatients during the off hours, specifically with issues related to communication, quality‐of‐care delivery processes, and patient transfers from the ED. Although specific concerns may be institution‐ (and service line‐) dependent, appropriately designing initiatives to improve the quality of care delivered overnight will need to take the perspectives of both provider groups into account. Additionally, educational initiatives should focus on achieving a shared mental model among all providers to improve collaboration and performance.
Acknowledgements
The authors thank the nurses, internal medicine housestaff physicians, and general internal medicine attending physicians at the Penn State Hershey Medical Center for their participation in this study.
Disclosure: Nothing to report.
- . Like night and day—shedding light on off‐hours care. N Engl J Med. 2008;358(20):2091–2093.
- , , , . Call nights and patient care. J Gen Intern Med. 1992;7(4):405–410.
- , , , et al. Uncovering system errors using a rapid response team: cross‐coverage caught in the crossfire. Discussion. J Trauma. 2009;67(1):173–179.
- , . The impact of shift work on the risk and severity of injuries for hospital employees: an analysis using Oregon workers' compensation data. Occup Med (Lond). 2004;54(8):556–563.
- , . Mortality among patients admitted to hospitals on weekends as compared with weekdays. N Engl J Med. 2001;345(9):663–668.
- , , , et al. The association of shift‐level nurse staffing with adverse patient events. J Nurs Adm. 2011;41(2):64–70.
- , , , et al. Heart disease and stroke statistics—2010 update A report from the American Heart Association. Circulation. 2010;121(7):e46–e215.
- , , , , O'Neil E. Minimum Nurse Staffing Ratios In California Acute Care Hospitals. Oakland, CA: California Workforce Initiative; 2000.
- , . Shift work, safety and productivity. Occup Med (Lond). 2003;53(2):95–101.
- , , . Increased injuries on night shift. Lancet. 1994;344(8930):1137–1139.
- , . Shift and night work and long working hours‐a systematic review of safety implications. Scand J Work Environ Health. 2011:37(3):173–185.
- , , , et al. Rotating shift work, sleep, and accidents related to sleepiness in hospital nurses. Am J Public Health. 1992;82(7):1011–1014.
- , , , et al. Survival from in‐hospital cardiac arrest during nights and weekends. JAMA. 2008;299(7):785–792.
- , , , , . The influence of shared mental models on team process and performance. J Appl Psychol. 2000;85(2):273.
- , . Team mental models and their potential to improve teamwork and safety: a review and implications for future research in healthcare. Saf Sci. 2012;50(5):1344–1354.
- . Editorial: mapping the field of mixed methods research. J Mix Methods Res. 2009;3(2):95–108.
- , . Decreasing adverse events through night talks: an interdisciplinary, hospital‐based quality improvement project. Perm J. Fall 2009;13(4):16–22.
- , , , et al. “Global trigger tool” shows that adverse events in hospitals may be ten times greater than previously measured. Health Aff (Millwood). 2011;30(4):581–589.
- , , , , , . Dropping the baton: a qualitative analysis of failures during the transition from emergency department to inpatient care. Ann Emerg Med. 2009;53(6):701–710.e704.
- . Smoothing transitions. Joint Commission targets patient handoffs. Mod Healthc. 2010;40(43):8–9.
- , , , , , . The patient handoff: a comprehensive curricular blueprint for resident education to improve continuity of care. Acad Med. 2012;87(4):411–418.
- , , , , , . Patient care transitions from the emergency department to the medicine ward: evaluation of a standardized electronic signout tool. Int J Qual Health Care. 2014;26(4):337–347.
- , . The unappreciated challenges of between‐unit handoffs: negotiating and coordinating across boundaries. Ann Emerg Med. 2013;61(2):155–160.
- , , , , , . The association between night or weekend admission and hospitalization‐relevant patient outcomes. J Hosp Med. 2011;6(1):10–14.
- . Middle‐of‐the‐night medicine is rarely patient‐centred. CMAJ. 2011;183(13):1467–1468.
- , , , et al. Survey of overnight academic hospitalist supervision of trainees. J Hosp Med. 2012;7(7):521–523.
- , , , , , . Effects of increased overnight supervision on resident education, decision‐making, and autonomy. J Hosp Med. 2012;7(8):606–610.
- , , , et al. A randomized trial of nighttime physician staffing in an intensive care unit. N Engl J Med. 2013;368(23):2201–2209.
- . Intensivists at night: putting resources in the right place. Crit Care. 2013;17(5):1008.
- , , . Changes in nurses' decision making during a 12‐h day shift. Occup Med (Lond). 2013;63(1):60–65.
- , , , , , . The incident reporting system does not detect adverse drug events: a problem for quality improvement. Jt Comm J Qual Improv. 1995;21(10):541–548.
- , , , , . An evaluation of adverse incident reporting. J Eval Clin Pract. 1999;5(1):5–12.
- , . Reporting and preventing medical mishaps: lessons from non‐medical near miss reporting systems. BMJ. 2000;320(7237):759–763.
© 2014 Society of Hospital Medicine
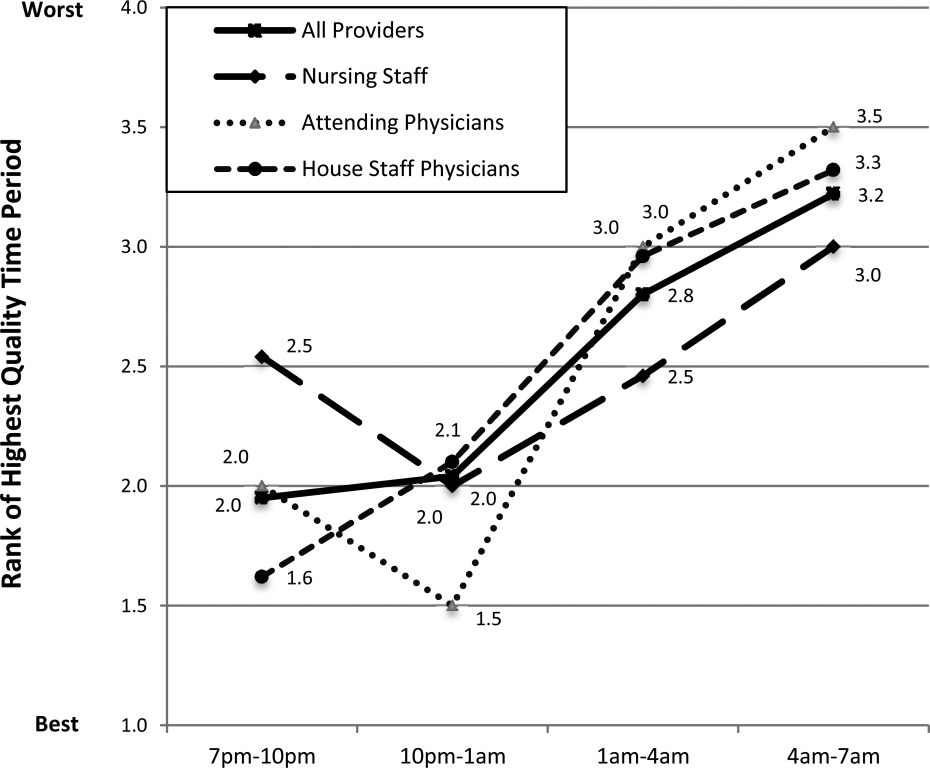
Munchausen Syndrome by Adult Proxy
Asher first described Munchausen syndrome by proxy over 60 years ago. Like the famous Baron von Munchausen, the persons affected have always traveled widely; and their stories like those attributed to him, are both dramatic and untruthful.[1] Munchausen syndrome is a psychiatric disorder in which a patient intentionally induces or feigns symptoms of physical or psychiatric illness to assume the sick role. In 1977, Meadow described the first case in which a caregiverperpetrator deliberately produced physical symptoms in a child for proxy gratification.[2] Unlike malingering, in which external incentives drive conscious symptom falsification, Munchausen syndrome by proxy (MSBP) is associated with fulfillment of the abuser's own psychological need for garnering praise from medical staff for devoted care given a sick child.[3, 4]
MSBP was once considered vanishingly rare. Many experts now believe it is more common, with a reported annual incidence of 0.4/100,000 in children younger than 16 years, and 2/100,000 in children younger than 1 year.[5] It is a disorder in which a parent, often the mother (94%99%)[6] and often with training or interest in the medical field,[5] is the perpetrator. The medical team caring for her child often views her as unusually helpful, and she is frequently psychiatrically ill with disorders such as depression, personality disorder, or prior personal history of somatoform or factitious disorder.[7, 8] The perpetrator typically inflicts physical harm, although occasionally she may simply lie about symptoms or tamper with laboratory samples.[5] The most common methods of inflicting harm are poisoning and suffocation. Overall mortality is 6% to 9%.[6, 9]
Although a large body of literature addresses pediatric cases, there is little to guide clinicians when victims are adults. An obvious reason may be that MSBP with adult proxies (MSB‐AP) has been reported so rarely, although we believe it is under‐recognized and more common than thought. The primary objective of this review was to identify all published cases of MSB‐AP, and synthesize them to characterize victims and perpetrators, modes of deceit, and relationships between victims and perpetrators so that clinicians will be better equipped to recognize such cases or at least include MSB‐AP in the differential of possibilities when symptoms and history are inconsistent.
METHODS
The Mayo Clinic Rochester Institutional Review Board approved this study. The databases of Ovid MEDLINE, Ovid EMBASE, PubMed, Web of Knowledge, and PsychINFO were searched from inception through April 2014 to identify all published cases of Munchausen by proxy in patients 18 years or older. The following search terms were used: Munchausen syndrome by proxy, factitious disorder by proxy, Munchausen syndrome, and factitious disorder. Reports were included when they described single or multiple cases of MSBP with victims aged at least 18 years. The search was not limited to articles published in English. Bibliographies of selected articles were reviewed for reports identifying additional cases.
RESULTS
We found 10 reports describing 11 cases of MSB‐AP and 1 report describing 2 unique cases of MSB‐AP (Tables 1 and 2). Two case reports were published in French[10, 11] and 1 in Polish.[12] Sigal et al.[13] describes 2 different victims with a common perpetrator, and another report[14] describes the same perpetrator with a third victim. One case, though cited as MSB‐AP in the literature was excluded because it did not meet the criteria for the disorder. In this case, the wife of a 28‐year‐old alcoholic male poured acid on him while he was inebriated, ostensibly to vent frustration and coerce him into sobriety.[15, 16]
| Author | Gender | Age, y | Presenting Features | Occupation/Education | Outcome |
|---|---|---|---|---|---|
| |||||
| Sigal M et al. (1986)[13] | F | 20s | Abscesses (skin) | NP | Death |
| F | 21 | Abscesses (skin) | Child care | Paraplegia | |
| Sigal MD et al. (1991)[14] | M | NP | Rash | NP | Abuse stopped |
| Smith NJ et al. (1989)[19] | M | 69 | None | Retired businessman | Continued fabrication |
| Krebs MO et al. (1996)[10] | M | 40s | Coma | Businessman | Abuse stopped |
| Ben‐Chetrit E et al. (1998)[20] | F | 73 | Coma | NP | Abuse stopped |
| Feldman KW et al. (1998)[8] | F | 21 | NP | Developmental delay | NP |
| Chodorowsk Z et al. (2003)[12] | F | 80 | Syncope | NP | Abuse stopped |
| Strubel D et al. (2003)[11] | F | 82 | None | NP | NP |
| Granot R et al. (2004)[21] | M | 71 | Coma | NP | Abuse stopped |
| Deimel GW et al. (2012)[17] | F | 23 | Rash | High school graduate | Continued abuse |
| F | 21 | Recurrent bacteremia | College student | Death | |
| Singh A et al. (2013)[22] | F | 79 | Fluid overload/false symptom history | Retired | Continued |
| Author | Gender | Age, y | Relationship | Occupation | Mode of Abuse | Outcome When Confronted |
|---|---|---|---|---|---|---|
| ||||||
| Sigal M et al. (1986)[13] | M | 26 | Husbanda | Businessman | Poisoningb followed by subcutaneous gasoline injection | Confession and incarceration |
| M | 29 | Boyfrienda | Businessman | Poisoningb followed by subcutaneous gasoline injection | Confession and incarceration | |
| Sigal MD et al. (1991)[14] | M | 34 | Cellmatea | Worked in medical clinic where incarcerated | Poisoningc followed by subcutaneous turpentine injection | Confession and attempted murder conviction |
| Smith NJ et al. (1989)[19] | F | 55 | Companion | Nurse | False history of hematuria, weakness, headaches | Denial |
| Krebs MO et al. (1996)[10] | F | 47 | Wife | Nurse | Tranquilizer injections | Confession and placed on probation |
| Ben‐Chetrit E et al. (1998)[20] | F | NP | Daughter | Nurse | Insulin injections | Denial |
| Feldman KW et al. (1998)[8] | F | NP | Mother | Business woman | False history of Batten's disease | NP |
| Chodorowsk Z et al. (2003)[12] | F | NP | Granddaughter | NP | Poisoningb | Denial |
| Strubel D et al. (2003)[11] | M | NP | Son | NP | False history of memory loss | NP |
| Granot R et al. (2004)[21] | F | NP | Wife | Hospital employee | Poisoningb | Confession |
| Deimel GW et al. (2012)[17] | F | NP | Mother | Unemployed chronic medical problems | Toxin application to skin | Denial |
| F | NP | Mother | Medical office receptionist | Intravenous injection unknown substance | Denial | |
| Singh A et al. (2013)[22] | M | NP | Son | NP | Fluid administration in context of fluid restriction/erratic medication administration/falsifying severity of symptoms | Denial |
Of the 13 victims, 9 (69%) were women and 4 (31%) were men. Of the ages reported, the median age was 69 years and the mean age was 51 (range, 2182 years). Exact age was not reported in 3 cases. Lying about signs and symptoms, but not actually inducing injury, occurred in 3 cases (23%), whereas in 10 cases (77%), the victims presented with physical findings, including coma (3), rash (2), skin abscesses (2), syncope (1), recurrent bacteremia (1), and fluid overload (1). Seven (54%) of the victims were poisoned, 2 via drug injection and 5 by beverage/food contamination. A perpetrator sedated 3 victims and subsequently injected them, 2 with gasoline and another with turpentine. Two of the victims were involved in business, 1 worked in childcare, 1 attended beauty school after graduating from high school, 1 attended college, and 1 was developmentally delayed. Victim education or occupation was not reported in 7 cases.
Of the 11 perpetrators, 8 (73%) were women, and 3 (27%) were men (note that the same male perpetrator had 3 victims). Median age was 34 years (range, 2655 years), although exact age was not reported in 4 cases. The perpetrator was the victim's mother in 3 cases, wife in 2 cases, son in 2 cases, and daughter, granddaughter, husband, companion, boyfriend, or prison cellmate in 1 case each. Five (38%) worked in healthcare.
All of the perpetrators were highly involved, even overly involved, in the care of their victims, frequently present, sometimes hovering, in hospital settings, and were viewed as generally helpful, if not overintrusive, by hospital staff. When confronted, 3 perpetrators confessed, 3 denied abuse that then ceased, and 4 more denied abuse that continued, culminating in death in 1 case. In 1 case, the outcome was not reported.[8] At least 3 victims remained with their perpetrators. Two perpetrators were criminally charged, 1 receiving probation and the other incarceration. The latter began abusing his cellmate, behavior that did not stop until he was confronted in prison.
CONCLUSION/DISCUSSION
Our primary objective was to locate and review all published cases of MSB‐AP. Our secondary aim was to describe salient characteristics of perpetrators, victims, and fabricated diseases in hopes of helping clinicians better recognize this disorder.
Our review shows that perpetrators were exclusively the victims' caregivers, including mothers, wives, husbands, daughters, granddaughters, or companions. These perpetrators, many with healthcare backgrounds, were attentive, helpful, and excessively present. In the majority of cases, hidden physical abuse yielded visible disease. Less commonly, perpetrators lied about symptoms rather than actually creating signs of disease. The most common mode of disease instigation involved poisoning through beverage/food contamination or subcutaneous injection. Geriatric and developmentally delayed persons appeared particularly vulnerable to victimization. Of the 13 victims, 5 were geriatric and 1 was developmentally delayed.
The adult cases we report are similar to child cases in that the perpetrators are caregivers; however, the caregivers of the adults are a more diverse group. Other similarities between adult and child cases are that physical signs occur more often than simply falsifying information, and poisoning is the most common method of disease fabrication. Suffocation, although common in child cases, has not been reported in adults. Though present in only a minority of cases, another feature distinguishing these cases from those reported in the pediatric literature is the presence of collusion between the perpetrator and victim. When MSBP was first described, Meadow believed that victims would reach an age at which the disorder would cease because they would fight back or report the abuse.[2] In 7 of the adult cases, the victims were unknowingly poisoned; however, in 2 cases,[17] the victims knew what their mothers were doing to them and yet denied that they were harming them. To explain this collusion, Deimel et al. proposed Stockholm syndrome, a condition in which a victim holds a perpetrator in high regard, despite experiencing at their hands what others might consider brainwashing and torture.
The data from the individual cases are sometimes frustratingly incomplete, with inconsistent reporting of dyad demographics and outcomes across the 13 cases, which compromises efforts to compare and contrast them. However, because no published studies have thoroughly reviewed all existing cases of MSB‐AP, we believe our review provides important insights into this condition by consolidating available information. It is our hope that by characterizing perpetrators, victims, and common presentations, we will raise awareness about this condition among healthcare providers so that it may be included in the differential diagnosis when they encounter this dyad: a patient's medical problems do not respond as expected to therapy and a caregivers appears overly involved or attention seeking.
The diagnosis of a factitious disorder often presents an immense clinical challenge and generally involves a multidisciplinary approach.[18] In addition to the incomplete data for existing cases in the literature, we recognize the ongoing difficulties in precise diagnosis of this disorder. Because a hallmark of pathology is secrecy at the outset and often denial, and even abrupt transition of care, upon confrontation, it is often very difficult, especially early on, to uncover patterns of perpetration, let alone posit a motive. We recognize that there may be some perpetrators who are motivated by something other than purely psychological end points, such as financial reward or even sexual victimization. And when alternate care venues are sought, clinicians are often left wondering. Further, the damage that may come to a therapeutic relationship by prematurely diagnosing MSB‐AP is important to keep in mind. Hospitalists who suspect MSB‐AP should consult psychiatry. Although MSB‐AP is a diagnosis of exclusion and often based on circumstantial evidence, psychiatry can assist in diagnosing this disorder and, in the event of a confession, provide immediate therapeutic intervention. Social services can aid in a vulnerable adult investigation for patients who do not have capacity.
When Meadow first described MSBP, he ended his article by asking Is this degree of falsification rare or is it under‐recognized? Time has answered Meadow's question. Now we ask the same question with regard to MSB‐AP, is it rare or under‐recognized? We must remain vigilant for this disorder. Early recognition can prevent healthcare providers from unknowingly perpetuating victimization by treating caregiver‐induced pathology as if legitimate, thereby satisfying the perpetrator's psychological needs. Despite Meadow's assertion that proxies outgrow their victimization, our review warns that advanced age does not preclude vulnerability and in some cases, may actually increase it. In the future, the incidence and prevalence of MSB‐AP is likely to increase as medical technology allows greater survival of cognitively impaired populations who are dependent on others for care. The elderly and developmentally delayed may be especially at risk.
ACKNOWLEDGMENTS
Disclosures: M.C.B., M.B.W., and M.I.L. report no conflicts of interest. J.M.B. receives payment for lectures, including service on speakers bureaus, from nonprofit continuing medical education organizations and universities for occasional lectures; however, this funding is not relevant to this review.
- . Munchausen syndrome. Lancet. 1951(1):339–341.
- . Munchausen syndrome by proxy. The hinterland of child abuse. Lancet. 1977;2(8033):343–345.
- American Psychiatric Association. Diagnostic and Statistical Manual of Mental Disorders, 4th Edition, Text Revision. 4th ed. Washington, DC: American Psychiatric Press; 2000.
- , , , et al. Position paper: definitional issues in Munchausen by proxy. Child Maltreat. 2002;7(2):105–111.
- , , , . Epidemiology of Munchausen syndrome by proxy, non‐accidental poisoning, and non‐accidental suffocation. Arch Dis Child. 1996;75(1):57–61.
- . Web of deceit: a literature review of Munchausen syndrome by proxy. Child Abuse Negl. 1987;11(4):547–563.
- , . Psychopathology of perpetrators of fabricated or induced illness in children: case series. Br J Psychiatry. 2011;199(2):113–118.
- , . The central venous catheter as a source of medical chaos in Munchausen syndrome by proxy. J Pediatr Surg. 1998;33(4):623–627.
- , . Munchausen syndrome by proxy: diagnosis and prevalence. Am J Orthopsychiatry. 1993;63(2):318–321.
- , , , . Munchhausen syndrome by proxy between two adults [in French]. Presse Med. 1996;25(12):583–586.
- , , . Munchhausen syndrome by proxy in an old woman [in French]. Revue Geriatr. 2003;28:425–428.
- , , , . Consciousness disturbances: a case report of Munchausen by proxy syndrome in an elderly patient [in Polish]. Przegl Lek. 2003;60(4):307–308.
- , , . Munchausen syndrome by adult proxy: a perpetrator abusing two adults. J Nerv Ment Dis. 1986;174(11):696–698.
- , , . Munchausen syndrome by adult proxy revisited. Isr J Psychiatry Relat Sci. 1991;28(1):33–36.
- , , , , , . Otolaryngology fantastica: the ear, nose, and throat manifestations of Munchausen's syndrome. Laryngoscope. 2012;122(1):51–57.
- . Witchcraft's syndrome: Munchausen's syndrome by proxy. Int J Dermatol. 1998;37(3):229–230.
- , , , , , . Munchausen syndrome by proxy: an adult dyad. Psychosomatics. 2012;53(3):294–299.
- , . Factitious disorders and malingering: challenges for clinical assessment and management. Lancet. 2014;383(9926):1422–1432.
- , . More in sickness than in health: a case study of Munchausen by proxy in the elderly. J Fam Ther. 1989;11(4):321–334.
- , . Recurrent hypoglycaemia in multiple myeloma: a case of Munchausen syndrome by proxy in an elderly patient. J Intern Med. 1998;244(2):175–178.
- , , , , . Idiopathic recurrent stupor: a warning. J Neurol Neurosurg Psychiatry. 2004;75(3):368–369.
- , , . Munchausen by proxy in older adults: A case report. Maced J Med Sci. 2013;6(2):178–181.
Asher first described Munchausen syndrome by proxy over 60 years ago. Like the famous Baron von Munchausen, the persons affected have always traveled widely; and their stories like those attributed to him, are both dramatic and untruthful.[1] Munchausen syndrome is a psychiatric disorder in which a patient intentionally induces or feigns symptoms of physical or psychiatric illness to assume the sick role. In 1977, Meadow described the first case in which a caregiverperpetrator deliberately produced physical symptoms in a child for proxy gratification.[2] Unlike malingering, in which external incentives drive conscious symptom falsification, Munchausen syndrome by proxy (MSBP) is associated with fulfillment of the abuser's own psychological need for garnering praise from medical staff for devoted care given a sick child.[3, 4]
MSBP was once considered vanishingly rare. Many experts now believe it is more common, with a reported annual incidence of 0.4/100,000 in children younger than 16 years, and 2/100,000 in children younger than 1 year.[5] It is a disorder in which a parent, often the mother (94%99%)[6] and often with training or interest in the medical field,[5] is the perpetrator. The medical team caring for her child often views her as unusually helpful, and she is frequently psychiatrically ill with disorders such as depression, personality disorder, or prior personal history of somatoform or factitious disorder.[7, 8] The perpetrator typically inflicts physical harm, although occasionally she may simply lie about symptoms or tamper with laboratory samples.[5] The most common methods of inflicting harm are poisoning and suffocation. Overall mortality is 6% to 9%.[6, 9]
Although a large body of literature addresses pediatric cases, there is little to guide clinicians when victims are adults. An obvious reason may be that MSBP with adult proxies (MSB‐AP) has been reported so rarely, although we believe it is under‐recognized and more common than thought. The primary objective of this review was to identify all published cases of MSB‐AP, and synthesize them to characterize victims and perpetrators, modes of deceit, and relationships between victims and perpetrators so that clinicians will be better equipped to recognize such cases or at least include MSB‐AP in the differential of possibilities when symptoms and history are inconsistent.
METHODS
The Mayo Clinic Rochester Institutional Review Board approved this study. The databases of Ovid MEDLINE, Ovid EMBASE, PubMed, Web of Knowledge, and PsychINFO were searched from inception through April 2014 to identify all published cases of Munchausen by proxy in patients 18 years or older. The following search terms were used: Munchausen syndrome by proxy, factitious disorder by proxy, Munchausen syndrome, and factitious disorder. Reports were included when they described single or multiple cases of MSBP with victims aged at least 18 years. The search was not limited to articles published in English. Bibliographies of selected articles were reviewed for reports identifying additional cases.
RESULTS
We found 10 reports describing 11 cases of MSB‐AP and 1 report describing 2 unique cases of MSB‐AP (Tables 1 and 2). Two case reports were published in French[10, 11] and 1 in Polish.[12] Sigal et al.[13] describes 2 different victims with a common perpetrator, and another report[14] describes the same perpetrator with a third victim. One case, though cited as MSB‐AP in the literature was excluded because it did not meet the criteria for the disorder. In this case, the wife of a 28‐year‐old alcoholic male poured acid on him while he was inebriated, ostensibly to vent frustration and coerce him into sobriety.[15, 16]
| Author | Gender | Age, y | Presenting Features | Occupation/Education | Outcome |
|---|---|---|---|---|---|
| |||||
| Sigal M et al. (1986)[13] | F | 20s | Abscesses (skin) | NP | Death |
| F | 21 | Abscesses (skin) | Child care | Paraplegia | |
| Sigal MD et al. (1991)[14] | M | NP | Rash | NP | Abuse stopped |
| Smith NJ et al. (1989)[19] | M | 69 | None | Retired businessman | Continued fabrication |
| Krebs MO et al. (1996)[10] | M | 40s | Coma | Businessman | Abuse stopped |
| Ben‐Chetrit E et al. (1998)[20] | F | 73 | Coma | NP | Abuse stopped |
| Feldman KW et al. (1998)[8] | F | 21 | NP | Developmental delay | NP |
| Chodorowsk Z et al. (2003)[12] | F | 80 | Syncope | NP | Abuse stopped |
| Strubel D et al. (2003)[11] | F | 82 | None | NP | NP |
| Granot R et al. (2004)[21] | M | 71 | Coma | NP | Abuse stopped |
| Deimel GW et al. (2012)[17] | F | 23 | Rash | High school graduate | Continued abuse |
| F | 21 | Recurrent bacteremia | College student | Death | |
| Singh A et al. (2013)[22] | F | 79 | Fluid overload/false symptom history | Retired | Continued |
| Author | Gender | Age, y | Relationship | Occupation | Mode of Abuse | Outcome When Confronted |
|---|---|---|---|---|---|---|
| ||||||
| Sigal M et al. (1986)[13] | M | 26 | Husbanda | Businessman | Poisoningb followed by subcutaneous gasoline injection | Confession and incarceration |
| M | 29 | Boyfrienda | Businessman | Poisoningb followed by subcutaneous gasoline injection | Confession and incarceration | |
| Sigal MD et al. (1991)[14] | M | 34 | Cellmatea | Worked in medical clinic where incarcerated | Poisoningc followed by subcutaneous turpentine injection | Confession and attempted murder conviction |
| Smith NJ et al. (1989)[19] | F | 55 | Companion | Nurse | False history of hematuria, weakness, headaches | Denial |
| Krebs MO et al. (1996)[10] | F | 47 | Wife | Nurse | Tranquilizer injections | Confession and placed on probation |
| Ben‐Chetrit E et al. (1998)[20] | F | NP | Daughter | Nurse | Insulin injections | Denial |
| Feldman KW et al. (1998)[8] | F | NP | Mother | Business woman | False history of Batten's disease | NP |
| Chodorowsk Z et al. (2003)[12] | F | NP | Granddaughter | NP | Poisoningb | Denial |
| Strubel D et al. (2003)[11] | M | NP | Son | NP | False history of memory loss | NP |
| Granot R et al. (2004)[21] | F | NP | Wife | Hospital employee | Poisoningb | Confession |
| Deimel GW et al. (2012)[17] | F | NP | Mother | Unemployed chronic medical problems | Toxin application to skin | Denial |
| F | NP | Mother | Medical office receptionist | Intravenous injection unknown substance | Denial | |
| Singh A et al. (2013)[22] | M | NP | Son | NP | Fluid administration in context of fluid restriction/erratic medication administration/falsifying severity of symptoms | Denial |
Of the 13 victims, 9 (69%) were women and 4 (31%) were men. Of the ages reported, the median age was 69 years and the mean age was 51 (range, 2182 years). Exact age was not reported in 3 cases. Lying about signs and symptoms, but not actually inducing injury, occurred in 3 cases (23%), whereas in 10 cases (77%), the victims presented with physical findings, including coma (3), rash (2), skin abscesses (2), syncope (1), recurrent bacteremia (1), and fluid overload (1). Seven (54%) of the victims were poisoned, 2 via drug injection and 5 by beverage/food contamination. A perpetrator sedated 3 victims and subsequently injected them, 2 with gasoline and another with turpentine. Two of the victims were involved in business, 1 worked in childcare, 1 attended beauty school after graduating from high school, 1 attended college, and 1 was developmentally delayed. Victim education or occupation was not reported in 7 cases.
Of the 11 perpetrators, 8 (73%) were women, and 3 (27%) were men (note that the same male perpetrator had 3 victims). Median age was 34 years (range, 2655 years), although exact age was not reported in 4 cases. The perpetrator was the victim's mother in 3 cases, wife in 2 cases, son in 2 cases, and daughter, granddaughter, husband, companion, boyfriend, or prison cellmate in 1 case each. Five (38%) worked in healthcare.
All of the perpetrators were highly involved, even overly involved, in the care of their victims, frequently present, sometimes hovering, in hospital settings, and were viewed as generally helpful, if not overintrusive, by hospital staff. When confronted, 3 perpetrators confessed, 3 denied abuse that then ceased, and 4 more denied abuse that continued, culminating in death in 1 case. In 1 case, the outcome was not reported.[8] At least 3 victims remained with their perpetrators. Two perpetrators were criminally charged, 1 receiving probation and the other incarceration. The latter began abusing his cellmate, behavior that did not stop until he was confronted in prison.
CONCLUSION/DISCUSSION
Our primary objective was to locate and review all published cases of MSB‐AP. Our secondary aim was to describe salient characteristics of perpetrators, victims, and fabricated diseases in hopes of helping clinicians better recognize this disorder.
Our review shows that perpetrators were exclusively the victims' caregivers, including mothers, wives, husbands, daughters, granddaughters, or companions. These perpetrators, many with healthcare backgrounds, were attentive, helpful, and excessively present. In the majority of cases, hidden physical abuse yielded visible disease. Less commonly, perpetrators lied about symptoms rather than actually creating signs of disease. The most common mode of disease instigation involved poisoning through beverage/food contamination or subcutaneous injection. Geriatric and developmentally delayed persons appeared particularly vulnerable to victimization. Of the 13 victims, 5 were geriatric and 1 was developmentally delayed.
The adult cases we report are similar to child cases in that the perpetrators are caregivers; however, the caregivers of the adults are a more diverse group. Other similarities between adult and child cases are that physical signs occur more often than simply falsifying information, and poisoning is the most common method of disease fabrication. Suffocation, although common in child cases, has not been reported in adults. Though present in only a minority of cases, another feature distinguishing these cases from those reported in the pediatric literature is the presence of collusion between the perpetrator and victim. When MSBP was first described, Meadow believed that victims would reach an age at which the disorder would cease because they would fight back or report the abuse.[2] In 7 of the adult cases, the victims were unknowingly poisoned; however, in 2 cases,[17] the victims knew what their mothers were doing to them and yet denied that they were harming them. To explain this collusion, Deimel et al. proposed Stockholm syndrome, a condition in which a victim holds a perpetrator in high regard, despite experiencing at their hands what others might consider brainwashing and torture.
The data from the individual cases are sometimes frustratingly incomplete, with inconsistent reporting of dyad demographics and outcomes across the 13 cases, which compromises efforts to compare and contrast them. However, because no published studies have thoroughly reviewed all existing cases of MSB‐AP, we believe our review provides important insights into this condition by consolidating available information. It is our hope that by characterizing perpetrators, victims, and common presentations, we will raise awareness about this condition among healthcare providers so that it may be included in the differential diagnosis when they encounter this dyad: a patient's medical problems do not respond as expected to therapy and a caregivers appears overly involved or attention seeking.
The diagnosis of a factitious disorder often presents an immense clinical challenge and generally involves a multidisciplinary approach.[18] In addition to the incomplete data for existing cases in the literature, we recognize the ongoing difficulties in precise diagnosis of this disorder. Because a hallmark of pathology is secrecy at the outset and often denial, and even abrupt transition of care, upon confrontation, it is often very difficult, especially early on, to uncover patterns of perpetration, let alone posit a motive. We recognize that there may be some perpetrators who are motivated by something other than purely psychological end points, such as financial reward or even sexual victimization. And when alternate care venues are sought, clinicians are often left wondering. Further, the damage that may come to a therapeutic relationship by prematurely diagnosing MSB‐AP is important to keep in mind. Hospitalists who suspect MSB‐AP should consult psychiatry. Although MSB‐AP is a diagnosis of exclusion and often based on circumstantial evidence, psychiatry can assist in diagnosing this disorder and, in the event of a confession, provide immediate therapeutic intervention. Social services can aid in a vulnerable adult investigation for patients who do not have capacity.
When Meadow first described MSBP, he ended his article by asking Is this degree of falsification rare or is it under‐recognized? Time has answered Meadow's question. Now we ask the same question with regard to MSB‐AP, is it rare or under‐recognized? We must remain vigilant for this disorder. Early recognition can prevent healthcare providers from unknowingly perpetuating victimization by treating caregiver‐induced pathology as if legitimate, thereby satisfying the perpetrator's psychological needs. Despite Meadow's assertion that proxies outgrow their victimization, our review warns that advanced age does not preclude vulnerability and in some cases, may actually increase it. In the future, the incidence and prevalence of MSB‐AP is likely to increase as medical technology allows greater survival of cognitively impaired populations who are dependent on others for care. The elderly and developmentally delayed may be especially at risk.
ACKNOWLEDGMENTS
Disclosures: M.C.B., M.B.W., and M.I.L. report no conflicts of interest. J.M.B. receives payment for lectures, including service on speakers bureaus, from nonprofit continuing medical education organizations and universities for occasional lectures; however, this funding is not relevant to this review.
- . Munchausen syndrome. Lancet. 1951(1):339–341.
- . Munchausen syndrome by proxy. The hinterland of child abuse. Lancet. 1977;2(8033):343–345.
- American Psychiatric Association. Diagnostic and Statistical Manual of Mental Disorders, 4th Edition, Text Revision. 4th ed. Washington, DC: American Psychiatric Press; 2000.
- , , , et al. Position paper: definitional issues in Munchausen by proxy. Child Maltreat. 2002;7(2):105–111.
- , , , . Epidemiology of Munchausen syndrome by proxy, non‐accidental poisoning, and non‐accidental suffocation. Arch Dis Child. 1996;75(1):57–61.
- . Web of deceit: a literature review of Munchausen syndrome by proxy. Child Abuse Negl. 1987;11(4):547–563.
- , . Psychopathology of perpetrators of fabricated or induced illness in children: case series. Br J Psychiatry. 2011;199(2):113–118.
- , . The central venous catheter as a source of medical chaos in Munchausen syndrome by proxy. J Pediatr Surg. 1998;33(4):623–627.
- , . Munchausen syndrome by proxy: diagnosis and prevalence. Am J Orthopsychiatry. 1993;63(2):318–321.
- , , , . Munchhausen syndrome by proxy between two adults [in French]. Presse Med. 1996;25(12):583–586.
- , , . Munchhausen syndrome by proxy in an old woman [in French]. Revue Geriatr. 2003;28:425–428.
- , , , . Consciousness disturbances: a case report of Munchausen by proxy syndrome in an elderly patient [in Polish]. Przegl Lek. 2003;60(4):307–308.
- , , . Munchausen syndrome by adult proxy: a perpetrator abusing two adults. J Nerv Ment Dis. 1986;174(11):696–698.
- , , . Munchausen syndrome by adult proxy revisited. Isr J Psychiatry Relat Sci. 1991;28(1):33–36.
- , , , , , . Otolaryngology fantastica: the ear, nose, and throat manifestations of Munchausen's syndrome. Laryngoscope. 2012;122(1):51–57.
- . Witchcraft's syndrome: Munchausen's syndrome by proxy. Int J Dermatol. 1998;37(3):229–230.
- , , , , , . Munchausen syndrome by proxy: an adult dyad. Psychosomatics. 2012;53(3):294–299.
- , . Factitious disorders and malingering: challenges for clinical assessment and management. Lancet. 2014;383(9926):1422–1432.
- , . More in sickness than in health: a case study of Munchausen by proxy in the elderly. J Fam Ther. 1989;11(4):321–334.
- , . Recurrent hypoglycaemia in multiple myeloma: a case of Munchausen syndrome by proxy in an elderly patient. J Intern Med. 1998;244(2):175–178.
- , , , , . Idiopathic recurrent stupor: a warning. J Neurol Neurosurg Psychiatry. 2004;75(3):368–369.
- , , . Munchausen by proxy in older adults: A case report. Maced J Med Sci. 2013;6(2):178–181.
© 2014 Society of Hospital Medicine