User login
Is it a 'senior moment' or early dementia? Addressing memory concerns in older patients
Many older patients are concerned about their memory. The “worried well” may come into your office with a list of things they can’t recall, yet they remember each “deficit” quite well. Anticipatory anxiety about one’s own decline is common, and is most often concerned with changes in memory.1,2
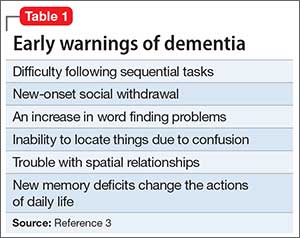
Patients with dementia or early cognitive decline often are oblivious to their cognitive changes, however. Of particular concern is progressive dementia, especially Alzheimer’s disease (AD). Although jokes about “senior moments” are common, concern about AD incurs deep-seated worry. It is essential for clinicians to differentiate normal cognitive changes of aging—particularly those in memory—from early signs of neurodegenerative disease (Table 13).
In this article, we review typical memory changes in persons age >65, and differentiate these from mild cognitive impairment (MCI), an increasingly recognized prodrome of AD. Clinicians armed with knowledge of MCI are able to reassure the worried well, or recommend neuropsychological testing as indicated.
Is memory change inevitable with aging?
Memory loss is a common problem in aging, with variable severity. Research is establishing norms in cognitive functioning through the ninth decade of life.4 Controversy about sampling, measures, and methods abound,5 and drives prolific research on the subject, which is beyond the scope of this article. It has been demonstrated that there are a few “optimally aging” persons who avoid memory decline altogether.5,6 Most researchers and clinicians agree, however, that memory change is pervasive with advancing age.
Memory change follows a gradient with recent memories lost to a greater degree than remote memories (Ribot’s Law).7 Forgetfulness is characteristic of normal aging, and frequently manifests with misplaced objects and short-term lapses. However, this is not pathological—as long as the item or memory is recalled within 24 to 48 hours.
Compared with younger adults, healthy older adults are less efficient at encoding new information. Subsequently, they have more difficulty retrieving data, particularly after a delay. The time needed to learn and use new information increases, which is referred to as processing inefficiency. This influences changes in test performance across all cognitive domains, with decreases in measures of mental processing speed, working memory, and problem-solving.
Many patients who complain about “forgetfulness” are experiencing this normal change. It is not uncommon for a patient to offer a list of things she has forgotten recently, along with the dates and circumstances in which she forgot them. Because she sometimes forgets things, but remembers them later, there likely is nothing to worry about. If reminders—such as her list—help, this too is a good sign, because it shows her resourcefulness in using accommodations. If the patient is managing her normal activities, reassurance is warranted.
Mild cognitive impairment
Since at least 1958,8 clinical observations and research have recognized a prodrome that differentiates cognitive changes predictive of dementia from those that represent typical aging. Several studies and methods have converged toward consensus that MCI is a valid construct for that purpose, with ecological validity and sound predictive value. Clinical value is evident when a patient does not meet criteria for MCI; in this case, the clinician can reassure the worried well with conviction.
Revealing the diagnosis of MCI to patients requires sensitivity and assurance that you will reevaluate the condition annually. Although there is no evidence-based remedy for MCI or means to slow its progression to dementia, data are rapidly accruing regarding the value of lifestyle changes and other nonpharmacologic interventions.9
Recognizing MCI most simply requires 2 criteria:
The patient’s expressed concern about decline in cognitive functioning from a previous level of performance. Alternately, a caretaker’s report is valuable because the patient might lack insight. You are not looking for an inability to perform activities of daily living, which is indicative of frank dementia; rather, you want to determine whether the person’s independence in functional abilities is preserved, although less efficient. Patients might repeatedly report occurrences of new problems, although modest, in some cases. Although problems with memory often are the most frequently reported symptoms, changes can be observed in any cognitive domain. Uncharacteristic inability to understand instructions, frustration with new tasks, and inflexibility are common.
Quantified clinical assessment that the patient’s cognitive decline exceeds norms of his age cohort. Clinicians are already familiar with many of these tests (5-minute recall, clock face drawing, etc.). For MCI, we recommend the Montreal Cognitive Assessment (MoCA), which is specifically designed for MCI.10 It takes only 10 minutes to administer. Multiple versions of the MoCA, and instructions for its administration are available for provider use at www.mocatest.org.
When these criteria are met—a decline in previous functioning and an objective clinical confirmation—referral for neuropsychological testing is recommended. Subtypes of MCI—amnestic and non-amnestic—have been employed to specify the subtype (amnesic) that is most consistent with prodromal AD. However, this dichotomous scheme does not adequately explain or capture the heterogeneity of MCI.11,12
Medical considerations
Just as all domains of cognition are correlated to some degree, the overall health status of a person influences evaluation of memory. Variables, such as fatigue, test anxiety, mood, motivation, visual and auditory acuity, education, language fluency, attention, and pain, affect test performance. In addition, clinician rapport and the manner in which tests are administered must be considered.
Depression can mimic MCI. A depressed patient often has poor expectations of himself and slowed thinking, and might exaggerate symptoms. He might give up on tests or refuse to complete them. His presentation initially could suggest cognitive decline, but depression is revealed when the clinician pays attention to vegetative signs (insomnia, poor appetite) or suicidal ideation. There is growing evidence that subjective complaints of memory loss are more frequently associated with depression than with objective measures of cognitive impairment.13,14
Other treatable conditions can present with cognitive change (the so-called reversible dementias). A deficiency of vitamin B12, thiamine, or folate often is seen because quality of nutrition generally decreases with age. Hyponatremia and dehydration can present with confusion and memory impairment. Other treatable conditions include:
- cerebral vasculitis, which could improve with immune suppressants
- endocrine diseases, which might respond to hormonal or surgical treatment
- normal pressure hydrocephalus, which can be relieved by surgical placement of a shunt.
Take a complete history. What exactly is the nature of the patient or caregiver’s complaint? You need to attempt to engage the patient in conversation, observing his behavior during the evaluation. Is there notable delay in response, difficulty in attention and focus, or in understanding questions?
The content of speech is an indicator of the patient’s information processing. Ask the patient to recite as many animals from the jungle as possible. Most people can come up with at least 15. The person with MCI will likely name fewer animals, but may respond well to cueing, and perform better in recognition (eg, pictures or drawings) vs retrieval. When asked to describe a typical day, the patient may offer a vague, nonchalant response eg, “I keep busy watching the news.” This kind of response may be evidence of confabulation; with further questioning, he is unable to identify current issues of interest.
Substance abuse. It is essential that clinicians recognize that elders are not exempt from alcohol and other drug abuse that affects cognition. Skilled history taking, including attention to non-verbal responses, is indicated. A defensive tone, rolling of eyes, or silent yet affirmative nodding are means by which caregivers offer essential “clues” to the provider.
A quick screening tool for the office is valuable; many clinicians are most familiar with the Mini-Mental State Examination or the Saint Louis University Mental Status Examination, which are known to be sensitive in detecting memory problems and other cognitive defects. As we noted, the MoCA is now recommended for differentiating more subtle changes of MCI.10,15 It is important to remember that common conditions such as an urinary tract infection or trauma after anesthesia for routine procedures such as colonoscopy can cause cognitive impairment. Again, eliciting history from a family member is valuable because the patient may have forgotten vital data.
A good physical exam is important when evaluating for dementia. Look for any neurologic anomaly. Check for disinhibition of primitive reflexes, eg, abnormal grasp or snout response or Babinski sign. Compare the symmetry and strength of deep tendon reflexes. Look for neurologic soft signs. Any pathological reflex response can be an important clue about neurodegeneration or space-occupying lesions. We recall seeing a 62-year-old man whose spouse brought him for evaluation for new-onset reckless driving and marked inattention to personal hygiene that developed over the previous 3 months. On examination, he appeared disheveled and had a dull affect, although disinhibited and careless. His mentation and gait were slowed. He denied distress of any kind. Frontal release signs were noted on exam. An MRI revealed a space-occupying lesion of the frontal lobe measuring 3 cm wide with a thickness of 2 cm, which pathology confirmed as a benign tumor.
Always check for arrhythmia and hypertension. These are significant risk factors for ischemic brain disease, multiple-infarct stroke, or other forms of vascular dementia. A shuffling gait suggests Parkinson’s disease, or even Lewy body dementia, or medication-related conditions, for example, from antipsychotics.
Take a medication history. Many common treatments for anxiety and insomnia can cause symptoms that mimic dementia. Digitalis toxicity results in poor recall and confusion. Combinations of common medicines (antacids, antihistamines, and others) compete for metabolic pathways and lead to altered mental status. Referencing the Beers List16 is valuable; anticholinergics, benzodiazepines, and narcotic analgesics are of special concern. The latter could still be useful for comfort care at the end of life.
It is common for seniors to take a variety of untested and unproven supplements in the hope of preventing or lessening memory problems. In addition to incurring significant costs, the indiscriminate use of supplements poses risks of toxicity, including unintended interactions with prescribed medications. Many older adults do not disclose their use of these supplements to providers because they do not consider them “medicine.”
Labs. The next level of evaluation calls for a basic laboratory workup. Check complete blood count, liver enzymes, thyroid function tests, vitamin D, B12 and folate levels; perform urinalysis and a complete metabolic panel. Look at a general hormone panel; abnormal values could reveal a pituitary adenoma. (In the past 33 years, the first author has found 42 pituitary tumors in the workup of mental status change.)
We use imaging, such as a CT or MRI of the brain, in almost all cases of suspected dementia. Cerebral atrophy, space-occupying lesions, and shifting of the ventricles often correspond with cognitive decline.
Treatment
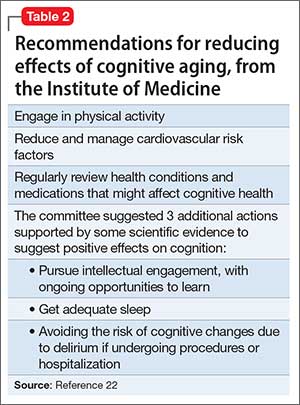
Effective treatment of dementia remains elusive. Other than for the “reversible dementias,” pharmacotherapy has shown less progress than had been expected. Donepezil, galantamine, rivastigmine, and memantine could slow disease progression in some cases. There have been many studies for dementia preventives and treatments. Extensive reviews and meta-analyses, including those of randomized controlled trials17-19 abound for a variety of herbs, supplements, and antioxidants; none have shown compelling results. Table 2 lists Institute of Medicine recommendations supported by evidence that could reduce effects of cognitive aging.20
Recommendations from collaboration between the National Institute on Aging and the Alzheimer’s Association21 state that research should focus on biomarkers, such as neural substrates or genotypes. Indicators of oxidative stress (cytokines) and inflammation (isoprostanes) show promise as measures of brain changes that correspond with increased risk of AD or other dementias.
Summing up
Older adults are a heterogeneous group. Intellectual capacity does not diminish with advancing age. Many elders now exceed expectations for productivity, athletic ability, scientific achievement, and the creative arts. Others live longer with diminished quality of life, their health compromised by progressive neurodegenerative disease.
Age-associated memory change often is exaggerated and feared by older adults and, regrettably, is associated with inevitable functional impairment and is seen as heralding the loss of autonomy. The worried well are anxious, although the stigma associated with cognitive decline may preclude confiding their concerns.
Providers need the tools and acumen to treat patients along an increasingly long continuum of time, including conveyance of evidence-based encouragement toward optimal health and vitality.
1. Serby MJ, Yhap C, Landron EY. A study of herbal remedies for memory complaints. J Neuropsychiatry Clin Neurosci. 2010;22(3):345-347.
2. Jaremka LM, Derry HM, Bornstein R, et al. Omega-3 supplementation and loneliness-related memory problems: secondary analyses of a randomized controlled trial. Psychosom Med. 2014;76(8):650-658.
3. Depp CA, Harmell A, Vania IV. Successful cognitive aging. In: Pardon MC, Bondi MW, eds. Behavioral neurobiology of aging. New York, NY: Springer-Verlag; 2012:35-50.
4. Invik RJ, Malec JF, Smith GE, et al. Mayo’s older Americans normative studies: WAIS-R, WMS-R, and AVLT norms for ages 56 to 97. Clin Neuropsychol. 1992;6(suppl 1):1-104.
5. Powell DH, Whitla DK. Profiles in cognitive aging. Boston, MA: Harvard University Press; 1994.
6. Negash S, Smith GE, Pankratz SE, et al. Successful aging: definitions and prediction of longevity and conversion to mild cognitive impairment. Am J Geriatr Psychiatry. 2011;19(6):581-588.
7. Ribot T. Diseases of memory: an essay in the positive psychology. London, United Kingdom: Kegan Paul Trench; 1882.
8. Kral VA. Neuropsychiatric observations in old peoples home: studies of memory dysfunction in senescence. J Gerontol. 1958;13(2):169-176.
9. Gitlin LN, Kales HC, Lyketsos CG. Nonpharmacologic management of behavioral symptoms in dementia. JAMA. 2012;308(19):2020-2029.
10. Nasreddine ZS, Phillips NA, Bédirian V, et al. The Montreal Cognitive Assessment, MoCA: a brief screening tool for mild cognitive assessment. J Am Geriatr Soc. 2005;53(4):695-699.
11. Clark LR, Delano-Wood L, Lisbon DJ, et al. Are empirically-derived subtypes of mild cognitive impairment consistent with conventional subtypes? J Intl Neuropsychol Soc. 2013;19(6):1-11.
12. Ganguli M, Snitz BE, Saxton JA, et al. Outcomes of mild cognitive impairment by definition: a population study. Arch Neurol. 2011;68(6):761-767.
13. Bartley M, Bokde AL, Ewers M, et al. Subjective memory complaints in community dwelling older people: the influence of brain and psychopathology. Intl J Geriatr Psychiatry. 2012;27(8):836-843.
14. Chung JC, Man DW. Self-appraised, informant-reported, and objective memory and cognitive function in mild cognitive impairment. Dement Geriatr Cogn Disord. 2009;27(2):187-193.
15. Tsoi KK, Chan JY, Hirai HW, et al. Cognitive tests to detect dementia: a systematic review and meta-analysis. JAMA Intern Med. 2015;175(9):1450-1458.
16. American Geriatrics Society 2012 Beers Criteria Update Expert Panel. American Geriatrics Society updated Beers Criteria for potentially inappropriate medication use in older adults. J Am Geriatr Soc. 2012;60(4):616-631.
17. May BH, Yang AW, Zhang AL, et al. Chinese herbal medicine for mild cognitive impairment and age associated memory impairment: a review of randomised controlled trials. Biogerontology. 2009;10(2):109-123.
18. Loef M, Walach H. The omega-6/omega-3 ratio and dementia or cognitive decline: a systematic review on human studies and biological evidence. J Nutr Gerontol Geriatr. 2013;32(1):1-23.
19. Solfrizzi VP, Panza F. Plant-based nutraceutical interventions against cognitive impairment and dementia: meta-analytic evidence of efficacy of a standardized Gingko biloba extract. J Alzheimers Dis. 2015;43(2):605-611.
20. Institute of Medicine. Cognitive aging: progress in understanding and opportunities for action. Washington, DC: National Academies Press; 2015.
21. Albert MS, DeKosky ST, Dickson D, et al. The diagnosis of mild cognitive impairment due to Alzheimer’s disease: recommendations from the National Institute on Aging-Alzheimer’s Association workgroups on diagnostic guidelines for Alzheimer’s disease. Alzheimers Dement. 2011;7(3):270-279.
Many older patients are concerned about their memory. The “worried well” may come into your office with a list of things they can’t recall, yet they remember each “deficit” quite well. Anticipatory anxiety about one’s own decline is common, and is most often concerned with changes in memory.1,2
Patients with dementia or early cognitive decline often are oblivious to their cognitive changes, however. Of particular concern is progressive dementia, especially Alzheimer’s disease (AD). Although jokes about “senior moments” are common, concern about AD incurs deep-seated worry. It is essential for clinicians to differentiate normal cognitive changes of aging—particularly those in memory—from early signs of neurodegenerative disease (Table 13).
In this article, we review typical memory changes in persons age >65, and differentiate these from mild cognitive impairment (MCI), an increasingly recognized prodrome of AD. Clinicians armed with knowledge of MCI are able to reassure the worried well, or recommend neuropsychological testing as indicated.
Is memory change inevitable with aging?
Memory loss is a common problem in aging, with variable severity. Research is establishing norms in cognitive functioning through the ninth decade of life.4 Controversy about sampling, measures, and methods abound,5 and drives prolific research on the subject, which is beyond the scope of this article. It has been demonstrated that there are a few “optimally aging” persons who avoid memory decline altogether.5,6 Most researchers and clinicians agree, however, that memory change is pervasive with advancing age.
Memory change follows a gradient with recent memories lost to a greater degree than remote memories (Ribot’s Law).7 Forgetfulness is characteristic of normal aging, and frequently manifests with misplaced objects and short-term lapses. However, this is not pathological—as long as the item or memory is recalled within 24 to 48 hours.
Compared with younger adults, healthy older adults are less efficient at encoding new information. Subsequently, they have more difficulty retrieving data, particularly after a delay. The time needed to learn and use new information increases, which is referred to as processing inefficiency. This influences changes in test performance across all cognitive domains, with decreases in measures of mental processing speed, working memory, and problem-solving.
Many patients who complain about “forgetfulness” are experiencing this normal change. It is not uncommon for a patient to offer a list of things she has forgotten recently, along with the dates and circumstances in which she forgot them. Because she sometimes forgets things, but remembers them later, there likely is nothing to worry about. If reminders—such as her list—help, this too is a good sign, because it shows her resourcefulness in using accommodations. If the patient is managing her normal activities, reassurance is warranted.
Mild cognitive impairment
Since at least 1958,8 clinical observations and research have recognized a prodrome that differentiates cognitive changes predictive of dementia from those that represent typical aging. Several studies and methods have converged toward consensus that MCI is a valid construct for that purpose, with ecological validity and sound predictive value. Clinical value is evident when a patient does not meet criteria for MCI; in this case, the clinician can reassure the worried well with conviction.
Revealing the diagnosis of MCI to patients requires sensitivity and assurance that you will reevaluate the condition annually. Although there is no evidence-based remedy for MCI or means to slow its progression to dementia, data are rapidly accruing regarding the value of lifestyle changes and other nonpharmacologic interventions.9
Recognizing MCI most simply requires 2 criteria:
The patient’s expressed concern about decline in cognitive functioning from a previous level of performance. Alternately, a caretaker’s report is valuable because the patient might lack insight. You are not looking for an inability to perform activities of daily living, which is indicative of frank dementia; rather, you want to determine whether the person’s independence in functional abilities is preserved, although less efficient. Patients might repeatedly report occurrences of new problems, although modest, in some cases. Although problems with memory often are the most frequently reported symptoms, changes can be observed in any cognitive domain. Uncharacteristic inability to understand instructions, frustration with new tasks, and inflexibility are common.
Quantified clinical assessment that the patient’s cognitive decline exceeds norms of his age cohort. Clinicians are already familiar with many of these tests (5-minute recall, clock face drawing, etc.). For MCI, we recommend the Montreal Cognitive Assessment (MoCA), which is specifically designed for MCI.10 It takes only 10 minutes to administer. Multiple versions of the MoCA, and instructions for its administration are available for provider use at www.mocatest.org.
When these criteria are met—a decline in previous functioning and an objective clinical confirmation—referral for neuropsychological testing is recommended. Subtypes of MCI—amnestic and non-amnestic—have been employed to specify the subtype (amnesic) that is most consistent with prodromal AD. However, this dichotomous scheme does not adequately explain or capture the heterogeneity of MCI.11,12
Medical considerations
Just as all domains of cognition are correlated to some degree, the overall health status of a person influences evaluation of memory. Variables, such as fatigue, test anxiety, mood, motivation, visual and auditory acuity, education, language fluency, attention, and pain, affect test performance. In addition, clinician rapport and the manner in which tests are administered must be considered.
Depression can mimic MCI. A depressed patient often has poor expectations of himself and slowed thinking, and might exaggerate symptoms. He might give up on tests or refuse to complete them. His presentation initially could suggest cognitive decline, but depression is revealed when the clinician pays attention to vegetative signs (insomnia, poor appetite) or suicidal ideation. There is growing evidence that subjective complaints of memory loss are more frequently associated with depression than with objective measures of cognitive impairment.13,14
Other treatable conditions can present with cognitive change (the so-called reversible dementias). A deficiency of vitamin B12, thiamine, or folate often is seen because quality of nutrition generally decreases with age. Hyponatremia and dehydration can present with confusion and memory impairment. Other treatable conditions include:
- cerebral vasculitis, which could improve with immune suppressants
- endocrine diseases, which might respond to hormonal or surgical treatment
- normal pressure hydrocephalus, which can be relieved by surgical placement of a shunt.
Take a complete history. What exactly is the nature of the patient or caregiver’s complaint? You need to attempt to engage the patient in conversation, observing his behavior during the evaluation. Is there notable delay in response, difficulty in attention and focus, or in understanding questions?
The content of speech is an indicator of the patient’s information processing. Ask the patient to recite as many animals from the jungle as possible. Most people can come up with at least 15. The person with MCI will likely name fewer animals, but may respond well to cueing, and perform better in recognition (eg, pictures or drawings) vs retrieval. When asked to describe a typical day, the patient may offer a vague, nonchalant response eg, “I keep busy watching the news.” This kind of response may be evidence of confabulation; with further questioning, he is unable to identify current issues of interest.
Substance abuse. It is essential that clinicians recognize that elders are not exempt from alcohol and other drug abuse that affects cognition. Skilled history taking, including attention to non-verbal responses, is indicated. A defensive tone, rolling of eyes, or silent yet affirmative nodding are means by which caregivers offer essential “clues” to the provider.
A quick screening tool for the office is valuable; many clinicians are most familiar with the Mini-Mental State Examination or the Saint Louis University Mental Status Examination, which are known to be sensitive in detecting memory problems and other cognitive defects. As we noted, the MoCA is now recommended for differentiating more subtle changes of MCI.10,15 It is important to remember that common conditions such as an urinary tract infection or trauma after anesthesia for routine procedures such as colonoscopy can cause cognitive impairment. Again, eliciting history from a family member is valuable because the patient may have forgotten vital data.
A good physical exam is important when evaluating for dementia. Look for any neurologic anomaly. Check for disinhibition of primitive reflexes, eg, abnormal grasp or snout response or Babinski sign. Compare the symmetry and strength of deep tendon reflexes. Look for neurologic soft signs. Any pathological reflex response can be an important clue about neurodegeneration or space-occupying lesions. We recall seeing a 62-year-old man whose spouse brought him for evaluation for new-onset reckless driving and marked inattention to personal hygiene that developed over the previous 3 months. On examination, he appeared disheveled and had a dull affect, although disinhibited and careless. His mentation and gait were slowed. He denied distress of any kind. Frontal release signs were noted on exam. An MRI revealed a space-occupying lesion of the frontal lobe measuring 3 cm wide with a thickness of 2 cm, which pathology confirmed as a benign tumor.
Always check for arrhythmia and hypertension. These are significant risk factors for ischemic brain disease, multiple-infarct stroke, or other forms of vascular dementia. A shuffling gait suggests Parkinson’s disease, or even Lewy body dementia, or medication-related conditions, for example, from antipsychotics.
Take a medication history. Many common treatments for anxiety and insomnia can cause symptoms that mimic dementia. Digitalis toxicity results in poor recall and confusion. Combinations of common medicines (antacids, antihistamines, and others) compete for metabolic pathways and lead to altered mental status. Referencing the Beers List16 is valuable; anticholinergics, benzodiazepines, and narcotic analgesics are of special concern. The latter could still be useful for comfort care at the end of life.
It is common for seniors to take a variety of untested and unproven supplements in the hope of preventing or lessening memory problems. In addition to incurring significant costs, the indiscriminate use of supplements poses risks of toxicity, including unintended interactions with prescribed medications. Many older adults do not disclose their use of these supplements to providers because they do not consider them “medicine.”
Labs. The next level of evaluation calls for a basic laboratory workup. Check complete blood count, liver enzymes, thyroid function tests, vitamin D, B12 and folate levels; perform urinalysis and a complete metabolic panel. Look at a general hormone panel; abnormal values could reveal a pituitary adenoma. (In the past 33 years, the first author has found 42 pituitary tumors in the workup of mental status change.)
We use imaging, such as a CT or MRI of the brain, in almost all cases of suspected dementia. Cerebral atrophy, space-occupying lesions, and shifting of the ventricles often correspond with cognitive decline.
Treatment
Effective treatment of dementia remains elusive. Other than for the “reversible dementias,” pharmacotherapy has shown less progress than had been expected. Donepezil, galantamine, rivastigmine, and memantine could slow disease progression in some cases. There have been many studies for dementia preventives and treatments. Extensive reviews and meta-analyses, including those of randomized controlled trials17-19 abound for a variety of herbs, supplements, and antioxidants; none have shown compelling results. Table 2 lists Institute of Medicine recommendations supported by evidence that could reduce effects of cognitive aging.20
Recommendations from collaboration between the National Institute on Aging and the Alzheimer’s Association21 state that research should focus on biomarkers, such as neural substrates or genotypes. Indicators of oxidative stress (cytokines) and inflammation (isoprostanes) show promise as measures of brain changes that correspond with increased risk of AD or other dementias.
Summing up
Older adults are a heterogeneous group. Intellectual capacity does not diminish with advancing age. Many elders now exceed expectations for productivity, athletic ability, scientific achievement, and the creative arts. Others live longer with diminished quality of life, their health compromised by progressive neurodegenerative disease.
Age-associated memory change often is exaggerated and feared by older adults and, regrettably, is associated with inevitable functional impairment and is seen as heralding the loss of autonomy. The worried well are anxious, although the stigma associated with cognitive decline may preclude confiding their concerns.
Providers need the tools and acumen to treat patients along an increasingly long continuum of time, including conveyance of evidence-based encouragement toward optimal health and vitality.
1. Serby MJ, Yhap C, Landron EY. A study of herbal remedies for memory complaints. J Neuropsychiatry Clin Neurosci. 2010;22(3):345-347.
2. Jaremka LM, Derry HM, Bornstein R, et al. Omega-3 supplementation and loneliness-related memory problems: secondary analyses of a randomized controlled trial. Psychosom Med. 2014;76(8):650-658.
3. Depp CA, Harmell A, Vania IV. Successful cognitive aging. In: Pardon MC, Bondi MW, eds. Behavioral neurobiology of aging. New York, NY: Springer-Verlag; 2012:35-50.
4. Invik RJ, Malec JF, Smith GE, et al. Mayo’s older Americans normative studies: WAIS-R, WMS-R, and AVLT norms for ages 56 to 97. Clin Neuropsychol. 1992;6(suppl 1):1-104.
5. Powell DH, Whitla DK. Profiles in cognitive aging. Boston, MA: Harvard University Press; 1994.
6. Negash S, Smith GE, Pankratz SE, et al. Successful aging: definitions and prediction of longevity and conversion to mild cognitive impairment. Am J Geriatr Psychiatry. 2011;19(6):581-588.
7. Ribot T. Diseases of memory: an essay in the positive psychology. London, United Kingdom: Kegan Paul Trench; 1882.
8. Kral VA. Neuropsychiatric observations in old peoples home: studies of memory dysfunction in senescence. J Gerontol. 1958;13(2):169-176.
9. Gitlin LN, Kales HC, Lyketsos CG. Nonpharmacologic management of behavioral symptoms in dementia. JAMA. 2012;308(19):2020-2029.
10. Nasreddine ZS, Phillips NA, Bédirian V, et al. The Montreal Cognitive Assessment, MoCA: a brief screening tool for mild cognitive assessment. J Am Geriatr Soc. 2005;53(4):695-699.
11. Clark LR, Delano-Wood L, Lisbon DJ, et al. Are empirically-derived subtypes of mild cognitive impairment consistent with conventional subtypes? J Intl Neuropsychol Soc. 2013;19(6):1-11.
12. Ganguli M, Snitz BE, Saxton JA, et al. Outcomes of mild cognitive impairment by definition: a population study. Arch Neurol. 2011;68(6):761-767.
13. Bartley M, Bokde AL, Ewers M, et al. Subjective memory complaints in community dwelling older people: the influence of brain and psychopathology. Intl J Geriatr Psychiatry. 2012;27(8):836-843.
14. Chung JC, Man DW. Self-appraised, informant-reported, and objective memory and cognitive function in mild cognitive impairment. Dement Geriatr Cogn Disord. 2009;27(2):187-193.
15. Tsoi KK, Chan JY, Hirai HW, et al. Cognitive tests to detect dementia: a systematic review and meta-analysis. JAMA Intern Med. 2015;175(9):1450-1458.
16. American Geriatrics Society 2012 Beers Criteria Update Expert Panel. American Geriatrics Society updated Beers Criteria for potentially inappropriate medication use in older adults. J Am Geriatr Soc. 2012;60(4):616-631.
17. May BH, Yang AW, Zhang AL, et al. Chinese herbal medicine for mild cognitive impairment and age associated memory impairment: a review of randomised controlled trials. Biogerontology. 2009;10(2):109-123.
18. Loef M, Walach H. The omega-6/omega-3 ratio and dementia or cognitive decline: a systematic review on human studies and biological evidence. J Nutr Gerontol Geriatr. 2013;32(1):1-23.
19. Solfrizzi VP, Panza F. Plant-based nutraceutical interventions against cognitive impairment and dementia: meta-analytic evidence of efficacy of a standardized Gingko biloba extract. J Alzheimers Dis. 2015;43(2):605-611.
20. Institute of Medicine. Cognitive aging: progress in understanding and opportunities for action. Washington, DC: National Academies Press; 2015.
21. Albert MS, DeKosky ST, Dickson D, et al. The diagnosis of mild cognitive impairment due to Alzheimer’s disease: recommendations from the National Institute on Aging-Alzheimer’s Association workgroups on diagnostic guidelines for Alzheimer’s disease. Alzheimers Dement. 2011;7(3):270-279.

Review of the BRIDGE Trial
In the United States, it is estimated that 2.7 to 6.1 million people have atrial fibrillation (AF).[1] This number is projected to increase to 12.1 million in 2030.[2] Despite the advent of direct oral anticoagulants (DOAC), roughly half of patients with AF on anticoagulation are treated with vitamin K antagonists (VKA), warfarin being the most widely used.[3]
Every year at least 250,000 individuals will require anticoagulation interruption for an elective procedure.[4] Clinicians, especially in hospitalized settings, are faced with the need to balance the risk of procedural bleeding with the potential for arterial thromboembolic (ATE) events. This is further complicated by warfarin's long half‐life (3660 hours).[5] The slow weaning off and restoration of warfarin's anticoagulant effect expose patients, in theory, to a higher risk of ATE in the perioperative period. Heparin bridging therapy with unfractionated heparin (UFH) or low‐molecular‐weight heparin (LMWH) was believed to be a solution to provide continuous anticoagulant effect during temporary interruption of warfarin. Perioperative bridging therapy remains widely used by hospitalists, despite uncertainties about whether it meets its premise of conferring a clinically meaningful reduction of ATE's risk that overweighs the likely higher incidence of major bleeding associated with its use over a no‐bridging strategy. Up until recently, no randomized clinical trials have evaluated the fundamental question of should we bridge. The landmark BRIDGE (Perioperative Bridging Anticoagulation in Patients with Atrial Fibrillation) trial published in August 2015 greatly contributed to answering this question.[6]
In this article we perform a narrative review of the literature on the perioperative anticoagulation management of patients with AF on chronic warfarin needing an elective procedure or surgery that led to the BRIDGE trial. We also examine the most recent 9th Edition Guidelines from the American College of Chest Physicians (ACCP) on perioperative management of anticoagulation in this population.[4] We then discuss in detail findings from the BRIDGE trial along with its implications for the hospitalist. Further, we suggest a practical treatment algorithm to the perioperative anticoagulation management of patients with AF on warfarin who are undergoing an elective procedure or surgery. We opt to focus on warfarin and to omit DOAC and antiplatelet therapies in our suggested practical approach. We lastly evaluate ongoing trials in this field.
RECENT STUDIES ON HEPARIN BRIDGING IN ATRIAL FIBRILLATION USING CONTROL GROUPS
In the last five years a body of evidence has progressively questioned the value of perioperative bridging therapy in preventing ATEs. The ORBIT‐AF (Outcomes Registry for Better Informed Treatment of Atrial Fibrillation) study examined data on oral anticoagulation (OAC) interruption among 2200 patients in the United States.[7] Patients who received bridging therapy accounted for 24% of interruptions and had a slightly higher CHADS2 score than non‐bridged groups (2.53 vs 2.34, P = 0.004). Overall, no significant differences in the rate of stroke or systemic embolism were detected between the bridged and nonbridged groups (0.6% vs 0.3%, P = 0.3). In multivariate analysis, bridging was associated with an odds ratio (OR) of 3.84 of major bleeding within 30 days (P < 0.0001), along with a higher 30‐day composite incidence of myocardial infarction, stroke or systemic embolism, bleeding, hospitalization, or death (OR: 1.94, P = 0.0001). The increased adverse events with bridging therapy were independent of the baseline OAC (warfarin or dabigatran). Although the study argued against the routine use of bridging in AF patients, the authors could not exclude the potential impact of measured (CHADS2) and unmeasured confounding variables.[7]
The open‐label RE‐LY (Randomized Evaluation of Long Term Anticoagulant Therapy With Dabigatran Etexilate) trial compared dabigatran to warfarin in nonvalvular AF. Its dataset provided prospective information on 1424 warfarin interruptions for an elective procedure or surgery. The interruptions, of which 27.5% were treated with bridging therapy, were analyzed in a substudy of the trial.[8] The CHADS2 or CHA2DS2‐VASC scores were similar in the bridged and nonbridged warfarin groups. Relatively higher rates of major bleeding were observed in the bridged group (6.8% vs 1.6%, P < 0.001) with no statistically significant difference in stroke and systemic embolism (0.5% vs 0.2%, P = 0.32) compared to the nonbridged group. Paradoxically, bridging therapy was associated with a 6‐fold increase in the risk of any thromboembolic event among patients on warfarin (P = 0.007). As in the ORBIT‐AF study, it was difficult to determine whether this increase was secondary to unmeasured confounding variables associated with higher baseline risk of ATE.[8]
The problem of unmeasured variables was common to the previous studies of perioperative bridging therapy. The heterogeneity of event definitions, bridging regimens, and per‐protocol adherence rates were additional limitations to the studies' clinical implications, despite the consistency of a 3‐ to 4‐fold increase in the major bleeding risk among bridged patients with no accompanying protection against ATE. From this perspective, the absence of high‐quality data was the motivating force behind the BRIDGE trial.
THE BRIDGE TRIAL
The BRIDGE trial[6] attempted to answer a simple yet fundamental question: in patients with AF on warfarin who need temporary interruption for an elective procedure or surgery, is perioperative heparin bridging necessary?
Adult patients (18 years of age) were eligible for the study if they had chronic AF treated with warfarin for 3 months or more with a target International Normalized Ratio (INR) range of 2.0 to 3.0, CHADS2 score 1, and were undergoing an elective invasive procedure or nonurgent surgery. The study excluded patients planned for a cardiac, intracranial, or intraspinal surgery. A history of stroke, ATE, or TIA in the preceding 3 months; a major bleed in the previous 6 weeks; or a mechanical heart valve precluded study participation. Further, those with a platelet count <100,000/mm[3] or creatinine clearance less than 30 mL per minute were also excluded.
Patients were randomly assigned to receive LMWH (dalteparin 100 IU/kg of body weight) or placebo subcutaneously twice daily in a double‐blind fashion. In all patients, warfarin was withheld 5 days before the invasive procedure or elective surgery and restarted within 24 hours afterward. The bridging arm received therapeutic‐dose LMWH starting 3 days before the procedure with matching placebo in the nonbridged arm. The last dose of LMWH or placebo was given around 24 hours before the procedure and then withheld. LMWH or placebo was restarted 12 to 24 hours after the procedure for defined low bleeding‐risk procedures and 48 to 72 hours for high bleeding‐risk procedures. The study drug was continued for 5 to 10 days and stopped when the INR was in the therapeutic range. The coprimary outcomes were ATE (stroke, TIA, or systemic embolism) and major bleeding using a standardized definition. These outcomes were assessed in the 30 days following the procedure.
Out of 1884 recruited patients in the United States and Canada, 934 patients were assigned to the bridging arm and 950 to the nonbridging arm. Study participants had a mean age of 71.7 years, a CHADS2 score of 2.3, and 3 out of 4 were men. The 2 arms had similar baseline characteristics. Adherence to the study‐drug protocol was high, with an 86.5% rate of adherence before the procedure to 96.5% after the procedure. At 30 days, the rate of ATE in the bridging group (0.4%) was noninferior to the nonbridging one (0.3%) (95% confidence interval [CI]: 0.6 to 0.8; P value for noninferiority = 0.01). The mean CHADS2 score in patients who sustained an ATE event was 2.6 (range, 14). The median time to an ATE event was 19.0 days (interquartile range [IQR], 6.023.0 days). The bridging group had a significantly higher rate of major bleeding compared to the nonbridging one (3.2% vs 1.3%, P = 0.005). The median time to a major bleeding event after a procedure was 7.0 days (IQR, 4.018.0 days). The 2 arms did not differ in their rates of venous thromboembolic (VTE) events and death in the study period. Yet, there was a significantly greater rate of minor bleeding in the bridging group (20.9% vs 12.0%, P < 0.001) and a trend toward more episodes of myocardial infarction in the bridging group as well (1.6% vs 0.8%, P = 0.10).
The BRIDGE trial was a proof of concept that the average AF patient may safely undergo commonly performed elective procedures or surgeries in which warfarin is simply withheld 5 days before and reinitiated within a day of the procedure without the need for periprocedural heparin bridging. Perioperative ATE rates, previously thought to be around 1%, have been overestimated. The ATE rate was low in the BRIDGE trial (0.4%), especially given a representative AF study population. The classical concern that warfarin interruption leads to a rebound hypercoagulable state was not supported by the trial.
The 9th Edition 2012 ACCP Guidelines on perioperative management of anticoagulation had suggested bridging in AF patients at high thrombotic risk and no bridging in the low risk group (Table 1).[4] For patients at moderate risk, the ACCP Guidelines called for an individualized assessment of risk versus benefits of bridging, a recommendation that was not based on high‐quality data. The BRIDGE trial findings are likely to change practice by providing level 1 evidence to forgo bridging in the vast majority of represented AF patients. For the hospitalist, this should greatly simplify periprocedural anticoagulant management for the AF patient on chronic warfarin in a hospitalized setting.
| Risk Category | Mechanical Heart Valve | Atrial Fibrillation | Venous Thromboembolism |
|---|---|---|---|
| |||
| High | Mitral valve prosthesis | CHADS2 score of 5 or 6 | Recent (<3 month) VTE |
| Caged‐ball or tilting‐disc aortic valve prosthesis | Recent (<3 months) stroke or TIA | Severe thrombophilia | |
| Recent (<6 months) stroke or TIA | Rheumatic valvular heart disease | Deficiency of protein C, protein S, or antithrombin | |
| Antiphospholipid antibodies | |||
| Multiple thrombophilias | |||
| Intermediate | Bileaflet aortic valve prosthesis with a major risk factor for stroke | CHADS2 score of 3 or 4 | VTE within past 312 months |
| Nonsevere thrombophilia | |||
| Recurrent VTE | |||
| Active cancer | |||
| Low | Bileaflet aortic valve prosthesis without a major risk factor for stroke | CHADS2 score of 0 to 2 with no prior stroke or TIA | VTE >12 months previous |
Limitations of the BRIDGE trial include the exclusion of surgeries that have an inherent high risk of postoperative thrombosis as well as bleeding, such as cardiac and vascular surgeries. Also, the trial had an under‐representation of patients with a CHADS2 score of 5 or 6 and excluded those with a mechanical heart valve. Both of these groups carry a high risk of ATE. However, it would be expected that the increase in postprocedural bleed risk seen with therapeutic‐dose bridging therapy in the BRIDGE trial would only be magnified in high bleeding‐risk procedures, with either no effect on postoperative ATE risk reduction, or the potential to cause an increase in downstream ATE events by the withholding of anticoagulant therapy for a bleed event. The ongoing placebo‐controlled PERIOP‐2 trial (
PRACTICAL APPROACH TO PERIOPERATIVE MANAGEMENT OF WARFARIN ANTICOAGULATION IN ATRIAL FIBRILLATION
In Figure 1 we suggest a practical 3‐step framework for the perioperative anticoagulation management of patients on chronic warfarin for AF. First, if the planned invasive procedure or surgery falls under the minimal bleeding‐risk group in Table 2, we propose continuing warfarin in the perioperative period. Notably, implantation of a pacemaker or cardioverter‐defibrillator device is included in this group based on recently completed randomized trials in this patient group. In fact, the BRUISE CONTROL trial showed a markedly reduced incidence of device‐pocket hematoma when warfarin was continued in the perioperative period as compared to its temporary interruption and use of bridging (3.5% vs 16%, P < 0.001). Other surgical complications including ATE events were similar in the 2 groups.[10] The COMPARE trial demonstrated that warfarin can also be continued in the periprocedural period in patients undergoing catheter ablation of AF. Warfarin's continuation among 1584 AF patients who had this procedure was associated with significantly fewer thromboembolic events(0.25% vs 4.9%, P < 0.001) and minor bleeding complications (4.1% vs 22%, P < 0.001) compared to its temporary interruption and use of bridging.[11] We recognize that the clinical distinction between minimal and low bleeding risk can be difficult, yet the former is increasingly recognized as a group in which anticoagulation can be safely continued in the perioperative period.[12]
| Minimal Bleeding‐Risk Procedures | Low Bleeding‐Risk Procedures | High Bleeding‐Risk Procedures |
|---|---|---|
| Implantation of pacemaker or cardioverter‐defibrillator device;* catheter ablation of atrial fibrillation* | Coronary angiography | Cardiac, intracranial, or spinal surgery; any major procedure lasting 45 minutes |
| Minor cutaneous excision (actinic keratosis, premalignant/malignant skin nevi, basal and squamous cell skin carcinoma) | Cutaneous or lymph node biopsy | Major surgery with extensive tissue resection; cancer surgery |
| Cataract surgery | Arthroscopy; surgery of hand, foot, or shoulder | Major orthopedic surgery |
| Minor dental procedure (cleaning, filling, extraction, endodontic, prosthetic) | Endoscopy/colonoscopy biopsy, laparoscopic cholecystectomy, hemorrhoidal surgery, abdominal hernia repair | Liver or spleen surgery, bowel resection, colonic polyp resection, percutaneous endoscopic gastrotomy placement, endoscopic retrograde cholangiopancreatography |
| Bronchosopy | Nephrectomy, kidney biopsy, transurethral prostate resection, bladder resection, or tumor ablation | |

Second, if the decision was made to hold warfarin, the next step is to estimate the patient's perioperative thrombotic risk based on the 9th Edition ACCP Guidelines shown in Table 1. Whereas patients may have additional comorbidities, a theoretical framework for an individual patient's ATE risk stratification as seen in the ACCP Guidelines is determined by the CHADS2 score, a history of rheumatic heart disease, and a recent ATE event (within 3 months). In the low ATE risk group, recommendations from the ACCP,[4] the American Heart Association, and the American College of Cardiology[13] are in agreement against the use of perioperative bridging. Level 1 evidence from the BRIDGE trial now supports that bridging may be forgone in patients in the moderate ATE risk group and likely many patients in the high ATE risk group (although patients with a CHADS2 score of 5 and 6 were under‐represented in the BRIDGE trial). In certain high ATE risk patient groups with AF, especially those with a recent ATE event, mechanical heart valves, or severe rheumatic heart disease, it may be prudent to bridge those patients with UFH/LMWH.
Third, assuming adequate hemostasis is achieved after the procedure, warfarin can be restarted within 24 hours at its usual maintenance dose regardless of bridging. For patients among whom bridging is chosen, we suggest that the timing of resumption of LMWH bridging be based on the procedural risk of bleeding (Table 2): 1‐day postprocedurally in the low bleeding‐risk groups or 2 to 3 days postprocedurally in the high bleeding‐risk groups. For the latter group, a stepwise use of prophylactic‐dose LMWH, especially after a major surgery for the prevention of VTE, may be resumed earlier at the discretion of the surgeon or interventionist. For both groups, therapeutic‐dose LMWH may be stopped once the INR is 2.
A number of challenges are associated with the proposed framework. Real‐world data show that nonindicated OAC interruptions and bridging are commonplace. This may defer the hospitalist's readiness to change practice.[7] Although the CHADS2/CHA2DS2‐VASc scores are widely used to estimate the perioperative ATE risk, there is scant evidence from validation studies,[14, 15] whereas the CHADS2 score has been used in guideline recommendations.[4] Also, as previously discussed, this framework excludes patients with a recent stroke or a mechanical heart valve, patients on warfarin for VTE, and patients on DOACs.
RETHINKING HEPARIN BRIDGING THERAPY IN NONATRIAL FIBRILLATION PATIENT GROUPS
There is now mounting recent evidence from over 12,000 patients that any heparin‐based bridging strategy does not reduce the risk of ATE events but confers an over 2‐ to 3‐fold increased risk of major bleeding.[16] Thus, in our view, the BRIDGE trial was a proof of concept that calls to question the premise of heparin bridging therapy in preventing ATE beyond the AF population. Retrospective studies provide evidence of the lack of treatment effect with heparin bridging even in perceived high thromboembolic risk populations, including those with mechanical heart valves and VTE (2 patient groups for whom there are currently no level 1 data on perioperative management of anticoagulation and bridging therapy).
In their systematic review and meta‐analysis, Siegal et al. evaluated periprocedural rates of bleeding and thromboembolic events in more than 12,000 patients on VKA based on whether they were bridged with control groups.[16] Thirty out of 34 studies reported the indication for anticoagulation, with AF being the most common (44%). Bridging was associated with an OR of 5.4 for overall bleeding (95% CI: 3.0 to 9.7) and an OR of 3.6 for major bleeding (95% CI: 1.5 to 8.5). ATE and VTE events were rare, with no statistically significant differences between the bridged (0.9%) and nonbridged patients (0.6%) (OR: 0.8, 95% CI: 0.42 to 1.54). The authors suggested that bridging might better be reserved to patients who are at high risk of thromboembolism. Nonetheless, the implications of the findings were limited by the poor quality of included studies and their heterogeneity in reporting outcomes, especially bleeding events.[16]
In a retrospective cohort study of 1777 patients who underwent mechanical heart valve replacement (56% aortic, 34% mitral, 9% combined aortic and mitral), 923 patients who received therapeutic‐dose bridging therapy in the immediate postvalve implantation period had a 2.5 to 3 times more major bleeding (5.4% vs 1.9%, P = 0.001) and a longer hospital stay compared to those who received prophylactic‐dose bridging anticoagulation. The two groups had comparable thromboembolic complications at 30 days (2%, P = 0.81).[17] Another study retrospectively analyzed data from 1178 patients on warfarin for prevention of secondary VTE who had anticoagulation interruption for an invasive procedure or surgery. About one‐third received bridging therapy, the majority with therapeutic‐dose LMWH. Of the bridged patients, 2.7% had a clinically relevant bleeding at 30 days compared to 0.2% in the nonbridged groups (P = 0.01). The incidence of a recurrent VTE was low across all thrombotic risk groups, with no differences between bridged and nonbridged patients (0.0% vs 0.2%, P = 0.56).[18]
There are a number of factors as to why heparin bridging appears ineffective in preventing periprocedural ATE events. It is possible that rebound hypercoagulability and a postoperative thrombotic state have been overestimated. Older analyses supporting postoperative ATE rates of 1.6% to 4.0% and a 10‐fold increased risk of ATE by major surgery are not supported by recent perioperative anticoagulant studies with control arms, including the BRIDGE trial, where the ATE event rate was closer to 0.5% to 1.0%.[6, 7, 8, 19] The mechanisms of perioperative ATE may be more related to other factors than anticoagulant‐related factors, such as the vascular milieu,[14] alterations in blood pressure,[20] improvements in surgical and anesthetic techniques (including increasing use of neuraxial anesthesia),[21] and earlier patient mobilization. Indeed, the occurrence of ATE events in the BRIDGE trial did not appear to be influenced by a patient's underlying CHADS2 score (mean CHADS2 score of 2.6). There is a growing body of evidence that suggests perioperative heparin bridging has the opposite effect to that assumed by its use: there are trends toward an increase in postoperative ATE events in patients who receive bridging therapy.[8]
In the BRIDGE trial, there was a trend toward an increase in myocardial infarction in the bridging arm. This can be explained by a number of factors, but the most obvious includes an increase in bleeding events as may be expected by the use of therapeutic‐dose heparin bridging over a no‐bridging approach, which then predisposes a patient to downstream ATE events after withholding of anticoagulant therapy. The median time to a major bleed in BRIDGE was 7 days, whereas the mean time to an ATE event was 19 days, suggesting that bleeding is front‐loaded and that withholding of anticoagulant therapy after a bleed event may potentially place a patient at risk for later ATE events. This is consistent with an earlier single‐arm prospective cohort study of 224 high ATE risk patients on warfarin who were treated with perioperative LMWH bridging therapy. Among patients who had a thromboembolic event in the 90 postoperative days, 75% (6 out of 8) had their warfarin therapy withdrawn or deferred because of bleeding.[22] Last, if prophylactic doses of heparin were used as bridging therapy, there is no evidence that this would be protective of ATE events, which is the premise of using heparin bridging. Both of these concepts will be assessed when results of the PERIOP‐2 trial are made available.
An emerging body of evidence suggests an unfavorable risk versus benefit balance of heparin bridging, regardless of the underlying thrombotic risk. Overall, if bridging therapy is effective in protecting against ATE (which has yet to be demonstrated), recent studies show that its number needed to treat (NNT) would be very large and far larger than its number needed to harm (NNH). If more patients undergoing high bleeding‐risk procedures were included in the BRIDGE trial, these effects of unfavorable NNT to NNH would be magnified. While awaiting more definite answers from future trials, we believe clinicians should be critical of heparin bridging. We also suggest that they reserve it for patients who are at a significantly high risk of ATE complications until uncertainties around its use are clarified.
CONCLUSION
The BRIDGE trial provided high‐quality evidence that routine perioperative heparin bridging of patients on chronic warfarin for AF needing an elective procedure or surgery is both unnecessary and harmful. The trial is practice changing for patients with AF, and its results will likely be implemented in future international guidelines on the topic, including those of the ACCP. The hospitalist should be aware that the current large body of evidence points to more harm than benefit associated with heparin bridging in preventing ATE for any patient group, including those at high risk of ATE. Ongoing and future trials may clarify the role of heparin bridgingif anyin patients on chronic warfarin at high risk of ATE, including those with mechanical heart valves.
Disclosures: Alex C. Spyropoulos, MD, has served as a consultant for Bayer, Boehringer Ingelheim, Daiichi Sankyo, and Janssen. He also has served on advisory committees for Bristol‐Myers Squibb and Pfizer.
- Centers for Disease Control and Prevention. Atrial fibrillation fact sheet. Available at: http://www.cdc.gov/dhdsp/data_statistics/fact_sheets/fs_atrial_fibrillation.htm. Updated August 13, 2015. Accessed November 22, 2015.
- , , , , , . Estimates of current and future incidence and prevalence of atrial fibrillation in the U.S. adult population. Am J Cardiol. 2013;112(8):1142–1147.
- , , , . National trends in ambulatory oral anticoagulant use. Am J Med. 2015;128(12):1300–1305.e2.
- , , , et al. Perioperative management of antithrombotic therapy: Antithrombotic Therapy and Prevention of Thrombosis, 9th ed: American College of Chest Physicians evidence‐based clinical practice guidelines. Chest. 2012;141(2 suppl):e326S–e350S.
- , , , et al. Pharmacology and management of the vitamin K antagonists: American College of Chest Physicians evidence‐based clinical practice guidelines (8th edition). Chest. 2008;133(6 suppl):160S–198S.
- , , , et al. Perioperative Bridging Anticoagulation in Patients with Atrial Fibrillation. N Engl J Med. 2015;373(9):823–833.
- , , , et al. Use and outcomes associated with bridging during anticoagulation interruptions in patients with atrial fibrillation: findings from the Outcomes Registry for Better Informed Treatment of Atrial Fibrillation (ORBIT‐AF). Circulation. 2015;131(5):488–494.
- , , , et al. Perioperative bridging anticoagulation during dabigatran or warfarin interruption among patients who had an elective surgery or procedure. Substudy of the RE‐LY trial. Thromb Haemost. 2015;113(3):625–632.
- PERIOP 2—A Safety and Effectiveness Study of LMWH Bridging Therapy Versus Placebo Bridging Therapy for Patients on Long Term Warfarin and Require Temporary Interruption of Their Warfarin. ClinicalTrials.gov. Available at: https://clinicaltrials.gov/ct2/show/NCT00432796. Accessed December 9, 2015.
- , , , et al. Pacemaker or defibrillator surgery without interruption of anticoagulation. N Engl J Med. 2013;368(22):2084–2093.
- , , , et al. Periprocedural stroke and bleeding complications in patients undergoing catheter ablation of atrial fibrillation with different anticoagulation management: results from the Role of Coumadin in Preventing Thromboembolism in Atrial Fibrillation (AF) Patients Undergoing Catheter Ablation (COMPARE) randomized trial. Circulation. 2014;129(25):2638–2644.
- , , , . Risk factors for bleeding after oral surgery in patients who continued using oral anticoagulant therapy. J Am Dent Assoc. 2015;146(6):375–381.
- , , , et al. 2014 ACC/AHA guideline on perioperative cardiovascular evaluation and management of patients undergoing noncardiac surgery: executive summary: a report of the American College of Cardiology/American Heart Association Task Force on Practice Guidelines. Circulation. 2014;130(24):2215–2245.
- , , , , . Risk of stroke after surgery in patients with and without chronic atrial fibrillation. J Thromb Haemost. 2010;8(5):884–890.
- . Peri‐procedural management of patients taking oral anticoagulants. BMJ. 2015;351:h2391.
- , , , , , . Periprocedural heparin bridging in patients receiving vitamin K antagonists: systematic review and meta‐analysis of bleeding and thromboembolic rates. Circulation. 2012;126(13):1630–1639.
- , , , et al. Efficacy and safety of early parenteral anticoagulation as a bridge to warfarin after mechanical valve replacement. Thromb Haemost. 2014;112(6):1120–1128.
- , , , et al. Bleeding, recurrent venous thromboembolism, and mortality risks during warfarin interruption for invasive procedures. JAMA Intern Med. 2015;175(7):1163–1168.
- , . Perioperative management of patients receiving oral anticoagulants: a systematic review. Arch Intern Med. 2003;163(8):901–908.
- , , , et al. Predictors of intraoperative hypotension and bradycardia. Am J Med. 2015;128(5):532–538.
- . Perioperative stroke. N Engl J Med. 2007;356(7):706–713.
- , , , et al. Single‐arm study of bridging therapy with low‐molecular‐weight heparin for patients at risk of arterial embolism who require temporary interruption of warfarin. Circulation. 2004;110(12):1658–1663.
In the United States, it is estimated that 2.7 to 6.1 million people have atrial fibrillation (AF).[1] This number is projected to increase to 12.1 million in 2030.[2] Despite the advent of direct oral anticoagulants (DOAC), roughly half of patients with AF on anticoagulation are treated with vitamin K antagonists (VKA), warfarin being the most widely used.[3]
Every year at least 250,000 individuals will require anticoagulation interruption for an elective procedure.[4] Clinicians, especially in hospitalized settings, are faced with the need to balance the risk of procedural bleeding with the potential for arterial thromboembolic (ATE) events. This is further complicated by warfarin's long half‐life (3660 hours).[5] The slow weaning off and restoration of warfarin's anticoagulant effect expose patients, in theory, to a higher risk of ATE in the perioperative period. Heparin bridging therapy with unfractionated heparin (UFH) or low‐molecular‐weight heparin (LMWH) was believed to be a solution to provide continuous anticoagulant effect during temporary interruption of warfarin. Perioperative bridging therapy remains widely used by hospitalists, despite uncertainties about whether it meets its premise of conferring a clinically meaningful reduction of ATE's risk that overweighs the likely higher incidence of major bleeding associated with its use over a no‐bridging strategy. Up until recently, no randomized clinical trials have evaluated the fundamental question of should we bridge. The landmark BRIDGE (Perioperative Bridging Anticoagulation in Patients with Atrial Fibrillation) trial published in August 2015 greatly contributed to answering this question.[6]
In this article we perform a narrative review of the literature on the perioperative anticoagulation management of patients with AF on chronic warfarin needing an elective procedure or surgery that led to the BRIDGE trial. We also examine the most recent 9th Edition Guidelines from the American College of Chest Physicians (ACCP) on perioperative management of anticoagulation in this population.[4] We then discuss in detail findings from the BRIDGE trial along with its implications for the hospitalist. Further, we suggest a practical treatment algorithm to the perioperative anticoagulation management of patients with AF on warfarin who are undergoing an elective procedure or surgery. We opt to focus on warfarin and to omit DOAC and antiplatelet therapies in our suggested practical approach. We lastly evaluate ongoing trials in this field.
RECENT STUDIES ON HEPARIN BRIDGING IN ATRIAL FIBRILLATION USING CONTROL GROUPS
In the last five years a body of evidence has progressively questioned the value of perioperative bridging therapy in preventing ATEs. The ORBIT‐AF (Outcomes Registry for Better Informed Treatment of Atrial Fibrillation) study examined data on oral anticoagulation (OAC) interruption among 2200 patients in the United States.[7] Patients who received bridging therapy accounted for 24% of interruptions and had a slightly higher CHADS2 score than non‐bridged groups (2.53 vs 2.34, P = 0.004). Overall, no significant differences in the rate of stroke or systemic embolism were detected between the bridged and nonbridged groups (0.6% vs 0.3%, P = 0.3). In multivariate analysis, bridging was associated with an odds ratio (OR) of 3.84 of major bleeding within 30 days (P < 0.0001), along with a higher 30‐day composite incidence of myocardial infarction, stroke or systemic embolism, bleeding, hospitalization, or death (OR: 1.94, P = 0.0001). The increased adverse events with bridging therapy were independent of the baseline OAC (warfarin or dabigatran). Although the study argued against the routine use of bridging in AF patients, the authors could not exclude the potential impact of measured (CHADS2) and unmeasured confounding variables.[7]
The open‐label RE‐LY (Randomized Evaluation of Long Term Anticoagulant Therapy With Dabigatran Etexilate) trial compared dabigatran to warfarin in nonvalvular AF. Its dataset provided prospective information on 1424 warfarin interruptions for an elective procedure or surgery. The interruptions, of which 27.5% were treated with bridging therapy, were analyzed in a substudy of the trial.[8] The CHADS2 or CHA2DS2‐VASC scores were similar in the bridged and nonbridged warfarin groups. Relatively higher rates of major bleeding were observed in the bridged group (6.8% vs 1.6%, P < 0.001) with no statistically significant difference in stroke and systemic embolism (0.5% vs 0.2%, P = 0.32) compared to the nonbridged group. Paradoxically, bridging therapy was associated with a 6‐fold increase in the risk of any thromboembolic event among patients on warfarin (P = 0.007). As in the ORBIT‐AF study, it was difficult to determine whether this increase was secondary to unmeasured confounding variables associated with higher baseline risk of ATE.[8]
The problem of unmeasured variables was common to the previous studies of perioperative bridging therapy. The heterogeneity of event definitions, bridging regimens, and per‐protocol adherence rates were additional limitations to the studies' clinical implications, despite the consistency of a 3‐ to 4‐fold increase in the major bleeding risk among bridged patients with no accompanying protection against ATE. From this perspective, the absence of high‐quality data was the motivating force behind the BRIDGE trial.
THE BRIDGE TRIAL
The BRIDGE trial[6] attempted to answer a simple yet fundamental question: in patients with AF on warfarin who need temporary interruption for an elective procedure or surgery, is perioperative heparin bridging necessary?
Adult patients (18 years of age) were eligible for the study if they had chronic AF treated with warfarin for 3 months or more with a target International Normalized Ratio (INR) range of 2.0 to 3.0, CHADS2 score 1, and were undergoing an elective invasive procedure or nonurgent surgery. The study excluded patients planned for a cardiac, intracranial, or intraspinal surgery. A history of stroke, ATE, or TIA in the preceding 3 months; a major bleed in the previous 6 weeks; or a mechanical heart valve precluded study participation. Further, those with a platelet count <100,000/mm[3] or creatinine clearance less than 30 mL per minute were also excluded.
Patients were randomly assigned to receive LMWH (dalteparin 100 IU/kg of body weight) or placebo subcutaneously twice daily in a double‐blind fashion. In all patients, warfarin was withheld 5 days before the invasive procedure or elective surgery and restarted within 24 hours afterward. The bridging arm received therapeutic‐dose LMWH starting 3 days before the procedure with matching placebo in the nonbridged arm. The last dose of LMWH or placebo was given around 24 hours before the procedure and then withheld. LMWH or placebo was restarted 12 to 24 hours after the procedure for defined low bleeding‐risk procedures and 48 to 72 hours for high bleeding‐risk procedures. The study drug was continued for 5 to 10 days and stopped when the INR was in the therapeutic range. The coprimary outcomes were ATE (stroke, TIA, or systemic embolism) and major bleeding using a standardized definition. These outcomes were assessed in the 30 days following the procedure.
Out of 1884 recruited patients in the United States and Canada, 934 patients were assigned to the bridging arm and 950 to the nonbridging arm. Study participants had a mean age of 71.7 years, a CHADS2 score of 2.3, and 3 out of 4 were men. The 2 arms had similar baseline characteristics. Adherence to the study‐drug protocol was high, with an 86.5% rate of adherence before the procedure to 96.5% after the procedure. At 30 days, the rate of ATE in the bridging group (0.4%) was noninferior to the nonbridging one (0.3%) (95% confidence interval [CI]: 0.6 to 0.8; P value for noninferiority = 0.01). The mean CHADS2 score in patients who sustained an ATE event was 2.6 (range, 14). The median time to an ATE event was 19.0 days (interquartile range [IQR], 6.023.0 days). The bridging group had a significantly higher rate of major bleeding compared to the nonbridging one (3.2% vs 1.3%, P = 0.005). The median time to a major bleeding event after a procedure was 7.0 days (IQR, 4.018.0 days). The 2 arms did not differ in their rates of venous thromboembolic (VTE) events and death in the study period. Yet, there was a significantly greater rate of minor bleeding in the bridging group (20.9% vs 12.0%, P < 0.001) and a trend toward more episodes of myocardial infarction in the bridging group as well (1.6% vs 0.8%, P = 0.10).
The BRIDGE trial was a proof of concept that the average AF patient may safely undergo commonly performed elective procedures or surgeries in which warfarin is simply withheld 5 days before and reinitiated within a day of the procedure without the need for periprocedural heparin bridging. Perioperative ATE rates, previously thought to be around 1%, have been overestimated. The ATE rate was low in the BRIDGE trial (0.4%), especially given a representative AF study population. The classical concern that warfarin interruption leads to a rebound hypercoagulable state was not supported by the trial.
The 9th Edition 2012 ACCP Guidelines on perioperative management of anticoagulation had suggested bridging in AF patients at high thrombotic risk and no bridging in the low risk group (Table 1).[4] For patients at moderate risk, the ACCP Guidelines called for an individualized assessment of risk versus benefits of bridging, a recommendation that was not based on high‐quality data. The BRIDGE trial findings are likely to change practice by providing level 1 evidence to forgo bridging in the vast majority of represented AF patients. For the hospitalist, this should greatly simplify periprocedural anticoagulant management for the AF patient on chronic warfarin in a hospitalized setting.
| Risk Category | Mechanical Heart Valve | Atrial Fibrillation | Venous Thromboembolism |
|---|---|---|---|
| |||
| High | Mitral valve prosthesis | CHADS2 score of 5 or 6 | Recent (<3 month) VTE |
| Caged‐ball or tilting‐disc aortic valve prosthesis | Recent (<3 months) stroke or TIA | Severe thrombophilia | |
| Recent (<6 months) stroke or TIA | Rheumatic valvular heart disease | Deficiency of protein C, protein S, or antithrombin | |
| Antiphospholipid antibodies | |||
| Multiple thrombophilias | |||
| Intermediate | Bileaflet aortic valve prosthesis with a major risk factor for stroke | CHADS2 score of 3 or 4 | VTE within past 312 months |
| Nonsevere thrombophilia | |||
| Recurrent VTE | |||
| Active cancer | |||
| Low | Bileaflet aortic valve prosthesis without a major risk factor for stroke | CHADS2 score of 0 to 2 with no prior stroke or TIA | VTE >12 months previous |
Limitations of the BRIDGE trial include the exclusion of surgeries that have an inherent high risk of postoperative thrombosis as well as bleeding, such as cardiac and vascular surgeries. Also, the trial had an under‐representation of patients with a CHADS2 score of 5 or 6 and excluded those with a mechanical heart valve. Both of these groups carry a high risk of ATE. However, it would be expected that the increase in postprocedural bleed risk seen with therapeutic‐dose bridging therapy in the BRIDGE trial would only be magnified in high bleeding‐risk procedures, with either no effect on postoperative ATE risk reduction, or the potential to cause an increase in downstream ATE events by the withholding of anticoagulant therapy for a bleed event. The ongoing placebo‐controlled PERIOP‐2 trial (
PRACTICAL APPROACH TO PERIOPERATIVE MANAGEMENT OF WARFARIN ANTICOAGULATION IN ATRIAL FIBRILLATION
In Figure 1 we suggest a practical 3‐step framework for the perioperative anticoagulation management of patients on chronic warfarin for AF. First, if the planned invasive procedure or surgery falls under the minimal bleeding‐risk group in Table 2, we propose continuing warfarin in the perioperative period. Notably, implantation of a pacemaker or cardioverter‐defibrillator device is included in this group based on recently completed randomized trials in this patient group. In fact, the BRUISE CONTROL trial showed a markedly reduced incidence of device‐pocket hematoma when warfarin was continued in the perioperative period as compared to its temporary interruption and use of bridging (3.5% vs 16%, P < 0.001). Other surgical complications including ATE events were similar in the 2 groups.[10] The COMPARE trial demonstrated that warfarin can also be continued in the periprocedural period in patients undergoing catheter ablation of AF. Warfarin's continuation among 1584 AF patients who had this procedure was associated with significantly fewer thromboembolic events(0.25% vs 4.9%, P < 0.001) and minor bleeding complications (4.1% vs 22%, P < 0.001) compared to its temporary interruption and use of bridging.[11] We recognize that the clinical distinction between minimal and low bleeding risk can be difficult, yet the former is increasingly recognized as a group in which anticoagulation can be safely continued in the perioperative period.[12]
| Minimal Bleeding‐Risk Procedures | Low Bleeding‐Risk Procedures | High Bleeding‐Risk Procedures |
|---|---|---|
| Implantation of pacemaker or cardioverter‐defibrillator device;* catheter ablation of atrial fibrillation* | Coronary angiography | Cardiac, intracranial, or spinal surgery; any major procedure lasting 45 minutes |
| Minor cutaneous excision (actinic keratosis, premalignant/malignant skin nevi, basal and squamous cell skin carcinoma) | Cutaneous or lymph node biopsy | Major surgery with extensive tissue resection; cancer surgery |
| Cataract surgery | Arthroscopy; surgery of hand, foot, or shoulder | Major orthopedic surgery |
| Minor dental procedure (cleaning, filling, extraction, endodontic, prosthetic) | Endoscopy/colonoscopy biopsy, laparoscopic cholecystectomy, hemorrhoidal surgery, abdominal hernia repair | Liver or spleen surgery, bowel resection, colonic polyp resection, percutaneous endoscopic gastrotomy placement, endoscopic retrograde cholangiopancreatography |
| Bronchosopy | Nephrectomy, kidney biopsy, transurethral prostate resection, bladder resection, or tumor ablation | |
Second, if the decision was made to hold warfarin, the next step is to estimate the patient's perioperative thrombotic risk based on the 9th Edition ACCP Guidelines shown in Table 1. Whereas patients may have additional comorbidities, a theoretical framework for an individual patient's ATE risk stratification as seen in the ACCP Guidelines is determined by the CHADS2 score, a history of rheumatic heart disease, and a recent ATE event (within 3 months). In the low ATE risk group, recommendations from the ACCP,[4] the American Heart Association, and the American College of Cardiology[13] are in agreement against the use of perioperative bridging. Level 1 evidence from the BRIDGE trial now supports that bridging may be forgone in patients in the moderate ATE risk group and likely many patients in the high ATE risk group (although patients with a CHADS2 score of 5 and 6 were under‐represented in the BRIDGE trial). In certain high ATE risk patient groups with AF, especially those with a recent ATE event, mechanical heart valves, or severe rheumatic heart disease, it may be prudent to bridge those patients with UFH/LMWH.
Third, assuming adequate hemostasis is achieved after the procedure, warfarin can be restarted within 24 hours at its usual maintenance dose regardless of bridging. For patients among whom bridging is chosen, we suggest that the timing of resumption of LMWH bridging be based on the procedural risk of bleeding (Table 2): 1‐day postprocedurally in the low bleeding‐risk groups or 2 to 3 days postprocedurally in the high bleeding‐risk groups. For the latter group, a stepwise use of prophylactic‐dose LMWH, especially after a major surgery for the prevention of VTE, may be resumed earlier at the discretion of the surgeon or interventionist. For both groups, therapeutic‐dose LMWH may be stopped once the INR is 2.
A number of challenges are associated with the proposed framework. Real‐world data show that nonindicated OAC interruptions and bridging are commonplace. This may defer the hospitalist's readiness to change practice.[7] Although the CHADS2/CHA2DS2‐VASc scores are widely used to estimate the perioperative ATE risk, there is scant evidence from validation studies,[14, 15] whereas the CHADS2 score has been used in guideline recommendations.[4] Also, as previously discussed, this framework excludes patients with a recent stroke or a mechanical heart valve, patients on warfarin for VTE, and patients on DOACs.
RETHINKING HEPARIN BRIDGING THERAPY IN NONATRIAL FIBRILLATION PATIENT GROUPS
There is now mounting recent evidence from over 12,000 patients that any heparin‐based bridging strategy does not reduce the risk of ATE events but confers an over 2‐ to 3‐fold increased risk of major bleeding.[16] Thus, in our view, the BRIDGE trial was a proof of concept that calls to question the premise of heparin bridging therapy in preventing ATE beyond the AF population. Retrospective studies provide evidence of the lack of treatment effect with heparin bridging even in perceived high thromboembolic risk populations, including those with mechanical heart valves and VTE (2 patient groups for whom there are currently no level 1 data on perioperative management of anticoagulation and bridging therapy).
In their systematic review and meta‐analysis, Siegal et al. evaluated periprocedural rates of bleeding and thromboembolic events in more than 12,000 patients on VKA based on whether they were bridged with control groups.[16] Thirty out of 34 studies reported the indication for anticoagulation, with AF being the most common (44%). Bridging was associated with an OR of 5.4 for overall bleeding (95% CI: 3.0 to 9.7) and an OR of 3.6 for major bleeding (95% CI: 1.5 to 8.5). ATE and VTE events were rare, with no statistically significant differences between the bridged (0.9%) and nonbridged patients (0.6%) (OR: 0.8, 95% CI: 0.42 to 1.54). The authors suggested that bridging might better be reserved to patients who are at high risk of thromboembolism. Nonetheless, the implications of the findings were limited by the poor quality of included studies and their heterogeneity in reporting outcomes, especially bleeding events.[16]
In a retrospective cohort study of 1777 patients who underwent mechanical heart valve replacement (56% aortic, 34% mitral, 9% combined aortic and mitral), 923 patients who received therapeutic‐dose bridging therapy in the immediate postvalve implantation period had a 2.5 to 3 times more major bleeding (5.4% vs 1.9%, P = 0.001) and a longer hospital stay compared to those who received prophylactic‐dose bridging anticoagulation. The two groups had comparable thromboembolic complications at 30 days (2%, P = 0.81).[17] Another study retrospectively analyzed data from 1178 patients on warfarin for prevention of secondary VTE who had anticoagulation interruption for an invasive procedure or surgery. About one‐third received bridging therapy, the majority with therapeutic‐dose LMWH. Of the bridged patients, 2.7% had a clinically relevant bleeding at 30 days compared to 0.2% in the nonbridged groups (P = 0.01). The incidence of a recurrent VTE was low across all thrombotic risk groups, with no differences between bridged and nonbridged patients (0.0% vs 0.2%, P = 0.56).[18]
There are a number of factors as to why heparin bridging appears ineffective in preventing periprocedural ATE events. It is possible that rebound hypercoagulability and a postoperative thrombotic state have been overestimated. Older analyses supporting postoperative ATE rates of 1.6% to 4.0% and a 10‐fold increased risk of ATE by major surgery are not supported by recent perioperative anticoagulant studies with control arms, including the BRIDGE trial, where the ATE event rate was closer to 0.5% to 1.0%.[6, 7, 8, 19] The mechanisms of perioperative ATE may be more related to other factors than anticoagulant‐related factors, such as the vascular milieu,[14] alterations in blood pressure,[20] improvements in surgical and anesthetic techniques (including increasing use of neuraxial anesthesia),[21] and earlier patient mobilization. Indeed, the occurrence of ATE events in the BRIDGE trial did not appear to be influenced by a patient's underlying CHADS2 score (mean CHADS2 score of 2.6). There is a growing body of evidence that suggests perioperative heparin bridging has the opposite effect to that assumed by its use: there are trends toward an increase in postoperative ATE events in patients who receive bridging therapy.[8]
In the BRIDGE trial, there was a trend toward an increase in myocardial infarction in the bridging arm. This can be explained by a number of factors, but the most obvious includes an increase in bleeding events as may be expected by the use of therapeutic‐dose heparin bridging over a no‐bridging approach, which then predisposes a patient to downstream ATE events after withholding of anticoagulant therapy. The median time to a major bleed in BRIDGE was 7 days, whereas the mean time to an ATE event was 19 days, suggesting that bleeding is front‐loaded and that withholding of anticoagulant therapy after a bleed event may potentially place a patient at risk for later ATE events. This is consistent with an earlier single‐arm prospective cohort study of 224 high ATE risk patients on warfarin who were treated with perioperative LMWH bridging therapy. Among patients who had a thromboembolic event in the 90 postoperative days, 75% (6 out of 8) had their warfarin therapy withdrawn or deferred because of bleeding.[22] Last, if prophylactic doses of heparin were used as bridging therapy, there is no evidence that this would be protective of ATE events, which is the premise of using heparin bridging. Both of these concepts will be assessed when results of the PERIOP‐2 trial are made available.
An emerging body of evidence suggests an unfavorable risk versus benefit balance of heparin bridging, regardless of the underlying thrombotic risk. Overall, if bridging therapy is effective in protecting against ATE (which has yet to be demonstrated), recent studies show that its number needed to treat (NNT) would be very large and far larger than its number needed to harm (NNH). If more patients undergoing high bleeding‐risk procedures were included in the BRIDGE trial, these effects of unfavorable NNT to NNH would be magnified. While awaiting more definite answers from future trials, we believe clinicians should be critical of heparin bridging. We also suggest that they reserve it for patients who are at a significantly high risk of ATE complications until uncertainties around its use are clarified.
CONCLUSION
The BRIDGE trial provided high‐quality evidence that routine perioperative heparin bridging of patients on chronic warfarin for AF needing an elective procedure or surgery is both unnecessary and harmful. The trial is practice changing for patients with AF, and its results will likely be implemented in future international guidelines on the topic, including those of the ACCP. The hospitalist should be aware that the current large body of evidence points to more harm than benefit associated with heparin bridging in preventing ATE for any patient group, including those at high risk of ATE. Ongoing and future trials may clarify the role of heparin bridgingif anyin patients on chronic warfarin at high risk of ATE, including those with mechanical heart valves.
Disclosures: Alex C. Spyropoulos, MD, has served as a consultant for Bayer, Boehringer Ingelheim, Daiichi Sankyo, and Janssen. He also has served on advisory committees for Bristol‐Myers Squibb and Pfizer.
- Centers for Disease Control and Prevention. Atrial fibrillation fact sheet. Available at: http://www.cdc.gov/dhdsp/data_statistics/fact_sheets/fs_atrial_fibrillation.htm. Updated August 13, 2015. Accessed November 22, 2015.
- , , , , , . Estimates of current and future incidence and prevalence of atrial fibrillation in the U.S. adult population. Am J Cardiol. 2013;112(8):1142–1147.
- , , , . National trends in ambulatory oral anticoagulant use. Am J Med. 2015;128(12):1300–1305.e2.
- , , , et al. Perioperative management of antithrombotic therapy: Antithrombotic Therapy and Prevention of Thrombosis, 9th ed: American College of Chest Physicians evidence‐based clinical practice guidelines. Chest. 2012;141(2 suppl):e326S–e350S.
- , , , et al. Pharmacology and management of the vitamin K antagonists: American College of Chest Physicians evidence‐based clinical practice guidelines (8th edition). Chest. 2008;133(6 suppl):160S–198S.
- , , , et al. Perioperative Bridging Anticoagulation in Patients with Atrial Fibrillation. N Engl J Med. 2015;373(9):823–833.
- , , , et al. Use and outcomes associated with bridging during anticoagulation interruptions in patients with atrial fibrillation: findings from the Outcomes Registry for Better Informed Treatment of Atrial Fibrillation (ORBIT‐AF). Circulation. 2015;131(5):488–494.
- , , , et al. Perioperative bridging anticoagulation during dabigatran or warfarin interruption among patients who had an elective surgery or procedure. Substudy of the RE‐LY trial. Thromb Haemost. 2015;113(3):625–632.
- PERIOP 2—A Safety and Effectiveness Study of LMWH Bridging Therapy Versus Placebo Bridging Therapy for Patients on Long Term Warfarin and Require Temporary Interruption of Their Warfarin. ClinicalTrials.gov. Available at: https://clinicaltrials.gov/ct2/show/NCT00432796. Accessed December 9, 2015.
- , , , et al. Pacemaker or defibrillator surgery without interruption of anticoagulation. N Engl J Med. 2013;368(22):2084–2093.
- , , , et al. Periprocedural stroke and bleeding complications in patients undergoing catheter ablation of atrial fibrillation with different anticoagulation management: results from the Role of Coumadin in Preventing Thromboembolism in Atrial Fibrillation (AF) Patients Undergoing Catheter Ablation (COMPARE) randomized trial. Circulation. 2014;129(25):2638–2644.
- , , , . Risk factors for bleeding after oral surgery in patients who continued using oral anticoagulant therapy. J Am Dent Assoc. 2015;146(6):375–381.
- , , , et al. 2014 ACC/AHA guideline on perioperative cardiovascular evaluation and management of patients undergoing noncardiac surgery: executive summary: a report of the American College of Cardiology/American Heart Association Task Force on Practice Guidelines. Circulation. 2014;130(24):2215–2245.
- , , , , . Risk of stroke after surgery in patients with and without chronic atrial fibrillation. J Thromb Haemost. 2010;8(5):884–890.
- . Peri‐procedural management of patients taking oral anticoagulants. BMJ. 2015;351:h2391.
- , , , , , . Periprocedural heparin bridging in patients receiving vitamin K antagonists: systematic review and meta‐analysis of bleeding and thromboembolic rates. Circulation. 2012;126(13):1630–1639.
- , , , et al. Efficacy and safety of early parenteral anticoagulation as a bridge to warfarin after mechanical valve replacement. Thromb Haemost. 2014;112(6):1120–1128.
- , , , et al. Bleeding, recurrent venous thromboembolism, and mortality risks during warfarin interruption for invasive procedures. JAMA Intern Med. 2015;175(7):1163–1168.
- , . Perioperative management of patients receiving oral anticoagulants: a systematic review. Arch Intern Med. 2003;163(8):901–908.
- , , , et al. Predictors of intraoperative hypotension and bradycardia. Am J Med. 2015;128(5):532–538.
- . Perioperative stroke. N Engl J Med. 2007;356(7):706–713.
- , , , et al. Single‐arm study of bridging therapy with low‐molecular‐weight heparin for patients at risk of arterial embolism who require temporary interruption of warfarin. Circulation. 2004;110(12):1658–1663.
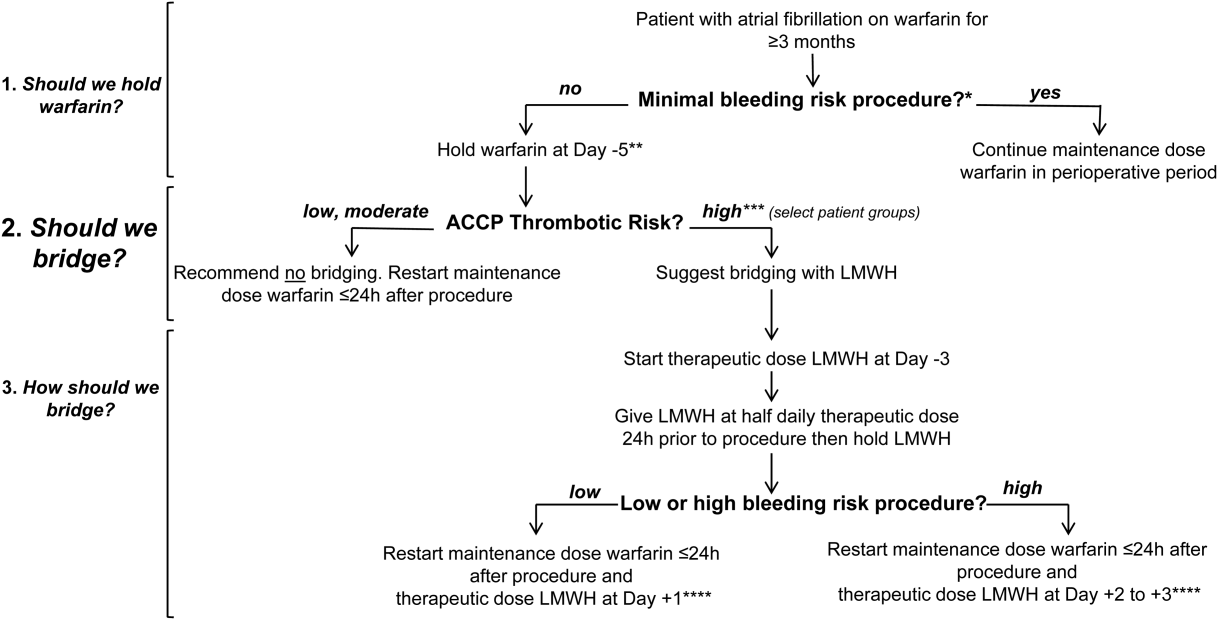
Goodbye measures of data quantity, hello data quality measures of MACRA
Practicing clinical medicine is increasingly challenging. Besides the onslaught of new clinical information, we have credentialing, accreditation, certification, team-based care, and patient satisfaction that contribute to the complexity of current medical practice. At the heart of many of these challenges is the issue of accountability. Never has our work product as physicians been under such intense scrutiny as it is today.

To demonstrate proof of the care we have provided, we have enlisted a host of administrators, assistants, abstractors, and other helpers to decipher our work and demonstrate its value to professional organizations, boards, hospitals, insurers, and the government. They comb through our charts, decipher our handwriting and dictations, guesstimate our intentions, and sometimes devalue our care because we have not adequately documented what we have done. To solve this accountability problem, our government and the payer community have promoted the electronic health record (EHR) as the “single source of truth” for the care we provide.
This effort received a huge boost in 2009 with the Health Information Technology for Economic and Clinical Health (HITECH) Act. HITECH authorized incentive payments through Medicare and Medicaid to health care providers that could demonstrate Meaningful Use (MU) of a certified EHR. This resulted in a boom in EHR purchases and installations.
By 2012, 71.8% of office-based physicians reported using some type of EHR system, up from 34.8% in 2007.1 In many respects this action was designed as a stimulus for the slow economy, but Congress also wanted some type of accountability that the money spent to subsidize EHR purchases was going to be well spent, and would hopefully have an impact on some of the serious health issues we face.
The initial stage of this MU program seemed to work out reasonably well. So, if a little is good, more must be better, right? Unfortunately, no. But, where did MU go wrong, and how is it being fixed? Contrary to popular belief, MU is not going away, it is being transformed. To help you navigate the tethered landscape of MU past and, more importantly, bring you up to speed on MU future (the Medicare Access and CHIP Reauthorization Act of 2015 [MACRA]) and your payment incentives in this data-centric world, we address MU transformation in this article.
Where Meaningful Use stage 2 went wrong
MU stage 2 turned out to significantly increase the documentation burden on health care professionals. In addition, one of the tragic unintended consequences was that all available EHR development resources by vendors went toward meeting MU data capture requirements rather than to improving the usability and efficiency of the EHRs. Neither result has been well received by health care professionals.
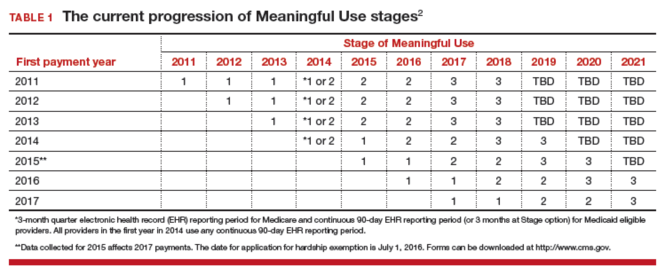
Stage 3 of MU is now in place. It is an attempt to simplify the requirements and focus on quality, safety, interoperability, and patient engagement. See “Meaningful Use stage 3 specifications”. The current progression of MU stages is depicted in TABLE 1.2
Meaningful Use stage 3 specifications
Objective 1: Protect patient health information. Protect electronic health information created or maintained by the Certified Electronic Health Record Technology (CEHRT) through the implementation of appropriate technical, administrative, and physical safeguards.
Objective 2: Electronic prescribing. Eligible providers (EPs) must generate and transmit permissible prescriptions electronically, and eligible hospitals must generate and transmit permissible discharge prescriptions electronically.
Objective 3: Clinical decision support. Implement clinical decision support interventions focused on improving performance on high-priority health conditions.
Objective 4: Computerized provider order entry. Use computerized provider order entry for medication, laboratory, and diagnostic imaging orders directly entered by any licensed health care professional, credentialed medical assistant, or a medical staff member credentialed and performing the equivalent duties of a credentialed medical assistant, who can enter orders into the medical record per state, local, and professional guidelines.
Objective 5: Patient electronic access to health information. The EP provides patients (or patient-authorized representatives) with timely electronic access to their health information and patient-specific education.
Objective 6: Coordination of care through patient engagement. Use the CEHRT to engage with patients or their authorized representatives about the patient's care.
Objective 7: Health information exchange. The EP provides a summary of care record when transitioning or referring their patient to another setting of care, receives or retrieves a summary of care record upon the receipt of a transition or referral or upon the first patient encounter with a new patient, and incorporates summary of care information from other providers into their EHR using the functions of CEHRT.
Objective 8: Public health and clinical data registry reporting. The EP is in active engagement with a public health agency or clinical data registry to submit electronic public health data in a meaningful way using certified EHR technology, except where prohibited, and in accordance with applicable law and practice.
Reference
1. Medicare and Medicaid Programs; Electronic Health Record Incentive Program-Stage 3. Federal Register website. https://www.federalregister.gov/articles/2015/03/30/2015-06685/medicare-and-medicaid-programs-electronic-health-record-incentive-program-stage-3#t-4. Accessed March 19, 2016.
Our new paradigm
Now that EHR implementation is fairly widespread, attention is focused on streamlining the reporting and documentation required for accountability, both from the data entry standpoint and the data analysis standpoint. Discrete data elements, entered by clinicians at the point of care, and downloaded directly from the EHR increasingly will be the way our patient care is assessed. Understanding this new paradigm is critical for both practice and professional viability.
Challenges in this new era
To understand the challenges ahead, we must first take a critical look at how physicians think about documentation, and what changes these models of documentation will have to undergo. Physicians are taught to think in complex models that we document as narratives or stories. While these models are composed of individual “elements” (patient age, due date, hemoglobin value, systolic blood pressure), the real information is in how these elements are related. Understanding a patient, a disease process, or a clinical workflow involves elements that must have context and relationships to be meaningful. Isolated hemoglobin or systolic blood pressure values tell us little, and may in fact obscure the forest for the trees. Physicians want to tell, and understand, the story.
However, an EHR is much more than a collection of narrative text documents. Entering data as discrete elements will allow each data element to be standardized, delegated, automated, analyzed, and monetized. In fact, these processes cannot be accomplished without the data being in this discrete form. While a common complaint about EHRs is that the “story” is hard to decipher, discrete elements are here to stay. Algorithms that can “read” a story and automatically populate these elements (known as natural language processing, or NLP) may someday allow us to go back to our dictations, but that day is frustratingly still far off.
Hello eCQMs
Up to now, physicians have relied on an army of abstractors, coders, billers, quality and safety helpers, and the like to read our notes and supply discrete data to the many clients who want to see accountability for our work. This process of course adds considerable cost to the health care system, and the data collected may not always supply accurate information. The gap between administrative data (gathered from the International Classificationof Diseases Ninth and Tenth revisions and Current Procedural Terminology [copyright American Medical Association] codes) and clinical reality is well documented.3–5
In an attempt to simplify this process, and to create a stronger connection to actual clinical data, the Centers for Medicare and Medicaid Services (CMS)6 is moving toward direct extraction of discrete data that have been entered by health care providers themselves.7 Using clinical data to report on quality metrics allows for improvement in risk adjustment as well as accuracy. Specific measures of this type have been designated eCQMs.
An eCQM is a format for a quality measure, utilizing data entered directly by health care professionals, and extracted directly from the EHR, without the need for additional personnel to review and abstract the chart. eCQMs rapidly are being phased into use for Medicare reimbursement; it is assumed that Medicaid and private payers soon will follow. Instead of payment solely for the quantity of documentation and intervention, we will soon also be paid for the quality of the care we provide (and document). TABLE 2 includes the proposed eCQM reporting timelines for Medicare and Medicaid.2
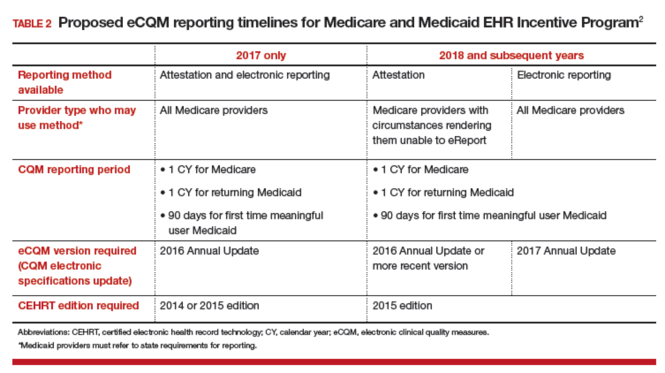
MACRA
eCQMs are a part of a larger federal effort to reform physician payments—MACRA. Over the past few years, there have been numerous federal programs to measure the quality and appropriateness of care. The Evaluation and Management (E&M) coding guidelines have been supplemented with factors for quality (Physician Quality Reporting System [PQRS]), resource use (the Value-based Payment Modifier), and EHR engagement (MU stages 1, 2, and 3). All of these programs are now being rolled up into a single program under MACRA.
MACRA has 2 distinct parts, known as the Merit-based Incentive Payment System (MIPS) and the Alternative Payment Model. MIPS keeps the underlying fee-for-service model but adds in a factor based on the following metrics:
- clinical quality (which will be based on eCQMs)
- resource use (a gauge of how many economic resources you use in comparison to your peers)
- clinical practice improvement (a measure of how well you are engaged in quality improvement, which includes capturing patient satisfaction data, and being part of a qualified clinical data registry is one way to demonstrate that engagement)
- meaningful use of EHR.
It is important to understand this last bulleted metric: MU is not going away (although that is a popular belief), it is just being transformed into MACRA, with the MU criteria simplified to emphasize a patient-centered medical record. Getting your patients involved through a portal and being able yourself to download, transmit, and accept patients’ data in electronic form are significant parts of MU. Vendors will continue to bear some of this burden, as their requirement to produce systems capable of these functions also increases their accountability.
Measurement and payment incentive
In the MIPS part of MACRA, the 4 factors of clinical quality, resource use, clinical practice improvement, and meaningful use of EHR will be combined in a formula to determine where each practitioner lies in comparison to his or her peers.
Now the bad news: Instead of receiving a bonus by meeting a benchmark, the bonus funds will be subtracted from those providers on the low end of the curve, and given to those at the top end. No matter how well the group does as a whole, no additional money will be available, and the bottom tier will be paying the bonuses of the top tier. The total pool of money to be distributed by CMS in the MIPS program will only grow by 0.5% per year for the foreseeable future. But MACRA does provide an alternative model for reimbursement, the Alternative Payment Model.
Alternative Payment Model
The Alternative Payment Model is basically an Accountable Care Organization—a group of providers agree to meet a certain standard of care (eCQMs again) and, in turn, receive a lump sum of money to deliver that care to a population. If there is some money left over at the end of a year, the group runs a profit. If not, they run a loss. One advantage of this model is that, under MACRA, the pool of money paid to “qualified” groups will increase at 5% per year for the next 5 years. This is certainly a better deal than the 0.5% increase of MIPS.
For specialists in general obstetrics and gynecology it may very well be that the volume of Medicare patients we see will be insufficient to participate meaningfully in either MIPS or the Alternative Payment Model. Regulations are still being crafted to exempt low-volume providers from the burdens associated with MACRA, and the American Congress of Obstetricians and Gynecologists (ACOG) is working diligently to advocate for systems that will allow members to see Medicare patients without requiring the substantial investments these programs likely will require.
The EHR: The single source of truth
The push to make the EHR the single source of truth will streamline many peripheral activities on the health care delivery side as well as the payer side. These requirements will present a new challenge to health care professionals, however. No one went to medical school to become a data entry clerk. Still, EHRs show the promise to transform many aspects of health care delivery. They speed communication,8 reduce errors,9 and may well improve the safety and quality of care. There also is some evidence developing that they may slow the rising cost of health care.10
But they are also quickly becoming a major source of physician dissatisfaction,11 with an apparent dose-response relationship.12 Authors of a recent RAND study note, “the current state of EHR technology significantly worsened professional satisfaction in multiple ways, due to poor usability, time-consuming data entry, interference with face-to-face patient care, inefficient and less fulfilling work content, insufficient health information exchange, and degradation of clinical documentation.”13
This pushback against EHRs has beenheard all the way to Congress. The Senate recently has introduced the ‘‘Improving Health Information Technology Act.’’14 This bill includes proposals for rating EHR systems, decreasing “unnecessary” documentation, prohibiting “information blocking,” and increasing interoperability. It remains to be seen what specific actions will be included, and how this bill will fare in an election year.
So the practice of medicine continues to evolve, and our accountability obligations show no sign of slowing down. The vision of the EHR as a single source of truth—the tool to streamline both the data entry and the data analysis—is being pushed hard by the folks who control the purse strings. This certainly will change the way we conduct our work as physicians and health care professionals. There are innovative efforts being developed to ease this burden. Cloud-based object-oriented data models, independent “apps,” open Application Programming Interfaces, or other technologies may supplant the transactional billing platforms15 we now rely upon.
ACOG is engaged at many levels with these issues, and we will continue to keep the interests of our members and the health of our patients at the center of our efforts. But it seems that, at least for now, a move to capturing discrete data elements and relying on eCQMs for quality measurements will shape the foreseeable payment incentive future.
Share your thoughts! Send your Letter to the Editor to rbarbieri@frontlinemedcom.com. Please include your name and the city and state in which you practice.
- Hsiao CJ, Hing E, Ashman J. Trends in electronic health record system use among office-based physicians: United States, 2007–2012. Natl Health Stat Report. 2014;(75):1–18.
- Medicare and Medicaid Programs; Electronic Health Record Incentive Program-Stage 3. Federal Register website. https://www.federalregister.gov/articles/2015/03/30/2015-06685/medicare-and-medicaid-programs-electronic-health-record-incentive-program-stage-3#t-4. Published March 10, 2015. Accessed March 19, 2016.
- Assareh H, Achat HM, Stubbs JM, Guevarra VM, Hill K.Incidence and variation of discrepancies in recording chronic conditions in Australian hospital administrative data. PLoS One. 2016;11(1):e0147087.
- Williams DJ, Shah SS, Myers A, et al. Identifying pediatric community-acquired pneumonia hospitalizations: Accuracy of administrative billing codes. JAMA Pediatr. 2013;167(9):851–858.
- Liede A, Hernandez RK, Roth M, Calkins G, Larrabee K, Nicacio L. Validation of International Classification of Diseases coding for bone metastases in electronic health records using technology-enabled abstraction. Clin Epidemiol. 2015;7:441–448.
- Revisions of Quality Reporting Requirements for Specific Providers, Including Changes Related to the Electronic Health Record Incentive Program. Federal Register website. https://federalregister.gov/a/2015-19049. Published August 17, 2015. Accessed March 19, 2016.
- Panjamapirom A. Hospitals: Electronic CQM Reporting Has Arrived. Are You Ready? http://www.ihealthbeat.org/perspectives/2015/hospitals-electronic-cqm-reporting-has -arrived-are-you-ready. Published August 24, 2015. Accessed March 17, 2016.
- Bernstein PS, Farinelli C, Merkatz IR. Using an electronic medical record to improve communication within a prenatal care network. Obstet Gynecol. 2005;105(3):607–612.
- George J, Bernstein PS. Using electronic medical records to reduce errors and risks in a prenatal network. Curr Opin Obstet Gynecol. 2009;21(6):527–531.
- Adler-Milstein J, Salzberg C, Franz C, Orav EJ, Newhouse JP, Bates DW. Effect of electronic health records on health care costs: longitudinal comparative evidence from community practices. Ann Intern Med. 2013;159(2):97–104.
- Pedulli L. Survey reveals widespread dissatisfaction with EHR systems. http://www.clinical-innovation.com/topics/ehr-emr/survey-reveals-widespread-dissatisfaction-ehr-systems. Published February 11, 2014. Accessed March 17, 2016.
- Babbott S, Manwell LB, Brown R, et al. Electronic medical records and physician stress in primary care: results from the MEMO Study. J Am Med Inform Assoc. 2014;21(e1):e100–e106.
- Friedberg MW, Chen PG, Van Busum KR, et al. Factors affecting physician professional satisfaction and their implications for patient care, health systems, and health policy. RAND Corporation website. http://www.rand.org/pubs/research_reports/RR439.html. Published 2013. Accessed March 17, 2016.
- Majority and Minority Staff of the Senate Committee on Health, Education, Labor, and Pensions. Summary of Improving Health Information Technology Act. http://www.help.senate.gov/imo/media/doc/Improving%20Health%20Information%20Technology%20Act%20--%20Summary.pdf. Accessed March 18, 2016.
- LetDoctorsbeDoctors.com. http://www.letdoctorsbedoctors.com/?sf21392355=1. Published 2016. Accessed March 18, 2016.
Steve Hasley, MD, and Barbara S. Levy, MD

Dr. Hasley is Chief Medical Informatics Officer, American Congress of Obstetricians and Gynecologists; Medical Director for Information Technology, Women’s Health, University of Pittsburgh Medical Center; Medical Director eRecord, Magee Women’s Hospital; Assistant Professor, Department of Obstetrics and Gynecology and Reproductive Science and Department of Medicine; and Adjunct Professor, Department of Biomedical Informatics at the University of Pittsburgh in Pennsylvania.

Dr. Levy is Vice President for Health Policy at the American Congress of Obstetricians and Gynecologistsin Washington, DC.
The authors report no financial relationships relevant to this article.
Steve Hasley, MD, and Barbara S. Levy, MD
Dr. Hasley is Chief Medical Informatics Officer, American Congress of Obstetricians and Gynecologists; Medical Director for Information Technology, Women’s Health, University of Pittsburgh Medical Center; Medical Director eRecord, Magee Women’s Hospital; Assistant Professor, Department of Obstetrics and Gynecology and Reproductive Science and Department of Medicine; and Adjunct Professor, Department of Biomedical Informatics at the University of Pittsburgh in Pennsylvania.
Dr. Levy is Vice President for Health Policy at the American Congress of Obstetricians and Gynecologistsin Washington, DC.
The authors report no financial relationships relevant to this article.
Practicing clinical medicine is increasingly challenging. Besides the onslaught of new clinical information, we have credentialing, accreditation, certification, team-based care, and patient satisfaction that contribute to the complexity of current medical practice. At the heart of many of these challenges is the issue of accountability. Never has our work product as physicians been under such intense scrutiny as it is today.
To demonstrate proof of the care we have provided, we have enlisted a host of administrators, assistants, abstractors, and other helpers to decipher our work and demonstrate its value to professional organizations, boards, hospitals, insurers, and the government. They comb through our charts, decipher our handwriting and dictations, guesstimate our intentions, and sometimes devalue our care because we have not adequately documented what we have done. To solve this accountability problem, our government and the payer community have promoted the electronic health record (EHR) as the “single source of truth” for the care we provide.
This effort received a huge boost in 2009 with the Health Information Technology for Economic and Clinical Health (HITECH) Act. HITECH authorized incentive payments through Medicare and Medicaid to health care providers that could demonstrate Meaningful Use (MU) of a certified EHR. This resulted in a boom in EHR purchases and installations.
By 2012, 71.8% of office-based physicians reported using some type of EHR system, up from 34.8% in 2007.1 In many respects this action was designed as a stimulus for the slow economy, but Congress also wanted some type of accountability that the money spent to subsidize EHR purchases was going to be well spent, and would hopefully have an impact on some of the serious health issues we face.
The initial stage of this MU program seemed to work out reasonably well. So, if a little is good, more must be better, right? Unfortunately, no. But, where did MU go wrong, and how is it being fixed? Contrary to popular belief, MU is not going away, it is being transformed. To help you navigate the tethered landscape of MU past and, more importantly, bring you up to speed on MU future (the Medicare Access and CHIP Reauthorization Act of 2015 [MACRA]) and your payment incentives in this data-centric world, we address MU transformation in this article.
Where Meaningful Use stage 2 went wrong
MU stage 2 turned out to significantly increase the documentation burden on health care professionals. In addition, one of the tragic unintended consequences was that all available EHR development resources by vendors went toward meeting MU data capture requirements rather than to improving the usability and efficiency of the EHRs. Neither result has been well received by health care professionals.
Stage 3 of MU is now in place. It is an attempt to simplify the requirements and focus on quality, safety, interoperability, and patient engagement. See “Meaningful Use stage 3 specifications”. The current progression of MU stages is depicted in TABLE 1.2
Meaningful Use stage 3 specifications
Objective 1: Protect patient health information. Protect electronic health information created or maintained by the Certified Electronic Health Record Technology (CEHRT) through the implementation of appropriate technical, administrative, and physical safeguards.
Objective 2: Electronic prescribing. Eligible providers (EPs) must generate and transmit permissible prescriptions electronically, and eligible hospitals must generate and transmit permissible discharge prescriptions electronically.
Objective 3: Clinical decision support. Implement clinical decision support interventions focused on improving performance on high-priority health conditions.
Objective 4: Computerized provider order entry. Use computerized provider order entry for medication, laboratory, and diagnostic imaging orders directly entered by any licensed health care professional, credentialed medical assistant, or a medical staff member credentialed and performing the equivalent duties of a credentialed medical assistant, who can enter orders into the medical record per state, local, and professional guidelines.
Objective 5: Patient electronic access to health information. The EP provides patients (or patient-authorized representatives) with timely electronic access to their health information and patient-specific education.
Objective 6: Coordination of care through patient engagement. Use the CEHRT to engage with patients or their authorized representatives about the patient's care.
Objective 7: Health information exchange. The EP provides a summary of care record when transitioning or referring their patient to another setting of care, receives or retrieves a summary of care record upon the receipt of a transition or referral or upon the first patient encounter with a new patient, and incorporates summary of care information from other providers into their EHR using the functions of CEHRT.
Objective 8: Public health and clinical data registry reporting. The EP is in active engagement with a public health agency or clinical data registry to submit electronic public health data in a meaningful way using certified EHR technology, except where prohibited, and in accordance with applicable law and practice.
Reference
1. Medicare and Medicaid Programs; Electronic Health Record Incentive Program-Stage 3. Federal Register website. https://www.federalregister.gov/articles/2015/03/30/2015-06685/medicare-and-medicaid-programs-electronic-health-record-incentive-program-stage-3#t-4. Accessed March 19, 2016.
Our new paradigm
Now that EHR implementation is fairly widespread, attention is focused on streamlining the reporting and documentation required for accountability, both from the data entry standpoint and the data analysis standpoint. Discrete data elements, entered by clinicians at the point of care, and downloaded directly from the EHR increasingly will be the way our patient care is assessed. Understanding this new paradigm is critical for both practice and professional viability.
Challenges in this new era
To understand the challenges ahead, we must first take a critical look at how physicians think about documentation, and what changes these models of documentation will have to undergo. Physicians are taught to think in complex models that we document as narratives or stories. While these models are composed of individual “elements” (patient age, due date, hemoglobin value, systolic blood pressure), the real information is in how these elements are related. Understanding a patient, a disease process, or a clinical workflow involves elements that must have context and relationships to be meaningful. Isolated hemoglobin or systolic blood pressure values tell us little, and may in fact obscure the forest for the trees. Physicians want to tell, and understand, the story.
However, an EHR is much more than a collection of narrative text documents. Entering data as discrete elements will allow each data element to be standardized, delegated, automated, analyzed, and monetized. In fact, these processes cannot be accomplished without the data being in this discrete form. While a common complaint about EHRs is that the “story” is hard to decipher, discrete elements are here to stay. Algorithms that can “read” a story and automatically populate these elements (known as natural language processing, or NLP) may someday allow us to go back to our dictations, but that day is frustratingly still far off.
Hello eCQMs
Up to now, physicians have relied on an army of abstractors, coders, billers, quality and safety helpers, and the like to read our notes and supply discrete data to the many clients who want to see accountability for our work. This process of course adds considerable cost to the health care system, and the data collected may not always supply accurate information. The gap between administrative data (gathered from the International Classificationof Diseases Ninth and Tenth revisions and Current Procedural Terminology [copyright American Medical Association] codes) and clinical reality is well documented.3–5
In an attempt to simplify this process, and to create a stronger connection to actual clinical data, the Centers for Medicare and Medicaid Services (CMS)6 is moving toward direct extraction of discrete data that have been entered by health care providers themselves.7 Using clinical data to report on quality metrics allows for improvement in risk adjustment as well as accuracy. Specific measures of this type have been designated eCQMs.
An eCQM is a format for a quality measure, utilizing data entered directly by health care professionals, and extracted directly from the EHR, without the need for additional personnel to review and abstract the chart. eCQMs rapidly are being phased into use for Medicare reimbursement; it is assumed that Medicaid and private payers soon will follow. Instead of payment solely for the quantity of documentation and intervention, we will soon also be paid for the quality of the care we provide (and document). TABLE 2 includes the proposed eCQM reporting timelines for Medicare and Medicaid.2
MACRA
eCQMs are a part of a larger federal effort to reform physician payments—MACRA. Over the past few years, there have been numerous federal programs to measure the quality and appropriateness of care. The Evaluation and Management (E&M) coding guidelines have been supplemented with factors for quality (Physician Quality Reporting System [PQRS]), resource use (the Value-based Payment Modifier), and EHR engagement (MU stages 1, 2, and 3). All of these programs are now being rolled up into a single program under MACRA.
MACRA has 2 distinct parts, known as the Merit-based Incentive Payment System (MIPS) and the Alternative Payment Model. MIPS keeps the underlying fee-for-service model but adds in a factor based on the following metrics:
- clinical quality (which will be based on eCQMs)
- resource use (a gauge of how many economic resources you use in comparison to your peers)
- clinical practice improvement (a measure of how well you are engaged in quality improvement, which includes capturing patient satisfaction data, and being part of a qualified clinical data registry is one way to demonstrate that engagement)
- meaningful use of EHR.
It is important to understand this last bulleted metric: MU is not going away (although that is a popular belief), it is just being transformed into MACRA, with the MU criteria simplified to emphasize a patient-centered medical record. Getting your patients involved through a portal and being able yourself to download, transmit, and accept patients’ data in electronic form are significant parts of MU. Vendors will continue to bear some of this burden, as their requirement to produce systems capable of these functions also increases their accountability.
Measurement and payment incentive
In the MIPS part of MACRA, the 4 factors of clinical quality, resource use, clinical practice improvement, and meaningful use of EHR will be combined in a formula to determine where each practitioner lies in comparison to his or her peers.
Now the bad news: Instead of receiving a bonus by meeting a benchmark, the bonus funds will be subtracted from those providers on the low end of the curve, and given to those at the top end. No matter how well the group does as a whole, no additional money will be available, and the bottom tier will be paying the bonuses of the top tier. The total pool of money to be distributed by CMS in the MIPS program will only grow by 0.5% per year for the foreseeable future. But MACRA does provide an alternative model for reimbursement, the Alternative Payment Model.
Alternative Payment Model
The Alternative Payment Model is basically an Accountable Care Organization—a group of providers agree to meet a certain standard of care (eCQMs again) and, in turn, receive a lump sum of money to deliver that care to a population. If there is some money left over at the end of a year, the group runs a profit. If not, they run a loss. One advantage of this model is that, under MACRA, the pool of money paid to “qualified” groups will increase at 5% per year for the next 5 years. This is certainly a better deal than the 0.5% increase of MIPS.
For specialists in general obstetrics and gynecology it may very well be that the volume of Medicare patients we see will be insufficient to participate meaningfully in either MIPS or the Alternative Payment Model. Regulations are still being crafted to exempt low-volume providers from the burdens associated with MACRA, and the American Congress of Obstetricians and Gynecologists (ACOG) is working diligently to advocate for systems that will allow members to see Medicare patients without requiring the substantial investments these programs likely will require.
The EHR: The single source of truth
The push to make the EHR the single source of truth will streamline many peripheral activities on the health care delivery side as well as the payer side. These requirements will present a new challenge to health care professionals, however. No one went to medical school to become a data entry clerk. Still, EHRs show the promise to transform many aspects of health care delivery. They speed communication,8 reduce errors,9 and may well improve the safety and quality of care. There also is some evidence developing that they may slow the rising cost of health care.10
But they are also quickly becoming a major source of physician dissatisfaction,11 with an apparent dose-response relationship.12 Authors of a recent RAND study note, “the current state of EHR technology significantly worsened professional satisfaction in multiple ways, due to poor usability, time-consuming data entry, interference with face-to-face patient care, inefficient and less fulfilling work content, insufficient health information exchange, and degradation of clinical documentation.”13
This pushback against EHRs has beenheard all the way to Congress. The Senate recently has introduced the ‘‘Improving Health Information Technology Act.’’14 This bill includes proposals for rating EHR systems, decreasing “unnecessary” documentation, prohibiting “information blocking,” and increasing interoperability. It remains to be seen what specific actions will be included, and how this bill will fare in an election year.
So the practice of medicine continues to evolve, and our accountability obligations show no sign of slowing down. The vision of the EHR as a single source of truth—the tool to streamline both the data entry and the data analysis—is being pushed hard by the folks who control the purse strings. This certainly will change the way we conduct our work as physicians and health care professionals. There are innovative efforts being developed to ease this burden. Cloud-based object-oriented data models, independent “apps,” open Application Programming Interfaces, or other technologies may supplant the transactional billing platforms15 we now rely upon.
ACOG is engaged at many levels with these issues, and we will continue to keep the interests of our members and the health of our patients at the center of our efforts. But it seems that, at least for now, a move to capturing discrete data elements and relying on eCQMs for quality measurements will shape the foreseeable payment incentive future.
Share your thoughts! Send your Letter to the Editor to rbarbieri@frontlinemedcom.com. Please include your name and the city and state in which you practice.
- Hsiao CJ, Hing E, Ashman J. Trends in electronic health record system use among office-based physicians: United States, 2007–2012. Natl Health Stat Report. 2014;(75):1–18.
- Medicare and Medicaid Programs; Electronic Health Record Incentive Program-Stage 3. Federal Register website. https://www.federalregister.gov/articles/2015/03/30/2015-06685/medicare-and-medicaid-programs-electronic-health-record-incentive-program-stage-3#t-4. Published March 10, 2015. Accessed March 19, 2016.
- Assareh H, Achat HM, Stubbs JM, Guevarra VM, Hill K.Incidence and variation of discrepancies in recording chronic conditions in Australian hospital administrative data. PLoS One. 2016;11(1):e0147087.
- Williams DJ, Shah SS, Myers A, et al. Identifying pediatric community-acquired pneumonia hospitalizations: Accuracy of administrative billing codes. JAMA Pediatr. 2013;167(9):851–858.
- Liede A, Hernandez RK, Roth M, Calkins G, Larrabee K, Nicacio L. Validation of International Classification of Diseases coding for bone metastases in electronic health records using technology-enabled abstraction. Clin Epidemiol. 2015;7:441–448.
- Revisions of Quality Reporting Requirements for Specific Providers, Including Changes Related to the Electronic Health Record Incentive Program. Federal Register website. https://federalregister.gov/a/2015-19049. Published August 17, 2015. Accessed March 19, 2016.
- Panjamapirom A. Hospitals: Electronic CQM Reporting Has Arrived. Are You Ready? http://www.ihealthbeat.org/perspectives/2015/hospitals-electronic-cqm-reporting-has -arrived-are-you-ready. Published August 24, 2015. Accessed March 17, 2016.
- Bernstein PS, Farinelli C, Merkatz IR. Using an electronic medical record to improve communication within a prenatal care network. Obstet Gynecol. 2005;105(3):607–612.
- George J, Bernstein PS. Using electronic medical records to reduce errors and risks in a prenatal network. Curr Opin Obstet Gynecol. 2009;21(6):527–531.
- Adler-Milstein J, Salzberg C, Franz C, Orav EJ, Newhouse JP, Bates DW. Effect of electronic health records on health care costs: longitudinal comparative evidence from community practices. Ann Intern Med. 2013;159(2):97–104.
- Pedulli L. Survey reveals widespread dissatisfaction with EHR systems. http://www.clinical-innovation.com/topics/ehr-emr/survey-reveals-widespread-dissatisfaction-ehr-systems. Published February 11, 2014. Accessed March 17, 2016.
- Babbott S, Manwell LB, Brown R, et al. Electronic medical records and physician stress in primary care: results from the MEMO Study. J Am Med Inform Assoc. 2014;21(e1):e100–e106.
- Friedberg MW, Chen PG, Van Busum KR, et al. Factors affecting physician professional satisfaction and their implications for patient care, health systems, and health policy. RAND Corporation website. http://www.rand.org/pubs/research_reports/RR439.html. Published 2013. Accessed March 17, 2016.
- Majority and Minority Staff of the Senate Committee on Health, Education, Labor, and Pensions. Summary of Improving Health Information Technology Act. http://www.help.senate.gov/imo/media/doc/Improving%20Health%20Information%20Technology%20Act%20--%20Summary.pdf. Accessed March 18, 2016.
- LetDoctorsbeDoctors.com. http://www.letdoctorsbedoctors.com/?sf21392355=1. Published 2016. Accessed March 18, 2016.

Treating and preventing acute exacerbations of COPD
In contrast to stable chronic obstructive pulmonary disease (COPD),1 acute exacerbations of COPD pose special management challenges and can significantly increase the risk of morbidity and death and the cost of care.
This review addresses the definition and diagnosis of COPD exacerbations, disease burden and costs, etiology and pathogenesis, and management and prevention strategies.
DEFINITIONS ARE PROBLEMATIC
The Global Initiative for Chronic Obstructive Lung Disease (GOLD) defines a COPD exacerbation as “an acute event characterized by a worsening of the patient’s respiratory symptoms that is beyond normal day-to-day variations and leads to a change in medication.”2 It further categorizes acute exacerbations by severity:
- Mild—treated with increased frequency of doses of existing medications
- Moderate—treated with corticosteroids or antibiotics, or both
- Severe—requires hospital utilization (either emergency room treatment or admission).
Although descriptive and useful for retrospective analyses, this current definition poses ambiguities for clinicians. Day-to-day variation in symptoms is not routinely assessed, so deviations from baseline may be difficult to detect. Although clinical tools are available for assessing symptoms in stable and exacerbated states (eg, the COPD assessment test3 and the Exacerbations of Chronic Pulmonary Disease Tool [EXACT]4), they have not been widely adopted in daily practice. Also, according to the current definition, the severity of an exacerbation can be classified only after the course of action is determined, so the severity is not helpful for forming a management strategy at bedside. In addition, physicians may have different thresholds for prescribing antibiotics and corticosteroids.
An earlier definition categorized a COPD exacerbation by the presence of its three cardinal symptoms (ie, increased shortness of breath, sputum volume, and purulence):
- Type I—all three symptoms present
- Type II—two symptoms present
- Type III—one symptom present, accompanied by at least one of the following: upper respiratory tract infection within the past 5 days, unexplained fever, increased wheezing or cough, or 20% increased respiratory rate or heart rate from baseline.
This older definition was successfully used in a prospective clinical trial to identify patients who benefited most from antibiotics for COPD exacerbations.5
Despite these caveats regarding a definition, most clinicians agree on the clinical presentation of a patient with COPD exacerbation: ie, having some combination of shortness of breath, increased sputum volume, and purulence. By the same token, patients with COPD who present with symptoms not typical of an exacerbation should be evaluated for another diagnosis. For instance, Tillie-Leblond et al6 reported that 49 (25%) of 197 patients hospitalized with an “unexplained” exacerbation of COPD were eventually diagnosed with pulmonary embolism.
EXACERBATIONS ARE COSTLY
The care of patients with COPD places a great burden on the healthcare system. Using multiple national databases, Ford et al7 estimated that medical costs in the United States in 2010 attributable to COPD and its complications were $32.1 billion.
The largest component of direct healthcare costs of COPD is exacerbations and subsequent hospitalizations.8 Data from a predominantly Medicare population indicate that the annualized mean COPD-related cost for a patient with no exacerbations was $1,425, compared with $12,765 for a patient with severe exacerbations.9 The investigators estimated that reducing exacerbations from two or more to none could save $5,125 per patient per year.
EXACERBATIONS AFFECT HEALTH BEYOND THE EVENT
COPD exacerbations are associated with a faster decline in lung function,10 reduced quality of life,11 and lost workdays.7 A single exacerbation may cause a decline in lung function and health status that may not return to baseline for several months, particularly if another exacerbation occurs within 6 months.12,13 COPD exacerbations have also been linked to poor clinical outcomes, including death.
In a prospective study in 304 men with COPD followed for 5 years, those who had three or more COPD exacerbations annually were four times as likely to die than patients who did not have an exacerbation.14 Nevertheless, the relationship with mortality may not be causal: Brusselle pointed out in an editorial15 that established mortality predictors for COPD do not include exacerbations, and symptomatic patients with COPD without any history of exacerbations are at greater risk of death than those who are asymptomatic but at high risk for exacerbations.
INFECTION + INFLAMMATION = EXACERBATION
An acute COPD exacerbation can be viewed as an acute inflammatory event superimposed on chronic inflammation associated with COPD. Inflammation in the airways increases resistance to air flow with consequent air trapping. Increased resistance and elastic load due to air trapping place respiratory muscles at a mechanical disadvantage and increase the work of breathing.
Infection starts the process
Infections, particularly bacterial and viral, are thought to be the major instigators of COPD exacerbation, although environmental factors such as air pollution may also play a role.16
Airway inflammation is markedly reduced when bacterial infection is eradicated. But if bacterial colonization continues, inflammatory markers remain elevated despite clinical resolution of the exacerbation.17 Desai et al18 found that patients with COPD and chronic bronchitis with bacterial colonization had a larger symptom burden than patients without colonization, even without an exacerbation.
Allergic profile increases risk
Although most studies indicate that infection is the main cause of exacerbations, clinicians should consider other mechanisms of inflammation on an individual basis. COPD exacerbations may be phenotyped by measuring inflammatory markers, perhaps as a starting point for tailored therapies.
Bafadhel et al19 studied 145 patients with COPD over the course of a year and recorded various biomarkers at baseline and during exacerbations. Exacerbations had an inflammatory profile that was predominantly bacterial in 37%, viral in 10%, and eosinophilic in 17%, and had limited changes in the inflammatory profile in 14%. The remaining episodes were combinations of categories. In another study,20 multivariate analysis conducted in two cohorts with COPD found that patients who had an allergic phenotype had more respiratory symptoms and a higher likelihood of COPD exacerbations.
Frequent COPD exacerbations are increasingly recognized as being associated with an asthma-COPD overlap syndrome, consisting of symptoms of increased airflow variability and incompletely reversible airflow obstruction.21
Inflammation as a marker of frequent exacerbations
Evidence is accumulating that supports systemic inflammation as a marker of frequent exacerbations. The Copenhagen Heart Study tested for baseline plasma C-reactive protein, fibrinogen, and white blood cell count in 6,574 stable patients with COPD.22 After multivariable adjustment, they found a significantly higher likelihood of having a subsequent exacerbation in patients who had all three biomarkers elevated (odds ratio [OR] 3.7, 95% confidence interval [CI] 1.9–7.4), even in patients with milder COPD and those without previous exacerbations.
Past exacerbations predict risk
The Evaluation of COPD Longitudinally to Identify Predictive Surrogate Endpoints study23 found that a history of acute COPD exacerbation was the single best predictor of future exacerbations. This risk factor remained stable over 3 years and was present across the severity of COPD, ie, patients at lower GOLD stages who had a history of frequent exacerbations were likely to have exacerbations during follow-up.
EXACERBATION INCREASES CARDIOVASCULAR RISK
COPD exacerbations increase the risk of cardiovascular events, particularly myocardial infarction.24 During hospitalization for acute exacerbation of COPD, markers of myocardial injury and heart failure may be elevated and are a predictor of death.25
Patel et al26 measured arterial stiffness (aortic pulse wave velocity, a validated measure of cardiovascular risk) and cardiac biomarkers (troponin and N-terminal B-type natriuretic peptide) at baseline in 98 patients and longitudinally during and after a COPD exacerbation. In addition to increased levels of cardiac biomarkers, they found a significant rise in arterial stiffness during the exacerbation event without return to baseline levels over 35 days of follow-up. The arterial stiffness increase was related to airway inflammation as measured by sputum interleukin 6, particularly in patients with documented lower respiratory tract infection.
Retrospective analysis suggests a reduced all-cause mortality rate in COPD patients who are treated with beta-blockers.27
Recommendation. We recommend that patients already taking a selective beta-blocker continue to do so during a COPD exacerbation.
OUTPATIENT MANAGEMENT
Treatment with a combination of a corticosteroid, antibiotic, and bronchodilator addresses the underlying pathophysiologic processes of an acute exacerbation: inflammation, infection, and airway trapping.
Short course of a corticosteroid improves outcomes
A 10-day systemic course of a corticosteroid prescribed for COPD exacerbation before discharge from the emergency department was found to offer a small advantage over placebo for reducing treatment failure (unscheduled physician visits, return to emergency room for recurrent symptoms) and improving dyspnea scores and lung function.28 Even just a 3-day course improved measures of respiration (forced expiratory volume in the first second of expiration [FEV1] and arterial oxygenation) at days 3 and 10, and reduced treatment failures compared with placebo.29
Corticosteroid prescription should not be taken lightly, because adverse effects are common. In a systematic review, one adverse effect (hyperglycemia, weight gain, or insomnia) occurred for every five people treated.30
Identifying subgroups of patients most likely to benefit from corticosteroid treatment may be helpful. Corticosteroids may delay improvement in patients without eosinophilic inflammation and hasten recovery in those with more than 2% peripheral eosinophils.31 Siva et al32 found that limiting corticosteroids to patients with sputum eosinophilia reduced corticosteroid use and reduced severe exacerbations compared with standard care.32
Recommendation. For an acute exacerbation, we prescribe a short course of corticosteroids (eg, prednisone 40 mg daily for 5 to 7 days). Tapering dosing is probably unnecessary because adrenal insufficiency is uncommon before 2 weeks of corticosteroid exposure. Clinicians should weigh the merits of tapering (reduced corticosteroid exposure) against patient inconvenience and difficulty following complicated instructions.
Antibiotics help, but exact strategy uncertain
Although antibiotic therapy is one of the three pillars of COPD exacerbation management, the optimal antimicrobial agent, duration of therapy, and which patients will benefit remain areas of controversy and research. Thus far, large trials have been unable to definitely show the superiority of one antibiotic over another.33,34
A 1987 randomized controlled trial5 of antibiotic therapy in acute exacerbation of COPD found the greatest benefit to patients who had all three cardinal symptoms (ie, increased shortness of breath, sputum volume, and purulence), with less marked but still significant improvement in patients with two symptoms. In a 2012 multicenter trial35 patients with mild to moderate COPD experiencing an exacerbation were treated with either combined amoxicillin and clavulanate or placebo if they had one of the three cardinal symptoms. The antibiotic group had a significantly higher clinical cure rate at days 9 to 11 (74.1% vs 59.9%) as well as a longer time until the next exacerbation (233 vs 160 days).

Recommendation. Optimal antibiotic management of COPD exacerbations may also depend on risk factors. For patients with at least two cardinal symptoms, we favor a scheme akin to one proposed for treating community-acquired pneumonia (Table 1).16,36
INPATIENT MANAGEMENT
Corticosteroids improve outcomes
A Department of Veterans Affairs cooperative trial37 randomized 271 patients hospitalized with COPD exacerbation to receive either corticosteroids (intravenous followed by oral) or placebo for either 2 weeks or 8 weeks. Corticosteroid recipients had lower rates of treatment failure at 30 and 90 days, defined as death from any cause, need for mechanical ventilation, readmission, or intensification of pharmacologic therapy. Corticosteroid therapy also reduced hospital length of stay and improved the rate of recovery. The longer corticosteroid course was associated with a higher rate of adverse effects.
Oral corticosteroids not inferior to intravenous
Using the same end point of treatment failure as the Veterans Affairs cooperative trial, deJong et al38 demonstrated that prednisone 60 mg by mouth was not inferior to intravenous prednisone. Neither trial demonstrated a difference in mortality between corticosteroid use and placebo.
Short course of a corticosteroid not inferior to a long course
In 2013, the Reduction in the Use of Corticosteroids in Exacerbated COPD (REDUCE) trial39 randomized 314 patients presenting with an acute COPD exacerbation (92% requiring hospital admission) to oral prednisone 40 mg daily for either 5 days or 14 days. They found that the short course was noninferior in preventing exacerbations over the ensuing 6 months in terms of death and the need for mechanical ventilation.
Recommendation. Our threshold for initiating systemic corticosteroid therapy is lower in hospitalized patients than in outpatients. We recommend the regimen of the REDUCE trial: prednisone 40 mg daily for 5 days.
Corticosteroids for patients on ventilatory support
Severe COPD exacerbations requiring admission to intensive care are a significant source of morbidity and mortality, and the strategy of corticosteroid treatment is still under investigation.
Intravenous corticosteroids are effective. A multicenter trial40 in 354 patients requiring either invasive or noninvasive mechanical ventilation randomized them to treatment with either intravenous methylprednisolone (tapered) or placebo. Treatment was associated with fewer mechanical ventilation days and a lower rate of noninvasive ventilation failure.
Low-dose oral corticosteroids ineffective. In contrast, an open-label trial41 of patients requiring ventilatory support and randomized to either oral prednisone (1 mg/kg for up to 10 days) or usual care found no difference in intensive care length of stay or noninvasive ventilation failure. This study used the oral route and smaller doses, and its open-label design might have introduced bias.
Lower-dose steroids better than high-dose. A 2014 cohort study of 17,239 patients admitted to the ICU with acute exacerbations of COPD evaluated outcomes of treatment with high methylprednisolone dosages (> 240 mg per day) vs lower dosages, using propensity score matching.42 No mortality difference was found between the groups. The lower dosage group (median methylprednisolone dose 100 mg per day) had shorter hospital and intensive care unit stays, shorter duration of noninvasive positive pressure ventilation, less need for insulin therapy, and fewer fungal infections.
Antibiotics for hospitalized patients
Only scarce data are available on the use of antibiotics for patients hospitalized with COPD exacerbation. In a study of patients hospitalized with COPD exacerbations, adding doxycycline to corticosteroids led to better clinical success and cure rates at 10 days compared with placebo, but the primary end point of clinical success at 30 days was not different between the two groups.43
BRONCHODILATORS: A MAINSTAY OF COPD TREATMENT
Bronchodilators are an important part of treatment of COPD exacerbations in inpatient and outpatient settings.
Nebulized beta-2 agonists are given every 1 to 4 hours. Albuterol at a 2.5-mg dose in each nebulization was found to be as effective as 5 mg for length of hospital stay and recovery of lung function in patients with an acute exacerbation of COPD.44
Adding an anticholinergic may help. Nebulized anticholinergics can be given alone or combined with beta-2 agonists. Whether long-acting bronchodilators should be used to manage COPD patients hospitalized with an exacerbation requires further inquiry. In an observational study with historical controls, Drescher and colleagues45 found cost savings and shorter hospital stays if tiotropium (a long-acting anticholinergic) was added to the respiratory care protocol, which also included formoterol (a long-acting beta-2 agonist).
OXYGEN: TITRATED APPROACH SAFER
Oxygen should be supplied during a COPD exacerbation to ensure adequate oxyhemoglobin saturation. Caution is needed to avoid hyperoxemic hypercapnia, particularly in patients with severe COPD and propensity to ventilatory failure. The routine administration of oxygen at high concentrations during a COPD exacerbation has been associated with a higher mortality rate than with a titrated oxygen approach.46 Long-term oxygen treatment started at discharge or as outpatient therapy is associated with reduced hospital admissions and shorter hospital stays for acute exacerbations of COPD.47
VENTILATION SUPPORT
Noninvasive positive-pressure ventilation is a useful adjunct to treatment of COPD exacerbations with evidence of ventilatory failure (ie, acute respiratory acidosis), helping to offset the work of breathing until respiratory system mechanics improve. Keenan et al48 reviewed 15 randomized controlled trials, involving 636 patients, of noninvasive positive-pressure ventilation in the setting of COPD exacerbation. They concluded that noninvasive positive-pressure ventilation reduced the in-hospital mortality rate and length of stay compared with standard therapy. Noninvasive positive-pressure ventilation is most useful in patients with severe COPD exacerbations and acute respiratory acidosis (pH < 7.35).49
Intubation and mechanical ventilation. Although no standards exist for determining which COPD exacerbations may be too severe for noninvasive positive-pressure ventilation, intubation is clearly indicated for impending respiratory failure or hemodynamic instability. Other factors to consider include the greater likelihood of noninvasive positive-pressure ventilation failure in patients with severe respiratory acidosis (pH < 7.25 is associated with a > 50% failure rate) and in those with no improvement in acidosis or respiratory rate during the first hour after initiation of noninvasive positive-pressure ventilation.50
PREVENTING EXACERBATIONS
Recent data indicate that COPD exacerbations can often be prevented (Table 2).
Inhaled pharmacotherapy
Inhaled pharmacotherapeutic agents, singly or in combination, reduce the frequency of COPD exacerbations.
Combined long-acting beta-2 agonist and corticosteroid is better than single-agent therapy. In 2007, the Towards a Revolution in COPD Health (TORCH) trial51 evaluated outpatient therapy in more than 6,000 patients worldwide with either an inhaled long-acting beta-2 agonist (salmeterol), an inhaled corticosteroid (fluticasone), both drugs in combination, or placebo. Patients had baseline prebronchodilator FEV1 of less than 60% and were followed for 3 years. No difference was found between the groups in the primary end point of deaths, but the annualized rate of moderate to severe exacerbations was reduced by 25% in the group that received combination therapy vs placebo. Combination therapy showed superior efficacy over individual drug therapy in preventing exacerbations. Treatment with the inhaled corticosteroid, whether alone or in combination with salmeterol, increased the risk of pneumonia.
A long-acting antimuscarinic agent is better than placebo. In 2008, the Understanding Potential Long-Term Impacts on Function With Tiotropium (UPLIFT) trial52 randomized nearly 6,000 patients with COPD and a postbronchodilator FEV1 of less than 70% to placebo or tiotropium, a long-acting antimuscarinic agent. Tiotropium reduced the exacerbation rate by 14% compared with placebo and improved quality of life.
Antimuscarinics may be better than beta-2 agonists. Head-to-head comparisons suggest that long-acting antimuscarinic agents are preferable to long-acting beta-2 agonists for preventing COPD exacerbations.53,54
Triple therapy: evidence is mixed. For patients with severe symptomatic COPD and frequent exacerbations, triple therapy with a combination of an inhaled long-acting antimuscarinic agent, an inhaled long-acting beta-2 agonist, and an inhaled corticosteroid has been suggested.
Data to support this practice are limited. In the Canadian Optimal Trial,55 the rate of exacerbations was not different between tiotropium alone, tiotropium plus salmeterol, and triple therapy. However, the rate of hospitalization for severe exacerbation was lower with triple therapy than tiotropium alone. A large, retrospective cohort study also supported triple therapy by finding reduced mortality, hospitalizations, and need for oral corticosteroid bursts compared to combination therapy with an inhaled long-acting beta-2 agonist and an inhaled corticosteroid.56
The drawback of triple therapy is an increased incidence of pneumonia associated with combined beta-2 agonist and corticosteroids, most likely due to the corticosteroid component.51 The risk appears to be higher for higher potency corticosteroids, eg, fluticasone.57
In 2014, the Withdrawal of Inhaled Steroids During Optimised Bronchodilator Management (WISDOM) trial58 randomized nearly 2,500 patients with a history of COPD exacerbation receiving triple therapy consisting of tiotropium, salmeterol, and inhaled fluticasone to either continue treatment or withdraw the corticosteroid for 3 months. The investigators defined an annualized exacerbation rate of 1.2 (ie, a 20% increase) as the upper limit of the confidence interval for an acceptable therapeutic margin of noninferiority. The study showed that the risk of moderate to severe exacerbations with combined tiotropium and salmeterol was noninferior to triple therapy.
Nevertheless, caution is advised when removing the corticosteroid component from triple therapy. The trial demonstrated a worsening in overall health status, some reduction in lung function, and a transient increase in severe exacerbations in the withdrawal group. Patients with increased symptom burden at baseline and a history of severe exacerbations may not be optimal candidates for this strategy.
Roflumilast is effective but has side effects
Roflumilast, an oral phosphodiesterase 4 inhibitor, is an anti-inflammatory drug without bronchodilator properties. In randomized controlled trials, the drug was associated with a 17% reduction in acute exacerbations compared with placebo.59
Adding roflumilast to either a long-acting beta-2 agonist or a long-acting antimuscarinic agent resulted in a 6% to 8% further reduction in the proportion of patients with exacerbation.60,61 Martinez et al61 found that roflumilast added to a regimen of a long-acting beta-2 agonist plus an inhaled corticosteroid reduced moderate to severe exacerbations by 14.2%, even in the presence of tiotropium. Compared with placebo, roflumilast treatment reduced exacerbations necessitating hospitalizations by 23.9%.
The FDA has approved oral roflumilast 500 µg once daily to prevent COPD exacerbations.
Roflumilast is frequently associated with side effects, including gastrointestinal symptoms (chiefly diarrhea), weight loss, and psychiatric effects. A benefit-to-harm study in 2014 concluded that using the drug is only favorable for patients who have a high risk of severe exacerbations, ie, those who have a greater than 22% baseline risk of having at least one exacerbation annually.62
Recommendation. Roflumilast should be reserved for patients who have severe COPD with a chronic bronchitis phenotype (ie, with cough and sputum production) and repeated exacerbations despite an optimal regimen of an inhaled corticosteroid, long-acting beta-2 agonist, and long-acting antimuscarinic agent.
Macrolide antibiotics: Role unclear
Macrolide antibiotics have anti-inflammatory and immunomodulatory activities.
Azithromycin: fewer exacerbations but some side effects. A multicenter trial63 in 1,142 COPD patients randomized to either oral azithromycin 250 mg daily or placebo found a 27% reduction in the risk of COPD exacerbation in the intervention arm. No differences were found between the groups in mortality, hospitalizations, emergency department visits, or respiratory failure. Hearing loss and increased macrolide resistance were noted in the intervention arm. In a secondary subgroup analysis,64 no difference in efficacy was found by sex, history of chronic bronchitis, oxygen use, or concomitant COPD treatment.
The COPD: Influence of Macrolides on Exacerbation Frequency in Patients trial65 helped refine patient selection for macrolide therapy. In this single-center study, 92 patients with COPD and at least three exacerbations during the year prior to enrollment were randomized to receive either azithromycin 500 mg three times weekly or placebo. Exacerbations in the intervention group were markedly reduced (42%) with no difference in hospitalization rate.
The place of macrolide antibiotics in the treatment strategy of COPD is unclear, and they are not currently part of the GOLD guidelines. Still unknown is the incremental benefit of adding them to existing preventive regimens, cardiovascular safety, side effects, and potential effects on the resident microbial flora.
Other antibiotics have also been investigated for efficacy in preventing exacerbations.
Moxifloxacin: fewer exacerbations. The Pulsed Moxifloxacin Usage and Its Long-term Impact on the Reduction of Subsequent Exacerbations study66 randomized more than 1,000 patients with stable COPD to receive either moxifloxacin 400 mg or placebo daily for 5 days repeated every 8 weeks for six courses. Frequent assessment during the treatment period and for 6 months afterward revealed a reduced exacerbation rate in the intervention group but without benefit in hospitalization rate, mortality, lung function, or health status.
Recommendation. Azithromycin (either 250 mg daily or 500 mg three times weekly) can be considered for patients who have repeated COPD exacerbations despite an optimal regimen of an inhaled corticosteroid, inhaled long-acting beta-2 agonist, and inhaled long-acting antimuscarinic agent. The need to continue azithromycin should be reassessed yearly.
Mucolytics
Greatest benefit to patients not taking inhaled corticosteroids. Mucolytic agents help clear airway secretions by reducing viscosity. N-acetylcysteine and carbocysteine (not available in the United States) also have antioxidant properties that may counteract oxidant stress associated with acute COPD exacerbations.
The Bronchitis Randomized on NAC Cost-Utility Study (BRONCUS)67 randomized 523 COPD patients to N-acetylcysteine 600 mg daily or placebo. After 3 years of follow-up, no differences were found in the rate of exacerbations, lung function decline, and quality of life. Subgroup analysis suggested a reduction in exacerbations for patients who were not taking inhaled corticosteroids.
The Effect of Carbocisteine on Acute Exacerbation of Chronic Obstructive Pulmonary Disease (PEACE) study randomized more than 700 patients from multiple centers in China who had COPD and a recent history of exacerbations; they found a 25% lower exacerbation rate over 1 year with carbocysteine vs placebo.68 Most of the patients (83%) were not on inhaled corticosteroids, which complemented findings of the BRONCUS trial.
The Effect of High Dose N-acetylcysteine on Air Trapping and Airway Resistance of COPD (HIACE) study randomized 120 patients with stable COPD in a hospital in Hong Kong to either oral N-acetylcysteine (600 mg twice daily) or placebo and found a reduced exacerbation rate of exacerbations. Patients were matched at baseline for inhaled corticosteroid use.69
In 2014, the Twice Daily N-acetylcysteine 600 mg for Exacerbations of Chronic Obstructive Pulmonary Disease (PANTHEON) study70 randomized 1,006 patients from multiple hospitals in China with a history of moderate to severe COPD and exacerbations to receive either N-acetylcysteine 600 mg twice daily or placebo for 1 year. They found a 22% reduction in exacerbations in the treatment group vs placebo.
GOLD guidelines2 recommend mucolytics for patients with severe COPD and exacerbations when inhaled corticosteroids are not available or affordable.
Recommendation. Mucolytics may be useful for patients with difficulty expectorating and with a history of exacerbations despite appropriate inhaled therapy.
OTHER INTERVENTIONS CAN HELP
Pulmonary rehabilitation provides multiple benefits
Pulmonary rehabilitation increases exercise tolerance and reduces symptom burden in patients with stable COPD. It is also a multidisciplinary effort that may help reinforce adherence to medications, enhance COPD education, and provide closer medical surveillance to patients at high risk for recurrent exacerbations.
A small randomized controlled trial71 prescribed pulmonary rehabilitation on discharge for a COPD exacerbation and found sustainable improvements in exercise capacity and health status after 3 months.
In a later study,72 the same group started pulmonary rehabilitation within a week of hospital discharge and found reduced hospital readmissions over a 3-month period.
Smoking cessation is always worth advocating
A large observational cohort study concluded that current smokers were at a higher risk for COPD exacerbations compared with former smokers.73 Although there are no randomized controlled trials that assess the effects of smoking cessation at the time of COPD exacerbation, we recommend seizing the opportunity to implement this important intervention.
Vaccinations: Influenza and pneumococcal
Influenza vaccination is associated with reduced incidence of hospitalization among patients with cardiopulmonary disease.74 A meta-analysis of randomized clinical trials of influenza vaccination for patients with COPD75 reported significantly fewer exacerbations from vaccination, mostly owing to fewer episodes occurring after 3 to 4 weeks, coinciding with anticipated vaccine-induced immune protection. Furumoto and colleagues76 reported an added benefit of combined vaccination with 23-valent pneumococcal polysaccharide vaccine and influenza vaccine in reducing hospital admissions over influenza vaccination alone. We also recommend providing the 13-valent pneumococcal conjugate vaccine to patients with COPD, particularly for those older than 65, consistent with CDC recommendations.77
- Hatipoglu U, Aboussouan LS. Chronic obstructive pulmonary disease: an update for the primary physician. Cleve Clin J Med 2014; 81:373–383.
- Global initiative for chronic obstructive lung disease. Pocket Guide to COPD Diagnosis, Management, and Prevention. A Guide for Health Care Professionals. Updated 2016. http://www.goldcopd.org/uploads/users/files/WatermarkedPocket%20Guide%202016(2).pdf. Accessed March 7, 2016.
- Gupta N, Pinto LM, Morogan A, Bourbeau J. The COPD assessment test: a systematic review. Eur Respir J 2014; 44:873–884.
- Leidy NK, Wilcox TK, Jones PW, et al; EXACT-PRO Study Group. Development of the EXAcerbations of chronic obstructive pulmonary disease tool (EXACT): a patient-reported outcome (PRO) measure. Value Health 2010; 13:965–975.
- Anthonisen NR, Manfreda J, Warren CP, Hershfield ES, Harding GK, Nelson NA. Antibiotic therapy in exacerbations of chronic obstructive pulmonary disease. Ann Intern Med 1987; 106:196–204.
- Tillie-Leblond I, Marquette CH, Perez T, et al. Pulmonary embolism in patients with unexplained exacerbation of chronic obstructive pulmonary disease: prevalence and risk factors. Ann Intern Med 2006; 144:390–396.
- Ford ES, Murphy LB, Khavjou O, Giles WH, Holt JB, Croft JB. Total and state-specific medical and absenteeism costs of COPD among adults aged ≥ 18 years in the United States for 2010 and projections through 2020. Chest 2015; 147:31–45.
- Toy EL, Gallagher KF, Stanley EL, Swensen AR, Duh MS. The economic impact of exacerbations of chronic obstructive pulmonary disease and exacerbation definition: a review. COPD 2010; 7:214–228.
- Pasquale MK, Sun SX, Song F, Hartnett HJ, Stemkowski SA. Impact of exacerbations on health care cost and resource utilization in chronic obstructive pulmonary disease patients with chronic bronchitis from a predominantly Medicare population. Int J Chron Obstruct Pulmon Dis 2012; 7:757–764.
- Donaldson GC, Seemungal TA, Bhowmik A, Wedzicha JA. Relationship between exacerbation frequency and lung function decline in chronic obstructive pulmonary disease. Thorax 2002; 57:847–852.
- Seemungal TA, Donaldson GC, Paul EA, Bestall JC, Jeffries DJ, Wedzicha JA. Effect of exacerbation on quality of life in patients with chronic obstructive pulmonary disease. Am J Respir Crit Care Med 1998; 157:1418–1422.
- Seemungal TA, Donaldson GC, Bhowmik A, Jeffries DJ, Wedzicha JA. Time course and recovery of exacerbations in patients with chronic obstructive pulmonary disease. Am J Respir Crit Care Med 2000; 161:1608–1613.
- Spencer S, Calverley PM, Sherwood Burge P, Jones PW; ISOLDE Study Group, Inhaled Steroids in Obstructive Lung Disease. Health status deterioration in patients with chronic obstructive pulmonary disease. Am J Respir Crit Care Med 2001; 163:122–128.
- Soler-Cataluña JJ, Martínez-García MA, Román Sánchez P, Salcedo E, Navarro M, Ochando R. Severe acute exacerbations and mortality in patients with chronic obstructive pulmonary disease. Thorax 2005; 60:925–931.
- Brusselle G. Why doesn’t reducing exacerbations decrease COPD mortality? Lancet Respir Med 2014; 2:681–683.
- Sethi S, Murphy TF. Infection in the pathogenesis and course of chronic obstructive pulmonary disease. N Engl J Med 2008; 359:2355–2365.
- White AJ, Gompertz S, Bayley DL, et al. Resolution of bronchial inflammation is related to bacterial eradication following treatment of exacerbations of chronic bronchitis. Thorax 2003; 58:680–685.
- Desai H, Eschberger K, Wrona C, et al. Bacterial colonization increases daily symptoms in patients with chronic obstructive pulmonary disease. Ann Am Thorac Soc 2014; 11:303–309.
- Bafadhel M, McKenna S, Terry S, et al. Acute exacerbations of chronic obstructive pulmonary disease: identification of biologic clusters and their biomarkers. Am J Respir Crit Care Med 2011; 184:662–671.
- Jamieson DB, Matsui EC, Belli A, et al. Effects of allergic phenotype on respiratory symptoms and exacerbations in patients with chronic obstructive pulmonary disease. Am J Respir Crit Care Med 2013; 188:187–192.
- Gibson PG, Simpson JL. The overlap syndrome of asthma and COPD: what are its features and how important is it? Thorax 2009; 64:728–735.
- Thomsen M, Ingebrigtsen TS, Marott JL, et al. Inflammatory biomarkers and exacerbations in chronic obstructive pulmonary disease. JAMA 2013; 309:2353–2361.
- Hurst JR, Vestbo J, Anzueto A, et al; Evaluation of COPD Longitudinally to Identify Predictive Surrogate Endpoints (ECLIPSE) Investigators. Susceptibility to exacerbation in chronic obstructive pulmonary disease. N Engl J Med 2010; 363:1128–1138.
- Donaldson GC, Hurst JR, Smith CJ, Hubbard RB, Wedzicha JA. Increased risk of myocardial infarction and stroke following exacerbation of COPD. Chest 2010; 137:1091–1097.
- Chang CL, Robinson SC, Mills GD, et al. Biochemical markers of cardiac dysfunction predict mortality in acute exacerbations of COPD. Thorax 2011; 66:764–768.
- Patel AR, Kowlessar BS, Donaldson GC, et al. Cardiovascular risk, myocardial injury, and exacerbations of chronic obstructive pulmonary disease. Am J Respir Crit Care Med 2013; 188:1091–1099.
- Dransfield MT, Rowe SM, Johnson JE, Bailey WC, Gerald LB. Use of beta blockers and the risk of death in hospitalised patients with acute exacerbations of COPD. Thorax 2008; 63:301–305.
- Thompson WH, Nielson CP, Carvalho P, Charan NB, Crowley JJ. Controlled trial of oral prednisone in outpatients with acute COPD exacerbation. Am J Respir Crit Care Med 1996; 154:407–412.
- Aaron SD, Vandemheen KL, Hebert P, et al. Outpatient oral prednisone after emergency treatment of chronic obstructive pulmonary disease. N Engl J Med 2003; 348:2618–2625.
- Walters JA, Gibson PG, Wood-Baker R, Hannay M, Walters EH. Systemic corticosteroids for acute exacerbations of chronic obstructive pulmonary disease. Cochrane Database Syst Rev 2009; 1:CD001288.
- Bafadhel M, McKenna S, Terry S, et al. Blood eosinophils to direct corticosteroid treatment of exacerbations of chronic obstructive pulmonary disease: a randomized placebo-controlled trial. Am J Respir Crit Care Med 2012; 186:48–55.
- Siva R, Green RH, Brightling CE, et al. Eosinophilic airway inflammation and exacerbations of COPD: a randomised controlled trial. Eur Respir J 2007; 29:906–913.
- Wilson R, Allegra L, Huchon G, et al; MOSAIC Study Group. Short-term and long-term outcomes of moxifloxacin compared to standard antibiotic treatment in acute exacerbations of chronic bronchitis. Chest 2004; 125:953–964.
- Wilson R, Anzueto A, Miravitlles M, et al. Moxifloxacin versus amoxicillin/clavulanic acid in outpatient acute exacerbations of COPD: MAESTRAL results. Eur Respir J 2012; 40:17–27.
- Llor C, Moragas A, Hernandez S, Bayona C, Miravitlles M. Efficacy of antibiotic therapy for acute exacerbations of mild to moderate chronic obstructive pulmonary disease. Am J Respir Crit Care Med 2012; 186:716–723.
- Anzueto A. Primary care management of chronic obstructive pulmonary disease to reduce exacerbations and their consequences. Am J Med Sci 2010; 340:309–318.
- Niewoehner DE, Erbland ML, Deupree RH, et al. Effect of systemic glucocorticoids on exacerbations of chronic obstructive pulmonary disease. Department of Veterans Affairs Cooperative Study Group. N Engl J Med 1999; 340:1941–1947.
- de Jong YP, Uil SM, Grotjohan HP, Postma DS, Kerstjens HA, van den Berg JW. Oral or IV prednisolone in the treatment of COPD exacerbations: a randomized, controlled, double-blind study. Chest 2007; 132:1741–1747.
- Leuppi JD, Schuetz P, Bingisser R, et al. Short-term vs conventional glucocorticoid therapy in acute exacerbations of chronic obstructive pulmonary disease: the REDUCE randomized clinical trial. JAMA 2013; 309:2223–2231.
- Alia I, de la Cal MA, Esteban A, et al. Efficacy of corticosteroid therapy in patients with an acute exacerbation of chronic obstructive pulmonary disease receiving ventilatory support. Arch Intern Med 2011; 171:1939–1946.
- Abroug F, Ouanes-Besbes L, Fkih-Hassen M, et al. Prednisone in COPD exacerbation requiring ventilatory support: an open-label randomised evaluation. Eur Respir J 2014; 43:717–724.
- Kiser TH, Allen RR, Valuck RJ, Moss M, Vandivier RW. Outcomes associated with corticosteroid dosage in critically ill patients with acute exacerbations of chronic obstructive pulmonary disease. Am J Respir Crit Care Med 2014; 189:1052–1064.
- Daniels JM, Snijders D, de Graaff CS, Vlaspolder F, Jansen HM, Boersma WG. Antibiotics in addition to systemic corticosteroids for acute exacerbations of chronic obstructive pulmonary disease. Am J Respir Crit Care Med 2010; 181:150–157.
- Nair S, Thomas E, Pearson SB, Henry MT. A randomized controlled trial to assess the optimal dose and effect of nebulized albuterol in acute exacerbations of COPD. Chest 2005; 128:48–54.
- Drescher GS, Carnathan BJ, Imus S, Colice GL. Incorporating tiotropium into a respiratory therapist-directed bronchodilator protocol for managing in-patients with COPD exacerbations decreases bronchodilator costs. Respir Care 2008; 53:1678–1684.
- Austin MA, Wills KE, Blizzard L, Walters EH, Wood-Baker R. Effect of high flow oxygen on mortality in chronic obstructive pulmonary disease patients in prehospital setting: randomised controlled trial. BMJ 2010; 341:c5462.
- Ringbaek TJ, Viskum K, Lange P. Does long-term oxygen therapy reduce hospitalisation in hypoxaemic chronic obstructive pulmonary disease? Eur Respir J 2002; 20:38–42.
- Keenan SP, Sinuff T, Cook DJ, Hill NS. Which patients with acute exacerbation of chronic obstructive pulmonary disease benefit from noninvasive positive-pressure ventilation? A systematic review of the literature. Ann Intern Med 2003; 138:861–870.
- Quon BS, Gan WQ, Sin DD. Contemporary management of acute exacerbations of COPD: a systematic review and metaanalysis. Chest 2008; 133:756–766.
- Sinuff T, Keenan SP; Department of Medicine, McMaster University. Clinical practice guideline for the use of noninvasive positive pressure ventilation in COPD patients with acute respiratory failure. J Crit Care 2004; 19:82–91.
- Calverley PM, Anderson JA, Celli B, et al. Salmeterol and fluticasone propionate and survival in chronic obstructive pulmonary disease. N Engl J Med 2007; 356:775–789.
- Tashkin DP, Celli B, Senn S, et al; UPLIFT Study Investigators. A 4-year trial of tiotropium in chronic obstructive pulmonary disease. N Engl J Med 2008; 359:1543–1554.
- Vogelmeier C, Hederer B, Glaab T, et al; POET-COPD Investigators. Tiotropium versus salmeterol for the prevention of exacerbations of COPD. N Engl J Med 2011; 364:1093–1103.
- Decramer ML, Chapman KR, Dahl R, et al; INVIGORATE investigators. Once-daily indacaterol versus tiotropium for patients with severe chronic obstructive pulmonary disease (INVIGORATE): a randomised, blinded, parallel-group study. Lancet Respir Med 2013; 1:524–533.
- Aaron SD, Vandemheen KL, Fergusson D, et al; Canadian Thoracic Society/Canadian Respiratory Clinical Research Consortium. Tiotropium in combination with placebo, salmeterol, or fluticasone-salmeterol for treatment of chronic obstructive pulmonary disease: a randomized trial. Ann Intern Med 2007; 146:545–555.
- Short PM, Williamson PA, Elder DH, Lipworth SI, Schembri S, Lipworth BJ. The impact of tiotropium on mortality and exacerbations when added to inhaled corticosteroids and long-acting beta-agonist therapy in COPD. Chest 2012; 141:81–86.
- Suissa S, Patenaude V, Lapi F, Ernst P. Inhaled corticosteroids in COPD and the risk of serious pneumonia. Thorax 2013; 68:1029–1036.
- Magnussen H, Disse B, Rodriguez-Roisin R, et al; WISDOM Investigators. Withdrawal of inhaled glucocorticoids and exacerbations of COPD. N Engl J Med 2014; 371:1285–1294.
- Calverley PM, Rabe KF, Goehring UM, Kristiansen S, Fabbri LM, Martinez FJ; M2-124 and M2-125 study groups. Roflumilast in symptomatic chronic obstructive pulmonary disease: two randomised clinical trials. Lancet 2009; 374:685–694.
- Fabbri LM, Calverley PM, Izquierdo-Alonso JL, et al; M2-127 and M2-128 study groups. Roflumilast in moderate-to-severe chronic obstructive pulmonary disease treated with longacting bronchodilators: two randomised clinical trials. Lancet 2009; 374:695–703.
- Martinez FJ, Calverley PM, Goehring UM, Brose M, Fabbri LM, Rabe KF. Effect of roflumilast on exacerbations in patients with severe chronic obstructive pulmonary disease uncontrolled by combination therapy (REACT): a multicentre randomised controlled trial. Lancet 2015; 385:857–866.
- Yu T, Fain K, Boyd CM, et al. Benefits and harms of roflumilast in moderate to severe COPD. Thorax 2014; 69:616–622.
- Albert RK, Connett J, Bailey WC, et al; COPD Clinical Research Network. Azithromycin for prevention of exacerbations of COPD. N Engl J Med 2011; 365:689–698.
- Han MK, Tayob N, Murray S, et al. Predictors of chronic obstructive pulmonary disease exacerbation reduction in response to daily azithromycin therapy. Am J Respir Crit Care Med 2014; 189:1503–1508.
- Uzun S, Djamin RS, Kluytmans JA, et al. Azithromycin maintenance treatment in patients with frequent exacerbations of chronic obstructive pulmonary disease (COLUMBUS): a randomised, double-blind, placebo-controlled trial. Lancet Respir Med 2014; 2:361–368.
- Sethi S, Jones PW, Theron MS, et al; PULSE Study group. Pulsed moxifloxacin for the prevention of exacerbations of chronic obstructive pulmonary disease: a randomized controlled trial. Respir Res 2010; 11:10.
- Decramer M, Rutten-van Molken M, Dekhuijzen PN, et al. Effects of N-acetylcysteine on outcomes in chronic obstructive pulmonary disease (Bronchitis Randomized On NAC Cost-Utility Study, BRONCUS): a randomised placebo-controlled trial. Lancet 2005; 365:1552–1560.
- Zheng JP, Kang J, Huang SG, et al. Effect of carbocisteine on acute exacerbation of chronic obstructive pulmonary disease (PEACE study): a randomised placebo-controlled study. Lancet 2008; 371:2013–2018.
- Tse HN, Raiteri L, Wong KY, et al. High-dose N-acetylcysteine in stable COPD: the 1-year, double-blind, randomized, placebo-controlled HIACE study. Chest 2013; 144:106–118.
- Zheng JP, Wen FQ, Bai CX, et al; PANTHEON study group. Twice daily N-acetylcysteine 600 mg for exacerbations of chronic obstructive pulmonary disease (PANTHEON): a randomised, double-blind placebo-controlled trial. Lancet Respir Med 2014; 2:187–194.
- Man WD, Polkey MI, Donaldson N, Gray BJ, Moxham J. Community pulmonary rehabilitation after hospitalisation for acute exacerbations of chronic obstructive pulmonary disease: randomised controlled study. BMJ 2004; 329:1209.
- Seymour JM, Moore L, Jolley CJ, et al. Outpatient pulmonary rehabilitation following acute exacerbations of COPD. Thorax 2010; 65:423–428.
- Au DH, Bryson CL, Chien JW, et al. The effects of smoking cessation on the risk of chronic obstructive pulmonary disease exacerbations. J Gen Intern Med 2009; 24:457–463.
- Seo YB, Hong KW, Kim IS, et al. Effectiveness of the influenza vaccine at preventing hospitalization due to acute lower respiratory infection and exacerbation of chronic cardiopulmonary disease in Korea during 2010-2011. Vaccine 2013; 31:1426–1430.
- Poole PJ, Chacko E, Wood-Baker RW, Cates CJ. Influenza vaccine for patients with chronic obstructive pulmonary disease. Cochrane Database Syst Rev 2006; 1:CD002733.
- Furumoto A, Ohkusa Y, Chen M, et al. Additive effect of pneumococcal vaccine and influenza vaccine on acute exacerbation in patients with chronic lung disease. Vaccine 2008; 26:4284–4289.
- Tomczyk S, Bennett NM, Stoecker C, et al; Centers for Disease Control and Prevention (CDC). Use of 13-valent pneumococcal conjugate vaccine and 23-valent pneumococcal polysaccharide vaccine among adults aged ≥65 years: recommendations of the Advisory Committee on Immunization Practices (ACIP). MMWR Morb Mortal Wkly Rep 2014; 63:822–825.
In contrast to stable chronic obstructive pulmonary disease (COPD),1 acute exacerbations of COPD pose special management challenges and can significantly increase the risk of morbidity and death and the cost of care.
This review addresses the definition and diagnosis of COPD exacerbations, disease burden and costs, etiology and pathogenesis, and management and prevention strategies.
DEFINITIONS ARE PROBLEMATIC
The Global Initiative for Chronic Obstructive Lung Disease (GOLD) defines a COPD exacerbation as “an acute event characterized by a worsening of the patient’s respiratory symptoms that is beyond normal day-to-day variations and leads to a change in medication.”2 It further categorizes acute exacerbations by severity:
- Mild—treated with increased frequency of doses of existing medications
- Moderate—treated with corticosteroids or antibiotics, or both
- Severe—requires hospital utilization (either emergency room treatment or admission).
Although descriptive and useful for retrospective analyses, this current definition poses ambiguities for clinicians. Day-to-day variation in symptoms is not routinely assessed, so deviations from baseline may be difficult to detect. Although clinical tools are available for assessing symptoms in stable and exacerbated states (eg, the COPD assessment test3 and the Exacerbations of Chronic Pulmonary Disease Tool [EXACT]4), they have not been widely adopted in daily practice. Also, according to the current definition, the severity of an exacerbation can be classified only after the course of action is determined, so the severity is not helpful for forming a management strategy at bedside. In addition, physicians may have different thresholds for prescribing antibiotics and corticosteroids.
An earlier definition categorized a COPD exacerbation by the presence of its three cardinal symptoms (ie, increased shortness of breath, sputum volume, and purulence):
- Type I—all three symptoms present
- Type II—two symptoms present
- Type III—one symptom present, accompanied by at least one of the following: upper respiratory tract infection within the past 5 days, unexplained fever, increased wheezing or cough, or 20% increased respiratory rate or heart rate from baseline.
This older definition was successfully used in a prospective clinical trial to identify patients who benefited most from antibiotics for COPD exacerbations.5
Despite these caveats regarding a definition, most clinicians agree on the clinical presentation of a patient with COPD exacerbation: ie, having some combination of shortness of breath, increased sputum volume, and purulence. By the same token, patients with COPD who present with symptoms not typical of an exacerbation should be evaluated for another diagnosis. For instance, Tillie-Leblond et al6 reported that 49 (25%) of 197 patients hospitalized with an “unexplained” exacerbation of COPD were eventually diagnosed with pulmonary embolism.
EXACERBATIONS ARE COSTLY
The care of patients with COPD places a great burden on the healthcare system. Using multiple national databases, Ford et al7 estimated that medical costs in the United States in 2010 attributable to COPD and its complications were $32.1 billion.
The largest component of direct healthcare costs of COPD is exacerbations and subsequent hospitalizations.8 Data from a predominantly Medicare population indicate that the annualized mean COPD-related cost for a patient with no exacerbations was $1,425, compared with $12,765 for a patient with severe exacerbations.9 The investigators estimated that reducing exacerbations from two or more to none could save $5,125 per patient per year.
EXACERBATIONS AFFECT HEALTH BEYOND THE EVENT
COPD exacerbations are associated with a faster decline in lung function,10 reduced quality of life,11 and lost workdays.7 A single exacerbation may cause a decline in lung function and health status that may not return to baseline for several months, particularly if another exacerbation occurs within 6 months.12,13 COPD exacerbations have also been linked to poor clinical outcomes, including death.
In a prospective study in 304 men with COPD followed for 5 years, those who had three or more COPD exacerbations annually were four times as likely to die than patients who did not have an exacerbation.14 Nevertheless, the relationship with mortality may not be causal: Brusselle pointed out in an editorial15 that established mortality predictors for COPD do not include exacerbations, and symptomatic patients with COPD without any history of exacerbations are at greater risk of death than those who are asymptomatic but at high risk for exacerbations.
INFECTION + INFLAMMATION = EXACERBATION
An acute COPD exacerbation can be viewed as an acute inflammatory event superimposed on chronic inflammation associated with COPD. Inflammation in the airways increases resistance to air flow with consequent air trapping. Increased resistance and elastic load due to air trapping place respiratory muscles at a mechanical disadvantage and increase the work of breathing.
Infection starts the process
Infections, particularly bacterial and viral, are thought to be the major instigators of COPD exacerbation, although environmental factors such as air pollution may also play a role.16
Airway inflammation is markedly reduced when bacterial infection is eradicated. But if bacterial colonization continues, inflammatory markers remain elevated despite clinical resolution of the exacerbation.17 Desai et al18 found that patients with COPD and chronic bronchitis with bacterial colonization had a larger symptom burden than patients without colonization, even without an exacerbation.
Allergic profile increases risk
Although most studies indicate that infection is the main cause of exacerbations, clinicians should consider other mechanisms of inflammation on an individual basis. COPD exacerbations may be phenotyped by measuring inflammatory markers, perhaps as a starting point for tailored therapies.
Bafadhel et al19 studied 145 patients with COPD over the course of a year and recorded various biomarkers at baseline and during exacerbations. Exacerbations had an inflammatory profile that was predominantly bacterial in 37%, viral in 10%, and eosinophilic in 17%, and had limited changes in the inflammatory profile in 14%. The remaining episodes were combinations of categories. In another study,20 multivariate analysis conducted in two cohorts with COPD found that patients who had an allergic phenotype had more respiratory symptoms and a higher likelihood of COPD exacerbations.
Frequent COPD exacerbations are increasingly recognized as being associated with an asthma-COPD overlap syndrome, consisting of symptoms of increased airflow variability and incompletely reversible airflow obstruction.21
Inflammation as a marker of frequent exacerbations
Evidence is accumulating that supports systemic inflammation as a marker of frequent exacerbations. The Copenhagen Heart Study tested for baseline plasma C-reactive protein, fibrinogen, and white blood cell count in 6,574 stable patients with COPD.22 After multivariable adjustment, they found a significantly higher likelihood of having a subsequent exacerbation in patients who had all three biomarkers elevated (odds ratio [OR] 3.7, 95% confidence interval [CI] 1.9–7.4), even in patients with milder COPD and those without previous exacerbations.
Past exacerbations predict risk
The Evaluation of COPD Longitudinally to Identify Predictive Surrogate Endpoints study23 found that a history of acute COPD exacerbation was the single best predictor of future exacerbations. This risk factor remained stable over 3 years and was present across the severity of COPD, ie, patients at lower GOLD stages who had a history of frequent exacerbations were likely to have exacerbations during follow-up.
EXACERBATION INCREASES CARDIOVASCULAR RISK
COPD exacerbations increase the risk of cardiovascular events, particularly myocardial infarction.24 During hospitalization for acute exacerbation of COPD, markers of myocardial injury and heart failure may be elevated and are a predictor of death.25
Patel et al26 measured arterial stiffness (aortic pulse wave velocity, a validated measure of cardiovascular risk) and cardiac biomarkers (troponin and N-terminal B-type natriuretic peptide) at baseline in 98 patients and longitudinally during and after a COPD exacerbation. In addition to increased levels of cardiac biomarkers, they found a significant rise in arterial stiffness during the exacerbation event without return to baseline levels over 35 days of follow-up. The arterial stiffness increase was related to airway inflammation as measured by sputum interleukin 6, particularly in patients with documented lower respiratory tract infection.
Retrospective analysis suggests a reduced all-cause mortality rate in COPD patients who are treated with beta-blockers.27
Recommendation. We recommend that patients already taking a selective beta-blocker continue to do so during a COPD exacerbation.
OUTPATIENT MANAGEMENT
Treatment with a combination of a corticosteroid, antibiotic, and bronchodilator addresses the underlying pathophysiologic processes of an acute exacerbation: inflammation, infection, and airway trapping.
Short course of a corticosteroid improves outcomes
A 10-day systemic course of a corticosteroid prescribed for COPD exacerbation before discharge from the emergency department was found to offer a small advantage over placebo for reducing treatment failure (unscheduled physician visits, return to emergency room for recurrent symptoms) and improving dyspnea scores and lung function.28 Even just a 3-day course improved measures of respiration (forced expiratory volume in the first second of expiration [FEV1] and arterial oxygenation) at days 3 and 10, and reduced treatment failures compared with placebo.29
Corticosteroid prescription should not be taken lightly, because adverse effects are common. In a systematic review, one adverse effect (hyperglycemia, weight gain, or insomnia) occurred for every five people treated.30
Identifying subgroups of patients most likely to benefit from corticosteroid treatment may be helpful. Corticosteroids may delay improvement in patients without eosinophilic inflammation and hasten recovery in those with more than 2% peripheral eosinophils.31 Siva et al32 found that limiting corticosteroids to patients with sputum eosinophilia reduced corticosteroid use and reduced severe exacerbations compared with standard care.32
Recommendation. For an acute exacerbation, we prescribe a short course of corticosteroids (eg, prednisone 40 mg daily for 5 to 7 days). Tapering dosing is probably unnecessary because adrenal insufficiency is uncommon before 2 weeks of corticosteroid exposure. Clinicians should weigh the merits of tapering (reduced corticosteroid exposure) against patient inconvenience and difficulty following complicated instructions.
Antibiotics help, but exact strategy uncertain
Although antibiotic therapy is one of the three pillars of COPD exacerbation management, the optimal antimicrobial agent, duration of therapy, and which patients will benefit remain areas of controversy and research. Thus far, large trials have been unable to definitely show the superiority of one antibiotic over another.33,34
A 1987 randomized controlled trial5 of antibiotic therapy in acute exacerbation of COPD found the greatest benefit to patients who had all three cardinal symptoms (ie, increased shortness of breath, sputum volume, and purulence), with less marked but still significant improvement in patients with two symptoms. In a 2012 multicenter trial35 patients with mild to moderate COPD experiencing an exacerbation were treated with either combined amoxicillin and clavulanate or placebo if they had one of the three cardinal symptoms. The antibiotic group had a significantly higher clinical cure rate at days 9 to 11 (74.1% vs 59.9%) as well as a longer time until the next exacerbation (233 vs 160 days).
Recommendation. Optimal antibiotic management of COPD exacerbations may also depend on risk factors. For patients with at least two cardinal symptoms, we favor a scheme akin to one proposed for treating community-acquired pneumonia (Table 1).16,36
INPATIENT MANAGEMENT
Corticosteroids improve outcomes
A Department of Veterans Affairs cooperative trial37 randomized 271 patients hospitalized with COPD exacerbation to receive either corticosteroids (intravenous followed by oral) or placebo for either 2 weeks or 8 weeks. Corticosteroid recipients had lower rates of treatment failure at 30 and 90 days, defined as death from any cause, need for mechanical ventilation, readmission, or intensification of pharmacologic therapy. Corticosteroid therapy also reduced hospital length of stay and improved the rate of recovery. The longer corticosteroid course was associated with a higher rate of adverse effects.
Oral corticosteroids not inferior to intravenous
Using the same end point of treatment failure as the Veterans Affairs cooperative trial, deJong et al38 demonstrated that prednisone 60 mg by mouth was not inferior to intravenous prednisone. Neither trial demonstrated a difference in mortality between corticosteroid use and placebo.
Short course of a corticosteroid not inferior to a long course
In 2013, the Reduction in the Use of Corticosteroids in Exacerbated COPD (REDUCE) trial39 randomized 314 patients presenting with an acute COPD exacerbation (92% requiring hospital admission) to oral prednisone 40 mg daily for either 5 days or 14 days. They found that the short course was noninferior in preventing exacerbations over the ensuing 6 months in terms of death and the need for mechanical ventilation.
Recommendation. Our threshold for initiating systemic corticosteroid therapy is lower in hospitalized patients than in outpatients. We recommend the regimen of the REDUCE trial: prednisone 40 mg daily for 5 days.
Corticosteroids for patients on ventilatory support
Severe COPD exacerbations requiring admission to intensive care are a significant source of morbidity and mortality, and the strategy of corticosteroid treatment is still under investigation.
Intravenous corticosteroids are effective. A multicenter trial40 in 354 patients requiring either invasive or noninvasive mechanical ventilation randomized them to treatment with either intravenous methylprednisolone (tapered) or placebo. Treatment was associated with fewer mechanical ventilation days and a lower rate of noninvasive ventilation failure.
Low-dose oral corticosteroids ineffective. In contrast, an open-label trial41 of patients requiring ventilatory support and randomized to either oral prednisone (1 mg/kg for up to 10 days) or usual care found no difference in intensive care length of stay or noninvasive ventilation failure. This study used the oral route and smaller doses, and its open-label design might have introduced bias.
Lower-dose steroids better than high-dose. A 2014 cohort study of 17,239 patients admitted to the ICU with acute exacerbations of COPD evaluated outcomes of treatment with high methylprednisolone dosages (> 240 mg per day) vs lower dosages, using propensity score matching.42 No mortality difference was found between the groups. The lower dosage group (median methylprednisolone dose 100 mg per day) had shorter hospital and intensive care unit stays, shorter duration of noninvasive positive pressure ventilation, less need for insulin therapy, and fewer fungal infections.
Antibiotics for hospitalized patients
Only scarce data are available on the use of antibiotics for patients hospitalized with COPD exacerbation. In a study of patients hospitalized with COPD exacerbations, adding doxycycline to corticosteroids led to better clinical success and cure rates at 10 days compared with placebo, but the primary end point of clinical success at 30 days was not different between the two groups.43
BRONCHODILATORS: A MAINSTAY OF COPD TREATMENT
Bronchodilators are an important part of treatment of COPD exacerbations in inpatient and outpatient settings.
Nebulized beta-2 agonists are given every 1 to 4 hours. Albuterol at a 2.5-mg dose in each nebulization was found to be as effective as 5 mg for length of hospital stay and recovery of lung function in patients with an acute exacerbation of COPD.44
Adding an anticholinergic may help. Nebulized anticholinergics can be given alone or combined with beta-2 agonists. Whether long-acting bronchodilators should be used to manage COPD patients hospitalized with an exacerbation requires further inquiry. In an observational study with historical controls, Drescher and colleagues45 found cost savings and shorter hospital stays if tiotropium (a long-acting anticholinergic) was added to the respiratory care protocol, which also included formoterol (a long-acting beta-2 agonist).
OXYGEN: TITRATED APPROACH SAFER
Oxygen should be supplied during a COPD exacerbation to ensure adequate oxyhemoglobin saturation. Caution is needed to avoid hyperoxemic hypercapnia, particularly in patients with severe COPD and propensity to ventilatory failure. The routine administration of oxygen at high concentrations during a COPD exacerbation has been associated with a higher mortality rate than with a titrated oxygen approach.46 Long-term oxygen treatment started at discharge or as outpatient therapy is associated with reduced hospital admissions and shorter hospital stays for acute exacerbations of COPD.47
VENTILATION SUPPORT
Noninvasive positive-pressure ventilation is a useful adjunct to treatment of COPD exacerbations with evidence of ventilatory failure (ie, acute respiratory acidosis), helping to offset the work of breathing until respiratory system mechanics improve. Keenan et al48 reviewed 15 randomized controlled trials, involving 636 patients, of noninvasive positive-pressure ventilation in the setting of COPD exacerbation. They concluded that noninvasive positive-pressure ventilation reduced the in-hospital mortality rate and length of stay compared with standard therapy. Noninvasive positive-pressure ventilation is most useful in patients with severe COPD exacerbations and acute respiratory acidosis (pH < 7.35).49
Intubation and mechanical ventilation. Although no standards exist for determining which COPD exacerbations may be too severe for noninvasive positive-pressure ventilation, intubation is clearly indicated for impending respiratory failure or hemodynamic instability. Other factors to consider include the greater likelihood of noninvasive positive-pressure ventilation failure in patients with severe respiratory acidosis (pH < 7.25 is associated with a > 50% failure rate) and in those with no improvement in acidosis or respiratory rate during the first hour after initiation of noninvasive positive-pressure ventilation.50
PREVENTING EXACERBATIONS
Recent data indicate that COPD exacerbations can often be prevented (Table 2).
Inhaled pharmacotherapy
Inhaled pharmacotherapeutic agents, singly or in combination, reduce the frequency of COPD exacerbations.
Combined long-acting beta-2 agonist and corticosteroid is better than single-agent therapy. In 2007, the Towards a Revolution in COPD Health (TORCH) trial51 evaluated outpatient therapy in more than 6,000 patients worldwide with either an inhaled long-acting beta-2 agonist (salmeterol), an inhaled corticosteroid (fluticasone), both drugs in combination, or placebo. Patients had baseline prebronchodilator FEV1 of less than 60% and were followed for 3 years. No difference was found between the groups in the primary end point of deaths, but the annualized rate of moderate to severe exacerbations was reduced by 25% in the group that received combination therapy vs placebo. Combination therapy showed superior efficacy over individual drug therapy in preventing exacerbations. Treatment with the inhaled corticosteroid, whether alone or in combination with salmeterol, increased the risk of pneumonia.
A long-acting antimuscarinic agent is better than placebo. In 2008, the Understanding Potential Long-Term Impacts on Function With Tiotropium (UPLIFT) trial52 randomized nearly 6,000 patients with COPD and a postbronchodilator FEV1 of less than 70% to placebo or tiotropium, a long-acting antimuscarinic agent. Tiotropium reduced the exacerbation rate by 14% compared with placebo and improved quality of life.
Antimuscarinics may be better than beta-2 agonists. Head-to-head comparisons suggest that long-acting antimuscarinic agents are preferable to long-acting beta-2 agonists for preventing COPD exacerbations.53,54
Triple therapy: evidence is mixed. For patients with severe symptomatic COPD and frequent exacerbations, triple therapy with a combination of an inhaled long-acting antimuscarinic agent, an inhaled long-acting beta-2 agonist, and an inhaled corticosteroid has been suggested.
Data to support this practice are limited. In the Canadian Optimal Trial,55 the rate of exacerbations was not different between tiotropium alone, tiotropium plus salmeterol, and triple therapy. However, the rate of hospitalization for severe exacerbation was lower with triple therapy than tiotropium alone. A large, retrospective cohort study also supported triple therapy by finding reduced mortality, hospitalizations, and need for oral corticosteroid bursts compared to combination therapy with an inhaled long-acting beta-2 agonist and an inhaled corticosteroid.56
The drawback of triple therapy is an increased incidence of pneumonia associated with combined beta-2 agonist and corticosteroids, most likely due to the corticosteroid component.51 The risk appears to be higher for higher potency corticosteroids, eg, fluticasone.57
In 2014, the Withdrawal of Inhaled Steroids During Optimised Bronchodilator Management (WISDOM) trial58 randomized nearly 2,500 patients with a history of COPD exacerbation receiving triple therapy consisting of tiotropium, salmeterol, and inhaled fluticasone to either continue treatment or withdraw the corticosteroid for 3 months. The investigators defined an annualized exacerbation rate of 1.2 (ie, a 20% increase) as the upper limit of the confidence interval for an acceptable therapeutic margin of noninferiority. The study showed that the risk of moderate to severe exacerbations with combined tiotropium and salmeterol was noninferior to triple therapy.
Nevertheless, caution is advised when removing the corticosteroid component from triple therapy. The trial demonstrated a worsening in overall health status, some reduction in lung function, and a transient increase in severe exacerbations in the withdrawal group. Patients with increased symptom burden at baseline and a history of severe exacerbations may not be optimal candidates for this strategy.
Roflumilast is effective but has side effects
Roflumilast, an oral phosphodiesterase 4 inhibitor, is an anti-inflammatory drug without bronchodilator properties. In randomized controlled trials, the drug was associated with a 17% reduction in acute exacerbations compared with placebo.59
Adding roflumilast to either a long-acting beta-2 agonist or a long-acting antimuscarinic agent resulted in a 6% to 8% further reduction in the proportion of patients with exacerbation.60,61 Martinez et al61 found that roflumilast added to a regimen of a long-acting beta-2 agonist plus an inhaled corticosteroid reduced moderate to severe exacerbations by 14.2%, even in the presence of tiotropium. Compared with placebo, roflumilast treatment reduced exacerbations necessitating hospitalizations by 23.9%.
The FDA has approved oral roflumilast 500 µg once daily to prevent COPD exacerbations.
Roflumilast is frequently associated with side effects, including gastrointestinal symptoms (chiefly diarrhea), weight loss, and psychiatric effects. A benefit-to-harm study in 2014 concluded that using the drug is only favorable for patients who have a high risk of severe exacerbations, ie, those who have a greater than 22% baseline risk of having at least one exacerbation annually.62
Recommendation. Roflumilast should be reserved for patients who have severe COPD with a chronic bronchitis phenotype (ie, with cough and sputum production) and repeated exacerbations despite an optimal regimen of an inhaled corticosteroid, long-acting beta-2 agonist, and long-acting antimuscarinic agent.
Macrolide antibiotics: Role unclear
Macrolide antibiotics have anti-inflammatory and immunomodulatory activities.
Azithromycin: fewer exacerbations but some side effects. A multicenter trial63 in 1,142 COPD patients randomized to either oral azithromycin 250 mg daily or placebo found a 27% reduction in the risk of COPD exacerbation in the intervention arm. No differences were found between the groups in mortality, hospitalizations, emergency department visits, or respiratory failure. Hearing loss and increased macrolide resistance were noted in the intervention arm. In a secondary subgroup analysis,64 no difference in efficacy was found by sex, history of chronic bronchitis, oxygen use, or concomitant COPD treatment.
The COPD: Influence of Macrolides on Exacerbation Frequency in Patients trial65 helped refine patient selection for macrolide therapy. In this single-center study, 92 patients with COPD and at least three exacerbations during the year prior to enrollment were randomized to receive either azithromycin 500 mg three times weekly or placebo. Exacerbations in the intervention group were markedly reduced (42%) with no difference in hospitalization rate.
The place of macrolide antibiotics in the treatment strategy of COPD is unclear, and they are not currently part of the GOLD guidelines. Still unknown is the incremental benefit of adding them to existing preventive regimens, cardiovascular safety, side effects, and potential effects on the resident microbial flora.
Other antibiotics have also been investigated for efficacy in preventing exacerbations.
Moxifloxacin: fewer exacerbations. The Pulsed Moxifloxacin Usage and Its Long-term Impact on the Reduction of Subsequent Exacerbations study66 randomized more than 1,000 patients with stable COPD to receive either moxifloxacin 400 mg or placebo daily for 5 days repeated every 8 weeks for six courses. Frequent assessment during the treatment period and for 6 months afterward revealed a reduced exacerbation rate in the intervention group but without benefit in hospitalization rate, mortality, lung function, or health status.
Recommendation. Azithromycin (either 250 mg daily or 500 mg three times weekly) can be considered for patients who have repeated COPD exacerbations despite an optimal regimen of an inhaled corticosteroid, inhaled long-acting beta-2 agonist, and inhaled long-acting antimuscarinic agent. The need to continue azithromycin should be reassessed yearly.
Mucolytics
Greatest benefit to patients not taking inhaled corticosteroids. Mucolytic agents help clear airway secretions by reducing viscosity. N-acetylcysteine and carbocysteine (not available in the United States) also have antioxidant properties that may counteract oxidant stress associated with acute COPD exacerbations.
The Bronchitis Randomized on NAC Cost-Utility Study (BRONCUS)67 randomized 523 COPD patients to N-acetylcysteine 600 mg daily or placebo. After 3 years of follow-up, no differences were found in the rate of exacerbations, lung function decline, and quality of life. Subgroup analysis suggested a reduction in exacerbations for patients who were not taking inhaled corticosteroids.
The Effect of Carbocisteine on Acute Exacerbation of Chronic Obstructive Pulmonary Disease (PEACE) study randomized more than 700 patients from multiple centers in China who had COPD and a recent history of exacerbations; they found a 25% lower exacerbation rate over 1 year with carbocysteine vs placebo.68 Most of the patients (83%) were not on inhaled corticosteroids, which complemented findings of the BRONCUS trial.
The Effect of High Dose N-acetylcysteine on Air Trapping and Airway Resistance of COPD (HIACE) study randomized 120 patients with stable COPD in a hospital in Hong Kong to either oral N-acetylcysteine (600 mg twice daily) or placebo and found a reduced exacerbation rate of exacerbations. Patients were matched at baseline for inhaled corticosteroid use.69
In 2014, the Twice Daily N-acetylcysteine 600 mg for Exacerbations of Chronic Obstructive Pulmonary Disease (PANTHEON) study70 randomized 1,006 patients from multiple hospitals in China with a history of moderate to severe COPD and exacerbations to receive either N-acetylcysteine 600 mg twice daily or placebo for 1 year. They found a 22% reduction in exacerbations in the treatment group vs placebo.
GOLD guidelines2 recommend mucolytics for patients with severe COPD and exacerbations when inhaled corticosteroids are not available or affordable.
Recommendation. Mucolytics may be useful for patients with difficulty expectorating and with a history of exacerbations despite appropriate inhaled therapy.
OTHER INTERVENTIONS CAN HELP
Pulmonary rehabilitation provides multiple benefits
Pulmonary rehabilitation increases exercise tolerance and reduces symptom burden in patients with stable COPD. It is also a multidisciplinary effort that may help reinforce adherence to medications, enhance COPD education, and provide closer medical surveillance to patients at high risk for recurrent exacerbations.
A small randomized controlled trial71 prescribed pulmonary rehabilitation on discharge for a COPD exacerbation and found sustainable improvements in exercise capacity and health status after 3 months.
In a later study,72 the same group started pulmonary rehabilitation within a week of hospital discharge and found reduced hospital readmissions over a 3-month period.
Smoking cessation is always worth advocating
A large observational cohort study concluded that current smokers were at a higher risk for COPD exacerbations compared with former smokers.73 Although there are no randomized controlled trials that assess the effects of smoking cessation at the time of COPD exacerbation, we recommend seizing the opportunity to implement this important intervention.
Vaccinations: Influenza and pneumococcal
Influenza vaccination is associated with reduced incidence of hospitalization among patients with cardiopulmonary disease.74 A meta-analysis of randomized clinical trials of influenza vaccination for patients with COPD75 reported significantly fewer exacerbations from vaccination, mostly owing to fewer episodes occurring after 3 to 4 weeks, coinciding with anticipated vaccine-induced immune protection. Furumoto and colleagues76 reported an added benefit of combined vaccination with 23-valent pneumococcal polysaccharide vaccine and influenza vaccine in reducing hospital admissions over influenza vaccination alone. We also recommend providing the 13-valent pneumococcal conjugate vaccine to patients with COPD, particularly for those older than 65, consistent with CDC recommendations.77
- Hatipoglu U, Aboussouan LS. Chronic obstructive pulmonary disease: an update for the primary physician. Cleve Clin J Med 2014; 81:373–383.
- Global initiative for chronic obstructive lung disease. Pocket Guide to COPD Diagnosis, Management, and Prevention. A Guide for Health Care Professionals. Updated 2016. http://www.goldcopd.org/uploads/users/files/WatermarkedPocket%20Guide%202016(2).pdf. Accessed March 7, 2016.
- Gupta N, Pinto LM, Morogan A, Bourbeau J. The COPD assessment test: a systematic review. Eur Respir J 2014; 44:873–884.
- Leidy NK, Wilcox TK, Jones PW, et al; EXACT-PRO Study Group. Development of the EXAcerbations of chronic obstructive pulmonary disease tool (EXACT): a patient-reported outcome (PRO) measure. Value Health 2010; 13:965–975.
- Anthonisen NR, Manfreda J, Warren CP, Hershfield ES, Harding GK, Nelson NA. Antibiotic therapy in exacerbations of chronic obstructive pulmonary disease. Ann Intern Med 1987; 106:196–204.
- Tillie-Leblond I, Marquette CH, Perez T, et al. Pulmonary embolism in patients with unexplained exacerbation of chronic obstructive pulmonary disease: prevalence and risk factors. Ann Intern Med 2006; 144:390–396.
- Ford ES, Murphy LB, Khavjou O, Giles WH, Holt JB, Croft JB. Total and state-specific medical and absenteeism costs of COPD among adults aged ≥ 18 years in the United States for 2010 and projections through 2020. Chest 2015; 147:31–45.
- Toy EL, Gallagher KF, Stanley EL, Swensen AR, Duh MS. The economic impact of exacerbations of chronic obstructive pulmonary disease and exacerbation definition: a review. COPD 2010; 7:214–228.
- Pasquale MK, Sun SX, Song F, Hartnett HJ, Stemkowski SA. Impact of exacerbations on health care cost and resource utilization in chronic obstructive pulmonary disease patients with chronic bronchitis from a predominantly Medicare population. Int J Chron Obstruct Pulmon Dis 2012; 7:757–764.
- Donaldson GC, Seemungal TA, Bhowmik A, Wedzicha JA. Relationship between exacerbation frequency and lung function decline in chronic obstructive pulmonary disease. Thorax 2002; 57:847–852.
- Seemungal TA, Donaldson GC, Paul EA, Bestall JC, Jeffries DJ, Wedzicha JA. Effect of exacerbation on quality of life in patients with chronic obstructive pulmonary disease. Am J Respir Crit Care Med 1998; 157:1418–1422.
- Seemungal TA, Donaldson GC, Bhowmik A, Jeffries DJ, Wedzicha JA. Time course and recovery of exacerbations in patients with chronic obstructive pulmonary disease. Am J Respir Crit Care Med 2000; 161:1608–1613.
- Spencer S, Calverley PM, Sherwood Burge P, Jones PW; ISOLDE Study Group, Inhaled Steroids in Obstructive Lung Disease. Health status deterioration in patients with chronic obstructive pulmonary disease. Am J Respir Crit Care Med 2001; 163:122–128.
- Soler-Cataluña JJ, Martínez-García MA, Román Sánchez P, Salcedo E, Navarro M, Ochando R. Severe acute exacerbations and mortality in patients with chronic obstructive pulmonary disease. Thorax 2005; 60:925–931.
- Brusselle G. Why doesn’t reducing exacerbations decrease COPD mortality? Lancet Respir Med 2014; 2:681–683.
- Sethi S, Murphy TF. Infection in the pathogenesis and course of chronic obstructive pulmonary disease. N Engl J Med 2008; 359:2355–2365.
- White AJ, Gompertz S, Bayley DL, et al. Resolution of bronchial inflammation is related to bacterial eradication following treatment of exacerbations of chronic bronchitis. Thorax 2003; 58:680–685.
- Desai H, Eschberger K, Wrona C, et al. Bacterial colonization increases daily symptoms in patients with chronic obstructive pulmonary disease. Ann Am Thorac Soc 2014; 11:303–309.
- Bafadhel M, McKenna S, Terry S, et al. Acute exacerbations of chronic obstructive pulmonary disease: identification of biologic clusters and their biomarkers. Am J Respir Crit Care Med 2011; 184:662–671.
- Jamieson DB, Matsui EC, Belli A, et al. Effects of allergic phenotype on respiratory symptoms and exacerbations in patients with chronic obstructive pulmonary disease. Am J Respir Crit Care Med 2013; 188:187–192.
- Gibson PG, Simpson JL. The overlap syndrome of asthma and COPD: what are its features and how important is it? Thorax 2009; 64:728–735.
- Thomsen M, Ingebrigtsen TS, Marott JL, et al. Inflammatory biomarkers and exacerbations in chronic obstructive pulmonary disease. JAMA 2013; 309:2353–2361.
- Hurst JR, Vestbo J, Anzueto A, et al; Evaluation of COPD Longitudinally to Identify Predictive Surrogate Endpoints (ECLIPSE) Investigators. Susceptibility to exacerbation in chronic obstructive pulmonary disease. N Engl J Med 2010; 363:1128–1138.
- Donaldson GC, Hurst JR, Smith CJ, Hubbard RB, Wedzicha JA. Increased risk of myocardial infarction and stroke following exacerbation of COPD. Chest 2010; 137:1091–1097.
- Chang CL, Robinson SC, Mills GD, et al. Biochemical markers of cardiac dysfunction predict mortality in acute exacerbations of COPD. Thorax 2011; 66:764–768.
- Patel AR, Kowlessar BS, Donaldson GC, et al. Cardiovascular risk, myocardial injury, and exacerbations of chronic obstructive pulmonary disease. Am J Respir Crit Care Med 2013; 188:1091–1099.
- Dransfield MT, Rowe SM, Johnson JE, Bailey WC, Gerald LB. Use of beta blockers and the risk of death in hospitalised patients with acute exacerbations of COPD. Thorax 2008; 63:301–305.
- Thompson WH, Nielson CP, Carvalho P, Charan NB, Crowley JJ. Controlled trial of oral prednisone in outpatients with acute COPD exacerbation. Am J Respir Crit Care Med 1996; 154:407–412.
- Aaron SD, Vandemheen KL, Hebert P, et al. Outpatient oral prednisone after emergency treatment of chronic obstructive pulmonary disease. N Engl J Med 2003; 348:2618–2625.
- Walters JA, Gibson PG, Wood-Baker R, Hannay M, Walters EH. Systemic corticosteroids for acute exacerbations of chronic obstructive pulmonary disease. Cochrane Database Syst Rev 2009; 1:CD001288.
- Bafadhel M, McKenna S, Terry S, et al. Blood eosinophils to direct corticosteroid treatment of exacerbations of chronic obstructive pulmonary disease: a randomized placebo-controlled trial. Am J Respir Crit Care Med 2012; 186:48–55.
- Siva R, Green RH, Brightling CE, et al. Eosinophilic airway inflammation and exacerbations of COPD: a randomised controlled trial. Eur Respir J 2007; 29:906–913.
- Wilson R, Allegra L, Huchon G, et al; MOSAIC Study Group. Short-term and long-term outcomes of moxifloxacin compared to standard antibiotic treatment in acute exacerbations of chronic bronchitis. Chest 2004; 125:953–964.
- Wilson R, Anzueto A, Miravitlles M, et al. Moxifloxacin versus amoxicillin/clavulanic acid in outpatient acute exacerbations of COPD: MAESTRAL results. Eur Respir J 2012; 40:17–27.
- Llor C, Moragas A, Hernandez S, Bayona C, Miravitlles M. Efficacy of antibiotic therapy for acute exacerbations of mild to moderate chronic obstructive pulmonary disease. Am J Respir Crit Care Med 2012; 186:716–723.
- Anzueto A. Primary care management of chronic obstructive pulmonary disease to reduce exacerbations and their consequences. Am J Med Sci 2010; 340:309–318.
- Niewoehner DE, Erbland ML, Deupree RH, et al. Effect of systemic glucocorticoids on exacerbations of chronic obstructive pulmonary disease. Department of Veterans Affairs Cooperative Study Group. N Engl J Med 1999; 340:1941–1947.
- de Jong YP, Uil SM, Grotjohan HP, Postma DS, Kerstjens HA, van den Berg JW. Oral or IV prednisolone in the treatment of COPD exacerbations: a randomized, controlled, double-blind study. Chest 2007; 132:1741–1747.
- Leuppi JD, Schuetz P, Bingisser R, et al. Short-term vs conventional glucocorticoid therapy in acute exacerbations of chronic obstructive pulmonary disease: the REDUCE randomized clinical trial. JAMA 2013; 309:2223–2231.
- Alia I, de la Cal MA, Esteban A, et al. Efficacy of corticosteroid therapy in patients with an acute exacerbation of chronic obstructive pulmonary disease receiving ventilatory support. Arch Intern Med 2011; 171:1939–1946.
- Abroug F, Ouanes-Besbes L, Fkih-Hassen M, et al. Prednisone in COPD exacerbation requiring ventilatory support: an open-label randomised evaluation. Eur Respir J 2014; 43:717–724.
- Kiser TH, Allen RR, Valuck RJ, Moss M, Vandivier RW. Outcomes associated with corticosteroid dosage in critically ill patients with acute exacerbations of chronic obstructive pulmonary disease. Am J Respir Crit Care Med 2014; 189:1052–1064.
- Daniels JM, Snijders D, de Graaff CS, Vlaspolder F, Jansen HM, Boersma WG. Antibiotics in addition to systemic corticosteroids for acute exacerbations of chronic obstructive pulmonary disease. Am J Respir Crit Care Med 2010; 181:150–157.
- Nair S, Thomas E, Pearson SB, Henry MT. A randomized controlled trial to assess the optimal dose and effect of nebulized albuterol in acute exacerbations of COPD. Chest 2005; 128:48–54.
- Drescher GS, Carnathan BJ, Imus S, Colice GL. Incorporating tiotropium into a respiratory therapist-directed bronchodilator protocol for managing in-patients with COPD exacerbations decreases bronchodilator costs. Respir Care 2008; 53:1678–1684.
- Austin MA, Wills KE, Blizzard L, Walters EH, Wood-Baker R. Effect of high flow oxygen on mortality in chronic obstructive pulmonary disease patients in prehospital setting: randomised controlled trial. BMJ 2010; 341:c5462.
- Ringbaek TJ, Viskum K, Lange P. Does long-term oxygen therapy reduce hospitalisation in hypoxaemic chronic obstructive pulmonary disease? Eur Respir J 2002; 20:38–42.
- Keenan SP, Sinuff T, Cook DJ, Hill NS. Which patients with acute exacerbation of chronic obstructive pulmonary disease benefit from noninvasive positive-pressure ventilation? A systematic review of the literature. Ann Intern Med 2003; 138:861–870.
- Quon BS, Gan WQ, Sin DD. Contemporary management of acute exacerbations of COPD: a systematic review and metaanalysis. Chest 2008; 133:756–766.
- Sinuff T, Keenan SP; Department of Medicine, McMaster University. Clinical practice guideline for the use of noninvasive positive pressure ventilation in COPD patients with acute respiratory failure. J Crit Care 2004; 19:82–91.
- Calverley PM, Anderson JA, Celli B, et al. Salmeterol and fluticasone propionate and survival in chronic obstructive pulmonary disease. N Engl J Med 2007; 356:775–789.
- Tashkin DP, Celli B, Senn S, et al; UPLIFT Study Investigators. A 4-year trial of tiotropium in chronic obstructive pulmonary disease. N Engl J Med 2008; 359:1543–1554.
- Vogelmeier C, Hederer B, Glaab T, et al; POET-COPD Investigators. Tiotropium versus salmeterol for the prevention of exacerbations of COPD. N Engl J Med 2011; 364:1093–1103.
- Decramer ML, Chapman KR, Dahl R, et al; INVIGORATE investigators. Once-daily indacaterol versus tiotropium for patients with severe chronic obstructive pulmonary disease (INVIGORATE): a randomised, blinded, parallel-group study. Lancet Respir Med 2013; 1:524–533.
- Aaron SD, Vandemheen KL, Fergusson D, et al; Canadian Thoracic Society/Canadian Respiratory Clinical Research Consortium. Tiotropium in combination with placebo, salmeterol, or fluticasone-salmeterol for treatment of chronic obstructive pulmonary disease: a randomized trial. Ann Intern Med 2007; 146:545–555.
- Short PM, Williamson PA, Elder DH, Lipworth SI, Schembri S, Lipworth BJ. The impact of tiotropium on mortality and exacerbations when added to inhaled corticosteroids and long-acting beta-agonist therapy in COPD. Chest 2012; 141:81–86.
- Suissa S, Patenaude V, Lapi F, Ernst P. Inhaled corticosteroids in COPD and the risk of serious pneumonia. Thorax 2013; 68:1029–1036.
- Magnussen H, Disse B, Rodriguez-Roisin R, et al; WISDOM Investigators. Withdrawal of inhaled glucocorticoids and exacerbations of COPD. N Engl J Med 2014; 371:1285–1294.
- Calverley PM, Rabe KF, Goehring UM, Kristiansen S, Fabbri LM, Martinez FJ; M2-124 and M2-125 study groups. Roflumilast in symptomatic chronic obstructive pulmonary disease: two randomised clinical trials. Lancet 2009; 374:685–694.
- Fabbri LM, Calverley PM, Izquierdo-Alonso JL, et al; M2-127 and M2-128 study groups. Roflumilast in moderate-to-severe chronic obstructive pulmonary disease treated with longacting bronchodilators: two randomised clinical trials. Lancet 2009; 374:695–703.
- Martinez FJ, Calverley PM, Goehring UM, Brose M, Fabbri LM, Rabe KF. Effect of roflumilast on exacerbations in patients with severe chronic obstructive pulmonary disease uncontrolled by combination therapy (REACT): a multicentre randomised controlled trial. Lancet 2015; 385:857–866.
- Yu T, Fain K, Boyd CM, et al. Benefits and harms of roflumilast in moderate to severe COPD. Thorax 2014; 69:616–622.
- Albert RK, Connett J, Bailey WC, et al; COPD Clinical Research Network. Azithromycin for prevention of exacerbations of COPD. N Engl J Med 2011; 365:689–698.
- Han MK, Tayob N, Murray S, et al. Predictors of chronic obstructive pulmonary disease exacerbation reduction in response to daily azithromycin therapy. Am J Respir Crit Care Med 2014; 189:1503–1508.
- Uzun S, Djamin RS, Kluytmans JA, et al. Azithromycin maintenance treatment in patients with frequent exacerbations of chronic obstructive pulmonary disease (COLUMBUS): a randomised, double-blind, placebo-controlled trial. Lancet Respir Med 2014; 2:361–368.
- Sethi S, Jones PW, Theron MS, et al; PULSE Study group. Pulsed moxifloxacin for the prevention of exacerbations of chronic obstructive pulmonary disease: a randomized controlled trial. Respir Res 2010; 11:10.
- Decramer M, Rutten-van Molken M, Dekhuijzen PN, et al. Effects of N-acetylcysteine on outcomes in chronic obstructive pulmonary disease (Bronchitis Randomized On NAC Cost-Utility Study, BRONCUS): a randomised placebo-controlled trial. Lancet 2005; 365:1552–1560.
- Zheng JP, Kang J, Huang SG, et al. Effect of carbocisteine on acute exacerbation of chronic obstructive pulmonary disease (PEACE study): a randomised placebo-controlled study. Lancet 2008; 371:2013–2018.
- Tse HN, Raiteri L, Wong KY, et al. High-dose N-acetylcysteine in stable COPD: the 1-year, double-blind, randomized, placebo-controlled HIACE study. Chest 2013; 144:106–118.
- Zheng JP, Wen FQ, Bai CX, et al; PANTHEON study group. Twice daily N-acetylcysteine 600 mg for exacerbations of chronic obstructive pulmonary disease (PANTHEON): a randomised, double-blind placebo-controlled trial. Lancet Respir Med 2014; 2:187–194.
- Man WD, Polkey MI, Donaldson N, Gray BJ, Moxham J. Community pulmonary rehabilitation after hospitalisation for acute exacerbations of chronic obstructive pulmonary disease: randomised controlled study. BMJ 2004; 329:1209.
- Seymour JM, Moore L, Jolley CJ, et al. Outpatient pulmonary rehabilitation following acute exacerbations of COPD. Thorax 2010; 65:423–428.
- Au DH, Bryson CL, Chien JW, et al. The effects of smoking cessation on the risk of chronic obstructive pulmonary disease exacerbations. J Gen Intern Med 2009; 24:457–463.
- Seo YB, Hong KW, Kim IS, et al. Effectiveness of the influenza vaccine at preventing hospitalization due to acute lower respiratory infection and exacerbation of chronic cardiopulmonary disease in Korea during 2010-2011. Vaccine 2013; 31:1426–1430.
- Poole PJ, Chacko E, Wood-Baker RW, Cates CJ. Influenza vaccine for patients with chronic obstructive pulmonary disease. Cochrane Database Syst Rev 2006; 1:CD002733.
- Furumoto A, Ohkusa Y, Chen M, et al. Additive effect of pneumococcal vaccine and influenza vaccine on acute exacerbation in patients with chronic lung disease. Vaccine 2008; 26:4284–4289.
- Tomczyk S, Bennett NM, Stoecker C, et al; Centers for Disease Control and Prevention (CDC). Use of 13-valent pneumococcal conjugate vaccine and 23-valent pneumococcal polysaccharide vaccine among adults aged ≥65 years: recommendations of the Advisory Committee on Immunization Practices (ACIP). MMWR Morb Mortal Wkly Rep 2014; 63:822–825.
KEY POINTS
- COPD exacerbations usually start with an infection.
- A short course of corticosteroids (eg, prednisone 40 mg daily for 5 to 7 days) improves outcomes with low risk.
- The choice of antibiotic depends on severity and frequency of exacerbations and the patient’s age and condition.
- Inhaled albuterol 2.5 mg, every 1 to 4 hours, should be prescribed with or without a nebulized anticholinergic.
- Ventilation support is important for patients with acute respiratory acidosis (pH < 7.35).
- Exacerbations can be prevented with some combination of inhaled agents (long-acting beta-2 agonist, corticosteroid, long-acting antimuscarinic), roflumilast (an oral phosphodiesterase inhibitor), and a mucolytic, depending on the patient’s needs.

Managing diabetes in hospitalized patients with chronic kidney disease
Managing glycemic control in hospitalized patients with chronic kidney disease (CKD) and diabetes mellitus is a challenge, with no published guidelines. In this setting, avoiding hypoglycemia takes precedence over meeting strict blood glucose targets. Optimal management is essential to reduce hypoglycemia and the risk of death from cardiovascular disease.1
This article reviews the evidence to guide diabetes management in hospitalized patients with CKD, focusing on blood glucose monitoring, insulin dosing, and concerns about other diabetic agents.
FOCUS ON AVOIDING HYPOGLYCEMIA
CKD is common, estimated to affect more than 50 million people worldwide.2 Diabetes mellitus is the primary cause of kidney failure in 45% of dialysis patients with CKD.
Tight control comes with a cost
Hyperglycemia in hospitalized patients is associated with a higher risk of death, a higher risk of infections, and a longer hospital stay.3,4 In 2001, Van den Berghe et al5 found that intensive insulin therapy reduced the mortality rate in critically ill patients in the surgical intensive care unit. But subsequent studies6,7 found that intensive insulin therapy to achieve tight glycemic control increased rates of morbidity and mortality without adding clinical benefit.
Randomized clinical trials in outpatients have shown that tight control of blood glucose levels reduces microvascular and macrovascular complications in patients with type 1 diabetes.8–10 In the Diabetes Control and Complications Trial,9 compared with conventional therapy, intensive insulin therapy reduced the incidence of retinopathy progression (4.7 vs 1.2 cases per 100 patient-years, number needed to treat [NNT] = 3 for 10 years) and clinical neuropathy (9.8 vs 3.1 per 100 patient-years, NNT = 1.5 for 10 years). The long-term likelihood of a cardiovascular event was also significantly lower in the intensive treatment group (0.38 vs 0.80 events per 100 patient-years).9
Similarly, in the Epidemiology of Diabetes Interventions and Complications follow-up study, the intensive therapy group had fewer cardiovascular deaths.11 On the other hand, the risk of severe hypoglycemia and subsequent coma or seizure was significantly higher in the intensive therapy group than in the conventional therapy group (16.3 vs 5.4 per 100 patient-years).8
CKD increases hypoglycemia risk

Moen et al12 found that the incidence of hypoglycemia was significantly higher in patients with CKD (estimated glomerular filtration rate [GFR] < 60 mL/min) with or without diabetes, and that patients with both conditions were at greatest risk (Figure 1). Multiple factors contribute to the increased risk of hypoglycemia: patients with advanced CKD tend to have poor nutrition, resulting in reduced glycogen stores, and a smaller renal mass reduces renal gluconeogenesis and decreases the elimination of insulin and oral antidiabetic agents.
After the onset of diabetic nephropathy, progression of renal complications and overall life expectancy are influenced by earlier glycemic control.8 Development of diabetic nephropathy is commonly accompanied by changes in metabolic control, particularly an increased risk of hypoglycemia.13 In addition, episodes of severe hypoglycemia constitute an independent cardiovascular risk factor.14
Aggressive glycemic control in hospitalized patients, particularly those with advanced CKD, is associated with a risk of hypoglycemia without overall improvement in outcomes.15 Elderly patients with type 2 diabetes are similar to patients with CKD in that they have a reduced GFR and are thus more sensitive to insulin. In both groups, intensifying glycemic control, especially in the hospital, is associated with more frequent episodes of severe hypoglycemia.16 The focus should be not only on maintaining optimal blood glucose concentration, but also on preventing hypoglycemia.
‘Burnt-out’ diabetes
Paradoxically, patients with end-stage renal disease and type 2 diabetes often experience altered glucose homeostasis with markedly improved glycemic control. They may attain normoglycemia and normalization of hemoglobin A1c, a condition known as “burnt-out” diabetes. Its precise mechanism is not understood and its significance remains unclear (Table 1).17
HEMOGLOBIN A1c CAN BE FALSELY HIGH OR FALSELY LOW
Hemoglobin A1c measurement is used to diagnose diabetes and to assess long-term glycemic control. It is a measure of the fraction of hemoglobin that has been glycated by exposure to glucose. Because the average lifespan of a red cell is 120 days, the hemoglobin A1c value reflects the mean blood glucose concentration over the preceding 3 months.
But hemoglobin A1c measurement has limitations: any condition that alters the lifespan of erythrocytes leads to higher or lower hemoglobin A1c levels. Hemoglobin A1c levels are also affected by kidney dysfunction, hemolysis, and acidosis.18
Falsely high hemoglobin A1c levels are associated with conditions that prolong the lifespan of erythrocytes, such as asplenia. Iron deficiency also increases the average age of circulating red cells because of reduced red cell production. For patients in whom blood glucose measurements do not correlate with hemoglobin A1c measurements, iron deficiency anemia should be considered before altering a treatment regimen.
Falsely low hemoglobin A1c levels are associated with conditions of more rapid erythrocyte turnover, such as autoimmune hemolytic anemia, hereditary spherocytosis, and acute blood loss anemia. In patients with CKD, recombinant erythropoietin treatment lowers hemoglobin A1c levels by increasing the number of immature red cells, which are less likely to glycosylate.19
Morgan et al20 compared the association between hemoglobin A1c and blood glucose levels in diabetic patients with moderate to severe CKD not requiring dialysis and in diabetic patients with normal renal function and found no difference between these two groups, suggesting that hemoglobin A1c is reliable in this setting. But study results conflict for patients on dialysis, making the usefulness of hemoglobin A1c testing for those patients less clear. In one study, hemoglobin A1c testing underestimated glycemic control,20 but other studies found that glycemic control was overestimated.21,22
Alternatives to hemoglobin A1c
Other measures of long-term glycemic control such as fructosamine and glycated albumin levels are sometimes used in conditions in which hemoglobin A1c may not be reliable.
Albumin also undergoes glycation when exposed to glucose. Glycated albumin appears to be a better measure of glycemic control in patients with CKD and diabetes than serum fructosamine,23 which has failed to show a significant correlation with blood glucose levels in patients with CKD.24 However, because serum albumin has a short half-life, glycated albumin reflects glycemic control in only the approximately 1 to 2 weeks before sampling,25 so monthly monitoring is required.
Glycated albumin levels may be reduced due to increased albumin turnover in patients with nephrotic-range proteinuria and in diabetic patients on peritoneal dialysis. Several issues remain unclear, such as the appropriate target level of glycated albumin and at what stage of CKD it should replace hemoglobin A1c testing. If an improved assay that is unaffected by changes in serum albumin becomes available, it may be appropriate to use glycated albumin measurements to assess long-term glycemic control for patients with CKD.
In general, therapeutic decisions to achieve optimum glycemic control in patients with diabetes and CKD should be based on hemoglobin A1c testing, multiple glucose measurements, and patient symptoms of hypoglycemia or hyperglycemia. The best measure for assessing glycemic control in hospitalized patients with CKD remains multiple blood glucose testing daily.
INSULIN THERAPY PREFERRED
Although several studies have evaluated inpatient glycemic control,26–29 no guidelines have been published for hospitalized patients with diabetes and CKD. Insulin therapy is preferred for achieving glycemic control in acutely ill or hospitalized patients with diabetes. Oral hypoglycemic agents should be discontinued.
Regardless of the form of insulin chosen to treat diabetes, caution is needed for patients with kidney disease. During hospitalization, clinical changes are expected owing to illness and differences in caloric intake and physical activity, resulting in altered insulin sensitivity. Insulin-treated hospitalized patients require individualized care, including multiple daily blood glucose tests and insulin therapy modifications for ideal glycemic control.
For surgical or medical intensive care patients on insulin therapy, the target blood glucose level before meals should be 140 mg/dL, and the target random level should be less than 180 mg/dL.15,26–29
Basal-bolus insulin
Sliding-scale therapy should be avoided as the only method for glycemic control. Instead, scheduled subcutaneous basal insulin once or twice daily combined with rapid- or short-acting insulin with meals is recommended.
Basal-bolus insulin therapy, one of the most advanced and flexible insulin replacement therapies, mimics endogenous insulin release and offers great advantages in diabetes care. Using mealtime bolus insulin permits variation in the amount of food eaten; more insulin can be taken with a larger meal and less with smaller meals. A bolus approach offers the flexibility of administering rapid-acting insulin immediately after meals when oral intake is variable.
Individualize insulin therapy
Optimizing glycemic control requires an understanding of the altered pharmacokinetics and pharmacodynamics of insulin in patients with diabetic nephropathy. Table 2 shows the pharmacokinetic profiles of insulin preparations in healthy people. Analogue insulins, which are manufactured by recombinant DNA technology, have conformational changes in the insulin molecule that alter their pharmacokinetics and pharmacodynamics. The rapid-acting analogue insulins are absorbed quickly, making them suitable for postprandial glucose control.
Changes in GFR are associated with altered pharmacokinetics and pharmacodynamics of insulin,30,31 but unlike for oral antidiabetic agents, these properties are not well characterized for insulin preparations in patients with renal insufficiency.13,32–36
CKD may reduce insulin clearance. Rave et al32 reported that the clearance of regular human insulin was reduced by 30% to 40% in patients with type 1 diabetes and a mean estimated GFR of 54 mL/min. They found that the metabolic activity of insulin lispro was more robust than that of short-acting regular human insulin in patients with diabetic nephropathy. In another study, patients with diabetes treated with insulin aspart did not show any significant change in the required insulin dosage in relation to the renal filtration rate.34 Biesenbach et al33 found a 38% reduction in insulin requirements in patients with type 1 diabetes as estimated GFR decreased from 80 mL/min to 10 mL/min. Further studies are required to better understand the safety of insulin in treating hospitalized patients with diabetes and renal insufficiency.
Few studies have compared the pharmacodynamics of long-acting insulins in relation to declining renal function. The long-acting analogue insulins have less of a peak than human insulin and thus better mimic endogenous insulin secretion. For insulin detemir, Lindholm and Jacobsen found no significant differences in the pharmacokinetics related to the stages of CKD.35 When using the long-acting insulins glargine or detemir, one should consider giving much lower doses (half the initial starting dosage) and titrating the dosage until target fasting glucose concentrations are reached to prevent hypoglycemia.
Table 3 summarizes recommended insulin dosage adjustments in CKD based on the literature and our clinical experience.
Considerations for dialysis patients
Subcutaneously administered insulin is eliminated renally, unlike endogenous insulin, which undergoes first-pass metabolism in the liver.13,37 As renal function declines, insulin clearance decreases and the insulin dosage must be reduced to prevent hypoglycemia.
Patients on hemodialysis or peritoneal dialysis pose a challenge for insulin dosing. Hemodialysis improves insulin sensitivity but also increases insulin clearance, making it difficult to determine insulin requirements. Sobngwi et al38 conducted a study in diabetic patients with end-stage renal disease on hemodialysis, using a 24-hour euglycemic clamp. They found that exogenous basal insulin requirements were 25% lower on the day after hemodialysis compared with the day before, but premeal insulin requirements stayed the same.
Peritoneal dialysis exposes patients to a high glucose load via the peritoneum, which can worsen insulin resistance. Intraperitoneal administration of insulin during peritoneal dialysis provides a more physiologic effect than subcutaneous administration: it prevents fluctuations of blood glucose and the formation of insulin antibodies. But insulin requirements are higher owing to a dilutional effect and to insulin binding to the plastic surface of the dialysis fluid reservoir.39
GLYCEMIC CONTROL FOR PROCEDURES
No guidelines have been established regarding the optimal blood glucose range for diabetic patients with CKD undergoing diagnostic or surgical procedures. Given the risk of hypoglycemia in such settings, less-stringent targets are reasonable, ie, premeal blood glucose levels of 140 mg/dL and random blood glucose levels of less than 180 mg/dL.
Before surgery, consideration should be given to the type of diabetes, surgical procedure, and metabolic control. Patients on insulin detemir or glargine as part of a basal-bolus regimen with rapid-acting insulin may safely be given the full dose of their basal insulin the night before or the morning of their procedure. However, patients on neutral protamine Hagedorn (NPH) insulin as a part of their basal-bolus regimen should receive half of their usual dose due to a difference in pharmacokinetic profile compared with insulin glargine or detemir.
In insulin-treated patients undergoing prolonged procedures (eg, coronary artery bypass grafting, transplant):
- Discontinue subcutaneous insulin and start an intravenous insulin infusion, titrated to maintain a blood glucose range of 140 to 180 mg/dL
- Subcutaneous insulin management may be acceptable for patients undergoing shorter outpatient procedures
- Supplemental subcutaneous doses of short- or rapid-acting insulin preparations can be given for blood glucose elevation greater than 180 mg/dL.
AVOID ORAL AGENTS AND NONINSULIN INJECTABLES
Oral antidiabetic agents and noninsulin injectables (Table 4) should generally be avoided in hospitalized patients, especially for those with decompensated heart failure, renal insufficiency, hypoperfusion, or chronic pulmonary disease, or for those given intravenous contrast. Most oral medications used to treat diabetes are affected by reduced kidney function, resulting in prolonged drug exposure and increased risk of hypoglycemia in patients with moderate to severe CKD (stages 3–5).
Metformin, a biguanide, is contraindicated in patients with high serum creatinine levels (> 1.5 mg/dL in men, > 1.4 mg/dL in women) because of the theoretical risk of lactic acidosis.40
Sulfonylurea clearance depends on kidney function.41 Severe prolonged episodes of hypoglycemia have been reported in dialysis patients taking these drugs, except with glipizide, which carries a lower risk.41,42
Repaglinide, a nonsulfonylurea insulin secretagogue, can be used in CKD stages 3 to 4 without any dosage adjustment.43
Thiazolidinediones have been reported to slow the progression of diabetic kidney disease independent of glycemic control.44 Adverse effects include fluid retention, edema, and congestive heart failure. Thiazolidinediones should not be used in patients with New York Heart Association class 3 or 4 heart failure,45 and so should not be prescribed in the hospital except for patients who are clinically stable or ready for discharge.
Quick-release bromocriptine, a dopamine receptor agonist, has been shown to be effective in lowering fasting plasma glucose levels and hemoglobin A1c, and improving glucose tolerance in obese patients with type 2 diabetes, although its usefulness in hospitalized patients with diabetes is not known.46,47
Dipeptidyl peptidase inhibitors. Sitagliptin and saxagliptin have been shown to be safe and effective in hospitalized patients with type 2 diabetes.48 However, except for linagliptin, dose reduction is recommended in patients with CKD stage 3 and higher.49–52
GLP-1 receptor agonists. Drugs of this class are potent agents for the reduction of glucose in the outpatient setting but are relatively contraindicated if the GFR is less than 30 mL/min, and they are currently not used in the hospital.
BLOOD GLUCOSE MONITORING IN HOSPITALIZED PATIENTS
Bedside blood glucose monitoring is recommended for all hospitalized patients with known diabetes with or without CKD, those with newly recognized hyperglycemia, and those who receive therapy associated with high risk for hyperglycemia, such as glucocorticoid therapy and enteral and parenteral nutrition. For patients on scheduled diets, fingerstick blood glucose monitoring is recommended before meals and at bedtime. In patients with no oral intake or on continuous enteral or parenteral nutrition, blood glucose monitoring every 4 to 6 hours is recommended. More frequent monitoring (eg, adding a 3:00 am check) may be prudent in patients with CKD.
Continuous glucose monitoring systems use a sensor inserted under the skin and transmit information via radio to a wireless monitor. Such systems are more expensive than conventional glucose monitoring but may enable better glucose control by providing real-time glucose measurements, with levels displayed at 5-minute or 1-minute intervals. Marshall et al53 confirmed this technology’s accuracy and precision in uremic patients on dialysis.
Considerations for peritoneal dialysis
For patients on peritoneal dialysis, glucose in the dialysate exacerbates hyperglycemia. Dialysis solutions with the glucose polymer icodextrin as the osmotic agent instead of glucose have been suggested to reduce glucose exposure.
Glucose monitoring systems measure interstitial fluid glucose by the glucose oxidase reaction and therefore are not affected by icodextrin. However, icodextrin is converted to maltose, a disaccharide composed of two glucose molecules, which can cause spuriously high readings in devices that use test strips containing the enzymes glucose dehydrogenase pyrroloquinoline quinone or glucose dye oxidoreductase. Spurious hyperglycemia may lead to giving too much insulin, in turn leading to symptomatic hypoglycemia.
Clinicians caring for patients receiving icodextrin should ensure that the glucose monitoring system uses only test strips that contain glucose oxidase, glucose dehydrogenase-nicotinamide adenine dinucleotide, or glucose dehydrogenase-flavin adenine dinucleotide, which are not affected by icodextrin.54
IMPROVING QUALITY
Hospitalized patients face many barriers to optimal glycemic control. Less experienced practitioners tend to have insufficient knowledge of insulin preparations and appropriate insulin dosing. Also, diabetes is often listed as a secondary diagnosis and so may be overlooked by the inpatient care team.
Educational programs should be instituted to overcome these barriers and improve knowledge related to inpatient diabetes care. When necessary, the appropriate use of consultants is important in hospitalized settings to improve quality and make hospital care more efficient and cost-effective.
No national benchmarks currently exist for inpatient diabetes care, and they need to be developed to ensure best practices. Physicians should take the initiative to remedy this by collaborating with other healthcare providers, such as dedicated diabetes educators, nursing staff, pharmacists, registered dietitians, and physicians with expertise in diabetes management, with the aim of achieving optimum glycemic control and minimizing hypoglycemia.
- Go AS, Chertow GM, Fan D, McCulloch CE, Hsu CY. Chronic kidney disease and the risks of death, cardiovascular events, and hospitalization. N Engl J Med 2004; 351:1296–1305.
- Newman DJ, Mattock MB, Dawnay AB, et al. Systematic review on urine albumin testing for early detection of diabetic complications. Health Technol Assess 2005; 9:iii–vi, xiii–163.
- Umpierrez GE, Isaacs SD, Bazargan N, You X, Thaler LM, Kitabchi AE. Hyperglycemia: an independent marker of in-hospital mortality in patients with undiagnosed diabetes. J Clin Endocrinol Metab 2002; 87:978–982.
- Golden SH, Peart-Vigilance C, Kao WH, Brancati FL. Perioperative glycemic control and the risk of infectious complications in a cohort of adults with diabetes. Diabetes Care 1999; 22:1408–1414.
- Van den Berghe G, Wouters P, Weekers F, et al. Intensive insulin therapy in critically ill patients. N Engl J Med 2001; 345:1359–1367.
- NICE-SUGAR Study Investigators; Finfer S, Chittock DR, Su SY, et al. Intensive versus conventional glucose control in critically ill patients. N Engl J Med 2009; 360:1283–1297.
- Brunkhorst FM, Engel C, Bloos F, et al; German Competence Network Sepsis (SepNet). Intensive insulin therapy and pentastarch resuscitation in severe sepsis. N Engl J Med 2008; 358:125–139.
- The effect of intensive treatment of diabetes on the development and progression of long-term complications in insulin-dependent diabetes mellitus. The Diabetes Control and Complications Trial Research Group. N Engl J Med 1993; 329:977–986.
- Effect of intensive diabetes management on macrovascular events and risk factors in the Diabetes Control and Complications Trial. Am J Cardiol 1995; 75:894–903.
- Nathan DM, Lachin J, Cleary P, et al; Diabetes Control and Complications Trial; Epidemiology of Diabetes Interventions and Complications Research Group. Intensive diabetes therapy and carotid intima-media thickness in type 1 diabetes mellitus. N Engl J Med 2003; 348:2294–2303.
- Writing Group for the DCCT/EDIC Research Group; Orchard TJ, Nathan DM, Zinman B, et al. Association between 7 years of intensive treatment of type 1 diabetes and long-term mortality. JAMA 2015; 313:45–53.
- Moen MF, Zhan M, Hsu VD, et al. Frequency of hypoglycemia and its significance in chronic kidney disease. Clin J Am Soc Nephrol 2009; 4:1121–1127.
- Iglesias P, Díez J. Insulin therapy in renal disease. Diabetes Obes Metab 2008; 10:811–823.
- Zoungas S, Patel A, Chalmers J, et al; ADVANCE Collaborative Group. Severe hypoglycemia and risks of vascular events and death. N Engl J Med 2010; 363:1410–1418.
- Moghissi ES, Korytkowski MT, DiNardo M, et al; American Association of Clinical Endocrinologists; American Diabetes Association. American Association of Clinical Endocrinologists and American Diabetes Association consensus statement on inpatient glycemic control. Diabetes Care 2009; 32:1119–1131.
- Action to Control Cardiovascular Risk in Diabetes Study Group; Gerstein HC, Miller ME, Byington RP, et al. Effects of intensive glucose lowering in type 2 diabetes. N Engl J Med 2008; 358:2545–2559.
- Kovesdy CP, Park JC, Kalantar-Zadeh K. Glycemic control and burnt-out diabetes in ESRD. Semin Dial 2010; 23:148–156.
- De Marchi S, Cecchin E, Camurri C, et al. Origin of glycosylated hemoglobin A1 in chronic renal failure. Int J Artif Organs 1983; 6:77–82.
- Brown JN, Kemp DW, Brice KR. Class effect of erythropoietin therapy on hemoglobin A(1c) in a patient with diabetes mellitus and chronic kidney disease not undergoing hemodialysis. Pharmacotherapy 2009; 29:468–472.
- Morgan L, Marenah CB, Jeffcoate WJ, Morgan AG. Glycated proteins as indices of glycemic control in diabetic patients with chronic renal failure. Diabet Med 1996; 13:514–519.
- Peacock TP, Shihabi ZK, Bleyer AJ, et al. Comparison of glycated albumin and hemoglobin A(1c) levels in diabetic subjects on hemodialysis. Kidney Int 2008; 73:1062–1068.
- Joy MS, Cefalu WT, Hogan SL, Nachman PH. Long-term glycemic control measurements in diabetic patients receiving hemodialysis. Am J Kidney Dis 2002; 39:297–307.
- Inaba M, Okuno S, Kumeda Y, et al; Osaka CKD Expert Research Group. Glycated albumin is a better glycemic indicator than glycated hemoglobin values in hemodialysis patients with diabetes: effect of anemia and erythropoietin injection. J Am Soc Nephrol 2007; 18:896–903.
- Mittman N, Desiraju B, Fazil I, et al. Serum fructosamine versus glycosylated hemoglobin as an index of glycemic control, hospitalization, and infection in diabetic hemodialysis patients. Kidney Int 2010; 78(suppl 117):S41–S45.
- Alskar O, Korelli J, Duffull SB. A pharmacokinetic model for the glycation of albumin. J Pharmacokinet Pharmacodyn 2012; 39:273–282.
- Qaseem A, Humphrey LL, Chou R, Snow V, Shekelle P; Clinical Guidelines Committee of the American College of Physicians. Use of intensive insulin therapy for the management of glycemic control in hospitalized patients: a clinical practice guideline from the American College of Physicians. Ann Intern Med 2011; 154:260–267.
- Murad MH, Coburn JA, Coto-Yglesias F, et al. Glycemic control in non-critically ill hospitalized patients: a systematic review and meta-analysis. J Clin Endocrinol Metab 2012; 97:49–58.
- Bogun M, Inzucchi SE. Inpatient management of diabetes and hyperglycemia. Clin Ther 2013; 35:724–733.
- Miller DB. Glycemic targets in hospital and barriers to attaining them. Can J Diabetes 2014; 38:74–78.
- Eidemak I, Feldt-Rasmussen B, Kanstrup IL, Nielsen SL, Schmitz O, Strandgaard S. Insulin resistance and hyperinsulinaemia in mild to moderate progressive chronic renal failure and its association with aerobic work capacity. Diabetologia 1995; 38:565–572.
- Svensson M, Yu Z, Eriksson J. A small reduction in glomerular filtration is accompanied by insulin resistance in type I diabetes patients with diabetic nephropathy. Eur J Clin Invest 2002; 32:100–109.
- Rave K, Heise T, Pfutzner A, Heinemann L, Sawicki P. Impact of diabetic nephropathy on pharmacodynamics and pharmacokinetic properties of insulin in type I diabetic patients. Diabetes Care 2001; 24:886–890.
- Biesenbach G, Raml A, Schmekal B, Eichbauer-Sturm G. Decreased insulin requirement in relation to GFR in nephropathic type 1 and insulin-treated type 2 diabetic patients. Diabet Med 2003; 20:642–645.
- Holmes G, Galitz L, Hu P, Lyness W. Pharmacokinetics of insulin aspart in obesity, renal impairment, or hepatic impairment. Br J Clin Pharmacol 2005; 60:469–476.
- Lindholm A, Jacobsen LV. Clinical pharmacokinetics and pharmacodynamics of insulin aspart. Clin Pharmacokinet 2001; 40:641–659.
- Bolli GB, Hahn AD, Schmidt R, et al. Plasma exposure to insulin glargine and its metabolites M1 and M2 after subcutaneous injection of therapeutic and supratherapeutic doses of glargine in subjects with type 1 diabetes. Diabetes Care 2012; 35:2626–2630.
- Nielsen S. Time course and kinetics of proximal tubular processing of insulin. Am J Physiol 1992; 262:F813–F822.
- Sobngwi E, Enoru S, Ashuntantang G, et al. Day-to-day variation of insulin requirements of patients with type 2 diabetes and end-stage renal disease undergoing maintenance hemodialysis. Diabetes Care 2010; 33:1409–1412.
- Quellhorst E. Insulin therapy during peritoneal dialysis: pros and cons of various forms of administration. J Am Soc Nephrol 2002; 13(suppl 1):S92–S96.
- Davidson MB, Peters AL. An overview of metformin in the treatment of type 2 diabetes mellitus. Am J Med 1997; 102:99–110.
- Ahmed Z, Simon B, Choudhury D. Management of diabetes in patients with chronic kidney disease. Postgrad Med 2009; 121:52–60.
- Charpentier G, Riveline JP, Varroud-Vial M. Management of drugs affecting blood glucose in diabetic patients with renal failure. Diabetes Metab 2000; 26(suppl 4):73–85.
- Hasslacher C; Multinational Repaglinide Renal Study Group. Safety and efficacy of repaglinide in type 2 diabetic patients with and without impaired renal function. Diabetes Care 2003; 26:886–891.
- Iglesias P, Dies JJ. Peroxisome proliferator-activated receptor gamma agonists in renal disease. Eur J Endocrinol 2006; 154:613–621.
- Hollenberg NK. Considerations for management of fluid dynamic issues associated with thiazolidinediones. Am J Med 2003; 115(suppl. 8A) 111S–115S.
- Kamath V, Jones CN, Yip JC, et al. Effects of a quick-release form of bromocriptine (Ergoset) on fasting and postprandial plasma glucose, insulin, lipid, and lipoprotein concentrations in obese nondiabetic hyperinsulinemic women. Diabetes Care 1997; 20:1697–1701.
- Pijl H, Ohashi S, Matsuda M, et al. Bromocriptine: a novel approach to the treatment of type 2 diabetes. Diabetes Care 2000; 23:1154–1161.
- Umpierrez GE, Gianchandani R, Smiley D, et al. Safety and efficacy of sitagliptin therapy for the inpatient management of general medicine and surgery patients with type 2 diabetes: a pilot, randomized, controlled study. Diabetes Care 2013; 36:3430–3435.
- Chan JC, Scott R, Arjona Ferreira JC, et al. Safety and efficacy of sitagliptin in patients with type 2 diabetes and chronic renal insufficiency. Diabetes Obes Metab 2008; 10:545–555.
- Bergman AJ, Cote J, Yi B, et al. Effect of renal insufficiency on the pharmacokinetics of sitagliptin, a dipeptidyl peptidase-4 inhibitor. Diabetes Care 2007; 30:1862–1864.
- Onglyza package insert. www.azpicentral.com/onglyza/pi_onglyza.pdf. Accessed March 8, 2016.
- Gallwitz B. Safety and efficacy of linagliptin in type 2 diabetes patients with common renal and cardiovascular risk factors. Ther Adv Endocrinol Metab 2013; 4:95–105.
- Marshall J, Jennings P, Scott A, Fluck RJ, McIntyre CW. Glycemic control in diabetic CAPD patients assessed by continuous glucose monitoring system (CGMS). Kidney Int 2003; 64:1480–1486.
- Schleis TG. Interference of maltose, icodextrin, galactose, or xylose with some blood glucose monitoring systems. Pharmacotherapy 2007; 27:1313–1321.
Managing glycemic control in hospitalized patients with chronic kidney disease (CKD) and diabetes mellitus is a challenge, with no published guidelines. In this setting, avoiding hypoglycemia takes precedence over meeting strict blood glucose targets. Optimal management is essential to reduce hypoglycemia and the risk of death from cardiovascular disease.1
This article reviews the evidence to guide diabetes management in hospitalized patients with CKD, focusing on blood glucose monitoring, insulin dosing, and concerns about other diabetic agents.
FOCUS ON AVOIDING HYPOGLYCEMIA
CKD is common, estimated to affect more than 50 million people worldwide.2 Diabetes mellitus is the primary cause of kidney failure in 45% of dialysis patients with CKD.
Tight control comes with a cost
Hyperglycemia in hospitalized patients is associated with a higher risk of death, a higher risk of infections, and a longer hospital stay.3,4 In 2001, Van den Berghe et al5 found that intensive insulin therapy reduced the mortality rate in critically ill patients in the surgical intensive care unit. But subsequent studies6,7 found that intensive insulin therapy to achieve tight glycemic control increased rates of morbidity and mortality without adding clinical benefit.
Randomized clinical trials in outpatients have shown that tight control of blood glucose levels reduces microvascular and macrovascular complications in patients with type 1 diabetes.8–10 In the Diabetes Control and Complications Trial,9 compared with conventional therapy, intensive insulin therapy reduced the incidence of retinopathy progression (4.7 vs 1.2 cases per 100 patient-years, number needed to treat [NNT] = 3 for 10 years) and clinical neuropathy (9.8 vs 3.1 per 100 patient-years, NNT = 1.5 for 10 years). The long-term likelihood of a cardiovascular event was also significantly lower in the intensive treatment group (0.38 vs 0.80 events per 100 patient-years).9
Similarly, in the Epidemiology of Diabetes Interventions and Complications follow-up study, the intensive therapy group had fewer cardiovascular deaths.11 On the other hand, the risk of severe hypoglycemia and subsequent coma or seizure was significantly higher in the intensive therapy group than in the conventional therapy group (16.3 vs 5.4 per 100 patient-years).8
CKD increases hypoglycemia risk
Moen et al12 found that the incidence of hypoglycemia was significantly higher in patients with CKD (estimated glomerular filtration rate [GFR] < 60 mL/min) with or without diabetes, and that patients with both conditions were at greatest risk (Figure 1). Multiple factors contribute to the increased risk of hypoglycemia: patients with advanced CKD tend to have poor nutrition, resulting in reduced glycogen stores, and a smaller renal mass reduces renal gluconeogenesis and decreases the elimination of insulin and oral antidiabetic agents.
After the onset of diabetic nephropathy, progression of renal complications and overall life expectancy are influenced by earlier glycemic control.8 Development of diabetic nephropathy is commonly accompanied by changes in metabolic control, particularly an increased risk of hypoglycemia.13 In addition, episodes of severe hypoglycemia constitute an independent cardiovascular risk factor.14
Aggressive glycemic control in hospitalized patients, particularly those with advanced CKD, is associated with a risk of hypoglycemia without overall improvement in outcomes.15 Elderly patients with type 2 diabetes are similar to patients with CKD in that they have a reduced GFR and are thus more sensitive to insulin. In both groups, intensifying glycemic control, especially in the hospital, is associated with more frequent episodes of severe hypoglycemia.16 The focus should be not only on maintaining optimal blood glucose concentration, but also on preventing hypoglycemia.
‘Burnt-out’ diabetes
Paradoxically, patients with end-stage renal disease and type 2 diabetes often experience altered glucose homeostasis with markedly improved glycemic control. They may attain normoglycemia and normalization of hemoglobin A1c, a condition known as “burnt-out” diabetes. Its precise mechanism is not understood and its significance remains unclear (Table 1).17
HEMOGLOBIN A1c CAN BE FALSELY HIGH OR FALSELY LOW
Hemoglobin A1c measurement is used to diagnose diabetes and to assess long-term glycemic control. It is a measure of the fraction of hemoglobin that has been glycated by exposure to glucose. Because the average lifespan of a red cell is 120 days, the hemoglobin A1c value reflects the mean blood glucose concentration over the preceding 3 months.
But hemoglobin A1c measurement has limitations: any condition that alters the lifespan of erythrocytes leads to higher or lower hemoglobin A1c levels. Hemoglobin A1c levels are also affected by kidney dysfunction, hemolysis, and acidosis.18
Falsely high hemoglobin A1c levels are associated with conditions that prolong the lifespan of erythrocytes, such as asplenia. Iron deficiency also increases the average age of circulating red cells because of reduced red cell production. For patients in whom blood glucose measurements do not correlate with hemoglobin A1c measurements, iron deficiency anemia should be considered before altering a treatment regimen.
Falsely low hemoglobin A1c levels are associated with conditions of more rapid erythrocyte turnover, such as autoimmune hemolytic anemia, hereditary spherocytosis, and acute blood loss anemia. In patients with CKD, recombinant erythropoietin treatment lowers hemoglobin A1c levels by increasing the number of immature red cells, which are less likely to glycosylate.19
Morgan et al20 compared the association between hemoglobin A1c and blood glucose levels in diabetic patients with moderate to severe CKD not requiring dialysis and in diabetic patients with normal renal function and found no difference between these two groups, suggesting that hemoglobin A1c is reliable in this setting. But study results conflict for patients on dialysis, making the usefulness of hemoglobin A1c testing for those patients less clear. In one study, hemoglobin A1c testing underestimated glycemic control,20 but other studies found that glycemic control was overestimated.21,22
Alternatives to hemoglobin A1c
Other measures of long-term glycemic control such as fructosamine and glycated albumin levels are sometimes used in conditions in which hemoglobin A1c may not be reliable.
Albumin also undergoes glycation when exposed to glucose. Glycated albumin appears to be a better measure of glycemic control in patients with CKD and diabetes than serum fructosamine,23 which has failed to show a significant correlation with blood glucose levels in patients with CKD.24 However, because serum albumin has a short half-life, glycated albumin reflects glycemic control in only the approximately 1 to 2 weeks before sampling,25 so monthly monitoring is required.
Glycated albumin levels may be reduced due to increased albumin turnover in patients with nephrotic-range proteinuria and in diabetic patients on peritoneal dialysis. Several issues remain unclear, such as the appropriate target level of glycated albumin and at what stage of CKD it should replace hemoglobin A1c testing. If an improved assay that is unaffected by changes in serum albumin becomes available, it may be appropriate to use glycated albumin measurements to assess long-term glycemic control for patients with CKD.
In general, therapeutic decisions to achieve optimum glycemic control in patients with diabetes and CKD should be based on hemoglobin A1c testing, multiple glucose measurements, and patient symptoms of hypoglycemia or hyperglycemia. The best measure for assessing glycemic control in hospitalized patients with CKD remains multiple blood glucose testing daily.
INSULIN THERAPY PREFERRED
Although several studies have evaluated inpatient glycemic control,26–29 no guidelines have been published for hospitalized patients with diabetes and CKD. Insulin therapy is preferred for achieving glycemic control in acutely ill or hospitalized patients with diabetes. Oral hypoglycemic agents should be discontinued.
Regardless of the form of insulin chosen to treat diabetes, caution is needed for patients with kidney disease. During hospitalization, clinical changes are expected owing to illness and differences in caloric intake and physical activity, resulting in altered insulin sensitivity. Insulin-treated hospitalized patients require individualized care, including multiple daily blood glucose tests and insulin therapy modifications for ideal glycemic control.
For surgical or medical intensive care patients on insulin therapy, the target blood glucose level before meals should be 140 mg/dL, and the target random level should be less than 180 mg/dL.15,26–29
Basal-bolus insulin
Sliding-scale therapy should be avoided as the only method for glycemic control. Instead, scheduled subcutaneous basal insulin once or twice daily combined with rapid- or short-acting insulin with meals is recommended.
Basal-bolus insulin therapy, one of the most advanced and flexible insulin replacement therapies, mimics endogenous insulin release and offers great advantages in diabetes care. Using mealtime bolus insulin permits variation in the amount of food eaten; more insulin can be taken with a larger meal and less with smaller meals. A bolus approach offers the flexibility of administering rapid-acting insulin immediately after meals when oral intake is variable.
Individualize insulin therapy
Optimizing glycemic control requires an understanding of the altered pharmacokinetics and pharmacodynamics of insulin in patients with diabetic nephropathy. Table 2 shows the pharmacokinetic profiles of insulin preparations in healthy people. Analogue insulins, which are manufactured by recombinant DNA technology, have conformational changes in the insulin molecule that alter their pharmacokinetics and pharmacodynamics. The rapid-acting analogue insulins are absorbed quickly, making them suitable for postprandial glucose control.
Changes in GFR are associated with altered pharmacokinetics and pharmacodynamics of insulin,30,31 but unlike for oral antidiabetic agents, these properties are not well characterized for insulin preparations in patients with renal insufficiency.13,32–36
CKD may reduce insulin clearance. Rave et al32 reported that the clearance of regular human insulin was reduced by 30% to 40% in patients with type 1 diabetes and a mean estimated GFR of 54 mL/min. They found that the metabolic activity of insulin lispro was more robust than that of short-acting regular human insulin in patients with diabetic nephropathy. In another study, patients with diabetes treated with insulin aspart did not show any significant change in the required insulin dosage in relation to the renal filtration rate.34 Biesenbach et al33 found a 38% reduction in insulin requirements in patients with type 1 diabetes as estimated GFR decreased from 80 mL/min to 10 mL/min. Further studies are required to better understand the safety of insulin in treating hospitalized patients with diabetes and renal insufficiency.
Few studies have compared the pharmacodynamics of long-acting insulins in relation to declining renal function. The long-acting analogue insulins have less of a peak than human insulin and thus better mimic endogenous insulin secretion. For insulin detemir, Lindholm and Jacobsen found no significant differences in the pharmacokinetics related to the stages of CKD.35 When using the long-acting insulins glargine or detemir, one should consider giving much lower doses (half the initial starting dosage) and titrating the dosage until target fasting glucose concentrations are reached to prevent hypoglycemia.
Table 3 summarizes recommended insulin dosage adjustments in CKD based on the literature and our clinical experience.
Considerations for dialysis patients
Subcutaneously administered insulin is eliminated renally, unlike endogenous insulin, which undergoes first-pass metabolism in the liver.13,37 As renal function declines, insulin clearance decreases and the insulin dosage must be reduced to prevent hypoglycemia.
Patients on hemodialysis or peritoneal dialysis pose a challenge for insulin dosing. Hemodialysis improves insulin sensitivity but also increases insulin clearance, making it difficult to determine insulin requirements. Sobngwi et al38 conducted a study in diabetic patients with end-stage renal disease on hemodialysis, using a 24-hour euglycemic clamp. They found that exogenous basal insulin requirements were 25% lower on the day after hemodialysis compared with the day before, but premeal insulin requirements stayed the same.
Peritoneal dialysis exposes patients to a high glucose load via the peritoneum, which can worsen insulin resistance. Intraperitoneal administration of insulin during peritoneal dialysis provides a more physiologic effect than subcutaneous administration: it prevents fluctuations of blood glucose and the formation of insulin antibodies. But insulin requirements are higher owing to a dilutional effect and to insulin binding to the plastic surface of the dialysis fluid reservoir.39
GLYCEMIC CONTROL FOR PROCEDURES
No guidelines have been established regarding the optimal blood glucose range for diabetic patients with CKD undergoing diagnostic or surgical procedures. Given the risk of hypoglycemia in such settings, less-stringent targets are reasonable, ie, premeal blood glucose levels of 140 mg/dL and random blood glucose levels of less than 180 mg/dL.
Before surgery, consideration should be given to the type of diabetes, surgical procedure, and metabolic control. Patients on insulin detemir or glargine as part of a basal-bolus regimen with rapid-acting insulin may safely be given the full dose of their basal insulin the night before or the morning of their procedure. However, patients on neutral protamine Hagedorn (NPH) insulin as a part of their basal-bolus regimen should receive half of their usual dose due to a difference in pharmacokinetic profile compared with insulin glargine or detemir.
In insulin-treated patients undergoing prolonged procedures (eg, coronary artery bypass grafting, transplant):
- Discontinue subcutaneous insulin and start an intravenous insulin infusion, titrated to maintain a blood glucose range of 140 to 180 mg/dL
- Subcutaneous insulin management may be acceptable for patients undergoing shorter outpatient procedures
- Supplemental subcutaneous doses of short- or rapid-acting insulin preparations can be given for blood glucose elevation greater than 180 mg/dL.
AVOID ORAL AGENTS AND NONINSULIN INJECTABLES
Oral antidiabetic agents and noninsulin injectables (Table 4) should generally be avoided in hospitalized patients, especially for those with decompensated heart failure, renal insufficiency, hypoperfusion, or chronic pulmonary disease, or for those given intravenous contrast. Most oral medications used to treat diabetes are affected by reduced kidney function, resulting in prolonged drug exposure and increased risk of hypoglycemia in patients with moderate to severe CKD (stages 3–5).
Metformin, a biguanide, is contraindicated in patients with high serum creatinine levels (> 1.5 mg/dL in men, > 1.4 mg/dL in women) because of the theoretical risk of lactic acidosis.40
Sulfonylurea clearance depends on kidney function.41 Severe prolonged episodes of hypoglycemia have been reported in dialysis patients taking these drugs, except with glipizide, which carries a lower risk.41,42
Repaglinide, a nonsulfonylurea insulin secretagogue, can be used in CKD stages 3 to 4 without any dosage adjustment.43
Thiazolidinediones have been reported to slow the progression of diabetic kidney disease independent of glycemic control.44 Adverse effects include fluid retention, edema, and congestive heart failure. Thiazolidinediones should not be used in patients with New York Heart Association class 3 or 4 heart failure,45 and so should not be prescribed in the hospital except for patients who are clinically stable or ready for discharge.
Quick-release bromocriptine, a dopamine receptor agonist, has been shown to be effective in lowering fasting plasma glucose levels and hemoglobin A1c, and improving glucose tolerance in obese patients with type 2 diabetes, although its usefulness in hospitalized patients with diabetes is not known.46,47
Dipeptidyl peptidase inhibitors. Sitagliptin and saxagliptin have been shown to be safe and effective in hospitalized patients with type 2 diabetes.48 However, except for linagliptin, dose reduction is recommended in patients with CKD stage 3 and higher.49–52
GLP-1 receptor agonists. Drugs of this class are potent agents for the reduction of glucose in the outpatient setting but are relatively contraindicated if the GFR is less than 30 mL/min, and they are currently not used in the hospital.
BLOOD GLUCOSE MONITORING IN HOSPITALIZED PATIENTS
Bedside blood glucose monitoring is recommended for all hospitalized patients with known diabetes with or without CKD, those with newly recognized hyperglycemia, and those who receive therapy associated with high risk for hyperglycemia, such as glucocorticoid therapy and enteral and parenteral nutrition. For patients on scheduled diets, fingerstick blood glucose monitoring is recommended before meals and at bedtime. In patients with no oral intake or on continuous enteral or parenteral nutrition, blood glucose monitoring every 4 to 6 hours is recommended. More frequent monitoring (eg, adding a 3:00 am check) may be prudent in patients with CKD.
Continuous glucose monitoring systems use a sensor inserted under the skin and transmit information via radio to a wireless monitor. Such systems are more expensive than conventional glucose monitoring but may enable better glucose control by providing real-time glucose measurements, with levels displayed at 5-minute or 1-minute intervals. Marshall et al53 confirmed this technology’s accuracy and precision in uremic patients on dialysis.
Considerations for peritoneal dialysis
For patients on peritoneal dialysis, glucose in the dialysate exacerbates hyperglycemia. Dialysis solutions with the glucose polymer icodextrin as the osmotic agent instead of glucose have been suggested to reduce glucose exposure.
Glucose monitoring systems measure interstitial fluid glucose by the glucose oxidase reaction and therefore are not affected by icodextrin. However, icodextrin is converted to maltose, a disaccharide composed of two glucose molecules, which can cause spuriously high readings in devices that use test strips containing the enzymes glucose dehydrogenase pyrroloquinoline quinone or glucose dye oxidoreductase. Spurious hyperglycemia may lead to giving too much insulin, in turn leading to symptomatic hypoglycemia.
Clinicians caring for patients receiving icodextrin should ensure that the glucose monitoring system uses only test strips that contain glucose oxidase, glucose dehydrogenase-nicotinamide adenine dinucleotide, or glucose dehydrogenase-flavin adenine dinucleotide, which are not affected by icodextrin.54
IMPROVING QUALITY
Hospitalized patients face many barriers to optimal glycemic control. Less experienced practitioners tend to have insufficient knowledge of insulin preparations and appropriate insulin dosing. Also, diabetes is often listed as a secondary diagnosis and so may be overlooked by the inpatient care team.
Educational programs should be instituted to overcome these barriers and improve knowledge related to inpatient diabetes care. When necessary, the appropriate use of consultants is important in hospitalized settings to improve quality and make hospital care more efficient and cost-effective.
No national benchmarks currently exist for inpatient diabetes care, and they need to be developed to ensure best practices. Physicians should take the initiative to remedy this by collaborating with other healthcare providers, such as dedicated diabetes educators, nursing staff, pharmacists, registered dietitians, and physicians with expertise in diabetes management, with the aim of achieving optimum glycemic control and minimizing hypoglycemia.
- Go AS, Chertow GM, Fan D, McCulloch CE, Hsu CY. Chronic kidney disease and the risks of death, cardiovascular events, and hospitalization. N Engl J Med 2004; 351:1296–1305.
- Newman DJ, Mattock MB, Dawnay AB, et al. Systematic review on urine albumin testing for early detection of diabetic complications. Health Technol Assess 2005; 9:iii–vi, xiii–163.
- Umpierrez GE, Isaacs SD, Bazargan N, You X, Thaler LM, Kitabchi AE. Hyperglycemia: an independent marker of in-hospital mortality in patients with undiagnosed diabetes. J Clin Endocrinol Metab 2002; 87:978–982.
- Golden SH, Peart-Vigilance C, Kao WH, Brancati FL. Perioperative glycemic control and the risk of infectious complications in a cohort of adults with diabetes. Diabetes Care 1999; 22:1408–1414.
- Van den Berghe G, Wouters P, Weekers F, et al. Intensive insulin therapy in critically ill patients. N Engl J Med 2001; 345:1359–1367.
- NICE-SUGAR Study Investigators; Finfer S, Chittock DR, Su SY, et al. Intensive versus conventional glucose control in critically ill patients. N Engl J Med 2009; 360:1283–1297.
- Brunkhorst FM, Engel C, Bloos F, et al; German Competence Network Sepsis (SepNet). Intensive insulin therapy and pentastarch resuscitation in severe sepsis. N Engl J Med 2008; 358:125–139.
- The effect of intensive treatment of diabetes on the development and progression of long-term complications in insulin-dependent diabetes mellitus. The Diabetes Control and Complications Trial Research Group. N Engl J Med 1993; 329:977–986.
- Effect of intensive diabetes management on macrovascular events and risk factors in the Diabetes Control and Complications Trial. Am J Cardiol 1995; 75:894–903.
- Nathan DM, Lachin J, Cleary P, et al; Diabetes Control and Complications Trial; Epidemiology of Diabetes Interventions and Complications Research Group. Intensive diabetes therapy and carotid intima-media thickness in type 1 diabetes mellitus. N Engl J Med 2003; 348:2294–2303.
- Writing Group for the DCCT/EDIC Research Group; Orchard TJ, Nathan DM, Zinman B, et al. Association between 7 years of intensive treatment of type 1 diabetes and long-term mortality. JAMA 2015; 313:45–53.
- Moen MF, Zhan M, Hsu VD, et al. Frequency of hypoglycemia and its significance in chronic kidney disease. Clin J Am Soc Nephrol 2009; 4:1121–1127.
- Iglesias P, Díez J. Insulin therapy in renal disease. Diabetes Obes Metab 2008; 10:811–823.
- Zoungas S, Patel A, Chalmers J, et al; ADVANCE Collaborative Group. Severe hypoglycemia and risks of vascular events and death. N Engl J Med 2010; 363:1410–1418.
- Moghissi ES, Korytkowski MT, DiNardo M, et al; American Association of Clinical Endocrinologists; American Diabetes Association. American Association of Clinical Endocrinologists and American Diabetes Association consensus statement on inpatient glycemic control. Diabetes Care 2009; 32:1119–1131.
- Action to Control Cardiovascular Risk in Diabetes Study Group; Gerstein HC, Miller ME, Byington RP, et al. Effects of intensive glucose lowering in type 2 diabetes. N Engl J Med 2008; 358:2545–2559.
- Kovesdy CP, Park JC, Kalantar-Zadeh K. Glycemic control and burnt-out diabetes in ESRD. Semin Dial 2010; 23:148–156.
- De Marchi S, Cecchin E, Camurri C, et al. Origin of glycosylated hemoglobin A1 in chronic renal failure. Int J Artif Organs 1983; 6:77–82.
- Brown JN, Kemp DW, Brice KR. Class effect of erythropoietin therapy on hemoglobin A(1c) in a patient with diabetes mellitus and chronic kidney disease not undergoing hemodialysis. Pharmacotherapy 2009; 29:468–472.
- Morgan L, Marenah CB, Jeffcoate WJ, Morgan AG. Glycated proteins as indices of glycemic control in diabetic patients with chronic renal failure. Diabet Med 1996; 13:514–519.
- Peacock TP, Shihabi ZK, Bleyer AJ, et al. Comparison of glycated albumin and hemoglobin A(1c) levels in diabetic subjects on hemodialysis. Kidney Int 2008; 73:1062–1068.
- Joy MS, Cefalu WT, Hogan SL, Nachman PH. Long-term glycemic control measurements in diabetic patients receiving hemodialysis. Am J Kidney Dis 2002; 39:297–307.
- Inaba M, Okuno S, Kumeda Y, et al; Osaka CKD Expert Research Group. Glycated albumin is a better glycemic indicator than glycated hemoglobin values in hemodialysis patients with diabetes: effect of anemia and erythropoietin injection. J Am Soc Nephrol 2007; 18:896–903.
- Mittman N, Desiraju B, Fazil I, et al. Serum fructosamine versus glycosylated hemoglobin as an index of glycemic control, hospitalization, and infection in diabetic hemodialysis patients. Kidney Int 2010; 78(suppl 117):S41–S45.
- Alskar O, Korelli J, Duffull SB. A pharmacokinetic model for the glycation of albumin. J Pharmacokinet Pharmacodyn 2012; 39:273–282.
- Qaseem A, Humphrey LL, Chou R, Snow V, Shekelle P; Clinical Guidelines Committee of the American College of Physicians. Use of intensive insulin therapy for the management of glycemic control in hospitalized patients: a clinical practice guideline from the American College of Physicians. Ann Intern Med 2011; 154:260–267.
- Murad MH, Coburn JA, Coto-Yglesias F, et al. Glycemic control in non-critically ill hospitalized patients: a systematic review and meta-analysis. J Clin Endocrinol Metab 2012; 97:49–58.
- Bogun M, Inzucchi SE. Inpatient management of diabetes and hyperglycemia. Clin Ther 2013; 35:724–733.
- Miller DB. Glycemic targets in hospital and barriers to attaining them. Can J Diabetes 2014; 38:74–78.
- Eidemak I, Feldt-Rasmussen B, Kanstrup IL, Nielsen SL, Schmitz O, Strandgaard S. Insulin resistance and hyperinsulinaemia in mild to moderate progressive chronic renal failure and its association with aerobic work capacity. Diabetologia 1995; 38:565–572.
- Svensson M, Yu Z, Eriksson J. A small reduction in glomerular filtration is accompanied by insulin resistance in type I diabetes patients with diabetic nephropathy. Eur J Clin Invest 2002; 32:100–109.
- Rave K, Heise T, Pfutzner A, Heinemann L, Sawicki P. Impact of diabetic nephropathy on pharmacodynamics and pharmacokinetic properties of insulin in type I diabetic patients. Diabetes Care 2001; 24:886–890.
- Biesenbach G, Raml A, Schmekal B, Eichbauer-Sturm G. Decreased insulin requirement in relation to GFR in nephropathic type 1 and insulin-treated type 2 diabetic patients. Diabet Med 2003; 20:642–645.
- Holmes G, Galitz L, Hu P, Lyness W. Pharmacokinetics of insulin aspart in obesity, renal impairment, or hepatic impairment. Br J Clin Pharmacol 2005; 60:469–476.
- Lindholm A, Jacobsen LV. Clinical pharmacokinetics and pharmacodynamics of insulin aspart. Clin Pharmacokinet 2001; 40:641–659.
- Bolli GB, Hahn AD, Schmidt R, et al. Plasma exposure to insulin glargine and its metabolites M1 and M2 after subcutaneous injection of therapeutic and supratherapeutic doses of glargine in subjects with type 1 diabetes. Diabetes Care 2012; 35:2626–2630.
- Nielsen S. Time course and kinetics of proximal tubular processing of insulin. Am J Physiol 1992; 262:F813–F822.
- Sobngwi E, Enoru S, Ashuntantang G, et al. Day-to-day variation of insulin requirements of patients with type 2 diabetes and end-stage renal disease undergoing maintenance hemodialysis. Diabetes Care 2010; 33:1409–1412.
- Quellhorst E. Insulin therapy during peritoneal dialysis: pros and cons of various forms of administration. J Am Soc Nephrol 2002; 13(suppl 1):S92–S96.
- Davidson MB, Peters AL. An overview of metformin in the treatment of type 2 diabetes mellitus. Am J Med 1997; 102:99–110.
- Ahmed Z, Simon B, Choudhury D. Management of diabetes in patients with chronic kidney disease. Postgrad Med 2009; 121:52–60.
- Charpentier G, Riveline JP, Varroud-Vial M. Management of drugs affecting blood glucose in diabetic patients with renal failure. Diabetes Metab 2000; 26(suppl 4):73–85.
- Hasslacher C; Multinational Repaglinide Renal Study Group. Safety and efficacy of repaglinide in type 2 diabetic patients with and without impaired renal function. Diabetes Care 2003; 26:886–891.
- Iglesias P, Dies JJ. Peroxisome proliferator-activated receptor gamma agonists in renal disease. Eur J Endocrinol 2006; 154:613–621.
- Hollenberg NK. Considerations for management of fluid dynamic issues associated with thiazolidinediones. Am J Med 2003; 115(suppl. 8A) 111S–115S.
- Kamath V, Jones CN, Yip JC, et al. Effects of a quick-release form of bromocriptine (Ergoset) on fasting and postprandial plasma glucose, insulin, lipid, and lipoprotein concentrations in obese nondiabetic hyperinsulinemic women. Diabetes Care 1997; 20:1697–1701.
- Pijl H, Ohashi S, Matsuda M, et al. Bromocriptine: a novel approach to the treatment of type 2 diabetes. Diabetes Care 2000; 23:1154–1161.
- Umpierrez GE, Gianchandani R, Smiley D, et al. Safety and efficacy of sitagliptin therapy for the inpatient management of general medicine and surgery patients with type 2 diabetes: a pilot, randomized, controlled study. Diabetes Care 2013; 36:3430–3435.
- Chan JC, Scott R, Arjona Ferreira JC, et al. Safety and efficacy of sitagliptin in patients with type 2 diabetes and chronic renal insufficiency. Diabetes Obes Metab 2008; 10:545–555.
- Bergman AJ, Cote J, Yi B, et al. Effect of renal insufficiency on the pharmacokinetics of sitagliptin, a dipeptidyl peptidase-4 inhibitor. Diabetes Care 2007; 30:1862–1864.
- Onglyza package insert. www.azpicentral.com/onglyza/pi_onglyza.pdf. Accessed March 8, 2016.
- Gallwitz B. Safety and efficacy of linagliptin in type 2 diabetes patients with common renal and cardiovascular risk factors. Ther Adv Endocrinol Metab 2013; 4:95–105.
- Marshall J, Jennings P, Scott A, Fluck RJ, McIntyre CW. Glycemic control in diabetic CAPD patients assessed by continuous glucose monitoring system (CGMS). Kidney Int 2003; 64:1480–1486.
- Schleis TG. Interference of maltose, icodextrin, galactose, or xylose with some blood glucose monitoring systems. Pharmacotherapy 2007; 27:1313–1321.
KEY POINTS
- Hemoglobin A1c values are often unreliable in patients with end-stage renal disease; close monitoring by fingerstick testing or a continuous monitoring system is recommended during hospitalization.
- Insulin is the preferred treatment for hospitalized patients with diabetes; oral antidiabetic agents should be avoided.
- Blood glucose targets for hospitalized patients with diabetes or stress hyperglycemia should be less than 140 mg/dL before meals, and random values should be less than 180 mg/dL.
- A basal-bolus insulin approach is flexible and mimics endogenous insulin release.
- Many insulin-treated patients with type 2 diabetes and CKD stop needing insulin as kidney disease progresses.
Drugs that may harm bone: Mitigating the risk
Drug-induced osteoporosis is common, and the list of drugs that can harm bone continues to grow. As part of routine health maintenance, practitioners should recognize the drugs that increase bone loss and take measures to mitigate these effects to help avoid osteopenia and osteoporosis.
Osteoporosis, a silent systemic disease defined by low bone mineral density and changes in skeletal microstructure, leads to a higher risk of fragility fractures. Some of the risk factors are well described, but less well known is the role of pharmacologic therapy. The implicated drugs (Table 1) have important therapeutic roles, so the benefits of using them must be weighed against their risks, including their potential effects on bone.
This review focuses on a few drugs known to increase fracture risk, their mechanisms of bone loss, and management considerations (Table 2).
GLUCOCORTICOIDS
Glucocorticoids are used to treat many medical conditions, including allergic, rheumatic, and other inflammatory diseases, and as immunosuppressive therapy after solid organ and bone marrow transplant. They are the most common cause of drug-induced bone loss and related secondary osteoporosis.
Multiple effects on bone
Glucocorticoids both increase bone resorption and decrease bone formation by a variety of mechanisms.1 They reduce intestinal calcium absorption, increase urinary excretion of calcium, and enhance osteocyte apoptosis, leading to deterioration of the bone microarchitecture and bone mineral density.2 They also affect sex hormones, decreasing testosterone production in men and estrogen in women, leading to increased bone resorption, altered bone architecture, and poorer bone quality.3,4 The bone loss is greater in trabecular bone (eg, the femoral neck and vertebral bodies) than in cortical bone (eg, the forearm).5
Glucocorticoids have other systemic effects that increase fracture risk. For example, they cause muscle weakness and atrophy, increasing the risk of falls.4 Additionally, many of the inflammatory conditions for which they are prescribed (eg, rheumatoid arthritis) also increase the risk of osteoporosis by means of proinflammatory cytokine production, which may contribute to systemic and local effects on bone.4,6
Bone mineral density declines quickly
Bone mineral density declines within the first 3 months after starting oral glucocorticoids, with the rate of bone loss peaking at 6 months. Up to 12% of bone mass is lost in the first year. In subsequent years of continued use, bone loss progresses at a slower, steadier rate, averaging 2% to 3% annually.5,7,8
Oral therapy increases fracture risk
Kanis et al9 performed a meta-analysis of seven prospective cohort studies in 40,000 patients and found that the current or previous use of an oral glucocorticoid increased the risk of fragility fractures, and that men and women were affected about equally.9
Van Staa et al10,11 reported that daily doses of glucocorticoids equivalent to more than 2.5 mg of prednisone were associated with an increased risk of vertebral and hip fractures; fracture risk was related mainly to daily dosage rather than cumulative dose.
Van Staa et al,12 in a retrospective cohort study, compared nearly 250,000 adult users of oral glucocorticoids from general medical practice settings with the same number of controls matched for sex, age, and medical practice. The relative risks for fractures and 95% confidence intervals (CIs) during oral glucocorticoid treatment were as follows:
- Forearm fracture 1.09 (1.01–1.17)
- Nonvertebral fracture 1.33 (1.29–1.38)
- Hip fracture 1.61 (1.47–1.76)
- Vertebral fracture 2.60 (2.31–2.92).
The risk was dose-dependent. For a low daily dose (< 2.5 mg/day of prednisolone), the relative risks were:
- Hip fracture 0.99 (0.82–1.20)
- Vertebral fracture 1.55 (1.20–2.01) .
For a medium daily dose (2.5–7.5 mg/day), the relative risks were:
- Hip fracture 1.77 (1.55–2.02)
- Vertebral fracture 2.59 (2.16–3.10) .
For a high daily dose (> 7.5 mg/day), the relative risks were:
- Hip fracture 2.27 (1.94–2.66)
- Vertebral fracture 5.18 (4.25–6.31).
Fracture risk rapidly declined toward baseline after the patients stopped taking oral glucocorticoids but did not return to baseline levels. The lessening of excess fracture risk occurred mainly within the first year after stopping therapy.
Other studies5,9,13 have suggested that the increased fracture risk is mostly independent of bone mineral density, and that other mechanisms are at play. One study14 found that oral glucocorticoid users with a prevalent vertebral fracture actually had higher bone mineral density than patients with a fracture not taking glucocorticoids, although this finding was not confirmed in a subsequent study.15
Inhaled glucocorticoids have less effect on bone
Inhaled glucocorticoids are commonly used to treat chronic obstructive pulmonary disease and asthma. They do not have the same systemic bioavailability as oral glucocorticoids, so the risk of adverse effects is lower.
Data are inconsistent among several studies that evaluated the relationship between inhaled glucocorticoids, bone mineral density, osteoporosis, and fragility fracture. The inconsistencies may be due to heterogeneity of the study populations, self-reporting of fractures, and different methods of assessing chronic obstructive pulmonary disease severity.16
A Cochrane review17 in 2002 evaluated seven randomized controlled trials that compared the use of inhaled glucocorticoids vs placebo in nearly 2,000 patients with mild asthma or chronic obstructive pulmonary disease and found no evidence for decreased bone mineral density, increased bone turnover, or increased vertebral fracture incidence in the glucocorticoid users at 2 to 3 years of follow-up (odds ratio for fracture 1.87, 95% CI 0.5–7.0).
The Evaluation of Obstructive Lung Disease and Osteoporosis study,16 a multicenter Italian observational epidemiologic study, reported that patients taking the highest daily doses of inhaled glucocorticoids (> 1,500 μg of beclomethasone or its equivalent) had a significantly higher risk of vertebral fracture (odds ratio 1.4, 95% CI 1.04–1.89).16
A meta-analysis18 of five case-control studies (43,783 cases and 259,936 controls) identified a possible dose-dependent relationship, with a relative risk for nonvertebral fracture of 1.12 (95% CI 1.0–1.26) for each 1,000-μg increase in beclomethasone-equivalent inhaled glucocorticoid per day.
In summary, the effects of inhaled glucocorticoids in adults are uncertain, although trends toward increased fracture risk and decreased bone mineral density are evident with chronic therapy at moderate to high dosages. The risks and benefits of treatment should be carefully considered in patients with osteoporosis and baseline elevated fracture risk.19
Managing the risk of glucocorticoid-induced osteoporosis
In 2010, the American College of Rheumatology published recommendations for preventing and treating glucocorticoid-induced osteoporosis, which were endorsed by the American Society for Bone and Mineral Research.20 To lessen the risk of osteoporosis, the recommendations are as follows:
Limit exposure. Patients receiving glucocorticoids should be given the smallest dosage for the shortest duration possible.
Advise lifestyle changes. Patients should be counseled to limit their alcohol intake to no more than two drinks per day, to quit smoking, to engage in weight-bearing exercise, and to ingest enough calcium (1,200–1,500 mg/day, through diet and supplements) and vitamin D.
Monitor bone mineral density. Patients starting glucocorticoids at any dosage for an expected duration of at least 3 months should have their bone mineral density measured at baseline. The frequency of subsequent measurements should be based on the presence of other risk factors for fracture, results of previous bone density testing, glucocorticoid dosage, whether therapy for bone health has been initiated, and the rate of change in bone mineral density. If warranted and if the results would lead to a change in management, patients can undergo dual-energy x-ray absorptiometry more often than usual, ie, more often than every 2 years. Prevalent and incident fragility fractures, height measurements, fall risk assessments, laboratory measurements of 25-hydroxyvitamin D, and consideration of vertebral fracture assessment or other imaging of the spine, as necessary, should be part of counseling and monitoring.
Osteoporosis treatment. For patients who will be taking glucocorticoids for at least 3 months, alendronate, risedronate, zoledronic acid, or teriparatide can be initiated to prevent or treat osteoporosis in the following groups:
- Postmenopausal women and men over age 50 if the daily glucocorticoid dosage is at least 7.5 mg/day or if the World Health Organization Fracture Risk Assessment Tool (FRAX) score is more than 10% (the threshold for medium fracture risk)
- Premenopausal women and men younger than 50 if they have a history of fragility fracture, the FRAX score is more than 20% (the threshold for high fracture risk), or the T score is less than –2.5.
Certain clinical factors can also put a patient into a higher-risk category. These include current tobacco use, low body mass index, parental history of hip fracture, consuming more than three alcoholic drinks daily, higher daily or cumulative glucocorticoid dosage, intravenous pulse glucocorticoid usage, or a decline in central bone mineral density that exceeds the least significant change according to the scanner used.20
The FRAX tool accounts for bone density only at the femoral neck, and while useful, it cannot replace clinical judgment in stratifying risk. Moreover, it does not apply to premenopausal women or men under age 40.
The long-term risks of medications to treat glucocorticoid-induced osteoporosis are not well defined for premenopausal women (or their unborn children) or in men younger than 40, so treatment is recommended in those groups only for those with prevalent fragility fractures who are clearly at higher risk of additional fractures.20
PROTON PUMP INHIBITORS
Proton pump inhibitors are available by prescription and over the counter for gastric acid-related conditions. Concerns have been raised that these highly effective drugs are overused.21 Several of their adverse effects are self-limited and minor, but long-term use may entail serious risks, including propensity to bone fracture.22
Low acid leads to poor calcium absorption
Why fracture risk increases with proton pump inhibitors is controversial and may relate to their desired effect of suppressing gastric acid production: calcium salts, including carbonate and chloride, are poorly soluble and require an acidic environment to increase calcium ionization and thus absorption.23 For this reason, if patients taking a proton pump inhibitor take a calcium supplement, it should be calcium citrate, which unlike calcium carbonate does not require an acid environment for absorption.
Higher risk in older patients, with longer use, and with higher dosage
Since the first reports on proton pump inhibitors and fracture risk were published in 2006,24,25 a number of studies have reported this association, including several systematic reviews.
In 2011, the US Food and Drug Administration (FDA) updated a 2010 safety communication based on seven epidemiologic studies reporting an increased risk of fractures of the spine, hip, and wrist with proton pump inhibitors.24–31 Time of exposure to a proton pump inhibitor in these studies varied from 1 to 12 years. Fracture risk was higher in older patients,26 with higher doses,24,29 and with longer duration of drug use.24,27 On the other hand, one study that included only patients without other major fracture risk factors failed to find an association between the use of proton pump inhibitors and fractures.28
Is evidence sufficient for changing use?
The FDA report included a disclaimer that they had no access to study data or protocols and so could not verify the findings.26 Moreover, the studies used claims data from computerized databases to evaluate the risk of fractures in patients treated with proton pump inhibitors compared with those not using these drugs.24–31 Information was often incomplete regarding potentially important factors (eg, falls, family history of osteoporosis, calcium and vitamin D intake, smoking, alcohol use, reason for medication use), as well as the timing of drug use related to the onset or worsening of osteoporosis.26
Although 34 published studies evaluated the association of fracture risk and proton pump inhibitors, Leontiadis and Moayyedi32 argued that insufficient evidence exists to change our prescribing habits for these drugs based on fracture risk, as the studies varied considerably in their designs and results, a clear dose-response relationship is lacking, and the modest association is likely related to multiple confounders.
Bottom line: Use with caution
Although the increased fracture risk associated with proton pump inhibitors is likely multifactorial and is not fully delineated, it appears to be real. These drugs should be used only if there is a clear indication for them and if their benefits likely outweigh their risks. The lowest effective dose should be used, and the need for continuing use should be frequently reassessed.
SELECTIVE SEROTONIN REUPTAKE INHIBITORS
Depression affects 1 in 10 people in the United States, is especially common in the elderly, and leads to significant morbidity and reduced quality of life.33 Selective serotonin reuptake inhibitors (SSRIs) are often prescribed and are generally considered first-line agents for treating depression.
Complex bone effects
SSRIs antagonize the serotonin transporter, which normally assists serotonin uptake from the extracellular space. The serotonin transporter is found in all main types of bone cells, including osteoclasts, osteoblasts, and osteocytes.33 Serotonin is made by different genes in the brain than in the periphery, causing opposing effects on bone biology: when generated peripherally, it acts as a hormone to inhibit bone formation, while when generated in the brain, it acts as a neurotransmitter to create a major and positive effect on bone mass accrual by enhancing bone formation and limiting bone resorption.34,35
Potential confounders complicate the effect of SSRIs on bone health, as depression itself may be a risk factor for fracture. Patients with depression tend to have increased inflammation and cortisol, decreased gonadal steroids, more behavioral risk factors such as tobacco and increased alcohol use, and less physical activity, all of which can contribute to low bone density and risk of falls and fractures.33
Daily use of SSRIs increases fracture risk
A 2012 meta-analysis36 of 12 studies (seven case-control and five cohort), showed that SSRI users had a higher overall risk of fracture (adjusted odds ratio 1.69, 95% CI 1.51–1.90). By anatomic site, pooled odds ratios and 95% CIs were:
- Vertebral fractures 1.34 (1.13–1.59)
- Wrist or forearm fractures 1.51 (1.26–1.82)
- Hip or femur fractures 2.06 (1.84–2.30).
A 2013 meta-analysis37 of 34 studies with more than 1 million patients found that the random-effects pooled relative risk of all fracture types in users of antidepressants (including but not limited to SSRIs) was 1.39 (95% CI 1.32–1.47) compared with nonusers. Relative risks and 95% CIs in antidepressant users were:
- Vertebral fractures 1.38 (1.19–1.61)
- Nonvertebral fractures 1.42 (1.34–1.51)
- Hip fractures 1.47 (1.36–1.58).
A population-based, prospective cohort study38 of 5,008 community-dwelling adults age 50 and older, followed for 5 years, found that the daily use of SSRIs was associated with a twofold increased risk of clinical fragility fractures (defined as minimal trauma fractures that were clinically reported and radiographically confirmed) after adjusting for potential covariates. Daily SSRI use was also associated with an increased risk of falling (odds ratio 2.2, 95% CI 1.4–3.5), lower bone mineral density at the hip, and a trend toward lower bone mineral density at the spine. These effects were dose-dependent and were similar for those who reported taking SSRIs at baseline and at 5 years.
Bottom line: Counsel bone health
Although no guidelines exist for preventing or treating SSRI-induced bone loss, providers should discuss with patients the potential effect of these medications on bone health, taking into account patient age, severity of depression, sex, duration of use, length of SSRI treatment, and other clinical risk factors for osteoporosis.34 Given the widespread use of these medications for treating depression, more study into this association is needed to further guide providers.
ANTIEPILEPTIC DRUGS
Antiepileptic drugs are used to treat not only seizure disorders but also migraine headaches, neuropathy, and psychiatric and pain disorders. Many studies have linked their use to an increased risk of fractures.
The mechanism of this effect remains controversial. Early studies reported that inducers of cytochrome P450 enzymes (eg, phenobarbital, phenytoin) lead to increased vitamin D degradation, causing osteomalacia.39 Another study suggested that changes in calcium metabolism and reduced bone mineral density occur without vitamin D deficiency and that drugs such as valproate that do not induce cytochrome P450 enzymes may also affect bone health.40 Other bone effects may include direct inhibition of intestinal calcium absorption (seen in animal studies) and the induction of a high remodeling state leading to osteomalacia.41,42
Epilepsy itself increases risk of fractures
Patients with seizure disorders may also have an increased risk of fractures because of falls, trauma, impaired balance, use of glucocorticoids and benzodiazepines, and comorbid conditions (eg, mental retardation, cerebral palsy, and brain neoplasm).43
A 2005 meta-analysis43 of 11 studies of epilepsy and fracture risk and 12 studies of epilepsy and bone mineral density found that the risks of fractures were increased. The following relative risks and 95% CIs were noted:
- Any fracture 2.2 (1.9–2.5), in five studies
- Forearm 1.7 (1.2–2.3), in six studies
- Hip 5.3 (3.2–8.8), six studies
- Spine 6.2 (2.5–15.5), in three studies.
A large proportion of fractures (35%) seemed related to seizures.
Certain drugs increase risk
A large 2004 population-based, case-control, study44 (124,655 fracture cases and 373,962 controls) found an association between the use of antiepileptic drugs and increased fracture risk. After adjusting for current or prior use of glucocorticoids, prior fracture, social variables, comorbid conditions, and epilepsy diagnosis, excess fracture risk was found to be associated with the following drugs (odds ratios and 95% CIs):
- Oxcarbazepine 1.14 (1.03–1.26)
- Valproate 1.15 (1.05–1.26)
- Carbamazepine 1.18 (1.10-1.26)
- Phenobarbital 1.79 (1.64–1.95).
The risk was higher with higher doses. Fracture risk was higher with cytochrome P450 enzyme-inducing drugs (carbamazepine, oxcarbazepine, phenobarbital, phenytoin, and primidone; odds ratio 1.38, 95% CI 1.31–1.45) than for noninducing drugs (clonazepam, ethosuximide, lamotrigine, tiagabine, topiramate, valproate, and vigabatrin; odds ratio 1.19, 95% CI 1.11–1.27). No significant increased risk of fracture was found with use of phenytoin, tiagabine, topiramate, ethosuximide, lamotrigine, vigabatrin, or primidone after adjusting for confounders.
Bottom line: Monitor bone health
With antiepileptic drugs, the benefit of preventing seizures outweighs the risks of fractures. Patients on long-term antiepileptic drug therapy should be monitored for bone mineral density and vitamin D levels and receive counseling on lifestyle measures including tobacco cessation, alcohol moderation, and fall prevention.45 As there are no evidence-based guidelines for bone health in patients on antiepileptic drugs, management should be based on current guidelines for treating osteoporosis.
AROMATASE INHIBITORS
Breast cancer is the most common cancer in women and is the second-leading cause of cancer-associated deaths in women after lung cancer. Aromatase inhibitors, such as anastrozole, letrozole, and exemestane, are the standard of care in adjuvant treatment for hormone-receptor-positive breast cancer, leading to longer disease-free survival.
However, aromatase inhibitors increase bone loss and fracture risk, and only partial recovery of bone mineral density occurs after treatment is stopped. The drugs deter the aromatization of androgens and their conversion to estrogens in peripheral tissue, leading to reduced estrogen levels and resulting bone loss.46 Anastrozole and letrozole have been found to reduce bone mineral density, increase bone turnover, and increase the relative risk for nonvertebral and vertebral fractures in postmenopausal women by 40% compared with tamoxifen.47,48
Base osteoporosis treatment on risk
Several groups have issued guidelines for preventing and treating bone loss in postmenopausal women being treated with an aromatase inhibitor. When initiating treatment, women should be counseled about modifiable risk factors, exercise, and calcium and vitamin D supplementation.
Baseline bone mineral testing should also be obtained when starting treatment. Hadji et al,49 in a review article, recommend starting bone-directed therapy if the patient’s T score is less than –2.0 (using the lowest score from three sites) or if she has any of at least two of the following fracture risk factors:
- T score less than –1.5
- Age over 65
- Family history of hip fracture
- Personal history of fragility fracture after age 50
- Low body mass index (< 20 kg/m2)
- Current or prior history of tobacco use
- Oral glucocorticoid use for longer than 6 months.
Patients with a T score at or above –2.0 and no risk factors should have bone mineral density reassessed after 1 to 2 years. Antiresorptive therapy with intravenous zoledronic acid and evaluation for other secondary causes of bone loss should be initiated for either:
- An annual decrease of at least 10% or
- An annual decrease of at least 4% in patients with osteopenia at baseline.49
In 2003, the American Society of Clinical Oncology updated its recommendations on the role of bisphosphonates and bone health in women with breast cancer.50 They recommend the following:
- If the T score is –2.5 or less, prescribe a bisphosphonate (alendronate, risedronate, or zoledronic acid)
- If the T score is –1.0 to –2.5, tailor treatment individually and monitor bone mineral density annually
- If the T score is greater than –1.0, monitor bone mineral density annually.
All patients should receive lifestyle counseling, calcium and vitamin D supplementation, and monitoring of additional risk factors for osteoporosis as appropriate.50
- Canalis E, Delany AM. Mechanisms of glucocorticoid action in bone. Ann N Y Acad Sci 2002; 966:73–81.
- Manolagas SC. Corticosteroids and fractures: a close encounter of the third cell kind. J Bone Miner Res 2000; 15:1001–1005.
- Papaioannou A, Ferko NC, Adachi JD. Corticosteroids and the skeletal system. In: Lin AN, Paget SA, eds. Principles of corticosteroid therapy. New York, NY: Arnold Publishers; 2002:69–86.
- Van Staa TP. The pathogenesis, epidemiology, and management of glucocorticoid-induced osteoporosis. Calcif Tissue Int 2006; 79:129–137.
- Van Staa TP, Leufkens HG, Cooper C. The epidemiology of corticosteroid-induced osteoporosis: a meta-analysis. Osteoporosis Int 2002; 13:777–787.
- Clowes JA, Riggs BL, Khosla S. The role of the immune system in the pathophysiology of osteoporosis. Immunol Rev 2005; 208:207–227.
- LoCascio V, Bonucci E, Imbimbo B, et al. Bone loss in response to long-term glucocorticoid therapy. Bone Miner 1990; 8:39–51.
- Lane NE, Lukert B. The science and therapy of glucocorticoid-induced bone loss. Endocrinol Metab Clin North Am 1998; 27:465–483.
- Kanis JA, Johansson H, Oden A, et al. A meta-analysis of prior corticosteroid use and fracture risk. J Bone Miner Res 2004; 19:893–899.
- Van Staa TP, Geusens P, Pols HA, de Laet C, Leufkens HG, Cooper C. A simple score for estimating the long-term risk of fracture in patients using oral glucocorticoids. QJM 2005; 98:191–198.
- Van Staa TP, Leufkens HG, Abenhaim L, Zhang B, Cooper C. Oral corticosteroids and fracture risk: relationship to daily and cumulative doses. Rheumatology (Oxford) 2000; 39:1383–1389.
- Van Staa TP, Leufkens HG, Abenhaim L, Zhang B, Cooper C. Use of corticosteroids and risk of fractures. J Bone Miner Res 2000; 15:993–1000.
- Van Staa TP, Laan RF, Barton IP, Cohen S, Reid DM, Cooper C. Bone density threshold and other predictors of vertebral fracture in patients receiving oral glucocorticoid therapy. Arthritis Rheum 2003; 48:3224–3229.
- Luengo M, Picado C, Del Rio L, Guanabens N, Montserrat JM, Setoain J. Vertebral fractures in steroid dependent asthma and involutional osteoporosis: a comparative study. Thorax 1991; 46:803–806.
- Selby PL, Halsey JP, Adams KRH, et al. Corticosteroids do not alter the threshold for vertebral fracture. J Bone Miner Res 2000; 15:952–956.
- Gonnelli S, Caffarelli C, Maggi S, et al. Effect of inhaled glucocorticoids and beta(2) agonists on vertebral fracture risk in COPD patients: the EOLO study. Calcif Tissue Int 2010; 87:137–143.
- Jones A, Fay JK, Burr M, Stone M, Hood K, Roberts G. Inhaled corticosteroid effects on bone metabolism in asthma and mild chronic obstructive pulmonary disease. Cochrane Database Syst Rev 2002; 1:CD003537.
- Weatherall M, James K, Clay J, et al. Dose-response relationship for risk of non-vertebral fracture with inhaled corticosteroids. Clin Exp Allergy 2008; 38:1451–1458
- Buehring B, Viswanathan R, Binkley N, Busse W. Glucocorticoid-induced osteoporosis: an update on effects and management. J Allergy Clin Immunol 2013; 132:1019–1030.
- Grossman JM, Gordon R, Ranganath VK, et al. American College of Rheumatology 2010 recommendations for the prevention and treatment of glucocorticoid-induced osteoporosis. Arthritis Care Res (Hoboken) 2010; 62:1515–1526.
- Naunton M, Peterson GM, Bleasel MD. Overuse of proton pump inhibitors. J Clin Pharm Ther 2000; 25:333–340.
- Wilhelm SM, Rjater RG, Kale-Pradhan PB. Perils and pitfalls of long-term effects of proton pump inhibitors. Expert Rev Clin Pharmacol 2013; 6:443–451.
- Sheikh MS, Santa Ana CA, Nicar MJ, Schiller LR, Fordtran JS. Gastrointestinal absorption of calcium from milk and calcium salts. N Engl J Med 1987; 317:532–536.
- Yang YX, Lewis JD, Epstein S, Metz DC. Long-term proton pump inhibitor therapy and risk of hip fracture. JAMA 2006; 296:2947–2953.
- Vestergaard P, Rejnmark L, Mosekilde L. Proton pump inhibitors, histamine H2 receptor antagonists, and other antacid medications and the risk of fracture. Calcif Tissue Int 2006; 79:76–83.
- Food and Drug Administration (FDA). FDA drug safety communication: possible increased risk of fractures of the hip, wrist, and spine with the use of proton pump inhibitors. www.fda.gov/Drugs/DrugSafety/PostmarketDrugSafetyInformationforPatientsandProviders/ucm213206.htm. Accessed March 7, 2016.
- Targownik LE, Lix LM, Metge CJ, Prior HJ, Leung S, Leslie WD. Use of proton pump inhibitors and risk of osteoporosis-related fractures. CMAJ 2008; 179:319–326.
- Kaye JA, Jick H. Proton pump inhibitor use and risk of hip fractures in patients without major risk factors. Pharmacotherapy 2008; 28:951–959.
- Corley DA, Kubo A, Zhao W, Quesenberry C. Proton pump inhibitors and histamine-2 receptor antagonists are associated with hip fractures among at-risk patients. Gastroenterology 2010; 139:93–101.
- Gray SL, LaCroix AZ, Larson J, et al. Proton pump inhibitor use, hip fracture, and change in bone mineral density in postmenopausal women: results from the Women’s Health Initiative. Arch Intern Med 2010; 170:765–771.
- Yu EW, Blackwell T, Ensrud KE, et al. Acid-suppressive medications and risk of bone loss and fracture in older adults. Calcif Tissue Int 2008; 83:251–259.
- Leontiadis GI, Moayyedi P. Proton pump inhibitors and risk of bone fractures. Curr Treat Options Gastroenterol 2014; 12:414–423.
- Chen F, Hahn TJ, Weintraub NT. Do SSRIs play a role in decreasing bone mineral density? J Am Med Dir Assoc 2012; 13:413–417.
- Bruyere O, Reginster JY. Osteoporosis in patients taking selective serotonin reuptake inhibitors: a focus on fracture outcome. Endocrine 2015; 48:65–68.
- Ducy P, Karsenty G. The two faces of serotonin in bone biology. J Cell Biol 2010; 191:7–13.
- Eom CS, Lee HK, Ye S, Park SM, Cho KH. Use of selective serotonin reuptake inhibitors and risk of fracture: a systematic review and meta-analysis. J Bone Miner Res 2012; 27:1186–1195.
- Rabenda V, Nicolet D, Beaudart C, Bruyere O, Reginster JY. Relationship between use of antidepressants and risk of fractures: a meta-analysis. Osteoporosis Int 2013; 24:121–137.
- Richards JB, Papaioannou A, Adachi JD, et al; Canadian Multicentre Osteoporosis Study Research Group. Effect of selective serotonin reuptake inhibitors on the risk of fracture. Arch Intern Med 2007; 22;167:188–194.
- Hahn TJ, Hendin BA, Scharp CR, Boisseau VC, Haddad JG Jr. Serum 25-hydroxycalciferol levels and bone mass in children on chronic anticonvulsant therapy. N Engl J Med 1975; 292:550–554.
- Weinstein RS, Bryce GF, Sappington LJ, King DW, Gallagher BB. Decreased serum ionized calcium and normal vitamin D metabolite levels with anticonvulsant drug treatment. J Clin Endocrinol Metab 1984; 58:1003–1009.
- Koch HU, Kraft D, von Herrath D, Schaefer K. Influence of diphenylhydantoin and phenobarbital on intestinal calcium transport in the rat. Epilepsia 1972; 13:829–834.
- Shane E. Osteoporosis associated with illness and medications. In: Marcus R, Feldman D, Kelsey J, editors. Osteoporosis. San Diego, CA: Academic Press; 1996.
- Vestergaard P. Epilepsy, osteoporosis and fracture risk—a meta-analysis. Acta Neurol Scand 2005; 112:277–286.
- Vestergaard P, Rejnmark L, Mosekilde L. Fracture risk associated with use of antiepileptic drugs. Epilepsia 2004; 45:1330–1337.
- Petty SJ, O’Brien TJ, Wark JD. Anti-epileptic medication and bone health. Osteoporos Int 2007; 18:129–142.
- Mazziotti G, Canalis E, Giustina A. Drug-induced osteoporosis: mechanisms and clinical implications. Am J Med 2010; 123:877–884.
- Rabaglio M, Sun Z, Price KN, et al; BIG 1-98 Collaborative and International Breast Cancer Study Groups. Bone fractures among postmenopausal patients with endocrine-responsive early breast cancer treated with 5 years of letrozole or tamoxifen in the BIG 1-98 trial. Ann Oncol 2009; 20:1489–1498.
- Khan MN, Khan AA. Cancer treatment-related bone loss: a review and synthesis of the literature. Curr Oncol 2008; 15:S30–S40.
- Hadji P, Aapro MS, Body JJ, et al. Management of aromatase inhibitor-associated bone loss in postmenopausal women with breast cancer: practical guidance for prevention and treatment. Ann Oncol 2011; 22:2546–2555.
- Hillner BE, Ingle JN, Chlebowski RT, et al; American Society of Clinical Oncology. American Society of Clinical Oncology 2003 update on the role of bisphosphonates and bone health issues in breast cancer. J Clin Oncol 2003; 21:4042–4057.
Drug-induced osteoporosis is common, and the list of drugs that can harm bone continues to grow. As part of routine health maintenance, practitioners should recognize the drugs that increase bone loss and take measures to mitigate these effects to help avoid osteopenia and osteoporosis.
Osteoporosis, a silent systemic disease defined by low bone mineral density and changes in skeletal microstructure, leads to a higher risk of fragility fractures. Some of the risk factors are well described, but less well known is the role of pharmacologic therapy. The implicated drugs (Table 1) have important therapeutic roles, so the benefits of using them must be weighed against their risks, including their potential effects on bone.
This review focuses on a few drugs known to increase fracture risk, their mechanisms of bone loss, and management considerations (Table 2).
GLUCOCORTICOIDS
Glucocorticoids are used to treat many medical conditions, including allergic, rheumatic, and other inflammatory diseases, and as immunosuppressive therapy after solid organ and bone marrow transplant. They are the most common cause of drug-induced bone loss and related secondary osteoporosis.
Multiple effects on bone
Glucocorticoids both increase bone resorption and decrease bone formation by a variety of mechanisms.1 They reduce intestinal calcium absorption, increase urinary excretion of calcium, and enhance osteocyte apoptosis, leading to deterioration of the bone microarchitecture and bone mineral density.2 They also affect sex hormones, decreasing testosterone production in men and estrogen in women, leading to increased bone resorption, altered bone architecture, and poorer bone quality.3,4 The bone loss is greater in trabecular bone (eg, the femoral neck and vertebral bodies) than in cortical bone (eg, the forearm).5
Glucocorticoids have other systemic effects that increase fracture risk. For example, they cause muscle weakness and atrophy, increasing the risk of falls.4 Additionally, many of the inflammatory conditions for which they are prescribed (eg, rheumatoid arthritis) also increase the risk of osteoporosis by means of proinflammatory cytokine production, which may contribute to systemic and local effects on bone.4,6
Bone mineral density declines quickly
Bone mineral density declines within the first 3 months after starting oral glucocorticoids, with the rate of bone loss peaking at 6 months. Up to 12% of bone mass is lost in the first year. In subsequent years of continued use, bone loss progresses at a slower, steadier rate, averaging 2% to 3% annually.5,7,8
Oral therapy increases fracture risk
Kanis et al9 performed a meta-analysis of seven prospective cohort studies in 40,000 patients and found that the current or previous use of an oral glucocorticoid increased the risk of fragility fractures, and that men and women were affected about equally.9
Van Staa et al10,11 reported that daily doses of glucocorticoids equivalent to more than 2.5 mg of prednisone were associated with an increased risk of vertebral and hip fractures; fracture risk was related mainly to daily dosage rather than cumulative dose.
Van Staa et al,12 in a retrospective cohort study, compared nearly 250,000 adult users of oral glucocorticoids from general medical practice settings with the same number of controls matched for sex, age, and medical practice. The relative risks for fractures and 95% confidence intervals (CIs) during oral glucocorticoid treatment were as follows:
- Forearm fracture 1.09 (1.01–1.17)
- Nonvertebral fracture 1.33 (1.29–1.38)
- Hip fracture 1.61 (1.47–1.76)
- Vertebral fracture 2.60 (2.31–2.92).
The risk was dose-dependent. For a low daily dose (< 2.5 mg/day of prednisolone), the relative risks were:
- Hip fracture 0.99 (0.82–1.20)
- Vertebral fracture 1.55 (1.20–2.01) .
For a medium daily dose (2.5–7.5 mg/day), the relative risks were:
- Hip fracture 1.77 (1.55–2.02)
- Vertebral fracture 2.59 (2.16–3.10) .
For a high daily dose (> 7.5 mg/day), the relative risks were:
- Hip fracture 2.27 (1.94–2.66)
- Vertebral fracture 5.18 (4.25–6.31).
Fracture risk rapidly declined toward baseline after the patients stopped taking oral glucocorticoids but did not return to baseline levels. The lessening of excess fracture risk occurred mainly within the first year after stopping therapy.
Other studies5,9,13 have suggested that the increased fracture risk is mostly independent of bone mineral density, and that other mechanisms are at play. One study14 found that oral glucocorticoid users with a prevalent vertebral fracture actually had higher bone mineral density than patients with a fracture not taking glucocorticoids, although this finding was not confirmed in a subsequent study.15
Inhaled glucocorticoids have less effect on bone
Inhaled glucocorticoids are commonly used to treat chronic obstructive pulmonary disease and asthma. They do not have the same systemic bioavailability as oral glucocorticoids, so the risk of adverse effects is lower.
Data are inconsistent among several studies that evaluated the relationship between inhaled glucocorticoids, bone mineral density, osteoporosis, and fragility fracture. The inconsistencies may be due to heterogeneity of the study populations, self-reporting of fractures, and different methods of assessing chronic obstructive pulmonary disease severity.16
A Cochrane review17 in 2002 evaluated seven randomized controlled trials that compared the use of inhaled glucocorticoids vs placebo in nearly 2,000 patients with mild asthma or chronic obstructive pulmonary disease and found no evidence for decreased bone mineral density, increased bone turnover, or increased vertebral fracture incidence in the glucocorticoid users at 2 to 3 years of follow-up (odds ratio for fracture 1.87, 95% CI 0.5–7.0).
The Evaluation of Obstructive Lung Disease and Osteoporosis study,16 a multicenter Italian observational epidemiologic study, reported that patients taking the highest daily doses of inhaled glucocorticoids (> 1,500 μg of beclomethasone or its equivalent) had a significantly higher risk of vertebral fracture (odds ratio 1.4, 95% CI 1.04–1.89).16
A meta-analysis18 of five case-control studies (43,783 cases and 259,936 controls) identified a possible dose-dependent relationship, with a relative risk for nonvertebral fracture of 1.12 (95% CI 1.0–1.26) for each 1,000-μg increase in beclomethasone-equivalent inhaled glucocorticoid per day.
In summary, the effects of inhaled glucocorticoids in adults are uncertain, although trends toward increased fracture risk and decreased bone mineral density are evident with chronic therapy at moderate to high dosages. The risks and benefits of treatment should be carefully considered in patients with osteoporosis and baseline elevated fracture risk.19
Managing the risk of glucocorticoid-induced osteoporosis
In 2010, the American College of Rheumatology published recommendations for preventing and treating glucocorticoid-induced osteoporosis, which were endorsed by the American Society for Bone and Mineral Research.20 To lessen the risk of osteoporosis, the recommendations are as follows:
Limit exposure. Patients receiving glucocorticoids should be given the smallest dosage for the shortest duration possible.
Advise lifestyle changes. Patients should be counseled to limit their alcohol intake to no more than two drinks per day, to quit smoking, to engage in weight-bearing exercise, and to ingest enough calcium (1,200–1,500 mg/day, through diet and supplements) and vitamin D.
Monitor bone mineral density. Patients starting glucocorticoids at any dosage for an expected duration of at least 3 months should have their bone mineral density measured at baseline. The frequency of subsequent measurements should be based on the presence of other risk factors for fracture, results of previous bone density testing, glucocorticoid dosage, whether therapy for bone health has been initiated, and the rate of change in bone mineral density. If warranted and if the results would lead to a change in management, patients can undergo dual-energy x-ray absorptiometry more often than usual, ie, more often than every 2 years. Prevalent and incident fragility fractures, height measurements, fall risk assessments, laboratory measurements of 25-hydroxyvitamin D, and consideration of vertebral fracture assessment or other imaging of the spine, as necessary, should be part of counseling and monitoring.
Osteoporosis treatment. For patients who will be taking glucocorticoids for at least 3 months, alendronate, risedronate, zoledronic acid, or teriparatide can be initiated to prevent or treat osteoporosis in the following groups:
- Postmenopausal women and men over age 50 if the daily glucocorticoid dosage is at least 7.5 mg/day or if the World Health Organization Fracture Risk Assessment Tool (FRAX) score is more than 10% (the threshold for medium fracture risk)
- Premenopausal women and men younger than 50 if they have a history of fragility fracture, the FRAX score is more than 20% (the threshold for high fracture risk), or the T score is less than –2.5.
Certain clinical factors can also put a patient into a higher-risk category. These include current tobacco use, low body mass index, parental history of hip fracture, consuming more than three alcoholic drinks daily, higher daily or cumulative glucocorticoid dosage, intravenous pulse glucocorticoid usage, or a decline in central bone mineral density that exceeds the least significant change according to the scanner used.20
The FRAX tool accounts for bone density only at the femoral neck, and while useful, it cannot replace clinical judgment in stratifying risk. Moreover, it does not apply to premenopausal women or men under age 40.
The long-term risks of medications to treat glucocorticoid-induced osteoporosis are not well defined for premenopausal women (or their unborn children) or in men younger than 40, so treatment is recommended in those groups only for those with prevalent fragility fractures who are clearly at higher risk of additional fractures.20
PROTON PUMP INHIBITORS
Proton pump inhibitors are available by prescription and over the counter for gastric acid-related conditions. Concerns have been raised that these highly effective drugs are overused.21 Several of their adverse effects are self-limited and minor, but long-term use may entail serious risks, including propensity to bone fracture.22
Low acid leads to poor calcium absorption
Why fracture risk increases with proton pump inhibitors is controversial and may relate to their desired effect of suppressing gastric acid production: calcium salts, including carbonate and chloride, are poorly soluble and require an acidic environment to increase calcium ionization and thus absorption.23 For this reason, if patients taking a proton pump inhibitor take a calcium supplement, it should be calcium citrate, which unlike calcium carbonate does not require an acid environment for absorption.
Higher risk in older patients, with longer use, and with higher dosage
Since the first reports on proton pump inhibitors and fracture risk were published in 2006,24,25 a number of studies have reported this association, including several systematic reviews.
In 2011, the US Food and Drug Administration (FDA) updated a 2010 safety communication based on seven epidemiologic studies reporting an increased risk of fractures of the spine, hip, and wrist with proton pump inhibitors.24–31 Time of exposure to a proton pump inhibitor in these studies varied from 1 to 12 years. Fracture risk was higher in older patients,26 with higher doses,24,29 and with longer duration of drug use.24,27 On the other hand, one study that included only patients without other major fracture risk factors failed to find an association between the use of proton pump inhibitors and fractures.28
Is evidence sufficient for changing use?
The FDA report included a disclaimer that they had no access to study data or protocols and so could not verify the findings.26 Moreover, the studies used claims data from computerized databases to evaluate the risk of fractures in patients treated with proton pump inhibitors compared with those not using these drugs.24–31 Information was often incomplete regarding potentially important factors (eg, falls, family history of osteoporosis, calcium and vitamin D intake, smoking, alcohol use, reason for medication use), as well as the timing of drug use related to the onset or worsening of osteoporosis.26
Although 34 published studies evaluated the association of fracture risk and proton pump inhibitors, Leontiadis and Moayyedi32 argued that insufficient evidence exists to change our prescribing habits for these drugs based on fracture risk, as the studies varied considerably in their designs and results, a clear dose-response relationship is lacking, and the modest association is likely related to multiple confounders.
Bottom line: Use with caution
Although the increased fracture risk associated with proton pump inhibitors is likely multifactorial and is not fully delineated, it appears to be real. These drugs should be used only if there is a clear indication for them and if their benefits likely outweigh their risks. The lowest effective dose should be used, and the need for continuing use should be frequently reassessed.
SELECTIVE SEROTONIN REUPTAKE INHIBITORS
Depression affects 1 in 10 people in the United States, is especially common in the elderly, and leads to significant morbidity and reduced quality of life.33 Selective serotonin reuptake inhibitors (SSRIs) are often prescribed and are generally considered first-line agents for treating depression.
Complex bone effects
SSRIs antagonize the serotonin transporter, which normally assists serotonin uptake from the extracellular space. The serotonin transporter is found in all main types of bone cells, including osteoclasts, osteoblasts, and osteocytes.33 Serotonin is made by different genes in the brain than in the periphery, causing opposing effects on bone biology: when generated peripherally, it acts as a hormone to inhibit bone formation, while when generated in the brain, it acts as a neurotransmitter to create a major and positive effect on bone mass accrual by enhancing bone formation and limiting bone resorption.34,35
Potential confounders complicate the effect of SSRIs on bone health, as depression itself may be a risk factor for fracture. Patients with depression tend to have increased inflammation and cortisol, decreased gonadal steroids, more behavioral risk factors such as tobacco and increased alcohol use, and less physical activity, all of which can contribute to low bone density and risk of falls and fractures.33
Daily use of SSRIs increases fracture risk
A 2012 meta-analysis36 of 12 studies (seven case-control and five cohort), showed that SSRI users had a higher overall risk of fracture (adjusted odds ratio 1.69, 95% CI 1.51–1.90). By anatomic site, pooled odds ratios and 95% CIs were:
- Vertebral fractures 1.34 (1.13–1.59)
- Wrist or forearm fractures 1.51 (1.26–1.82)
- Hip or femur fractures 2.06 (1.84–2.30).
A 2013 meta-analysis37 of 34 studies with more than 1 million patients found that the random-effects pooled relative risk of all fracture types in users of antidepressants (including but not limited to SSRIs) was 1.39 (95% CI 1.32–1.47) compared with nonusers. Relative risks and 95% CIs in antidepressant users were:
- Vertebral fractures 1.38 (1.19–1.61)
- Nonvertebral fractures 1.42 (1.34–1.51)
- Hip fractures 1.47 (1.36–1.58).
A population-based, prospective cohort study38 of 5,008 community-dwelling adults age 50 and older, followed for 5 years, found that the daily use of SSRIs was associated with a twofold increased risk of clinical fragility fractures (defined as minimal trauma fractures that were clinically reported and radiographically confirmed) after adjusting for potential covariates. Daily SSRI use was also associated with an increased risk of falling (odds ratio 2.2, 95% CI 1.4–3.5), lower bone mineral density at the hip, and a trend toward lower bone mineral density at the spine. These effects were dose-dependent and were similar for those who reported taking SSRIs at baseline and at 5 years.
Bottom line: Counsel bone health
Although no guidelines exist for preventing or treating SSRI-induced bone loss, providers should discuss with patients the potential effect of these medications on bone health, taking into account patient age, severity of depression, sex, duration of use, length of SSRI treatment, and other clinical risk factors for osteoporosis.34 Given the widespread use of these medications for treating depression, more study into this association is needed to further guide providers.
ANTIEPILEPTIC DRUGS
Antiepileptic drugs are used to treat not only seizure disorders but also migraine headaches, neuropathy, and psychiatric and pain disorders. Many studies have linked their use to an increased risk of fractures.
The mechanism of this effect remains controversial. Early studies reported that inducers of cytochrome P450 enzymes (eg, phenobarbital, phenytoin) lead to increased vitamin D degradation, causing osteomalacia.39 Another study suggested that changes in calcium metabolism and reduced bone mineral density occur without vitamin D deficiency and that drugs such as valproate that do not induce cytochrome P450 enzymes may also affect bone health.40 Other bone effects may include direct inhibition of intestinal calcium absorption (seen in animal studies) and the induction of a high remodeling state leading to osteomalacia.41,42
Epilepsy itself increases risk of fractures
Patients with seizure disorders may also have an increased risk of fractures because of falls, trauma, impaired balance, use of glucocorticoids and benzodiazepines, and comorbid conditions (eg, mental retardation, cerebral palsy, and brain neoplasm).43
A 2005 meta-analysis43 of 11 studies of epilepsy and fracture risk and 12 studies of epilepsy and bone mineral density found that the risks of fractures were increased. The following relative risks and 95% CIs were noted:
- Any fracture 2.2 (1.9–2.5), in five studies
- Forearm 1.7 (1.2–2.3), in six studies
- Hip 5.3 (3.2–8.8), six studies
- Spine 6.2 (2.5–15.5), in three studies.
A large proportion of fractures (35%) seemed related to seizures.
Certain drugs increase risk
A large 2004 population-based, case-control, study44 (124,655 fracture cases and 373,962 controls) found an association between the use of antiepileptic drugs and increased fracture risk. After adjusting for current or prior use of glucocorticoids, prior fracture, social variables, comorbid conditions, and epilepsy diagnosis, excess fracture risk was found to be associated with the following drugs (odds ratios and 95% CIs):
- Oxcarbazepine 1.14 (1.03–1.26)
- Valproate 1.15 (1.05–1.26)
- Carbamazepine 1.18 (1.10-1.26)
- Phenobarbital 1.79 (1.64–1.95).
The risk was higher with higher doses. Fracture risk was higher with cytochrome P450 enzyme-inducing drugs (carbamazepine, oxcarbazepine, phenobarbital, phenytoin, and primidone; odds ratio 1.38, 95% CI 1.31–1.45) than for noninducing drugs (clonazepam, ethosuximide, lamotrigine, tiagabine, topiramate, valproate, and vigabatrin; odds ratio 1.19, 95% CI 1.11–1.27). No significant increased risk of fracture was found with use of phenytoin, tiagabine, topiramate, ethosuximide, lamotrigine, vigabatrin, or primidone after adjusting for confounders.
Bottom line: Monitor bone health
With antiepileptic drugs, the benefit of preventing seizures outweighs the risks of fractures. Patients on long-term antiepileptic drug therapy should be monitored for bone mineral density and vitamin D levels and receive counseling on lifestyle measures including tobacco cessation, alcohol moderation, and fall prevention.45 As there are no evidence-based guidelines for bone health in patients on antiepileptic drugs, management should be based on current guidelines for treating osteoporosis.
AROMATASE INHIBITORS
Breast cancer is the most common cancer in women and is the second-leading cause of cancer-associated deaths in women after lung cancer. Aromatase inhibitors, such as anastrozole, letrozole, and exemestane, are the standard of care in adjuvant treatment for hormone-receptor-positive breast cancer, leading to longer disease-free survival.
However, aromatase inhibitors increase bone loss and fracture risk, and only partial recovery of bone mineral density occurs after treatment is stopped. The drugs deter the aromatization of androgens and their conversion to estrogens in peripheral tissue, leading to reduced estrogen levels and resulting bone loss.46 Anastrozole and letrozole have been found to reduce bone mineral density, increase bone turnover, and increase the relative risk for nonvertebral and vertebral fractures in postmenopausal women by 40% compared with tamoxifen.47,48
Base osteoporosis treatment on risk
Several groups have issued guidelines for preventing and treating bone loss in postmenopausal women being treated with an aromatase inhibitor. When initiating treatment, women should be counseled about modifiable risk factors, exercise, and calcium and vitamin D supplementation.
Baseline bone mineral testing should also be obtained when starting treatment. Hadji et al,49 in a review article, recommend starting bone-directed therapy if the patient’s T score is less than –2.0 (using the lowest score from three sites) or if she has any of at least two of the following fracture risk factors:
- T score less than –1.5
- Age over 65
- Family history of hip fracture
- Personal history of fragility fracture after age 50
- Low body mass index (< 20 kg/m2)
- Current or prior history of tobacco use
- Oral glucocorticoid use for longer than 6 months.
Patients with a T score at or above –2.0 and no risk factors should have bone mineral density reassessed after 1 to 2 years. Antiresorptive therapy with intravenous zoledronic acid and evaluation for other secondary causes of bone loss should be initiated for either:
- An annual decrease of at least 10% or
- An annual decrease of at least 4% in patients with osteopenia at baseline.49
In 2003, the American Society of Clinical Oncology updated its recommendations on the role of bisphosphonates and bone health in women with breast cancer.50 They recommend the following:
- If the T score is –2.5 or less, prescribe a bisphosphonate (alendronate, risedronate, or zoledronic acid)
- If the T score is –1.0 to –2.5, tailor treatment individually and monitor bone mineral density annually
- If the T score is greater than –1.0, monitor bone mineral density annually.
All patients should receive lifestyle counseling, calcium and vitamin D supplementation, and monitoring of additional risk factors for osteoporosis as appropriate.50
- Canalis E, Delany AM. Mechanisms of glucocorticoid action in bone. Ann N Y Acad Sci 2002; 966:73–81.
- Manolagas SC. Corticosteroids and fractures: a close encounter of the third cell kind. J Bone Miner Res 2000; 15:1001–1005.
- Papaioannou A, Ferko NC, Adachi JD. Corticosteroids and the skeletal system. In: Lin AN, Paget SA, eds. Principles of corticosteroid therapy. New York, NY: Arnold Publishers; 2002:69–86.
- Van Staa TP. The pathogenesis, epidemiology, and management of glucocorticoid-induced osteoporosis. Calcif Tissue Int 2006; 79:129–137.
- Van Staa TP, Leufkens HG, Cooper C. The epidemiology of corticosteroid-induced osteoporosis: a meta-analysis. Osteoporosis Int 2002; 13:777–787.
- Clowes JA, Riggs BL, Khosla S. The role of the immune system in the pathophysiology of osteoporosis. Immunol Rev 2005; 208:207–227.
- LoCascio V, Bonucci E, Imbimbo B, et al. Bone loss in response to long-term glucocorticoid therapy. Bone Miner 1990; 8:39–51.
- Lane NE, Lukert B. The science and therapy of glucocorticoid-induced bone loss. Endocrinol Metab Clin North Am 1998; 27:465–483.
- Kanis JA, Johansson H, Oden A, et al. A meta-analysis of prior corticosteroid use and fracture risk. J Bone Miner Res 2004; 19:893–899.
- Van Staa TP, Geusens P, Pols HA, de Laet C, Leufkens HG, Cooper C. A simple score for estimating the long-term risk of fracture in patients using oral glucocorticoids. QJM 2005; 98:191–198.
- Van Staa TP, Leufkens HG, Abenhaim L, Zhang B, Cooper C. Oral corticosteroids and fracture risk: relationship to daily and cumulative doses. Rheumatology (Oxford) 2000; 39:1383–1389.
- Van Staa TP, Leufkens HG, Abenhaim L, Zhang B, Cooper C. Use of corticosteroids and risk of fractures. J Bone Miner Res 2000; 15:993–1000.
- Van Staa TP, Laan RF, Barton IP, Cohen S, Reid DM, Cooper C. Bone density threshold and other predictors of vertebral fracture in patients receiving oral glucocorticoid therapy. Arthritis Rheum 2003; 48:3224–3229.
- Luengo M, Picado C, Del Rio L, Guanabens N, Montserrat JM, Setoain J. Vertebral fractures in steroid dependent asthma and involutional osteoporosis: a comparative study. Thorax 1991; 46:803–806.
- Selby PL, Halsey JP, Adams KRH, et al. Corticosteroids do not alter the threshold for vertebral fracture. J Bone Miner Res 2000; 15:952–956.
- Gonnelli S, Caffarelli C, Maggi S, et al. Effect of inhaled glucocorticoids and beta(2) agonists on vertebral fracture risk in COPD patients: the EOLO study. Calcif Tissue Int 2010; 87:137–143.
- Jones A, Fay JK, Burr M, Stone M, Hood K, Roberts G. Inhaled corticosteroid effects on bone metabolism in asthma and mild chronic obstructive pulmonary disease. Cochrane Database Syst Rev 2002; 1:CD003537.
- Weatherall M, James K, Clay J, et al. Dose-response relationship for risk of non-vertebral fracture with inhaled corticosteroids. Clin Exp Allergy 2008; 38:1451–1458
- Buehring B, Viswanathan R, Binkley N, Busse W. Glucocorticoid-induced osteoporosis: an update on effects and management. J Allergy Clin Immunol 2013; 132:1019–1030.
- Grossman JM, Gordon R, Ranganath VK, et al. American College of Rheumatology 2010 recommendations for the prevention and treatment of glucocorticoid-induced osteoporosis. Arthritis Care Res (Hoboken) 2010; 62:1515–1526.
- Naunton M, Peterson GM, Bleasel MD. Overuse of proton pump inhibitors. J Clin Pharm Ther 2000; 25:333–340.
- Wilhelm SM, Rjater RG, Kale-Pradhan PB. Perils and pitfalls of long-term effects of proton pump inhibitors. Expert Rev Clin Pharmacol 2013; 6:443–451.
- Sheikh MS, Santa Ana CA, Nicar MJ, Schiller LR, Fordtran JS. Gastrointestinal absorption of calcium from milk and calcium salts. N Engl J Med 1987; 317:532–536.
- Yang YX, Lewis JD, Epstein S, Metz DC. Long-term proton pump inhibitor therapy and risk of hip fracture. JAMA 2006; 296:2947–2953.
- Vestergaard P, Rejnmark L, Mosekilde L. Proton pump inhibitors, histamine H2 receptor antagonists, and other antacid medications and the risk of fracture. Calcif Tissue Int 2006; 79:76–83.
- Food and Drug Administration (FDA). FDA drug safety communication: possible increased risk of fractures of the hip, wrist, and spine with the use of proton pump inhibitors. www.fda.gov/Drugs/DrugSafety/PostmarketDrugSafetyInformationforPatientsandProviders/ucm213206.htm. Accessed March 7, 2016.
- Targownik LE, Lix LM, Metge CJ, Prior HJ, Leung S, Leslie WD. Use of proton pump inhibitors and risk of osteoporosis-related fractures. CMAJ 2008; 179:319–326.
- Kaye JA, Jick H. Proton pump inhibitor use and risk of hip fractures in patients without major risk factors. Pharmacotherapy 2008; 28:951–959.
- Corley DA, Kubo A, Zhao W, Quesenberry C. Proton pump inhibitors and histamine-2 receptor antagonists are associated with hip fractures among at-risk patients. Gastroenterology 2010; 139:93–101.
- Gray SL, LaCroix AZ, Larson J, et al. Proton pump inhibitor use, hip fracture, and change in bone mineral density in postmenopausal women: results from the Women’s Health Initiative. Arch Intern Med 2010; 170:765–771.
- Yu EW, Blackwell T, Ensrud KE, et al. Acid-suppressive medications and risk of bone loss and fracture in older adults. Calcif Tissue Int 2008; 83:251–259.
- Leontiadis GI, Moayyedi P. Proton pump inhibitors and risk of bone fractures. Curr Treat Options Gastroenterol 2014; 12:414–423.
- Chen F, Hahn TJ, Weintraub NT. Do SSRIs play a role in decreasing bone mineral density? J Am Med Dir Assoc 2012; 13:413–417.
- Bruyere O, Reginster JY. Osteoporosis in patients taking selective serotonin reuptake inhibitors: a focus on fracture outcome. Endocrine 2015; 48:65–68.
- Ducy P, Karsenty G. The two faces of serotonin in bone biology. J Cell Biol 2010; 191:7–13.
- Eom CS, Lee HK, Ye S, Park SM, Cho KH. Use of selective serotonin reuptake inhibitors and risk of fracture: a systematic review and meta-analysis. J Bone Miner Res 2012; 27:1186–1195.
- Rabenda V, Nicolet D, Beaudart C, Bruyere O, Reginster JY. Relationship between use of antidepressants and risk of fractures: a meta-analysis. Osteoporosis Int 2013; 24:121–137.
- Richards JB, Papaioannou A, Adachi JD, et al; Canadian Multicentre Osteoporosis Study Research Group. Effect of selective serotonin reuptake inhibitors on the risk of fracture. Arch Intern Med 2007; 22;167:188–194.
- Hahn TJ, Hendin BA, Scharp CR, Boisseau VC, Haddad JG Jr. Serum 25-hydroxycalciferol levels and bone mass in children on chronic anticonvulsant therapy. N Engl J Med 1975; 292:550–554.
- Weinstein RS, Bryce GF, Sappington LJ, King DW, Gallagher BB. Decreased serum ionized calcium and normal vitamin D metabolite levels with anticonvulsant drug treatment. J Clin Endocrinol Metab 1984; 58:1003–1009.
- Koch HU, Kraft D, von Herrath D, Schaefer K. Influence of diphenylhydantoin and phenobarbital on intestinal calcium transport in the rat. Epilepsia 1972; 13:829–834.
- Shane E. Osteoporosis associated with illness and medications. In: Marcus R, Feldman D, Kelsey J, editors. Osteoporosis. San Diego, CA: Academic Press; 1996.
- Vestergaard P. Epilepsy, osteoporosis and fracture risk—a meta-analysis. Acta Neurol Scand 2005; 112:277–286.
- Vestergaard P, Rejnmark L, Mosekilde L. Fracture risk associated with use of antiepileptic drugs. Epilepsia 2004; 45:1330–1337.
- Petty SJ, O’Brien TJ, Wark JD. Anti-epileptic medication and bone health. Osteoporos Int 2007; 18:129–142.
- Mazziotti G, Canalis E, Giustina A. Drug-induced osteoporosis: mechanisms and clinical implications. Am J Med 2010; 123:877–884.
- Rabaglio M, Sun Z, Price KN, et al; BIG 1-98 Collaborative and International Breast Cancer Study Groups. Bone fractures among postmenopausal patients with endocrine-responsive early breast cancer treated with 5 years of letrozole or tamoxifen in the BIG 1-98 trial. Ann Oncol 2009; 20:1489–1498.
- Khan MN, Khan AA. Cancer treatment-related bone loss: a review and synthesis of the literature. Curr Oncol 2008; 15:S30–S40.
- Hadji P, Aapro MS, Body JJ, et al. Management of aromatase inhibitor-associated bone loss in postmenopausal women with breast cancer: practical guidance for prevention and treatment. Ann Oncol 2011; 22:2546–2555.
- Hillner BE, Ingle JN, Chlebowski RT, et al; American Society of Clinical Oncology. American Society of Clinical Oncology 2003 update on the role of bisphosphonates and bone health issues in breast cancer. J Clin Oncol 2003; 21:4042–4057.
KEY POINTS
- Professional society guidelines advise initiating treatment for bone loss in patients starting glucocorticoid therapy expected to last at least 3 months and for women taking an aromatase inhibitor.
- If patients taking a proton pump inhibitor take a calcium supplement, they should take calcium citrate.
- Daily SSRI use nearly doubles the risk of hip fracture in people over age 50.
- Many drugs for epilepsy are associated with increased fracture risk, but so are seizures (which may confound the issue).

When does asymptomatic aortic stenosis warrant surgery? Assessment techniques
Aortic stenosis is the most common valvular heart condition in the developed world, affecting 3% of people between ages 75 and 851 and 4% of people over age 85.2 Aortic valve replacement remains the only treatment proven to reduce the rates of mortality and morbidity in this condition.3 Under current guidelines,4,5 the onset of symptoms of exertional angina, syncope, or dyspnea in a patient who has severe aortic stenosis is a class I indication for surgery—ie, surgery should be performed.
However, high-gradient, severe aortic stenosis that is asymptomatic often poses a dilemma. The annual rate of sudden death in patients with this condition is estimated at 1% to 3%,6–9 but the surgical mortality rate in aortic valve replacement has been as high as 6% in Medicare patients (varying by center and comorbidities).10 Therefore, the traditional teaching was to not surgically replace the valve in asymptomatic patients, based on an adverse risk-benefit ratio. But with improvements in surgical techniques and prostheses, these rates have been reduced to 2.41% at high-volume centers11 (and to less than 1% at some hospitals),12 arguing in favor of earlier intervention.
Complicating the issue, transcatheter aortic valve replacement has become widely available, but further investigation into its use in this patient cohort is warranted.
Furthermore, many patients with severe but apparently asymptomatic aortic stenosis and normal left ventricular ejection fraction may actually have impaired exercise capacity, or they may have structural left ventricular changes such as severe hypertrophy or reduction in global strain, which may worsen the long-term survival rate.13,14
A prospective trial in patients with severe aortic stenosis found that mortality rates were significantly lower in those who underwent surgery early than in those who received conventional treatment, ie, watchful waiting (no specific medical treatment for aortic stenosis is available).15
Patients with asymptomatic severe aortic stenosis are a diverse group; some have a far worse prognosis than others, with or without surgery.
This paper reviews the guidelines for valve replacement in this patient group and the factors useful in establishing who should be considered for early intervention even if they have no classic symptoms (Figure 1).
SIGNS AND SYMPTOMS OF STENOSIS
Aortic stenosis is often first suspected when a patient presents with angina, dyspnea, and syncope, or when an ejection systolic murmur is heard incidentally on physical examination—typically a high-pitched, crescendo-decrescendo, midsystolic ejection murmur that is best heard at the right upper sternal border and that radiates to the carotid arteries.
Several physical findings may help in assessing the severity of aortic stenosis. In mild stenosis, the murmur peaks in early systole, but as the disease progresses the peak moves later into systole. The corollary of this phenomenon is a weak and delayed carotid upstroke known as “pulsus parvus et tardus.” This can be assessed by palpating the carotid artery while auscultating the heart.
The second heart sound becomes progressively softer as the stenosis advances until it is no longer audible. If a fourth heart sound is present, it may be due to concentric left ventricular hypertrophy with reduced left ventricular compliance, and a third heart sound indicates severe left ventricular dysfunction. Both of these findings suggest severe aortic stenosis.
ECHOCARDIOGRAPHIC MEASURES OF SEVERITY
Echocardiography is the best established and most important initial investigation in the assessment of a patient with suspected aortic stenosis. It usually provides accurate information on the severity and the mechanism of stenosis. The following findings indicate severe aortic stenosis:
- Mean pressure gradient > 40 mm Hg
- Peak aortic jet velocity > 4.0 m/s
- Aortic valve area < 1 cm2.
RECOMMENDATIONS FOR SURGERY BASED ON SEVERITY AND SYMPTOMS
The American College of Cardiology and American Heart Association (ACC/AHA)4 have issued the following recommendations for aortic valve replacement, based on the severity of stenosis and on whether the patient has symptoms (Figure 2):
Severe stenosis, with symptoms: class I recommendation (surgery should be done). Without surgery, these patients have a very poor prognosis, with an overall mortality rate of 75% at 3 years.3
Severe stenosis, no symptoms, in patients undergoing cardiac surgery for another indication (eg, coronary artery bypass grafting, ascending aortic surgery, or surgery on other valves): class I recommendation for concomitant aortic valve replacement.
Moderate stenosis, no symptoms, in patients undergoing cardiac surgery for another indication: class IIa recommendation (ie, aortic valve replacement “is reasonable”).
Very severe stenosis (aortic peak velocity > 5.0 m/s or mean pressure gradient ≥ 60 mm Hg), no symptoms, and low risk of death during surgery: class IIa recommendation.
Severe stenosis, no symptoms, and an increase in transaortic velocity of 0.3 m/s or more per year on serial testing or in patients considered to be at high risk for rapid disease progression, such as elderly patients with severe calcification: class IIb recommendation (surgery “can be considered”). The threshold to replace the valve is lower for patients who cannot make serial follow-up appointments because they live far away or lack transportation, or because they have problems with compliance.
Surgery for those with left ventricular dysfunction
Echocardiography also provides information on left ventricular function, and patients with left ventricular dysfunction have significantly worse outcomes. Studies have shown substantial differences in survival in patients who had an ejection fraction of less than 50% before valve replacement compared with those with a normal ejection fraction.3
Thus, the ACC/AHA guidelines recommend immediate referral for aortic valve replacement in asymptomatic patients whose left ventricular ejection fraction is less than 50% (class I recommendation, level of evidence B) in the hope of preventing irreversible ventricular dysfunction.4
TREADMILL EXERCISE TESTING UNMASKS SYMPTOMS
In the past, severe aortic stenosis was considered a contraindication to stress testing because of concerns of precipitating severe, life-threatening complications. However, studies over the past 10 years have shown that a supervised modified Bruce protocol is safe in patients with severe asymptomatic aortic stenosis.16,17
However, treadmill exercise testing clearly is absolutely contraindicated in patients with severe symptomatic aortic stenosis because of the risk of syncope or of precipitating a malignant arrhythmia. Nevertheless, it may play an essential role in the workup of a physically active patient with no symptoms.
Symptoms can develop insidiously in patients with chronic valve disease and may often go unrecognized by patients and their physicians. Many patients who state they have no symptoms may actually be subconsciously limiting their exercise to avoid symptoms.
Amato et al13 examined the exercise capacity of 66 patients reported to have severe asymptomatic aortic stenosis. Treadmill exercise testing was considered positive in this study if the patient developed symptoms or complex ventricular arrhythmias, had blood pressure that failed to rise by 20 mm Hg, or developed horizontal or down-sloping ST depression (≥ 1 mm in men, ≥ 2 mm in women). Twenty (30.3%) of the 66 patients developed symptoms during exercise testing, and they had a significantly worse prognosis: the 2-year event-free survival rate was only 19% in those with a positive test compared with 85% in those with a negative test.13 This study highlights the problem of patients subconsciously reducing their level of activity, thereby masking their true symptoms.
A meta-analysis by Rafique et al18 found that asymptomatic patients with abnormal results on exercise testing had a risk of cardiac events during follow-up that was eight times higher than normal, and a risk of sudden death 5.5 times higher.
With trials demonstrating that exercise testing is safe and prognostically useful in patients with aortic stenosis, the ACC/AHA guidelines emphasize its role, giving a class I recommendation for aortic valve replacement in patients who develop symptoms on exercise testing, and a class IIa recommendation in asymptomatic patients with decreased exercise tolerance or an exercise-related fall in blood pressure (Figure 2).4
STRESS ECHOCARDIOGRAPHY
Stress echocardiography has been used since the 1980s to assess the hemodynamic consequences of valvular heart disease, and many studies highlight its prognostic usefulness in patients with asymptomatic aortic stenosis.
In a 2005 study by Lancellotti et al,19 69 patients with severe asymptomatic aortic stenosis underwent a symptom-limited bicycle exercise stress test using quantitative Doppler echocardiography both at rest and at peak exercise, and a number of independent predictors of poor outcome (ie, symptoms, aortic valve replacement, death) were identified. These predictors included an abnormal test result, defined as any of the following: angina, dyspnea, ST-segment depression of 2 mm Hg or more, a fall or a small (< 20 mm Hg) rise in systolic blood pressure during the test, an aortic valve area of 0.75 cm2 or less, or a mean increase in valve gradient of 18 mm Hg or more.
Subsequently, a multicenter prospective trial assessed the value of exercise stress echocardiography in 186 patients with asymptomatic moderate or severe aortic stenosis.20 A mean increase in the aortic valve gradient of 20 mm Hg or more after exercise was associated with a rate of cardiovascular events (death, aortic valve replacement) 3.8 times higher, independent of other risk factors and whether moderate or severe stenosis was present (Table 1).20
Exercise-induced changes in systolic pulmonary artery pressure, which can be assessed using stress echocardiography, also have prognostic utility. Elevated systolic pulmonary artery pressure (> 50 mm Hg) seems to portend a poorer prognosis21,22 and a higher mortality rate after valve replacement,23 making it an independent predictor of hospital mortality and postoperative major adverse cardiovascular and cerebrovascular events (Table 1).
Exercise echocardiography also can be used to assess the patient’s contractile reserve. Left ventricular contractile reserve can be defined as an exercise-induced increase in left ventricular ejection fraction. In a study by Maréchaux et al24 in 50 patients with asymptomatic aortic stenosis and a normal resting left ventricular ejection fraction (> 50%), 40% of patients did not have left ventricular contractile reserve. In fact, their left ventricular ejection fraction decreased with exercise (from 64 ± 10% to 53 ± 12%). The subgroup of patients without contractile reserve developed symptoms more frequently during exercise and had lower event-free survival (Table 1).
Stress echocardiography has recently been introduced into the European Society of Cardiology guidelines, which give a class IIb indication for aortic valve replacement in asymptomatic patients who have severe aortic stenosis, a normal ejection fraction, and a greater than 20-mm Hg increase in mean gradient on exercise.5 But it has yet to be introduced into the ACC/AHA guidelines as a consideration for surgery.
LEFT VENTRICULAR FUNCTION: BEYOND EJECTION FRACTION
Left ventricular dysfunction is a bad sign for patients with aortic stenosis. Struggling to empty its contents through the narrowed aortic valve, the left ventricle is subjected to increased wall stress and eventually develops hypertrophy. The hypertrophied heart muscle requires more oxygen but receives less perfusion. Eventually, myocardial fibrosis develops, leading to systolic dysfunction and a reduction in the ejection fraction. As described above, patients with asymptomatic aortic stenosis and a left ventricular ejection fraction less than 50% have a poor prognosis,14 and therefore the ACC/AHA guidelines give this condition a class I recommendation for surgery.4
However, the ejection fraction has limitations as a marker of left ventricular function. It reflects changes in left ventricular cavity volume but not in the complex structure of the left ventricle. Several studies show that up to one-third of patients with severe aortic stenosis have considerable impairment of intrinsic myocardial systolic function despite a preserved ejection fraction.8,25,26
Thus, other variables such as left atrial size, left ventricular hypertrophy, myocardial deformation (assessed using strain imaging), and B-type natriuretic peptide (BNP) level may also be considered in assessing the effect of severe aortic stenosis on left ventricular function in the context of a normal ejection fraction (Table 2).
Left ventricular hypertrophy
The development of left ventricular hypertrophy is one of the earliest compensatory responses of the ventricle to the increase in afterload. This leads to impaired myocardial relaxation and reduced myocardial compliance, with resultant diastolic dysfunction with increased filling pressures.
Cioffi et al,27 in a study in 209 patients with severe but asymptomatic aortic stenosis, found that inappropriately high left ventricular mass (> 110% of that expected for body size, sex, and wall stress) portended a 4.5-times higher risk of death, independent of other risk factors.
Severe left ventricular hypertrophy may have a long-term effect on prognosis irrespective of valve replacement. An observational study14 of 3,049 patients who underwent aortic valve replacement for severe aortic stenosis showed that the 10-year survival rate was 45% in those whose left ventricular mass was greater than 185 g/m2, compared with 65% in patients whose left ventricular mass was less than 100 g/m2.
Thus, as surgical mortality and morbidity rates decrease, the impact of these structural changes in left ventricular wall thickness may affect the decision to intervene earlier in order to improve longer-term outcomes in select asymptomatic patients with high-risk features.
Left atrial size
Diastolic dysfunction is caused by increased afterload and results in elevated left ventricular end-diastolic pressure and elevated left atrial pressure. The left atrium responds by dilating, which increases the risk of atrial fibrillation.
Lancellotti et al8 investigated the negative prognostic implications of a large indexed left atrial area in asymptomatic patients with severe aortic stenosis. They found that patients with an indexed left atrial area greater than 12.2 cm2/m2 had a 77% 2-year probability of aortic valve replacement or death.
Beach et al28 examined cardiac remodeling after surgery and found that the left atrial diameter did not decrease after aortic valve replacement, even after left ventricular hypertrophy reversed. This observation has major prognostic implications. Patients with a severely enlarged left atrium (> 5.0 cm in diameter) had considerably lower survival rates than patients with a diameter less than 3.55 cm at 5 years (61% vs 85%) and at 10 years (28% vs 62%) after aortic valve replacement.
Therefore, left atrial size appears to have an important long-term impact on prognosis in patients with aortic stenosis even after aortic valve replacement and adds valuable information when assessing the effect of aortic stenosis on myocardial function.
B-type natriuretic peptide
Natriuretic peptides are cardiac hormones released in response to myocyte stretch. In aortic stenosis, increased afterload induces significant expression of BNP, N-terminal proBNP,29 and atrial natriuretic peptide,30 with numerous studies showing a good correlation between plasma natriuretic peptide levels and severity of aortic stenosis.31–34
Bergler-Klein et al33 showed that patients with asymptomatic aortic stenosis who developed symptoms during follow-up had higher levels of these biomarkers than patients who remained asymptomatic. Of note, patients with BNP levels lower than 130 pg/mL had significantly better symptom-free survival than those with higher levels, 66% vs 34% at 12 months.
However, these biomarkers are not specific to aortic stenosis and can be elevated in any condition that increases left ventricular stress. Nevertheless, they offer an easy and low-cost way to assess left ventricular function and may give an indication of the total burden of disease on the left ventricle.
Global left ventricular longitudinal strain
In view of the limitations of the left ventricular ejection fraction in identifying changes in the structure of the heart and in early detection of myocardial dysfunction, assessment of myocardial deformation using strain imaging is proving an attractive alternative.
Strain is the normalized, dimensionless measure of deformation of a solid object (such as a segment of myocardium) in response to an applied force or stress.35 A novel echocardiographic technique allows assessment of segmental myocardial deformation and thereby overcomes the limitation of tethering, which limits other echocardiographic techniques in the assessment of systolic function. Strain can be circumferential, longitudinal, or radial and is generally assessed using either tissue Doppler velocities or 2D echocardiographic speckle-tracking techniques. Longitudinal strain has proven to be a more sensitive method than left ventricular ejection fraction in detecting subclinical myocardial dysfunction and is a superior prognosticator in a variety of clinical conditions.36,37
Abnormal strain develops very early in the disease process and can even be seen in patients with mild aortic stenosis.
A study by Kearney et al38 in 146 patients with various degrees of aortic stenosis (26% mild, 21% moderate, and 53% severe) and preserved left ventricular ejection fraction demonstrated that global longitudinal strain worsened with increasing severity of aortic stenosis. Furthermore, global longitudinal strain was a strong independent predictor of all-cause mortality (hazard ratio 1.38, P < .001).
Similarly, in a study by Lancellotti et al8 in 163 patients with at least moderate to severe asymptomatic aortic stenosis, impaired longitudinal myocardial strain was an independent predictor of survival. Patients with longitudinal strain greater than 15.9% had significantly better outcomes than patients with strain of 15.9% or less (4-year survival 63% vs 22%, P < .001).
Hence, left ventricular global longitudinal strain offers an alternative—perhaps a superior alternative—to left ventricular ejection fraction in detecting and quantifying left ventricular dysfunction in asymptomatic aortic stenosis. It is an exciting new marker for the future in aortic stenosis, with a threshold of strain below 15.9% as a possible cutoff for those at higher risk of poorer outcomes.
WHERE ARE WE NOW? WHERE ARE WE GOING?
Aortic valve replacement in patients with severe but asymptomatic aortic stenosis remains a topic of debate, but support is growing for earlier intervention.
Now that concerns over the safety of exercise stress testing in patients with severe asymptomatic aortic stenosis have subsided following multiple studies,16,17 exercise testing should be performed in patients with asymptomatic severe aortic stenosis suspected of having reduced exercise capacity, with stress echocardiography providing added prognostic information through its assessment of exercise-induced changes in mean pressure gradient19 and systolic pulmonary artery pressure.21–23
Assessing left ventricular function provides important information about prognosis, with left ventricular ejection fraction, left ventricular diameter, left atrial size, BNP, and global longitudinal strain all helping identify asymptomatic patients at higher risk of death. Surgical intervention in asymptomatic patients with severe aortic stenosis may be considered when there is evidence of higher longer-term mortality risk based on reduced functional capacity, excess left ventricular hypertrophy, and abnormal left ventricular function as detected by ancillary methods such as global longitudinal strain and BNP elevation despite a normal left ventricular ejection fraction.
Figure 3 shows a possible algorithm to define which patients would benefit from earlier intervention. However, left ventricular hypertrophy, left atrial diameter, BNP, left ventricular longitudinal strain, and changes in systolic pulmonary artery pressure are not included in the current ACC/AHA guidelines for the management of asymptomatic patients with severe aortic stenosis. Further study is needed to determine whether earlier intervention in those with adverse risk profiles based on the newer evaluation techniques described above leads to better long-term outcomes.
Intervention should especially be considered in those in whom the measured surgical risk is low and in surgical centers at which the mortality rate is low.
- Nkomo VT, Gardin JM, Skelton TN, Gottdiener JS, Scott CG, Enriquez-Sarano M. Burden of valvular heart diseases: a population-based study. Lancet 2006; 368:1005–1011.
- Stewart BF, Siscovick D, Lind BK, et al. Clinical factors associated with calcific aortic valve disease. Cardiovascular Health Study. J Am Coll Cardiol 1997; 29:630–634.
- Schwarz F, Baumann P, Manthey J, et al. The effect of aortic valve replacement on survival. Circulation 1982; 66:1105–1110.
- Nishimura RA, Otto CM, Bonow RO, et al; American College of Cardiology/American Heart Association Task Force on Practice Guidelines. 2014 AHA/ACC guideline for the management of patients with valvular heart disease: a report of the American College of Cardiology/American Heart Association Task Force on Practice Guidelines. J Am Coll Cardiol 2014; 63:e57–e185.
- Joint Task Force on the Management of Valvular Heart Disease of the European Society of Cardiology (ESC); European Association for Cardio-Thoracic Surgery (EACTS); Vahanian A, Alfieri O, Andreotti F, et al. Guidelines on the management of valvular heart disease (version 2012). Eur Heart J 2012; 33:2451–2496.
- Rosenhek R, Binder T, Porenta G, et al. Predictors of outcome in severe, asymptomatic aortic stenosis. N Engl J Med 2000; 343:611–617.
- Rosenhek R, Zilberszac R, Schemper M, at al. Natural history of very severe aortic stenosis. Circulation 2010; 121:151–156.
- Lancellotti P, Donal E, Magne J, et al. Risk stratification in asymptomatic moderate to severe aortic stenosis: the importance of the valvular, arterial and ventricular interplay. Heart 2010; 96:1364–1371.
- Pai R, Kapoor N, Bansal RC, Varadarajan P. Natural malignant history of asymptomatic severe aortic stenosis: benefit of aortic valve replacement. Ann Thorac Surg 2006; 82:2116–2122.
- American College of Cardiology; American Heart Association Task Force on Practice Guidelines (Writing Committee to revise the 1998 guidelines for the management of patients with valvular heart disease); Society of Cardiovascular Anesthesiologists; Bonow RO, Carabello BA, Chatterjee K, et al. ACC/AHA 2006 guidelines for the management of patients with valvular heart disease: a report of the American College of Cardiology/American Heart Association Task Force on Practice Guidelines (writing Committee to Revise the 1998 guidelines for the management of patients with valvular heart disease) developed in collaboration with the Society of Cardiovascular Anesthesiologists endorsed by the Society for Cardiovascular Angiography and Interventions and the Society of Thoracic Surgeons. J Am Coll Cardiol 2006; 48:e1–e148.
- Patel HJ, Herbert MA, Drake DH, et al. Aortic valve replacement: using a statewide cardiac surgical database identifies a procedural volume hinge point. Ann Thorac Surg 2013; 96:1560–1566.
- Johnston DR, Roselli EE. Minimally invasive aortic valve surgery: Cleveland Clinic experience. Ann Cardiothorac Surg 2015;4:140–147.
- Amato MC, Moffa PJ, Werner KE, Ramires JA. Treatment decision in asymptomatic aortic valve stenosis: role of exercise testing. Heart 2001; 86:381–386.
- Mihaljevic T, Nowicki ER, Rajeswaran J, et al. Survival after valve replacement for aortic stenosis: implications for decision making. J Thorac Cardiovasc Surg 2008; 135:1270–1279.
- Kang DH, Park SJ, Rim JH, et al. Early surgery versus conventional treatment in asymptomatic very severe aortic stenosis. Circulation 2010; 121:1502–1509.
- Alborino D, Hoffmann JL, Fournet PC, Bloch A. Value of exercise testing to evaluate the indication for surgery in asymptomatic patients with valvular aortic stenosis. J Heart Valve Dis 2002; 11:204–209.
- Das P, Rimington H, Chambers J. Exercise testing to stratify risk in aortic stenosis. Eur Heart J 2005; 26:1309–1313.
- Rafique AM, Biner S, Ray I, Forrester JS, Tolstrup K, Siegel RJ. Meta-analysis of prognostic value of stress testing in patients with asymptomatic severe aortic stenosis. Am J Cardiol 2009; 104:972–977.
- Lancellotti P, Lebois F, Simon M, Tombeux C, Chauvel C, Pierard LA. Prognostic importance of quantitative exercise Doppler echocardiography in asymptomatic valvular aortic stenosis. Circulation 2005; 112(suppl I):I377–I382.
- Marechaux S, Hachicha Z, Bellouin A, et al. Usefulness of exercise-stress echocardiography for risk stratification of true asymptomatic patients with aortic valve stenosis. Eur Heart J 2010; 31:1390–1397.
- Cooper R, Ghali J, Simmons BE, Castaner A. Elevated pulmonary artery pressure. An independent predictor of mortality. Chest 1991; 99:112–120.
- McHenry MM, Rice J, Matlof HJ, Flamm MD Jr. Pulmonary hypertension and sudden death in aortic stenosis. Br Heart J 1979; 41:463–467.
- Copeland JG, Griepp RB, Stinson EB, Shumway NE. Long-term follow-up after isolated aortic valve replacement. J Thorac Cardiovasc Surg 1977; 74: 875–889.
- Maréchaux S, Ennezat PV, LeJemtel TH, et al. Left ventricular response to exercise in aortic stenosis: an exercise echocardiographic study. Echocardiography 2007; 24:955–959.
- Cramariuc D, Cioffi G, Rieck AE, et al. Low-flow aortic stenosis in asymptomatic patients: valvular arterial impedance and systolic function from the SEAS substudy. JACC Cardiovasc Imaging 2009; 2:390–399.
- Dumesnil JG, Shoucri RM, Laurenceau JL, Turcot J. A mathematical model of the dynamic geometry of the intact left ventricle and its application to clinical data. Circulation 1979; 59:1024–1034.
- Cioffi G, Faggiano P, Vizzardi E, et al. Prognostic effect of inappropriately high left ventricular mass in asymptomatic severe aortic stenosis. Heart 2011; 97:301–307.
- Beach JM, Mihaljevic T, Rajeswaran J, et al. Ventricular hypertrophy and left atrial dilatation persist and are associated with reduced survival after valve replacement for aortic stenosis. J Thorac Cardiovasc Surg 2014; 147:362–369.e8.
- Vanderheyden M, Goethals M, Verstreken S, et al. Wall stress modulates brain natriuretic peptide production in pressure overload cardiomyopathy. J Am Coll Cardiol 2004; 44:2349–2354.
- Ikeda T, Matsuda K, Itoh H, et al. Plasma levels of brain and atrial natriuretic peptides elevate in proportion to left ventricular end-systolic wall stress in patients with aortic stenosis. Am Heart J 1997; 133:307–314.
- Qi W, Mathisen P, Kjekshus J, et al. Natriuretic peptides in patients with aortic stenosis. Am Heart J 2001; 142:725–732.
- Weber M, Arnold R, Rau M, et al. Relation of N-terminal pro-B-type natriuretic peptide to severity of valvular aortic stenosis. Am J Cardiol 2004; 94:740–745.
- Bergler-Klein J, Klaar U, Heger M, et al. Natriuretic peptides predict symptom-free survival and postoperative outcome in severe aortic stenosis. Circulation 2004; 109:2302–2308.
- Lim P, Monin JL, Monchi M, et al. Predictors of outcome in patients with severe aortic stenosis and normal left ventricular function: role of B-type natriuretic peptide. Eur Heart J 2004; 25:2048–2053.
- Holt B. Strain and strain rate echocardiography and coronary artery disease. Circ Cardiovasc Imaging 2011; 4:179–190.
- Ng AC, Delgado V, Bertini M, et al. Alterations in multidirectional myocardial functions in patients with aortic stenosis and preserved ejection fraction: a two-dimensional speckle tracking analysis. Eur Heart J 2011; 32:1542–1550.
- Ng AC, Delgado V, Bertini M, et al. Findings from left ventricular strain and strain rate imaging in asymptomatic patients with type 2 diabetes mellitus. Am J Cardiol 2009; 104:1398–1401
- Kearney LG, Lu K, Ord M, et al. Global longitudinal strain is a strong independent predictor of all-cause mortality in patients with aortic stenosis. Eur Heart J Cardiovasc Imag 2012; 13:827–833.
Aortic stenosis is the most common valvular heart condition in the developed world, affecting 3% of people between ages 75 and 851 and 4% of people over age 85.2 Aortic valve replacement remains the only treatment proven to reduce the rates of mortality and morbidity in this condition.3 Under current guidelines,4,5 the onset of symptoms of exertional angina, syncope, or dyspnea in a patient who has severe aortic stenosis is a class I indication for surgery—ie, surgery should be performed.
However, high-gradient, severe aortic stenosis that is asymptomatic often poses a dilemma. The annual rate of sudden death in patients with this condition is estimated at 1% to 3%,6–9 but the surgical mortality rate in aortic valve replacement has been as high as 6% in Medicare patients (varying by center and comorbidities).10 Therefore, the traditional teaching was to not surgically replace the valve in asymptomatic patients, based on an adverse risk-benefit ratio. But with improvements in surgical techniques and prostheses, these rates have been reduced to 2.41% at high-volume centers11 (and to less than 1% at some hospitals),12 arguing in favor of earlier intervention.
Complicating the issue, transcatheter aortic valve replacement has become widely available, but further investigation into its use in this patient cohort is warranted.
Furthermore, many patients with severe but apparently asymptomatic aortic stenosis and normal left ventricular ejection fraction may actually have impaired exercise capacity, or they may have structural left ventricular changes such as severe hypertrophy or reduction in global strain, which may worsen the long-term survival rate.13,14
A prospective trial in patients with severe aortic stenosis found that mortality rates were significantly lower in those who underwent surgery early than in those who received conventional treatment, ie, watchful waiting (no specific medical treatment for aortic stenosis is available).15
Patients with asymptomatic severe aortic stenosis are a diverse group; some have a far worse prognosis than others, with or without surgery.
This paper reviews the guidelines for valve replacement in this patient group and the factors useful in establishing who should be considered for early intervention even if they have no classic symptoms (Figure 1).
SIGNS AND SYMPTOMS OF STENOSIS
Aortic stenosis is often first suspected when a patient presents with angina, dyspnea, and syncope, or when an ejection systolic murmur is heard incidentally on physical examination—typically a high-pitched, crescendo-decrescendo, midsystolic ejection murmur that is best heard at the right upper sternal border and that radiates to the carotid arteries.
Several physical findings may help in assessing the severity of aortic stenosis. In mild stenosis, the murmur peaks in early systole, but as the disease progresses the peak moves later into systole. The corollary of this phenomenon is a weak and delayed carotid upstroke known as “pulsus parvus et tardus.” This can be assessed by palpating the carotid artery while auscultating the heart.
The second heart sound becomes progressively softer as the stenosis advances until it is no longer audible. If a fourth heart sound is present, it may be due to concentric left ventricular hypertrophy with reduced left ventricular compliance, and a third heart sound indicates severe left ventricular dysfunction. Both of these findings suggest severe aortic stenosis.
ECHOCARDIOGRAPHIC MEASURES OF SEVERITY
Echocardiography is the best established and most important initial investigation in the assessment of a patient with suspected aortic stenosis. It usually provides accurate information on the severity and the mechanism of stenosis. The following findings indicate severe aortic stenosis:
- Mean pressure gradient > 40 mm Hg
- Peak aortic jet velocity > 4.0 m/s
- Aortic valve area < 1 cm2.
RECOMMENDATIONS FOR SURGERY BASED ON SEVERITY AND SYMPTOMS
The American College of Cardiology and American Heart Association (ACC/AHA)4 have issued the following recommendations for aortic valve replacement, based on the severity of stenosis and on whether the patient has symptoms (Figure 2):
Severe stenosis, with symptoms: class I recommendation (surgery should be done). Without surgery, these patients have a very poor prognosis, with an overall mortality rate of 75% at 3 years.3
Severe stenosis, no symptoms, in patients undergoing cardiac surgery for another indication (eg, coronary artery bypass grafting, ascending aortic surgery, or surgery on other valves): class I recommendation for concomitant aortic valve replacement.
Moderate stenosis, no symptoms, in patients undergoing cardiac surgery for another indication: class IIa recommendation (ie, aortic valve replacement “is reasonable”).
Very severe stenosis (aortic peak velocity > 5.0 m/s or mean pressure gradient ≥ 60 mm Hg), no symptoms, and low risk of death during surgery: class IIa recommendation.
Severe stenosis, no symptoms, and an increase in transaortic velocity of 0.3 m/s or more per year on serial testing or in patients considered to be at high risk for rapid disease progression, such as elderly patients with severe calcification: class IIb recommendation (surgery “can be considered”). The threshold to replace the valve is lower for patients who cannot make serial follow-up appointments because they live far away or lack transportation, or because they have problems with compliance.
Surgery for those with left ventricular dysfunction
Echocardiography also provides information on left ventricular function, and patients with left ventricular dysfunction have significantly worse outcomes. Studies have shown substantial differences in survival in patients who had an ejection fraction of less than 50% before valve replacement compared with those with a normal ejection fraction.3
Thus, the ACC/AHA guidelines recommend immediate referral for aortic valve replacement in asymptomatic patients whose left ventricular ejection fraction is less than 50% (class I recommendation, level of evidence B) in the hope of preventing irreversible ventricular dysfunction.4
TREADMILL EXERCISE TESTING UNMASKS SYMPTOMS
In the past, severe aortic stenosis was considered a contraindication to stress testing because of concerns of precipitating severe, life-threatening complications. However, studies over the past 10 years have shown that a supervised modified Bruce protocol is safe in patients with severe asymptomatic aortic stenosis.16,17
However, treadmill exercise testing clearly is absolutely contraindicated in patients with severe symptomatic aortic stenosis because of the risk of syncope or of precipitating a malignant arrhythmia. Nevertheless, it may play an essential role in the workup of a physically active patient with no symptoms.
Symptoms can develop insidiously in patients with chronic valve disease and may often go unrecognized by patients and their physicians. Many patients who state they have no symptoms may actually be subconsciously limiting their exercise to avoid symptoms.
Amato et al13 examined the exercise capacity of 66 patients reported to have severe asymptomatic aortic stenosis. Treadmill exercise testing was considered positive in this study if the patient developed symptoms or complex ventricular arrhythmias, had blood pressure that failed to rise by 20 mm Hg, or developed horizontal or down-sloping ST depression (≥ 1 mm in men, ≥ 2 mm in women). Twenty (30.3%) of the 66 patients developed symptoms during exercise testing, and they had a significantly worse prognosis: the 2-year event-free survival rate was only 19% in those with a positive test compared with 85% in those with a negative test.13 This study highlights the problem of patients subconsciously reducing their level of activity, thereby masking their true symptoms.
A meta-analysis by Rafique et al18 found that asymptomatic patients with abnormal results on exercise testing had a risk of cardiac events during follow-up that was eight times higher than normal, and a risk of sudden death 5.5 times higher.
With trials demonstrating that exercise testing is safe and prognostically useful in patients with aortic stenosis, the ACC/AHA guidelines emphasize its role, giving a class I recommendation for aortic valve replacement in patients who develop symptoms on exercise testing, and a class IIa recommendation in asymptomatic patients with decreased exercise tolerance or an exercise-related fall in blood pressure (Figure 2).4
STRESS ECHOCARDIOGRAPHY
Stress echocardiography has been used since the 1980s to assess the hemodynamic consequences of valvular heart disease, and many studies highlight its prognostic usefulness in patients with asymptomatic aortic stenosis.
In a 2005 study by Lancellotti et al,19 69 patients with severe asymptomatic aortic stenosis underwent a symptom-limited bicycle exercise stress test using quantitative Doppler echocardiography both at rest and at peak exercise, and a number of independent predictors of poor outcome (ie, symptoms, aortic valve replacement, death) were identified. These predictors included an abnormal test result, defined as any of the following: angina, dyspnea, ST-segment depression of 2 mm Hg or more, a fall or a small (< 20 mm Hg) rise in systolic blood pressure during the test, an aortic valve area of 0.75 cm2 or less, or a mean increase in valve gradient of 18 mm Hg or more.
Subsequently, a multicenter prospective trial assessed the value of exercise stress echocardiography in 186 patients with asymptomatic moderate or severe aortic stenosis.20 A mean increase in the aortic valve gradient of 20 mm Hg or more after exercise was associated with a rate of cardiovascular events (death, aortic valve replacement) 3.8 times higher, independent of other risk factors and whether moderate or severe stenosis was present (Table 1).20
Exercise-induced changes in systolic pulmonary artery pressure, which can be assessed using stress echocardiography, also have prognostic utility. Elevated systolic pulmonary artery pressure (> 50 mm Hg) seems to portend a poorer prognosis21,22 and a higher mortality rate after valve replacement,23 making it an independent predictor of hospital mortality and postoperative major adverse cardiovascular and cerebrovascular events (Table 1).
Exercise echocardiography also can be used to assess the patient’s contractile reserve. Left ventricular contractile reserve can be defined as an exercise-induced increase in left ventricular ejection fraction. In a study by Maréchaux et al24 in 50 patients with asymptomatic aortic stenosis and a normal resting left ventricular ejection fraction (> 50%), 40% of patients did not have left ventricular contractile reserve. In fact, their left ventricular ejection fraction decreased with exercise (from 64 ± 10% to 53 ± 12%). The subgroup of patients without contractile reserve developed symptoms more frequently during exercise and had lower event-free survival (Table 1).
Stress echocardiography has recently been introduced into the European Society of Cardiology guidelines, which give a class IIb indication for aortic valve replacement in asymptomatic patients who have severe aortic stenosis, a normal ejection fraction, and a greater than 20-mm Hg increase in mean gradient on exercise.5 But it has yet to be introduced into the ACC/AHA guidelines as a consideration for surgery.
LEFT VENTRICULAR FUNCTION: BEYOND EJECTION FRACTION
Left ventricular dysfunction is a bad sign for patients with aortic stenosis. Struggling to empty its contents through the narrowed aortic valve, the left ventricle is subjected to increased wall stress and eventually develops hypertrophy. The hypertrophied heart muscle requires more oxygen but receives less perfusion. Eventually, myocardial fibrosis develops, leading to systolic dysfunction and a reduction in the ejection fraction. As described above, patients with asymptomatic aortic stenosis and a left ventricular ejection fraction less than 50% have a poor prognosis,14 and therefore the ACC/AHA guidelines give this condition a class I recommendation for surgery.4
However, the ejection fraction has limitations as a marker of left ventricular function. It reflects changes in left ventricular cavity volume but not in the complex structure of the left ventricle. Several studies show that up to one-third of patients with severe aortic stenosis have considerable impairment of intrinsic myocardial systolic function despite a preserved ejection fraction.8,25,26
Thus, other variables such as left atrial size, left ventricular hypertrophy, myocardial deformation (assessed using strain imaging), and B-type natriuretic peptide (BNP) level may also be considered in assessing the effect of severe aortic stenosis on left ventricular function in the context of a normal ejection fraction (Table 2).
Left ventricular hypertrophy
The development of left ventricular hypertrophy is one of the earliest compensatory responses of the ventricle to the increase in afterload. This leads to impaired myocardial relaxation and reduced myocardial compliance, with resultant diastolic dysfunction with increased filling pressures.
Cioffi et al,27 in a study in 209 patients with severe but asymptomatic aortic stenosis, found that inappropriately high left ventricular mass (> 110% of that expected for body size, sex, and wall stress) portended a 4.5-times higher risk of death, independent of other risk factors.
Severe left ventricular hypertrophy may have a long-term effect on prognosis irrespective of valve replacement. An observational study14 of 3,049 patients who underwent aortic valve replacement for severe aortic stenosis showed that the 10-year survival rate was 45% in those whose left ventricular mass was greater than 185 g/m2, compared with 65% in patients whose left ventricular mass was less than 100 g/m2.
Thus, as surgical mortality and morbidity rates decrease, the impact of these structural changes in left ventricular wall thickness may affect the decision to intervene earlier in order to improve longer-term outcomes in select asymptomatic patients with high-risk features.
Left atrial size
Diastolic dysfunction is caused by increased afterload and results in elevated left ventricular end-diastolic pressure and elevated left atrial pressure. The left atrium responds by dilating, which increases the risk of atrial fibrillation.
Lancellotti et al8 investigated the negative prognostic implications of a large indexed left atrial area in asymptomatic patients with severe aortic stenosis. They found that patients with an indexed left atrial area greater than 12.2 cm2/m2 had a 77% 2-year probability of aortic valve replacement or death.
Beach et al28 examined cardiac remodeling after surgery and found that the left atrial diameter did not decrease after aortic valve replacement, even after left ventricular hypertrophy reversed. This observation has major prognostic implications. Patients with a severely enlarged left atrium (> 5.0 cm in diameter) had considerably lower survival rates than patients with a diameter less than 3.55 cm at 5 years (61% vs 85%) and at 10 years (28% vs 62%) after aortic valve replacement.
Therefore, left atrial size appears to have an important long-term impact on prognosis in patients with aortic stenosis even after aortic valve replacement and adds valuable information when assessing the effect of aortic stenosis on myocardial function.
B-type natriuretic peptide
Natriuretic peptides are cardiac hormones released in response to myocyte stretch. In aortic stenosis, increased afterload induces significant expression of BNP, N-terminal proBNP,29 and atrial natriuretic peptide,30 with numerous studies showing a good correlation between plasma natriuretic peptide levels and severity of aortic stenosis.31–34
Bergler-Klein et al33 showed that patients with asymptomatic aortic stenosis who developed symptoms during follow-up had higher levels of these biomarkers than patients who remained asymptomatic. Of note, patients with BNP levels lower than 130 pg/mL had significantly better symptom-free survival than those with higher levels, 66% vs 34% at 12 months.
However, these biomarkers are not specific to aortic stenosis and can be elevated in any condition that increases left ventricular stress. Nevertheless, they offer an easy and low-cost way to assess left ventricular function and may give an indication of the total burden of disease on the left ventricle.
Global left ventricular longitudinal strain
In view of the limitations of the left ventricular ejection fraction in identifying changes in the structure of the heart and in early detection of myocardial dysfunction, assessment of myocardial deformation using strain imaging is proving an attractive alternative.
Strain is the normalized, dimensionless measure of deformation of a solid object (such as a segment of myocardium) in response to an applied force or stress.35 A novel echocardiographic technique allows assessment of segmental myocardial deformation and thereby overcomes the limitation of tethering, which limits other echocardiographic techniques in the assessment of systolic function. Strain can be circumferential, longitudinal, or radial and is generally assessed using either tissue Doppler velocities or 2D echocardiographic speckle-tracking techniques. Longitudinal strain has proven to be a more sensitive method than left ventricular ejection fraction in detecting subclinical myocardial dysfunction and is a superior prognosticator in a variety of clinical conditions.36,37
Abnormal strain develops very early in the disease process and can even be seen in patients with mild aortic stenosis.
A study by Kearney et al38 in 146 patients with various degrees of aortic stenosis (26% mild, 21% moderate, and 53% severe) and preserved left ventricular ejection fraction demonstrated that global longitudinal strain worsened with increasing severity of aortic stenosis. Furthermore, global longitudinal strain was a strong independent predictor of all-cause mortality (hazard ratio 1.38, P < .001).
Similarly, in a study by Lancellotti et al8 in 163 patients with at least moderate to severe asymptomatic aortic stenosis, impaired longitudinal myocardial strain was an independent predictor of survival. Patients with longitudinal strain greater than 15.9% had significantly better outcomes than patients with strain of 15.9% or less (4-year survival 63% vs 22%, P < .001).
Hence, left ventricular global longitudinal strain offers an alternative—perhaps a superior alternative—to left ventricular ejection fraction in detecting and quantifying left ventricular dysfunction in asymptomatic aortic stenosis. It is an exciting new marker for the future in aortic stenosis, with a threshold of strain below 15.9% as a possible cutoff for those at higher risk of poorer outcomes.
WHERE ARE WE NOW? WHERE ARE WE GOING?
Aortic valve replacement in patients with severe but asymptomatic aortic stenosis remains a topic of debate, but support is growing for earlier intervention.
Now that concerns over the safety of exercise stress testing in patients with severe asymptomatic aortic stenosis have subsided following multiple studies,16,17 exercise testing should be performed in patients with asymptomatic severe aortic stenosis suspected of having reduced exercise capacity, with stress echocardiography providing added prognostic information through its assessment of exercise-induced changes in mean pressure gradient19 and systolic pulmonary artery pressure.21–23
Assessing left ventricular function provides important information about prognosis, with left ventricular ejection fraction, left ventricular diameter, left atrial size, BNP, and global longitudinal strain all helping identify asymptomatic patients at higher risk of death. Surgical intervention in asymptomatic patients with severe aortic stenosis may be considered when there is evidence of higher longer-term mortality risk based on reduced functional capacity, excess left ventricular hypertrophy, and abnormal left ventricular function as detected by ancillary methods such as global longitudinal strain and BNP elevation despite a normal left ventricular ejection fraction.
Figure 3 shows a possible algorithm to define which patients would benefit from earlier intervention. However, left ventricular hypertrophy, left atrial diameter, BNP, left ventricular longitudinal strain, and changes in systolic pulmonary artery pressure are not included in the current ACC/AHA guidelines for the management of asymptomatic patients with severe aortic stenosis. Further study is needed to determine whether earlier intervention in those with adverse risk profiles based on the newer evaluation techniques described above leads to better long-term outcomes.
Intervention should especially be considered in those in whom the measured surgical risk is low and in surgical centers at which the mortality rate is low.
- Nkomo VT, Gardin JM, Skelton TN, Gottdiener JS, Scott CG, Enriquez-Sarano M. Burden of valvular heart diseases: a population-based study. Lancet 2006; 368:1005–1011.
- Stewart BF, Siscovick D, Lind BK, et al. Clinical factors associated with calcific aortic valve disease. Cardiovascular Health Study. J Am Coll Cardiol 1997; 29:630–634.
- Schwarz F, Baumann P, Manthey J, et al. The effect of aortic valve replacement on survival. Circulation 1982; 66:1105–1110.
- Nishimura RA, Otto CM, Bonow RO, et al; American College of Cardiology/American Heart Association Task Force on Practice Guidelines. 2014 AHA/ACC guideline for the management of patients with valvular heart disease: a report of the American College of Cardiology/American Heart Association Task Force on Practice Guidelines. J Am Coll Cardiol 2014; 63:e57–e185.
- Joint Task Force on the Management of Valvular Heart Disease of the European Society of Cardiology (ESC); European Association for Cardio-Thoracic Surgery (EACTS); Vahanian A, Alfieri O, Andreotti F, et al. Guidelines on the management of valvular heart disease (version 2012). Eur Heart J 2012; 33:2451–2496.
- Rosenhek R, Binder T, Porenta G, et al. Predictors of outcome in severe, asymptomatic aortic stenosis. N Engl J Med 2000; 343:611–617.
- Rosenhek R, Zilberszac R, Schemper M, at al. Natural history of very severe aortic stenosis. Circulation 2010; 121:151–156.
- Lancellotti P, Donal E, Magne J, et al. Risk stratification in asymptomatic moderate to severe aortic stenosis: the importance of the valvular, arterial and ventricular interplay. Heart 2010; 96:1364–1371.
- Pai R, Kapoor N, Bansal RC, Varadarajan P. Natural malignant history of asymptomatic severe aortic stenosis: benefit of aortic valve replacement. Ann Thorac Surg 2006; 82:2116–2122.
- American College of Cardiology; American Heart Association Task Force on Practice Guidelines (Writing Committee to revise the 1998 guidelines for the management of patients with valvular heart disease); Society of Cardiovascular Anesthesiologists; Bonow RO, Carabello BA, Chatterjee K, et al. ACC/AHA 2006 guidelines for the management of patients with valvular heart disease: a report of the American College of Cardiology/American Heart Association Task Force on Practice Guidelines (writing Committee to Revise the 1998 guidelines for the management of patients with valvular heart disease) developed in collaboration with the Society of Cardiovascular Anesthesiologists endorsed by the Society for Cardiovascular Angiography and Interventions and the Society of Thoracic Surgeons. J Am Coll Cardiol 2006; 48:e1–e148.
- Patel HJ, Herbert MA, Drake DH, et al. Aortic valve replacement: using a statewide cardiac surgical database identifies a procedural volume hinge point. Ann Thorac Surg 2013; 96:1560–1566.
- Johnston DR, Roselli EE. Minimally invasive aortic valve surgery: Cleveland Clinic experience. Ann Cardiothorac Surg 2015;4:140–147.
- Amato MC, Moffa PJ, Werner KE, Ramires JA. Treatment decision in asymptomatic aortic valve stenosis: role of exercise testing. Heart 2001; 86:381–386.
- Mihaljevic T, Nowicki ER, Rajeswaran J, et al. Survival after valve replacement for aortic stenosis: implications for decision making. J Thorac Cardiovasc Surg 2008; 135:1270–1279.
- Kang DH, Park SJ, Rim JH, et al. Early surgery versus conventional treatment in asymptomatic very severe aortic stenosis. Circulation 2010; 121:1502–1509.
- Alborino D, Hoffmann JL, Fournet PC, Bloch A. Value of exercise testing to evaluate the indication for surgery in asymptomatic patients with valvular aortic stenosis. J Heart Valve Dis 2002; 11:204–209.
- Das P, Rimington H, Chambers J. Exercise testing to stratify risk in aortic stenosis. Eur Heart J 2005; 26:1309–1313.
- Rafique AM, Biner S, Ray I, Forrester JS, Tolstrup K, Siegel RJ. Meta-analysis of prognostic value of stress testing in patients with asymptomatic severe aortic stenosis. Am J Cardiol 2009; 104:972–977.
- Lancellotti P, Lebois F, Simon M, Tombeux C, Chauvel C, Pierard LA. Prognostic importance of quantitative exercise Doppler echocardiography in asymptomatic valvular aortic stenosis. Circulation 2005; 112(suppl I):I377–I382.
- Marechaux S, Hachicha Z, Bellouin A, et al. Usefulness of exercise-stress echocardiography for risk stratification of true asymptomatic patients with aortic valve stenosis. Eur Heart J 2010; 31:1390–1397.
- Cooper R, Ghali J, Simmons BE, Castaner A. Elevated pulmonary artery pressure. An independent predictor of mortality. Chest 1991; 99:112–120.
- McHenry MM, Rice J, Matlof HJ, Flamm MD Jr. Pulmonary hypertension and sudden death in aortic stenosis. Br Heart J 1979; 41:463–467.
- Copeland JG, Griepp RB, Stinson EB, Shumway NE. Long-term follow-up after isolated aortic valve replacement. J Thorac Cardiovasc Surg 1977; 74: 875–889.
- Maréchaux S, Ennezat PV, LeJemtel TH, et al. Left ventricular response to exercise in aortic stenosis: an exercise echocardiographic study. Echocardiography 2007; 24:955–959.
- Cramariuc D, Cioffi G, Rieck AE, et al. Low-flow aortic stenosis in asymptomatic patients: valvular arterial impedance and systolic function from the SEAS substudy. JACC Cardiovasc Imaging 2009; 2:390–399.
- Dumesnil JG, Shoucri RM, Laurenceau JL, Turcot J. A mathematical model of the dynamic geometry of the intact left ventricle and its application to clinical data. Circulation 1979; 59:1024–1034.
- Cioffi G, Faggiano P, Vizzardi E, et al. Prognostic effect of inappropriately high left ventricular mass in asymptomatic severe aortic stenosis. Heart 2011; 97:301–307.
- Beach JM, Mihaljevic T, Rajeswaran J, et al. Ventricular hypertrophy and left atrial dilatation persist and are associated with reduced survival after valve replacement for aortic stenosis. J Thorac Cardiovasc Surg 2014; 147:362–369.e8.
- Vanderheyden M, Goethals M, Verstreken S, et al. Wall stress modulates brain natriuretic peptide production in pressure overload cardiomyopathy. J Am Coll Cardiol 2004; 44:2349–2354.
- Ikeda T, Matsuda K, Itoh H, et al. Plasma levels of brain and atrial natriuretic peptides elevate in proportion to left ventricular end-systolic wall stress in patients with aortic stenosis. Am Heart J 1997; 133:307–314.
- Qi W, Mathisen P, Kjekshus J, et al. Natriuretic peptides in patients with aortic stenosis. Am Heart J 2001; 142:725–732.
- Weber M, Arnold R, Rau M, et al. Relation of N-terminal pro-B-type natriuretic peptide to severity of valvular aortic stenosis. Am J Cardiol 2004; 94:740–745.
- Bergler-Klein J, Klaar U, Heger M, et al. Natriuretic peptides predict symptom-free survival and postoperative outcome in severe aortic stenosis. Circulation 2004; 109:2302–2308.
- Lim P, Monin JL, Monchi M, et al. Predictors of outcome in patients with severe aortic stenosis and normal left ventricular function: role of B-type natriuretic peptide. Eur Heart J 2004; 25:2048–2053.
- Holt B. Strain and strain rate echocardiography and coronary artery disease. Circ Cardiovasc Imaging 2011; 4:179–190.
- Ng AC, Delgado V, Bertini M, et al. Alterations in multidirectional myocardial functions in patients with aortic stenosis and preserved ejection fraction: a two-dimensional speckle tracking analysis. Eur Heart J 2011; 32:1542–1550.
- Ng AC, Delgado V, Bertini M, et al. Findings from left ventricular strain and strain rate imaging in asymptomatic patients with type 2 diabetes mellitus. Am J Cardiol 2009; 104:1398–1401
- Kearney LG, Lu K, Ord M, et al. Global longitudinal strain is a strong independent predictor of all-cause mortality in patients with aortic stenosis. Eur Heart J Cardiovasc Imag 2012; 13:827–833.
KEY POINTS
- Echocardiography is the best established and most important initial test in patients with suspected aortic stenosis.
- Traditional echocardiographic variables used in assessing aortic stenosis and the need for surgery are the pressure gradient across the valve, the velocity through the valve, the valve area, and the left ventricular ejection fraction.
- Aortic valve replacement is recommended for severe aortic stenosis if the patient has symptoms. It is also recommended if the left ventricular ejection fraction is less than 50%, if the patient is undergoing other cardiac surgery, or if symptoms arise on exercise stress testing.
- Novel assessment variables include left ventricular hypertrophy, left atrial size, B-type natriuretic peptide level, and global left ventricular longitudinal strain.
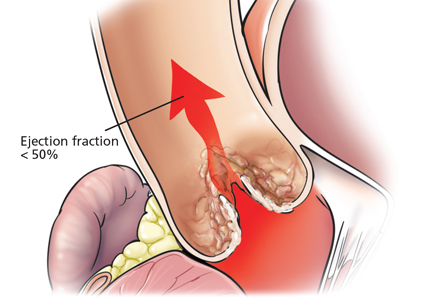
Zika virus: A primer for clinicians
On February 1, 2016, the World Health Organization declared Zika virus a public health emergency of international concern due to clusters of microcephaly and neurologic manifestations in areas of Zika virus transmission.1 On February 8, the US Centers for Disease Control and Prevention (CDC) elevated its response to level 1, its highest.2
Case reports and guidelines have been published to help clinicians better understand the epidemiology, risk, and pathogenesis of Zika virus infection, but much is still unknown. Clinicians must be ready to address the concerns of international travelers and must also consider Zika virus in the differential diagnosis of fever in the returned traveler.
FLAVIVIRUSES: DENGUE, WEST NILE … ZIKA
Zika virus, a single-stranded RNA arthropod-borne virus (arbovirus), is transmitted by mosquitoes. It is a member of the flavivirus family, which consists of over 70 viruses including some well known for causing diseases in humans, such as dengue, yellow fever, Japanese encephalitis, and West Nile virus.3
Phylogenetically, Zika virus is most similar to and included in a clade with Spondweni virus, which, like Zika, originated in Africa.4 Genomic analysis has revealed an African and an Asian lineage. The Asian lineage is responsible for the current epidemic in the Pacific and the Western Hemisphere.4–6
OUT OF AFRICA AND ASIA
Zika virus is named after a forested area in present-day Uganda, where it was first isolated in a febrile rhesus monkey that was being used to study yellow fever.7 Further studies in the 1950s confirmed its transmission to humans, as 6% of the sera tested in Ugandans showed evidence of specific antibodies to the virus.8 In 1978, antibody prevalence studies showed that up to 40% of Nigerians had Zika virus-neutralizing antibodies.9 Over the next 38 years, scattered case reports and seroprevalence studies showed infections occurring throughout Africa and Asia.9–11
In 2007, the first case of Zika virus transmission outside of Asia and Africa occurred on Yap Island in the Federated States of Micronesia.10–12 No further transmission in the Pacific was noted for 6 years until an outbreak occurred in French Polynesia in 2013.13–15 The first time Zika virus was found in the Western Hemisphere was in January 2014, when an outbreak occurred on Chile’s Easter Island.16 Genomic analysis of the Zika virus isolated on Easter Island indicated it was most closely related to isolates from French Polynesia.16 In 2014, additional cases of Zika virus infection were reported in New Caledonia and the Cook Islands.13,14

In May 2015, the World Health Organization issued an epidemiologic alert in response to dramatic increases in the spread of Zika virus in Brazil.17 From Brazil, Zika virus has rapidly spread to most countries in South and Central America and the Caribbean (Figure 1).2,5,6
TRANSMITTED BY MOSQUITO
The Aedes (Stegomyia) genus of mosquitoes is a well-known source of transmission for several arboviruses, including yellow fever, dengue, chikungunya, and now Zika virus.18,19 Zika virus was originally isolated in Uganda from Aedes africanus mosquitoes.7,20 Subsequently, other species of Aedes mosquitoes have been shown to transmit Zika virus, with Aedes aegypti being the most important human vector.7,8,19–21
Another species, Aedes albopictus has been identified as a human vector in Gabon and is also suspected of being a vector in the Brazilian outbreak.22 Spread of A albopictus from Asia to Europe, the Mediterranean region, and the Americas, including 32 states in the United States, has increased the fear of potential spread of Zika virus infection to a more expansive geographic range.13,18,19 Local transmission may become established if local mosquitoes become infected when infected travelers return from endemic areas.23
OTHER ROUTES OF TRANSMISSION
While mosquito-borne transmission is the most common route of infection with Zika virus, human-to-human transmission has been documented. Potential routes of transmission include sexual intercourse, blood transfusions, and vertical (mother-to-child) transmission.
Sexual transmission. Replicative Zika virus particles were identified in the semen of a patient who presented with hematospermia in French Polynesia.24
Previously, there was a report of Zika virus being sexually transmitted from a US man who had returned from Senegal to his spouse, who had not traveled to a Zika virus-endemic region. Both patients became ill following vaginal intercourse, with the onset of the wife’s illness occurring 5 days after the onset of the husband’s illness. The husband was noted to have hematospermia.25 Neutralization testing for both patients confirmed infection with Zika virus.25
The first reported case of sexual transmission in the current outbreak in the United States occurred in a traveler returning to Texas from Venezuela.26 The CDC is currently investigating several other potential cases and an additional two laboratory-confirmed cases. All cases were in symptomatic male travelers who had condomless vaginal intercourse with their female partners after return from Zika virus-endemic areas.27
Blood transfusions. Several arboviruses are known to be transmitted via blood.
In French Polynesia, Zika virus RNA was present in 3% of blood donors.28,29 These blood donors had been screened and were asymptomatic at the time of donation. Twenty-six percent of donors who had Zika RNA reported an illness compatible with Zika virus infection in the 3 to 10 days before donation.28
Brazil has reported two cases of Zika virus infection through blood transfusion.30
In May 2015, the European Centers for Disease Control recommended that travelers to affected areas defer blood donation for 28 days.31 The Association of American Blood Banks has also recommended that travelers self-defer donating blood for 28 days after travel to an endemic area.32 Most recently the US Food and Drug Administration recommended a 4-week deferral for travelers to Zika virus-endemic areas and after resolution of symptoms for those who have had Zika virus infection.33 Additional guidance for donors who have had sexual contact with Zika virus-infected persons and areas with active transmission of Zika virus is also available.33
Vertical transmission. Perinatal and transplacental transmission have also been documented.34,35 The extent and frequency of the clinical manifestations of these infections are still being elucidated in light of reports of association with fetal abnormalities.
Although Zika virus has been detected in breast milk, no cases of transmission through breastfeeding have been reported. Currently, women are advised to continue to breastfeed in areas of known Zika virus transmission.34,36,37
IS USUALLY ASYMPTOMATIC OR CAUSES MILD SYMPTOMS
Most Zika virus infections are asymptomatic, as illustrated by reports from the Yap Island outbreak, where only 19% of those with immunoglobulin M (IgM) antibodies to Zika virus had symptoms.12 The illness in symptomatic patients is often mild and self-limited, and most manifestations resolve by 7 days.12,25,38,39
Initial descriptions in the 1950s and 1960s of the clinical features of Zika virus infection in Africa included fever and headache as the most prominent symptoms.38,40 Description of the outbreak on Yap in 2007 characterized the predominant symptoms as rash, fever, arthralgia/arthritis, and nonpurulent conjunctivitis in 31 patients,12 and the current CDC case definition includes at least two of these four symptoms.41 The arthralgia and arthritis are usually of the small joints of the hands and feet and can persist for as long as a month.25,42 The rash can be pruritic.15,33,42,43
Less commonly reported manifestations of Zika virus infection include malaise, stomachaches, dizziness, anorexia, retro-orbital pain, aphthous ulcers, hematospermia, and prostatitis.14,15,24,25,44,45
The initial reports from eight patients in the outbreak in Brazil noted rash and joint pain as the most common manifestations. The maculopapular rash was present in all patients and the joint pain was characterized as severe, with the hands, ankles, elbows, knees, and wrists most consistently described.43

The clinical presentation is similar to those of dengue and chikungunya virus infections, confounding diagnosis, as these viruses may be cocirculating in the same geographic regions (and indeed are transmitted by the same mosquito vectors).11,12,15 The conjunctivitis present in Zika virus infections can also be present in chikungunya but is much less commonly a clinical feature of dengue.15,46,47 See Table 1 for the differential diagnosis of Zika virus infection.
Severe manifestations requiring hospitalization or resulting in death are thought to be uncommon, although neurologic and fetal complications have recently been described.12,29,43,48,49
CLINICAL ASSOCIATIONS
Primary infection with Zika virus is relatively benign. The greatest and most recent concerns are related to postinfectious complications and those that may occur in pregnant women.
Guillain-Barré syndrome
During the Zika virus outbreak in French Polynesia in 2013–2014, the incidence of Guillain-Barré syndrome was multiplied by a factor of 20.50 Prior to the first hospitalization of a patient with Zika virus infection and associated Guillain-Barré syndrome in French Polynesia, there had been no reported hospitalizations for Zika virus infection.50
This same association is now being seen in the recent outbreak in the Americas.50 In July 2015, Brazilian health officials in the State of Bahia reported 76 patients with neurologic syndromes, of whom 55% had Guillain-Barré syndrome.51 A history consistent with Zika virus infection was found in 62%.48
In January 2016, El Salvador also reported an unusual increase in Guillain-Barré syndrome cases since early December 2015.51 Between December 1, 2015, and January 6, 2016, there were 46 Guillain-Barré syndrome cases reported, compared with a baseline of 14 cases per month.51
Other countries where Zika virus infection is endemic are also currently investigating similar trends.51
Microcephaly
On November 17, 2015, the Pan American Health Organization issued an epidemiologic alert because of increased reports of microcephaly in the Pernambuco State of Brazil. Whereas there are typically about 10 cases per year, there had been 141 in the previous 11 months.51 Other states in Brazil such as Paraiba and Rio Grande del Norte also reported increases in the diagnosis of microcephaly. A physician alert published in Brazil described two infants from the Paraiba state who were diagnosed with fetal microcephaly.35 Testing for Zika virus by polymerase chain reaction (PCR) was negative in the maternal blood, but PCR of amniotic fluid was positive in both infants.35
In January 2016, the Brazil Ministry of Health reported that Zika virus had been detected by real-time PCR (RT-PCR) in four infants with congenital malformations in Rio Grande del Norte. Two of these cases were miscarriages and two were infants who died within 24 hours of birth. Immunohistochemistry of tissues from these infants was positive for Zika virus.
A February 2016 case report describes a European woman who developed Zika virus infection at 13 weeks gestation while working in Northeast Brazil and upon return to Europe elected to terminate the pregnancy after ultrasonography showed cerebral calcifications with microcephaly. The infant was found to have a very small brain, hypoplasia of the brainstem and spinal cord with degeneration of spinal tracts, complete absence of cerebral gyri, and severe dilatation of lateral ventricles as well as calcifications throughout the cerebral cortex.49 No genetic abnormalities or evidence of other etiologies was found, and large amounts of Zika virus RNA were found in the brain.

The CDC also recently reported confirmation of Zika virus infection from fetal tissues of two miscarriages (fetal loss at 11 and 13 weeks) and two fetal deaths (36 and 38 weeks) received from the state of Rio Grande do Norte in Brazil.52 All four mothers reported clinical signs of fever and rash during their first trimester of pregnancy.52 Additional testing for toxoplasmosis, rubella, cytomegalovirus, herpes simplex, and human immunodeficiency virus were all negative in the mothers who had miscarriages.52
Of critical note, the causality of Zika virus and microcephaly remains under investigation. See Table 2 for other causes of microcephaly.53
Macular atrophy
In January 2016, a case series of three infants with microcephaly and macular atrophy was reported.54 These infants were tested for toxoplasmosis, rubella, cytomegalovirus, herpes simplex, syphilis, and human immunodeficiency virus (HIV), and all the results were negative. The detection of Zika virus fulfilled the Brazilian Ministry of Health’s definition of vertical transmission of Zika virus, and laboratory diagnostic tests for Zika virus were not performed. In this series, one mother reported an illness with rash and arthralgias during the first trimester.54
LABORATORY DIAGNOSTIC METHODS
The diagnosis of Zika virus infection is challenging. The low viremia at initial presentation and cross-reactivity of serologic testing with other flaviviruses, especially dengue, can contribute to misdiagnosis.40,50
In the first 7 days of Zika virus infection, the diagnosis is based on detection of viral RNA in serum by RT-PCR.12,55,56 RT-PCR is very specific for Zika virus and is an important tool in differentiating between Zika virus and other flaviviruses often present in areas where Zika virus is circulating.12,56 After 3 to 4 days, viremia may decrease to levels that may be below the assay’s level of detection.40–42,45
While Zika virus RNA may be undetectable in the serum, other samples such as saliva, urine, and semen may be positive for longer.28,42,57 For example, urine samples were positive by RT-PCR up to 7 days beyond blood RT-PCR in the outbreak in New Caledonia.42 A recent report found semen remaining positive on RT-PCR for 62 days after the onset of confirmed Zika virus illness in a traveler returning to the United Kingdom from the Cook Islands in 2014.58
Because RT-PCR of blood is only useful early in infection, the current diagnostic guidelines recommend testing an acute-phase serum sample for Zika virus IgM collected as early as possible after the onset of illness and repeated 2 to 3 weeks after the initial set. These IgM antibodies typically develop toward the end of the first week of illness and are expected to be present for up to 12 weeks, based on experience with other flaviviruses.41 Cross-reactivity with other flaviviruses circulating in the area can occur and has been problematic in areas where dengue is circulating.12,41,45,56 IgM-positive specimens should be further tested, by plaque-reduction neutralization, to confirm the presence of Zika virus-specific neutralizing antibodies. Results can be difficult to interpret, especially in those who have been previously infected or vaccinated against other flaviviruses.12,41
If amniocentesis is done, these specimens should be tested by RT-PCR. However, the sensitivity of PCR in amniotic fluid is currently unknown.41

In infants with findings of cerebral calcifications and microcephaly, IgM serologies with RT-PCR are also recommended and should be drawn within 2 days of birth. Specimens should be drawn concurrently as it is not known which test is most reliable in infants.23 Additionally, placenta and umbilical cord samples should be collected for immunohistochemical staining at specialized laboratories.36

In the United States, providers should contact their state health departments to determine where tests can be run reliably. Refined diagnostic assays are in development at the time of this publication and are likely to be made available through CDC’s Laboratory Response Network.
See Figure 2 and Table 3 for a summary of diagnostic tests.
IMPLICATIONS, RECOMMENDATIONS
Pregnant women
The CDC now recommends that asymptomatic pregnant women who returned from travel to a Zika virus-endemic zone in the last 2 to 12 weeks be offered serologic testing.41 This includes women who may be living in an area with ongoing Zika virus transmission; however, these women should also have testing at the initiation of prenatal care and then follow-up testing in the middle of the second trimester. Of importance, these results may be difficult to interpret due to potential cross-reactivity between Zika virus and other flaviviruses, and false-positive results in recipients of yellow fever and Japanese encephalitis vaccines.41,59
If a pregnant woman with a positive travel history is symptomatic, testing should be offered during the first week of illness. After day 4 of the illness, testing should include both RT-PCR and IgM serology.41,59
A screening ultrasound scan is recommended for any pregnant woman who has traveled to a Zika virus-affected area to determine if microcephaly or cerebral or intracranial calcifications are present. Those women with confirmed Zika virus infection should continue to have monthly screening ultrasounds, while those who are negative for Zika virus should have another ultrasound at the end of the second trimester or the beginning of the third trimester to ensure that no abnormalities had developed.41,59
At present, pregnant women and women of childbearing age who may become pregnant are advised by the CDC to postpone travel to affected areas until more information becomes available about mother-to-child transmission.59
Algorithms for the care of pregnant women and women of childbearing age who may have been exposed to Zika virus are available from the CDC41 at www.cdc.gov/mmwr/volumes/65/wr/mm6505e2.htm.
Male partners of pregnant women
Since the length of time that Zika virus remains viable in semen is not known, men who have traveled to Zika virus-endemic areas and who have pregnant partners should refrain from having sex or use a condom with every sexual encounter through the duration of the pregnancy.60
Guidelines for prevention of sexual transmission of Zika virus are available from the CDC59 at www.cdc.gov/mmwr/volumes/65/wr/mm6505e1er.htm.
Infants with possible congenital Zika virus infection
Zika virus testing is recommended for any infant born with microcephaly or intracranial calcifications or whose mother has positive or inconclusive testing if the mother had visited an endemic area during her pregnancy.
Zika virus testing in infants consists of serologic IgM determination and RT-PCR for both dengue and Zika virus drawn concurrently in the first 2 days of life.36 Umbilical cord blood can be used. In addition, if cerebrospinal fluid is being collected for other reasons, it can also be tested for Zika virus. The placenta and umbilical cord should be saved for immunohistochemistry testing for Zika virus.61
An infant who tests positive or inconclusive for Zika virus, regardless of the presence of microcephaly or intracranial calcifications, should have a complete physical examination specifically evaluating growth parameters, estimated gestational age, and signs of neurologic disease, skin rashes, hepatosplenomegaly, or any dysmorphic features. Additional evaluation includes an ophthalmologic examination in the first month of life to evaluate for macular atrophy.36 An ultrasound scan of the head should be completed if it has not been done. Hearing is screened in all newborns, and hearing testing should be repeated at 6 months of age.36
Infants with microcephaly or intracranial calcifications should also have consultations with specialists in genetics, neurology, and pediatric infectious diseases.61 These infants should have blood work including complete blood cell counts and liver function testing that includes alanine aminotransferase, aspartate aminotransferase, and bilirubin levels.36
All infants with possible congenital Zika virus infection should be followed long-term with close attention to developmental milestones and growth parameters including occipital frontal head circumference measurements.61,62
Infants without microcephaly or calcifications whose mothers had negative Zika virus test results or were not tested for Zika virus should have routine care.37
Guidelines for the care of infants with Zika virus infection are available from the CDC36 at www.cdc.gov/mmwr/volumes/65/wr/mm6503e3.htm.
TREATMENT
There is no treatment for Zika virus infection, and care is supportive. Most infections are mild and self-limited.12,15 Avoidance of aspirin and other nonsteroidal anti-inflammatory drugs that may affect platelets is important until dengue infection has been ruled out.
PREVENTION
There is currently no vaccine to prevent Zika virus infection. Woman who are pregnant should avoid travel to any area where Zika virus transmission is occurring.41,59 The CDC advises pregnant women and women of childbearing age who may become pregnant to postpone travel to Zika virus-affected areas.59 Patients can find travel alerts for specific areas at wwwnc.cdc.gov/travel/notices/alert/zika-virus-south-america.
Avoiding mosquito bites is the best way to prevent the spread of Zika virus. Aedes aegypti and A albopictus, the most common vectors of Zika virus, can bite at night but are known more for being aggressive daytime biters.63 Travelers should apply an Environmental Protection Agency-registered insect repellent as directed, wear long-sleeved shirts and long pants, use permethrin-treated clothing and gear, and stay in places with screens or air conditioning. Any containers with standing water should be eliminated as they are breeding areas for mosquitoes. It is also important that symptomatic people in the first week of illness use mosquito precautions to prevent the spread of Zika virus.
Patient handouts and posters for mosquito bite prevention can be found at www.cdc.gov/zika/fs-posters/index.html.
WATCH FOR UPDATES
Many questions remain regarding the epidemiology of this infection and its relationship to neurologic and pregnancy complications. However, due to its rapid spread across the Western hemisphere and its potential for significant complications, much is being done at the local and international levels to better understand the virus and halt its spread. More information will continue to be available as results from ongoing studies are conducted and potential associations are investigated. Until more is known, providers should familiarize themselves with the latest guidelines in order to better counsel their patients who may live in or travel to Zika virus endemic areas. We advise clinicians to follow the CDC’s web site, www.cdc.gov/zika/.
- World Health Organization. Zika virus fact sheet. www.who.int/mediacentre/factsheets/zika/en/. Accessed February 24, 2016.
- Centers for Disease Control and Prevention. Areas with Zika. www.cdc.gov/zika/geo/index.html. Accessed February 24, 2016.
- Rice CM. Flaviviruses. In: Fields BN, Knipe DM, Howley PM, Chanock RM, editors. Fields Virology, 3rd ed. Philadelphia: Lippincott-Raven, 1996:961–1034.
- Kuno G, Chang GJ, Tsuchiya KR, Karabatsos N, Cropp CB. Phylogeny of the genus Flavivirus. J Virol 1998; 72:73–83.
- Haddow AD, Schuh AJ, Yasuda CY, et al. Genetic characterization of Zika virus strains: geographic expansion of the Asian lineage. PLoS Negl Trop Dis 2012; 6:e1477.
- Faye O, Freire CC, Iamarino A, et al. Molecular evolution of Zika virus during its emergence in the 20(th) century. PLoS Negl Trop Dis 2014; 8:e2636.
- Dick GW, Kitchen SF, Haddow AJ. Zika virus. I. Isolations and serological specificity. Trans R Soc Trop Med Hyg 1952; 46:509–520.
- Dick GW. Zika virus. II. Pathogenicity and physical properties. Trans R Soc Trop Med Hyg 1952; 46:521–534.
- Fagbami AH. Zika virus infections in Nigeria: virological and seroepidemiological investigations in Oyo State. J Hyg (Lond) 1979; 83:213–219.
- Hayes EB. Zika virus outside Africa. Emerg Infect Dis 2009; 15:1347–1350.
- Heang V, Yasuda CY, Sovann L, et al. Zika virus infection, Cambodia, 2010. Emerg Infect Dis 2012; 18:349–351.
- Duffy MR, Chen TH, Hancock WT, et al. Zika virus outbreak on Yap Island, Federated States of Micronesia. N Engl J Med 2009; 360:2536–2543.
- Musso D, Nilles EJ, Cao-Lormeau VM. Rapid spread of emerging Zika virus in the Pacific area. Clin Microbiol Infec 2014; 20:O595–O596.
- Cao-Lormeau VM, Roche C, Teissier A, et al. Zika virus, French polynesia, South Pacific, 2013. Emerg Infect Dis 2014; 20:1085–1086.
- Ioos S, Mallet HP, Leparc Goffart I, Gauthier V, Cardoso T, Herida M. Current Zika virus epidemiology and recent epidemics. Med Mal Infect 2014; 44:302–307.
- Tognarelli J, Ulloa S, Villagra E, et al. A report on the outbreak of Zika virus on Easter Island, South Pacific, 2014. Arch Virol Nov 26 2015 [Epub ahead of print].
- Pan American Health Organization/World Health Organization, Regional Office for the Americas. Zika virus infection. 7 May 2015. www.paho.org/hq/index.php?option=com_docman&task=doc_view&Itemid=270&gid=30075=en. Accessed February 24, 2016.
- Fauci AS, Morens DM. Zika virus in the Americas—yet another arbovirus threat. N Engl J Med 2016; 347:601–604.
- Marcondes CB, Ximenes MF. Zika virus in Brazil and the danger of infestation by Aedes (Stegomyia) mosquitoes. Rev Soc Bras Med Trop. Dec 22 2015. pii: S0037-86822015005003102. [Epub ahead of print]
- Weinbren MP, Williams MC. Zika virus: further isolations in the Zika area, and some studies on the strains isolated. Trans R Soc Trop Med Hyg 1958; 52:263–268.
- Diallo D, Sall AA, Diagne CT, et al. Zika virus emergence in mosquitoes in southeastern Senegal, 2011. PLoS One 2014; 9:e109442.
- Grard G, Caron M, Mombo IM, et al. Zika virus in Gabon (Central Africa)—2007: a new threat from Aedes albopictus? PLoS Negl Trop Dis 2014; 8:e2681.
- Hennessey M, Fischer M, Staples JE. Zika virus spreads to new areas—region of the Americas, May 2015–January 2016. MMWR 2016; 65:55–58.
- Musso D, Roche C, Robin E, Nhan T, Teissier A, Cao-Lormeau VM. Potential sexual transmission of Zika virus. Emerg Infect Dis 2015; 21:359–361.
- Foy BD, Kobylinski KC, Chilson Foy JL, et al. Probable non-vector-borne transmission of Zika virus, Colorado, USA. Emerg Infect Dis 2011; 17:880–882.
- Smith J, Woldai S, Chung W. Health advisory: sexual transmission of Zika virus. Dallas Country Department of Health and Human Services, February 2, 2016. http://walnuthillobgyn.com/wp-content/uploads/2012/05/zika-transmission.pdf. Accessed February 24, 2016.
- Hills SL, Russell K, Hennessey M, et al. Transmission of Zika virus through sexual contact with travelers to areas of ongoing transmission—continental United States, 2016. MMWR Early release February 26, 2016. www.cdc.gov/mmwr/volumes/65/wr/mm6508e2er.htm Accessed February 29, 2016.
- Musso D, Nhan T, Robin E, et al. Potential for Zika virus transmission through blood transfusion demonstrated during an outbreak in French Polynesia, November 2013 to February 2014. Euro Surveill 2014; 19(14). pii: 20761. Erratum in Euro Surveill 2014; 19(15). pii/20771.
- Marano G, Pupella S, Vaglio S, Liumbruno GM, Grazzini G. Zika virus and the never-ending story of emerging pathogens and transfusion medicine. Blood Transfus 2015; Nov 5:1–6. doi: 10.2450/2015.0066-15. [Epub ahead of print]
- European Centre for Disease Prevention and Control. Epidemiological update: complications potentially linked to Zika virus outbreak, Brazil and French Polynesia. November 27, 2015. http://ecdc.europa.eu/en/press/news/_layouts/forms/News_DispForm.aspx?ID=1332&List=8db7286c-fe2d-476c-9133-18ff4cb1b568&Source=http%3A%2F%2Fecdc%2Eeuropa%2Eeu%2Fen%2Fpress%2Fepidemiological%5Fupdates%2FPages%2Fepidemiological%5Fupdates%2Easpx. Accessed February 24, 2016
- European Centre for Disease Prevention and Control. Rapid risk assessment. Zika virus infection outbreak, Brazil and the Pacific region 25 May 2015. http://ecdc.europa.eu/en/publications/Publications/rapid-risk-assessment-Zika%20virus-south-america-Brazil-2015.pdf. Accessed February 24, 2016
- Regan DM, Markowitz MA. Association Bulletin #16-03. Re: Zika, dengue, and chikungunya viruses. American Association of Blood Banks, February 1, 2016. www.aabb.org/programs/publications/bulletins/Documents/ab16-03.pdf. Accessed February 24, 2016.
- US Food and Drug Administration (FDA). Recommendations for donor screening, deferral, and product management to reduce the risk of transfusion-transmission of Zika virus. Guidance for industry. February, 2016. www.fda.gov/downloads/BiologicsBloodVaccines/GuidanceComplianceRegulatoryInformation/Guidances/Blood/UCM486360.pdf. Accessed February 24, 2016.
- Besnard M, Lastere S, Teissier A, Cao-Lormeau V, Musso D. Evidence of perinatal transmission of Zika virus, French Polynesia, December 2013 and February 2014. Euro Surveill 2014; 19(13). pii: 20751.
- Oliveira Melo AS, Malinger G, Ximenes R, Szejnfeld PO, Alves Sampaio S, Bispo de Filippis AM. Zika virus intrauterine infection causes fetal brain abnormality and microcephaly: tip of the iceberg? Ultrasound Obstet Gynecol 2016; 47:6–7.
- Staples JE, Dziuban EJ, Fischer M, et al. Interim guidelines for the evaluation and testing of infants with possible congenital Zika virus infection—United States, 2016. MMWR 2016; 65:63–67.
- Fleming-Dutra K, Nelson J, Fischer M, Staples J, Mateusz P, et al. Update: interim guidelines for health care providers caring for infants and children with possible Zika virus infection—United States, February 2016. MMWR 2016; 65:1–6.
- Simpson DI. Zika virus infection in man. Trans R Soc Trop Med Hyg Jul 1964; 58:335–338.
- Olson JG, Ksiazek TG, Suhandiman, Triwibowo. Zika virus, a cause of fever in Central Java, Indonesia. Trans R Soc Trop Med Hyg 1981; 75:389–393.
- Bearcroft WG. Zika virus infection experimentally induced in a human volunteer. Trans R Soc Trop Med Hyg 1956; 50:442–448.
- Oduyebo T, Petersen EE, Rasmussen SA, et al. Update: interim guidelines for health care providers caring for pregnant women and women of reproductive age with possible Zika virus exposure—United States, 2016. MMWR 2016; 65:122–127.
- Gourinat AC, O’Connor O, Calvez E, Goarant C, Dupont-Rouzeyrol M. Detection of Zika virus in urine. Emerg Infect Dis 2015; 21:84–86.
- Zanluca C, de Melo VC, Mosimann AL, Dos Santos GI, Dos Santos CN, Luz K. First report of autochthonous transmission of Zika virus in Brazil. Mem Inst Oswaldo Cruz 2015; 110:569–572.
- Alera MT, Hermann L, Tac-An IA, et al. Zika virus infection, Philippines, 2012. Emerg Infect Dis 2015; 21:722–724.
- Lanciotti RS, Kosoy OL, Laven JJ, et al. Genetic and serologic properties of Zika virus associated with an epidemic, Yap State, Micronesia, 2007. Emerg Infect Dis 2008; 14:1232–1239.
- Centers for Disease Control and Prevention. Chikungunya virus. Clinical evaluation & disease. www.cdc.gov/chikungunya/hc/clinicalevaluation.html. Accessed February 24, 2016.
- Centers for Disease Control and Prevention. Clinical guidance. Dengue virus. www.cdc.gov/dengue/clinicalLab/clinical.html. Accessed February 24, 2016.
- Pan American Health Organization/World Health Organization. Epidemiological alert. Increase in microcephaly in the northeast of Brazil. November 17, 2015. http://www.paho.org/hq/index.php?option=com_docman&task=doc_view&Itemid=270&gid=32636&lang=en. Accessed February 24, 2016.
- Rubin EJ, Greene MF, Baden LR. Zika virus and microcephaly. N Engl J Med 2016; Feb 10 [Epub ahead of print].
- Oehler E, Watrin L, Larre P, et al. Zika virus infection complicated by Guillain-Barré syndrome—case report, French Polynesia, December 2013. Euro Surveill 2014; 19(9). pii: 20720.
- Pan American Health Organization/World Health Organization. Epidemiological alert. Neurological syndrome, congenital malformations, and Zika virus infection. Implications for public health in the Americas. December 1, 2015. www.paho.org/hq/index.php?option=com_docman&task=doc_view&Itemid=270&gid=32405&lang=en. Accessed February 24, 2016.
- Martines R, Bhatnagar J, Keating M, et al. Notes from the field: evidence of Zika virus infection in brain and placental tissues from two congenitally infected newborns and two fetal losses—Brazil, 2015. MMRW 2016; 65:159–160.
- Ashwal S, Michelson D, Plawner L, Dobyns WB; Quality Standards Subcommittee of the American Academy of Neurology and the Practice Committee of the Child Neurology Society. Practice parameter: evaluation of the child with microcephaly (an evidence-based review): report of the Quality Standards Subcommittee of the American Academy of Neurology and the Practice Committee of the Child Neurology Society. Neurology 2009; 73:887–897.
- Ventura CV, Maia M, Bravo-Filho V, Góis AL, Belfort R Jr. Zika virus in Brazil and macular atrophy in a child with microcephaly. Lancet 2016; 387:228.
- Centers for Disease Control and Prevention. Updated diagnostic testing for Zika, chikungunya, and dengue viruses in US Public Health Laboratories. http://stacks.cdc.gov/view/cdc/37594. Accessed February 24, 2016.
- Faye O, Faye O, Diallo D, Diallo M, Weidmann M, Sall AA. Quantitative real-time PCR detection of Zika virus and evaluation with field-caught mosquitoes. Virol J 2013; 10:311.
- Musso D, Roche C, Nhan TX, Robin E, Teissier A, Cao-Lormeau VM. Detection of Zika virus in saliva. J Clin Virol 2015; 68:53–55.
- Atkinson B, Hearn P, Afrough B, et al. Detection of Zika virus in semen [letter]. Emerg Infect Dis 2016 May. http://wwwnc.cdc.gov/eid/article/22/5/16-0107_article. Accessed February 24, 2016.
- Petersen EE, Staples JE, Meaney-Delman D, et al. Interim guidelines for pregnant women during a Zika virus outbreak—United States, 2016. MMWR 2016; 65:30–33.
- Oster AM, Brooks JT, Stryker JE, et al. Interim guidelines for prevention of sexual transmission of Zika virus—United States, 2016. MMWR 2016; 65:120–121.
- Staples JE, Dziuban EJ, Fischer M, et al. Interim guidelines for the evaluation and testing of infants with possible congenital Zika virus infection—United States, 2016. MMWR 2016; 65:63–67.
- Centers for Disease Control and Prevention. Zika virus clinical evaluation and disease. www.cdc.gov/zika/hc-providers/clinicalevaluation.html. Accessed February 24, 2016.
- Centers for Disease Control and Prevention. Zika virus. Transmission & risks. www.cdc.gov/zika/transmission/index.html. Accessed February 29, 2016.
On February 1, 2016, the World Health Organization declared Zika virus a public health emergency of international concern due to clusters of microcephaly and neurologic manifestations in areas of Zika virus transmission.1 On February 8, the US Centers for Disease Control and Prevention (CDC) elevated its response to level 1, its highest.2
Case reports and guidelines have been published to help clinicians better understand the epidemiology, risk, and pathogenesis of Zika virus infection, but much is still unknown. Clinicians must be ready to address the concerns of international travelers and must also consider Zika virus in the differential diagnosis of fever in the returned traveler.
FLAVIVIRUSES: DENGUE, WEST NILE … ZIKA
Zika virus, a single-stranded RNA arthropod-borne virus (arbovirus), is transmitted by mosquitoes. It is a member of the flavivirus family, which consists of over 70 viruses including some well known for causing diseases in humans, such as dengue, yellow fever, Japanese encephalitis, and West Nile virus.3
Phylogenetically, Zika virus is most similar to and included in a clade with Spondweni virus, which, like Zika, originated in Africa.4 Genomic analysis has revealed an African and an Asian lineage. The Asian lineage is responsible for the current epidemic in the Pacific and the Western Hemisphere.4–6
OUT OF AFRICA AND ASIA
Zika virus is named after a forested area in present-day Uganda, where it was first isolated in a febrile rhesus monkey that was being used to study yellow fever.7 Further studies in the 1950s confirmed its transmission to humans, as 6% of the sera tested in Ugandans showed evidence of specific antibodies to the virus.8 In 1978, antibody prevalence studies showed that up to 40% of Nigerians had Zika virus-neutralizing antibodies.9 Over the next 38 years, scattered case reports and seroprevalence studies showed infections occurring throughout Africa and Asia.9–11
In 2007, the first case of Zika virus transmission outside of Asia and Africa occurred on Yap Island in the Federated States of Micronesia.10–12 No further transmission in the Pacific was noted for 6 years until an outbreak occurred in French Polynesia in 2013.13–15 The first time Zika virus was found in the Western Hemisphere was in January 2014, when an outbreak occurred on Chile’s Easter Island.16 Genomic analysis of the Zika virus isolated on Easter Island indicated it was most closely related to isolates from French Polynesia.16 In 2014, additional cases of Zika virus infection were reported in New Caledonia and the Cook Islands.13,14
In May 2015, the World Health Organization issued an epidemiologic alert in response to dramatic increases in the spread of Zika virus in Brazil.17 From Brazil, Zika virus has rapidly spread to most countries in South and Central America and the Caribbean (Figure 1).2,5,6
TRANSMITTED BY MOSQUITO
The Aedes (Stegomyia) genus of mosquitoes is a well-known source of transmission for several arboviruses, including yellow fever, dengue, chikungunya, and now Zika virus.18,19 Zika virus was originally isolated in Uganda from Aedes africanus mosquitoes.7,20 Subsequently, other species of Aedes mosquitoes have been shown to transmit Zika virus, with Aedes aegypti being the most important human vector.7,8,19–21
Another species, Aedes albopictus has been identified as a human vector in Gabon and is also suspected of being a vector in the Brazilian outbreak.22 Spread of A albopictus from Asia to Europe, the Mediterranean region, and the Americas, including 32 states in the United States, has increased the fear of potential spread of Zika virus infection to a more expansive geographic range.13,18,19 Local transmission may become established if local mosquitoes become infected when infected travelers return from endemic areas.23
OTHER ROUTES OF TRANSMISSION
While mosquito-borne transmission is the most common route of infection with Zika virus, human-to-human transmission has been documented. Potential routes of transmission include sexual intercourse, blood transfusions, and vertical (mother-to-child) transmission.
Sexual transmission. Replicative Zika virus particles were identified in the semen of a patient who presented with hematospermia in French Polynesia.24
Previously, there was a report of Zika virus being sexually transmitted from a US man who had returned from Senegal to his spouse, who had not traveled to a Zika virus-endemic region. Both patients became ill following vaginal intercourse, with the onset of the wife’s illness occurring 5 days after the onset of the husband’s illness. The husband was noted to have hematospermia.25 Neutralization testing for both patients confirmed infection with Zika virus.25
The first reported case of sexual transmission in the current outbreak in the United States occurred in a traveler returning to Texas from Venezuela.26 The CDC is currently investigating several other potential cases and an additional two laboratory-confirmed cases. All cases were in symptomatic male travelers who had condomless vaginal intercourse with their female partners after return from Zika virus-endemic areas.27
Blood transfusions. Several arboviruses are known to be transmitted via blood.
In French Polynesia, Zika virus RNA was present in 3% of blood donors.28,29 These blood donors had been screened and were asymptomatic at the time of donation. Twenty-six percent of donors who had Zika RNA reported an illness compatible with Zika virus infection in the 3 to 10 days before donation.28
Brazil has reported two cases of Zika virus infection through blood transfusion.30
In May 2015, the European Centers for Disease Control recommended that travelers to affected areas defer blood donation for 28 days.31 The Association of American Blood Banks has also recommended that travelers self-defer donating blood for 28 days after travel to an endemic area.32 Most recently the US Food and Drug Administration recommended a 4-week deferral for travelers to Zika virus-endemic areas and after resolution of symptoms for those who have had Zika virus infection.33 Additional guidance for donors who have had sexual contact with Zika virus-infected persons and areas with active transmission of Zika virus is also available.33
Vertical transmission. Perinatal and transplacental transmission have also been documented.34,35 The extent and frequency of the clinical manifestations of these infections are still being elucidated in light of reports of association with fetal abnormalities.
Although Zika virus has been detected in breast milk, no cases of transmission through breastfeeding have been reported. Currently, women are advised to continue to breastfeed in areas of known Zika virus transmission.34,36,37
IS USUALLY ASYMPTOMATIC OR CAUSES MILD SYMPTOMS
Most Zika virus infections are asymptomatic, as illustrated by reports from the Yap Island outbreak, where only 19% of those with immunoglobulin M (IgM) antibodies to Zika virus had symptoms.12 The illness in symptomatic patients is often mild and self-limited, and most manifestations resolve by 7 days.12,25,38,39
Initial descriptions in the 1950s and 1960s of the clinical features of Zika virus infection in Africa included fever and headache as the most prominent symptoms.38,40 Description of the outbreak on Yap in 2007 characterized the predominant symptoms as rash, fever, arthralgia/arthritis, and nonpurulent conjunctivitis in 31 patients,12 and the current CDC case definition includes at least two of these four symptoms.41 The arthralgia and arthritis are usually of the small joints of the hands and feet and can persist for as long as a month.25,42 The rash can be pruritic.15,33,42,43
Less commonly reported manifestations of Zika virus infection include malaise, stomachaches, dizziness, anorexia, retro-orbital pain, aphthous ulcers, hematospermia, and prostatitis.14,15,24,25,44,45
The initial reports from eight patients in the outbreak in Brazil noted rash and joint pain as the most common manifestations. The maculopapular rash was present in all patients and the joint pain was characterized as severe, with the hands, ankles, elbows, knees, and wrists most consistently described.43
The clinical presentation is similar to those of dengue and chikungunya virus infections, confounding diagnosis, as these viruses may be cocirculating in the same geographic regions (and indeed are transmitted by the same mosquito vectors).11,12,15 The conjunctivitis present in Zika virus infections can also be present in chikungunya but is much less commonly a clinical feature of dengue.15,46,47 See Table 1 for the differential diagnosis of Zika virus infection.
Severe manifestations requiring hospitalization or resulting in death are thought to be uncommon, although neurologic and fetal complications have recently been described.12,29,43,48,49
CLINICAL ASSOCIATIONS
Primary infection with Zika virus is relatively benign. The greatest and most recent concerns are related to postinfectious complications and those that may occur in pregnant women.
Guillain-Barré syndrome
During the Zika virus outbreak in French Polynesia in 2013–2014, the incidence of Guillain-Barré syndrome was multiplied by a factor of 20.50 Prior to the first hospitalization of a patient with Zika virus infection and associated Guillain-Barré syndrome in French Polynesia, there had been no reported hospitalizations for Zika virus infection.50
This same association is now being seen in the recent outbreak in the Americas.50 In July 2015, Brazilian health officials in the State of Bahia reported 76 patients with neurologic syndromes, of whom 55% had Guillain-Barré syndrome.51 A history consistent with Zika virus infection was found in 62%.48
In January 2016, El Salvador also reported an unusual increase in Guillain-Barré syndrome cases since early December 2015.51 Between December 1, 2015, and January 6, 2016, there were 46 Guillain-Barré syndrome cases reported, compared with a baseline of 14 cases per month.51
Other countries where Zika virus infection is endemic are also currently investigating similar trends.51
Microcephaly
On November 17, 2015, the Pan American Health Organization issued an epidemiologic alert because of increased reports of microcephaly in the Pernambuco State of Brazil. Whereas there are typically about 10 cases per year, there had been 141 in the previous 11 months.51 Other states in Brazil such as Paraiba and Rio Grande del Norte also reported increases in the diagnosis of microcephaly. A physician alert published in Brazil described two infants from the Paraiba state who were diagnosed with fetal microcephaly.35 Testing for Zika virus by polymerase chain reaction (PCR) was negative in the maternal blood, but PCR of amniotic fluid was positive in both infants.35
In January 2016, the Brazil Ministry of Health reported that Zika virus had been detected by real-time PCR (RT-PCR) in four infants with congenital malformations in Rio Grande del Norte. Two of these cases were miscarriages and two were infants who died within 24 hours of birth. Immunohistochemistry of tissues from these infants was positive for Zika virus.
A February 2016 case report describes a European woman who developed Zika virus infection at 13 weeks gestation while working in Northeast Brazil and upon return to Europe elected to terminate the pregnancy after ultrasonography showed cerebral calcifications with microcephaly. The infant was found to have a very small brain, hypoplasia of the brainstem and spinal cord with degeneration of spinal tracts, complete absence of cerebral gyri, and severe dilatation of lateral ventricles as well as calcifications throughout the cerebral cortex.49 No genetic abnormalities or evidence of other etiologies was found, and large amounts of Zika virus RNA were found in the brain.
The CDC also recently reported confirmation of Zika virus infection from fetal tissues of two miscarriages (fetal loss at 11 and 13 weeks) and two fetal deaths (36 and 38 weeks) received from the state of Rio Grande do Norte in Brazil.52 All four mothers reported clinical signs of fever and rash during their first trimester of pregnancy.52 Additional testing for toxoplasmosis, rubella, cytomegalovirus, herpes simplex, and human immunodeficiency virus were all negative in the mothers who had miscarriages.52
Of critical note, the causality of Zika virus and microcephaly remains under investigation. See Table 2 for other causes of microcephaly.53
Macular atrophy
In January 2016, a case series of three infants with microcephaly and macular atrophy was reported.54 These infants were tested for toxoplasmosis, rubella, cytomegalovirus, herpes simplex, syphilis, and human immunodeficiency virus (HIV), and all the results were negative. The detection of Zika virus fulfilled the Brazilian Ministry of Health’s definition of vertical transmission of Zika virus, and laboratory diagnostic tests for Zika virus were not performed. In this series, one mother reported an illness with rash and arthralgias during the first trimester.54
LABORATORY DIAGNOSTIC METHODS
The diagnosis of Zika virus infection is challenging. The low viremia at initial presentation and cross-reactivity of serologic testing with other flaviviruses, especially dengue, can contribute to misdiagnosis.40,50
In the first 7 days of Zika virus infection, the diagnosis is based on detection of viral RNA in serum by RT-PCR.12,55,56 RT-PCR is very specific for Zika virus and is an important tool in differentiating between Zika virus and other flaviviruses often present in areas where Zika virus is circulating.12,56 After 3 to 4 days, viremia may decrease to levels that may be below the assay’s level of detection.40–42,45
While Zika virus RNA may be undetectable in the serum, other samples such as saliva, urine, and semen may be positive for longer.28,42,57 For example, urine samples were positive by RT-PCR up to 7 days beyond blood RT-PCR in the outbreak in New Caledonia.42 A recent report found semen remaining positive on RT-PCR for 62 days after the onset of confirmed Zika virus illness in a traveler returning to the United Kingdom from the Cook Islands in 2014.58
Because RT-PCR of blood is only useful early in infection, the current diagnostic guidelines recommend testing an acute-phase serum sample for Zika virus IgM collected as early as possible after the onset of illness and repeated 2 to 3 weeks after the initial set. These IgM antibodies typically develop toward the end of the first week of illness and are expected to be present for up to 12 weeks, based on experience with other flaviviruses.41 Cross-reactivity with other flaviviruses circulating in the area can occur and has been problematic in areas where dengue is circulating.12,41,45,56 IgM-positive specimens should be further tested, by plaque-reduction neutralization, to confirm the presence of Zika virus-specific neutralizing antibodies. Results can be difficult to interpret, especially in those who have been previously infected or vaccinated against other flaviviruses.12,41
If amniocentesis is done, these specimens should be tested by RT-PCR. However, the sensitivity of PCR in amniotic fluid is currently unknown.41
In infants with findings of cerebral calcifications and microcephaly, IgM serologies with RT-PCR are also recommended and should be drawn within 2 days of birth. Specimens should be drawn concurrently as it is not known which test is most reliable in infants.23 Additionally, placenta and umbilical cord samples should be collected for immunohistochemical staining at specialized laboratories.36
In the United States, providers should contact their state health departments to determine where tests can be run reliably. Refined diagnostic assays are in development at the time of this publication and are likely to be made available through CDC’s Laboratory Response Network.
See Figure 2 and Table 3 for a summary of diagnostic tests.
IMPLICATIONS, RECOMMENDATIONS
Pregnant women
The CDC now recommends that asymptomatic pregnant women who returned from travel to a Zika virus-endemic zone in the last 2 to 12 weeks be offered serologic testing.41 This includes women who may be living in an area with ongoing Zika virus transmission; however, these women should also have testing at the initiation of prenatal care and then follow-up testing in the middle of the second trimester. Of importance, these results may be difficult to interpret due to potential cross-reactivity between Zika virus and other flaviviruses, and false-positive results in recipients of yellow fever and Japanese encephalitis vaccines.41,59
If a pregnant woman with a positive travel history is symptomatic, testing should be offered during the first week of illness. After day 4 of the illness, testing should include both RT-PCR and IgM serology.41,59
A screening ultrasound scan is recommended for any pregnant woman who has traveled to a Zika virus-affected area to determine if microcephaly or cerebral or intracranial calcifications are present. Those women with confirmed Zika virus infection should continue to have monthly screening ultrasounds, while those who are negative for Zika virus should have another ultrasound at the end of the second trimester or the beginning of the third trimester to ensure that no abnormalities had developed.41,59
At present, pregnant women and women of childbearing age who may become pregnant are advised by the CDC to postpone travel to affected areas until more information becomes available about mother-to-child transmission.59
Algorithms for the care of pregnant women and women of childbearing age who may have been exposed to Zika virus are available from the CDC41 at www.cdc.gov/mmwr/volumes/65/wr/mm6505e2.htm.
Male partners of pregnant women
Since the length of time that Zika virus remains viable in semen is not known, men who have traveled to Zika virus-endemic areas and who have pregnant partners should refrain from having sex or use a condom with every sexual encounter through the duration of the pregnancy.60
Guidelines for prevention of sexual transmission of Zika virus are available from the CDC59 at www.cdc.gov/mmwr/volumes/65/wr/mm6505e1er.htm.
Infants with possible congenital Zika virus infection
Zika virus testing is recommended for any infant born with microcephaly or intracranial calcifications or whose mother has positive or inconclusive testing if the mother had visited an endemic area during her pregnancy.
Zika virus testing in infants consists of serologic IgM determination and RT-PCR for both dengue and Zika virus drawn concurrently in the first 2 days of life.36 Umbilical cord blood can be used. In addition, if cerebrospinal fluid is being collected for other reasons, it can also be tested for Zika virus. The placenta and umbilical cord should be saved for immunohistochemistry testing for Zika virus.61
An infant who tests positive or inconclusive for Zika virus, regardless of the presence of microcephaly or intracranial calcifications, should have a complete physical examination specifically evaluating growth parameters, estimated gestational age, and signs of neurologic disease, skin rashes, hepatosplenomegaly, or any dysmorphic features. Additional evaluation includes an ophthalmologic examination in the first month of life to evaluate for macular atrophy.36 An ultrasound scan of the head should be completed if it has not been done. Hearing is screened in all newborns, and hearing testing should be repeated at 6 months of age.36
Infants with microcephaly or intracranial calcifications should also have consultations with specialists in genetics, neurology, and pediatric infectious diseases.61 These infants should have blood work including complete blood cell counts and liver function testing that includes alanine aminotransferase, aspartate aminotransferase, and bilirubin levels.36
All infants with possible congenital Zika virus infection should be followed long-term with close attention to developmental milestones and growth parameters including occipital frontal head circumference measurements.61,62
Infants without microcephaly or calcifications whose mothers had negative Zika virus test results or were not tested for Zika virus should have routine care.37
Guidelines for the care of infants with Zika virus infection are available from the CDC36 at www.cdc.gov/mmwr/volumes/65/wr/mm6503e3.htm.
TREATMENT
There is no treatment for Zika virus infection, and care is supportive. Most infections are mild and self-limited.12,15 Avoidance of aspirin and other nonsteroidal anti-inflammatory drugs that may affect platelets is important until dengue infection has been ruled out.
PREVENTION
There is currently no vaccine to prevent Zika virus infection. Woman who are pregnant should avoid travel to any area where Zika virus transmission is occurring.41,59 The CDC advises pregnant women and women of childbearing age who may become pregnant to postpone travel to Zika virus-affected areas.59 Patients can find travel alerts for specific areas at wwwnc.cdc.gov/travel/notices/alert/zika-virus-south-america.
Avoiding mosquito bites is the best way to prevent the spread of Zika virus. Aedes aegypti and A albopictus, the most common vectors of Zika virus, can bite at night but are known more for being aggressive daytime biters.63 Travelers should apply an Environmental Protection Agency-registered insect repellent as directed, wear long-sleeved shirts and long pants, use permethrin-treated clothing and gear, and stay in places with screens or air conditioning. Any containers with standing water should be eliminated as they are breeding areas for mosquitoes. It is also important that symptomatic people in the first week of illness use mosquito precautions to prevent the spread of Zika virus.
Patient handouts and posters for mosquito bite prevention can be found at www.cdc.gov/zika/fs-posters/index.html.
WATCH FOR UPDATES
Many questions remain regarding the epidemiology of this infection and its relationship to neurologic and pregnancy complications. However, due to its rapid spread across the Western hemisphere and its potential for significant complications, much is being done at the local and international levels to better understand the virus and halt its spread. More information will continue to be available as results from ongoing studies are conducted and potential associations are investigated. Until more is known, providers should familiarize themselves with the latest guidelines in order to better counsel their patients who may live in or travel to Zika virus endemic areas. We advise clinicians to follow the CDC’s web site, www.cdc.gov/zika/.
- World Health Organization. Zika virus fact sheet. www.who.int/mediacentre/factsheets/zika/en/. Accessed February 24, 2016.
- Centers for Disease Control and Prevention. Areas with Zika. www.cdc.gov/zika/geo/index.html. Accessed February 24, 2016.
- Rice CM. Flaviviruses. In: Fields BN, Knipe DM, Howley PM, Chanock RM, editors. Fields Virology, 3rd ed. Philadelphia: Lippincott-Raven, 1996:961–1034.
- Kuno G, Chang GJ, Tsuchiya KR, Karabatsos N, Cropp CB. Phylogeny of the genus Flavivirus. J Virol 1998; 72:73–83.
- Haddow AD, Schuh AJ, Yasuda CY, et al. Genetic characterization of Zika virus strains: geographic expansion of the Asian lineage. PLoS Negl Trop Dis 2012; 6:e1477.
- Faye O, Freire CC, Iamarino A, et al. Molecular evolution of Zika virus during its emergence in the 20(th) century. PLoS Negl Trop Dis 2014; 8:e2636.
- Dick GW, Kitchen SF, Haddow AJ. Zika virus. I. Isolations and serological specificity. Trans R Soc Trop Med Hyg 1952; 46:509–520.
- Dick GW. Zika virus. II. Pathogenicity and physical properties. Trans R Soc Trop Med Hyg 1952; 46:521–534.
- Fagbami AH. Zika virus infections in Nigeria: virological and seroepidemiological investigations in Oyo State. J Hyg (Lond) 1979; 83:213–219.
- Hayes EB. Zika virus outside Africa. Emerg Infect Dis 2009; 15:1347–1350.
- Heang V, Yasuda CY, Sovann L, et al. Zika virus infection, Cambodia, 2010. Emerg Infect Dis 2012; 18:349–351.
- Duffy MR, Chen TH, Hancock WT, et al. Zika virus outbreak on Yap Island, Federated States of Micronesia. N Engl J Med 2009; 360:2536–2543.
- Musso D, Nilles EJ, Cao-Lormeau VM. Rapid spread of emerging Zika virus in the Pacific area. Clin Microbiol Infec 2014; 20:O595–O596.
- Cao-Lormeau VM, Roche C, Teissier A, et al. Zika virus, French polynesia, South Pacific, 2013. Emerg Infect Dis 2014; 20:1085–1086.
- Ioos S, Mallet HP, Leparc Goffart I, Gauthier V, Cardoso T, Herida M. Current Zika virus epidemiology and recent epidemics. Med Mal Infect 2014; 44:302–307.
- Tognarelli J, Ulloa S, Villagra E, et al. A report on the outbreak of Zika virus on Easter Island, South Pacific, 2014. Arch Virol Nov 26 2015 [Epub ahead of print].
- Pan American Health Organization/World Health Organization, Regional Office for the Americas. Zika virus infection. 7 May 2015. www.paho.org/hq/index.php?option=com_docman&task=doc_view&Itemid=270&gid=30075=en. Accessed February 24, 2016.
- Fauci AS, Morens DM. Zika virus in the Americas—yet another arbovirus threat. N Engl J Med 2016; 347:601–604.
- Marcondes CB, Ximenes MF. Zika virus in Brazil and the danger of infestation by Aedes (Stegomyia) mosquitoes. Rev Soc Bras Med Trop. Dec 22 2015. pii: S0037-86822015005003102. [Epub ahead of print]
- Weinbren MP, Williams MC. Zika virus: further isolations in the Zika area, and some studies on the strains isolated. Trans R Soc Trop Med Hyg 1958; 52:263–268.
- Diallo D, Sall AA, Diagne CT, et al. Zika virus emergence in mosquitoes in southeastern Senegal, 2011. PLoS One 2014; 9:e109442.
- Grard G, Caron M, Mombo IM, et al. Zika virus in Gabon (Central Africa)—2007: a new threat from Aedes albopictus? PLoS Negl Trop Dis 2014; 8:e2681.
- Hennessey M, Fischer M, Staples JE. Zika virus spreads to new areas—region of the Americas, May 2015–January 2016. MMWR 2016; 65:55–58.
- Musso D, Roche C, Robin E, Nhan T, Teissier A, Cao-Lormeau VM. Potential sexual transmission of Zika virus. Emerg Infect Dis 2015; 21:359–361.
- Foy BD, Kobylinski KC, Chilson Foy JL, et al. Probable non-vector-borne transmission of Zika virus, Colorado, USA. Emerg Infect Dis 2011; 17:880–882.
- Smith J, Woldai S, Chung W. Health advisory: sexual transmission of Zika virus. Dallas Country Department of Health and Human Services, February 2, 2016. http://walnuthillobgyn.com/wp-content/uploads/2012/05/zika-transmission.pdf. Accessed February 24, 2016.
- Hills SL, Russell K, Hennessey M, et al. Transmission of Zika virus through sexual contact with travelers to areas of ongoing transmission—continental United States, 2016. MMWR Early release February 26, 2016. www.cdc.gov/mmwr/volumes/65/wr/mm6508e2er.htm Accessed February 29, 2016.
- Musso D, Nhan T, Robin E, et al. Potential for Zika virus transmission through blood transfusion demonstrated during an outbreak in French Polynesia, November 2013 to February 2014. Euro Surveill 2014; 19(14). pii: 20761. Erratum in Euro Surveill 2014; 19(15). pii/20771.
- Marano G, Pupella S, Vaglio S, Liumbruno GM, Grazzini G. Zika virus and the never-ending story of emerging pathogens and transfusion medicine. Blood Transfus 2015; Nov 5:1–6. doi: 10.2450/2015.0066-15. [Epub ahead of print]
- European Centre for Disease Prevention and Control. Epidemiological update: complications potentially linked to Zika virus outbreak, Brazil and French Polynesia. November 27, 2015. http://ecdc.europa.eu/en/press/news/_layouts/forms/News_DispForm.aspx?ID=1332&List=8db7286c-fe2d-476c-9133-18ff4cb1b568&Source=http%3A%2F%2Fecdc%2Eeuropa%2Eeu%2Fen%2Fpress%2Fepidemiological%5Fupdates%2FPages%2Fepidemiological%5Fupdates%2Easpx. Accessed February 24, 2016
- European Centre for Disease Prevention and Control. Rapid risk assessment. Zika virus infection outbreak, Brazil and the Pacific region 25 May 2015. http://ecdc.europa.eu/en/publications/Publications/rapid-risk-assessment-Zika%20virus-south-america-Brazil-2015.pdf. Accessed February 24, 2016
- Regan DM, Markowitz MA. Association Bulletin #16-03. Re: Zika, dengue, and chikungunya viruses. American Association of Blood Banks, February 1, 2016. www.aabb.org/programs/publications/bulletins/Documents/ab16-03.pdf. Accessed February 24, 2016.
- US Food and Drug Administration (FDA). Recommendations for donor screening, deferral, and product management to reduce the risk of transfusion-transmission of Zika virus. Guidance for industry. February, 2016. www.fda.gov/downloads/BiologicsBloodVaccines/GuidanceComplianceRegulatoryInformation/Guidances/Blood/UCM486360.pdf. Accessed February 24, 2016.
- Besnard M, Lastere S, Teissier A, Cao-Lormeau V, Musso D. Evidence of perinatal transmission of Zika virus, French Polynesia, December 2013 and February 2014. Euro Surveill 2014; 19(13). pii: 20751.
- Oliveira Melo AS, Malinger G, Ximenes R, Szejnfeld PO, Alves Sampaio S, Bispo de Filippis AM. Zika virus intrauterine infection causes fetal brain abnormality and microcephaly: tip of the iceberg? Ultrasound Obstet Gynecol 2016; 47:6–7.
- Staples JE, Dziuban EJ, Fischer M, et al. Interim guidelines for the evaluation and testing of infants with possible congenital Zika virus infection—United States, 2016. MMWR 2016; 65:63–67.
- Fleming-Dutra K, Nelson J, Fischer M, Staples J, Mateusz P, et al. Update: interim guidelines for health care providers caring for infants and children with possible Zika virus infection—United States, February 2016. MMWR 2016; 65:1–6.
- Simpson DI. Zika virus infection in man. Trans R Soc Trop Med Hyg Jul 1964; 58:335–338.
- Olson JG, Ksiazek TG, Suhandiman, Triwibowo. Zika virus, a cause of fever in Central Java, Indonesia. Trans R Soc Trop Med Hyg 1981; 75:389–393.
- Bearcroft WG. Zika virus infection experimentally induced in a human volunteer. Trans R Soc Trop Med Hyg 1956; 50:442–448.
- Oduyebo T, Petersen EE, Rasmussen SA, et al. Update: interim guidelines for health care providers caring for pregnant women and women of reproductive age with possible Zika virus exposure—United States, 2016. MMWR 2016; 65:122–127.
- Gourinat AC, O’Connor O, Calvez E, Goarant C, Dupont-Rouzeyrol M. Detection of Zika virus in urine. Emerg Infect Dis 2015; 21:84–86.
- Zanluca C, de Melo VC, Mosimann AL, Dos Santos GI, Dos Santos CN, Luz K. First report of autochthonous transmission of Zika virus in Brazil. Mem Inst Oswaldo Cruz 2015; 110:569–572.
- Alera MT, Hermann L, Tac-An IA, et al. Zika virus infection, Philippines, 2012. Emerg Infect Dis 2015; 21:722–724.
- Lanciotti RS, Kosoy OL, Laven JJ, et al. Genetic and serologic properties of Zika virus associated with an epidemic, Yap State, Micronesia, 2007. Emerg Infect Dis 2008; 14:1232–1239.
- Centers for Disease Control and Prevention. Chikungunya virus. Clinical evaluation & disease. www.cdc.gov/chikungunya/hc/clinicalevaluation.html. Accessed February 24, 2016.
- Centers for Disease Control and Prevention. Clinical guidance. Dengue virus. www.cdc.gov/dengue/clinicalLab/clinical.html. Accessed February 24, 2016.
- Pan American Health Organization/World Health Organization. Epidemiological alert. Increase in microcephaly in the northeast of Brazil. November 17, 2015. http://www.paho.org/hq/index.php?option=com_docman&task=doc_view&Itemid=270&gid=32636&lang=en. Accessed February 24, 2016.
- Rubin EJ, Greene MF, Baden LR. Zika virus and microcephaly. N Engl J Med 2016; Feb 10 [Epub ahead of print].
- Oehler E, Watrin L, Larre P, et al. Zika virus infection complicated by Guillain-Barré syndrome—case report, French Polynesia, December 2013. Euro Surveill 2014; 19(9). pii: 20720.
- Pan American Health Organization/World Health Organization. Epidemiological alert. Neurological syndrome, congenital malformations, and Zika virus infection. Implications for public health in the Americas. December 1, 2015. www.paho.org/hq/index.php?option=com_docman&task=doc_view&Itemid=270&gid=32405&lang=en. Accessed February 24, 2016.
- Martines R, Bhatnagar J, Keating M, et al. Notes from the field: evidence of Zika virus infection in brain and placental tissues from two congenitally infected newborns and two fetal losses—Brazil, 2015. MMRW 2016; 65:159–160.
- Ashwal S, Michelson D, Plawner L, Dobyns WB; Quality Standards Subcommittee of the American Academy of Neurology and the Practice Committee of the Child Neurology Society. Practice parameter: evaluation of the child with microcephaly (an evidence-based review): report of the Quality Standards Subcommittee of the American Academy of Neurology and the Practice Committee of the Child Neurology Society. Neurology 2009; 73:887–897.
- Ventura CV, Maia M, Bravo-Filho V, Góis AL, Belfort R Jr. Zika virus in Brazil and macular atrophy in a child with microcephaly. Lancet 2016; 387:228.
- Centers for Disease Control and Prevention. Updated diagnostic testing for Zika, chikungunya, and dengue viruses in US Public Health Laboratories. http://stacks.cdc.gov/view/cdc/37594. Accessed February 24, 2016.
- Faye O, Faye O, Diallo D, Diallo M, Weidmann M, Sall AA. Quantitative real-time PCR detection of Zika virus and evaluation with field-caught mosquitoes. Virol J 2013; 10:311.
- Musso D, Roche C, Nhan TX, Robin E, Teissier A, Cao-Lormeau VM. Detection of Zika virus in saliva. J Clin Virol 2015; 68:53–55.
- Atkinson B, Hearn P, Afrough B, et al. Detection of Zika virus in semen [letter]. Emerg Infect Dis 2016 May. http://wwwnc.cdc.gov/eid/article/22/5/16-0107_article. Accessed February 24, 2016.
- Petersen EE, Staples JE, Meaney-Delman D, et al. Interim guidelines for pregnant women during a Zika virus outbreak—United States, 2016. MMWR 2016; 65:30–33.
- Oster AM, Brooks JT, Stryker JE, et al. Interim guidelines for prevention of sexual transmission of Zika virus—United States, 2016. MMWR 2016; 65:120–121.
- Staples JE, Dziuban EJ, Fischer M, et al. Interim guidelines for the evaluation and testing of infants with possible congenital Zika virus infection—United States, 2016. MMWR 2016; 65:63–67.
- Centers for Disease Control and Prevention. Zika virus clinical evaluation and disease. www.cdc.gov/zika/hc-providers/clinicalevaluation.html. Accessed February 24, 2016.
- Centers for Disease Control and Prevention. Zika virus. Transmission & risks. www.cdc.gov/zika/transmission/index.html. Accessed February 29, 2016.
KEY POINTS
- Zika virus infection is spread by the bite of infected mosquitoes and also through sexual contact, blood transfusions, and vertical transmission.
- Most Zika virus infections are asymptomatic, and symptomatic cases are often mild and self-limited, with rash, fever, joint pain, and nonpurulent conjunctivitis the most common symptoms.
- Polymerase chain reaction testing can detect viral RNA in the blood, but only in the first few days after the onset of symptoms. Immunoglobulin M against the virus becomes detectable at approximately 1 week and persists for about 12 weeks, but cross-reactivity with other viruses is a problem with serologic testing.
- As yet, there is no vaccine and no specific treatment.
- Pregnant women and women who may become pregnant are advised to defer travel to areas where Zika virus is endemic.

Be an activist to prevent edentulism among the mentally ill
Poor dental hygiene is a serious and prevalent problem among people with mental illness or cognitive impairment: Dental caries and periodontal disease are 3.4 times more common among the mentally ill than among the general population.1 Little has been published on the causes and prevention of these diseases among the mentally ill, however. Interprofessional education provides the opportunity to reinforce the connection between oral health and systemic health.
Untreated dental disease can result in edentulism (partial or complete tooth loss). Often, this condition leads to embarrassment, poor self-image, and social isolation—all of which can exacerbate the psychotic state and its symptoms. Working with your patient to improve oral health can, in turn, lead to better mental and physical health.
CASE REPORT
Edentulism in a man with schizophrenia
A 34-year-old man, given a diagnosis of schizophrenia at age 17, is admitted to the inpatient psychiatry unit for bizarre behavior. The next day, 4 maxillary and incisor teeth fall out suddenly while he is brushing his teeth. The patient is brought to emergency dental services.
Factors contributing to his tooth loss include:
- schizophrenia
- neglected oral hygiene
- adverse effects of antipsychotic medication
- lack of advice on the importance of oral hygiene
- failure to recognize signs of a dental problem.
What else can lead to edentulism?
Breakdown of the periodontal attachment2 also can be caused by disinterest in oral hygiene practices; craving of, and preference for, carbohydrates because of reduced central serotonin activity3,4; and xerostomia.
Xerostomia, or dry mouth, caused by psychotropic agents and an altered immune response, facilitates growth of pathogenic bacteria and can lead to several dental diseases (Table). These conditions are exacerbated by consumption of chewing gum, sweets, and sugary drinks in response to constantly feeling thirsty from xerostomia. Advise patients to take frequent sips of fluid or let ice cubes melt in their mouth.
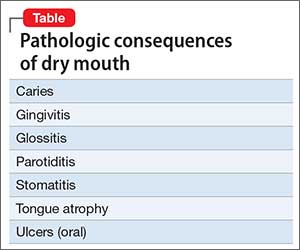
Bruxism. Patients taking a selective serotonin reuptake inhibitor or an atypical antipsychotic can develop a movement disorder (eg, extrapyramidal symptoms or tardive dyskinesia) that includes clenching, grinding of the teeth (bruxism), or both, which can worsen their periodontal condition.
Lack of skills, physical dexterity, and motivation to maintain good oral hygiene are common among people with mental illness. Most patients visit a dentist only when they experience a serious oral problem or an emergency (ie, trauma). Many dentists treat psychiatric patients by extracting the tooth that is causing the pain, instead of pursuing complex tooth preservation or restoration techniques because of (1) the extent of the disease, (2) lack of knowledge related to psychiatric illnesses, and (3) frequent and timely follow-ups.5
Providing education about oral health to patients, implementing preventive steps, and educating other medical specialities about the link between oral health and systemic health can help to reduce the burden of dental problems among mentally ill patients.
Disclosures
The authors report no financial relationships with any company whose products are mentioned in this article or with manufacturers of competing products
1. Persson K, Axtelius B, Söderfeldt B, et al. Oral health-related quality of life and dental status in an outpatient psychiatric population: a multivariate approach. Int J Ment Health Nurs. 2010;19(1):62-70.
2. Lalloo R, Kisely S, Amarasinghe H, et al. Oral health of patients on psychotropic medications: a study of outpatients in Queensland. Australas Psychiatry. 2013;21(4):338-342.
3. O’Neil A, Berk M, Venugopal K, et al. The association between poor dental health and depression: findings from a large-scale, population-based study (the NHANES study). Gen Hosp Psychiatry. 2014;36(3):266-270.
4. Kisely S, Quek LH, Paris J, et al. Advanced dental disease in people with severe mental illness: systematic review and meta-analysis. Br J Psychiatry. 2011;199(3):187-193.
5. Arnaiz A, Zumárraga M, Díez-Altuna I, et al. Oral health and the symptoms of schizophrenia. Psychiatry Res. 2011;188(1):24-28.
Poor dental hygiene is a serious and prevalent problem among people with mental illness or cognitive impairment: Dental caries and periodontal disease are 3.4 times more common among the mentally ill than among the general population.1 Little has been published on the causes and prevention of these diseases among the mentally ill, however. Interprofessional education provides the opportunity to reinforce the connection between oral health and systemic health.
Untreated dental disease can result in edentulism (partial or complete tooth loss). Often, this condition leads to embarrassment, poor self-image, and social isolation—all of which can exacerbate the psychotic state and its symptoms. Working with your patient to improve oral health can, in turn, lead to better mental and physical health.
CASE REPORT
Edentulism in a man with schizophrenia
A 34-year-old man, given a diagnosis of schizophrenia at age 17, is admitted to the inpatient psychiatry unit for bizarre behavior. The next day, 4 maxillary and incisor teeth fall out suddenly while he is brushing his teeth. The patient is brought to emergency dental services.
Factors contributing to his tooth loss include:
- schizophrenia
- neglected oral hygiene
- adverse effects of antipsychotic medication
- lack of advice on the importance of oral hygiene
- failure to recognize signs of a dental problem.
What else can lead to edentulism?
Breakdown of the periodontal attachment2 also can be caused by disinterest in oral hygiene practices; craving of, and preference for, carbohydrates because of reduced central serotonin activity3,4; and xerostomia.
Xerostomia, or dry mouth, caused by psychotropic agents and an altered immune response, facilitates growth of pathogenic bacteria and can lead to several dental diseases (Table). These conditions are exacerbated by consumption of chewing gum, sweets, and sugary drinks in response to constantly feeling thirsty from xerostomia. Advise patients to take frequent sips of fluid or let ice cubes melt in their mouth.
Bruxism. Patients taking a selective serotonin reuptake inhibitor or an atypical antipsychotic can develop a movement disorder (eg, extrapyramidal symptoms or tardive dyskinesia) that includes clenching, grinding of the teeth (bruxism), or both, which can worsen their periodontal condition.
Lack of skills, physical dexterity, and motivation to maintain good oral hygiene are common among people with mental illness. Most patients visit a dentist only when they experience a serious oral problem or an emergency (ie, trauma). Many dentists treat psychiatric patients by extracting the tooth that is causing the pain, instead of pursuing complex tooth preservation or restoration techniques because of (1) the extent of the disease, (2) lack of knowledge related to psychiatric illnesses, and (3) frequent and timely follow-ups.5
Providing education about oral health to patients, implementing preventive steps, and educating other medical specialities about the link between oral health and systemic health can help to reduce the burden of dental problems among mentally ill patients.
Disclosures
The authors report no financial relationships with any company whose products are mentioned in this article or with manufacturers of competing products
1. Persson K, Axtelius B, Söderfeldt B, et al. Oral health-related quality of life and dental status in an outpatient psychiatric population: a multivariate approach. Int J Ment Health Nurs. 2010;19(1):62-70.
2. Lalloo R, Kisely S, Amarasinghe H, et al. Oral health of patients on psychotropic medications: a study of outpatients in Queensland. Australas Psychiatry. 2013;21(4):338-342.
3. O’Neil A, Berk M, Venugopal K, et al. The association between poor dental health and depression: findings from a large-scale, population-based study (the NHANES study). Gen Hosp Psychiatry. 2014;36(3):266-270.
4. Kisely S, Quek LH, Paris J, et al. Advanced dental disease in people with severe mental illness: systematic review and meta-analysis. Br J Psychiatry. 2011;199(3):187-193.
5. Arnaiz A, Zumárraga M, Díez-Altuna I, et al. Oral health and the symptoms of schizophrenia. Psychiatry Res. 2011;188(1):24-28.
Technology offers tools for ensuring adherence to medical therapy
Nonadherence to medical therapy is a widespread and complex problem that is a significant variable in the treatment of psychiatric illness and in patients’ prognosis. More than 50% of people who have a chronic illness struggle to comply with their medication regimen—for many reasons.1
Many variables predict poor adherence, so it cannot be expected that a single solution will solve the problem entirely.2 Novel adherence technologies are available, as we discuss in this article, and more are in development.
What is nonadherence to medical therapy?
Nonadherence can be defined primarily as not taking prescribed medication in the recommended dosage or frequency, or not taking prescribed medication at all.3 Nonadherence can result in an increased risk of relapse, hospitalization, poor therapeutic response, and delayed remission and recovery.
Secondarily, non-attendance or irregular attendance at appointments with providers is a form of nonadherence that can have a negative impact on treatment outcomes.4
Why is medical adherence important in psychiatry?
Medication nonadherence has major consequences for psychiatric patients5 and for the greater health care system; it is estimated that, in the United States, the cost of nonadherence is as high as $300 billion a year.6 In psychiatry, the rate of nonadherence to medical therapy has been reported to be 11% to 80% of patients with schizophrenia; 12% to 64% with bipolar disorders; and 30% to 60% with depression.7-9 These surprising statistics make it imperative to design treatment strategies that include an effective patient-centric medication adherence plan, based on diagnosis, patient need, education, and support.
Why are patients nonadherent?
Many variables lead to patient nonadherence (Figure 1). The most common reason is that patients simply forget to take their medication.10 Among psychiatric patients, other reasons are:
- lack of insight
- negative emotional reaction to taking medication11
- feeling better and no longer believing that the medication is needed12,13
- distress associated with side effects14,15
- high cost of medication15
- patient’s perception that medication won’t be effective16,17
- concern about substance abuse18
- fear of dependency19
- complicated dosing regimen20
- general lack of motivation.21

Emotional barriers to medication nonadherence are an underestimated area that can benefit greatly from the expertise and understanding of psychiatrists. These barriers include a sense of losing control, self-stigmatization, denial, poor insight, and beliefs about illness and medications.
Additional patient variables that contribute to nonadherence include:
- suboptimal health literacy
- stigma and shame about the need for psychiatric treatment
- lack of patient involvement in treatment decision-making.
Who is responsible for adherence?
Adherence to medical therapy is not the patient’s responsibility, exclusively. Rather, it is a collection of complex components that generally includes physicians and the health care system. Because barriers to medication adherence are complex and varied, solutions to improve adherence must be multifaceted.
Providers. Patients’ care often is managed by multiple physicians, which can lead to communication lapses about complicated drug regimens and potential adverse effects. To assist patients in adhering to their medication regimen, physicians should recognize, and acknowledge to the patient, that many psychiatric patients have difficulty taking their medications and provide advice and information in how to address this problem.
Families. Likewise, it is important to educate patients and their family about the need for medication—helping the patient see that it is his (her) choice and, indeed, his direct responsibility to take his medication and improve his health. The risk–benefit balance of treatment should be explained to the patient and his family, as well as the nature of the psychiatric diagnosis and how effective patient–physician collaboration can help him function and adhere to his medication regimen in a consistent, reliable manner.
The larger system. Health care systems can contribute to medication adherence by reducing time constraints on visits to providers, to allow time to discuss all aspects of medication adherence. Limited visits in the clinic means physicians are not able to (1) spend adequate time discussing the medication regimen to ensure full patient comprehension and (2) conduct an assessment of medication-taking behaviors. Team-based approaches could improve efficiency, patient understanding, adherence, and early detection of adherence issues.22,23
Strategies such as additional clinic visits and reminder calls to discuss adherence carry a cost, but their long-term advantage is that, if patients understand how to better adhere to their medication regimens, their actions will have a positive impact on their health care costs and outcomes and on the wider health economy—as a result of reduced hospital admissions and reduced need to care for patients whose condition deteriorates because of nonadherence. It is imperative that we build strong relationships with other providers to show that we are committed to building supportive, effective adherence support programs that focus on the individual patient’s needs.
What is the available technology?
There is no standard way to measure nonadherence. The most common, and simplest, measure—asking the patient—is unreliable and severely overestimates adherence.
Direct measures of adherence include observing the patient taking his medications and testing for the concentration of those medications in blood or urine. Indirect adherence assessment methods, such as pill counts, a medication diary, self-report, clinician ratings, pharmacy chart review, and electronic devices that monitor the opening of a lid or tablet strip, have all been used; yet reviews of those methods have shown less than favorable results.6
Pre-packaged pill packs have helped some patients with a simple method for medication management.
Electronic monitoring, using a medication vial cap device (Figure 2) that electronically records the date and time of bottle opening, has become common in general medicine and among patients with schizophrenia.6,13,24-26 Diaz et al24 reported that electronic monitoring detected a greater nonadherence rate (57%) than what prescribers reported (7%) or patients self-reported (5%)—demonstrating that prescribers and patients grossly overestimate adherence. In another study that looked at electronic monitoring, researchers reported that adherence was much higher in depressed youth (87%)27 than what had been seen in adults (67%) in a similar study.13

The downside to pill packs and electronic monitoring? There is no guarantee the patient has actually taken the medication despite the data reported by the system.
Event marker-signaling devices. Novel technologies have been developed to measure adherence:
Proteus Digital Health feedback system (www.proteus.com) requires that patients ingest a tablet containing a tiny, dietary mineral-based “ingestible event marker.” Upon contact with gastric fluid electrolytes, the event marker emits a unique signal that is transmitted through bodily tissue to a small receiver in a patch worn on the torso. The receiver then transmits a signal to a cellular phone, indicating the time and date when the medication was ingested (Figure 3).

A 4-week pilot study28 found that the ingestible event marker is feasible and acceptable to patients: 27 of 28 participants (96%) completed the study, with a mean adherence rate of 74%. Although the system identifies ingestible sensors with high accuracy and is easily tolerated by patients, the pilot study was brief; a longer duration of adherence while wearing the patch needs to be studied.
Breath analysis, facial recognition. Even directly observing ingestion of a medication can be problematic: Some patients don’t swallow the medication and spit it out later. One way around that subterfuge is to consider using other advanced medication adherence solutions that are breath-based or use facial recognition technology and confirm ingestion.
Xhale SMART (www.xhale.com/smart) is a handheld device that generates a reminder to the patient to take his medication; afterward, he (she) must blow into the device so that ingestion of the medication is detected (Figure 4). The medication has breath-detectable adherence markers already incorporated. The adherence marker then is released into the stomach and small intestine, where the adherence marker metabolite is transported through the bloodstream into the lungs and exhaled. The patient must breathe into a breath analysis device, which measures medication ingestion compared with a baseline breath print.
Several articles in the literature have reported the accuracy of this device in detecting the ingested metabolite in every participant, without adverse effects.29,30 Clinical data on the use of the breath-based detector is not available to the public at this time.
AiCure (www.aicure.com) is a facial recognition-based technology platform that can work through any smartphone. The device is powered by artificial intelligence software and motion-sensing technology that can detect, in real time, whether the patient is taking the medication as prescribed. Patients who take an incorrect dose, or who do not use the software, are automatically flagged for immediate follow-up. This technology enables real-time intervention by a provider with the nonadherent patient.
An important note: These innovative technological advances are tools that can help clinicians manage an important aspect of treatment, but they do not show the entire picture: The physician−patient relationship and the therapeutic alliance are key to optimal treatment adherence.
Engage and empower the patient
Novel adherence technologies are, as we’ve described, available, and more are being developed. Incorporating these technologies into clinical care requires continued input and support from clinicians and patients. Digital and mobile health applications are multi-beneficial: They can empower patients to self-manage medication regimens and appointments while they also receive social and psychological information and support as needed. Understanding one’s own illness can, ultimately, improve outcomes and significantly reduce health care costs.
Patient empowerment is key. The physician is an important influencer in this regard.
The role of the physician must not be undervalued in maintaining adherence to therapy; she (he) plays a vital role in continued patient engagement and behavioral training. Integrating physician-led oversight, patient education, and commitment, and novel digital mobile adherence technologies will help deliver better outcomes.
The push to engage. A “one size fits all” approach to maintaining adherence won’t be effective. We need to better understand the individual patient’s underlying cause(s) for nonadherence, then to tailor a solution to influence and change that behavior. One way to do this is by interacting and engaging more directly (and in a digital manner) with patients to monitor adherence.
A recent example of the move toward direct patient engagement is the agreement entered by Otsuka Pharmaceuticals and Proteus Digital Health to develop novel digital health products. The FDA has accepted for review the combination product of Otsuka’s brand of aripiprazole and Proteus’s ingestible sensor. If the product is approved by the FDA, physicians will be able to prescribe aripiprazole with the ingestible sensor embedded in the tablet and then measure medication adherence and other patient physiologic metrics (eg, activity, rest) through the wearable sensor patch and medical software application designed specifically for patient and physician use.
This technology could have huge potential in mental health care, where patients struggle with both adhering to their medication regimen and communicating with the health care team. Physicians could measure adherence when treating adults with schizophrenia, bipolar disorders, and major depressive disorder; flag those who are not adhering as having higher risk of disease progression and poorer outcome; and allow decisions to be made more quickly based on treatment need.
Developing and enhancing these collaborative and patient-centric approaches will increase self-monitoring and patient responsibility, and encourage behavior change.
‘All-in’ strategy. By continuing to use the latest technologies and connecting them to the range of stakeholders—physicians, nurses, pharmacists, payers—we will develop an all-inclusive adherence intervention strategy. All patients will be integrated, and all of them, and their family, will be provided with positive psychoeducational care and motivational counseling (Figure 5). In addition, such a support-based patient experience must be aligned with the work of clinical care providers. Compliance therapy and behavioral training, together with active patient engagement, can help improve insight, acceptance of treatment, and, over the long term, adherence.31,32
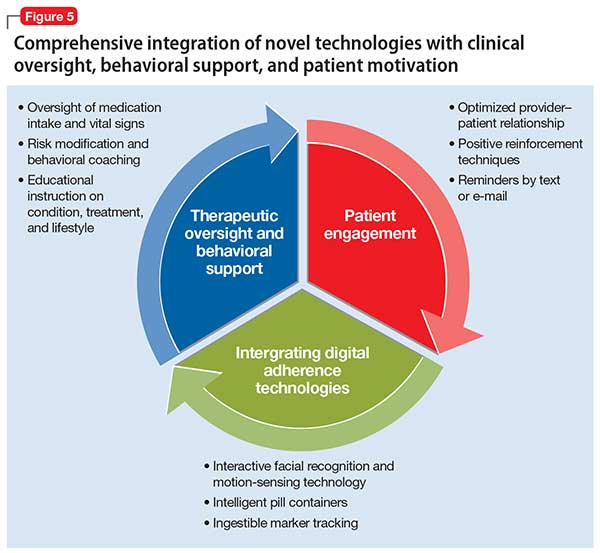
1. World Health Organization. Adherence to long-term therapies: evidence for action. Geneva, Switzerland: World Health Organization; 2003.
2. Bosworth HB, Granger BB, Mendys P, et al. Medication adherence: a call for action. Am Heart J. 2011;162(3):412-424.
3. Crowe M, Wilson L, Inder M. Patients’ reports of the factors influencing medication adherence in bipolar disorder – an integrative review of the literature. Int J Nurs Stud. 2011;48(7):894-903.
4. Mert D, Turgut NH, Kelleci M, et al. Perspectives on reasons of medication nonadherence in psychiatric patients. Patient Prefer Adherence. 2015;9:87-93.
5. Chapman SC, Horne R. Medication nonadherence and psychiatry. Curr Opin Psychiatry. 2013;26(5):446-452.
6. Osterberg L, Blaschke T. Adherence to medication. N Engl J Med. 2005;353(5):487-497.
7. Thompson L, McCabe R. The effect of clinician-patient alliance and communication on treatment adherence in mental health care: a systematic review. BMC Psychiatry. 2012;12:87.
8. Yilmaz S, Buzlu S. Antipsikotik kullanan hastalarda ilaç yan etkileri ve ilaç uyumu. Florence Nightingale Hem˘girelik Dergisi. 2012;20(2):93-103.
9. Kelleci M, Ata EE. Psikiyatri Klini˘ginde yatan hastaların ilaç uyumları ve sosyal destekle iliskisi. [Drug compliance of patients hospitalized in the psychiatry clinic and the relationship with social support]. Psikiyatri Hemsireli˘gi Dergisi. 2011;2(suppl 3):105-110.
10. Bulloch AG, Patten SB. Non-adherence with psychotropic medications in the general population. Soc Psychiatry Psychiatr Epidemiol. 2010;45(1):47-56.
11. Rosenbaum L. Beyond belief—how people feel about taking medications for heart disease. N Engl J Med. 2015;372(2):183-187.
12. Cramer J, Rosenheck R, Kirk G, et al. Medication compliance feedback and monitoring in a clinical trial: predictions and outcomes. Value Health. 2003;6(5):566-573.
13. Nakonezny PA, Byerly MJ, Rush AJ. Electronic monitoring of antipsychotic medication adherence in outpatients with schizophrenia or schizoaffective disorder: an empirical evaluation of its reliability and predictive validity. Psychiatry Res. 2008;157(1-3):259-263.
14. Fortney JC, Pyne JM, Edlund MJ, et al. Reasons for antidepressant nonadherence among veterans treated in primary care clinics. J Clin Psychiatry. 2011;72(6):827-834.
15. Kennedy J, Tuleu I, Mackay K. Unfilled prescriptions of medicare beneficiaries: prevalence, reasons, and types of medicines prescribed. J Manag Care Pharm. 2008;14(6):553-560.
16. Hoencamp E, Stevens A, Haffmans J. Patients’ attitudes toward antidepressants. Psychiatr Serv. 2002;53(9):1180-1181.
17. Keller MB, Hirschfeld RM, Demyttenaere K, et al. Optimizing outcomes in depression: focus on antidepressant compliance. Int Clin Psychopharmacol. 2002;17(6):265-271.
18. Akerblad AC, Bengtsson F, Holgersson M, et al. Identification of primary care patients at risk of nonadherence to antidepressant treatment. Patient Prefer Adherence. 2008;2:376-386.
19. Brown C, Battista DR, Bruehlman R, et al. Beliefs about antidepressant medications in primary care patients: relationship to self-reported adherence. Med Care. 2005;43(12):1203-1207.
20. Demyttenaere K, Adelin A, Patrick M, et al. Six-month compliance with antidepressant medication in the treatment of major depressive disorder. Int Clin Psychopharmacol. 2008;23(1):36-42.
21. Massand PS. Tolerability and adherence issues in antidepressant therapy. Clin Ther. 2003;25(8):2289-2304.
22. Medicare Prescription Drug, Improvement, and Modernization Act of 2003. Pub L No. 108-173, 117 Stat 2066.
23. Brown MT, Bussell JK. Medication adherence: WHO cares? Mayo Clin Proc. 2011;86(4):304-314.
24. Diaz E, Neuse E, Sullivan MC, et al. Adherence to conventional and atypical antipsychotics after hospital discharge. J Clin Psychiatry. 2004;65(3):354-360.
25. Byerly M, Fisher R, Whatley K, et al. A comparison of electronic monitoring vs. clinician rating of antipsychotic adherence in outpatients with schizophrenia. Psychiatry Res. 2005;133(2-3):129-133.
26. Byerly MJ, Nakonezny PA, Lescouflair E. Antipsychotic medication adherence in schizophrenia. Psychiatr Clin North Am. 2007;30(3):437-452.
27. Nakonezny PA, Hughes CW, Mayes TL, et al. A comparison of various methods of measuring antidepressant medication adherence among children and adolescents with major depressive disorder in a 12-week open trial of fluoxetine. J Child Adolesc Psychopharmacol. 2010;20(5):431-439.
28. Kane JM, Perlis RH, DiCarlo LA, et al. First experience with a wireless system incorporating physiologic assessments and direct confirmation of digital tablet ingestions in ambulatory patients with schizophrenia or bipolar disorder. J Clin Psychiatry. 2013;74(6):e533-e540. doi: 10.4088/JCP.12m08222.
29. Morey TE, Booth MM, Prather RA, et al. Measurement of ethanol in gaseous breath using a miniature gas chromatograph. J Anal Toxicol. 2011;35(3):134-142.
30. Morey TE, Booth M, Wasdo S, et al. Oral adherence monitoring using a breath test to supplement highly active antiretroviral therapy. AIDS Behav. 2013;17(1):298-306.
31. Torem MS. Participatory pharmacotherapy: 10 strategies for enhancing adherence. Current Psychiatry. 2013;12(7):21-25.
32. Zygmunt A, Olfson M, Boyer CA, et al. Interventions to improve medication adherence in schizophrenia. Am J Psychiatry. 2002;159(10):1653-1664.
Nonadherence to medical therapy is a widespread and complex problem that is a significant variable in the treatment of psychiatric illness and in patients’ prognosis. More than 50% of people who have a chronic illness struggle to comply with their medication regimen—for many reasons.1
Many variables predict poor adherence, so it cannot be expected that a single solution will solve the problem entirely.2 Novel adherence technologies are available, as we discuss in this article, and more are in development.
What is nonadherence to medical therapy?
Nonadherence can be defined primarily as not taking prescribed medication in the recommended dosage or frequency, or not taking prescribed medication at all.3 Nonadherence can result in an increased risk of relapse, hospitalization, poor therapeutic response, and delayed remission and recovery.
Secondarily, non-attendance or irregular attendance at appointments with providers is a form of nonadherence that can have a negative impact on treatment outcomes.4
Why is medical adherence important in psychiatry?
Medication nonadherence has major consequences for psychiatric patients5 and for the greater health care system; it is estimated that, in the United States, the cost of nonadherence is as high as $300 billion a year.6 In psychiatry, the rate of nonadherence to medical therapy has been reported to be 11% to 80% of patients with schizophrenia; 12% to 64% with bipolar disorders; and 30% to 60% with depression.7-9 These surprising statistics make it imperative to design treatment strategies that include an effective patient-centric medication adherence plan, based on diagnosis, patient need, education, and support.
Why are patients nonadherent?
Many variables lead to patient nonadherence (Figure 1). The most common reason is that patients simply forget to take their medication.10 Among psychiatric patients, other reasons are:
- lack of insight
- negative emotional reaction to taking medication11
- feeling better and no longer believing that the medication is needed12,13
- distress associated with side effects14,15
- high cost of medication15
- patient’s perception that medication won’t be effective16,17
- concern about substance abuse18
- fear of dependency19
- complicated dosing regimen20
- general lack of motivation.21
Emotional barriers to medication nonadherence are an underestimated area that can benefit greatly from the expertise and understanding of psychiatrists. These barriers include a sense of losing control, self-stigmatization, denial, poor insight, and beliefs about illness and medications.
Additional patient variables that contribute to nonadherence include:
- suboptimal health literacy
- stigma and shame about the need for psychiatric treatment
- lack of patient involvement in treatment decision-making.
Who is responsible for adherence?
Adherence to medical therapy is not the patient’s responsibility, exclusively. Rather, it is a collection of complex components that generally includes physicians and the health care system. Because barriers to medication adherence are complex and varied, solutions to improve adherence must be multifaceted.
Providers. Patients’ care often is managed by multiple physicians, which can lead to communication lapses about complicated drug regimens and potential adverse effects. To assist patients in adhering to their medication regimen, physicians should recognize, and acknowledge to the patient, that many psychiatric patients have difficulty taking their medications and provide advice and information in how to address this problem.
Families. Likewise, it is important to educate patients and their family about the need for medication—helping the patient see that it is his (her) choice and, indeed, his direct responsibility to take his medication and improve his health. The risk–benefit balance of treatment should be explained to the patient and his family, as well as the nature of the psychiatric diagnosis and how effective patient–physician collaboration can help him function and adhere to his medication regimen in a consistent, reliable manner.
The larger system. Health care systems can contribute to medication adherence by reducing time constraints on visits to providers, to allow time to discuss all aspects of medication adherence. Limited visits in the clinic means physicians are not able to (1) spend adequate time discussing the medication regimen to ensure full patient comprehension and (2) conduct an assessment of medication-taking behaviors. Team-based approaches could improve efficiency, patient understanding, adherence, and early detection of adherence issues.22,23
Strategies such as additional clinic visits and reminder calls to discuss adherence carry a cost, but their long-term advantage is that, if patients understand how to better adhere to their medication regimens, their actions will have a positive impact on their health care costs and outcomes and on the wider health economy—as a result of reduced hospital admissions and reduced need to care for patients whose condition deteriorates because of nonadherence. It is imperative that we build strong relationships with other providers to show that we are committed to building supportive, effective adherence support programs that focus on the individual patient’s needs.
What is the available technology?
There is no standard way to measure nonadherence. The most common, and simplest, measure—asking the patient—is unreliable and severely overestimates adherence.
Direct measures of adherence include observing the patient taking his medications and testing for the concentration of those medications in blood or urine. Indirect adherence assessment methods, such as pill counts, a medication diary, self-report, clinician ratings, pharmacy chart review, and electronic devices that monitor the opening of a lid or tablet strip, have all been used; yet reviews of those methods have shown less than favorable results.6
Pre-packaged pill packs have helped some patients with a simple method for medication management.
Electronic monitoring, using a medication vial cap device (Figure 2) that electronically records the date and time of bottle opening, has become common in general medicine and among patients with schizophrenia.6,13,24-26 Diaz et al24 reported that electronic monitoring detected a greater nonadherence rate (57%) than what prescribers reported (7%) or patients self-reported (5%)—demonstrating that prescribers and patients grossly overestimate adherence. In another study that looked at electronic monitoring, researchers reported that adherence was much higher in depressed youth (87%)27 than what had been seen in adults (67%) in a similar study.13
The downside to pill packs and electronic monitoring? There is no guarantee the patient has actually taken the medication despite the data reported by the system.
Event marker-signaling devices. Novel technologies have been developed to measure adherence:
Proteus Digital Health feedback system (www.proteus.com) requires that patients ingest a tablet containing a tiny, dietary mineral-based “ingestible event marker.” Upon contact with gastric fluid electrolytes, the event marker emits a unique signal that is transmitted through bodily tissue to a small receiver in a patch worn on the torso. The receiver then transmits a signal to a cellular phone, indicating the time and date when the medication was ingested (Figure 3).
A 4-week pilot study28 found that the ingestible event marker is feasible and acceptable to patients: 27 of 28 participants (96%) completed the study, with a mean adherence rate of 74%. Although the system identifies ingestible sensors with high accuracy and is easily tolerated by patients, the pilot study was brief; a longer duration of adherence while wearing the patch needs to be studied.
Breath analysis, facial recognition. Even directly observing ingestion of a medication can be problematic: Some patients don’t swallow the medication and spit it out later. One way around that subterfuge is to consider using other advanced medication adherence solutions that are breath-based or use facial recognition technology and confirm ingestion.
Xhale SMART (www.xhale.com/smart) is a handheld device that generates a reminder to the patient to take his medication; afterward, he (she) must blow into the device so that ingestion of the medication is detected (Figure 4). The medication has breath-detectable adherence markers already incorporated. The adherence marker then is released into the stomach and small intestine, where the adherence marker metabolite is transported through the bloodstream into the lungs and exhaled. The patient must breathe into a breath analysis device, which measures medication ingestion compared with a baseline breath print.
Several articles in the literature have reported the accuracy of this device in detecting the ingested metabolite in every participant, without adverse effects.29,30 Clinical data on the use of the breath-based detector is not available to the public at this time.
AiCure (www.aicure.com) is a facial recognition-based technology platform that can work through any smartphone. The device is powered by artificial intelligence software and motion-sensing technology that can detect, in real time, whether the patient is taking the medication as prescribed. Patients who take an incorrect dose, or who do not use the software, are automatically flagged for immediate follow-up. This technology enables real-time intervention by a provider with the nonadherent patient.
An important note: These innovative technological advances are tools that can help clinicians manage an important aspect of treatment, but they do not show the entire picture: The physician−patient relationship and the therapeutic alliance are key to optimal treatment adherence.
Engage and empower the patient
Novel adherence technologies are, as we’ve described, available, and more are being developed. Incorporating these technologies into clinical care requires continued input and support from clinicians and patients. Digital and mobile health applications are multi-beneficial: They can empower patients to self-manage medication regimens and appointments while they also receive social and psychological information and support as needed. Understanding one’s own illness can, ultimately, improve outcomes and significantly reduce health care costs.
Patient empowerment is key. The physician is an important influencer in this regard.
The role of the physician must not be undervalued in maintaining adherence to therapy; she (he) plays a vital role in continued patient engagement and behavioral training. Integrating physician-led oversight, patient education, and commitment, and novel digital mobile adherence technologies will help deliver better outcomes.
The push to engage. A “one size fits all” approach to maintaining adherence won’t be effective. We need to better understand the individual patient’s underlying cause(s) for nonadherence, then to tailor a solution to influence and change that behavior. One way to do this is by interacting and engaging more directly (and in a digital manner) with patients to monitor adherence.
A recent example of the move toward direct patient engagement is the agreement entered by Otsuka Pharmaceuticals and Proteus Digital Health to develop novel digital health products. The FDA has accepted for review the combination product of Otsuka’s brand of aripiprazole and Proteus’s ingestible sensor. If the product is approved by the FDA, physicians will be able to prescribe aripiprazole with the ingestible sensor embedded in the tablet and then measure medication adherence and other patient physiologic metrics (eg, activity, rest) through the wearable sensor patch and medical software application designed specifically for patient and physician use.
This technology could have huge potential in mental health care, where patients struggle with both adhering to their medication regimen and communicating with the health care team. Physicians could measure adherence when treating adults with schizophrenia, bipolar disorders, and major depressive disorder; flag those who are not adhering as having higher risk of disease progression and poorer outcome; and allow decisions to be made more quickly based on treatment need.
Developing and enhancing these collaborative and patient-centric approaches will increase self-monitoring and patient responsibility, and encourage behavior change.
‘All-in’ strategy. By continuing to use the latest technologies and connecting them to the range of stakeholders—physicians, nurses, pharmacists, payers—we will develop an all-inclusive adherence intervention strategy. All patients will be integrated, and all of them, and their family, will be provided with positive psychoeducational care and motivational counseling (Figure 5). In addition, such a support-based patient experience must be aligned with the work of clinical care providers. Compliance therapy and behavioral training, together with active patient engagement, can help improve insight, acceptance of treatment, and, over the long term, adherence.31,32
1. World Health Organization. Adherence to long-term therapies: evidence for action. Geneva, Switzerland: World Health Organization; 2003.
2. Bosworth HB, Granger BB, Mendys P, et al. Medication adherence: a call for action. Am Heart J. 2011;162(3):412-424.
3. Crowe M, Wilson L, Inder M. Patients’ reports of the factors influencing medication adherence in bipolar disorder – an integrative review of the literature. Int J Nurs Stud. 2011;48(7):894-903.
4. Mert D, Turgut NH, Kelleci M, et al. Perspectives on reasons of medication nonadherence in psychiatric patients. Patient Prefer Adherence. 2015;9:87-93.
5. Chapman SC, Horne R. Medication nonadherence and psychiatry. Curr Opin Psychiatry. 2013;26(5):446-452.
6. Osterberg L, Blaschke T. Adherence to medication. N Engl J Med. 2005;353(5):487-497.
7. Thompson L, McCabe R. The effect of clinician-patient alliance and communication on treatment adherence in mental health care: a systematic review. BMC Psychiatry. 2012;12:87.
8. Yilmaz S, Buzlu S. Antipsikotik kullanan hastalarda ilaç yan etkileri ve ilaç uyumu. Florence Nightingale Hem˘girelik Dergisi. 2012;20(2):93-103.
9. Kelleci M, Ata EE. Psikiyatri Klini˘ginde yatan hastaların ilaç uyumları ve sosyal destekle iliskisi. [Drug compliance of patients hospitalized in the psychiatry clinic and the relationship with social support]. Psikiyatri Hemsireli˘gi Dergisi. 2011;2(suppl 3):105-110.
10. Bulloch AG, Patten SB. Non-adherence with psychotropic medications in the general population. Soc Psychiatry Psychiatr Epidemiol. 2010;45(1):47-56.
11. Rosenbaum L. Beyond belief—how people feel about taking medications for heart disease. N Engl J Med. 2015;372(2):183-187.
12. Cramer J, Rosenheck R, Kirk G, et al. Medication compliance feedback and monitoring in a clinical trial: predictions and outcomes. Value Health. 2003;6(5):566-573.
13. Nakonezny PA, Byerly MJ, Rush AJ. Electronic monitoring of antipsychotic medication adherence in outpatients with schizophrenia or schizoaffective disorder: an empirical evaluation of its reliability and predictive validity. Psychiatry Res. 2008;157(1-3):259-263.
14. Fortney JC, Pyne JM, Edlund MJ, et al. Reasons for antidepressant nonadherence among veterans treated in primary care clinics. J Clin Psychiatry. 2011;72(6):827-834.
15. Kennedy J, Tuleu I, Mackay K. Unfilled prescriptions of medicare beneficiaries: prevalence, reasons, and types of medicines prescribed. J Manag Care Pharm. 2008;14(6):553-560.
16. Hoencamp E, Stevens A, Haffmans J. Patients’ attitudes toward antidepressants. Psychiatr Serv. 2002;53(9):1180-1181.
17. Keller MB, Hirschfeld RM, Demyttenaere K, et al. Optimizing outcomes in depression: focus on antidepressant compliance. Int Clin Psychopharmacol. 2002;17(6):265-271.
18. Akerblad AC, Bengtsson F, Holgersson M, et al. Identification of primary care patients at risk of nonadherence to antidepressant treatment. Patient Prefer Adherence. 2008;2:376-386.
19. Brown C, Battista DR, Bruehlman R, et al. Beliefs about antidepressant medications in primary care patients: relationship to self-reported adherence. Med Care. 2005;43(12):1203-1207.
20. Demyttenaere K, Adelin A, Patrick M, et al. Six-month compliance with antidepressant medication in the treatment of major depressive disorder. Int Clin Psychopharmacol. 2008;23(1):36-42.
21. Massand PS. Tolerability and adherence issues in antidepressant therapy. Clin Ther. 2003;25(8):2289-2304.
22. Medicare Prescription Drug, Improvement, and Modernization Act of 2003. Pub L No. 108-173, 117 Stat 2066.
23. Brown MT, Bussell JK. Medication adherence: WHO cares? Mayo Clin Proc. 2011;86(4):304-314.
24. Diaz E, Neuse E, Sullivan MC, et al. Adherence to conventional and atypical antipsychotics after hospital discharge. J Clin Psychiatry. 2004;65(3):354-360.
25. Byerly M, Fisher R, Whatley K, et al. A comparison of electronic monitoring vs. clinician rating of antipsychotic adherence in outpatients with schizophrenia. Psychiatry Res. 2005;133(2-3):129-133.
26. Byerly MJ, Nakonezny PA, Lescouflair E. Antipsychotic medication adherence in schizophrenia. Psychiatr Clin North Am. 2007;30(3):437-452.
27. Nakonezny PA, Hughes CW, Mayes TL, et al. A comparison of various methods of measuring antidepressant medication adherence among children and adolescents with major depressive disorder in a 12-week open trial of fluoxetine. J Child Adolesc Psychopharmacol. 2010;20(5):431-439.
28. Kane JM, Perlis RH, DiCarlo LA, et al. First experience with a wireless system incorporating physiologic assessments and direct confirmation of digital tablet ingestions in ambulatory patients with schizophrenia or bipolar disorder. J Clin Psychiatry. 2013;74(6):e533-e540. doi: 10.4088/JCP.12m08222.
29. Morey TE, Booth MM, Prather RA, et al. Measurement of ethanol in gaseous breath using a miniature gas chromatograph. J Anal Toxicol. 2011;35(3):134-142.
30. Morey TE, Booth M, Wasdo S, et al. Oral adherence monitoring using a breath test to supplement highly active antiretroviral therapy. AIDS Behav. 2013;17(1):298-306.
31. Torem MS. Participatory pharmacotherapy: 10 strategies for enhancing adherence. Current Psychiatry. 2013;12(7):21-25.
32. Zygmunt A, Olfson M, Boyer CA, et al. Interventions to improve medication adherence in schizophrenia. Am J Psychiatry. 2002;159(10):1653-1664.